


- Stock trends show bearish signals for leading companies
- Moving averages indicate mixed momentum across sectors
- MACD and RSI highlight key market weakness signs
Highlights
Latest news

CEO among three held for gangrape of woman IT firm manager in Udaipur

PM Modi says government reforms to continue with greater vigour, focusing on ‘Ease of Living’

Reflation, possible earnings revival to push Indian equities higher through 2026: Report

Declassified US documents reveal US, Russia 'nervous' over Pakistan's nuclear proliferation

Delhi Environment Minister warns pollution could spike again amid western disturbances

China hits out at Pentagon report alleging bid to weaken US-India ties

Four VHP, Bajrang Dal members arrested for Christmas vandalism in Assam school

'Papa, I cannot bear pain': Indian-origin man dies after 8-hour wait at Canada hospital
NSE Nifty 50: Top 5 stock losers of April 2, 2025


In this article, we will explore the technical indicators of some of the low-performing stocks on the Indian stock market, including BEL, LT, NESTLEIND, POWERGRID, and ULTRACEMCO.
By looking at these stocks through the lens of key technical factors, we aim to better understand their price movements, trends, and potential future performance.

Analysis for Bharat Electronics - April 02, 2025

Bharat Electronics exhibited a decline in performance with the stock closing at 282.40, a decrease of 3.29% or 9.60 points from the previous close. The current tools like RSI and MACD are showing neutral signals, while the company is operating in the Aerospace & Defense sector in India, with a moderate PE ratio of 41.35.

Relationship with Key Moving Averages
Bharat Electronics is trading below its 10 EMA (291.82), indicating recent weakness, but it is trading above both its 50 EMA (279.49) and 200 EMA (272.14), which suggests a longer-term upward momentum. This positioning reflects a short-term bearish sentiment while maintaining a bullish outlook in the medium to long term.
Moving Averages Trend (MACD)
The MACD for Bharat Electronics (BEL) is 7.34, which is slightly below the MACD Signal of 7.46. This indicates a potential bearish crossover, suggesting a slight weakening in momentum. Traders might want to monitor for further confirmation in the stock's trend.

RSI Analysis
Bharat Electronics has an RSI of 49.47, indicating a neutral momentum in its current trading cycle. The RSI is approaching the midpoint of 50, suggesting neither overbought nor oversold conditions, which could imply a potential consolidation phase in the stock's movement.

Analysis for HCL Technologies - April 02, 2025
HCL Technologies Based on the data provided, HCL Technologies likely showcases similar analytics such as stock prices and technical indicators for insightful analysis. For an accurate performance assessment, details on opening and closing prices, EMA values, RSI, MACD, financial ratios, and other sector-related data should be compared to similar metrics of other companies in the same industry, like L&T. Such thorough comparisons can offer a comprehensive view of how HCL Technologies is performing within its sector and the overarching market conditions.

Relationship with Key Moving Averages
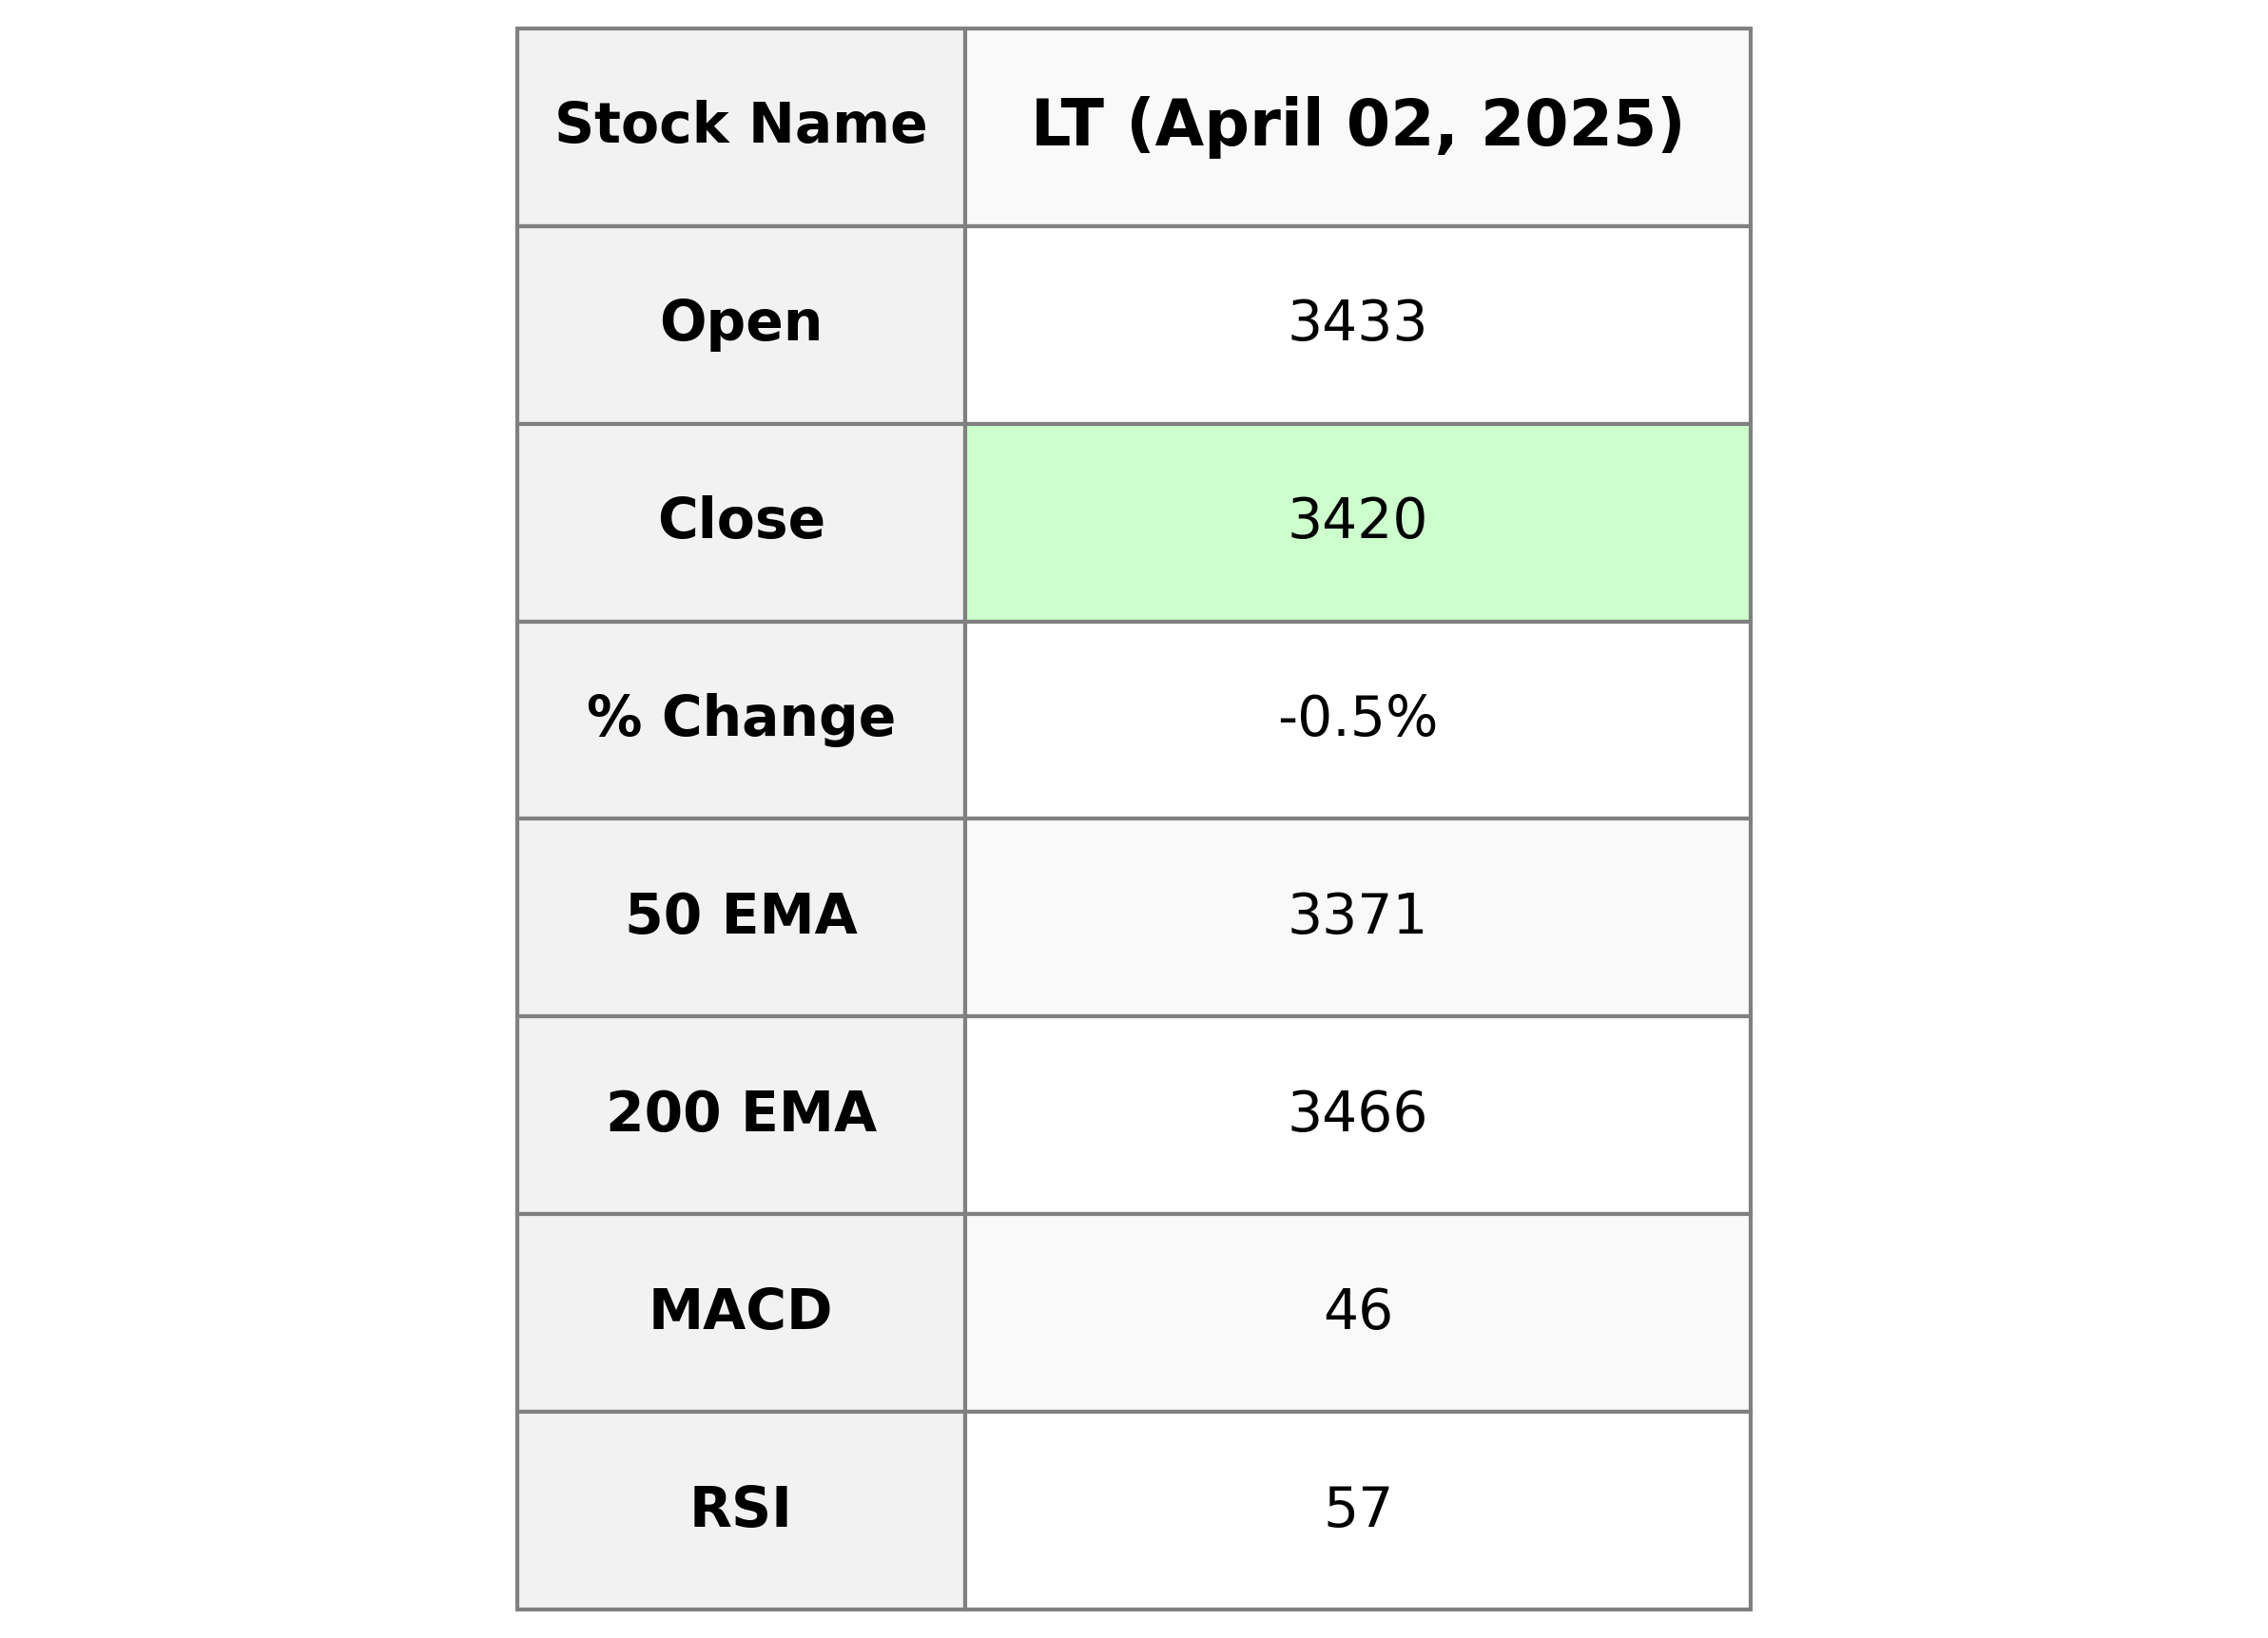
For Larsen & Toubro (LT.NS), the close price of 3419.90 is above the 50-day EMA of 3371.34 but below the 200-day EMA of 3465.67, indicating short-term strength relative to the 50-day trend but underlying weakness compared to the longer-term trend. Additionally, the stock is slightly above the 10-day EMA, suggesting recent upward momentum despite a slight overall negative change.
Moving Averages Trend (MACD)
The data provided is for Larsen & Toubro Limited and not for HCL Technologies. However, based on the MACD analysis for the given data, the MACD value of 45.90 is above the MACD signal line of 23.47, suggesting bullish momentum. You should verify the MACD analysis for HCL Technologies with its specific data for an accurate assessment.

RSI Analysis
RSI for HCL Technologies indicates a positive momentum, as it is above the neutral level of 50, currently at 57.07. This suggests that the stock might be experiencing an uptrend in the short term.

Analysis for Nestle - April 02, 2025

Nestle India's stock opened at 2230.0 and closed at 2210.7, indicating a decrease of 1.04% from the previous close. The stock experienced a high of 2230.0 and a low of 2148.0 during the trading session. With a market capitalization of 2,131,461,799,936 INR and a PE Ratio of 71.71, Nestle operates in the Consumer Defensive sector, specifically in the Packaged Foods industry in India.

Relationship with Key Moving Averages
For Nestle India, the stock's current price (close: 2210.70) is below its 50-day EMA (2222.10) and 10-day EMA (2231.43), suggesting a short-term bearish trend. Additionally, it's significantly lower than the 200-day EMA (2302.03), indicating an overall bearish sentiment in comparison to longer-term averages.
Moving Averages Trend (MACD)
Nestle's MACD of 6.467 is above the MACD Signal of 5.855, indicating a potential bullish trend. This crossover suggests that the stock might be gaining positive momentum, which could indicate a possible upward movement in the near term.

RSI Analysis
The Relative Strength Index (RSI) for Nestle is 47.33, indicating a neutral stance in terms of stock momentum. Generally, an RSI below 30 suggests the stock is oversold, and above 70 indicates it is overbought, so Nestle is currently neither overbought nor oversold.

Analysis for Power Grid - April 02, 2025

Power Grid Corporation of India Limited The stock opened at 286.85, reached a high of 289.75, and closed at 286.75, reflecting a slight decrease of 0.88% from the previous close of 289.30. With a market cap of 2,666 billion INR, it operates in the Utilities sector and is part of the Utilities - Regulated Electric industry. The PE Ratio stands at 17.21, and the EPS is 16.66, indicating a relatively stable financial performance. The RSI of 59.30 suggests a neutral trend, while the MACD indicates a possible upward momentum with a bullish crossover.

Relationship with Key Moving Averages
Power Grid's current stock price of 286.75 is above its 50-day EMA of 280.14, indicating short-term strength. However, it is slightly below the 200-day EMA of 291.89, suggesting a potential long-term resistance. Additionally, it is near the 10-day EMA of 285.82, reflecting a recent consolidation phase.
Moving Averages Trend (MACD)
Power Grid's MACD value is 5.73, which is above its MACD Signal of 3.75, suggesting a bullish trend. This indicates that the stock price might continue to experience upward momentum.

RSI Analysis
The RSI for Power Grid is 59.30, indicating that the stock is in a neutral zone but approaching overbought levels, as RSI values above 70 typically suggest overbought conditions. A value below 30 would indicate oversold conditions.

Analysis for UltraTech Cement - April 02, 2025

UltraTech Cement experienced a slight decline, with its stock closing at 11,250.95, down by approximately 1.12% from the previous close. The company, operating in the Basic Materials sector in India, has a strong technical position, trading above its 50-day and 200-day EMAs. The stock has a PE ratio of 52.04, reflecting its earnings performance.

Relationship with Key Moving Averages
UltraTech Cement's recent closing price of 11250.9502 is above the 50-day EMA at 11058.4759 and the 200-day EMA at 10973.4765, indicating a potential upward trend. The stock also trades slightly above the 10-day EMA at 11221.6374, suggesting momentum may still be in the buyer's favor.
Moving Averages Trend (MACD)
UltraTech Cement's MACD stands at 132.43 with a Signal Line at 42.57, indicating a bullish momentum, given that the MACD is significantly higher than the Signal Line. This suggests potential continued upward movement in the stock price.

RSI Analysis
RSI Analysis for UltraTech Cement: The Relative Strength Index (RSI) for UltraTech Cement is 56.23. This suggests a neutral momentum, as it is closer to the midpoint of 50 on the RSI scale, indicating neither overbought nor oversold conditions.

Up Next
NSE Nifty 50: Top 5 stock losers of April 2, 2025

New Zealand commits USD 20 bn investment in India under FTA in 15 yrs; on lines of EFTA pact

India, New Zealand conclude FTA talks; pact to offer duty-free access, USD 20 bn FDI

FTA with New Zealand to significantly deepen bilateral economic engagement: Govt

Rupee breaches 91-mark against US dollar for first time in intra-day trade

Microsoft commits USD 17.5 billion investment in India: CEO Satya Nadella

More videos

CBI books Anil Ambani's son, Reliance Home Finance Ltd. in Rs 228 crore bank fraud case

RBI raises FY26 GDP growth projection to 7.3 pc

RBI trims policy interest rate by 25bps to 5.25pc, loans to get cheaper

Rupee slumps to all-time low of 90.25 against US dollar in intra-day trade

Reliance completes merger of Star Television Productions with Jiostar

India to lead emerging market growth with 7pc GDP rise in 2025: Moody’s

Nifty hits record high after 14 months; Sensex nears all-time peak

Reliance stops Russian oil use at its only-for-export refinery to comply with EU sanctions

ED attaches fresh assets worth over Rs 1,400 cr in case against Anil Ambani's Reliance Group

India signs one-year deal to import 2.2 million tonnes of LPG from US
Editorji Technologies Pvt. Ltd. © 2022 All Rights Reserved.