


Highlights
- Bajaj Auto maintains strong bullish trend indicators
- Hero MotoCorp shows momentum with bullish crossover
- IndusInd Bank struggles below key moving averages
Latest news

Gujarat AAP MLA Chaitar Vasava announces Aravalli protection convention on December 23

New Zealand commits USD 20 bn investment in India under FTA in 15 yrs; on lines of EFTA pact

Bihar CM Nitish Kumar, Dy CM Samrat Choudhary call on PM Modi in Delhi

Union Home Minister Amit Shah meets Bihar CM Nitish Kumar in Delhi

National Herald case: Delhi HC seeks Gandhis' reply on ED plea against trial court order

Delhi: Over 2.12 lakh PUC certificates issued in four days as GRAP-IV enforcement intensifies

Assam on high alert in view of fresh unrest in Bangaldesh: Himanta

Oppo Reno 15 Pro Mini First Look & Hands-On: Small Phone, Big Intentions
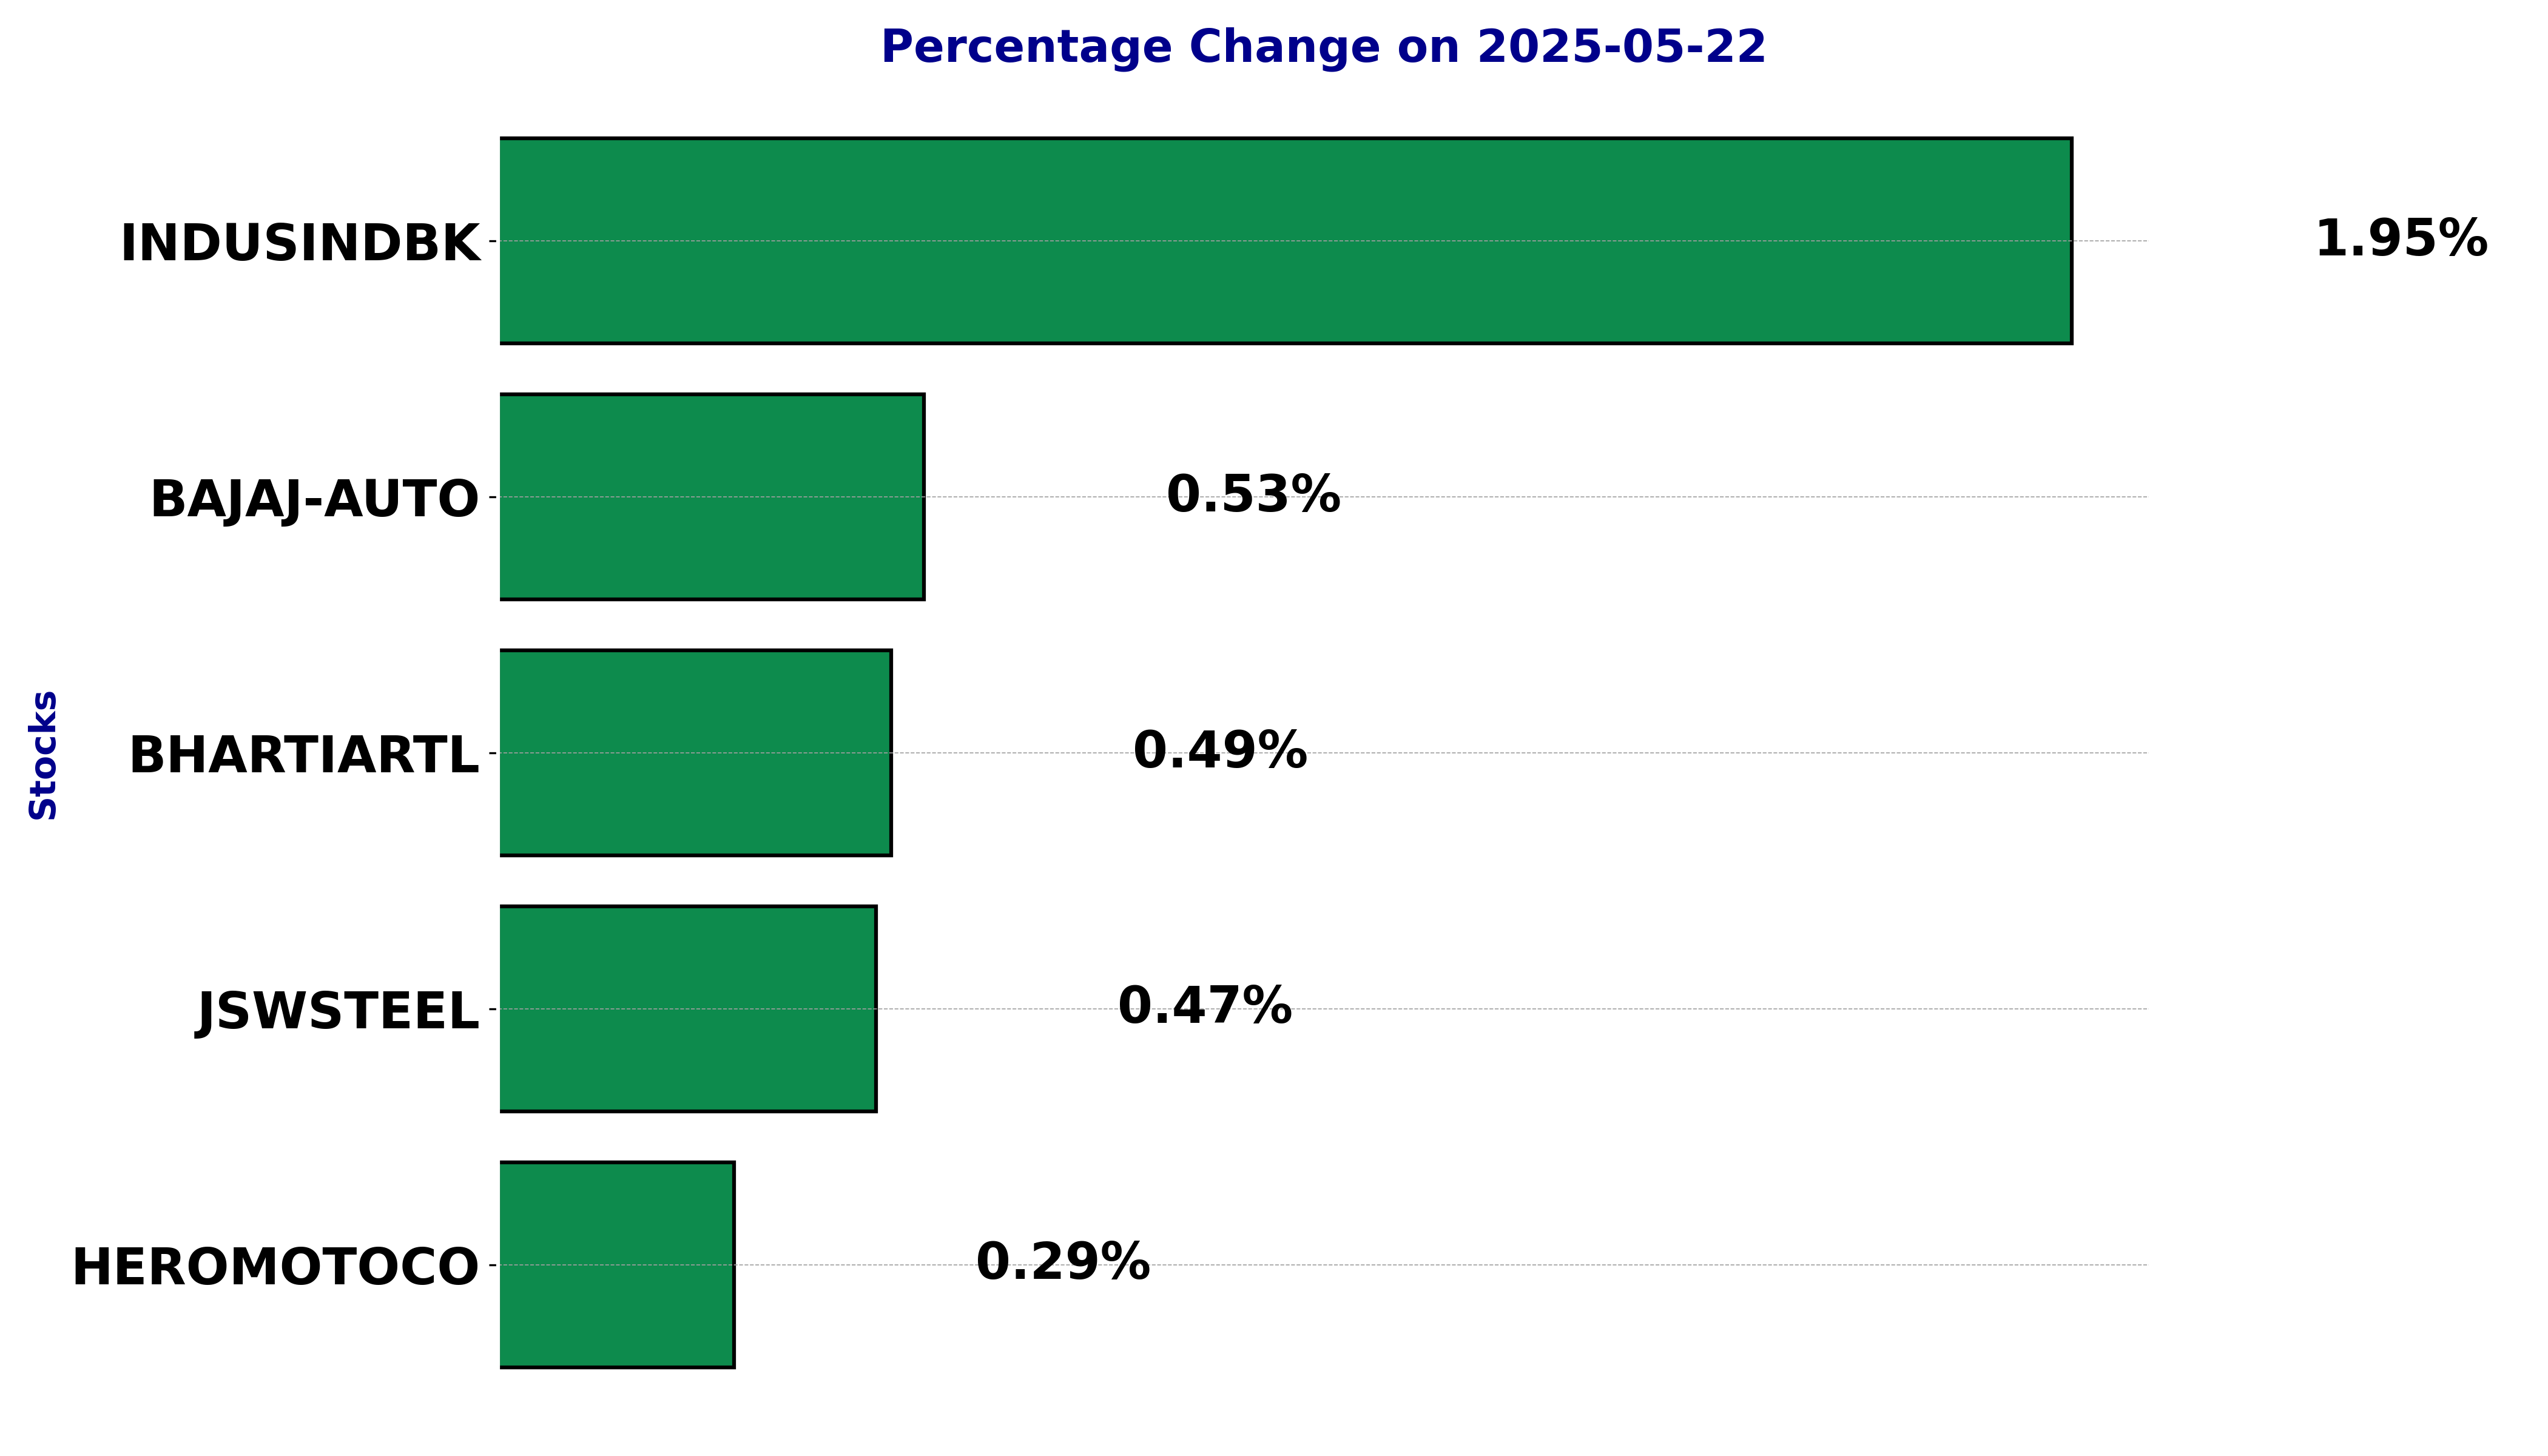
Top 5 Nifty 50 gainers today – May 22, 2025: Biggest stock moves


In this article, we will explore the technical indicators of some of the high-performing stocks on the Indian stock market, including BAJAJ-AUTO, BHARTIARTL, HEROMOTOCO, INDUSINDBK, and JSWSTEEL.
By looking at these stocks through the lens of key technical factors, we aim to better understand their price movements, trends, and potential future performance.
Analysis for Bajaj Auto - May 22, 2025
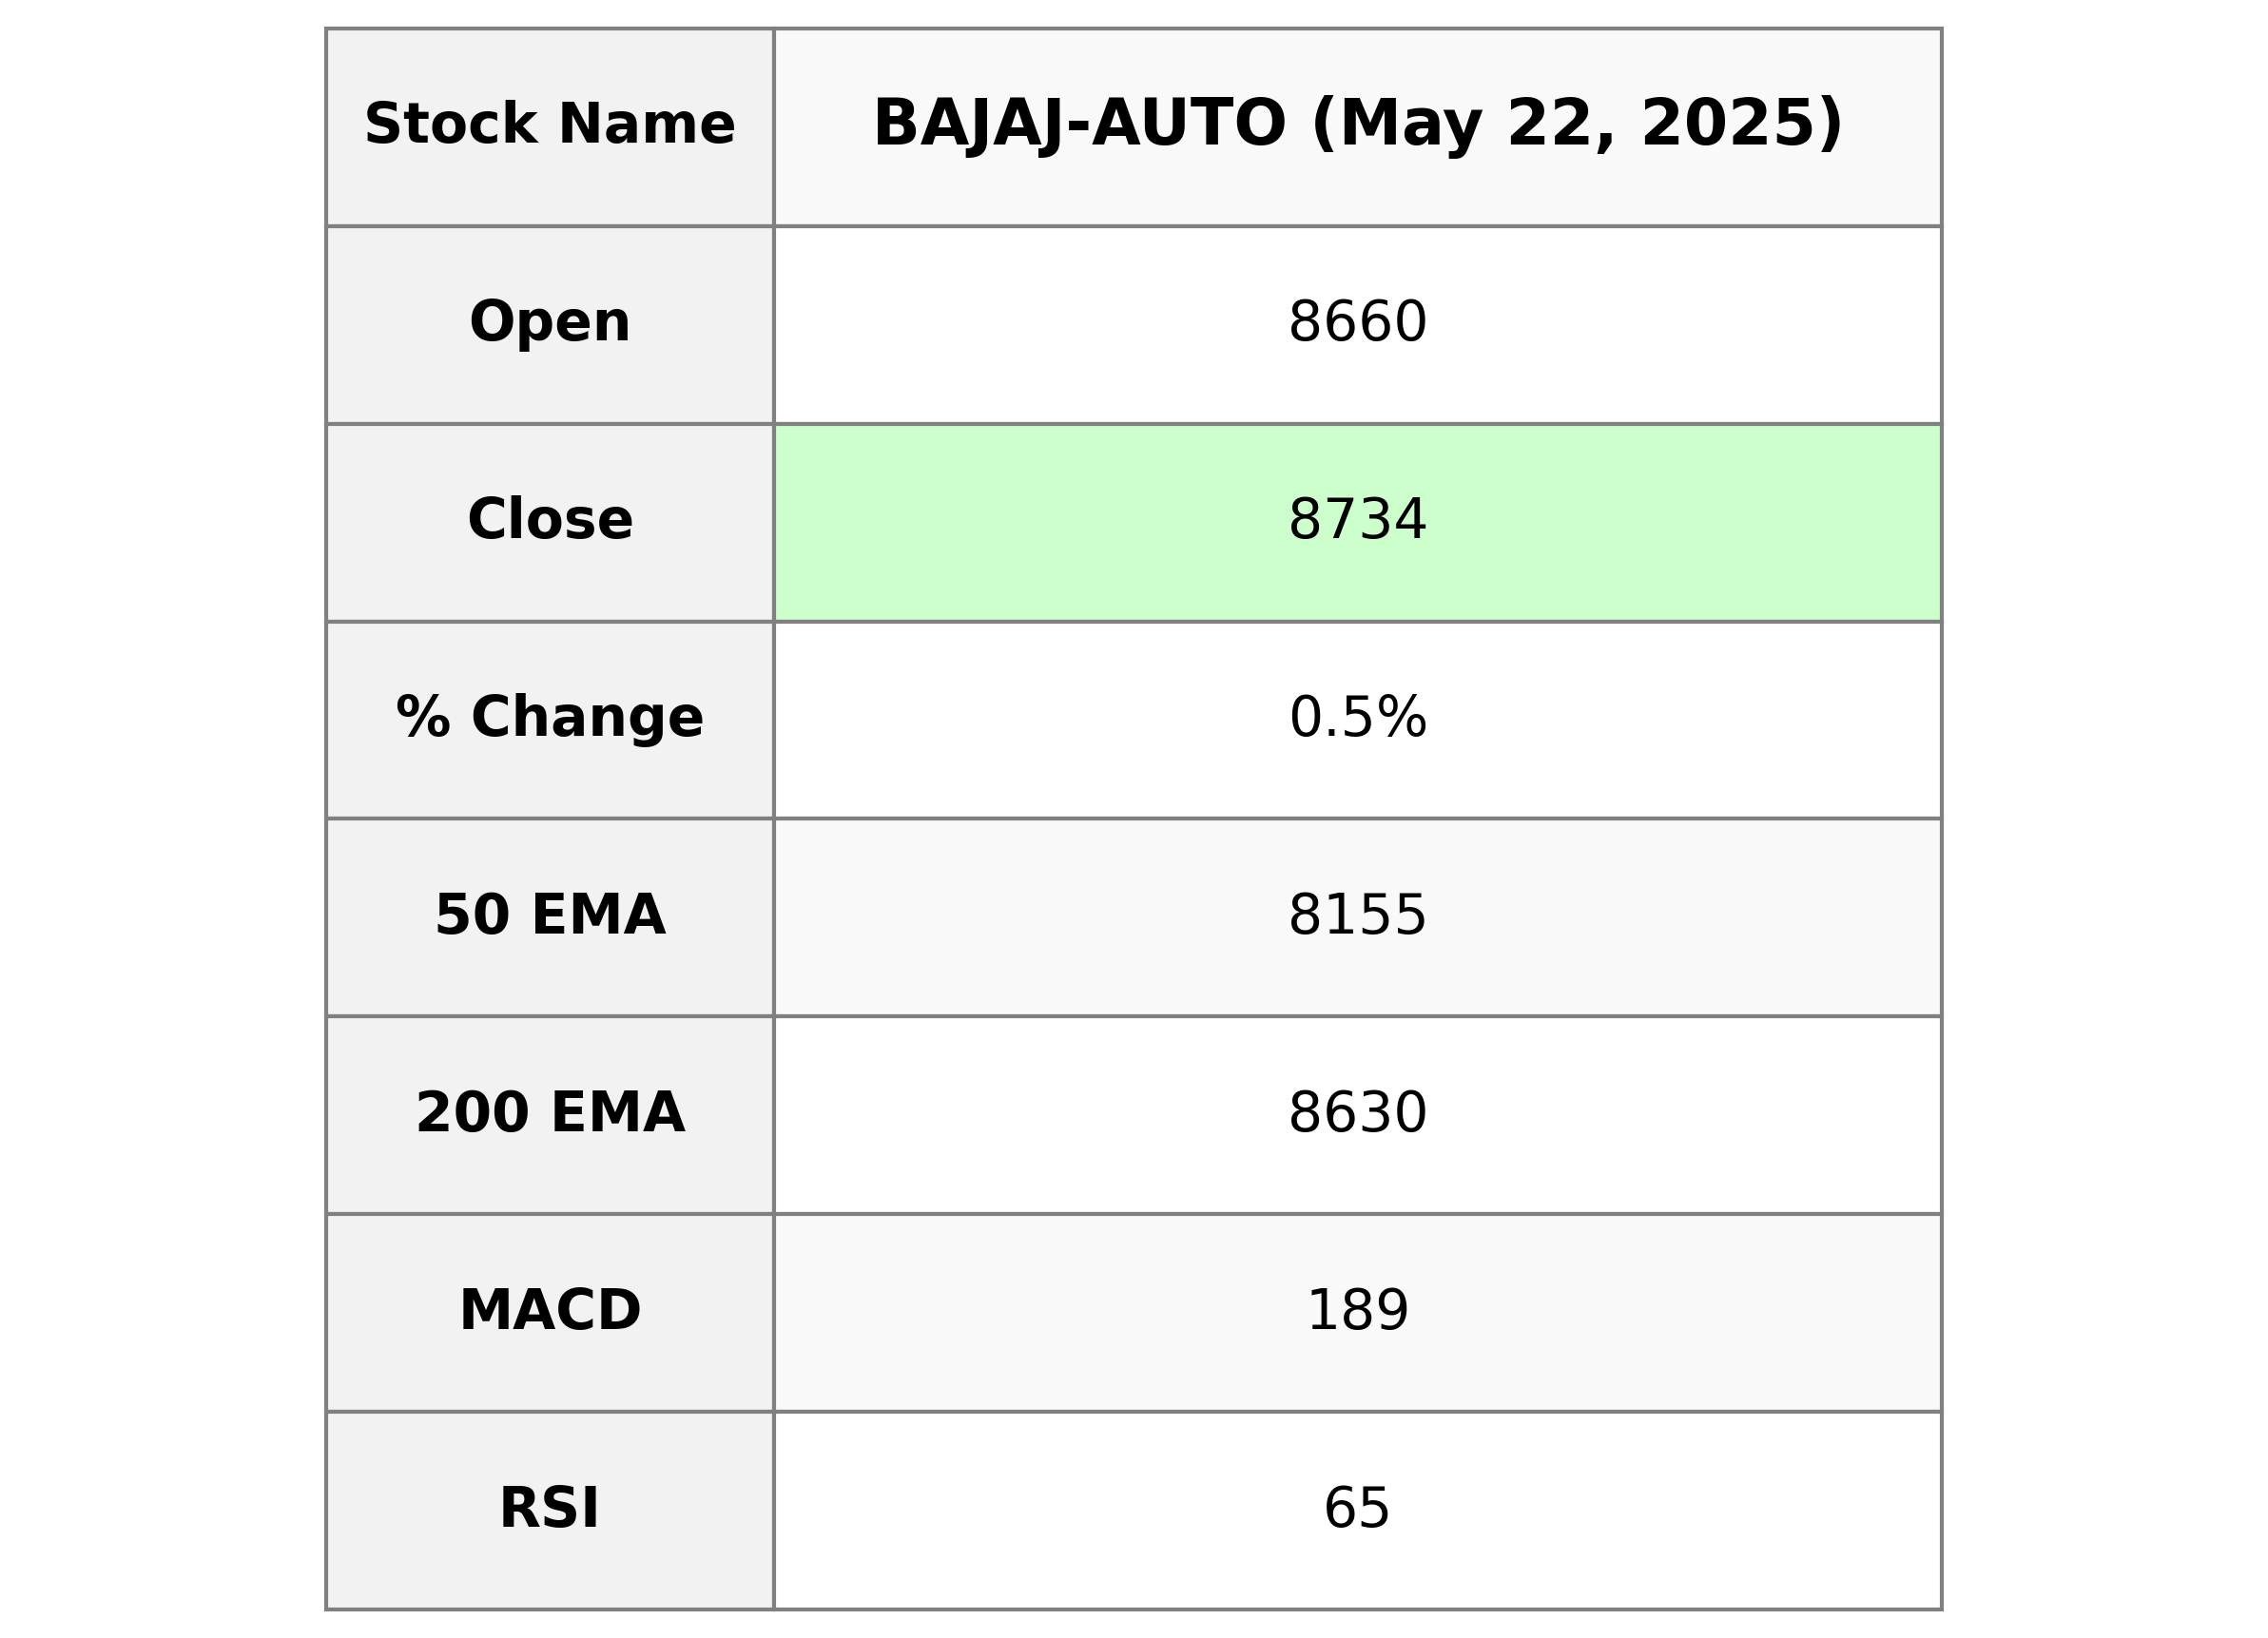
Bajaj Auto Performance Bajaj Auto closed at 8733.5, marking a 0.53% increase from its previous close, with a trading volume of 916,593 shares. The stock currently trades above its 50-day and 200-day EMAs, indicating a bullish trend. With a Market Cap of approximately 2.44 trillion INR and a PE Ratio of 32.43, Bajaj Auto is positioned strongly within the Consumer Cyclical sector, particularly in Auto Manufacturing in India.
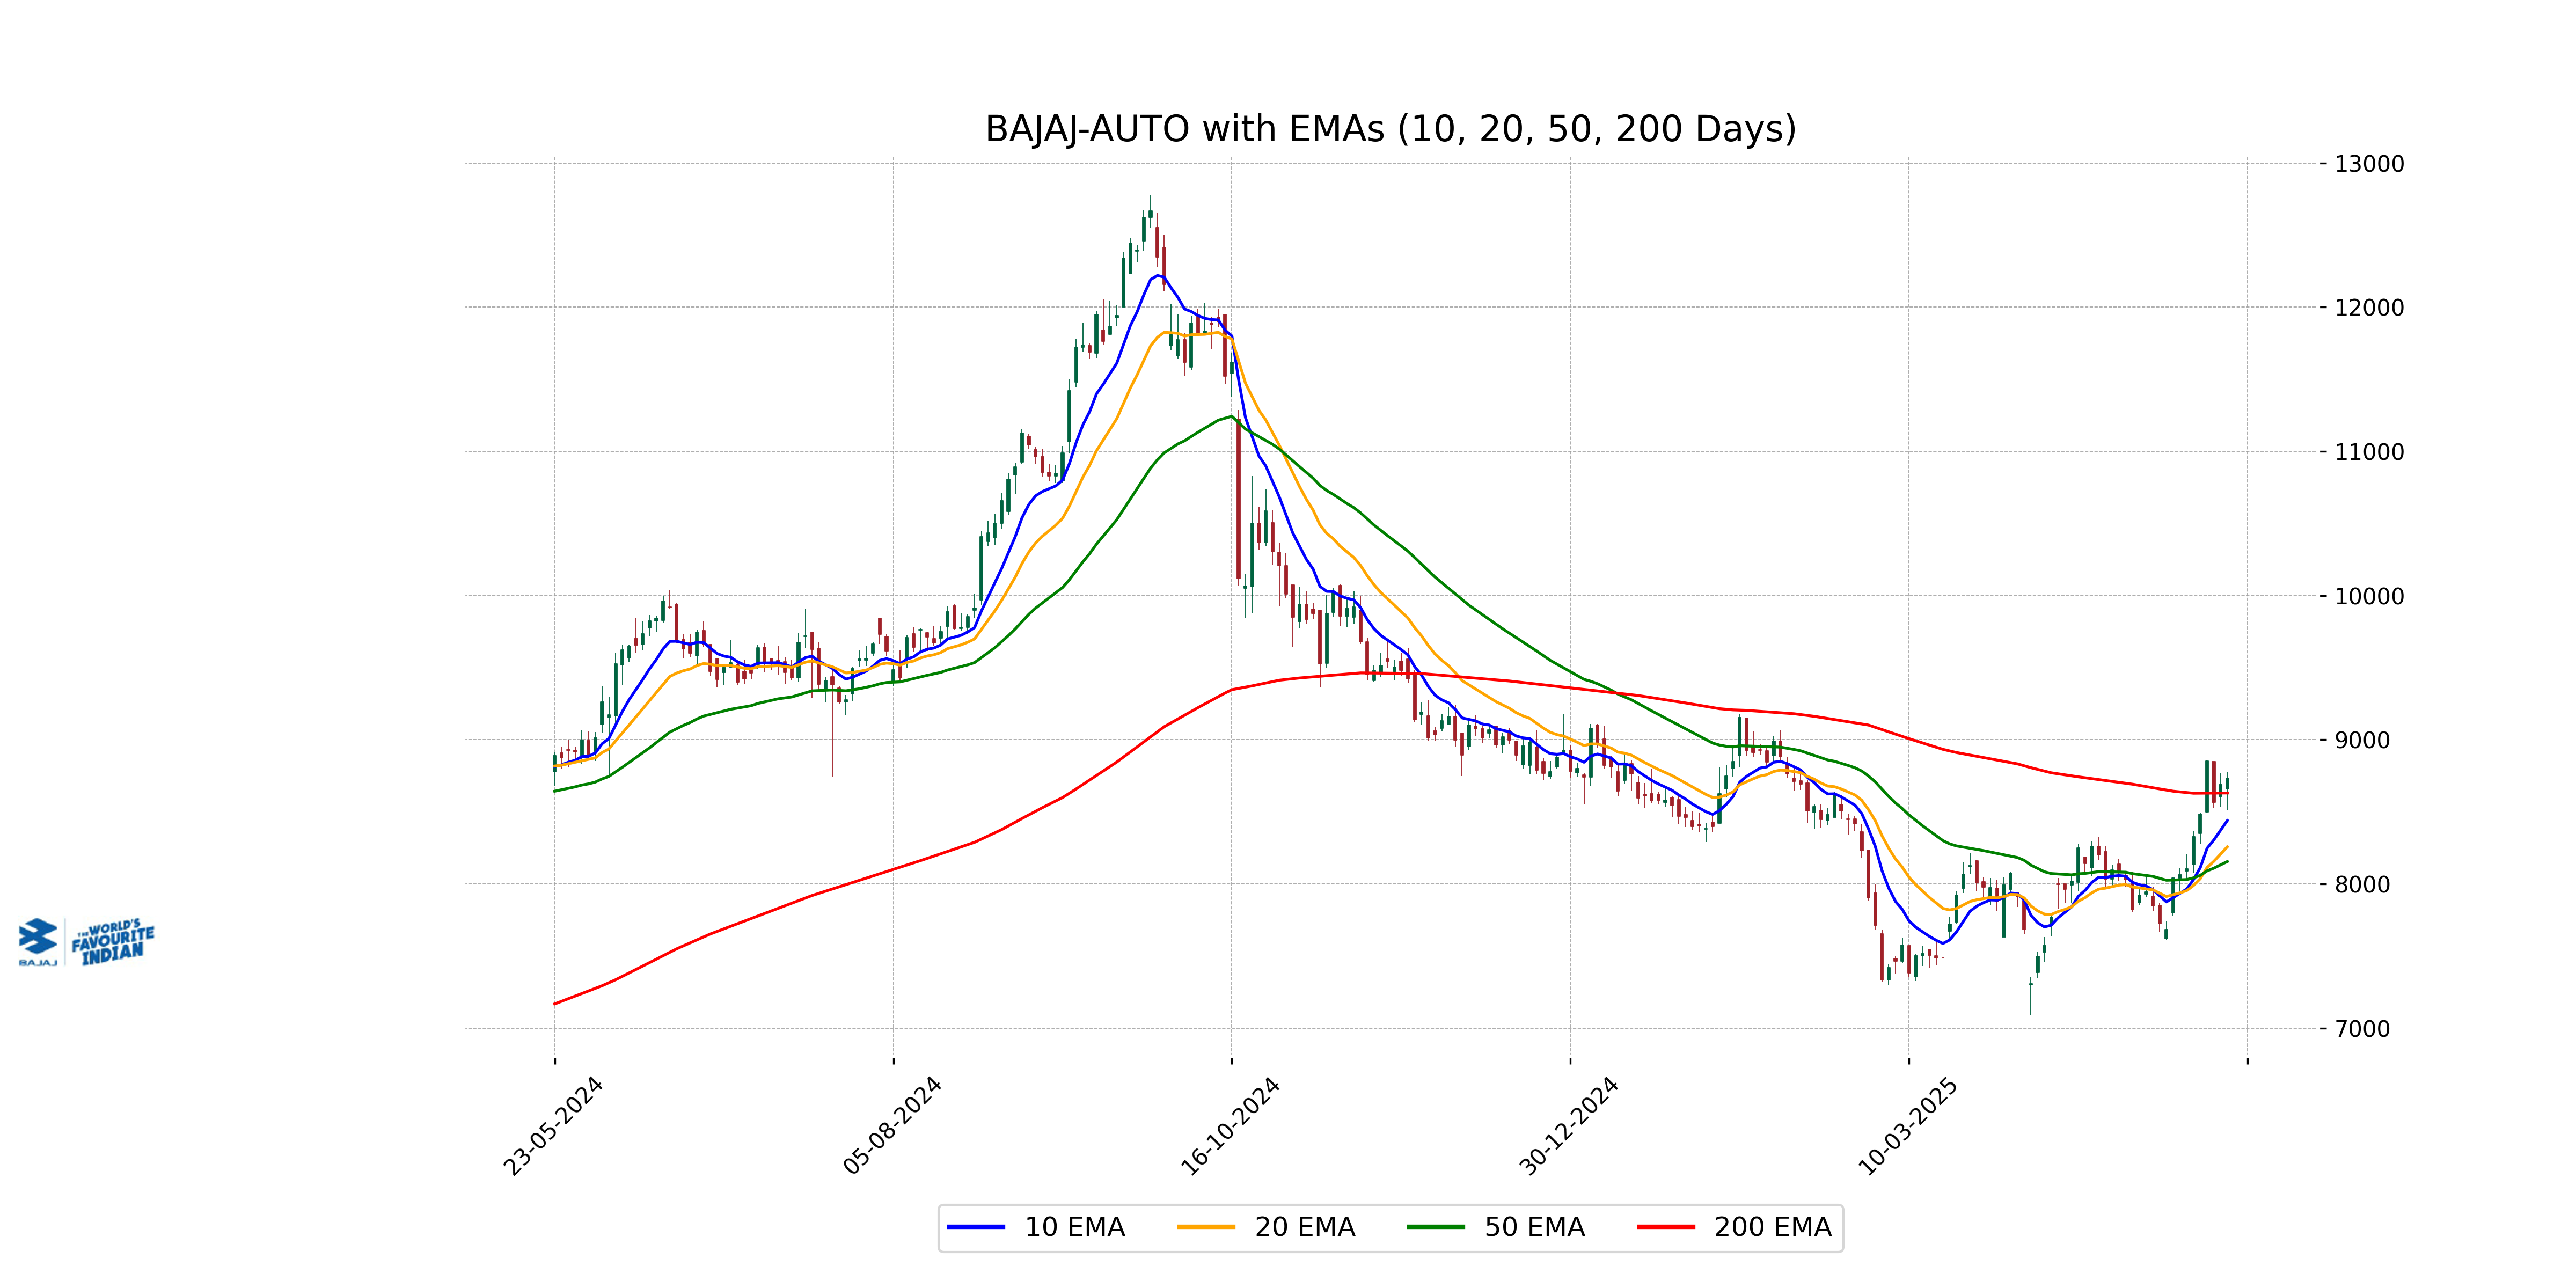
Relationship with Key Moving Averages
Bajaj Auto's closing price of 8733.5 is above its 50-day EMA of 8155.02 and its 200-day EMA of 8630.41, suggesting a bullish trend in the short to long term. Additionally, the close is significantly above both the 10-day EMA of 8439.48 and the 20-day EMA of 8257.17, further indicating strength in the current price movement.
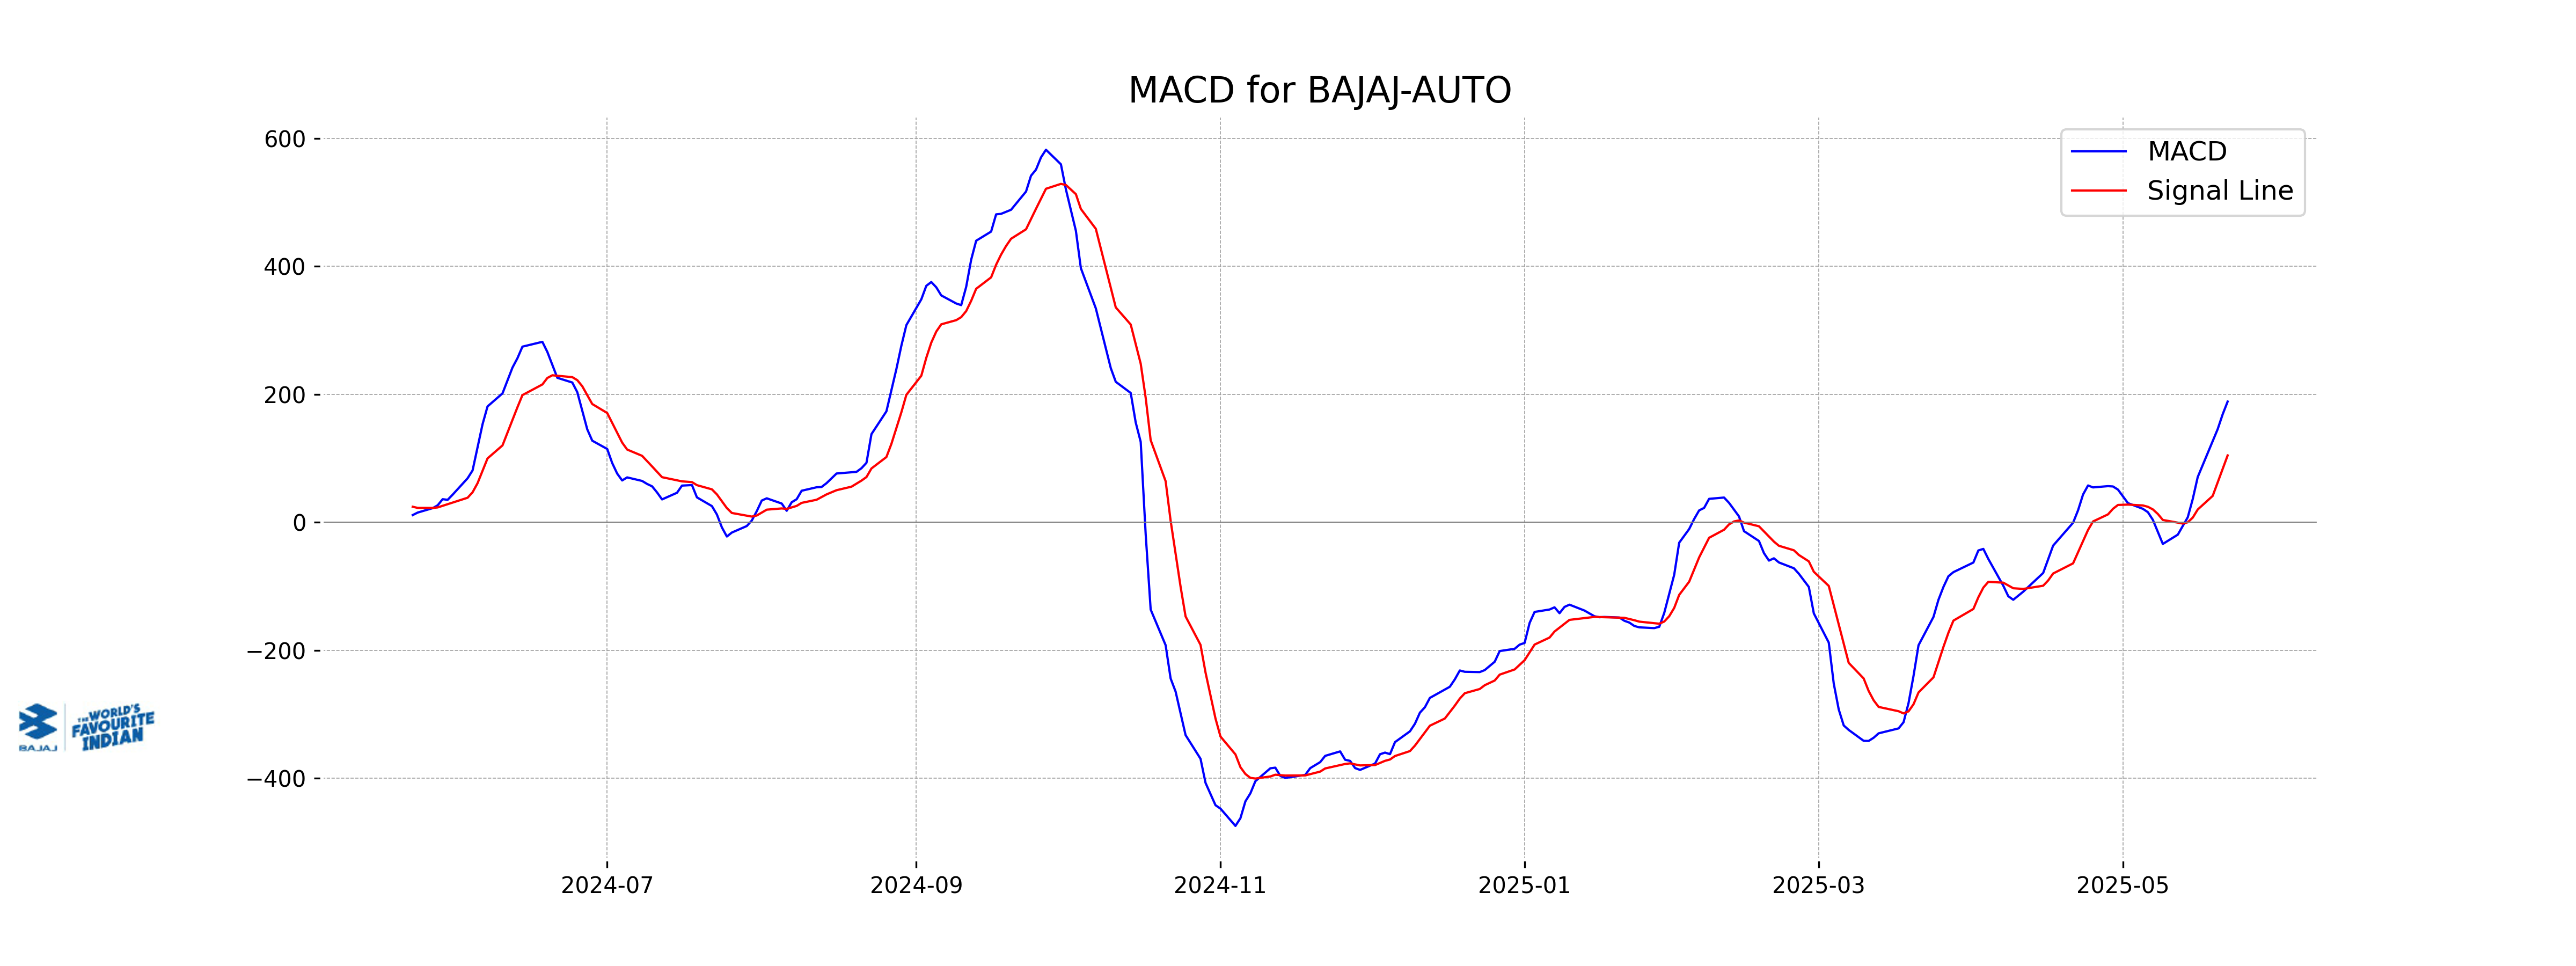
Moving Averages Trend (MACD)
MACD Analysis for Bajaj Auto: The MACD value of 188.72, which is above the MACD Signal line at 104.49, suggests a bullish trend. This indicates increasing upward momentum in the stock's price movement.
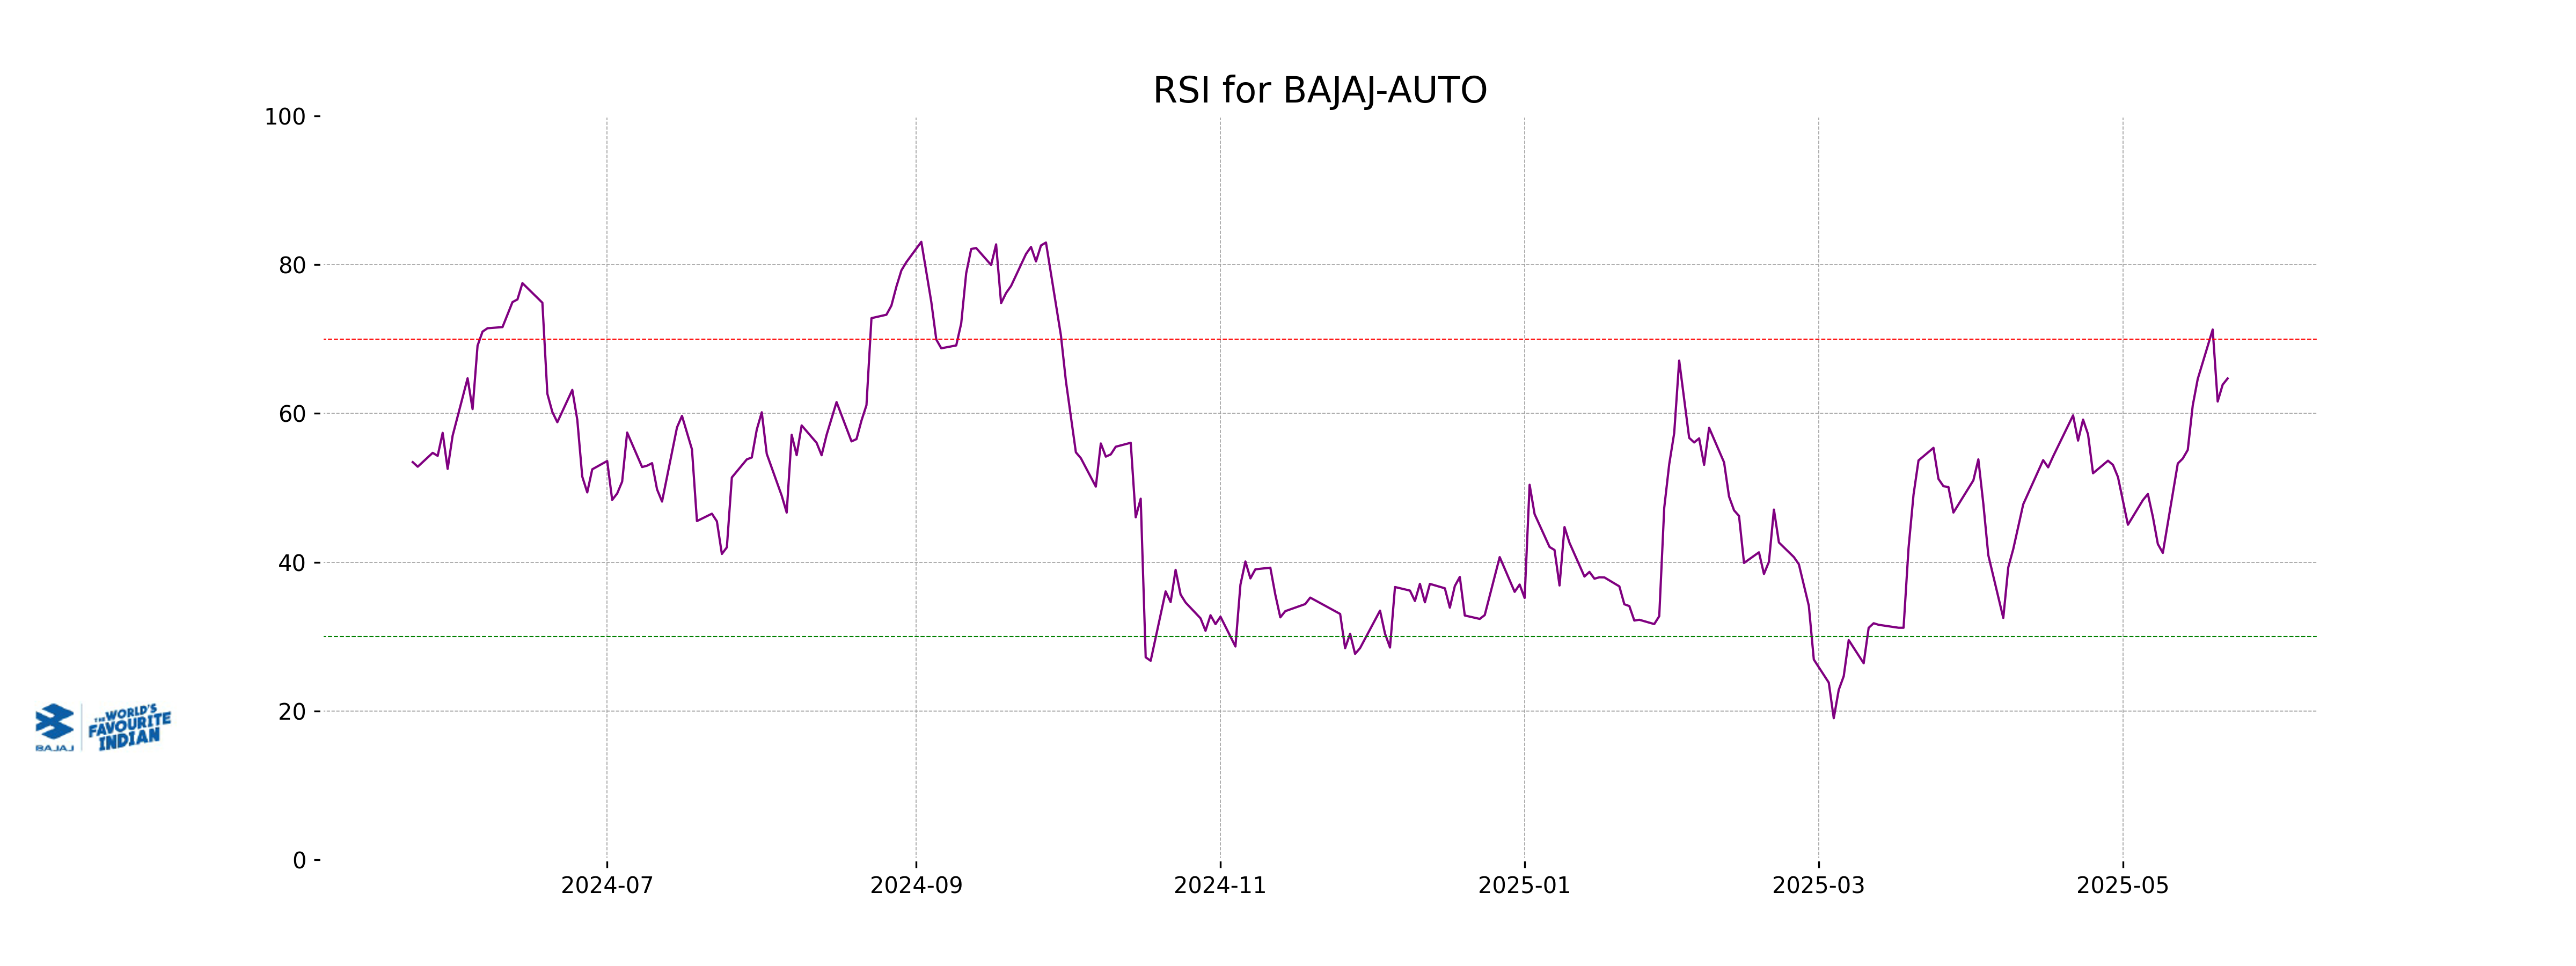
RSI Analysis
The RSI (Relative Strength Index) for Bajaj Auto is 64.71, which indicates that the stock is approaching the overbought zone but is not necessarily overbought yet. Typically, an RSI above 70 suggests overbought conditions, while an RSI below 30 suggests oversold conditions. Thus, there may still be room for upward movement, but caution is advised as it nears the 70 mark.
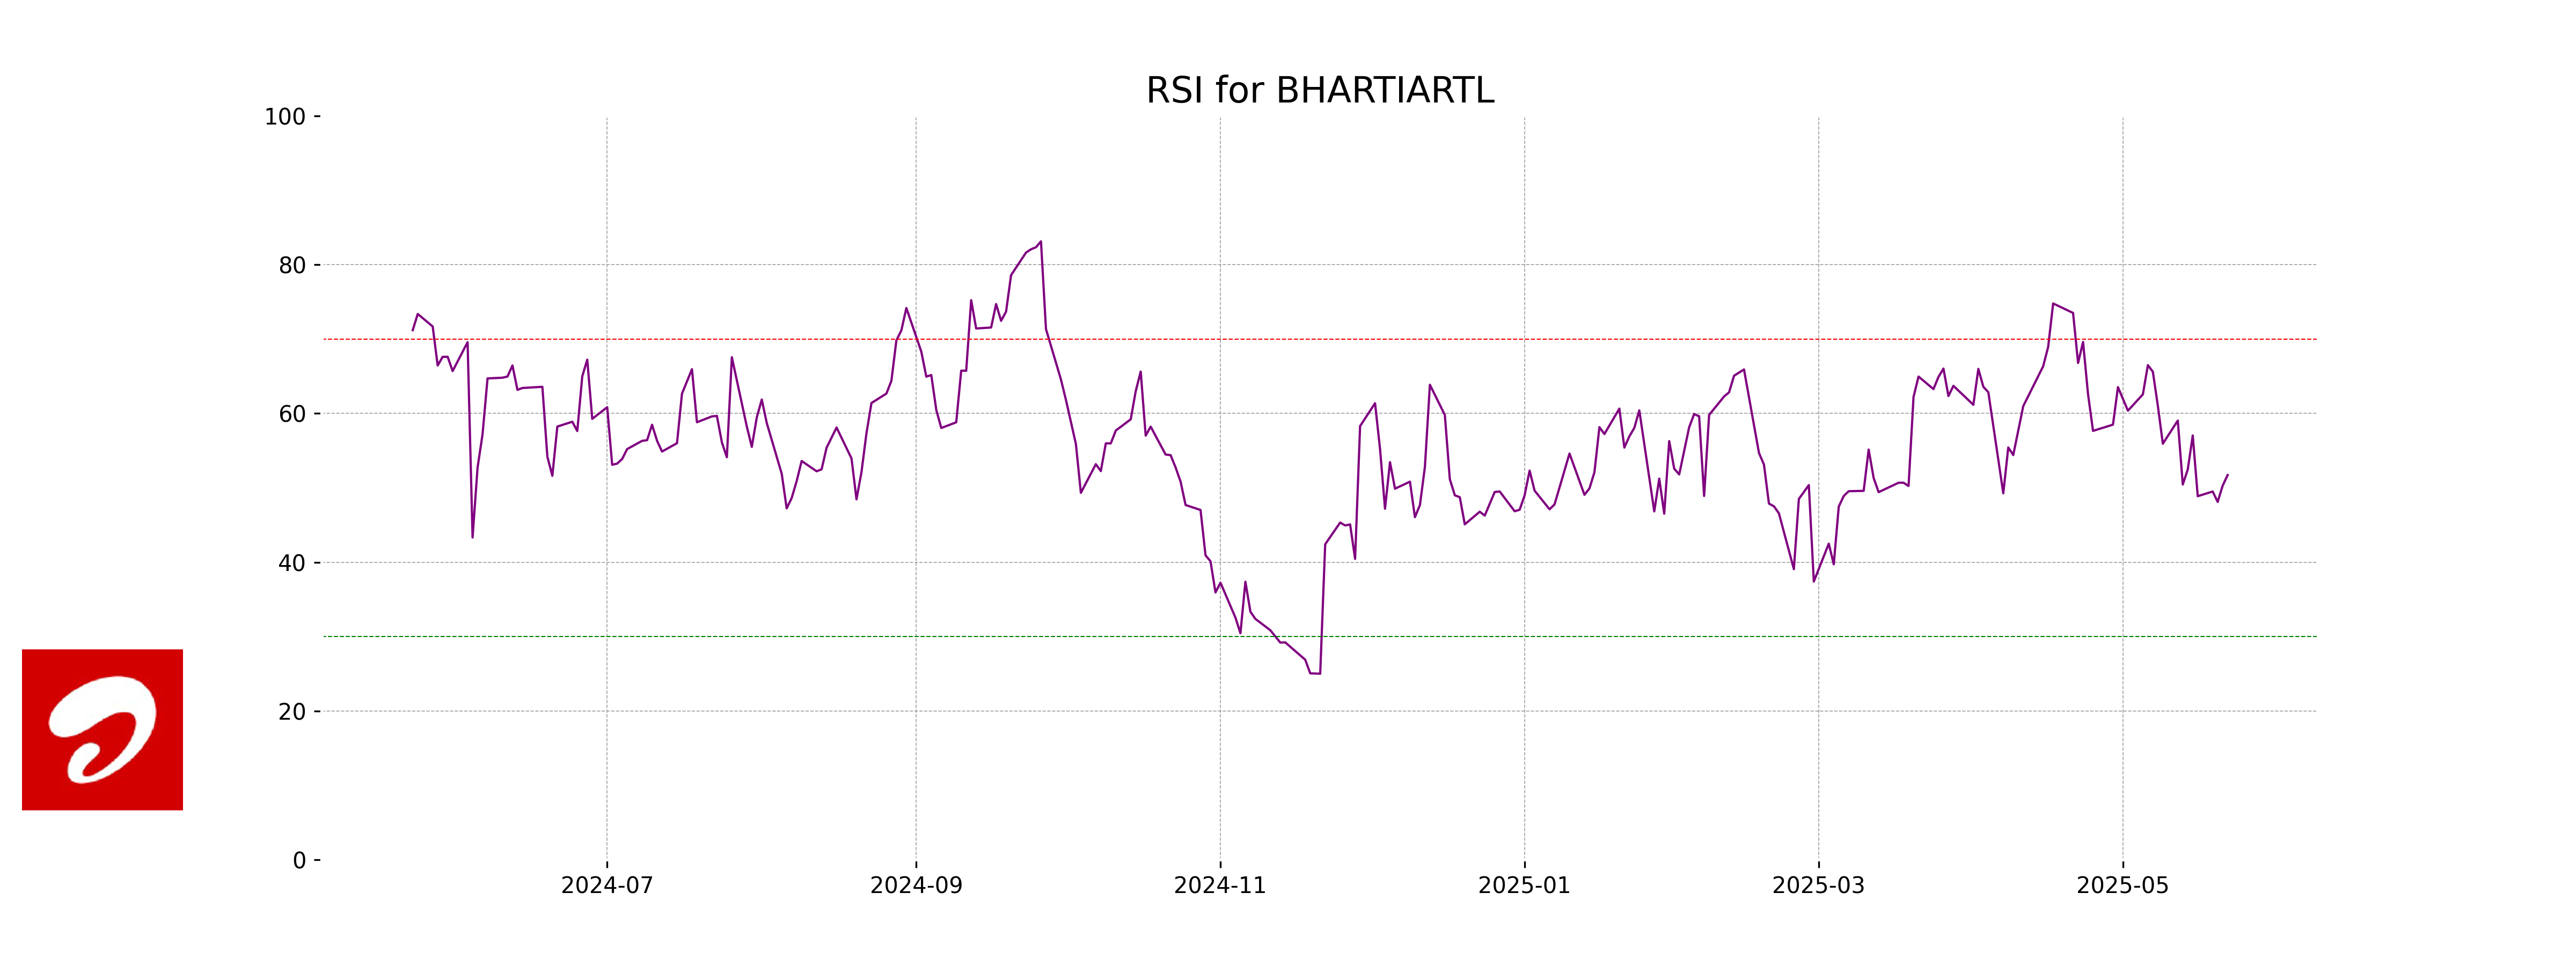
Analysis for Bharti Airtel - May 22, 2025
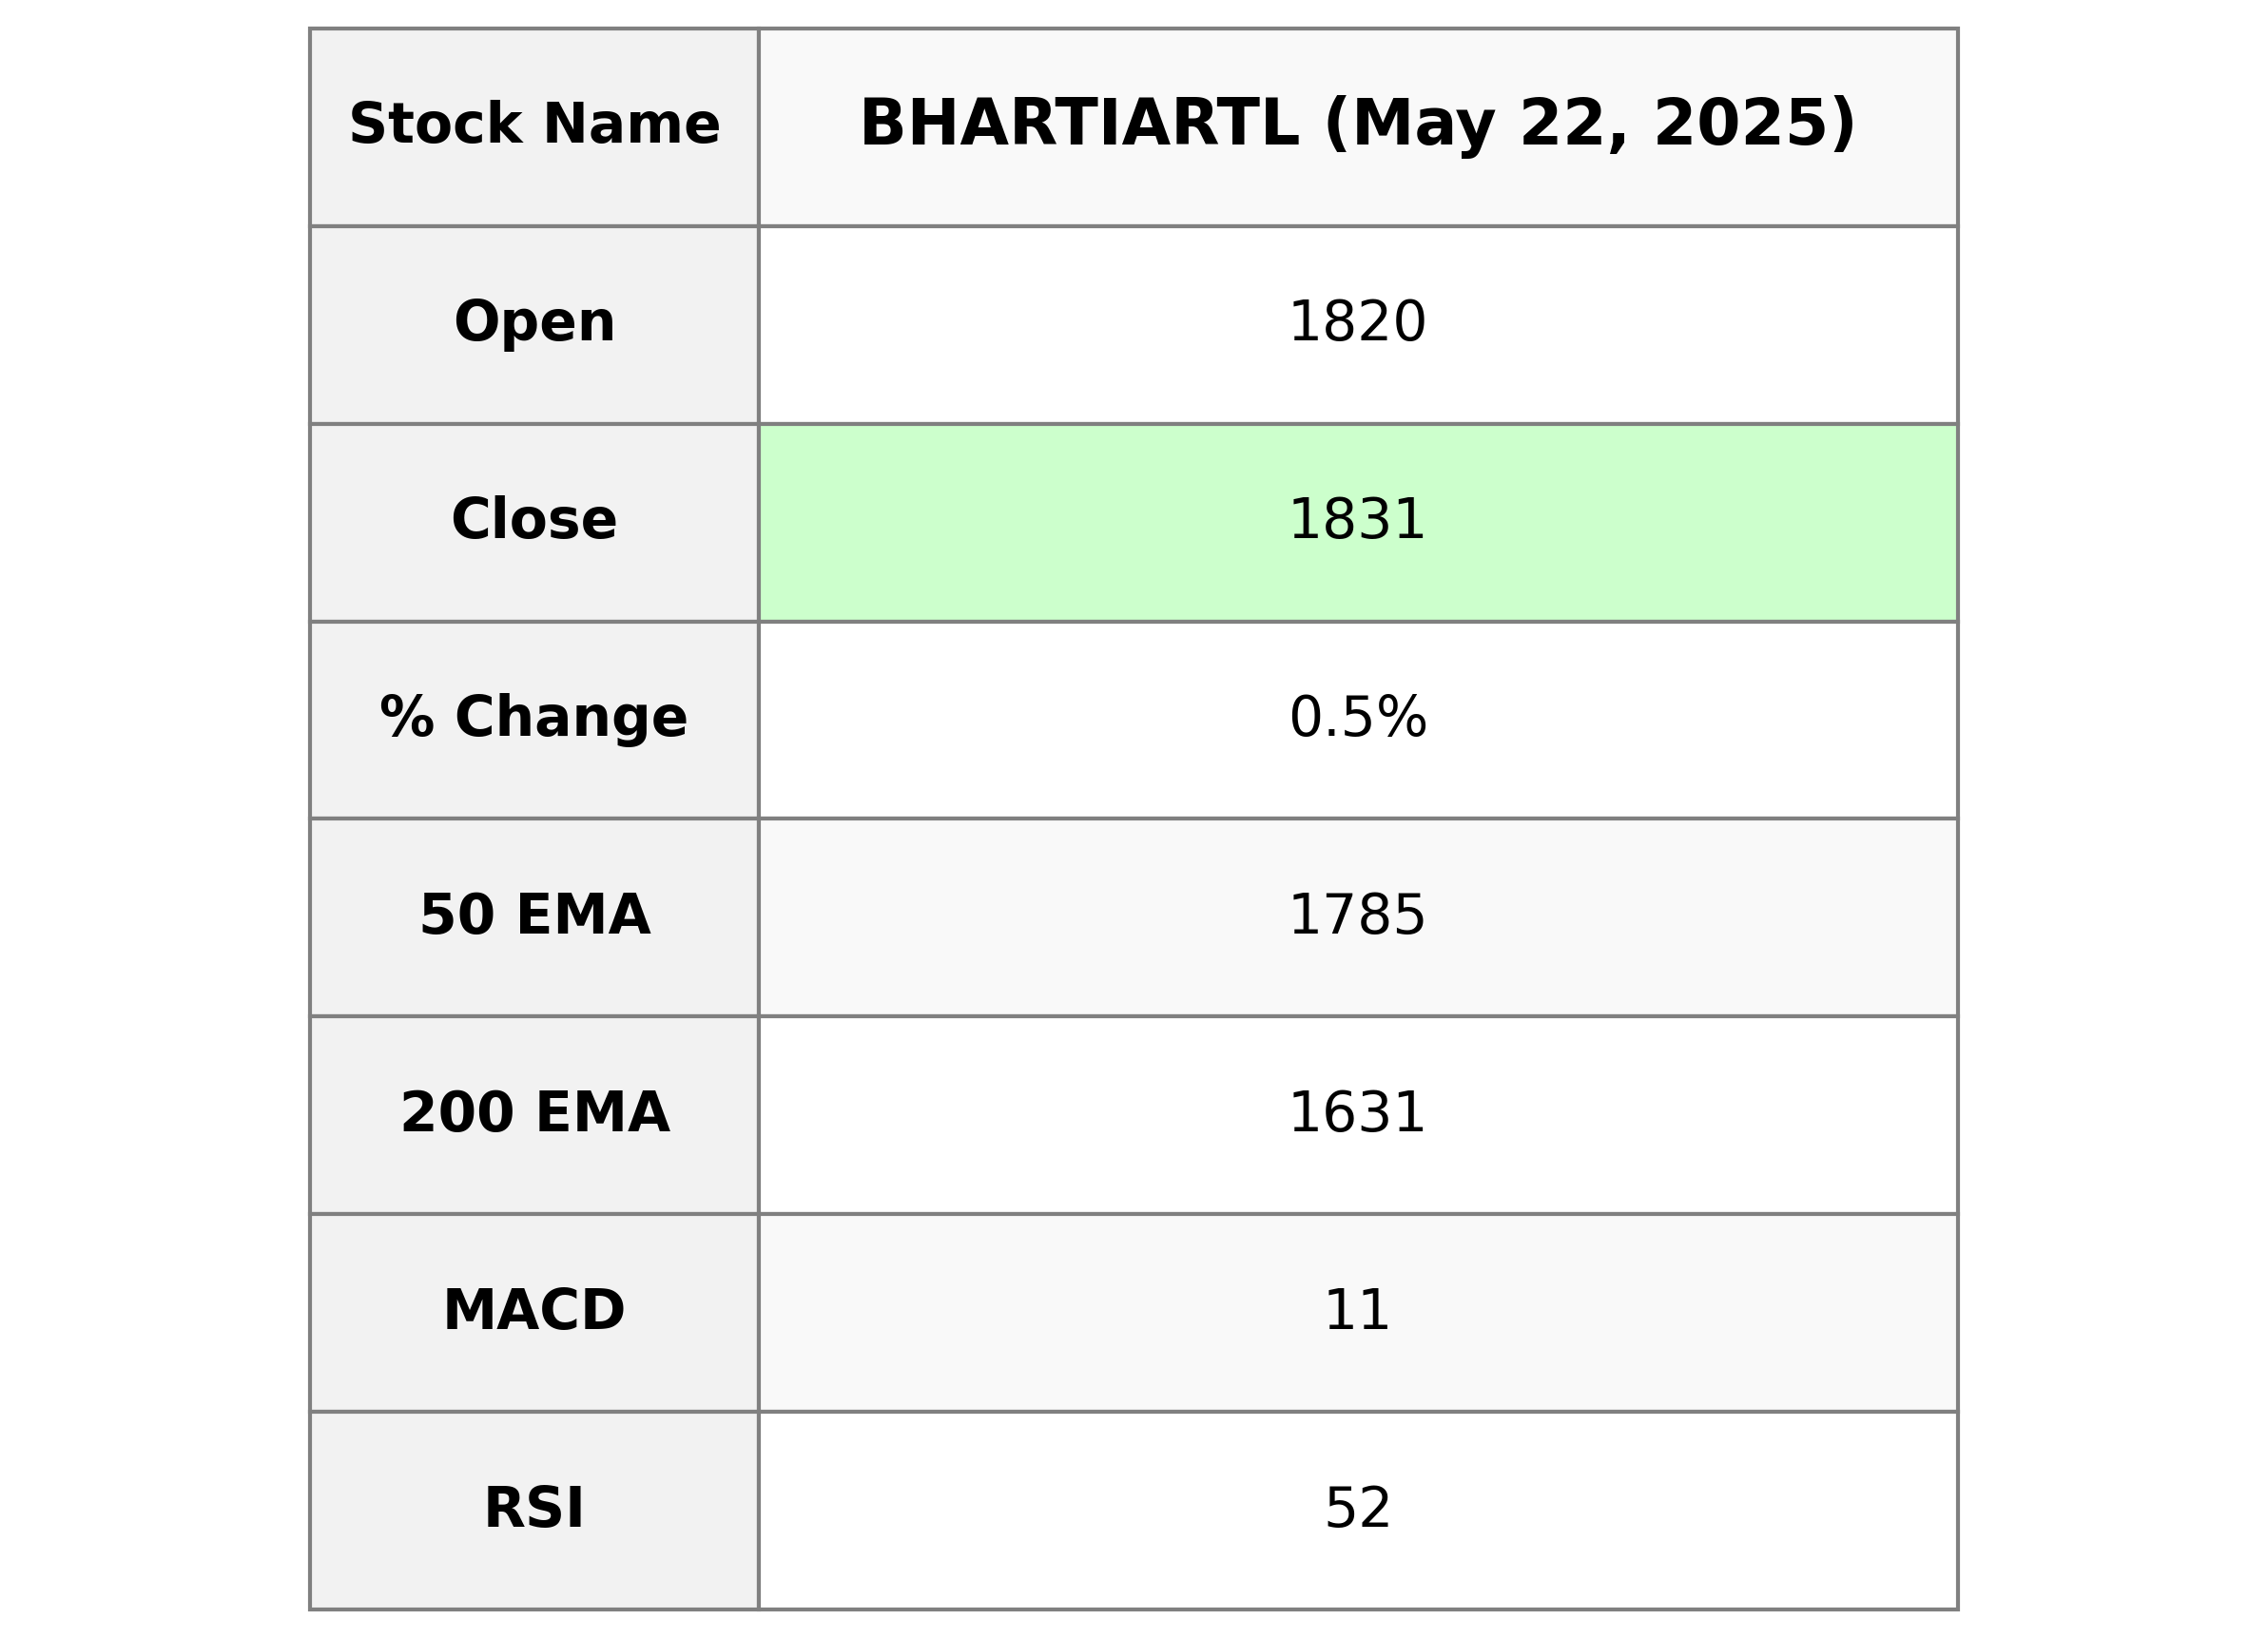
Bharti Airtel Performance Overview Bharti Airtel experienced a slight increase in stock price with a closing at 1831.40, marking a percentage change of 0.49%. The company, operating in the Communication Services sector of the Telecom Services industry in India, holds a market cap of 10,974,701,551,616 INR and a PE ratio of 32.73. The RSI of 51.72 suggests a balanced momentum, while the stock's recent performance has edged above both the 50-day and 200-day EMA, indicating a gradual upward trend.
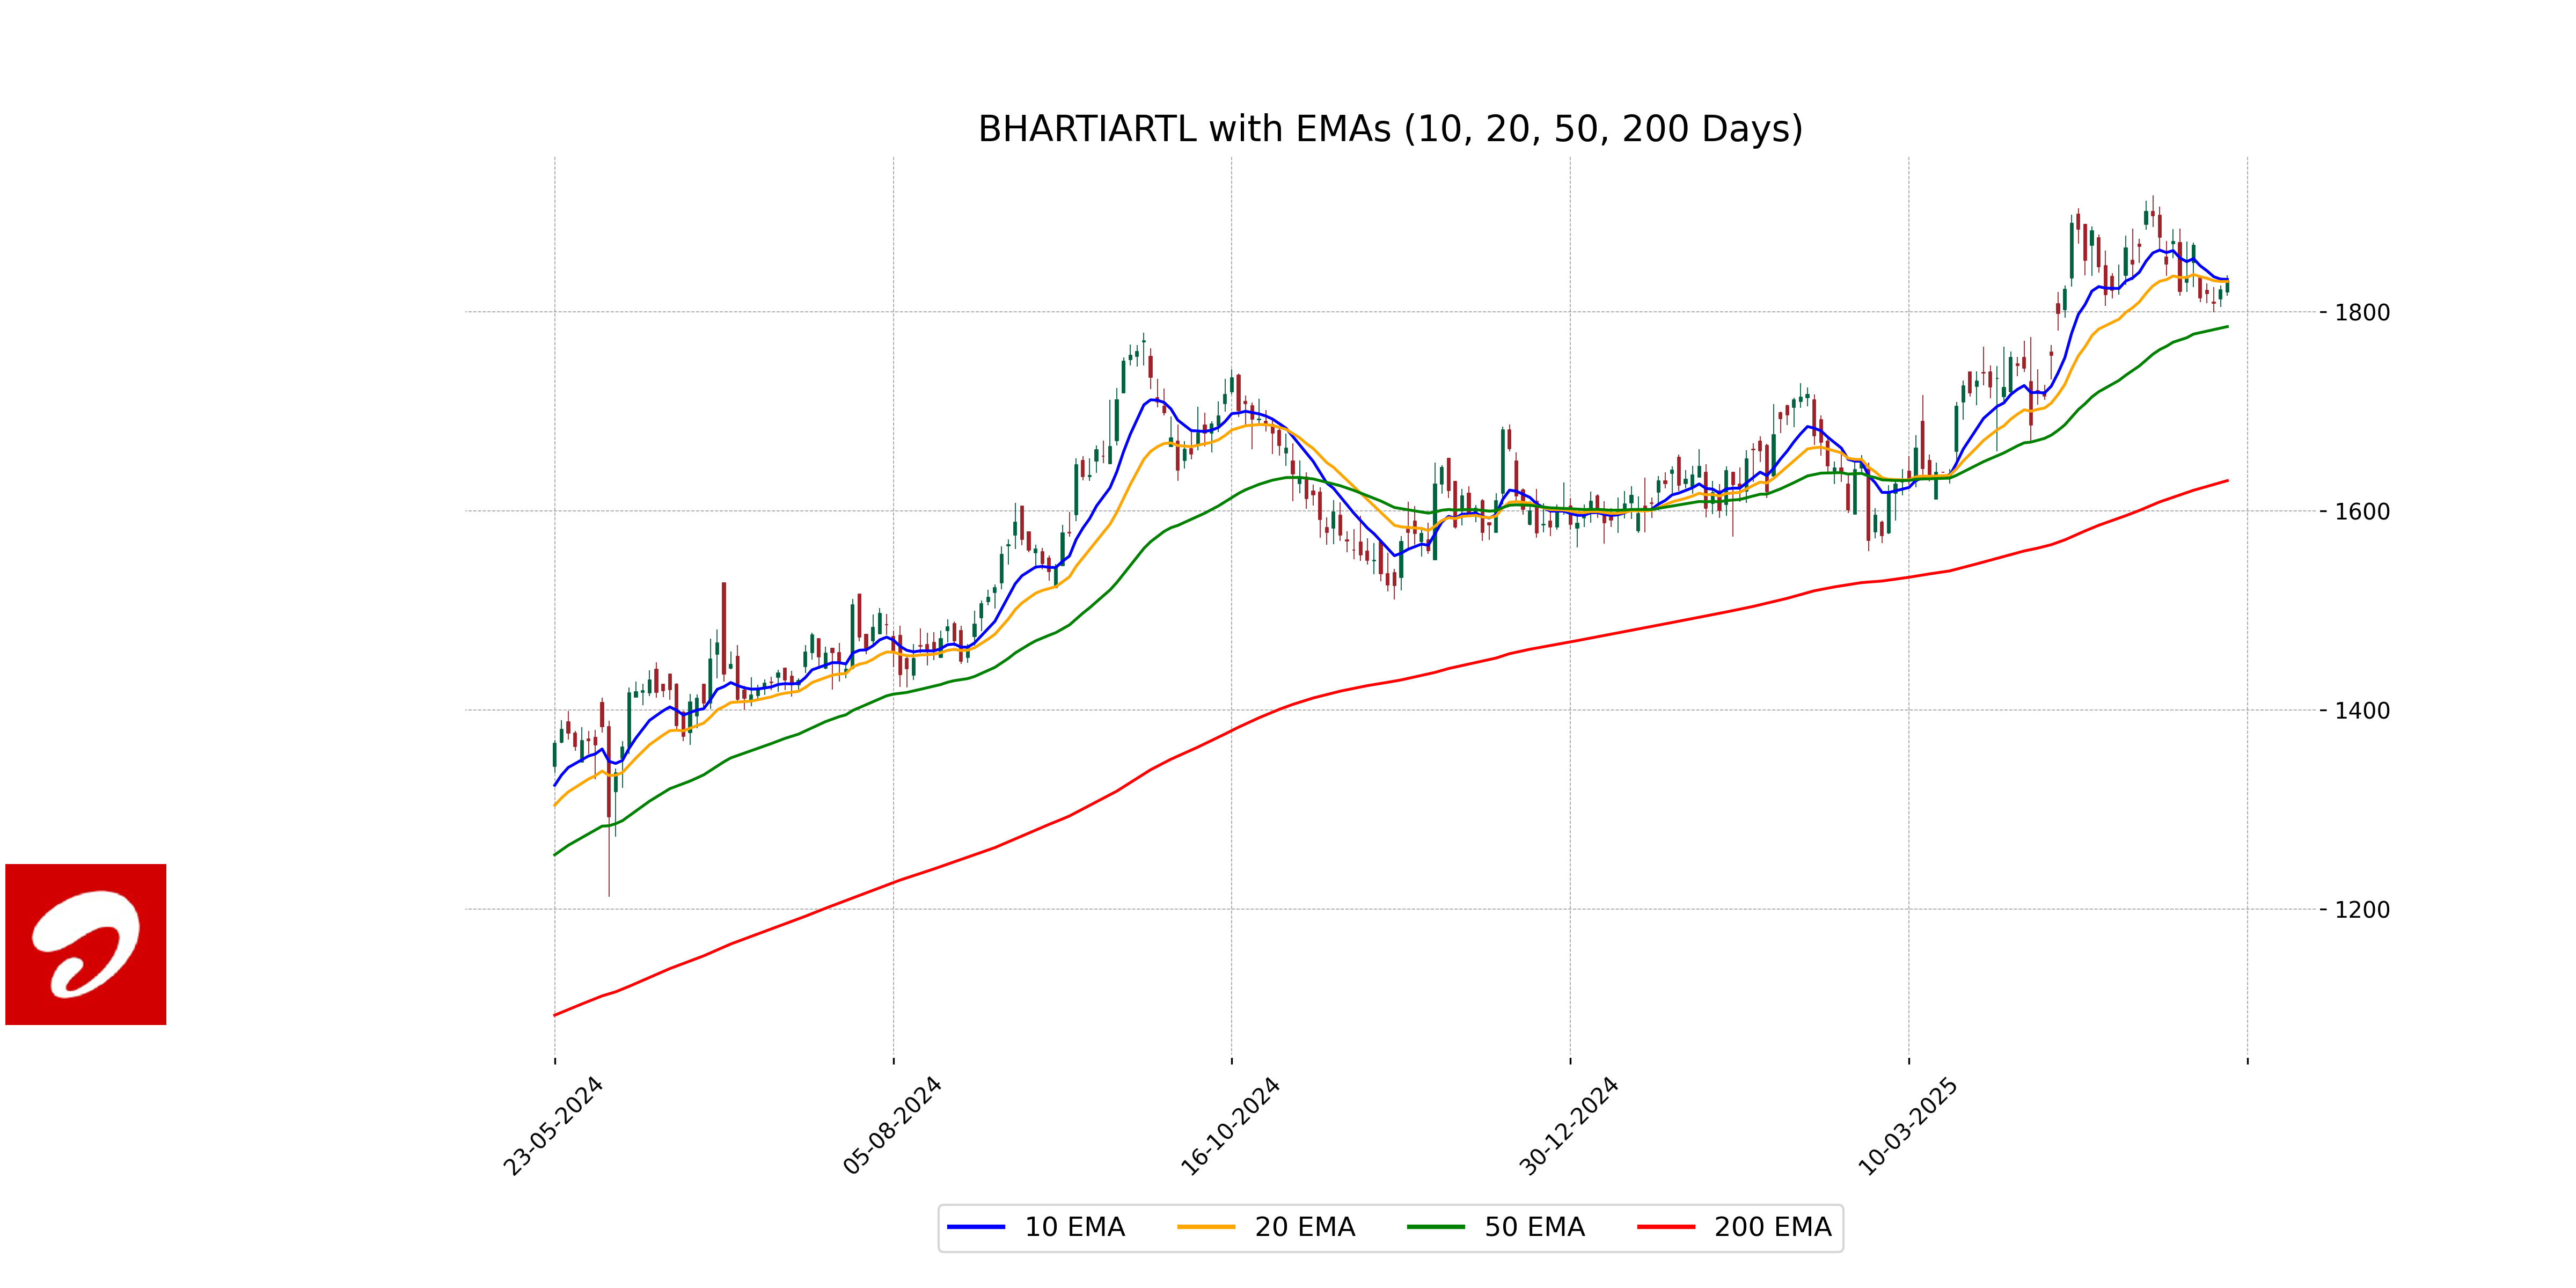
Relationship with Key Moving Averages
Bharti Airtel's current closing price of 1831.40 is above its 50-day Exponential Moving Average (EMA) of 1785.29 and significantly higher than its 200-day EMA of 1630.53, indicating a bullish trend over the long term. However, it is slightly below the 10-day EMA of 1832.76 and above the 20-day EMA of 1830.69, reflecting short-term support around these levels.
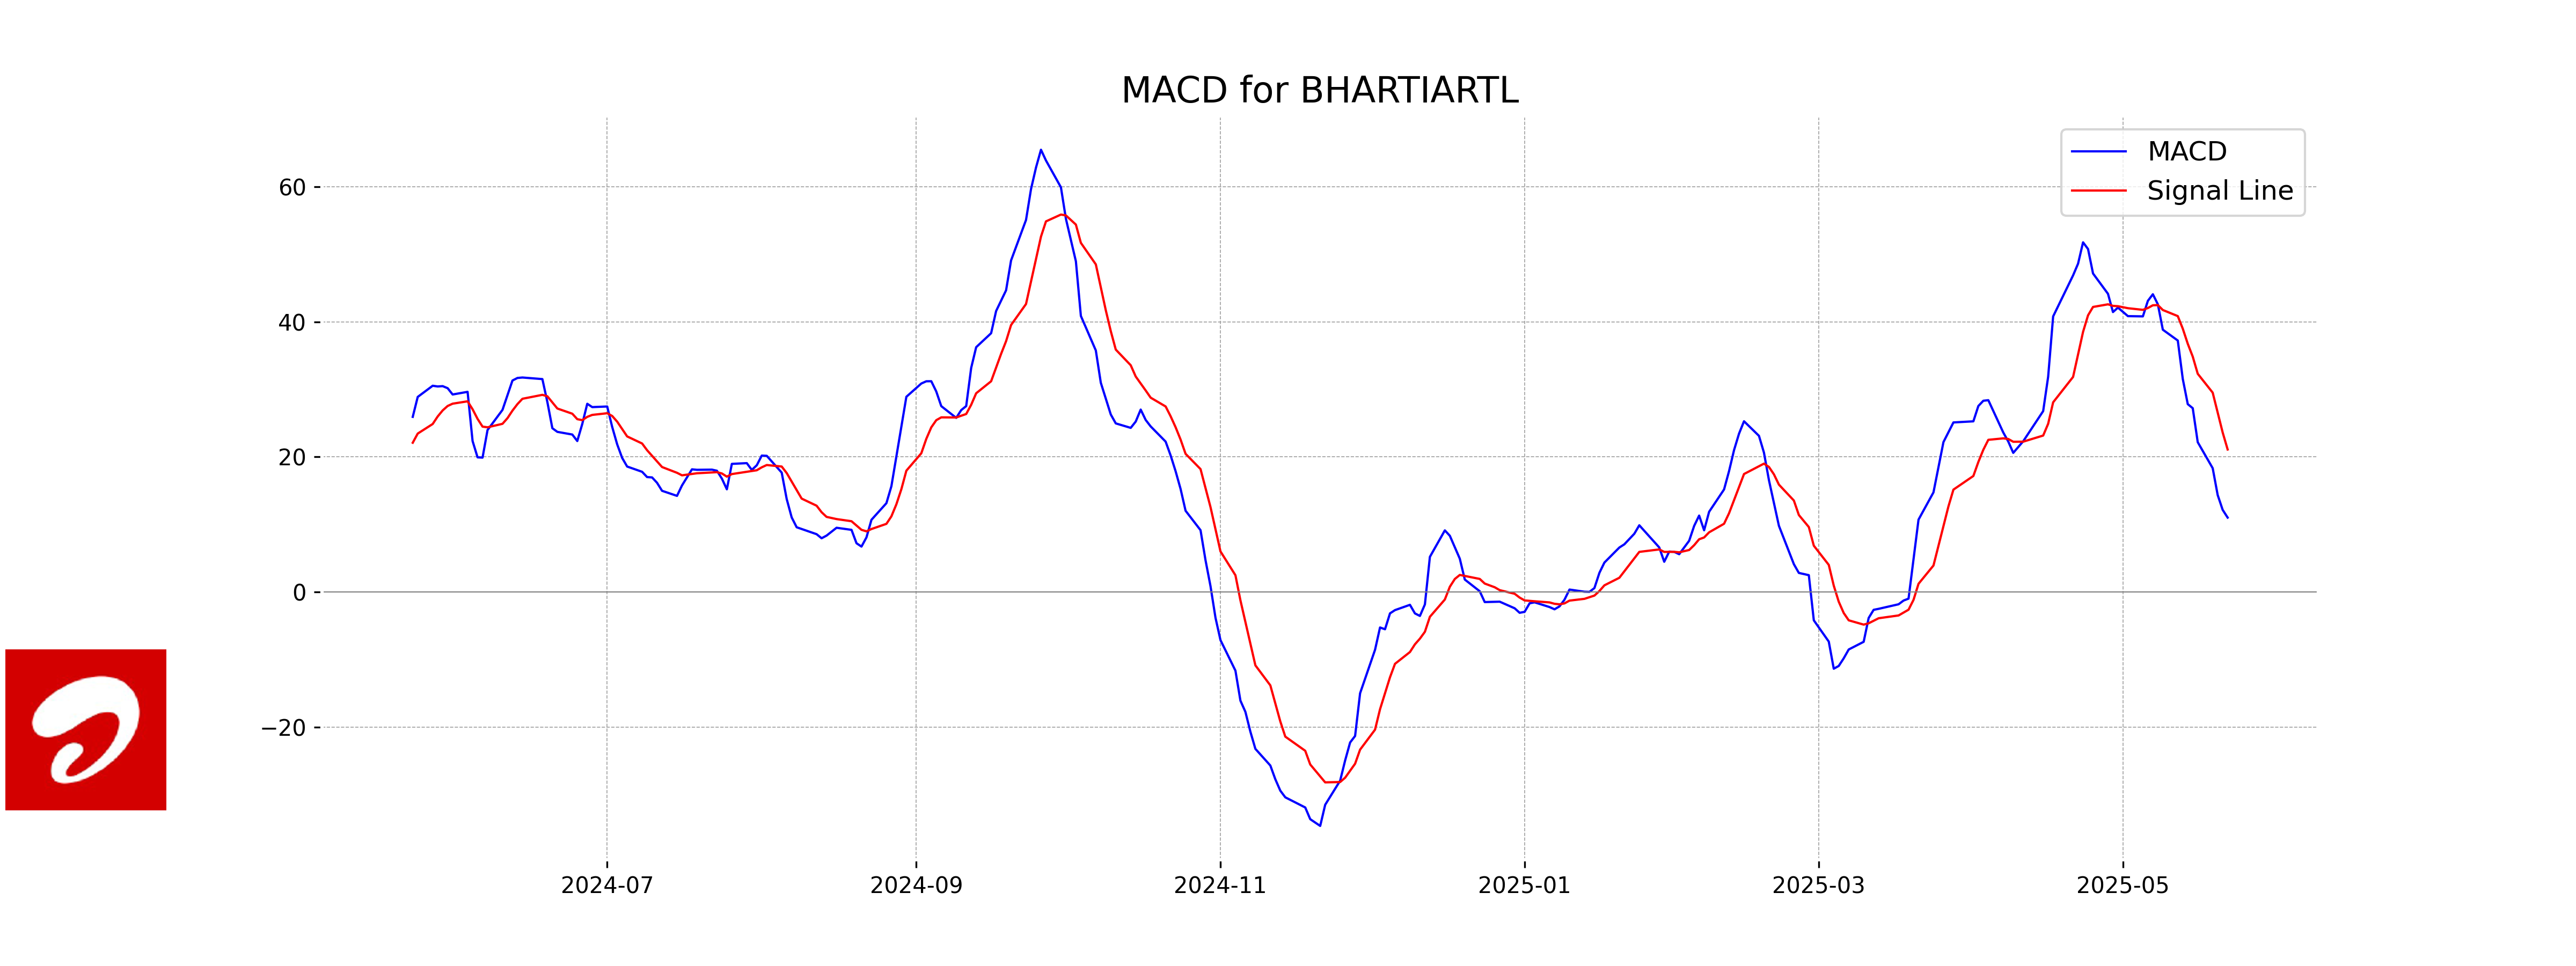
Moving Averages Trend (MACD)
The MACD for Bharti Airtel is 11.01, while the MACD Signal is 21.09. This indicates a bearish crossover signal, as the MACD line is below the signal line. This situation can suggest potential weakness in the stock's recent uptrend.
RSI Analysis
Based on the data provided, Bharti Airtel has a Relative Strength Index (RSI) of 51.72. This indicates a neutral market condition, suggesting that the stock is neither overbought nor oversold at the current level. An RSI between 30 and 70 typically signifies a stable momentum.
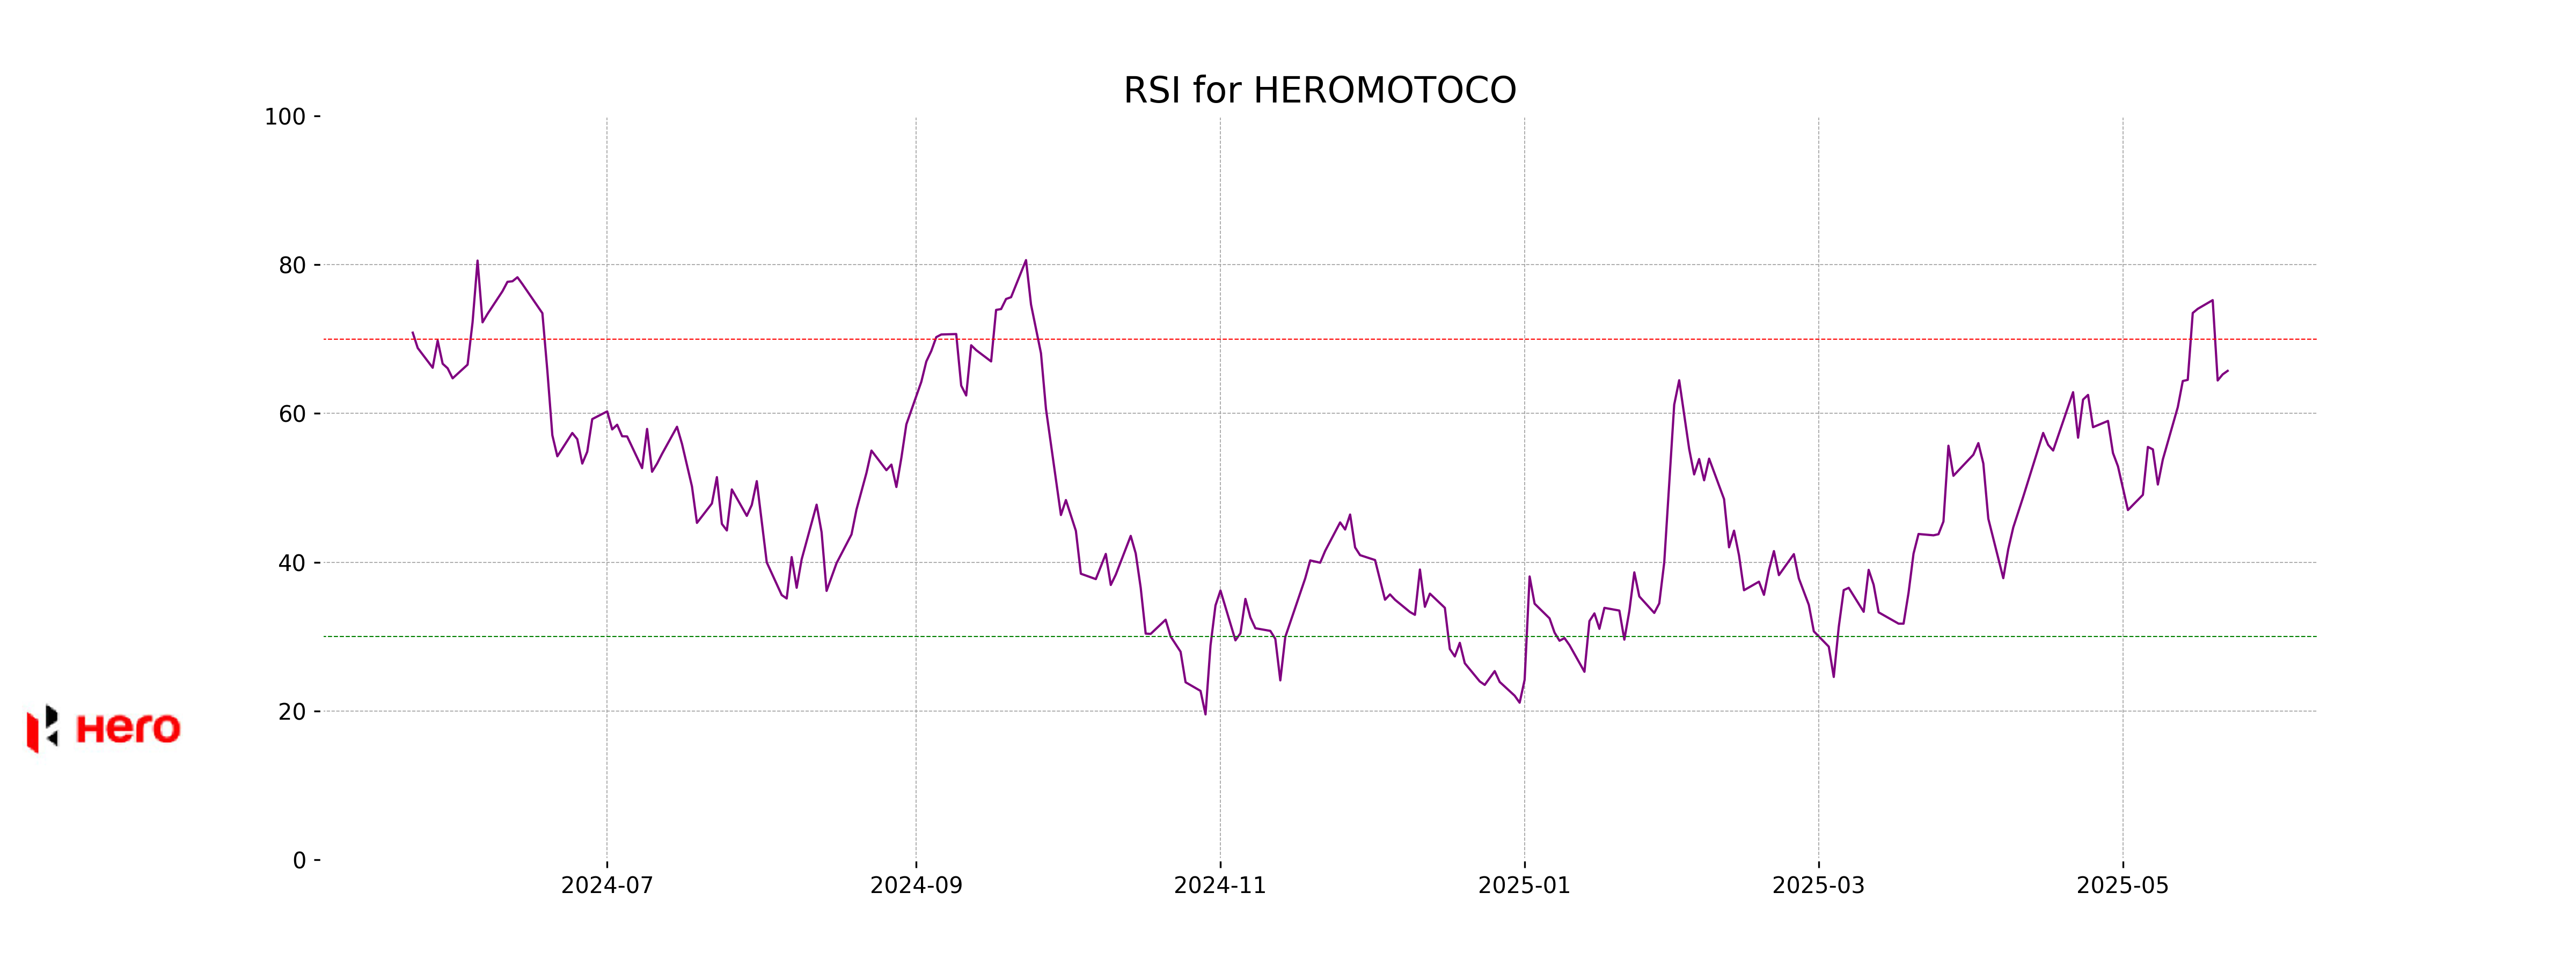
Analysis for Hero MotoCorp - May 22, 2025
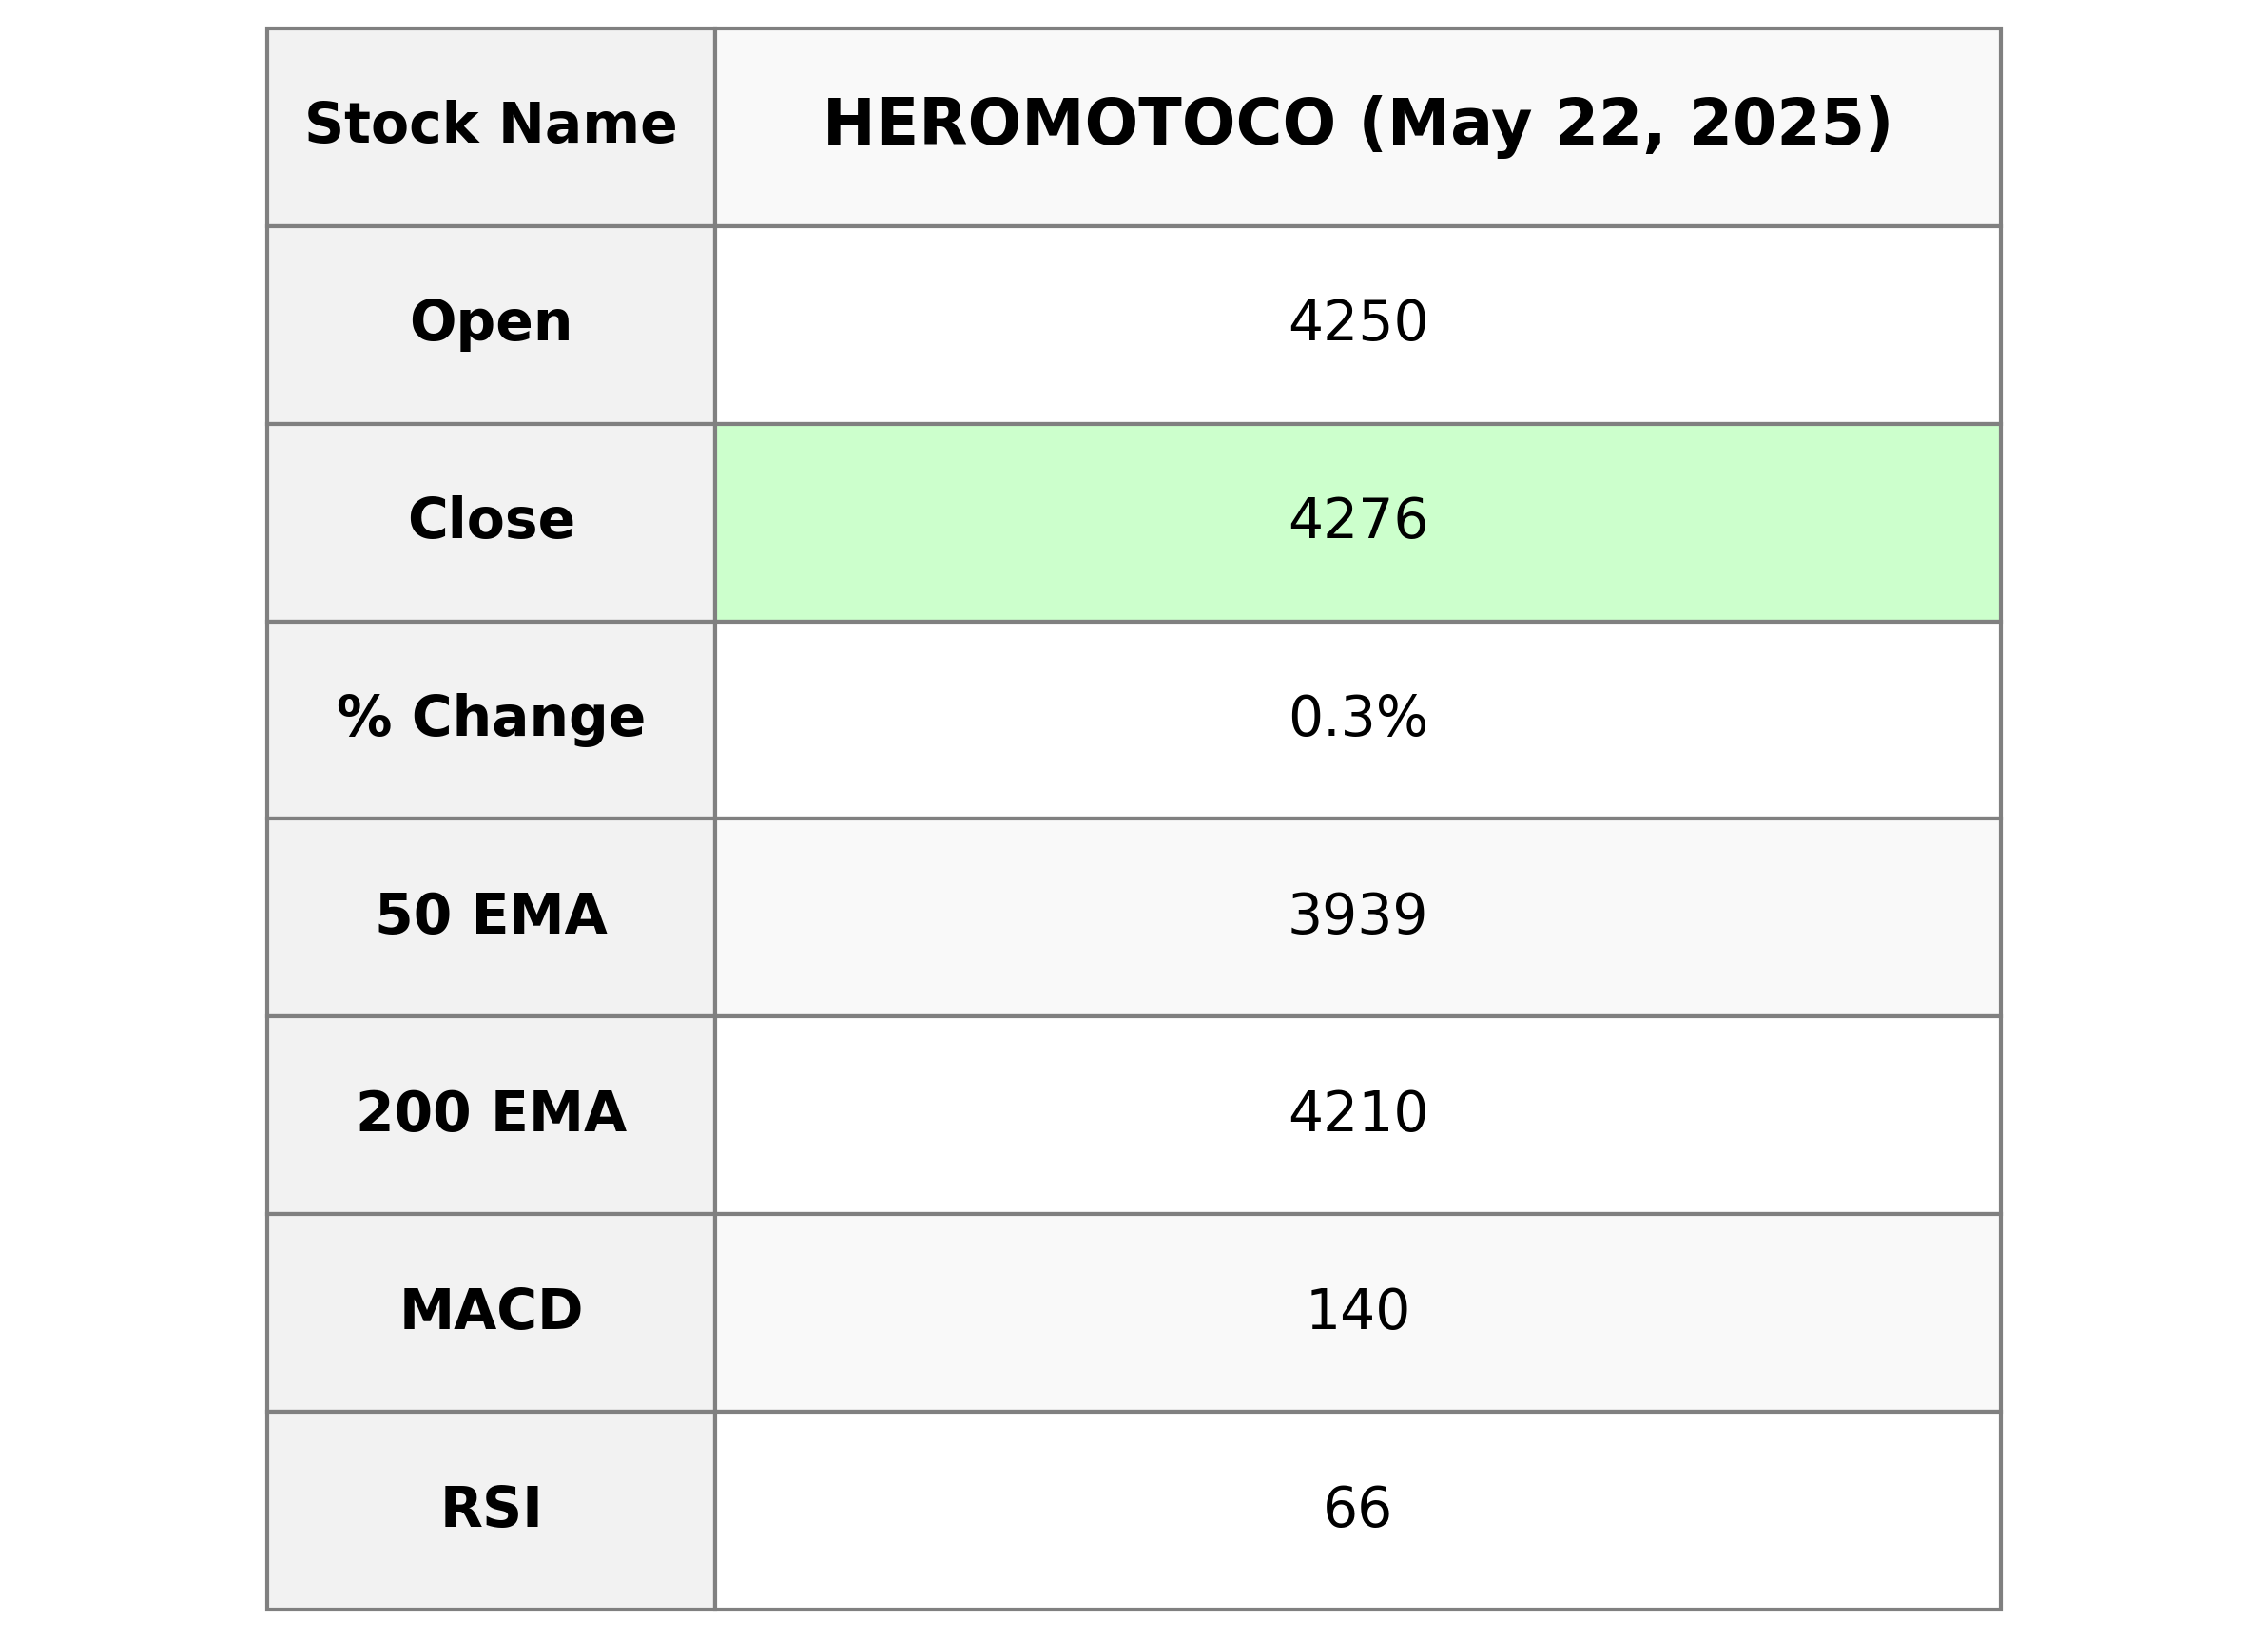
Hero MotoCorp: The stock opened at 4250.0 and closed at 4276.30, experiencing a modest percentage change of 0.29% with a 12.5 point increase from the previous close. The volume for the day was 394,777 shares. With technical indicators showing a positive trend, including an RSI of 65.73 and a MACD higher than its signal, the stock reflects a strong market presence. The company's market capitalization is approximately 855.3 billion INR, and it operates in the Consumer Cyclical sector within the Auto Manufacturers industry.
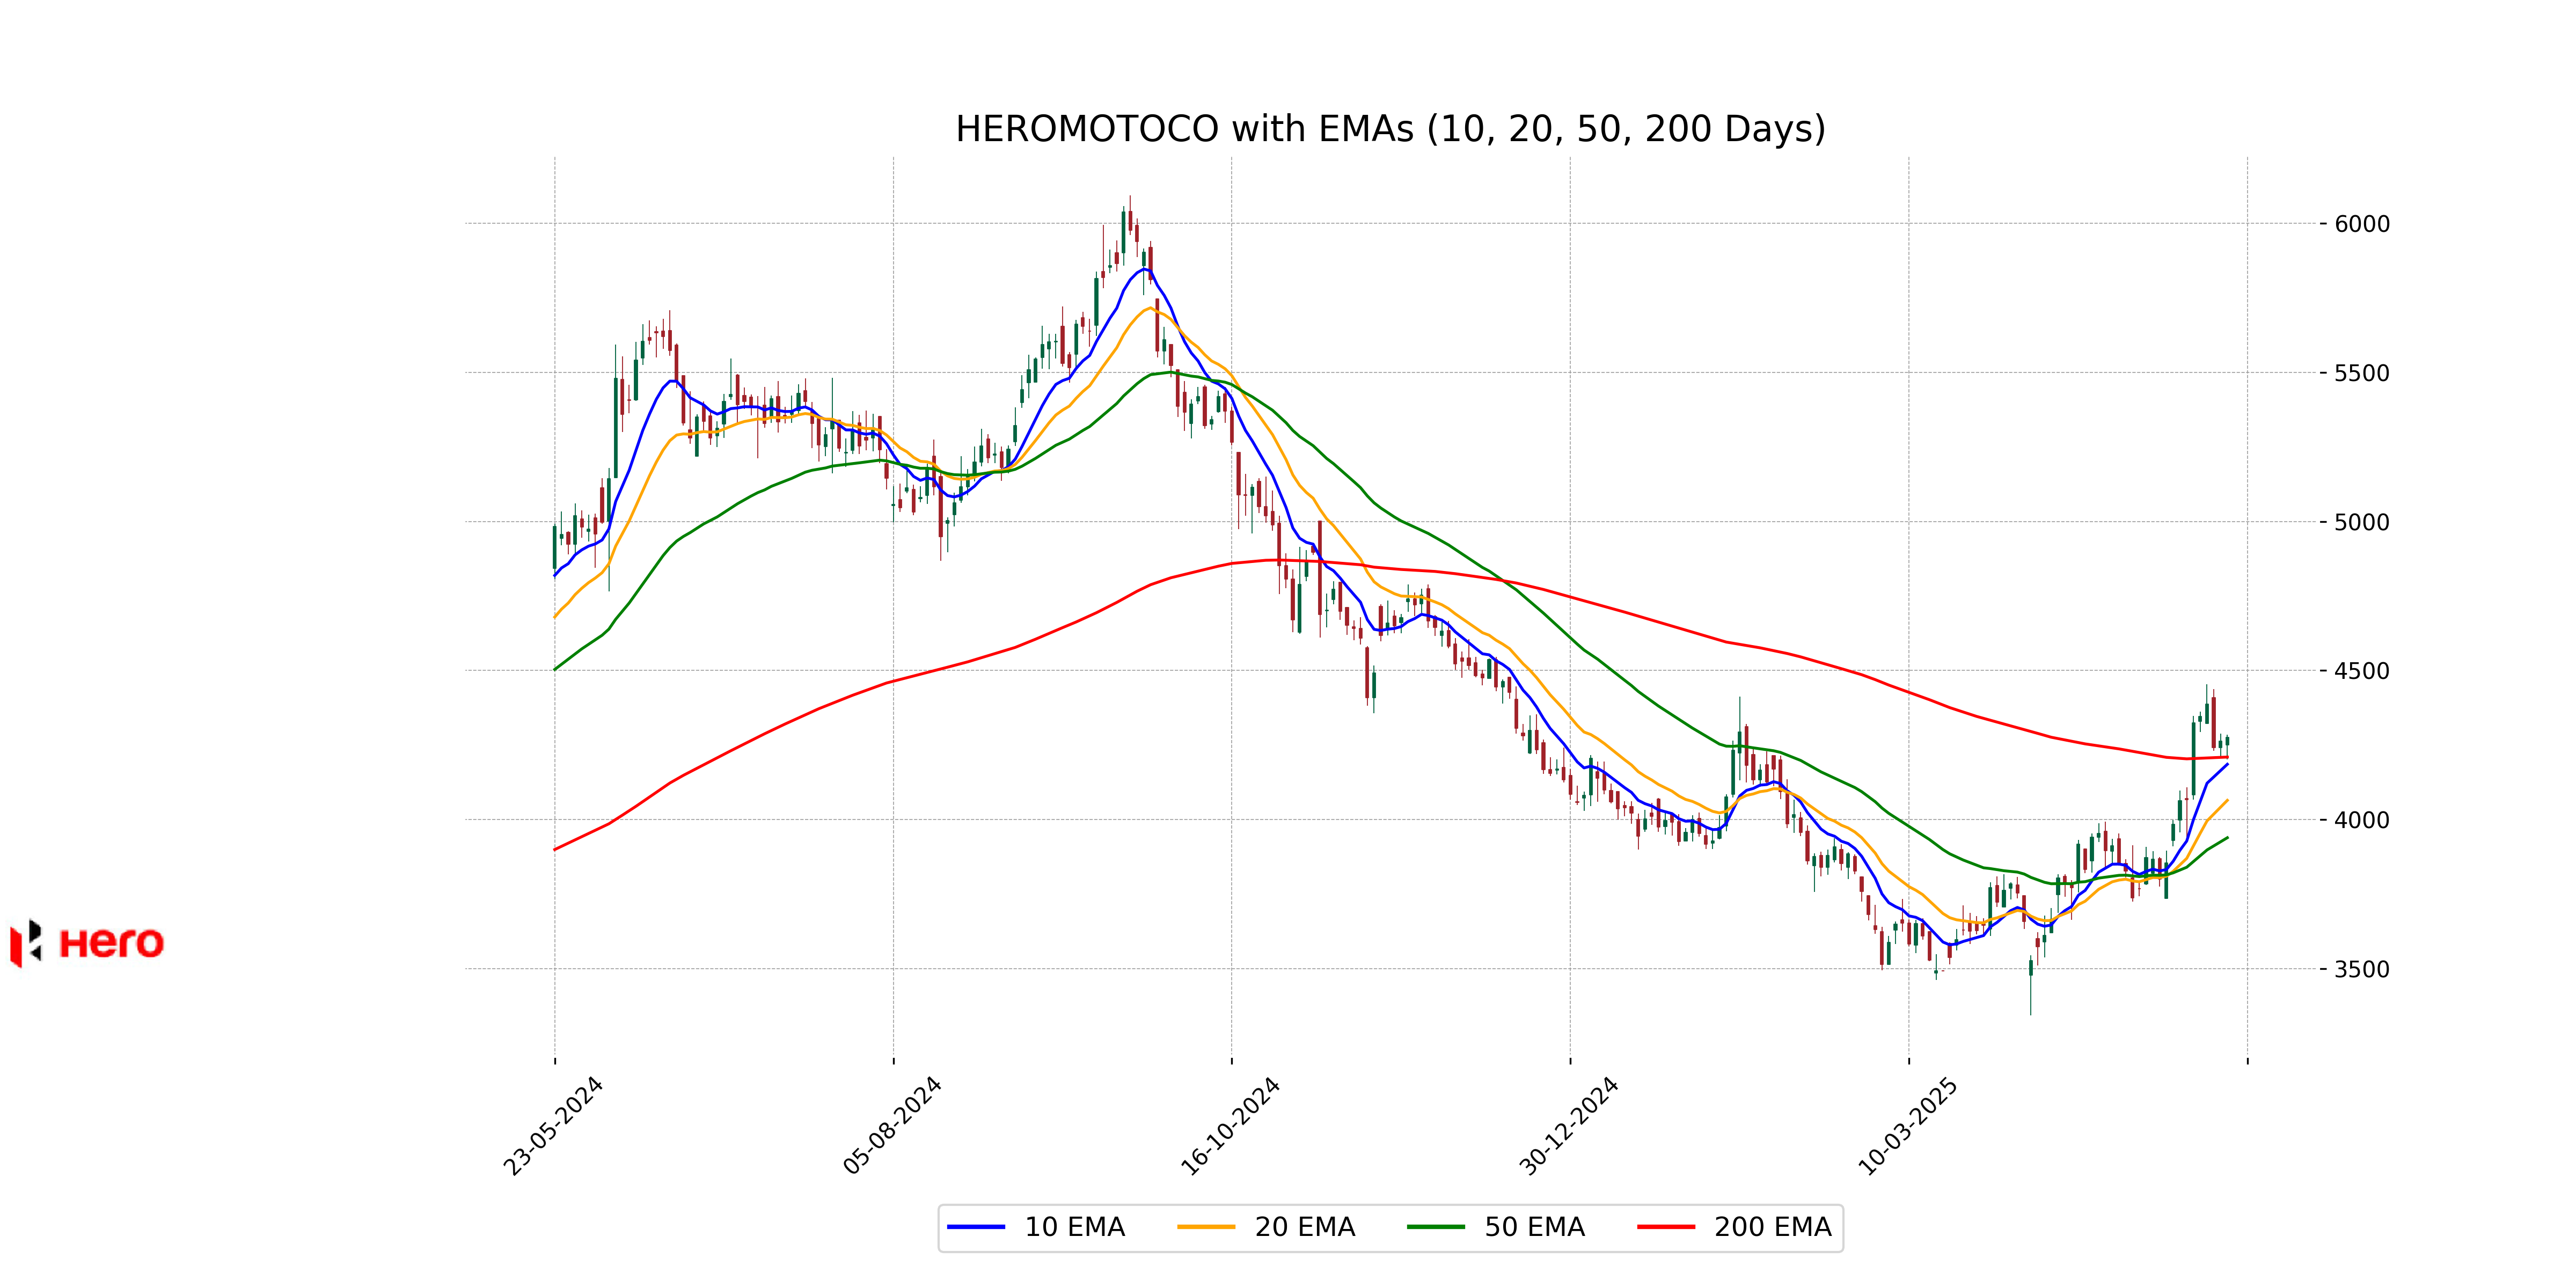
Relationship with Key Moving Averages
Based on the given data, Hero MotoCorp's current close price of 4276.30 is above its 50 EMA of 3939.28, 200 EMA of 4209.82, and 10 EMA of 4185.73, indicating a bullish trend. The stock is also trading higher than its 20 EMA of 4064.69, further supporting positive momentum.
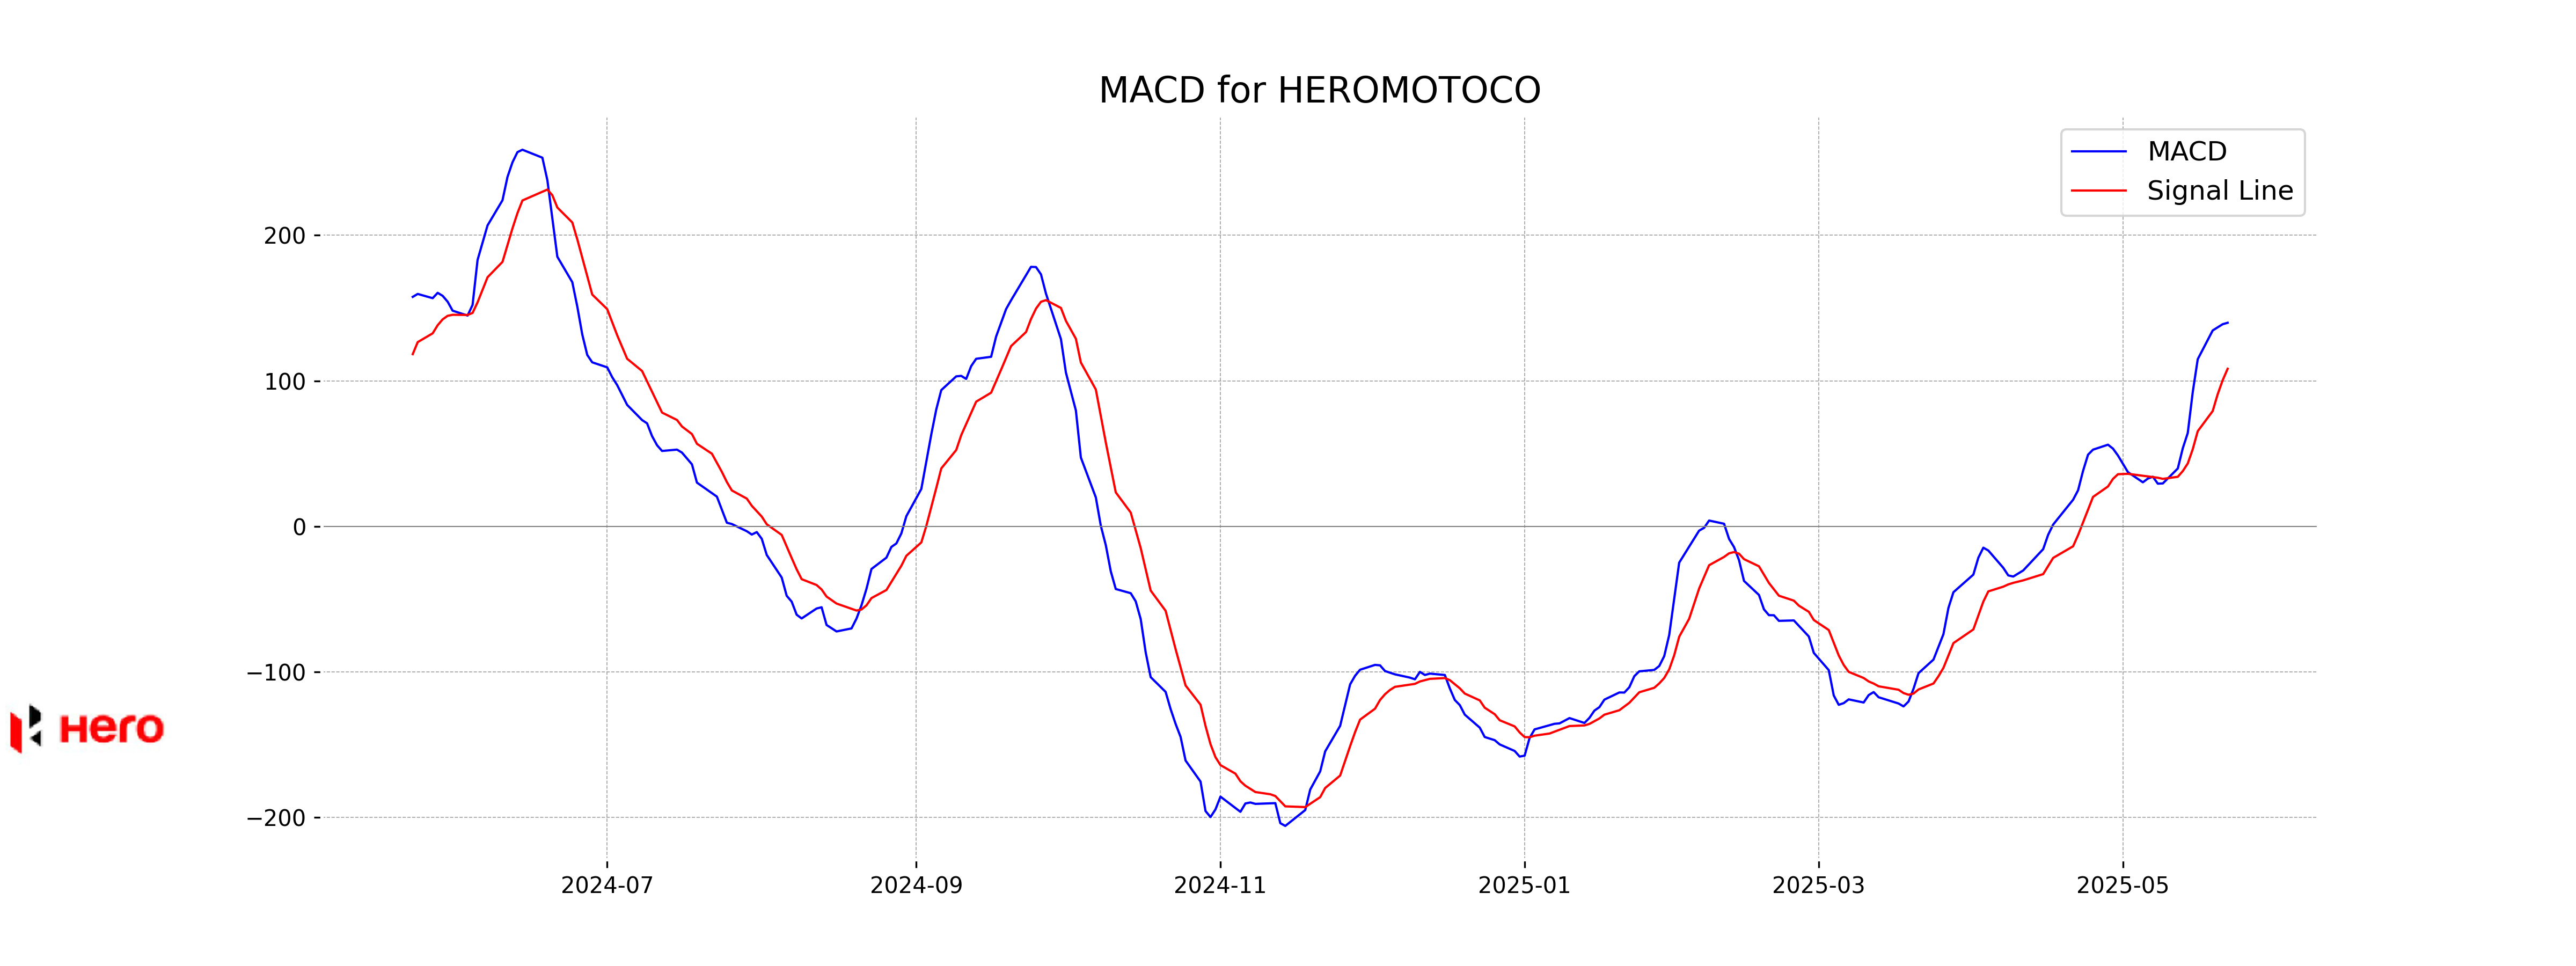
Moving Averages Trend (MACD)
MACD Analysis for Hero MotoCorp: The MACD value for Hero MotoCorp is 139.86, which is above its signal line at 108.27. This indicates a bullish trend, suggesting positive momentum and potential further upward movement in the stock's price.
RSI Analysis
The RSI for Hero MotoCorp is 65.73, indicating that the stock is approaching overbought conditions. Typically, an RSI above 70 suggests that a stock may be overbought, while an RSI below 30 indicates it may be oversold. Hence, investors should monitor for any potential reversal signals.
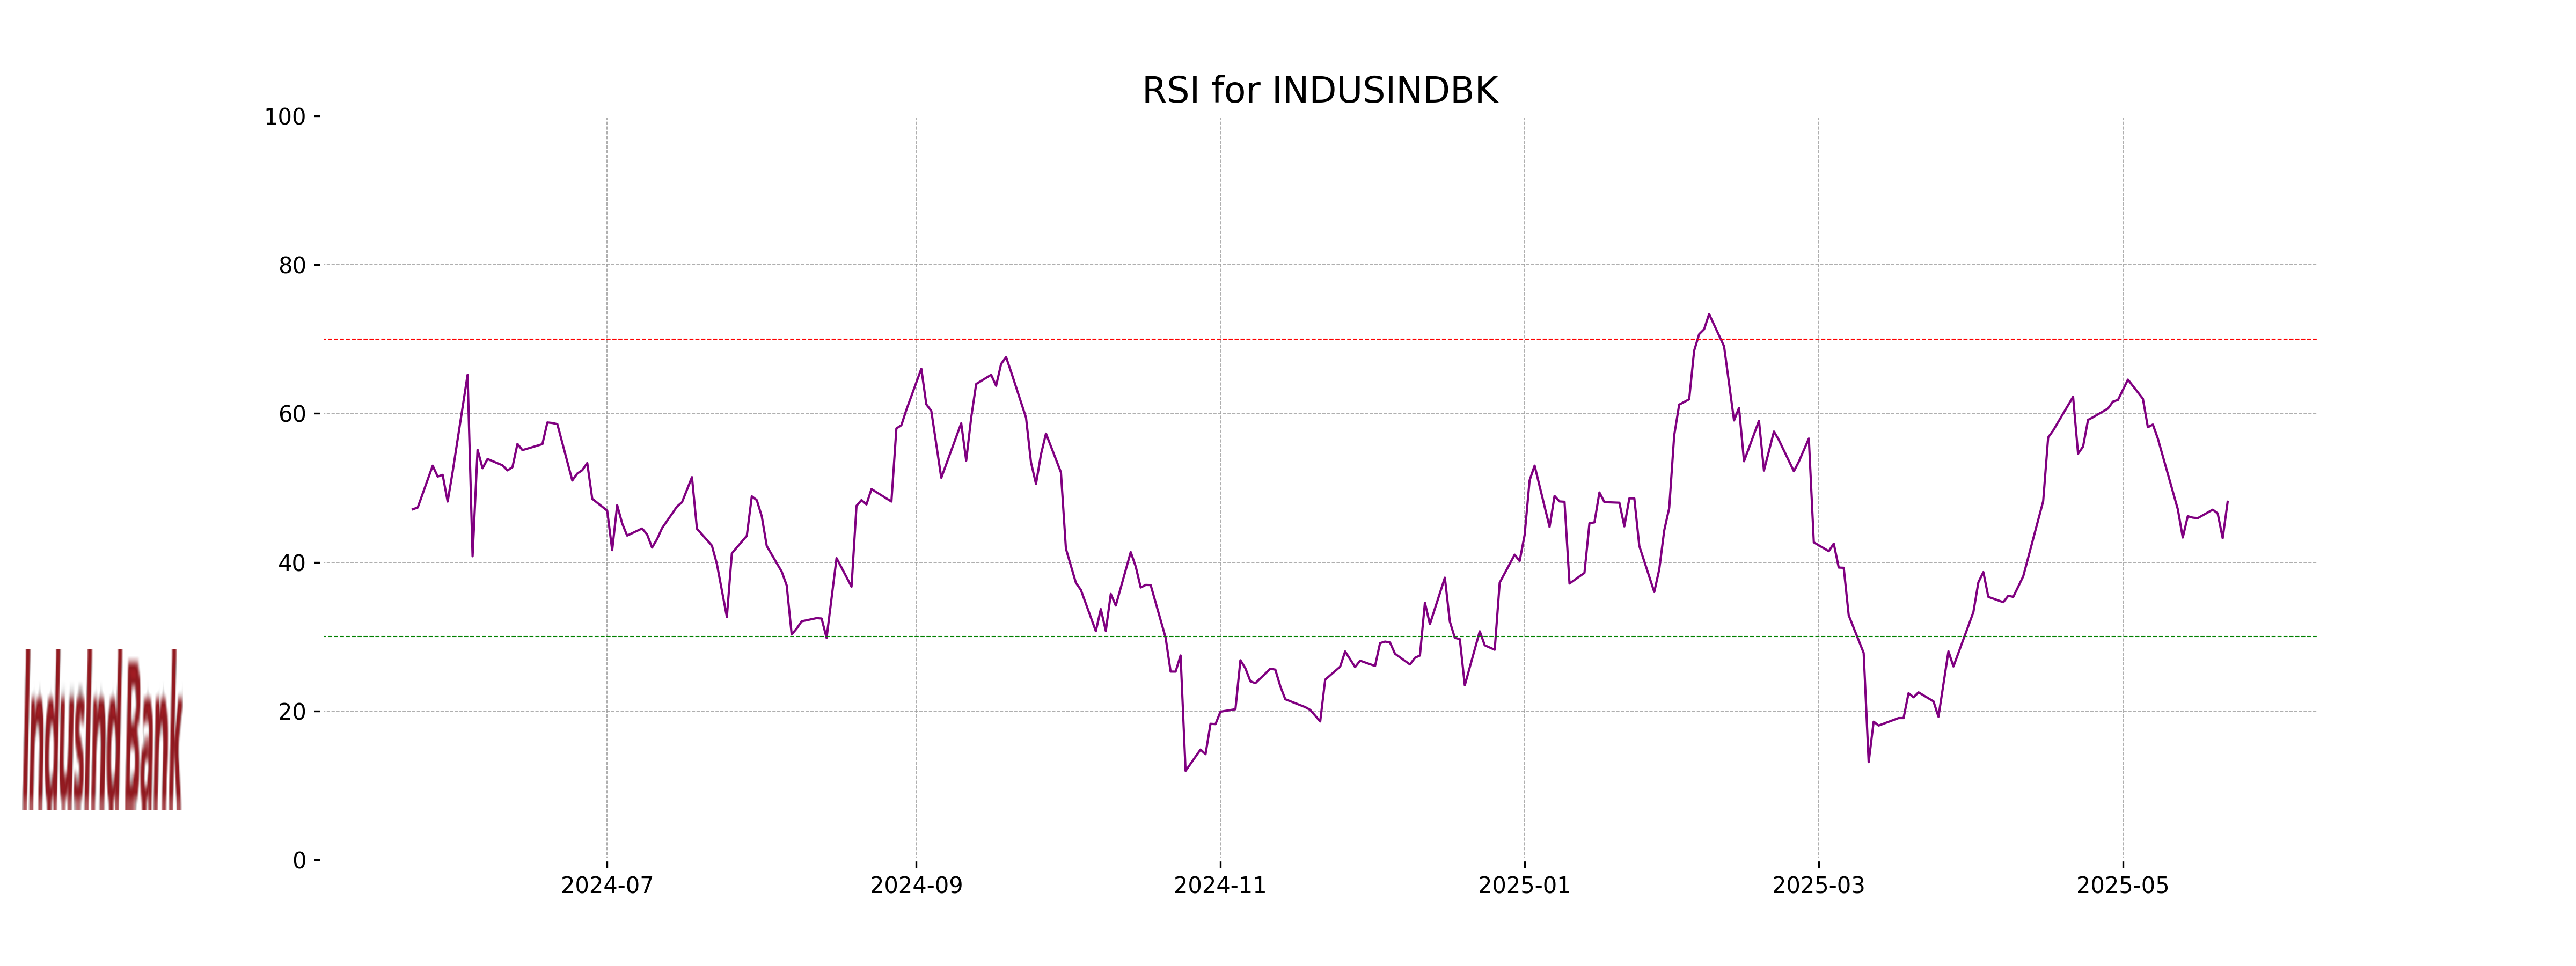
Analysis for IndusInd Bank - May 22, 2025
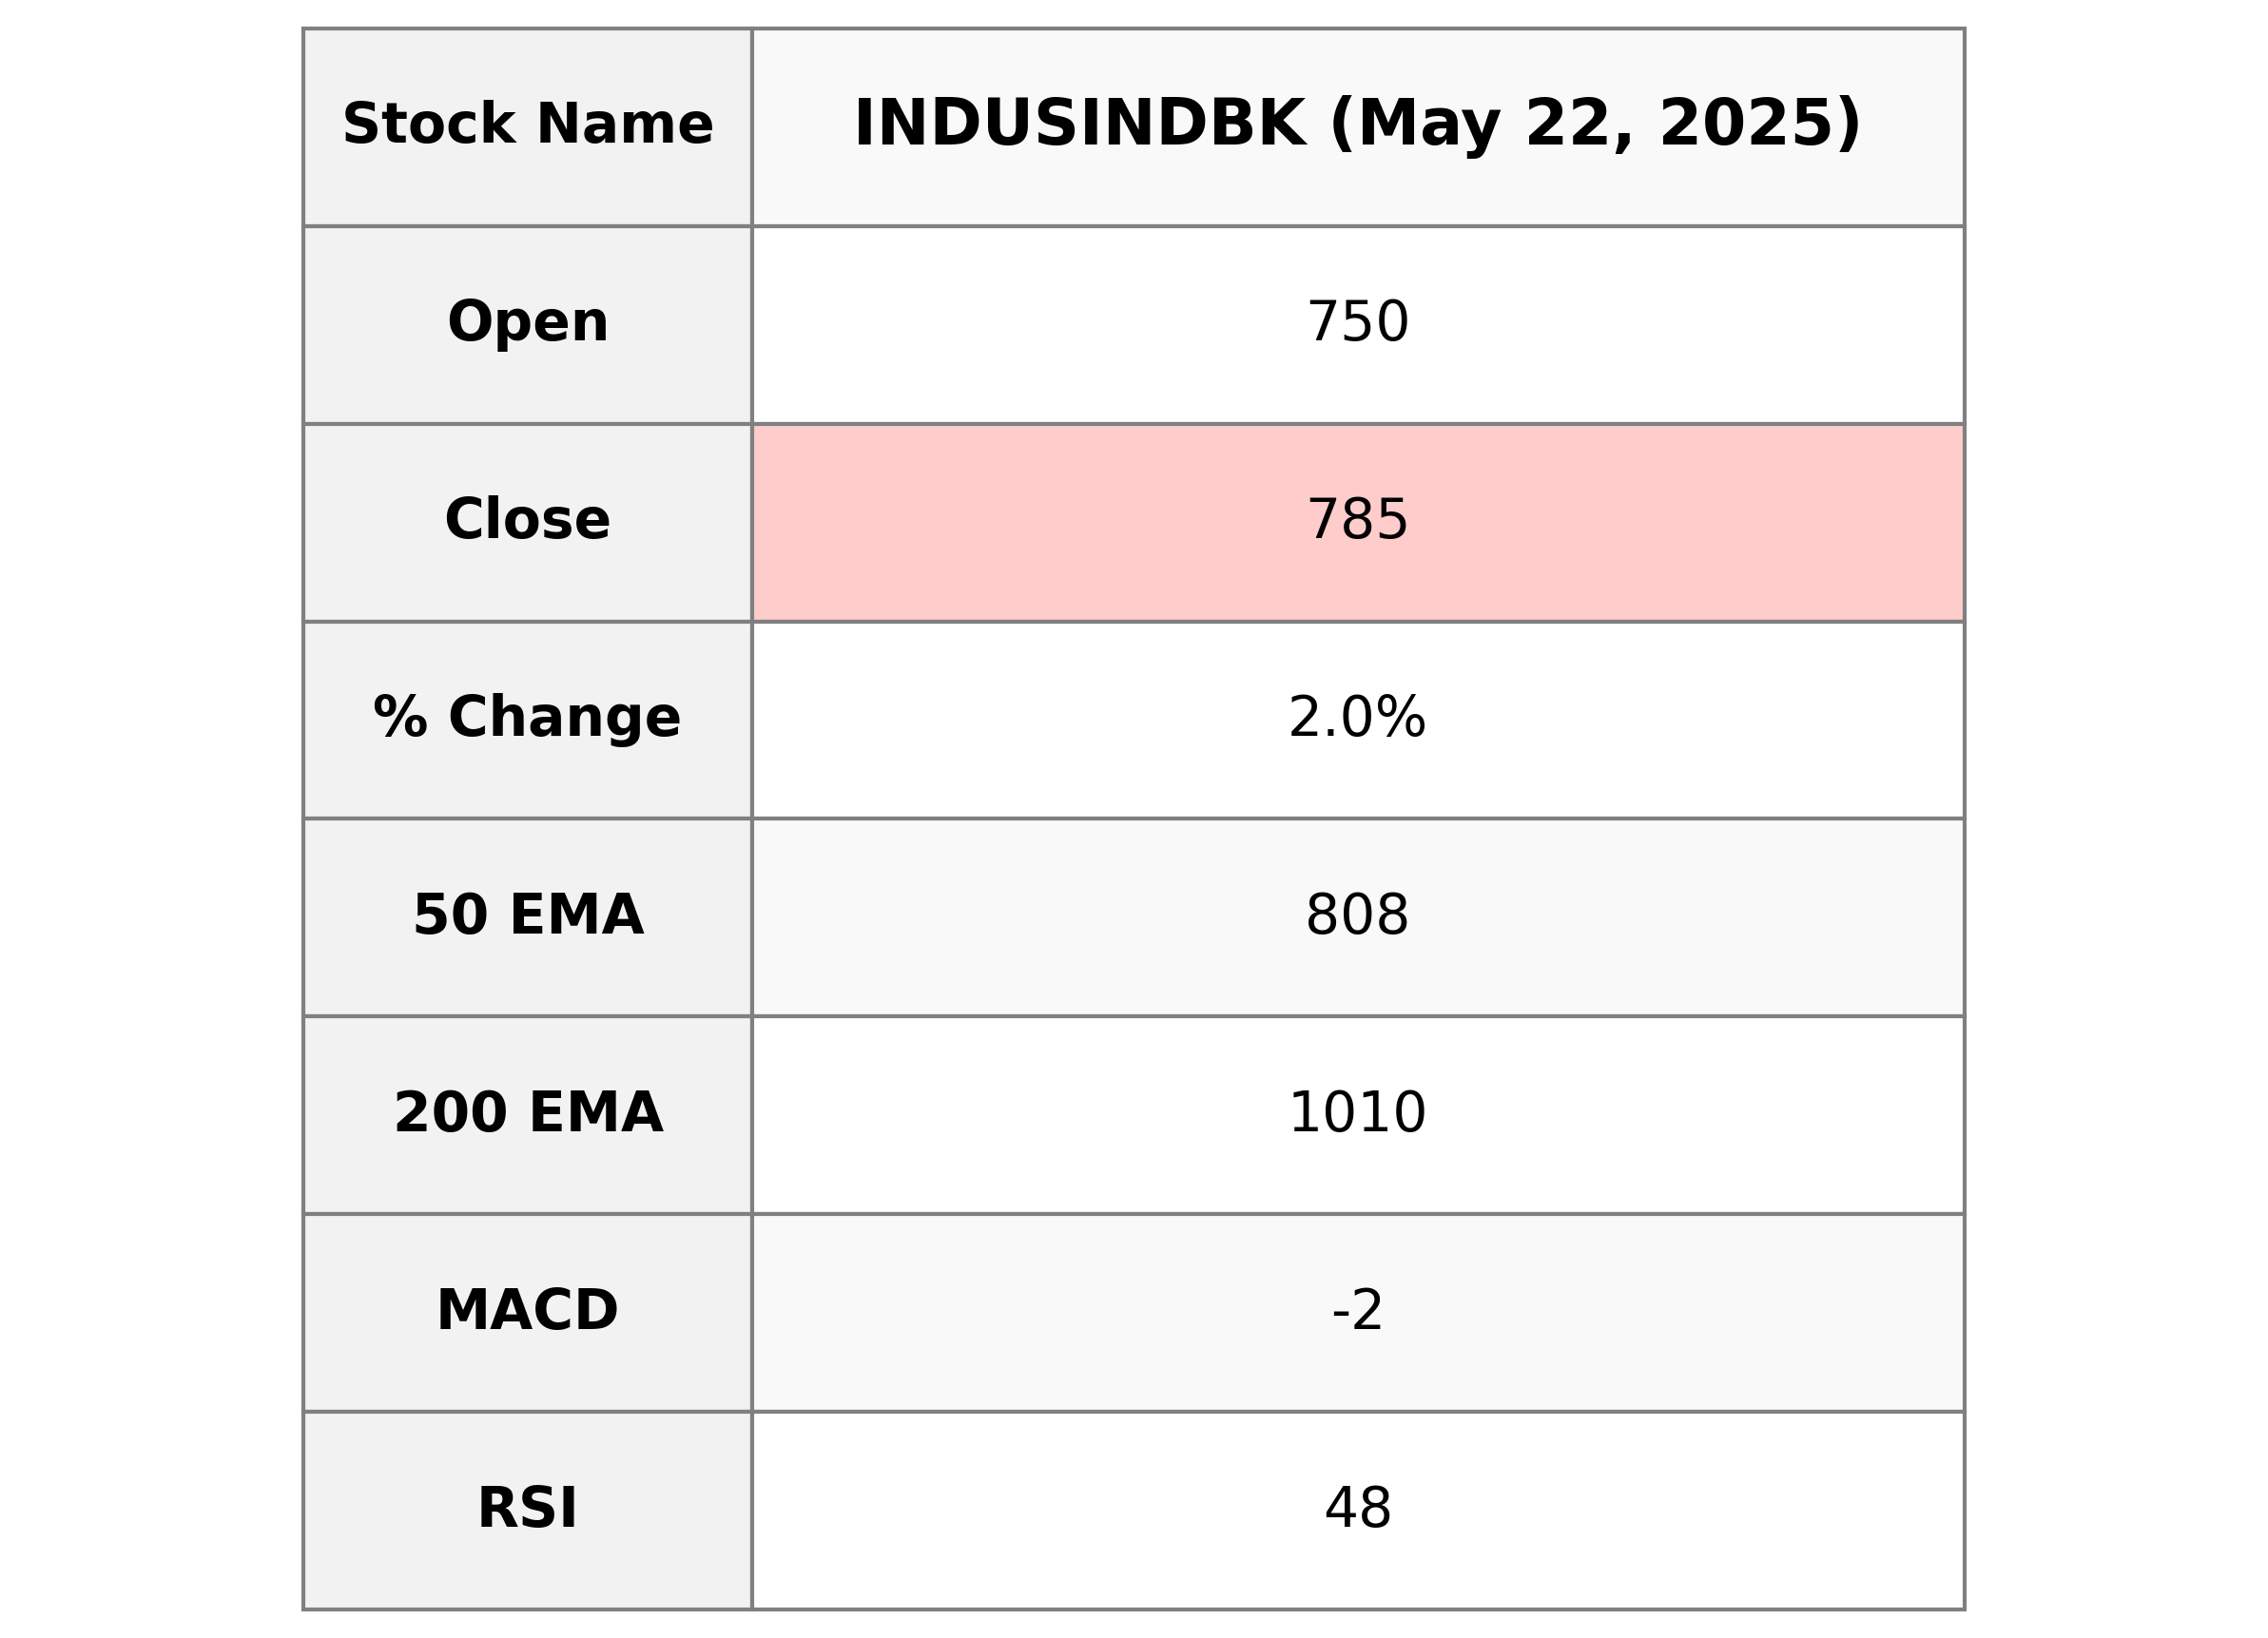
IndusInd Bank has shown a positive performance with a closing price of 785.0, reflecting a 1.95% increase from the previous close of 769.95. The stock experienced a high volume of 43,468,934, and its current RSI indicates a neutral momentum at 48.13. However, the stock is trading below its 50-day and 200-day EMAs, suggesting potential resistance in longer trends.
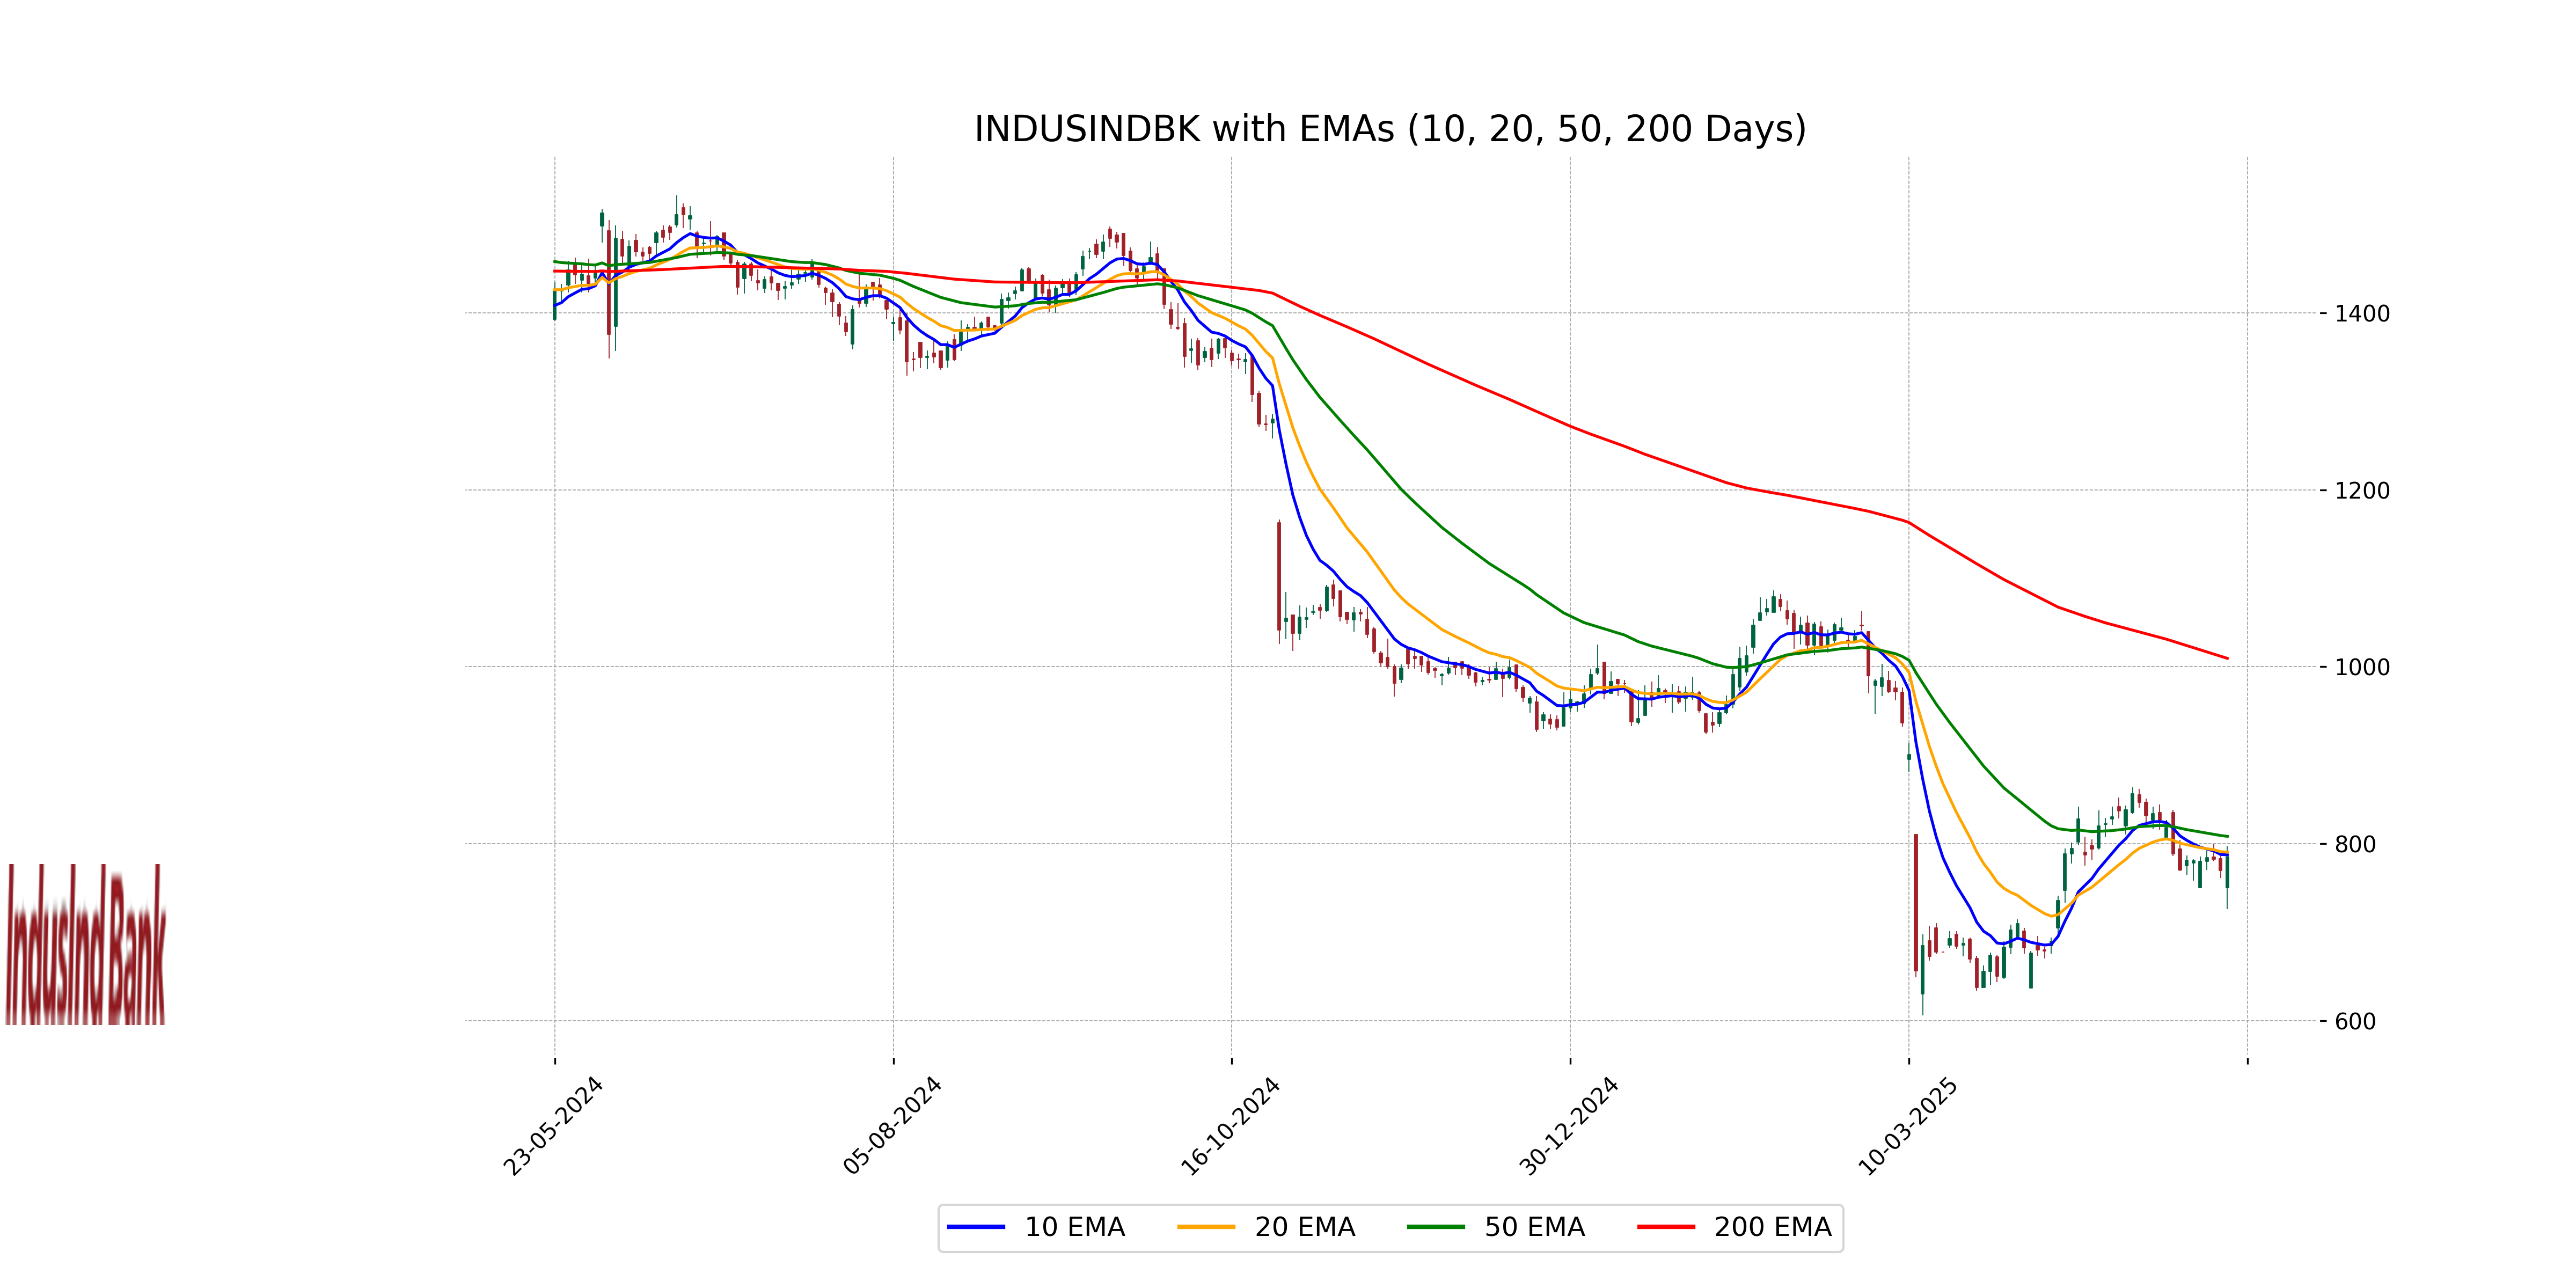
Relationship with Key Moving Averages
IndusInd Bank closed at 785.0, which is below its 50 EMA of 808.26 and significantly below its 200 EMA of 1009.57, indicating a bearish trend over the medium to long term. However, it is slightly below its 10 EMA of 787.28 and 20 EMA of 790.39, suggesting a short-term possible reversal or consolidation.
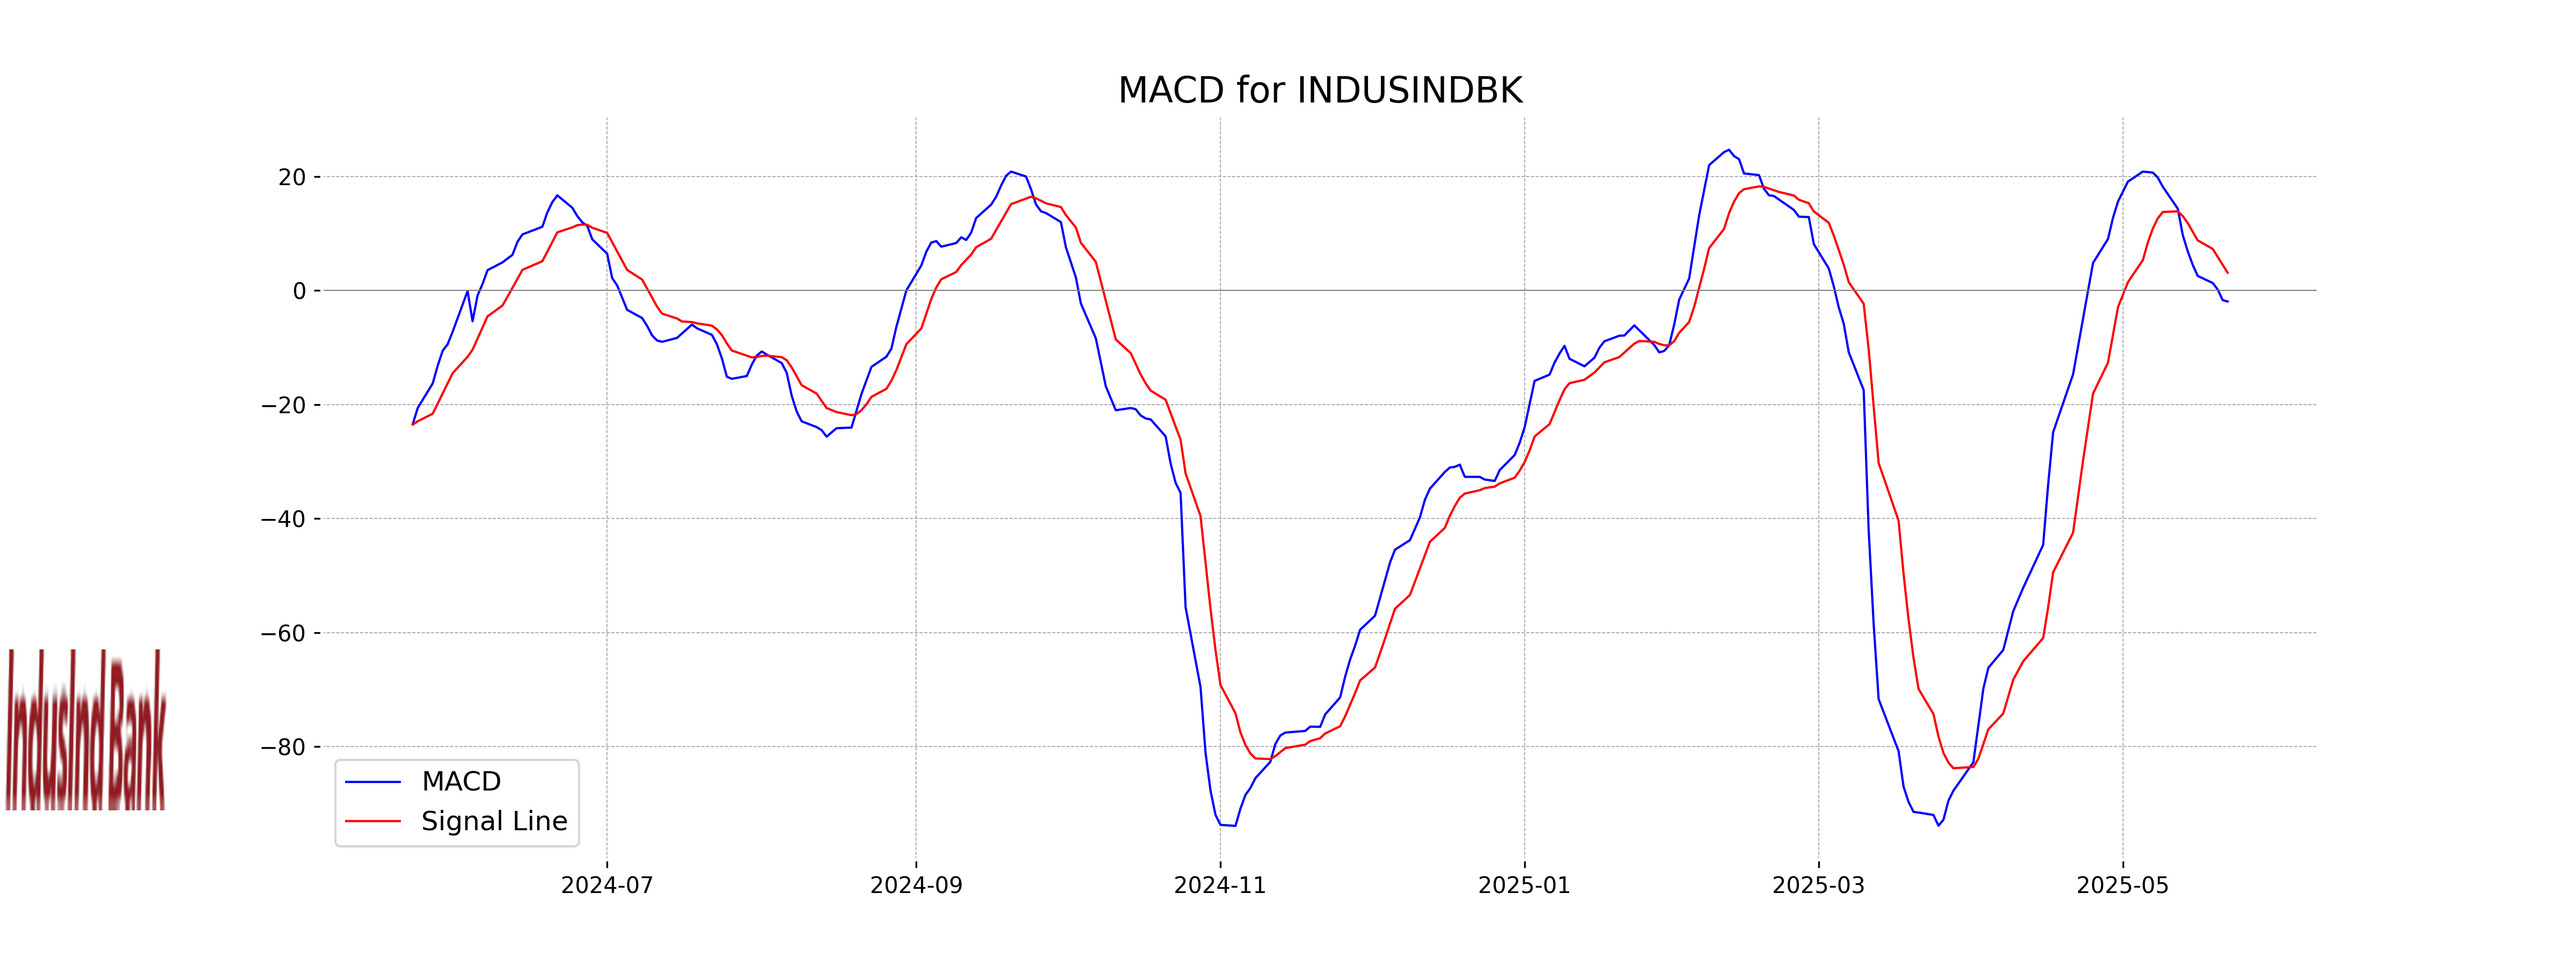
Moving Averages Trend (MACD)
The MACD for IndusInd Bank is -1.92, which is below the MACD Signal of 3.11. This suggests that the stock is experiencing bearish momentum and may see further downward pressure unless there's a positive crossover. The current MACD position also indicates weakness compared to its historical average performance.
RSI Analysis
IndusInd Bank's Relative Strength Index (RSI) is 48.13, which is considered neutral. This suggests that the stock is neither overbought nor oversold at the moment. It indicates a balanced momentum, providing no clear direction on future price movement based on RSI alone.
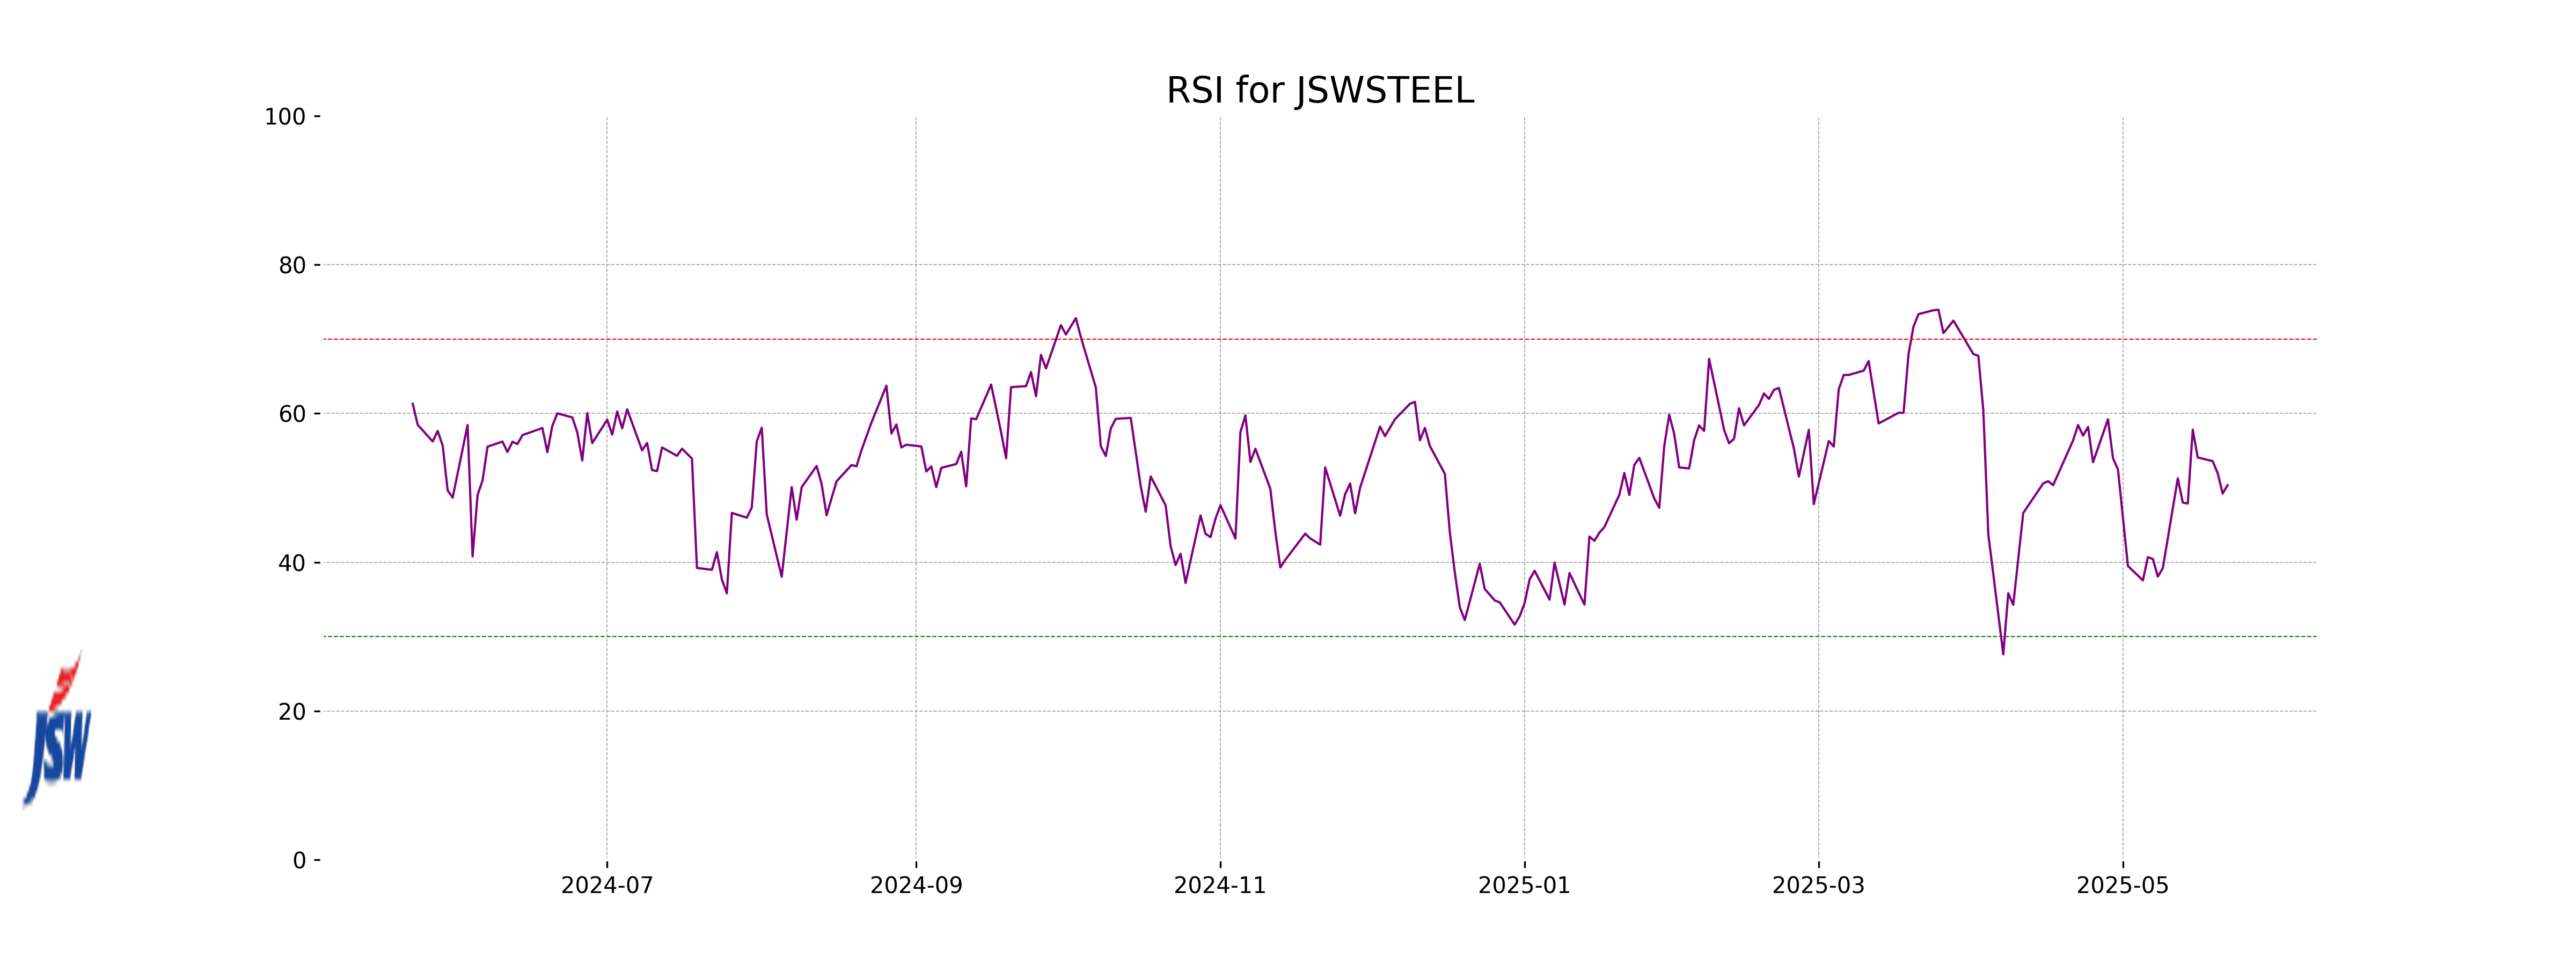
Analysis for JSW Steel - May 22, 2025
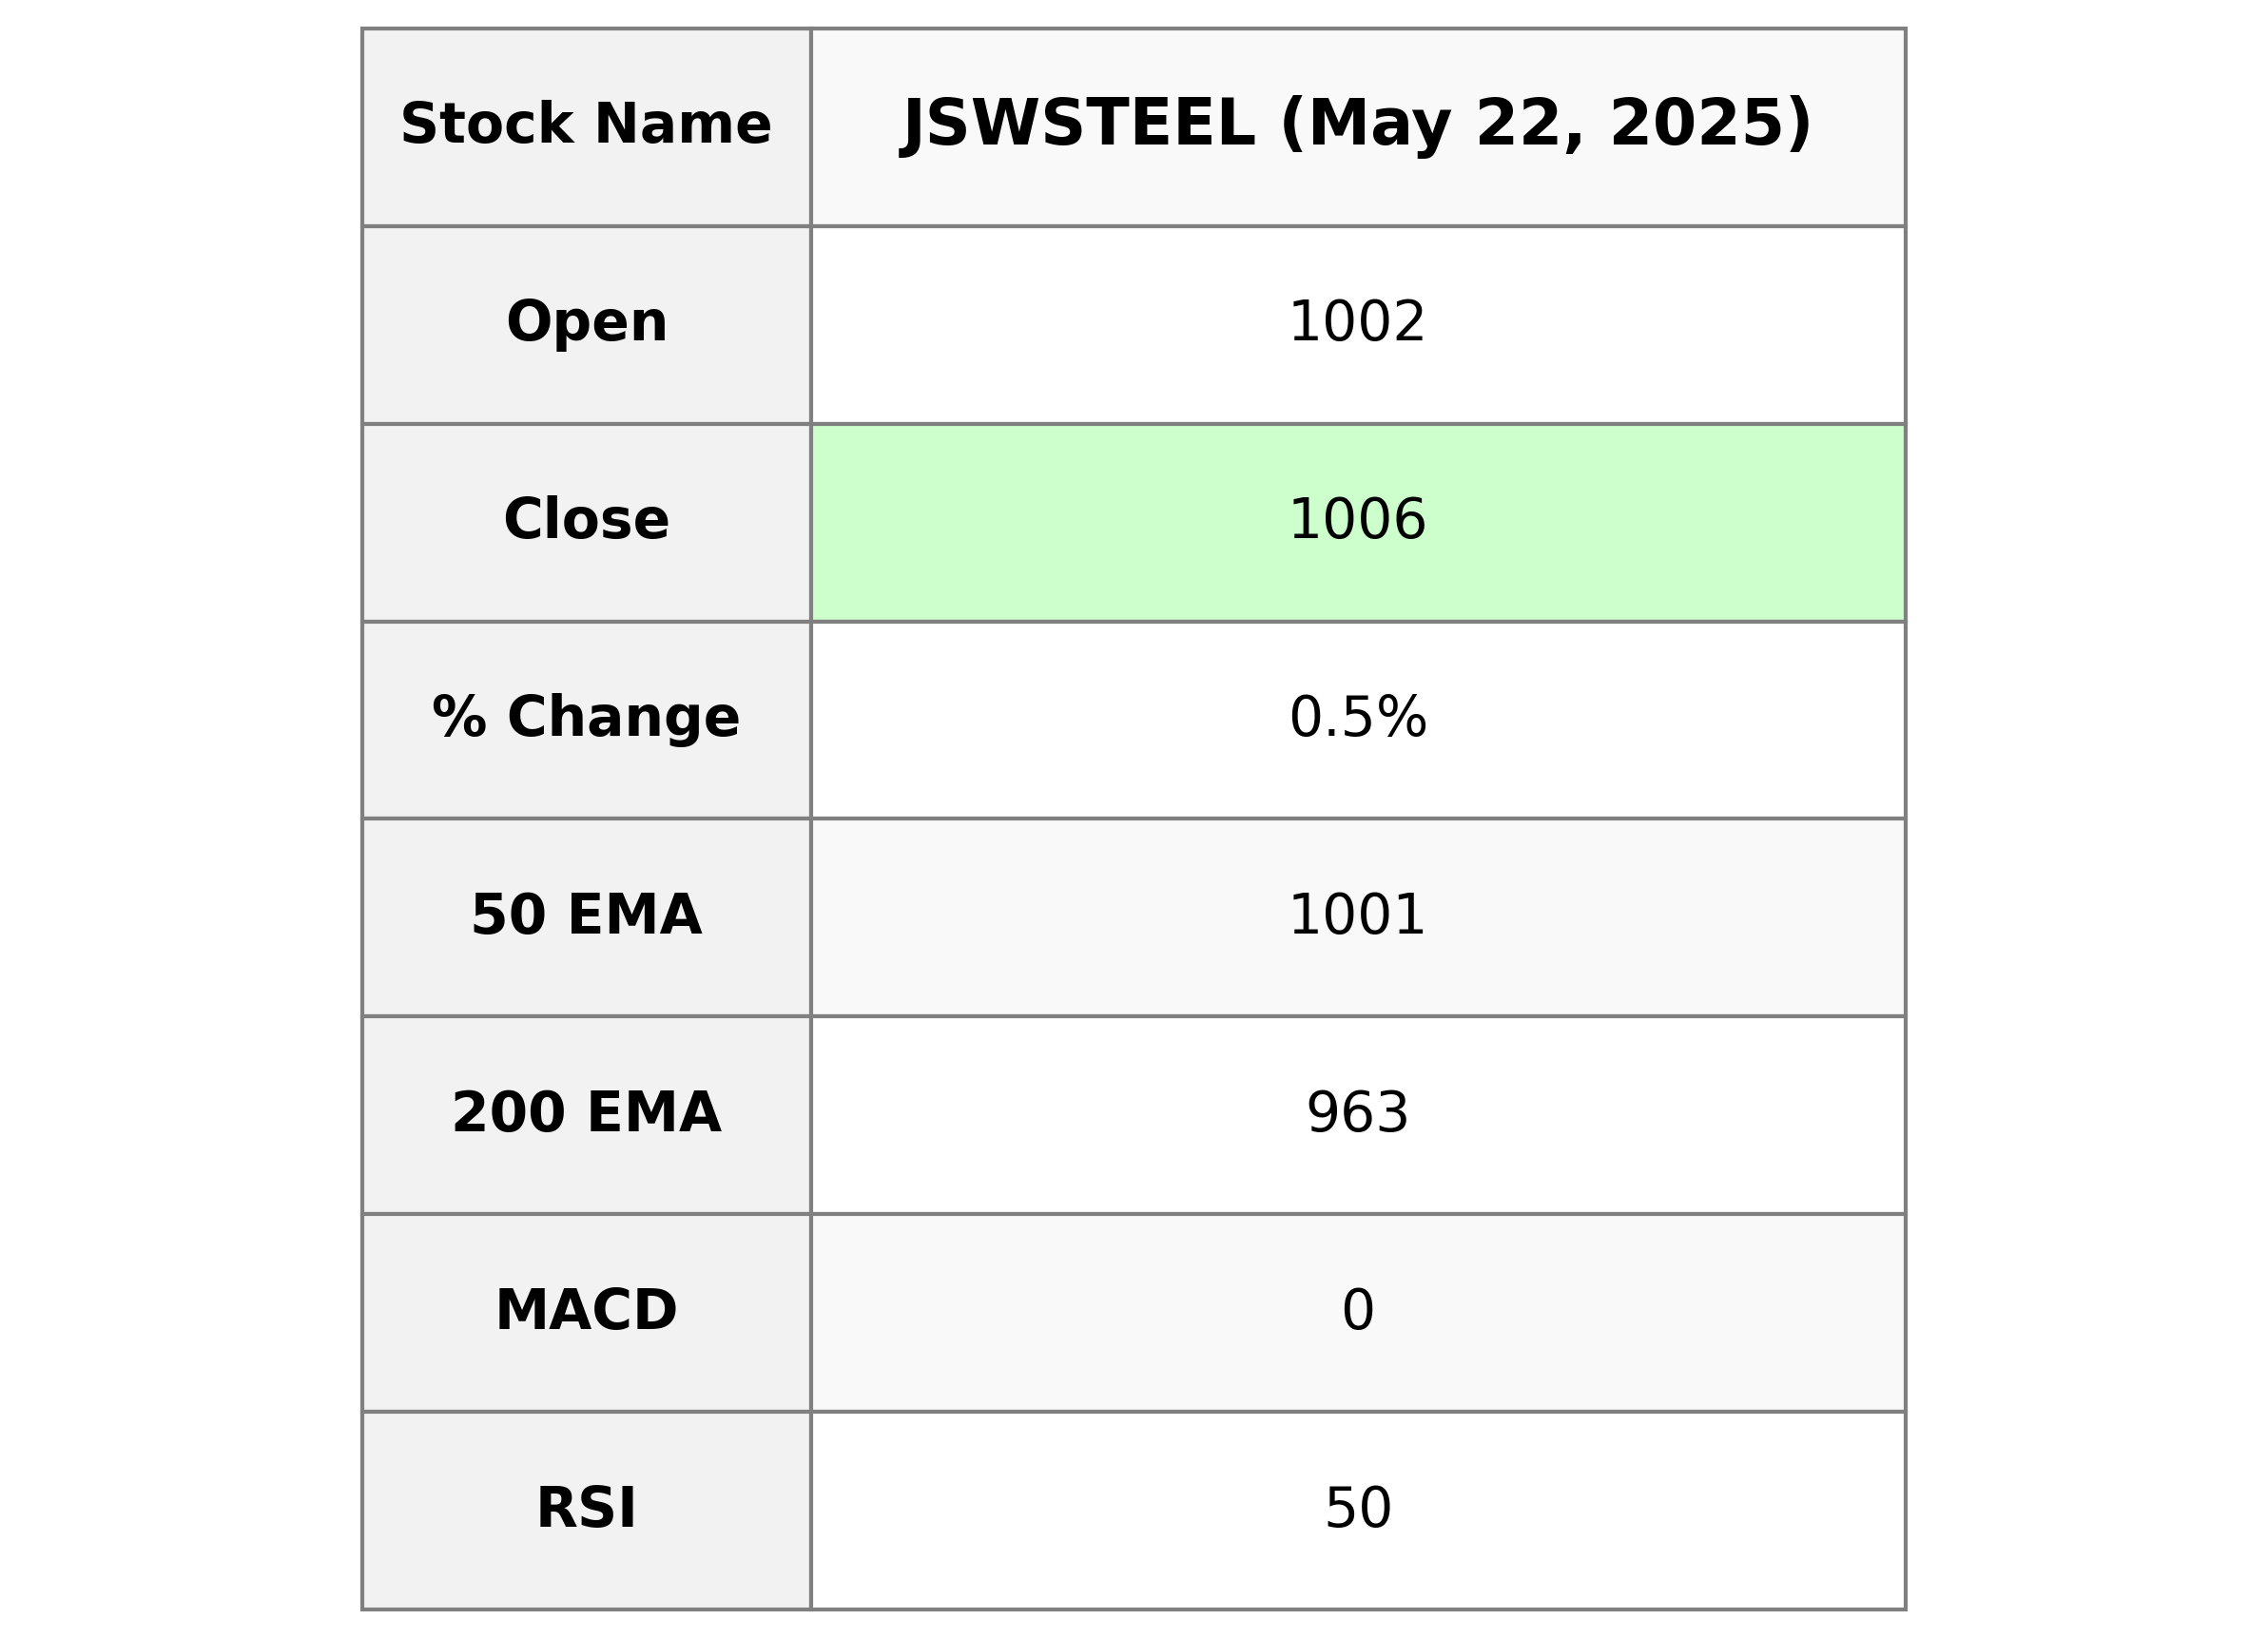
JSW Steel reported a daily close of 1005.60, with a minimal percentage increase of 0.47% from the previous close, amidst a trading range of 987.90 to 1011.50. The stock's short-term indicators, such as the 10 and 20-day EMAs, show alignment with recent price action, while its RSI suggests a neutral momentum state. Operating within the Basic Materials sector in the Steel industry, JSW Steel's significant market capitalization and moderate PE ratio reflect its standing in the Indian market.
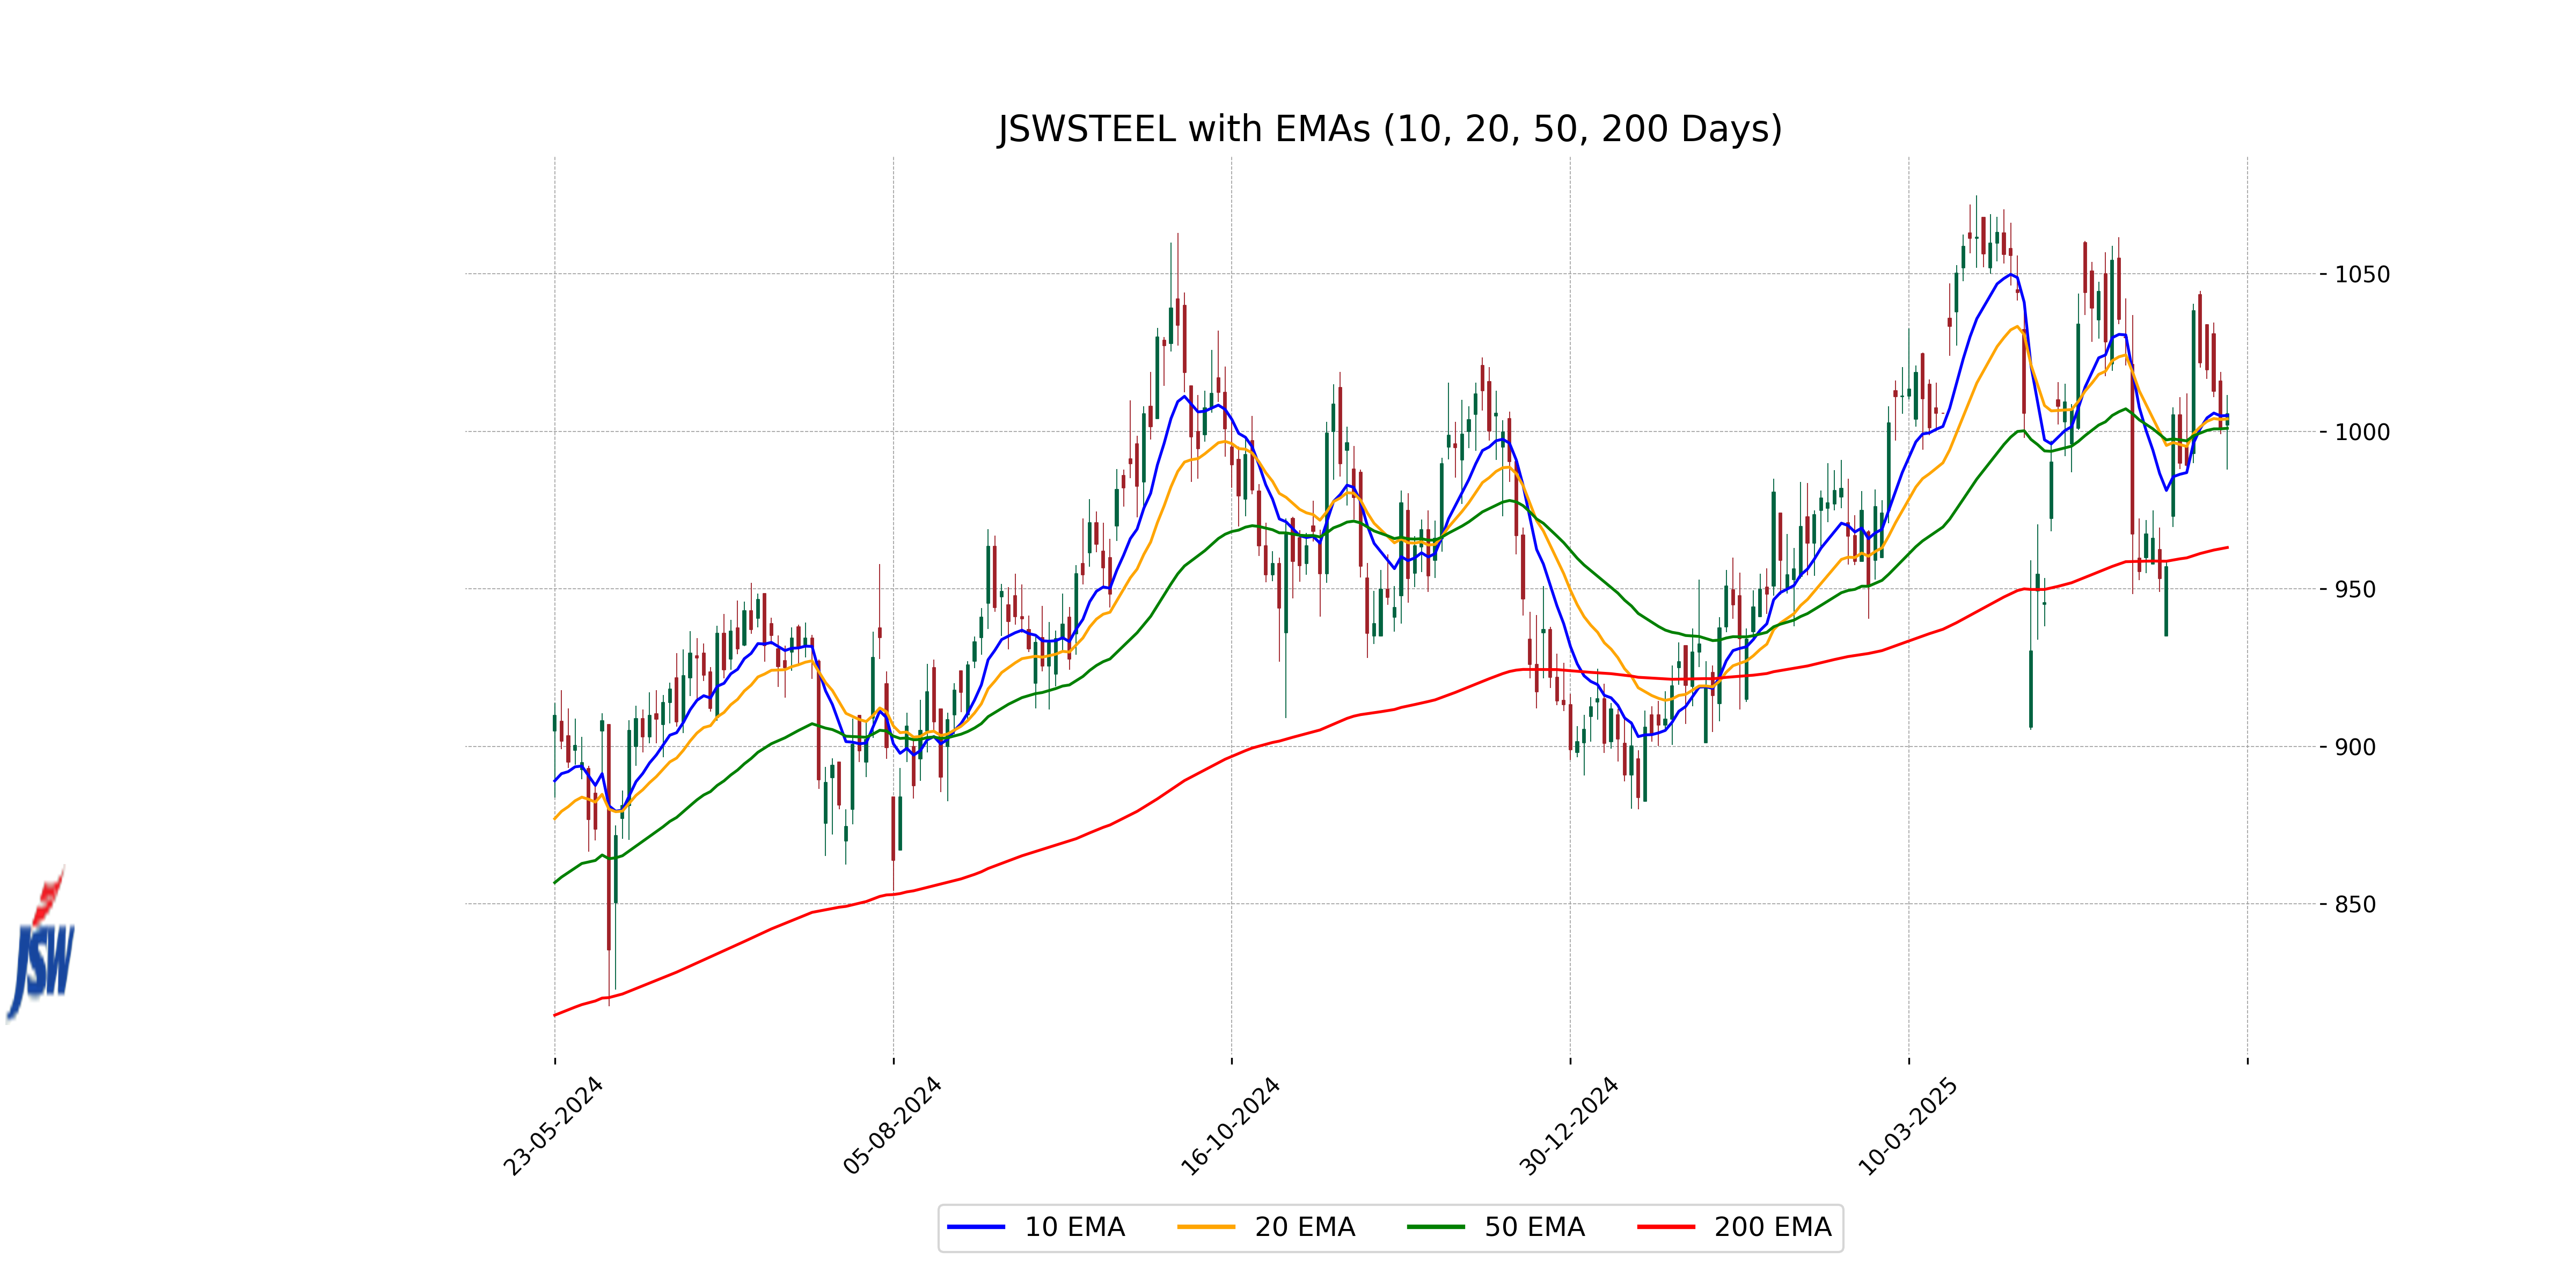
Relationship with Key Moving Averages
JSW Steel's current close price of 1005.60 is slightly above its 50 EMA of 1000.99, indicating a short-term positive sentiment. The close price is also above the 200 EMA of 963.13, suggesting long-term bullish momentum. Additionally, it's nearly aligned with the 10 EMA of 1005.05, showing consistency with shorter-term trends.
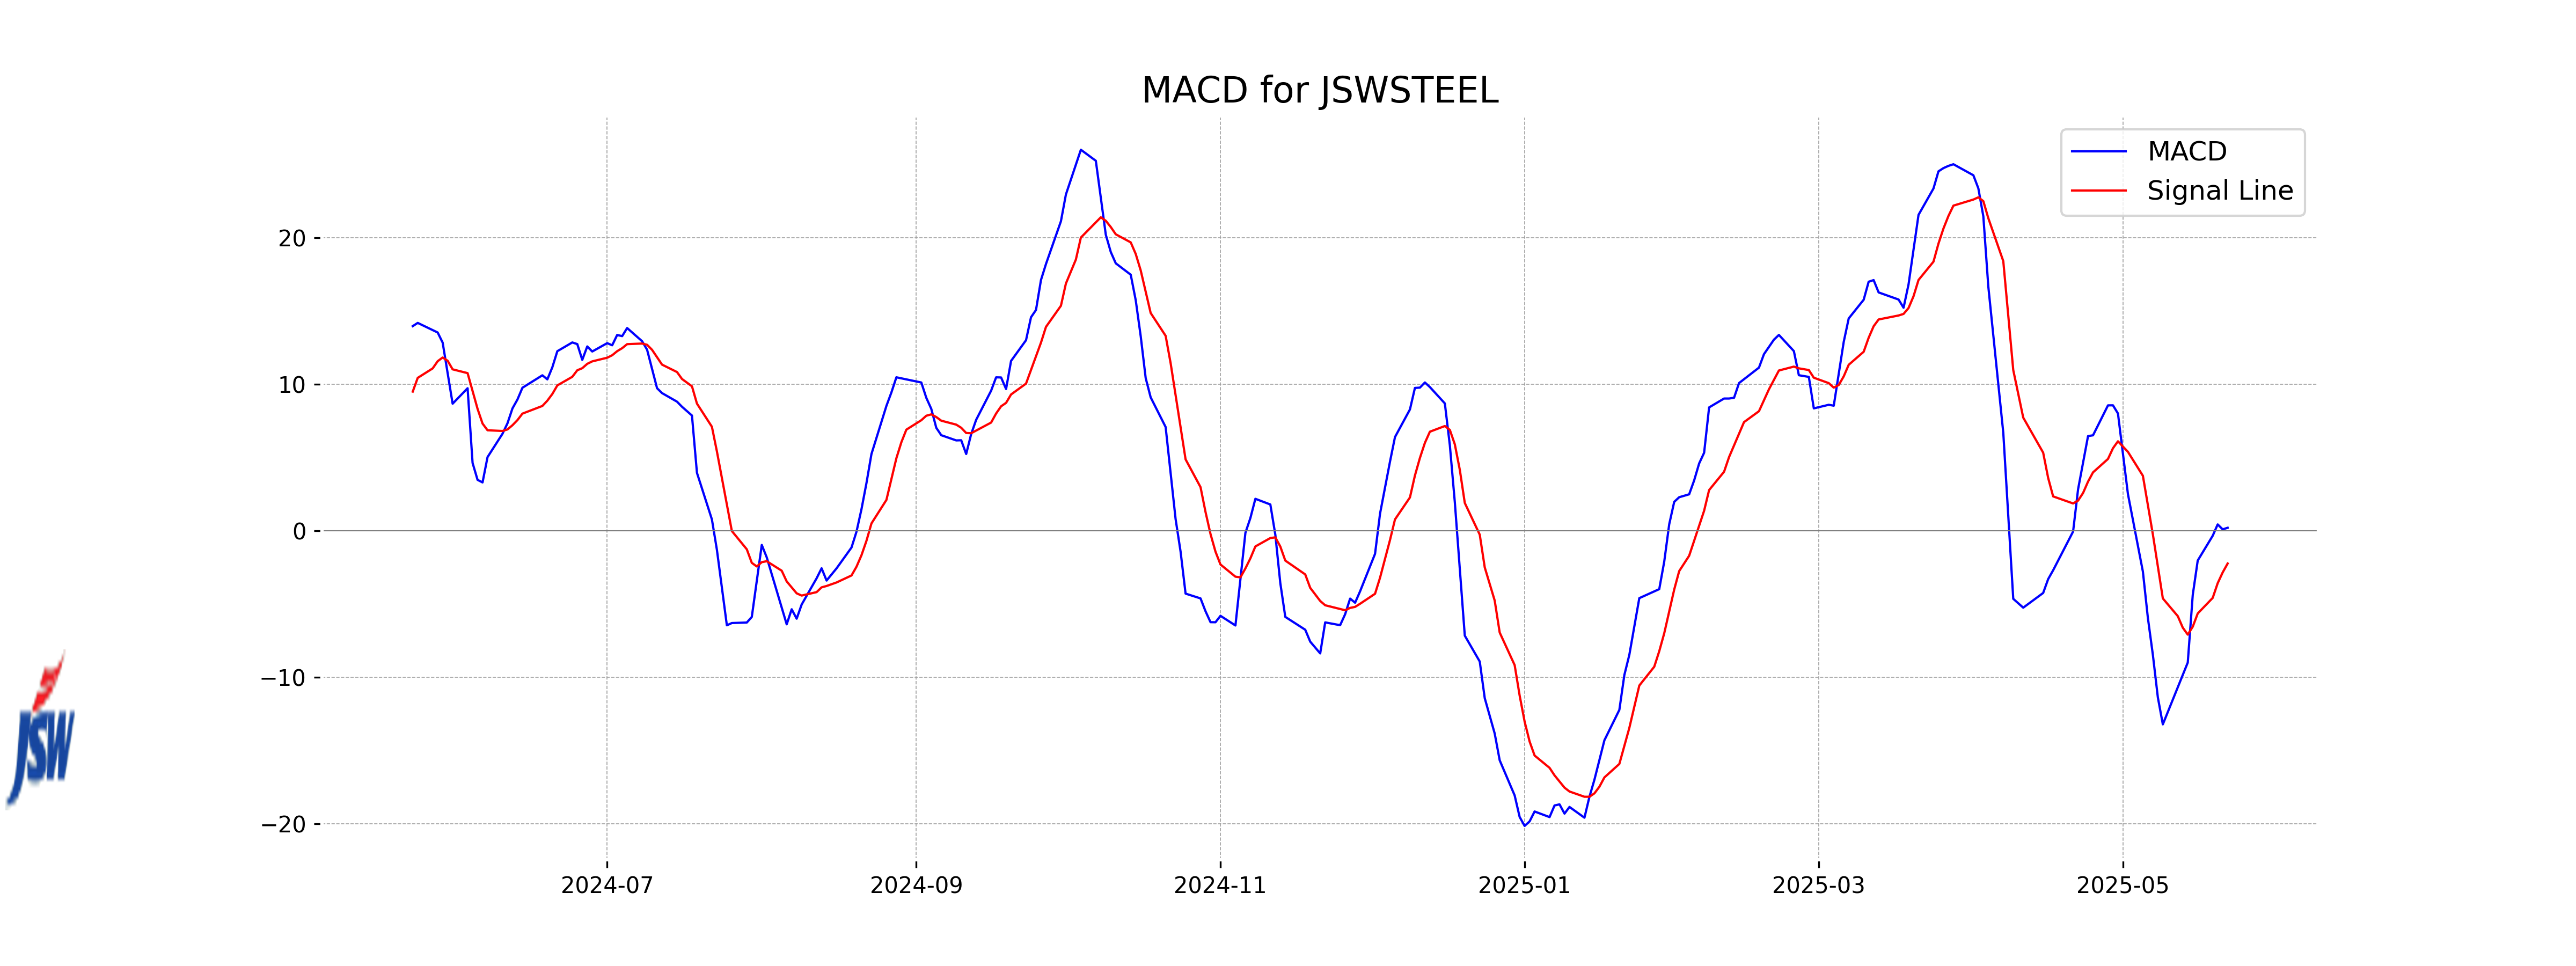
Moving Averages Trend (MACD)
The MACD value for JSW Steel is 0.1944, which is above the MACD Signal of -2.2448. This suggests a potential bullish momentum as the MACD line has crossed over the signal line, indicating a possible upward price movement in the stock. However, as with any technical analysis, it is advisable to consider other indicators and market conditions before making any investment decisions.
RSI Analysis
### RSI Analysis for JSW Steel The Relative Strength Index (RSI) for JSW Steel is currently at 50.36, indicating a neutral market sentiment as it is around the mid-point of 50. This suggests that the stock is neither overbought nor oversold at the moment.
Up Next
Top 5 Nifty 50 gainers today – May 22, 2025: Biggest stock moves

India, New Zealand conclude FTA talks; pact to offer duty-free access, USD 20 bn FDI

FTA with New Zealand to significantly deepen bilateral economic engagement: Govt

Rupee breaches 91-mark against US dollar for first time in intra-day trade

Microsoft commits USD 17.5 billion investment in India: CEO Satya Nadella

CBI books Anil Ambani's son, Reliance Home Finance Ltd. in Rs 228 crore bank fraud case

More videos

RBI raises FY26 GDP growth projection to 7.3 pc

RBI trims policy interest rate by 25bps to 5.25pc, loans to get cheaper

Rupee slumps to all-time low of 90.25 against US dollar in intra-day trade

Reliance completes merger of Star Television Productions with Jiostar

India to lead emerging market growth with 7pc GDP rise in 2025: Moody’s

Nifty hits record high after 14 months; Sensex nears all-time peak

Reliance stops Russian oil use at its only-for-export refinery to comply with EU sanctions

ED attaches fresh assets worth over Rs 1,400 cr in case against Anil Ambani's Reliance Group

India signs one-year deal to import 2.2 million tonnes of LPG from US

India International Trade Fair begins at Pragati Maidan amid tight security