


Highlights
- Apollo Hospital stock shows bullish momentum with RSI 60.51
- Kotak Mahindra Bank signals overbought zone with RSI 73.44
- Tata Motors trades below 50-day EMA, indicating consolidation
Latest news

iQOO Buds Review: Monster Battery and Serious Gaming Chops for under ₹2,000

Repo rate today at 5.25%: how long an RBI decision takes to reach your home loan interest rate

CMF Buds Neo Review: 35dB ANC, 52-Hour Battery and Incredible Value

iQOO Z11 Review: A Balanced Mid-Range Powerhouse

Samsung Galaxy Watch 9 Review: Familiar, Faster And Better Where It Matters

Samsung Galaxy Watch Ultra2 Review: A Smarter, Tougher and Longer-Lasting Ultra

Gabit Smart Ring Review: A Better Way To Track Your Health?
Xiaomi Power Bank 5i 20000 67W Review: A Powerful Travel Companion
Top 5 Nifty 50 gainers today – March 28, 2025: Biggest stock moves



In this article, we will explore the technical indicators of some of the high-performing stocks on the Indian stock market, including APOLLOHOSP, KOTAKBANK, ONGC, TATACONSUM, and TATAMOTORS.
By looking at these stocks through the lens of key technical factors, we aim to better understand their price movements, trends, and potential future performance.

Analysis for Apollo Hospital - March 28, 2025

Apollo Hospital demonstrated a positive performance with a closing price of 6616.20, reflecting a 1.91% increase from its previous close. Trading volume was 413,870, and technical indicators suggest a bullish sentiment with RSI at 60.51 and a positive MACD value of 39.15. The stock belongs to the Healthcare sector in India, specifically in Medical Care Facilities, with a market cap of 951.31 billion and a PE Ratio of 72.79.

Relationship with Key Moving Averages
Apollo Hospital's stock closed at 6616.20, which is above the 50 EMA of 6512.36 and just above the 200 EMA of 6599.40, indicating a bullish trend. The stock also closed higher than the 10 EMA of 6483.31 and the 20 EMA of 6420.44, further suggesting upward momentum.
Moving Averages Trend (MACD)
The MACD for Apollo Hospital is currently at 39.15, which is above the MACD Signal Line of -17.68, indicating a bullish trend. This suggests positive momentum in the stock's price movement.

RSI Analysis
Apollo Hospitals has an RSI value of 60.51, which suggests that the stock is in the moderately overbought region. Typically, an RSI above 70 indicates overbought conditions, while an RSI below 30 indicates oversold conditions.

Analysis for Kotak Mahindra Bank - March 28, 2025

Kotak Mahindra Bank exhibited a positive performance, closing at 2171.20, marking a 1.99% increase from its previous close of 2128.65. The stock's RSI of 73.44 suggests it might be in overbought territory, while the MACD indicates bullish momentum. With a strong market cap of over 4.31 trillion INR, the bank maintains a significant presence in the financial sector.

Relationship with Key Moving Averages
Kotak Mahindra Bank's closing price of 2171.20 is significantly above its 50-day EMA at 1967.45, 200-day EMA at 1854.27, and 10-day EMA at 2100.02. This indicates a strong upward trend, reinforced by a high RSI value of 73.44, suggesting overbought conditions.
Moving Averages Trend (MACD)
MACD Analysis for Kotak Mahindra Bank: The MACD value is 61.33, indicating a strong bullish momentum as it is above the MACD Signal line at 44.53. This suggests a positive trend in the stock's price movement.

RSI Analysis
Kotak Mahindra Bank's current RSI stands at 73.44, indicating overbought conditions. This suggests that the stock has experienced significant buying pressure, which may precede a potential pullback or correction. Traders often consider an RSI above 70 as a signal that a reversal or consolidation could occur.

Analysis for ONGC - March 28, 2025

Company: ONGC Performance Summary: ONGC's recent trading session saw a 1.74% price increase, closing at 246.38, up from the previous close of 242.17. The stock is under pressure from its 200-day EMA of 249.52, indicating a possible resistance level, but is supported by the current 50-day EMA at 239.32. With a MACD above the signal line, the momentum shows bullish tendencies. Despite a market-sensitive sector, the company maintains a healthy PE ratio of 7.94.

Relationship with Key Moving Averages
The current close price of ONGC at 246.38 is above the 50-day and 20-day EMAs, which are at 239.32 and 236.88 respectively, indicating a short-term bullish trend. However, the close price is slightly below the 200-day EMA of 249.52, suggesting that it is still in proximity to longer-term resistance levels.
Moving Averages Trend (MACD)
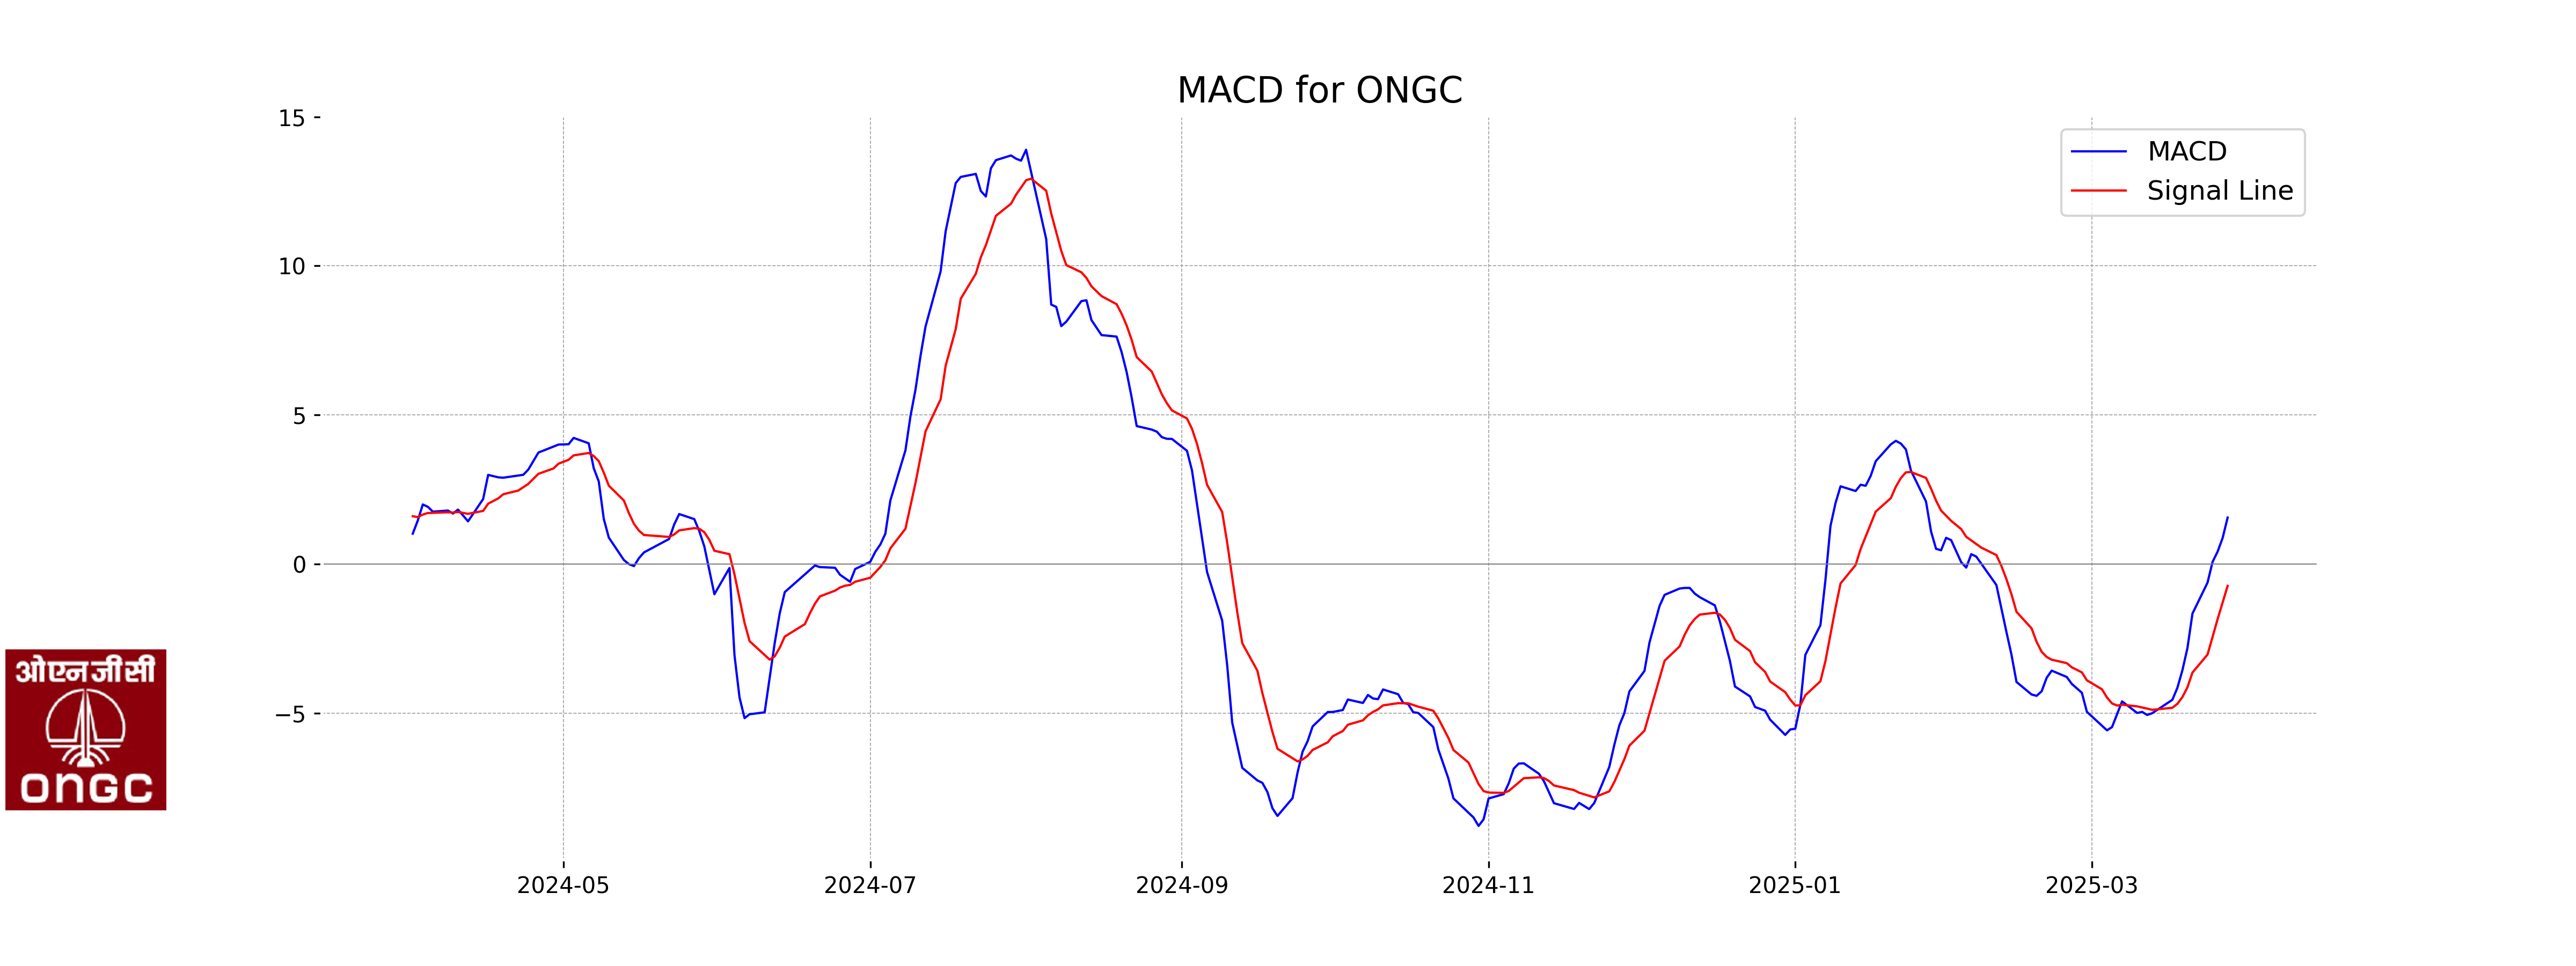
The MACD value for ONGC is 1.56, which is above the MACD Signal line at -0.73, suggesting a bullish momentum. This indicates a potential buying signal as the bullish crossover implies increasing positive trend strength in the stock's price movement.
RSI Analysis
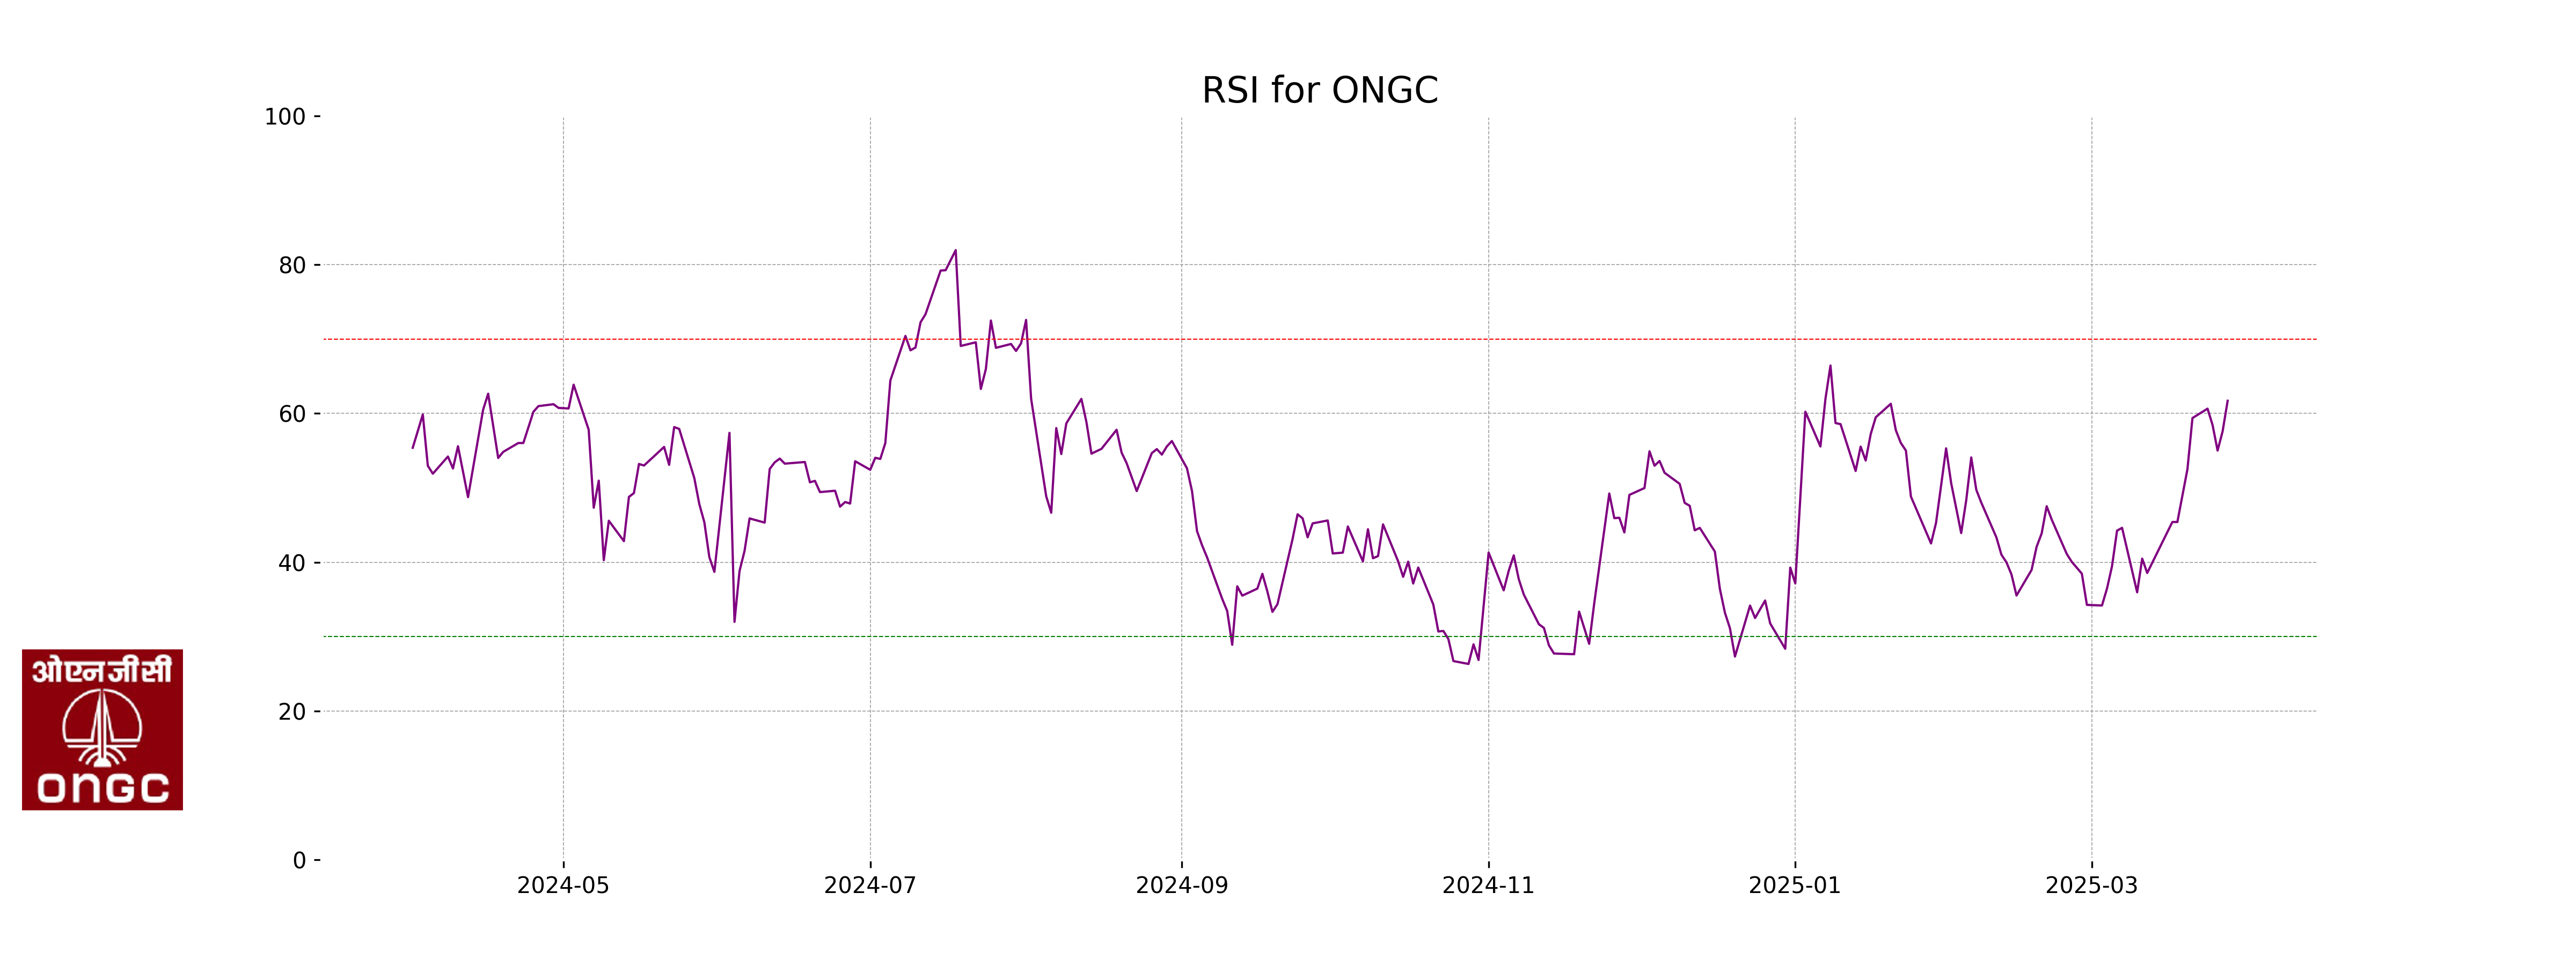
The RSI (Relative Strength Index) for ONGC is 61.71, indicating a bullish sentiment in the stock as it's above the midpoint of 50. An RSI between 50 and 70 typically suggests that the stock is gaining strength but is not yet overbought.
Analysis for Tata Consumer - March 28, 2025

Tata Consumer Performance Tata Consumer closed at 1001.90, marking a notable increase of 2.91% from the previous close of 973.55. The stock saw a high of 1015.00 with a volume of 2,312,294 shares traded. Despite the MACD indicating a potential bearish trend, the stock's RSI of 61.97 suggests a moderately strong momentum, supported by a positive points change of 28.35. The company, with a market cap of 991,374,082,048 INR, operates in India's Consumer Defensive sector, specifically in Packaged Foods. The PE Ratio stands at 85.05, reflecting investor expectations for growth.

Relationship with Key Moving Averages
Tata Consumer is currently trading above its 10-day and 20-day EMAs, indicating short-term bullish momentum, but is below the 200-day EMA, suggesting potential long-term resistance. The stock's closing price of 1001.90 is above the 50-day EMA, reinforcing the short-term upward trend.
Moving Averages Trend (MACD)
MACD Analysis for Tata Consumer The MACD is currently at -2.60, indicating a bearish momentum, as it is below the signal line at -7.78. However, the difference between the MACD and the signal line suggests that a possible crossover might occur if upward momentum continues.

RSI Analysis
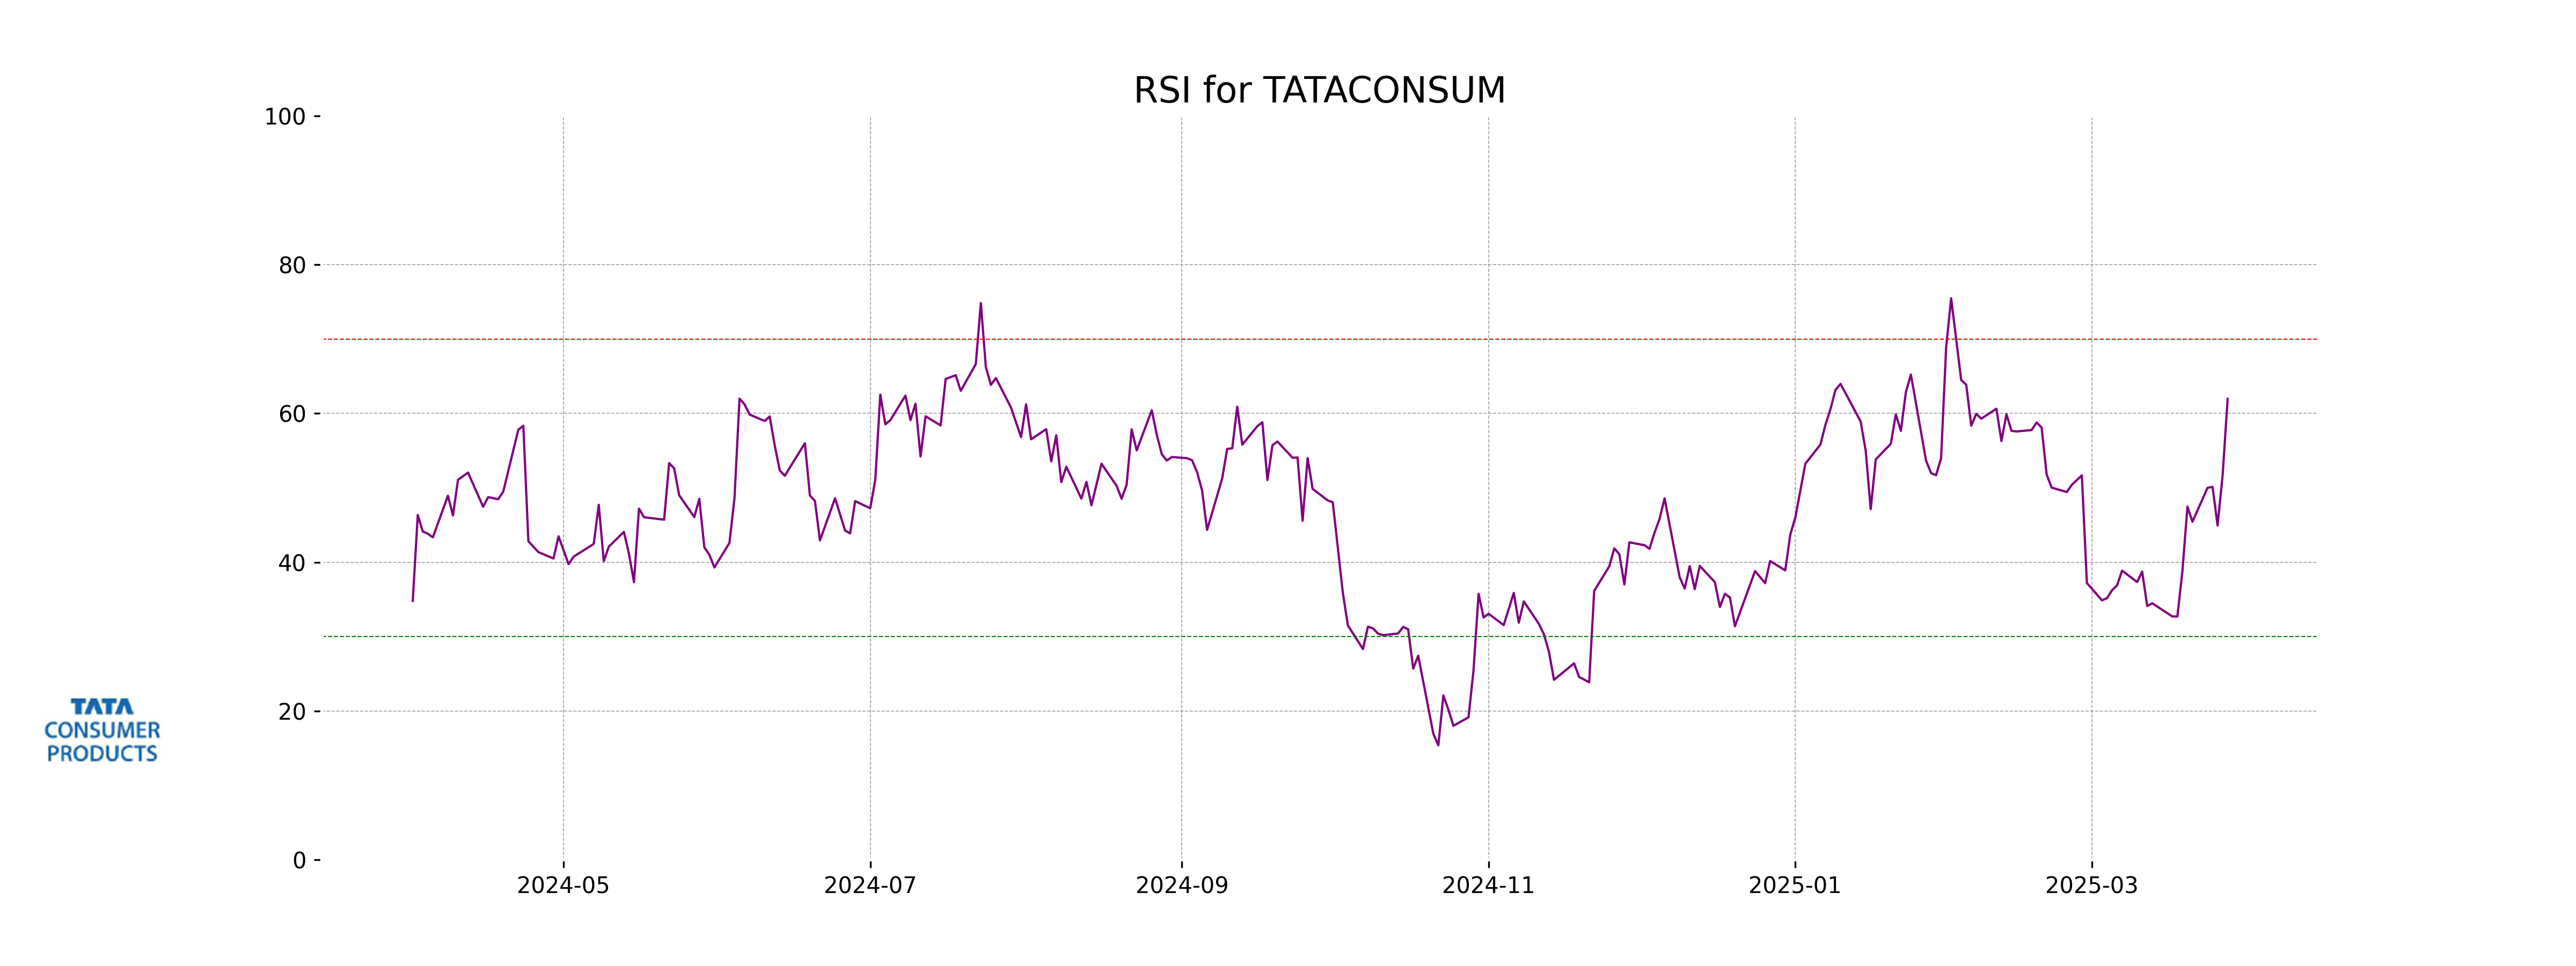
Tata Consumer shows an RSI value of 61.97, which indicates a moderately strong momentum as it is above the neutral 50 level. This suggests that the stock is in a bullish phase, but it is not yet overbought since the RSI is still below 70.
Analysis for Tata Motors - March 28, 2025

Tata Motors experienced a slightly positive trading session, with the stock closing at 674.45, showing a percentage change of 0.88%. The stock traded between a high of 684.95 and a low of 669.30. The market sentiment appears moderately stable, with a relative strength index (RSI) of 48.18, indicating the stock is neither overbought nor oversold.

Relationship with Key Moving Averages
Tata Motors is currently trading below its 50-day EMA at 695.12 and significantly below its 200-day EMA at 797.51, indicating a potential bearish trend. However, the current price at 674.45 is slightly above the 20-day EMA at 678.45 and just below the 10-day EMA at 683.61, suggesting recent consolidation near short-term averages.
Moving Averages Trend (MACD)
MACD Analysis for Tata Motors The MACD value of 2.72, which is above the MACD Signal of -1.54, suggests a potential bullish trend. This indicates that the stock's momentum may be shifting towards an upward movement.

RSI Analysis
The RSI for Tata Motors is 48.18, indicating that the stock is in a neutral range. It is not currently overbought or oversold, suggesting a potential for balanced price movement without extreme bullish or bearish momentum.

Frequently Asked Questions
Up Next
Top 5 Nifty 50 gainers today – March 28, 2025: Biggest stock moves
Repo rate today at 5.25%: how long an RBI decision takes to reach your home loan interest rate

Step-by-step guide to apply for a mortgage loan online with minimal documentation

Honda Activa 6G: Everything You Need to Know Before Buying

How much does a ULIP plan really cost? A break-down of all charges

Centre plans to borrow Rs 8.20 lakh cr from market in first half of FY27

More videos

Reliance denies buying Iranian oil amid US sanctions waiver

Premium petrol price up Rs 2, industrial diesel up Rs 22; no change in normal petrol, diesel rates

India's GDP expected to register over 8 pc growth in Sep-Dec: Report

Govt announces seven measures to help boost exports
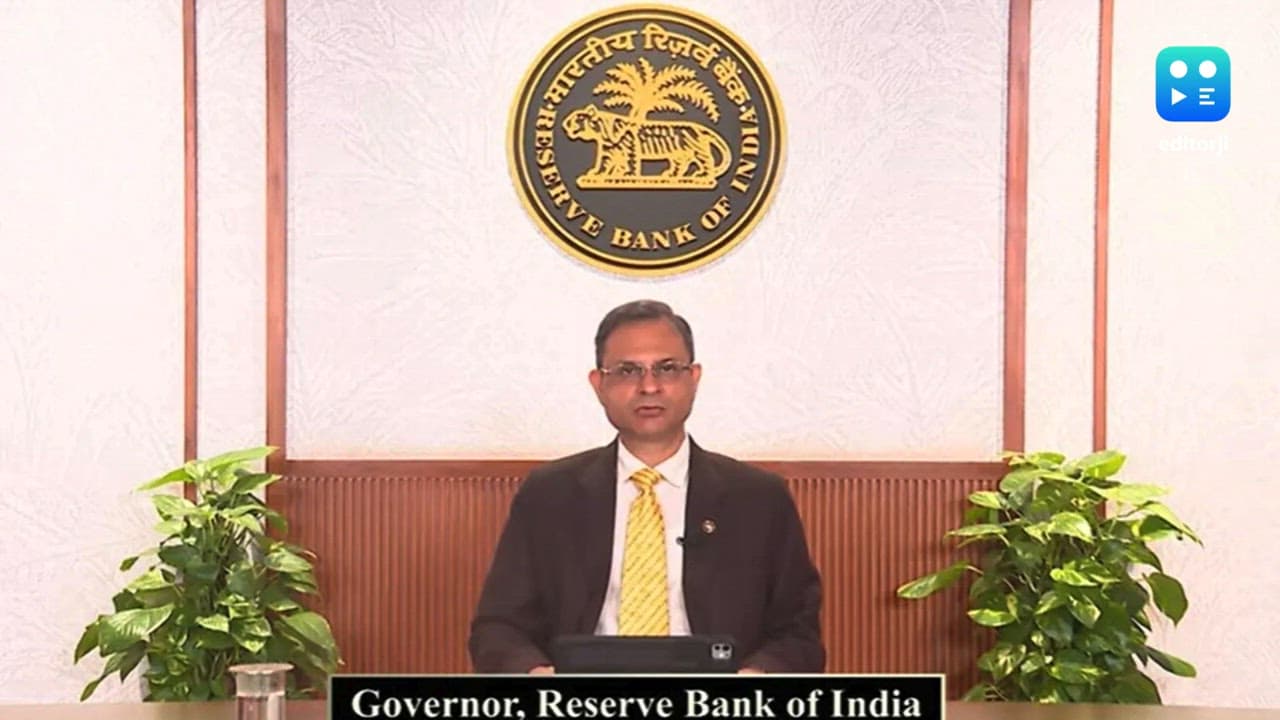
RBI keeps interest rates on hold after US trade deal boosts outlook

RBI proposes to compensate customers up to Rs 25,000 loss due to fraud

RBI raises GDP growth projection of Q1, Q2 of FY27

RBI pauses rate cuts, retains interest rate at 5.25 pc

Rupee jumps 122 paise to close at 90.27 against US dollar on India-US trade deal

Stock markets cheer India-US trade deal: Sensex, Nifty surge 2.5 pc