


Highlights
- BPCL shows short-term strength but long-term caution
- ICICI Bank maintains bullish trend with stable RSI
- Shriram Finance nears overbought zone with strong momentum
Latest news

Indian cricket prodigy Vaibhav Suryavanshi honoured with 'Pradhan Mantri Rashtriya Bal Puraskar'

AAP Gujarat chief Isudan Gadhvi calls BJP allegations against MLA Chaitar Vasava as politically driven

Aditya Dhar's 'Dhurandhar' earns over Rs 1000 crore at box office

Australia lead England by 46 after 20 wickets fall on crazy day at MCG

Delhi HC asks Centre to respond on plea seeking GST cut on air purifiers amid worsening air quality

Congress pays tribute to former PM Manmohan Singh on first death anniversary

Ruled out of last two Ashes Tests, Cummins sets sights on T20 World Cup in Feb

CEO among three held for gangrape of woman IT firm manager in Udaipur
Top 5 Nifty 50 gainers today – March 11, 2025: Biggest stock moves


In this article, we will explore the technical indicators of some of the high-performing stocks on the Indian stock market, including BPCL, ICICIBANK, SHRIRAMFIN, SUNPHARMA, and TRENT.
By looking at these stocks through the lens of key technical factors, we aim to better understand their price movements, trends, and potential future performance.

Analysis for BPCL - March 11, 2025

BPCL has shown a notable performance with an increase of approximately 2.98% in its closing price to 264.58, compared to the previous close of 256.93. It witnessed an active trading volume of 12,303,730 shares. The stock is trading above its 50-day EMA of 262.94, while remaining below its 200-day EMA of 280.57, indicating possible short-term strength. The RSI of 56.58 suggests that the stock is not in overbought territory within the Energy sector, specifically in Oil & Gas Refining & Marketing in India.

Relationship with Key Moving Averages
For BPCL, the closing price of 264.579987 is above the 50-day EMA of 262.937415, indicating short-term bullish momentum. However, it remains below the 200-day EMA of 280.570251, suggesting bearish sentiment in the longer term.
Moving Averages Trend (MACD)
BPCL's MACD stands at -0.64, indicating a bearish sentiment as it is below the MACD Signal line of -2.97. This discrepancy suggests potential downward momentum, but with the MACD being upward, there might be signs of recovery or a trend reversal in the near term.

RSI Analysis
The RSI for BPCL is 56.58, indicating that the stock is in a neutral zone. It suggests that BPCL is neither overbought nor oversold at the moment, providing a balanced outlook for potential buyers and sellers.

Analysis for ICICI Bank - March 11, 2025

ICICI Bank experienced a positive performance with a significant increase of 2.51% in its stock price, closing at 1245.40. It surpassed both its 50-day and 200-day EMAs, indicating a strong short-term momentum. The stock's RSI is moderately strong at 55.02, suggesting a relatively balanced demand.

Relationship with Key Moving Averages
ICICI Bank's closing price is slightly above its 50-EMA, indicating potential upward momentum, while also being above its 10-EMA and 20-EMA, suggesting near-term strength. The company's closing price surpasses its 200-EMA, reinforcing a longer-term bullish trend.
Moving Averages Trend (MACD)
{"MACD Analysis": "The MACD for ICICI Bank is -8.13 while the MACD Signal is -9.18, indicating a potential bullish signal as the MACD line is above the signal line. However, both values being negative suggests the stock might still be in a bearish phase."}

RSI Analysis
The current RSI value for ICICI Bank is 55.02, which suggests that the stock is in a neutral zone. An RSI value between 30 and 70 typically indicates that the stock is neither overbought nor oversold, suggesting balanced market conditions.

Analysis for Shriram Finance - March 11, 2025

Shriram Finance showed a positive performance with a closing price of 638.25, showing a 2.02% increase from the previous close of 625.60. The stock experienced healthy trading volume and demonstrated strong momentum, as indicated by a high RSI of 66.82 and a positive MACD. The company's financial health is supported by a PE Ratio of 15.46 and an EPS of 41.29, situating it well within the Financial Services sector in India.

Relationship with Key Moving Averages
The closing price of Shriram Finance is above its 50-day and 200-day EMAs, indicating a positive trend. Additionally, the close is above the 10-day and 20-day EMAs, suggesting short-term bullish momentum.
Moving Averages Trend (MACD)
MACD Analysis for Shriram Finance: The MACD line (21.99) is above the MACD signal line (17.27), which indicates a bullish momentum. This suggests that the stock may continue to experience upward price movement in the near term.

RSI Analysis
Shriram Finance's RSI is at 66.82, which indicates that the stock is nearing overbought territory. RSI values above 70 typically suggest that a stock may be overbought, while values below 30 indicate it may be oversold. Therefore, investors should monitor the stock for potential price corrections.

Analysis for SUN Pharma - March 11, 2025

### SUN Pharma Performance: SUN Pharma closed at 1655.30, marking a 2.72% increase from its previous close of 1611.50. The stock demonstrated a positive upward movement with a points change of 43.80 and traded a volume of 3,325,299 shares. Despite the recent rise, it is trading below its 50 EMA of 1701.22 but above its 10 EMA. The stock's RSI is at 48.69, suggesting a neutral position, while the MACD indicates a slight bearish trend with a value of -33.55.

Relationship with Key Moving Averages
SUN Pharma closed at 1655.30, which is below its 50-day EMA of 1701.22 and 200-day EMA of 1690.94, indicating a short-term bearish trend. However, it is above the 10-day EMA of 1622.86 and slightly below the 20-day EMA of 1646.23, suggesting some recent positive momentum.
Moving Averages Trend (MACD)
MACD Analysis for SUN Pharma: The MACD value for SUN Pharma is -33.55, while the MACD Signal is -37.49. Since the MACD is above the Signal line, it suggests that the stock might be experiencing a bullish divergence in the short term.

RSI Analysis
SUN Pharma's RSI is at 48.69, which is near the neutral range, indicating neither an overbought nor oversold condition. This suggests potential stability or a possible consolidation phase for the stock.

Analysis for Trent - March 11, 2025

Trent Ltd. opened at 4739.70 and closed at 4995.45, showing a positive change of 4.08% from the previous close of 4799.70, with a significant points increase of 195.75. The stock's performance is supported by a trading volume of 1,437,899 and is currently under its 50 and 200-day EMAs, indicating a short-term bearish trend. With a PE Ratio of 92.10, Trent is part of the Consumer Cyclical sector and specializes in Apparel Retail, based in India.
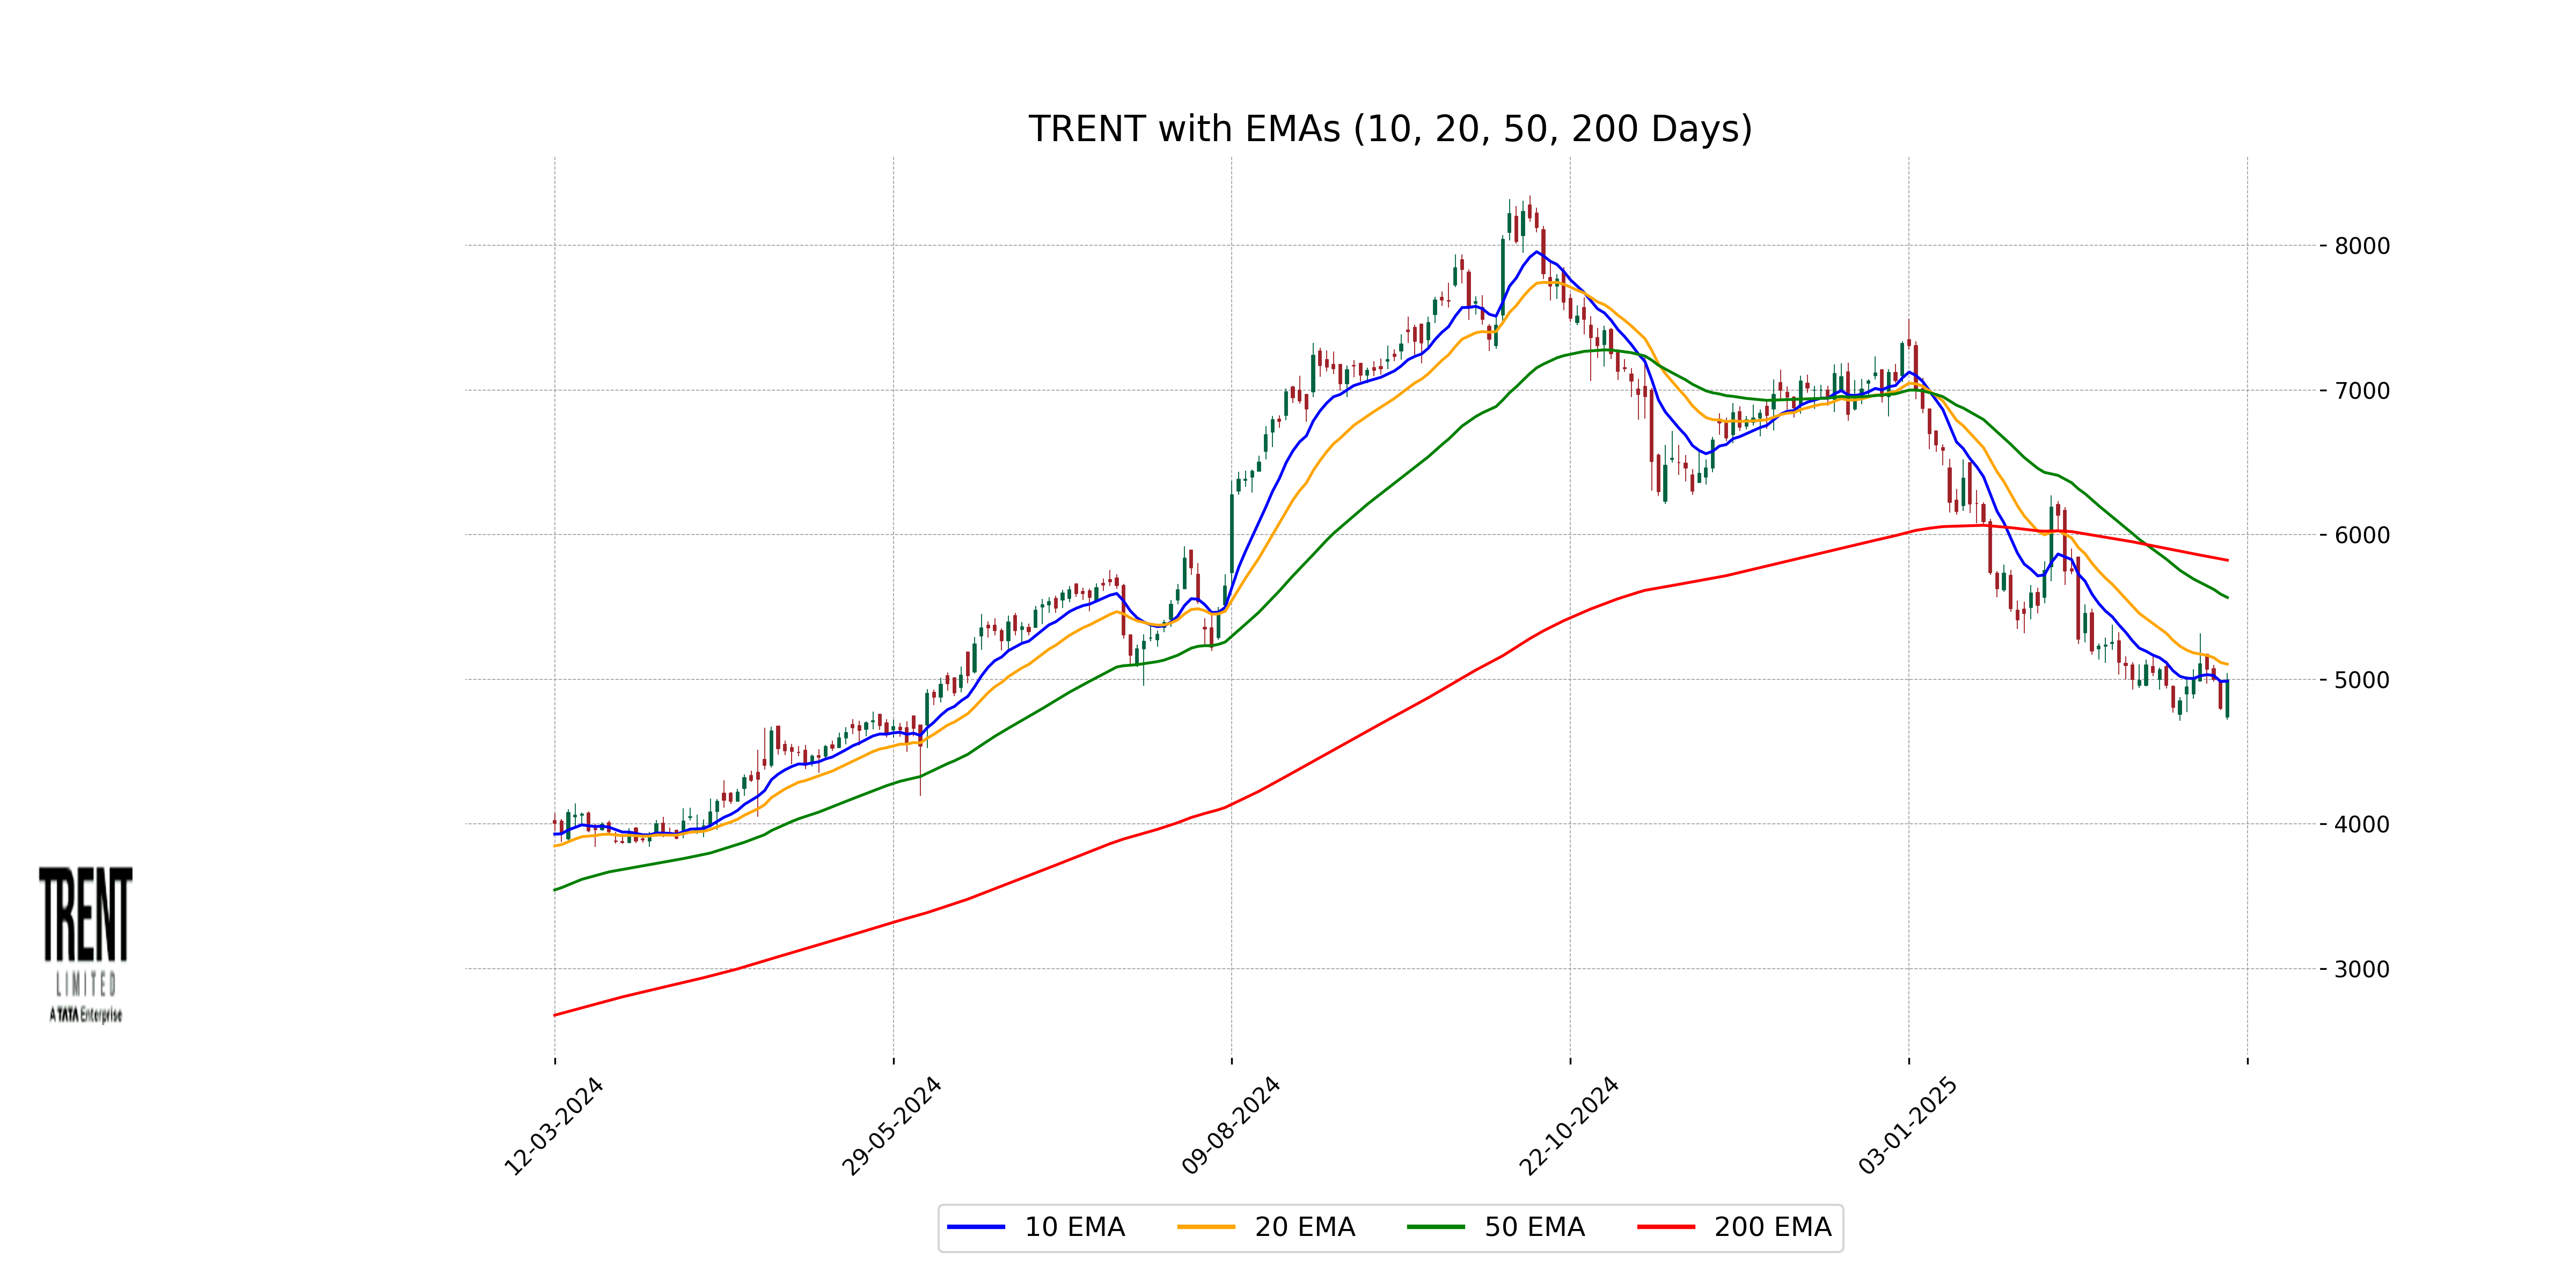
Relationship with Key Moving Averages
Trent's recent closing price of 4995.45 is below its 50-day EMA of 5566.38 and 200-day EMA of 5823.99, indicating a potential bearish trend. However, it is slightly above the 10-day EMA of 4987.17, suggesting short-term bullish momentum.
Moving Averages Trend (MACD)
Trent's MACD analysis indicates a bearish trend, with a MACD value of -195.27 compared to a signal line at -234.64, suggesting the recent momentum may still be downward but shows signs of a potential crossover. As the MACD is below the signal line, it confirms ongoing bearish sentiment. Keep monitoring for any shifts that might indicate a trend reversal.

RSI Analysis
RSI Analysis for Trent: The RSI of 42.50 suggests that Trent is in a neutral to slightly oversold territory. This indicates that the stock isn't experiencing strong buying or selling pressure currently and decreases the likelihood of an imminent trend reversal.

Up Next
Top 5 Nifty 50 gainers today – March 11, 2025: Biggest stock moves

India revamps tax regime in 2025, new I-T Act to take effect from April 1

New Zealand commits USD 20 bn investment in India under FTA in 15 yrs; on lines of EFTA pact

India, New Zealand conclude FTA talks; pact to offer duty-free access, USD 20 bn FDI

FTA with New Zealand to significantly deepen bilateral economic engagement: Govt

Rupee breaches 91-mark against US dollar for first time in intra-day trade

More videos

Microsoft commits USD 17.5 billion investment in India: CEO Satya Nadella

CBI books Anil Ambani's son, Reliance Home Finance Ltd. in Rs 228 crore bank fraud case

RBI raises FY26 GDP growth projection to 7.3 pc

RBI trims policy interest rate by 25bps to 5.25pc, loans to get cheaper

Rupee slumps to all-time low of 90.25 against US dollar in intra-day trade

Reliance completes merger of Star Television Productions with Jiostar

India to lead emerging market growth with 7pc GDP rise in 2025: Moody’s

Nifty hits record high after 14 months; Sensex nears all-time peak

Reliance stops Russian oil use at its only-for-export refinery to comply with EU sanctions

ED attaches fresh assets worth over Rs 1,400 cr in case against Anil Ambani's Reliance Group