


Highlights
- Adani Enterprises shows bearish momentum with RSI at 40.89
- Shriram Finance bullish with RSI of 70.81, strong trend
- SBI Life nearing oversold levels with RSI at 34.49
Latest news

Emma Roberts to return for 'Aquamarine' TV series 20 years after original film

IBM unveils first sub-1 nm chip; Packs nearly 100 bn transistors into a space the size of fingernail

ZTE Showcases Full-Stack AI Capabilities at MWC Shanghai 2026, Empowering New Era of Token Operations

Tailorworks Introduces a Modern Approach to Bespoke Fashion for Today's Luxury Consumer

Zoey Deutch says having two Taylor Swift songs in 'Voicemails For Isabelle' "meant a lot" to her

PNB MetLife records 99.81 percent Individual Claim Settlement Ratio in FY26

"India-Israel FTA may be signed in very near future": Israel Embassy's Economic Division head Ofir Amami

When Should You Review Your Term Life Insurance Policy?
Top 5 Nifty 50 gainers today – March 04, 2025: Biggest stock moves


In this article, we will explore the technical indicators of some of the high-performing stocks on the Indian stock market, including ADANIENT, BEL, BPCL, SBILIFE, and SHRIRAMFIN.
By looking at these stocks through the lens of key technical factors, we aim to better understand their price movements, trends, and potential future performance.

Analysis for Adani Enterprises - March 04, 2025

Adani Enterprises, operating in India's thermal coal industry, closed at 2144.8, with a 1.31% increase from the previous close of 2117.1. The stock's RSI is 40.89, indicating potential market pressure, while the MACD of -62.44 suggests a bearish trend. It comes with a PE Ratio of 70.86 and an EPS of 30.27 with a significant market cap of approximately 2.48 trillion.

Relationship with Key Moving Averages
Adani Enterprises' current close of 2144.80 is below its 50 EMA of 2312.88 and 200 EMA of 2651.84, indicating a potential bearish trend. However, it remains close to its 10 EMA of 2149.18.
Moving Averages Trend (MACD)
Adani Enterprises MACD Analysis: The MACD value for Adani Enterprises is -62.44, while the MACD Signal is -59.51. This indicates a bearish trend as the MACD is below the signal line, suggesting that the stock may experience further downward movement.

RSI Analysis
Adani Enterprises has an RSI of 40.89, which indicates that it is in the neutral zone but closer to being oversold. Typically, an RSI below 30 suggests an oversold condition, while above 70 indicates overbought; hence, the current RSI suggests mild selling pressure but not at an extreme level.

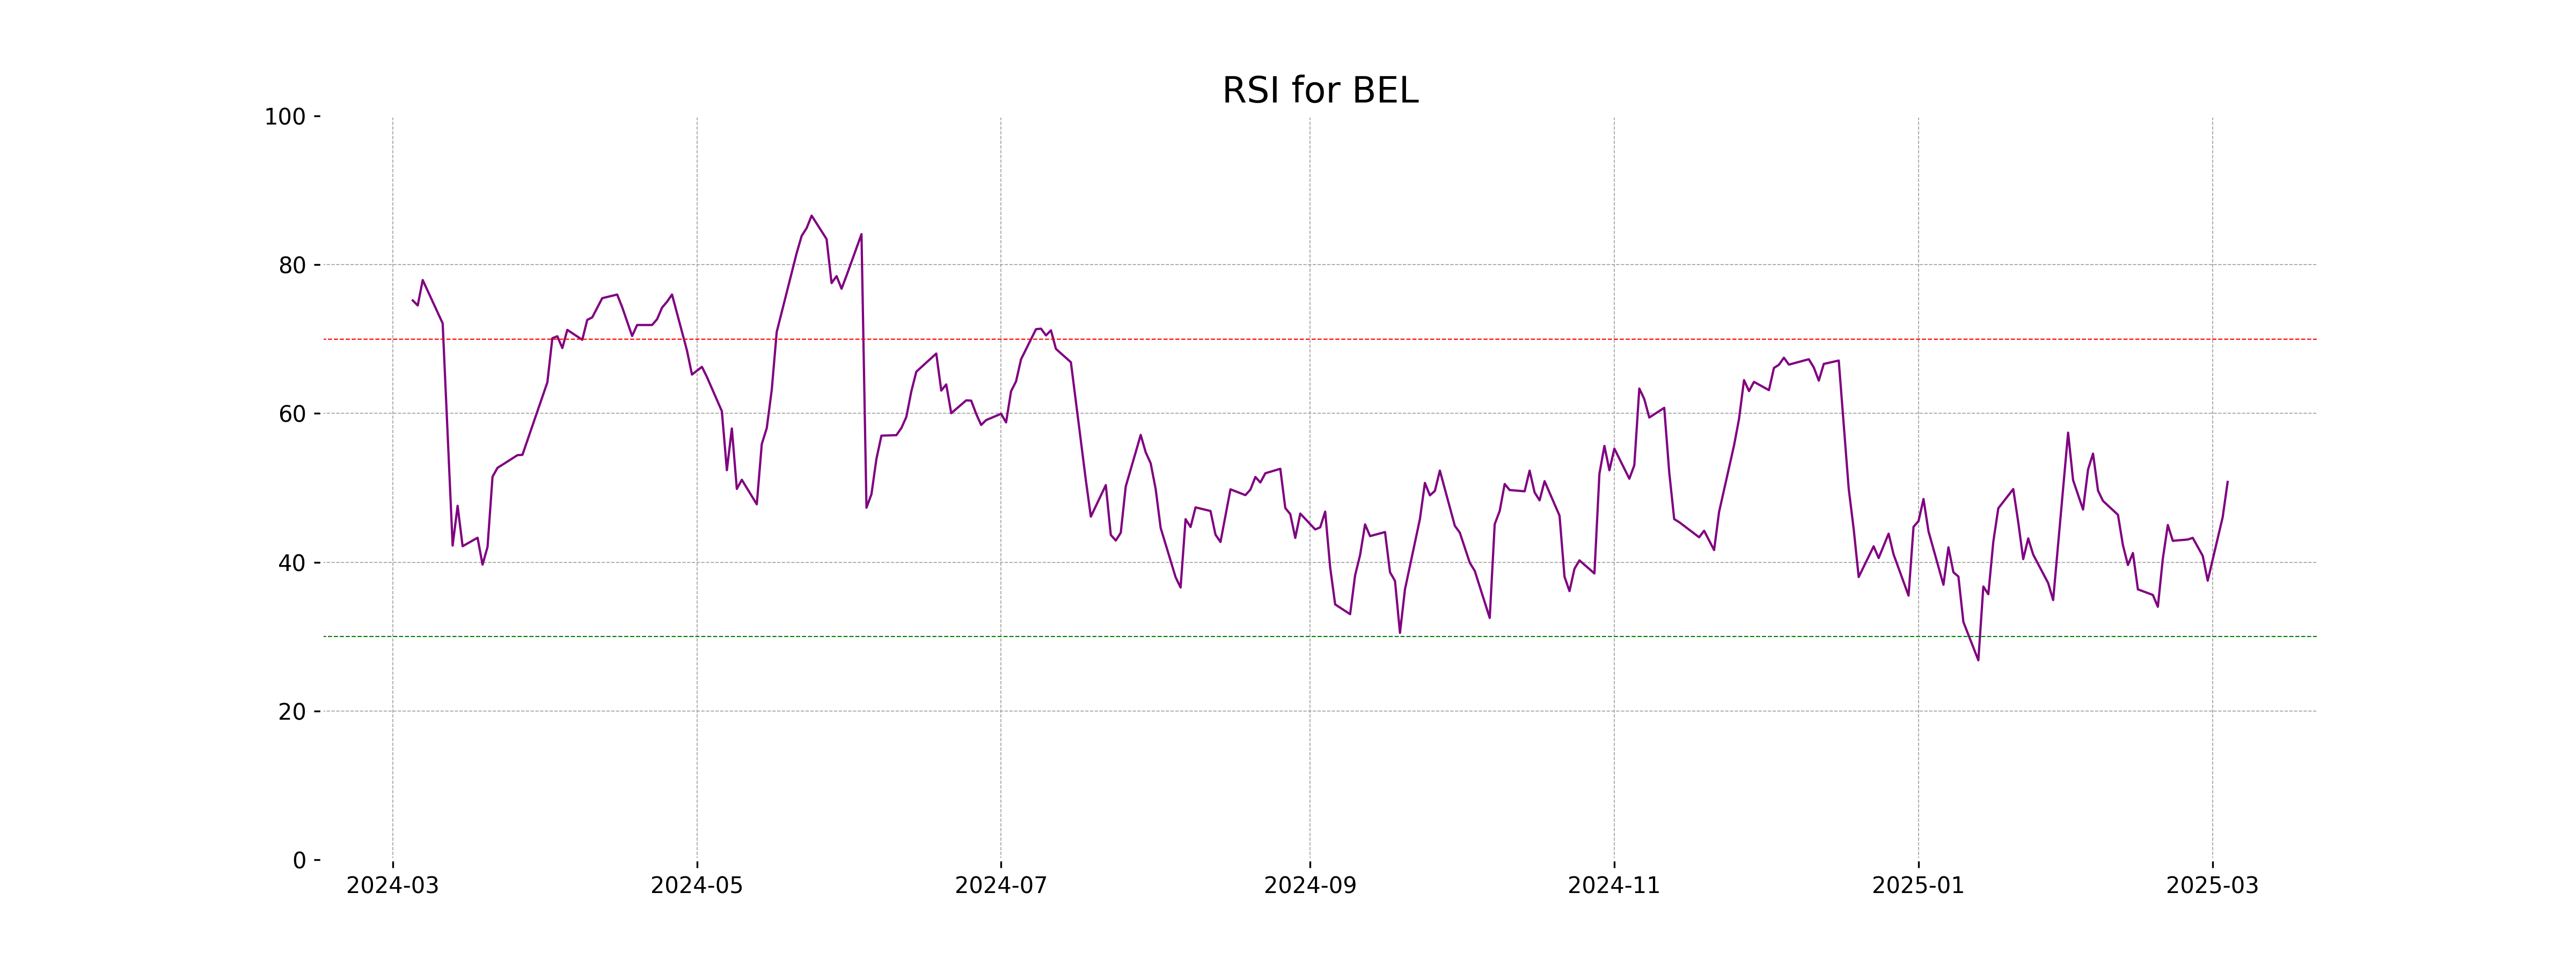
Analysis for Bharat Electronics - March 04, 2025

Bharat Electronics Limited saw its stock close at 264.71, marking a positive change of 2.84% from the previous close, with a points increase of 7.32. The stock's current price is slightly below both its 50-day and 200-day EMA, while trading volumes stood at nearly 25 million, indicating active investor interest. In terms of technical indicators, the RSI of 50.80 suggests a neutral stance, and the MACD indicates a bearish momentum. The company operates in the Aerospace & Defense sector, maintaining a substantial market cap of approximately 1.93 trillion INR, with a PE ratio of 37.13.

Relationship with Key Moving Averages
Bharat Electronics' current closing price of 264.71 is below the 50-day EMA of 270.75 and the 200-day EMA of 270.40, suggesting a bearish trend. However, it is above the 10-day EMA of 257.11 and the 20-day EMA of 260.69, indicating short-term upward momentum.
Moving Averages Trend (MACD)
Bharat Electronics' MACD indicator is at -5.435, with a signal line at -6.410, suggesting the potential for a bearish trend to be weakening. The MACD line being above the signal line indicates positive momentum, which could mean a potential turnaround or confirmation that the stock might gain strength in the near future.

RSI Analysis
Based on the given data, the RSI for Bharat Electronics is 50.80, which suggests a neutral stance in terms of market momentum. An RSI around 50 indicates that the stock is neither overbought nor oversold, implying a balance between buying and selling pressures.
Analysis for BPCL - March 04, 2025

BPCL Performance BPCL had a notable trading session with the stock opening at 241.0 and closing at 249.92, marking a positive percentage change of 3.10% compared to the previous close of 242.41. The share exhibited a significant volume of 7,199,811 trades, with a market cap standing at 1,084,280,340,480 INR. Despite having an RSI of 45.17 suggesting slight overselling, the stock saw an upward movement, perhaps indicating investor optimism or positive sectoral trends in Energy, specifically in Oil & Gas Refining & Marketing.

Relationship with Key Moving Averages
The closing price of BPCL is below both the 50-day EMA (263.41) and the 200-day EMA (281.57), indicating a bearish trend. However, the closing price is just above the 10-day EMA (248.27), suggesting potential short-term upward momentum.
Moving Averages Trend (MACD)
Based on the provided financial data for Bharat Petroleum Corporation Limited (BPCL), the MACD value is -5.3479, which is below the MACD Signal value of -5.1020. This indicates a bearish momentum as the MACD line is below the signal line, suggesting potential downward price movement. The RSI at 45.17 implies neutral to slightly bearish sentiment.

RSI Analysis
BPCL's RSI (Relative Strength Index) is currently at 45.17, indicating that the stock is in the neutral zone, leaning slightly towards being oversold. This suggests there may be potential for upward price movement, but further analysis is recommended.

Analysis for SBI Life - March 04, 2025

SBI Life Performance: SBI Life experienced a decline in its stock performance with a close price dropping by approximately -1.09% from the previous close. The stock closed at 1393.10, with a notable RSI of 34.49 indicating it might be approaching an oversold position. The company's market cap stands robust at 1,418,398.66 million INR, with a PE ratio of 57.97, reflecting its standing in the financial services industry, specifically in life insurance within India.

Relationship with Key Moving Averages
The stock price of SBI Life is currently trading below its key moving averages, as indicated by the current close of 1393.10, which is beneath the 50 EMA of 1467.29, the 200 EMA of 1524.43, the 10 EMA of 1443.91, and the 20 EMA of 1453.68. This positioning suggests a bearish trend in relation to these averages.
Moving Averages Trend (MACD)
SBI Life Insurance's MACD of -8.56 indicates a bearish momentum as it's below the signal line at -0.45. With the RSI at 34.49, the stock is approaching the oversold territory, suggesting potential for a reversal.

RSI Analysis
The RSI (Relative Strength Index) for SBI Life is currently at 34.49, indicating that the stock is approaching the oversold territory. This suggests that the stock has been experiencing recent selling pressure and may be due for a potential reversal or consolidation if this trend continues.

Analysis for Shriram Finance - March 04, 2025

Shriram Finance Performance Description: Shriram Finance showed a positive performance with a closing price of 632.90, reflecting a 1.87% increase from the previous close. The stock's performance is supported by strong moving averages, with the 50-day EMA at 571.59 and the 200-day EMA at 555.31. Additionally, the RSI indicates a robust momentum at 70.81, suggesting that the stock is in a bullish phase. The company's market cap is approximately 1.19 trillion INR, making it a significant player in the financial services sector in India.

Relationship with Key Moving Averages
Shriram Finance is trading well above its 50 EMA at 632.90, compared to the 50 EMA of 571.59, indicating short-term bullish momentum. Additionally, the stock is also trading above its 200 EMA of 555.31, reinforcing a longer-term upward trend.
Moving Averages Trend (MACD)
Shriram Finance MACD Analysis: The MACD for Shriram Finance is 17.17, which is above the MACD Signal of 8.88. This suggests a bullish momentum, indicating a potential upward trend in the stock price.

RSI Analysis
Based on the RSI value of 70.81 for Shriram Finance, the stock is approaching the overbought territory, which suggests that it may be overvalued and could be due for a price correction. Traders often consider an RSI above 70 as an indicator that a stock might be overbought.

Up Next
Top 5 Nifty 50 gainers today – March 04, 2025: Biggest stock moves

Step-by-step guide to apply for a mortgage loan online with minimal documentation

Honda Activa 6G: Everything You Need to Know Before Buying

How much does a ULIP plan really cost? A break-down of all charges

Centre plans to borrow Rs 8.20 lakh cr from market in first half of FY27

Reliance denies buying Iranian oil amid US sanctions waiver

More videos

Premium petrol price up Rs 2, industrial diesel up Rs 22; no change in normal petrol, diesel rates

India's GDP expected to register over 8 pc growth in Sep-Dec: Report

Govt announces seven measures to help boost exports

RBI keeps interest rates on hold after US trade deal boosts outlook

RBI proposes to compensate customers up to Rs 25,000 loss due to fraud

RBI raises GDP growth projection of Q1, Q2 of FY27

RBI pauses rate cuts, retains interest rate at 5.25 pc

Rupee jumps 122 paise to close at 90.27 against US dollar on India-US trade deal

Stock markets cheer India-US trade deal: Sensex, Nifty surge 2.5 pc

UPI transactions hit record high of Rs 230 lakh crore in 2025-26 till Dec: Govt