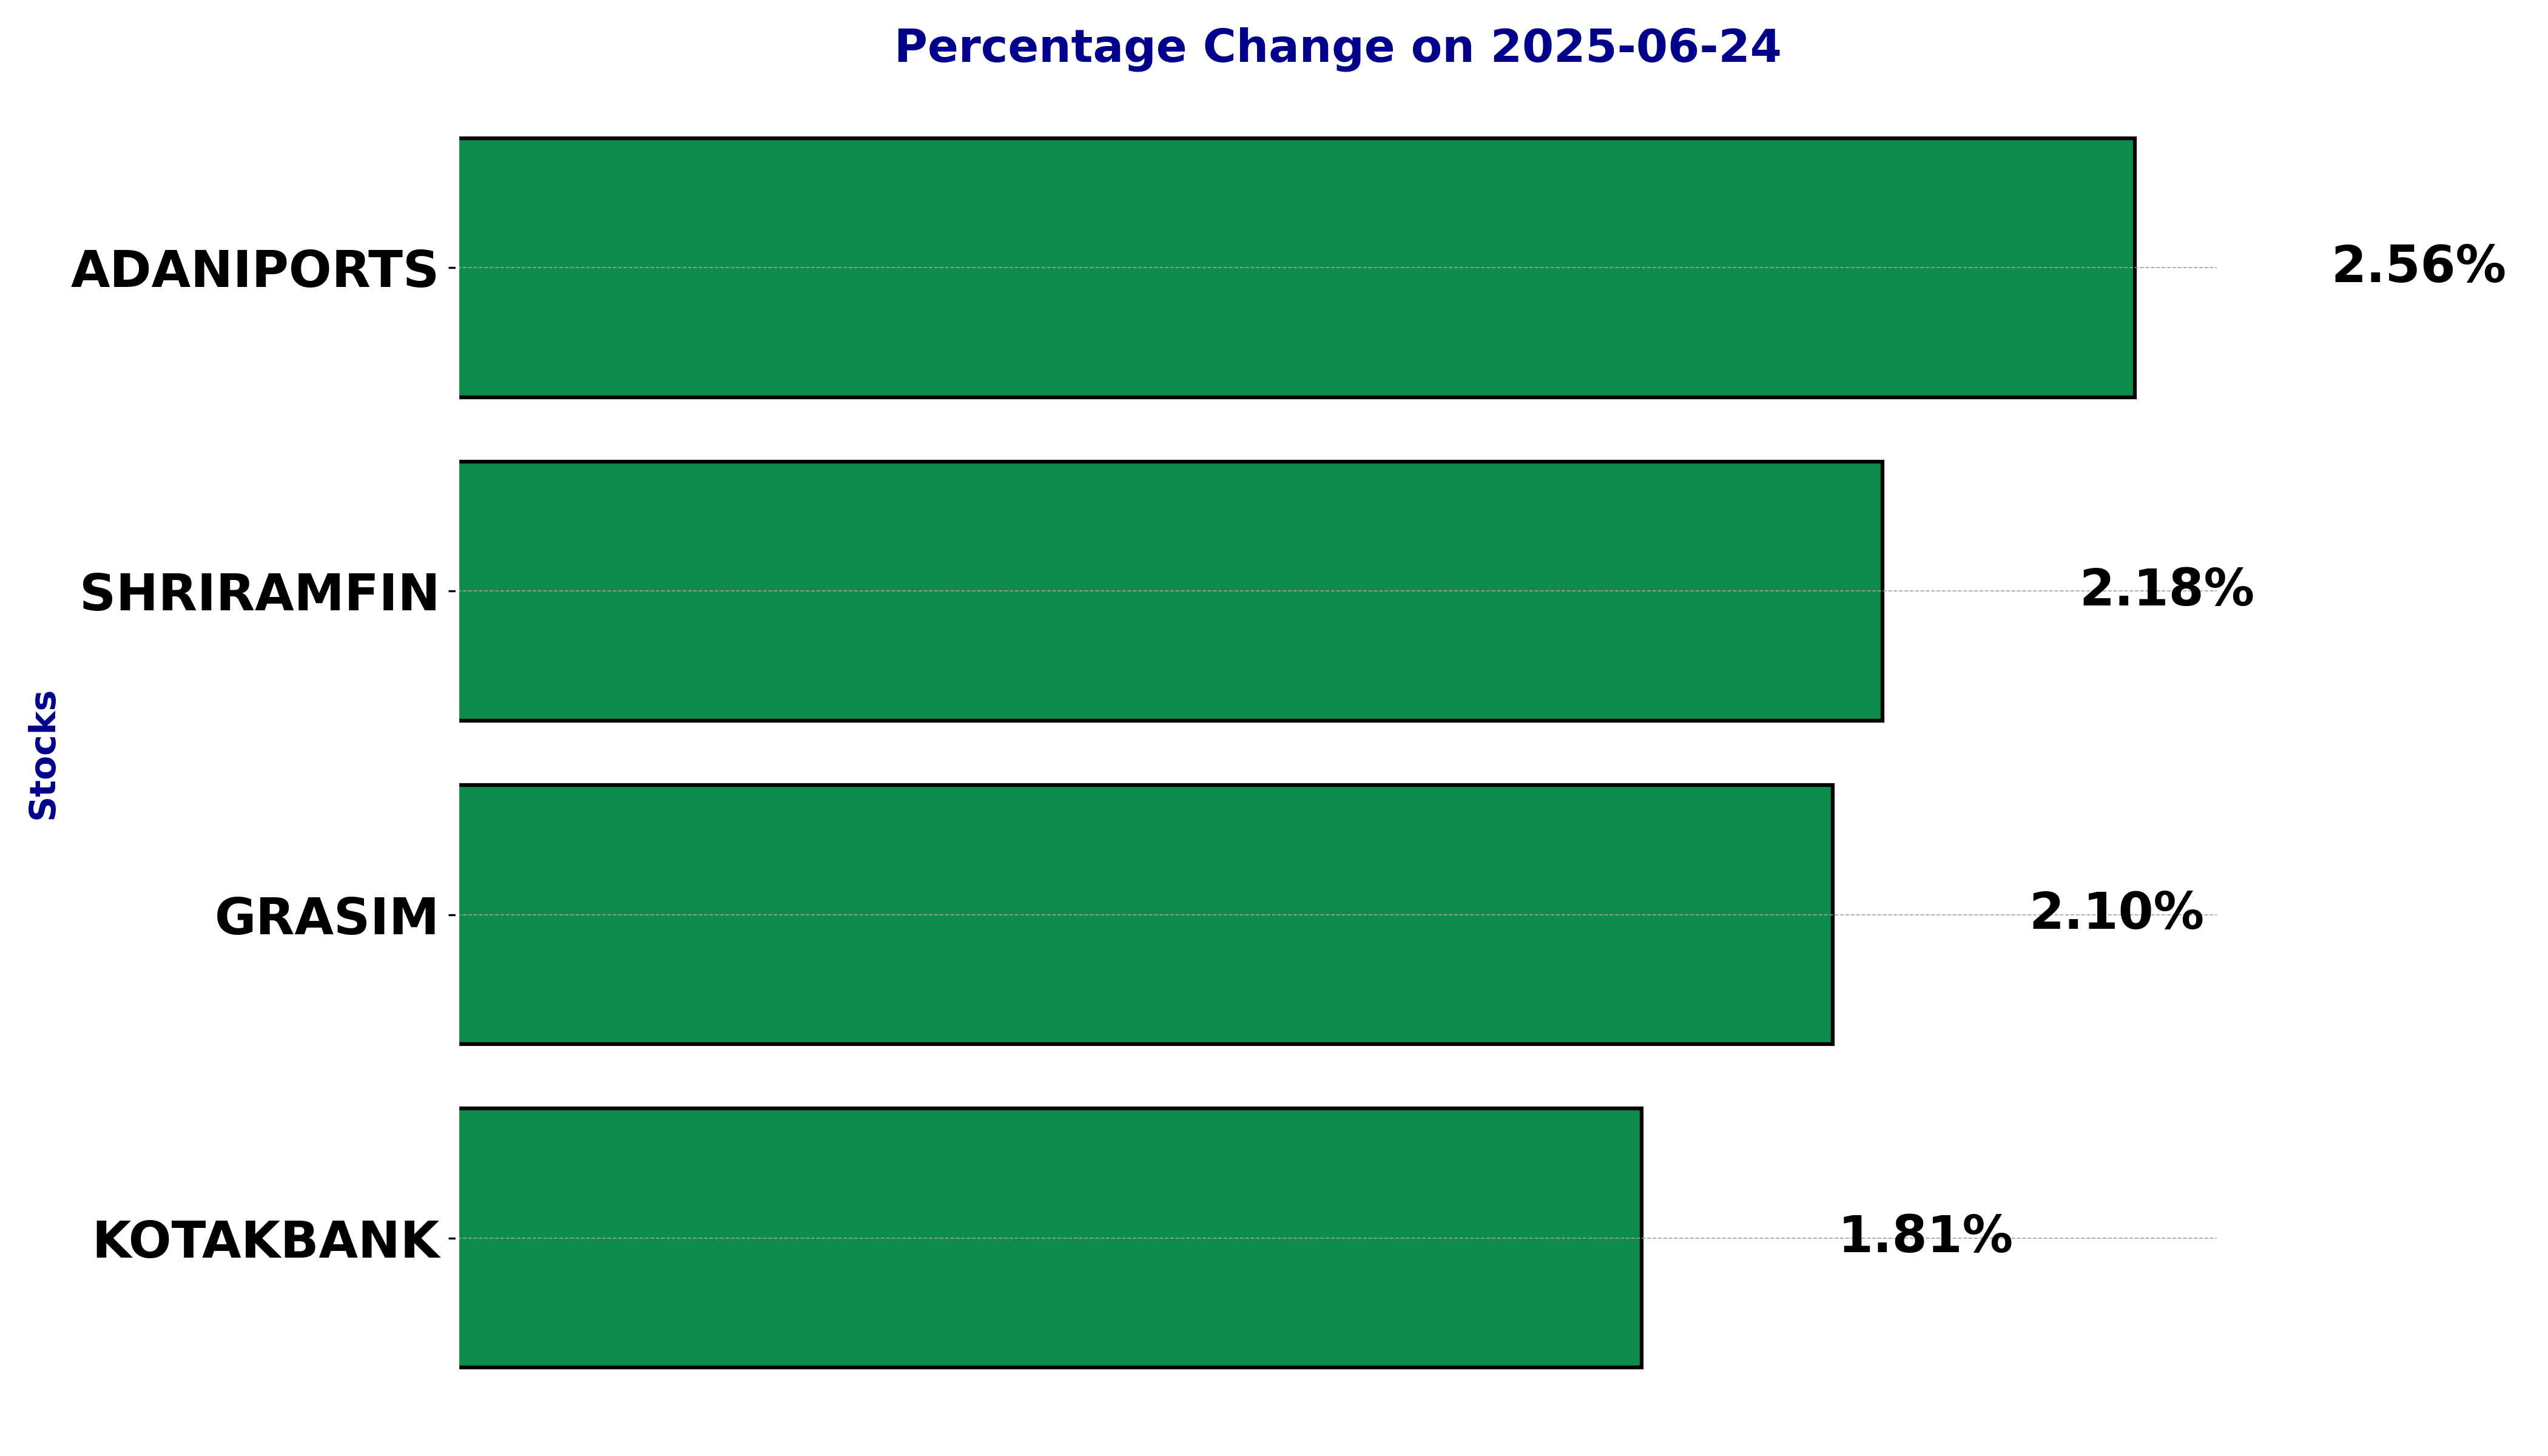
In this article, we will explore the technical indicators of some of the high-performing stocks on the Indian stock market, including ADANIPORTS, GRASIM, KOTAKBANK, and SHRIRAMFIN.
By looking at these stocks through the lens of key technical factors, we aim to better understand their price movements, trends, and potential future performance.
Analysis for Adani Ports - June 24, 2025
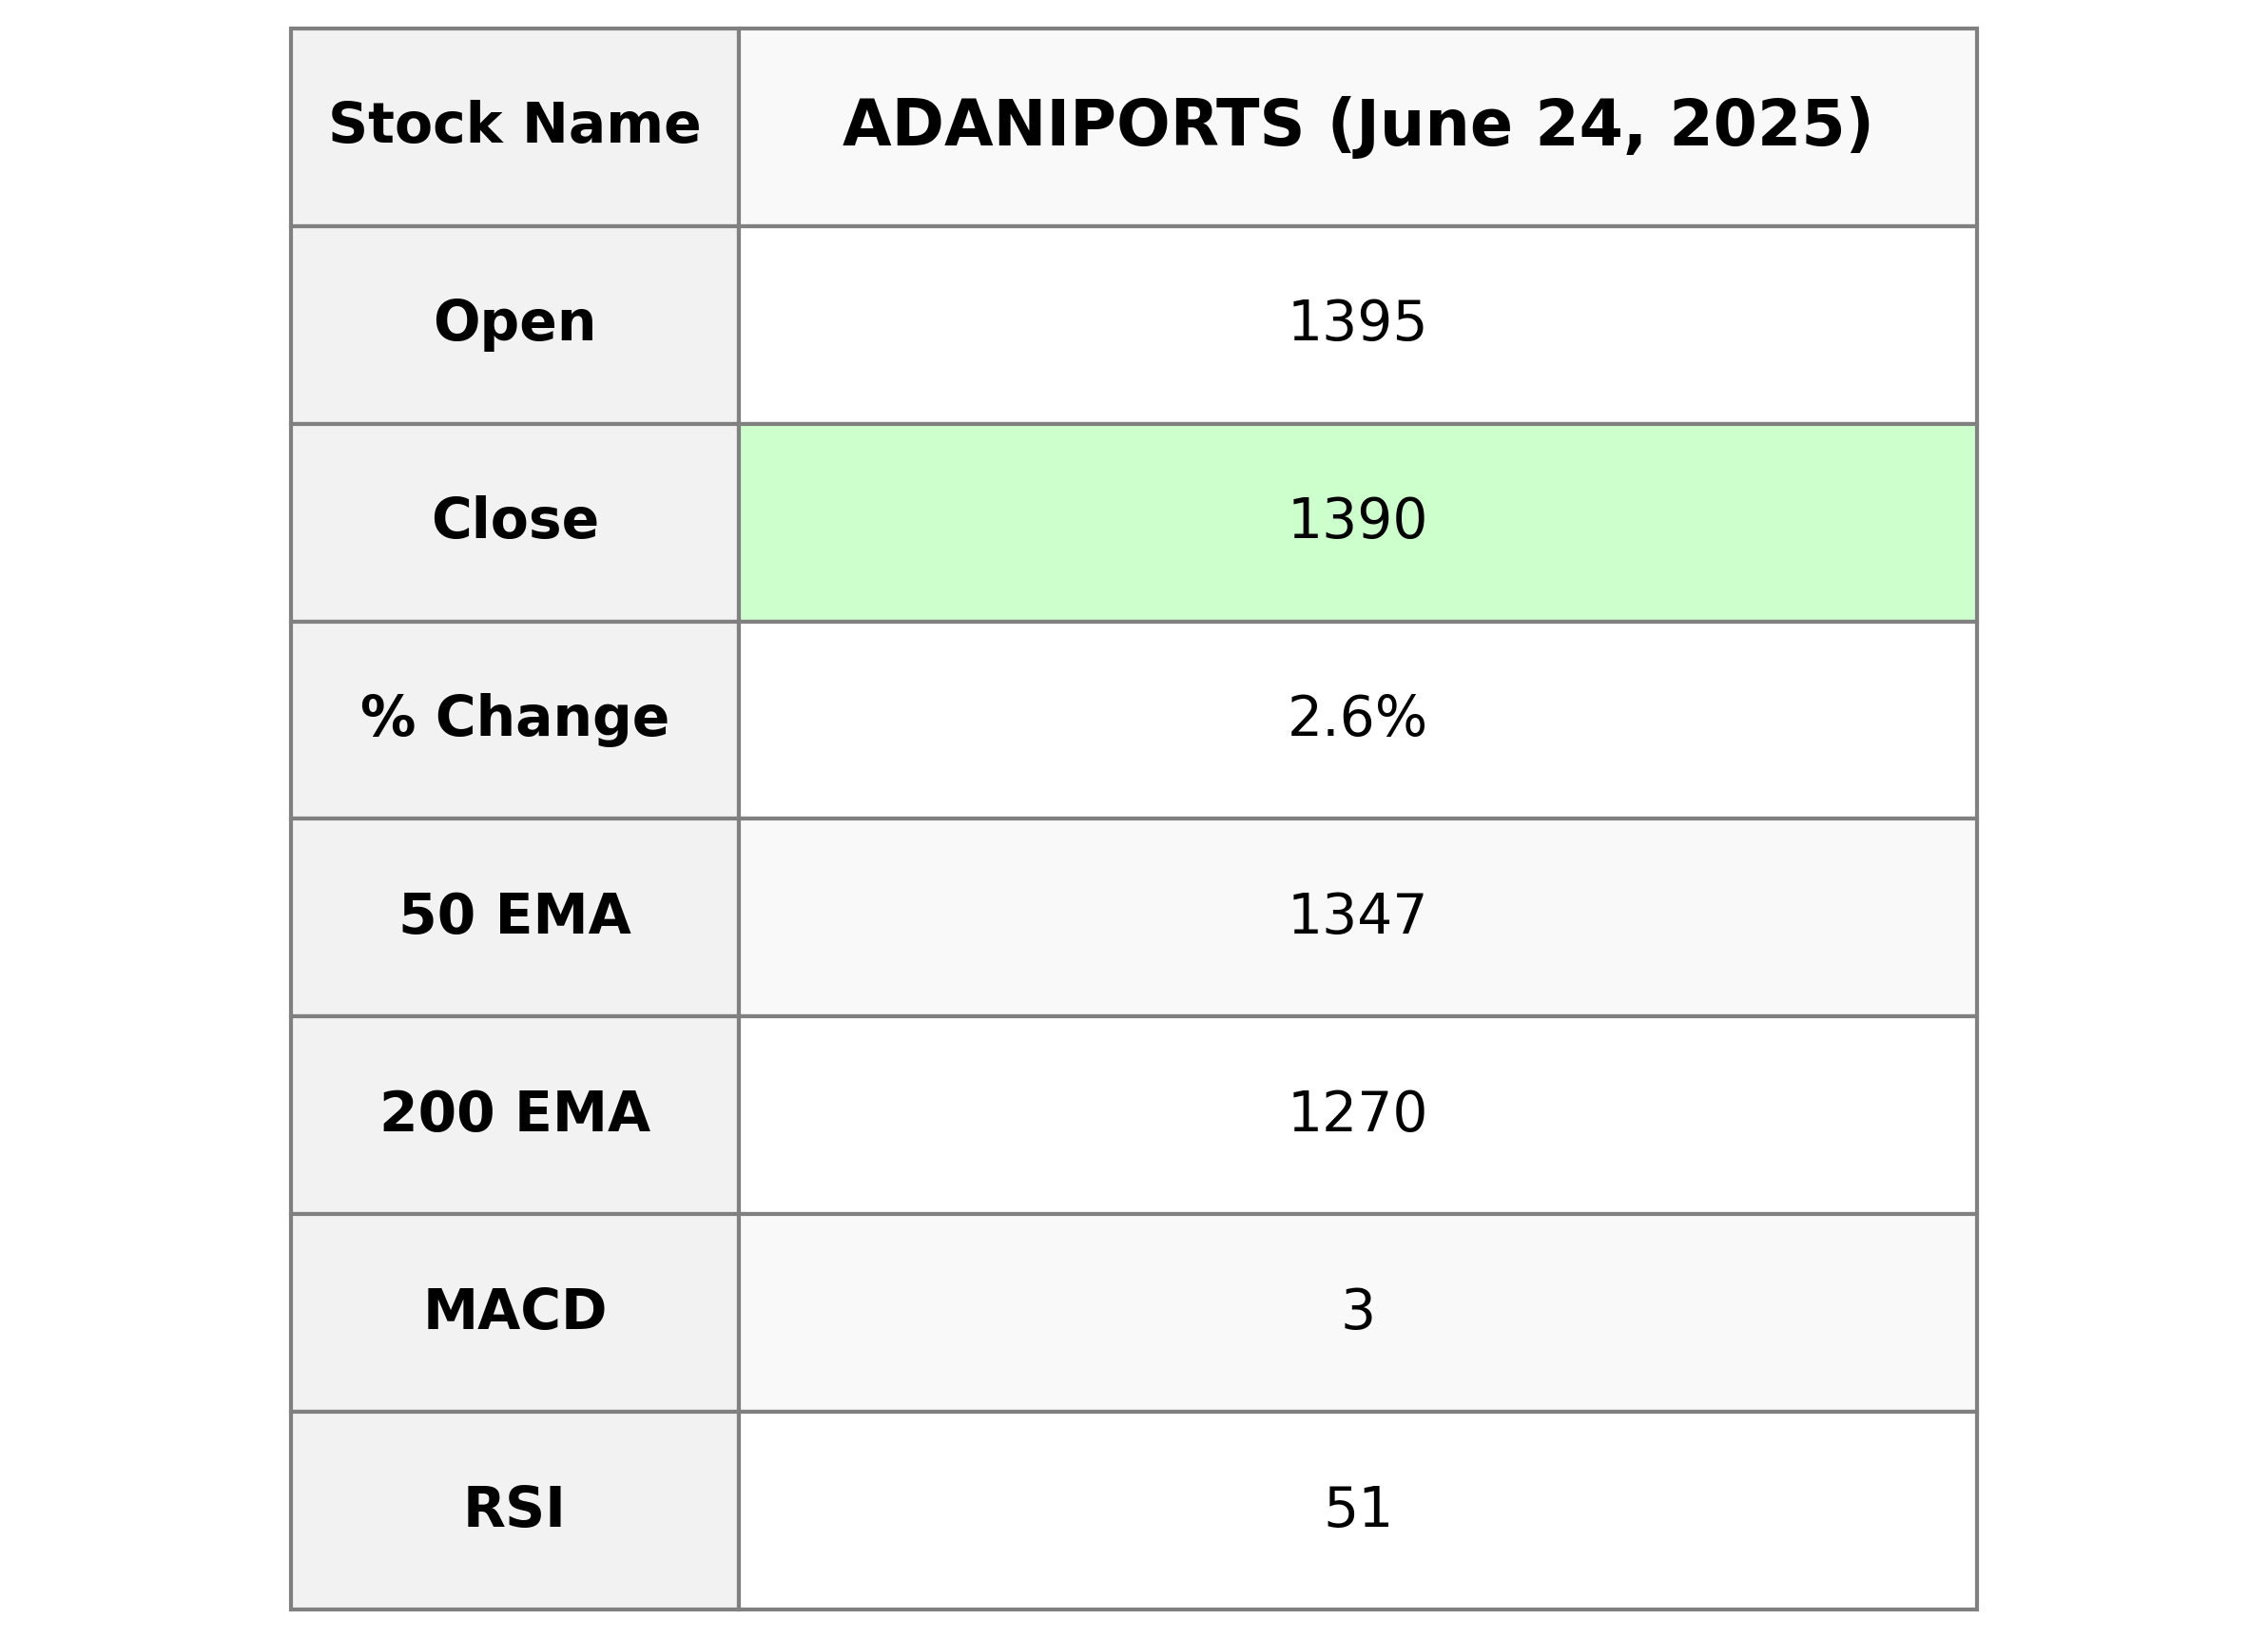
Adani Ports Performance: Adani Ports experienced a positive change, closing at 1389.5, up 2.56% from the previous close of 1354.8. The stock traded between a high and low of 1418.7 and 1385.1, respectively, with a trading volume of 7,634,997. The company operates in the marine shipping industry within the industrials sector and is based in India.
Relationship with Key Moving Averages
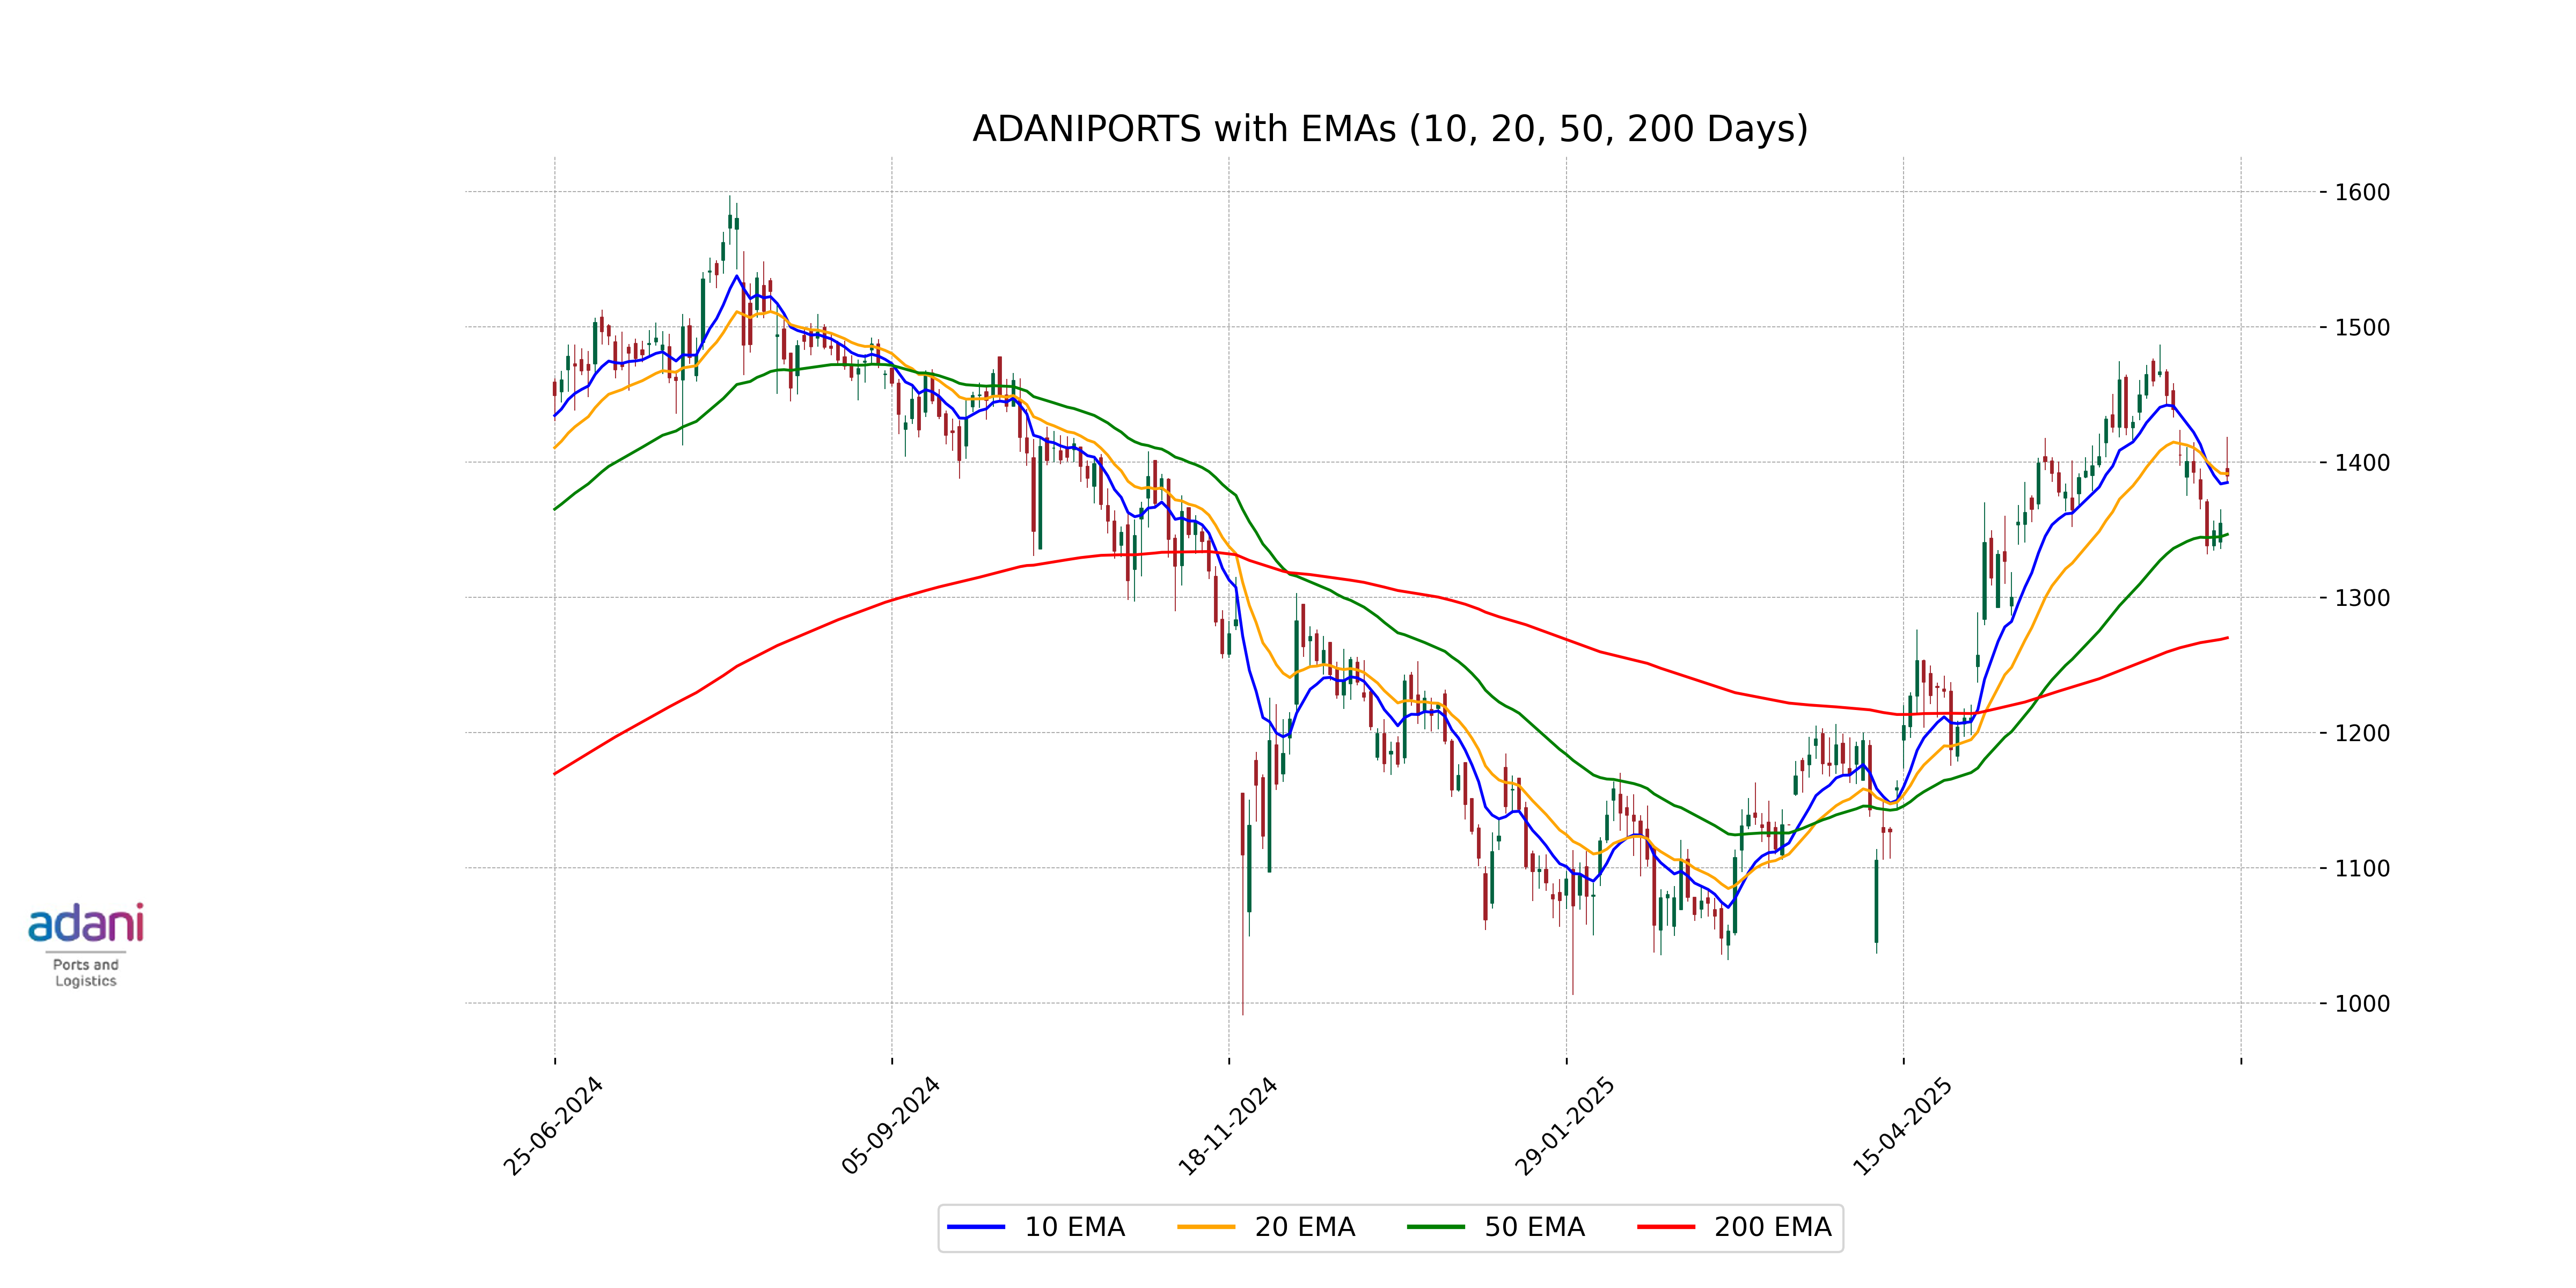
Adani Ports is currently trading at 1389.5, which is above its 50-day EMA of 1346.53 and its 200-day EMA of 1270.02, indicating a bullish trend. However, it is slightly below its 20-day EMA of 1391.48, suggesting some short-term bearishness.
Moving Averages Trend (MACD)
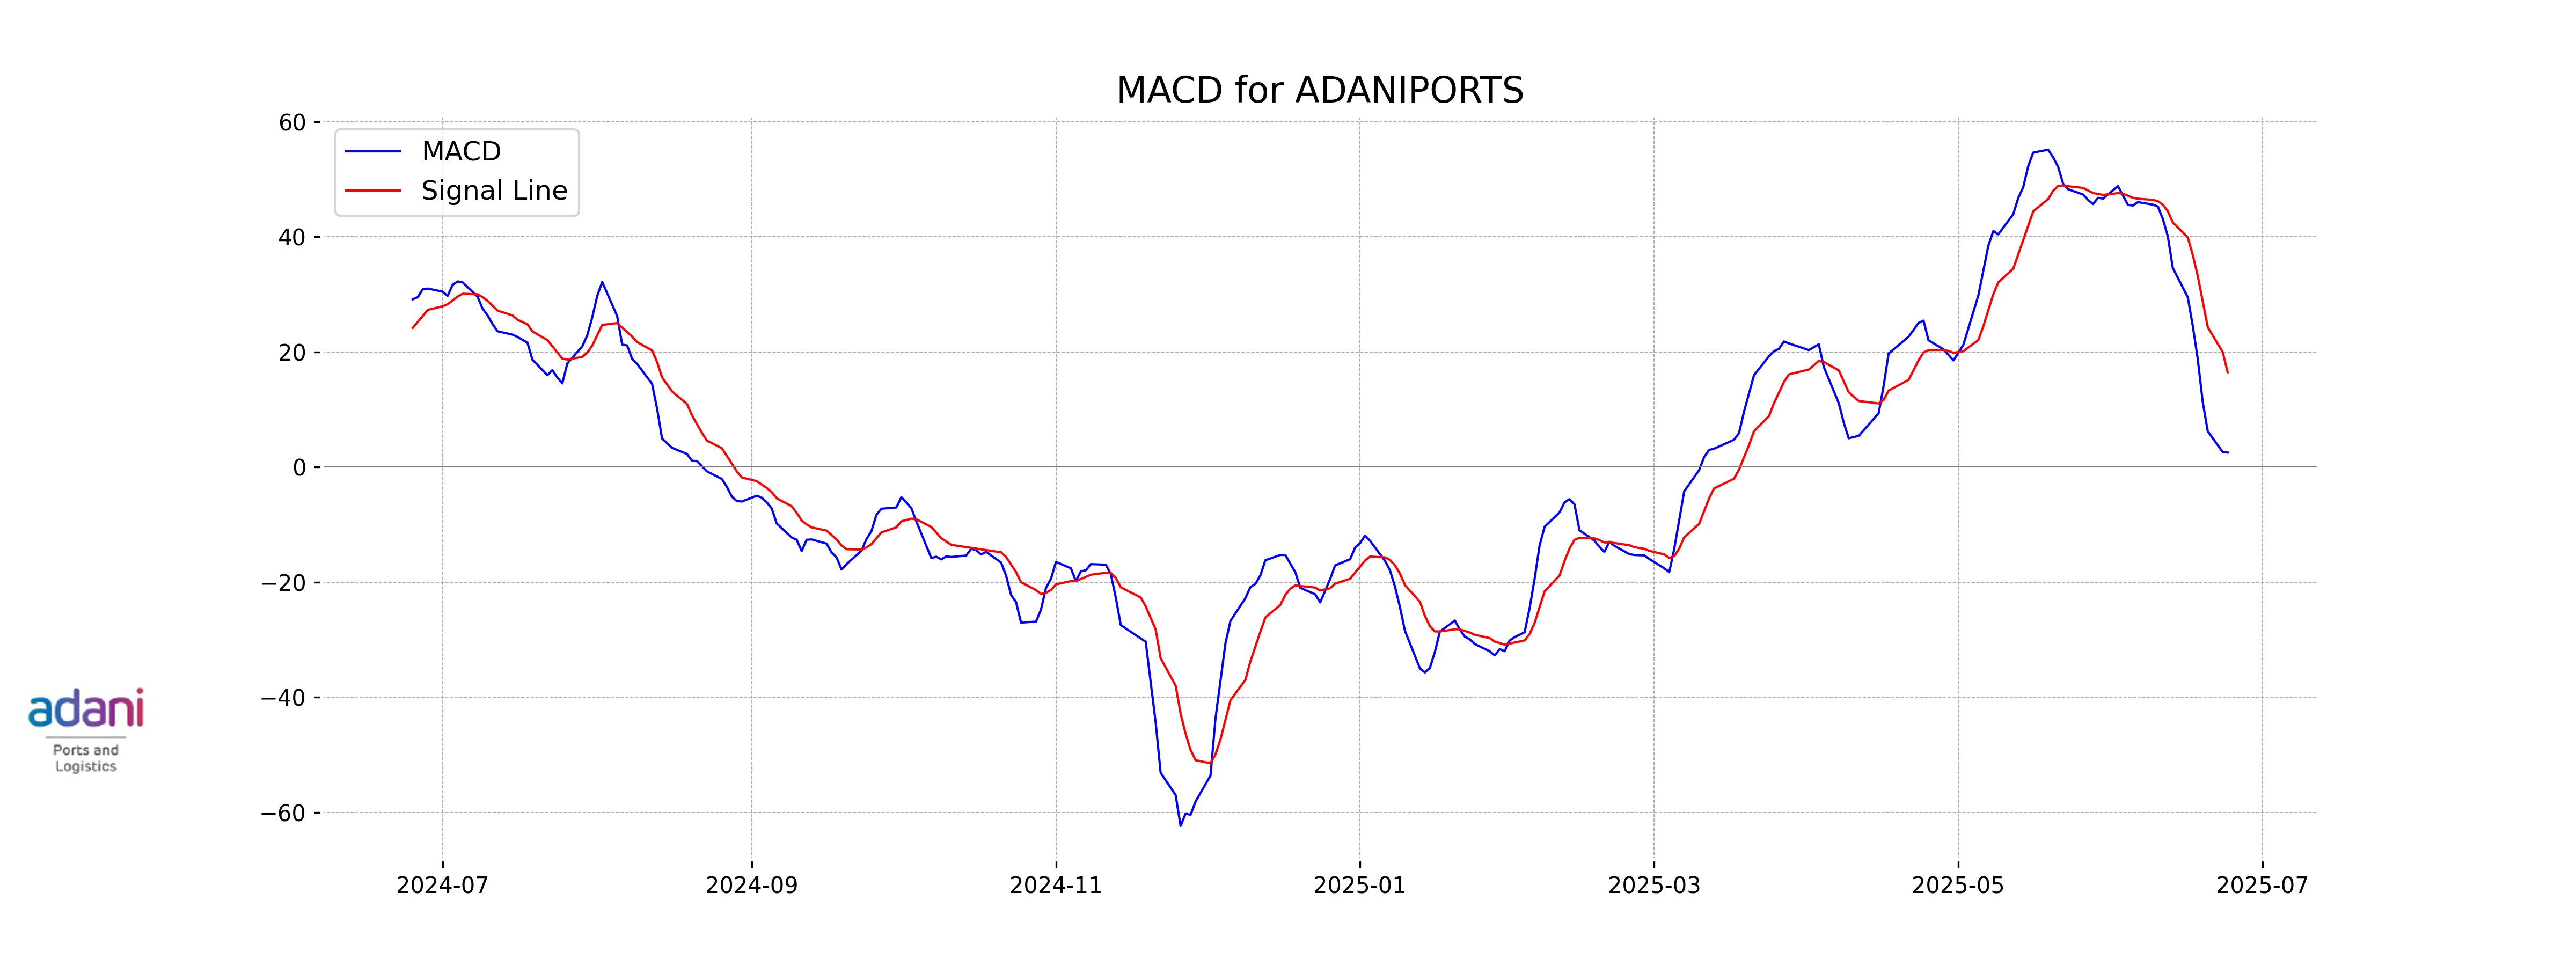
MACD Analysis for Adani Ports: The MACD value is 2.53, while the MACD Signal is 16.50, indicating a potential bearish sentiment as the MACD line is below the signal line. This suggests that momentum may be slowing down in the short term compared to recent trends.
RSI Analysis
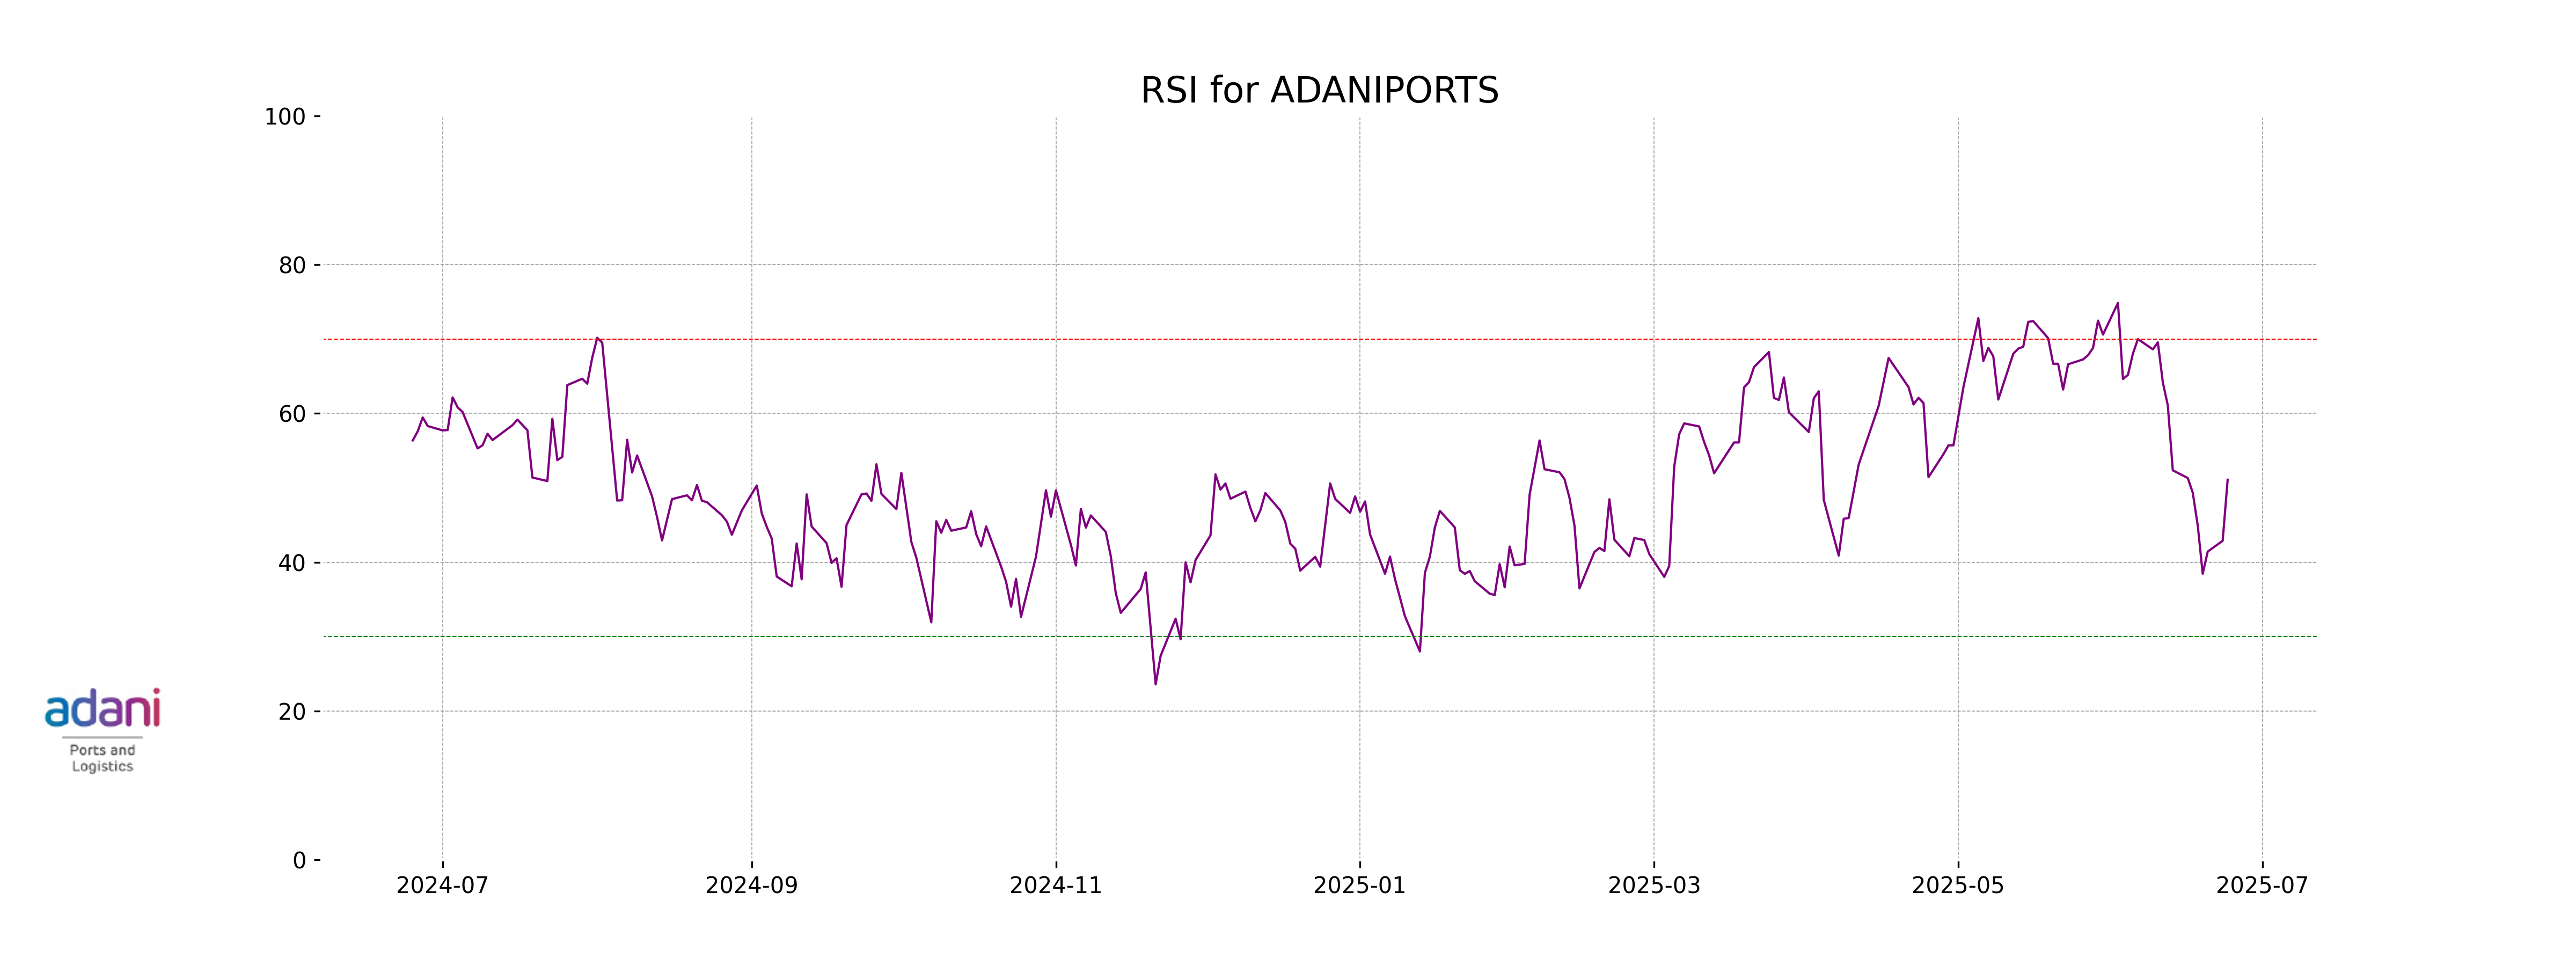
The RSI value for Adani Ports is 51.09, indicating a neutral market position. This suggests that the stock is neither overbought nor oversold at the current time, and the price may continue to move in either direction depending on market conditions.
Analysis for Grasim Industries - June 24, 2025
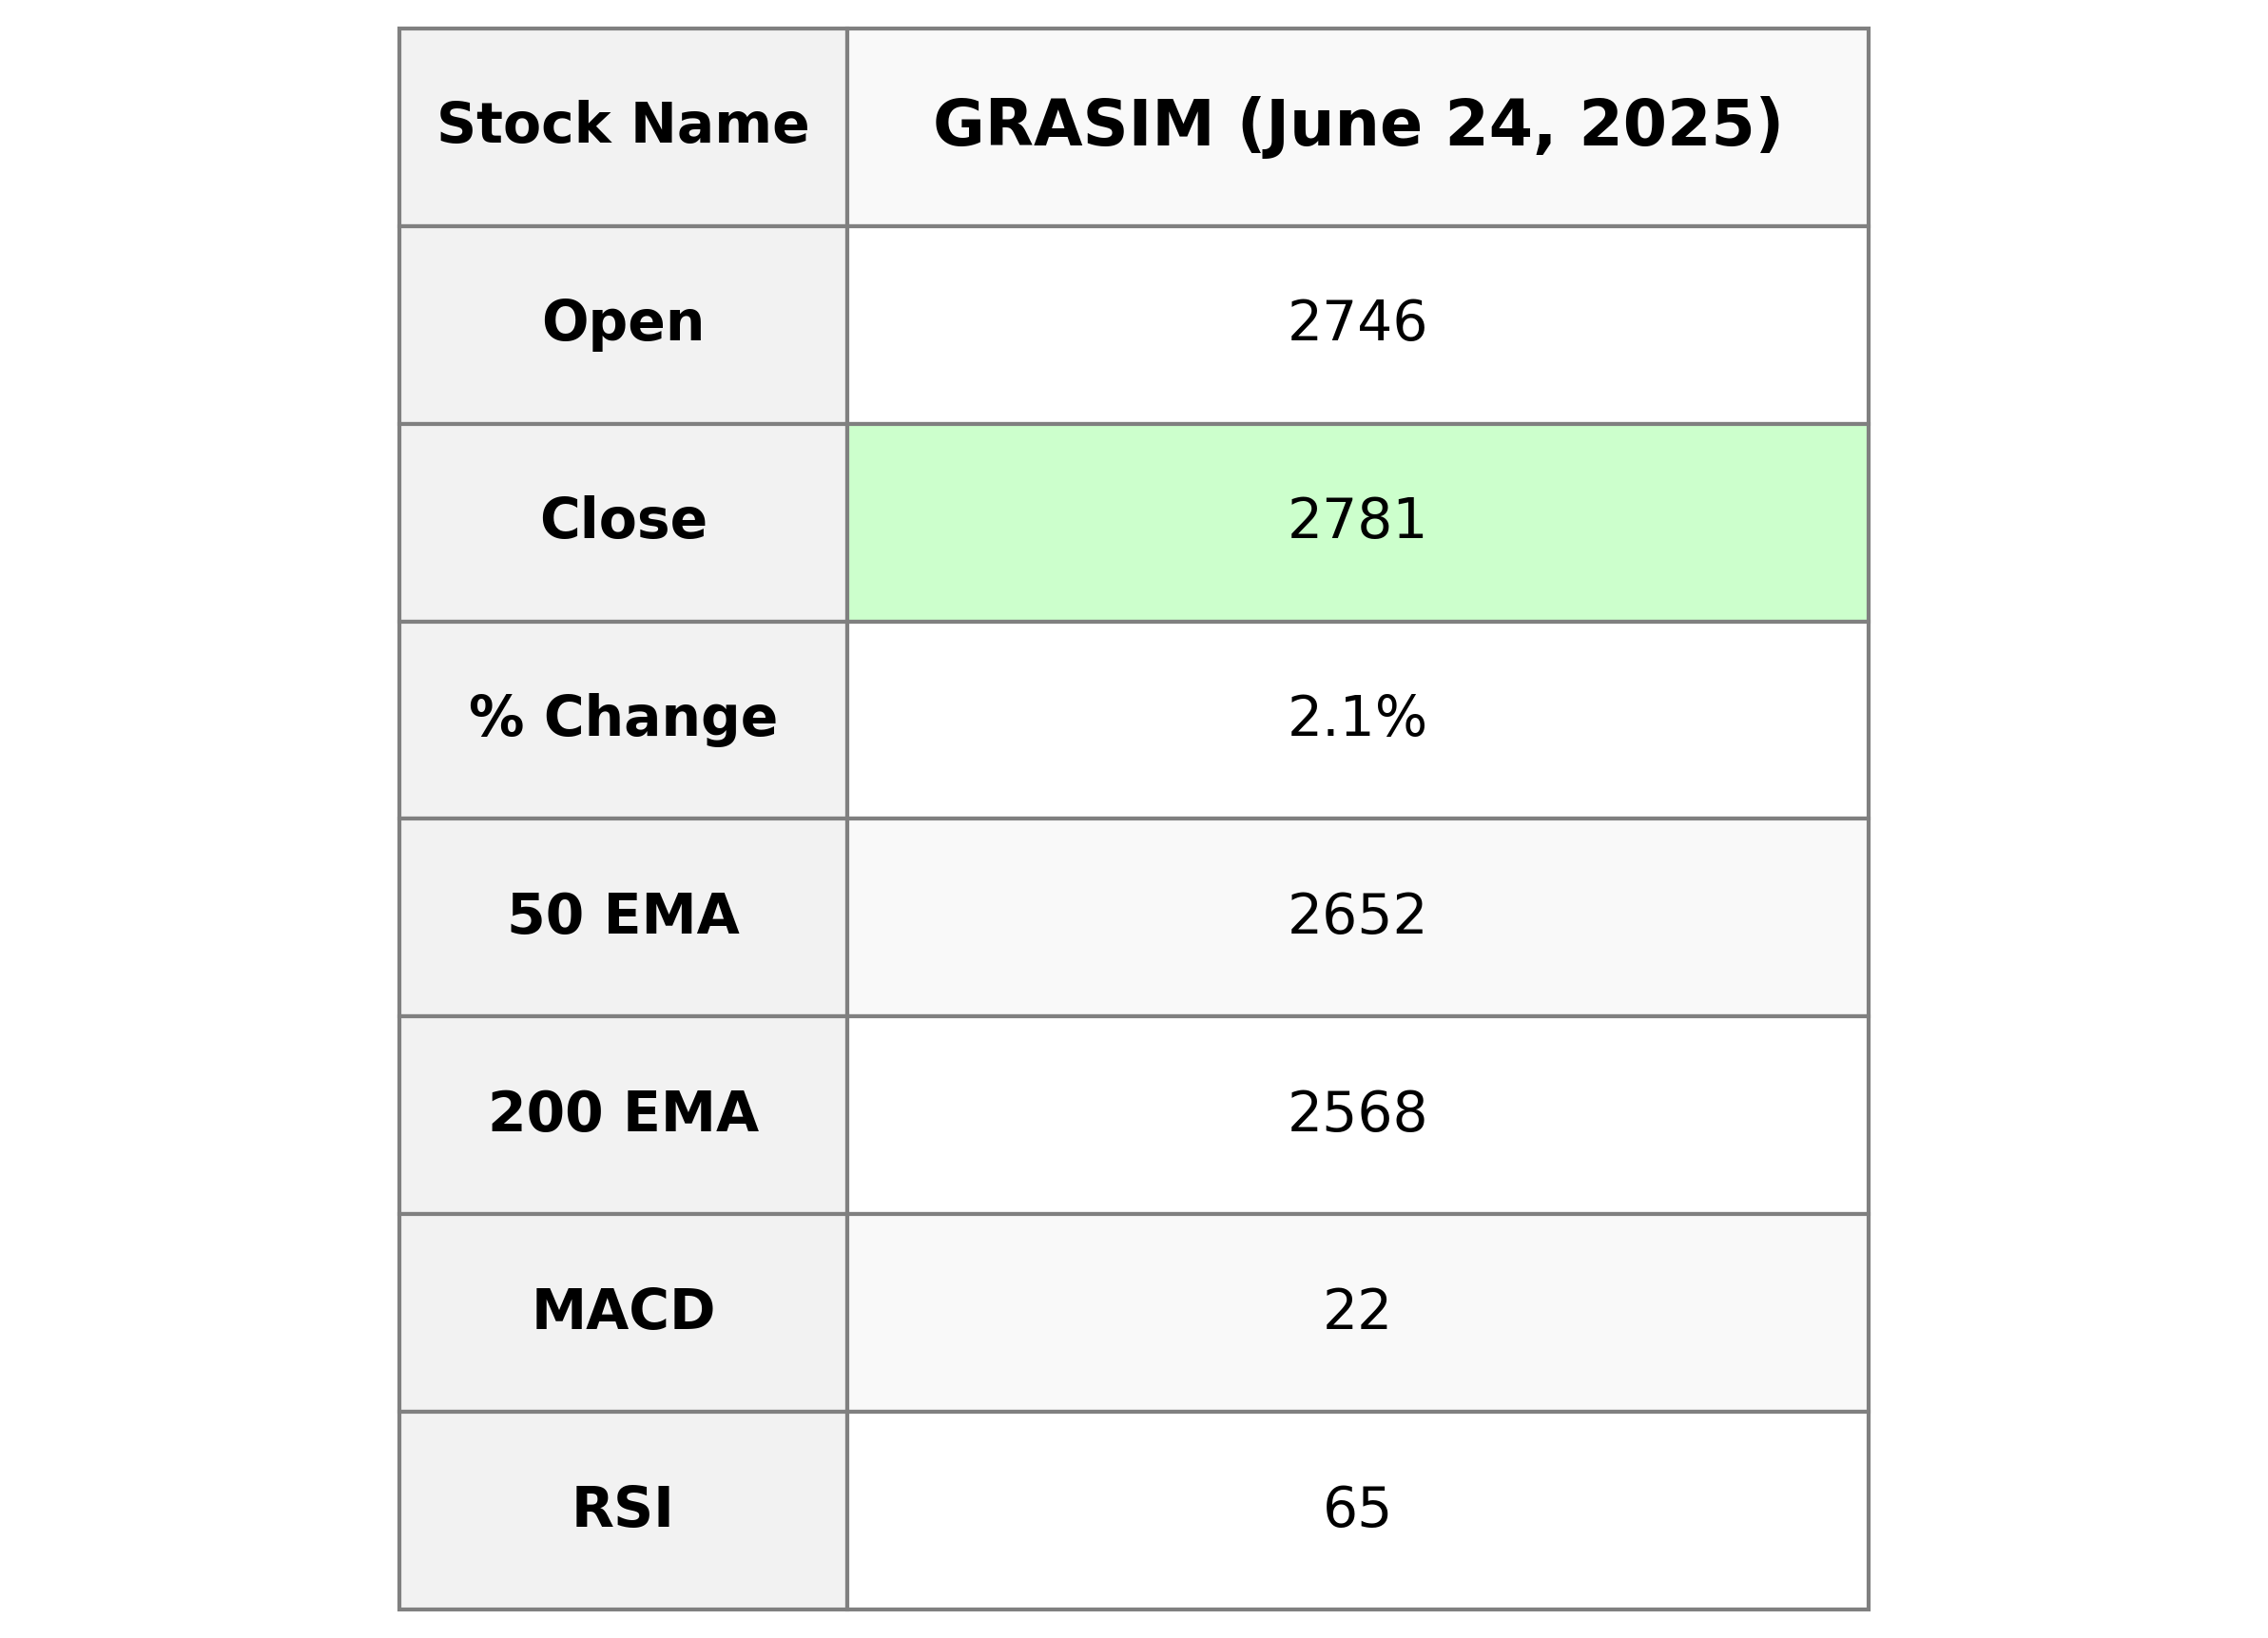
Grasim Industries, part of the Basic Materials sector, showcased a positive performance with a closing price of 2780.90, reflecting a 2.10% increase from the previous close. The company's technical indicators, such as a high RSI of 64.52 and a MACD well above the signal line, indicate bullish momentum. Grasim operates in the Building Materials industry in India and maintains a substantial market cap of over 1.88 trillion INR.
Relationship with Key Moving Averages
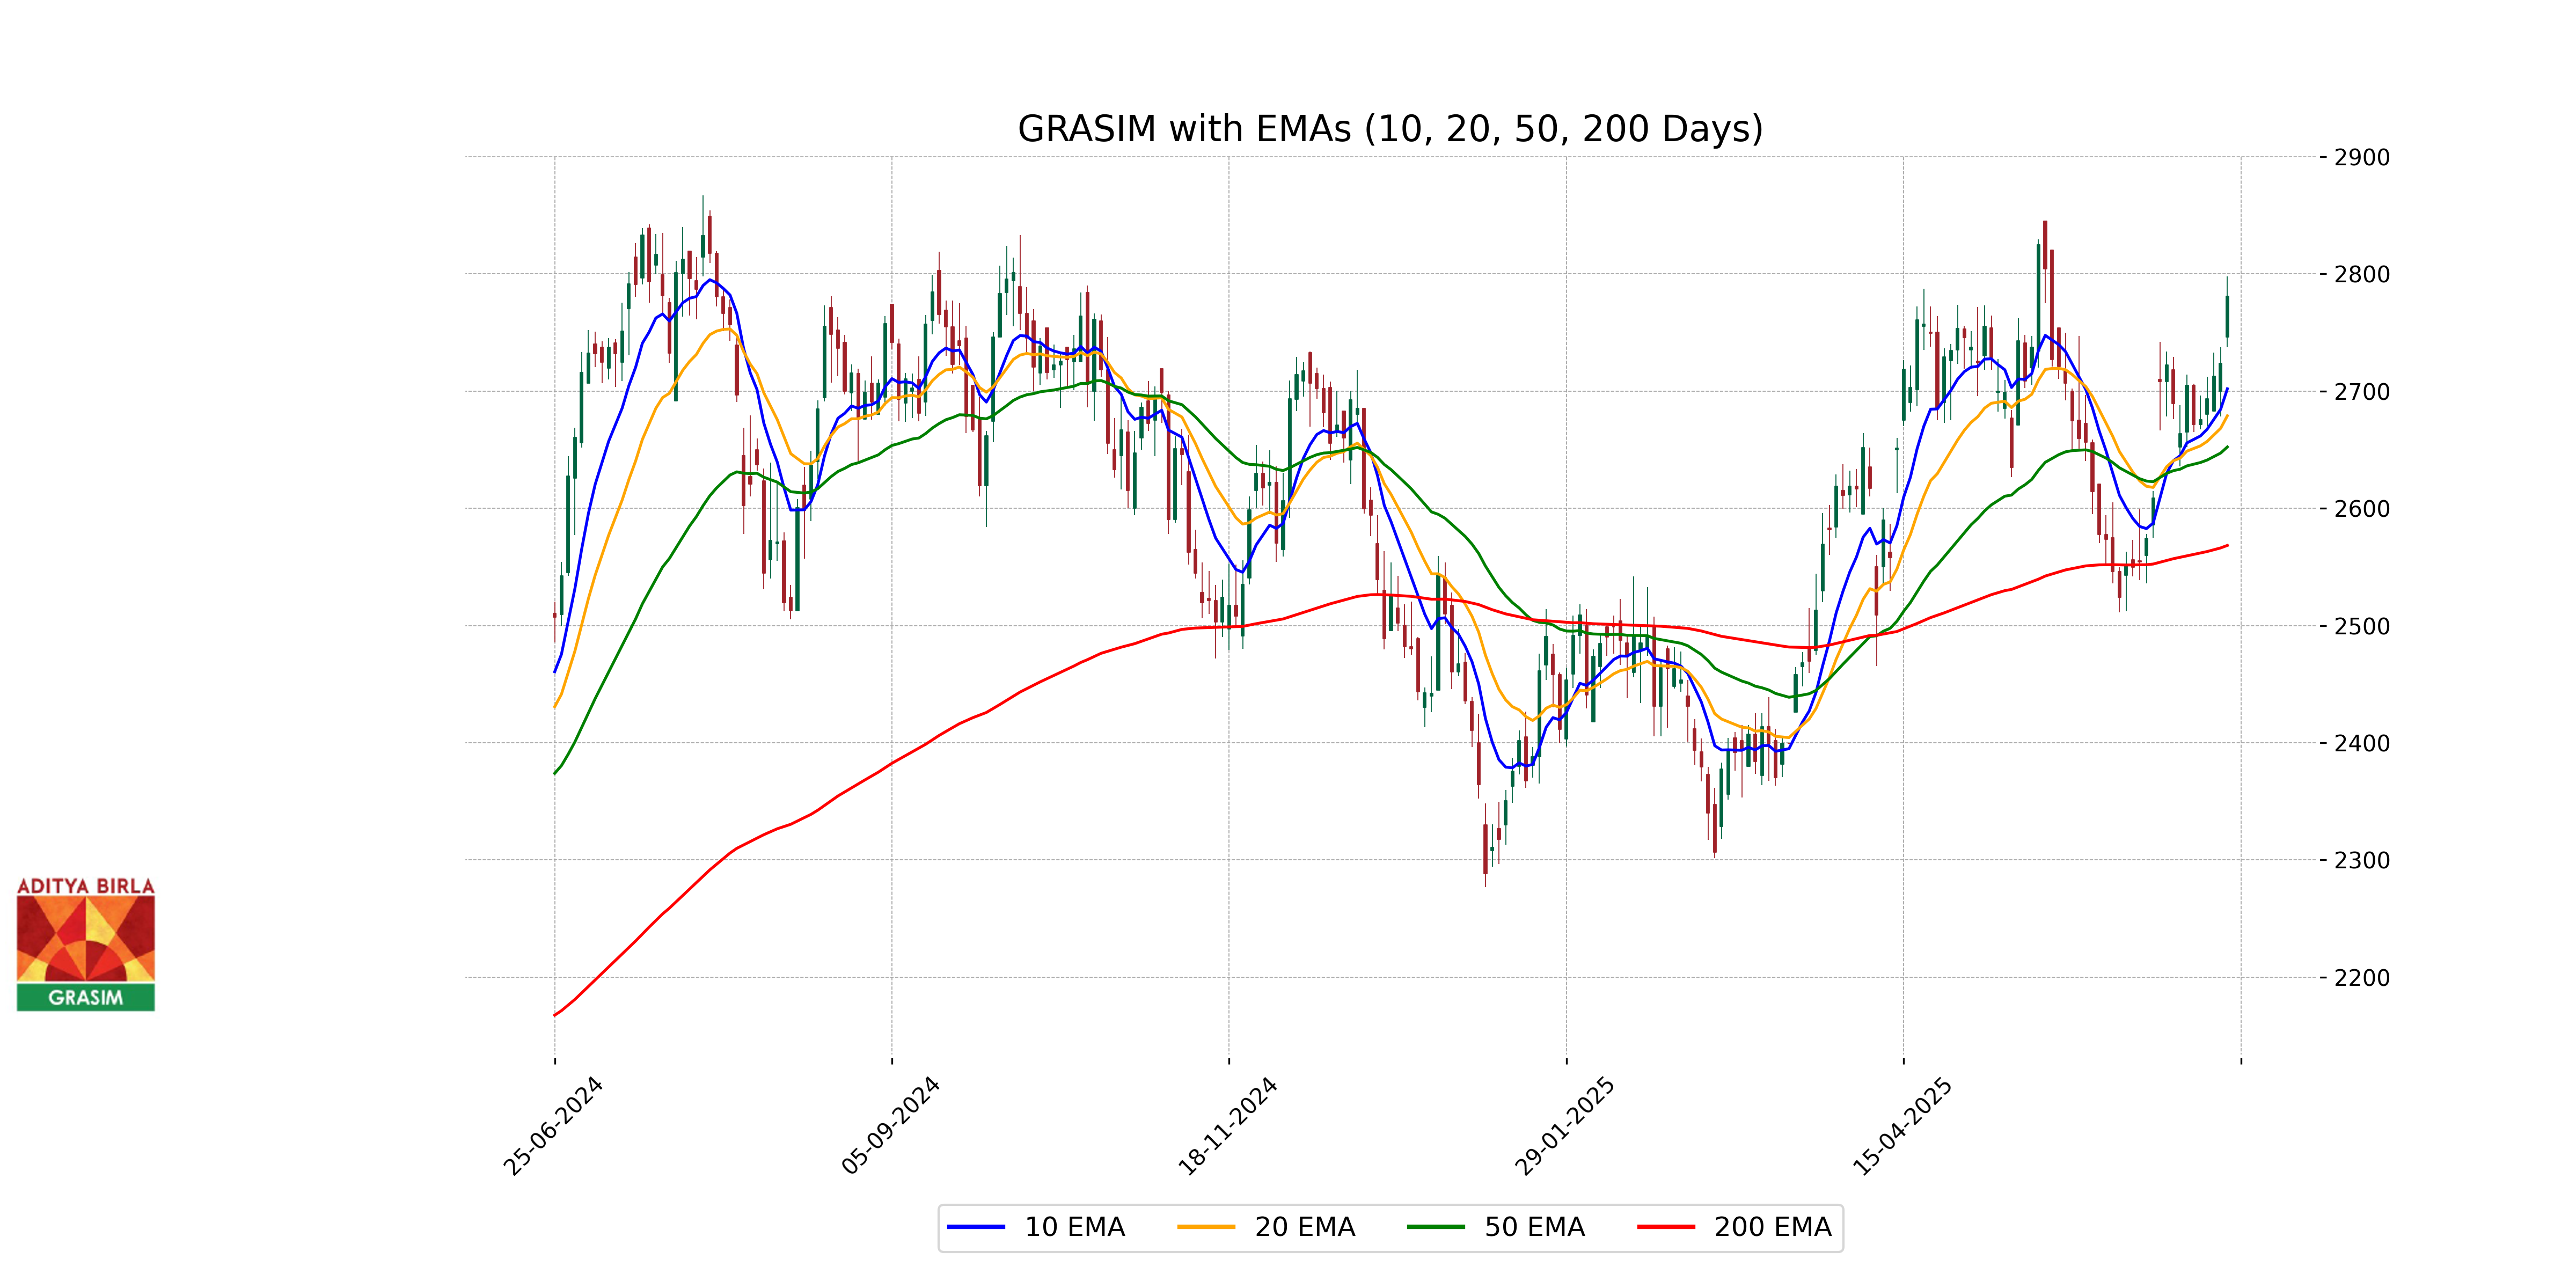
Grasim Industries is trading above its key moving averages, with the closing price of 2780.90 lying above the 50 EMA of 2652.30, the 200 EMA of 2568.30, the 10 EMA of 2701.90, and the 20 EMA of 2678.90. This indicates a bullish trend in the short, medium, and long term based on the moving averages.
Moving Averages Trend (MACD)
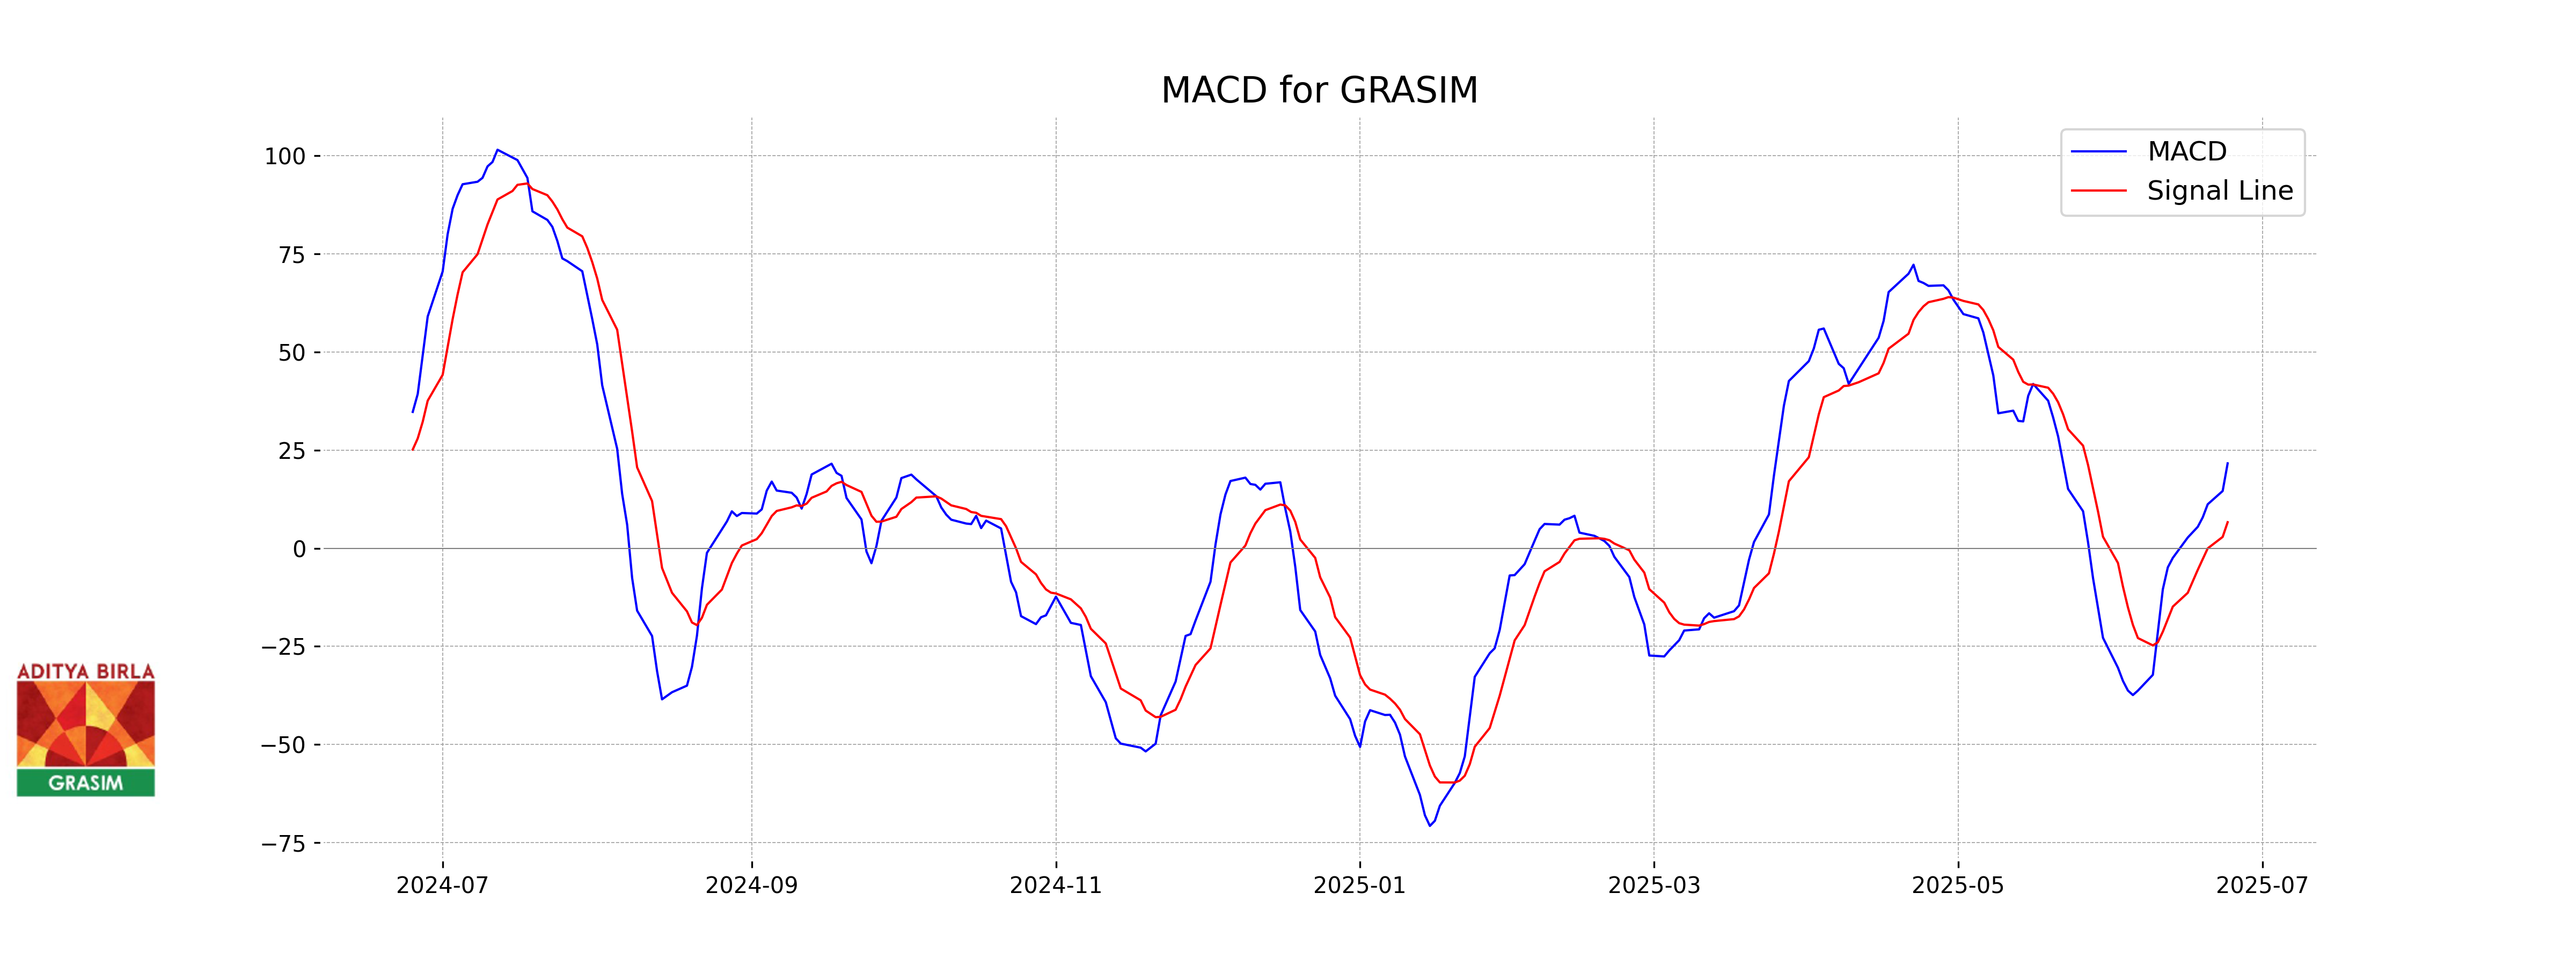
The MACD for Grasim Industries is currently at 21.62, with a MACD Signal at 6.63, suggesting a bullish momentum. The MACD being above the signal line typically indicates potential upward price movement.
RSI Analysis
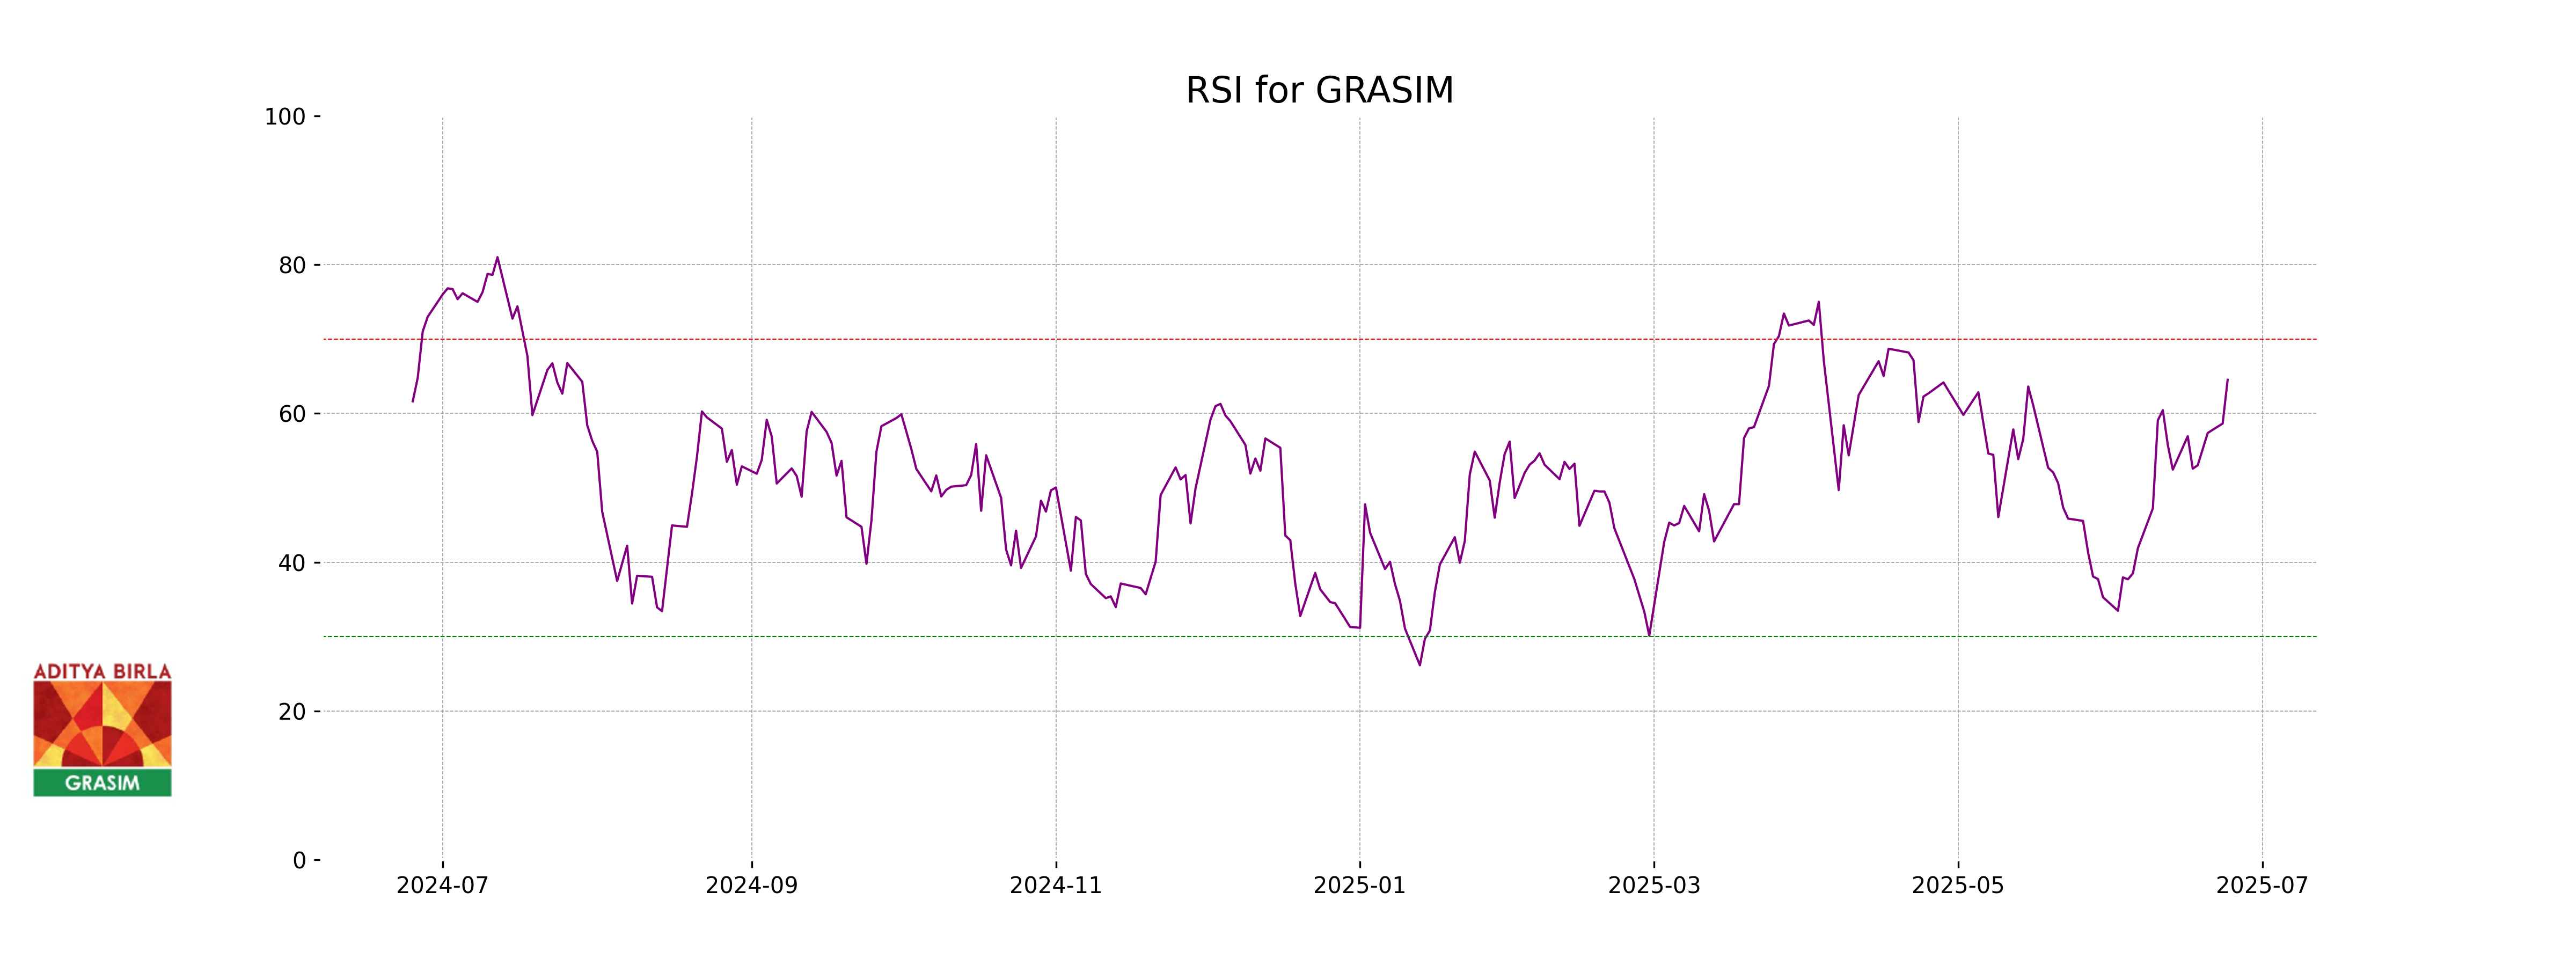
Grasim Industries has an RSI of 64.52, which suggests that the stock is in neutral territory but approaching overbought levels. It indicates a relatively strong momentum, but caution is advised as it nears the threshold.
Analysis for Kotak Mahindra Bank - June 24, 2025
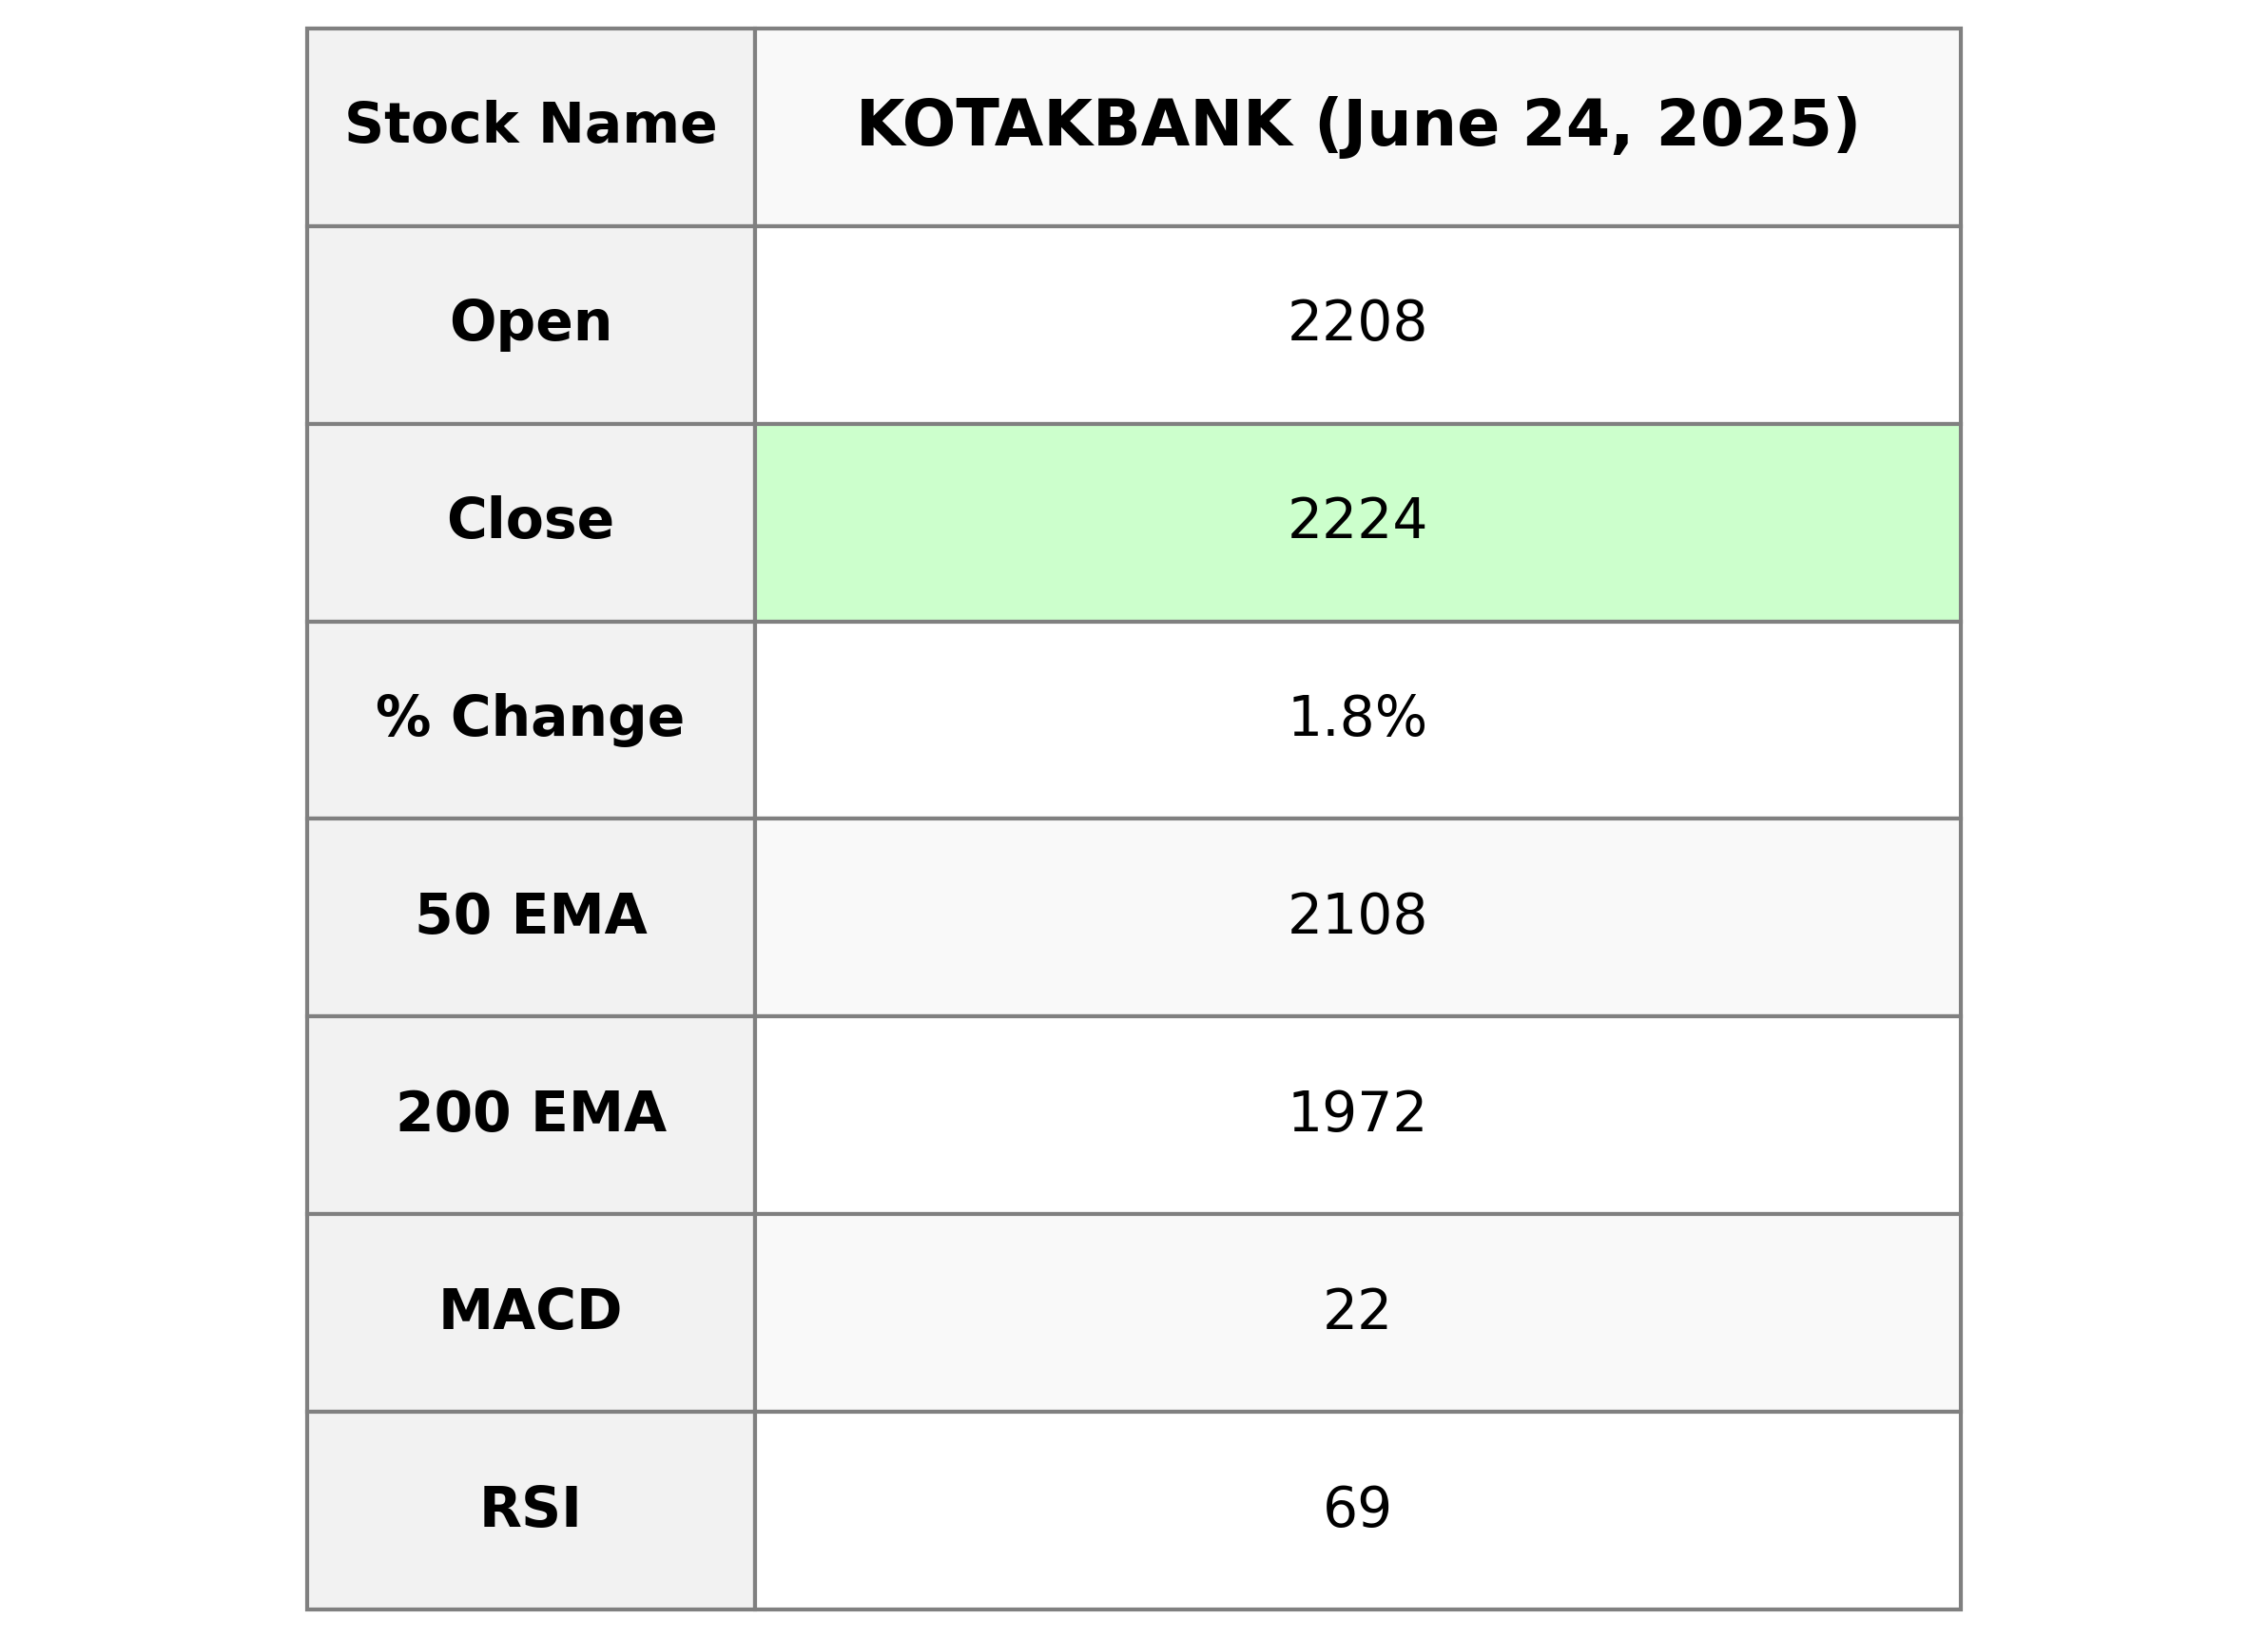
Kotak Mahindra Bank had a positive trading day, closing at 2223.60 with a 1.81% increase from the previous close of 2184.10, gaining 39.5 points. The bank's technical indicators such as the RSI at 69.49 and the MACD higher than its signal indicate bullish momentum. The market capitalization stands at over 4 trillion with a PE ratio of 19.96, suggesting moderate valuation in the Financial Services sector.
Relationship with Key Moving Averages
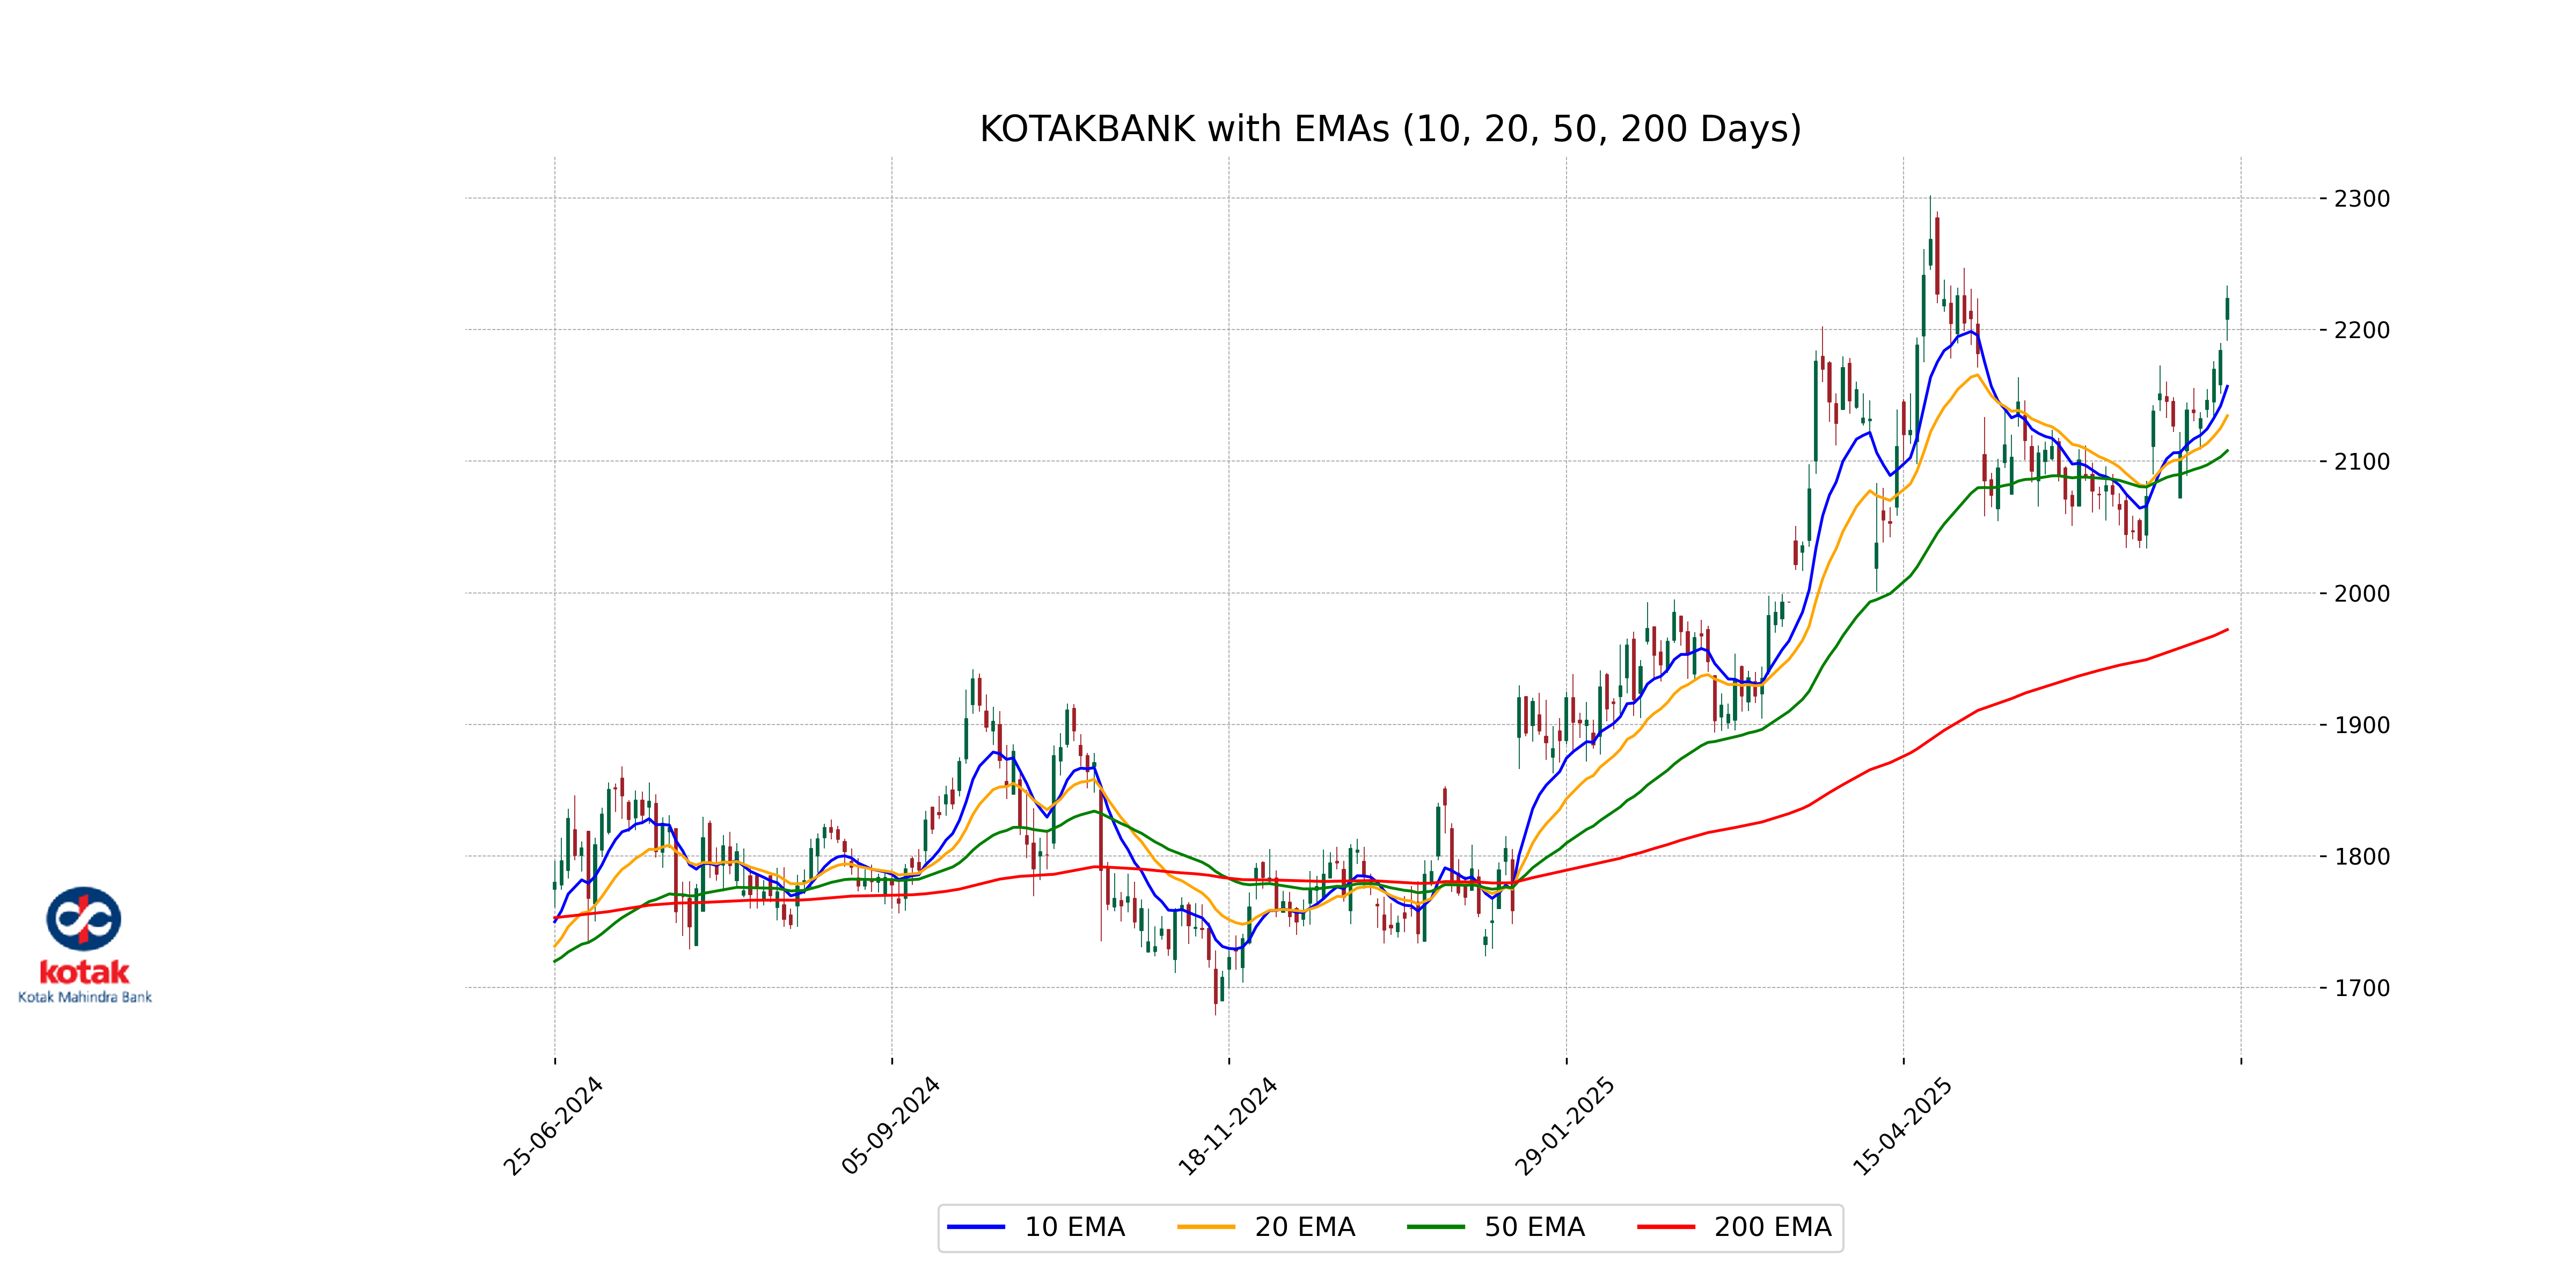
Kotak Mahindra Bank's closing price of 2223.60 is above its 50-day EMA of 2108.04 and significantly higher than the 200-day EMA of 1972.03, suggesting a strong bullish trend. The 10-day EMA at 2156.94 and 20-day EMA at 2134.54 further indicate positive momentum over the short and medium terms.
Moving Averages Trend (MACD)
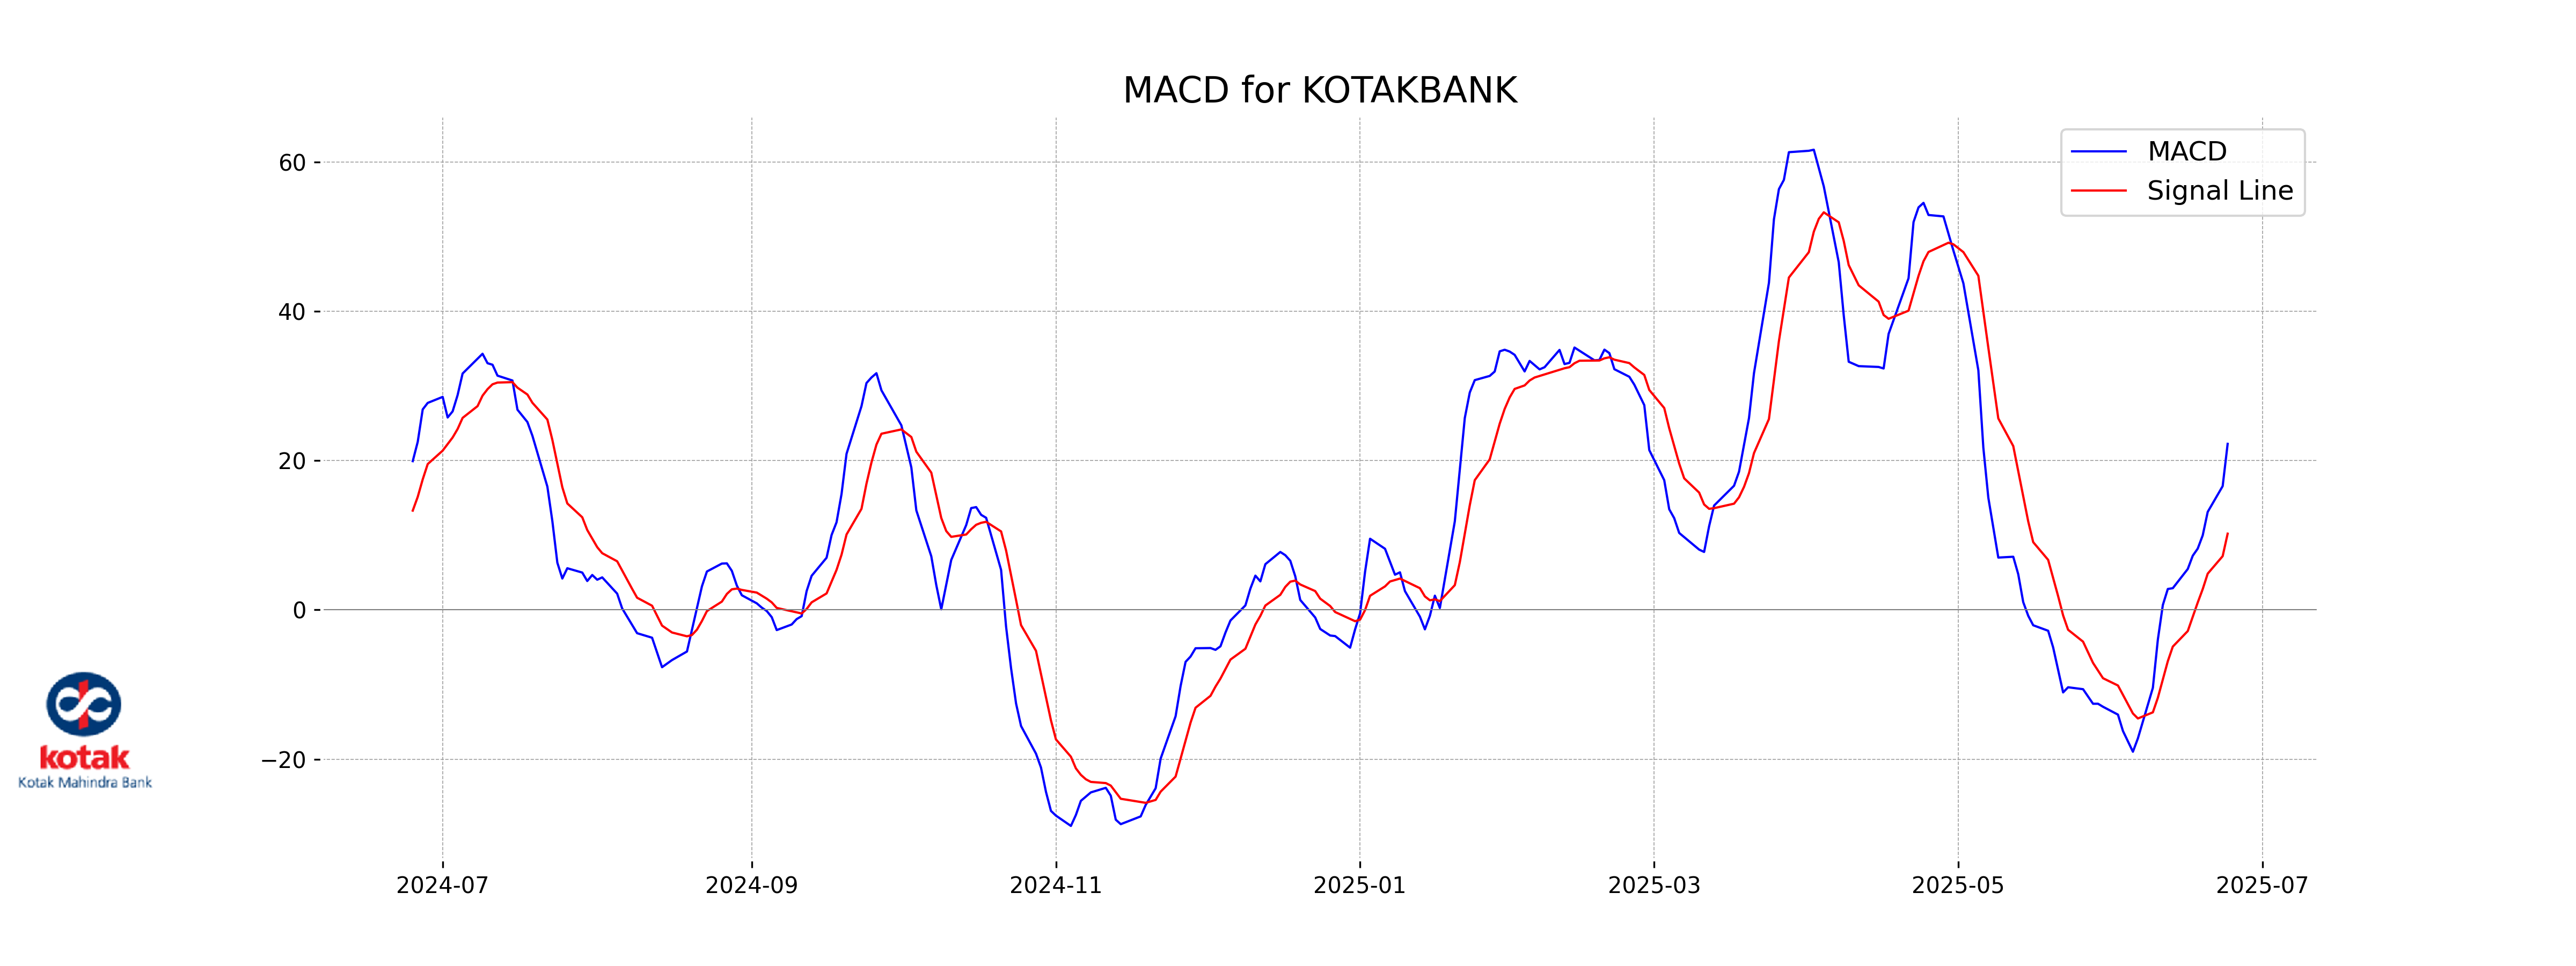
Kotak Mahindra Bank's MACD of 22.25 is significantly higher than its MACD Signal of 10.21, indicating a strong bullish momentum. This suggests that the stock is experiencing upward pressure, which could be viewed as a potential buying opportunity if the trend continues.
RSI Analysis
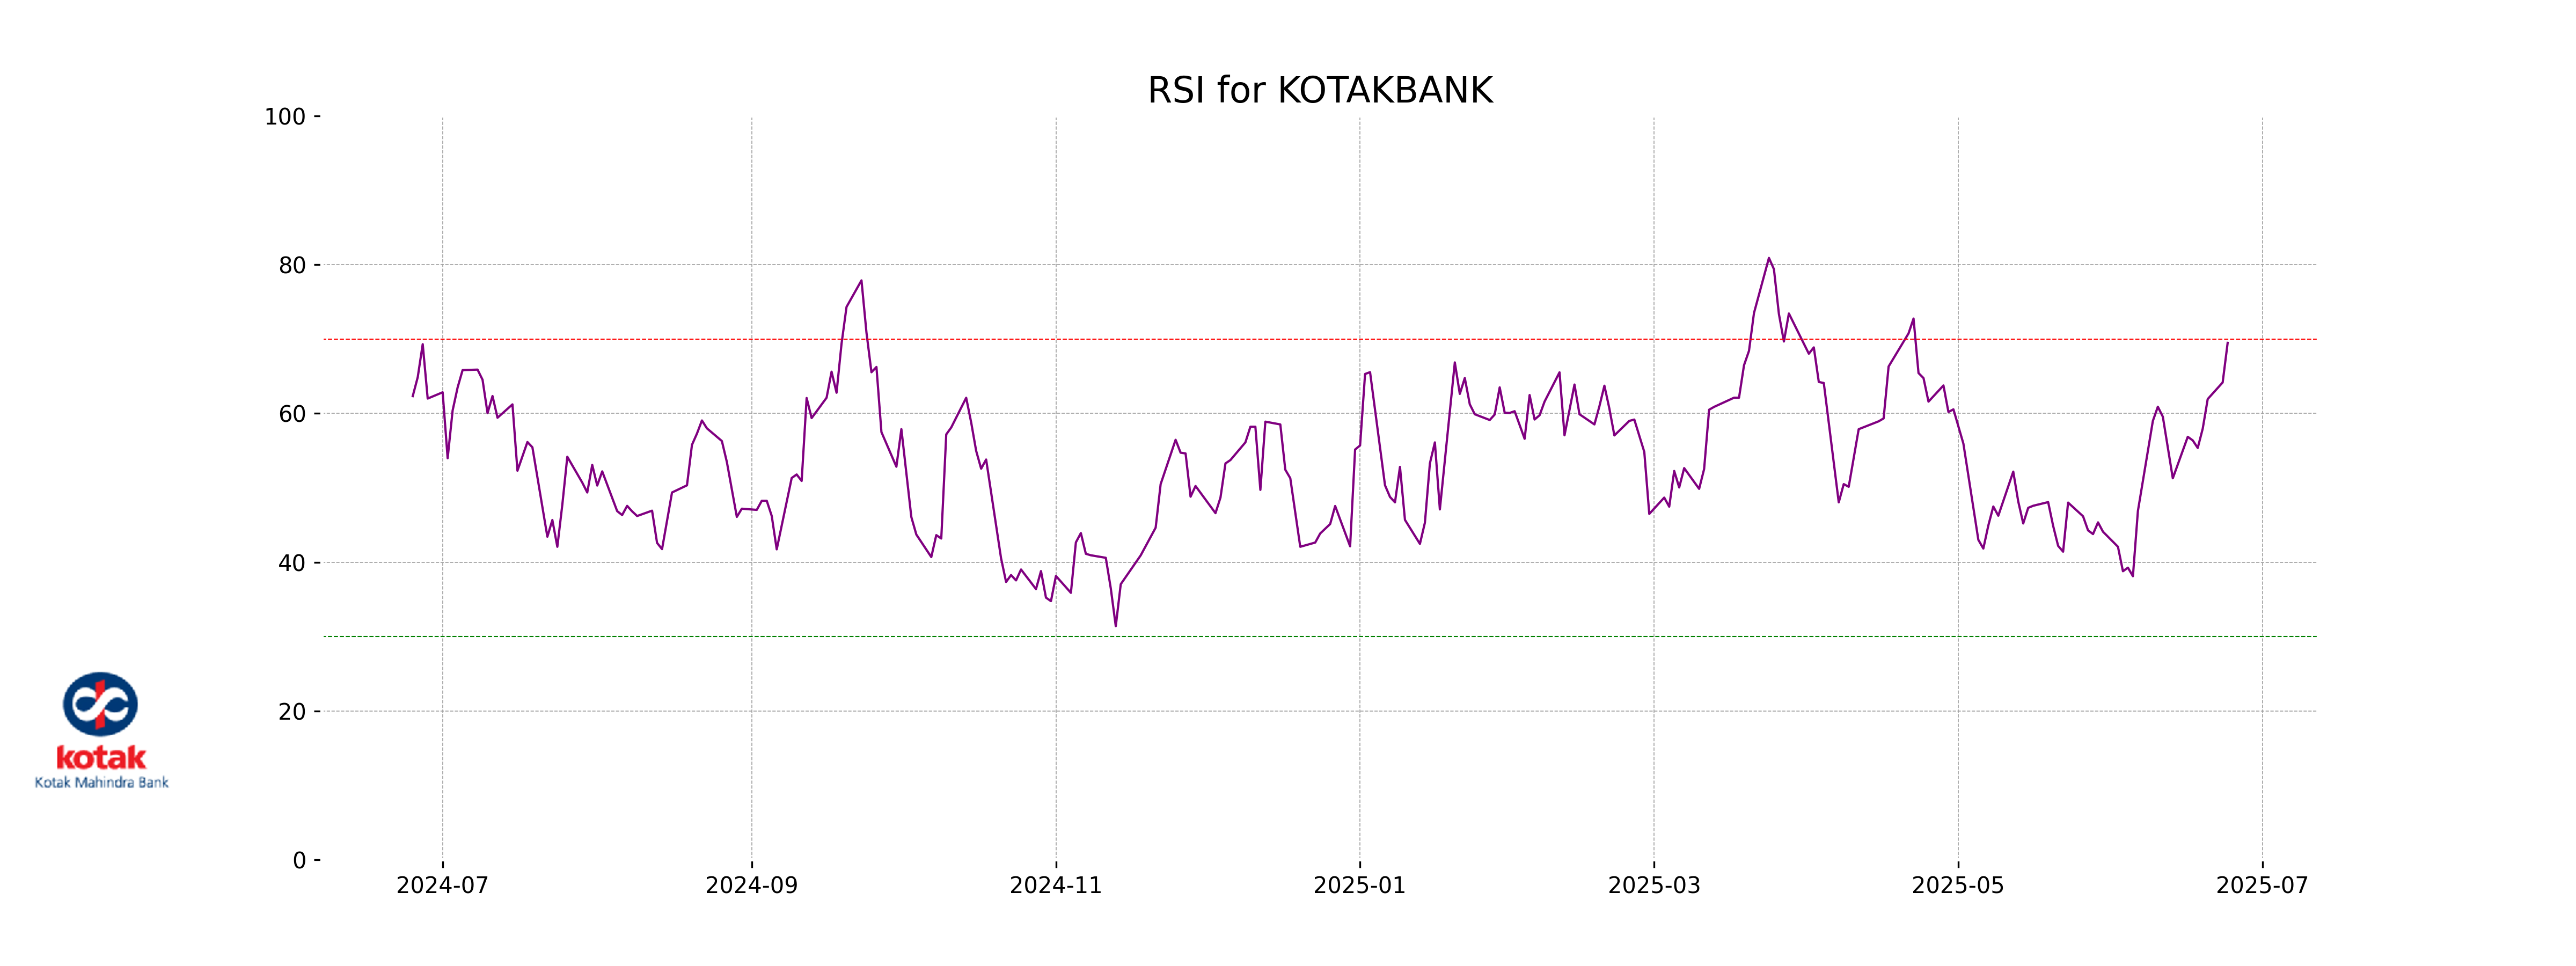
The RSI (Relative Strength Index) for Kotak Mahindra Bank is 69.49. This suggests that the stock is nearing the overbought territory, as RSI values above 70 typically indicate this. Investors may want to watch for potential price reversals or consider that the stock could be overvalued at these levels.
Analysis for Shriram Finance - June 24, 2025
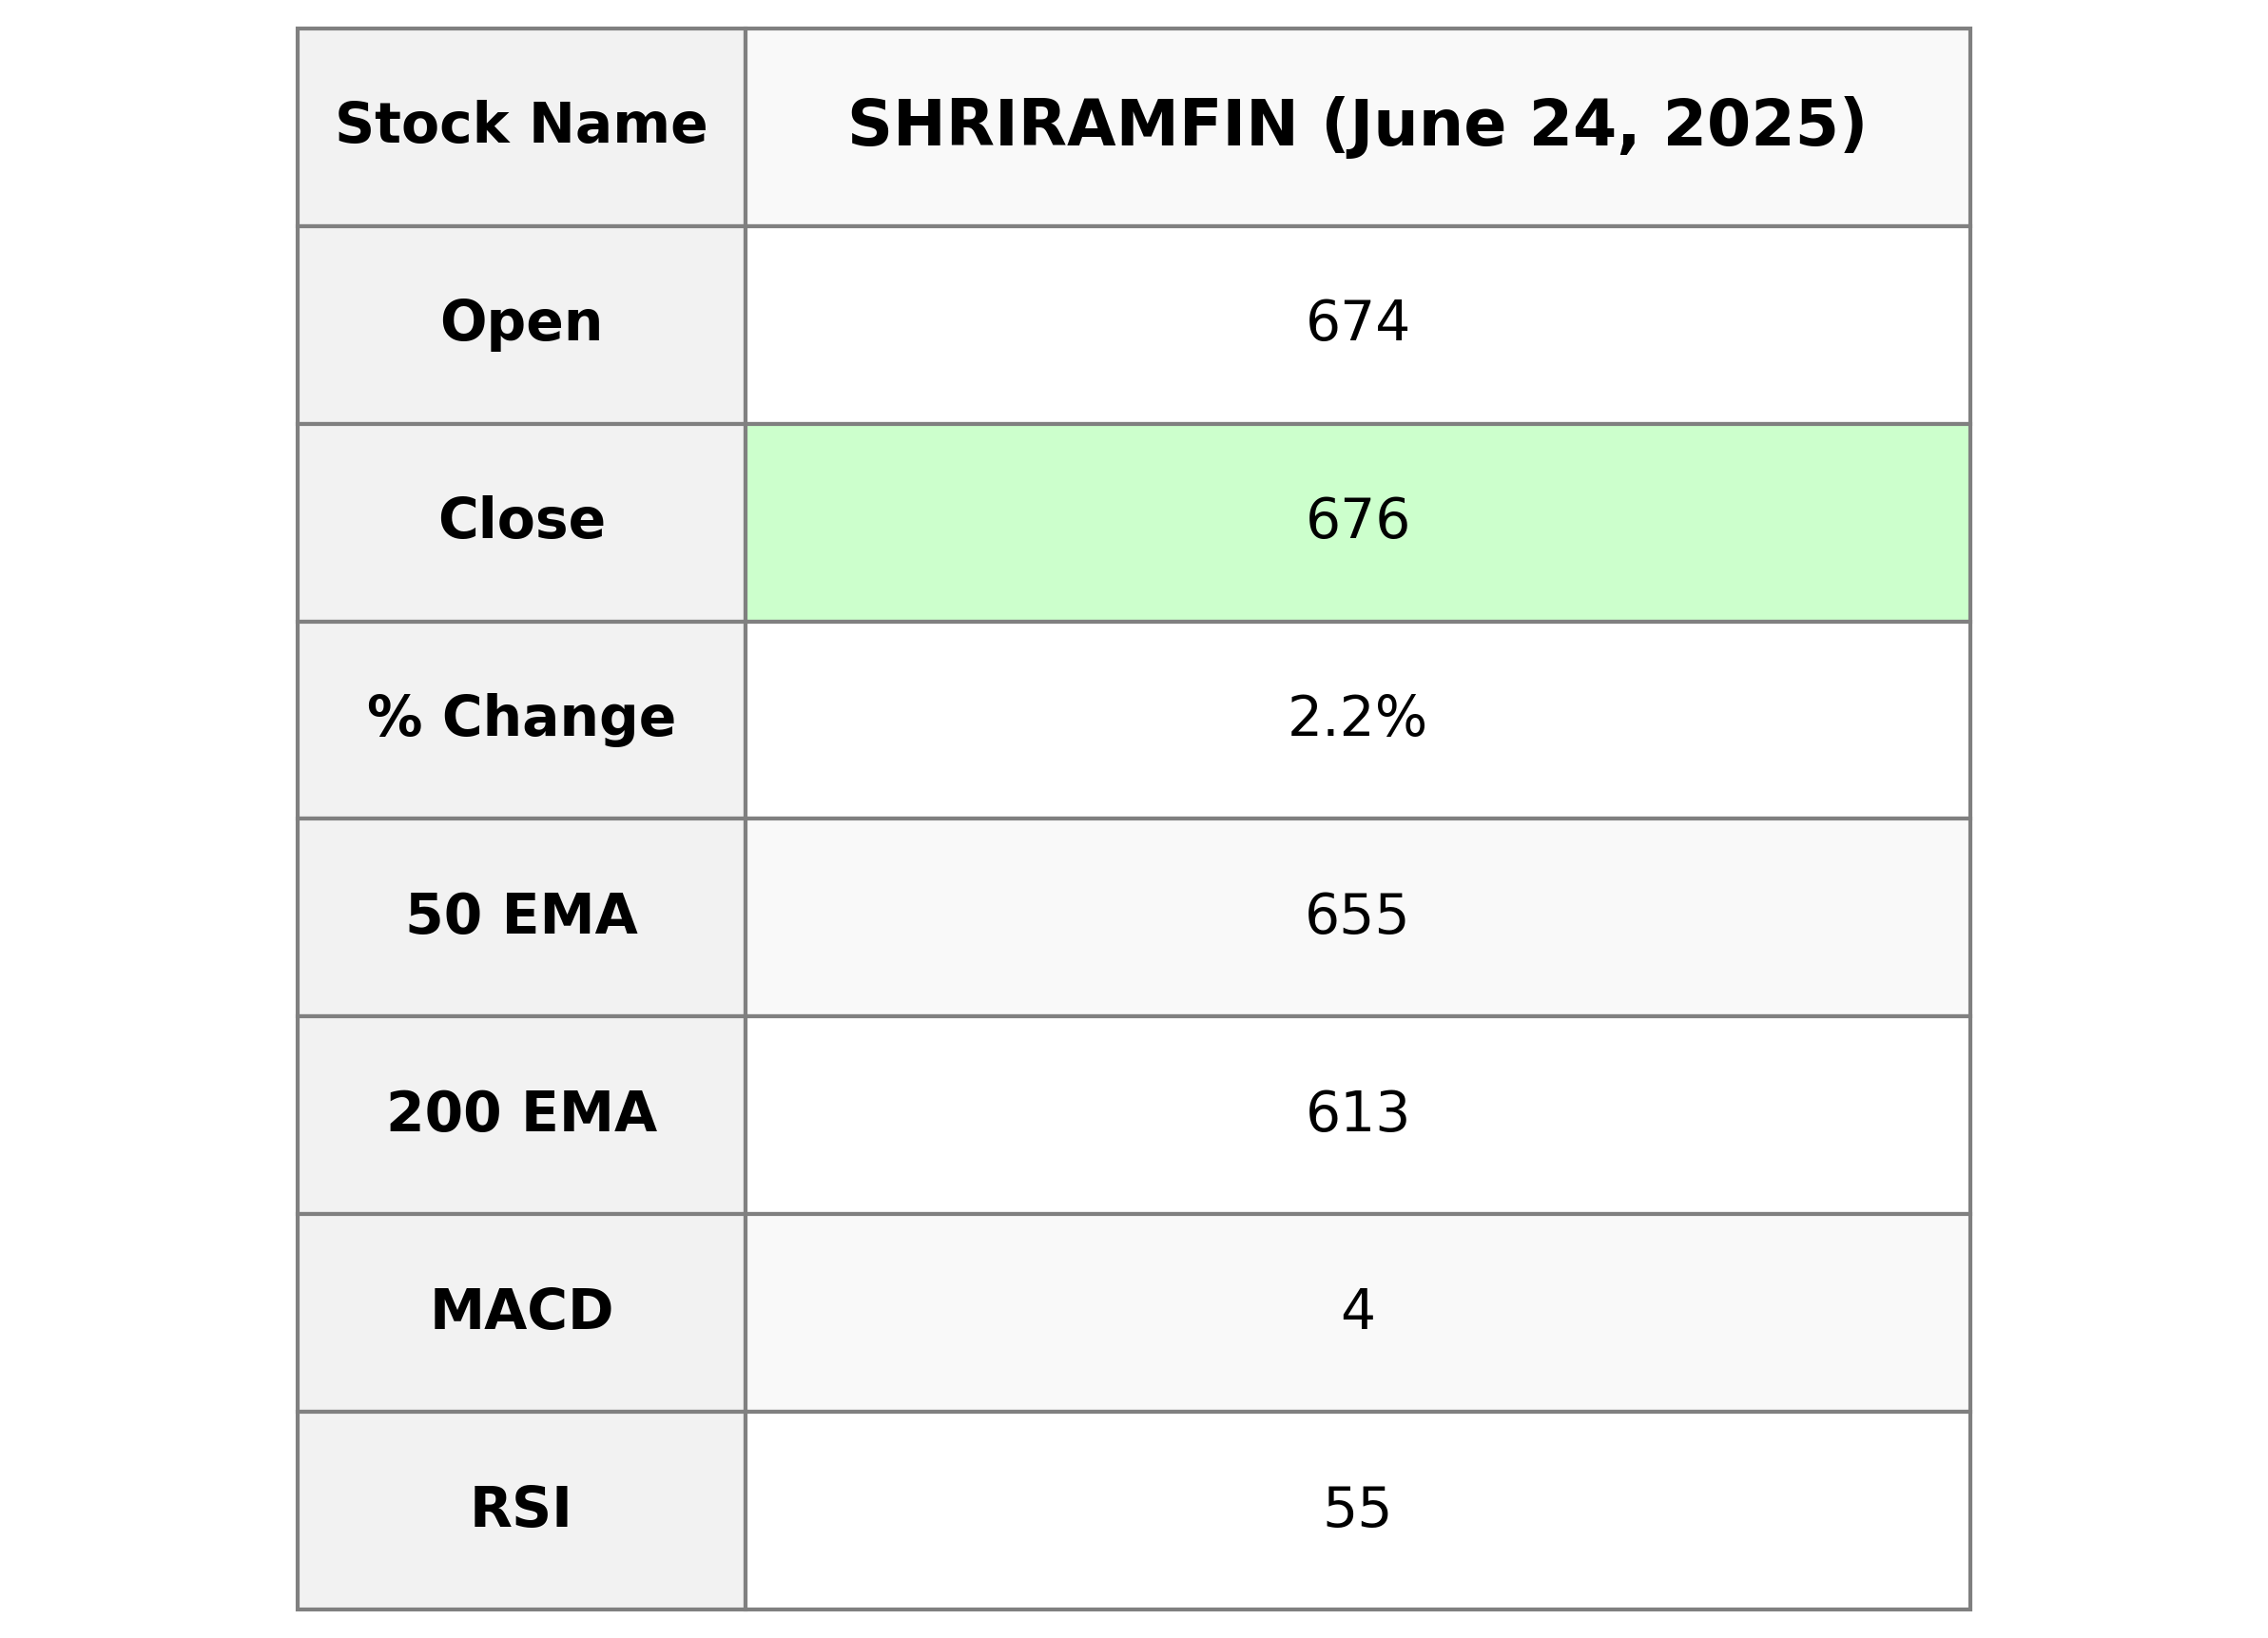
Shriram Finance demonstrated a positive performance with a closing price of 676.05, marking a 2.18% increase from the previous close. The company's market cap stands at approximately 1.27 trillion INR, with a PE Ratio of 13.48 and an EPS of 50.15, positioning it well within the Credit Services industry in India's Financial Services sector.
Relationship with Key Moving Averages
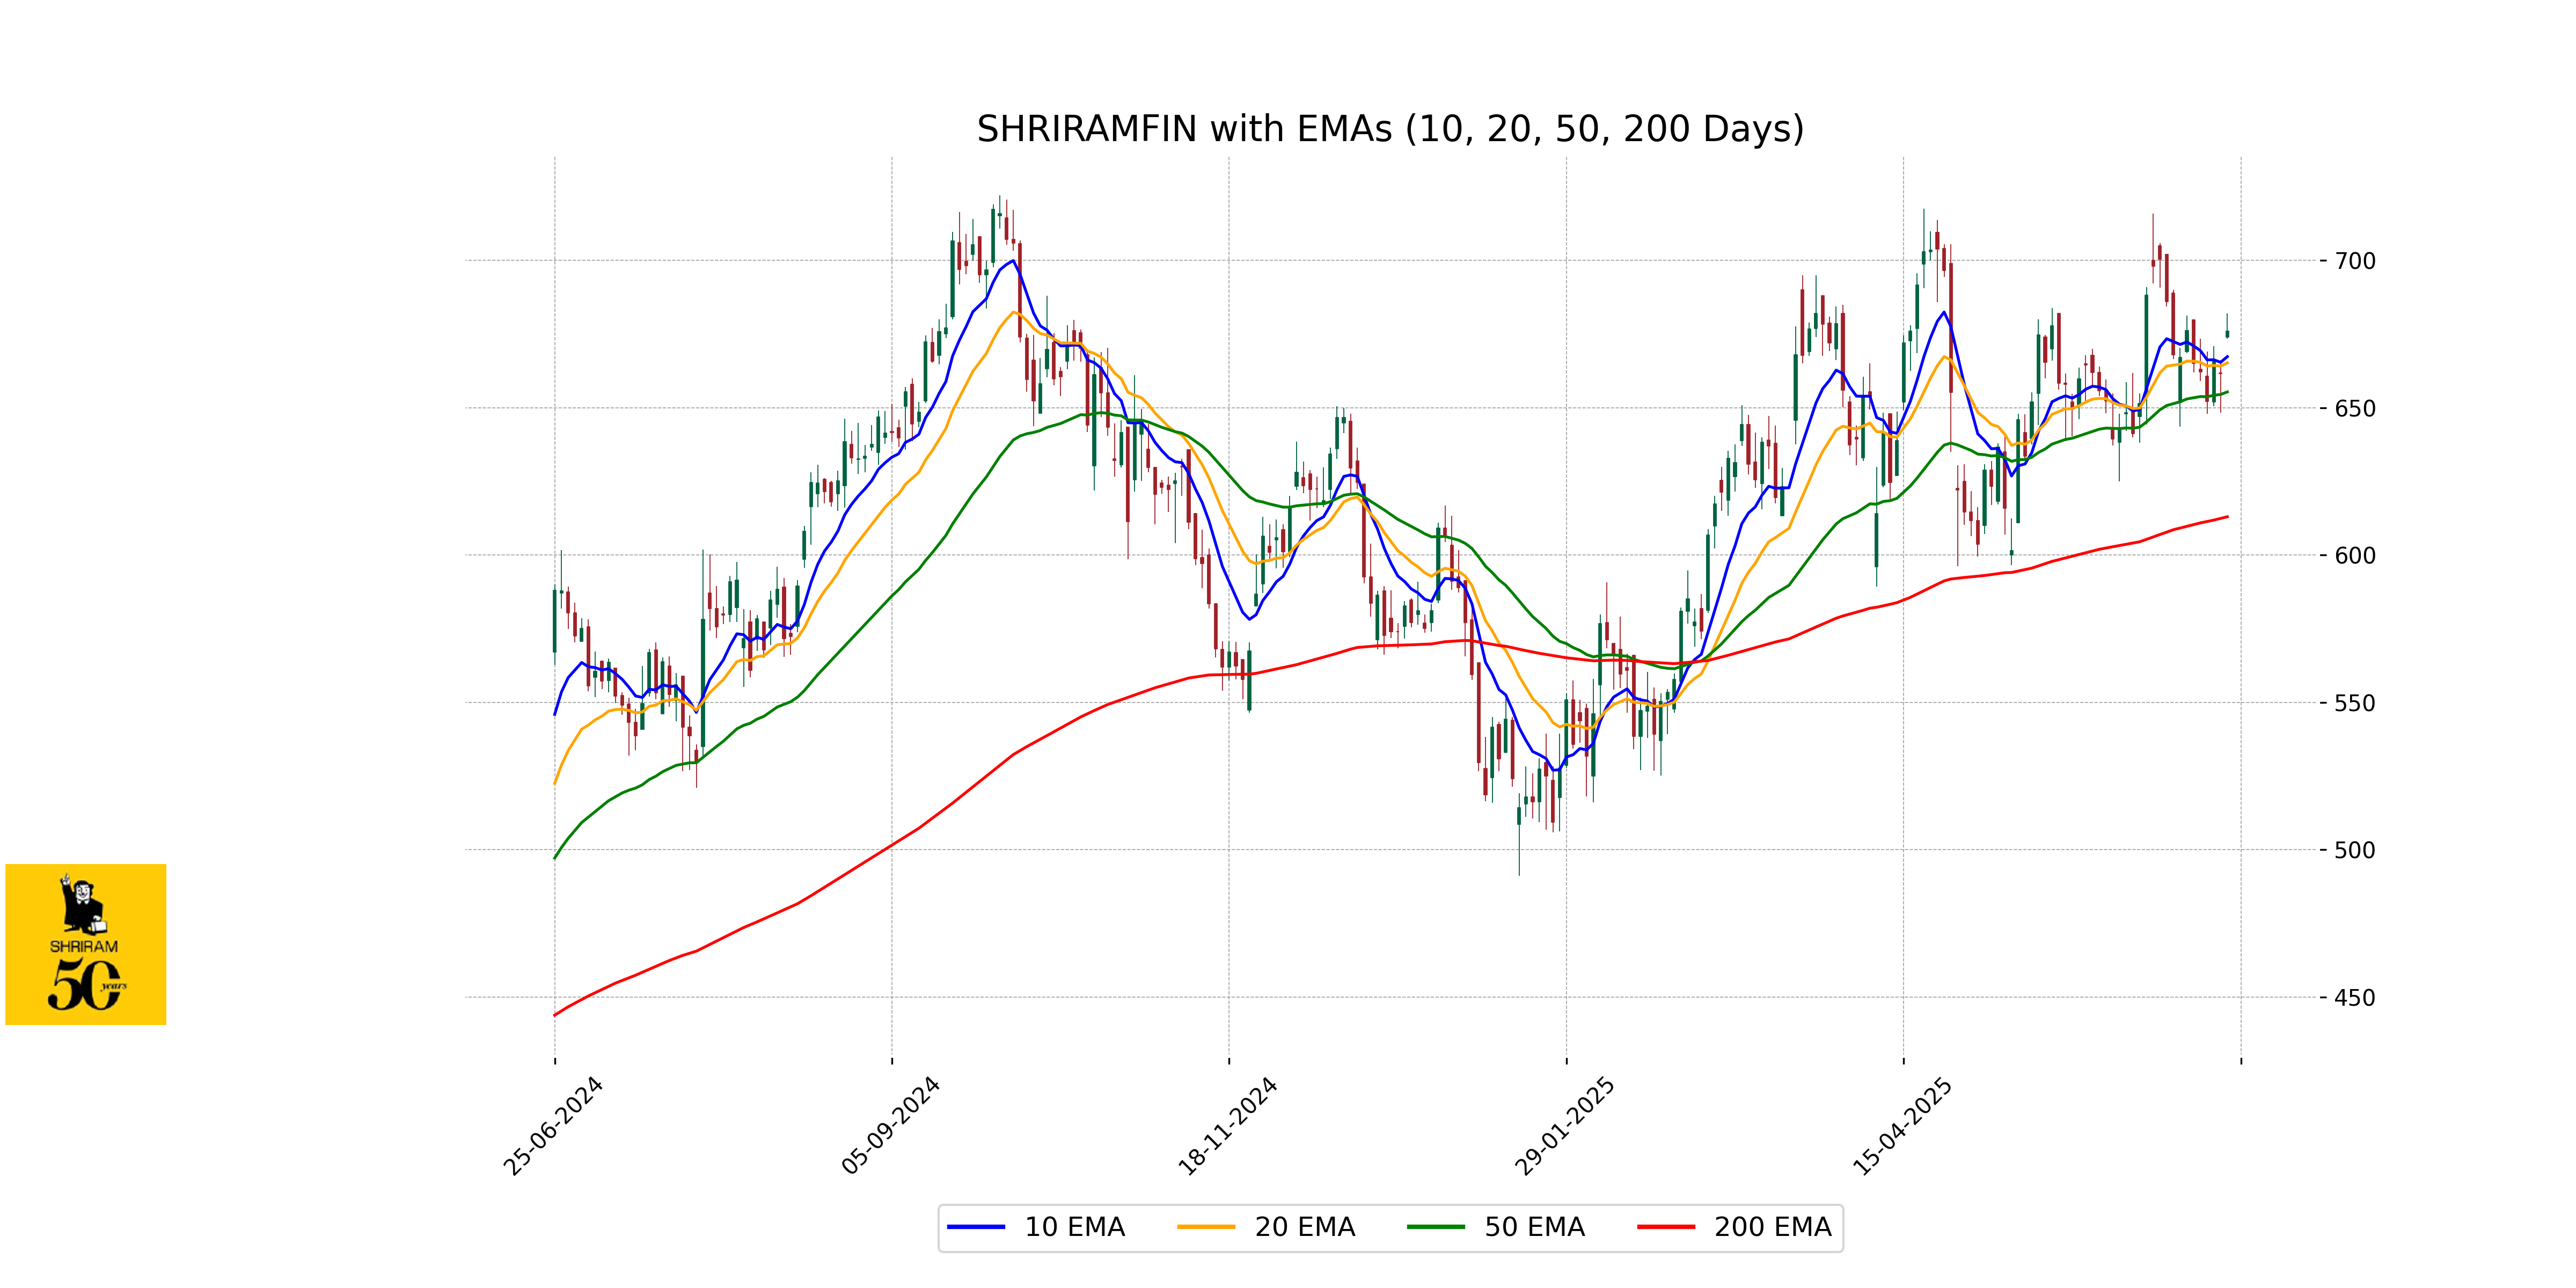
Shriram Finance's current closing price of 676.05 is above its 50-day EMA of 655.37, indicating a short-term upward trend. Additionally, it is higher than the 200-day EMA of 612.99, suggesting a longer-term bullish sentiment. However, the closing price is slightly above the 10-day and 20-day EMAs, which are 667.36 and 665.25 respectively, reflecting recent momentum.
Moving Averages Trend (MACD)
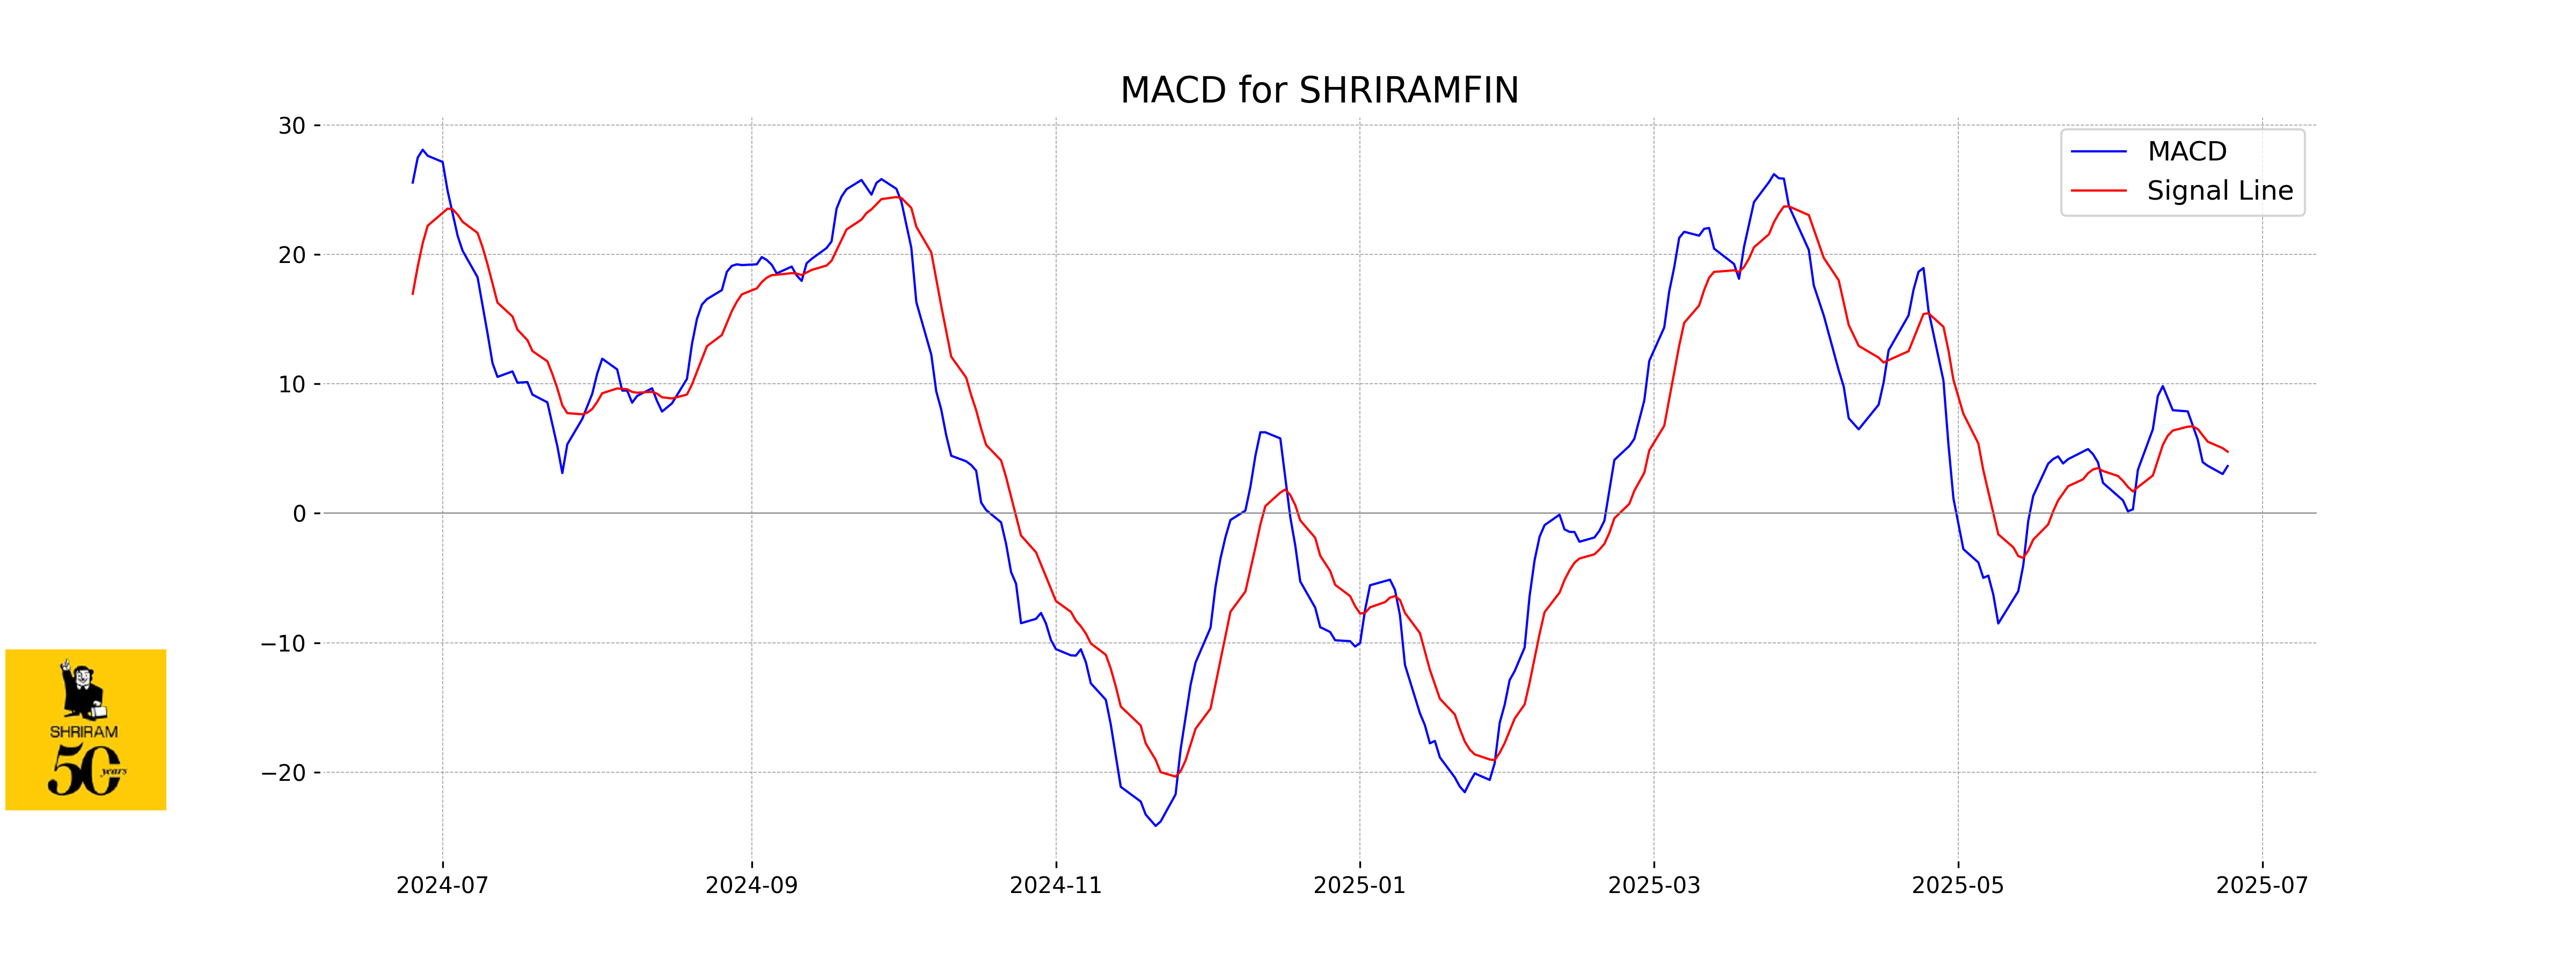
The MACD value for Shriram Finance is 3.6451, while the MACD Signal is at 4.7518. This indicates a bearish trend, as the MACD line is below the signal line, suggesting potential downside momentum.
RSI Analysis
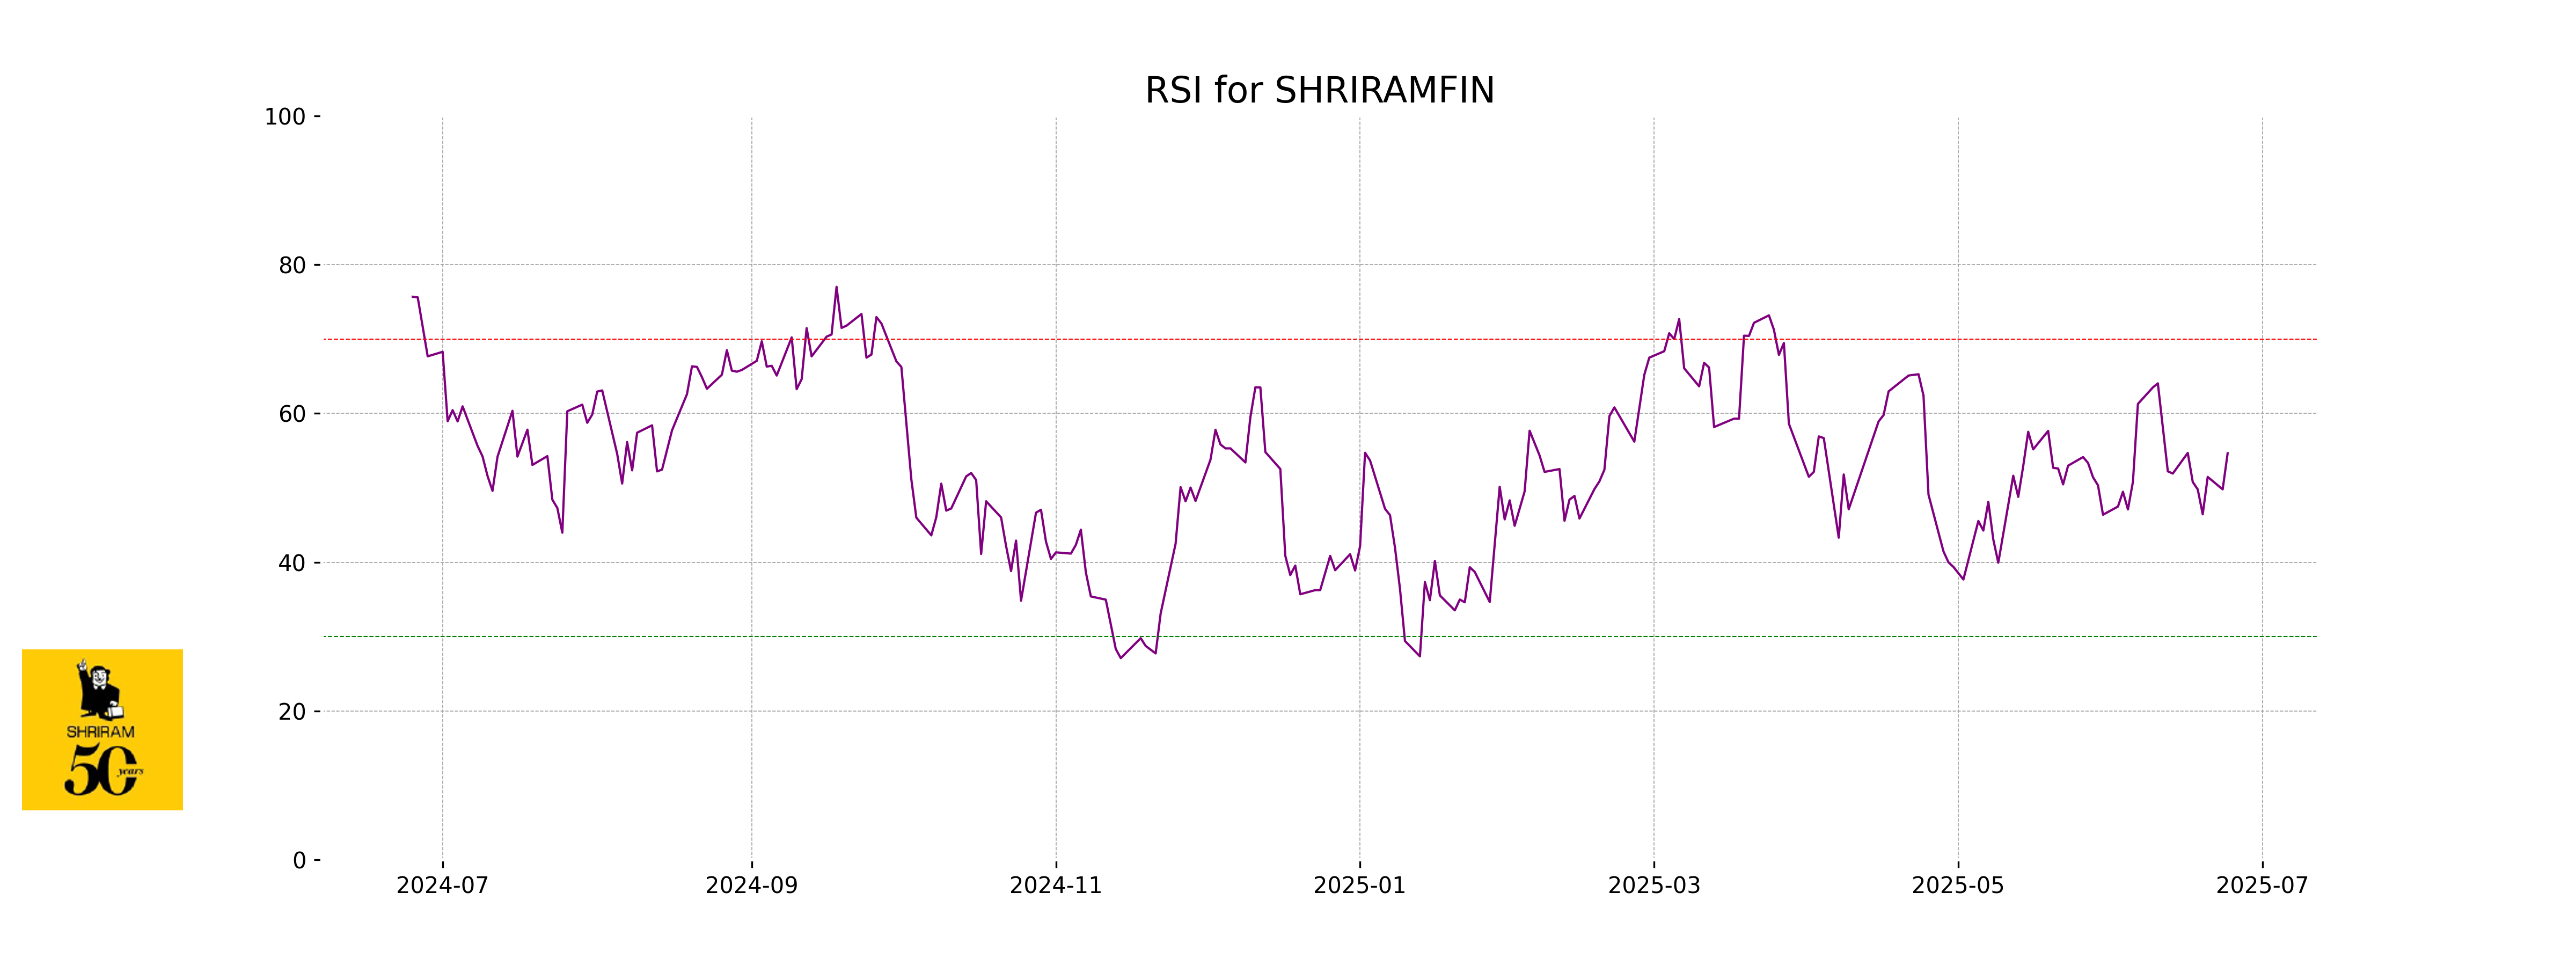
RSI Analysis for Shriram Finance: The Relative Strength Index (RSI) is currently at 54.65, which suggests that the stock is in a neutral zone. This indicates no clear overbought or oversold conditions, showing moderate strength and balance between buying and selling pressures.
