


Highlights
- Bajaj Finance leads gainers with strong bullish indicators
- Nestle and Tata Steel show upward momentum signs
- ONGC, Wipro trade near neutral RSI zones
Latest news

Samsung Galaxy Z Fold 8, Fold 8 Ultra & Z Flip 8: A More Mature Foldable Family

Dell Launches New Alienware 16X Aurora, 16 Area-51 and 18 Area-51 Gaming Laptops in India

Samsung Takes on Premium Home Audio With New Music Studio Series

The End of OxygenOS: OnePlus Confirms Shift to Oppo's ColorOS

Fujifilm Instax Mini Evo Cinema Review: A Hybrid Camera That Prints Memories Differently

iQOO Teases Z11 Lite With AI Tools, Military-Grade Durability and a 6500mAh Battery

Editorji Launches Hook Global, Its International Digital News Brand

Samsung's Bespoke AI ACs Focus on Humidity, Hygiene and Smarter Cooling
Top 5 Nifty 50 gainers today – July 18, 2025: Biggest stock moves


In this article, we will explore the technical indicators of some of the high-performing stocks on the Indian stock market, including BAJFINANCE, NESTLEIND, ONGC, TATASTEEL, and WIPRO.
By looking at these stocks through the lens of key technical factors, we aim to better understand their price movements, trends, and potential future performance.

Analysis for Bajaj Finance - July 18, 2025

Bajaj Finance showed a positive performance with its stock closing at 942.0, up by approx. 2.03% from its previous close. The company's financial strength is highlighted with a market cap of over 5.85 trillion and a P/E ratio of 35.18, indicating growth in the financial services sector in India. Technical indicators such as the 50 EMA and MACD suggest upward momentum, while the RSI of 55.67 indicates a relatively neutral stock position.
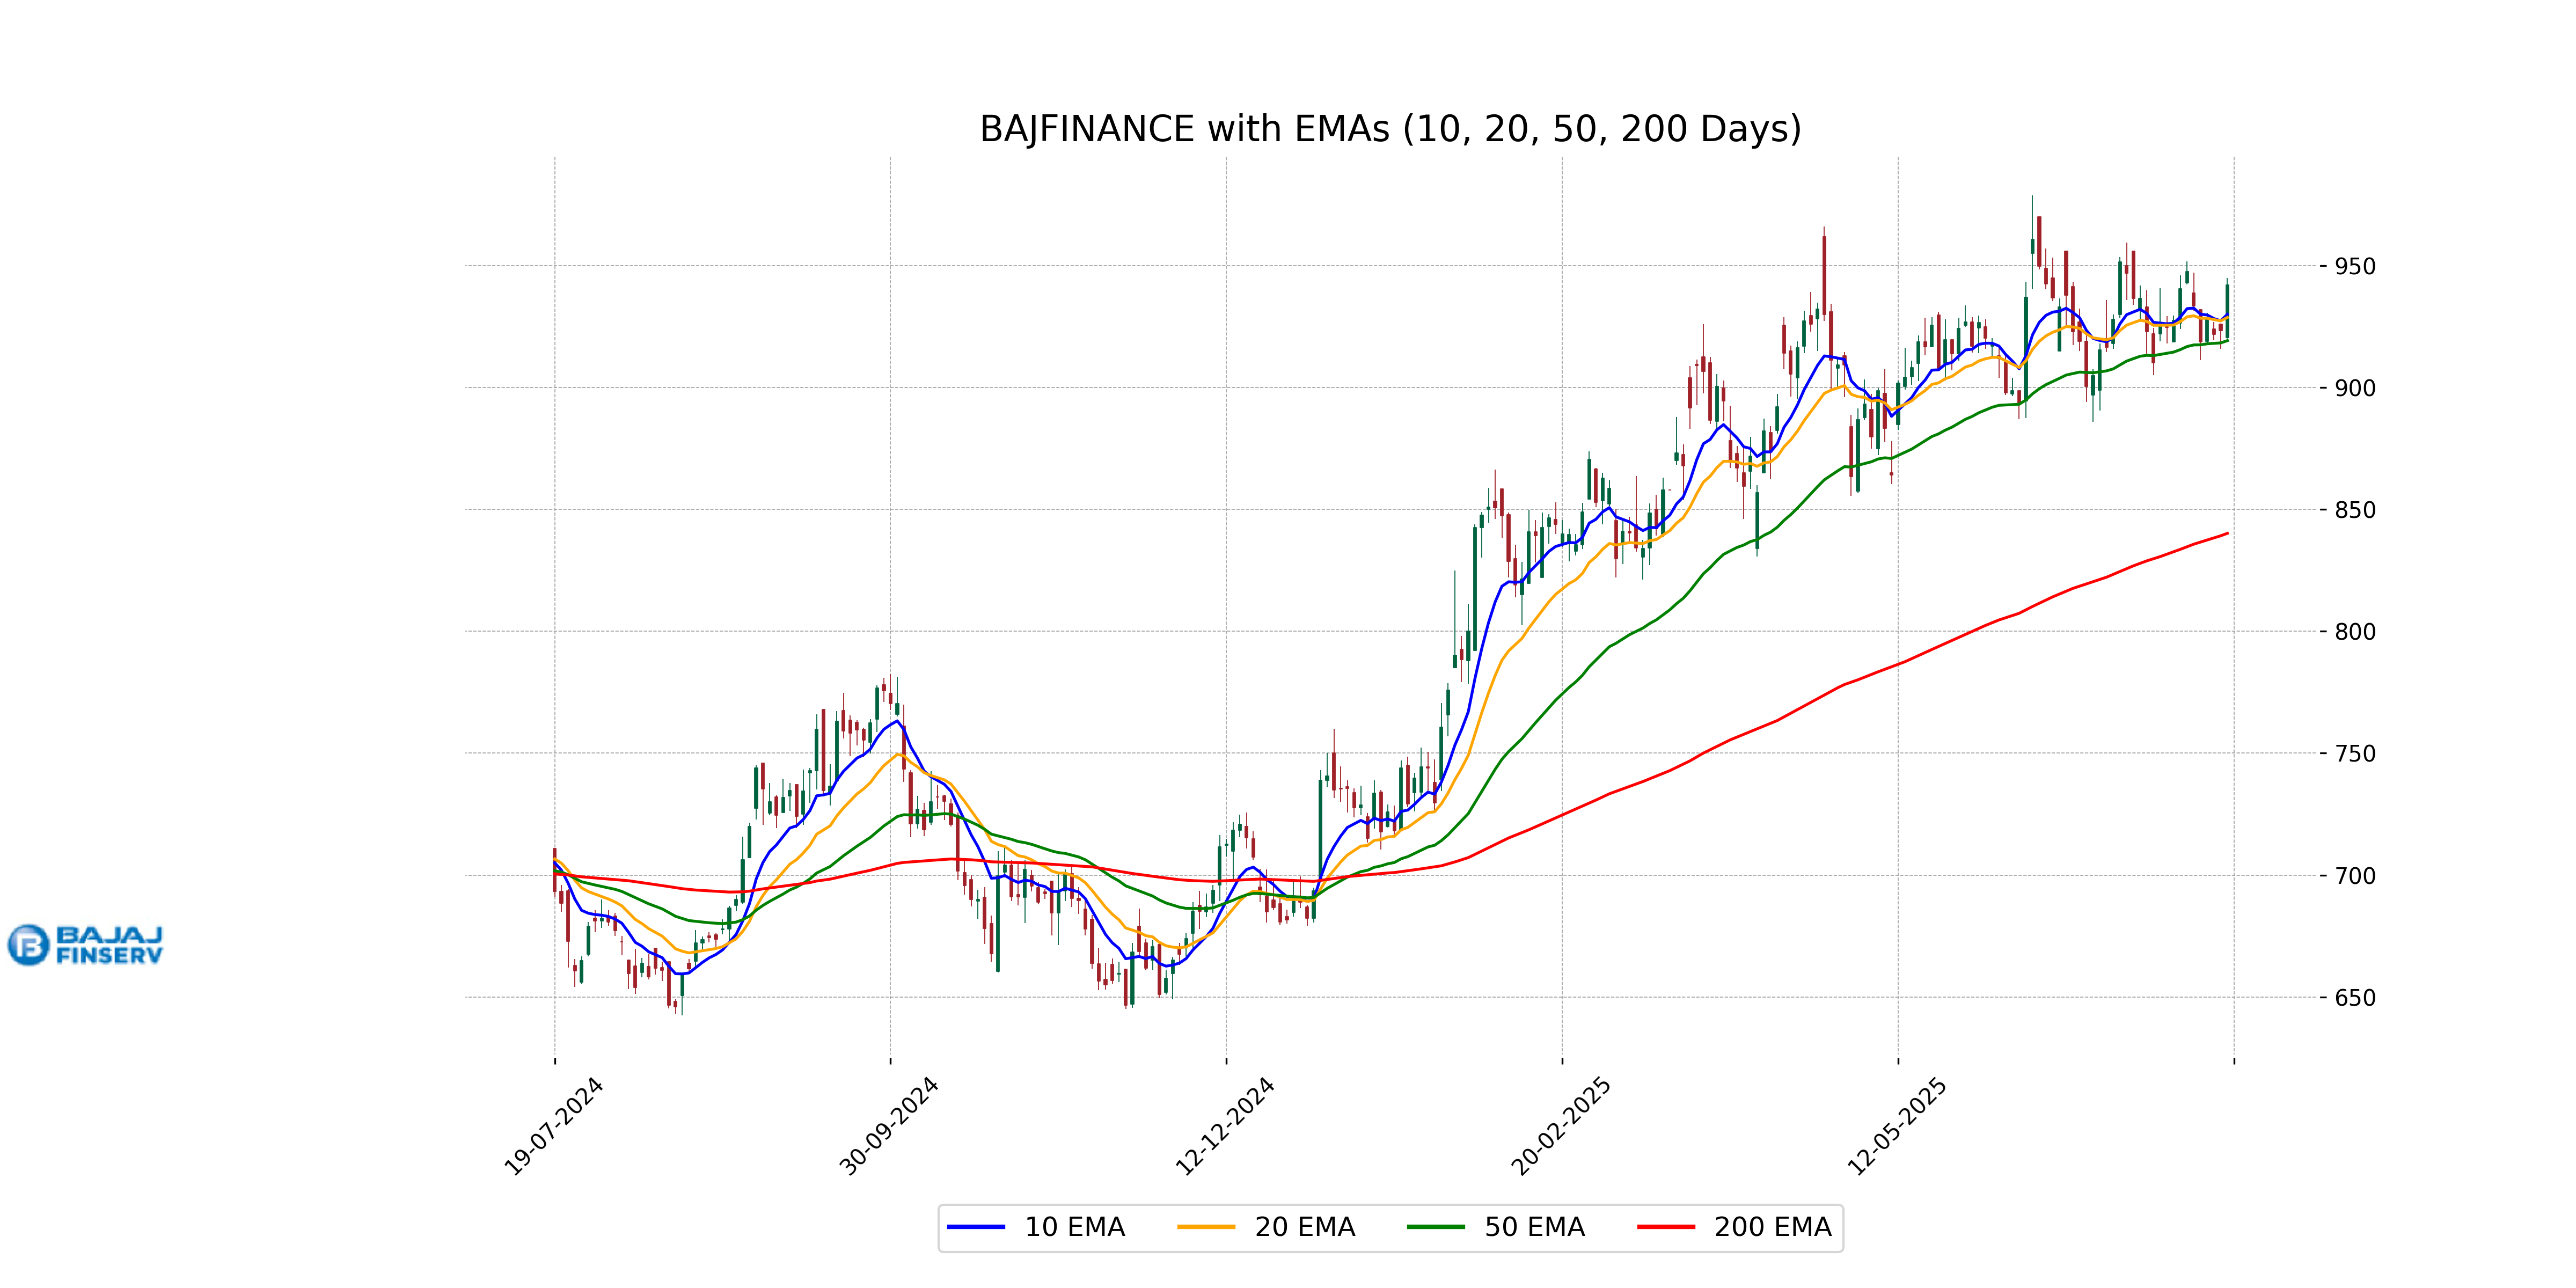
Relationship with Key Moving Averages
Bajaj Finance closed at 942.0, which is above the 50 EMA of 919.26, the 10 EMA of 930.07, and the 20 EMA of 928.77, indicating a bullish trend in the short to medium term. The current close also remains significantly above the 200 EMA of 840.22, suggesting strong long-term support.
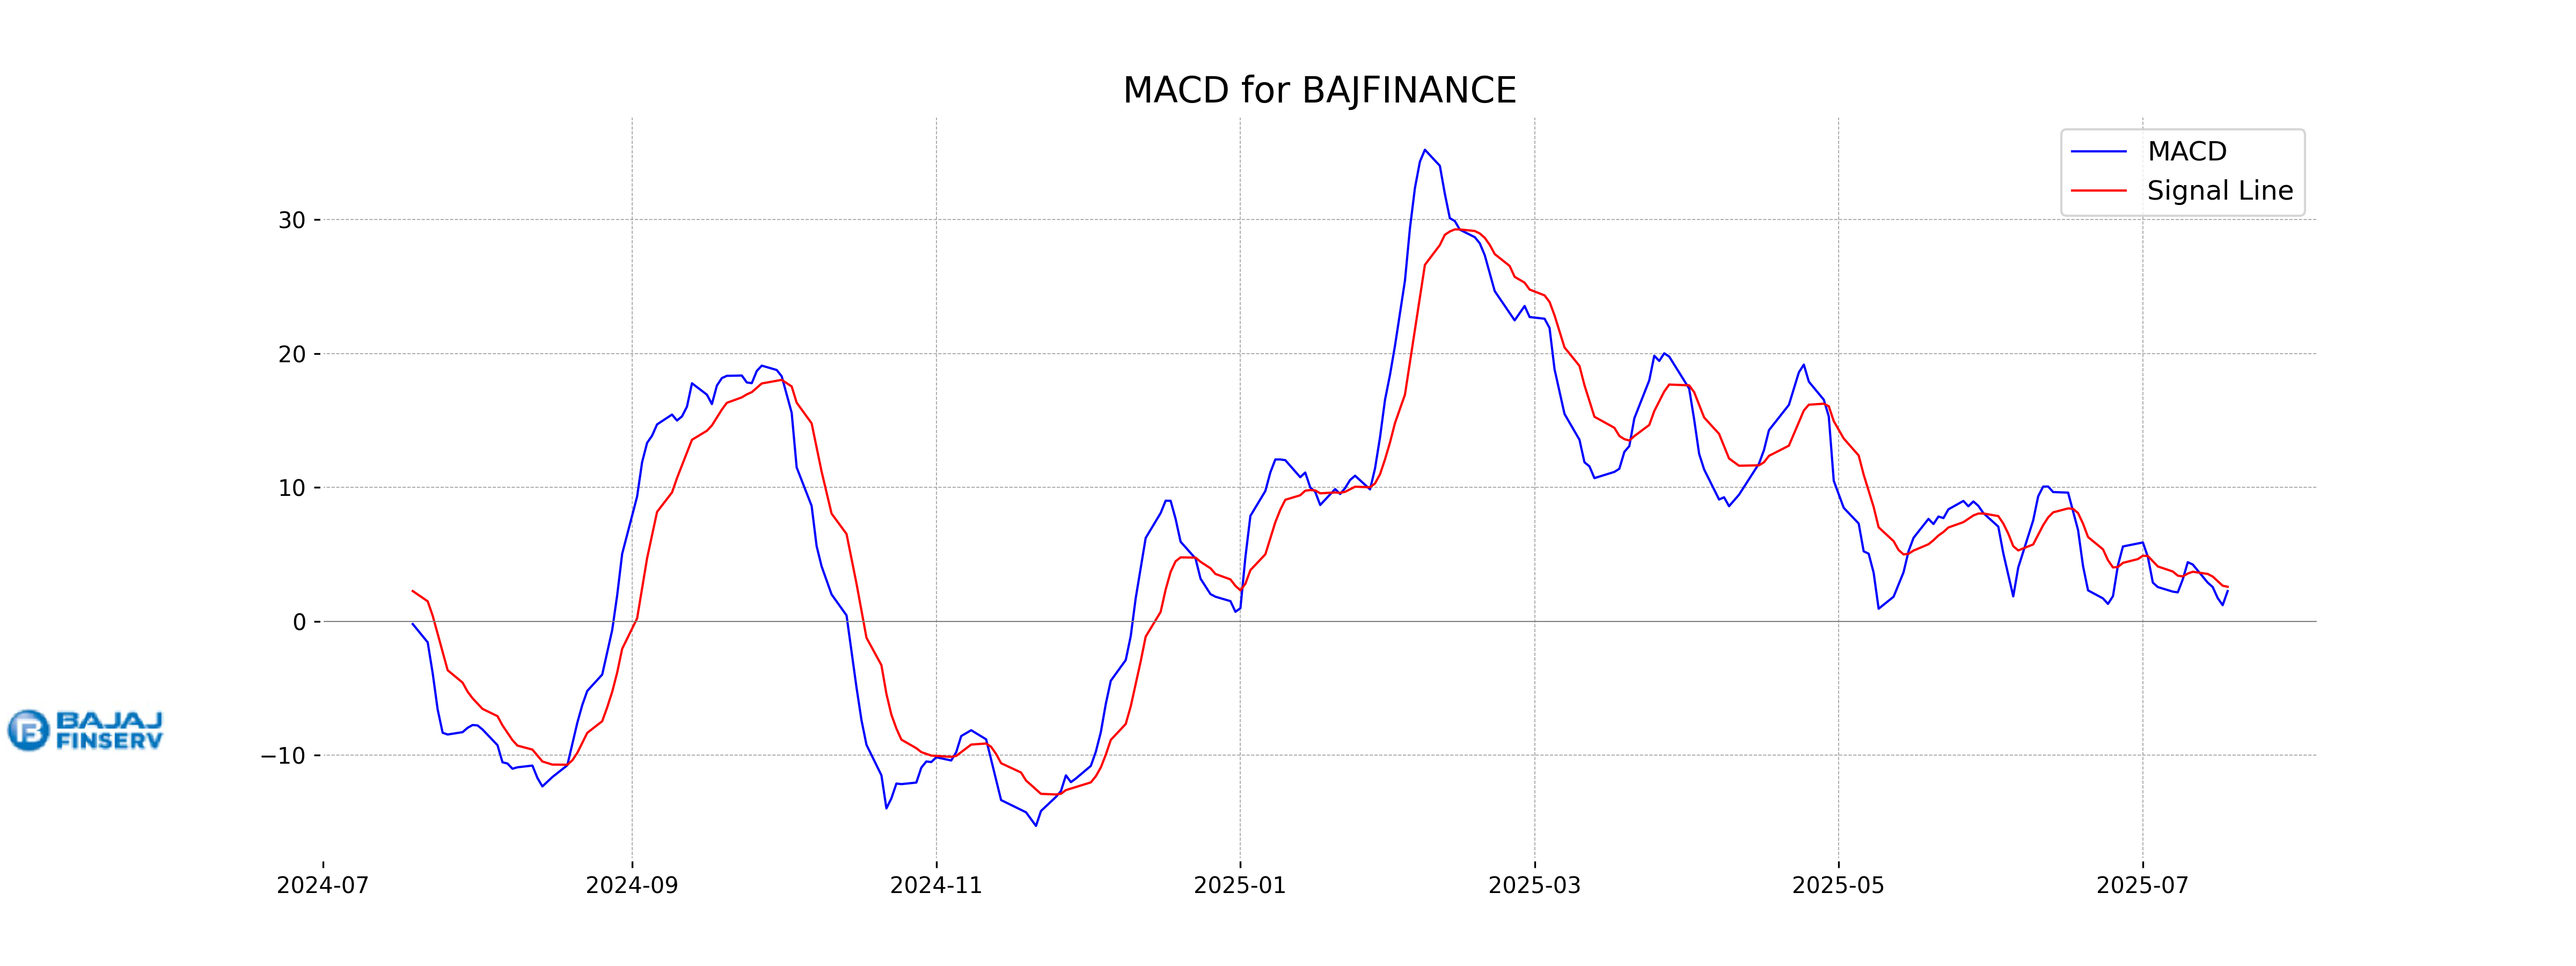
Moving Averages Trend (MACD)
MACD Analysis for Bajaj Finance: The MACD value of 2.25 is slightly below the MACD Signal of 2.57, suggesting a potential bearish signal. This indicates that the recent momentum might be slowing down, and caution is advised as the stock may experience a short-term consolidation or a pullback.
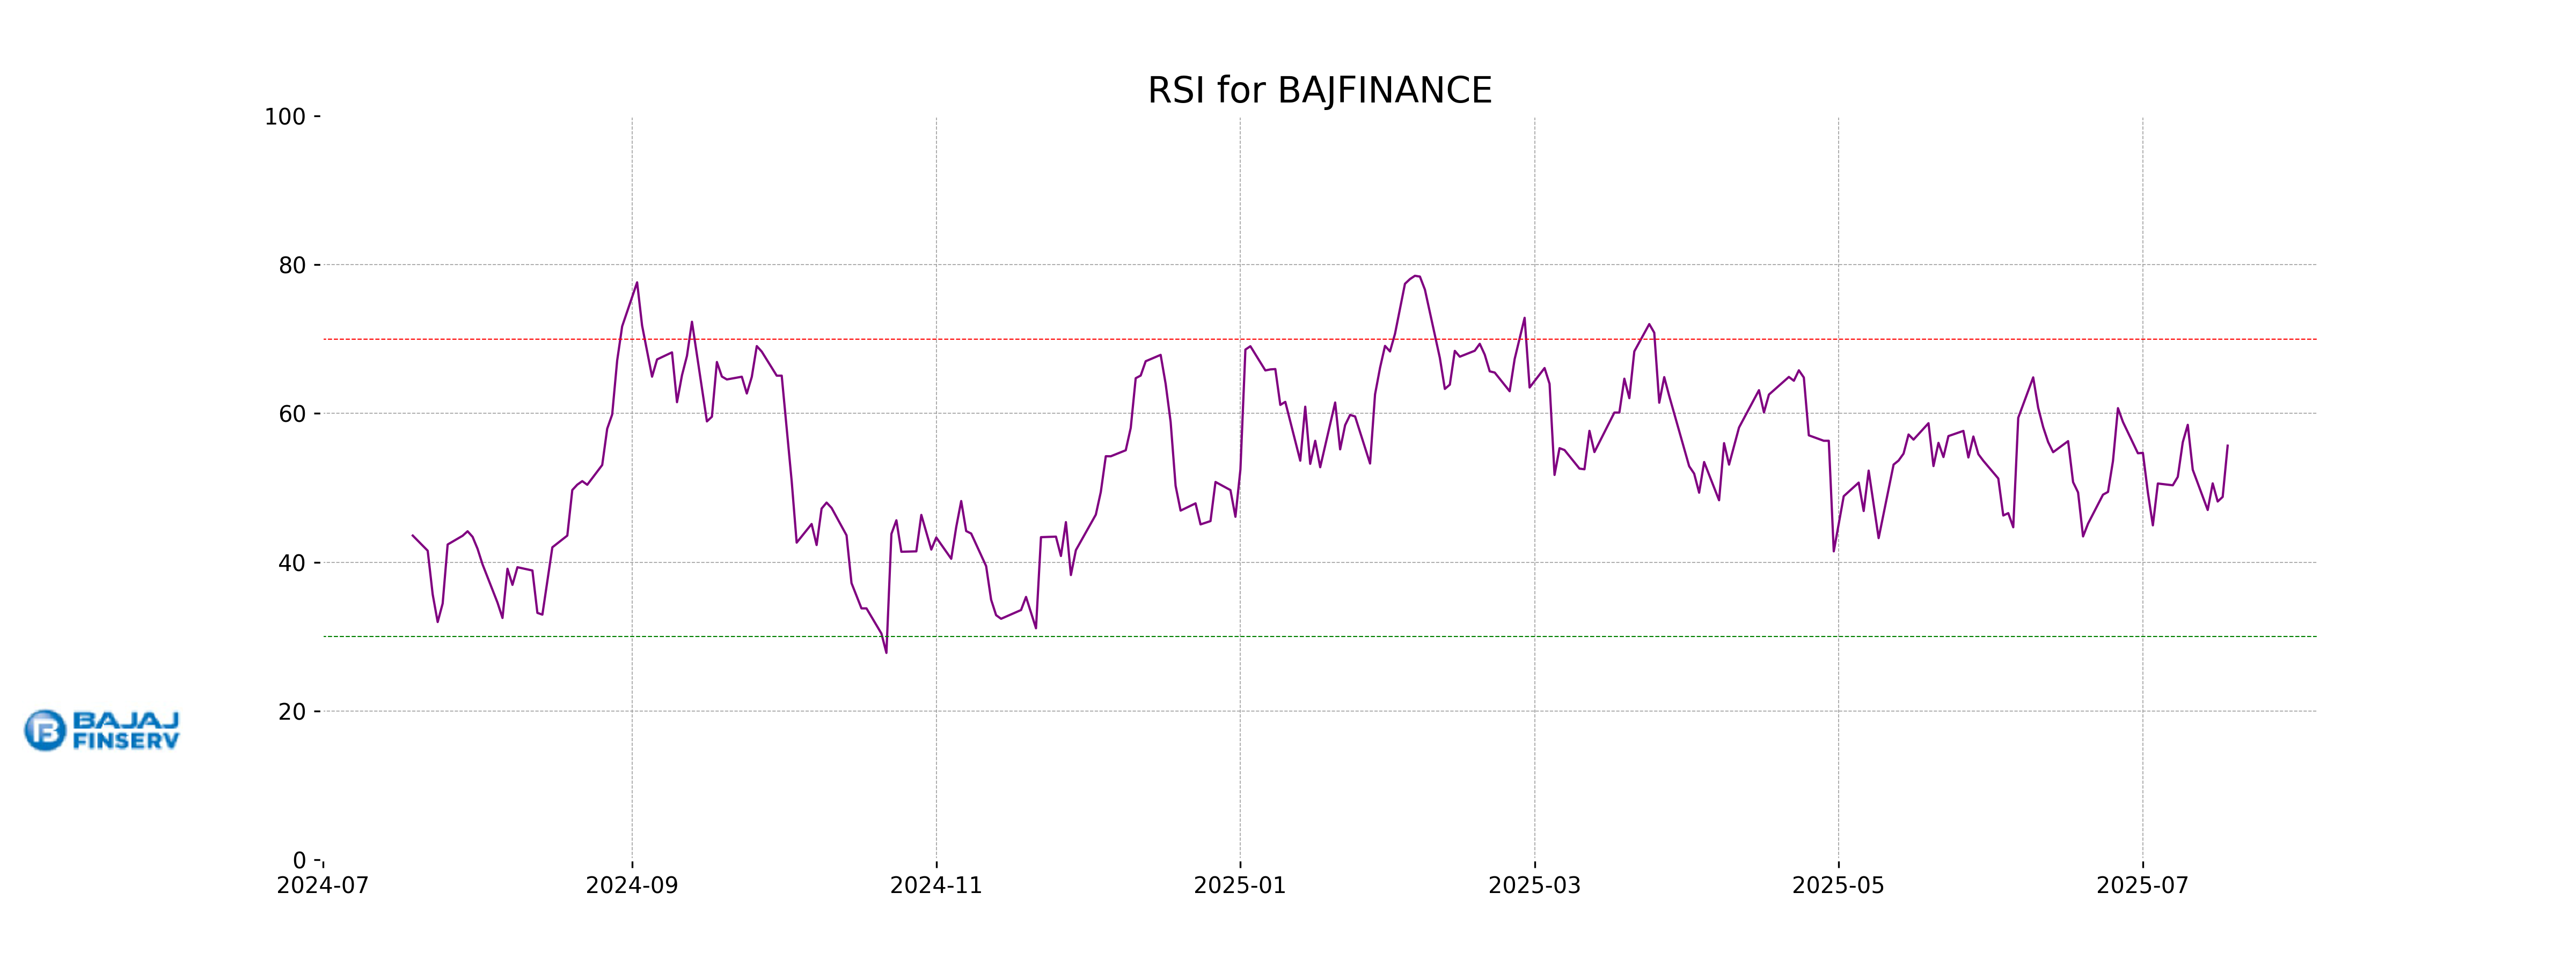
RSI Analysis
The RSI for Bajaj Finance is 55.67, which indicates a neutral position, neither overbought nor oversold. This suggests that the stock may not experience immediate drastic price movements based on RSI alone.
Analysis for Nestle - July 18, 2025

Nestle India's stock opened at 2459.0 and closed at 2472.2, marking a 0.94% increase from the previous close, with a volume of 449,594 shares traded. The company's market cap is 2,383,588,884,480 INR, and it operates in the Consumer Defensive sector, specifically in the Packaged Foods industry. The stock exhibits bullish indicators with an RSI of 62.42 and MACD above the signal line, suggesting potential upward momentum.
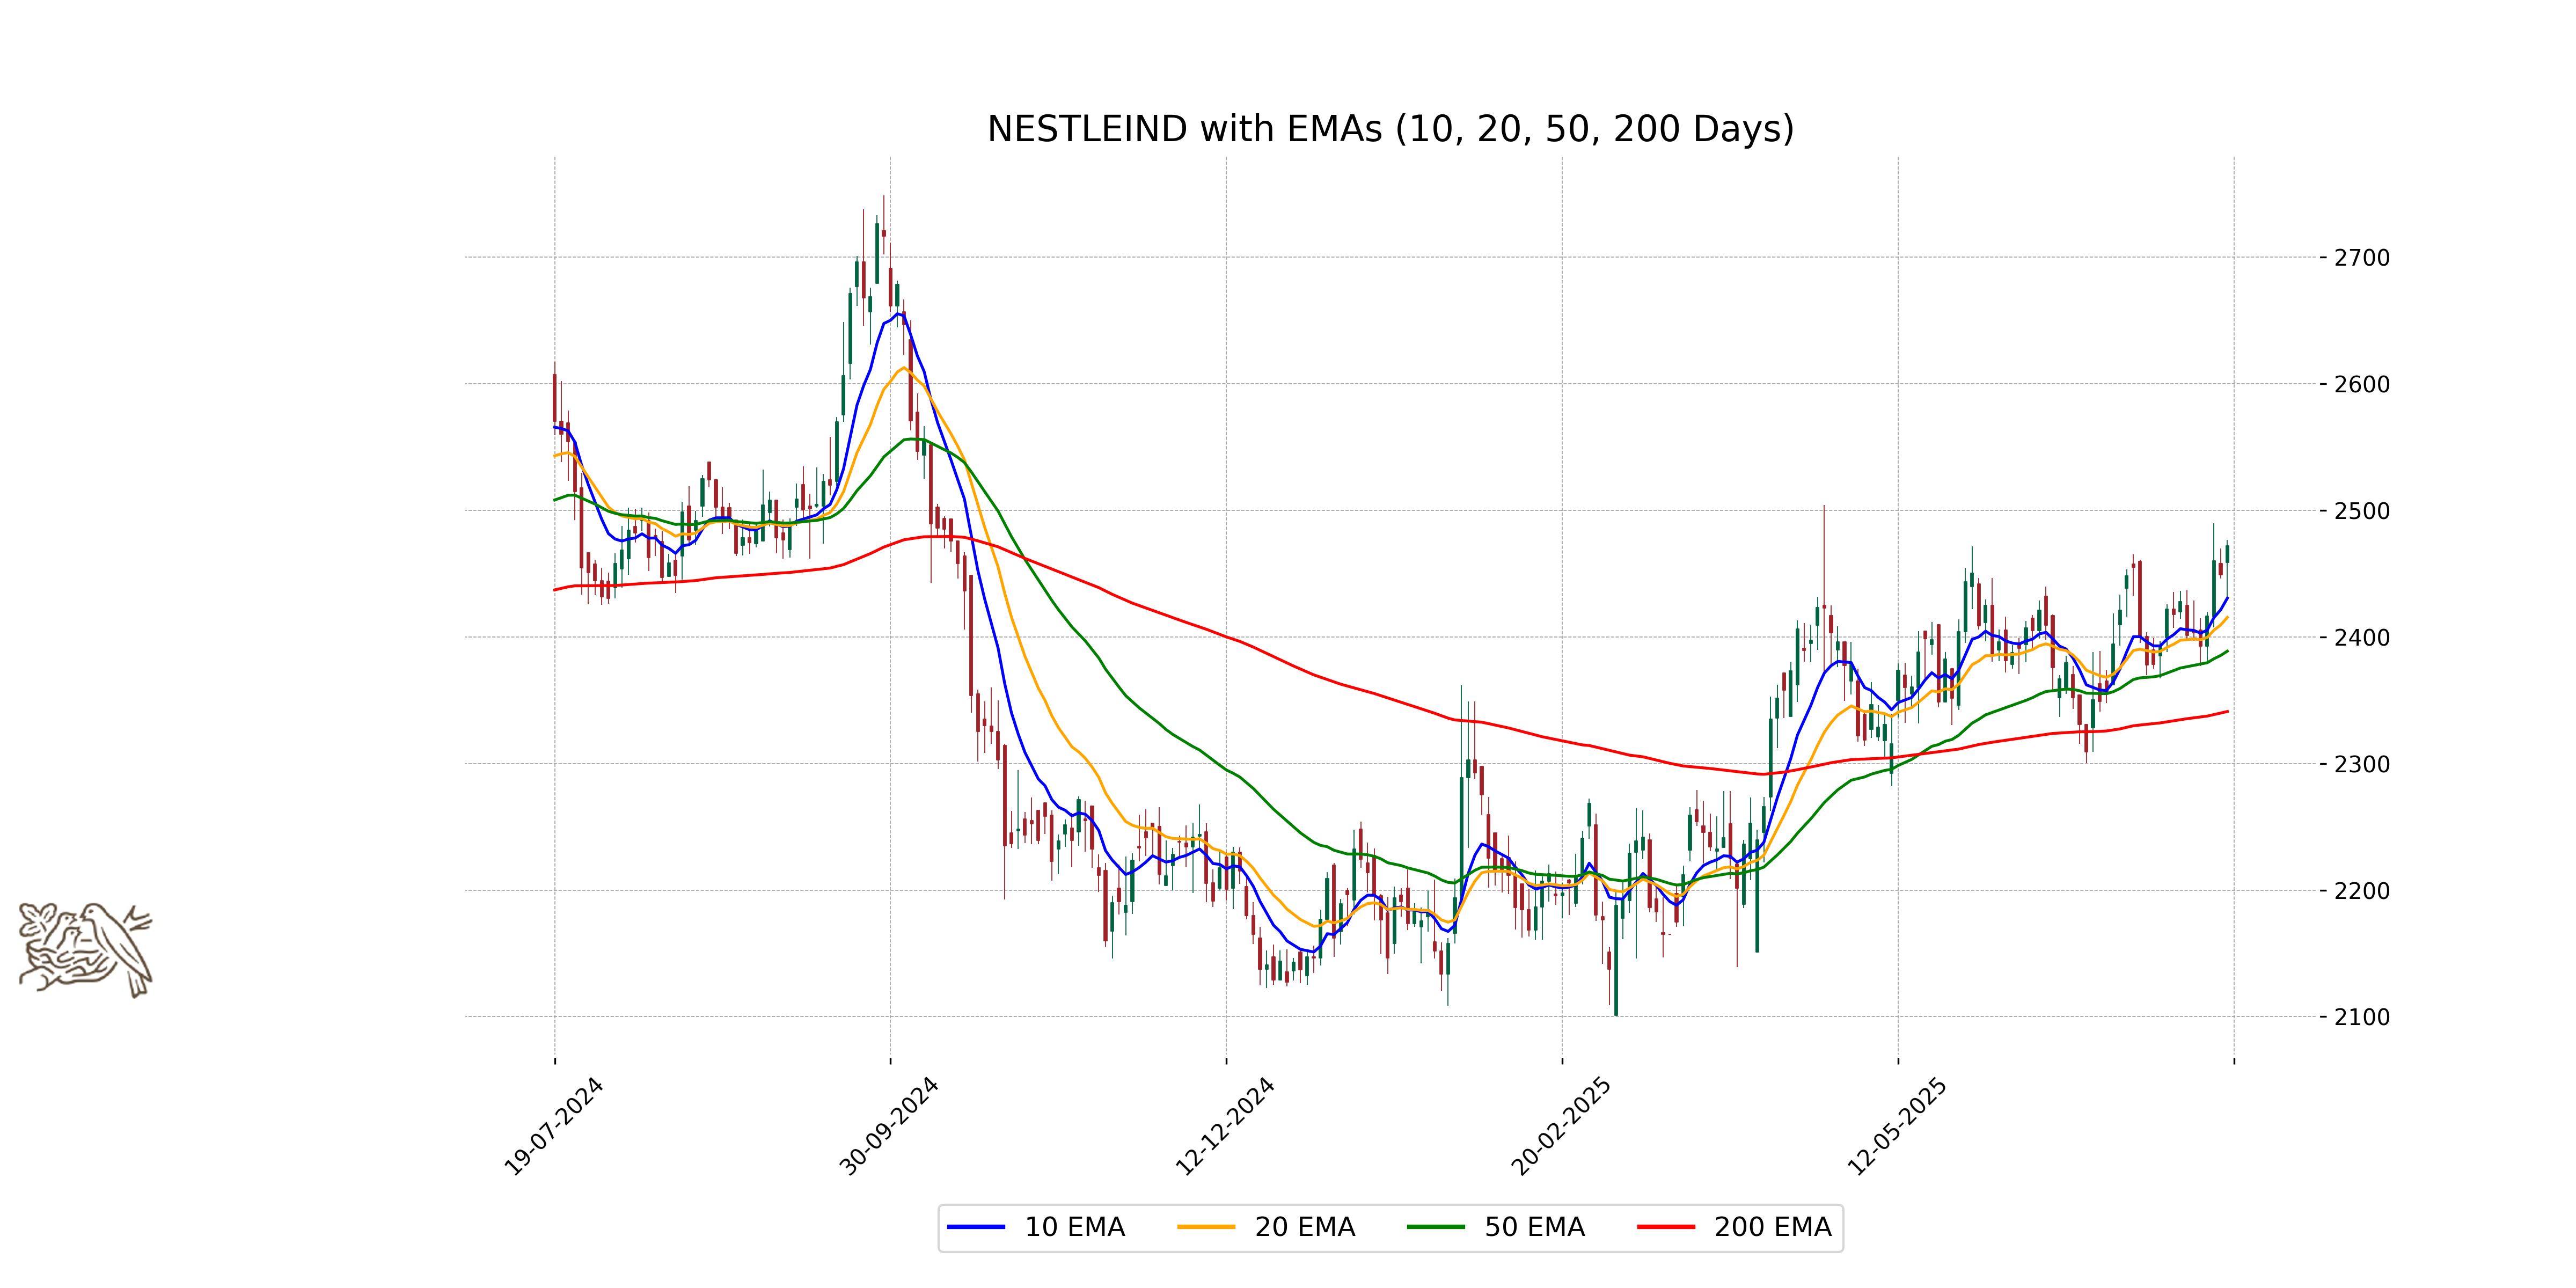
Relationship with Key Moving Averages
Nestle India's stock closed at 2472.20, which is above its 50-day EMA (2388.80), 20-day EMA (2415.49), and 10-day EMA (2430.69), indicating a bullish trend in the short to medium term. This close is also above the 200-day EMA (2341.11), suggesting long-term bullish sentiment.
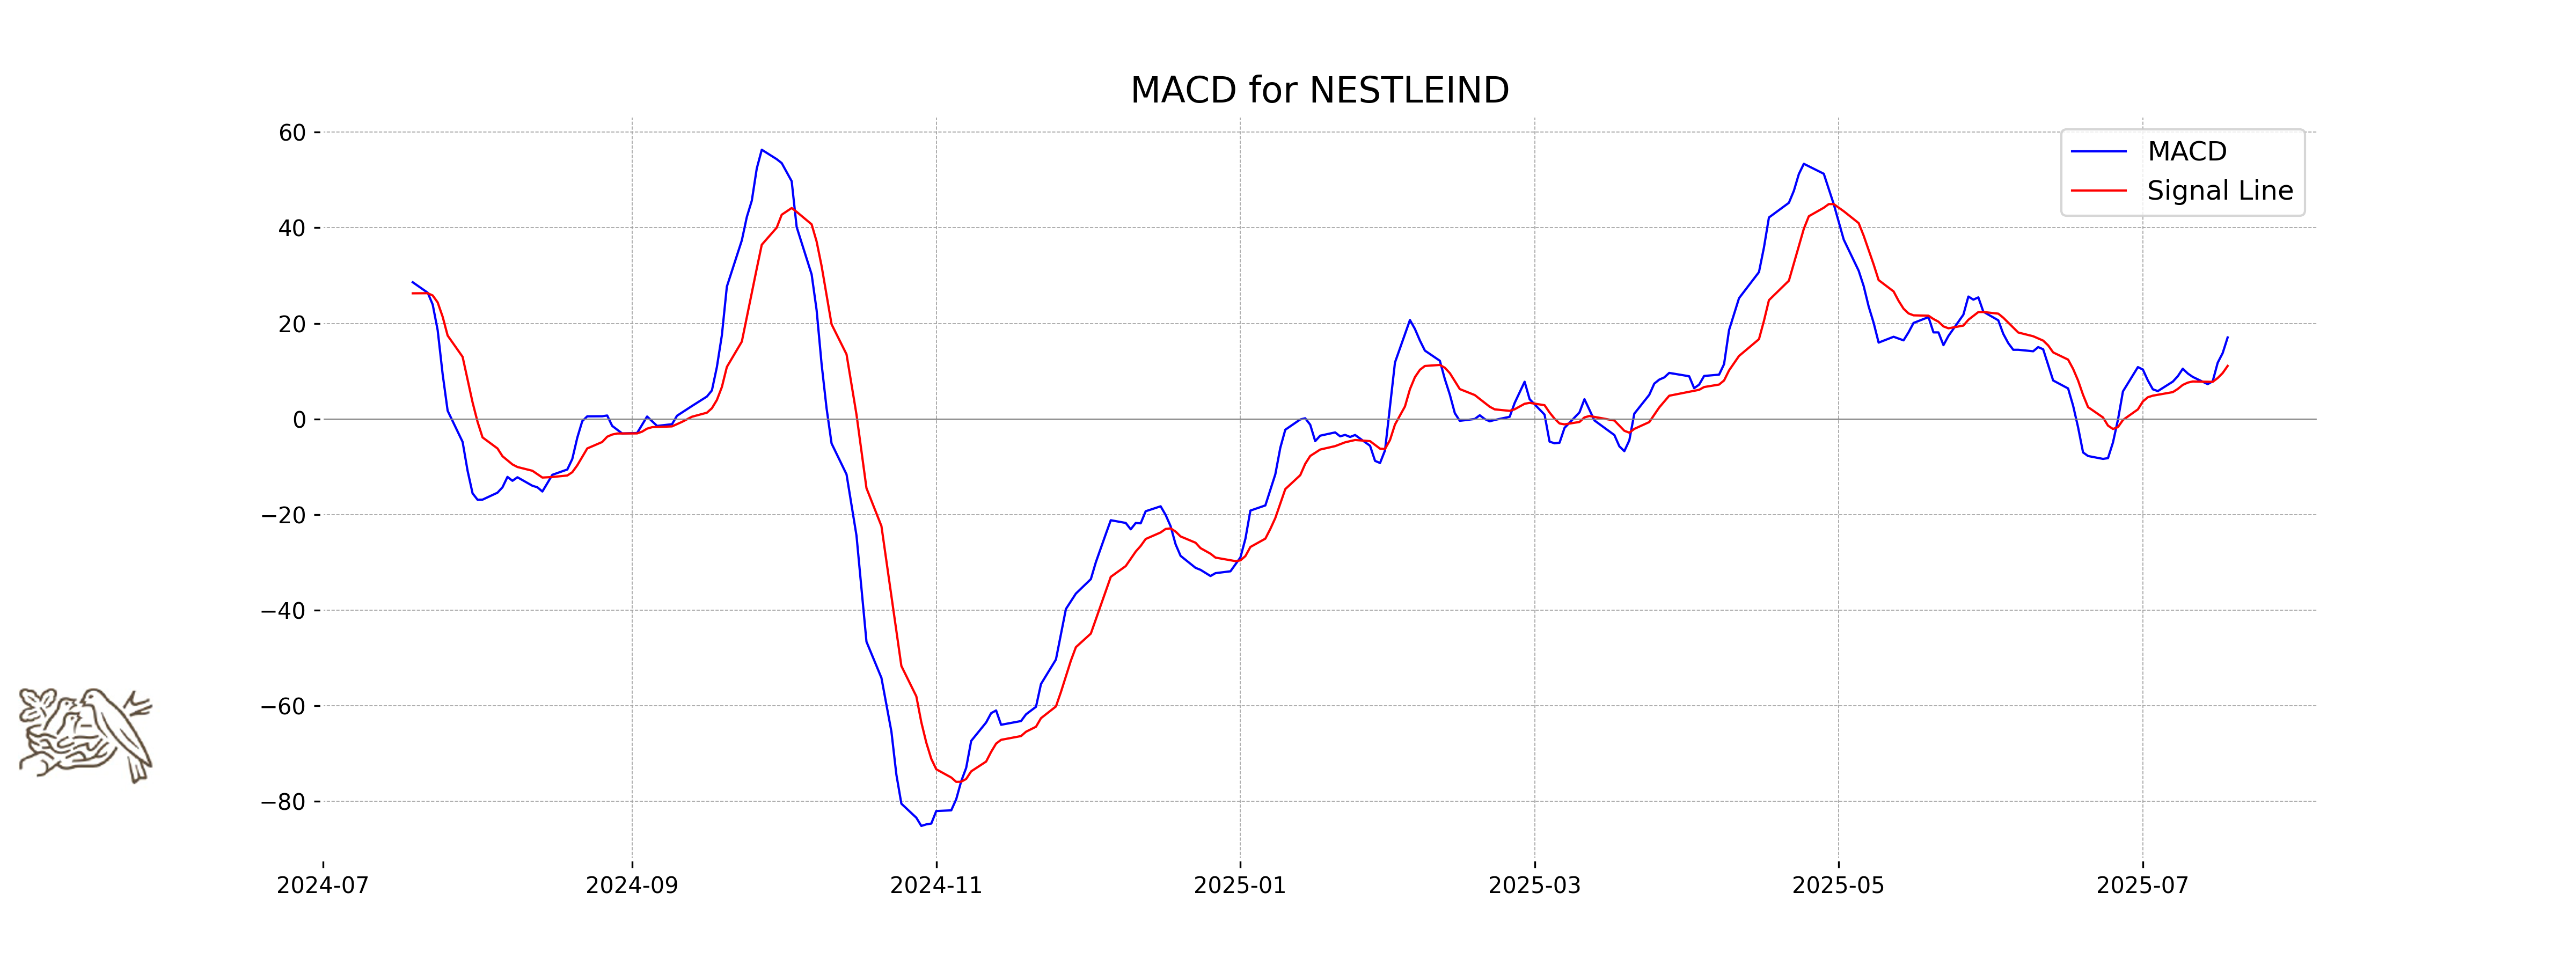
Moving Averages Trend (MACD)
The MACD for Nestle shows a bullish trend with a value of 17.05, which is higher than the signal line value of 11.10. This indicates that Nestle's stock has positive momentum and could potentially continue to rise in the near term.
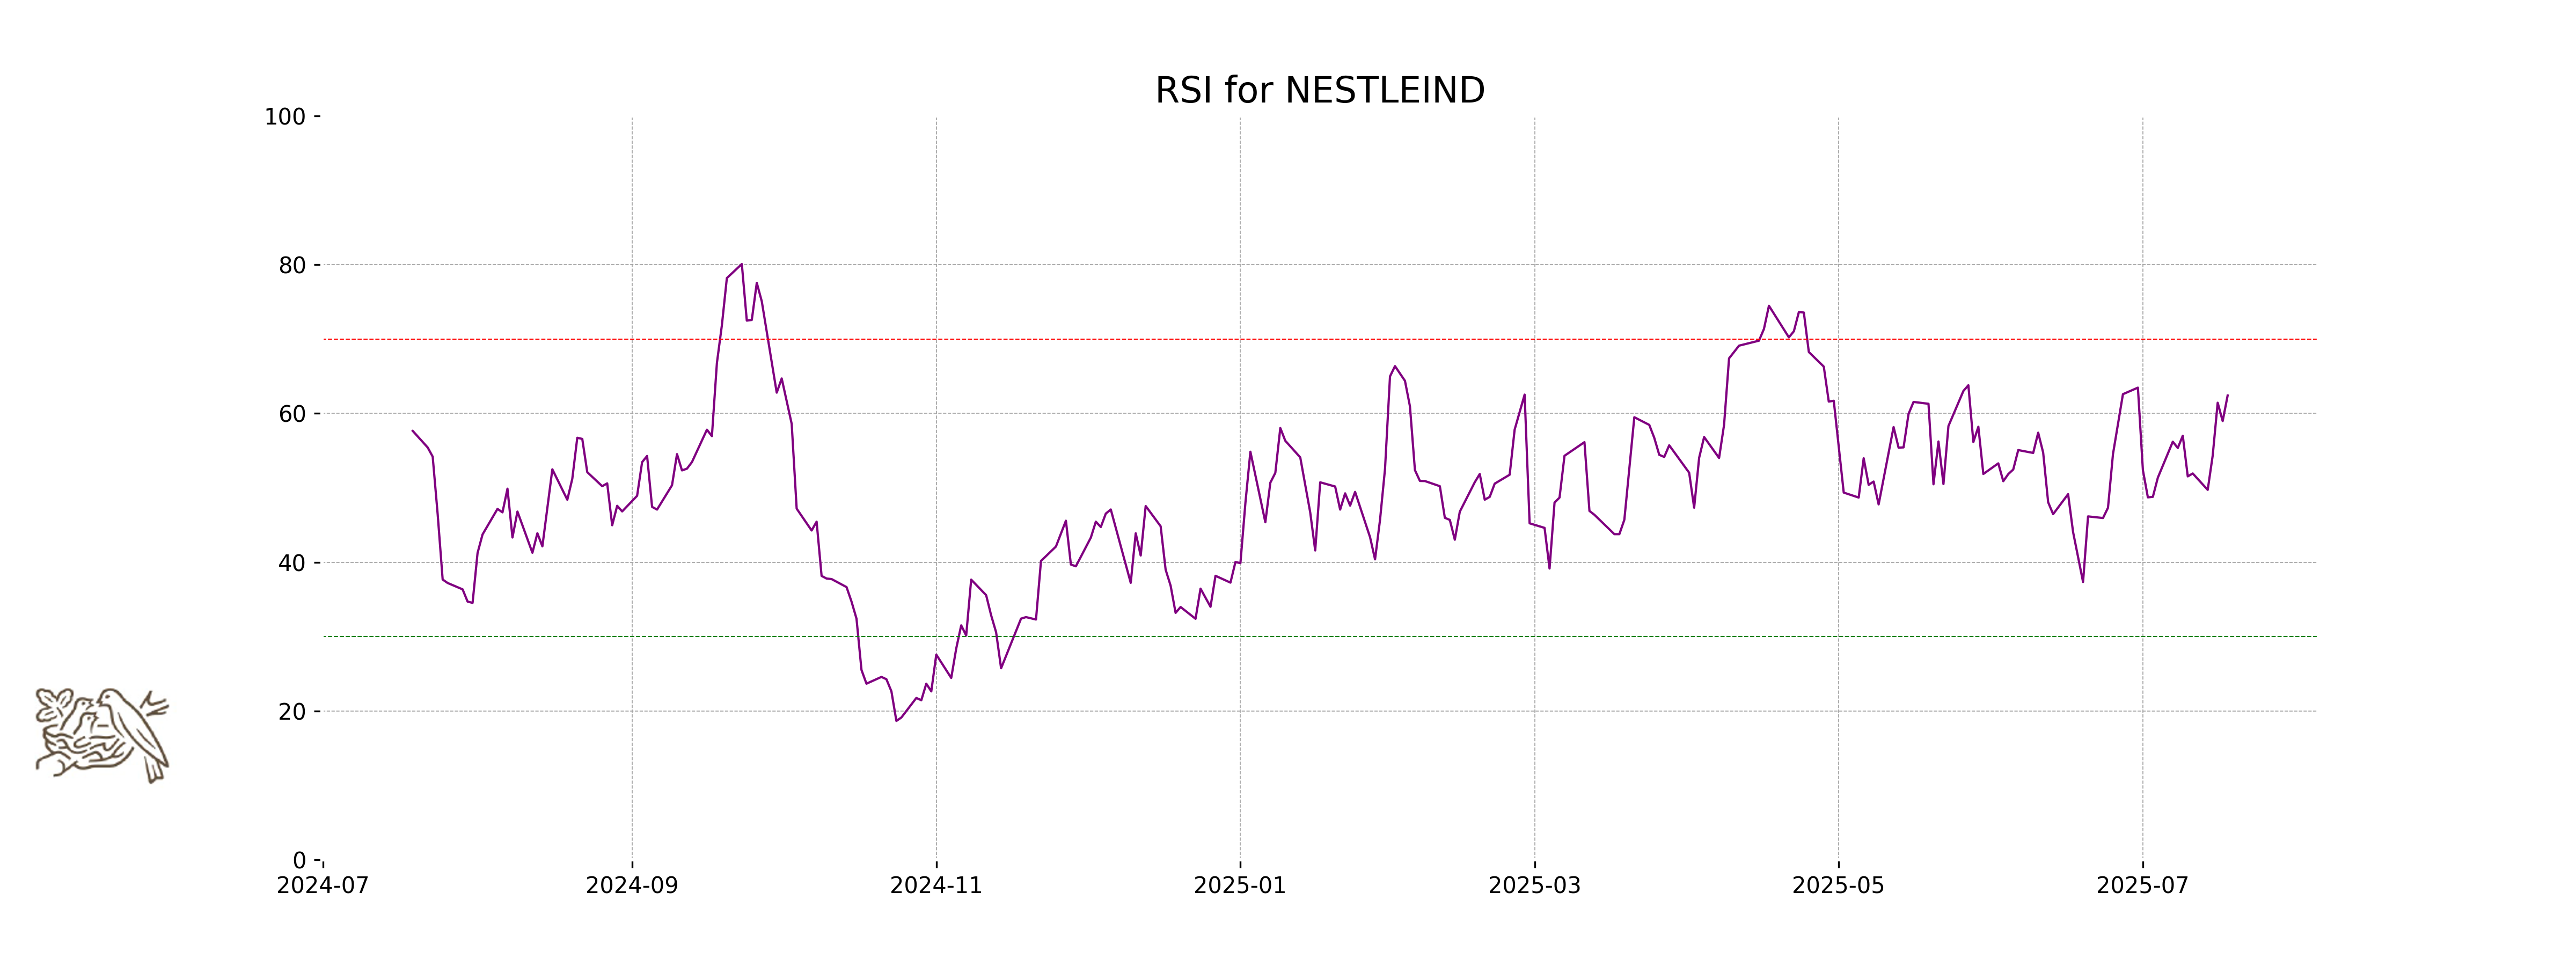
RSI Analysis
Nestle's current RSI (Relative Strength Index) stands at 62.42, indicating a bullish momentum but nearing the overbought territory. Values above 70 suggest overbought conditions, while those below 30 indicate oversold; hence, the current RSI suggests that the stock is approaching an overbought status, suggesting potential caution for new buyers.
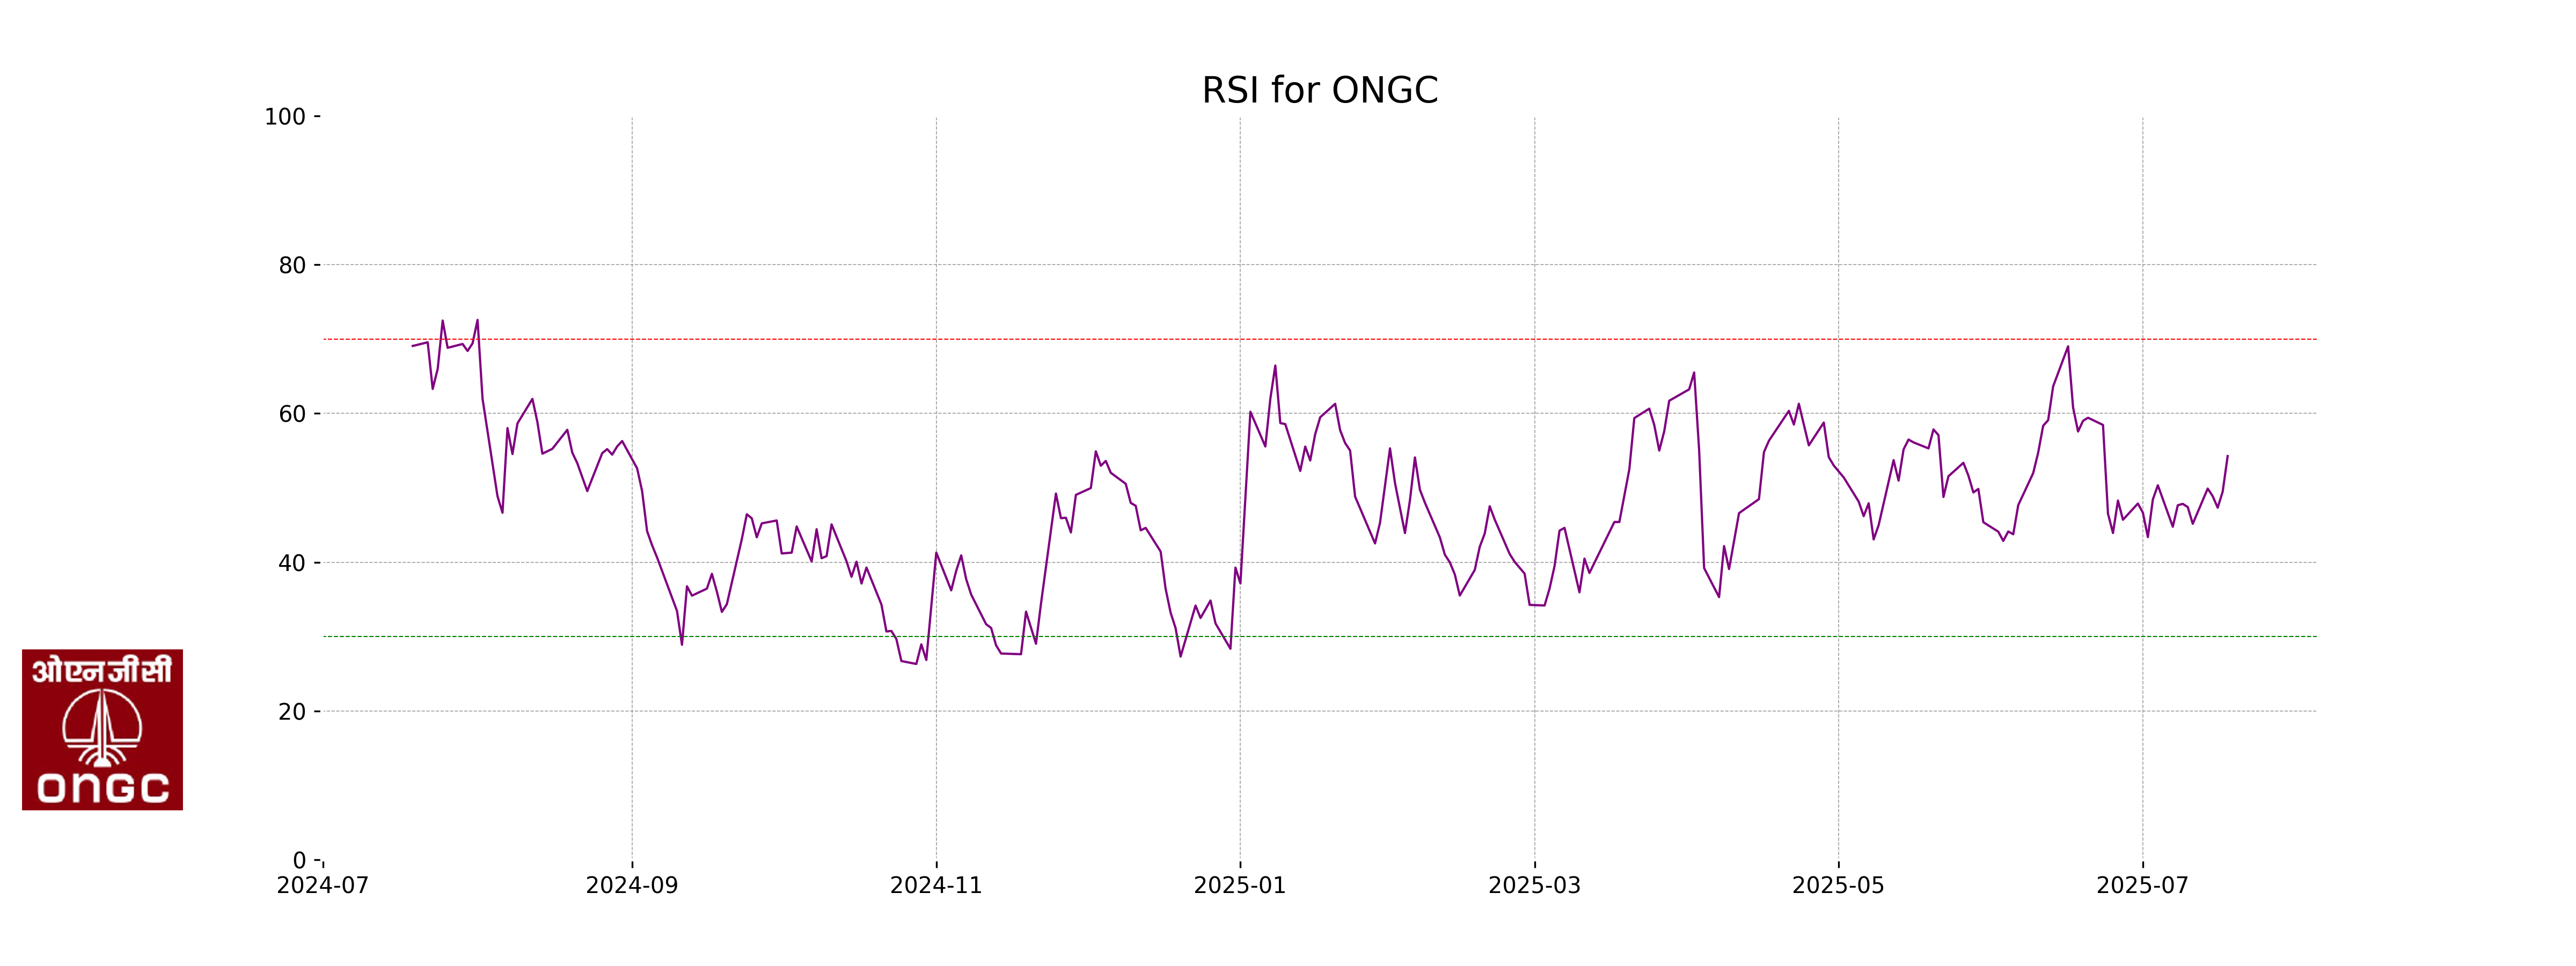
Analysis for ONGC - July 18, 2025

ONGC Performance ONGC opened at 244.74 and closed at 246.31, representing a 1% increase with a points change of 2.44. The stock's RSI of 54.27 suggests a neutral momentum, while its MACD value is slightly negative. With a PE ratio of 8.55 and a market capitalization over 3 trillion, ONGC remains a significant player in the Indian energy sector.
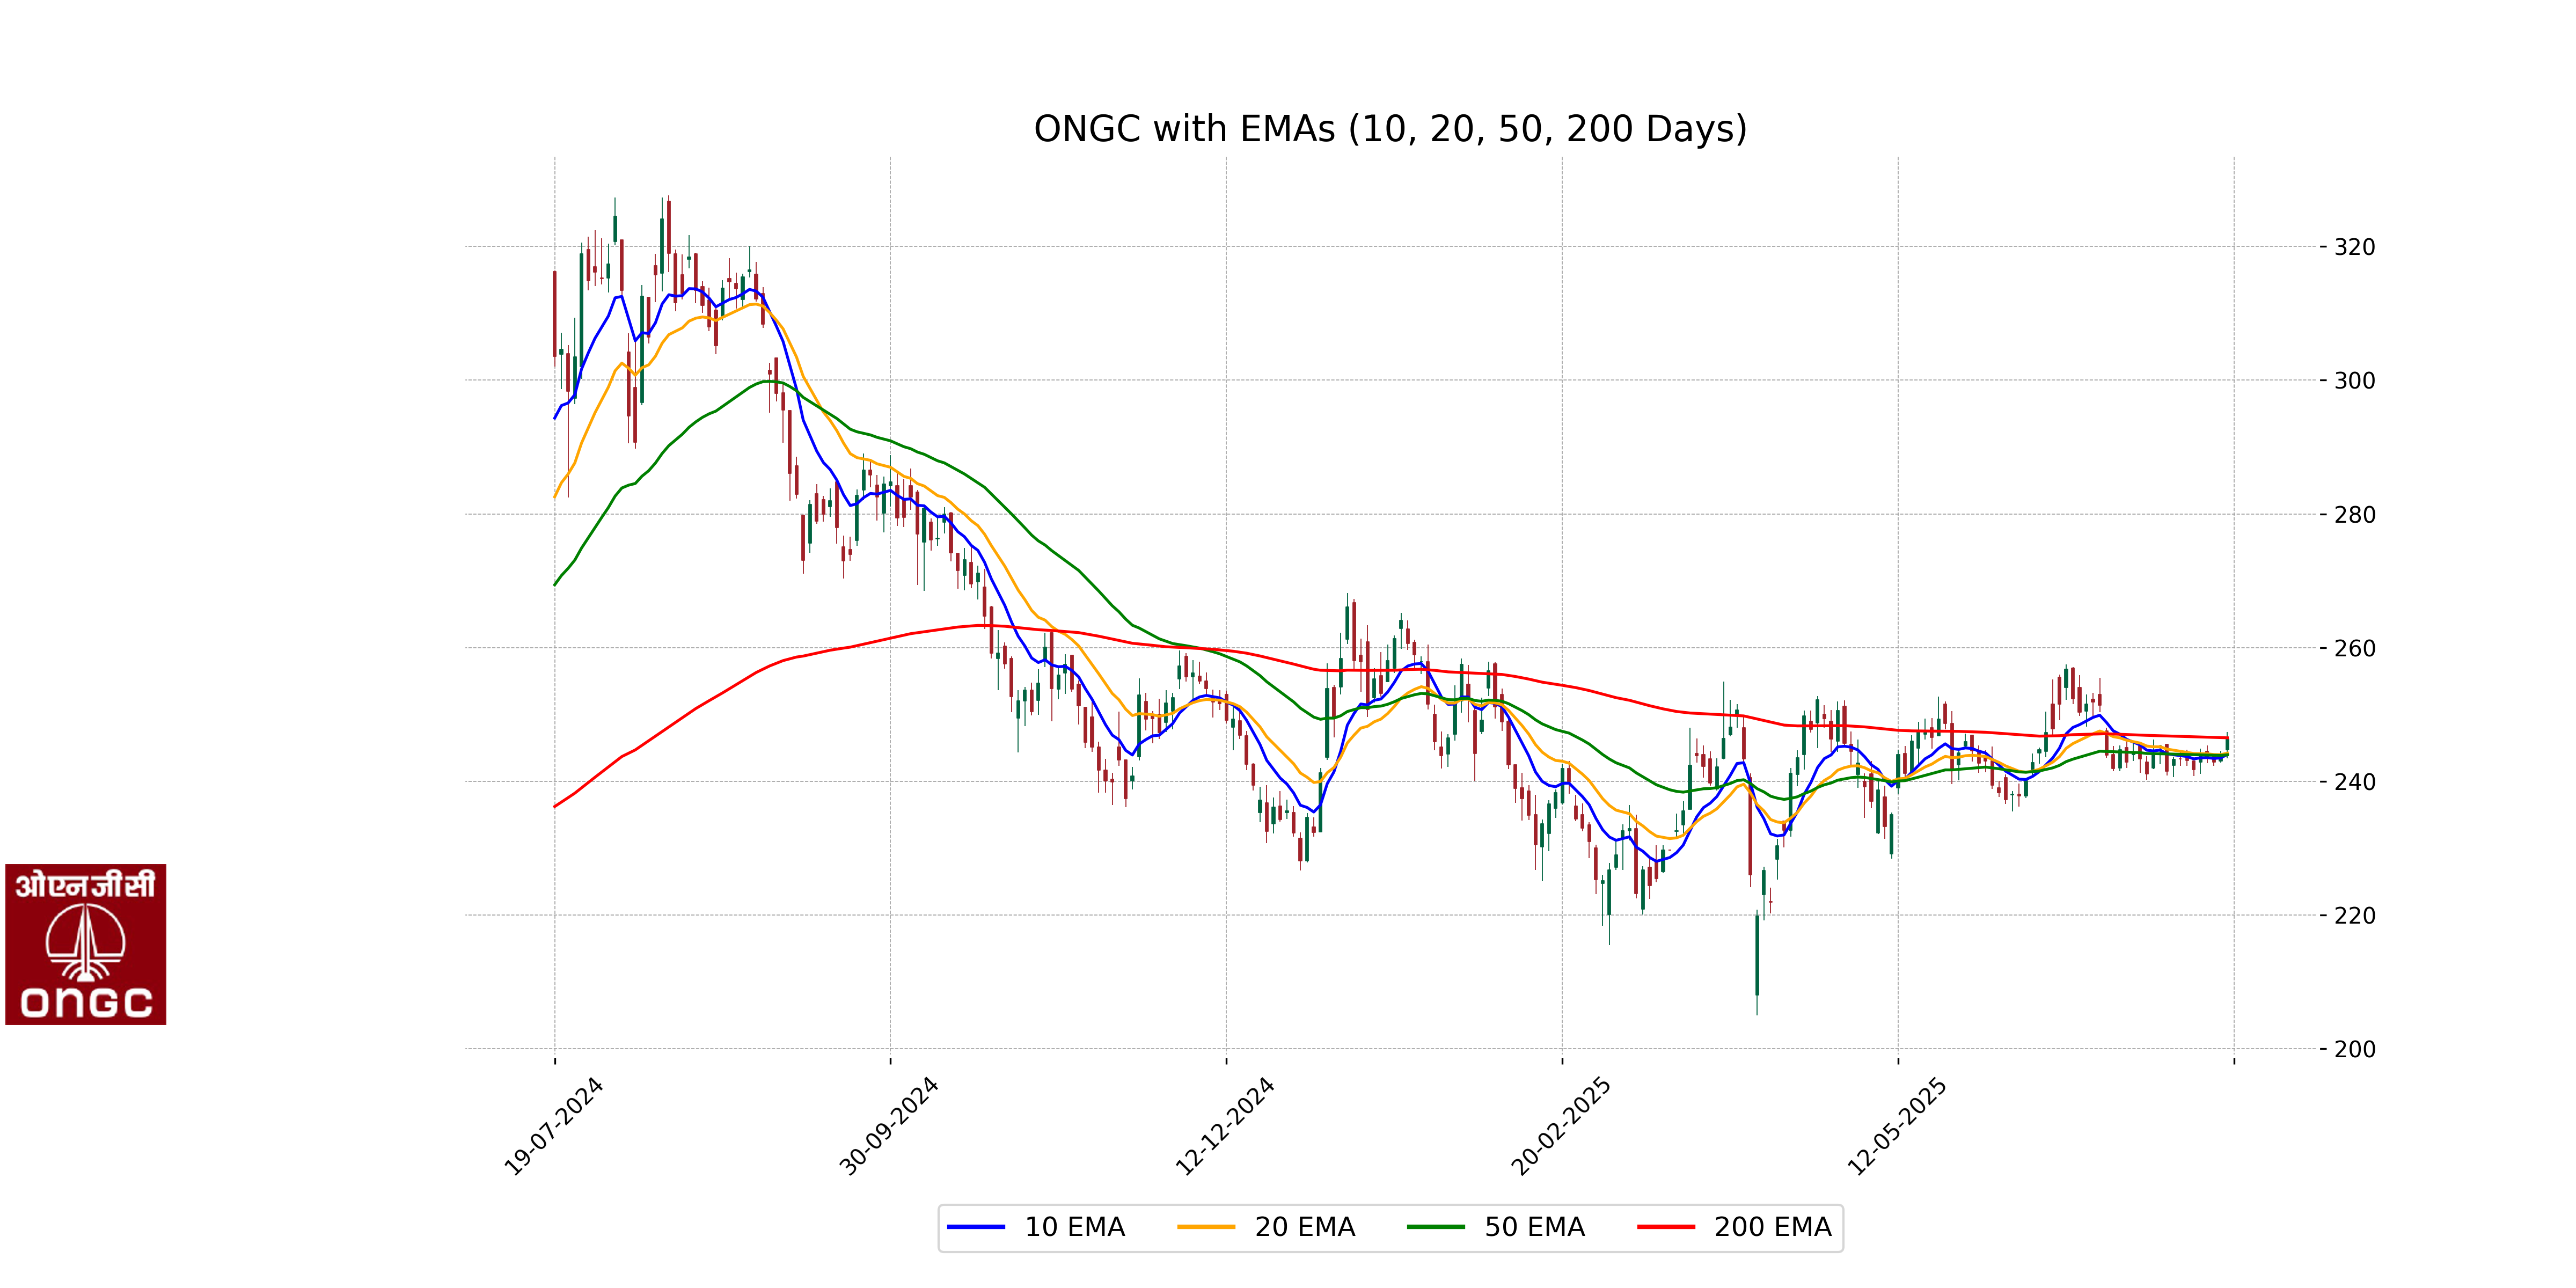
Relationship with Key Moving Averages
The closing price of ONGC at 246.31 is above the 50-day EMA of 243.96 and the 10-day EMA of 244.01, suggesting short-term bullish momentum. However, it is slightly below the 200-day EMA of 246.50, indicating some upper resistance in the longer-term trend.
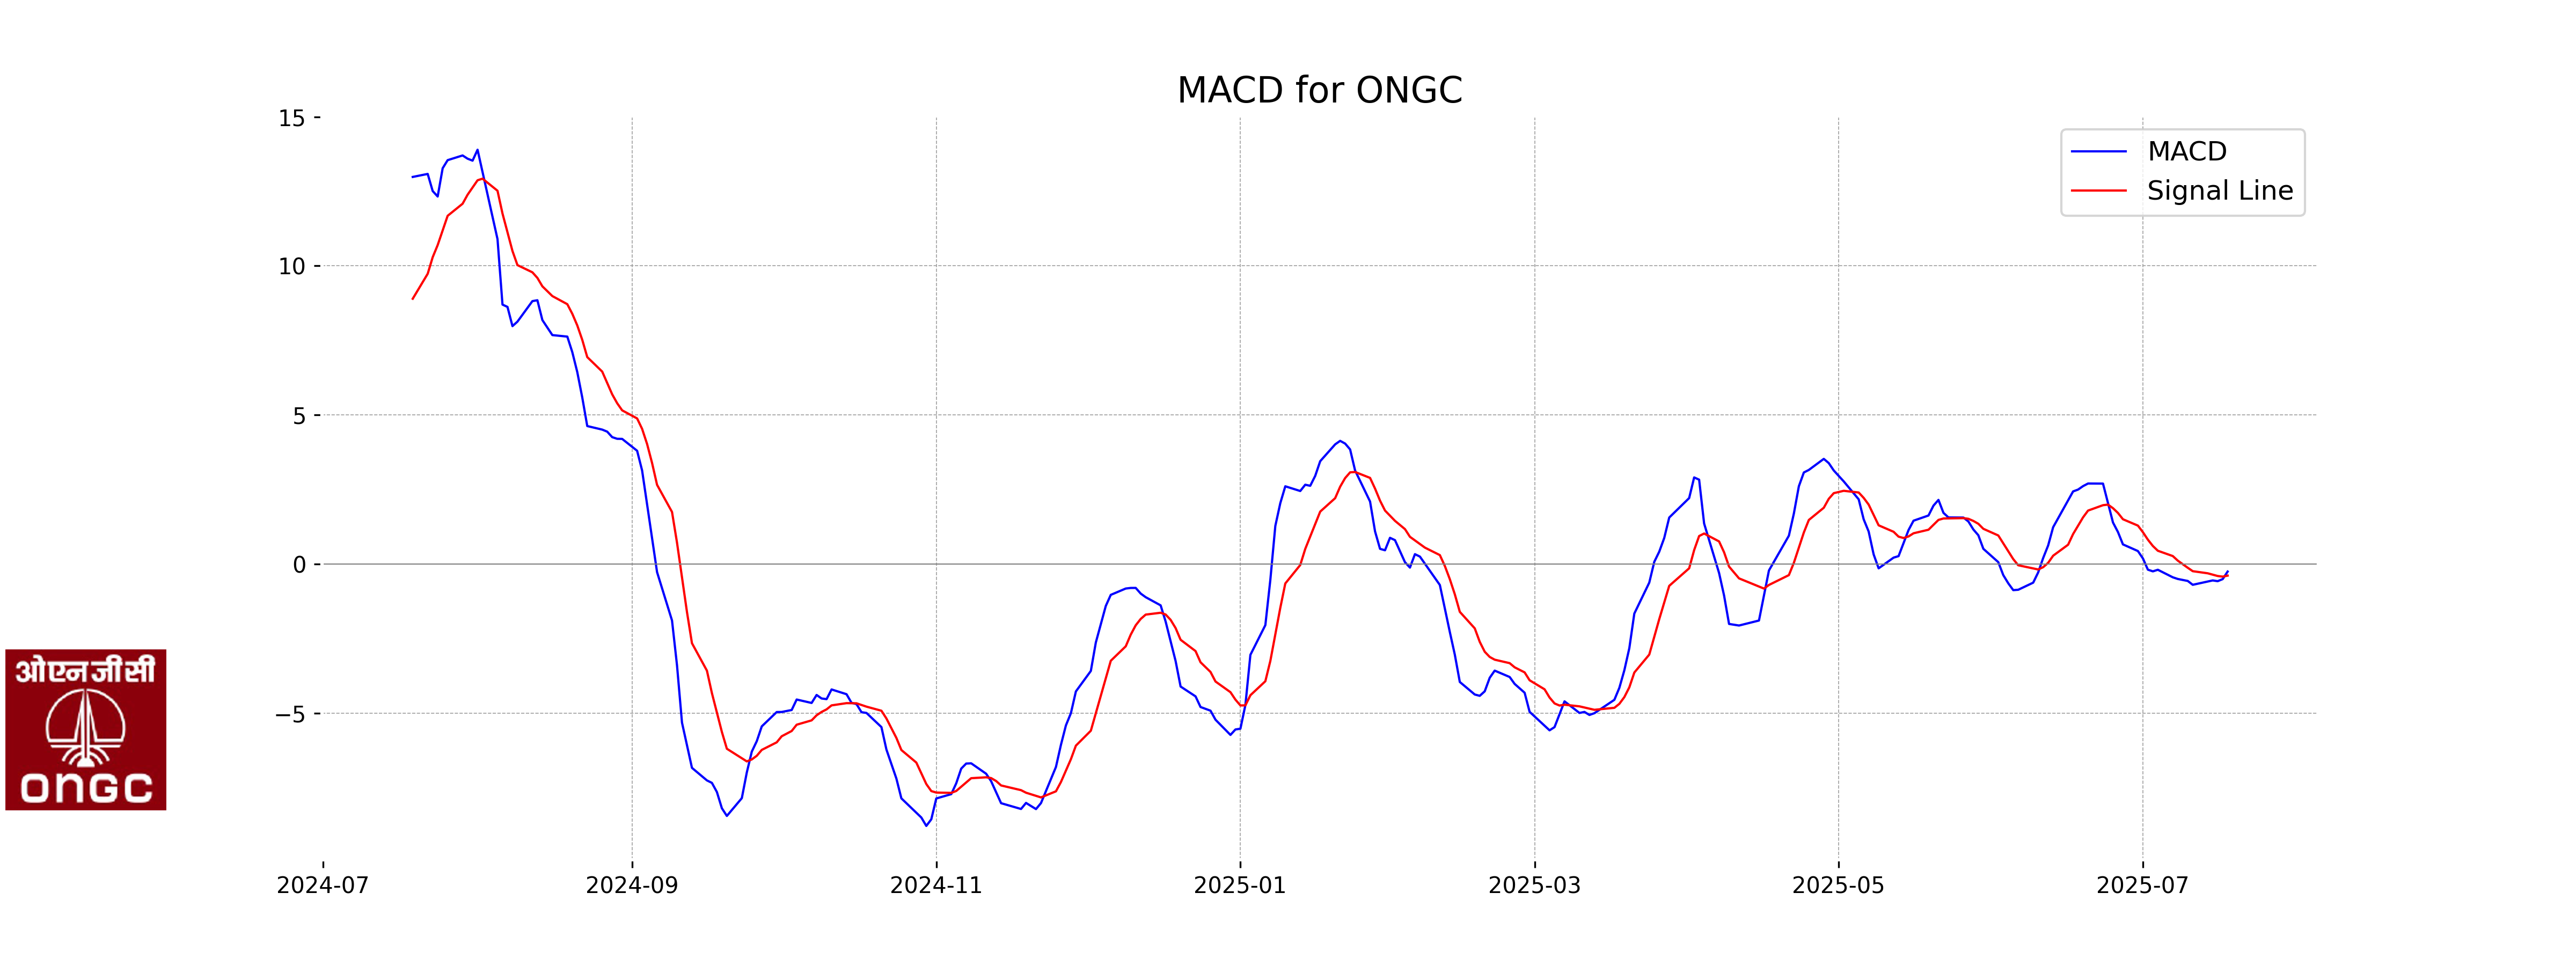
Moving Averages Trend (MACD)
The MACD value for ONGC is -0.2536, which is higher than the MACD Signal of -0.3898. This suggests potential bullish momentum as the MACD line is crossing above the signal line, although the overall value is still negative indicating a cautious outlook.
RSI Analysis
The RSI for ONGC stands at approximately 54.27, which indicates a neutral position, suggesting that the stock is neither overbought nor oversold. This level is within the typical range that signals a balanced momentum, so no significant bullish or bearish trends are strongly indicated at the moment.
Analysis for Tata Steel - July 18, 2025

Tata Steel opened the trading session at 160.10 and closed at 162.37, witnessing a 1.54% increase from the previous close of 159.90. The stock shows an upward momentum with its 10 EMA and RSI at 58.41, indicating a positive trend. Tata Steel operates in the Basic Materials sector, specifically in the Steel industry in India.
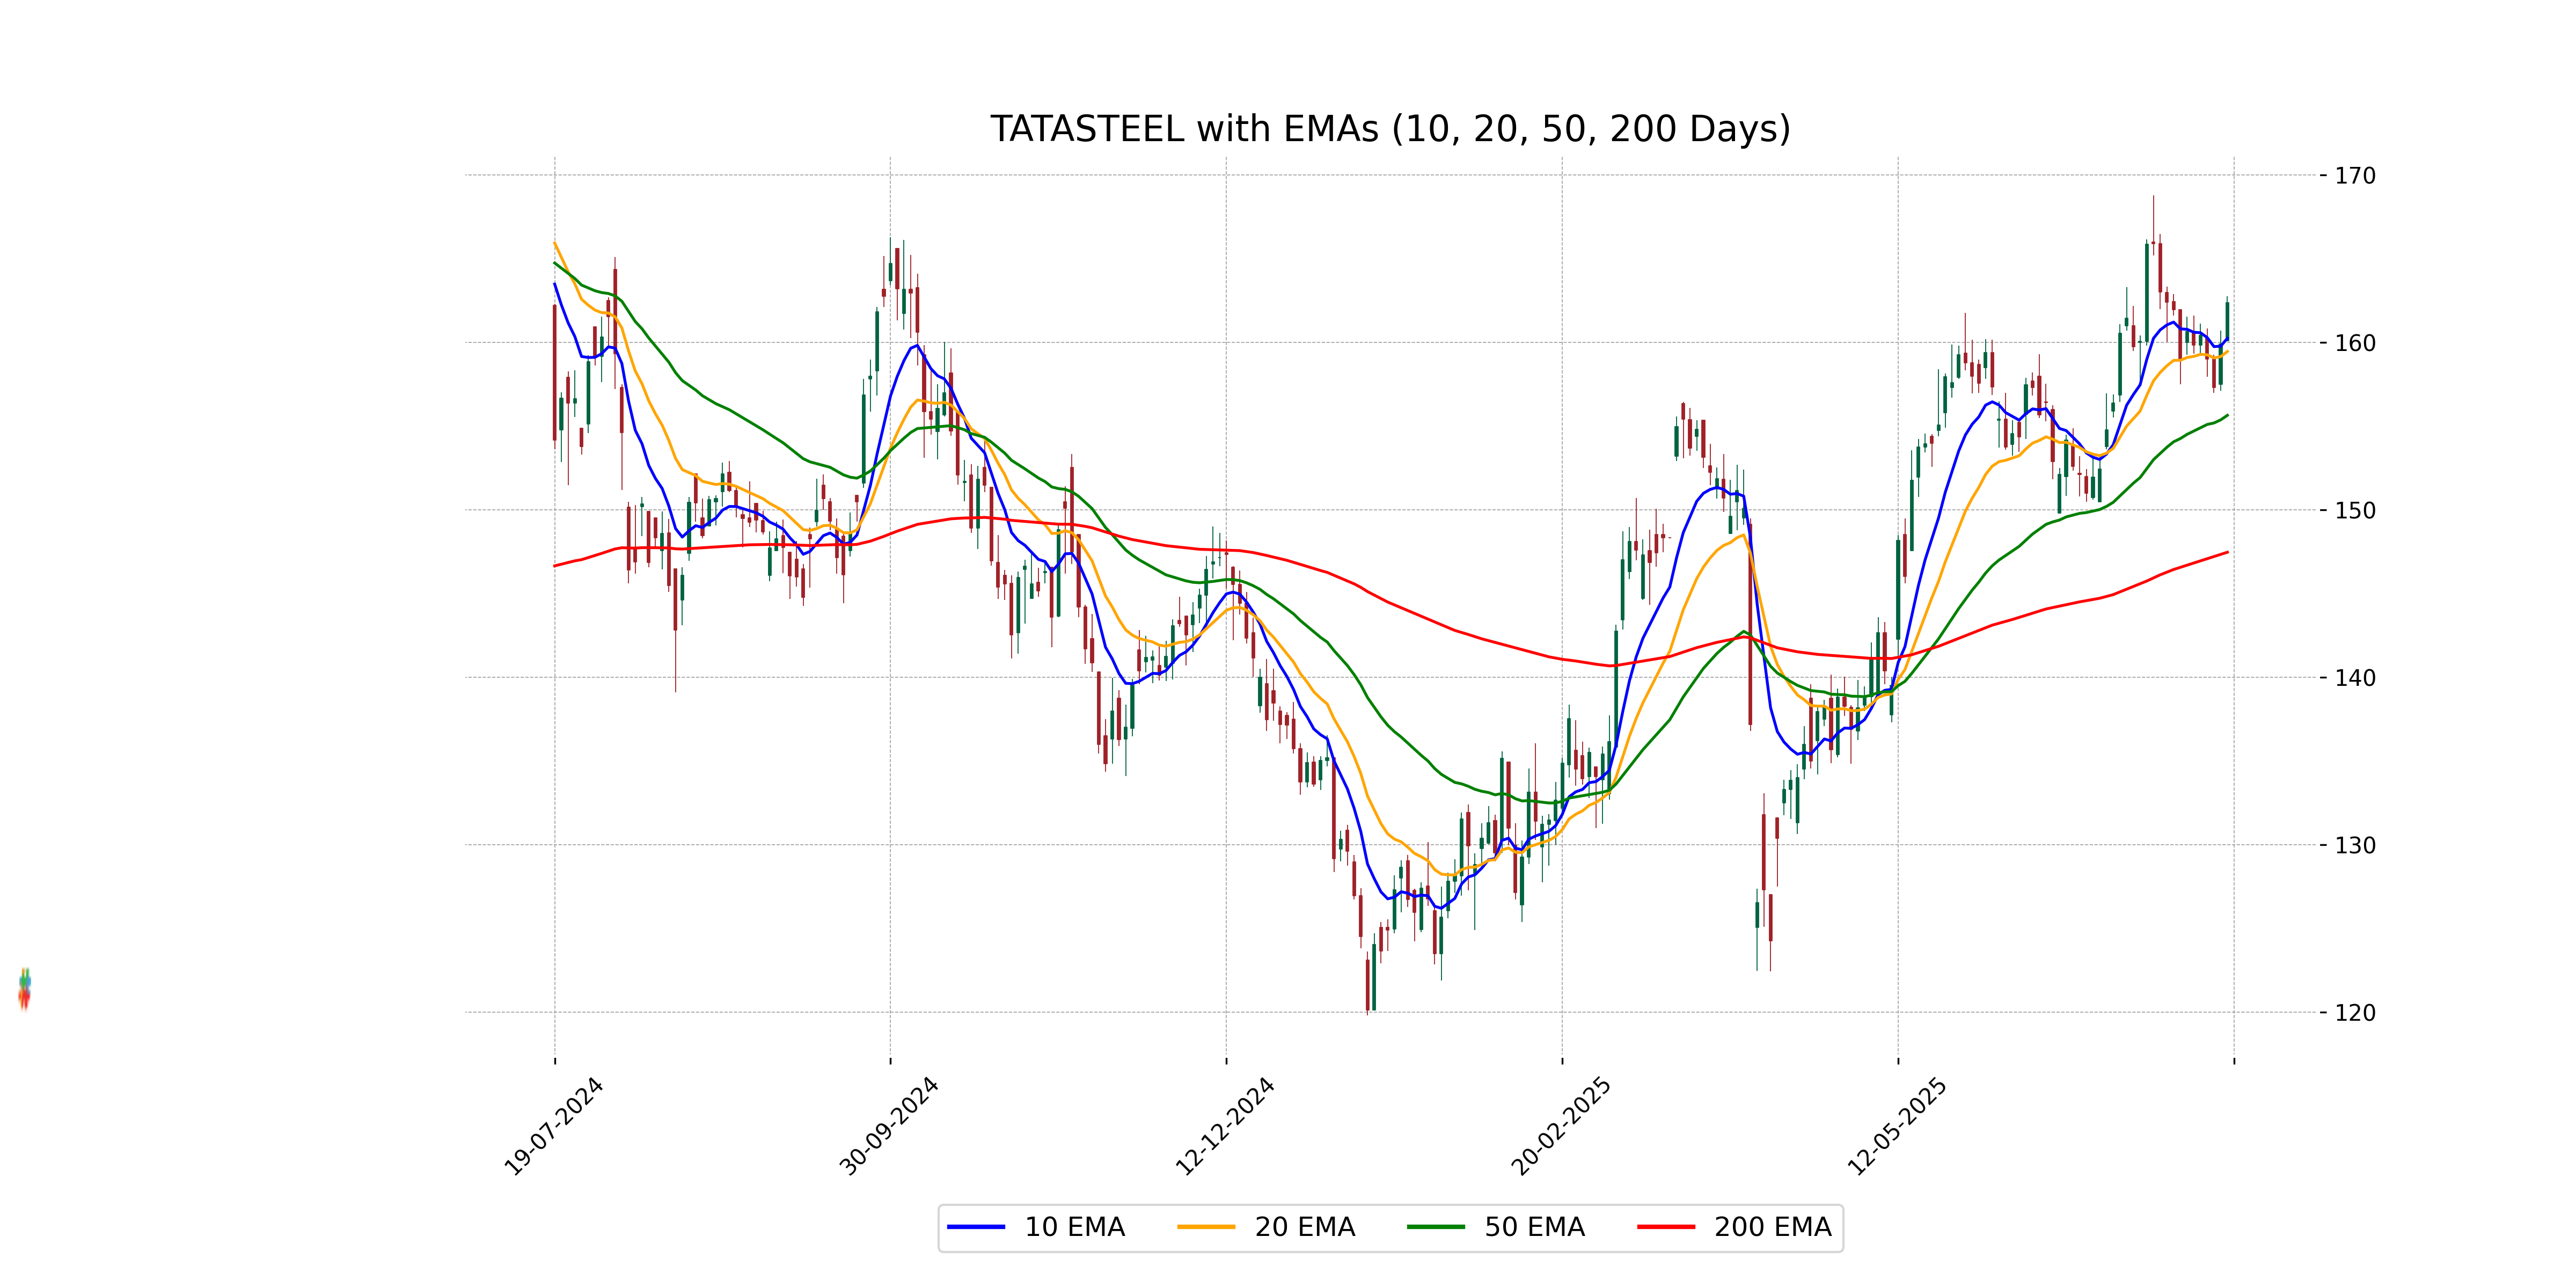
Relationship with Key Moving Averages
Tata Steel's current close price of 162.37 is above its 50-day EMA of 155.65 and its 200-day EMA of 147.48, indicating a bullish trend, while it is also above the 10-day EMA of 160.25 and the 20-day EMA of 159.47. This suggests positive momentum in the short to medium term.
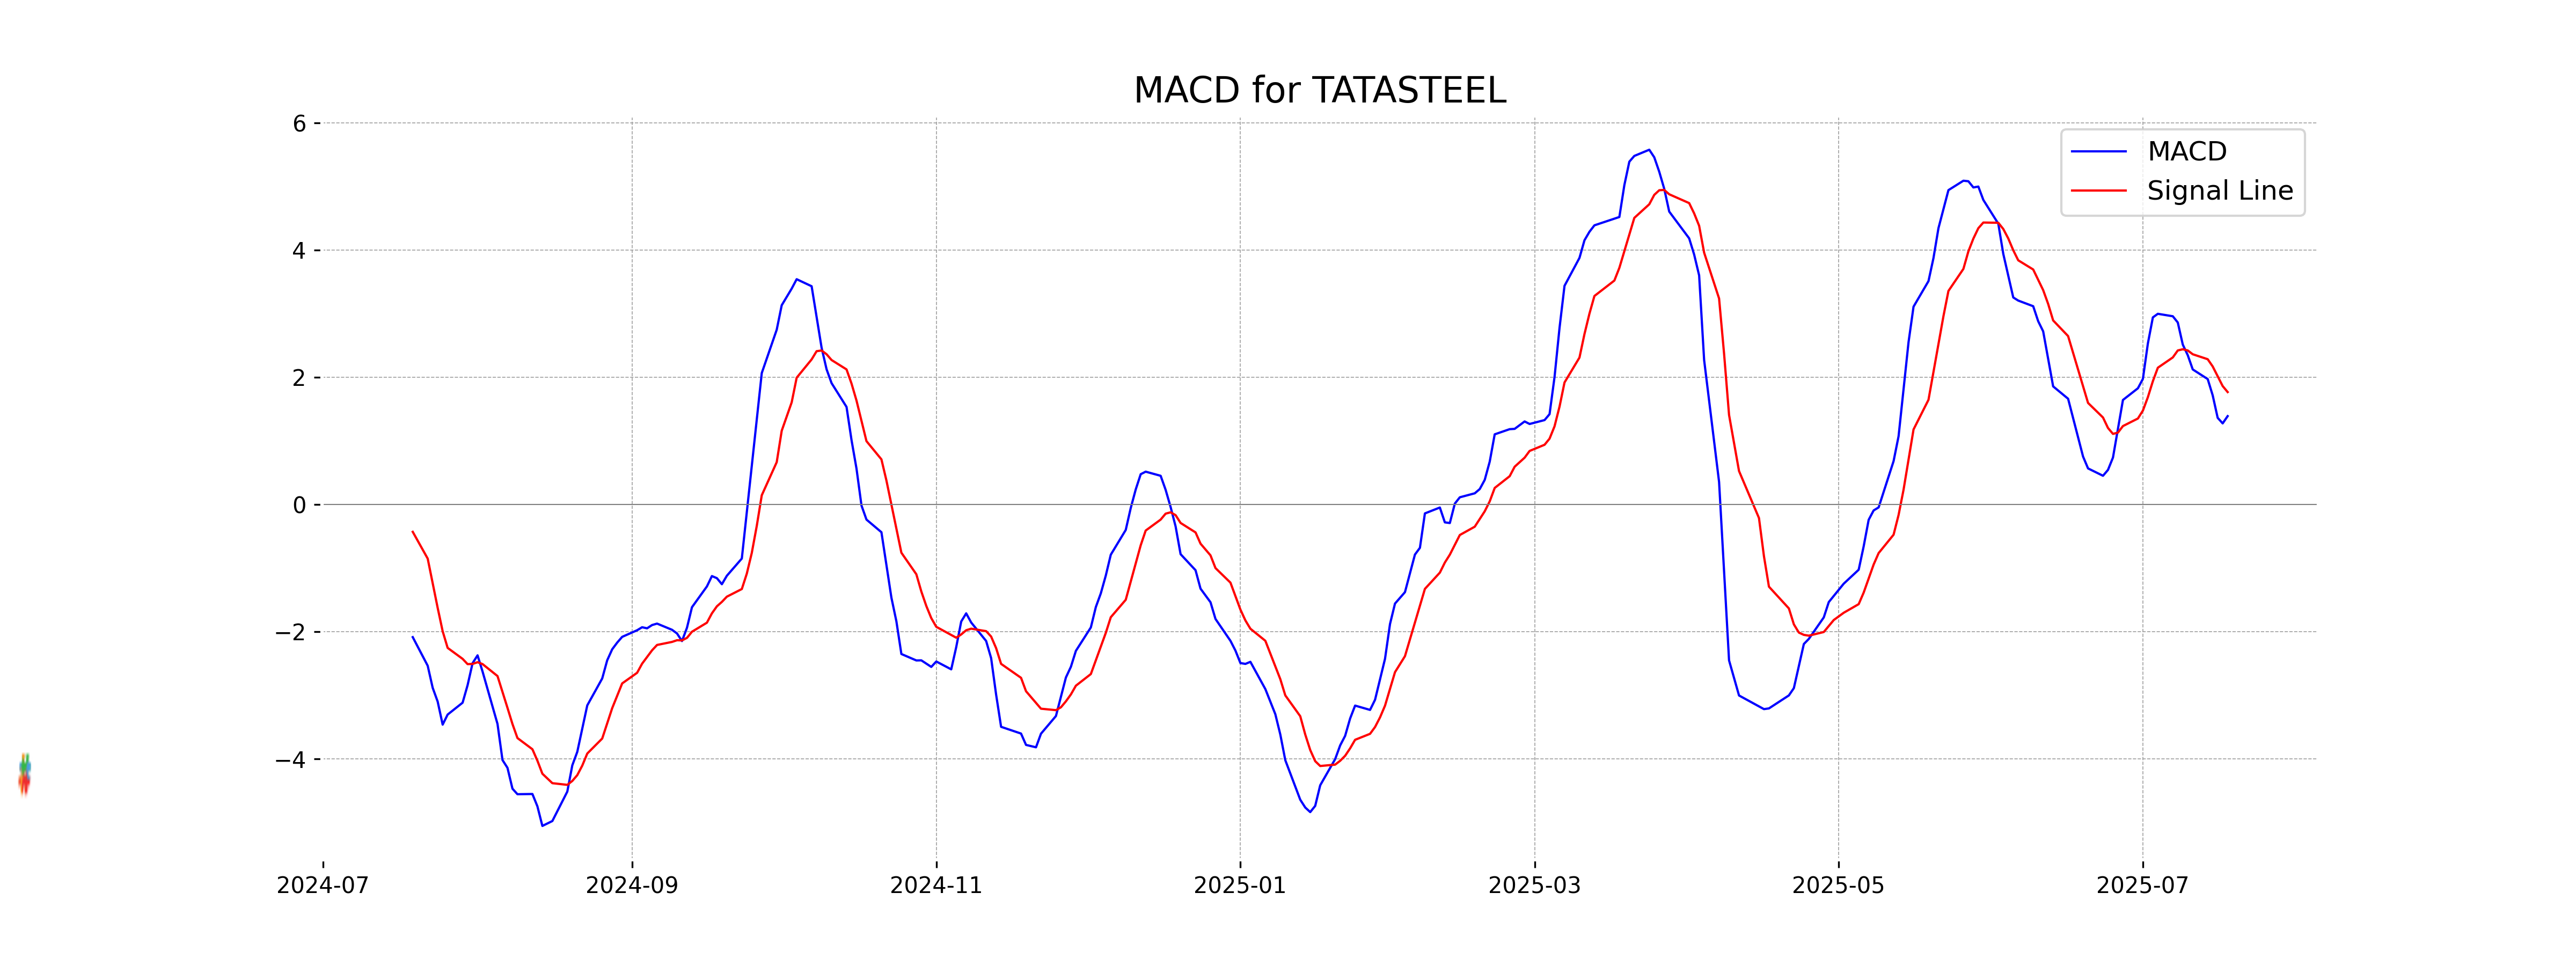
Moving Averages Trend (MACD)
Tata Steel's MACD value of 1.3879, which is lower than the MACD Signal of 1.7661, suggests a bearish sentiment in the current trend. Although the MACD is positive, the downward crossover indicates a potential weakening in upward momentum, warranting cautious monitoring for any trend reversals.
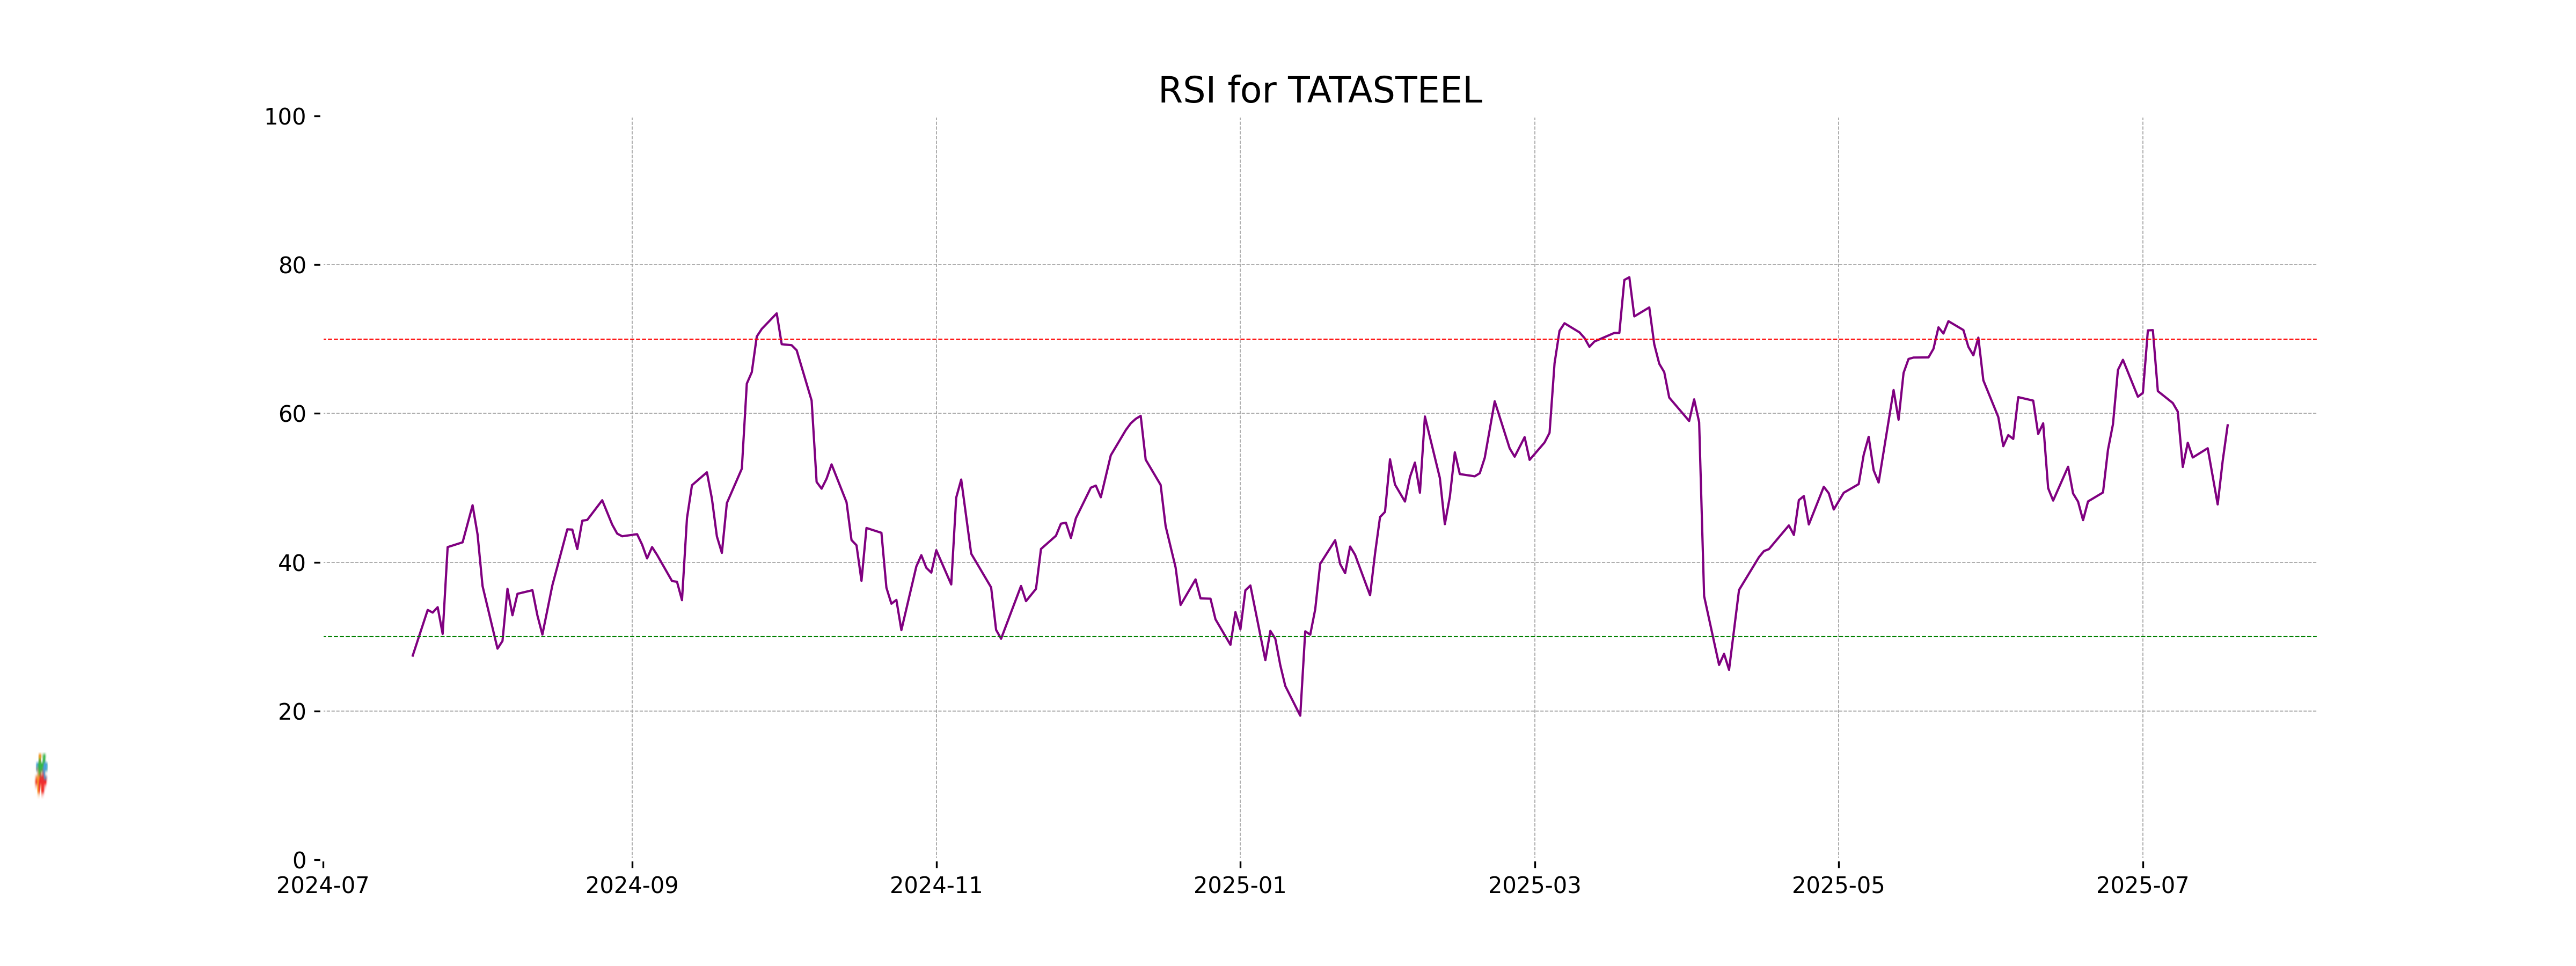
RSI Analysis
Tata Steel's RSI is 58.41, indicating neutral momentum but approaching overbought conditions, as RSI values over 70 typically suggest overbought levels. Monitoring for potential trend changes is advisable if the RSI moves significantly higher.
Analysis for Wipro - July 18, 2025

Performance Overview of Wipro Wipro opened at 268.60 and closed at 266.95, showing a positive daily change of 2.44%. The company's market cap stands at 2,870,753,624,064 INR with a PE ratio of 21.34 and an EPS of 12.51. The RSI of 56.23 indicates moderate momentum, while the MACD suggests potential for continued movement within the positive trend.
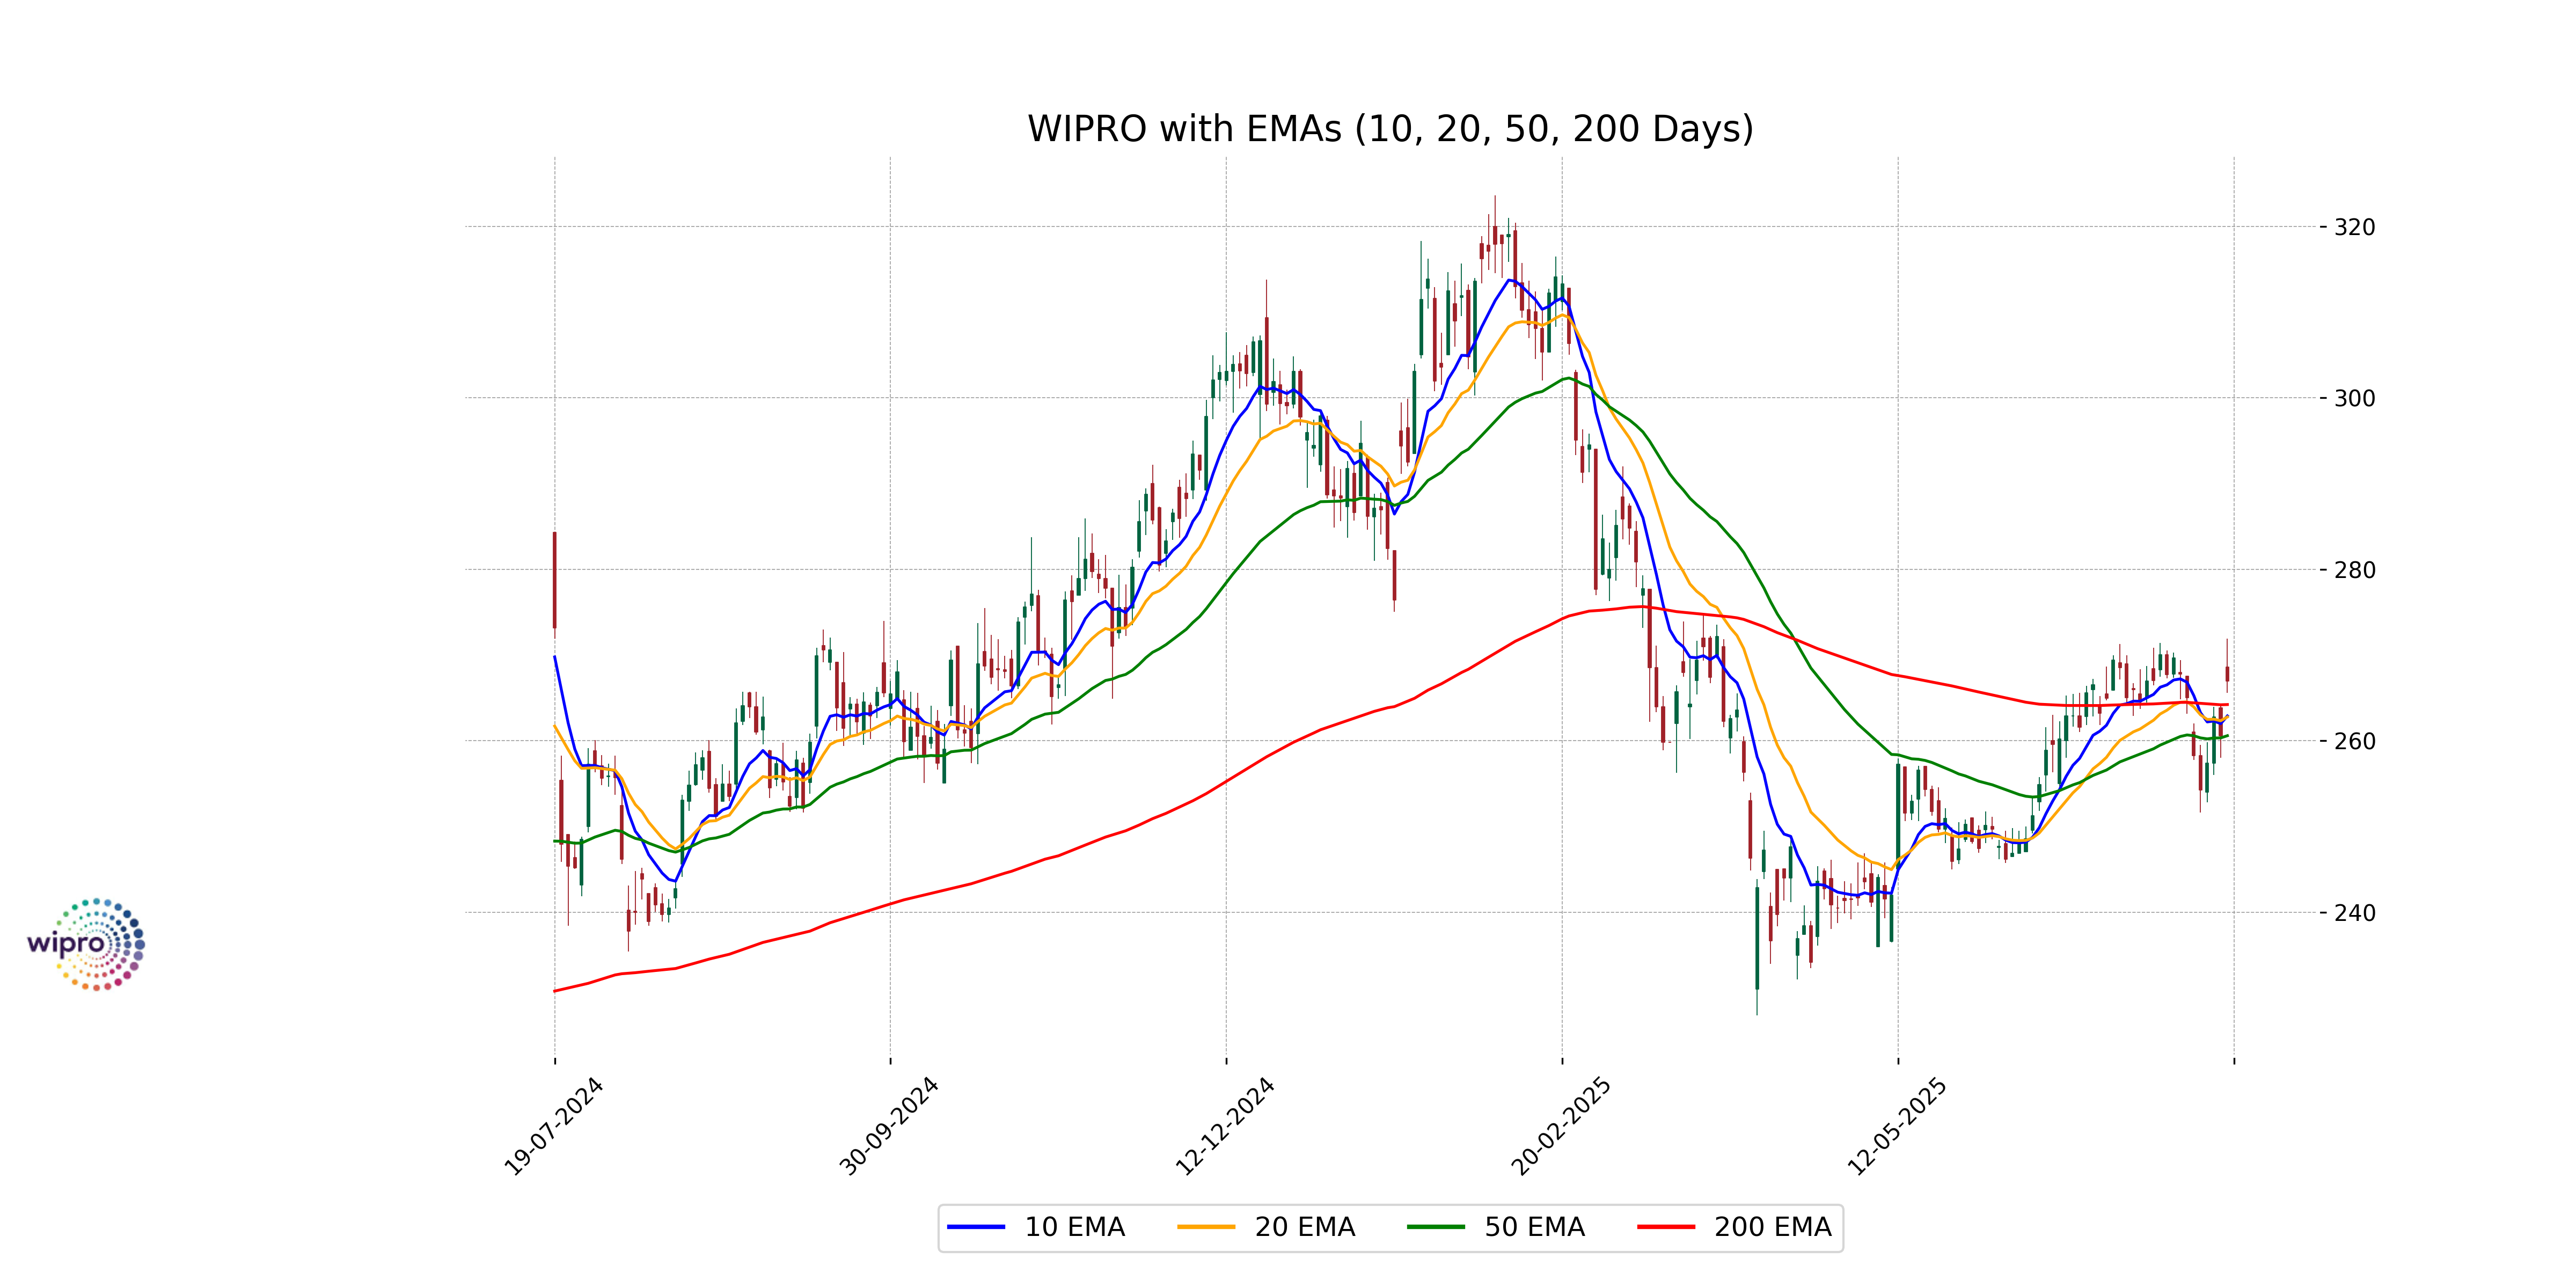
Relationship with Key Moving Averages
The current closing price of Wipro at 266.95 is above its 50-day EMA of 260.60 and its 10-day EMA of 262.90, indicating a short-term bullish trend. However, it is lower than the 200-day EMA of 264.23, suggesting a potential long-term bearish perspective.
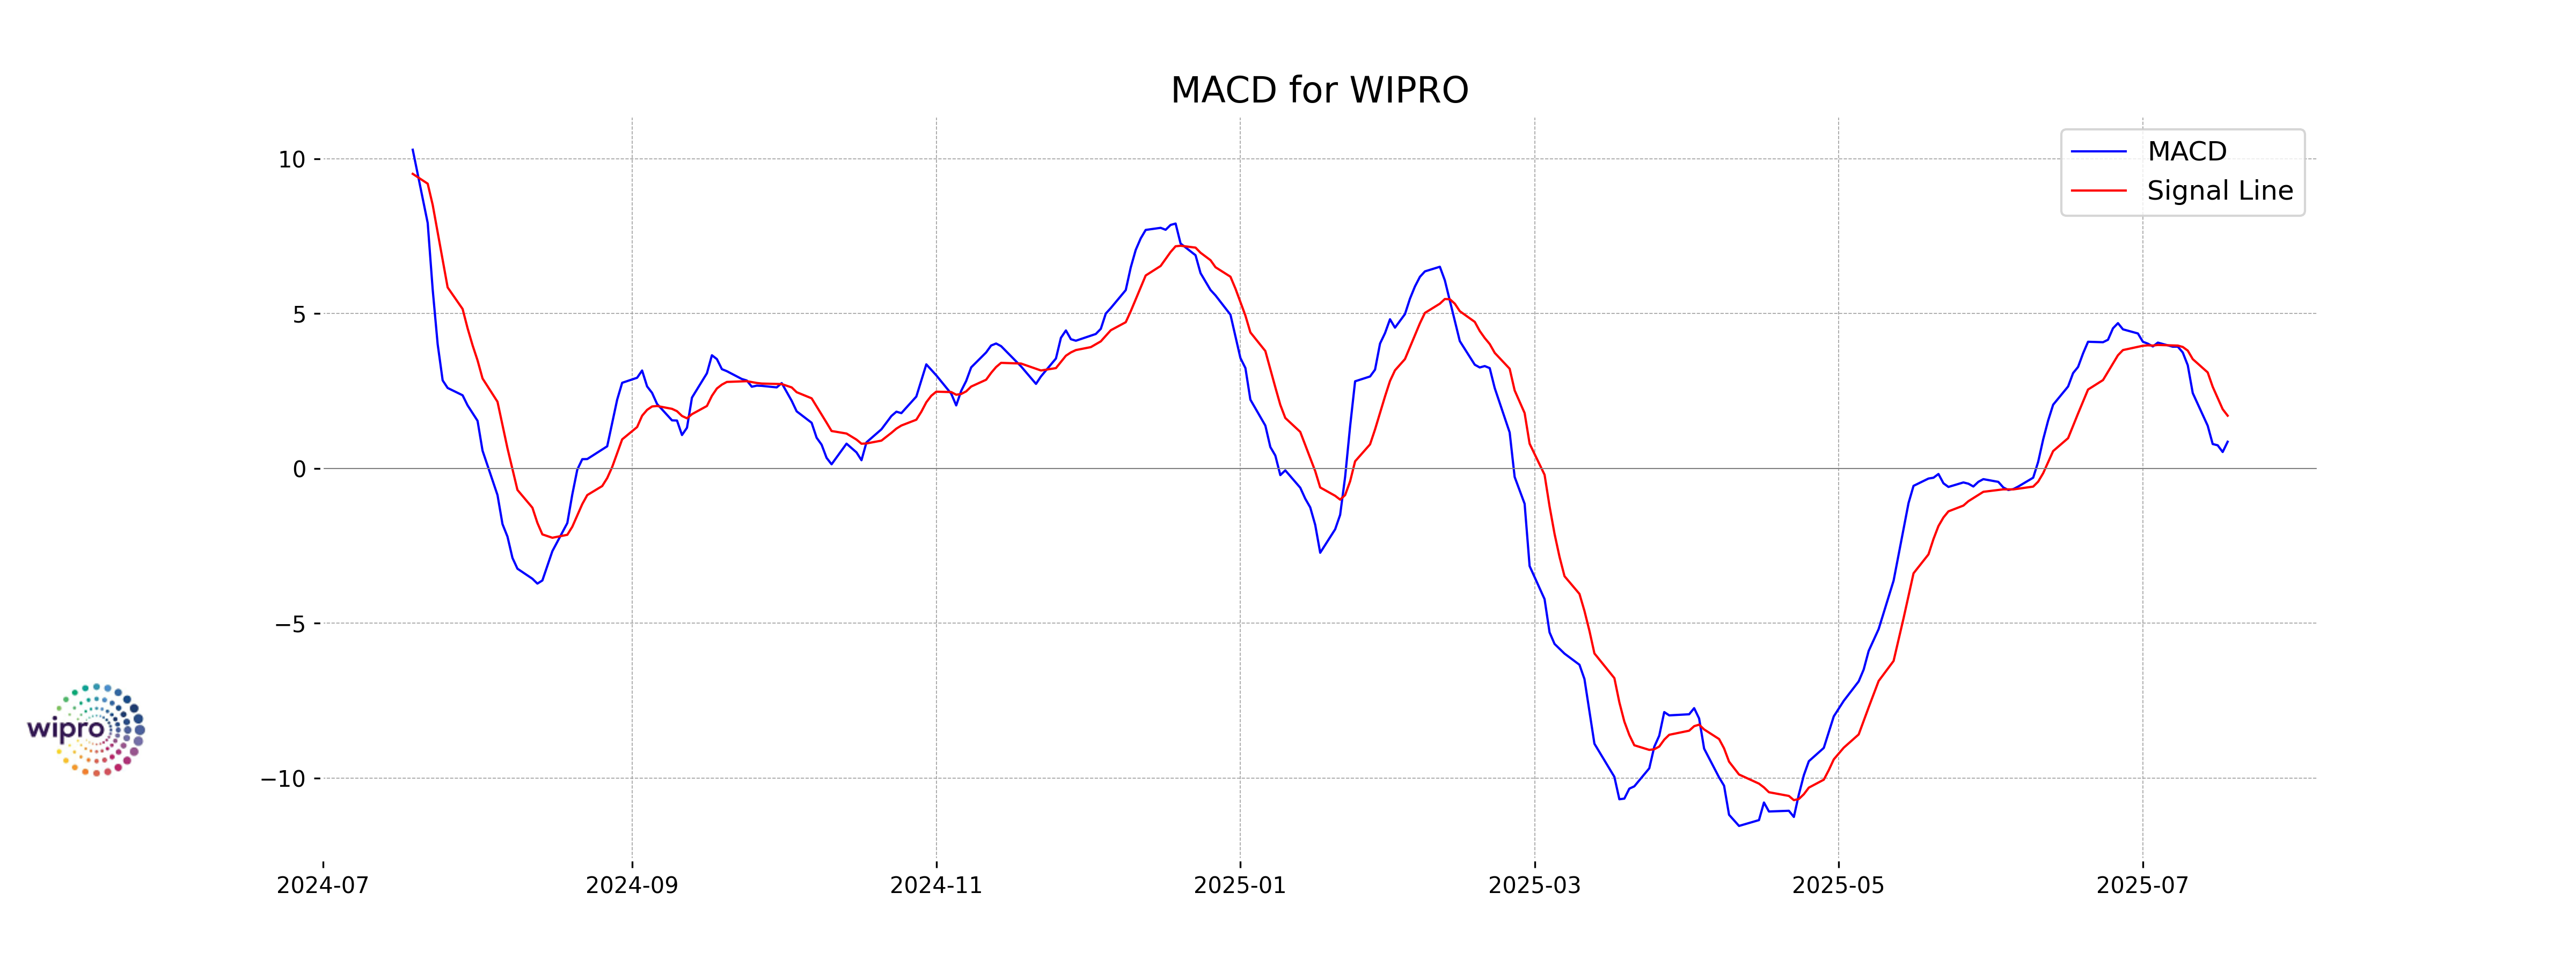
Moving Averages Trend (MACD)
The MACD for Wipro is currently 0.8618, with a MACD Signal line of 1.7032. Since the MACD is below the Signal line, it indicates a potential bearish trend or a weakening bullish momentum. Traders should watch for any further divergence to confirm a potential trend reversal.
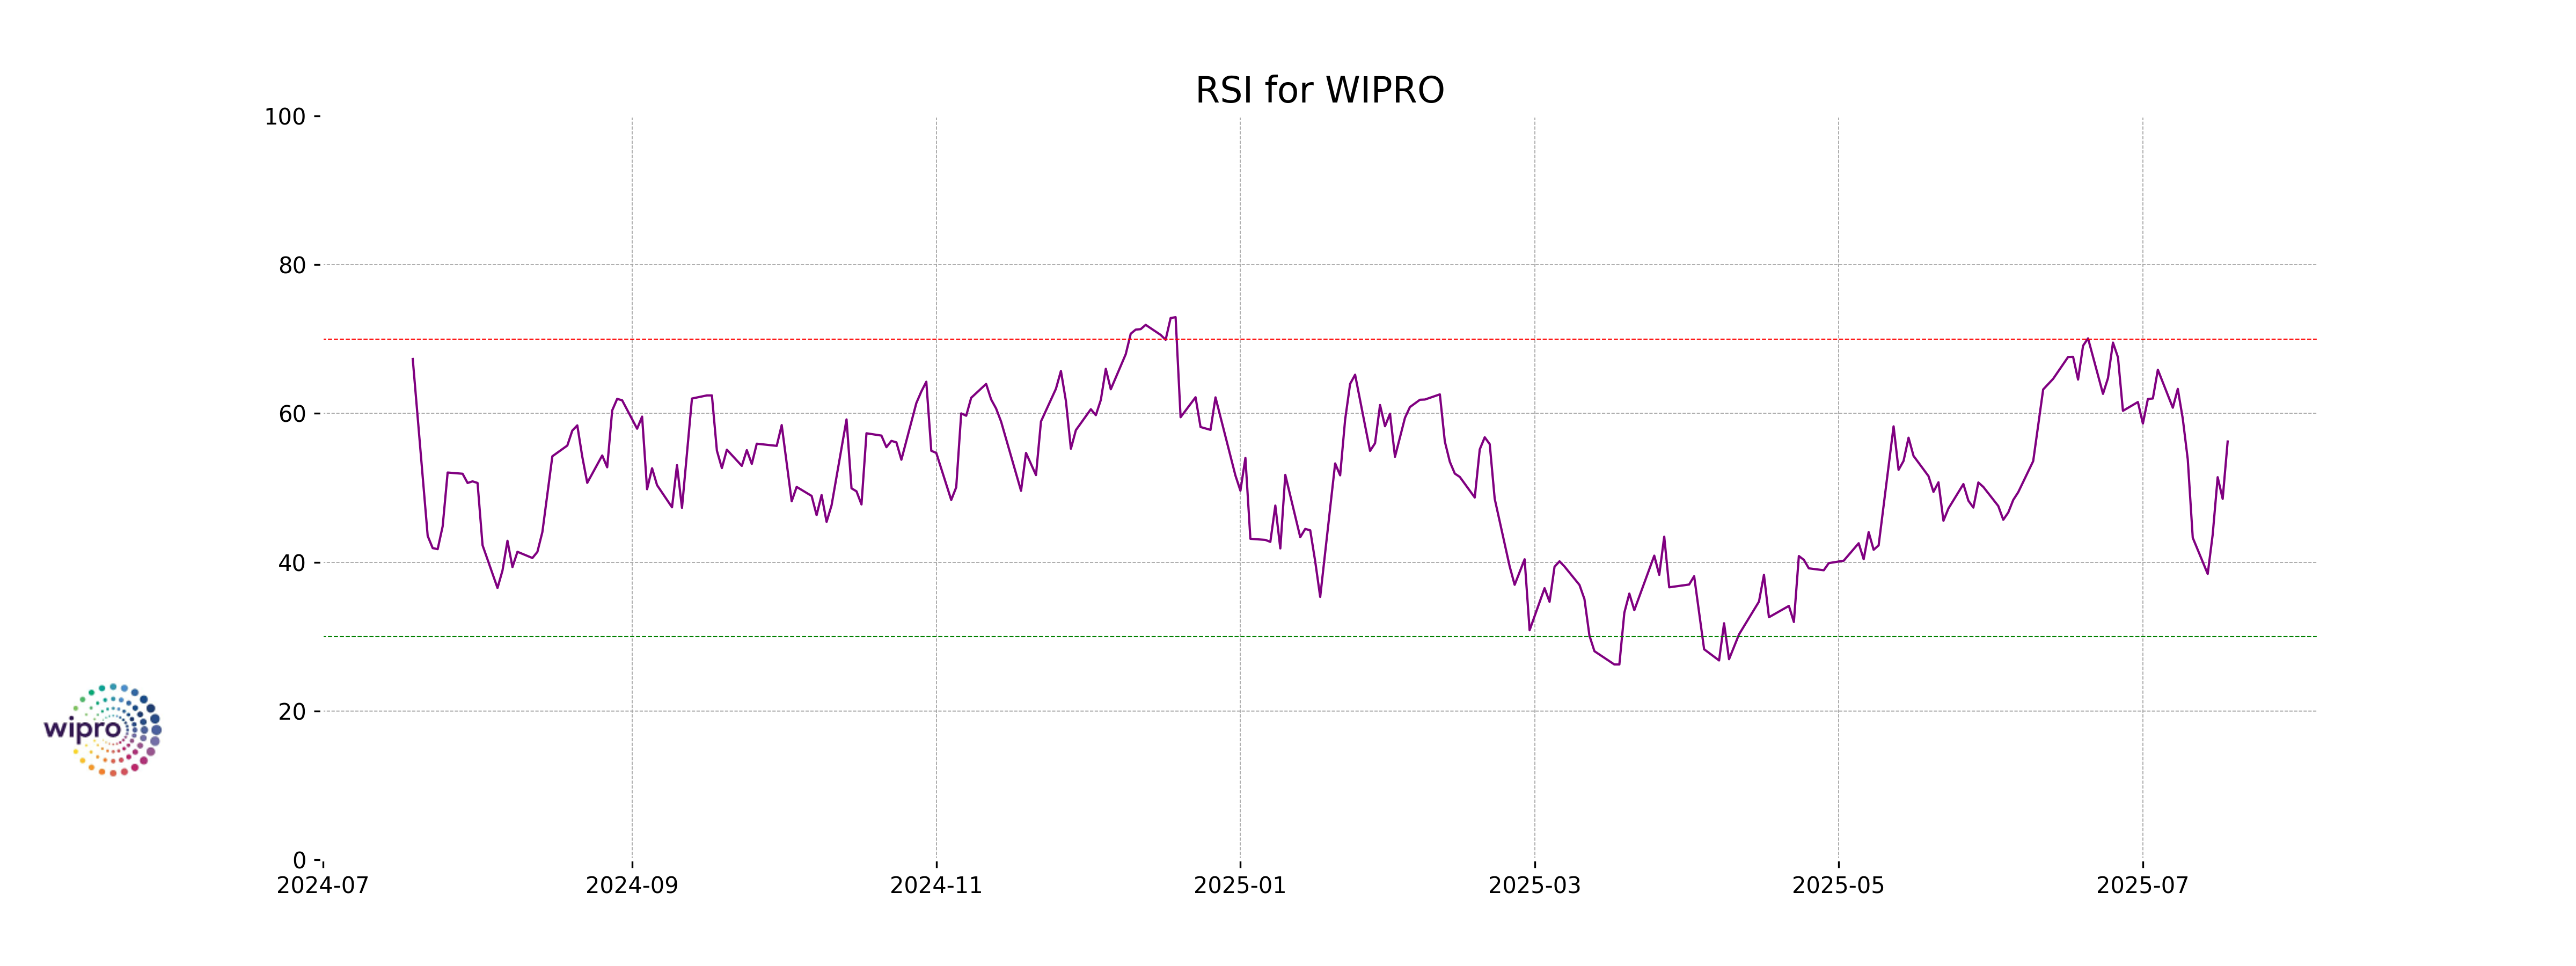
RSI Analysis
Wipro's RSI of 56.23 suggests that the stock is currently in a neutral region. This value indicates that the stock is neither overbought nor oversold, signaling a balance of upward and downward momentum. Investors might view this as a point where they could consider both potential buying and selling opportunities, depending on other market factors and personal investment strategies.
Up Next
Top 5 Nifty 50 gainers today – July 18, 2025: Biggest stock moves

Step-by-step guide to apply for a mortgage loan online with minimal documentation

Honda Activa 6G: Everything You Need to Know Before Buying

How much does a ULIP plan really cost? A break-down of all charges

Centre plans to borrow Rs 8.20 lakh cr from market in first half of FY27

Reliance denies buying Iranian oil amid US sanctions waiver

More videos

Premium petrol price up Rs 2, industrial diesel up Rs 22; no change in normal petrol, diesel rates

India's GDP expected to register over 8 pc growth in Sep-Dec: Report

Govt announces seven measures to help boost exports

RBI keeps interest rates on hold after US trade deal boosts outlook

RBI proposes to compensate customers up to Rs 25,000 loss due to fraud

RBI raises GDP growth projection of Q1, Q2 of FY27

RBI pauses rate cuts, retains interest rate at 5.25 pc

Rupee jumps 122 paise to close at 90.27 against US dollar on India-US trade deal

Stock markets cheer India-US trade deal: Sensex, Nifty surge 2.5 pc

UPI transactions hit record high of Rs 230 lakh crore in 2025-26 till Dec: Govt