


Highlights
- Bullish Trend: Nifty 50 gained upward momentum.
- Key Signals: RSI >50 shows demand; near 70 suggests overbought.
- Market Optimism: Positive MACD divergence boosts confidence.
Latest news

Anant National University Hosts Open House 2026, Offering Aspiring Designers an Immersive Introduction to Design Education

Deakin University Ranked #1 Emerging Foreign University Campus, Strengthens India's Skilling Push

Himalayan Group of Professional Institutions Honours 5,000 Participants at National Scholarship Test Ceremony

After Rockstar, A New Story Redefines Heartbreak - Sourav Kalyan's Nargis-e-Mastana Leaves a Lasting Impact

Lord's Mark Secures Global Milestone in HIV Diagnostics, Joins Elite Group of Nine Worldwide

"Heartfelt gratitude for inviting me": PM Modi sends blessings to newlyweds in thoughtful response

Accenture rolls out microsoft 365 copilot to 7.4 lakh employees, reports major productivity gains

Railway Minister Vaishnaw shares Bullet train plan for South India, says it will transform connectivity
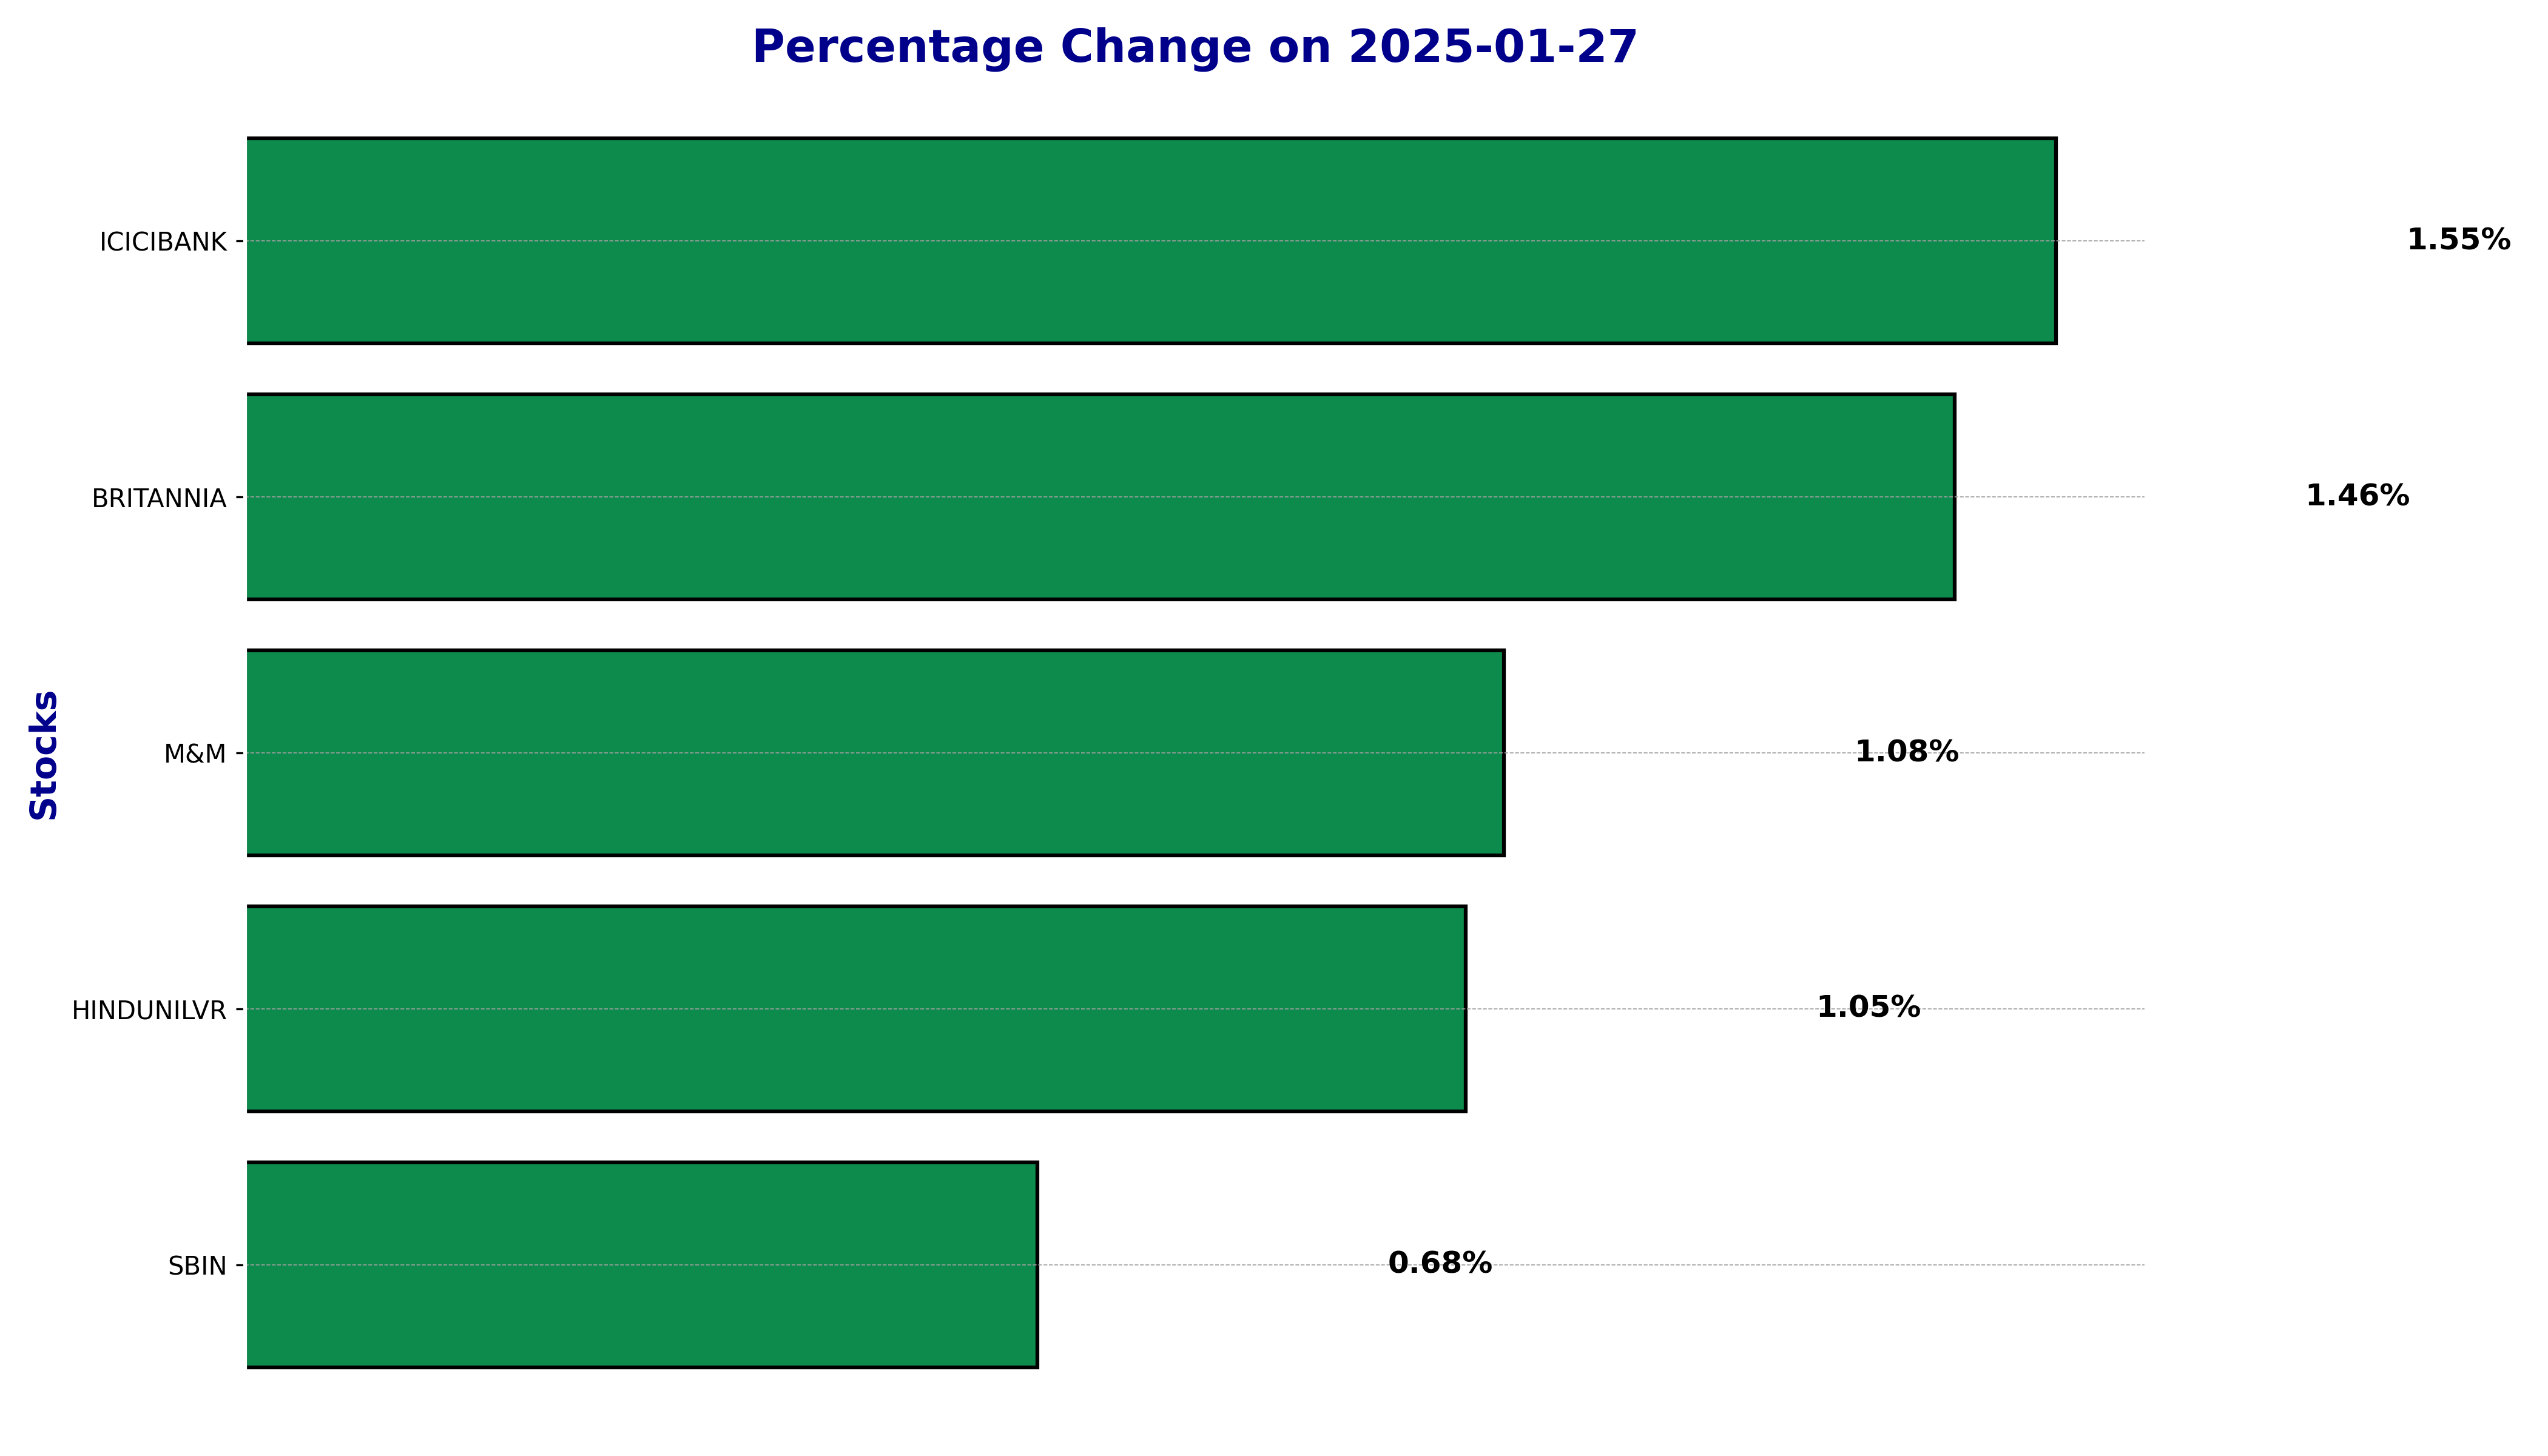
NSE Nifty 50 Top gainers: Who are the 5 Biggest Stock gainers Today January 27, 2025


In this article, we will explore the technical indicators of some of the high-performing stocks on the Indian stock market, including BRITANNIA, HINDUNILVR, ICICIBANK, M&M, and SBIN.
By looking at these stocks through the lens of key technical factors, we aim to better understand their price movements, trends, and potential future performance.
BRITANNIA January 27, 2025 Stock Performance:
- Open: 5103.65
- High: 5215.00
- Low: 5103.05
- Close: 5176.25
- Previous Close: 5101.55
- Percentage Change: 1.46%
- Points Change: 74.70
- Volume: 937,687

Relationship with Key Moving Averages:
The current closing price of 5176.25 is above the 10-EMA (4987.18), 20-EMA (4931.54), and 50-EMA (5003.84), indicating a short-term bullish trend. However, it is below the 200-EMA (5236.05), suggesting some resistance in the longer term.

Relative Strength Index (RSI):
The RSI stands at 72.74, indicating that the stock is in the overbought zone, which might lead to a potential correction.

MACD Analysis:
The MACD value of 44.14, with a MACD Signal of 5.23, supports the continuation of the current bullish momentum.

Stock Performance for HINDUNILVR on January 27, 2025:
The stock opened at 2365.0 and closed at 2392.85. Throughout the day, the stock reached a high of 2409.70 and dipped to a low of 2361.15. The closing price resulted in a percentage change of 1.05% with a points change of 24.75.


Relationship with Key Moving Averages:
The closing price of 2392.85 is below the 10-EMA (2364.04) and 20-EMA (2370.53), indicating a short-term upward momentum, supporting a potential bullish trend. However, it remains below the 50-EMA (2417.30) and significantly under the 200-EMA (2512.77), suggesting overall bearish pressure in the longer time frame. These moving averages suggest mixed signals with potential bullish short-term optimism.
RSI and MACD Indicators:
The RSI at 52.75 indicates a neutral position—neither overbought nor oversold. The MACD of -11.60 with a signal line at -13.58 shows a slightly bullish crossover. This could imply weakening bearish sentiment.


ICICIBANK January 27, 2025, Stock Performance:
The stock symbol for ICICIBANK is "ICICIBANK.NS". On January 27, 2025, the stock opened at ₹1195.00, reached a high of ₹1234.65, and fell to a low of ₹1193.10. It closed at ₹1227.95, marking a percentage change of 1.55% and a points change of 18.75.


Relationship with Key Moving Averages:
ICICIBANK's current price sits below its 10-EMA (₹1223.45) and 20-EMA (₹1240.99), indicating a bearish short-term trend. However, it is trading above the 200-EMA (₹1209.99), suggesting a potential long-term bullish momentum. The stock is below its 50-EMA (₹1262.83), reinforcing the bearish sentiment over the medium term. Overall, the stock appears to be experiencing a short to medium-term downward trend while maintaining potential upward movement in the long term.
RSI Indicator:
The Relative Strength Index (RSI) for ICICIBANK is currently at 42.73, which is below the 50-neutral level. This implies that the stock is experiencing slight bearish momentum and is nearing oversold territory.

MACD Indicator:
The Moving Average Convergence Divergence (MACD) is at -21.56, with the signal line at -19.48. The MACD being below the signal line suggests bearish momentum, indicating downward pressure in the stock's price movement.

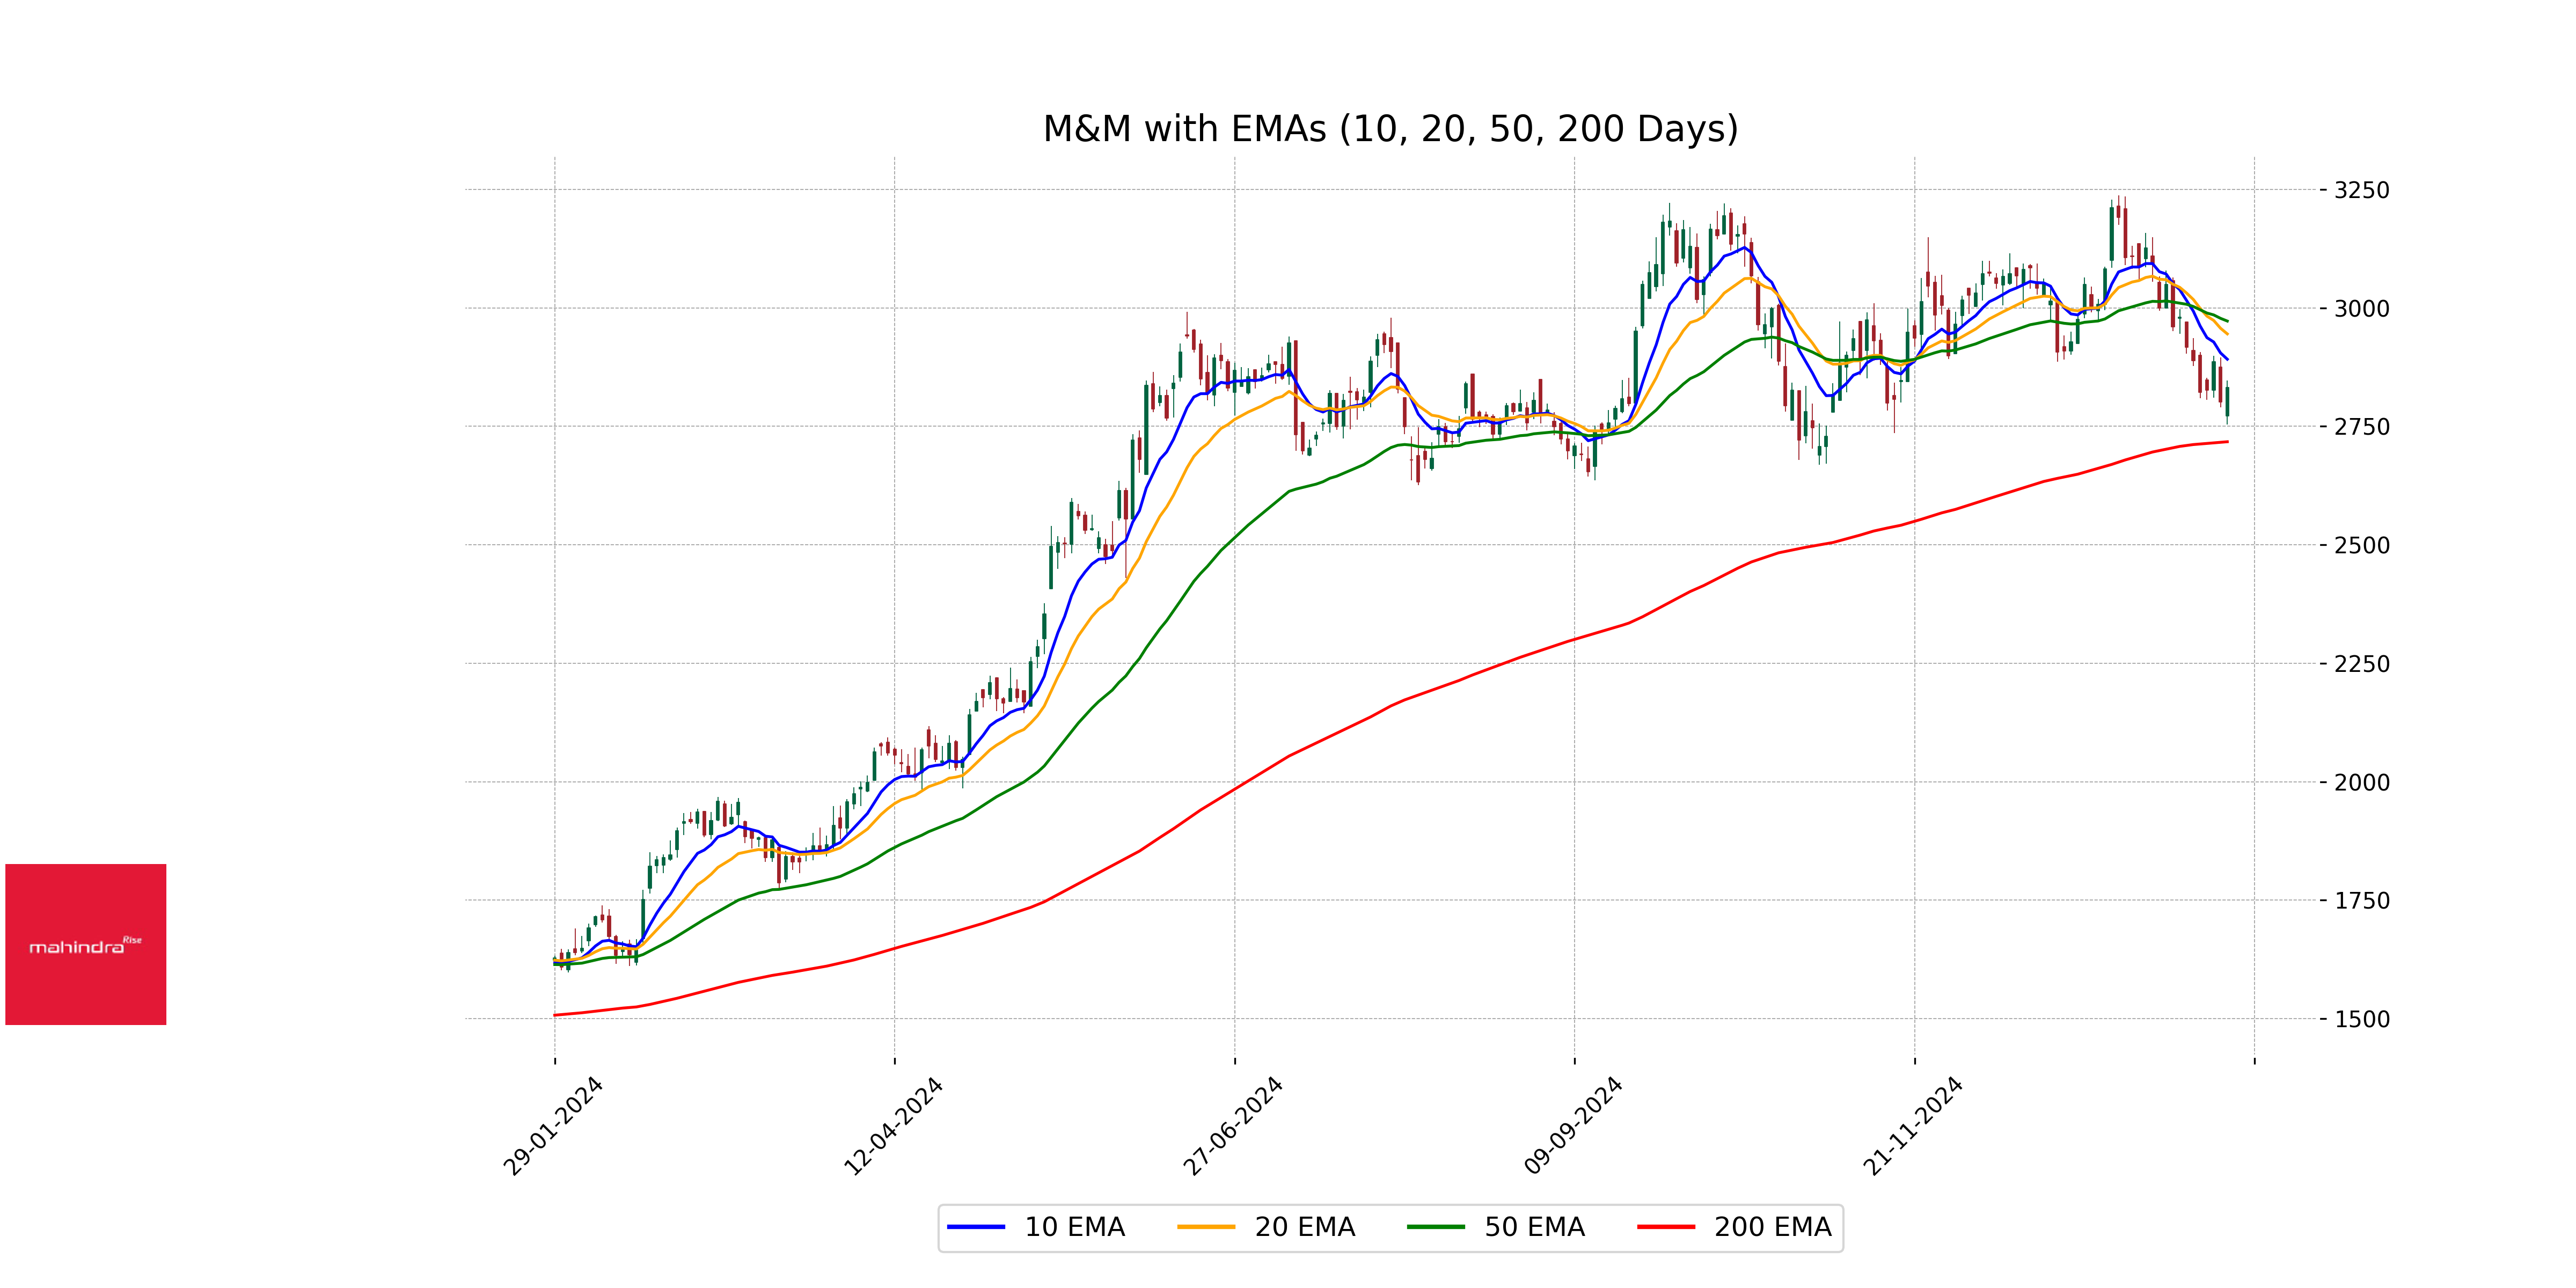
Stock Performance for M&M on January 27, 2025:
The stock of M&M traded with volatility throughout the day. It opened at 2772.30, reached a high of 2846.90, and a low of 2754.15. The stock closed at 2831.60, showing a percentage change of 1.08% with a points change of 30.20 from the previous close of 2801.40.
Performance Image:
Current Day Stock Table:

Relationship with Key Moving Averages:
The current price of M&M at 2831.60 is below the 10-EMA (2891.64) and the 20-EMA (2945.09). However, it is above the 200-EMA (2717.52). The price being below both the 10-EMA and 20-EMA suggests a short-term bearish trend, while it being above the 200-EMA indicates potential for long-term bullish support.
Technical Indicators – RSI:
The Relative Strength Index (RSI) stands at 39.40, which is below the neutral level of 50, indicating that the market sentiment is somewhat bearish. The RSI value reflects a possible undervaluation, signaling a potential buying opportunity.

Technical Indicators – MACD:
The MACD is -53.42, and the MACD Signal is -28.01, resulting in a negative MACD line, suggesting downward momentum. The widening gap between MACD and its signal line could affirm a continued bearish trend unless a crossover occurs.

SBIN Stock Performance for January 27, 2025:
The stock of State Bank of India (SBIN) opened at ₹740.00 and experienced some fluctuations during the day. The highest price reached was ₹755.35, while the lowest was ₹735.90. At the closing of the trading session, the stock settled at ₹749.20. Compared to the previous close of ₹744.15, the stock witnessed a percentage change of 0.68%, equivalent to a points change of 5.05.


Relationship with Key Moving Averages:
SBIN's current price is below the 10-day EMA of ₹755.70, the 20-day EMA of ₹767.91, the 50-day EMA of ₹791.58, and the 200-day EMA of ₹786.49. This indicates a bearish trend for the stock, as the price is consistently trailing below these moving averages. Such a setup often reflects downward pressure on the stock's price.
RSI and MACD Analysis:
The Relative Strength Index (RSI) for SBIN stands at 38.89, suggesting that the stock is currently experiencing weak momentum, potentially approaching an oversold territory.  Moreover, the MACD (Moving Average Convergence Divergence) is at -16.80 with a signal line of -17.48, which also supports a bearish sentiment as it indicates that the stock might continue to experience downward trends.
Up Next

NSE Nifty 50 Top gainers: Who are the 5 Biggest Stock gainers Today January 27, 2025

Centre plans to borrow Rs 8.20 lakh cr from market in first half of FY27

Reliance denies buying Iranian oil amid US sanctions waiver

Premium petrol price up Rs 2, industrial diesel up Rs 22; no change in normal petrol, diesel rates

India's GDP expected to register over 8 pc growth in Sep-Dec: Report

Govt announces seven measures to help boost exports

More videos

RBI keeps interest rates on hold after US trade deal boosts outlook

RBI proposes to compensate customers up to Rs 25,000 loss due to fraud

RBI raises GDP growth projection of Q1, Q2 of FY27

RBI pauses rate cuts, retains interest rate at 5.25 pc

Rupee jumps 122 paise to close at 90.27 against US dollar on India-US trade deal

Stock markets cheer India-US trade deal: Sensex, Nifty surge 2.5 pc

UPI transactions hit record high of Rs 230 lakh crore in 2025-26 till Dec: Govt

Explained: India-US trade deal, tariffs and trade benefits

Trade deal with US adds momentum to India's growth ambition: Industry leaders

Rupee jumps 119 paise to 90.30 against the US dollar on India-US trade deal