


Highlights
Latest news

Samsung Galaxy A57 & A37 Review: Safe Upgrades or Missed Opportunity?

Trust-based governance, Jan Vishwas Bill will decriminalise minor offences, boosts ease of doing business: Piyush Goyal
, Marking a New Era for Inclusive Sport")
India Set to Launch Korfball Premier League (KPL), Marking a New Era for Inclusive Sport

"It belongs to all Dogras": Kathua's Thakur Khajoor Singh after receiving Sahitya Akademi Award

fischer Strengthens Production in Asia: New Production Sites in India and China

Punjab Carbonic Limited Files DRHP With SEBI, NSE and BSE

Cupid Limited Deploys Rs 82.88 crore as Strategic Investment into Baazar Style Retail Limited

Selena Gomez to direct 'Wizards Beyond Waverly Place' finale, series ends this summer
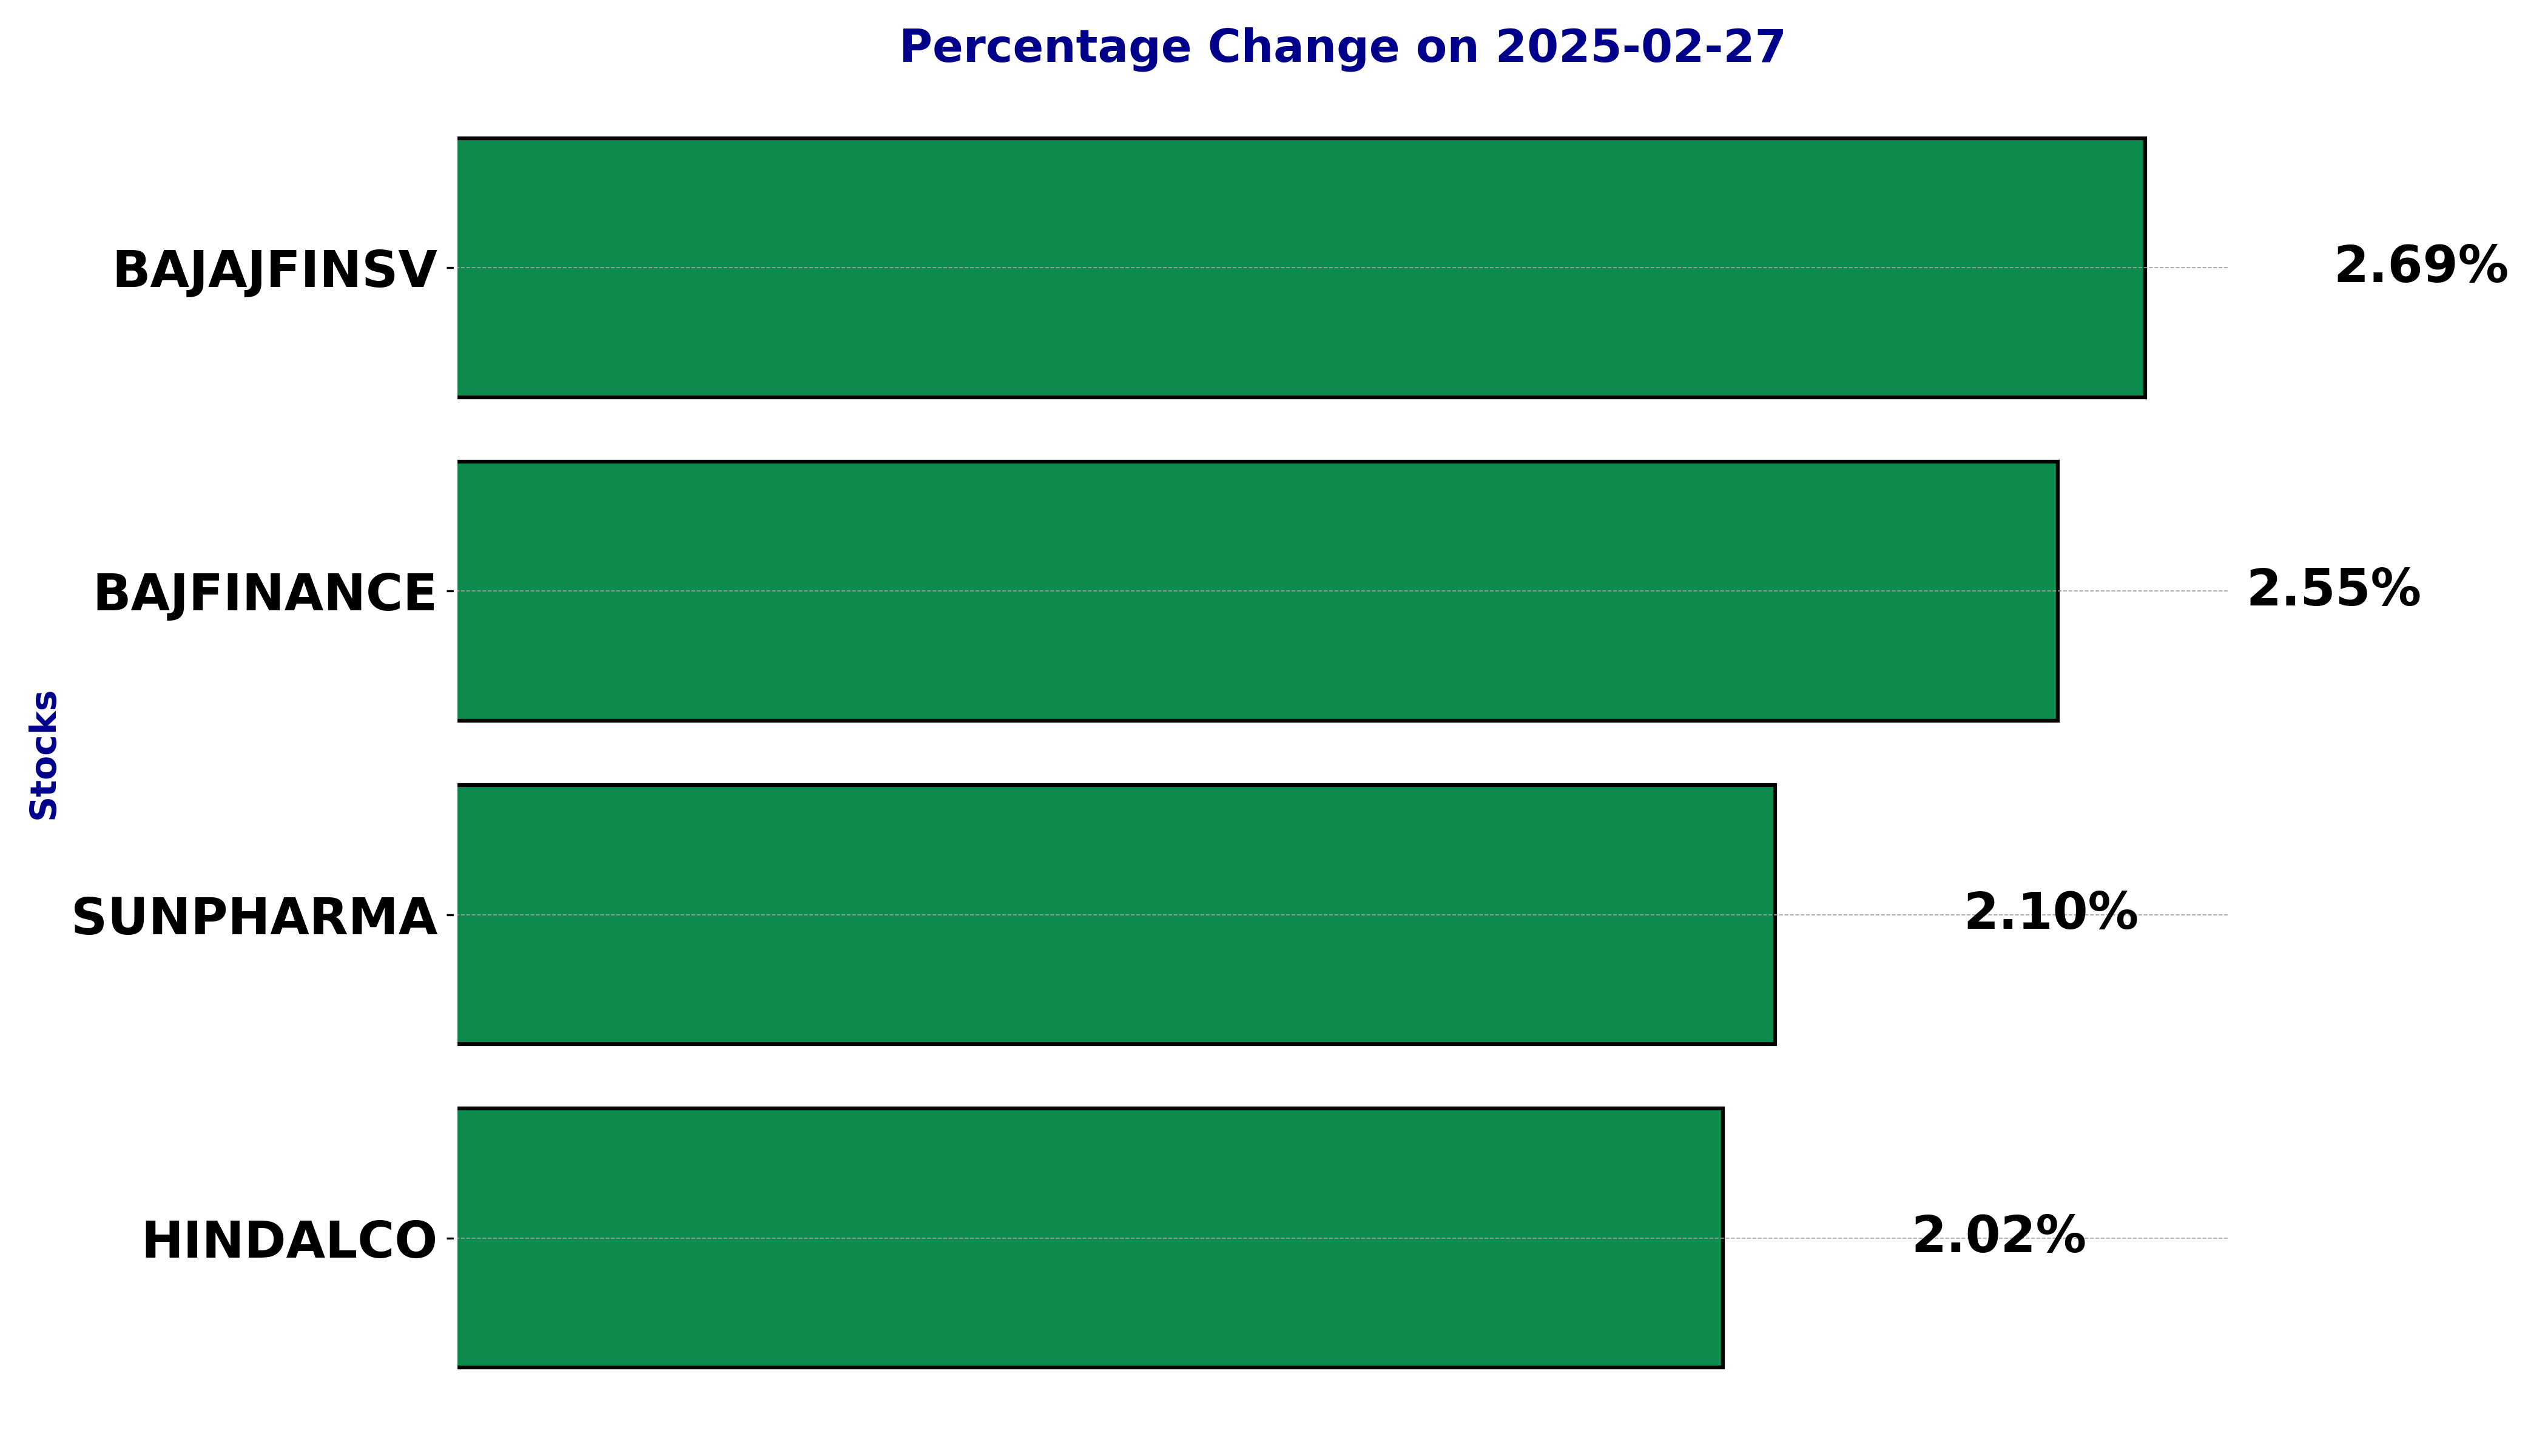
NSE Nifty 50 Top gainers: What are the 5 Biggest Stock gainers Today February 27, 2025


In this article, we will explore the technical indicators of some of the high-performing stocks on the Indian stock market, including BAJAJFINSV, BAJFINANCE, HINDALCO, and SUNPHARMA.
By looking at these stocks through the lens of key technical factors, we aim to better understand their price movements, trends, and potential future performance.
Analysis for Bajaj Finserv - February 27, 2025
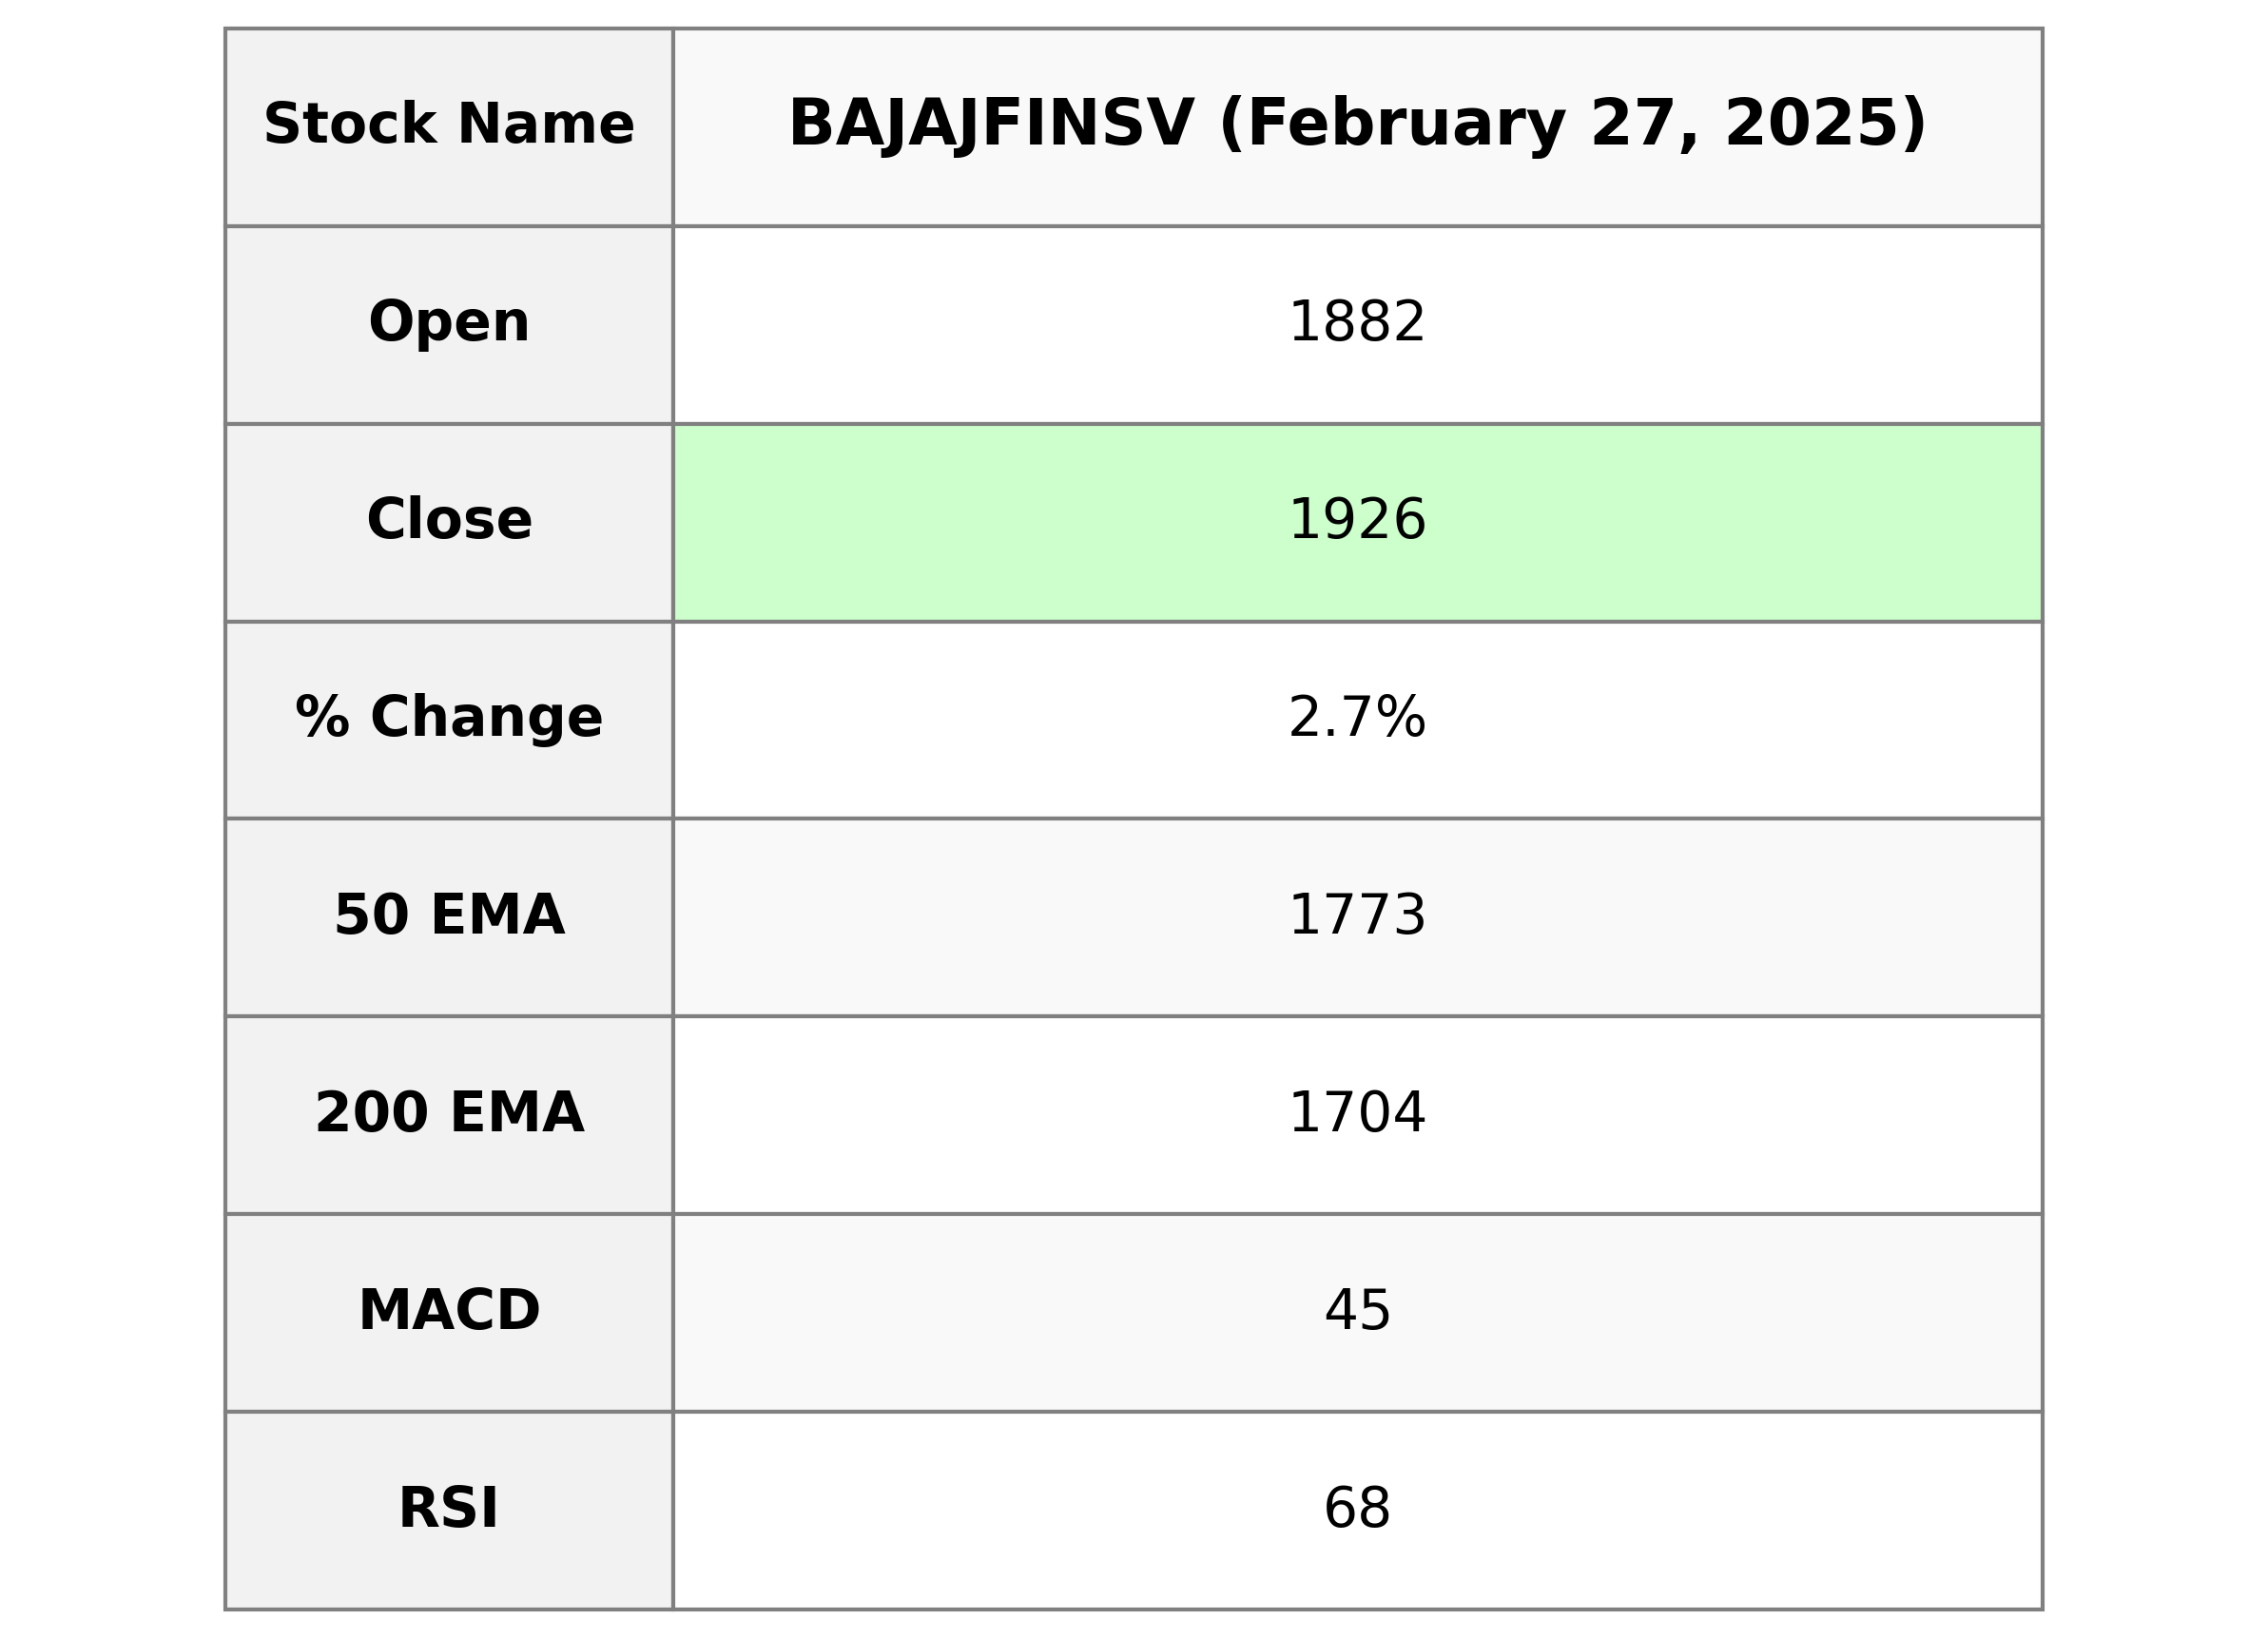
Bajaj Finserv Performance: Bajaj Finserv exhibited a positive trading session on this particular day, closing at 1925.55, which marks a 2.69% increase from the previous close. The stock's performance is supported by a robust volume of 2,878,013 shares and an RSI of 67.92, indicating it is nearing overbought conditions. With a market cap of approximately 3.07 trillion INR, it remains a significant player in the Financial Services sector of India.
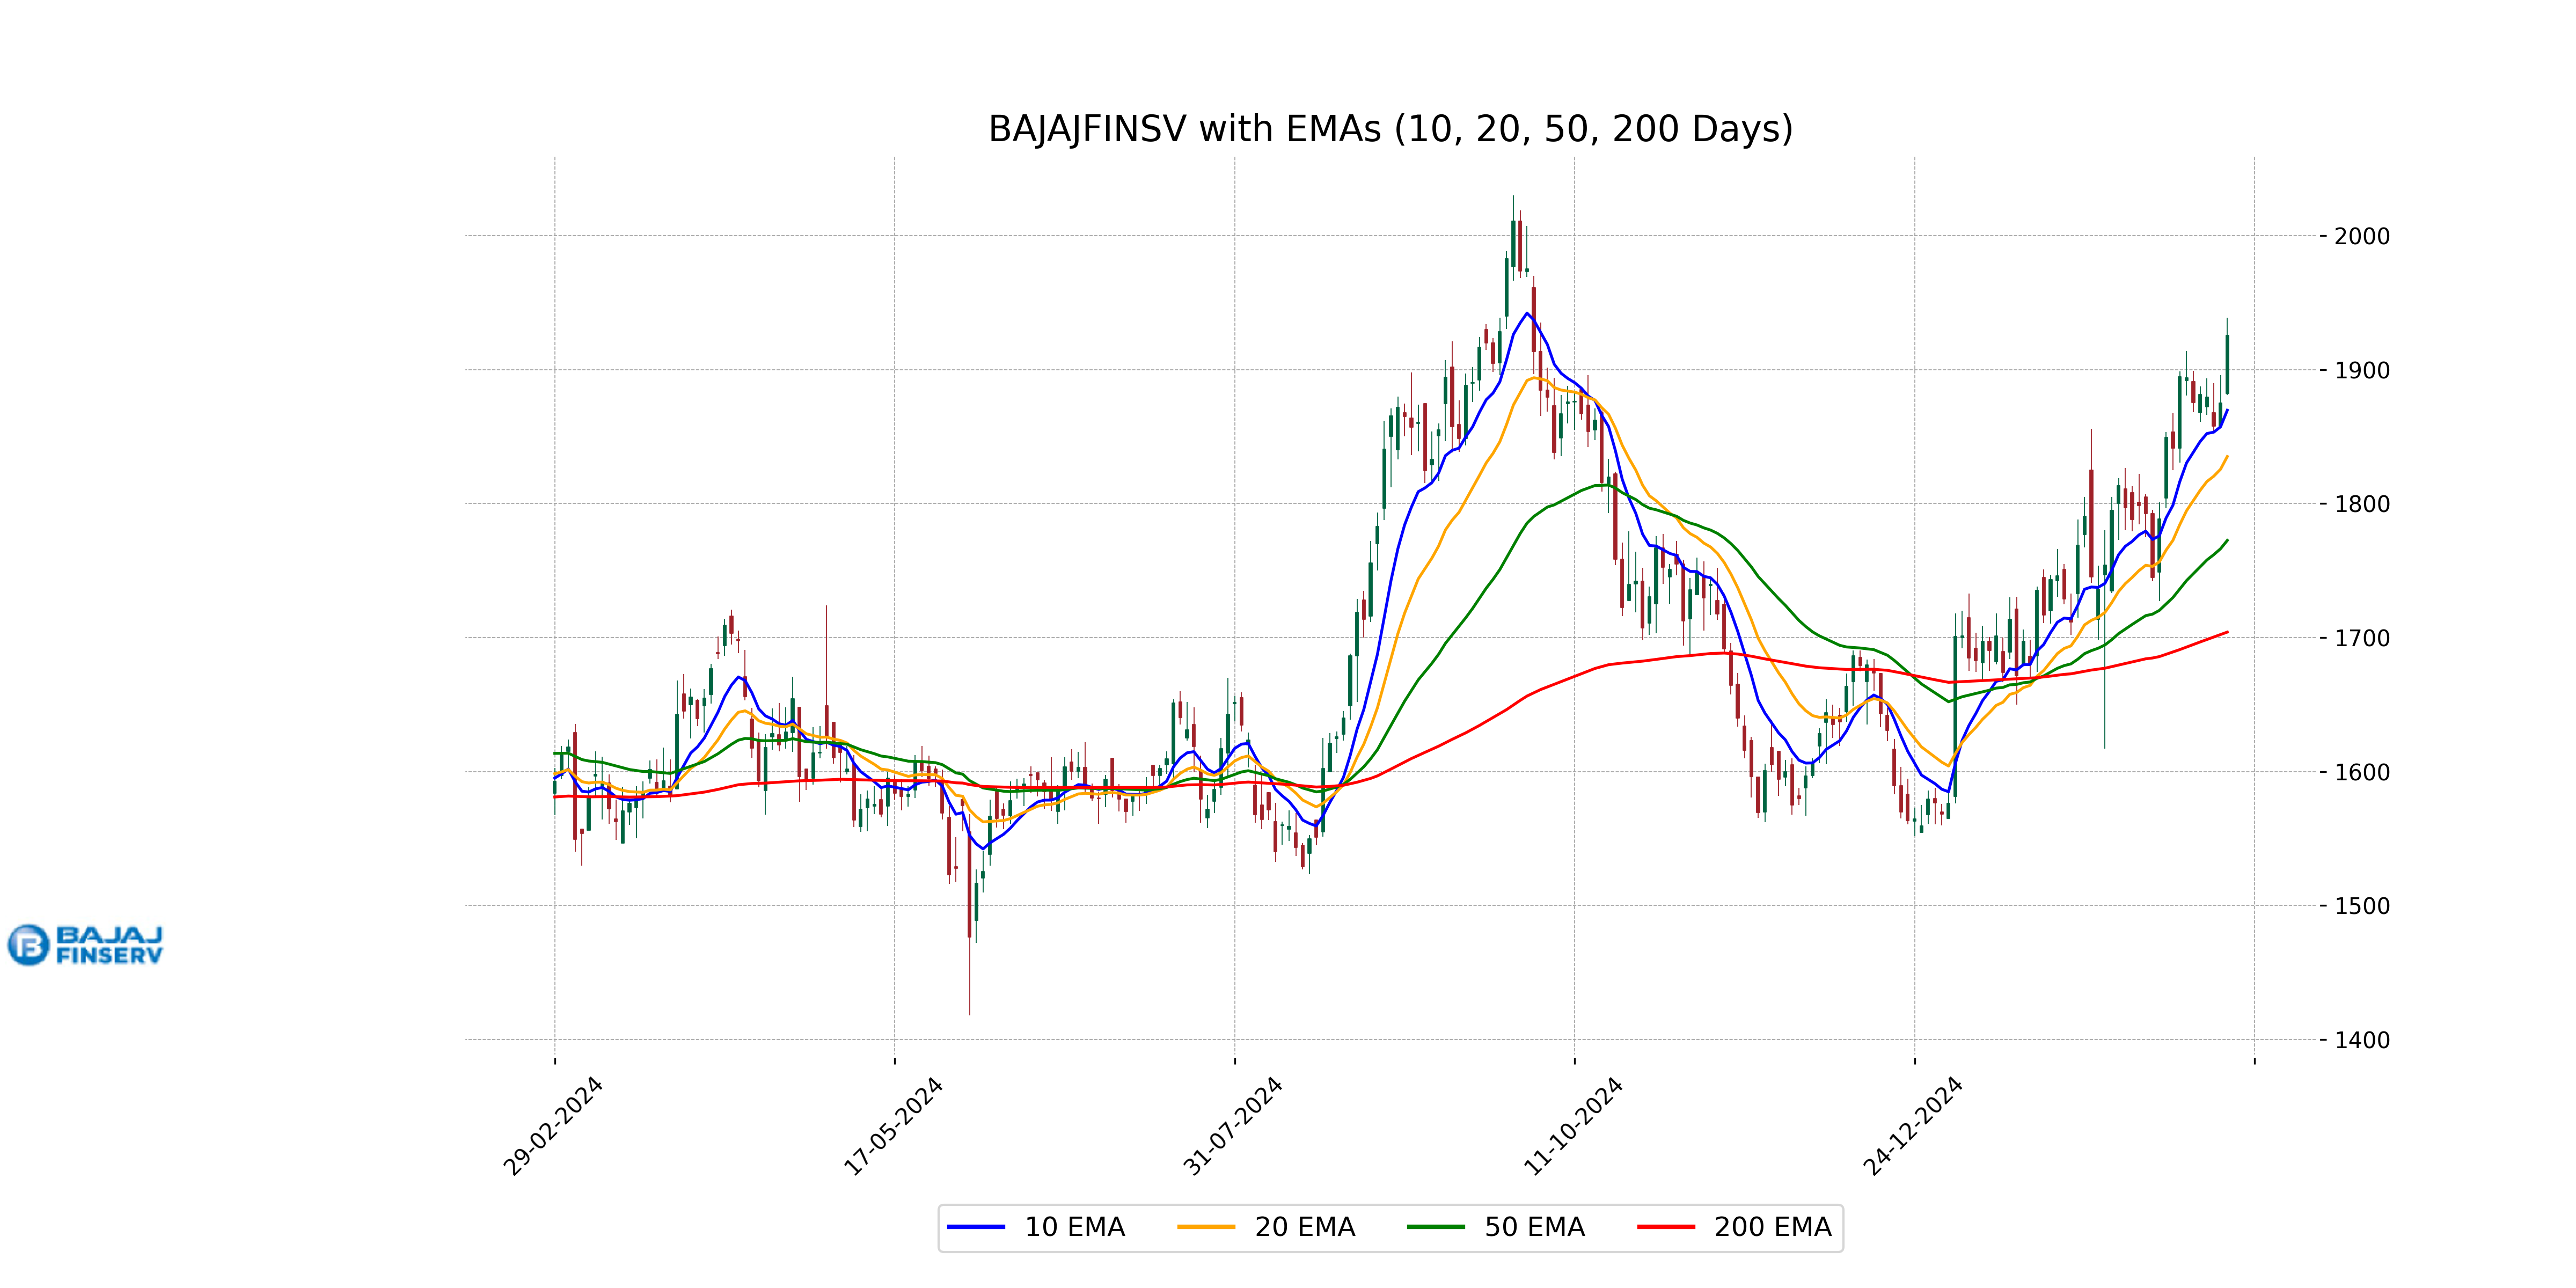
Relationship with Key Moving Averages
The closing price for Bajaj Finserv at 1925.55 is above its 10 EMA at 1869.67, 20 EMA at 1835.12, 50 EMA at 1772.52, and 200 EMA at 1704.08, indicating a bullish trend in the short to long term based on moving averages. The stock has also shown a positive price change with a % change of 2.69%.
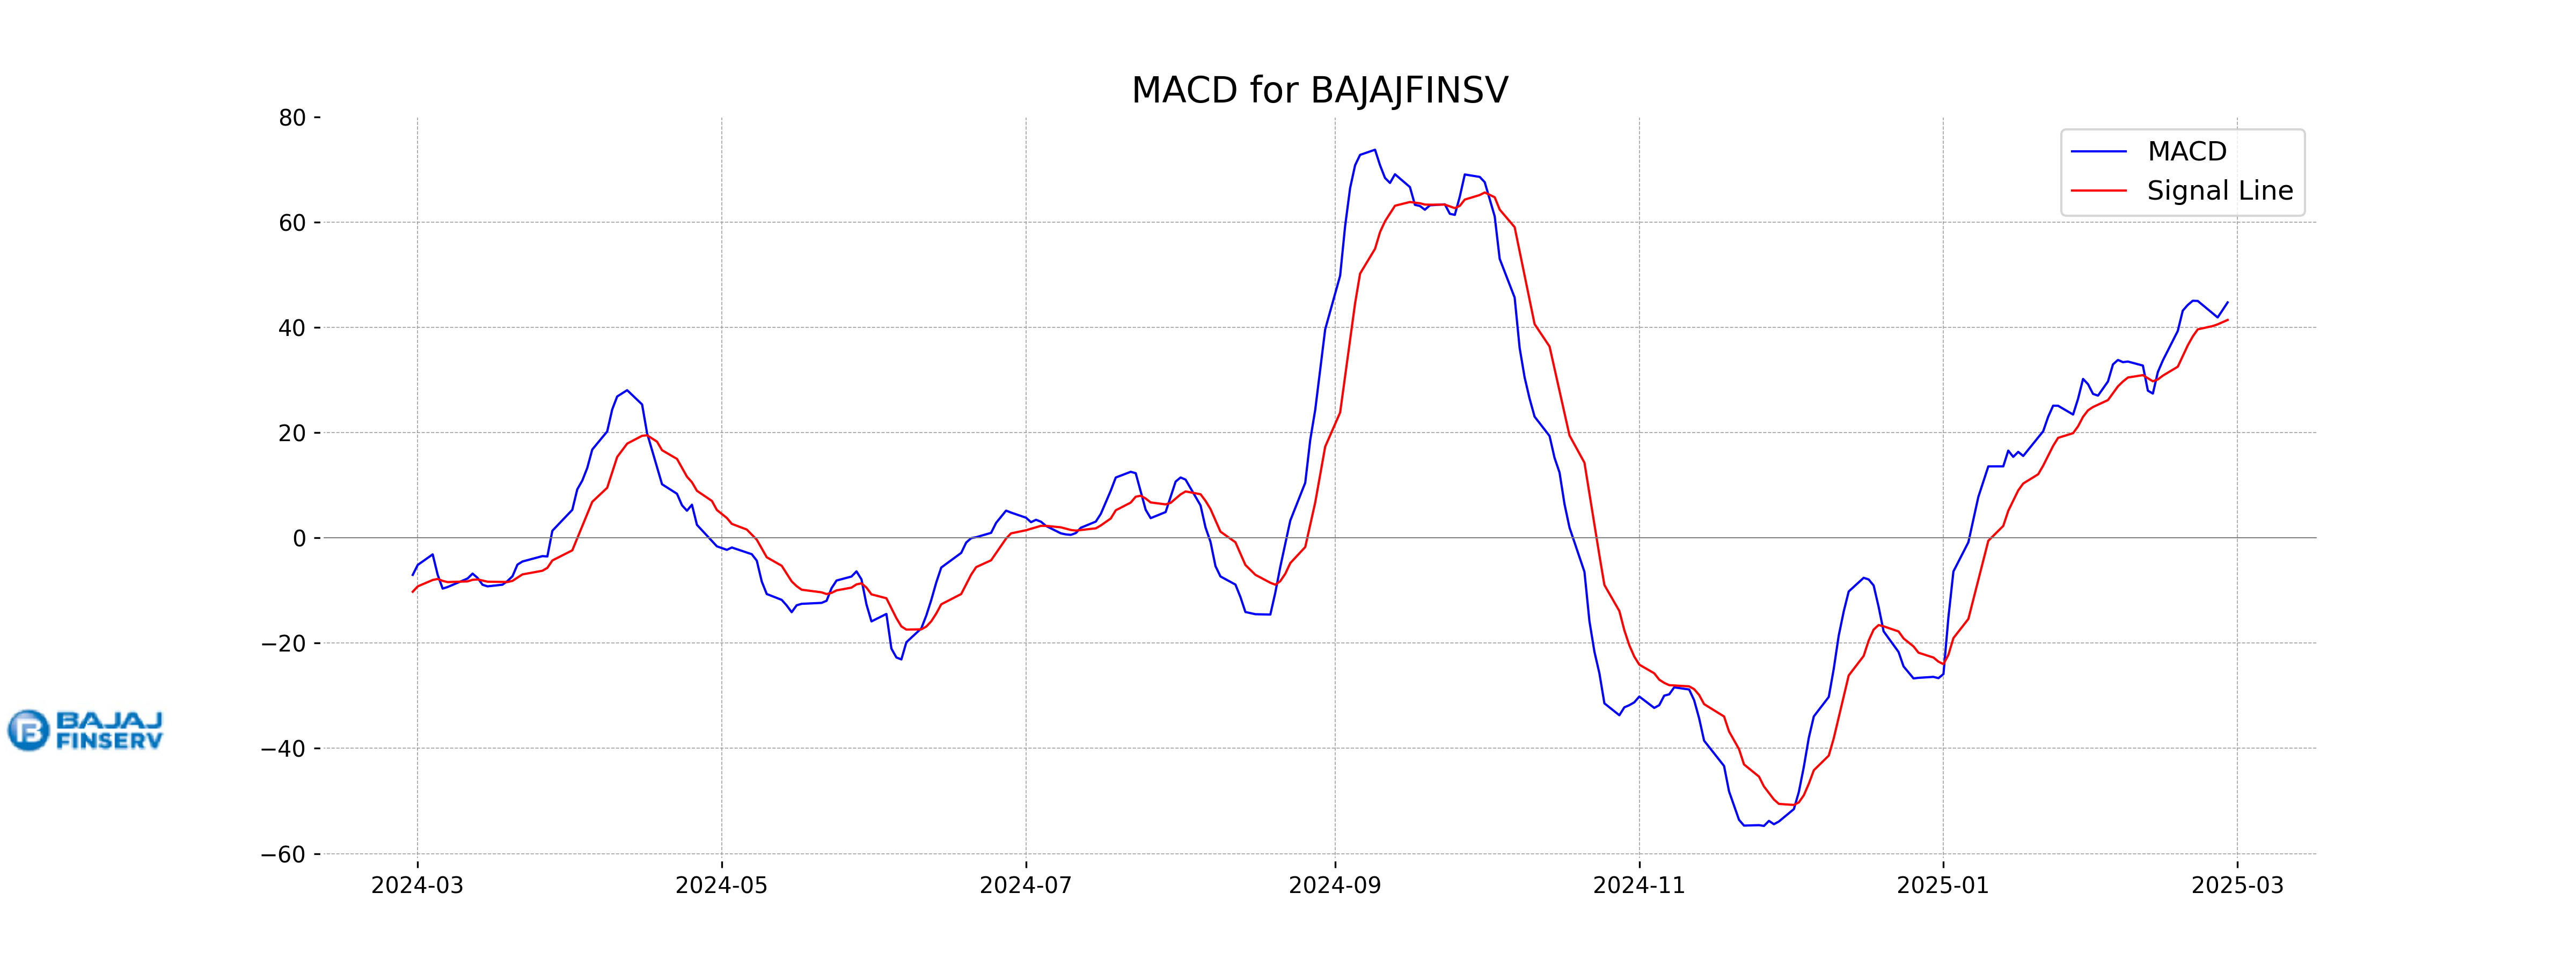
Moving Averages Trend (MACD)
Bajaj Finserv's MACD is at 44.74, which is above the MACD Signal line at 41.40. This suggests a bullish momentum in the stock. A positive MACD indicates that the short-term moving average is above the long-term moving average, pointing to potential upward movement.
RSI Analysis
The Relative Strength Index (RSI) for Bajaj Finserv is 67.92, indicating that the stock is approaching an overbought condition. An RSI above 70 typically suggests the stock might be overvalued, leading to a potential pullback. While currently below the overbought threshold, it is advisable for investors to monitor closely.
Analysis for Bajaj Finance - February 27, 2025
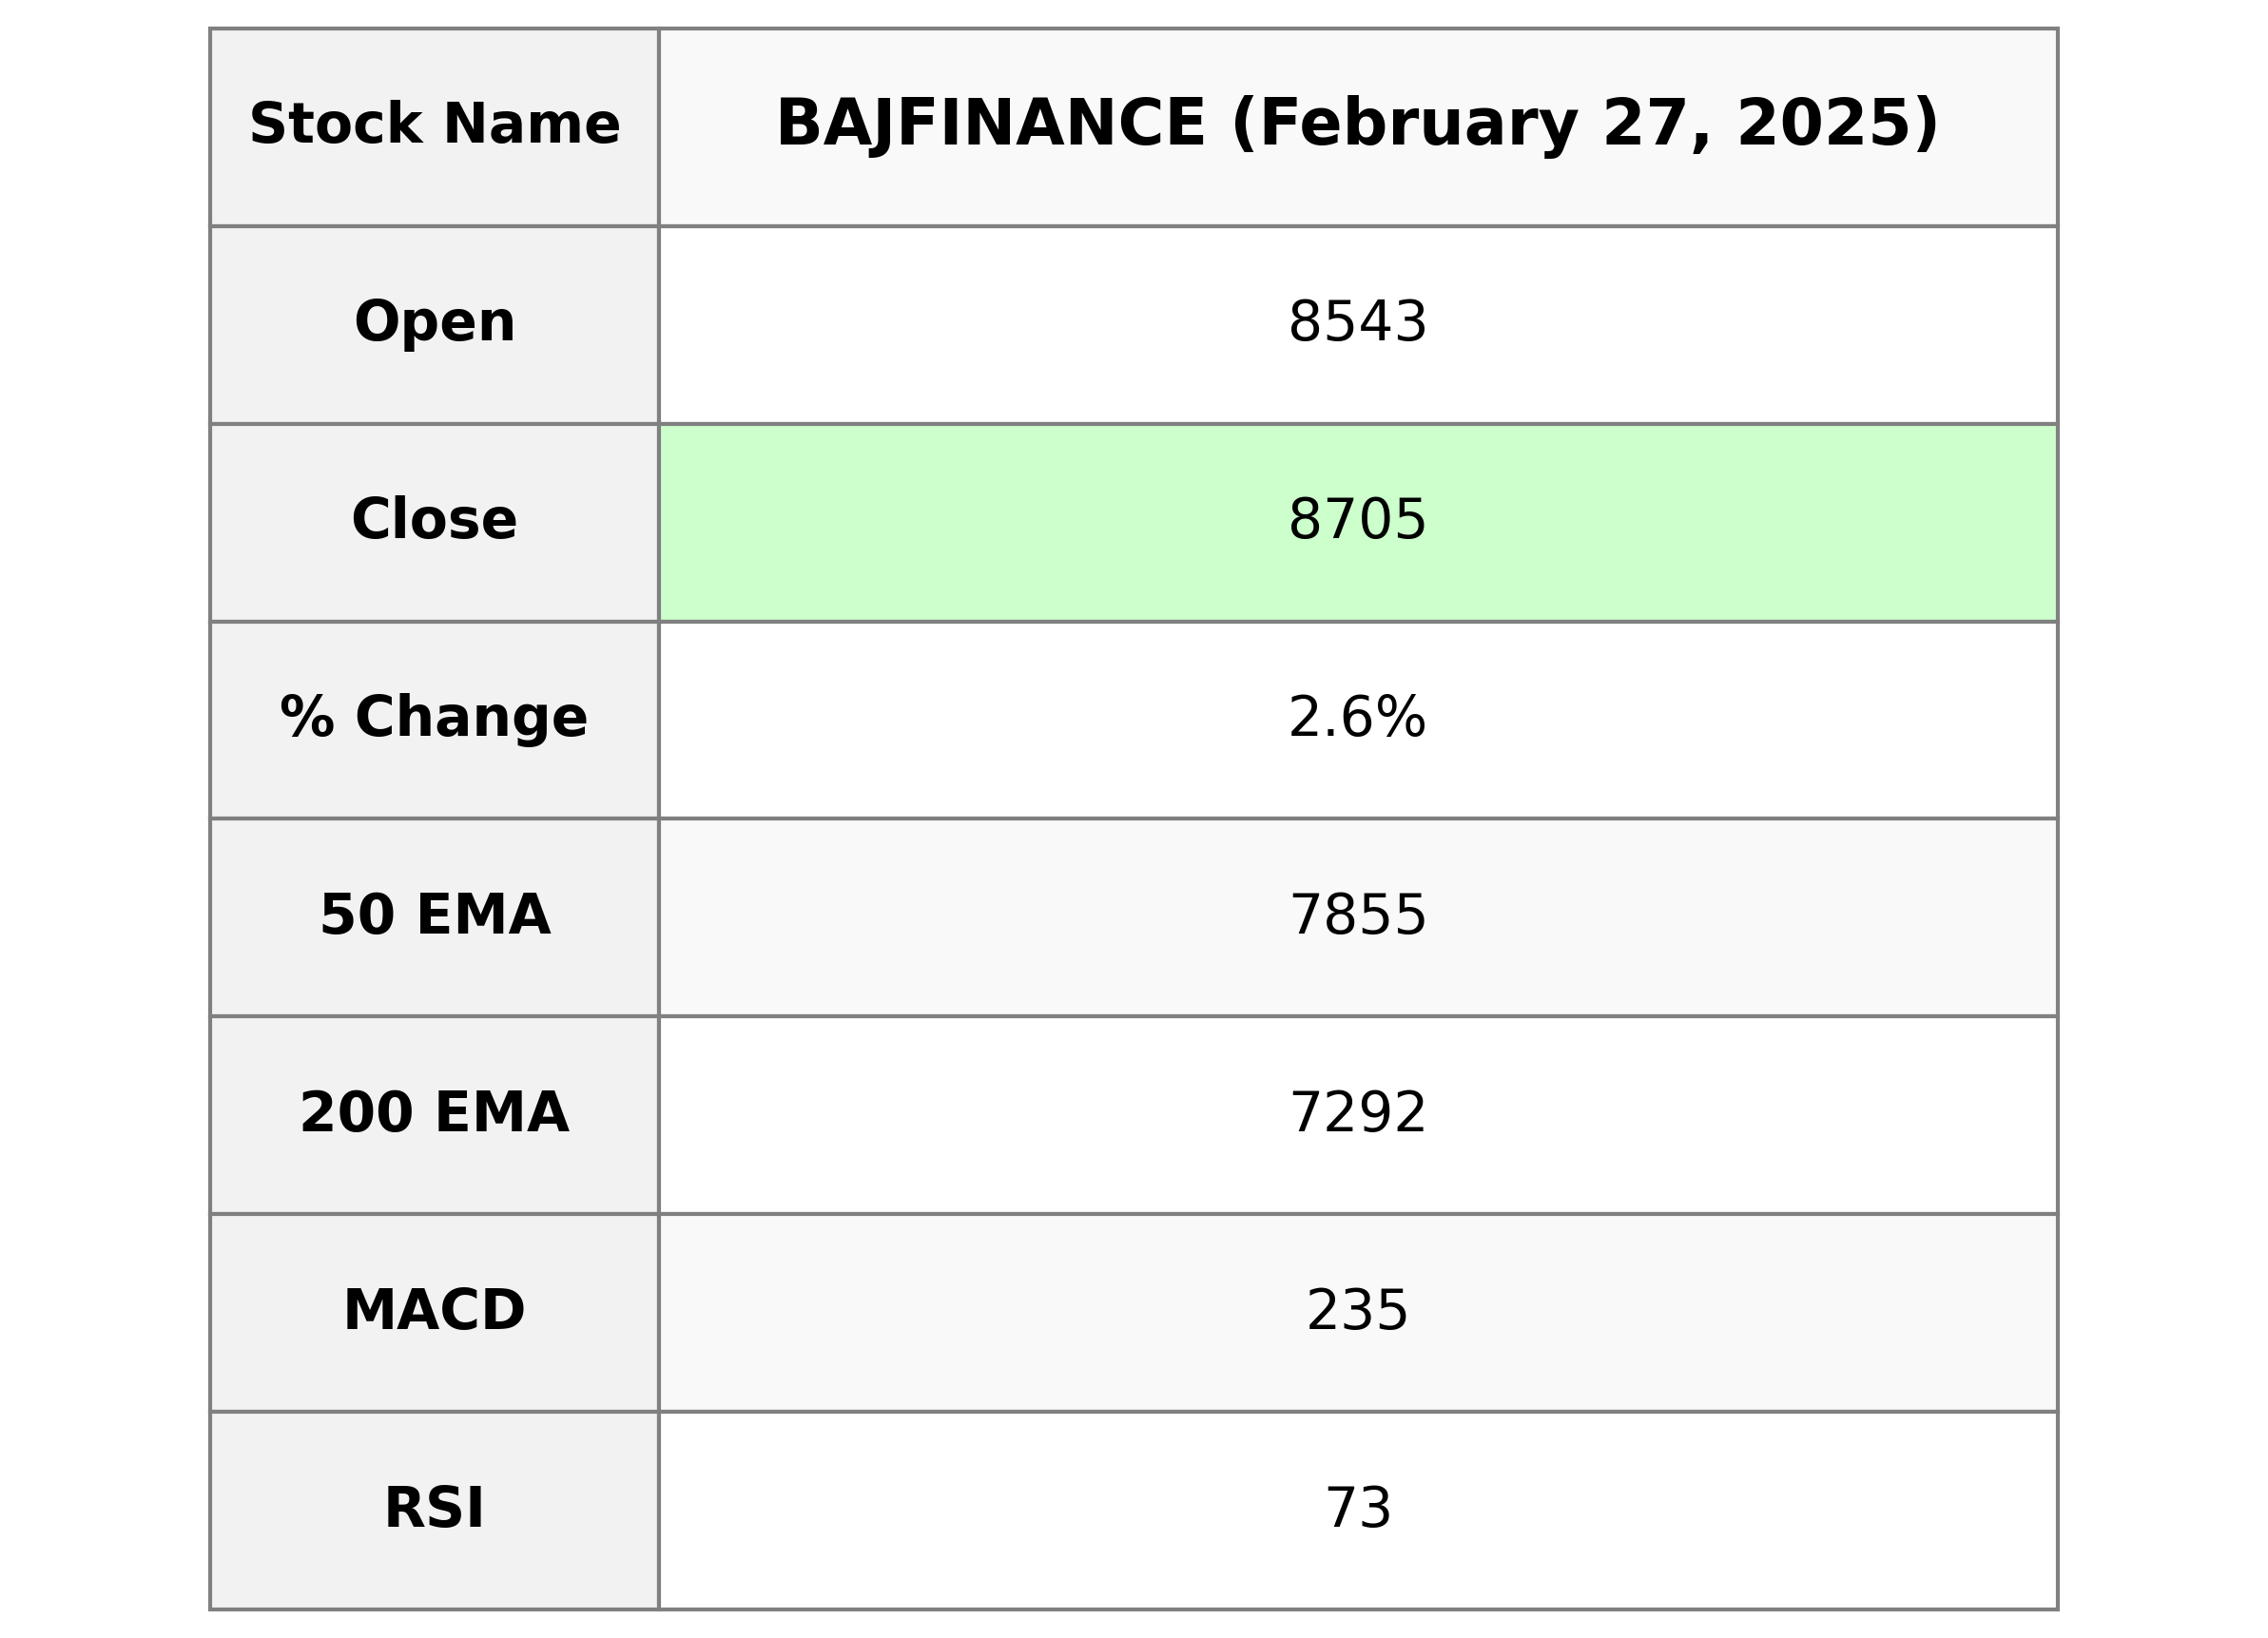
Bajaj Finance Performance Summary: Bajaj Finance closed at 8705.40, reflecting a 2.55% increase from its previous close of 8488.80. The stock experienced significant trading activity, with a volume of 1,837,971. It is currently trading well above its 50-day and 200-day EMAs, indicating strong upward momentum. The RSI of 72.86 suggests the stock is overbought. It operates in the financial services sector, specifically in credit services, within the Indian market.
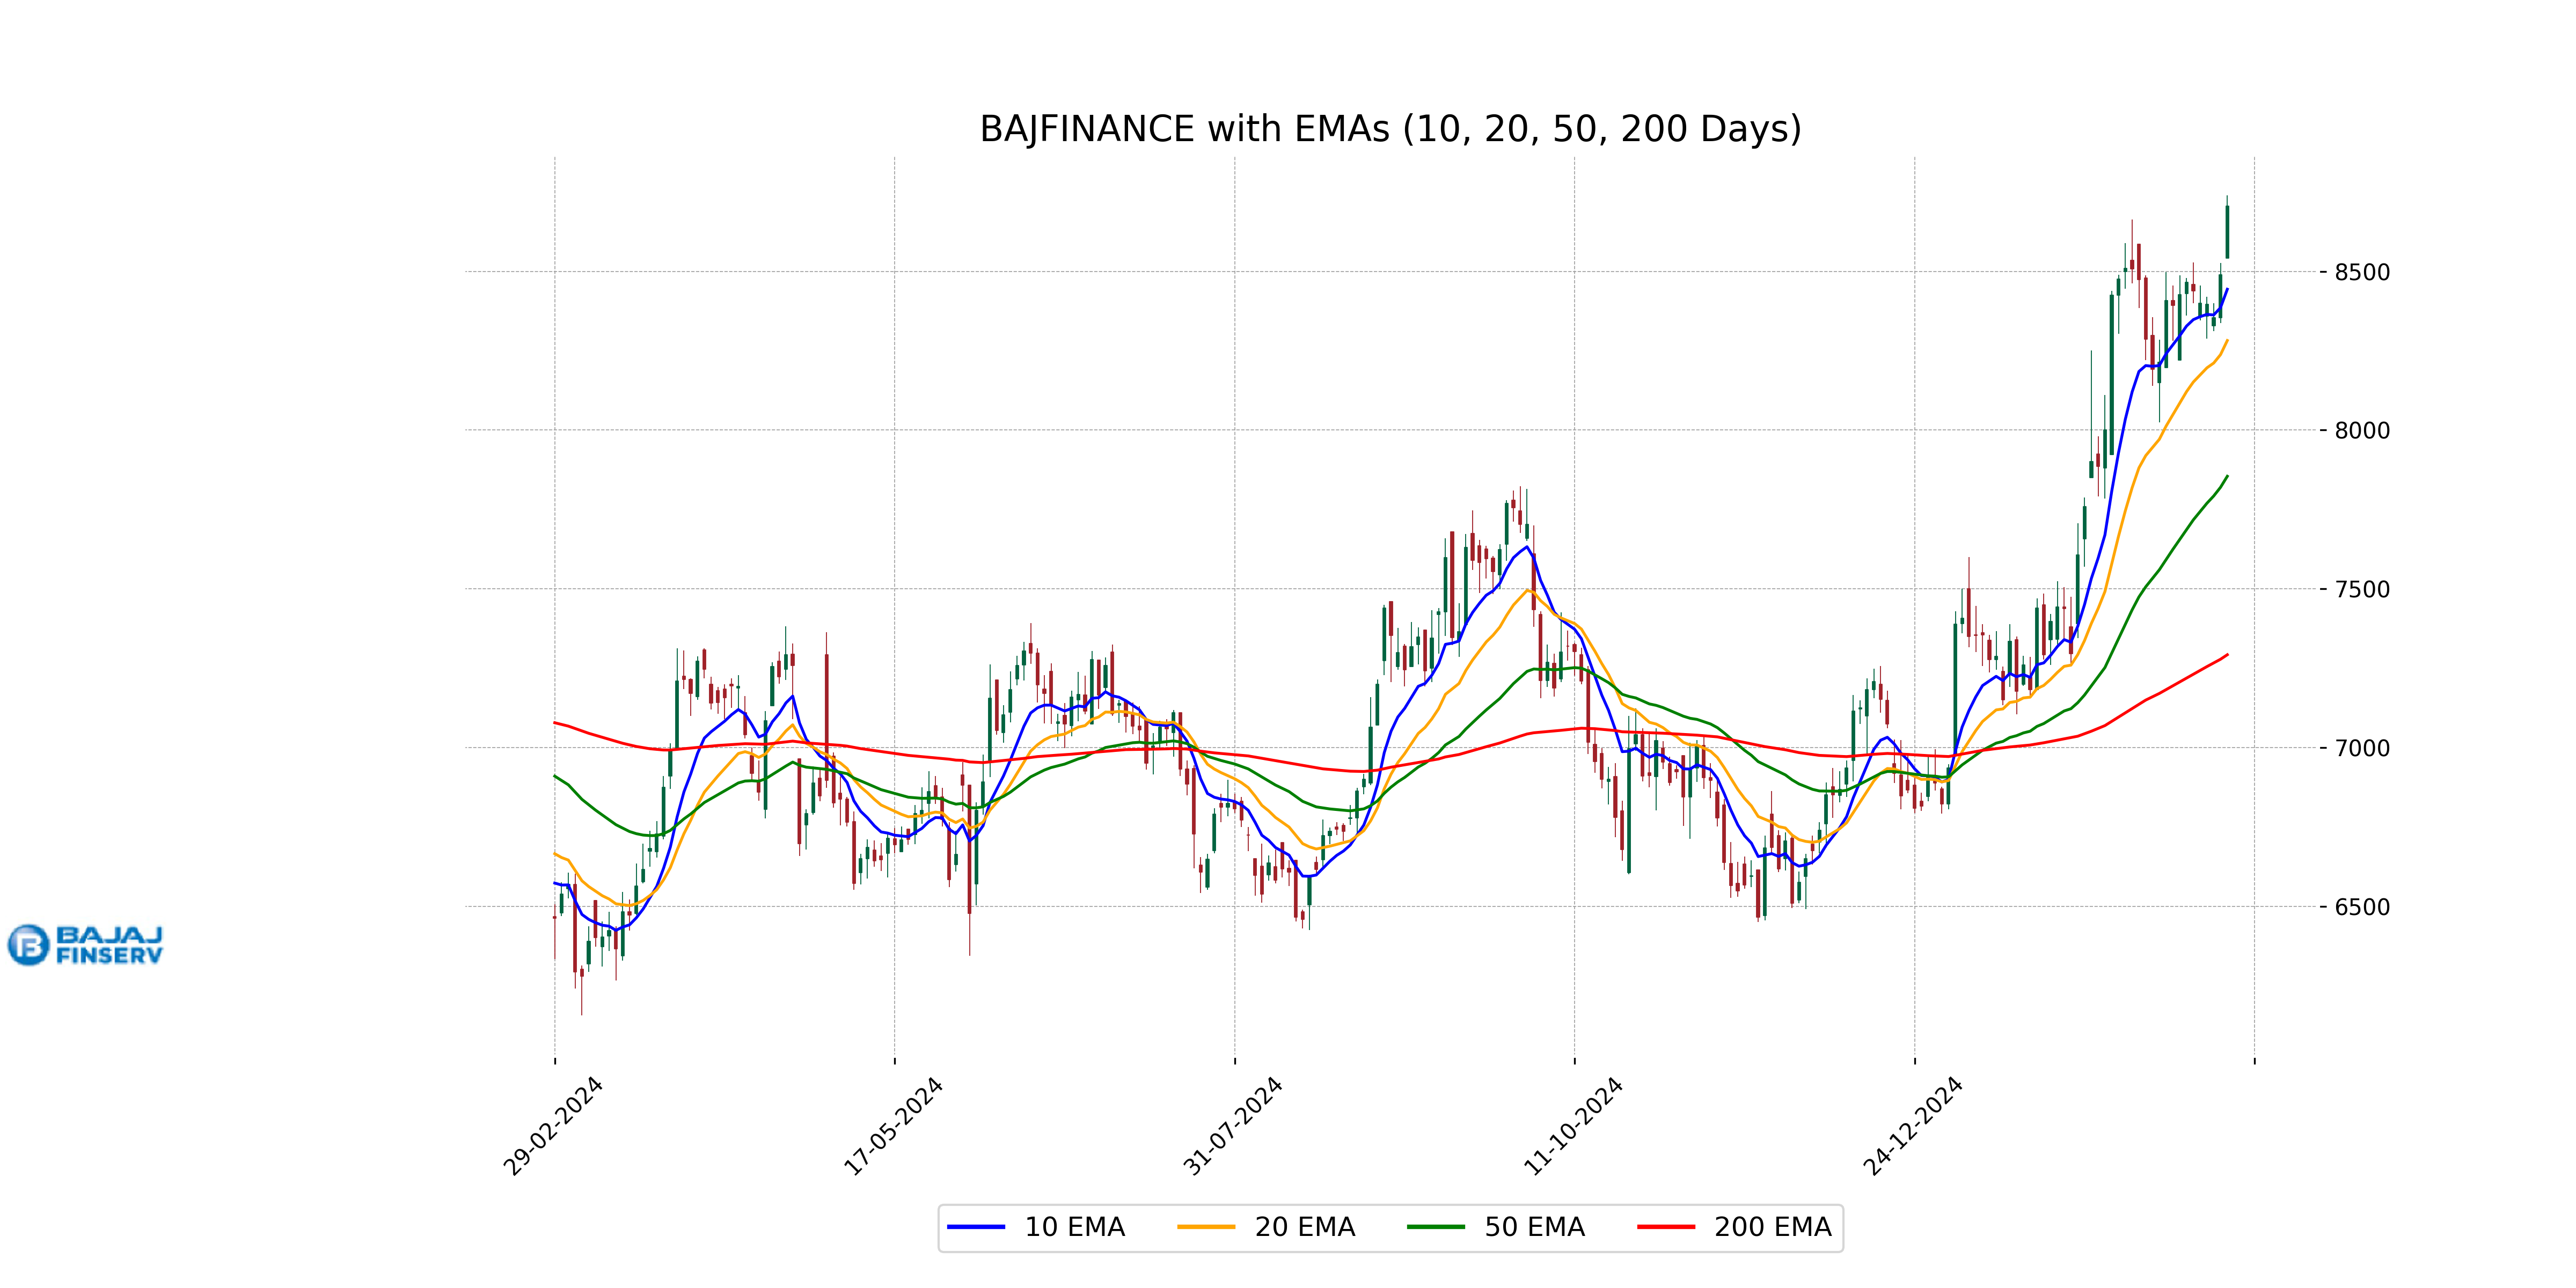
Relationship with Key Moving Averages
Bajaj Finance is trading above its 50-day EMA of 7854.61 and 200-day EMA of 7292.43, indicating a strong upward trend. Additionally, the stock's current price is also above the 10-day EMA of 8443.86 and 20-day EMA of 8282.30, suggesting short-term strength in the price movements.
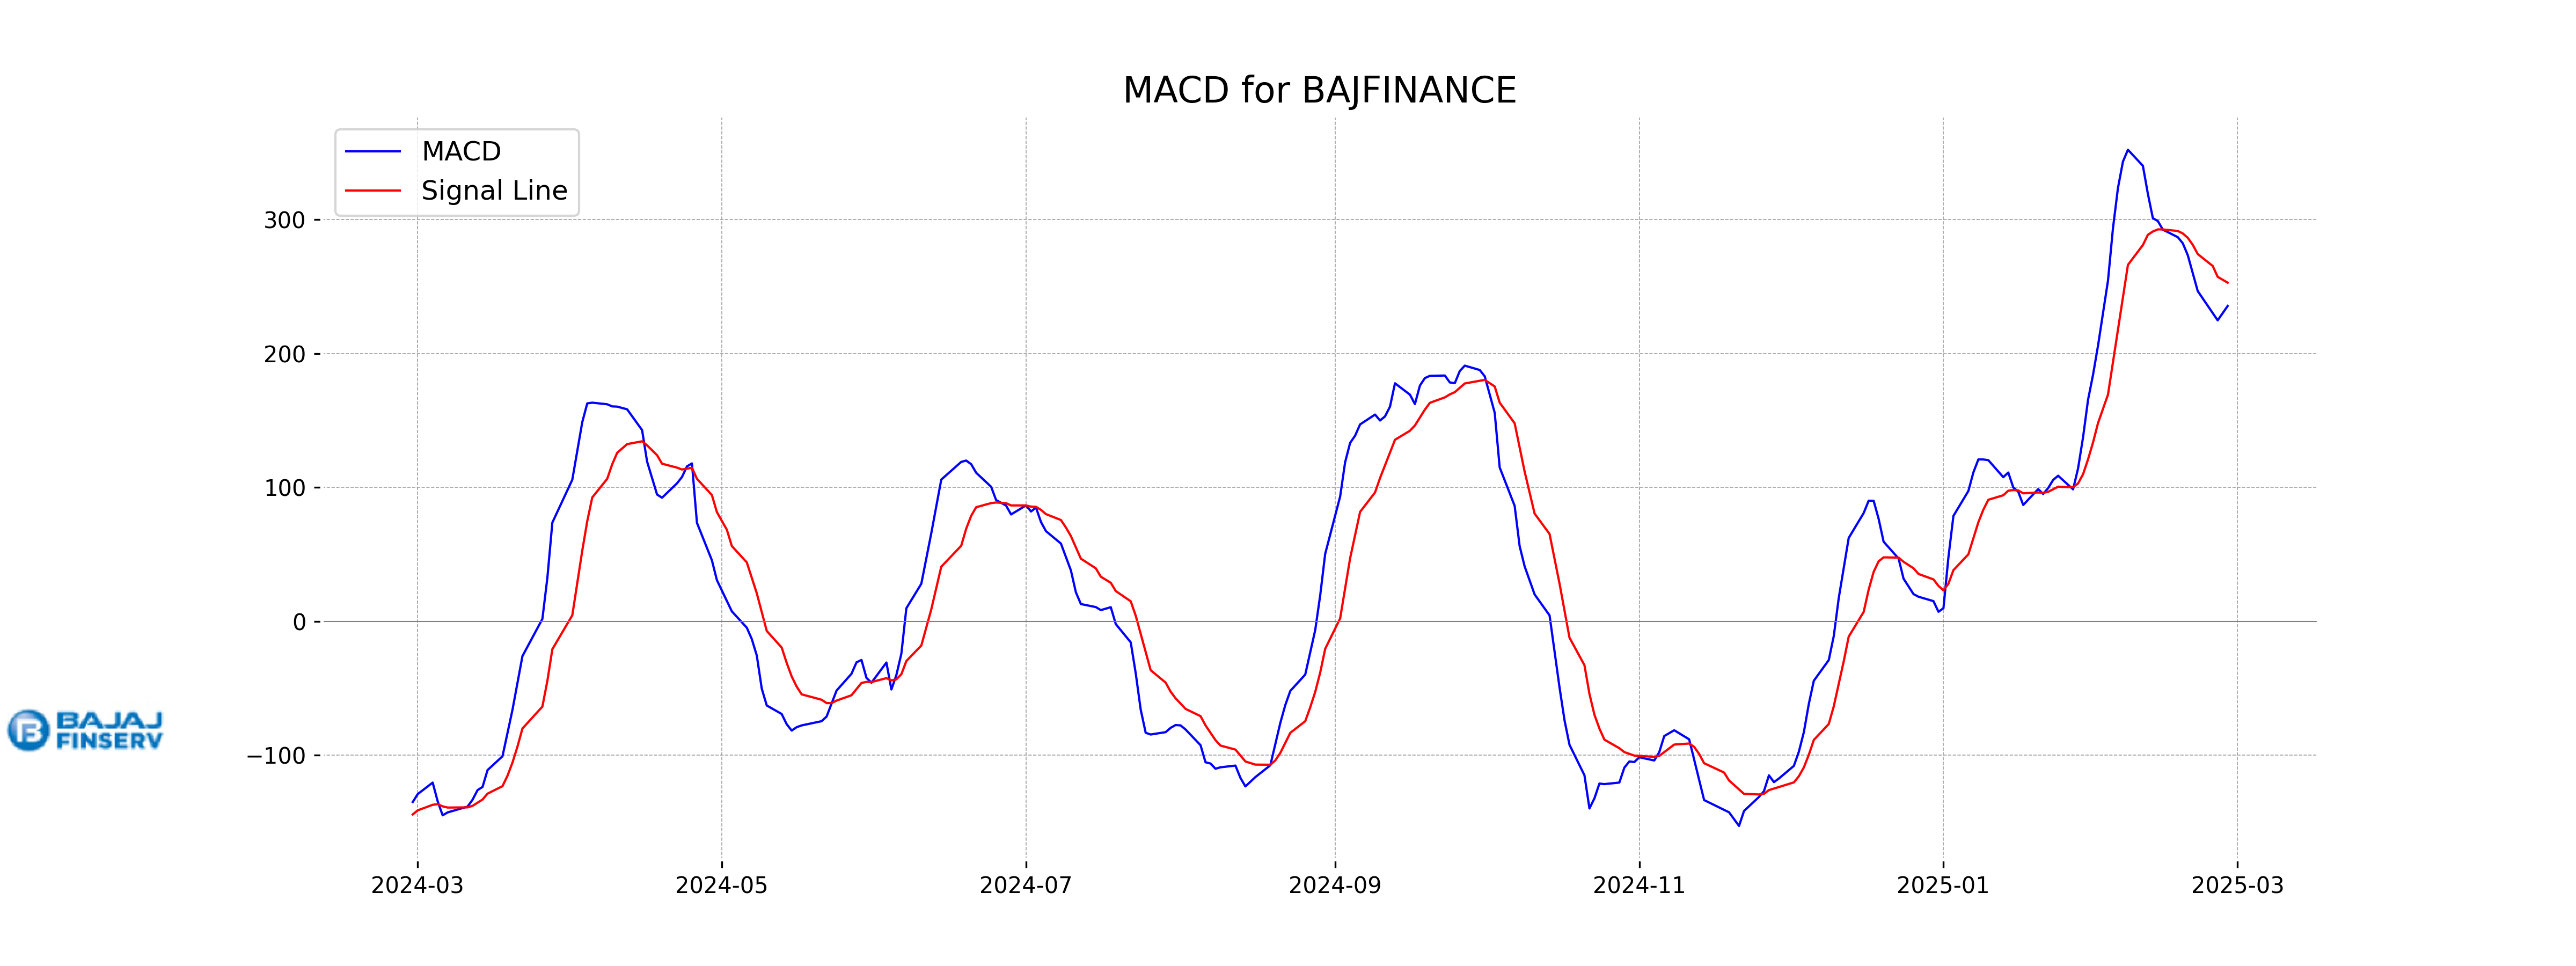
Moving Averages Trend (MACD)
MACD Analysis for Bajaj Finance: The MACD line (235.49) is below the Signal line (252.91), indicating a potential bearish trend. However, the RSI value of 72.86 suggests that the stock might be in the overbought condition, which could affect the trend direction.
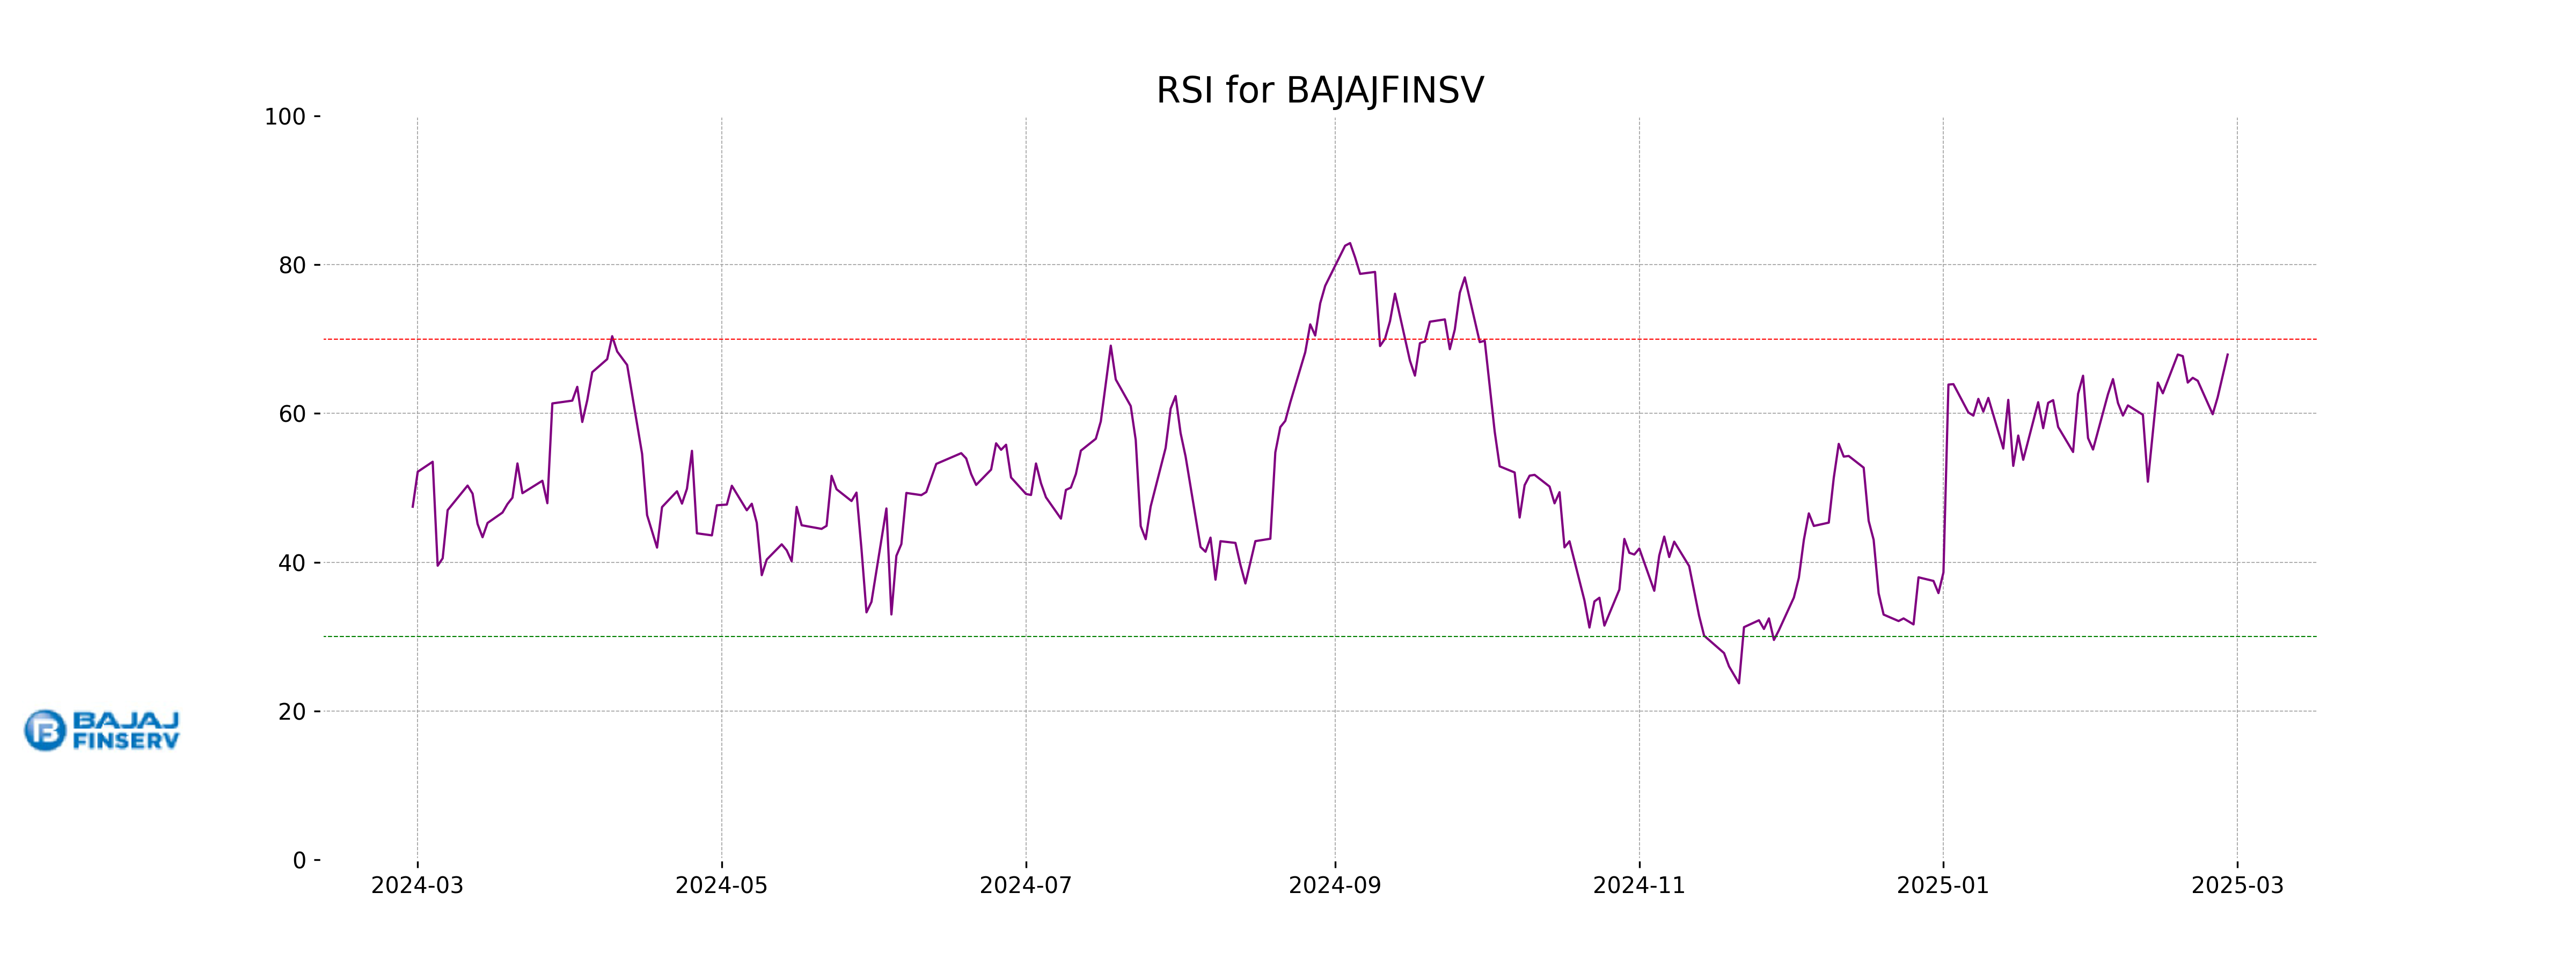
RSI Analysis
Bajaj Finance's current RSI is 72.86, indicating that the stock is in the overbought territory. This suggests that there may be a potential for a price reversal or a pullback in the near term as the stock might be overvalued at current levels. However, it is crucial to consider other indicators and market conditions before making any investment decisions.
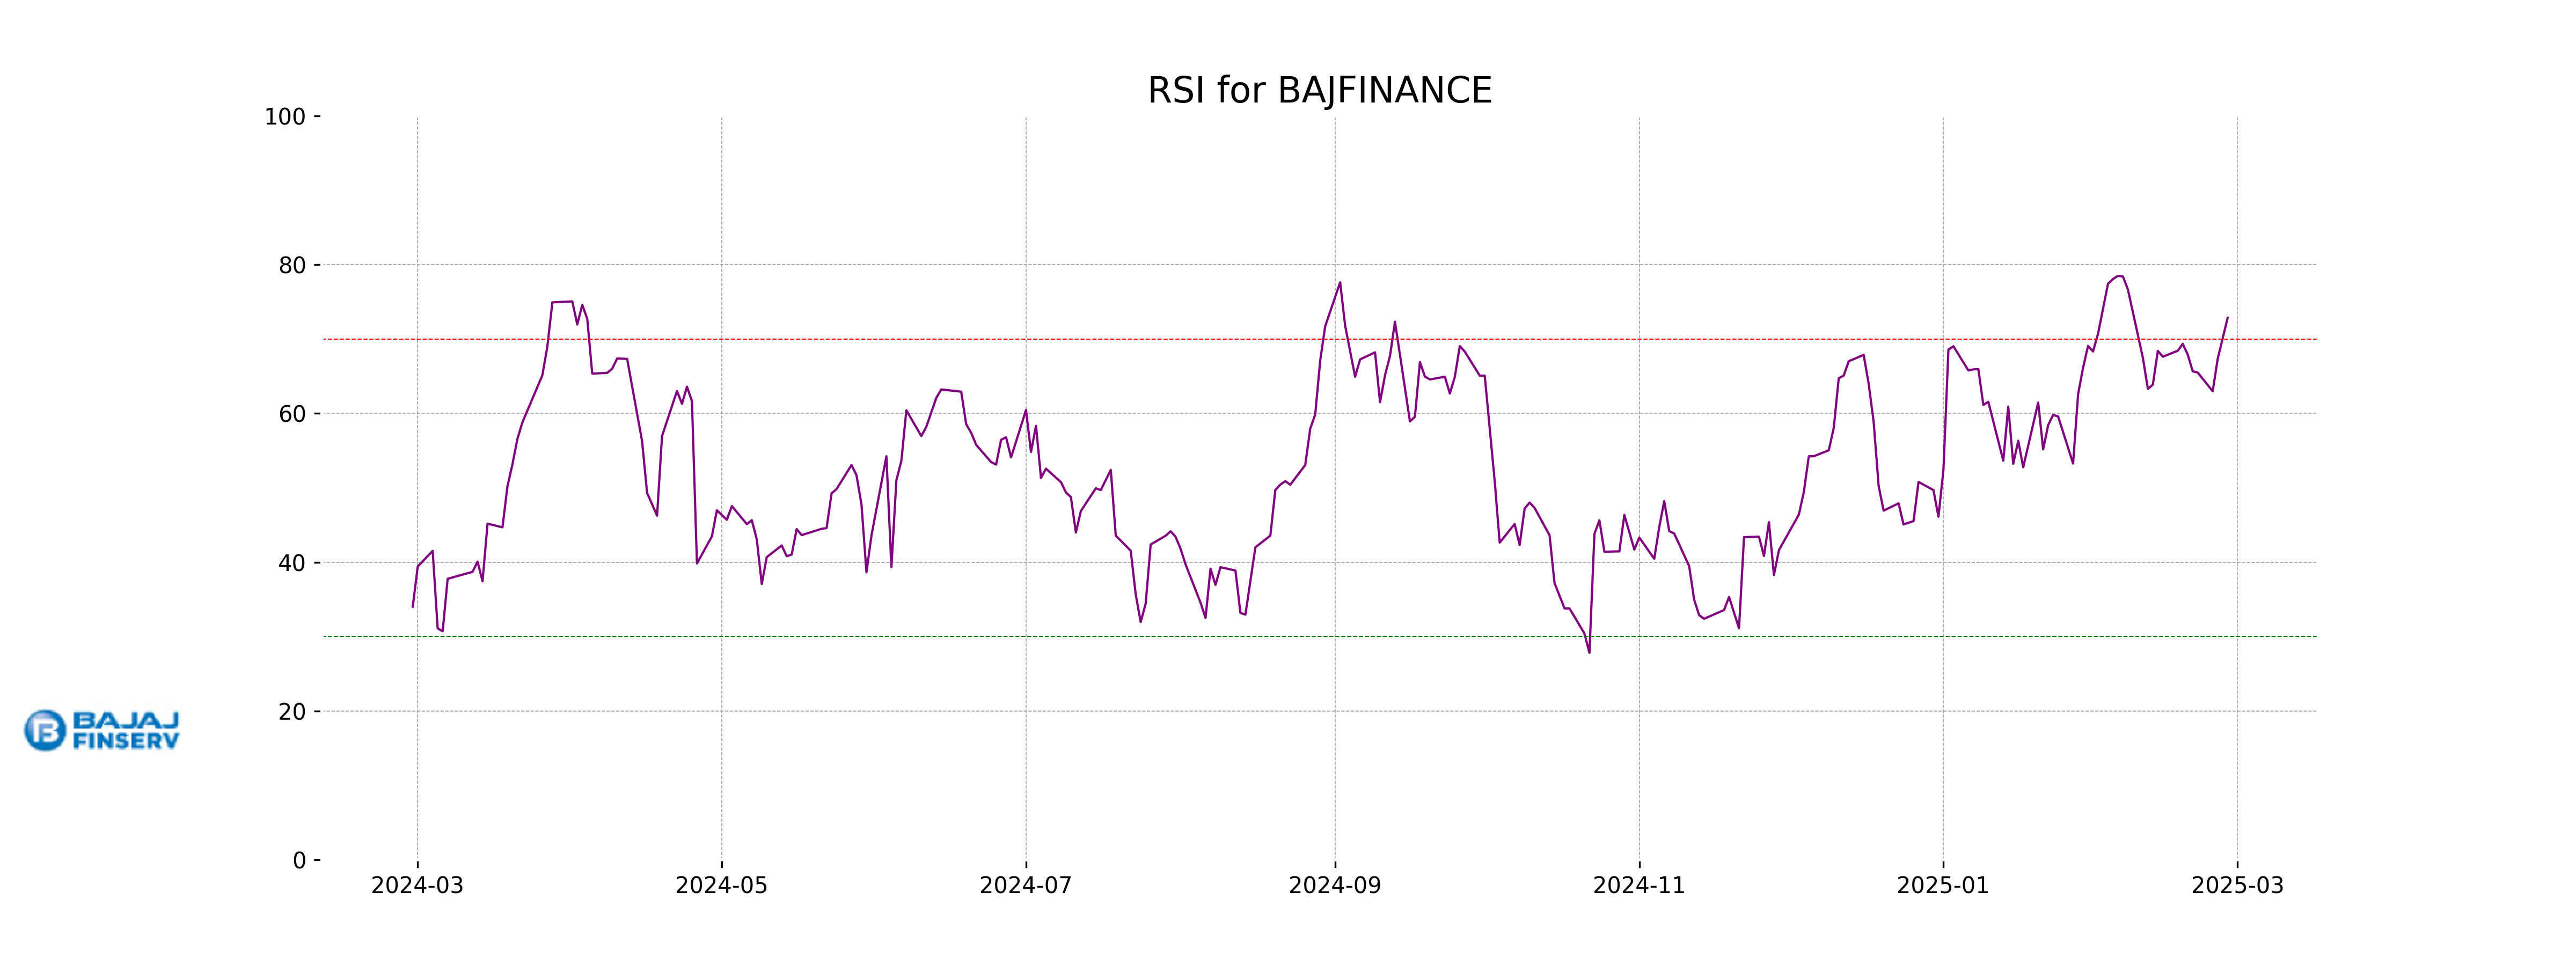
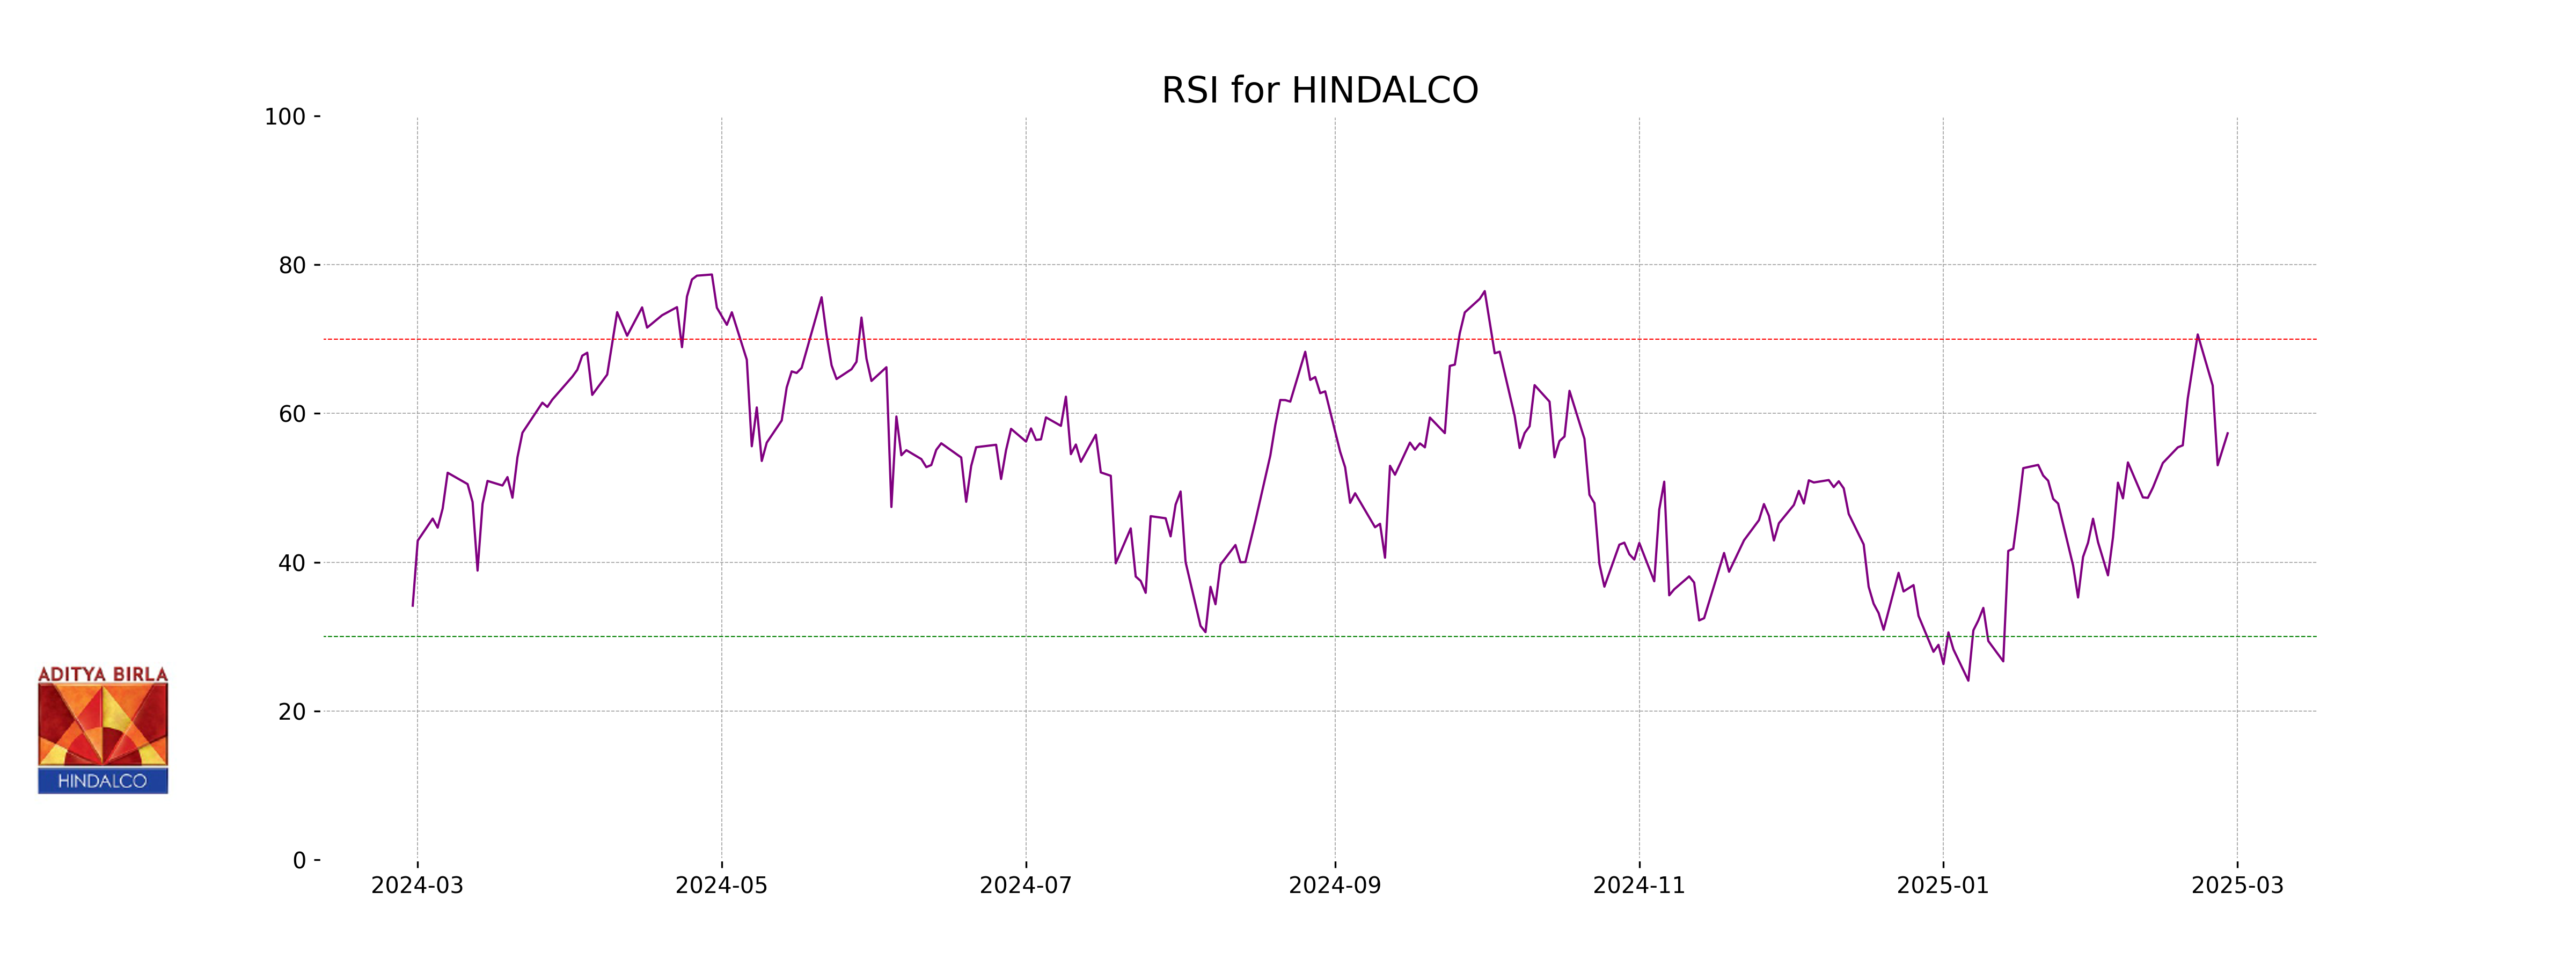
Analysis for HINDALCO - February 27, 2025
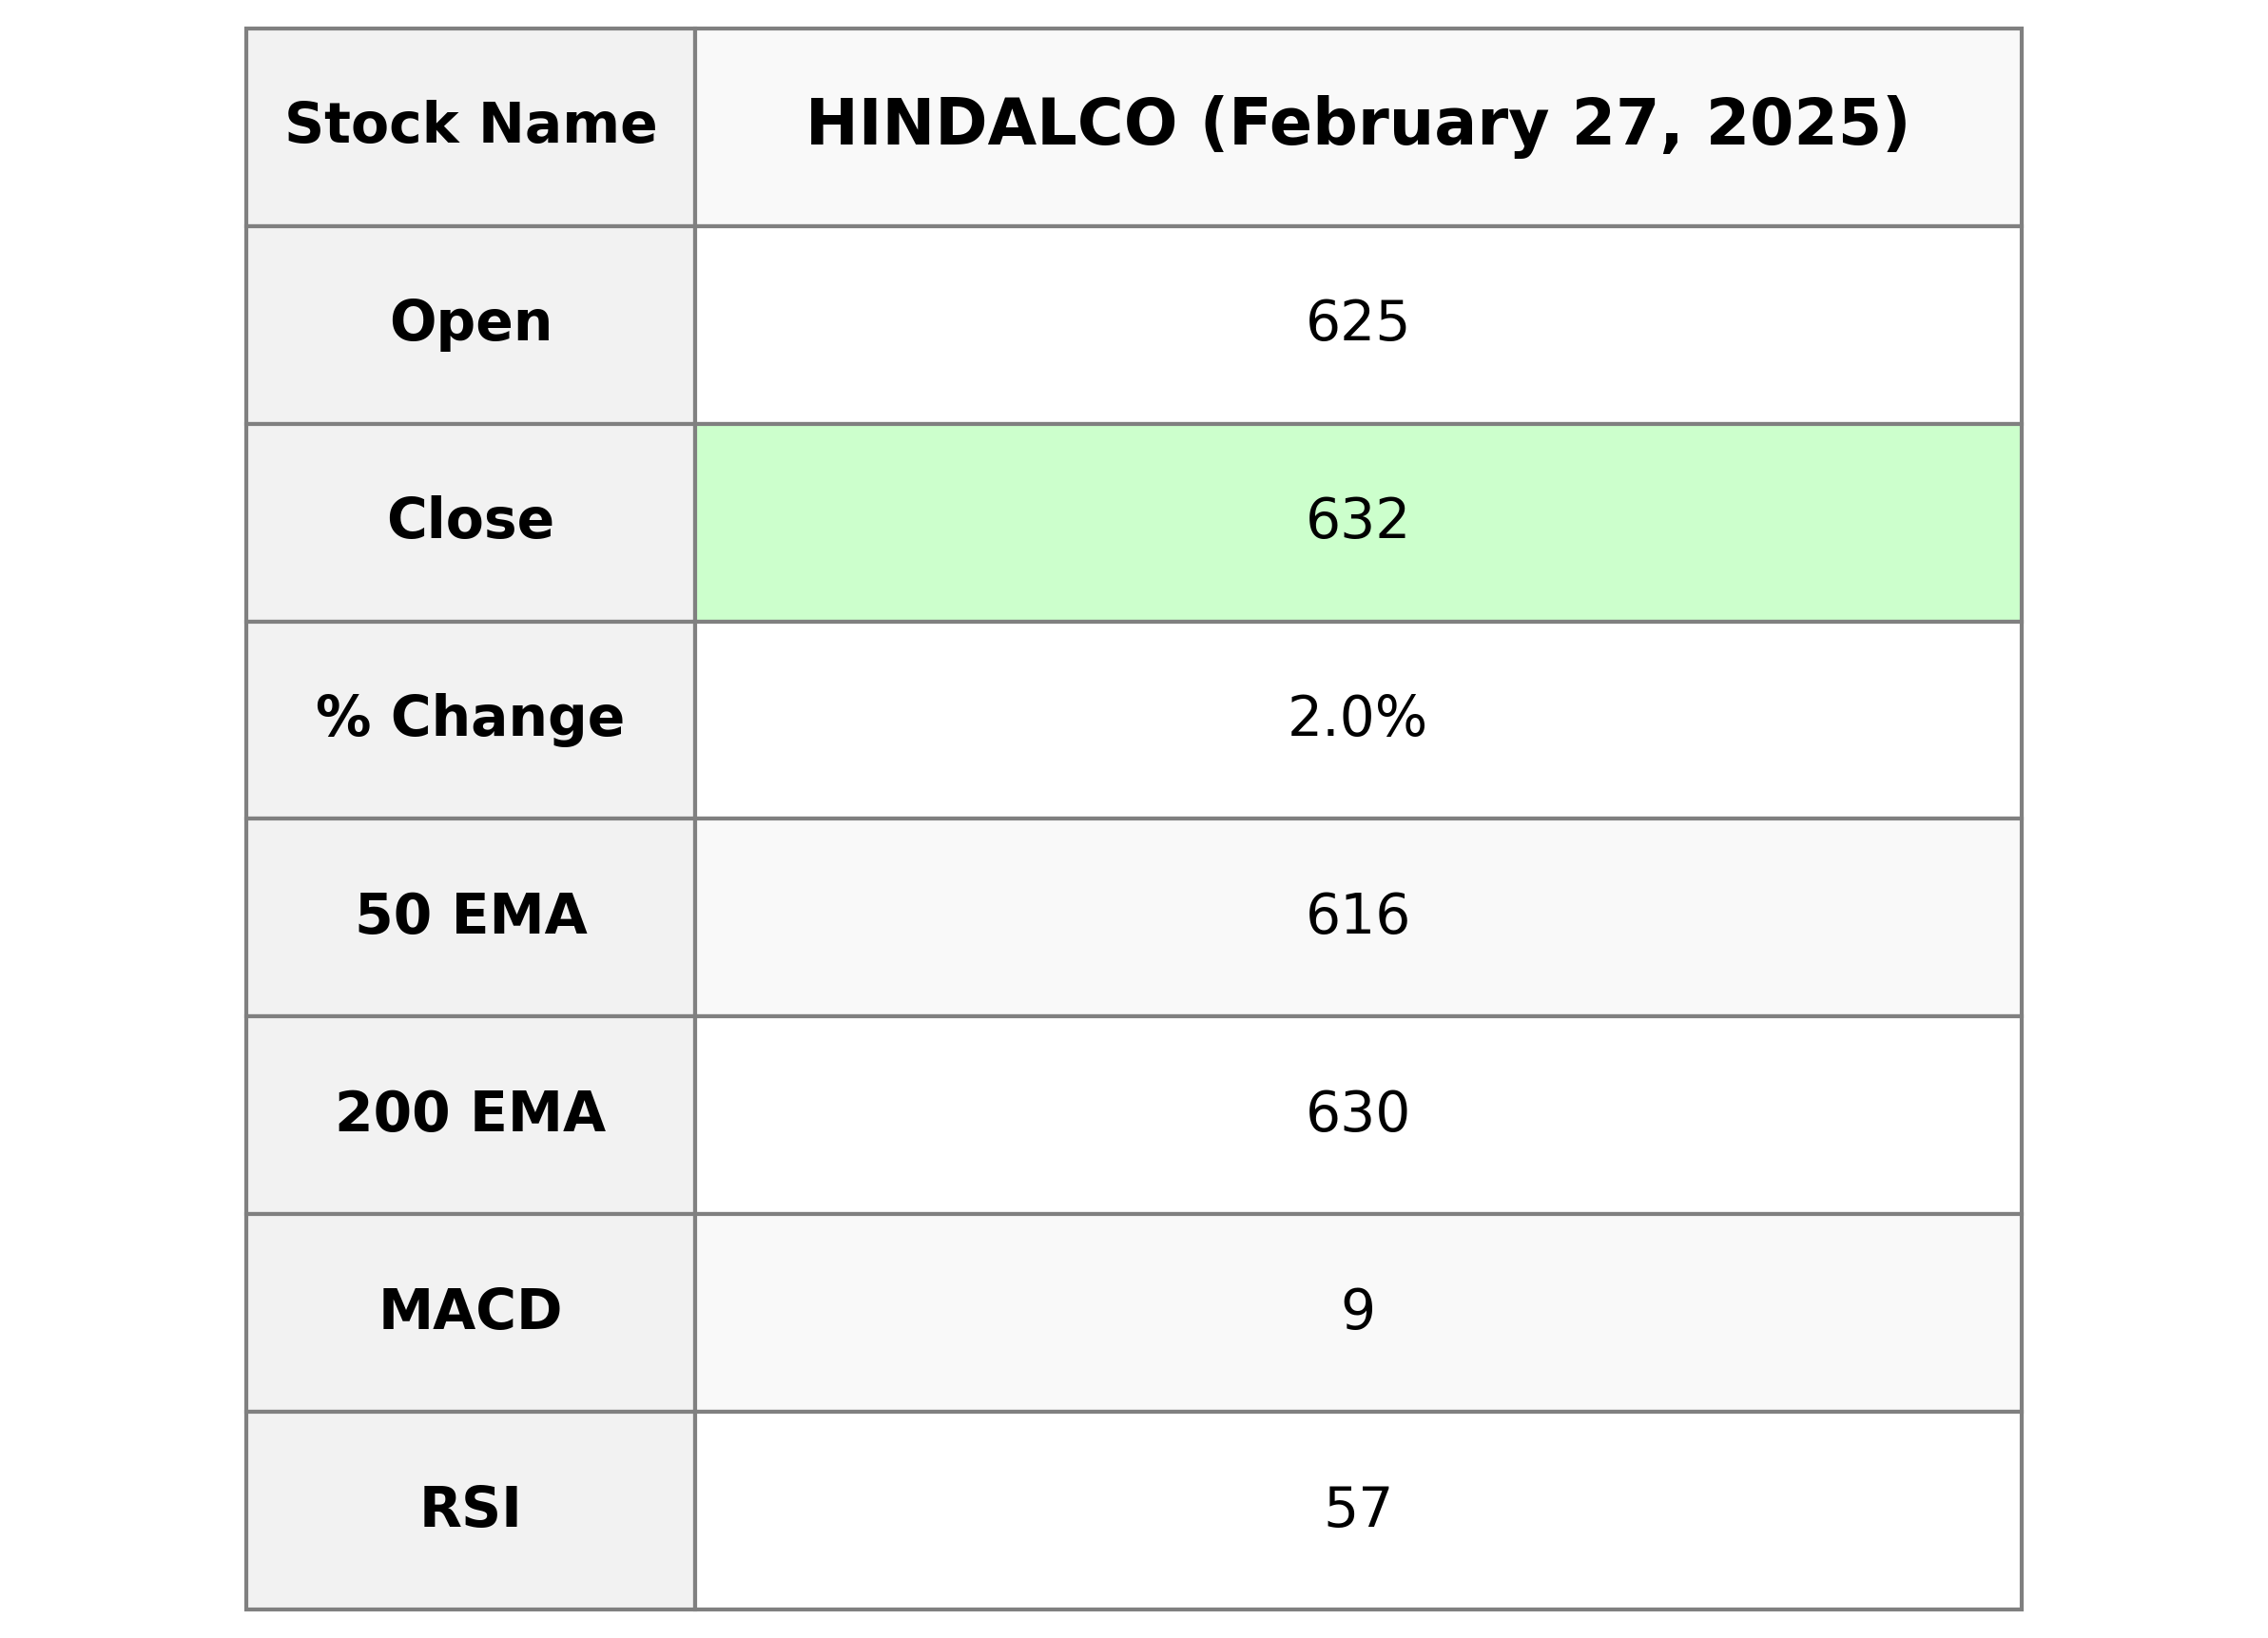
HINDALCO opened at 625.10 and closed at 631.95, marking a positive change with a 2.02% increase and a 12.5 points rise. The stock exhibited strong movement with a high of 633.90 and is above its 50-day EMA but closely aligned with its 200-day EMA, indicating a potential upward trend. With a strong RSI of 57.33 and a PE ratio of 10.12, the aluminum industry giant shows momentum in the basic materials sector in India.
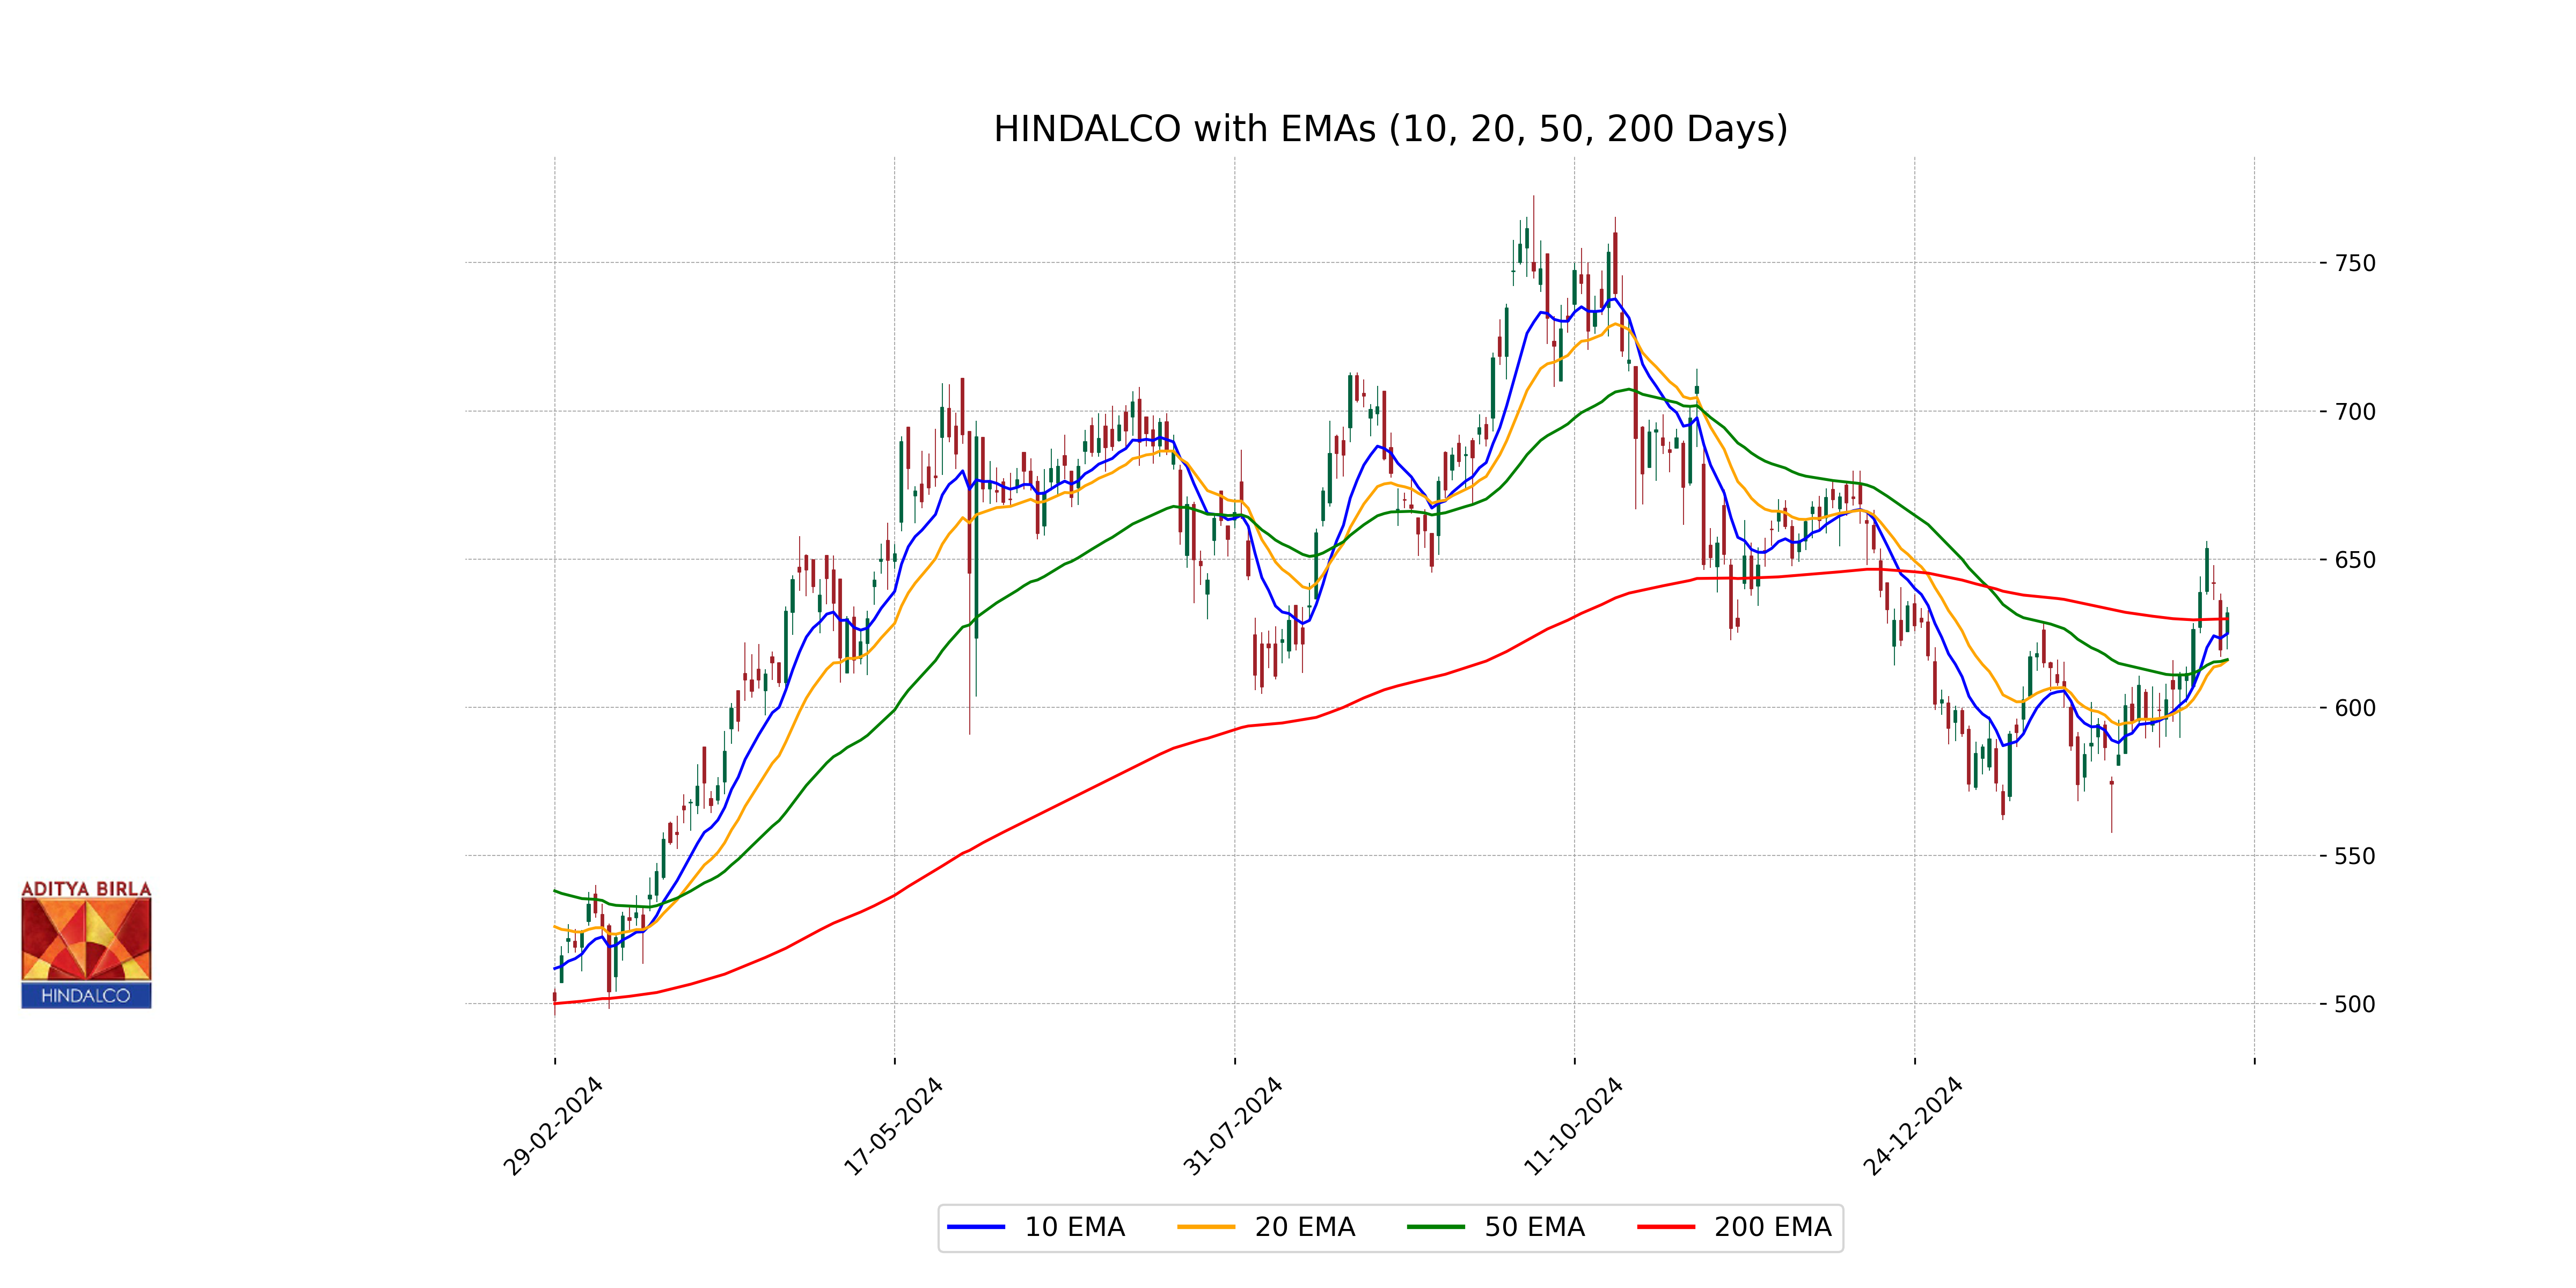
Relationship with Key Moving Averages
The stock HINDALCO is trading above its 50-day EMA of 616.11 and also above its 200-day EMA of 629.87, indicating a positive trend in the short to medium term. Additionally, the price is above the 10-day EMA of 624.86 and the 20-day EMA of 615.85, further suggesting near-term bullish momentum.
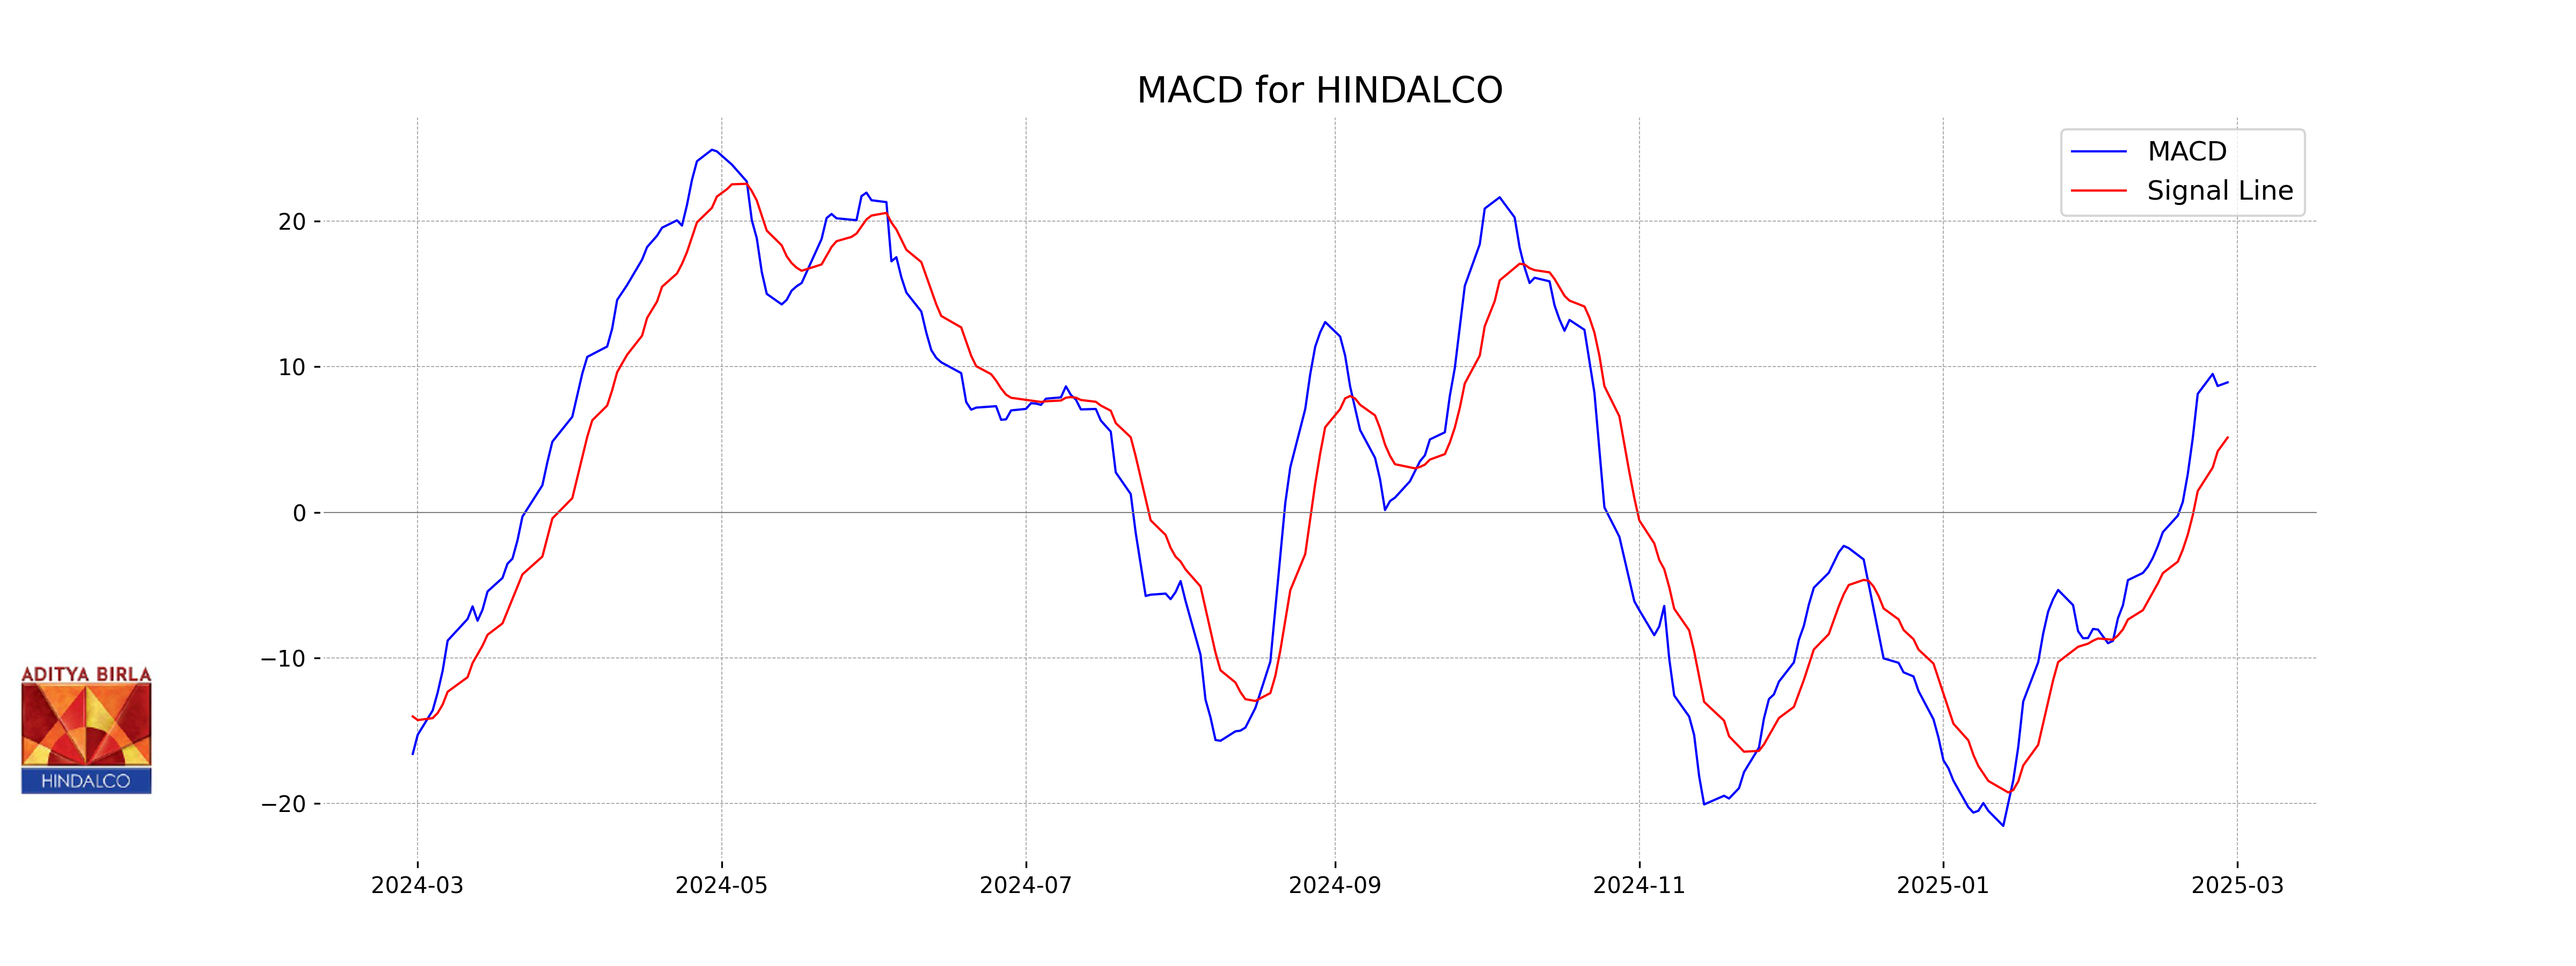
Moving Averages Trend (MACD)
Hindalco's MACD is at 8.93, which is above the MACD Signal line at 5.14, indicating a potential bullish trend. This suggests that upward momentum is strengthening, possibly presenting a buying opportunity. Additionally, RSI at 57.33 signifies a relatively balanced momentum without overbought or oversold conditions.
RSI Analysis
Hindalco's RSI is 57.33, suggesting mild bullish momentum as it is above the neutral 50 level but below the overbought threshold of 70. This indicates some buying demand, while not yet overextended.
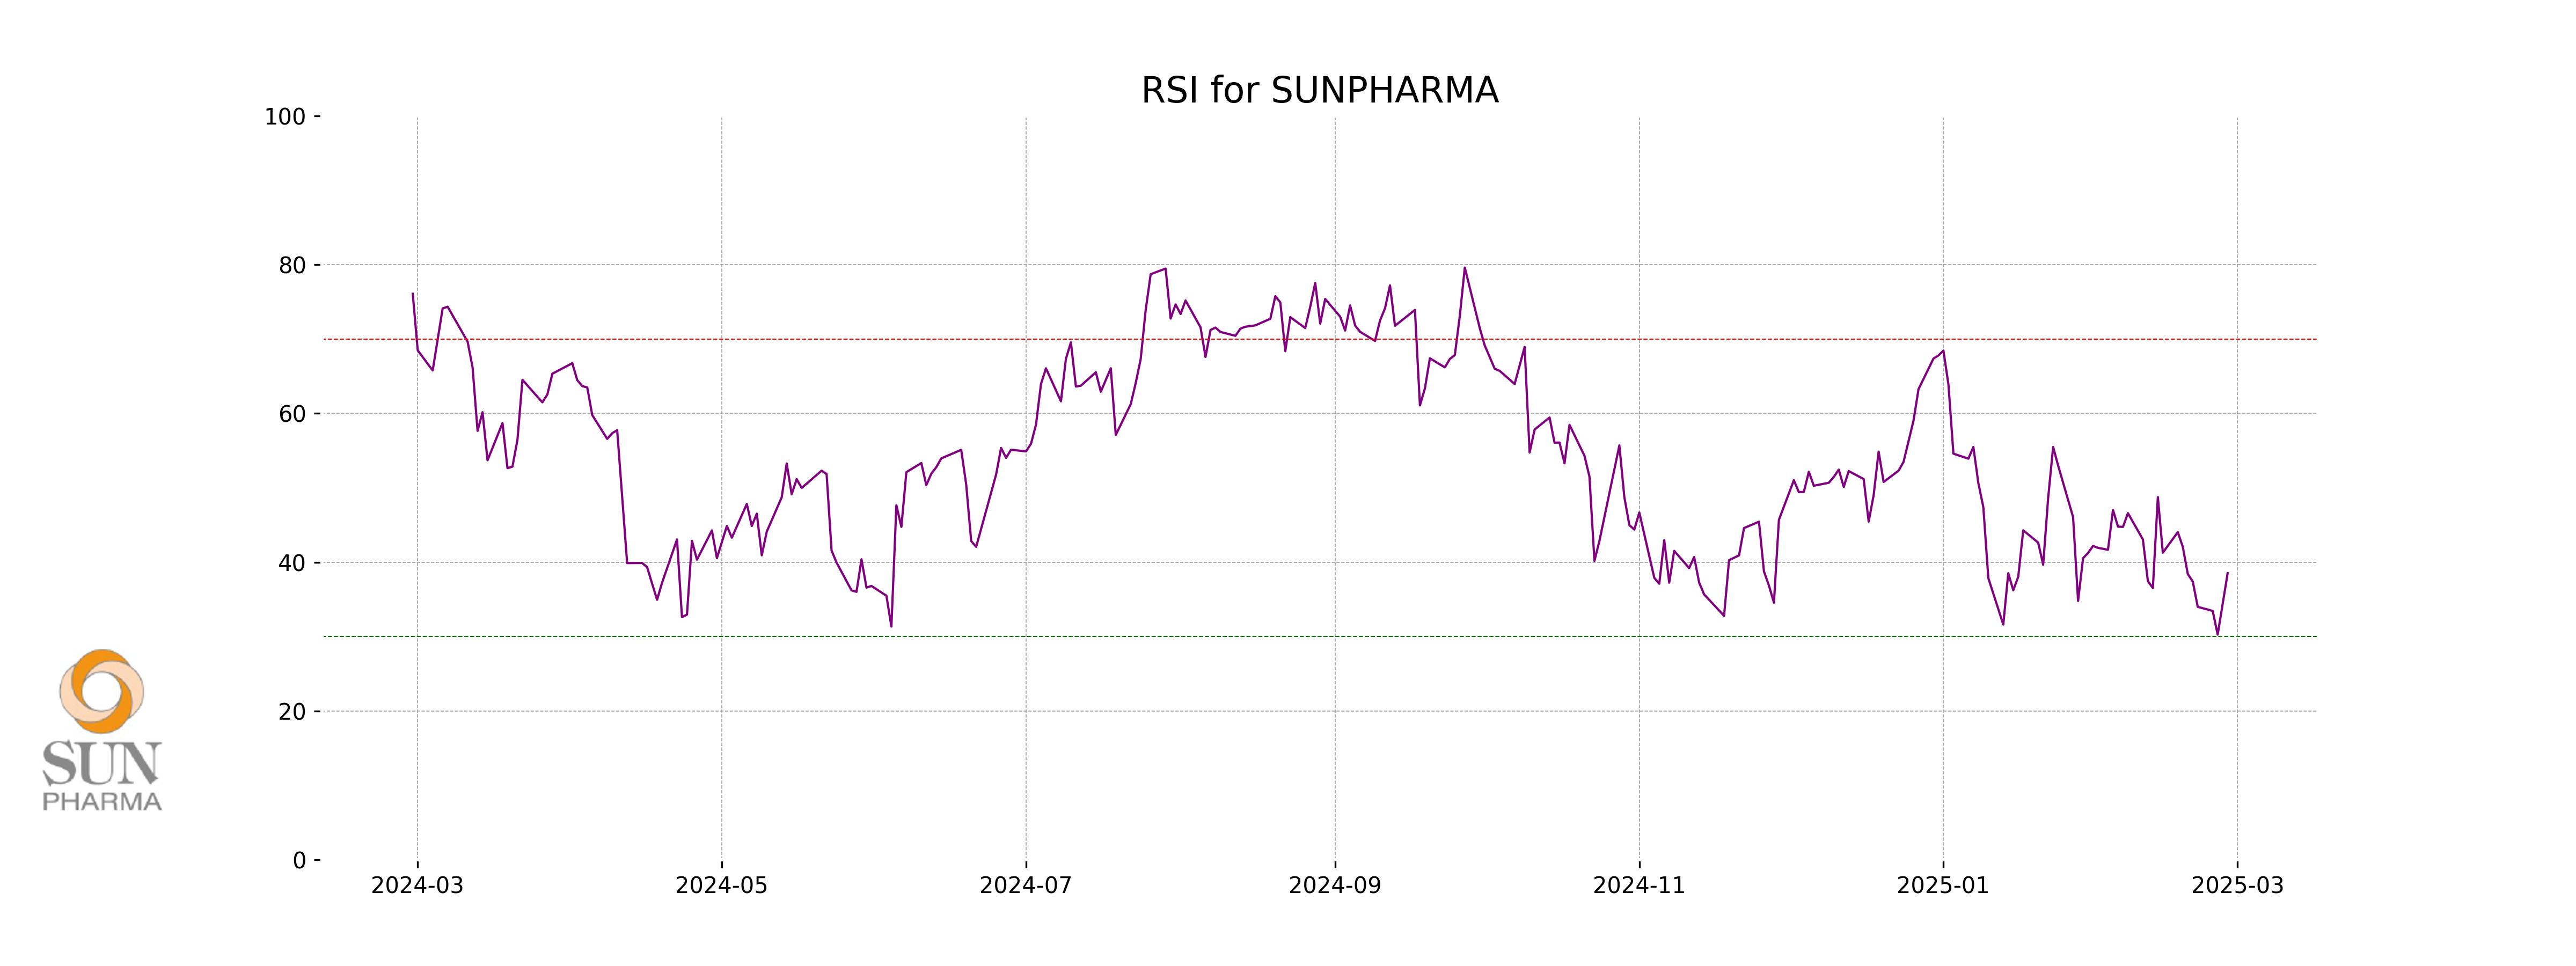
Analysis for SUN Pharma - February 27, 2025
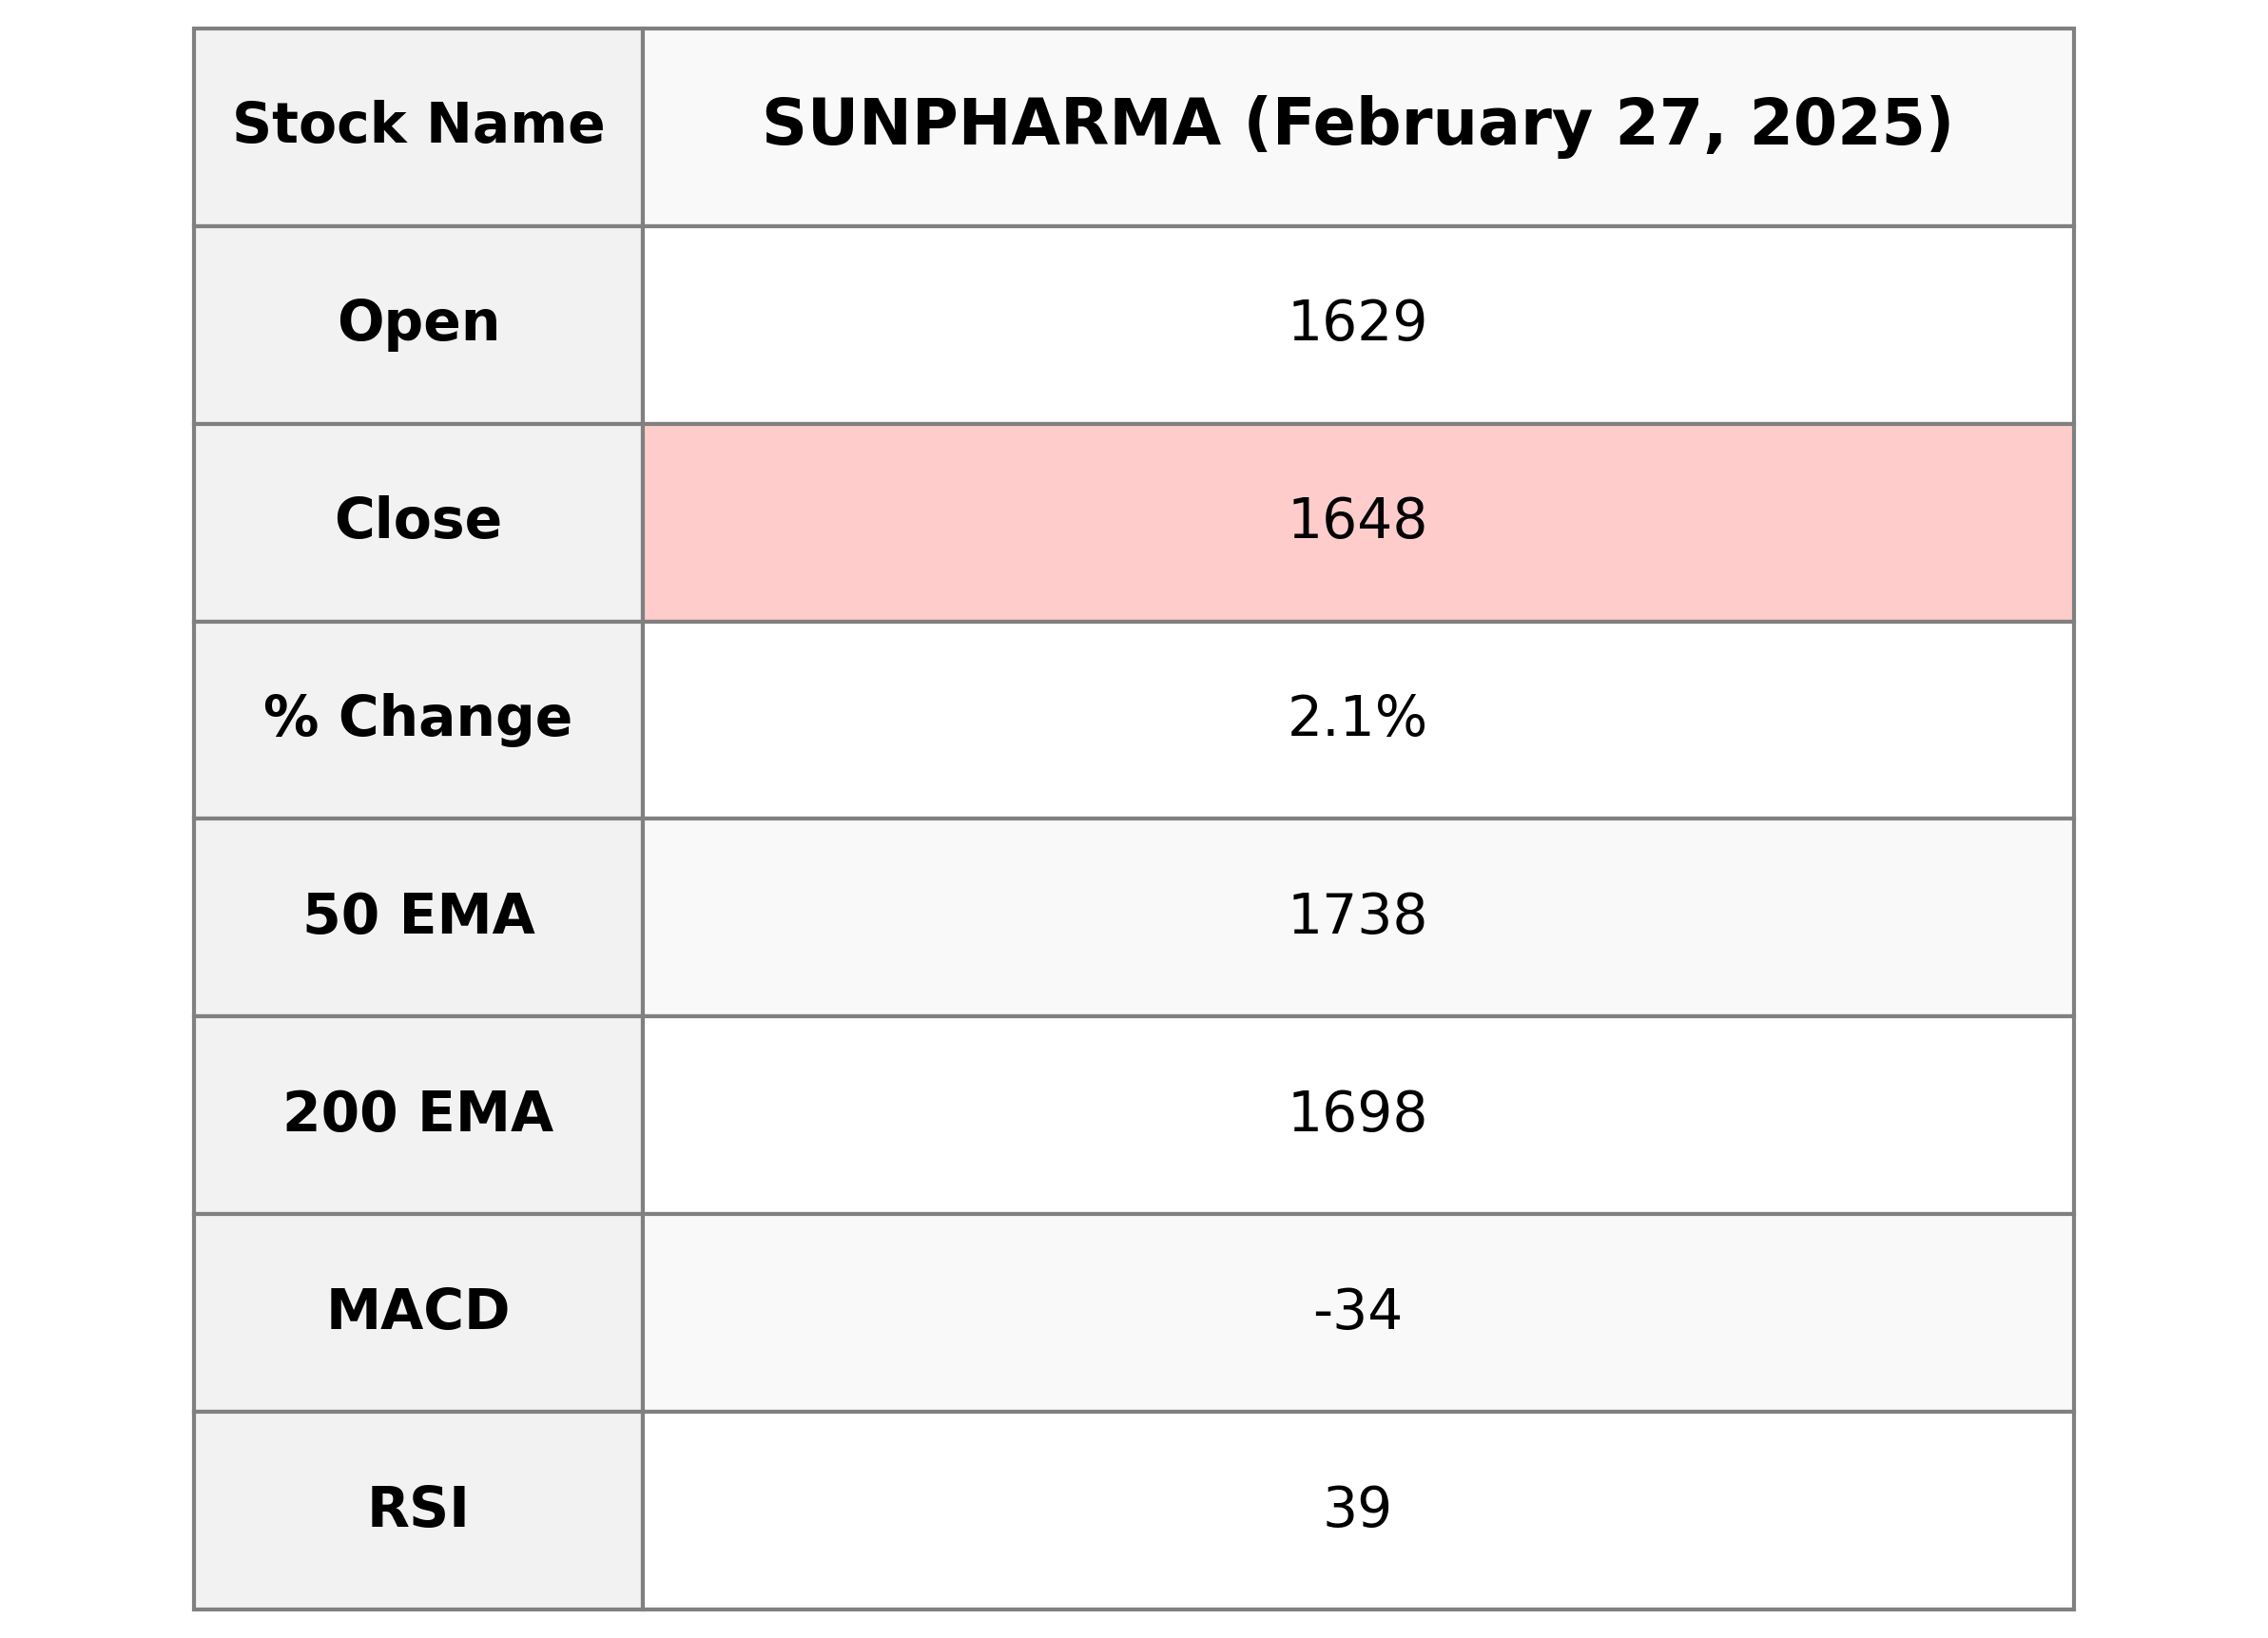
SUN Pharma has shown a positive performance with a closing price of 1647.5, up by 2.10% from the previous close. Despite a high trading volume of 2,744,475, the Relative Strength Index (RSI) suggests it might still be in a weaker position at 38.52. The company's Market Cap stands strong at 3,952,896,376,832, reflecting its substantial presence in the Healthcare sector, specifically within the Drug Manufacturers - Specialty & Generic industry in India.
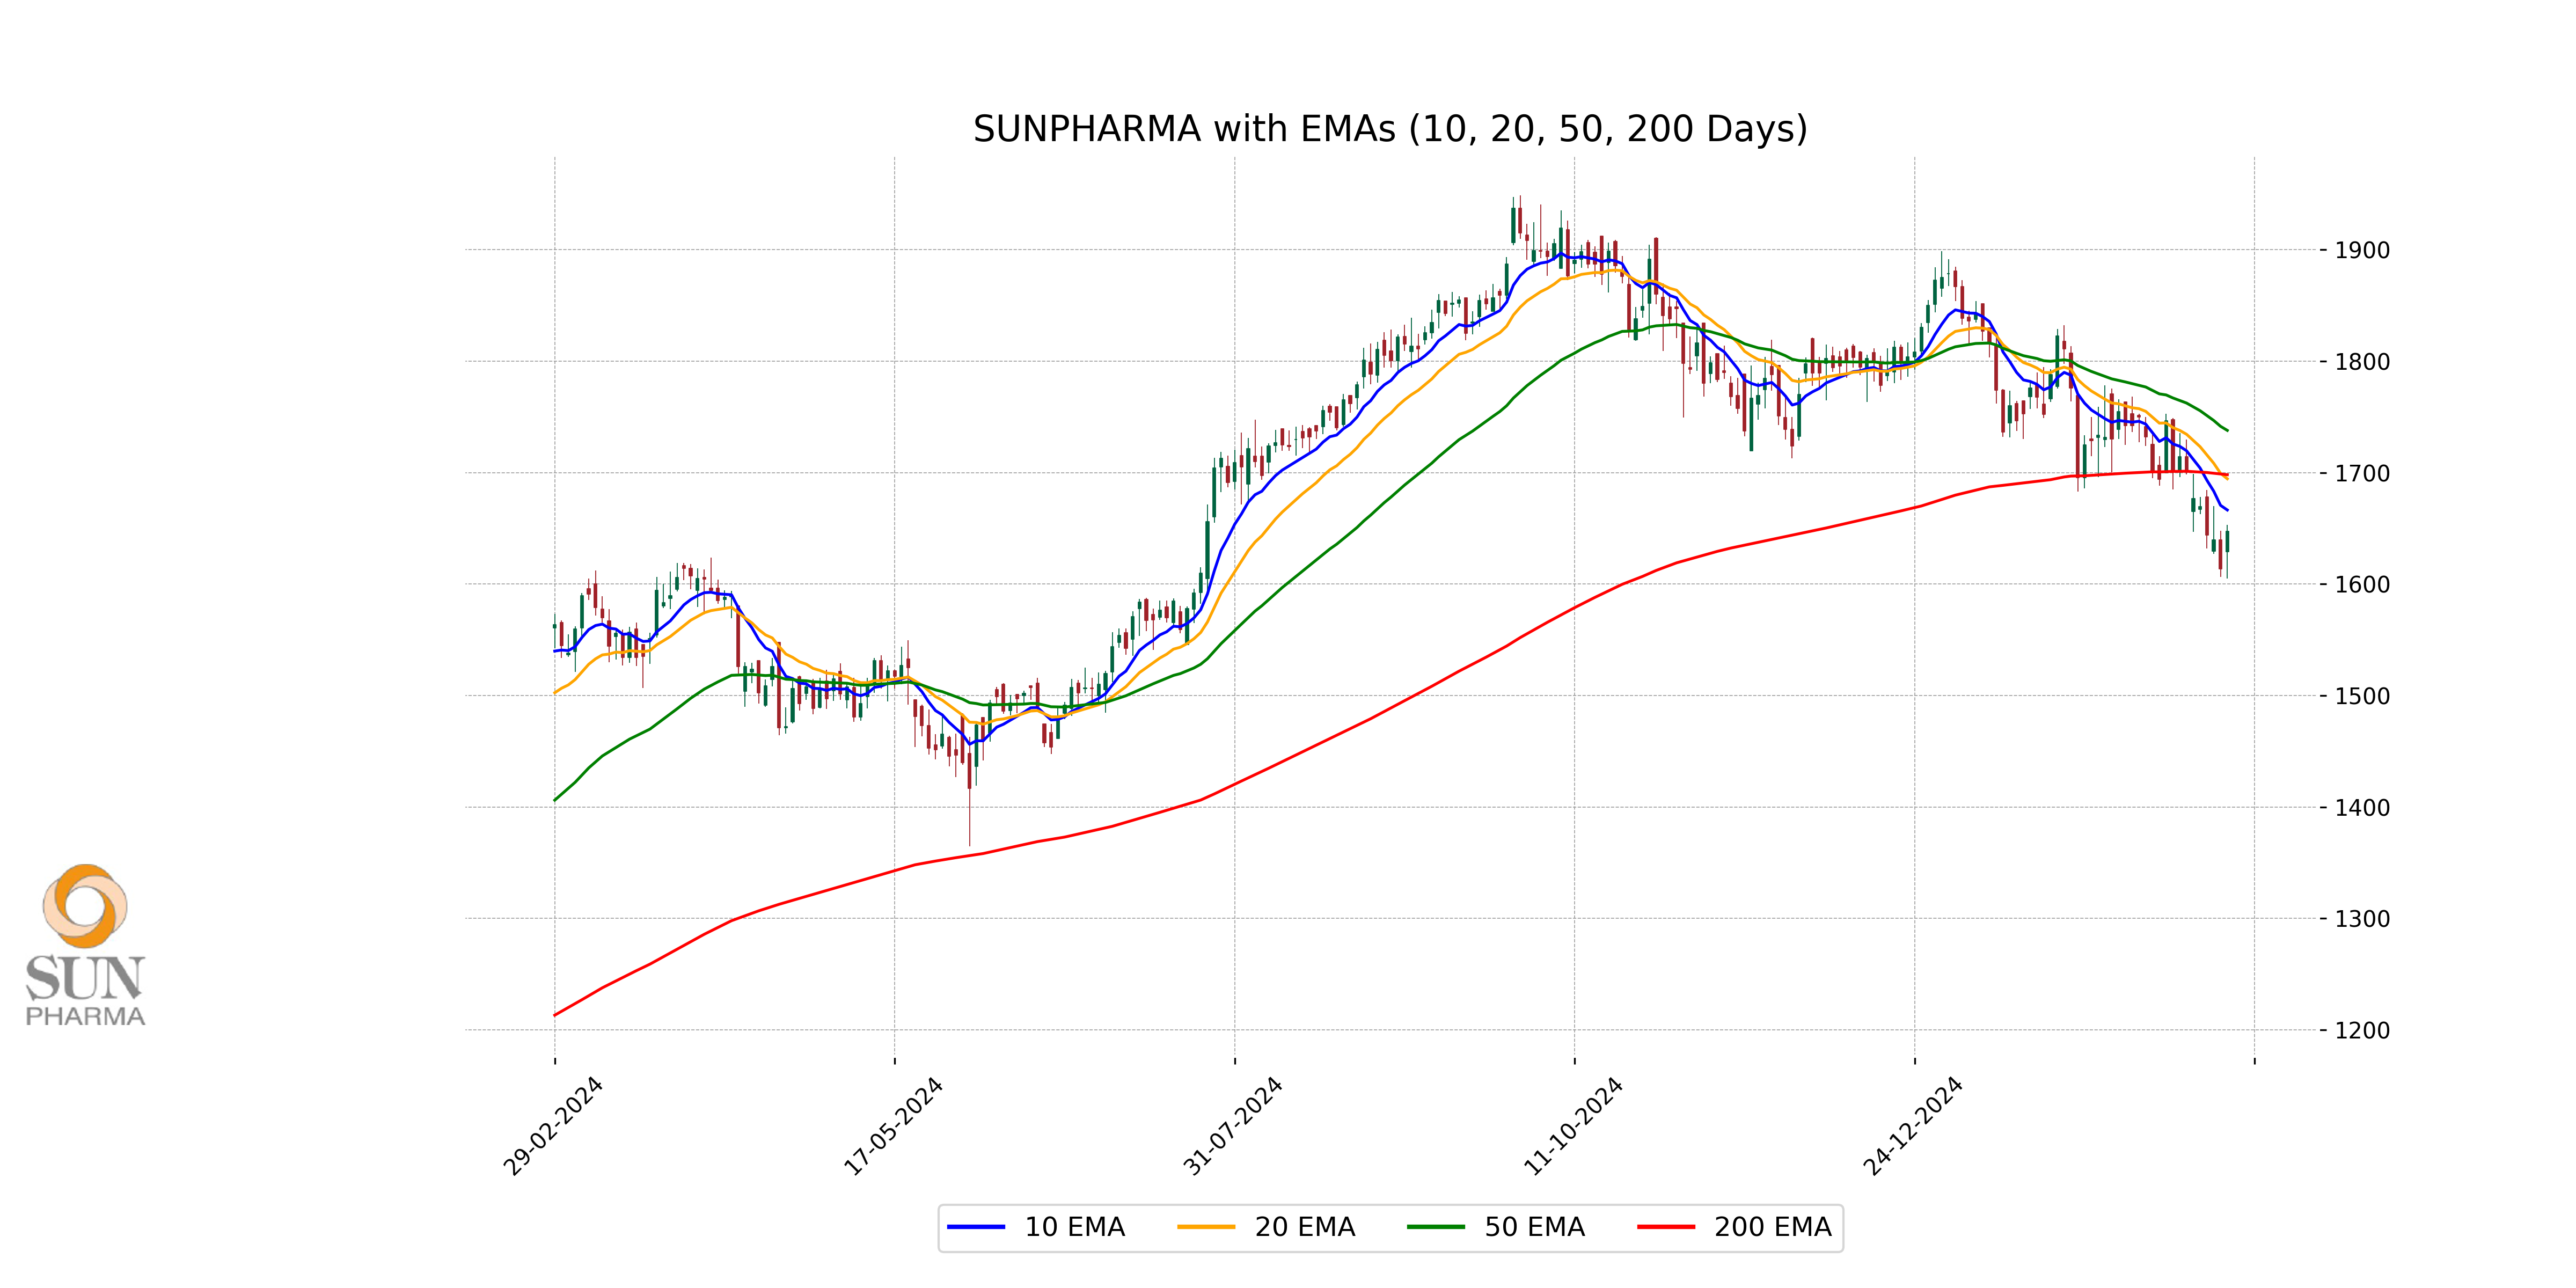
Relationship with Key Moving Averages
SUN Pharma's current closing price of 1647.5 is below its 10-day EMA of 1666.46, 20-day EMA of 1694.45, 50-day EMA of 1737.88, and 200-day EMA of 1698.13, indicating a bearish trend as it is trading below these key averages. This suggests a short-term downward momentum relative to its recent moving averages.
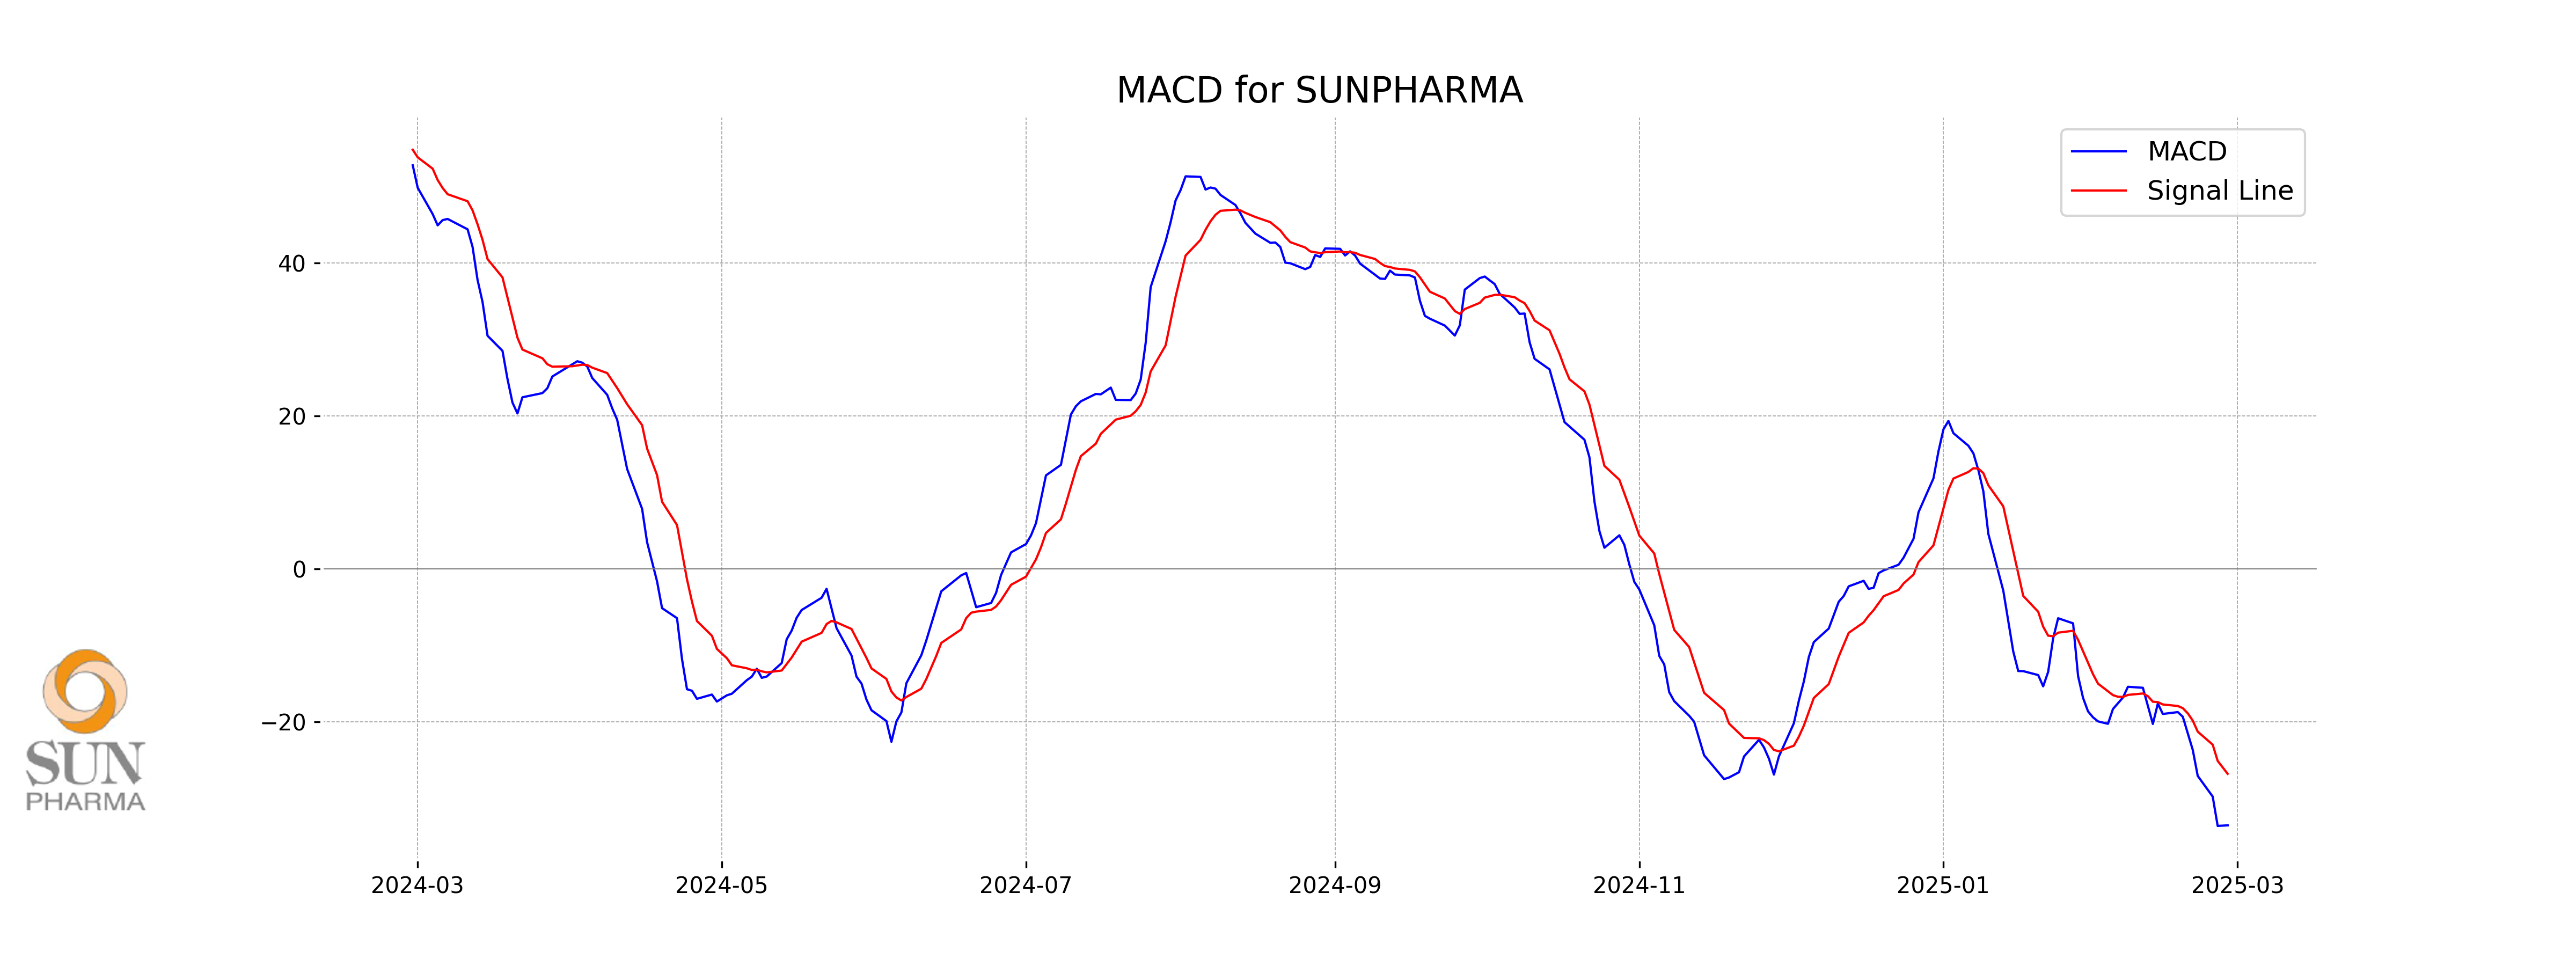
Moving Averages Trend (MACD)
The MACD for SUN Pharma stands at -33.57, while the MACD Signal is -26.83, indicating a bearish signal as the MACD is below the signal line. This suggests that the stock may be experiencing downward momentum.
RSI Analysis
Sun Pharma's RSI (Relative Strength Index) is 38.52, which indicates that the stock is currently in the lower range of neutral, potentially nearing oversold territory. Typically, an RSI below 30 is considered oversold, suggesting that the stock may be undervalued at its current levels if downward momentum continues.
Up Next

NSE Nifty 50 Top gainers: What are the 5 Biggest Stock gainers Today February 27, 2025

Centre plans to borrow Rs 8.20 lakh cr from market in first half of FY27

Reliance denies buying Iranian oil amid US sanctions waiver

Premium petrol price up Rs 2, industrial diesel up Rs 22; no change in normal petrol, diesel rates

India's GDP expected to register over 8 pc growth in Sep-Dec: Report

Govt announces seven measures to help boost exports

More videos

RBI keeps interest rates on hold after US trade deal boosts outlook

RBI proposes to compensate customers up to Rs 25,000 loss due to fraud

RBI raises GDP growth projection of Q1, Q2 of FY27

RBI pauses rate cuts, retains interest rate at 5.25 pc

Rupee jumps 122 paise to close at 90.27 against US dollar on India-US trade deal

Stock markets cheer India-US trade deal: Sensex, Nifty surge 2.5 pc

UPI transactions hit record high of Rs 230 lakh crore in 2025-26 till Dec: Govt

Explained: India-US trade deal, tariffs and trade benefits

Trade deal with US adds momentum to India's growth ambition: Industry leaders

Rupee jumps 119 paise to 90.30 against the US dollar on India-US trade deal