


Highlights
Latest news

RBI announces Rs 30,000 crore G-Sec underwriting auction, releases OMO purchase results

Sriram Raghavan, Dibakar Banerjee, other filmmakers onboard to judge films at MAMI Mumbai Film Festival 2026

Gold should now be seen more as an "insurance policy", SIP route advisable at current levels: Analysts

AAP MLA Hemant Khava flags poor road conditions, questions toll tax usage in Gujarat

AAP calls Punjab district panchayat win historic, eyes Gujarat local body polls

Gujarat AAP MLA Chaitar Vasava questions police action against tribal villagers in Banaskantha

Sitharaman introduced Securities Markets Code Bill in Lok Sabha, proposes to send it to parliamentary committee

OnePlus 15R review: A clear shift in what the R-series stands for
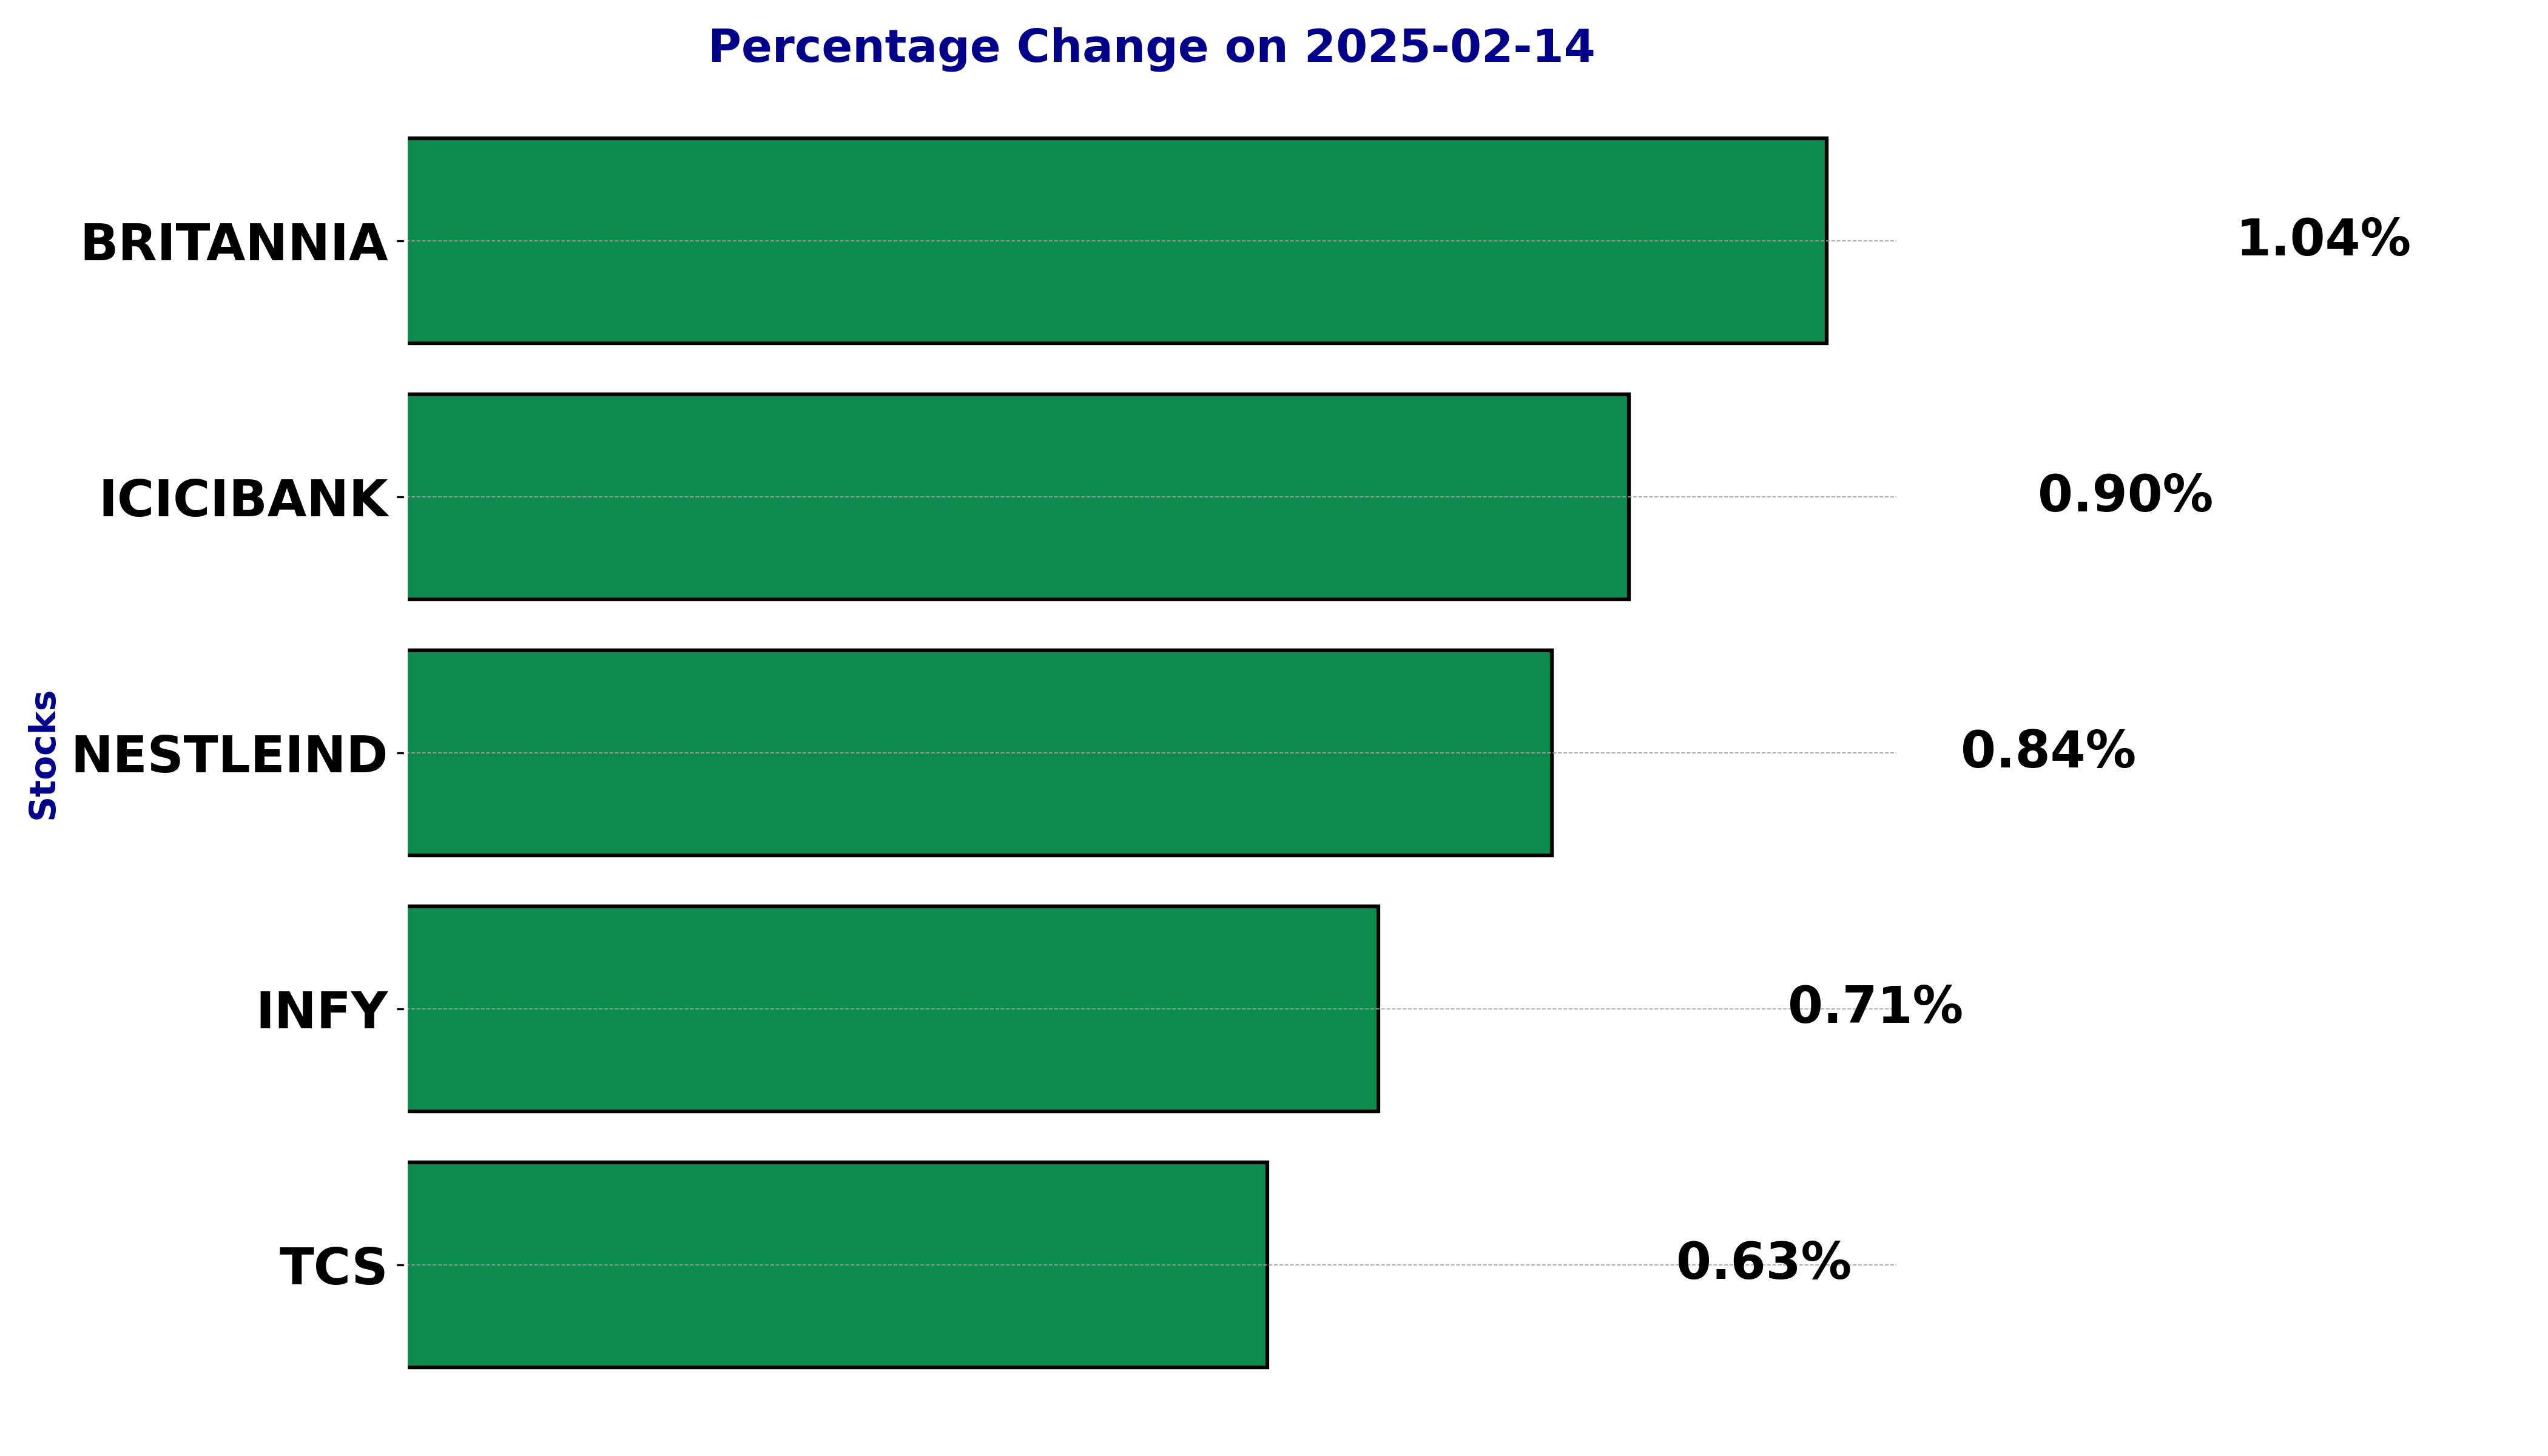
NSE Nifty 50 Top gainers: What are the 5 Biggest Stock gainers Today February 14, 2025


In this article, we will explore the technical indicators of some of the high-performing stocks on the Indian stock market, including BRITANNIA, ICICIBANK, INFY, NESTLEIND, and TCS.
By looking at these stocks through the lens of key technical factors, we aim to better understand their price movements, trends, and potential future performance.
Analysis for Britannia - February 14, 2025
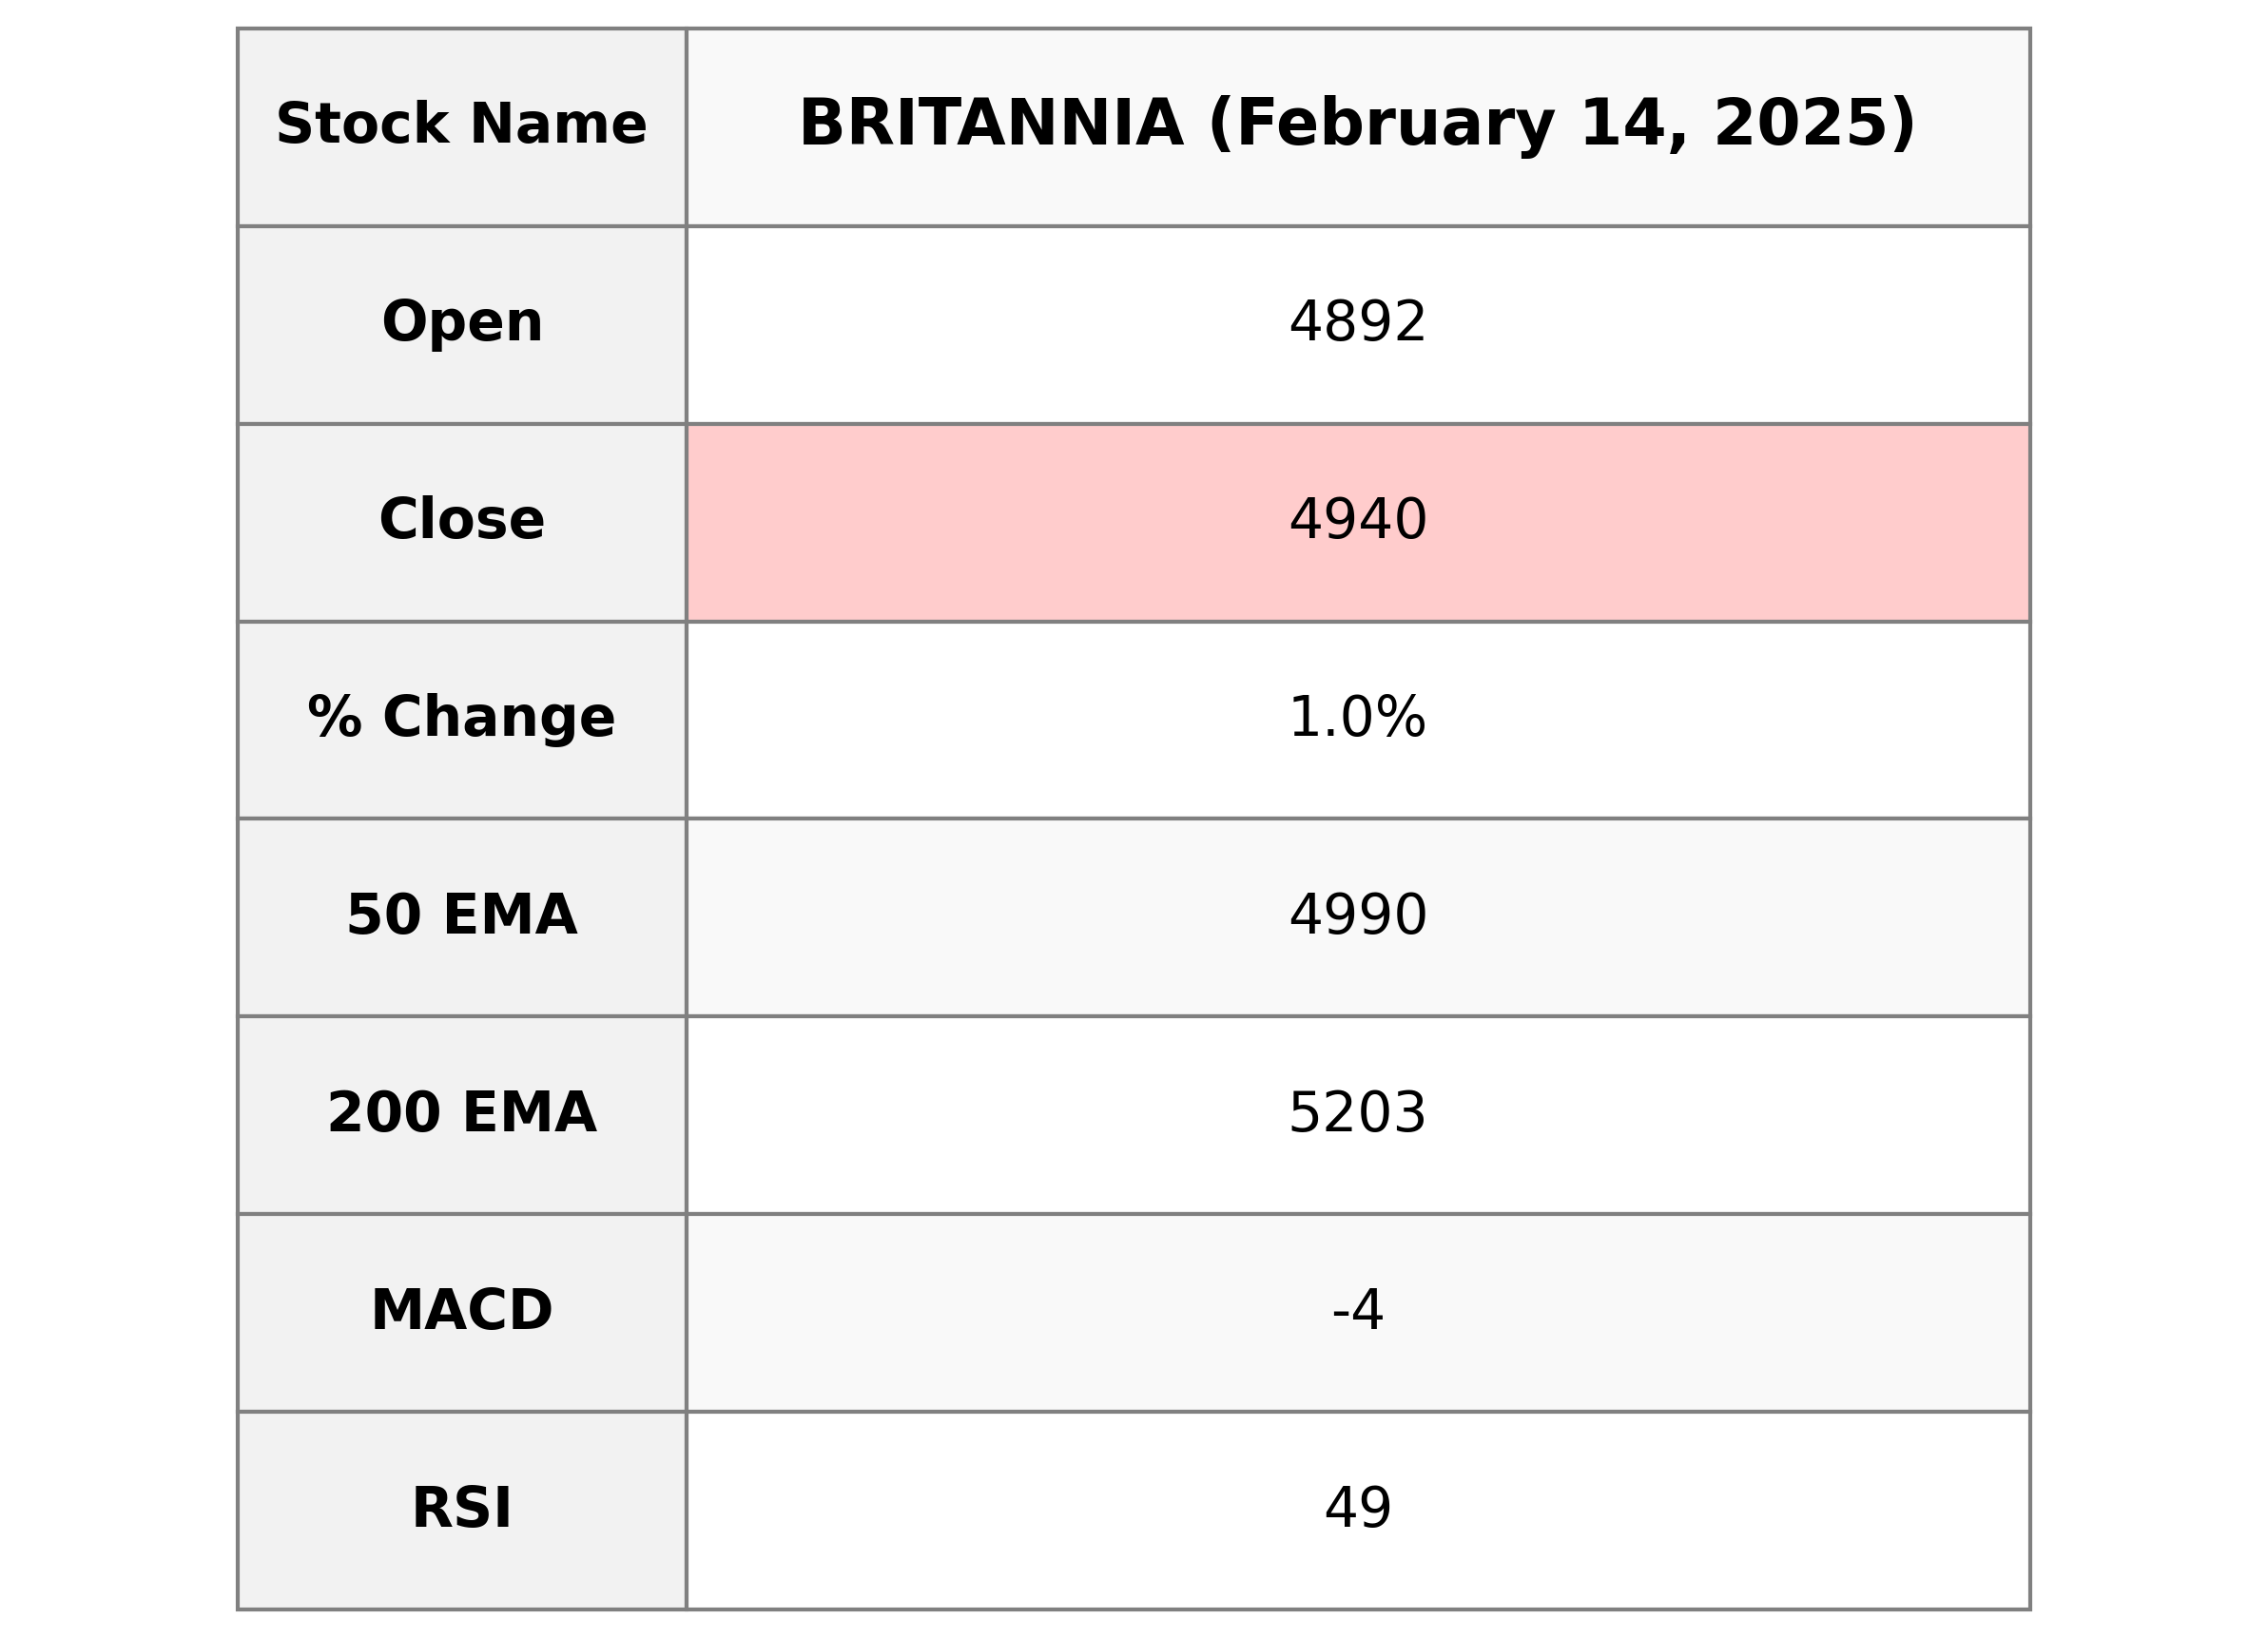
**Britannia** The stock opened at 4891.70 and closed at 4939.65, showing a percentage change of 1.04%. The volume recorded was 489,219 shares. Currently, the RSI stands at 49.07, which indicates it is neither overbought nor oversold. The company operates within the Consumer Defensive sector, specifically in Packaged Foods, and has a market cap of approximately 1.19 trillion INR.
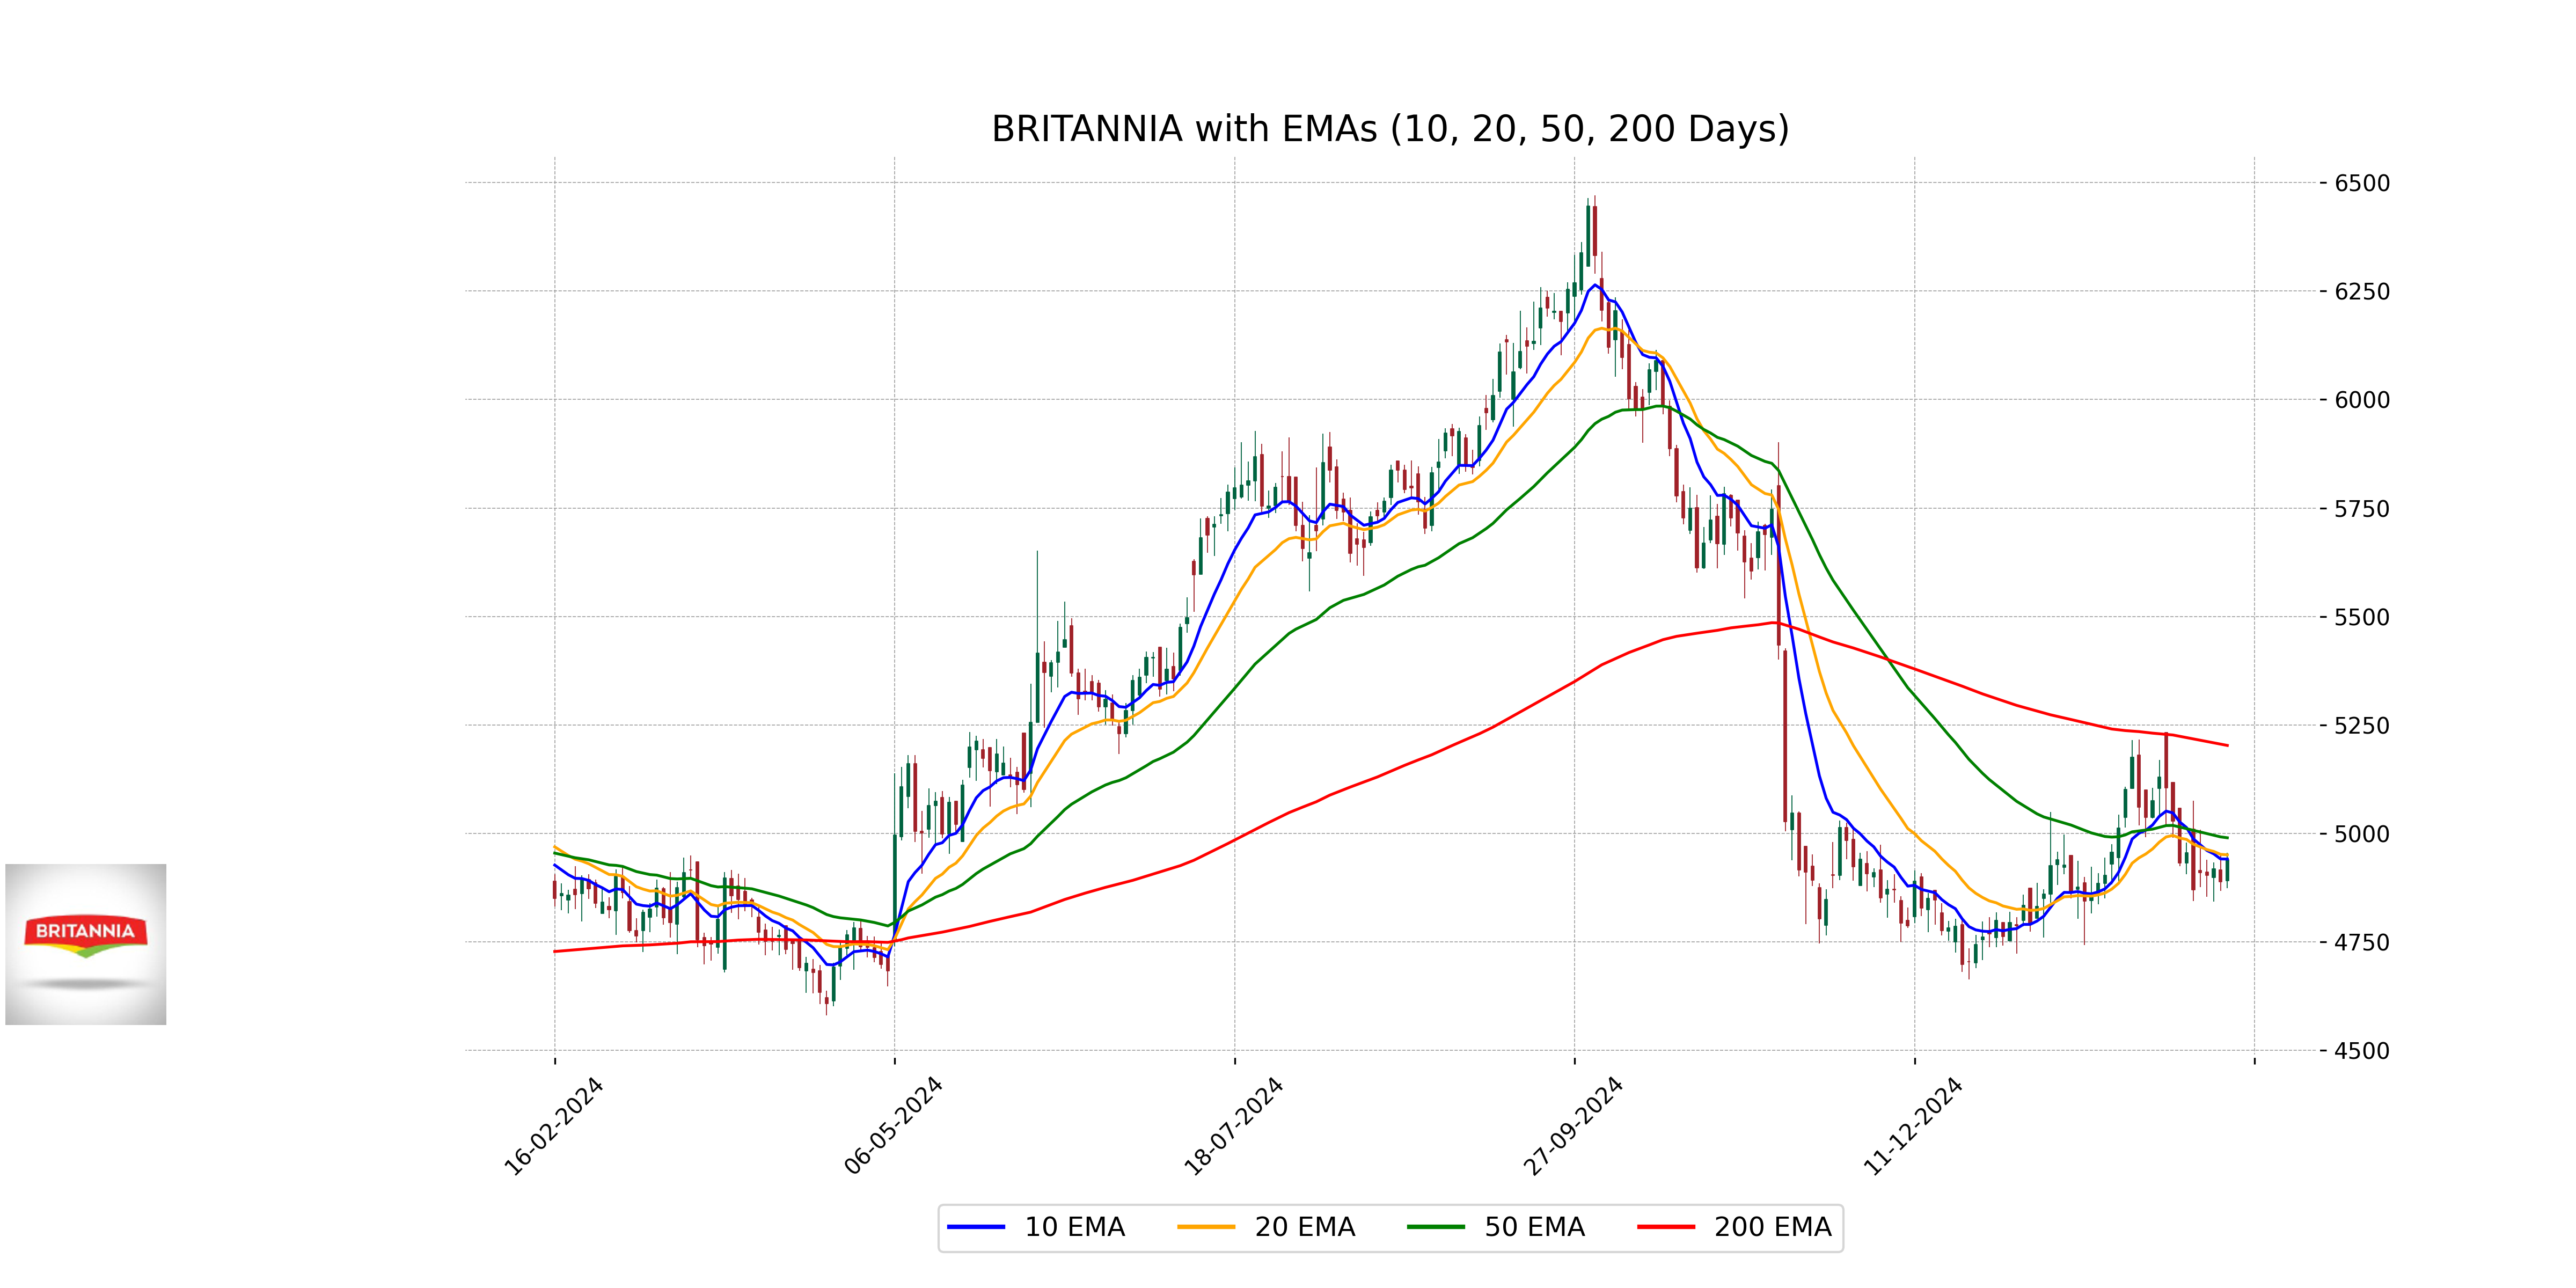
Relationship with Key Moving Averages
Britannia's current close at 4939.65 is below its 50-day EMA at 4990.13 and significantly below its 200-day EMA at 5202.90, indicating potential short-term and long-term bearish trends. However, the close is very close to the 10-day EMA at 4941.09 and near the 20-day EMA at 4950.80, suggesting neutrality in the short-to-medium term trends.
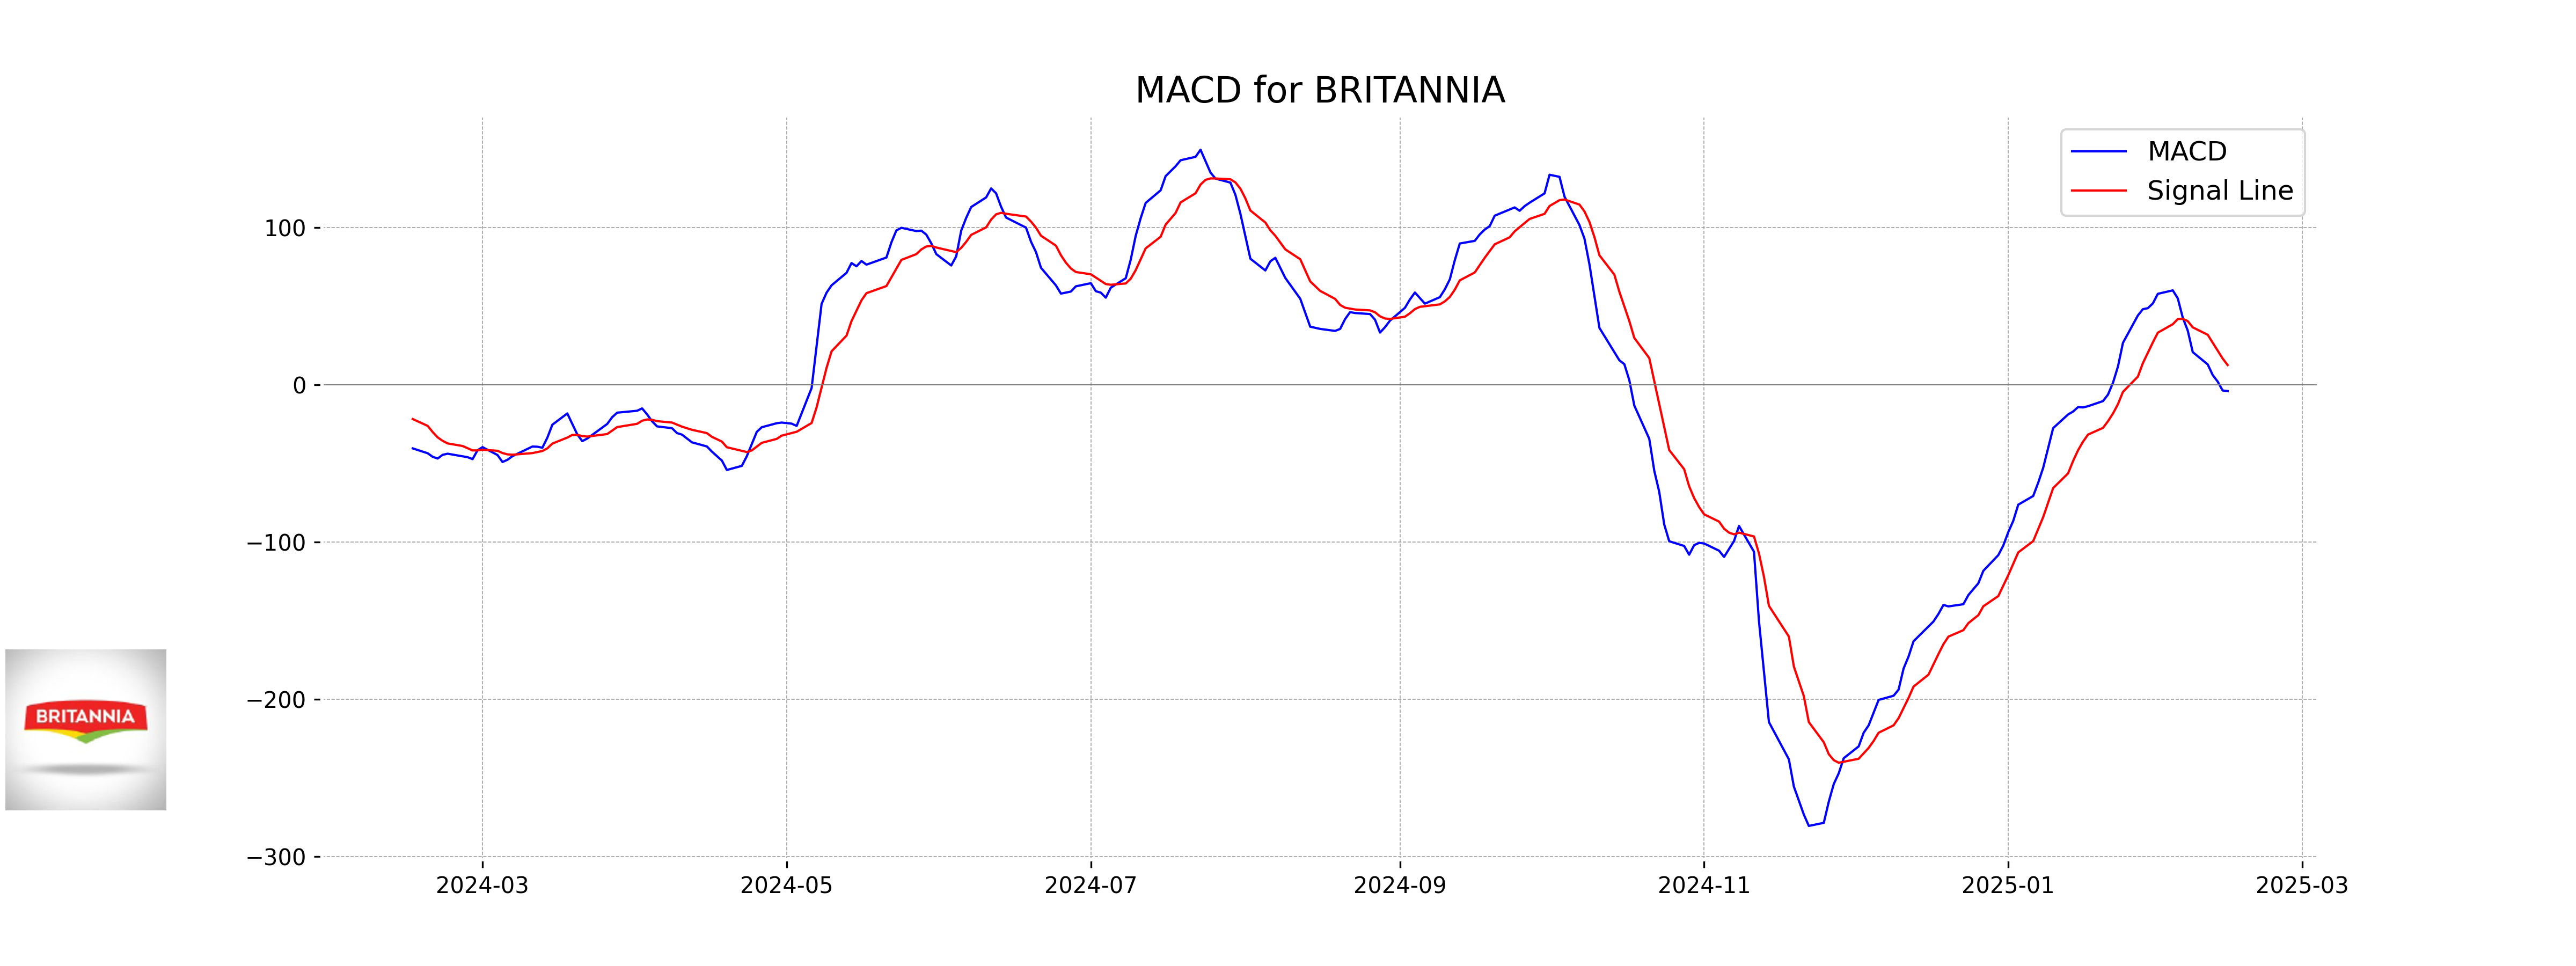
Moving Averages Trend (MACD)
**MACD Analysis for Britannia:** The MACD is currently at -3.96, which is below the MACD Signal of 12.58. This indicates a bearish trend as the MACD line is below the signal line, suggesting potential downward momentum.
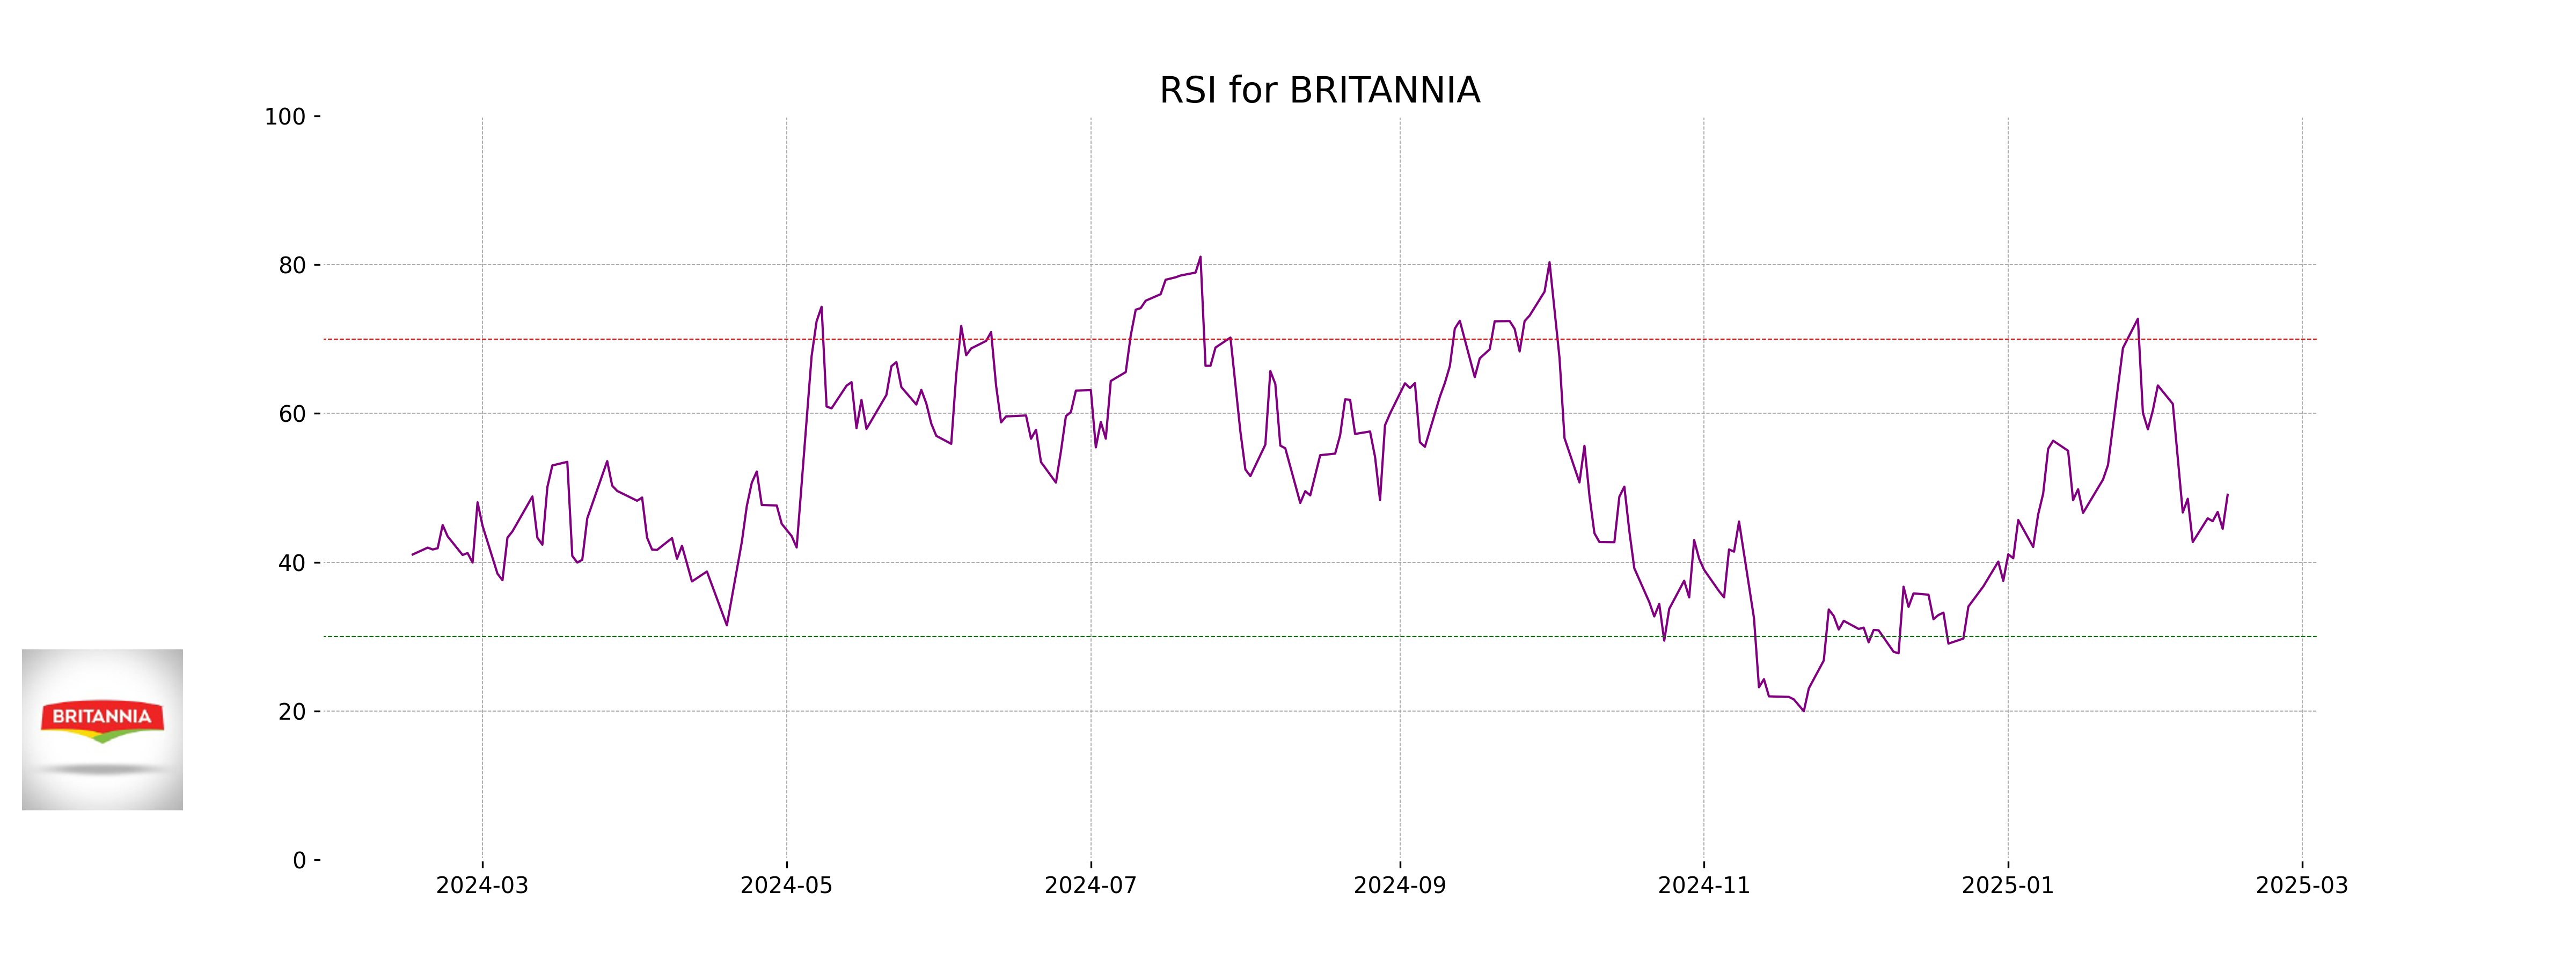
RSI Analysis
RSI Analysis for Britannia: The Relative Strength Index (RSI) for Britannia is 49.07, which is close to the neutral level of 50. This suggests that the stock is neither overbought nor oversold at the moment, indicating a balanced momentum.
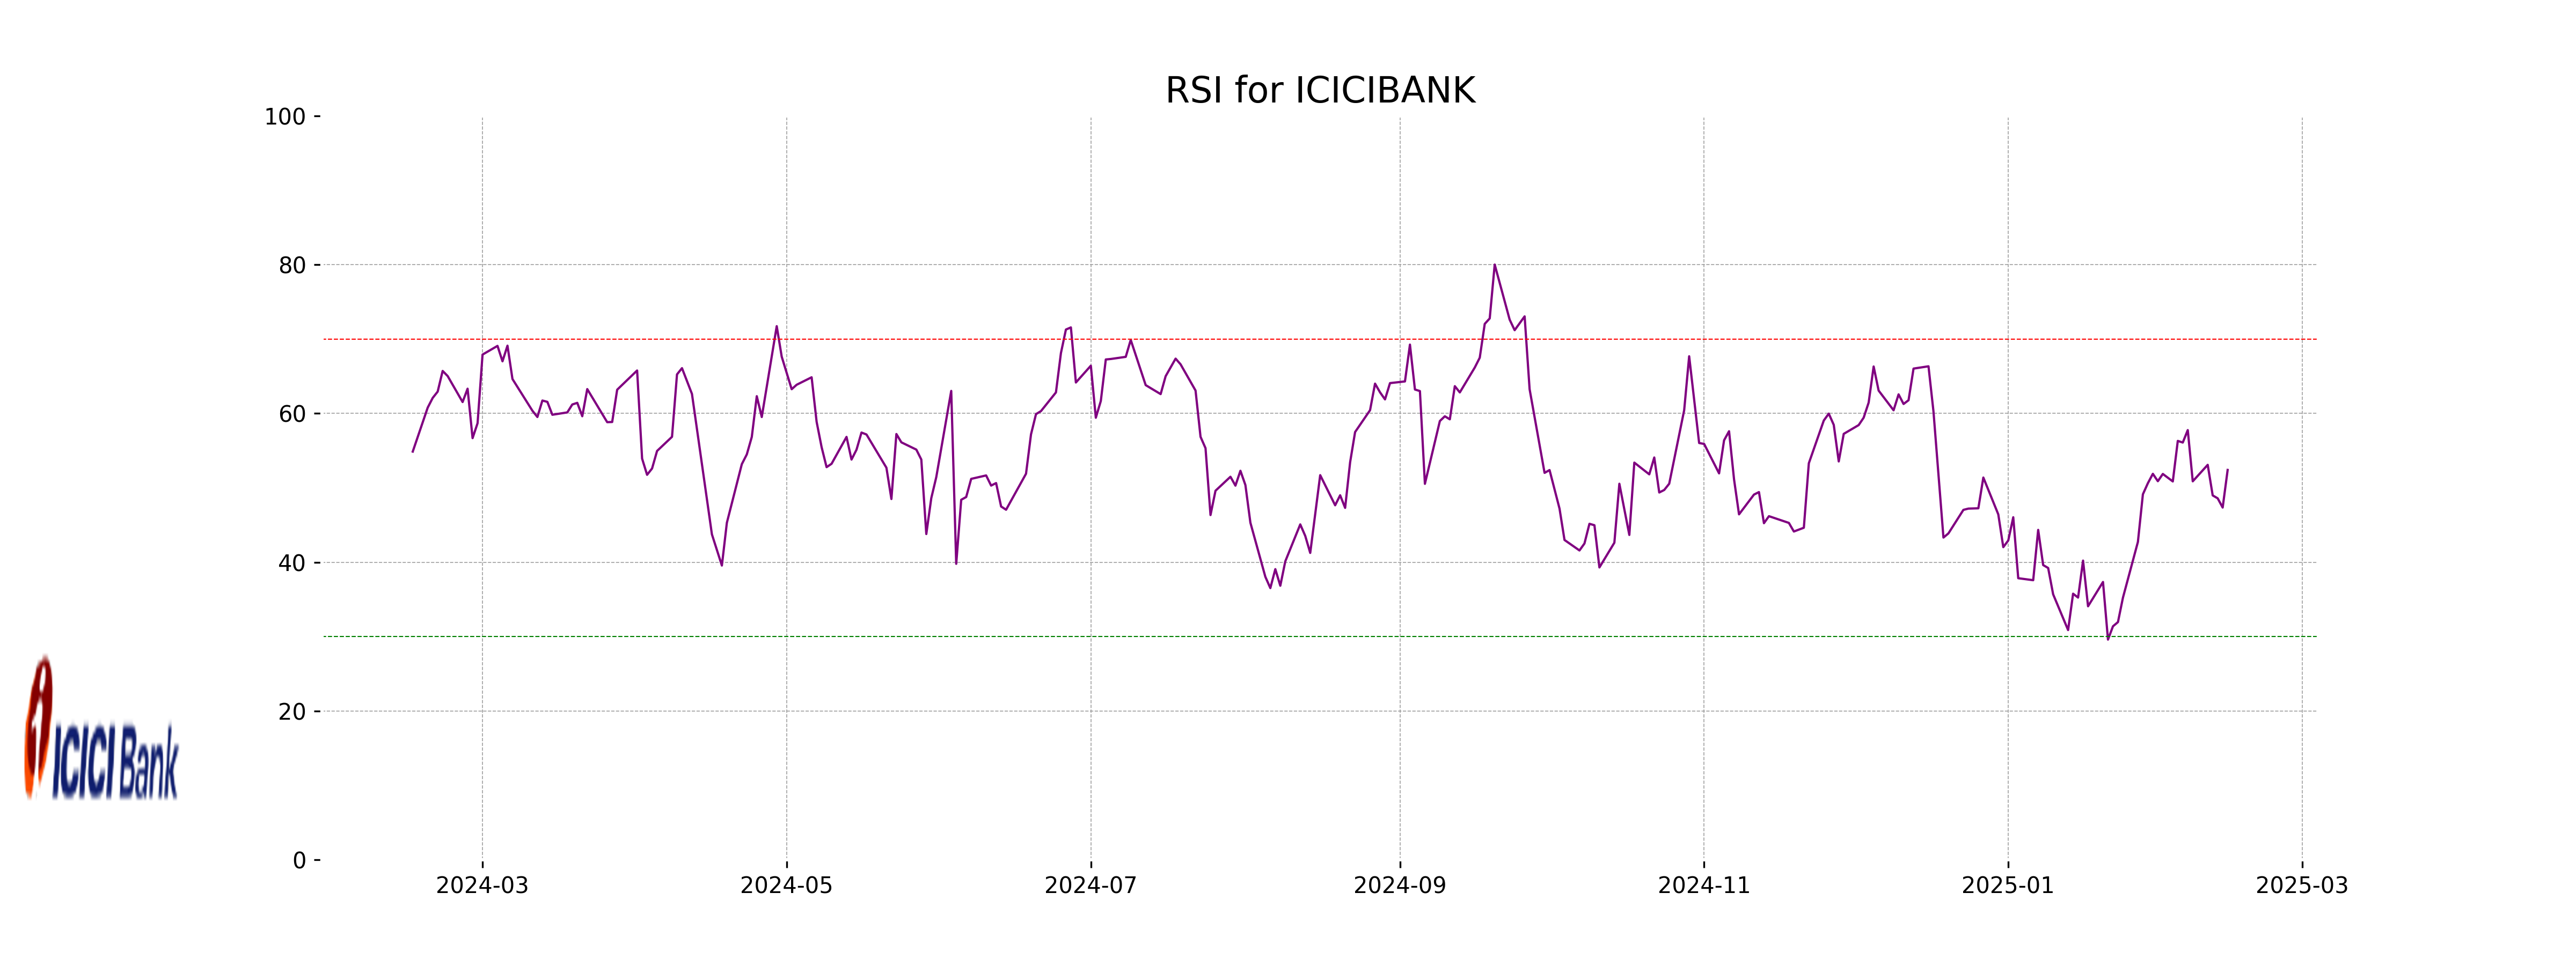
Analysis for ICICI Bank - February 14, 2025
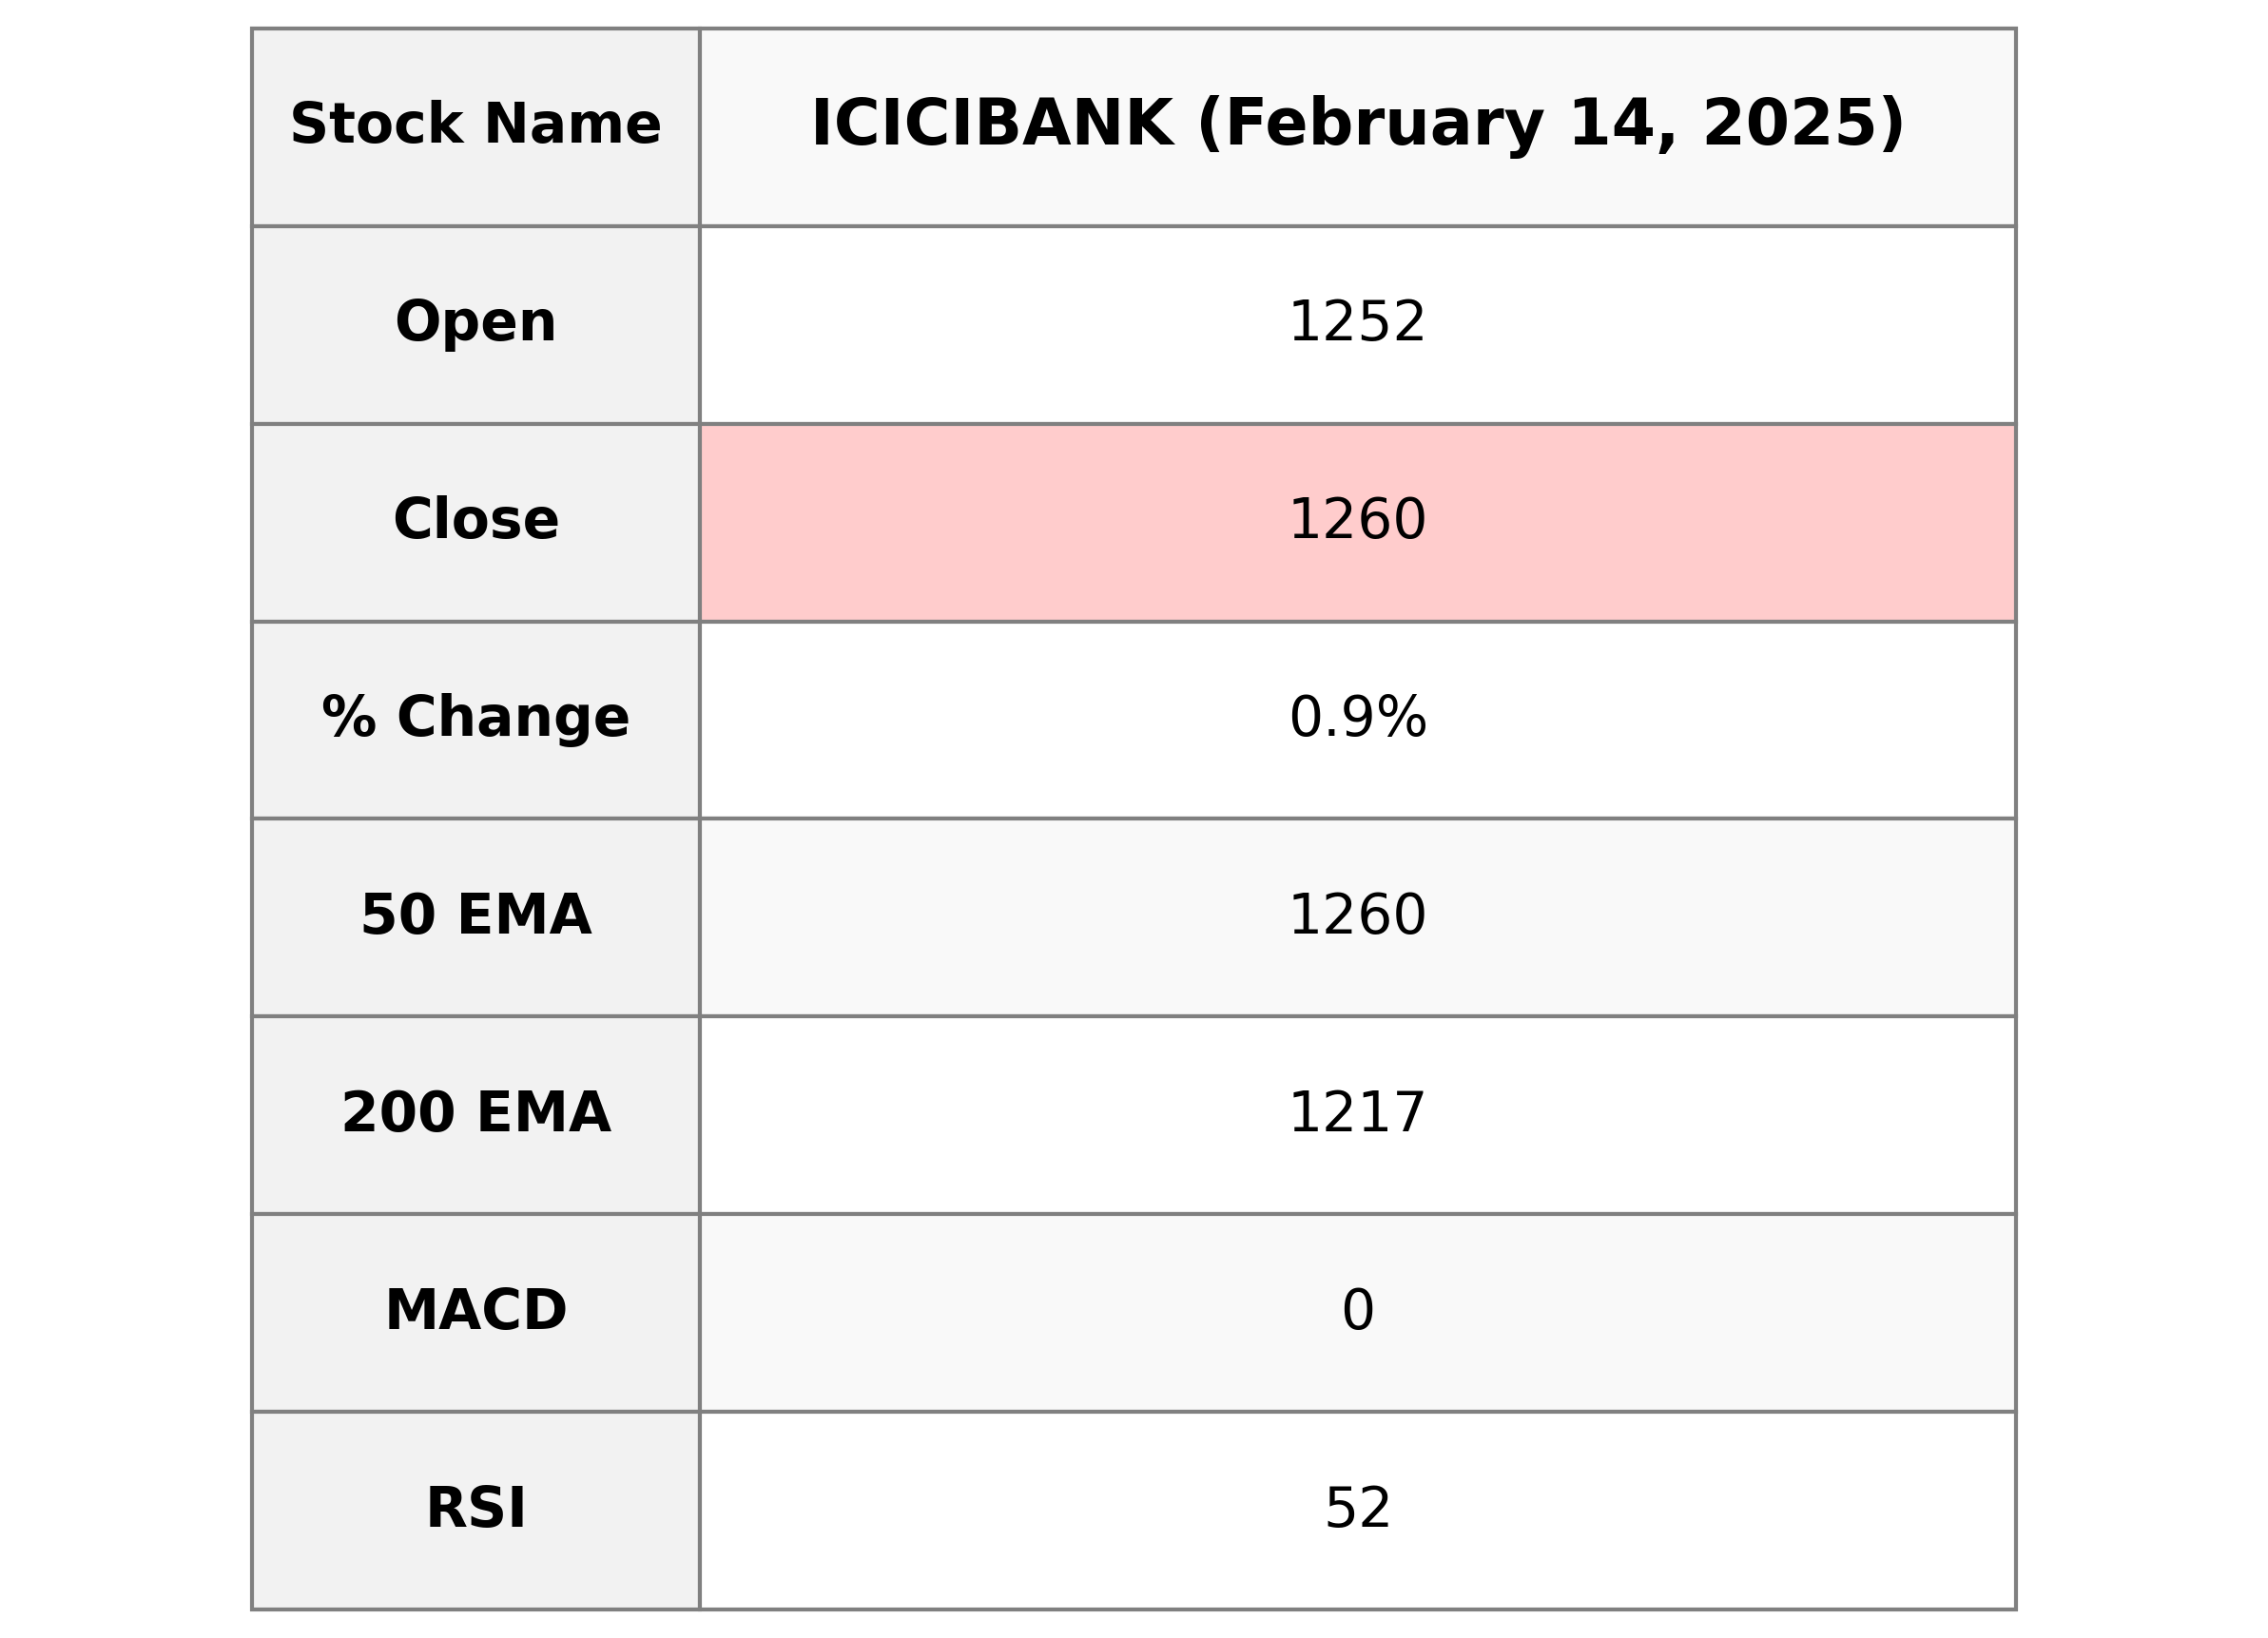
**ICICI Bank's** stock opened at 1252.10, peaked at 1263.5, and closed at 1260.10, reflecting a 0.90% increase from the previous close with a volume of 10,368,102 shares traded. The bank shows a healthy financial position with a market cap of approximately 8.90 trillion INR, backed by a PE ratio of 18.38, indicating investor confidence and stable earnings in the financial services sector.
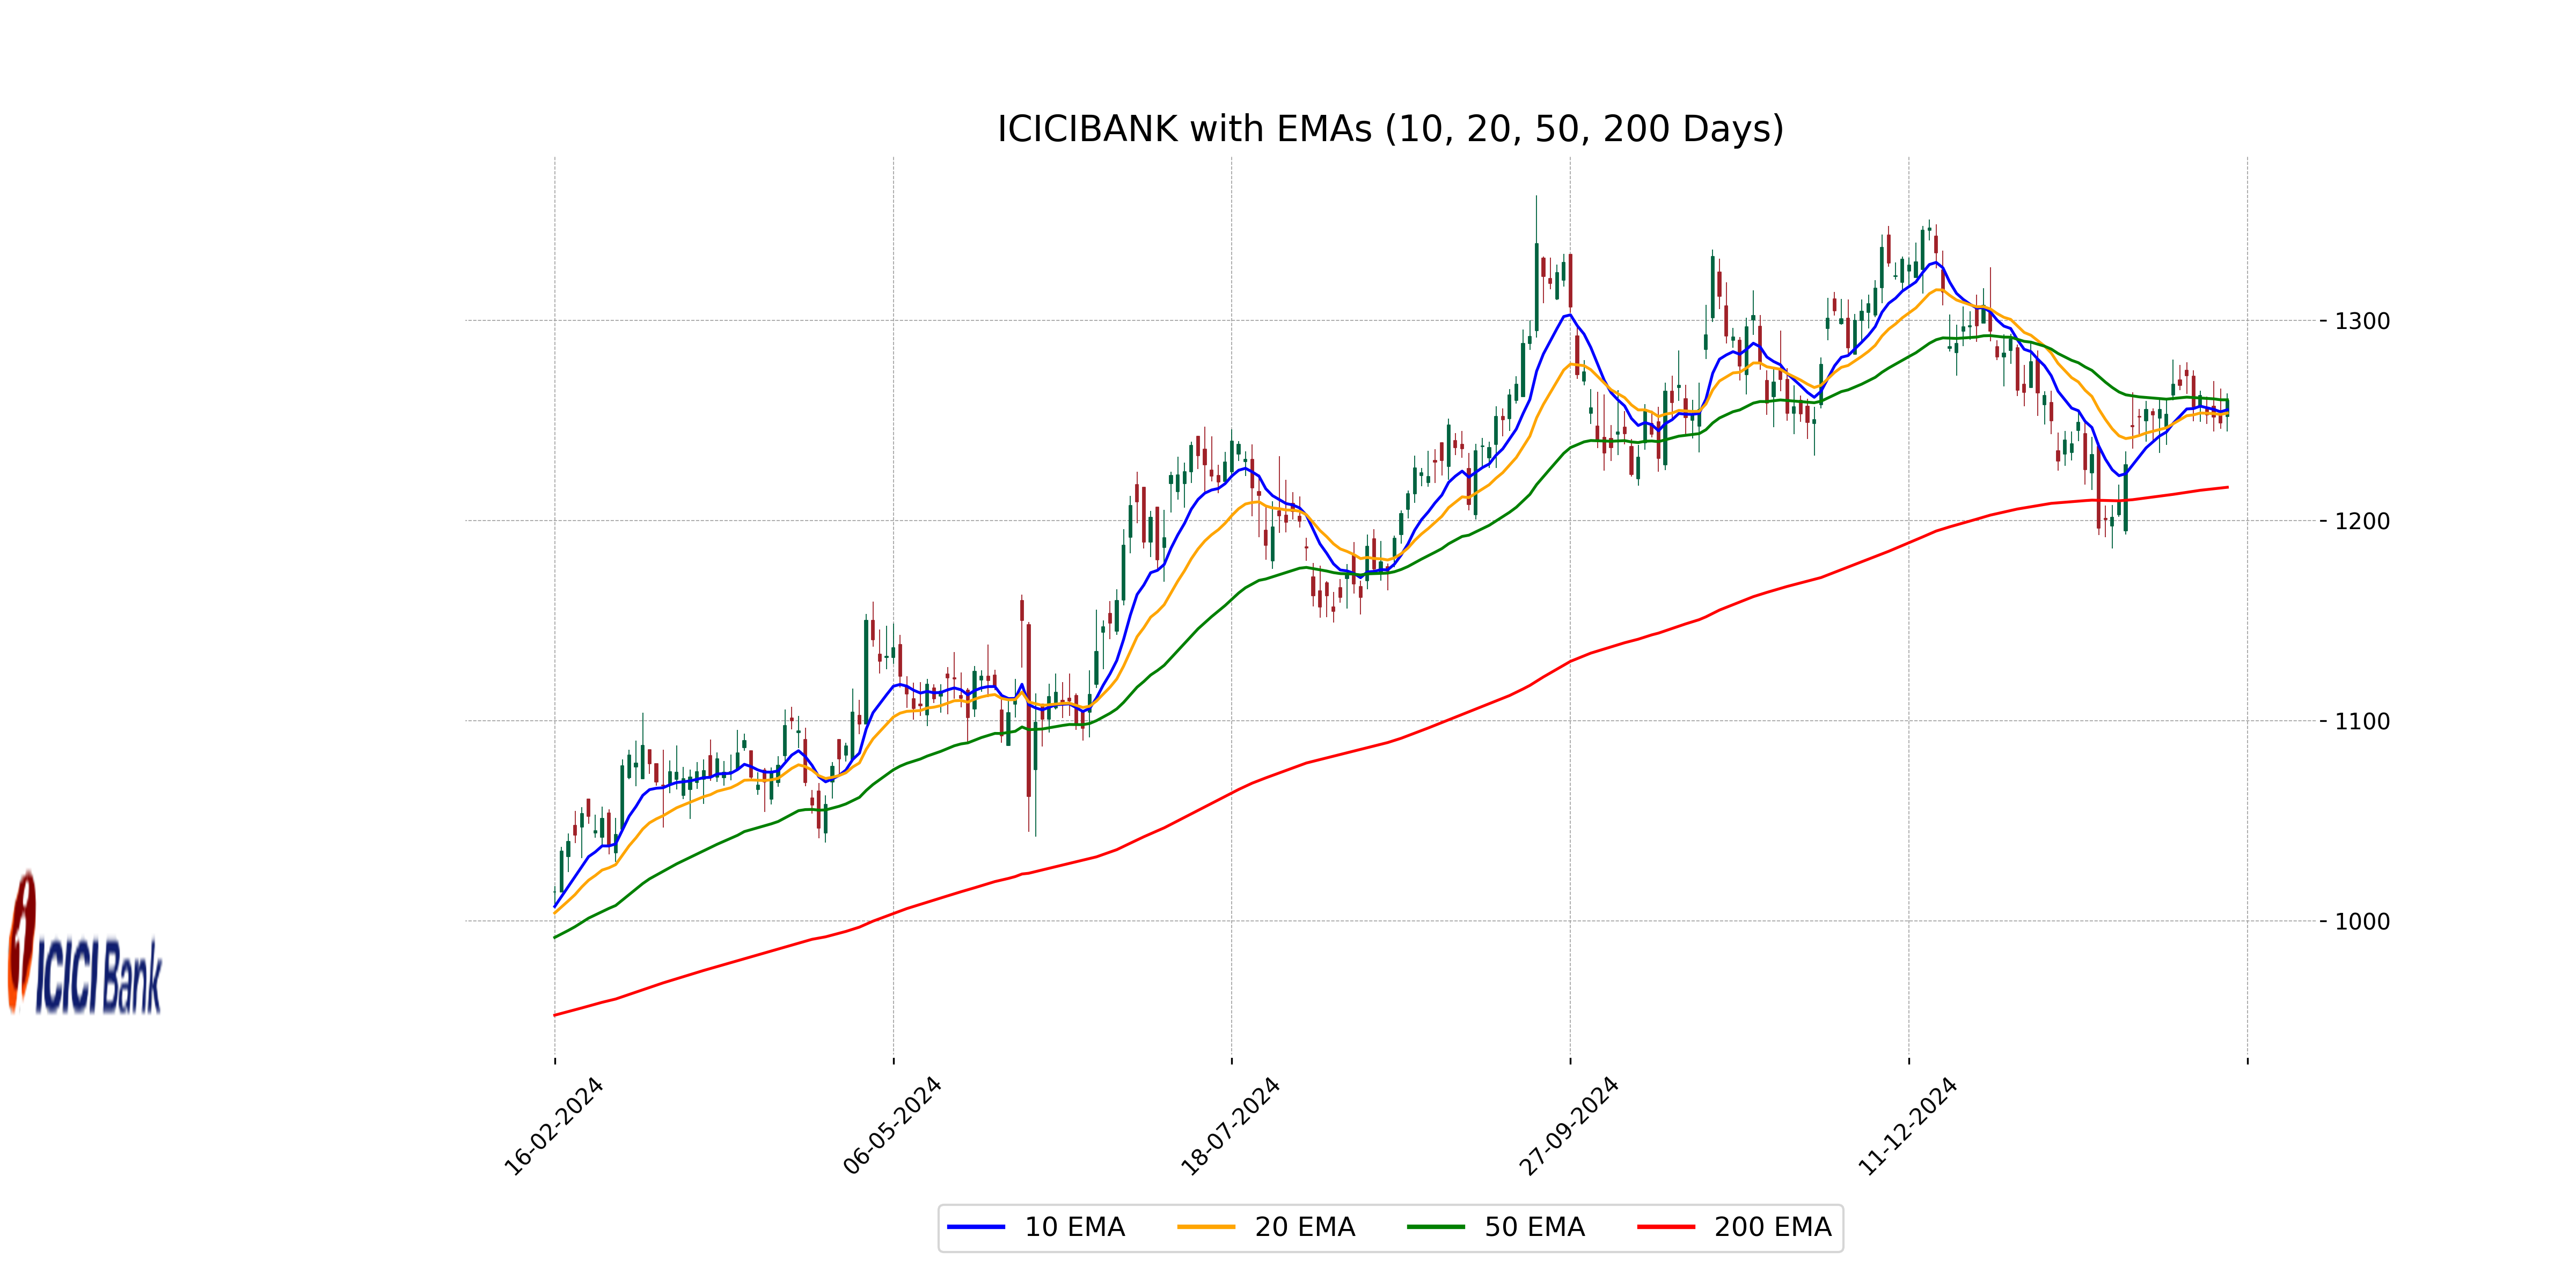
Relationship with Key Moving Averages
ICICI Bank's closing price of 1260.10 is slightly below its 50-day EMA of 1260.34 but above its 10-day and 20-day EMAs, which are at 1255.38 and 1253.71, respectively. This suggests a minor upward momentum in the short-term trend. The price remains well above the 200-day EMA of 1216.66, indicating a strong overall upward trend.
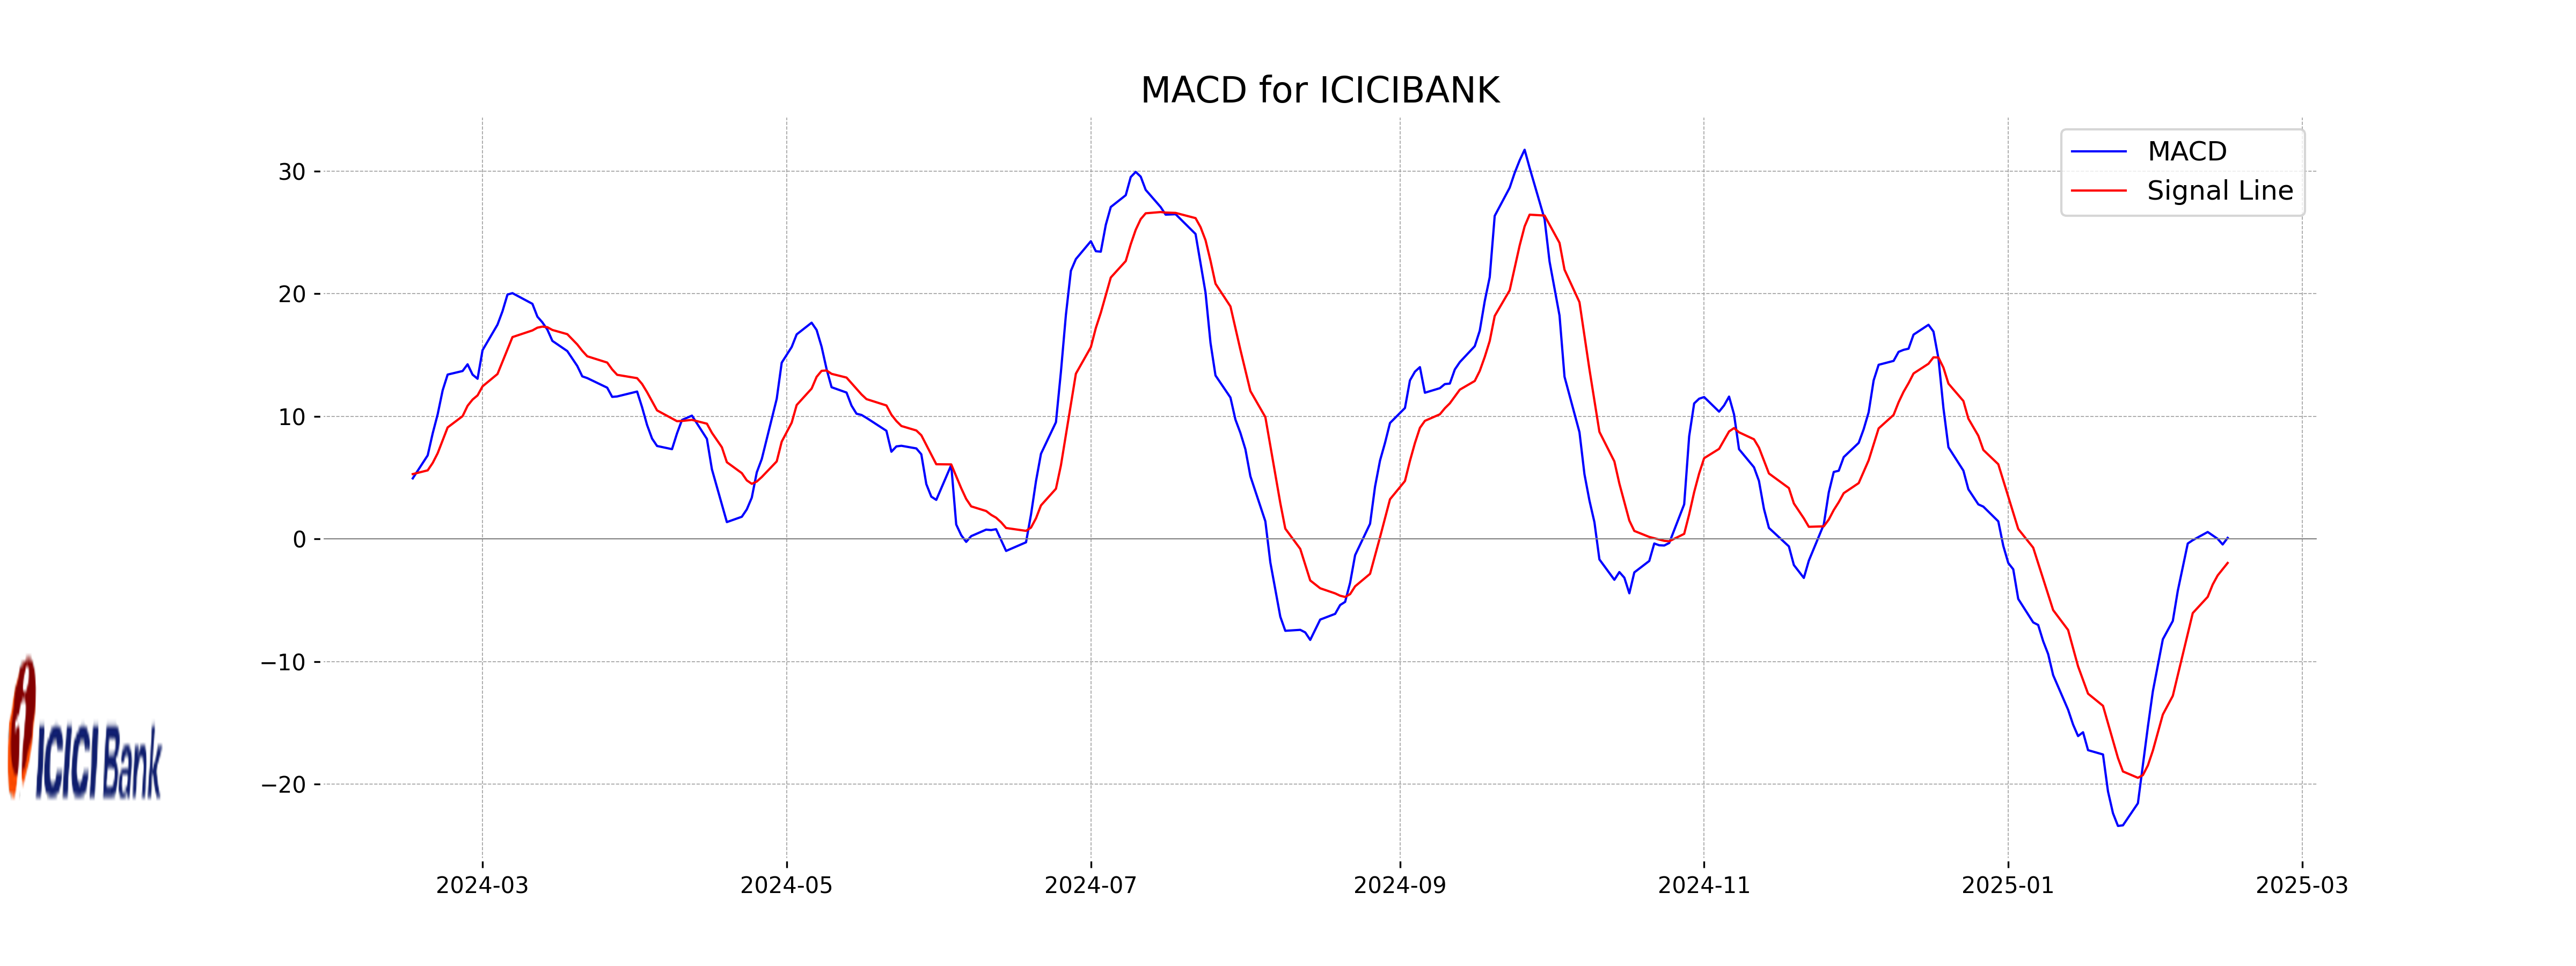
Moving Averages Trend (MACD)
The MACD line for ICICI Bank is slightly higher than the MACD Signal line, indicating a potential bullish crossover. This can be seen as a positive sign of momentum for the stock. Traders might view this as a potential opportunity for a short-term upward movement.
RSI Analysis
The Relative Strength Index (RSI) for ICICI Bank is 52.41. This suggests that the stock is neither overbought nor oversold, indicating a neutral trend. It's in the middle of the typical RSI range, suggesting balanced buying and selling pressure.
Analysis for Infosys - February 14, 2025
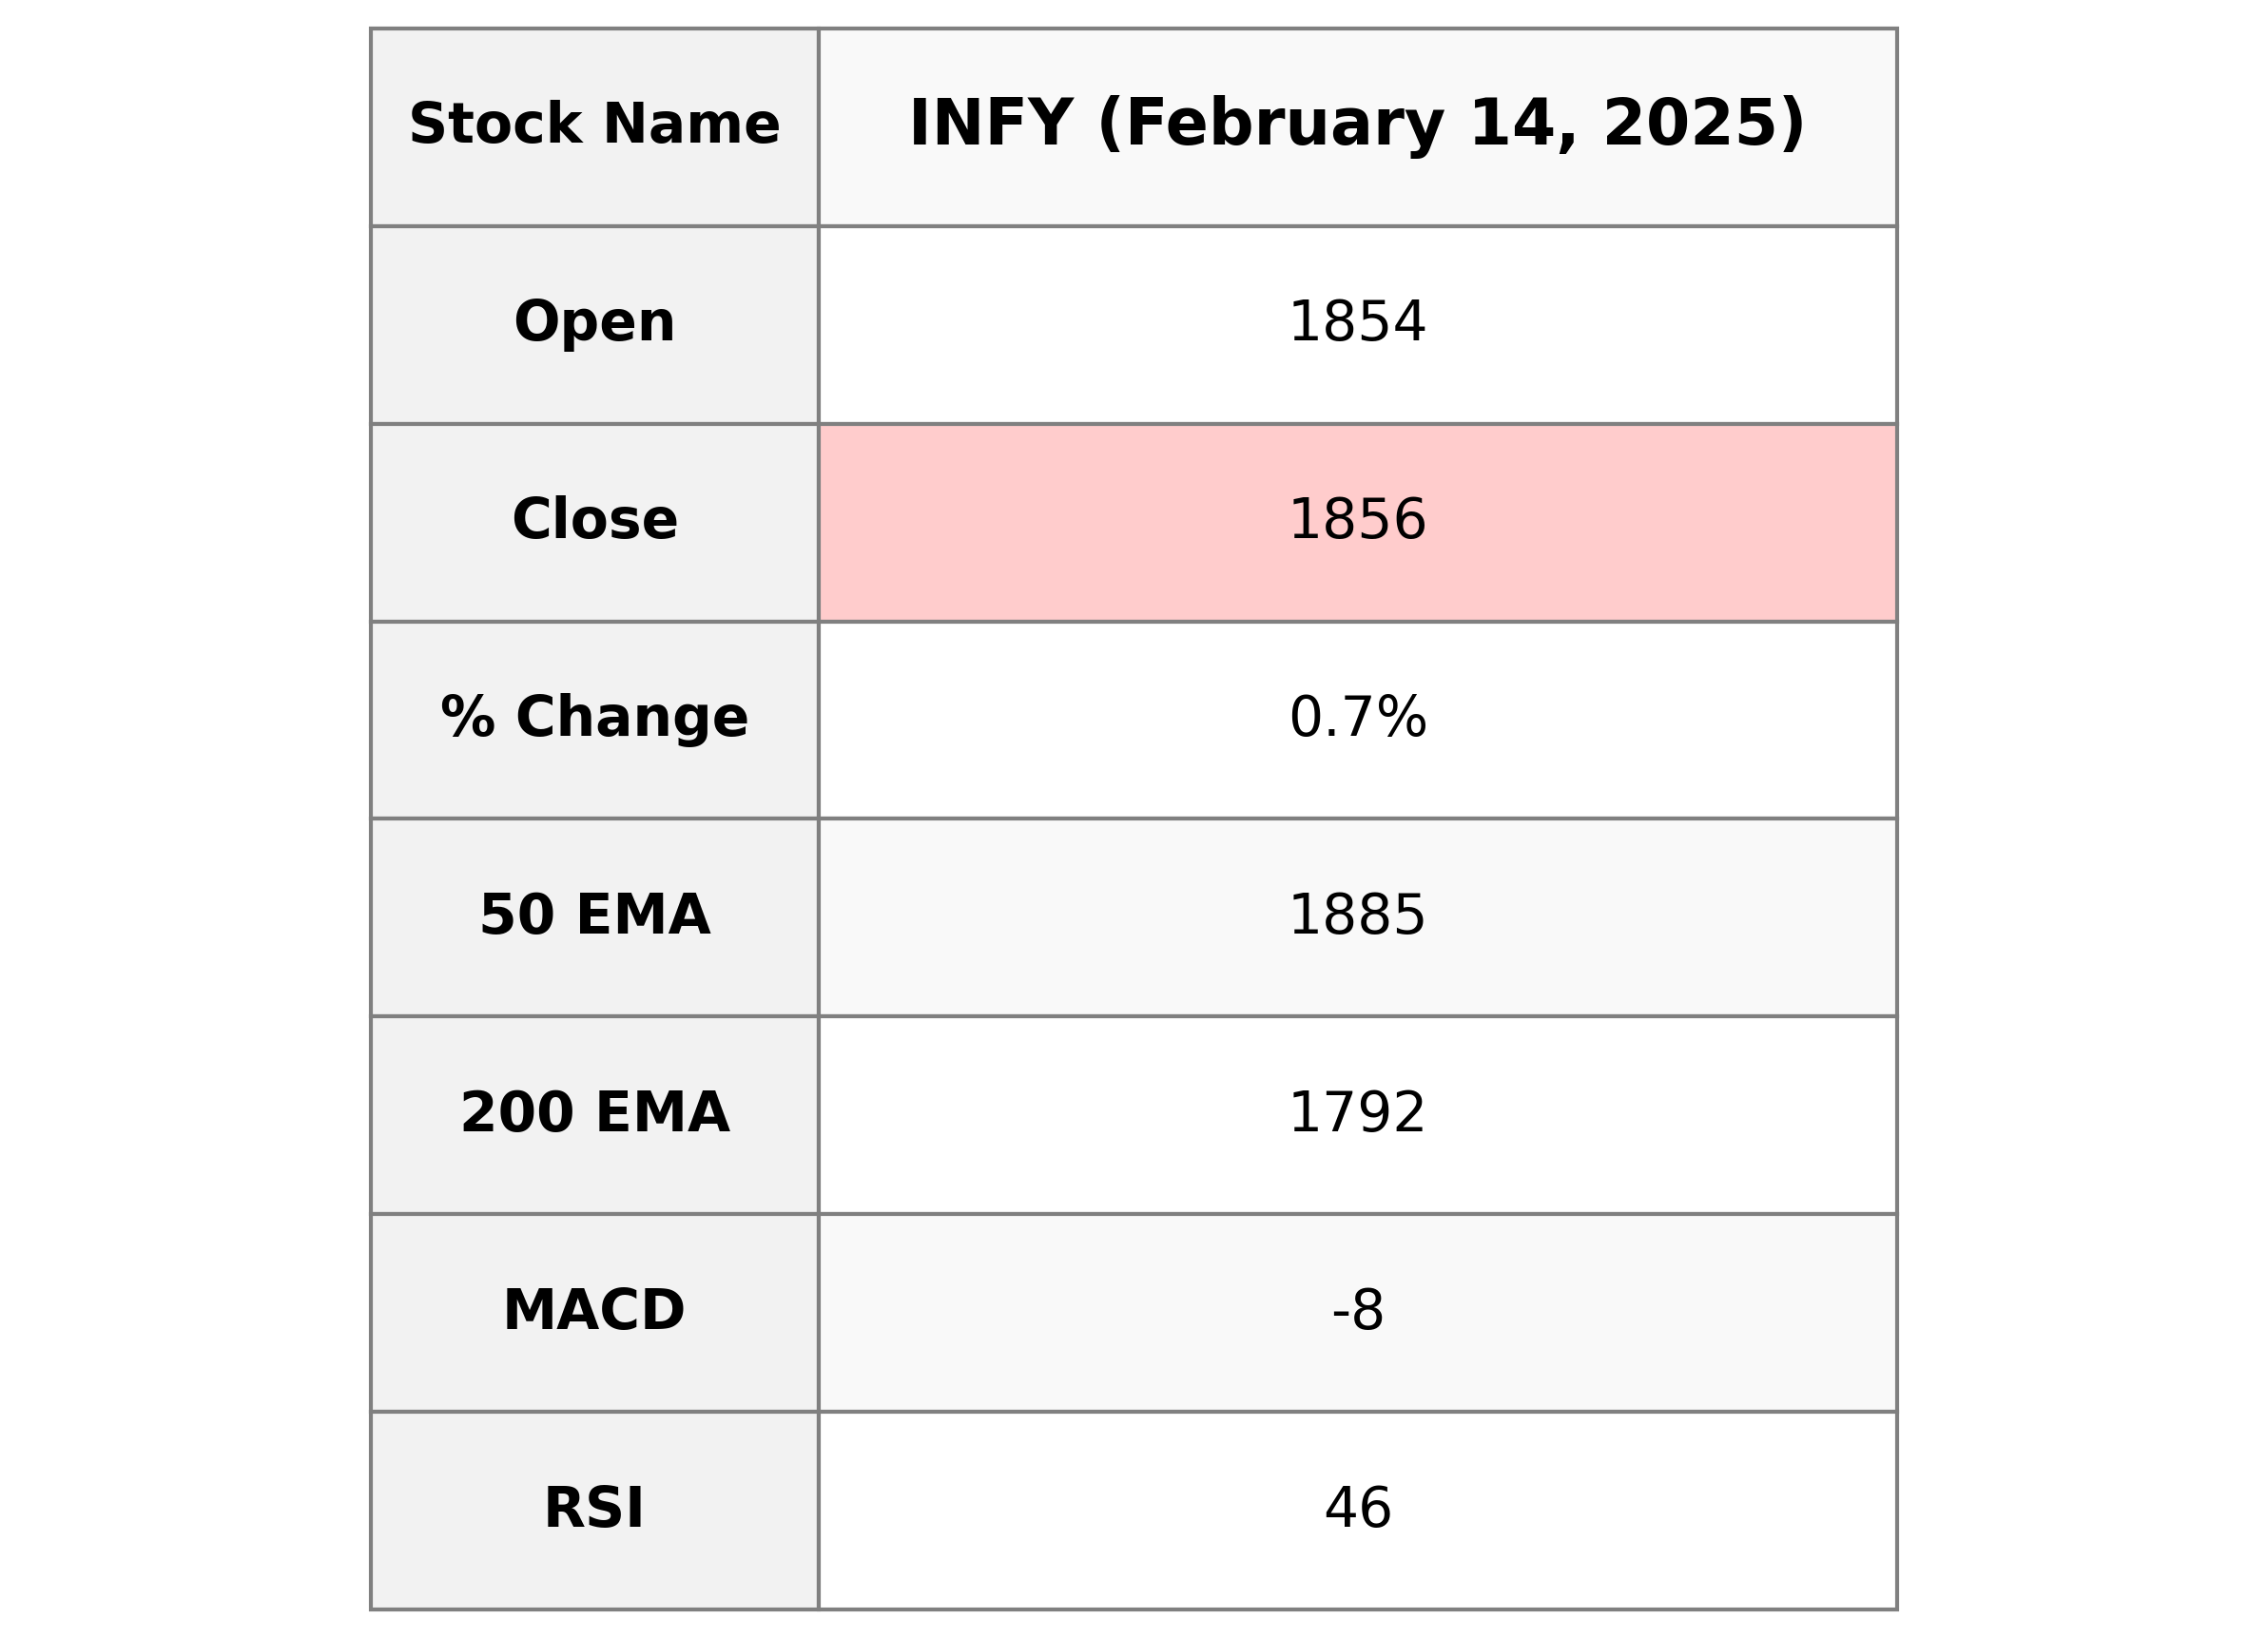
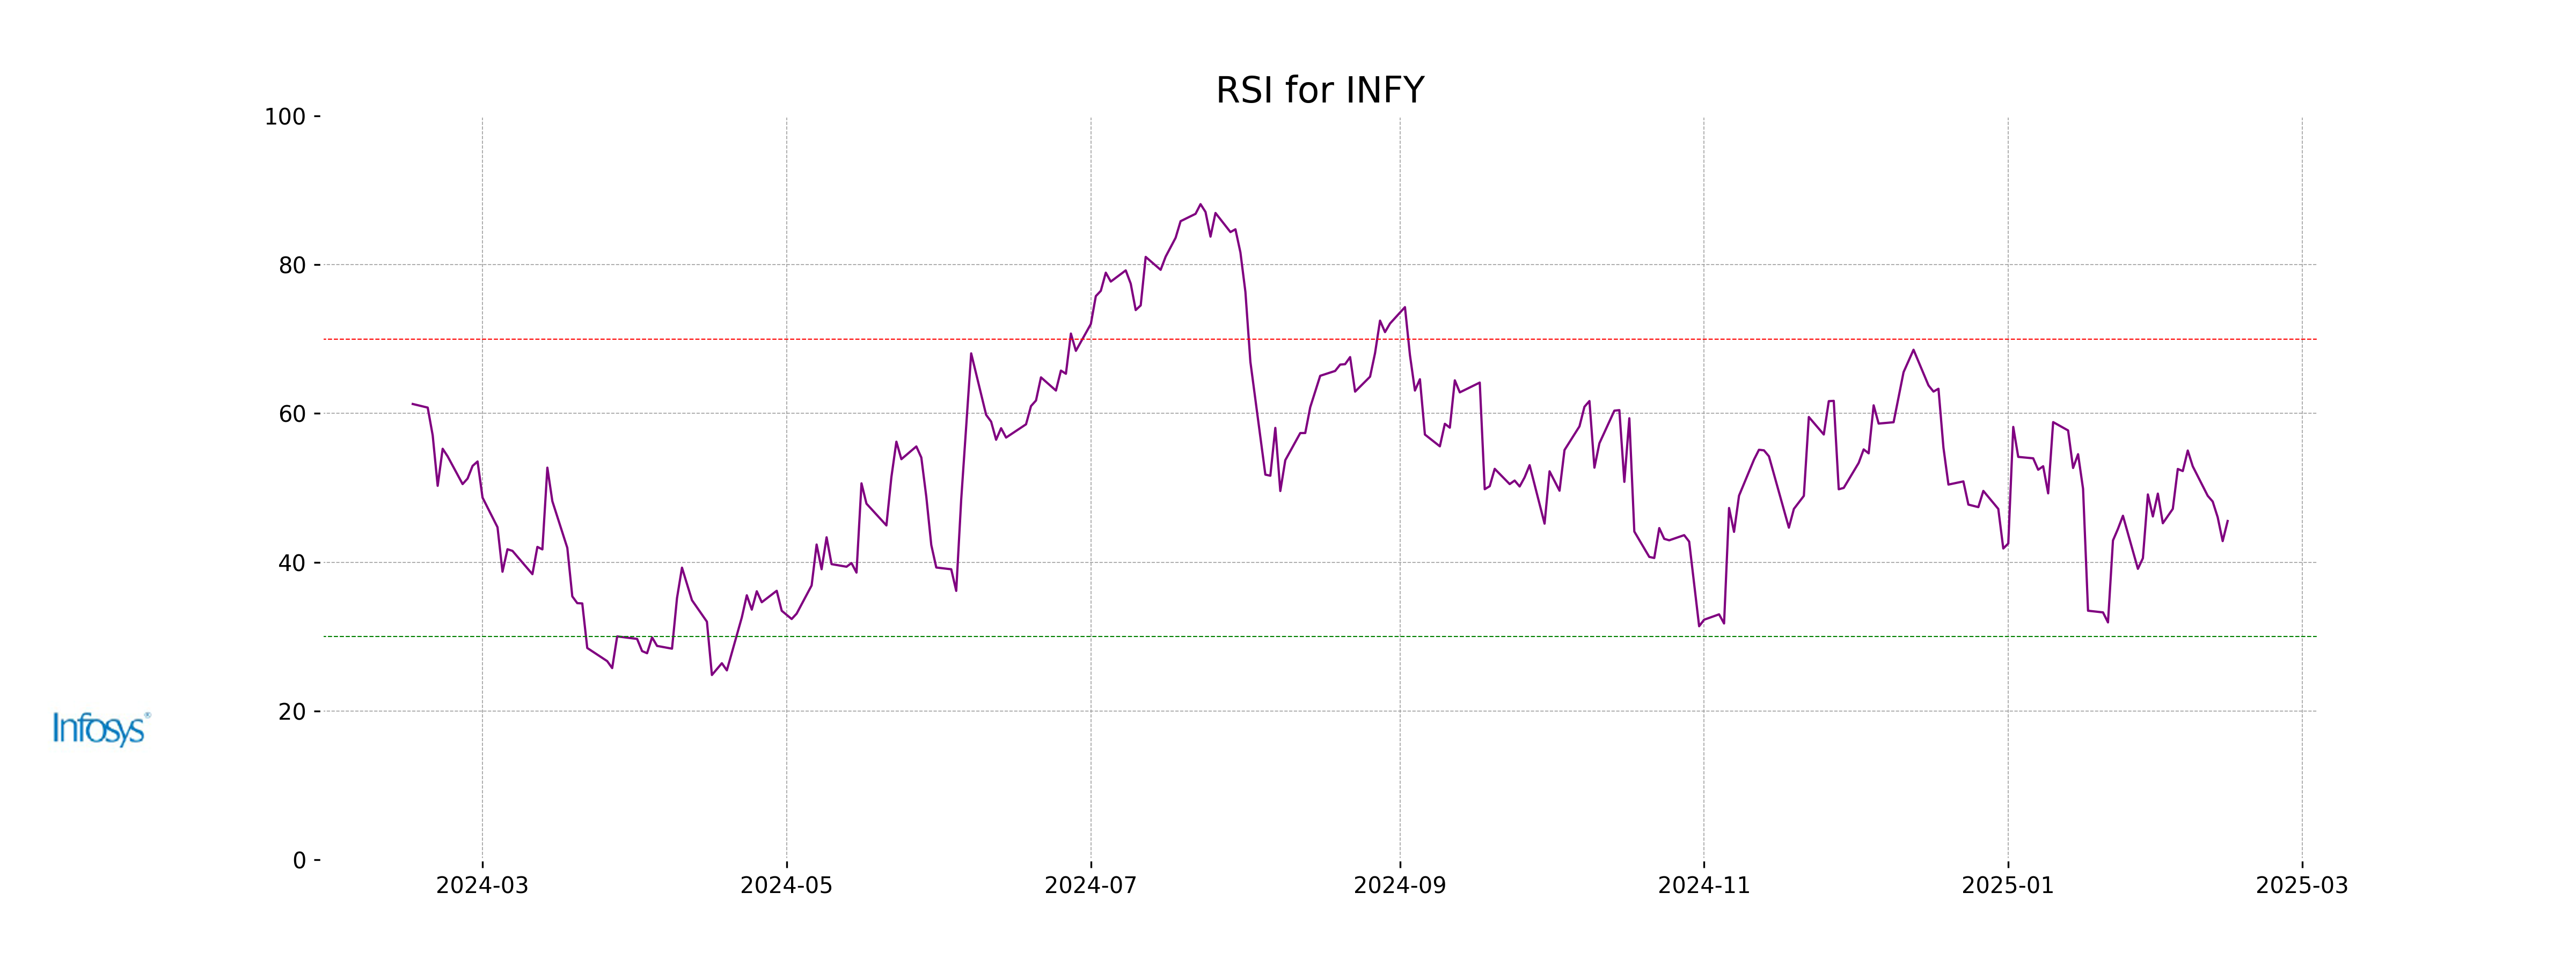
**Infosys Performance** Infosys experienced a slight increase in its stock price with a closing value of 1856.40, marking a 0.71% rise from the previous close. Despite the moderate volume of 5.29 million shares traded, the stock shows a relatively low RSI of 45.54, suggesting bearish momentum. Infosys operates within the Technology sector, specifically in Information Technology Services, and is based in India.
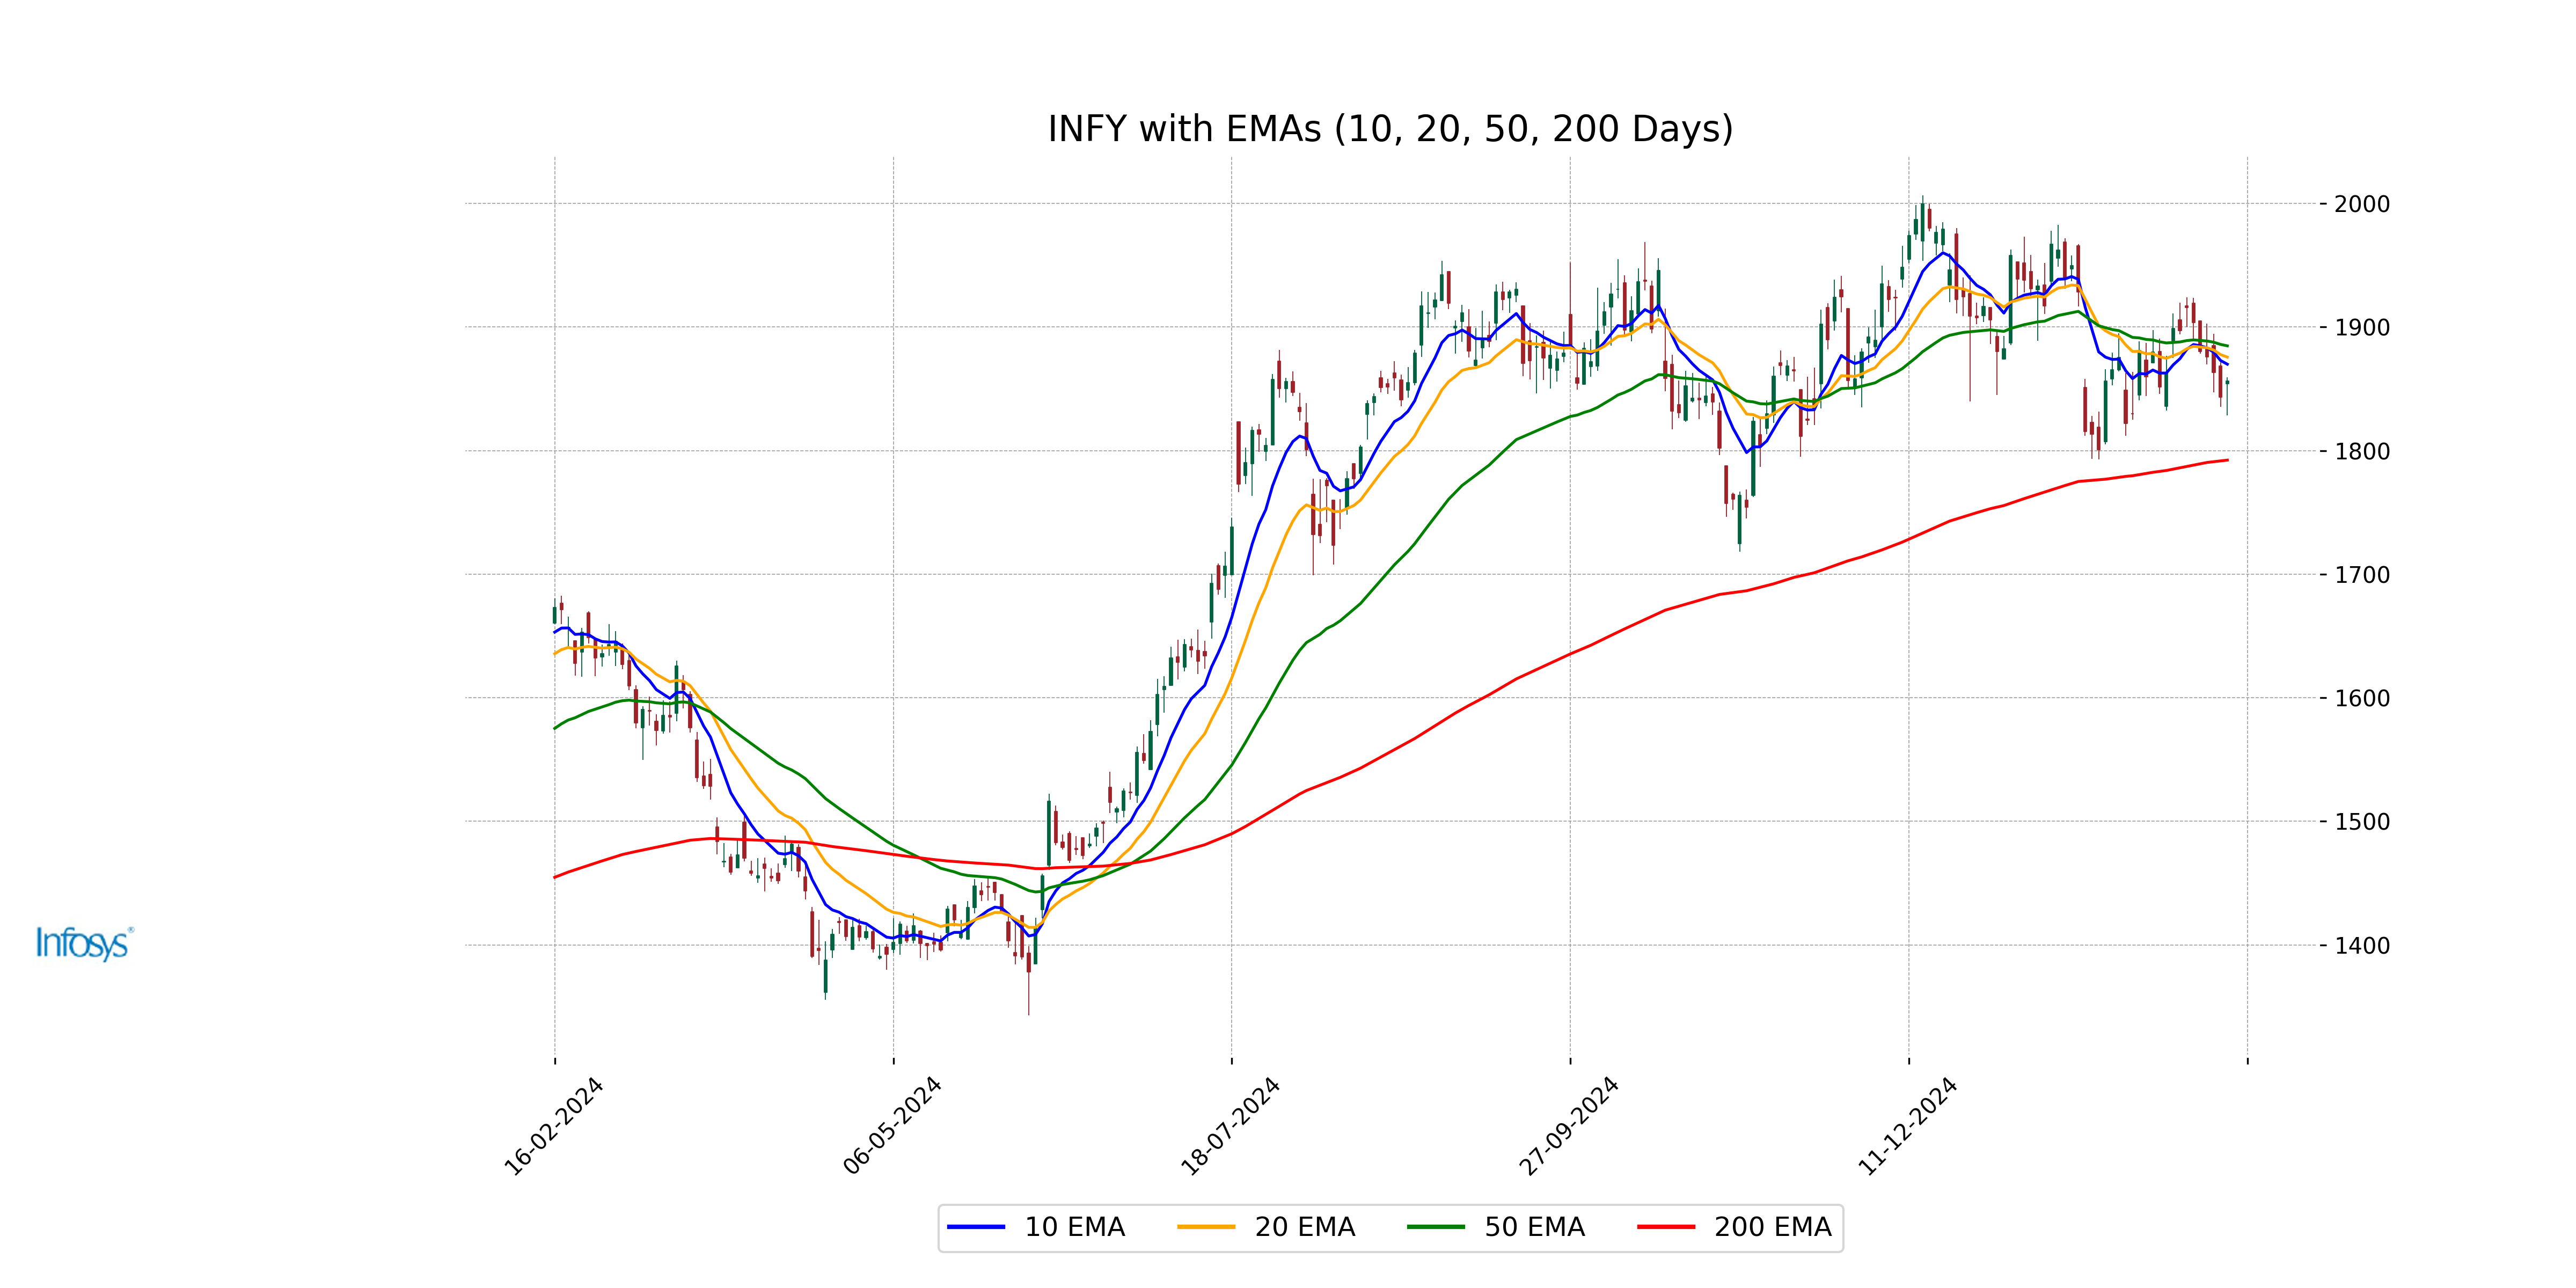
Relationship with Key Moving Averages
Infosys is currently trading below its 10-day EMA of 1869.93, indicating a potential bearish short-term trend. It is also below the 50-day EMA of 1884.81, suggesting a downward pressure compared to its intermediate trend, but it is above the 200-day EMA of 1792.31, indicating a longer-term bullish trend.
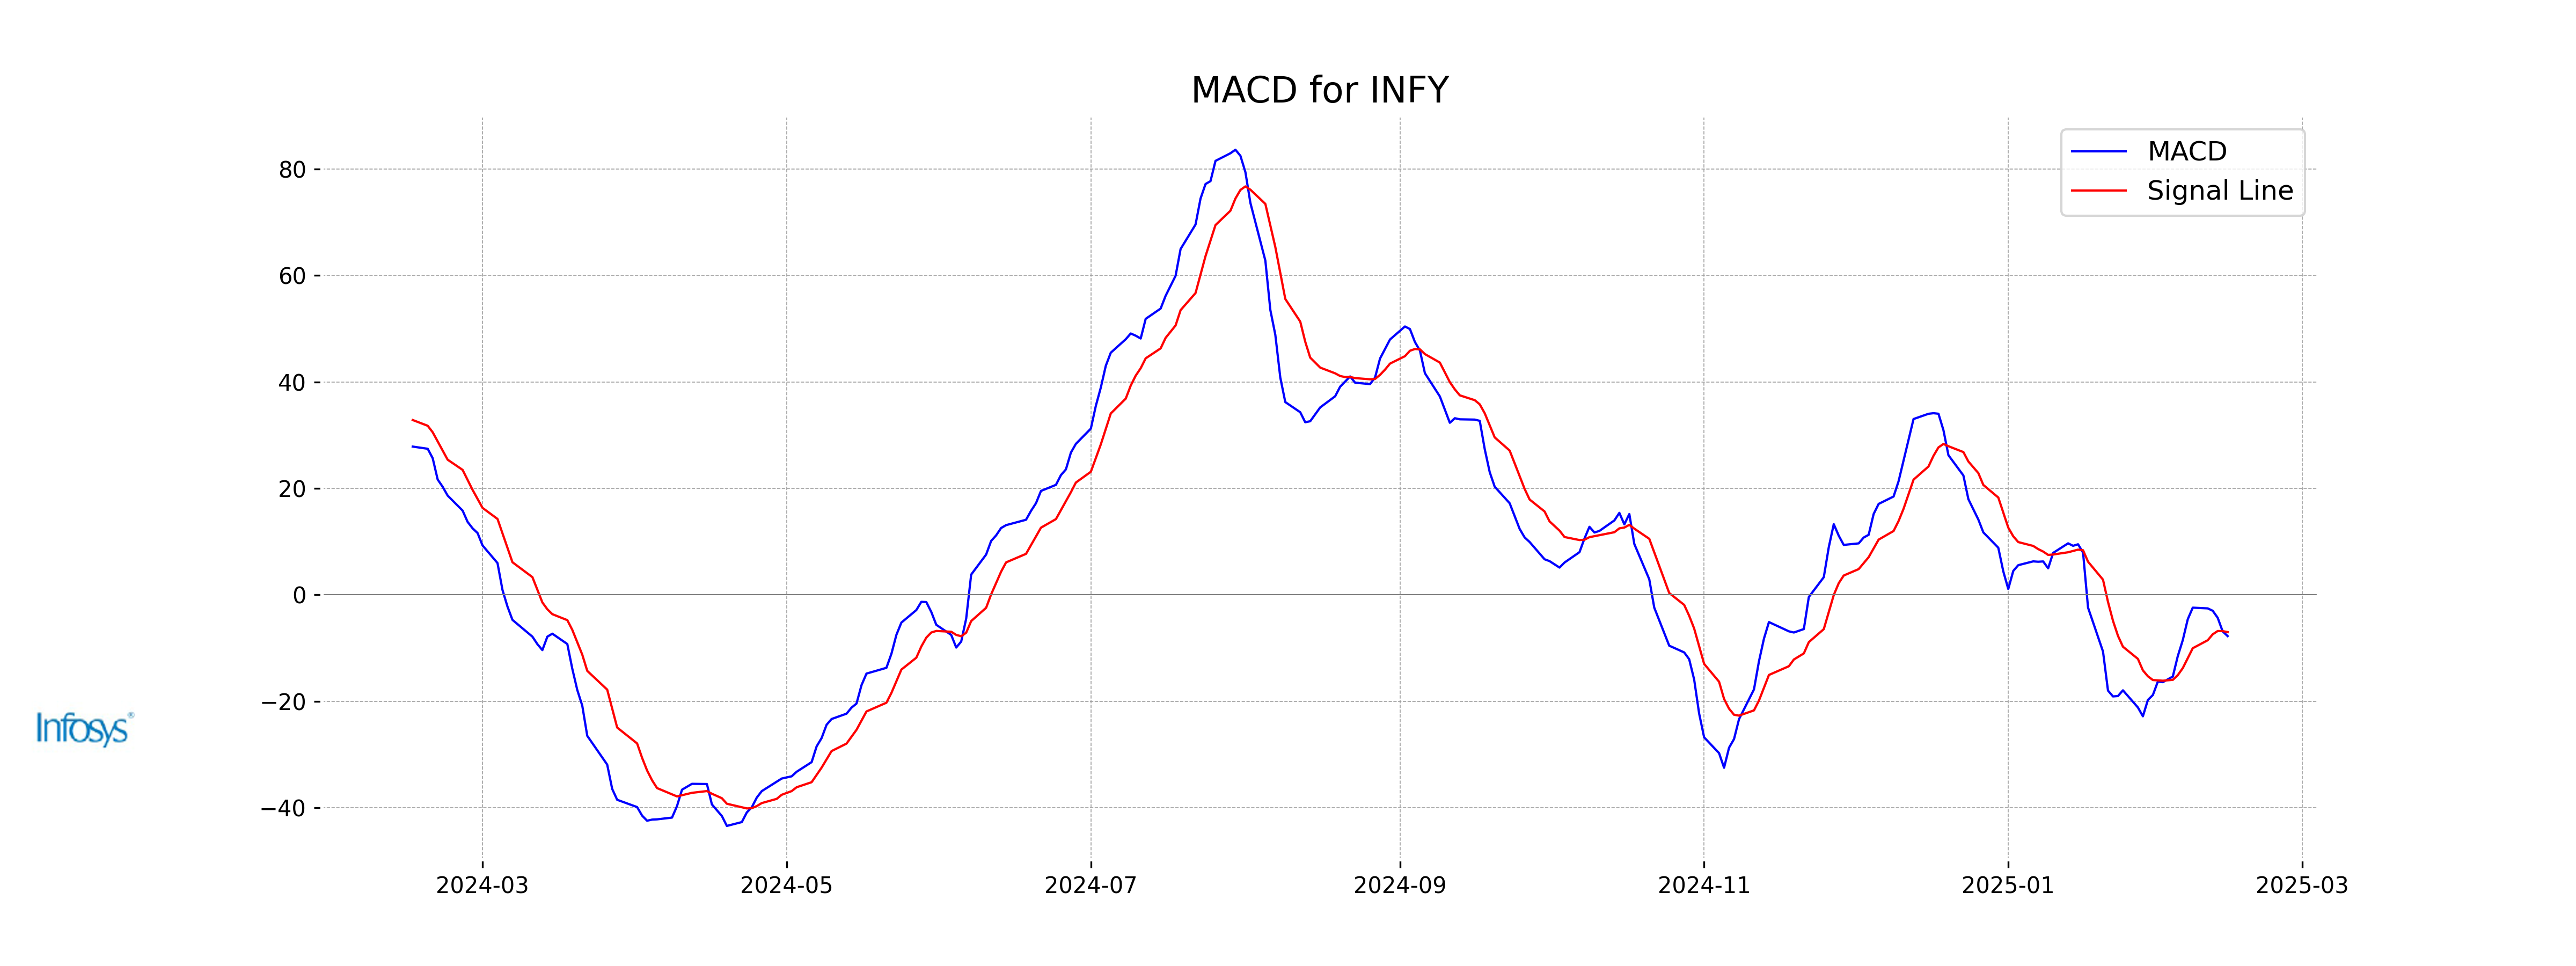
Moving Averages Trend (MACD)
The MACD for Infosys is currently at -7.76, which is below the MACD Signal line at -7.00. This indicates a bearish trend as the MACD is crossing below its signal line, suggesting that the stock may be experiencing downward momentum.
RSI Analysis
The RSI for Infosys stands at 45.54, which suggests that the stock is currently neither overbought nor oversold. This indicates a neutral market sentiment and potential consolidation in its recent price movements.
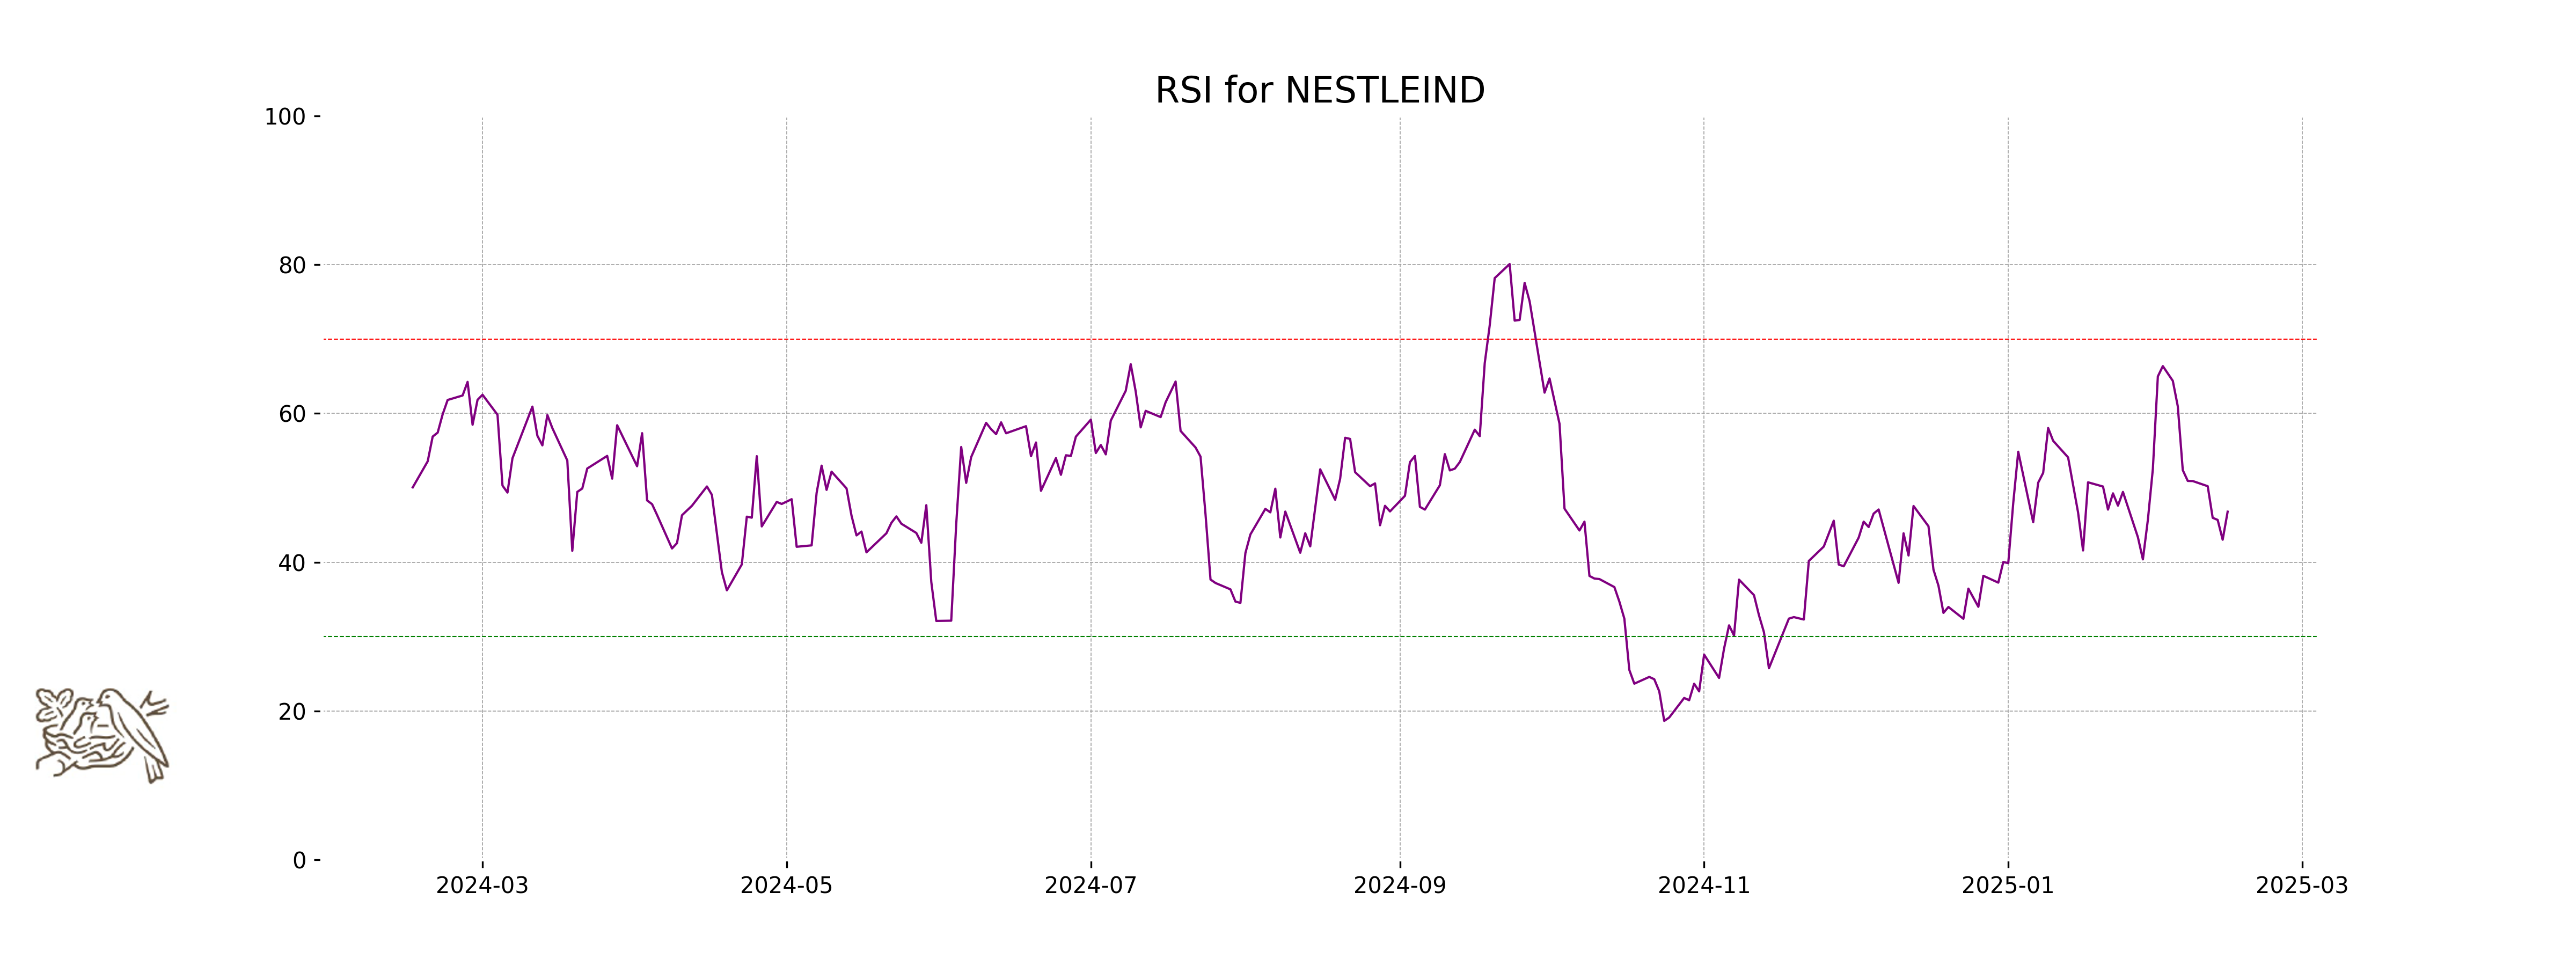
Analysis for Nestle - February 14, 2025
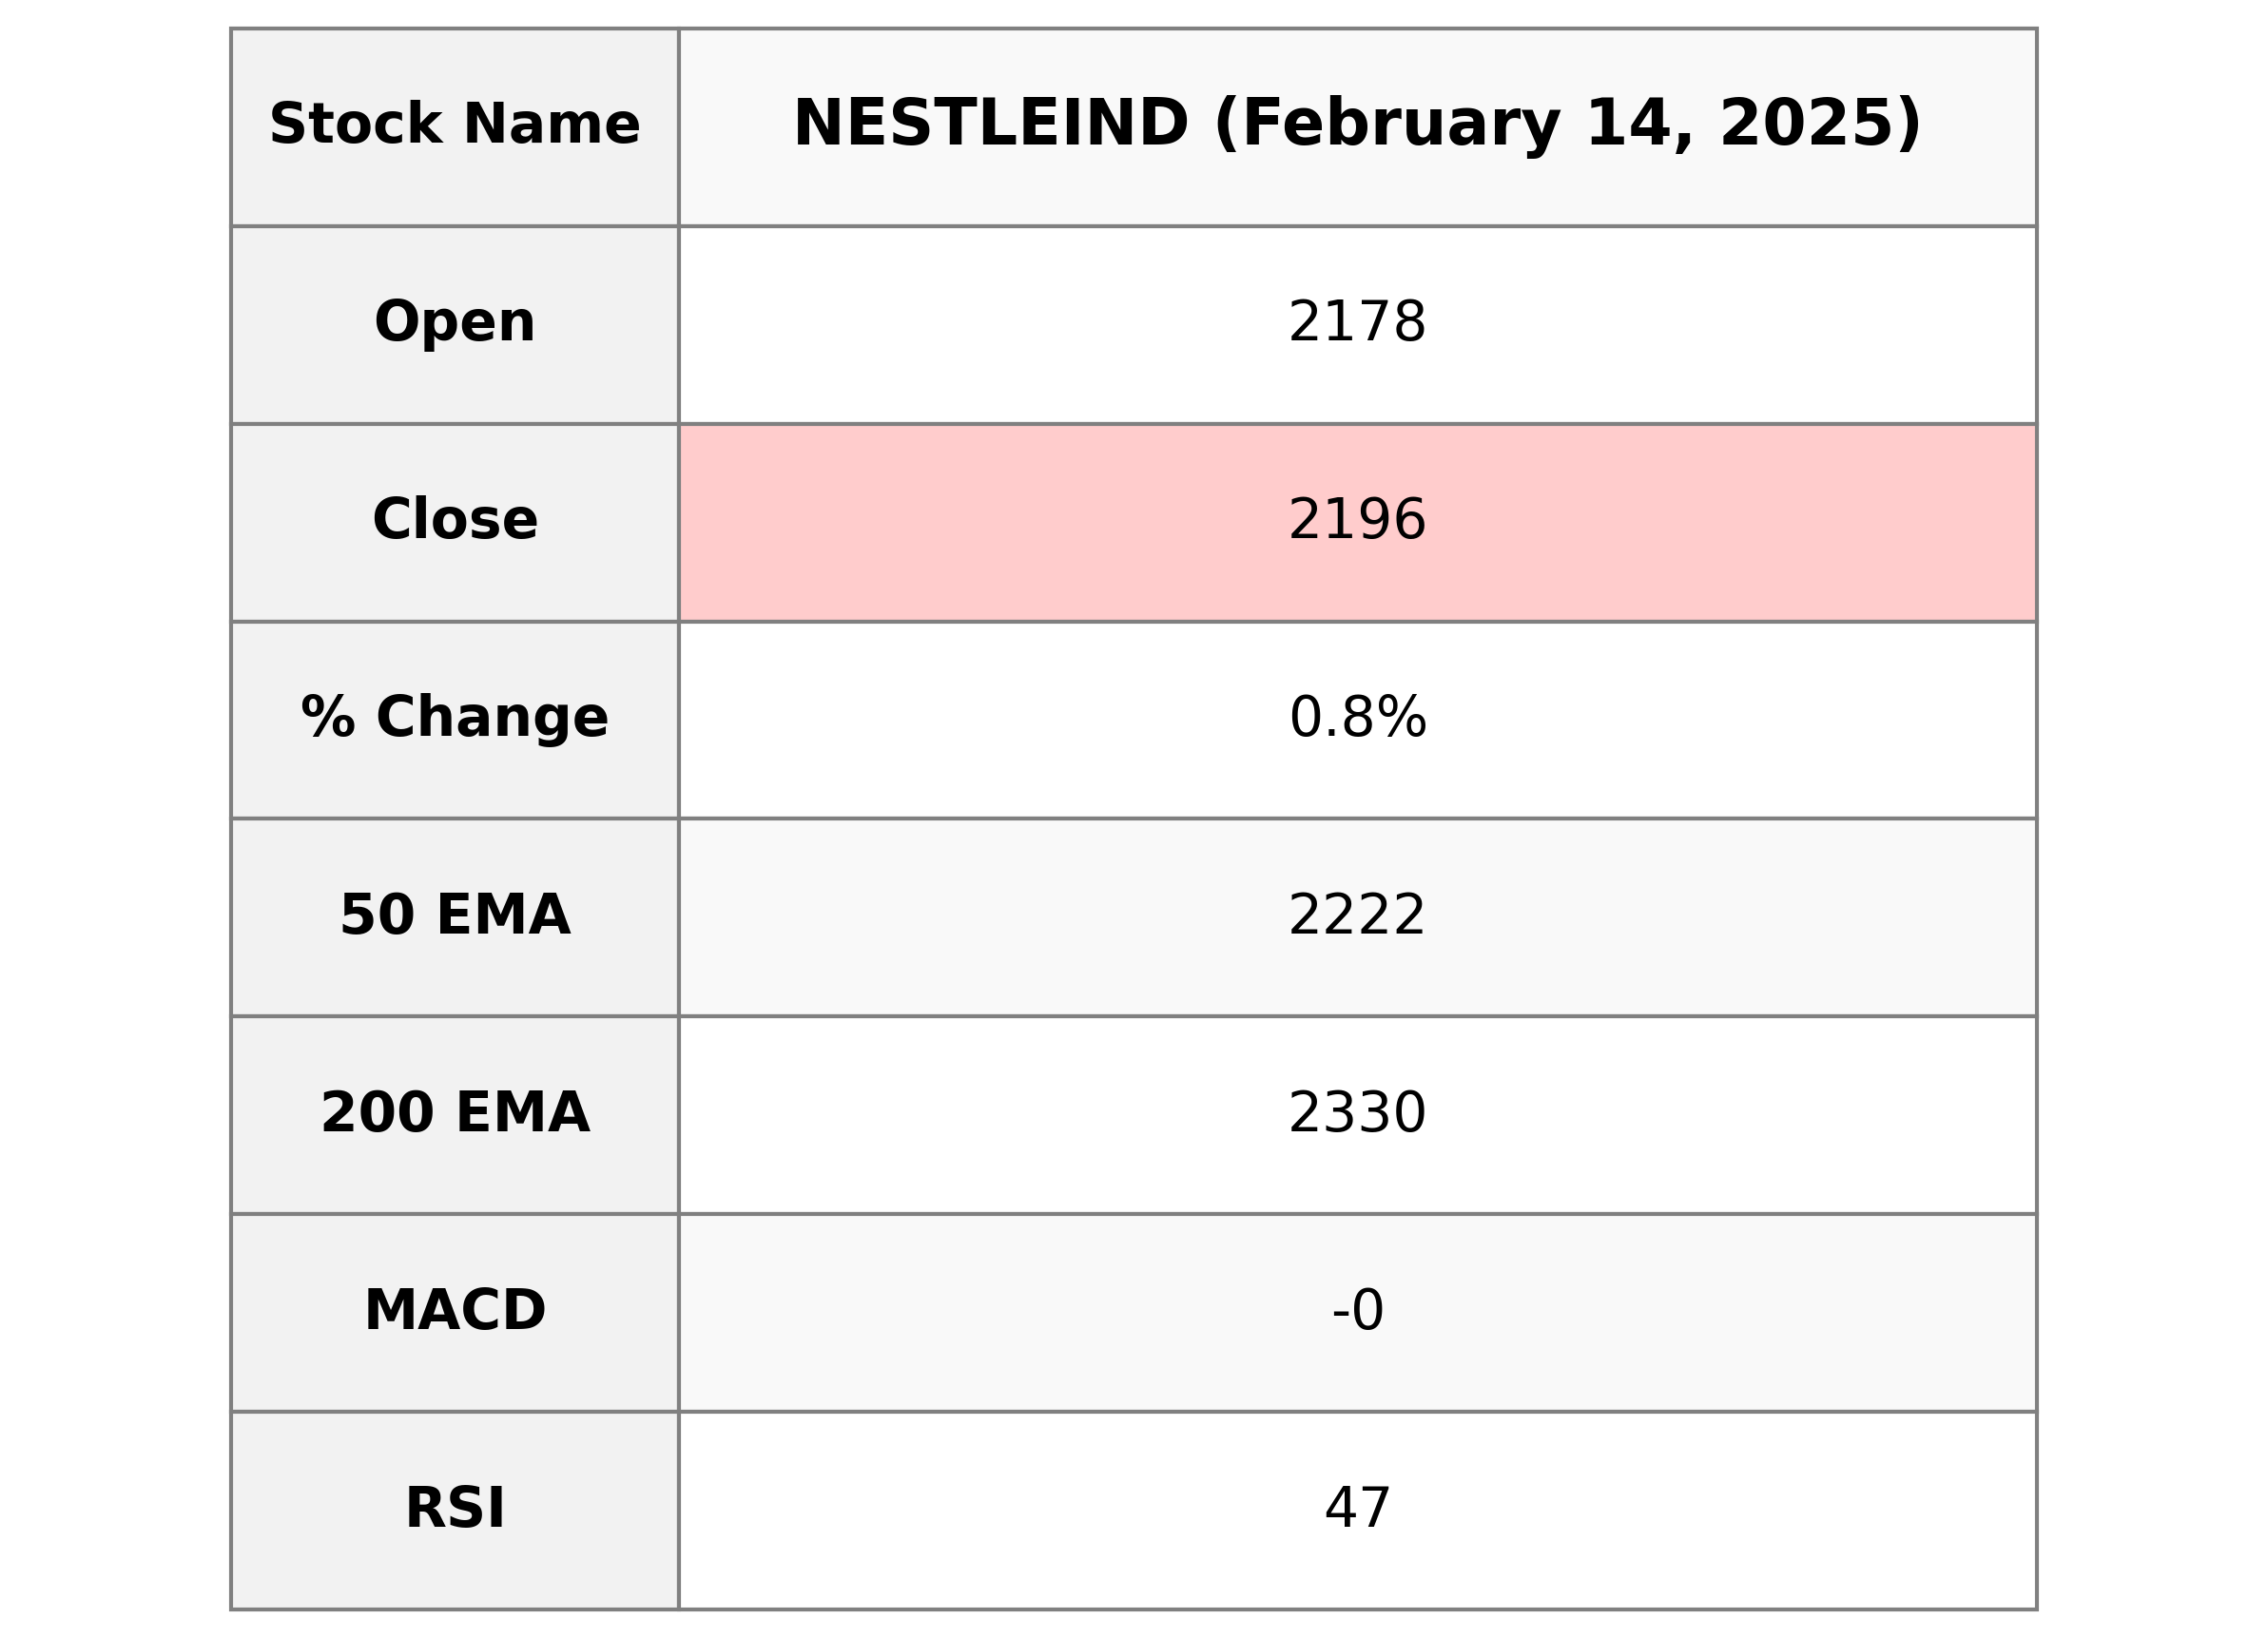
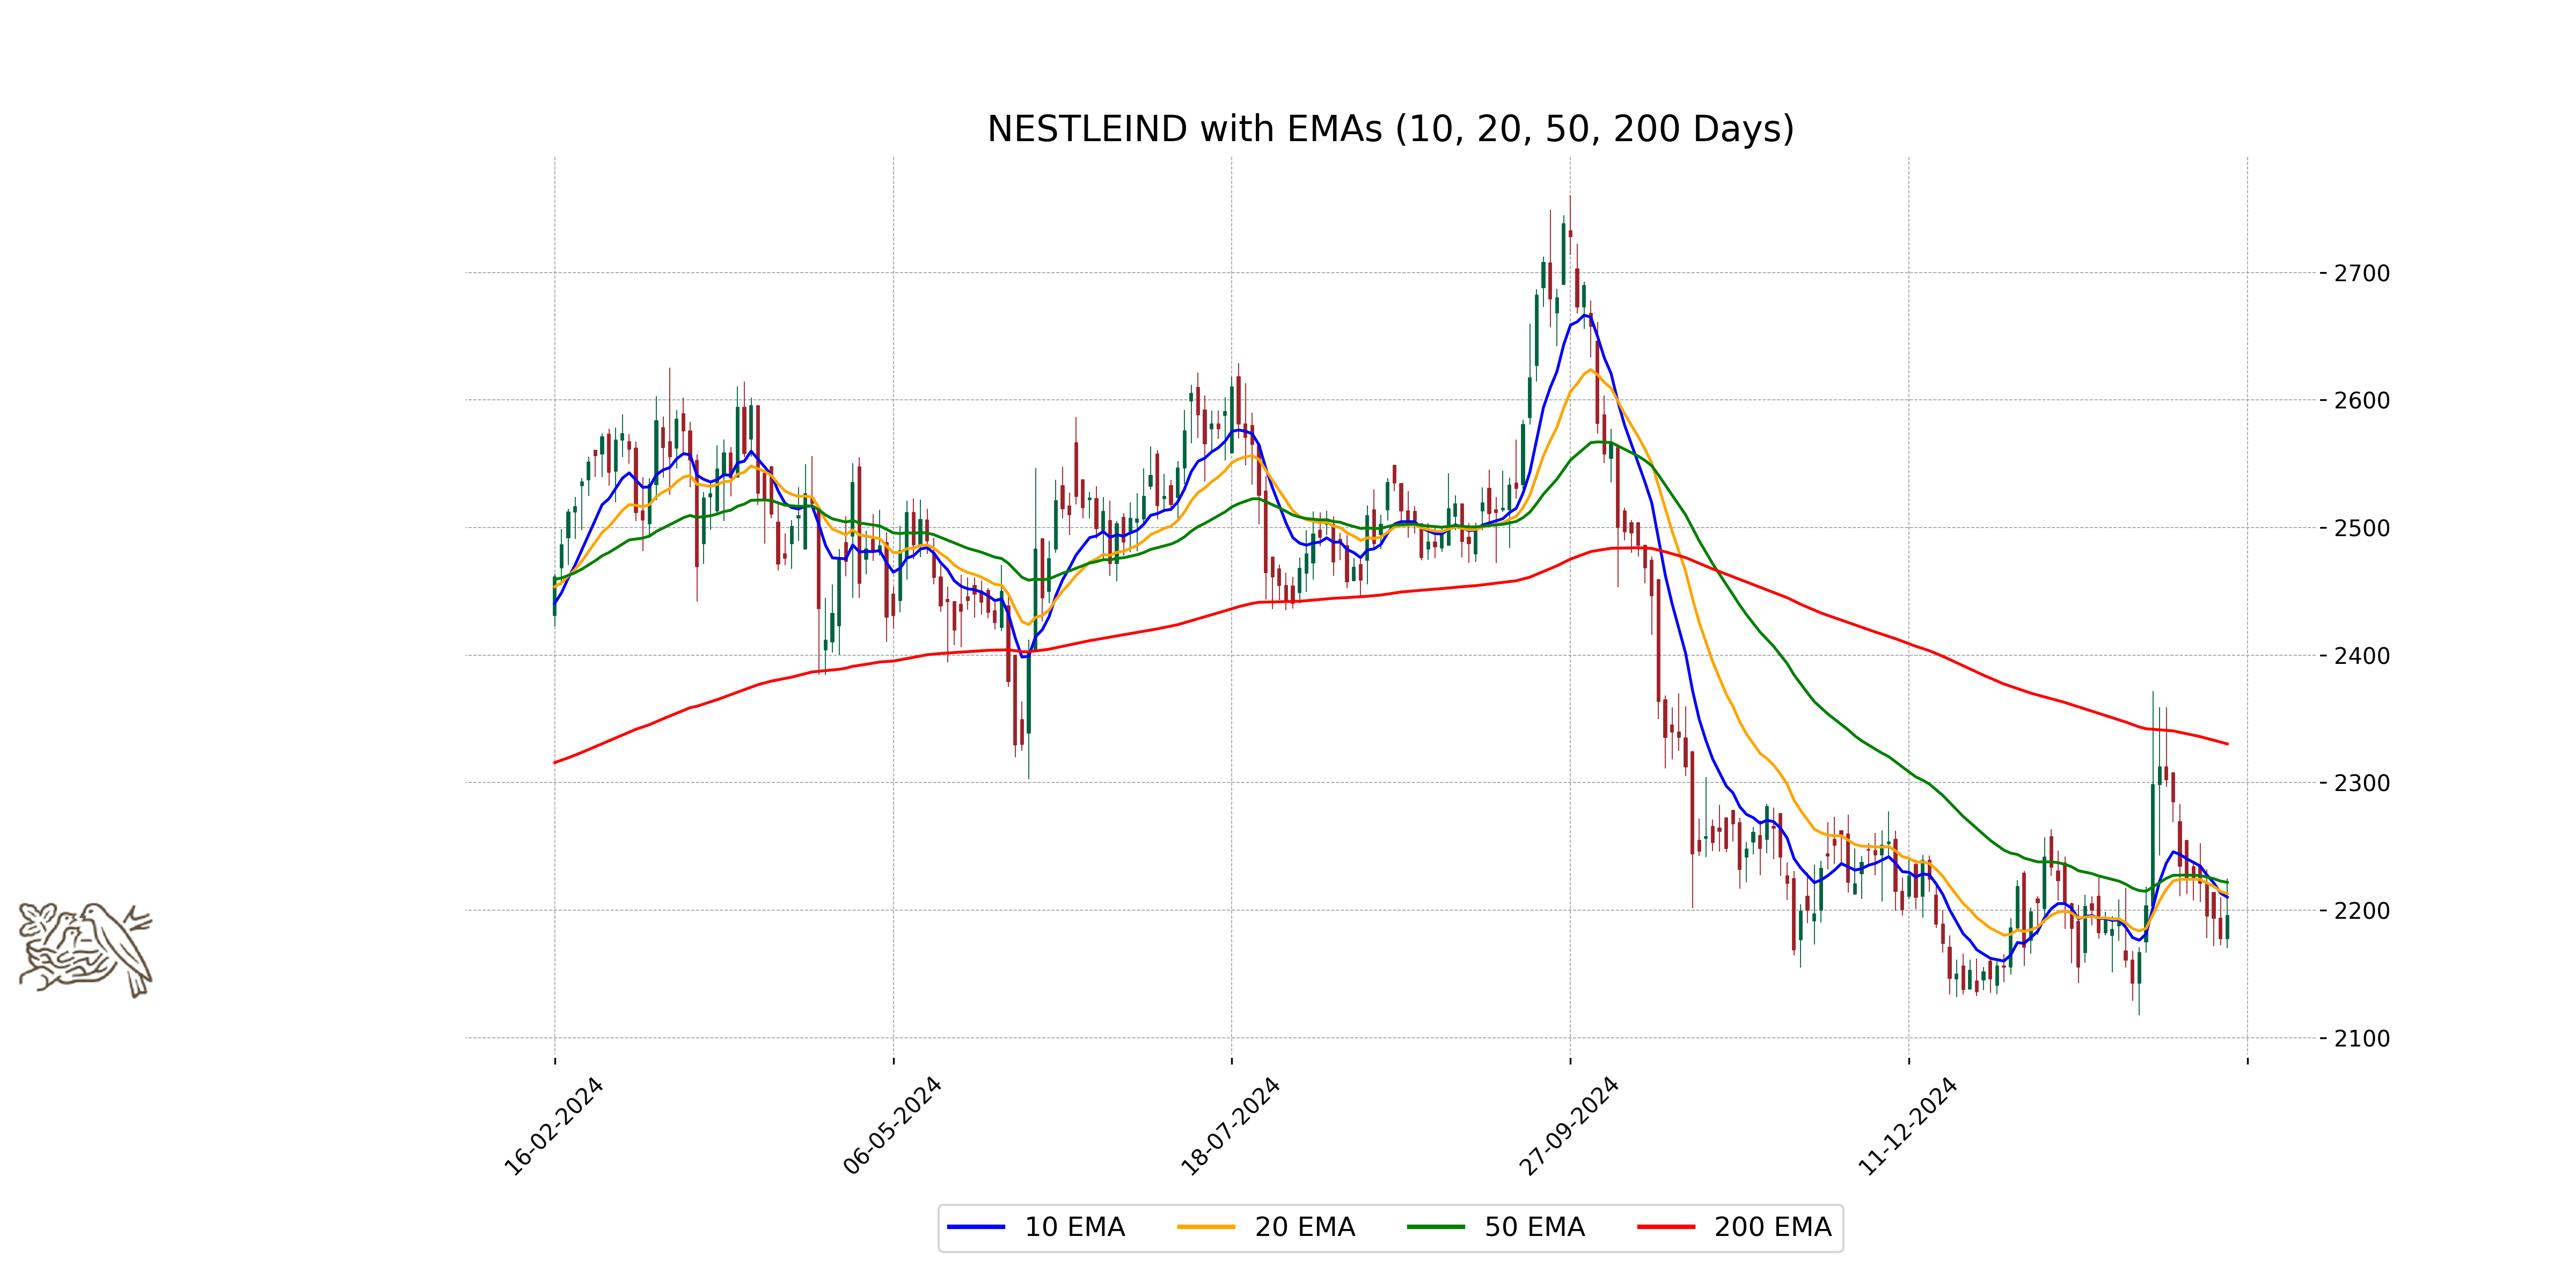
**Nestle India Performance:** On the trading day, Nestle India opened at 2177.55 and closed at 2195.85, marking a percentage change of 0.84% with a points increase of 18.30. The stock had a trading volume of 960,842 shares. Important indicators include a 50-day EMA of 2221.78 and a 200-day EMA at 2330.38, with an RSI of 46.79, suggesting it is neither overbought nor oversold. The company's market capitalization stands at 2,117,144,281,088 INR, and it operates within the Consumer Defensive sector, specifically in the Packaged Foods industry in India.
Relationship with Key Moving Averages
The current closing price of Nestle is below its 10, 20, and 50-day EMAs, indicating potential bearish sentiment in the short to medium term. Additionally, the 50-day EMA is also below the 200-day EMA, often seen as a bearish signal for longer-term trends.
Moving Averages Trend (MACD)
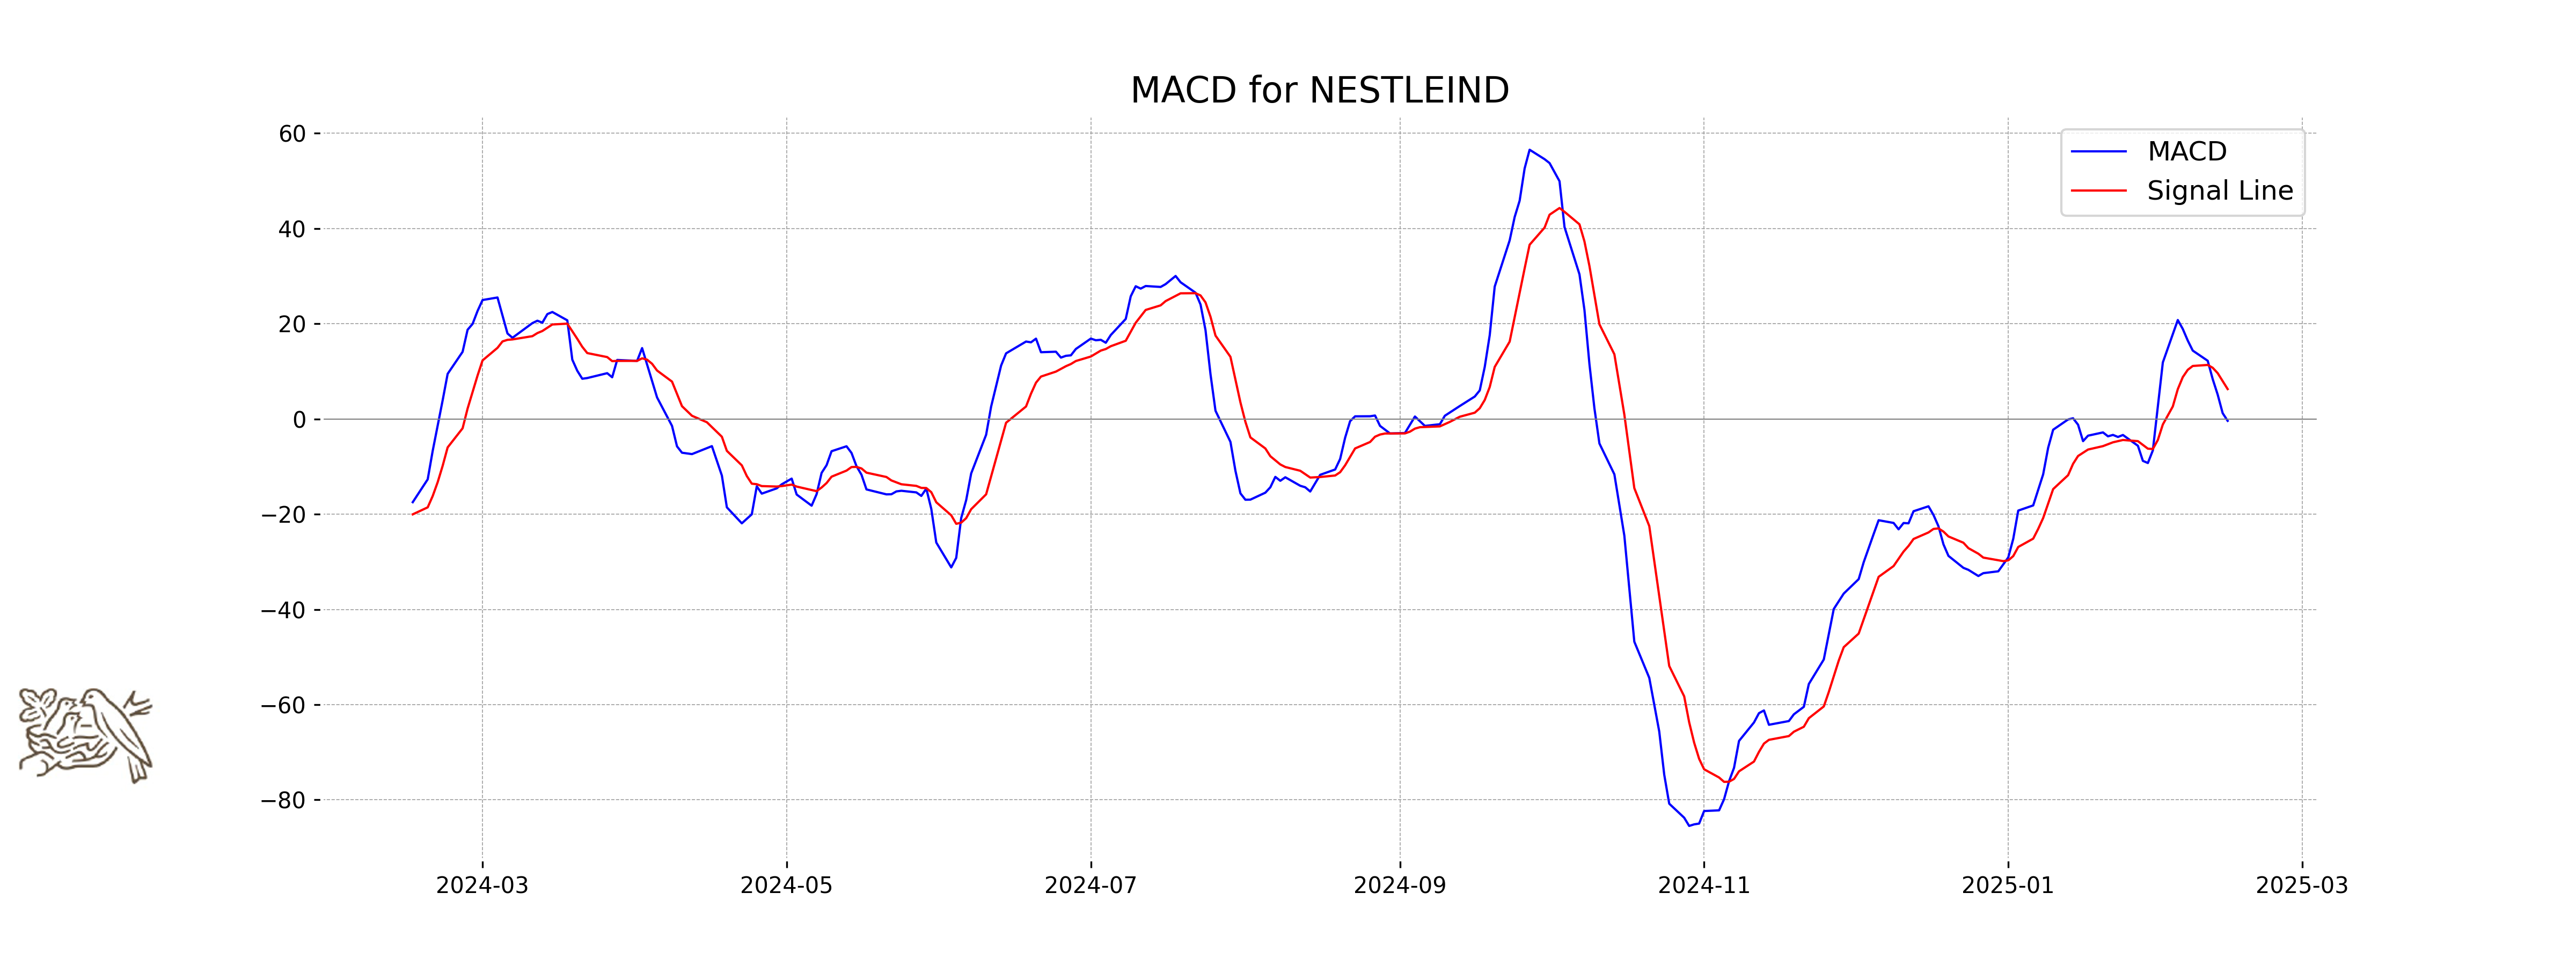
**Nestle MACD Analysis:** The MACD value for Nestle is -0.388, which is below the MACD Signal value of 6.280. This negative divergence suggests a bearish trend, indicating that the stock's momentum may be weakening.
RSI Analysis
The RSI (Relative Strength Index) for Nestle is at 46.79, which indicates that the stock is neither overbought nor oversold. Generally, an RSI below 30 is considered oversold, and above 70 is considered overbought. Therefore, Nestle is currently in a neutral zone, suggesting no strong momentum in either direction.
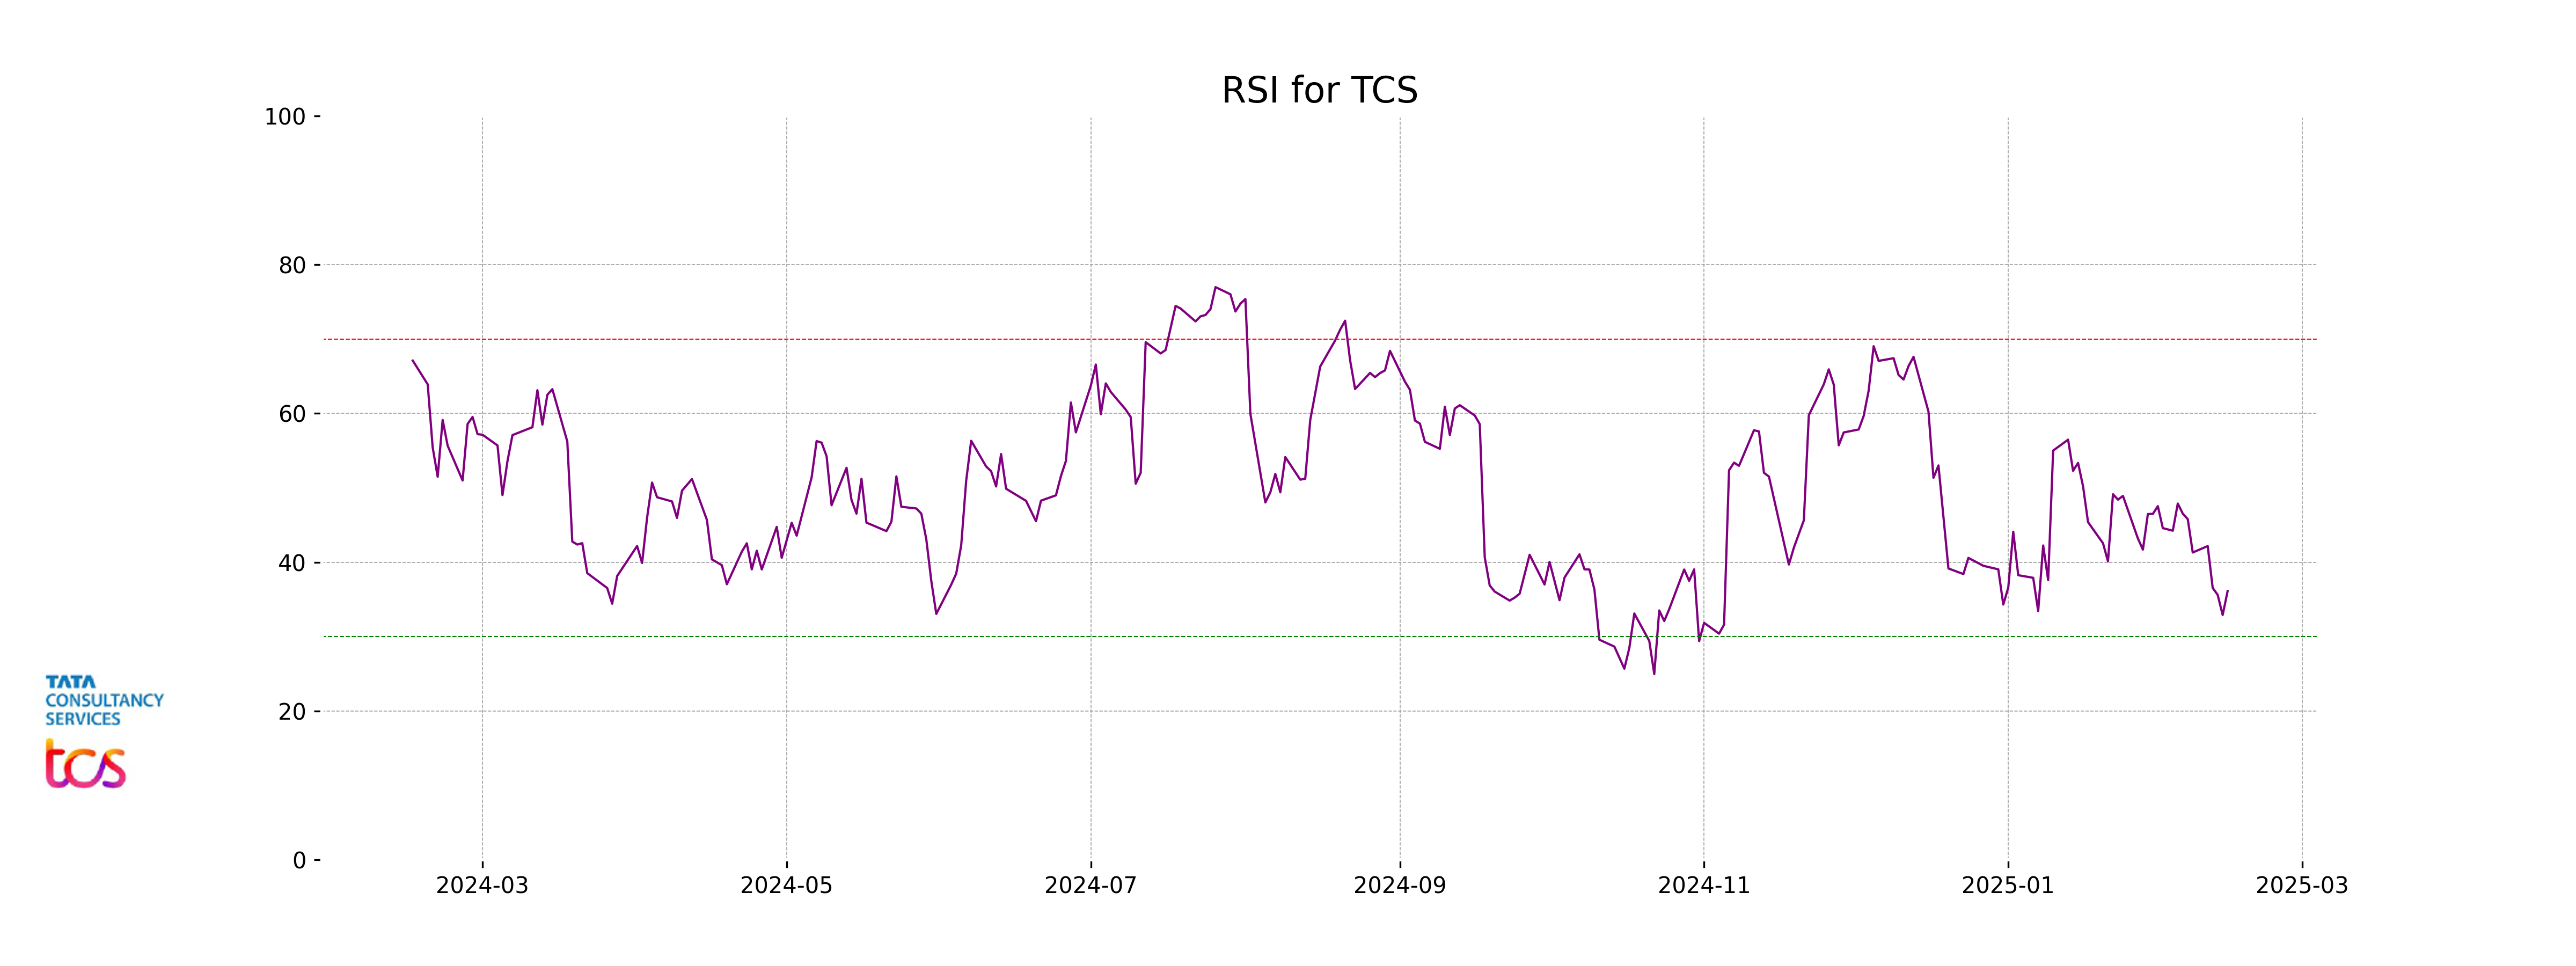
Analysis for TCS - February 14, 2025
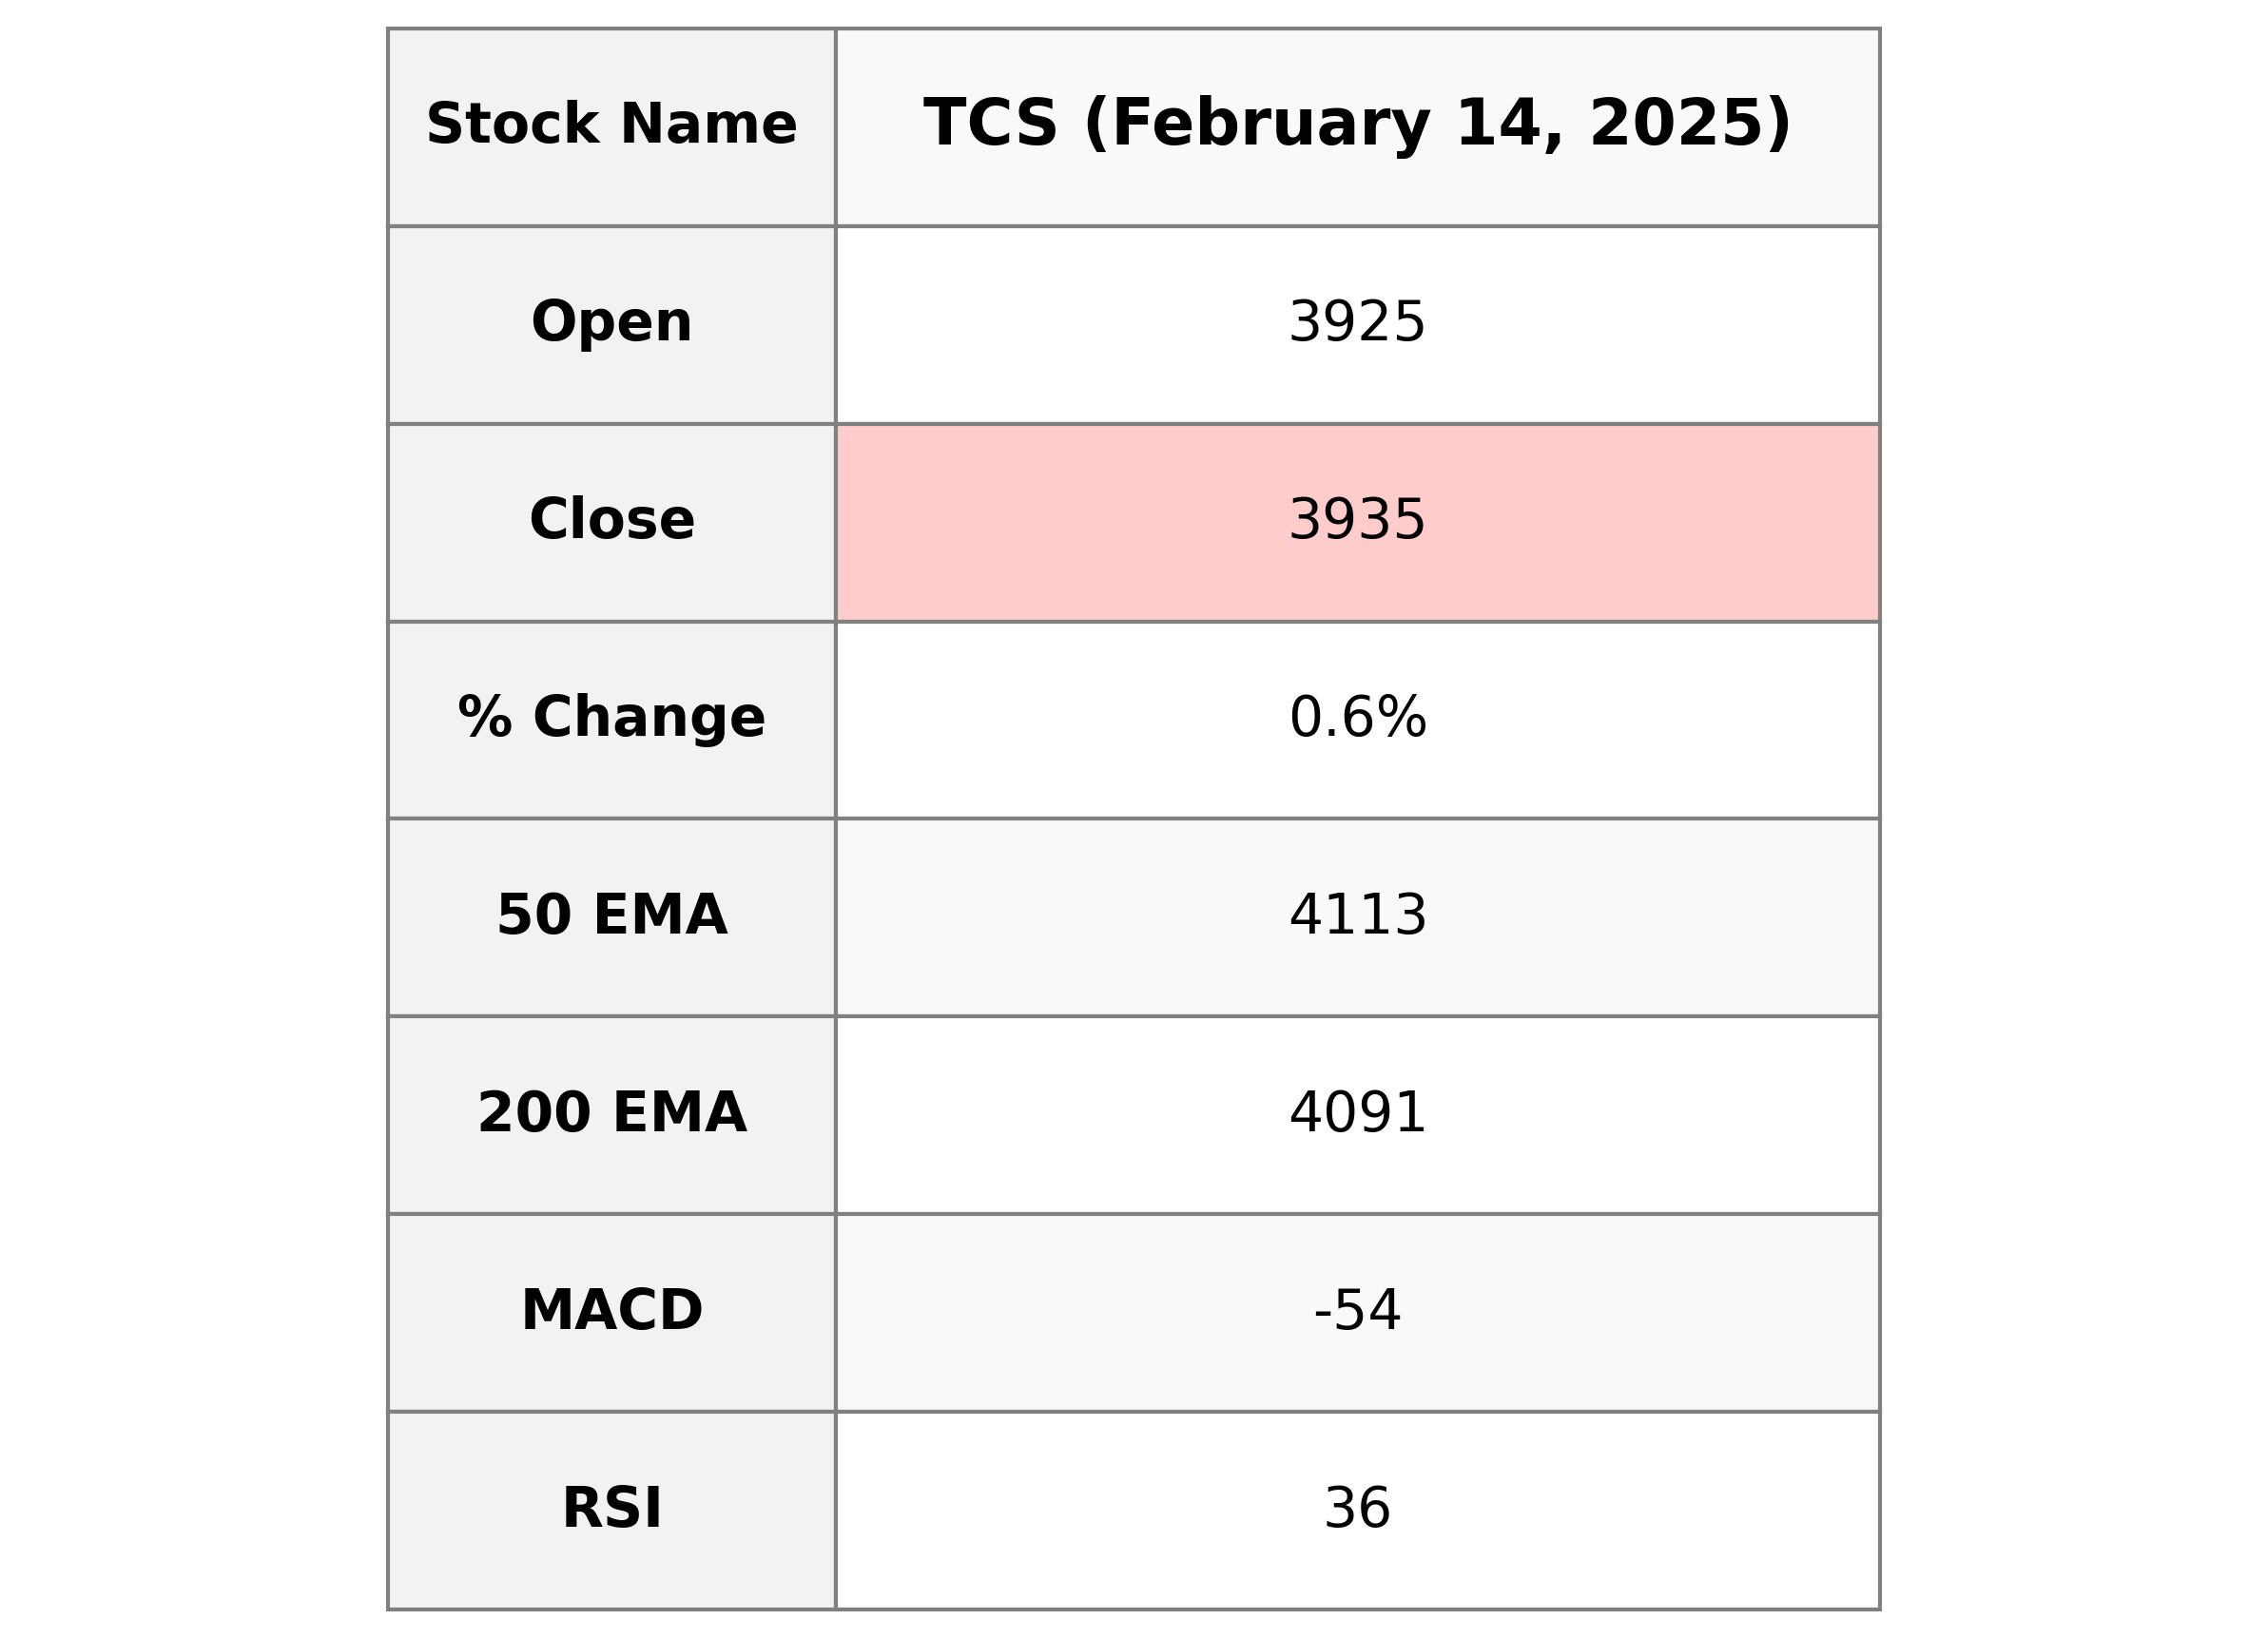
Performance Summary for TCS: TCS closed at 3934.85 with a percentage change of 0.63% from the previous close of 3910.15, after reaching a high of 3948 during the trading session. The stock's performance reflects a modest gain with a points change of 24.70. The RSI indicates a lower momentum at 36.13, suggesting potential oversold conditions. With a substantial market cap and a PE ratio of 29.17, TCS is a significant player in the Technology sector, specifically within Information Technology Services in India.
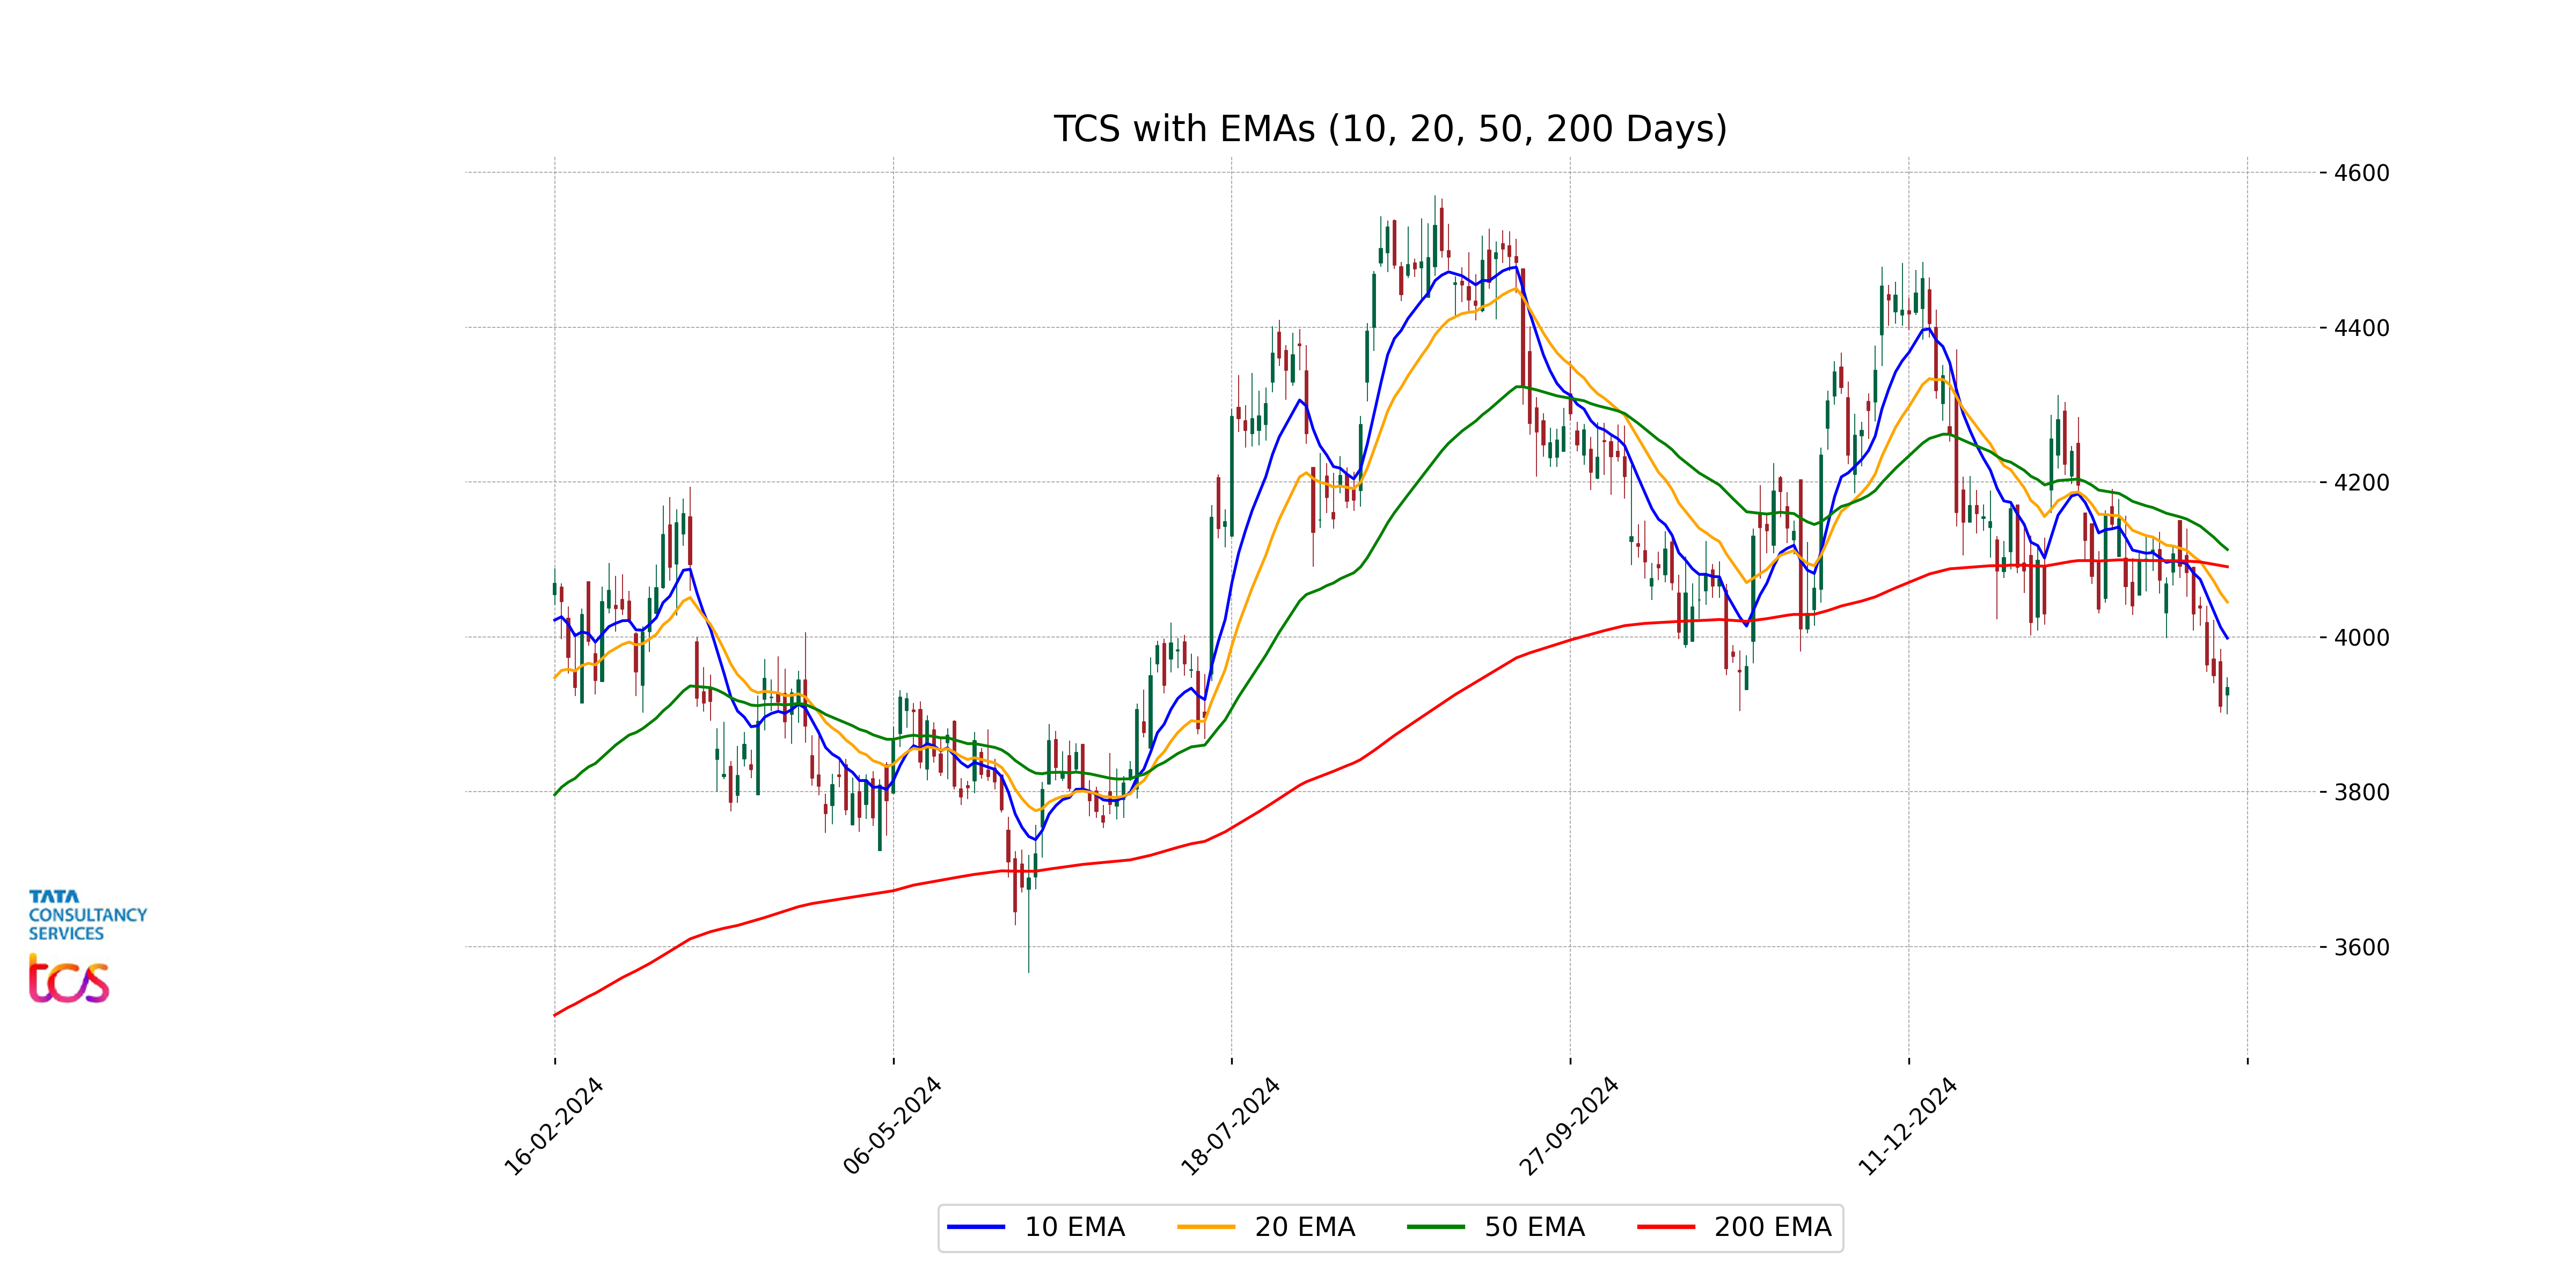
Relationship with Key Moving Averages
The stock price of TCS closed at 3934.85, which is below all key moving averages, including the 10-day EMA (3998.36), 20-day EMA (4044.98), 50-day EMA (4112.87), and 200-day EMA (4090.58). This indicates a bearish trend as the current price is lower than all its short-term and long-term moving averages.
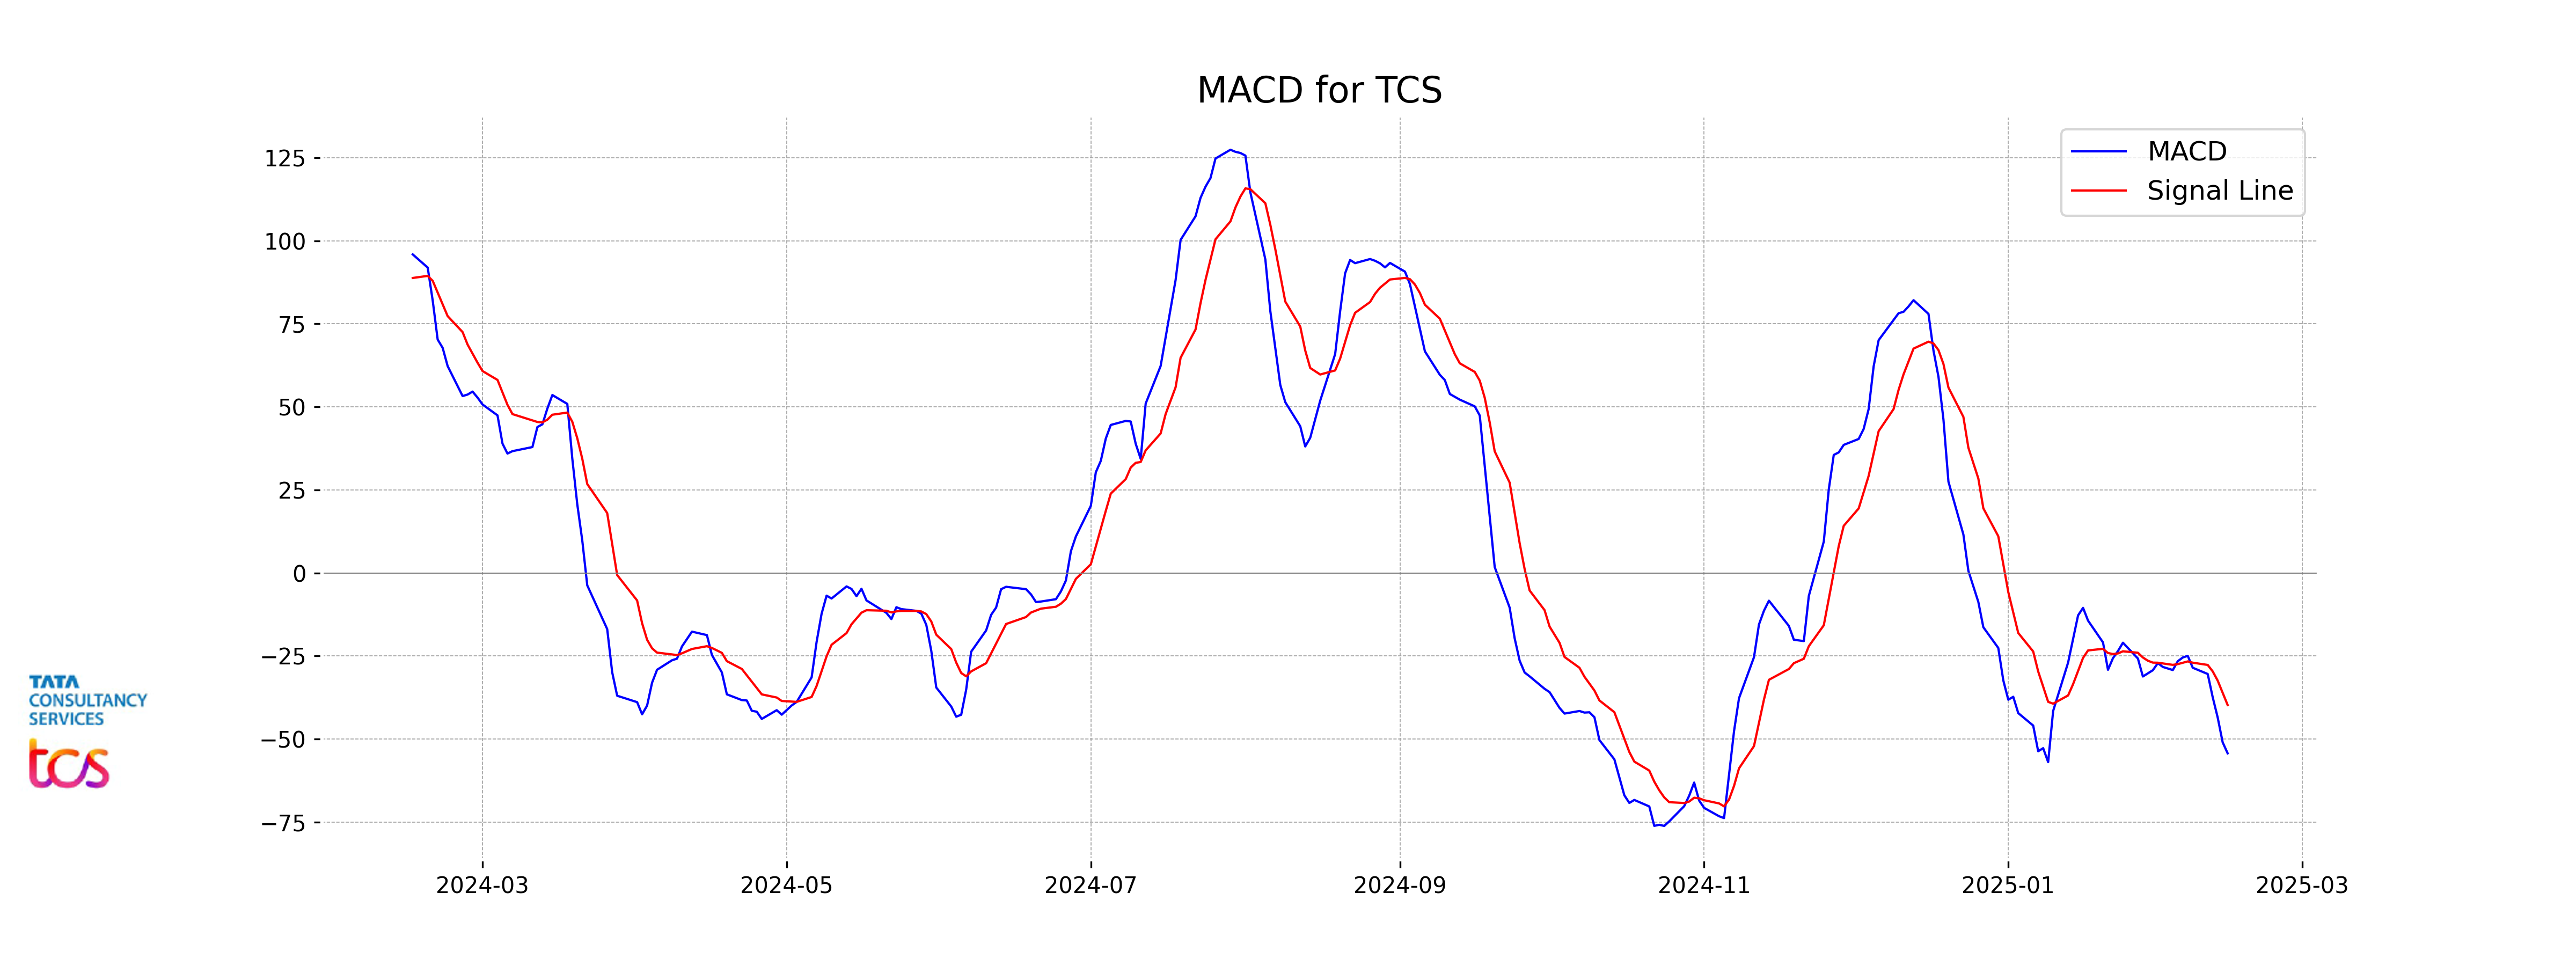
Moving Averages Trend (MACD)
The MACD for TCS is currently negative at -54.31, which indicates a bearish trend as it is below the MACD Signal line of -39.77. This suggests that the stock might be experiencing downward momentum and could continue to face selling pressure in the short term.
RSI Analysis
The RSI for TCS is currently at 36.13, which is considered to be in the lower range indicating that the stock may be approaching oversold conditions. This could suggest potential buying interest if the stock is seen as undervalued at this level.
Up Next

NSE Nifty 50 Top gainers: What are the 5 Biggest Stock gainers Today February 14, 2025

Rupee breaches 91-mark against US dollar for first time in intra-day trade

Microsoft commits USD 17.5 billion investment in India: CEO Satya Nadella

CBI books Anil Ambani's son, Reliance Home Finance Ltd. in Rs 228 crore bank fraud case

RBI raises FY26 GDP growth projection to 7.3 pc

RBI trims policy interest rate by 25bps to 5.25pc, loans to get cheaper

More videos

Rupee slumps to all-time low of 90.25 against US dollar in intra-day trade

Reliance completes merger of Star Television Productions with Jiostar

India to lead emerging market growth with 7pc GDP rise in 2025: Moody’s

Nifty hits record high after 14 months; Sensex nears all-time peak

Reliance stops Russian oil use at its only-for-export refinery to comply with EU sanctions

ED attaches fresh assets worth over Rs 1,400 cr in case against Anil Ambani's Reliance Group

India signs one-year deal to import 2.2 million tonnes of LPG from US

India International Trade Fair begins at Pragati Maidan amid tight security

Stock markets decline in initial trade on foreign fund outflows, weak Asian peers

Amazon to lay off 30,000 office workers amid AI-driven cost cuts