


Highlights
- Bajaj Finserv shows strong uptrend above key EMAs
- HDFC Life gains but stays below long-term EMAs
- Tata Steel struggles below key moving averages
Latest news

Putin hails Ukraine gains, threatens more, in annual press conference

OnePlus Pad Go 2 Review: No drama, just a good tablet

Parliament Moment: Priyanka Gandhi shares tea with Rajnath Singh. PM Modi and Om Birla

Cold wave deepens in Kashmir as Chillai-Kalan nears, temperatures dip below freezing

Pakistan accuses India of attempting to undermine Indus treaty

Vande Mataram discussion in UP legislature to mark 150th anniversary: Yogi Adityanath

Ashes 2025: Travis Head slams unbeaten 142 to crush England's Ashes hopes

Tipra Motha youth wing protests Bangladesh leader's anti-India remarks in Agartala
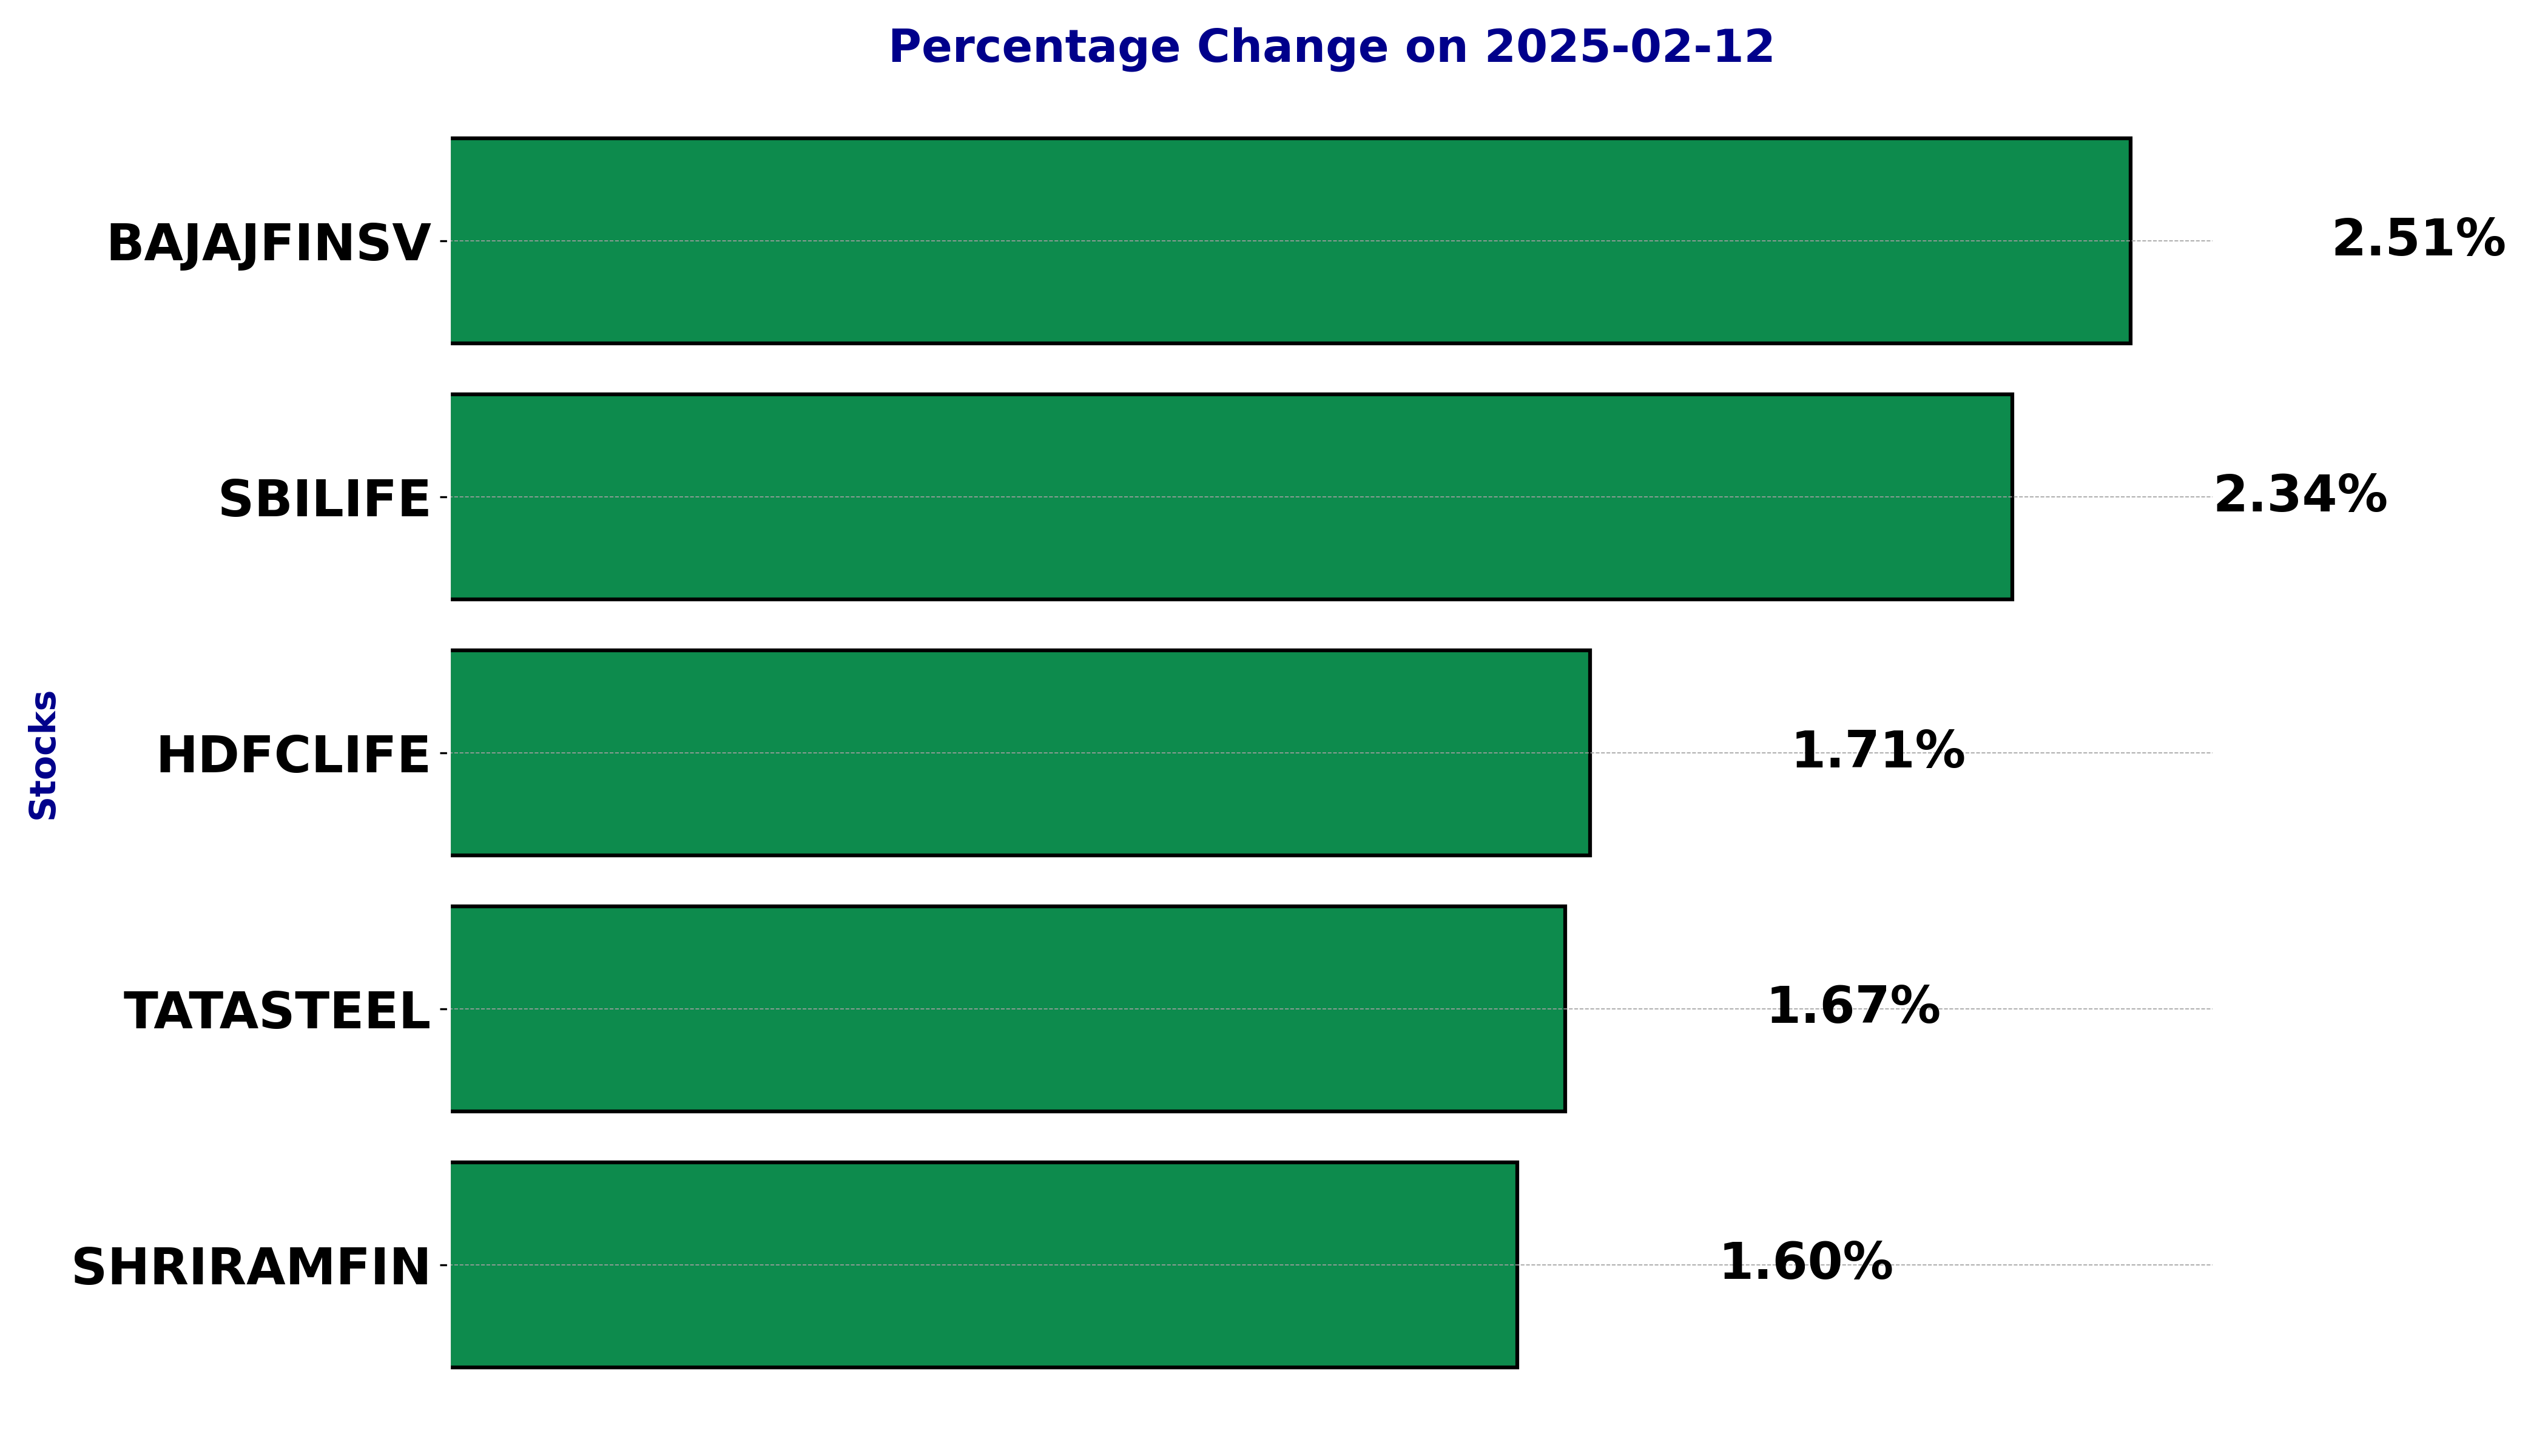
Top 5 Nifty 50 gainers today – February 12, 2025: Biggest stock moves


In this article, we will explore the technical indicators of some of the high-performing stocks on the Indian stock market, including BAJAJFINSV, HDFCLIFE, SBILIFE, SHRIRAMFIN, and TATASTEEL.
By looking at these stocks through the lens of key technical factors, we aim to better understand their price movements, trends, and potential future performance.
Analysis for Bajaj Finserv - February 12, 2025
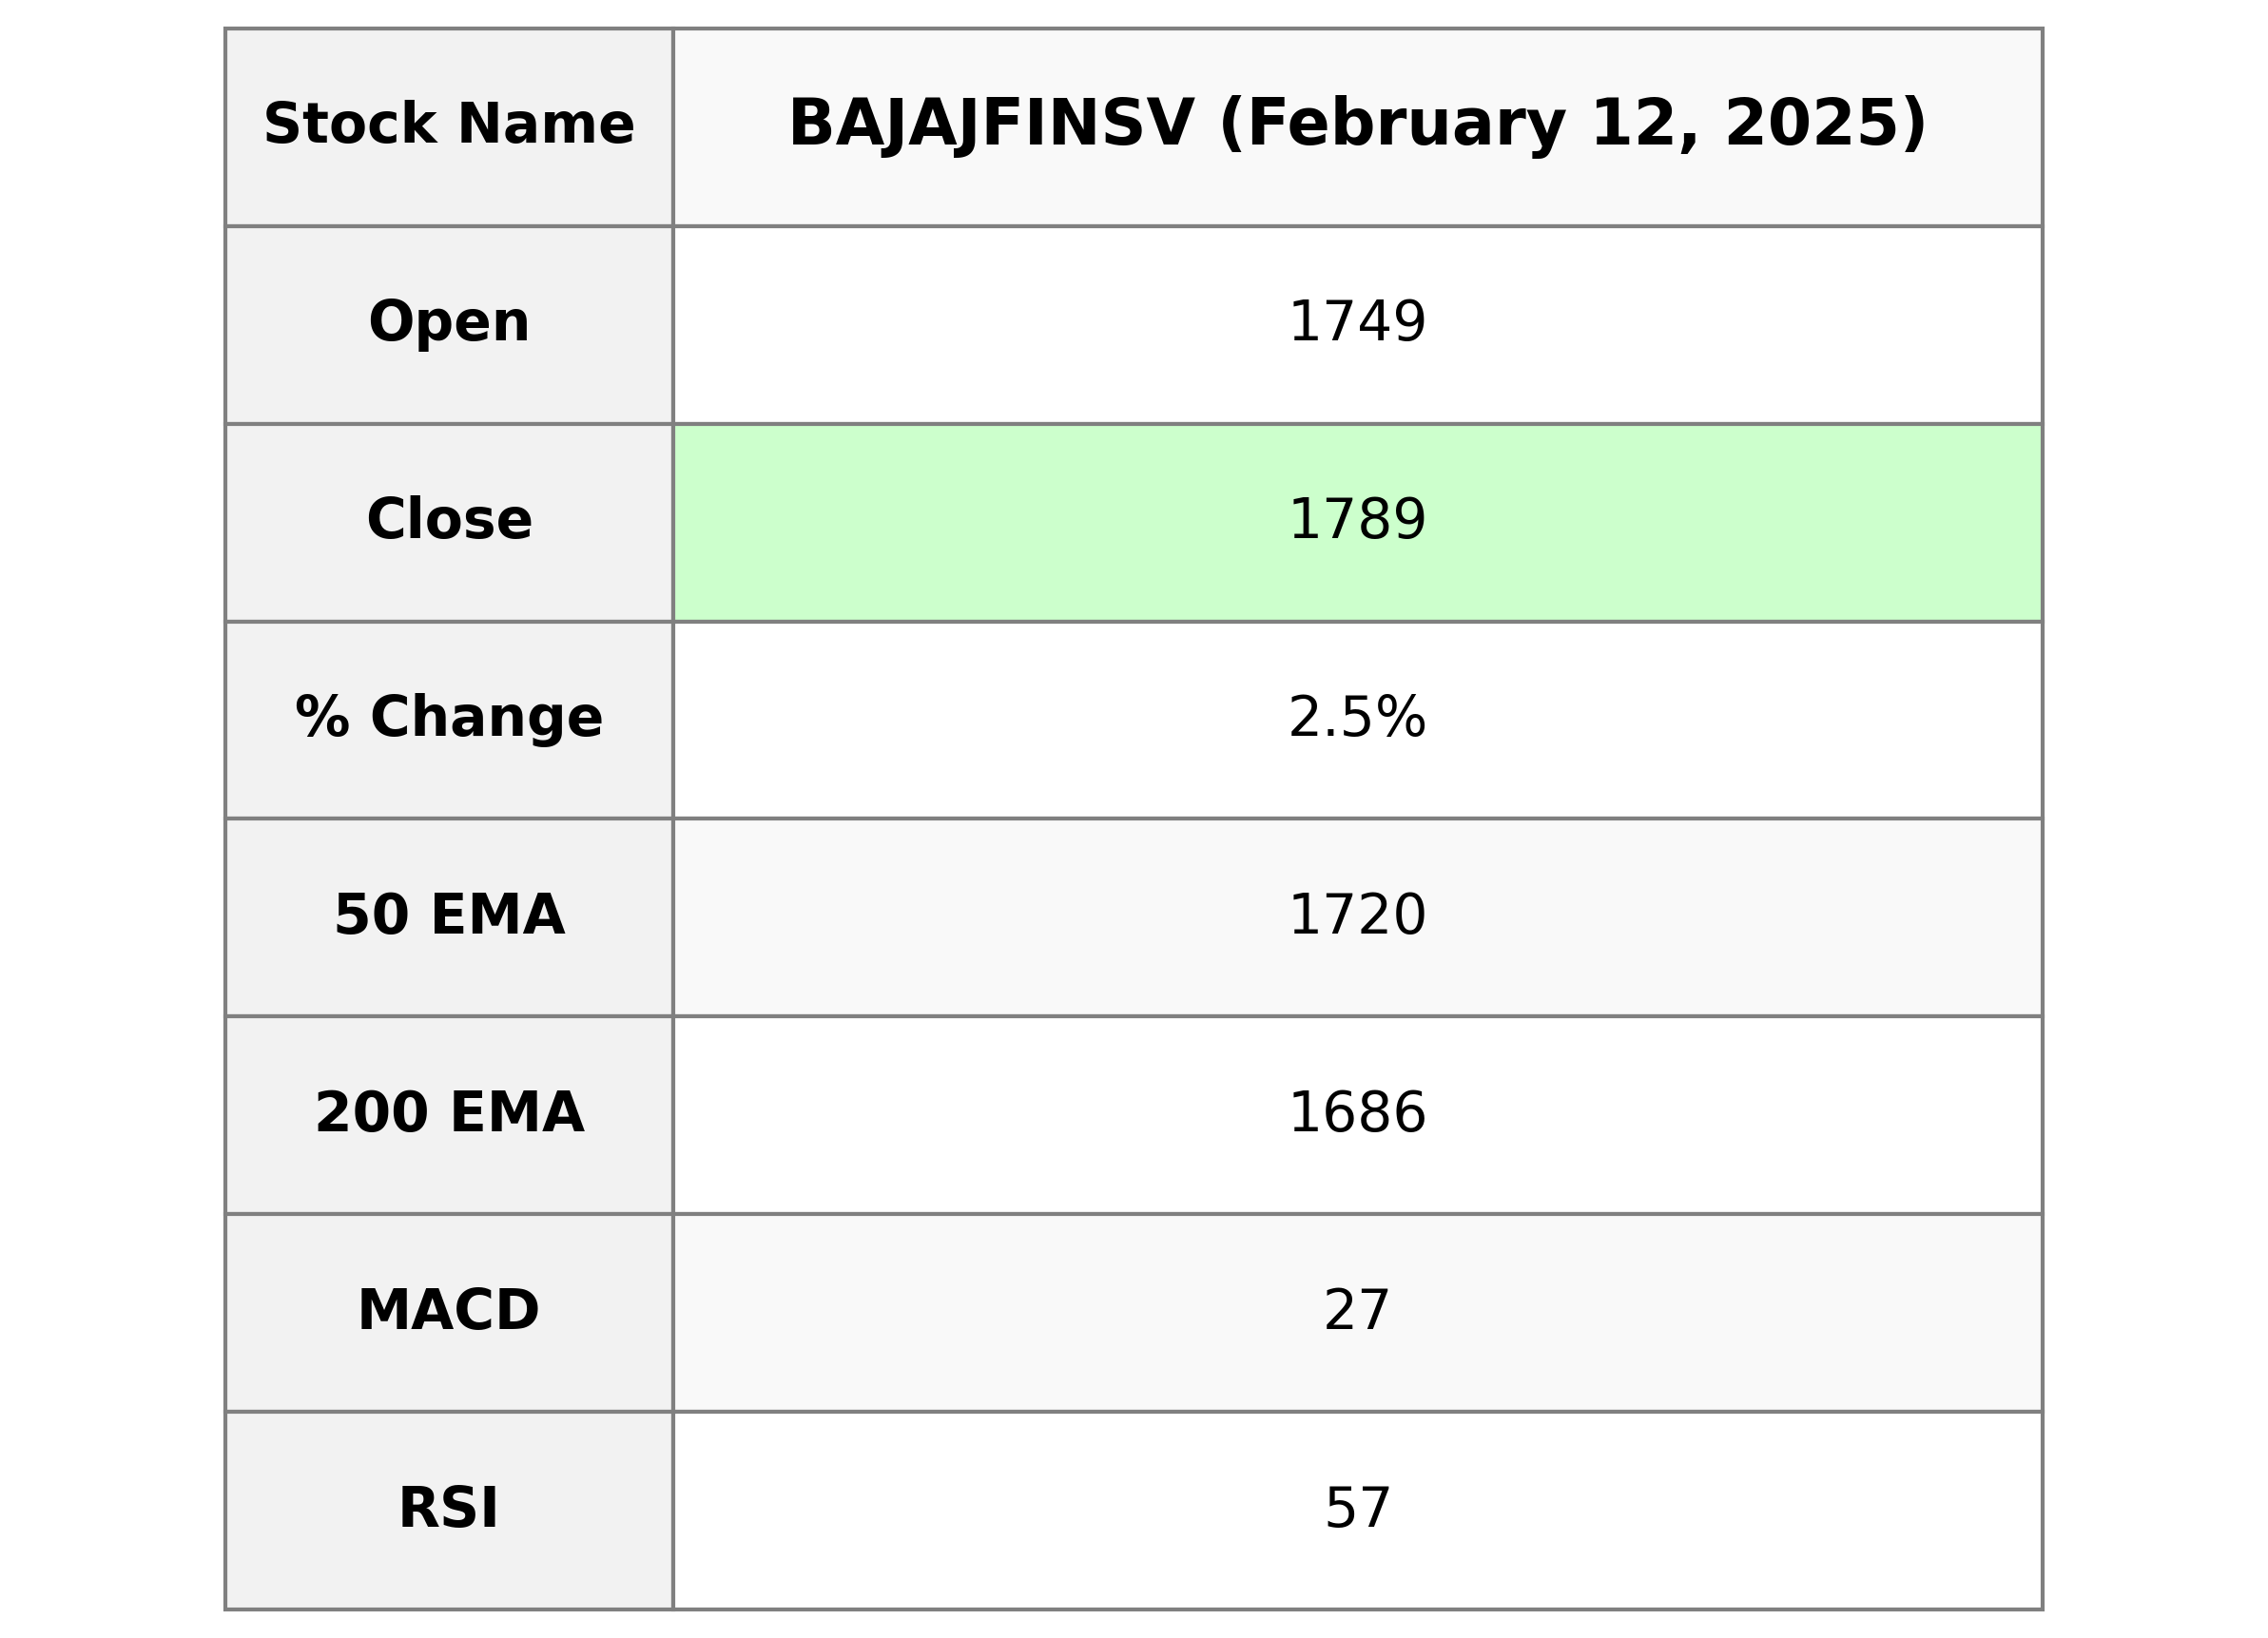
## Bajaj Finserv Performance Bajaj Finserv showed a positive performance with a closing price of 1788.70, up by 2.51% from its previous close of 1744.85. The stock's RSI indicates a moderately strong trend, supported by its price closing above both the 50 and 200 EMAs. This performance is accompanied by a robust market cap in the Financial Services sector, despite a high PE ratio and missing EPS information.
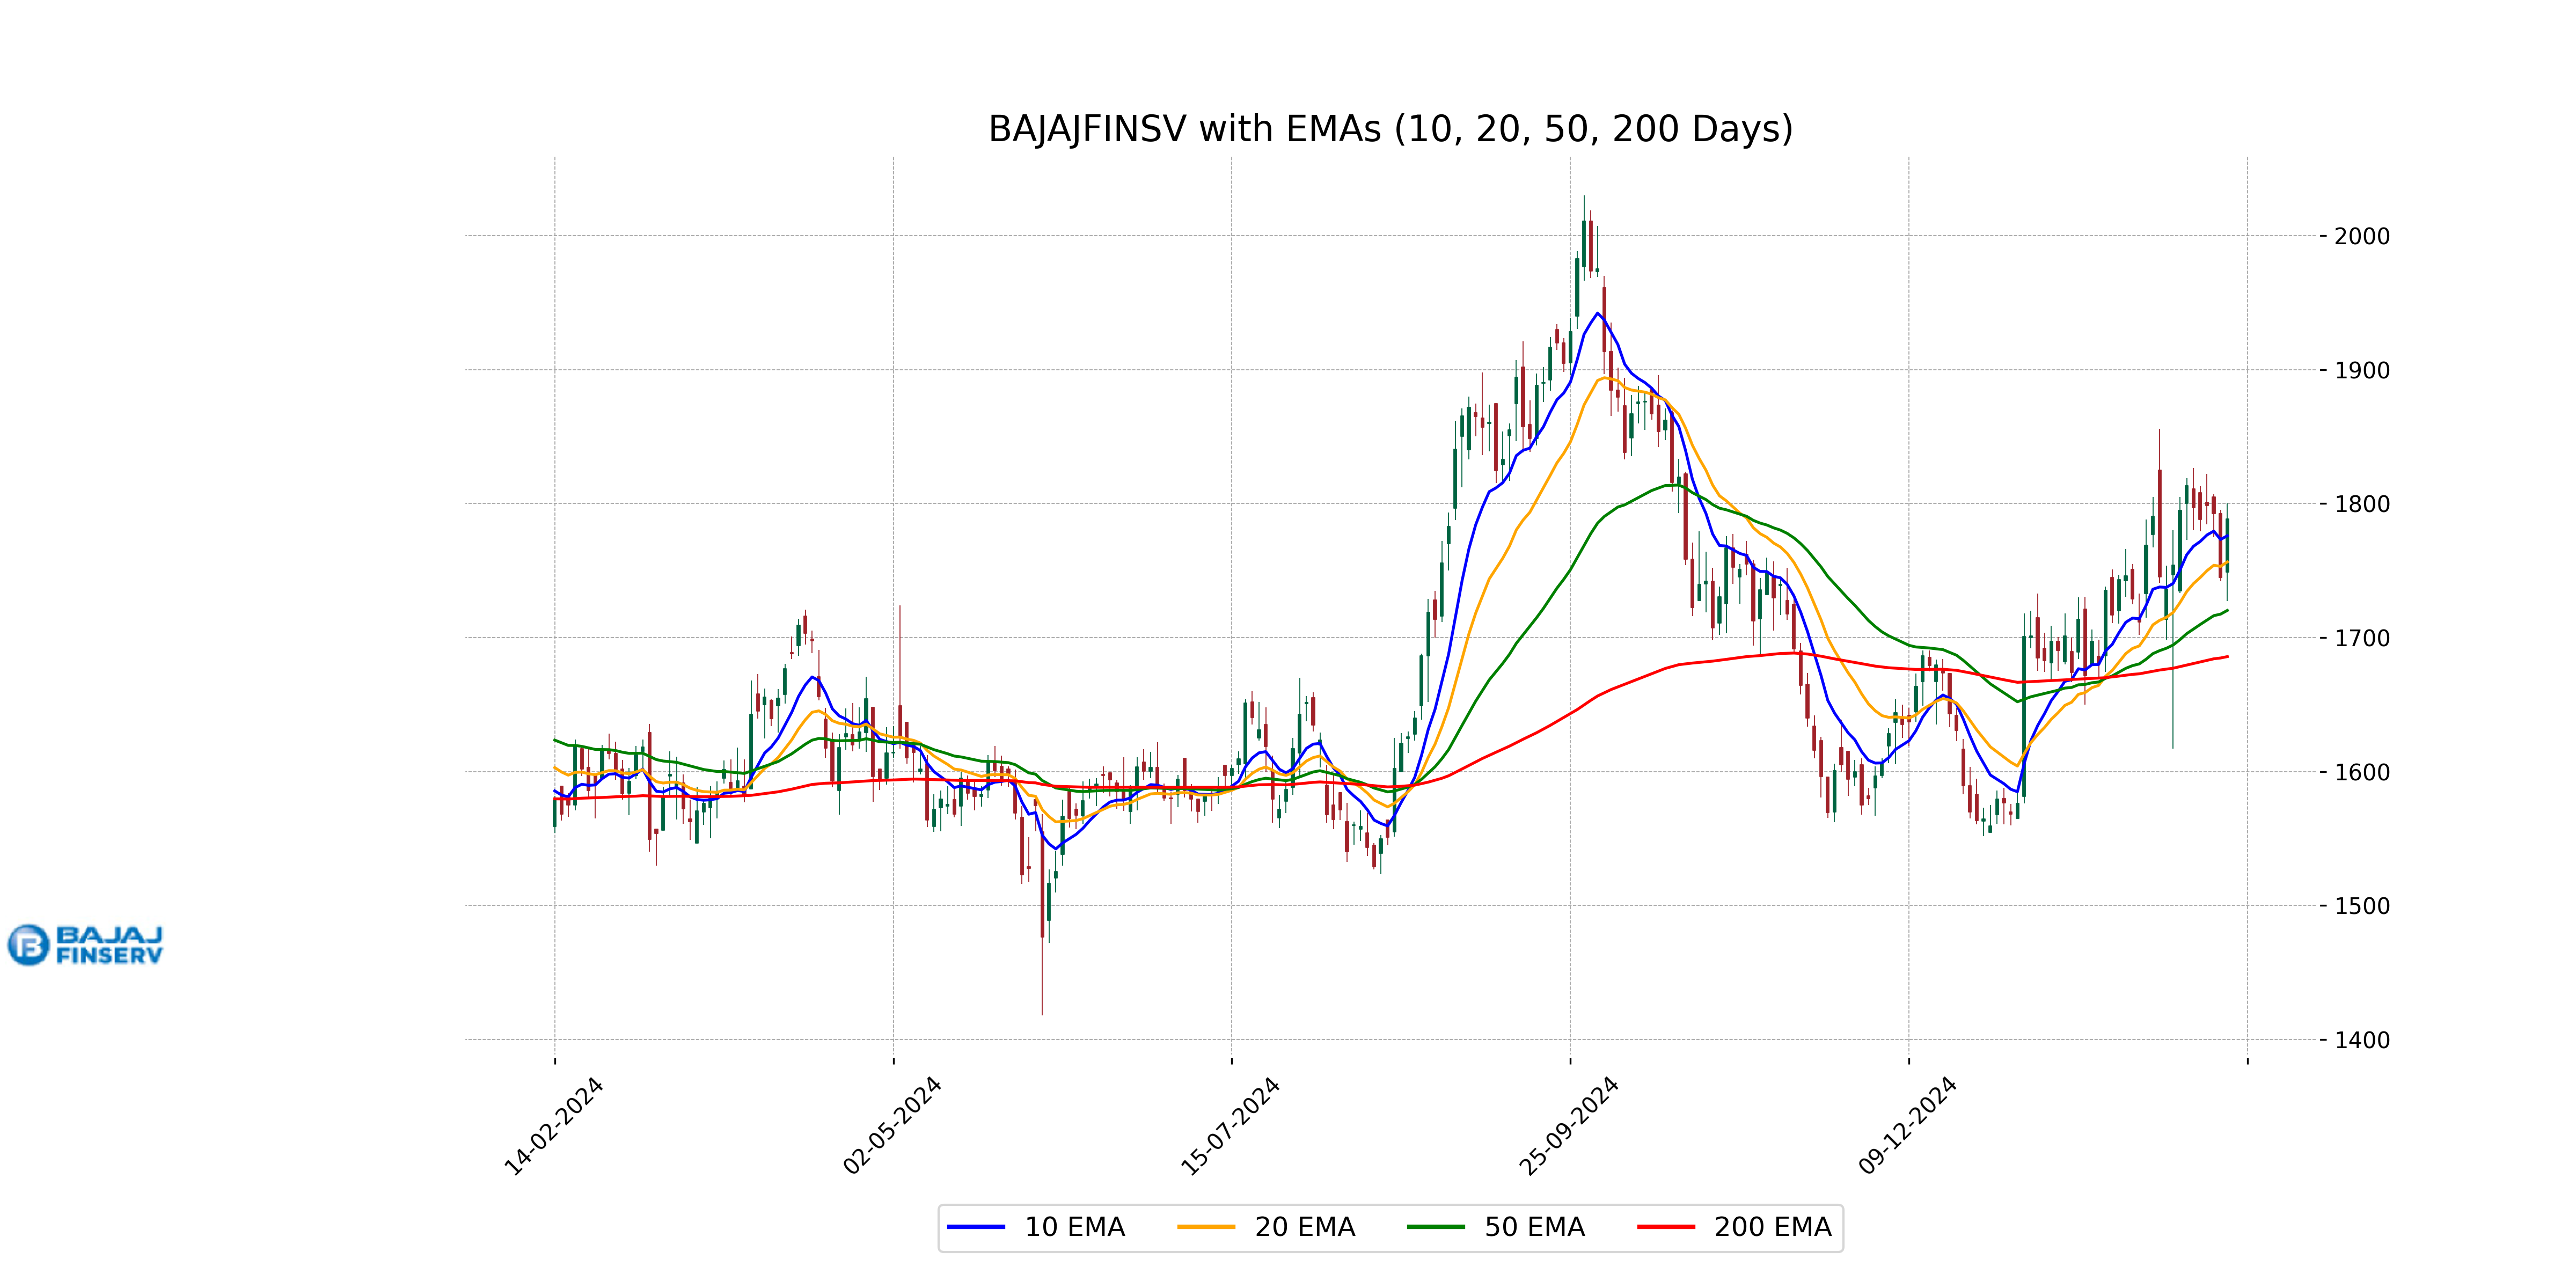
Relationship with Key Moving Averages
Bajaj Finserv is currently trading above all its key moving averages, with a closing price of 1788.70. The 10-day EMA is at 1775.99, suggesting a short-term uptrend, while the 50-day EMA stands at 1720.26 and the 200-day EMA at 1685.78, indicating a longer-term bullish trend.
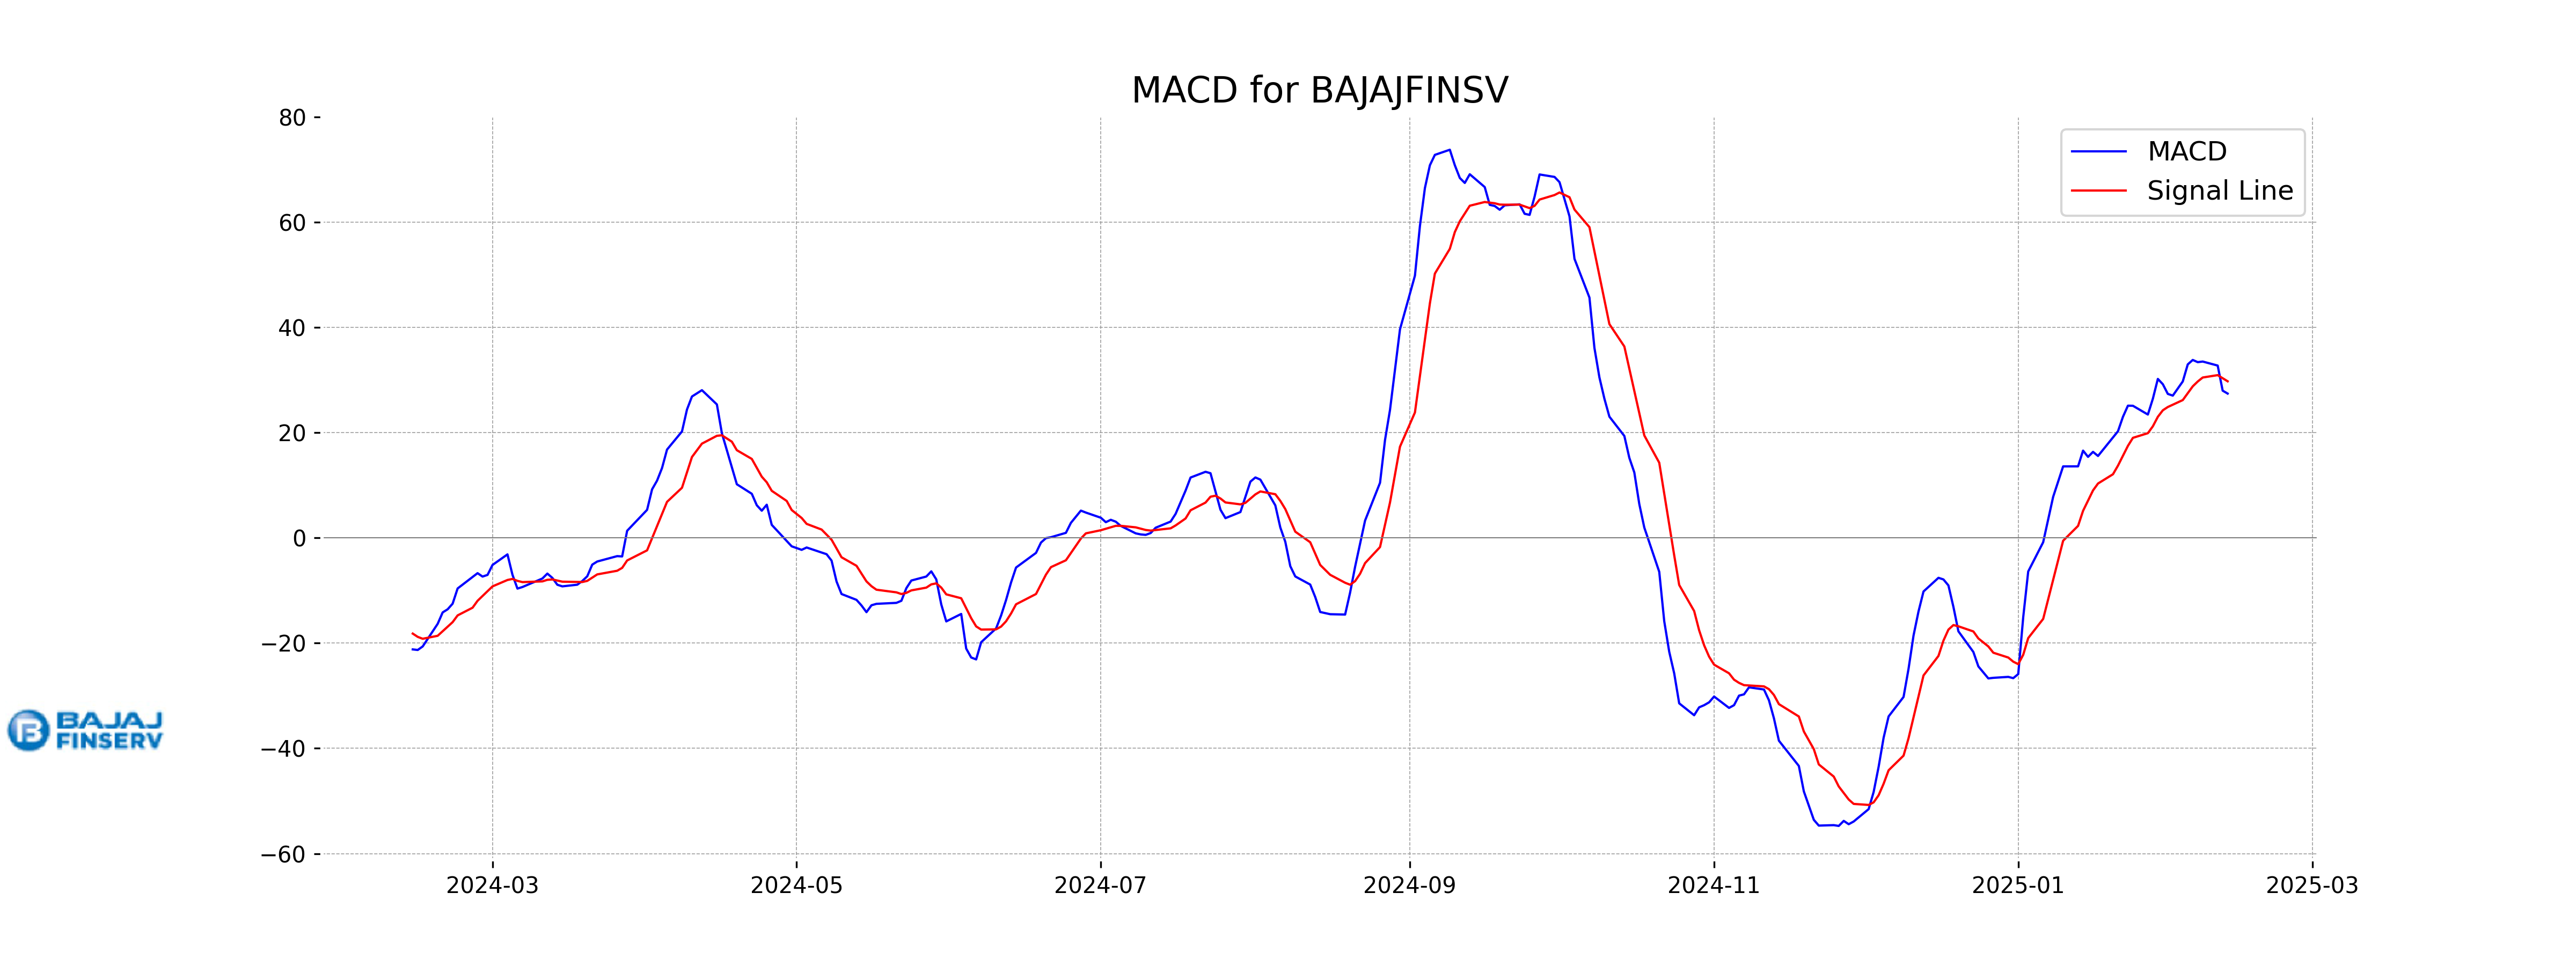
Moving Averages Trend (MACD)
**Bajaj Finserv** has a MACD of 27.41, which is below the MACD Signal line of 29.75, suggesting a bearish momentum. The decline below the signal line indicates potential downward pressure or a weakening bullish trend for the stock.
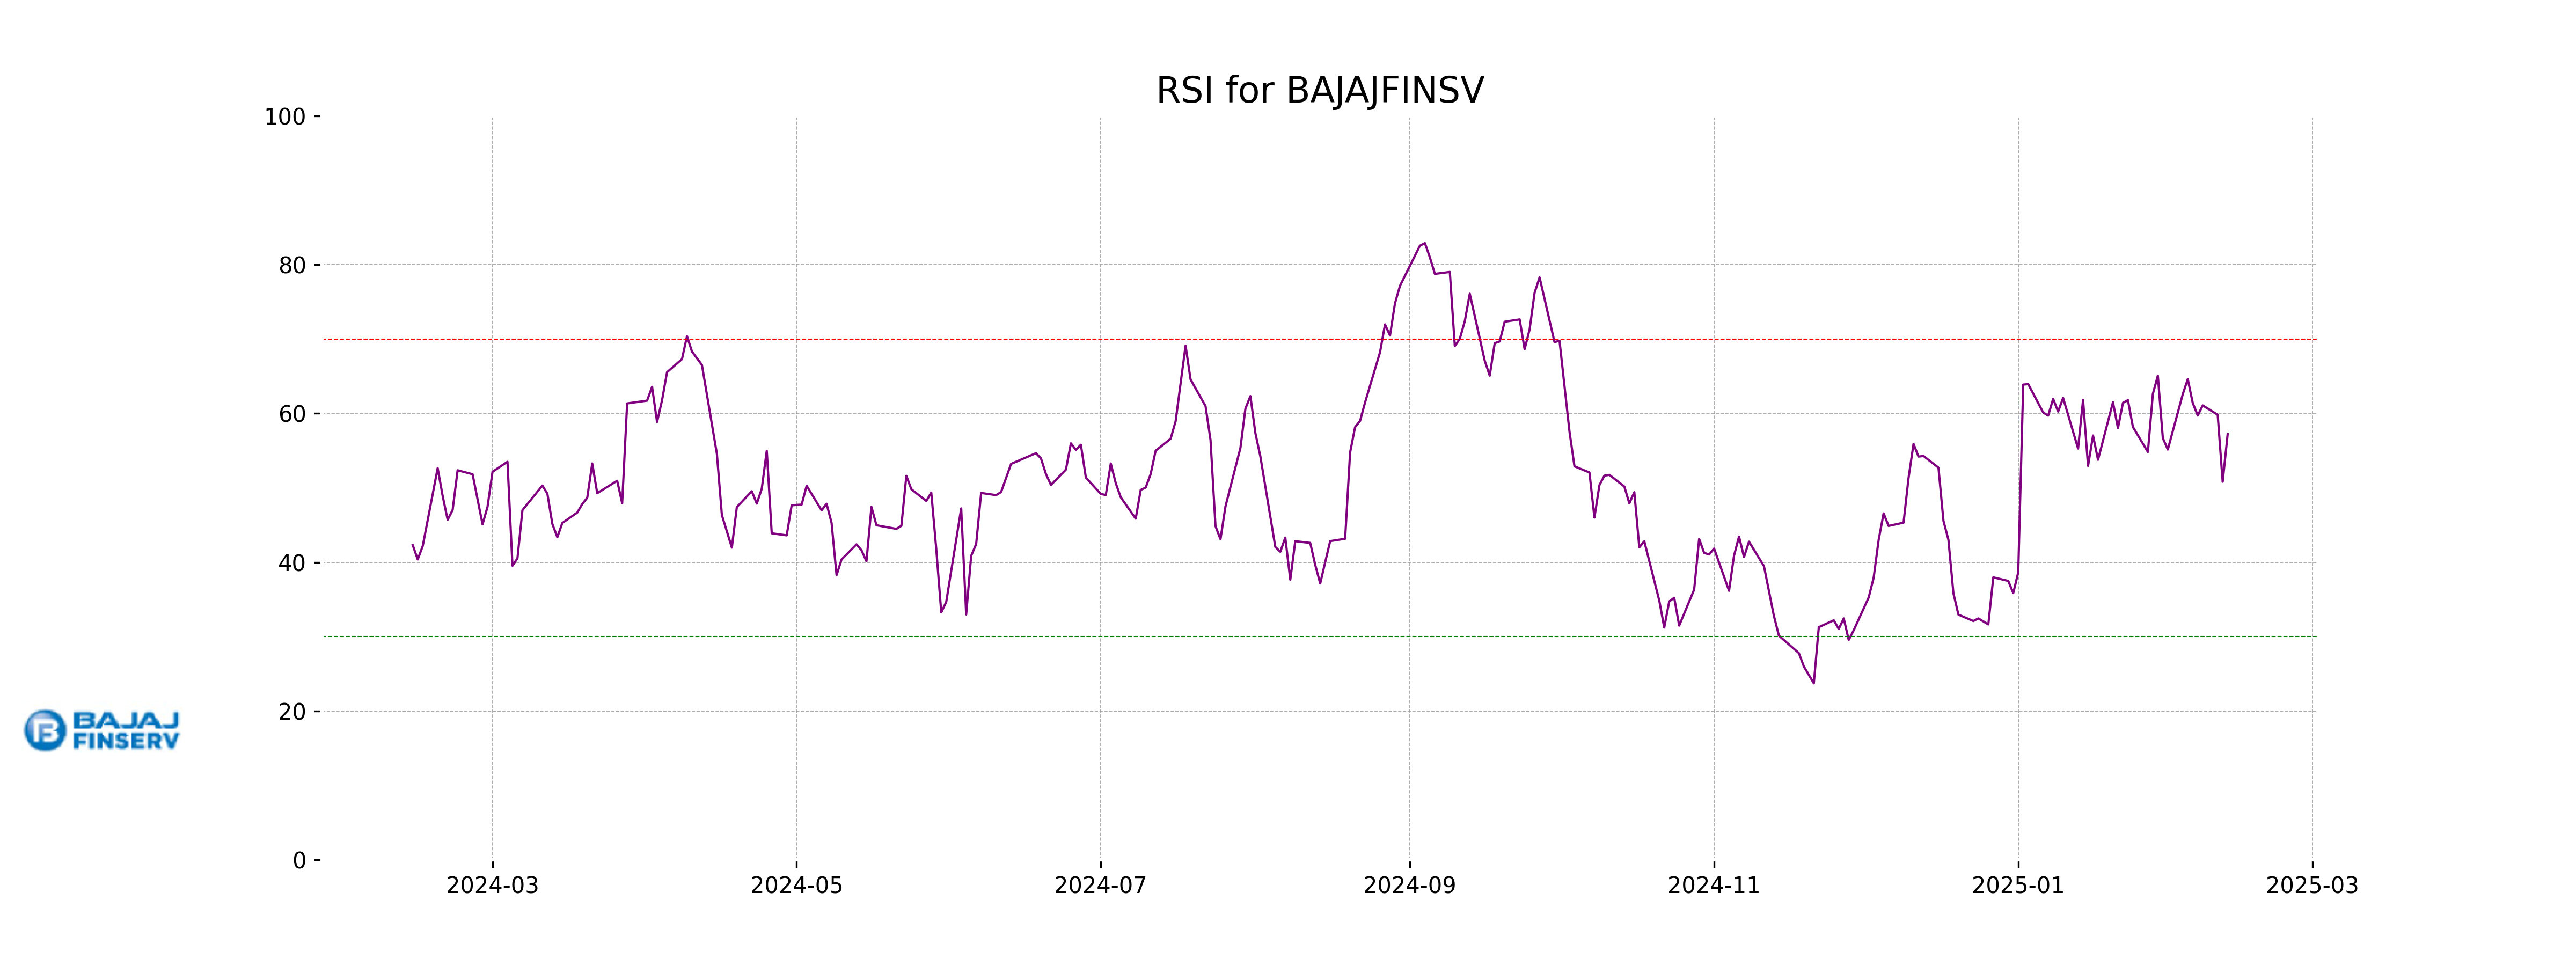
RSI Analysis
The Relative Strength Index (RSI) for Bajaj Finserv is 57.22, indicating a neutral market position. This suggests that the stock is neither overbought nor oversold, and it is trading in a relatively stable range.
Analysis for HDFC LIFE - February 12, 2025
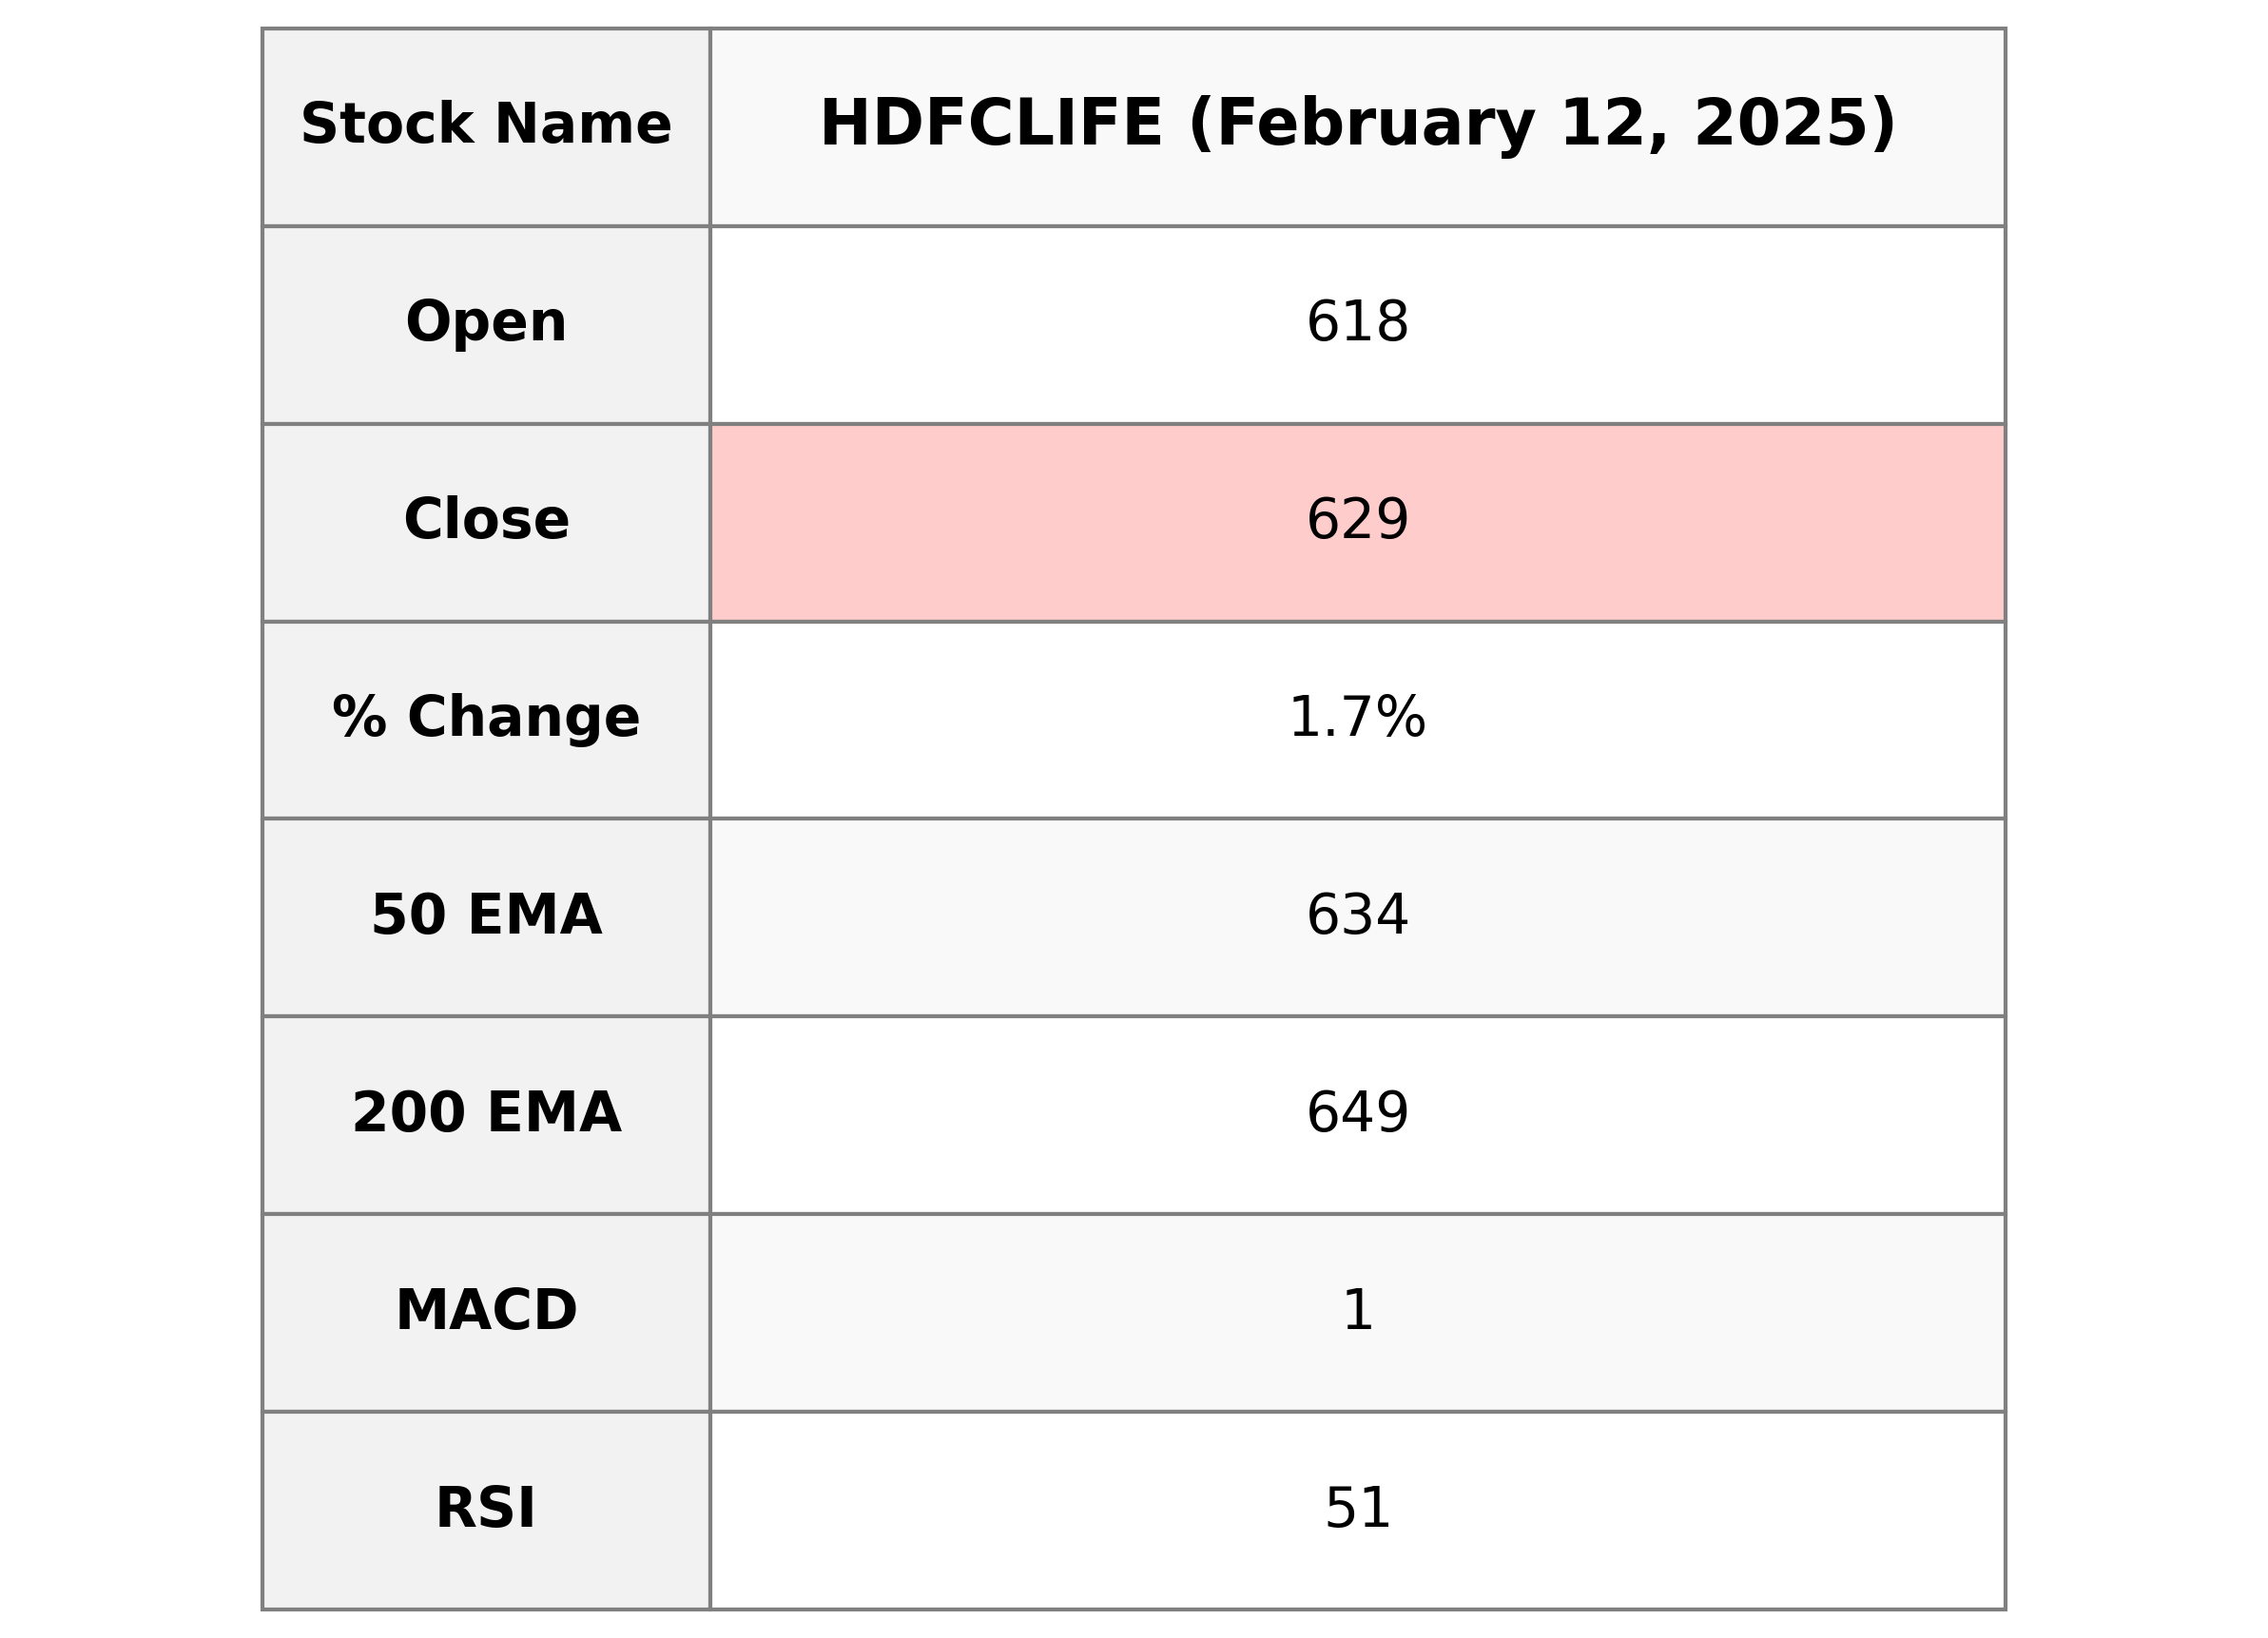
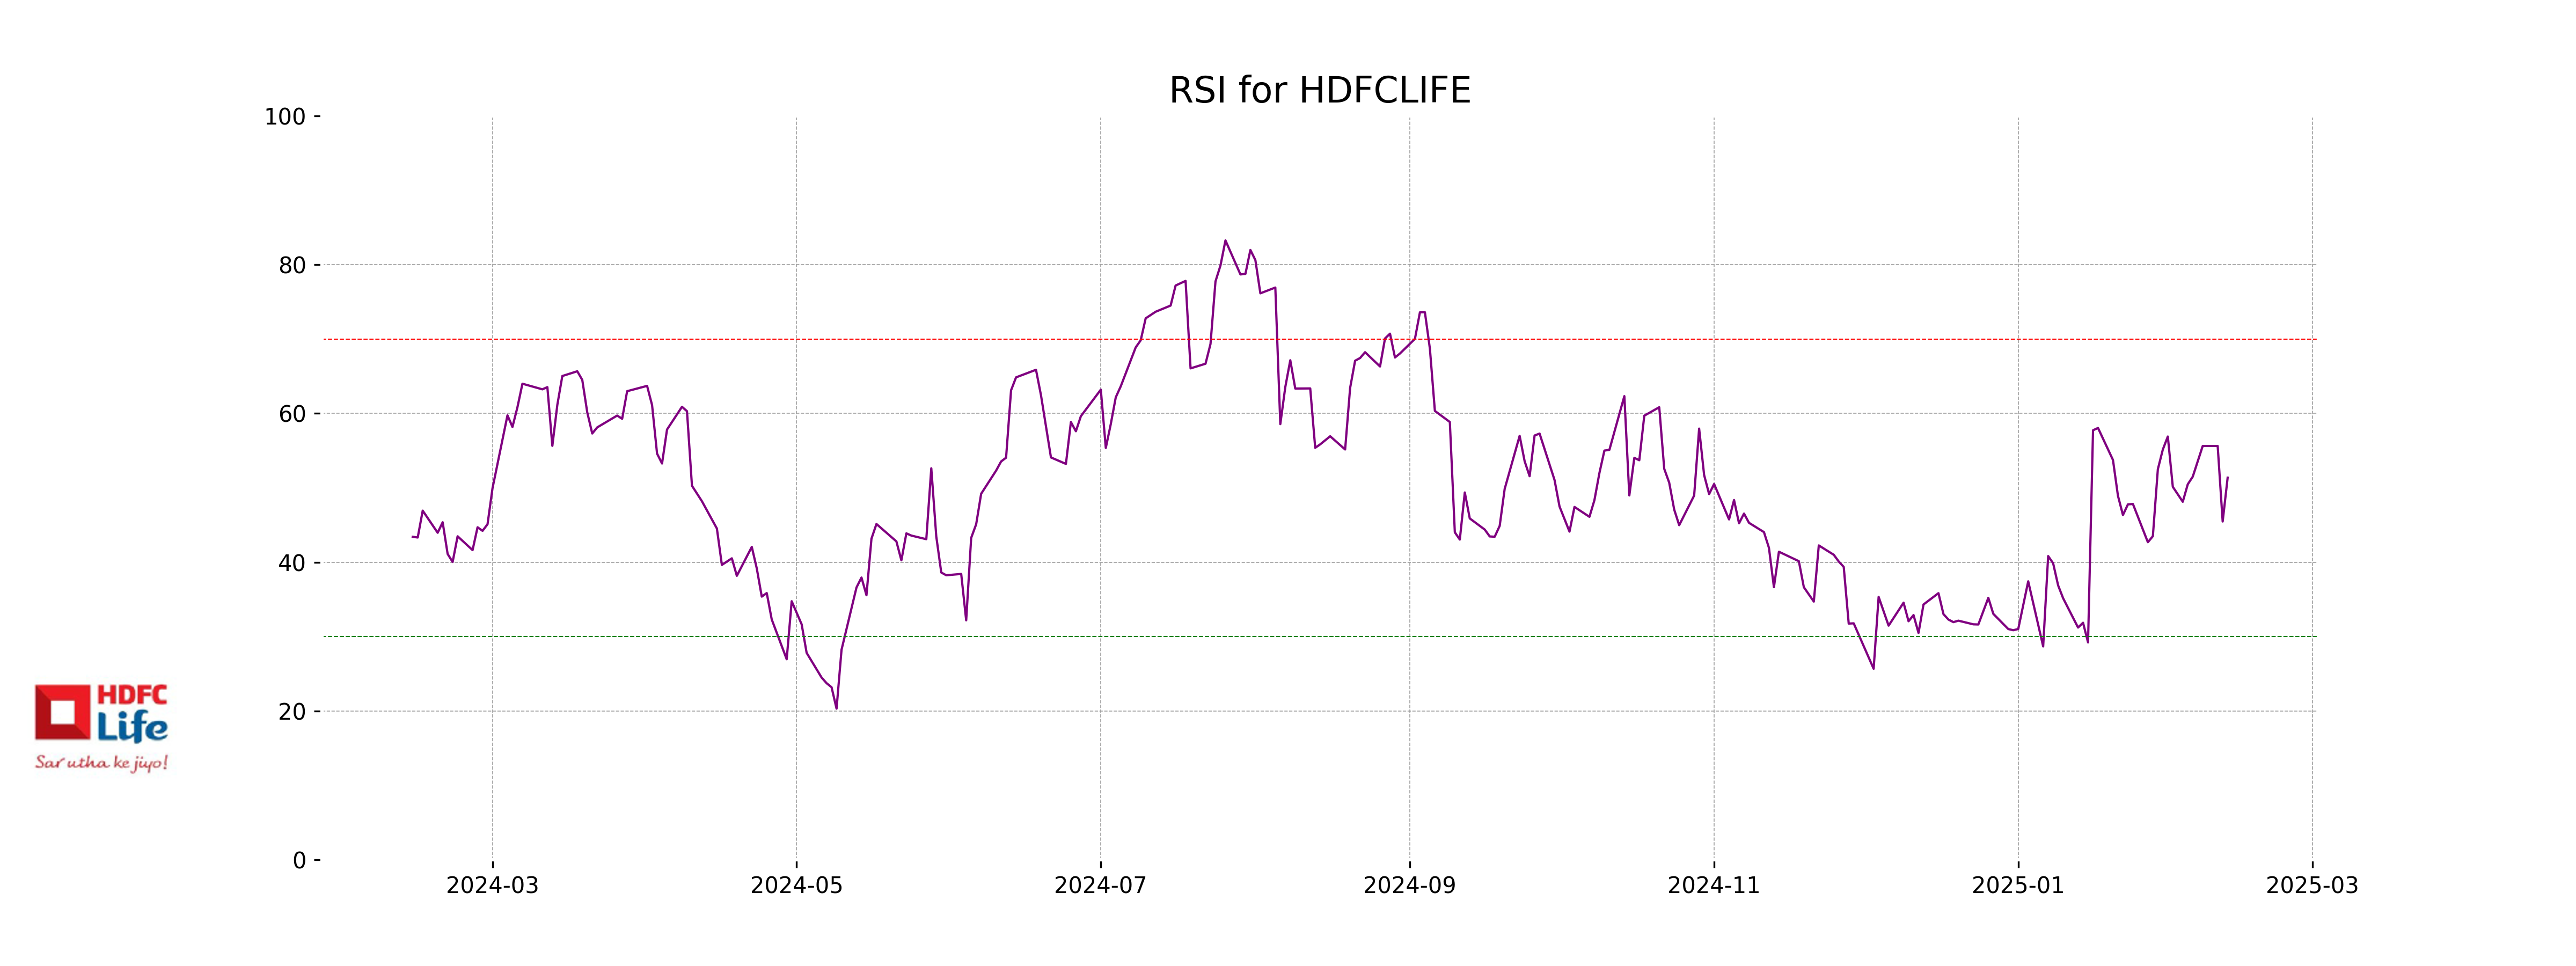
HDFC LIFE demonstrated a positive trading session with a 1.71% increase in its stock price, closing at 629.15 compared to the previous close of 618.60. The stock is currently trading below its 50-day and 200-day EMAs, suggesting it might be in a short-term upward trend but still below long-term performance averages. With a moderate RSI of 51.37, the stock is neither overbought nor oversold.
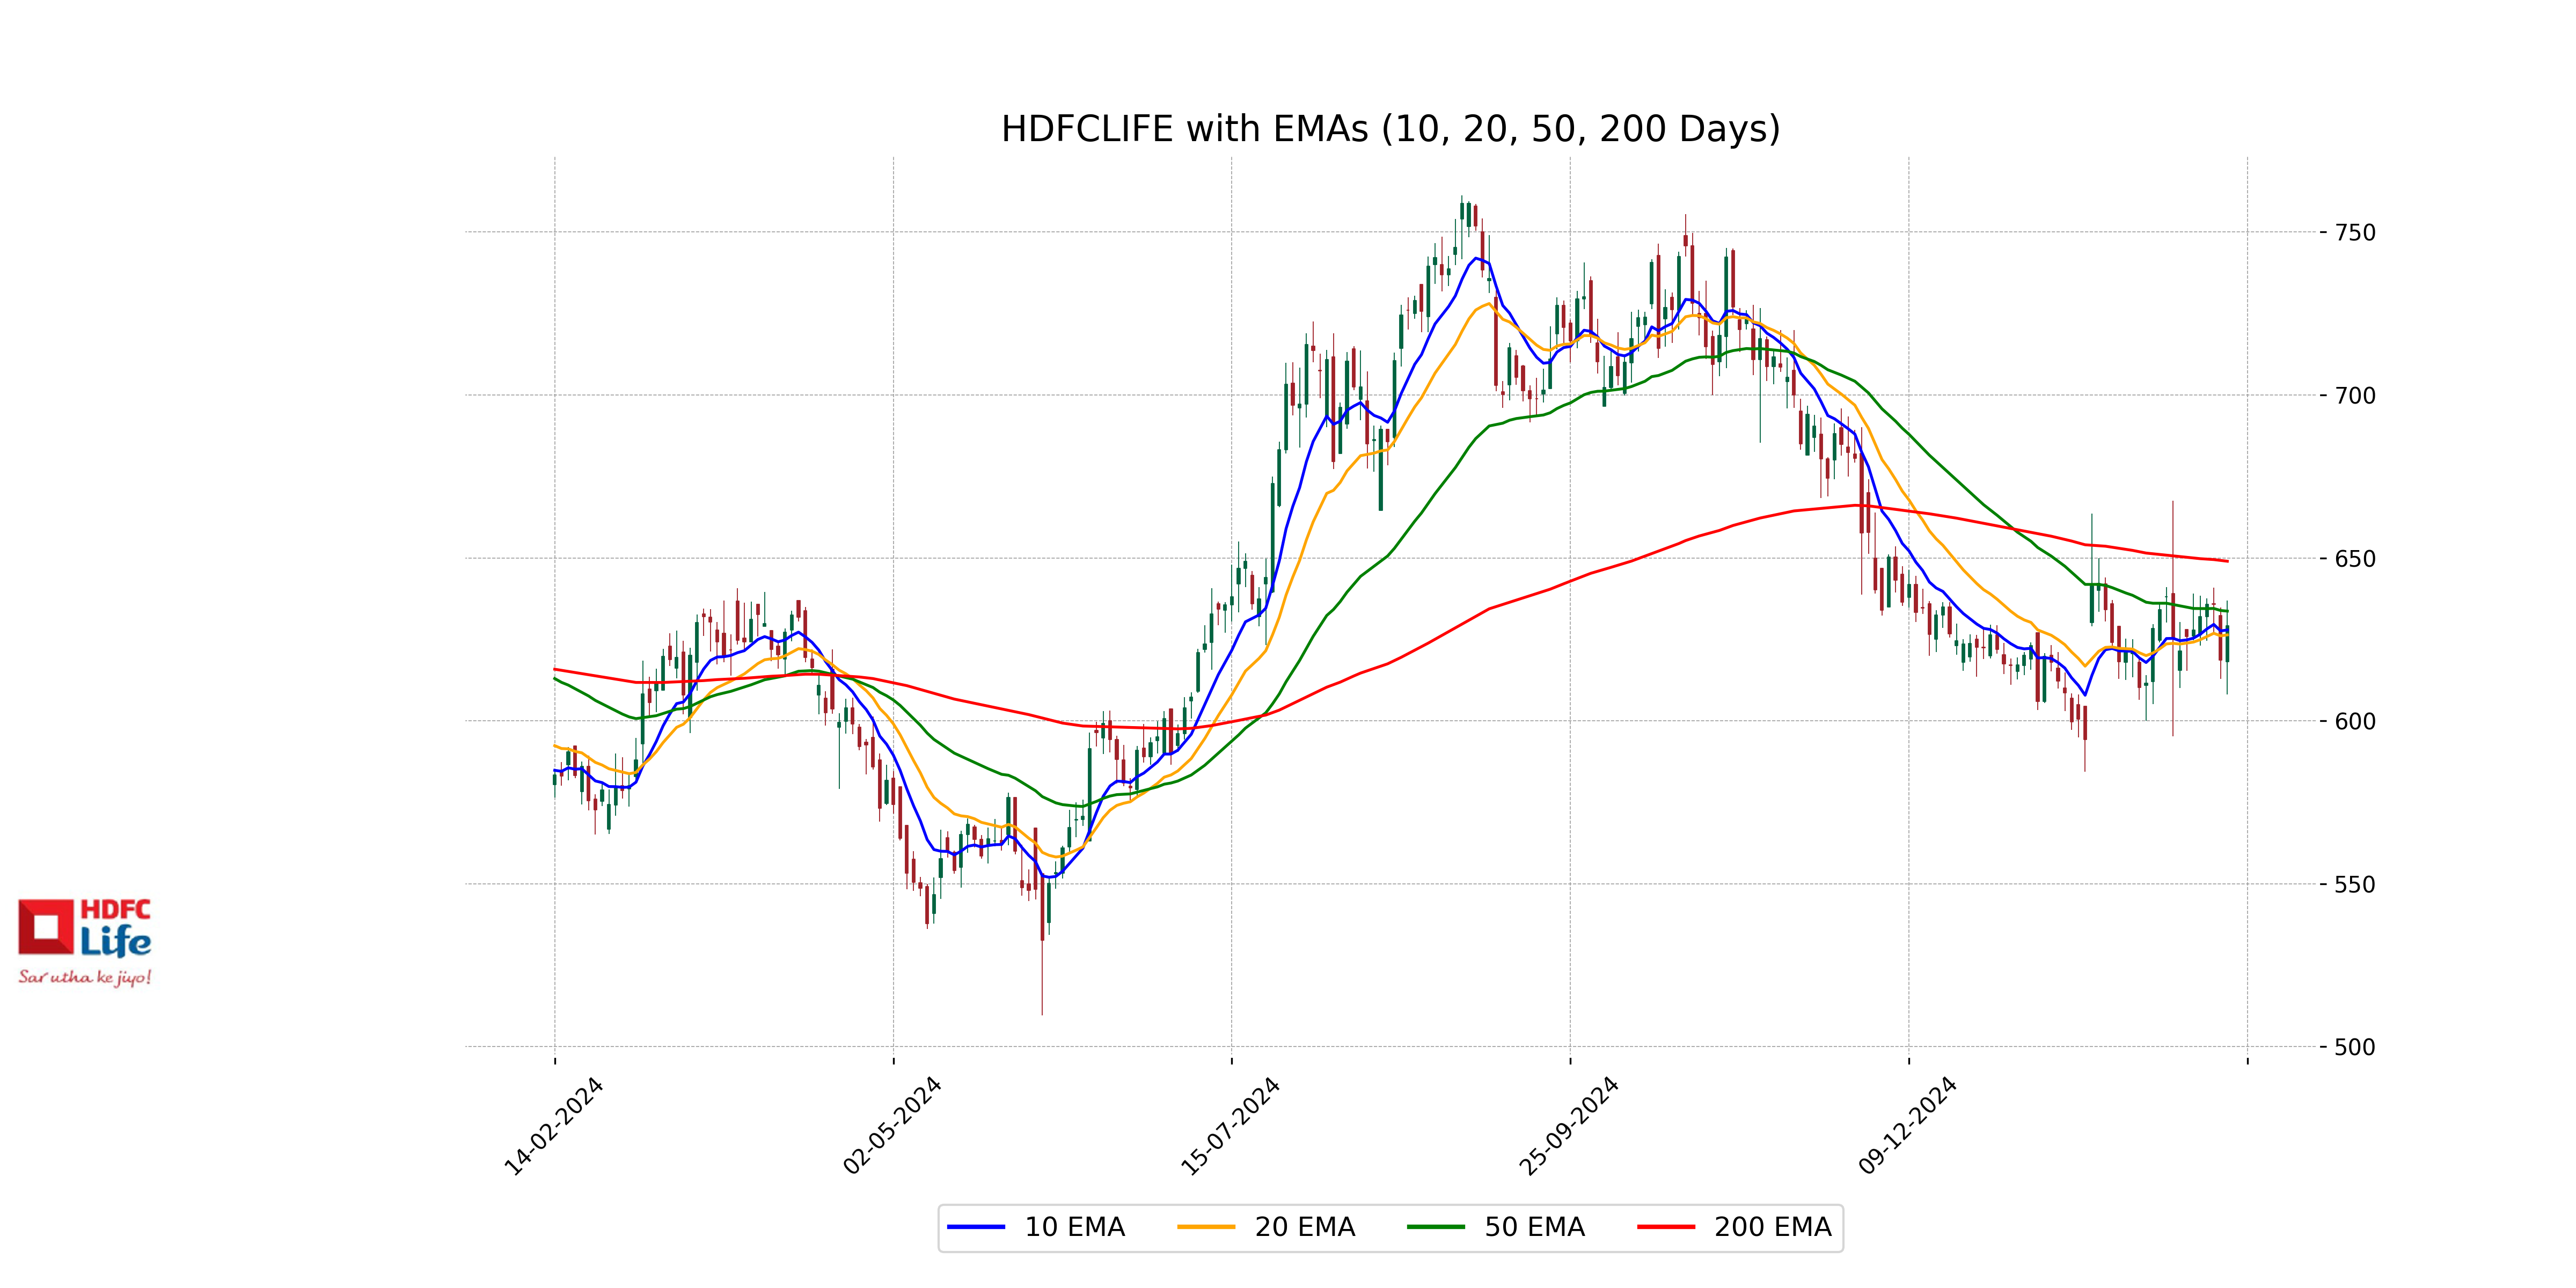
Relationship with Key Moving Averages
HDFC Life closed at 629.15, above its 10 EMA of 627.88 and 20 EMA of 626.37, but below its 50 EMA of 633.67 and significantly below its 200 EMA of 648.97. This suggests short-term bullish momentum compared to the recent past but still experiencing a relative downtrend in the longer term.
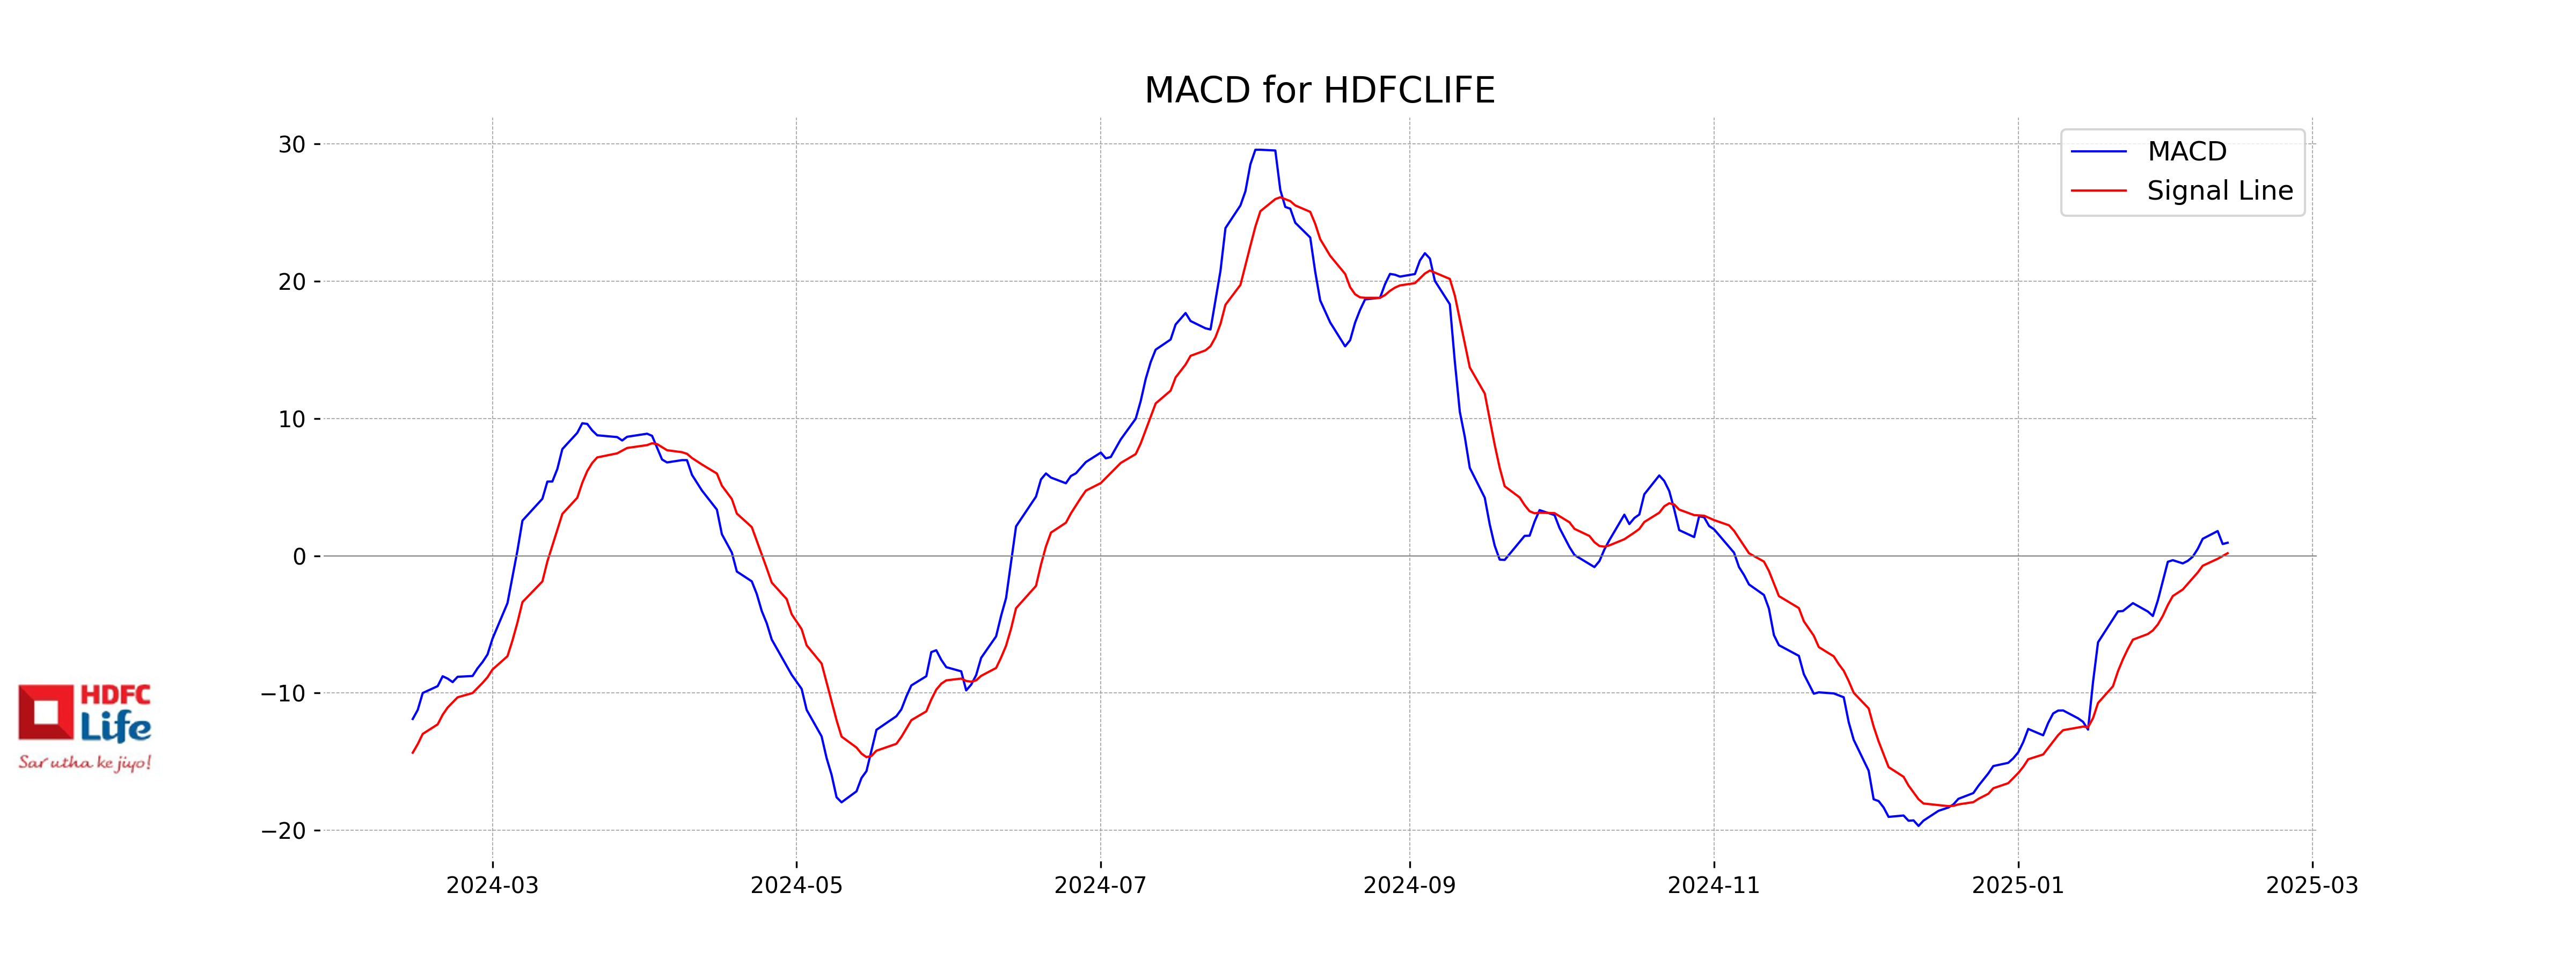
Moving Averages Trend (MACD)
**MACD Analysis for HDFC LIFE:** The MACD for HDFC LIFE is currently at 0.9479, with a MACD Signal of 0.1847. The positive MACD indicates a bullish trend, as the MACD line is above the signal line, suggesting that the stock may experience upward momentum. The RSI at 51.37 supports a neutral to slightly bullish market sentiment.
RSI Analysis
HDFC LIFE displays an RSI of 51.37, which indicates a neutral stance as it is close to the midpoint of the RSI scale. This suggests that the stock is neither overbought nor oversold, and it may be in a consolidation phase. Investors should watch for movements above 70 or below 30 for potential overbought or oversold conditions, respectively.
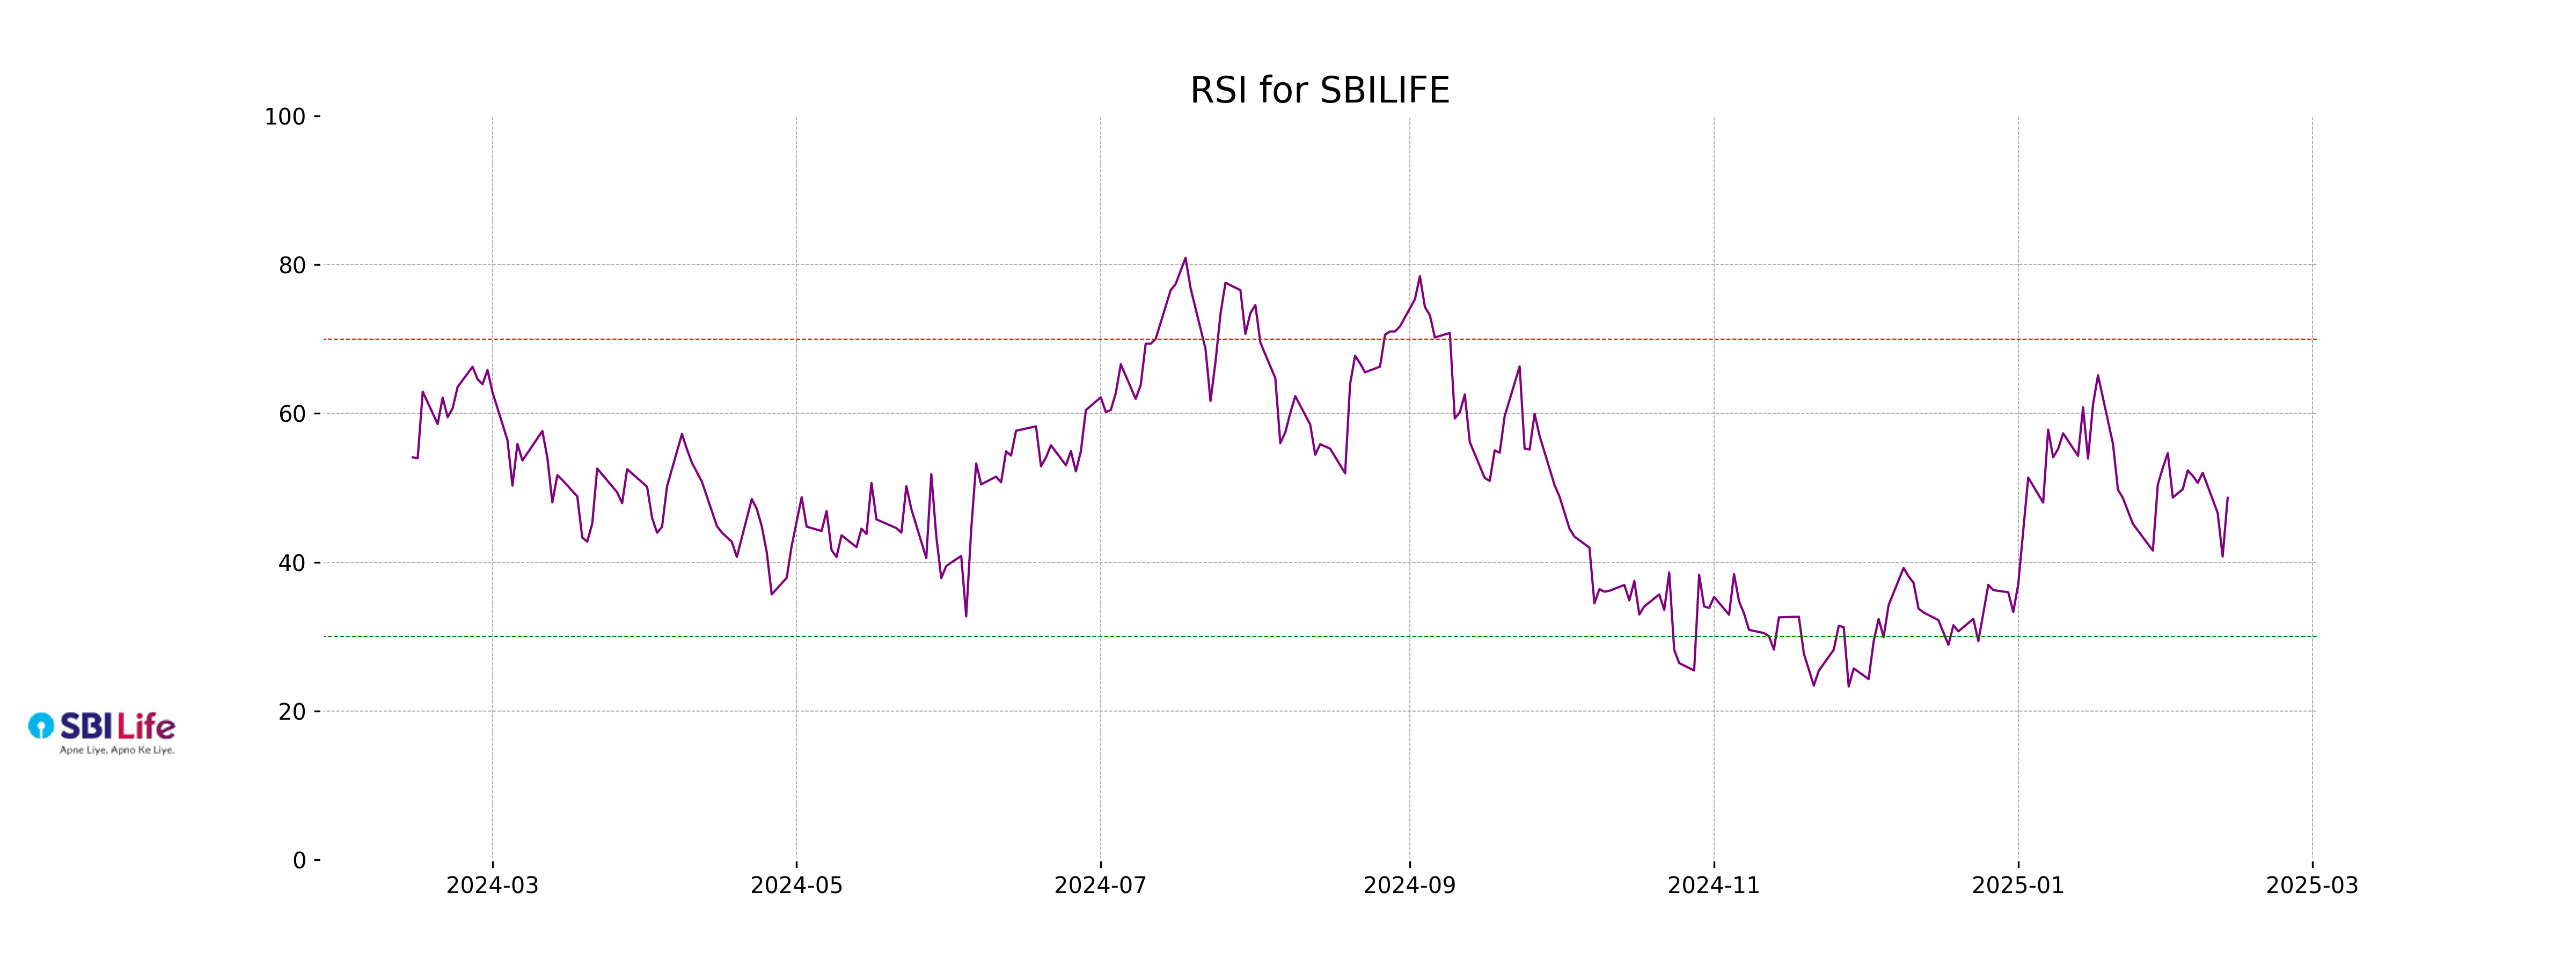
Analysis for SBI Life - February 12, 2025
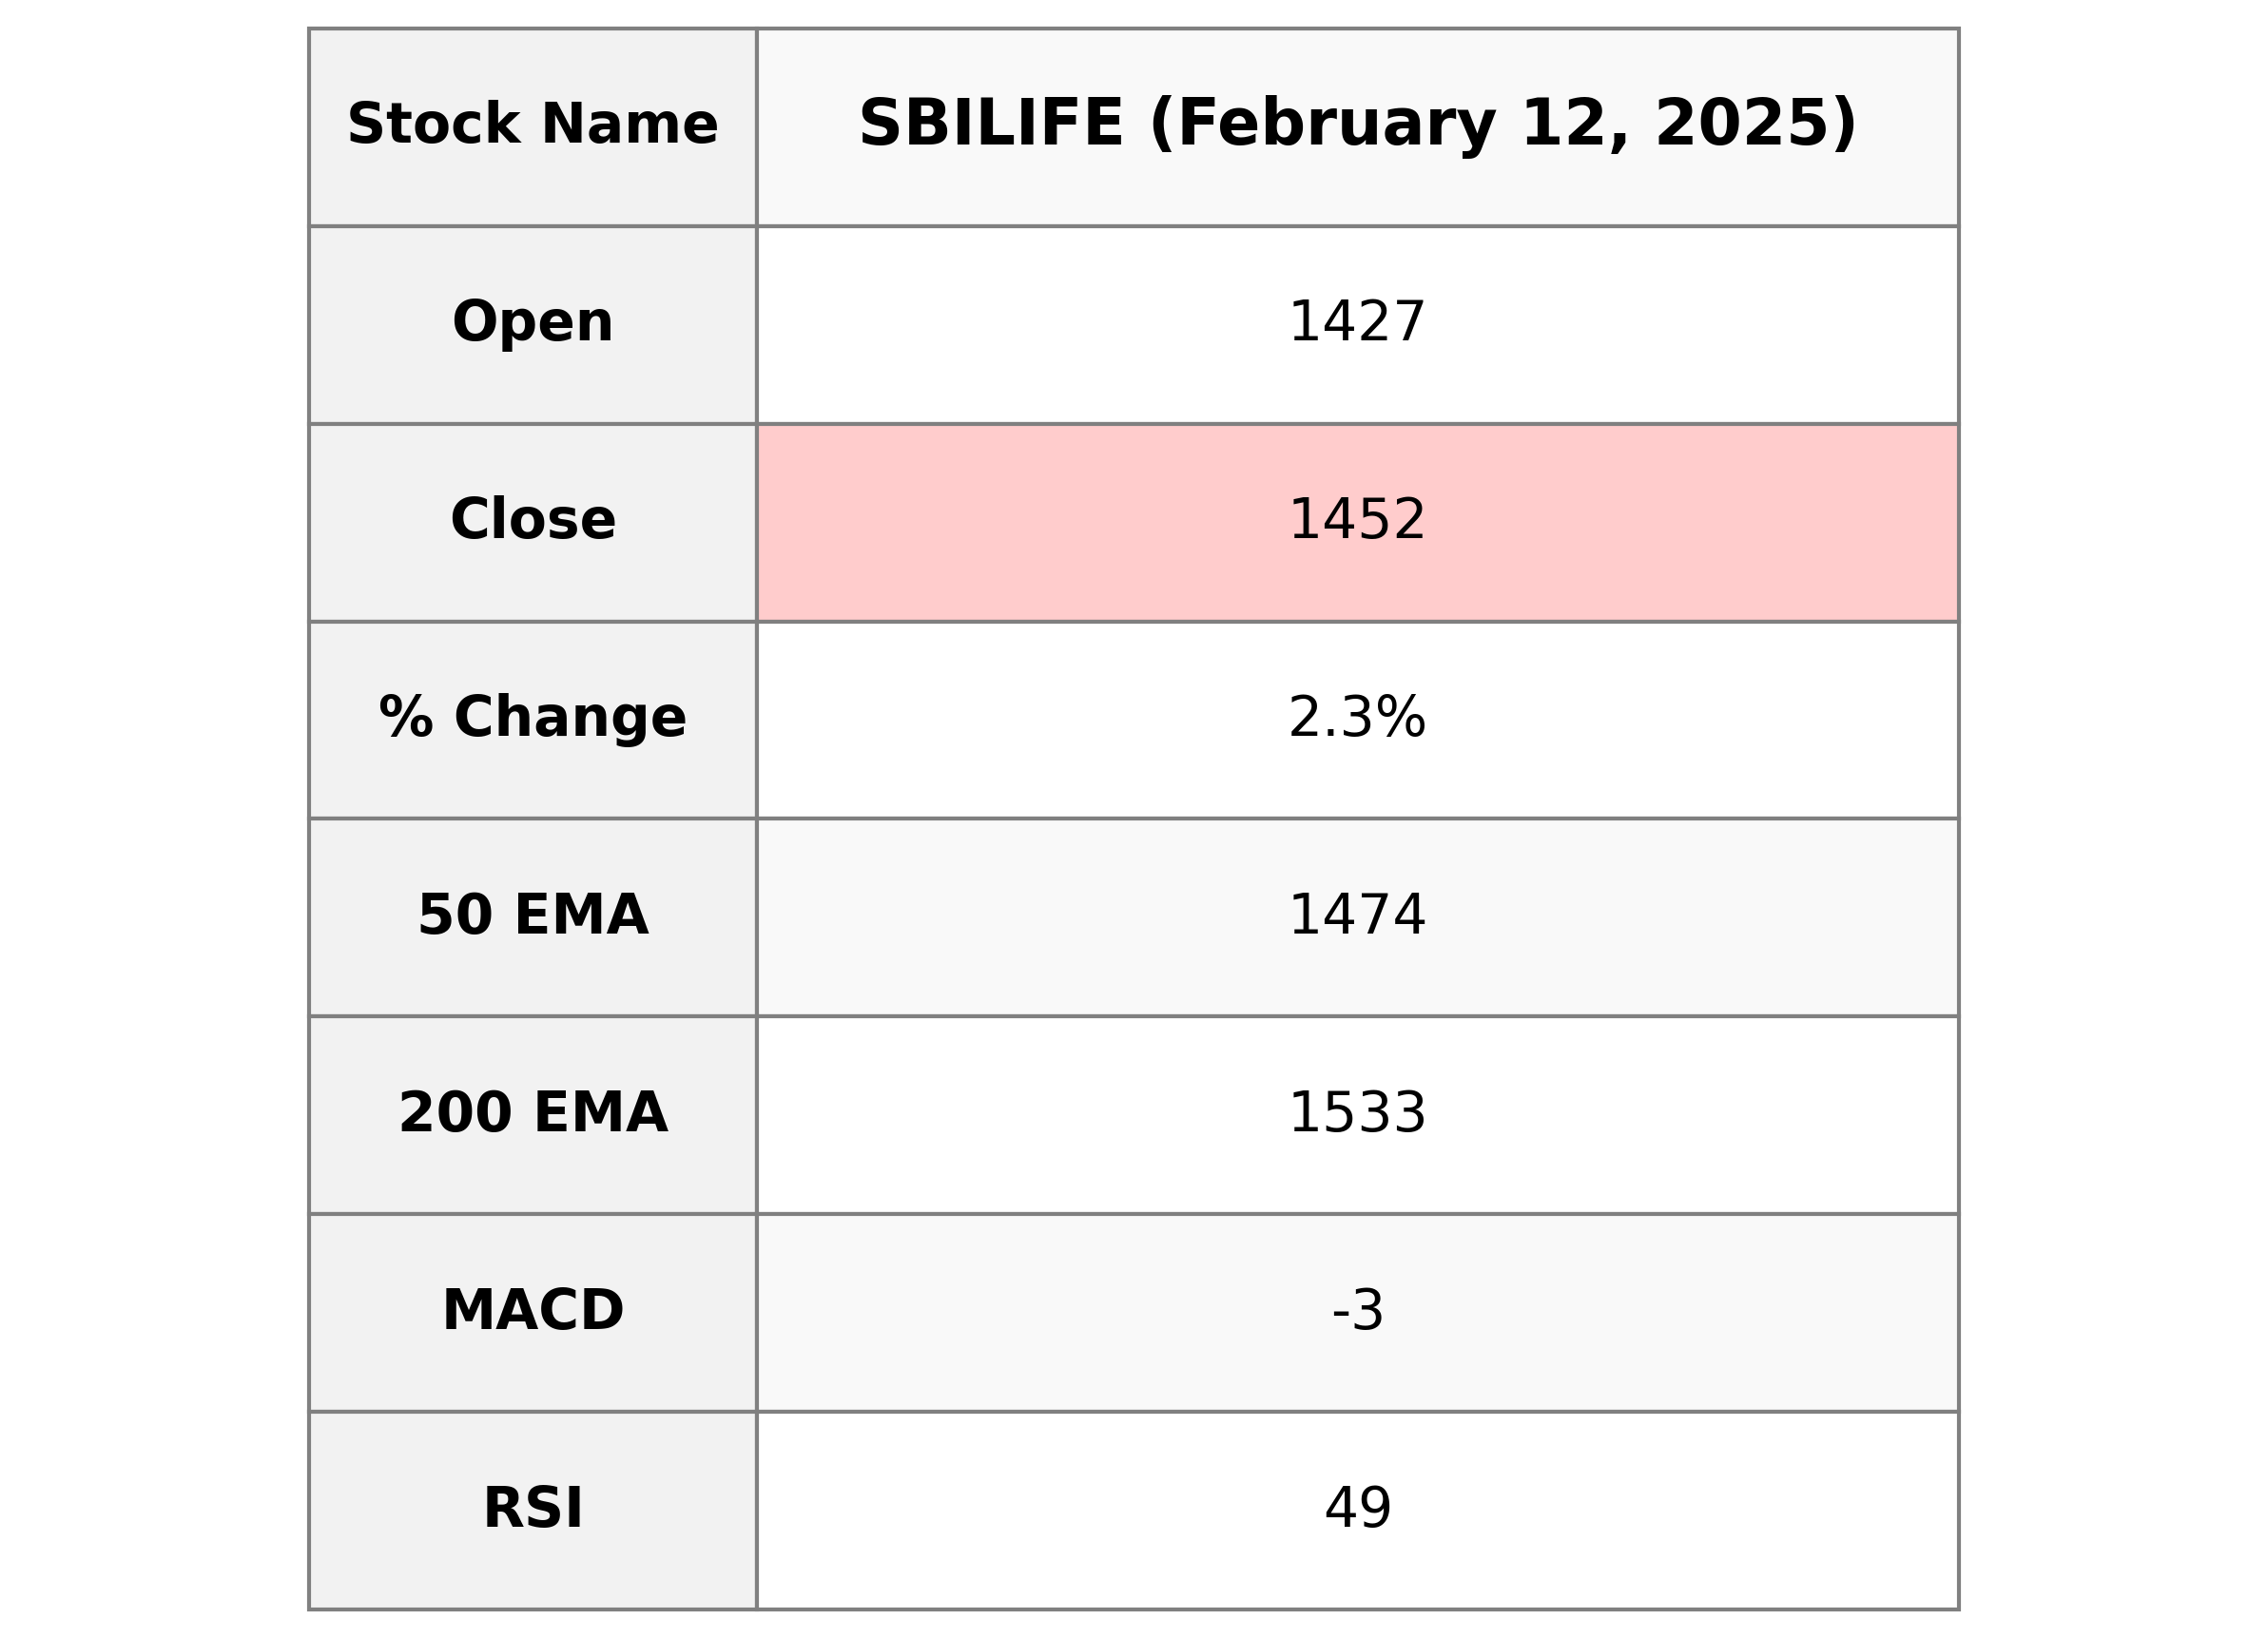
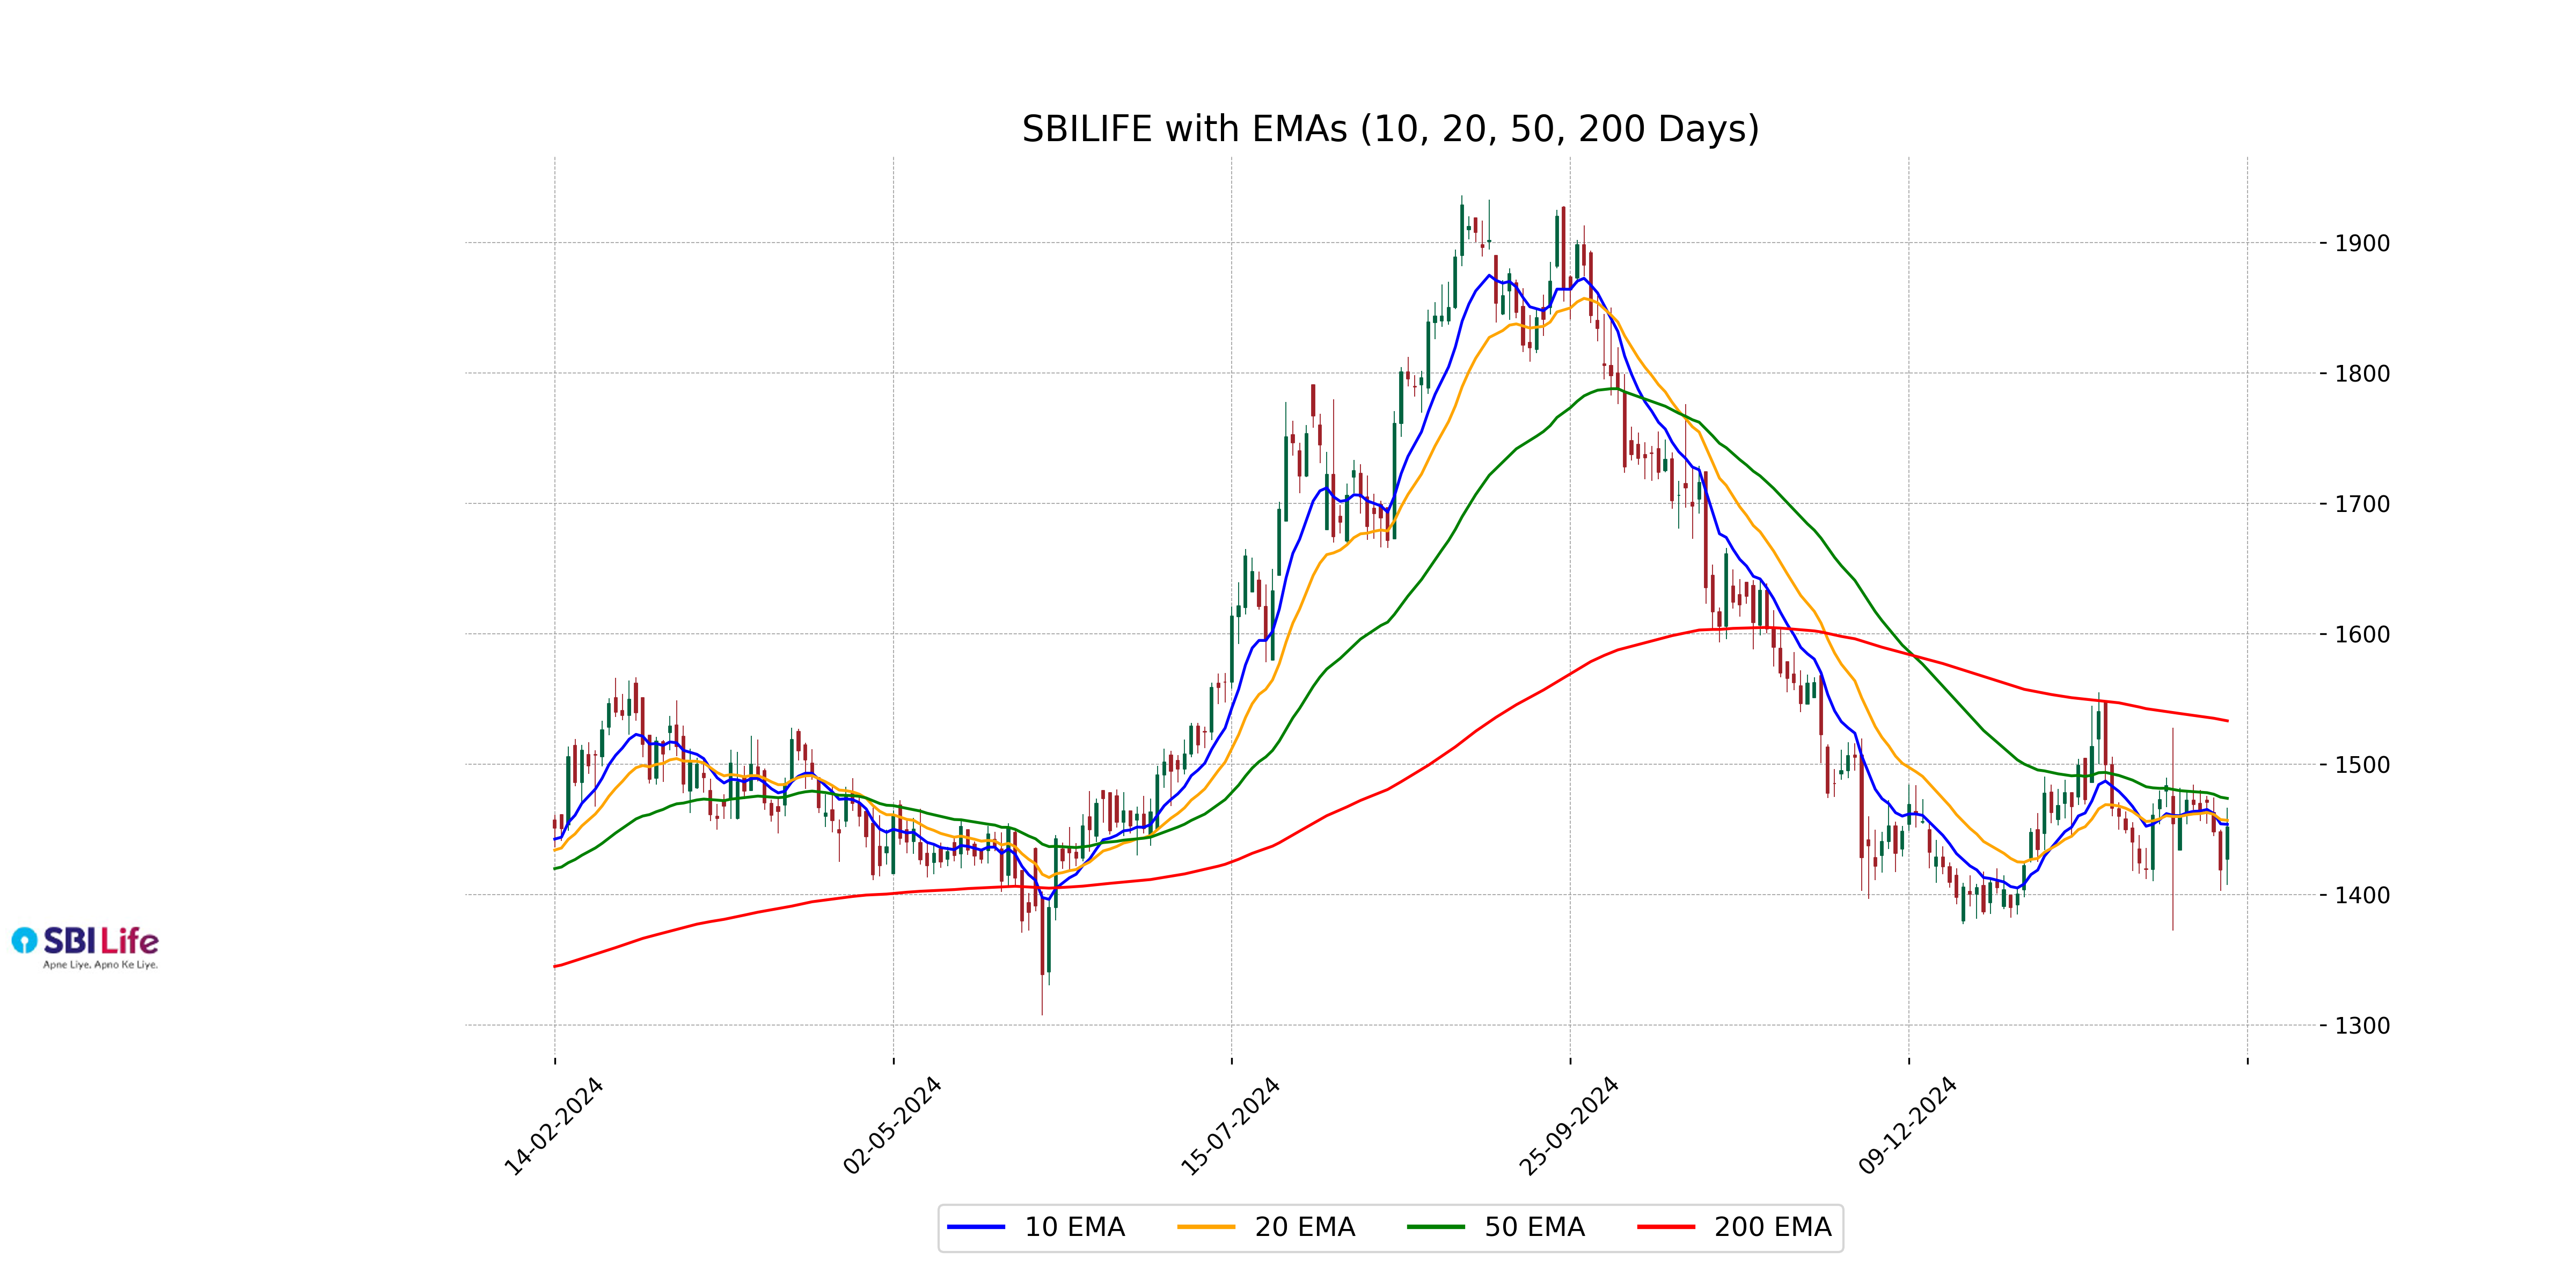
**SBI Life Insurance Company**: **Performance Summary**: The stock opened at 1427.45, reached a high of 1466.95, and closed at 1452.15, marking a 2.34% increase from its previous close of 1419. It is trading below its 50 EMA of 1473.91 and 200 EMA of 1533.34, indicating a potential bearish trend. With a RSI of 48.65, the stock is nearing a neutral momentum. The market capitalization stands at 1,455,184,936,960 INR, and the PE Ratio is 60.56. The company's performance is within the Financial Services sector, specifically in the Life Insurance industry.
Relationship with Key Moving Averages
SBI Life closed at 1452.15, which is below its 50-day EMA of 1473.91 and significantly below its 200-day EMA of 1533.34, indicating a bearish trend over the mid to long term. However, it is slightly below the 10-day EMA of 1453.99 and the 20-day EMA of 1457.08, suggesting short-term mixed momentum.
Moving Averages Trend (MACD)
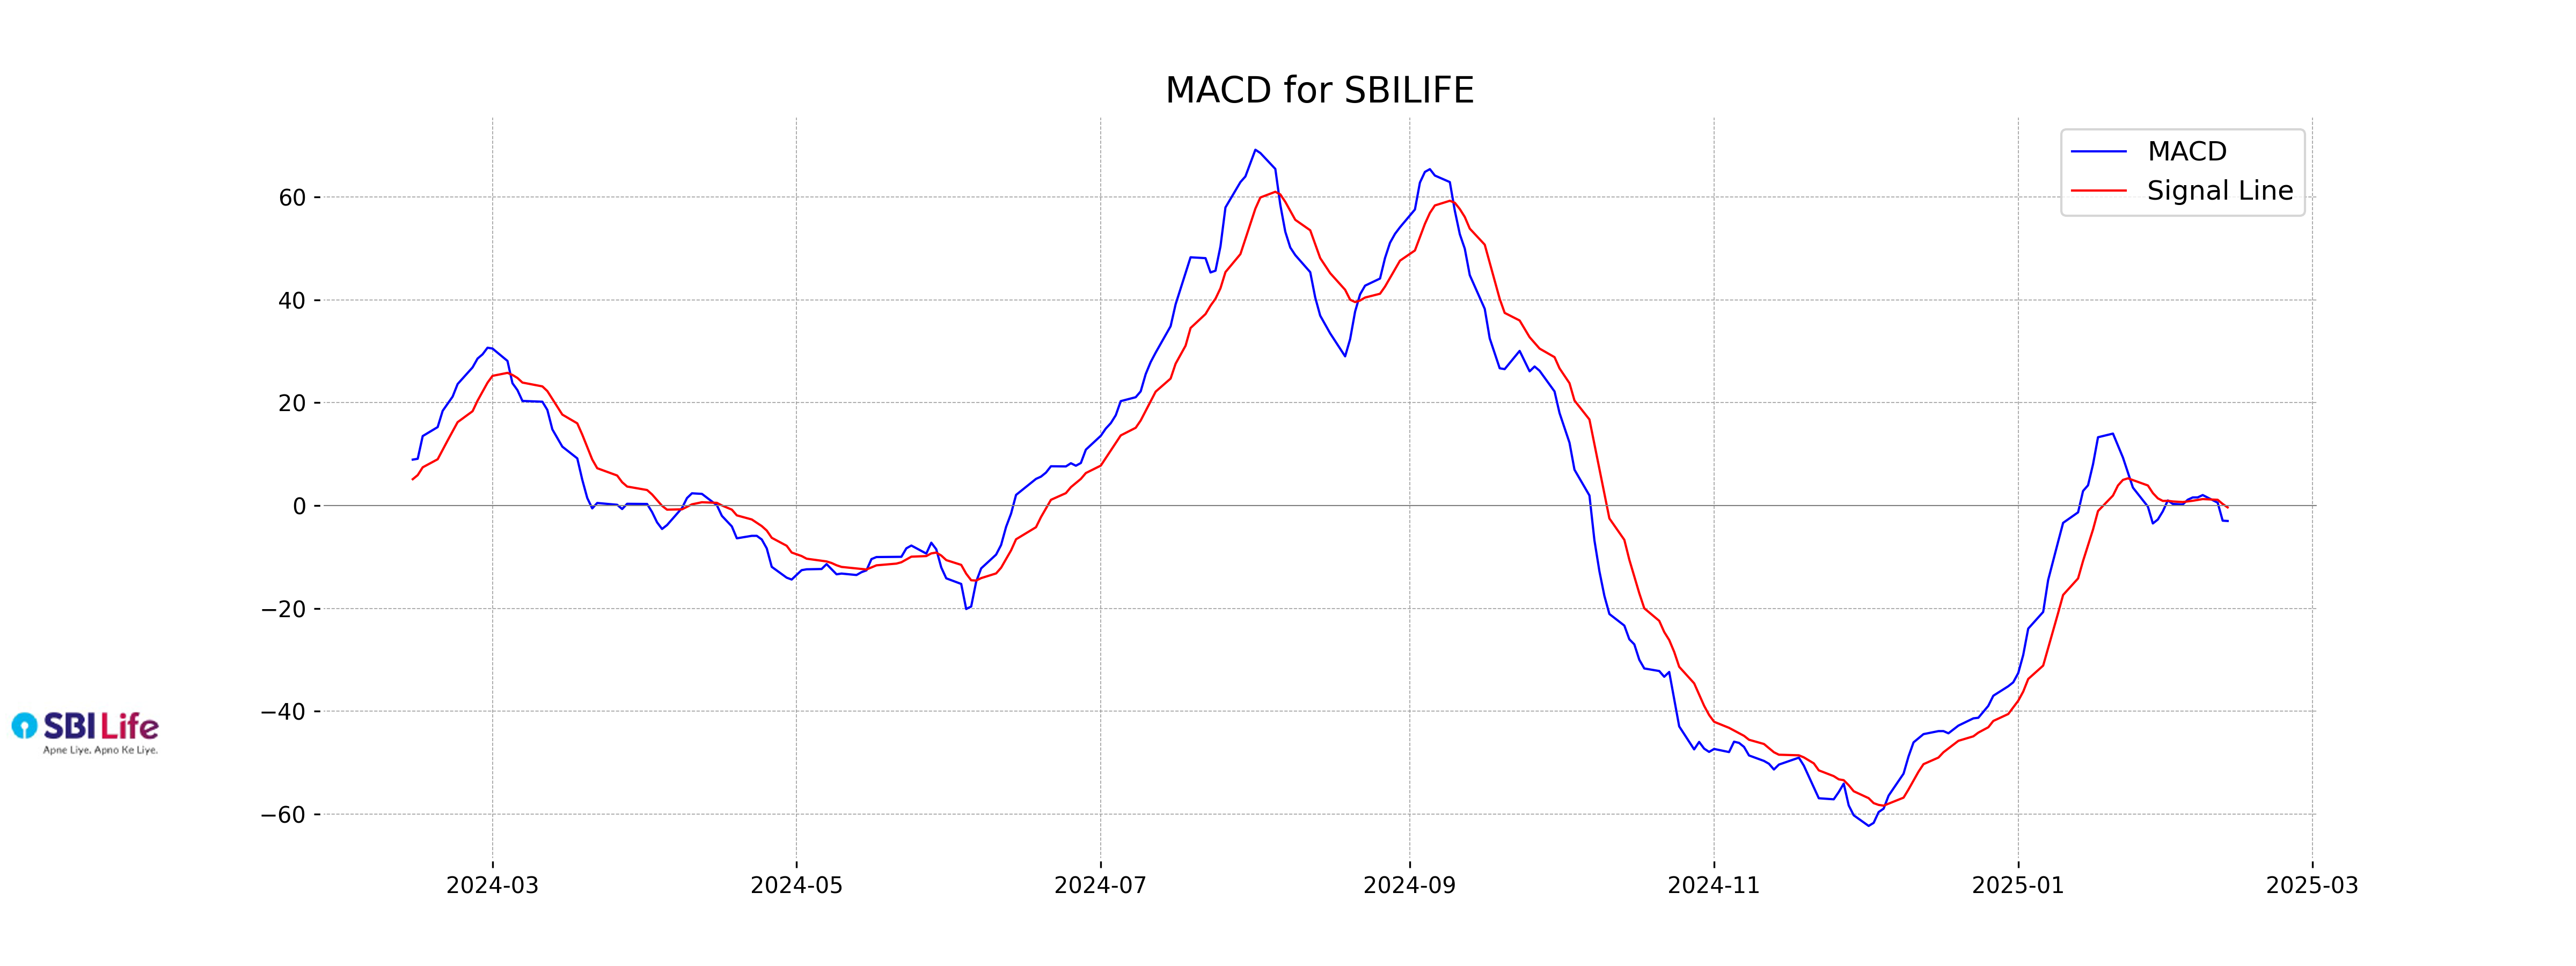
**MACD Analysis:** SBI Life's MACD is currently at -3.00, which is below its signal line at -0.36. This indicates a bearish trend, suggesting potential downward momentum in the stock price. Investors should monitor for any changes that might signal a reversal.
RSI Analysis
The Relative Strength Index (RSI) for SBI Life is 48.65, indicating that the stock is currently in a neutral zone, neither overbought nor oversold. Typically, an RSI above 70 suggests an overbought condition, whereas below 30 indicates an oversold condition.
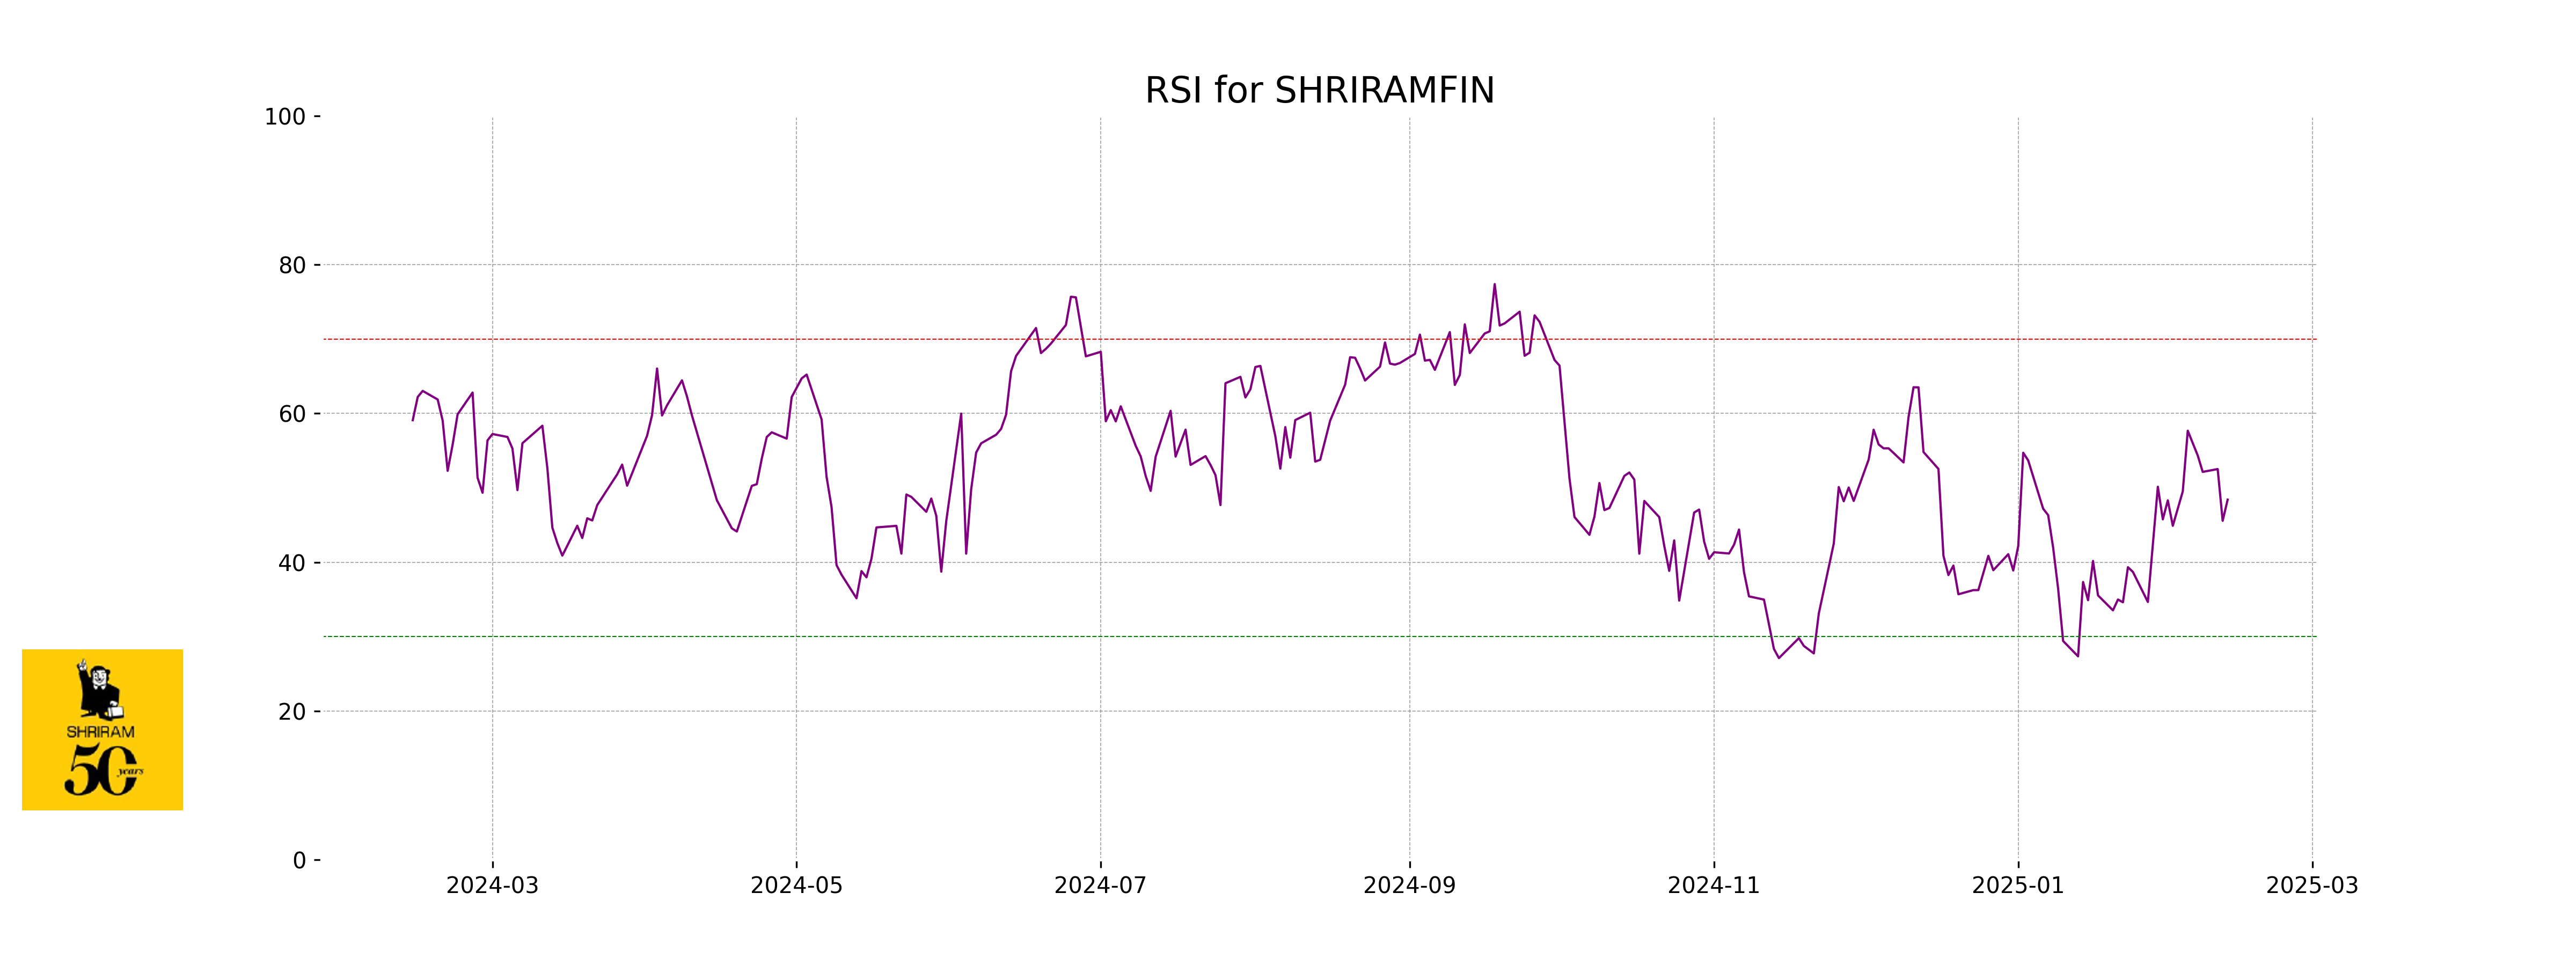
Analysis for Shriram Finance - February 12, 2025
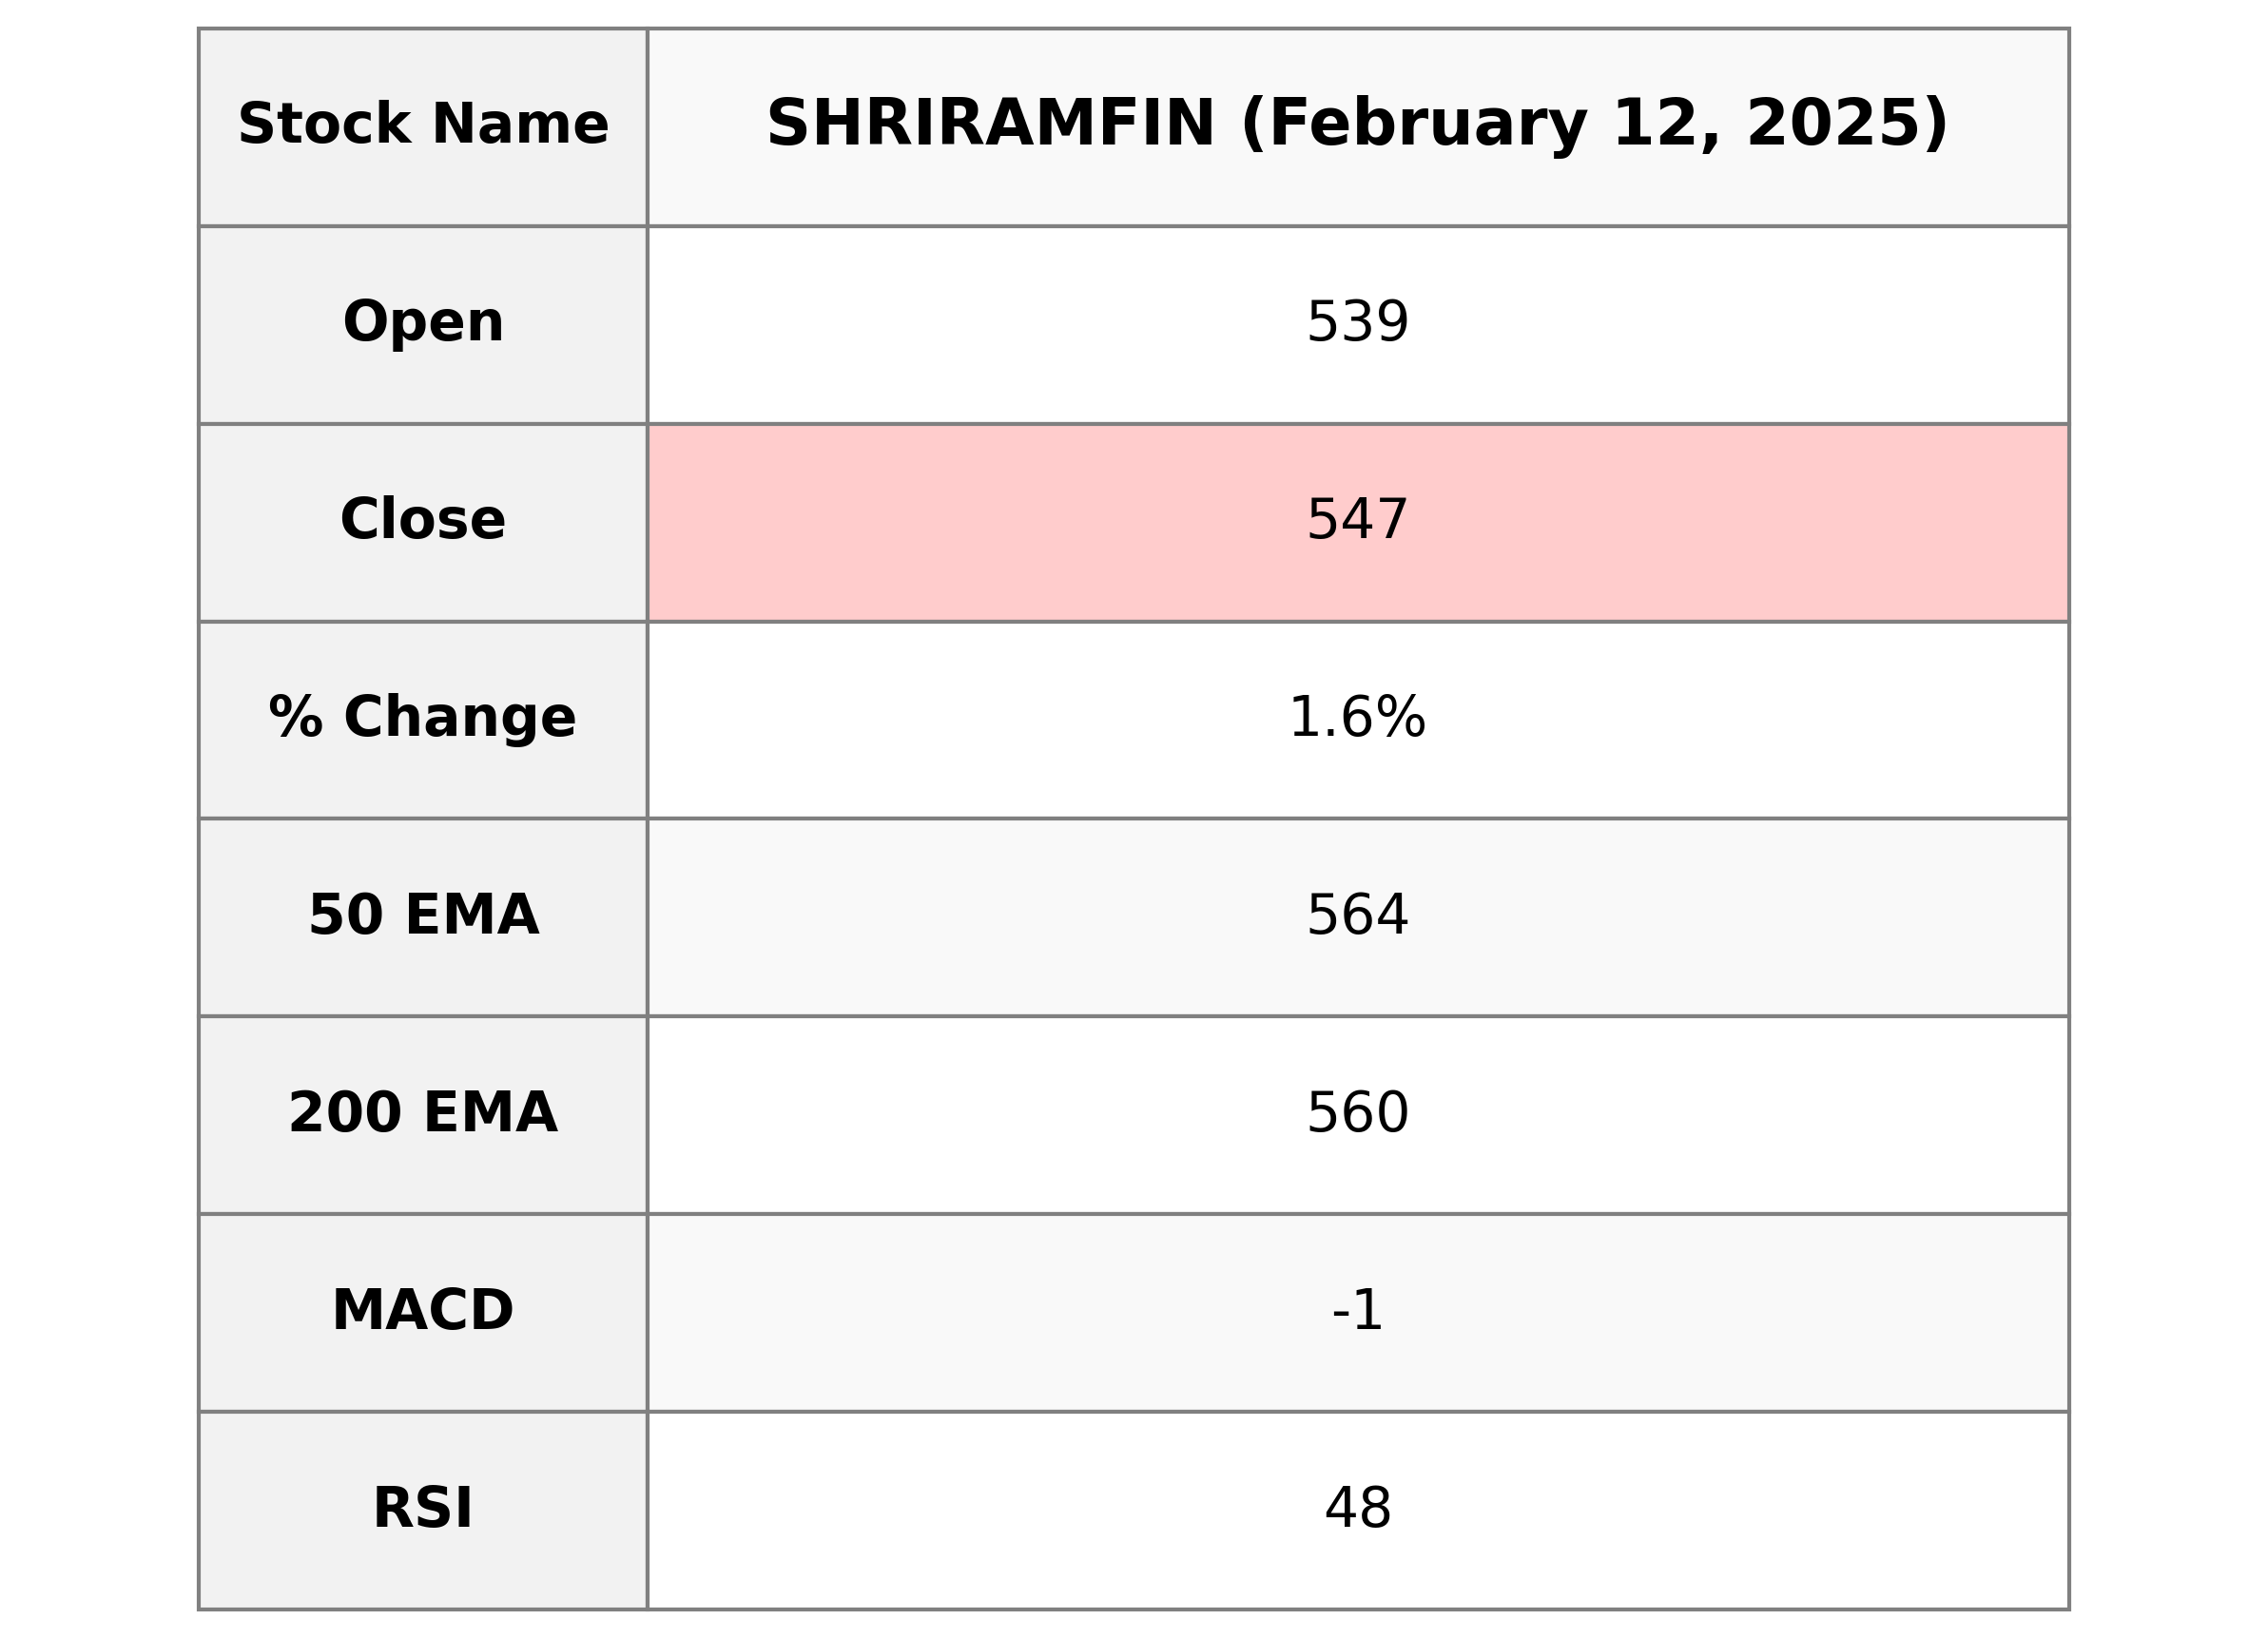
Shriram Finance experienced a positive day with the stock closing at 547.15, representing a 1.60% increase from its previous close of 538.55. The trading volume was relatively high at 5,467,424, and technical indicators such as the RSI at 48.41 suggest a neutral market sentiment. Meanwhile, both the 50 and 200-day EMAs indicate that the stock is below these averages, suggesting a bearish trend in the longer term.
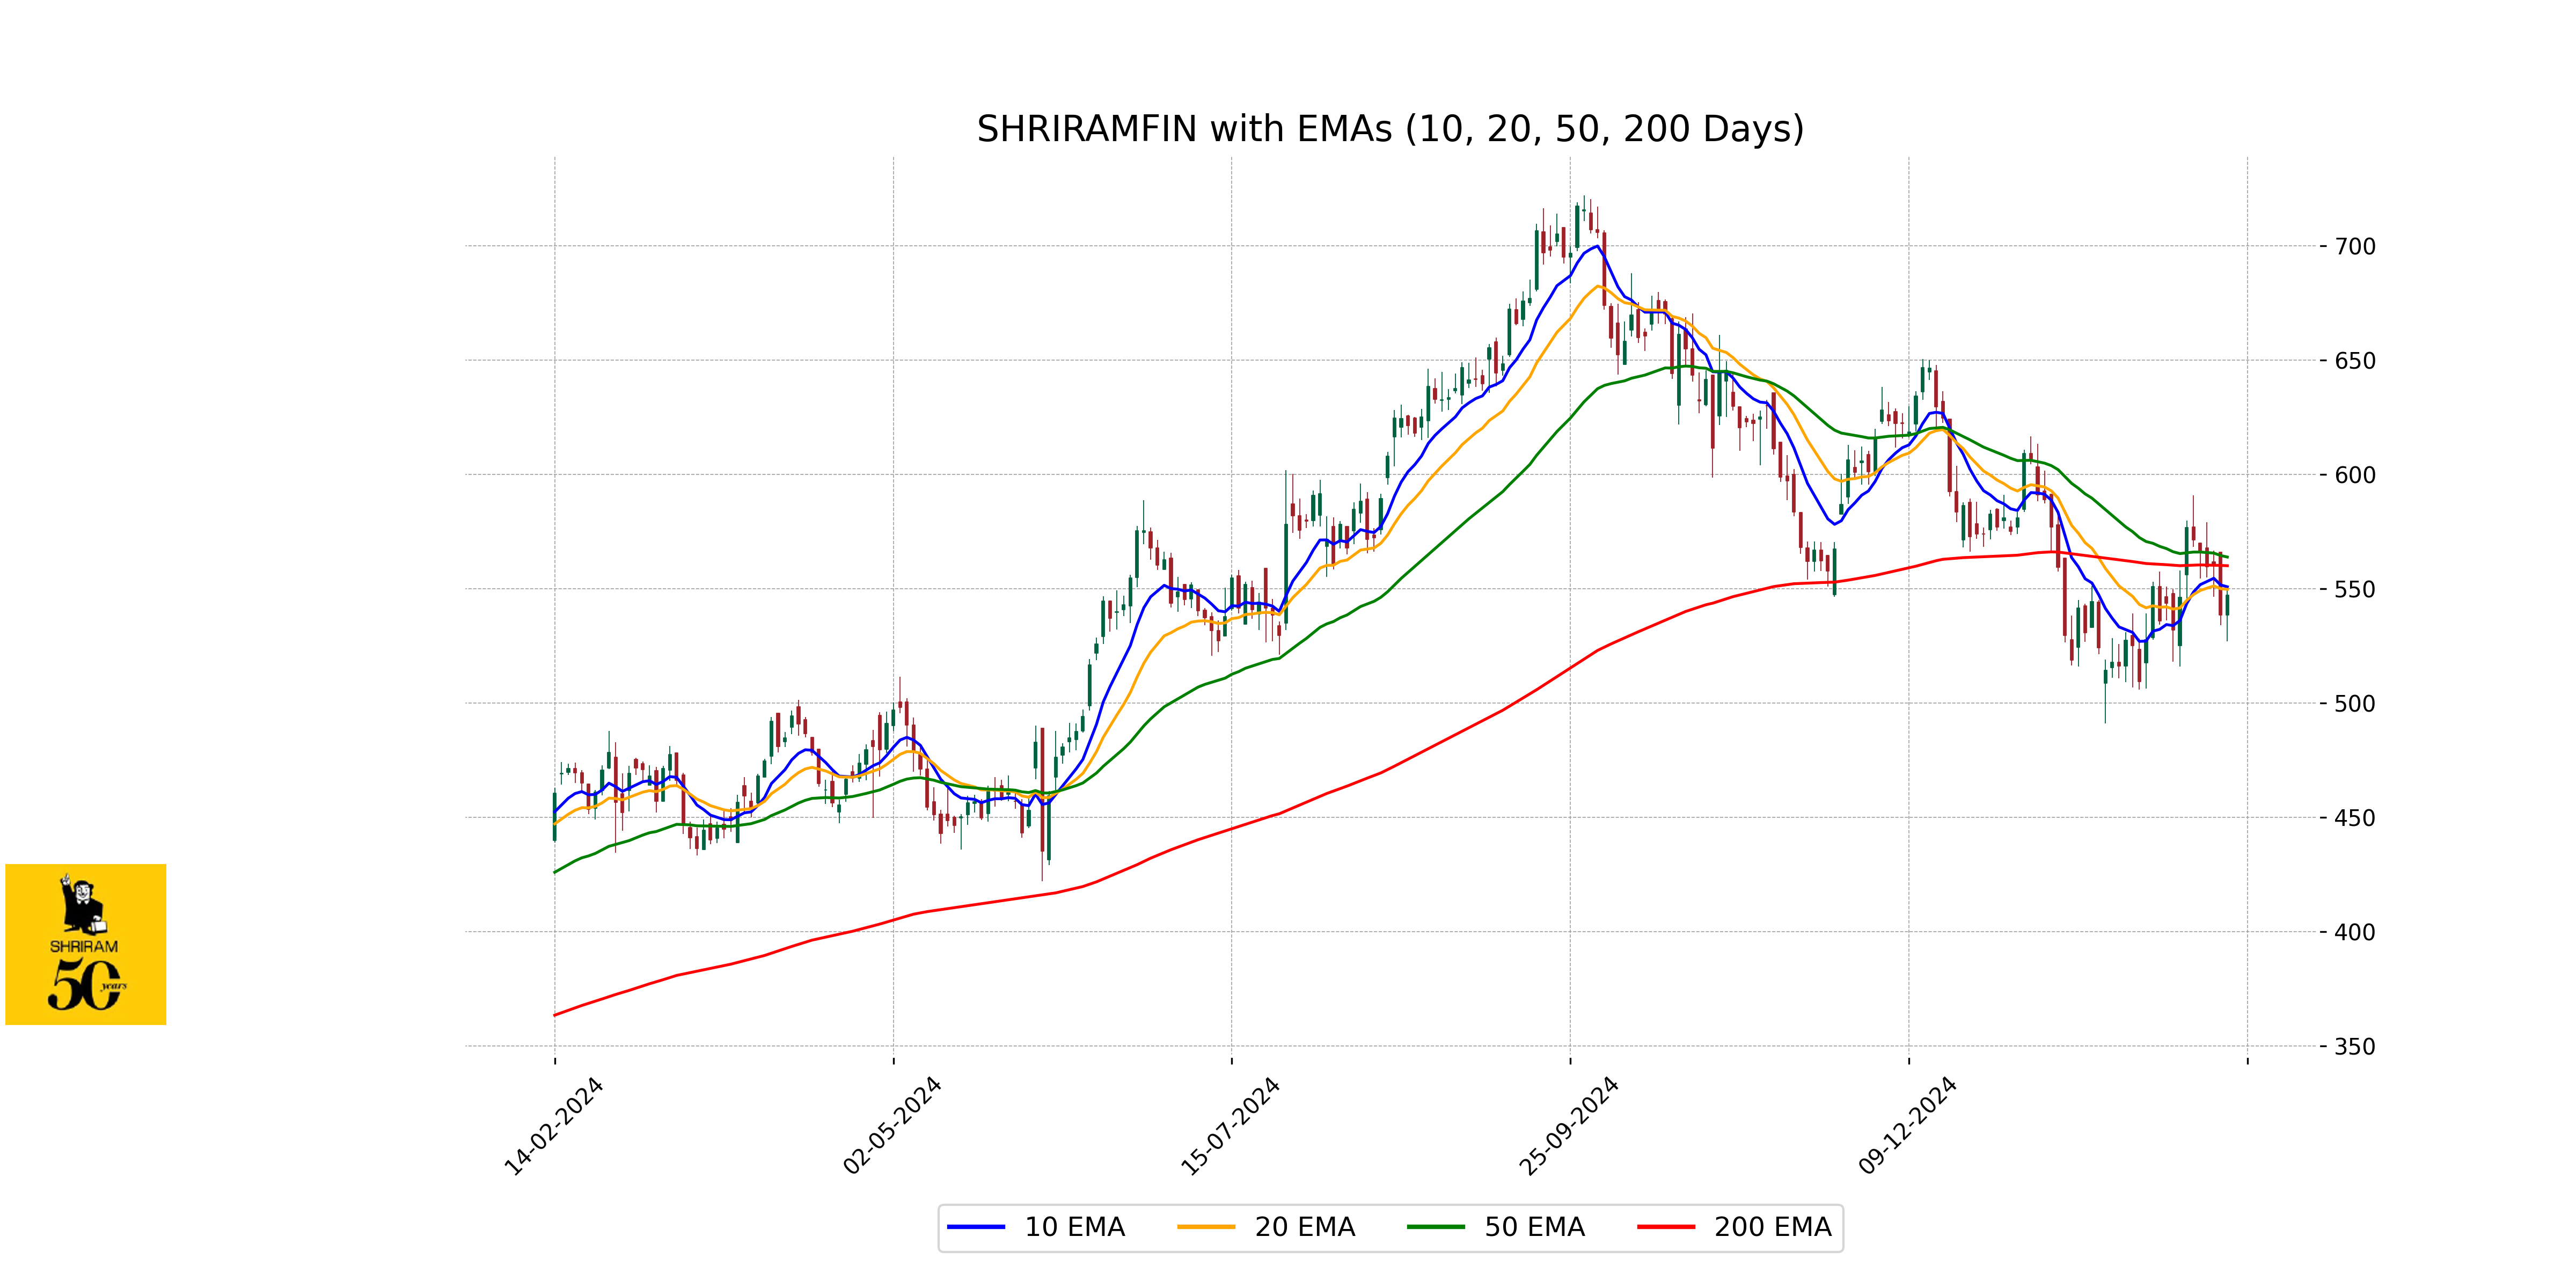
Relationship with Key Moving Averages
Shriram Finance's closing price of 547.15 is below its 50 EMA of 563.86 and 200 EMA of 560.06, indicating a current downtrend relative to these longer-term moving averages. However, it is slightly above its 10 EMA of 550.84 and close to its 20 EMA of 549.74, suggesting some short-term recovery in price movement.
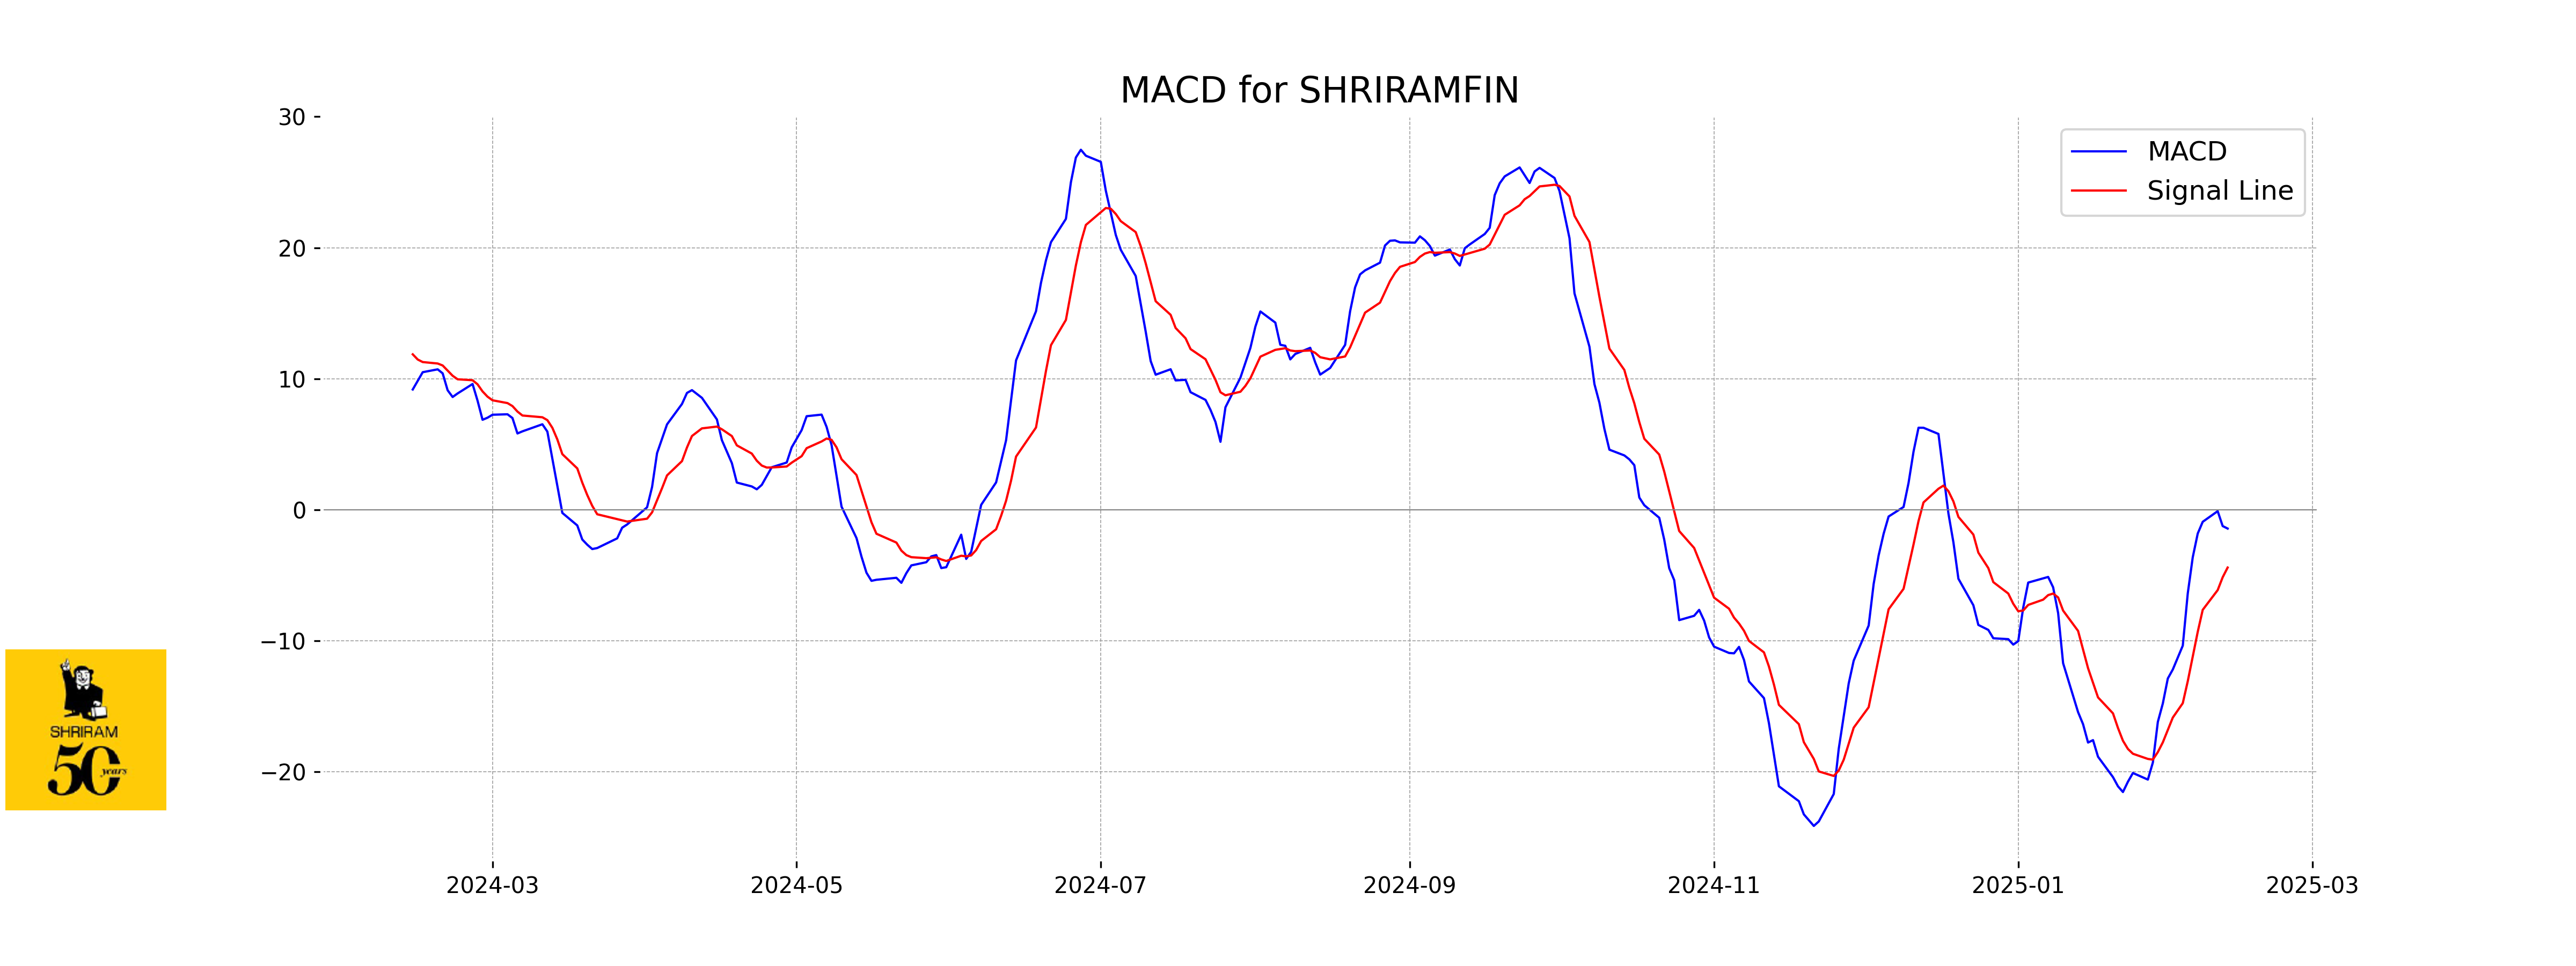
Moving Averages Trend (MACD)
**Shriram Finance** is experiencing a MACD value of -1.44, which is above its MACD Signal of -4.41, indicating potential bullish momentum. However, since both values are negative, it suggests that the stock could still be in a bearish phase. Monitoring for a crossover above zero could confirm a trend change.
RSI Analysis
The RSI (Relative Strength Index) for Shriram Finance is 48.41, indicating a neutral position. An RSI below 30 typically suggests oversold conditions, while above 70 indicates overbought conditions. With an RSI around 50, the stock may not exhibit strong momentum in either direction.
Analysis for Tata Steel - February 12, 2025

**Tata Steel** opened at 129.35 and closed at 132.28, resulting in a positive percentage change of approximately 1.67%. The company's performance shows a significant volume of 37,915,025 shares traded. Despite the increase, the stock's current closing price is still below its 50-day EMA of 135.71 and its 200-day EMA of 144.75, suggesting a potential downtrend. The RSI value is 48.79, indicating that the stock is neither overbought nor oversold.
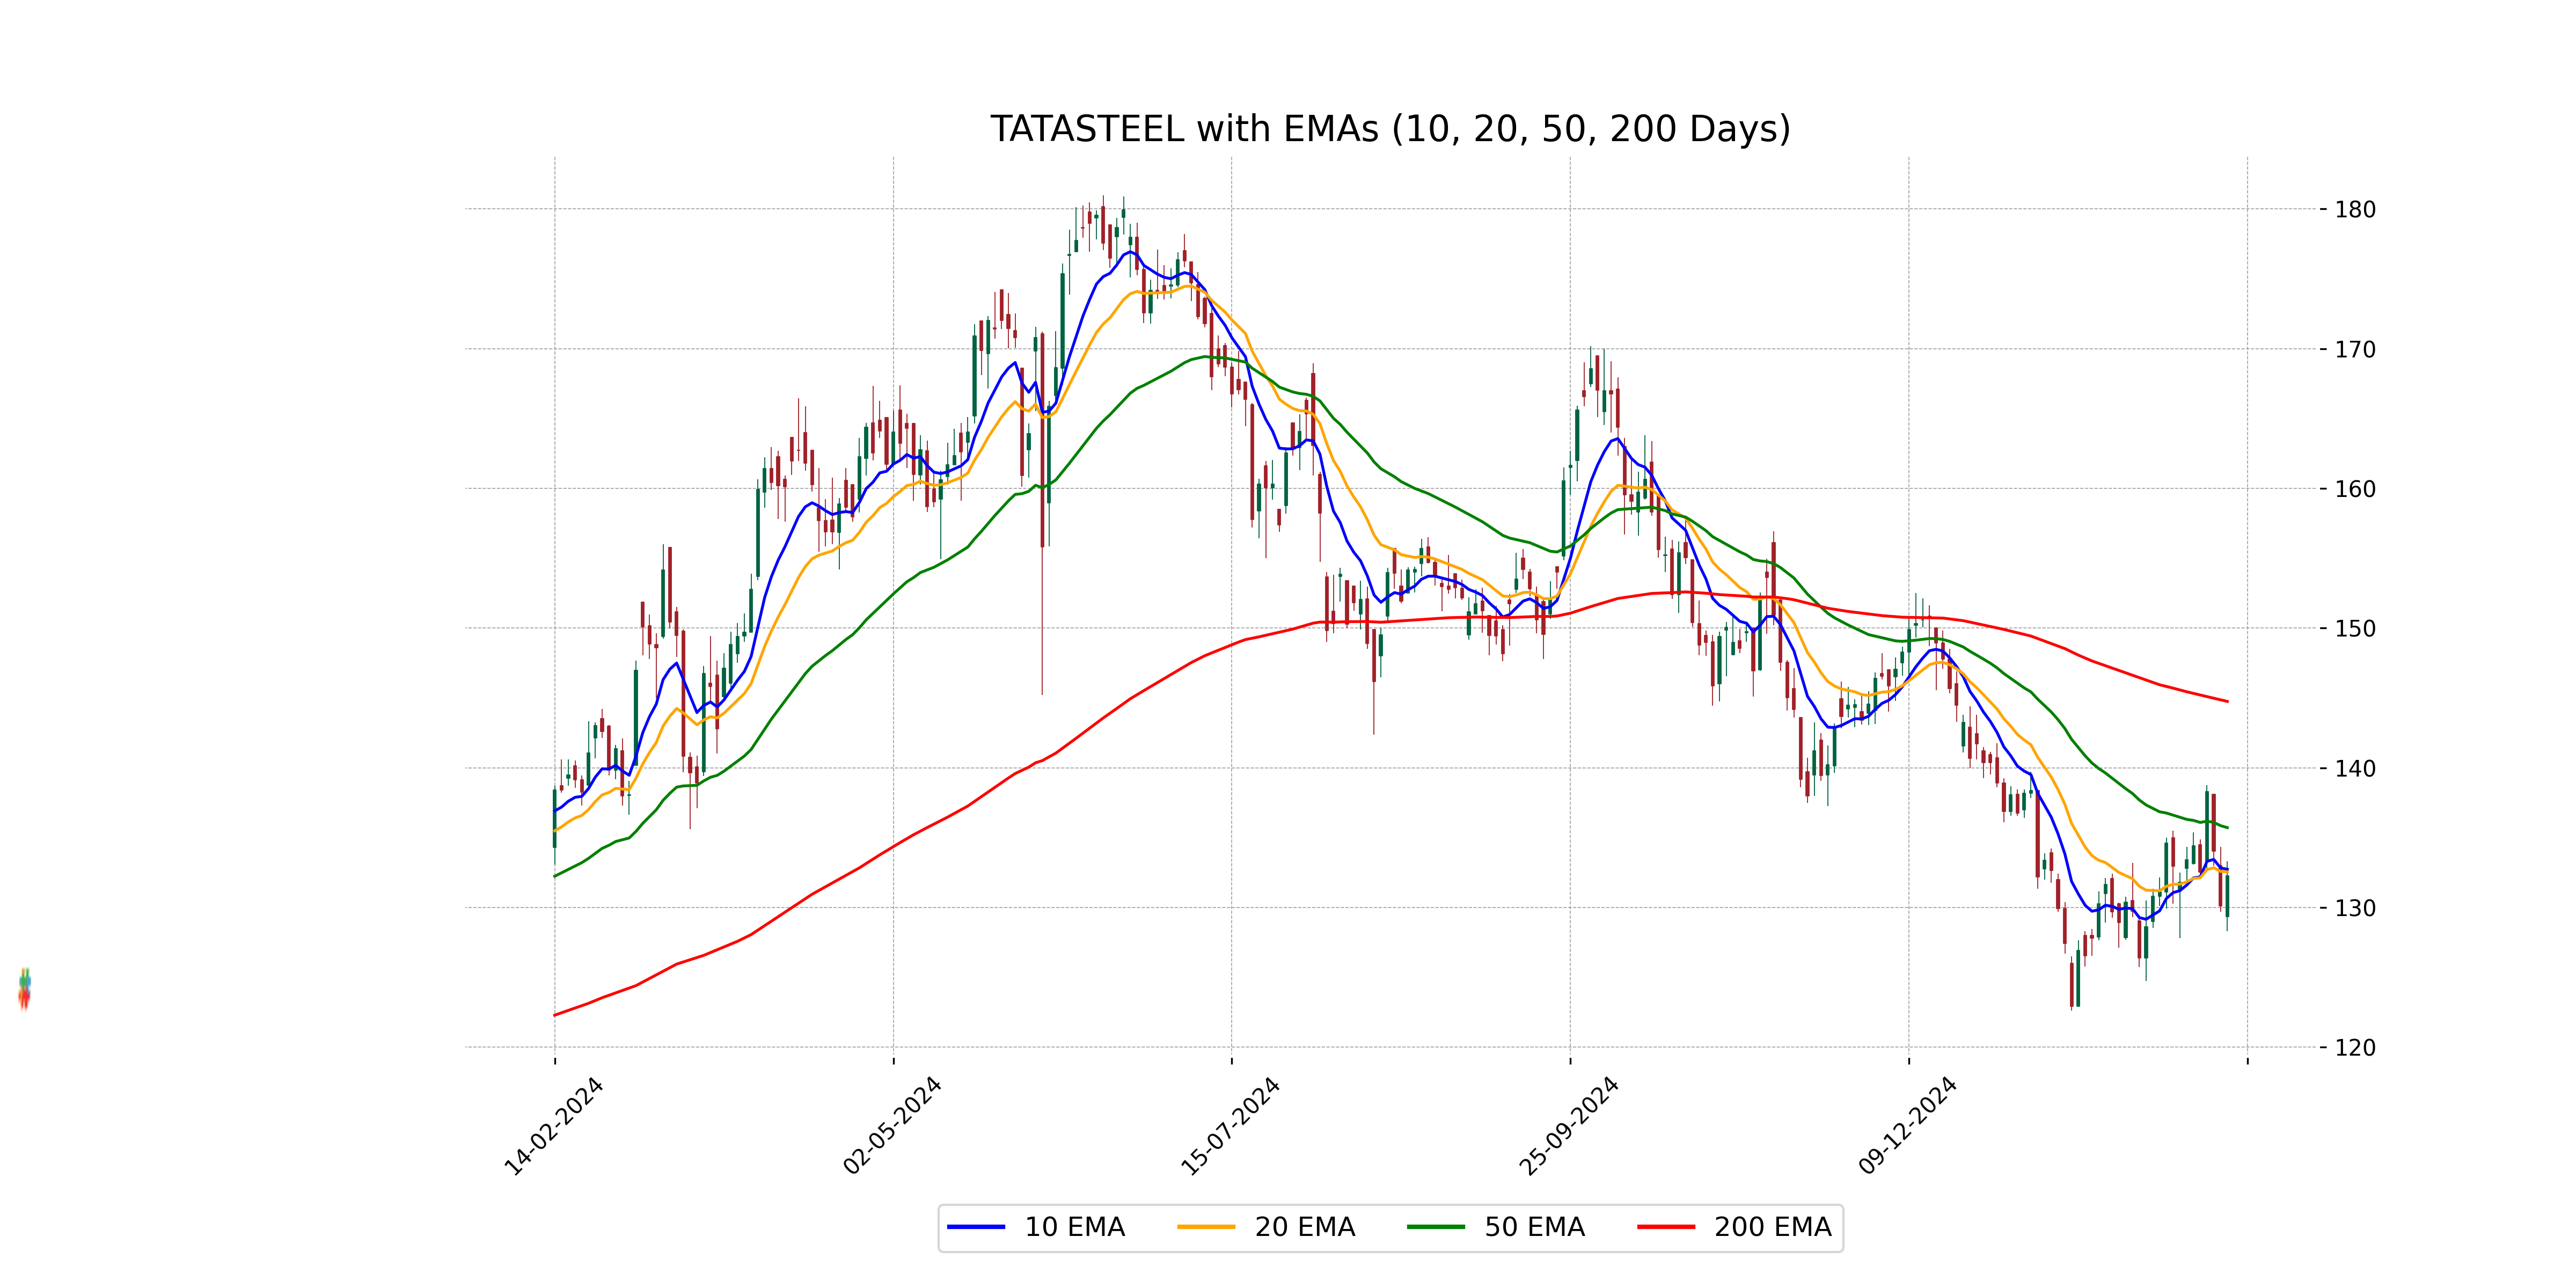
Relationship with Key Moving Averages
Tata Steel's current close price of 132.28 is below its 50-day EMA of 135.71 and 200-day EMA of 144.75, indicating a potential bearish trend. However, it is slightly below its 10-day EMA of 132.73 and close to its 20-day EMA of 132.55, suggesting a short-term convergence.
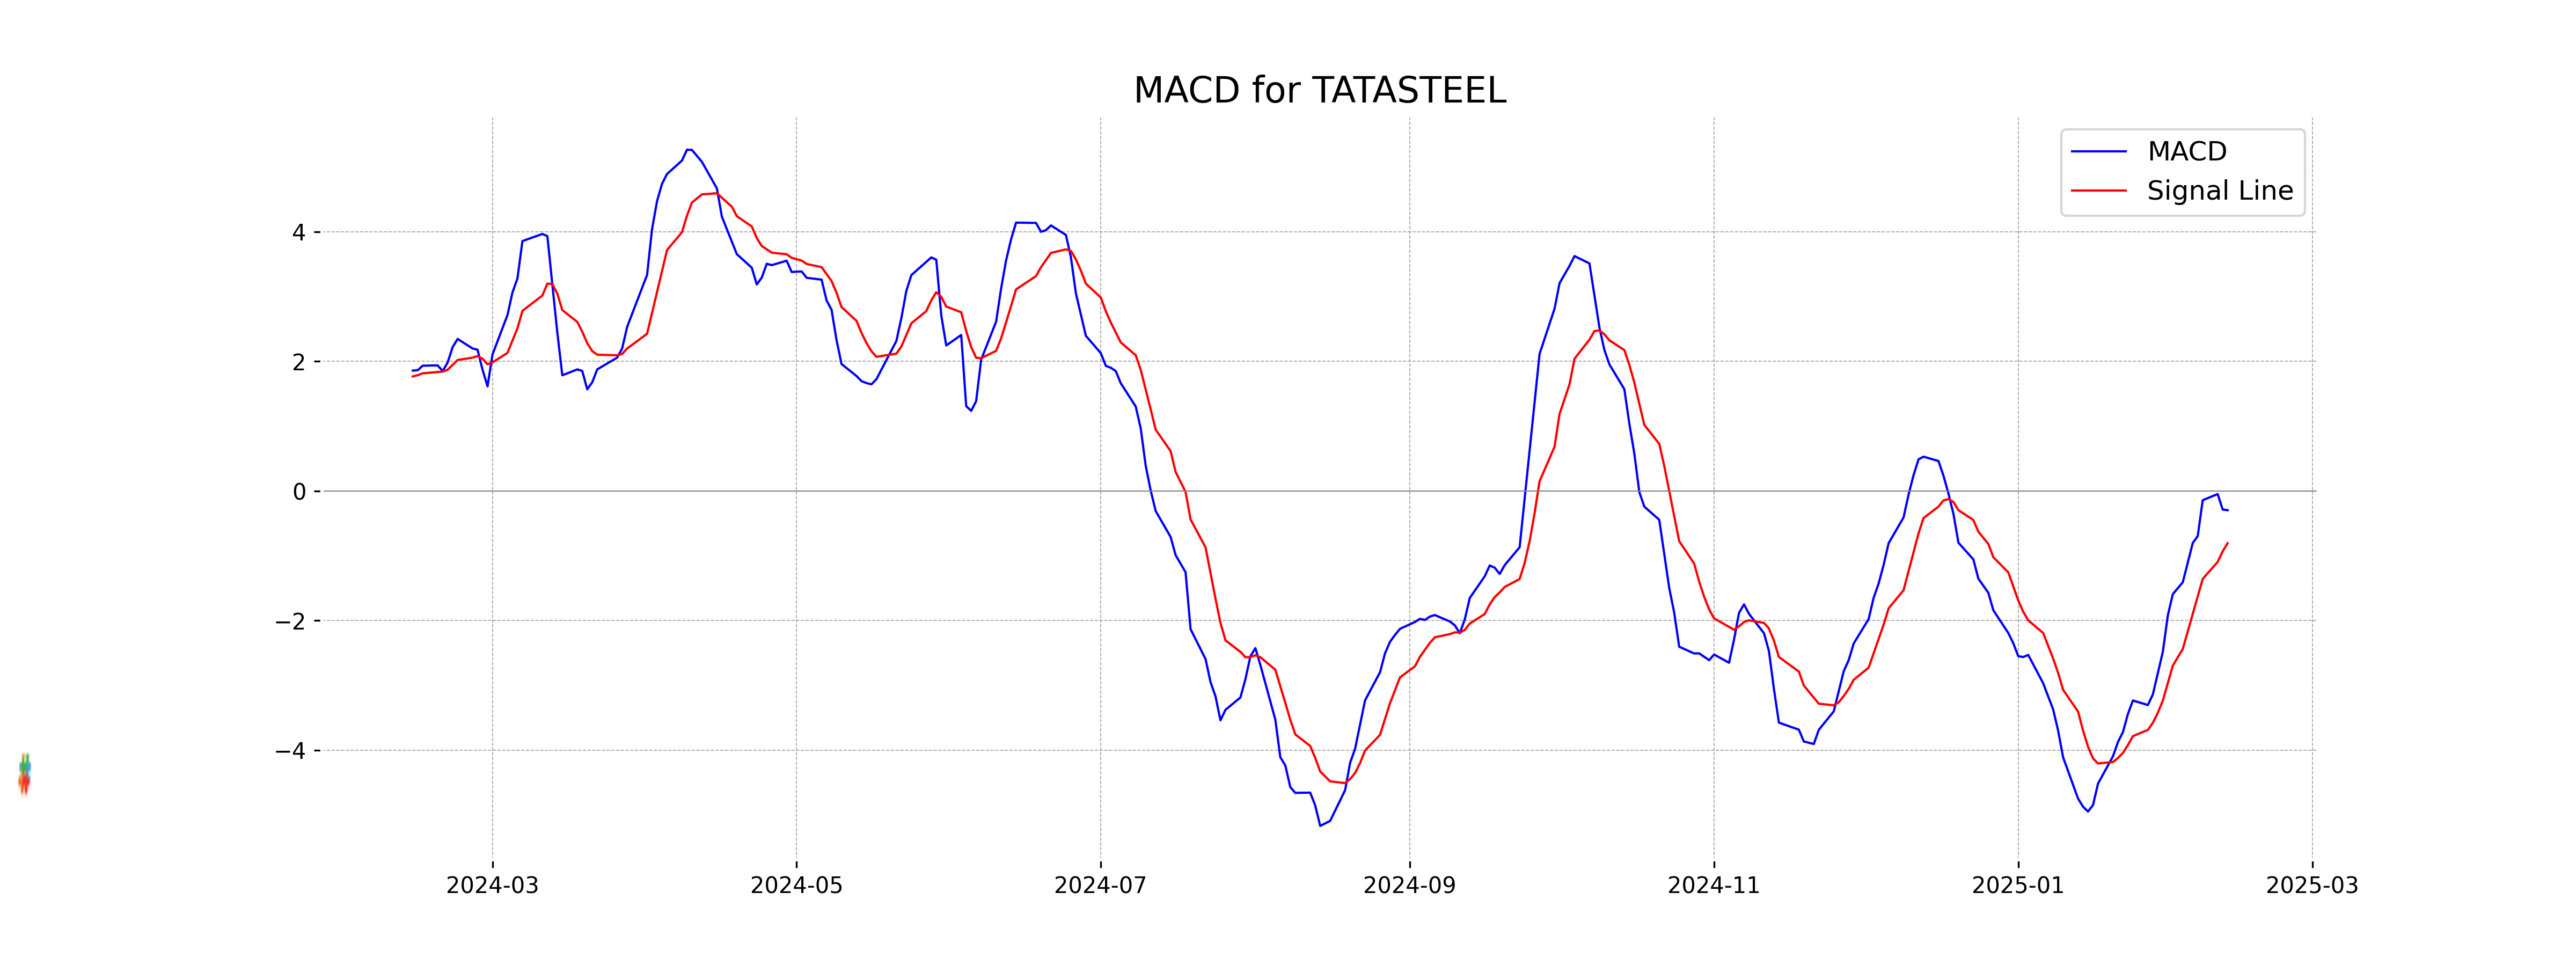
Moving Averages Trend (MACD)
The MACD for Tata Steel is -0.2993, with a signal line of -0.8081. The MACD being higher than the signal line suggests a potential bullish crossover, but given both values are negative, the overall trend may still be weak.
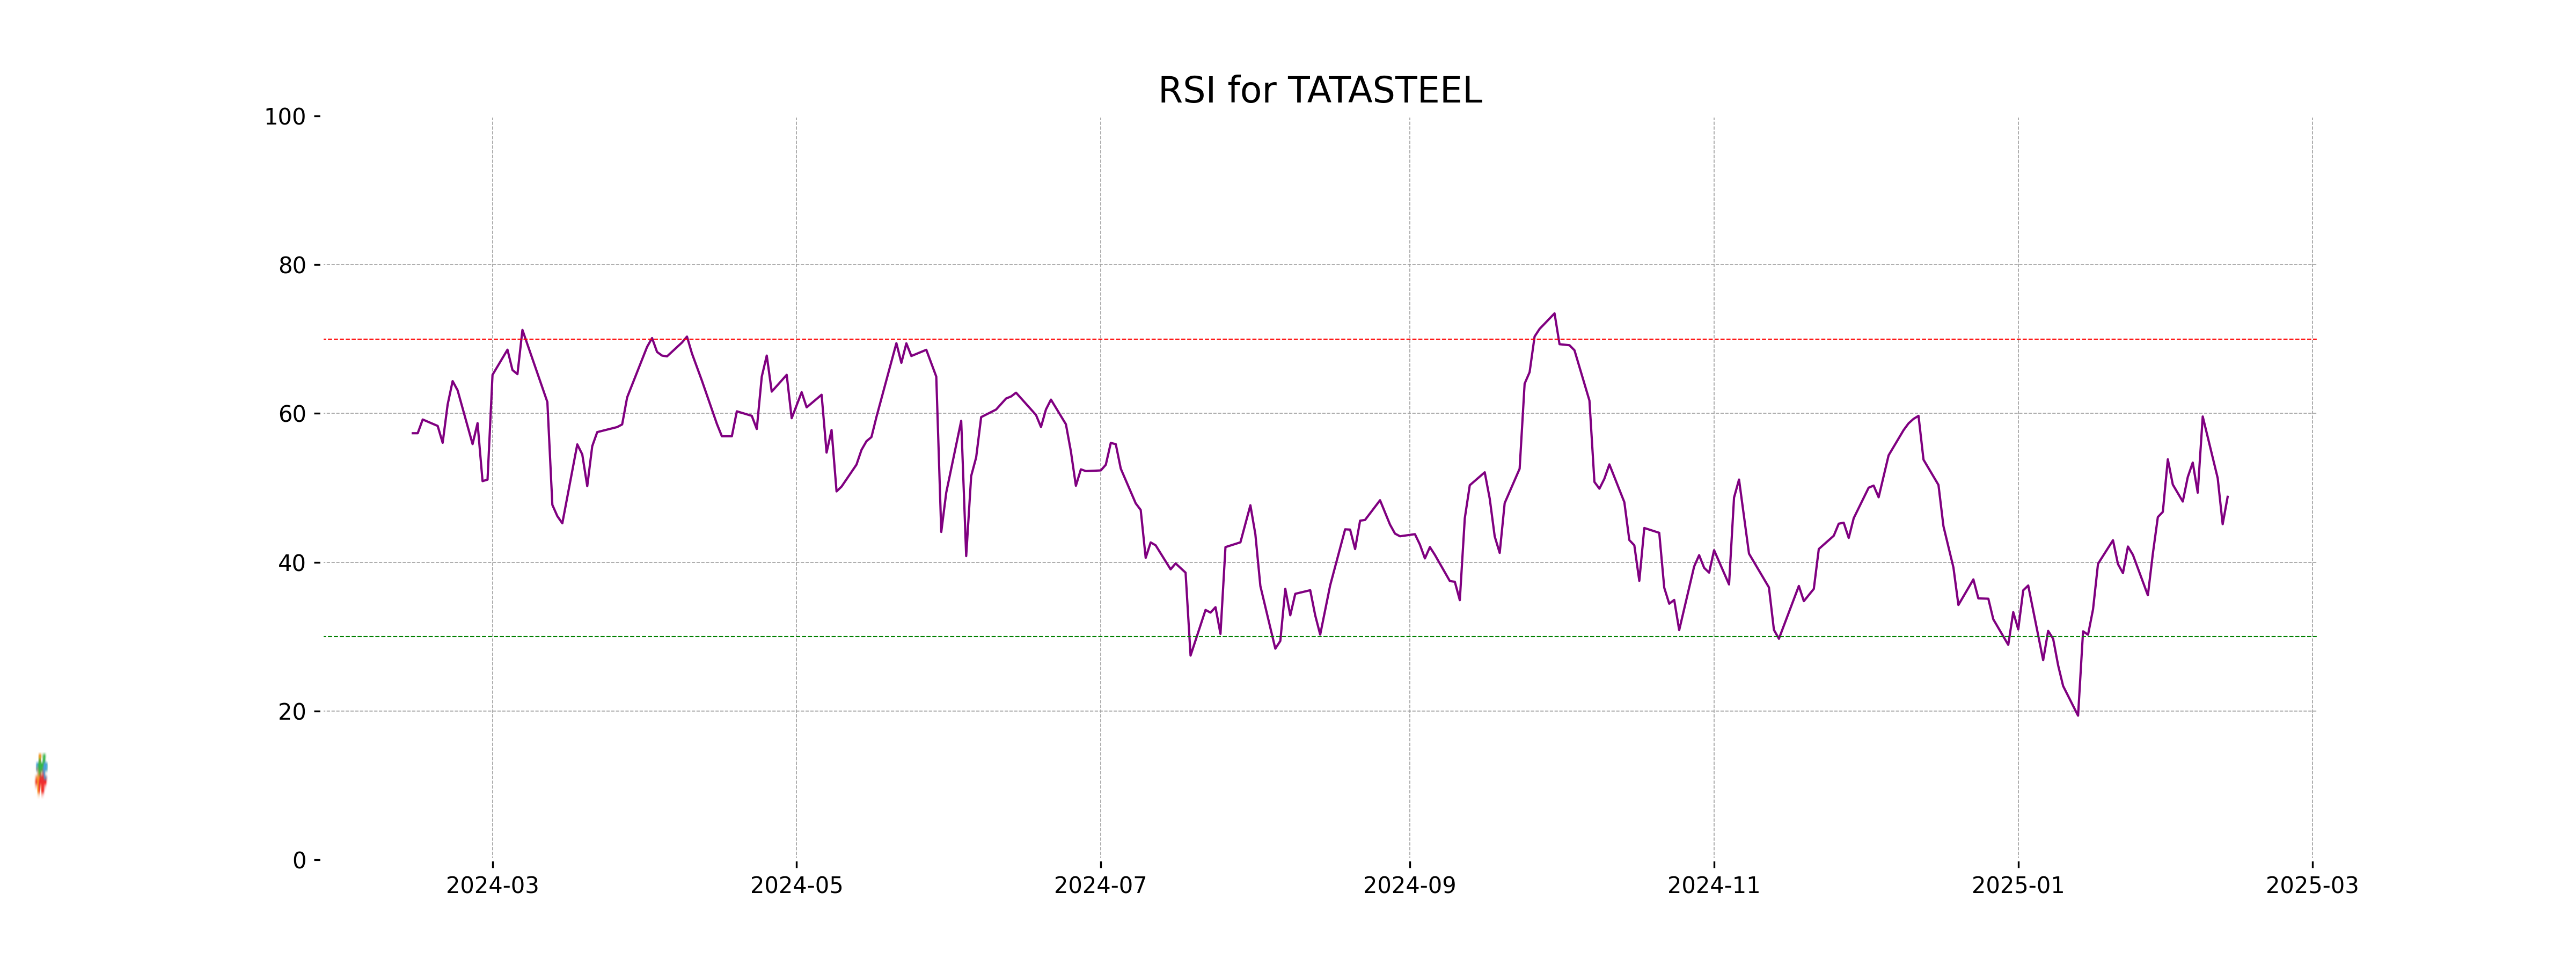
RSI Analysis
The RSI for Tata Steel is 48.79, which indicates that the stock is in a neutral zone. It's neither in the overbought region (above 70) nor in the oversold region (below 30). This suggests a balanced momentum, with no immediate signs of extreme price movement pressures.
Up Next
Top 5 Nifty 50 gainers today – February 12, 2025: Biggest stock moves

Rupee breaches 91-mark against US dollar for first time in intra-day trade

Microsoft commits USD 17.5 billion investment in India: CEO Satya Nadella

CBI books Anil Ambani's son, Reliance Home Finance Ltd. in Rs 228 crore bank fraud case

RBI raises FY26 GDP growth projection to 7.3 pc

RBI trims policy interest rate by 25bps to 5.25pc, loans to get cheaper

More videos

Rupee slumps to all-time low of 90.25 against US dollar in intra-day trade

Reliance completes merger of Star Television Productions with Jiostar

India to lead emerging market growth with 7pc GDP rise in 2025: Moody’s

Nifty hits record high after 14 months; Sensex nears all-time peak

Reliance stops Russian oil use at its only-for-export refinery to comply with EU sanctions

ED attaches fresh assets worth over Rs 1,400 cr in case against Anil Ambani's Reliance Group

India signs one-year deal to import 2.2 million tonnes of LPG from US

India International Trade Fair begins at Pragati Maidan amid tight security

Stock markets decline in initial trade on foreign fund outflows, weak Asian peers

Amazon to lay off 30,000 office workers amid AI-driven cost cuts