


Highlights
- Overall market sentiment on February 03, 2025, was decidedly bullish
- Technical indicators underline a strong uptrend, particularly through key stocks
- RSI values above 60 for both BAJFINANCE.NS and M&M.NS
Latest news

Putin hails Ukraine gains, threatens more, in annual press conference

OnePlus Pad Go 2 Review: No drama, just a good tablet

Parliament Moment: Priyanka Gandhi shares tea with Rajnath Singh. PM Modi and Om Birla

Cold wave deepens in Kashmir as Chillai-Kalan nears, temperatures dip below freezing

Pakistan accuses India of attempting to undermine Indus treaty

Vande Mataram discussion in UP legislature to mark 150th anniversary: Yogi Adityanath

Ashes 2025: Travis Head slams unbeaten 142 to crush England's Ashes hopes

Tipra Motha youth wing protests Bangladesh leader's anti-India remarks in Agartala
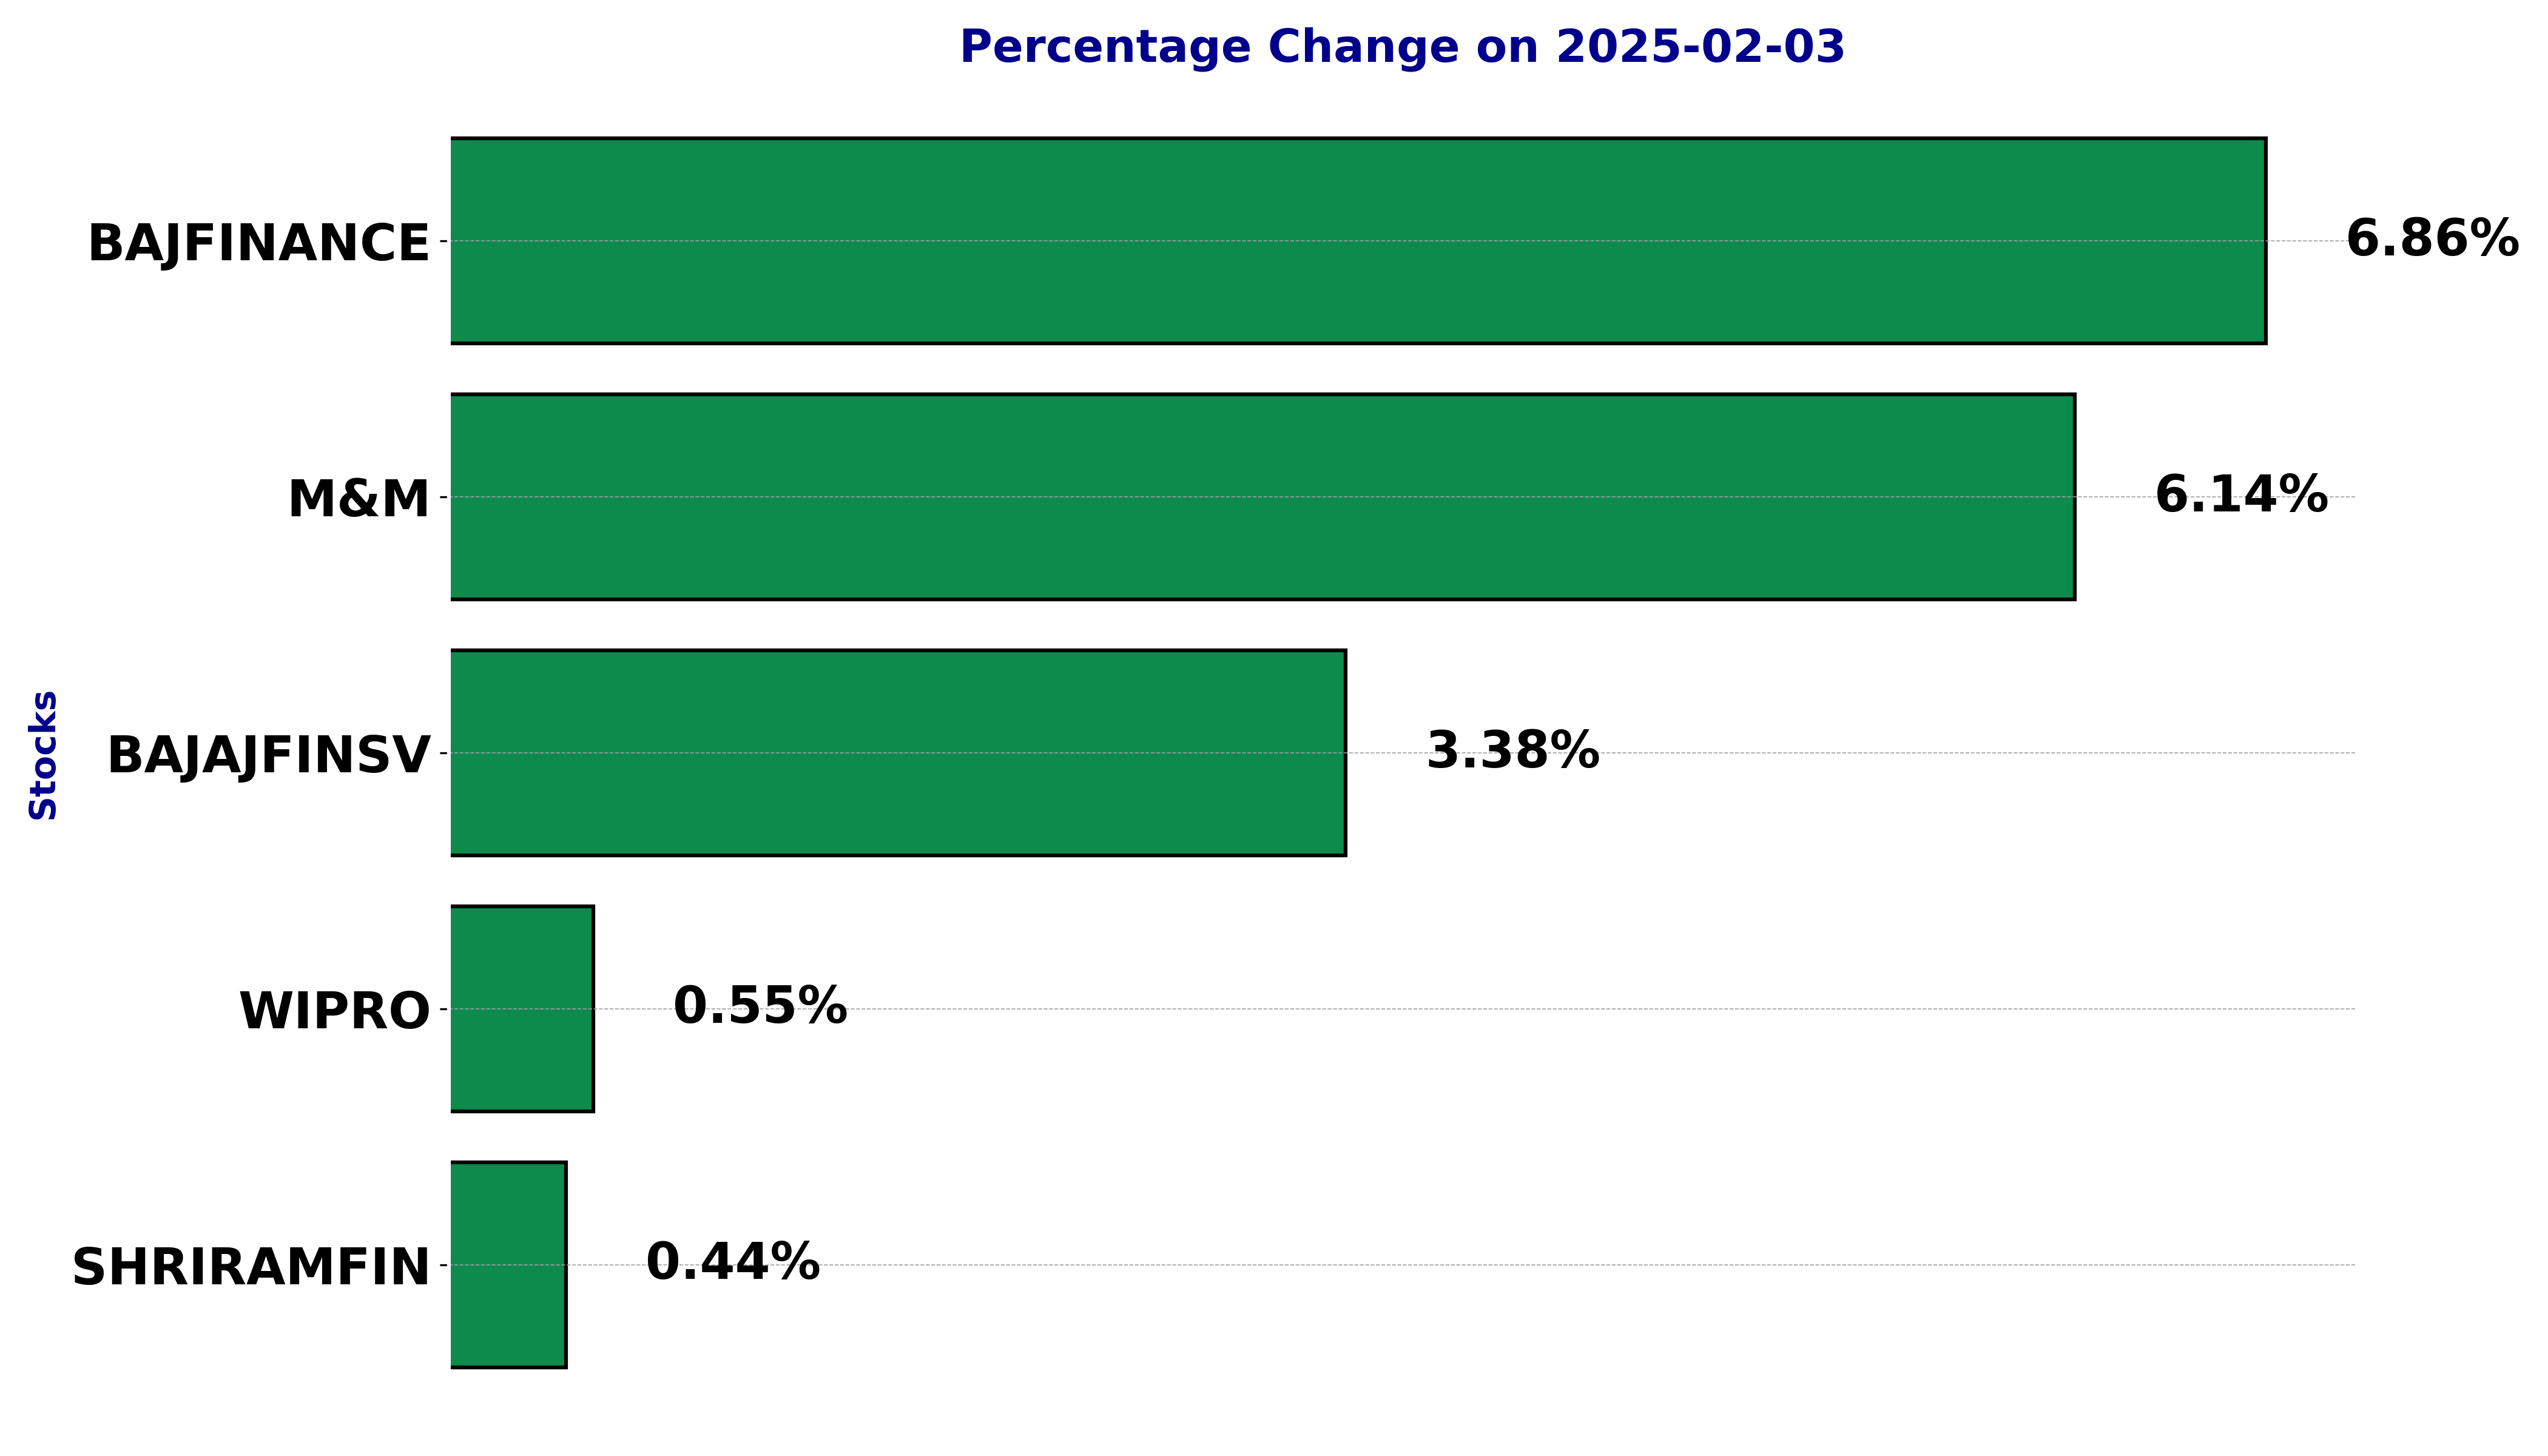
Top 5 Nifty 50 gainers today – February 3, 2025: Biggest stock moves


In this article, we will explore the technical indicators of some of the high-performing stocks on the Indian stock market, including BAJAJFINSV, BAJFINANCE, M&M, SHRIRAMFIN, and WIPRO.
By looking at these stocks through the lens of key technical factors, we aim to better understand their price movements, trends, and potential future performance.
Analysis for Bajaj Finserv - February 03, 2025
Stock Performance
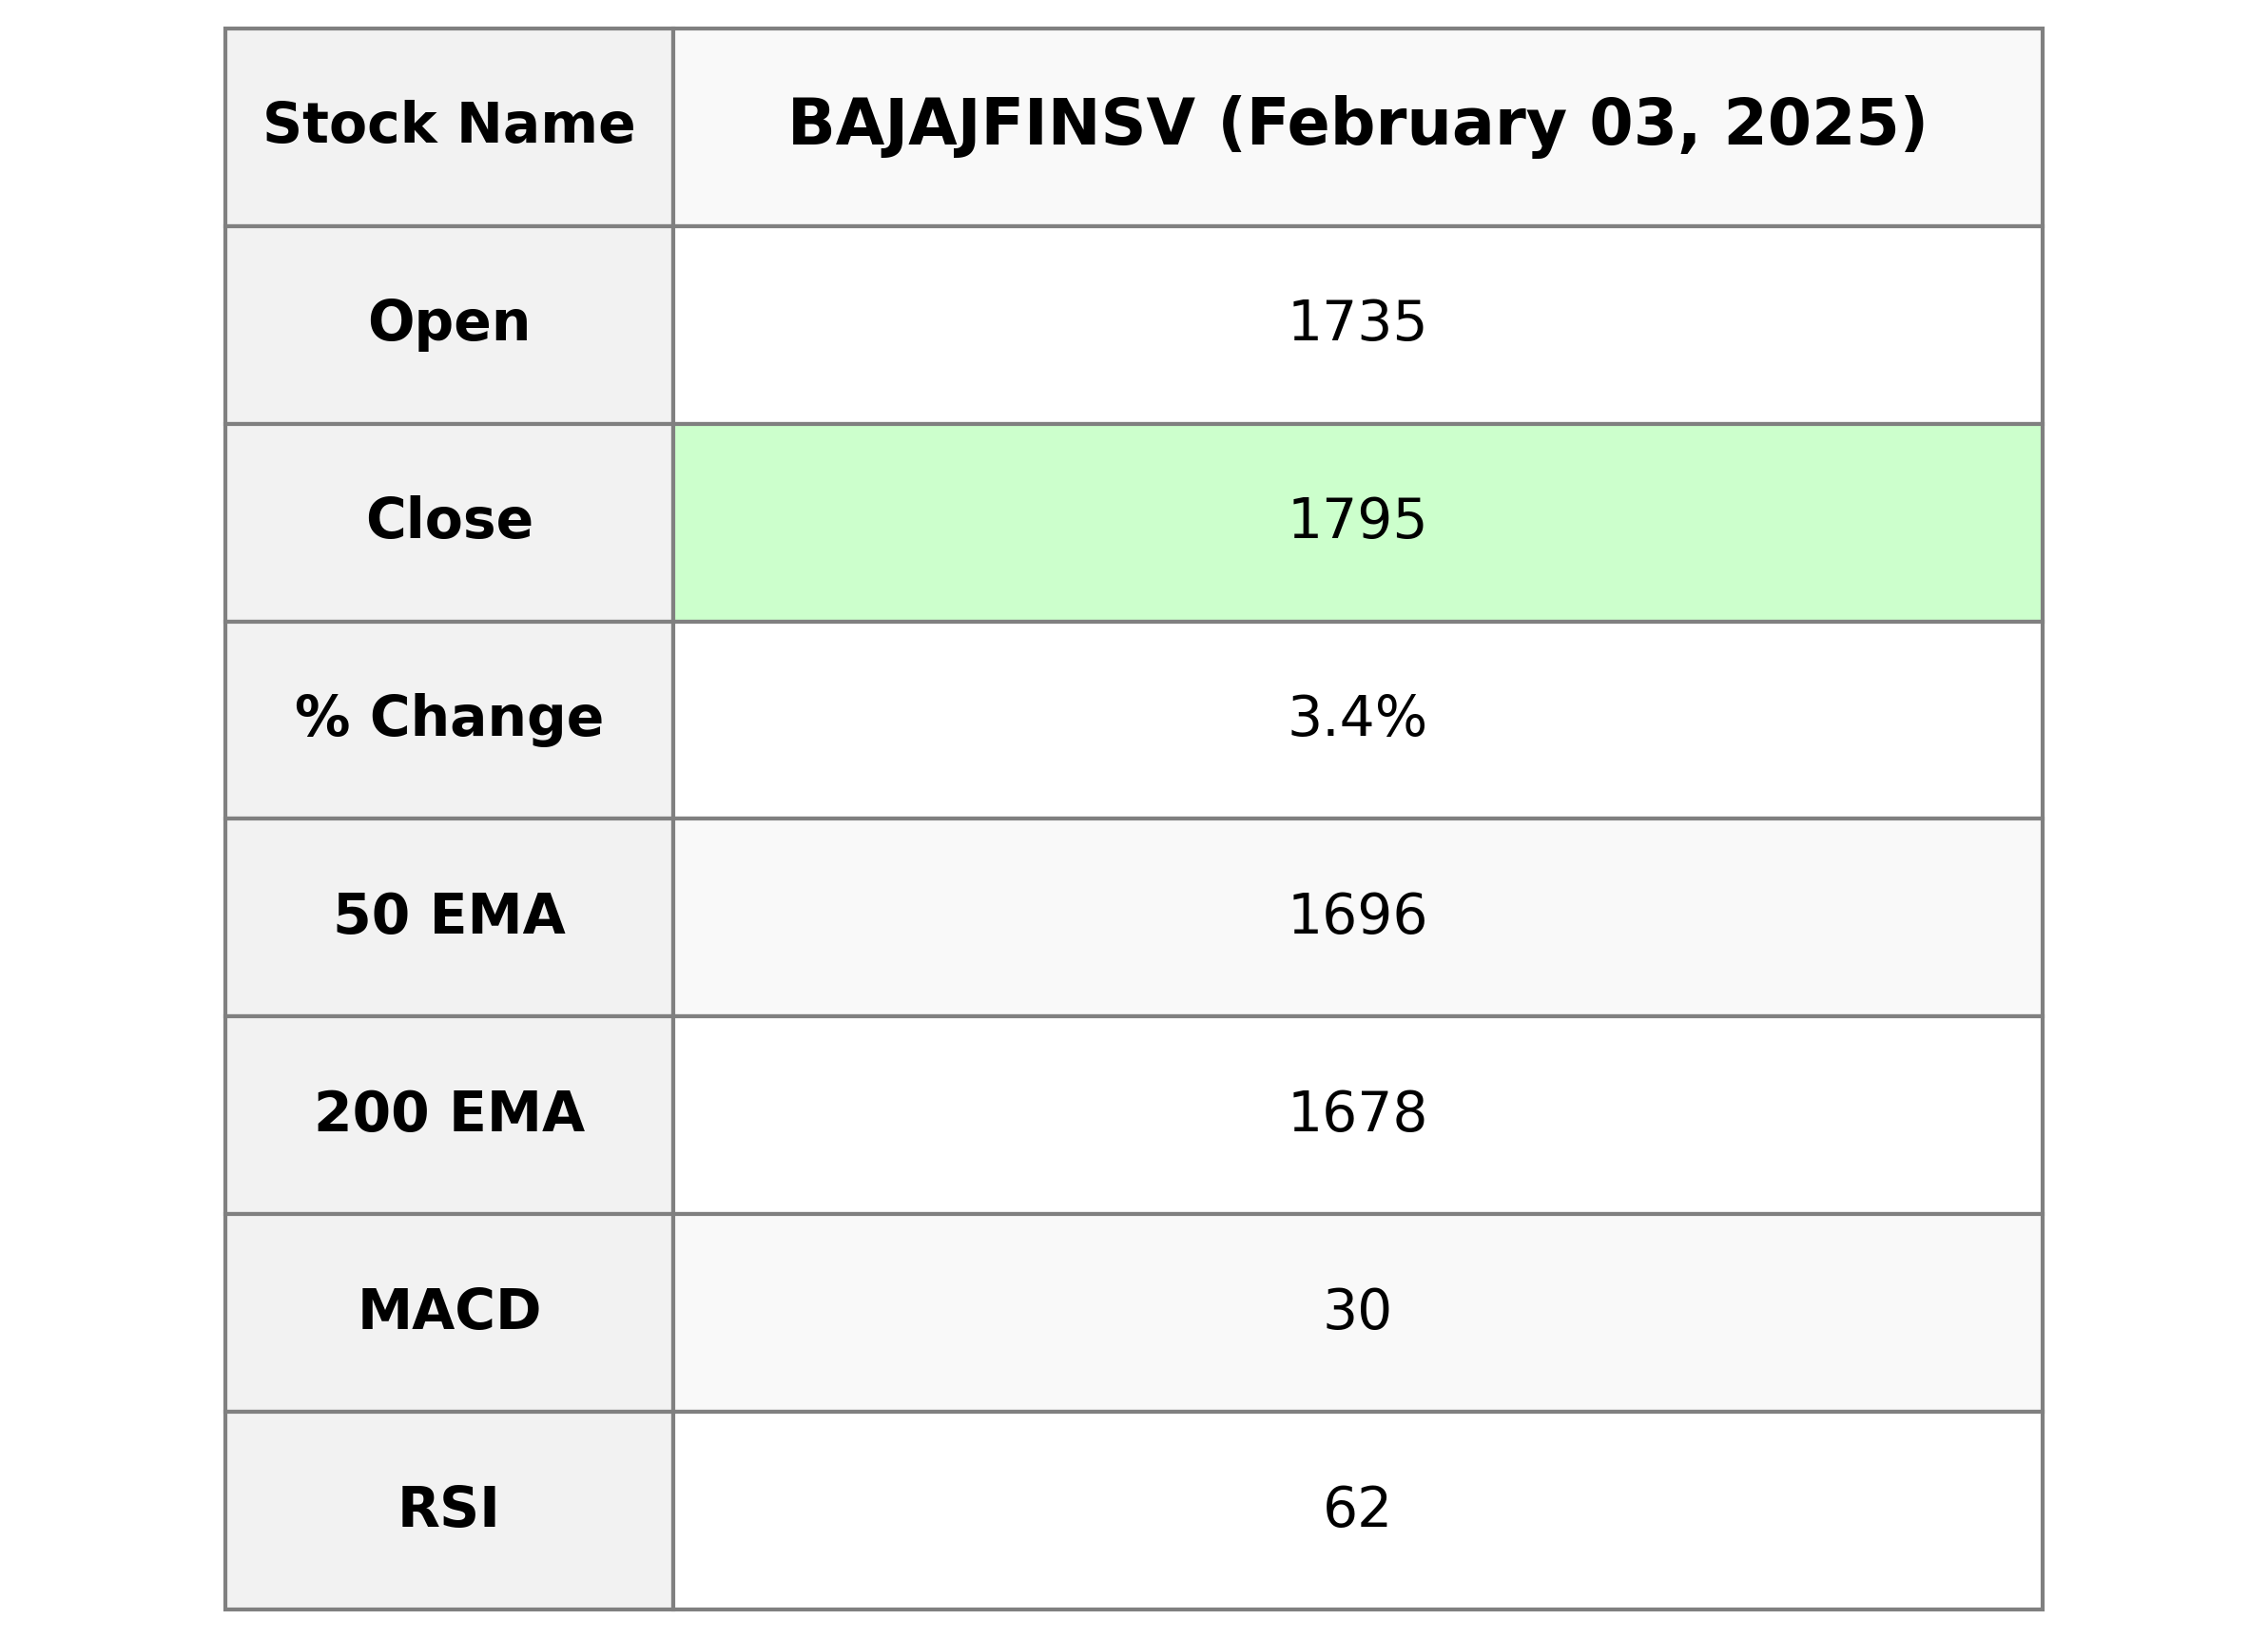
On February 03, 2025, Bajaj Finserv (BAJAJFINSV.NS) experienced a notable performance in the stock market. The stock opened at 1735.0 and closed higher at 1794.85, marking a 3.38% increase from the previous close of 1736.10. The trading volume was robust at 2,918,007 shares, with the stock exhibiting strong technical indicators, including a MACD of 30.28 and an RSI of 62.27, suggesting bullish momentum.

Relationship with Key Moving Averages
Bajaj Finserv's closing price of 1794.85 is above all its key moving averages: the 10 EMA at 1747.87, 20 EMA at 1722.67, 50 EMA at 1696.06, and 200 EMA at 1677.53. This suggests a bullish trend as the stock is trading above these critical support levels.
Moving Averages Trend (MACD)
The MACD analysis for Bajaj Finserv indicates bullish momentum, as the MACD line (30.28) is above the signal line (25.95). This crossover suggests a potential uptrend, supported by a positive MACD value, signaling strength in the stock's recent price movement.

RSI Analysis
The RSI (Relative Strength Index) of Bajaj Finserv is currently at 62.27, indicating a moderately strong momentum. Typically, an RSI above 70 may suggest overbought conditions, while an RSI below 30 indicates oversold conditions. As Bajaj Finserv's RSI is between 30 and 70, it suggests that the stock is neither overbought nor oversold, showing stable market momentum.

Analysis for Bajaj Finance - February 03, 2025
Stock Performance

On February 3, 2025, Bajaj Finance (BAJFINANCE.NS) showed a strong performance with a closing price of ₹8425.80, reflecting a significant increase of 6.86% from the previous close of ₹7885.10. The stock witnessed substantial trading activity with a volume of 4,336,516 shares and exhibited bullish momentum as indicated by an RSI of 77.05 and positive MACD.

Relationship with Key Moving Averages
Bajaj Finance's current closing price of 8425.80 significantly surpasses its 50-day EMA of 7268.73 and 200-day EMA of 7073.44, indicating strong upward momentum. Additionally, the price is notably above the 10-day EMA of 7747.42 and the 20-day EMA of 7532.03, suggesting sustained short-term bullish sentiment.
Moving Averages Trend (MACD)
The MACD value of 239.78 for Bajaj Finance indicates a strong bullish momentum, as it is significantly above the MACD Signal line of 154.81. This suggests that the stock has been experiencing upward price movement. The RSI value of 77.05 also supports this, indicating the stock is in an overbought condition, which investors should monitor closely for potential short-term reversals.

RSI Analysis
Based on the given data, Bajaj Finance's RSI (Relative Strength Index) is 77.05, which indicates that the stock is in the overbought territory. This suggests that the stock may be experiencing heightened buying pressure, and a potential price correction or pullback could be on the horizon.

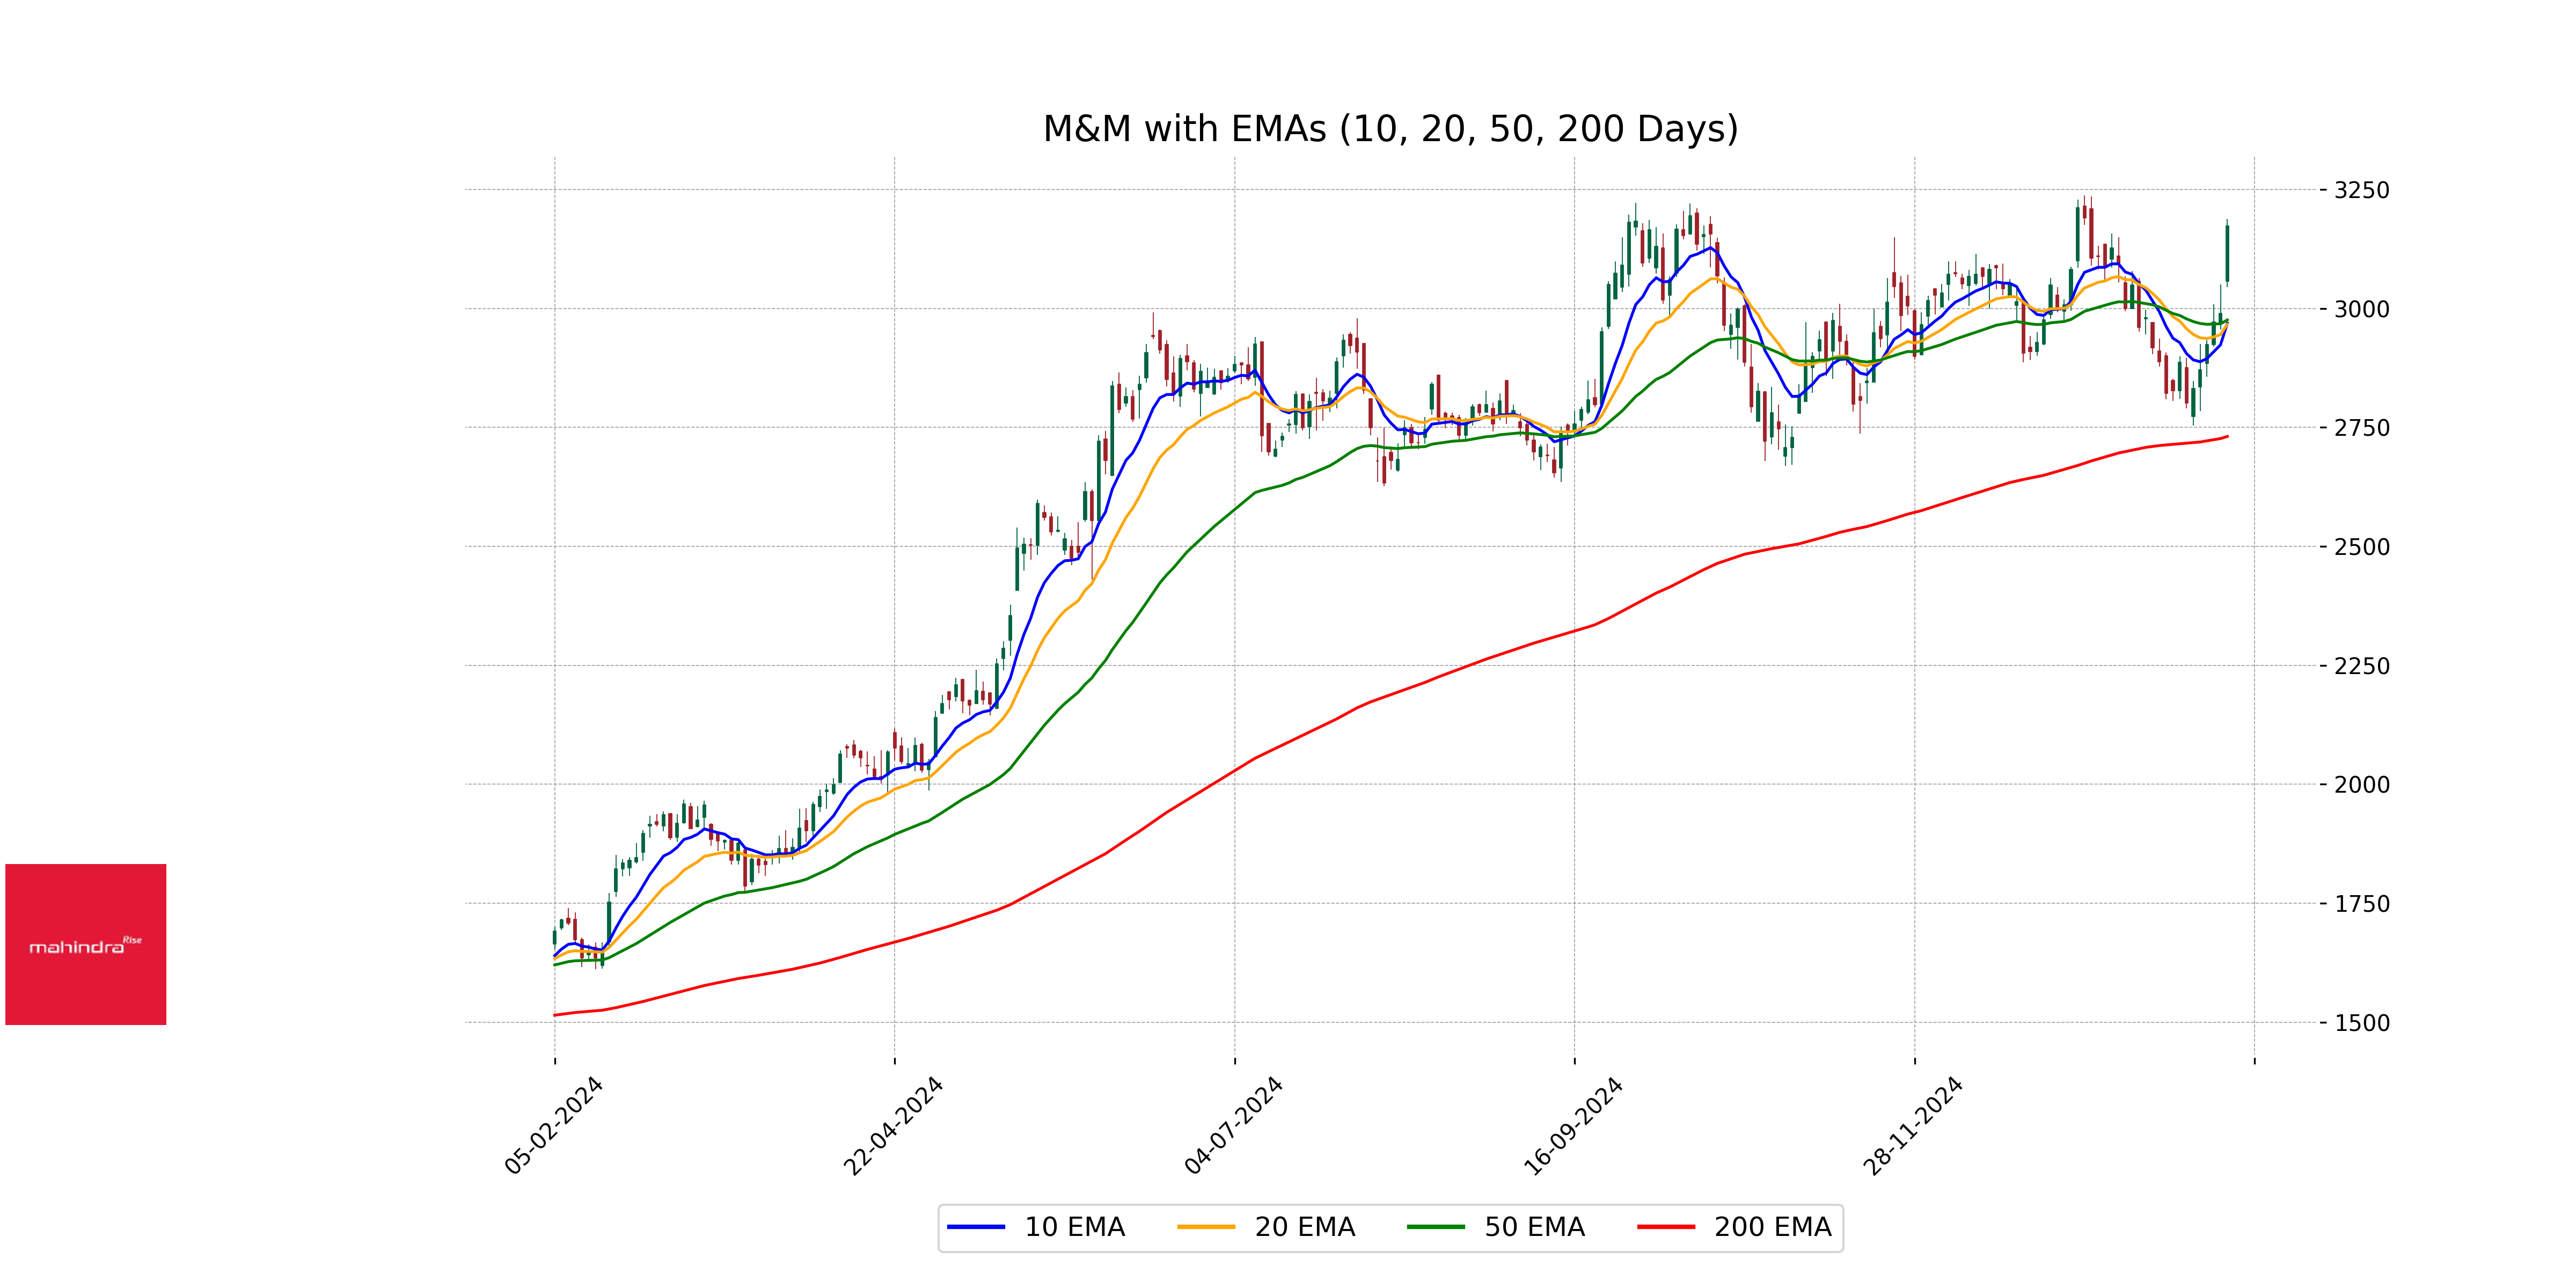
Analysis for Mahindra & Mahindra - February 03, 2025
Stock Performance

On February 03, 2025, Mahindra & Mahindra's stock, traded under the symbol M&M.NS, showed a strong performance with a closing price of 3173.30, representing a significant increase of 6.14% from the previous close. This robust movement was supported by substantial trading volume, indicating positive market sentiment towards the company, characterized within the Consumer Cyclical sector and Auto Manufacturers industry in India.
Relationship with Key Moving Averages
The stock price of Mahindra & Mahindra (M&M.NS) is currently trading above key moving averages with the close at 3173.30, which is higher than the 50-day EMA of 2975.65 and the 200-day EMA of 2730.84, indicating a strong upward momentum. Additionally, it's above both the 10-day EMA of 2968.72 and the 20-day EMA of 2966.52, supporting short-term bullishness.
Moving Averages Trend (MACD)
The MACD for Mahindra & Mahindra (M&M.NS) is -7.15, which is above its MACD Signal of -29.14. This suggests a potential bullish momentum, indicating that the stock price may continue to rise in the short term. However, it's essential to monitor other technical indicators and market conditions for a comprehensive analysis.

RSI Analysis
The RSI (Relative Strength Index) for Mahindra & Mahindra is at 64.08, which suggests that the stock is nearing the overbought territory but is not yet overextended. This indicates a potential continuation of the current bullish trend, with some caution advised as it approaches the 70 mark, where it may become overbought.

Analysis for Shriram Finance - February 03, 2025
Stock Performance

On February 03, 2025, Shriram Finance (SHRIRAMFIN.NS) closed at 546.15, marking a slight increase of 0.44% or 2.40 points from its previous close of 543.75. The stock experienced a trading range between a low of 516.0 and a high of 558.0, with a trading volume of 7,441,886 shares. Its technical indicators showed a subdued momentum with a Relative Strength Index (RSI) of 49.17, and the MACD stood at -10.88, indicating a bearish trend.

Relationship with Key Moving Averages
Shriram Finance's current stock price is below the 50-day EMA (565.16) and 200-day EMA (553.88), indicating a potential bearish trend and suggesting resistance above current levels. However, it is trading above the short-term 10-day EMA (536.47) and close to the 20-day EMA (542.41), which may imply some short-term stability or consolidation in price.
Moving Averages Trend (MACD)
The MACD for Shriram Finance is -10.88, with a MACD Signal of -15.38, indicating that the MACD line is above the signal line. This suggests a potential bullish signal, as the MACD is moving closer to the signal line, potentially indicating a reversal if the trend continues. However, with both values in the negative region, caution is advised.

RSI Analysis
RSI Analysis for Shriram Finance (SHRIRAMFIN.NS): The Relative Strength Index (RSI) for Shriram Finance is currently at 49.17, which is near the midpoint of the typical 0-100 scale. This suggests that the stock is neither in overbought nor oversold territory, indicating a relatively balanced momentum without any imminent extreme buying or selling pressure.

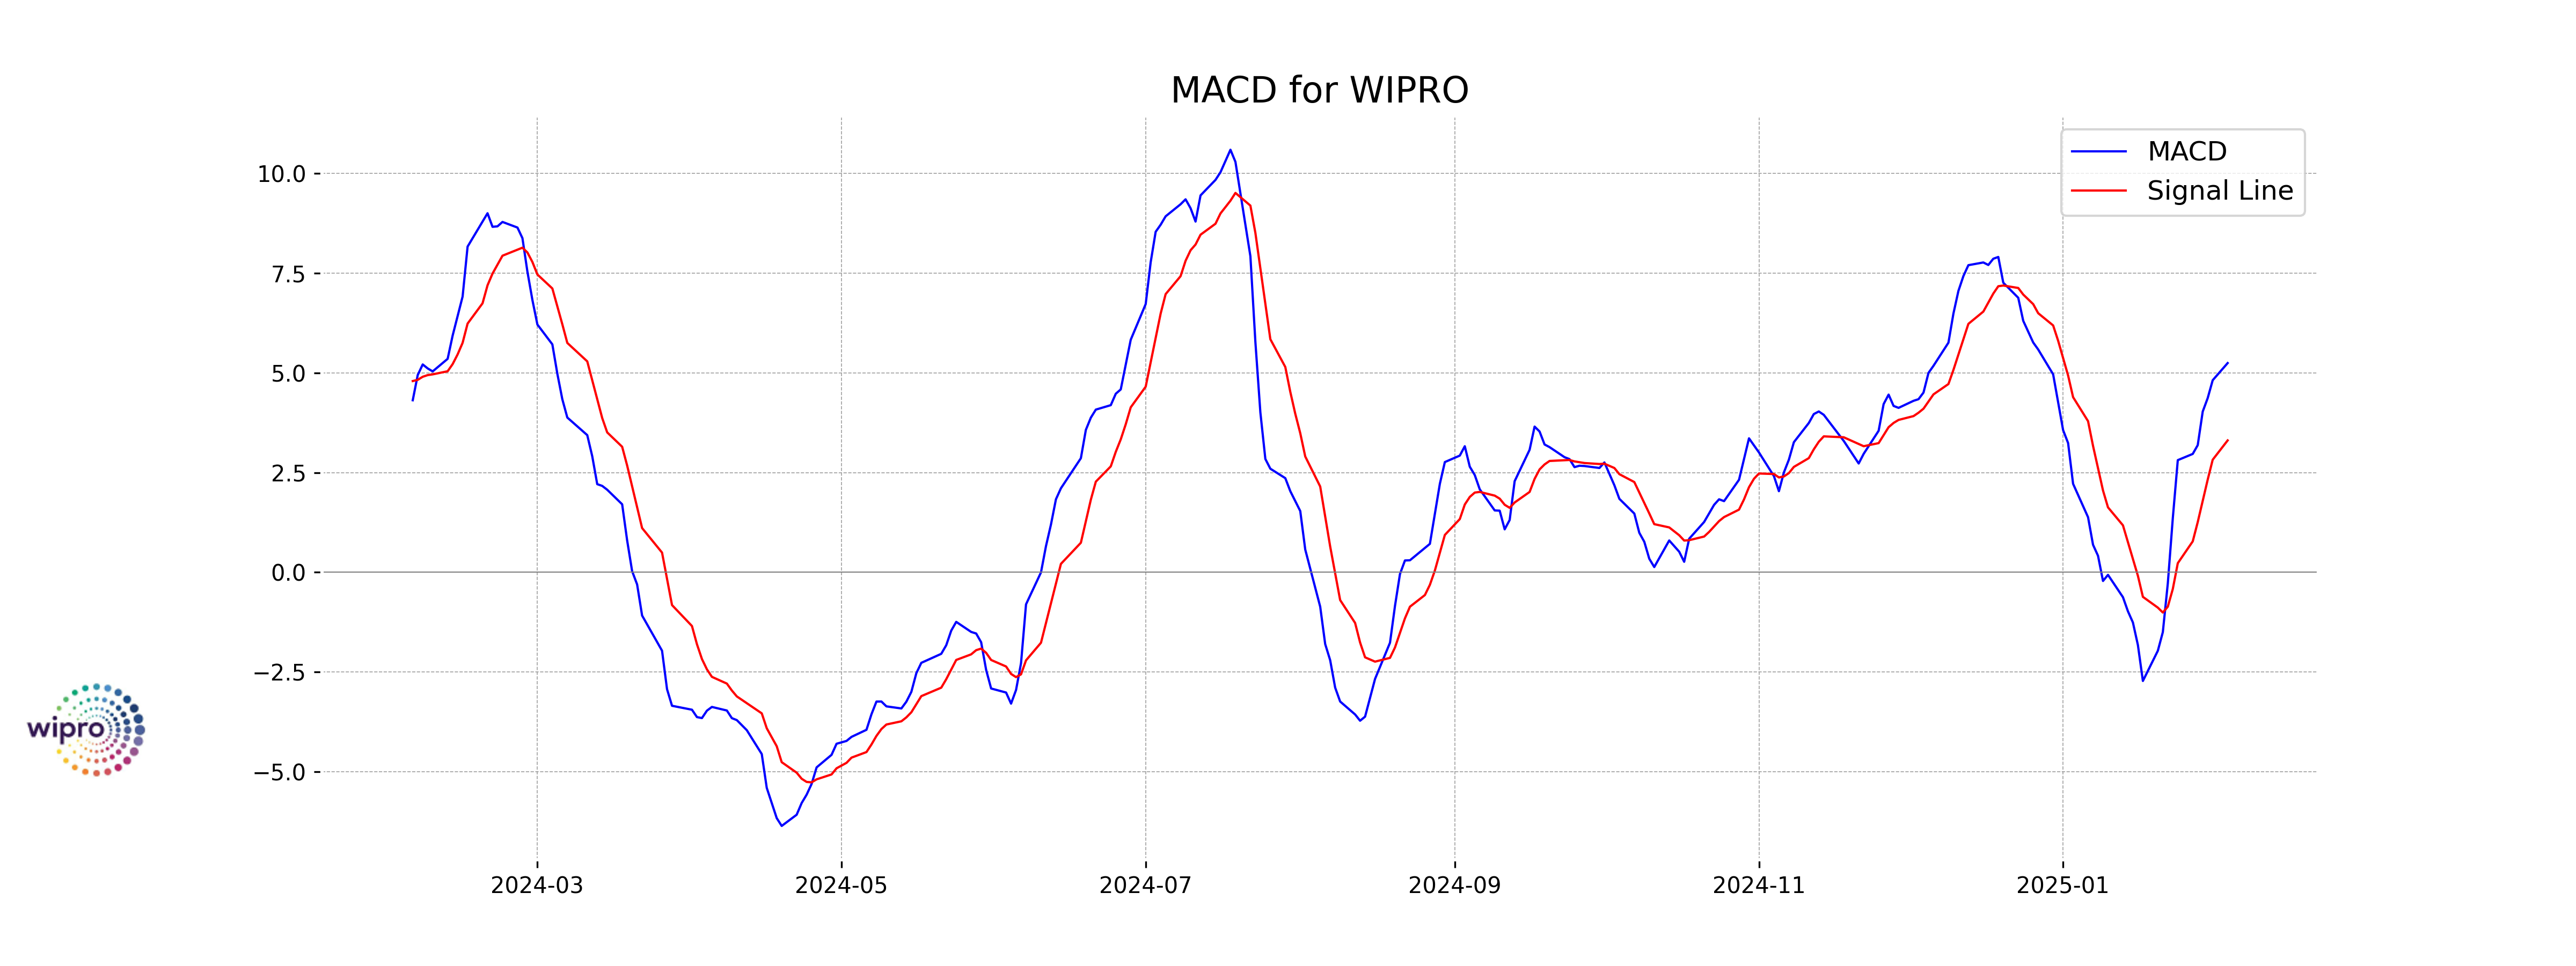
Analysis for Wipro - February 03, 2025
Stock Performance

On February 3, 2025, Wipro's stock (WIPRO.NS) opened at ₹303 and closed at ₹313.60, marking a 0.55% increase from the previous close of ₹311.90. The stock traded between a low of ₹300.30 and a high of ₹314, with a trading volume of 14,874,628 shares. The company, operating in the Technology sector, witnessed a positive trend supported by key moving averages like the 10 EMA at ₹306.53 and RSI at 60.97, indicating bullish momentum in the market.

Relationship with Key Moving Averages
Wipro's current closing price of 313.60 is above its 50-EMA (294.35), 200-EMA (268.01), and 10-EMA (306.53), indicating a strong bullish trend. The price also surpasses the 20-EMA (301.74), further confirming the upward momentum. This price positioning relative to key moving averages suggests sustained buying interest in the stock.
Moving Averages Trend (MACD)
The MACD for WIPRO.NS is 5.25, which is above the MACD Signal line of 3.31, indicating a potential bullish trend. This suggests that the stock might experience upward momentum, but it's important to consider other factors for a comprehensive analysis.
RSI Analysis
Based on the provided data, Wipro's RSI (Relative Strength Index) is 60.97. This value suggests that the stock is in a neutral to slightly overbought condition, as RSI values between 50 and 70 often indicate that the stock has potential upward momentum without being overextended. Generally, an RSI above 70 might indicate overbought conditions, while below 30 suggests oversold conditions.

Up Next
Top 5 Nifty 50 gainers today – February 3, 2025: Biggest stock moves

Rupee breaches 91-mark against US dollar for first time in intra-day trade

Microsoft commits USD 17.5 billion investment in India: CEO Satya Nadella

CBI books Anil Ambani's son, Reliance Home Finance Ltd. in Rs 228 crore bank fraud case

RBI raises FY26 GDP growth projection to 7.3 pc

RBI trims policy interest rate by 25bps to 5.25pc, loans to get cheaper

More videos

Rupee slumps to all-time low of 90.25 against US dollar in intra-day trade

Reliance completes merger of Star Television Productions with Jiostar

India to lead emerging market growth with 7pc GDP rise in 2025: Moody’s

Nifty hits record high after 14 months; Sensex nears all-time peak

Reliance stops Russian oil use at its only-for-export refinery to comply with EU sanctions

ED attaches fresh assets worth over Rs 1,400 cr in case against Anil Ambani's Reliance Group

India signs one-year deal to import 2.2 million tonnes of LPG from US

India International Trade Fair begins at Pragati Maidan amid tight security

Stock markets decline in initial trade on foreign fund outflows, weak Asian peers

Amazon to lay off 30,000 office workers amid AI-driven cost cuts