


Highlights
- HDFC Bank shows bullish trend, RSI overbought
- Hindustan Unilever nears resistance, bullish momentum holds
- ITC and M&M trade above key averages
Latest news

Indian cricket prodigy Vaibhav Suryavanshi honoured with 'Pradhan Mantri Rashtriya Bal Puraskar'

AAP Gujarat chief Isudan Gadhvi calls BJP allegations against MLA Chaitar Vasava as politically driven

Aditya Dhar's 'Dhurandhar' earns over Rs 1000 crore at box office

Australia lead England by 46 after 20 wickets fall on crazy day at MCG

Delhi HC asks Centre to respond on plea seeking GST cut on air purifiers amid worsening air quality

Congress pays tribute to former PM Manmohan Singh on first death anniversary

Ruled out of last two Ashes Tests, Cummins sets sights on T20 World Cup in Feb

CEO among three held for gangrape of woman IT firm manager in Udaipur
Top 5 Nifty 50 gainers today – April 22, 2025: Biggest stock moves


In this article, we will explore the technical indicators of some of the high-performing stocks on the Indian stock market, including HDFCBANK, HINDUNILVR, ITC, and M&M.
By looking at these stocks through the lens of key technical factors, we aim to better understand their price movements, trends, and potential future performance.

Analysis for HDFC Bank - April 22, 2025

The data for HDFC Bank indicates that on the given trading day, the stock opened at 1935.0 and closed at 1961.7, showing a positive change of approximately 1.80% or 34.6 points from the previous close. The bank has a strong market position with a Market Cap of 15,011,320,692,736 rupees and a PE Ratio of 21.94, which is reflective of its robust performance in the financial services sector in India. The RSI value of 75.05 suggests that the stock may be overbought.

Relationship with Key Moving Averages
HDFC Bank's close price of 1961.70 is above its 50-day EMA of 1775.89 and 200-day EMA of 1707.79, indicating a strong bullish trend. Additionally, it is also above the 10-day EMA of 1868.75 and 20-day EMA of 1827.28, reinforcing the near-term strength.
Moving Averages Trend (MACD)
HDFC Bank's MACD is currently at 46.86, which is above the MACD Signal line of 32.03. This positive divergence suggests a bullish momentum in the stock's price. With an RSI of 75.05, it indicates an overbought condition, which might lead to a corrective phase in the near term.

RSI Analysis
The RSI (Relative Strength Index) for HDFC Bank is 75.05, which suggests that the stock is currently in an overbought condition. Typically, an RSI above 70 indicates that a stock may be overvalued and could be due for a price correction or pullback.

Analysis for Hindustan Unilever - April 22, 2025

Hindustan Unilever exhibited a positive performance, closing at 2398.70, which reflects a 2.03% increase from its previous close of 2351.00, with a significant points change of 47.70. The stock traded within a range from 2355.10 to 2406.00, supported by strong trading volume, indicating investor interest. The market cap stands at approximately 5.64 trillion INR, and the stock’s financials are solid with a PE ratio of 52.33 and an EPS of 45.84, positioning it robustly in the Consumer Defensive sector, specifically within Household & Personal Products, in India.

Relationship with Key Moving Averages
Hindustan Unilever closed at 2398.70, which is above its 10-day EMA (2341.30) and 50-day EMA (2298.78), indicating short to medium-term bullish momentum. However, it is slightly below the 200-day EMA (2415.43), suggesting potential resistance at longer-term levels.
Moving Averages Trend (MACD)
The MACD for Hindustan Unilever indicates bullish momentum, with a MACD value of 34.30, which is above the signal line at 19.65. This suggests potential upward movement in the stock price given the current positive trend.

RSI Analysis
The RSI for Hindustan Unilever is 69.83, which suggests that the stock is approaching the overbought threshold. This indicates potential slowing in upward momentum and a possibility of a price correction in the near term.

Analysis for ITC - April 22, 2025
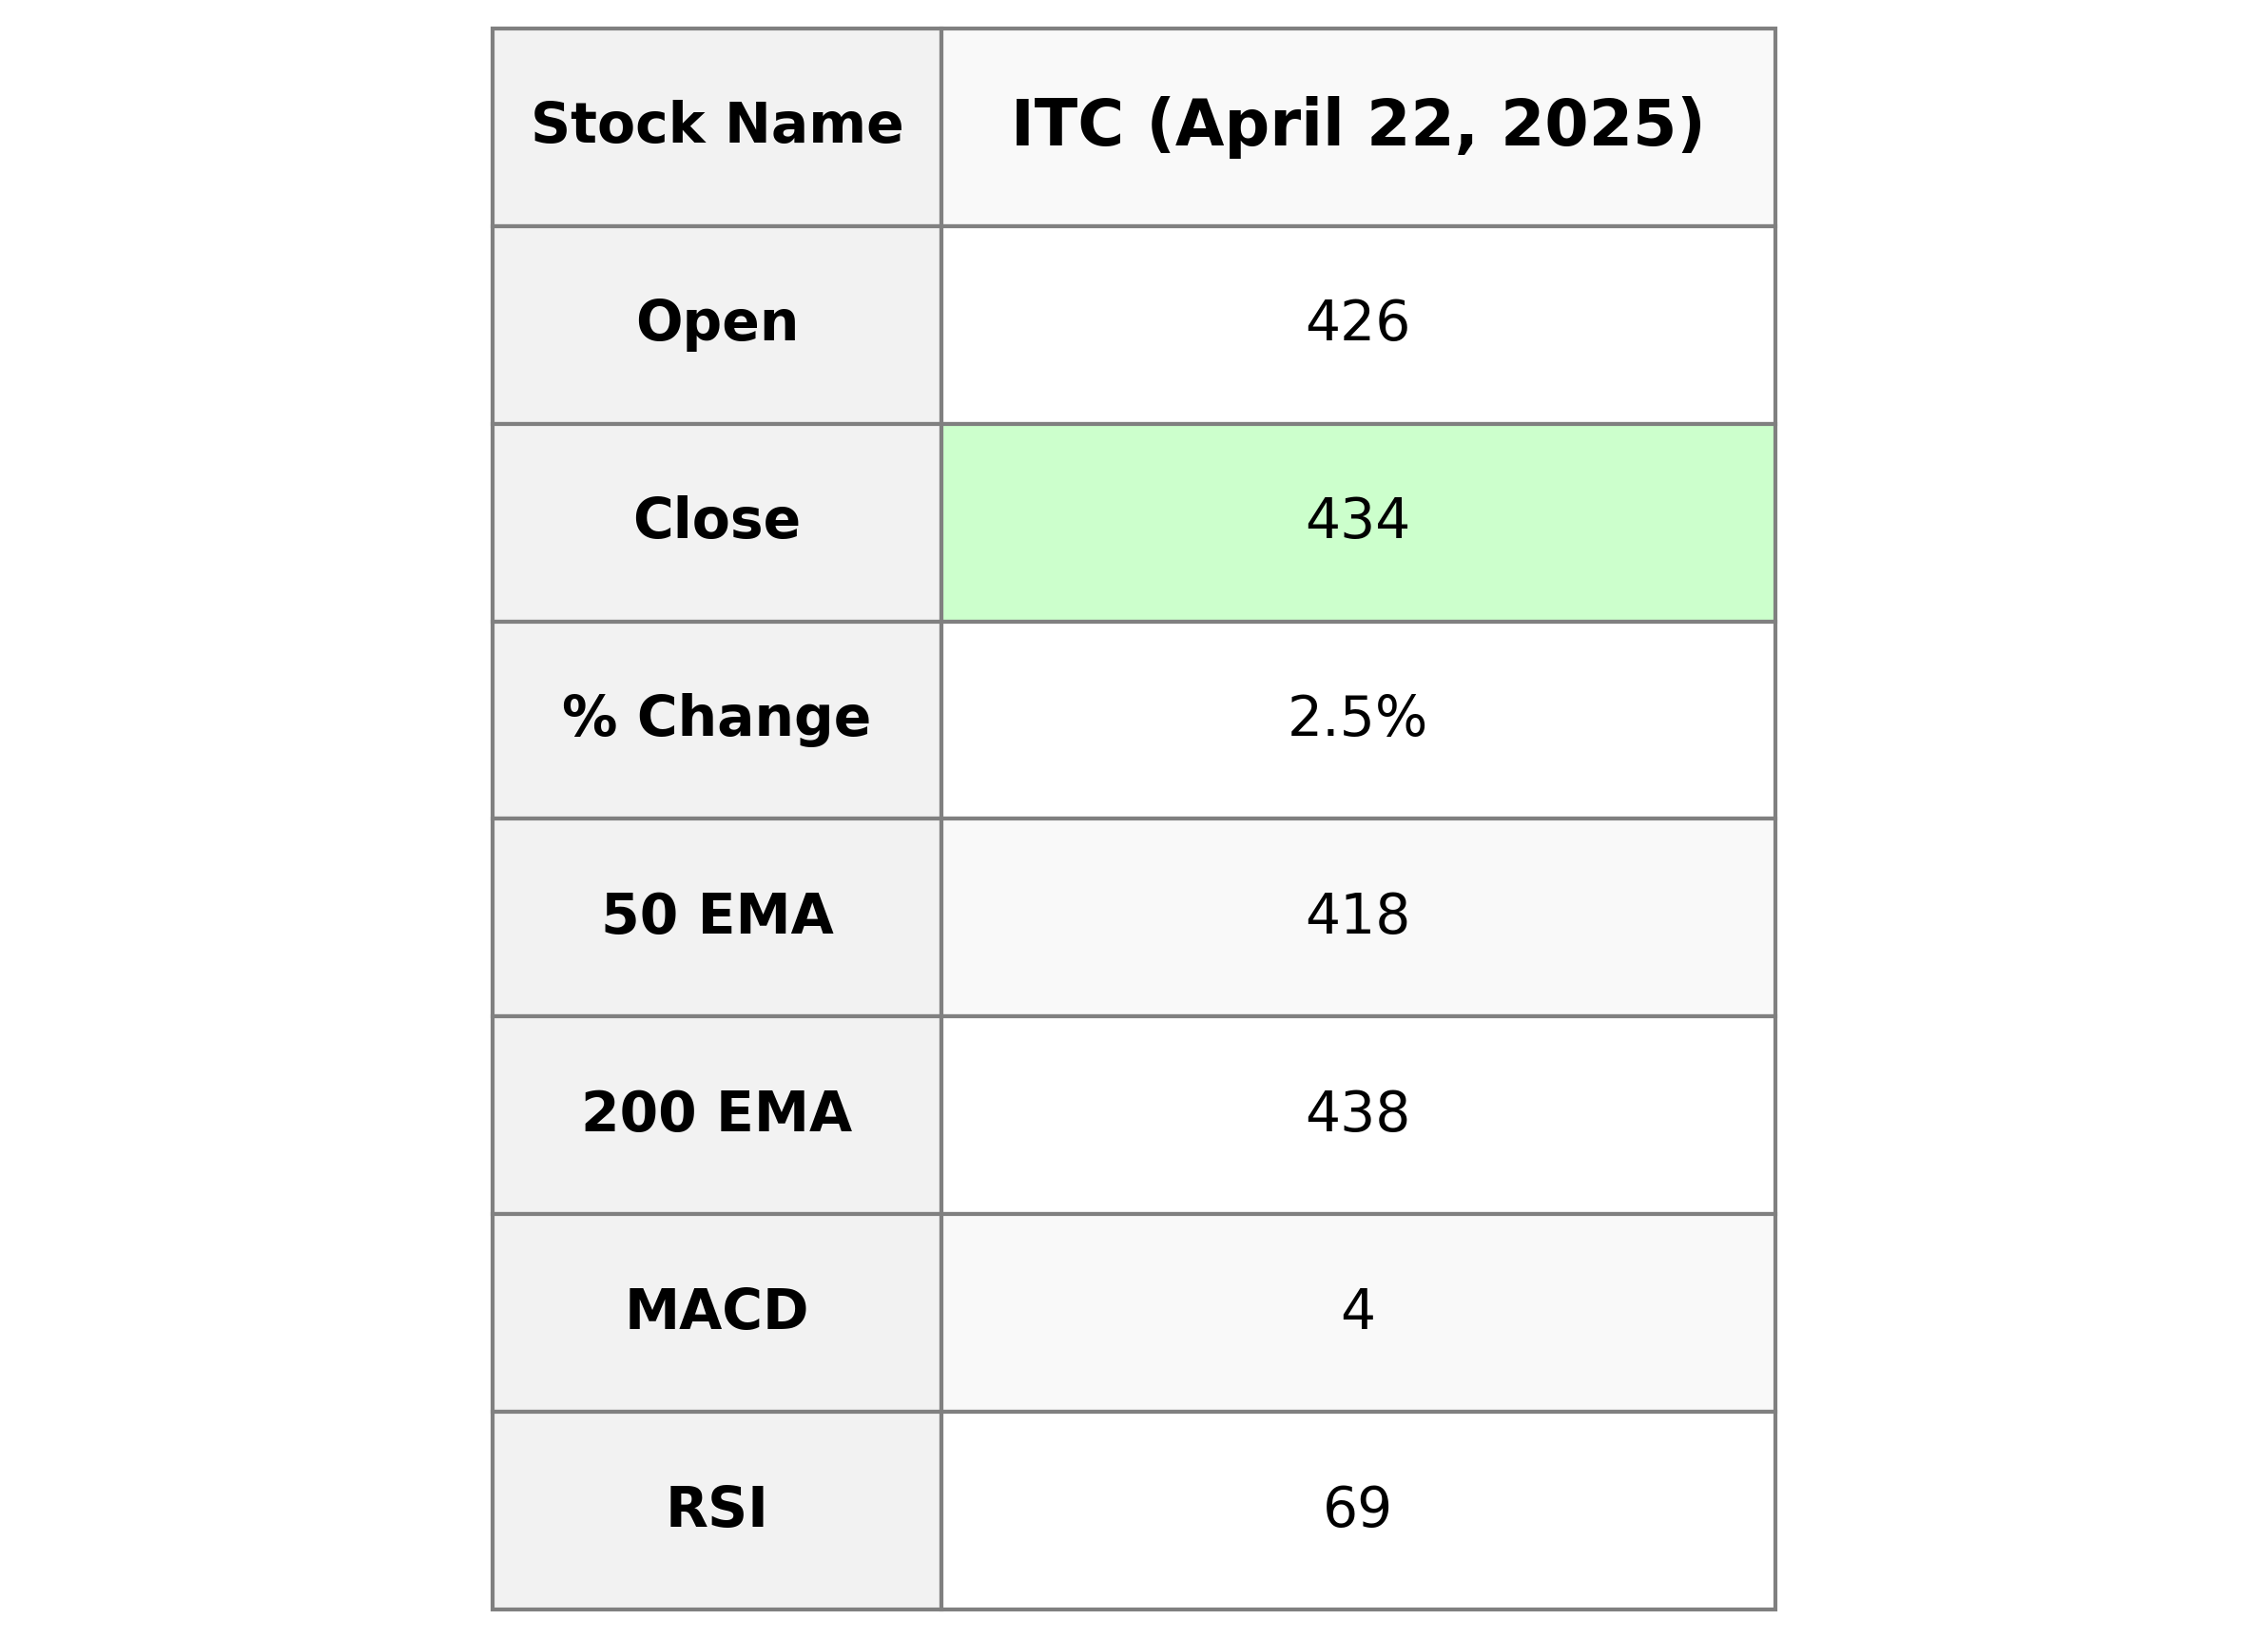
### Stock Performance Overview of ITC ITC exhibited a positive trading session with its closing price at 433.60, which is a 2.54% increase over the previous close of 422.85, marking a gain of 10.75 points. The stock's RSI is relatively high at 69.27, indicating a potentially overbought condition. Additionally, the MACD is 4.50 against a signal of 2.01, suggesting strong bullish momentum. The stock is part of the Consumer Defensive sector, specifically in the Tobacco industry in India.

Relationship with Key Moving Averages
ITC's current closing price of 433.60 is above its 50-day EMA of 417.73 and below its 200-day EMA of 438.05. This indicates a short-term bullish trend as ITC has recently crossed above its 50-day EMA, but it is still trading below its long-term 200-day EMA.
Moving Averages Trend (MACD)
The MACD for ITC is 4.50, with a signal line at 2.01, indicating a bullish momentum as the MACD line is above the signal line. This suggests potential upward movement in the stock price. Additionally, the RSI is at 69.27, nearing the overbought region, which may warrant cautious optimism.

RSI Analysis
ITC's RSI is 69.27, which indicates that it is approaching overbought territory, as RSI values above 70 are generally considered overbought. This suggests a potential for a price correction or consolidation in the near term.

Analysis for Mahindra & Mahindra - April 22, 2025

Mahindra & Mahindra experienced a positive performance with the stock closing at 2817.10, marking a 1.92% increase from the previous close, and a volume of 3,193,489 shares traded. The company, part of India's Consumer Cyclical sector in the Auto Manufacturers industry, has a market cap of 3,379 billion INR, a PE ratio of 25.48, and an EPS of 110.56, indicating strong market positioning and earnings potential.

Relationship with Key Moving Averages
Based on the given data, Mahindra & Mahindra's current stock price of 2817.10 is above its 50-day EMA of 2742.97 and 200-day EMA of 2740.66, indicating a bullish trend in the longer term. However, it is significantly above its 10-day EMA of 2678.95 and 20-day EMA of 2674.80, suggesting recent upward momentum.
Moving Averages Trend (MACD)
MACD Analysis for Mahindra & Mahindra The MACD for Mahindra & Mahindra is -12.40, which is above the MACD Signal Line of -39.86. This suggests a bullish sentiment as the MACD line is moving closer to crossing above the signal line, indicating potential upward momentum.

RSI Analysis
The RSI value for Mahindra & Mahindra is 61.64. This indicates a moderately strong market position, suggesting the stock is neither overbought nor oversold. Investors may interpret this as a neutral to slightly bullish signal.

Up Next
Top 5 Nifty 50 gainers today – April 22, 2025: Biggest stock moves

India revamps tax regime in 2025, new I-T Act to take effect from April 1

New Zealand commits USD 20 bn investment in India under FTA in 15 yrs; on lines of EFTA pact

India, New Zealand conclude FTA talks; pact to offer duty-free access, USD 20 bn FDI

FTA with New Zealand to significantly deepen bilateral economic engagement: Govt

Rupee breaches 91-mark against US dollar for first time in intra-day trade

More videos

Microsoft commits USD 17.5 billion investment in India: CEO Satya Nadella

CBI books Anil Ambani's son, Reliance Home Finance Ltd. in Rs 228 crore bank fraud case

RBI raises FY26 GDP growth projection to 7.3 pc

RBI trims policy interest rate by 25bps to 5.25pc, loans to get cheaper

Rupee slumps to all-time low of 90.25 against US dollar in intra-day trade

Reliance completes merger of Star Television Productions with Jiostar

India to lead emerging market growth with 7pc GDP rise in 2025: Moody’s

Nifty hits record high after 14 months; Sensex nears all-time peak

Reliance stops Russian oil use at its only-for-export refinery to comply with EU sanctions

ED attaches fresh assets worth over Rs 1,400 cr in case against Anil Ambani's Reliance Group