


Highlights
Latest news

Putin hails Ukraine gains, threatens more, in annual press conference

OnePlus Pad Go 2 Review: No drama, just a good tablet

Parliament Moment: Priyanka Gandhi shares tea with Rajnath Singh. PM Modi and Om Birla

Cold wave deepens in Kashmir as Chillai-Kalan nears, temperatures dip below freezing

Pakistan accuses India of attempting to undermine Indus treaty

Vande Mataram discussion in UP legislature to mark 150th anniversary: Yogi Adityanath

Ashes 2025: Travis Head slams unbeaten 142 to crush England's Ashes hopes

Tipra Motha youth wing protests Bangladesh leader's anti-India remarks in Agartala
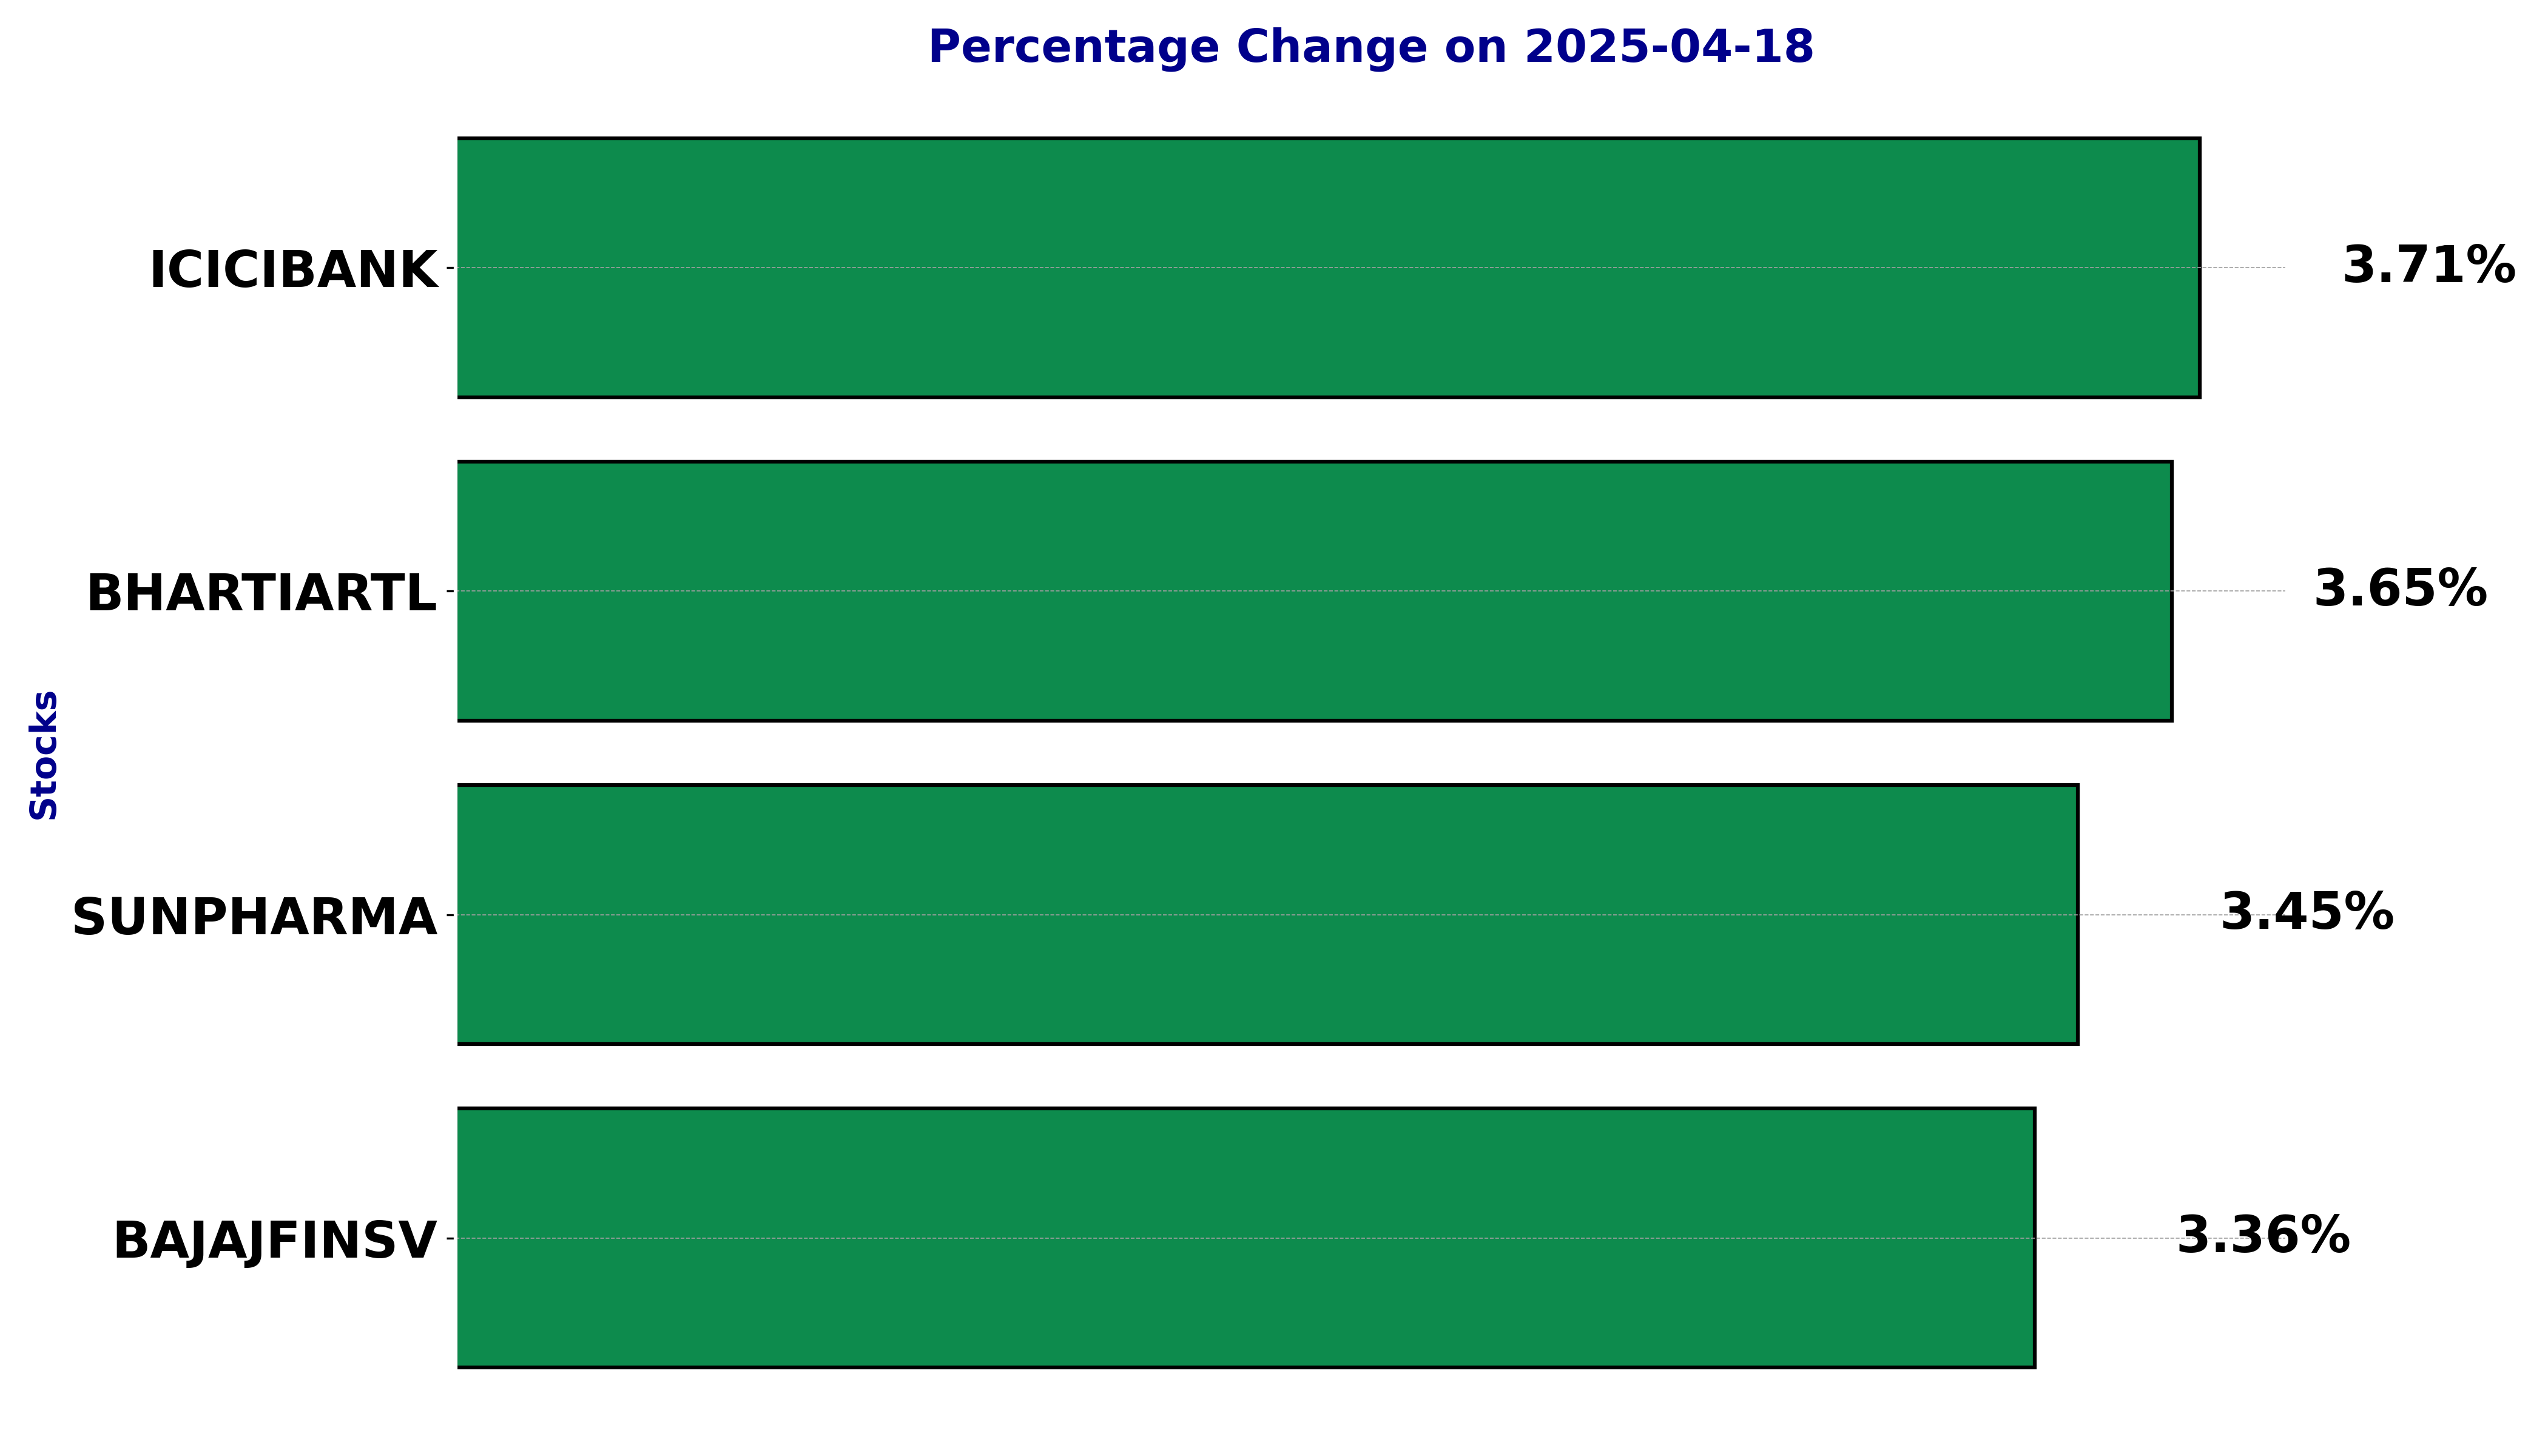
NSE Nifty 50 Top gainers: What are the 5 Biggest Stock gainers Today April 18, 2025


In this article, we will explore the technical indicators of some of the high-performing stocks on the Indian stock market, including BAJAJFINSV, BHARTIARTL, ICICIBANK, and SUNPHARMA.
By looking at these stocks through the lens of key technical factors, we aim to better understand their price movements, trends, and potential future performance.
Analysis for Bajaj Finserv - April 18, 2025

Bajaj Finserv opened at 1961.5 and closed at 2035.3, marking a positive change of 3.36% or 66.1 points. With a volume of 2,104,540, its performance surpassed both the 50-EMA and 200-EMA, as well as the 10 and 20 EMAs. The company operates within the financial services sector in India, showing a PE ratio of 38.32 and an EPS of 53.12. With an RSI of 66.47, Bajaj Finserv appears to be performing strongly, further supported by a MACD of 32.42.
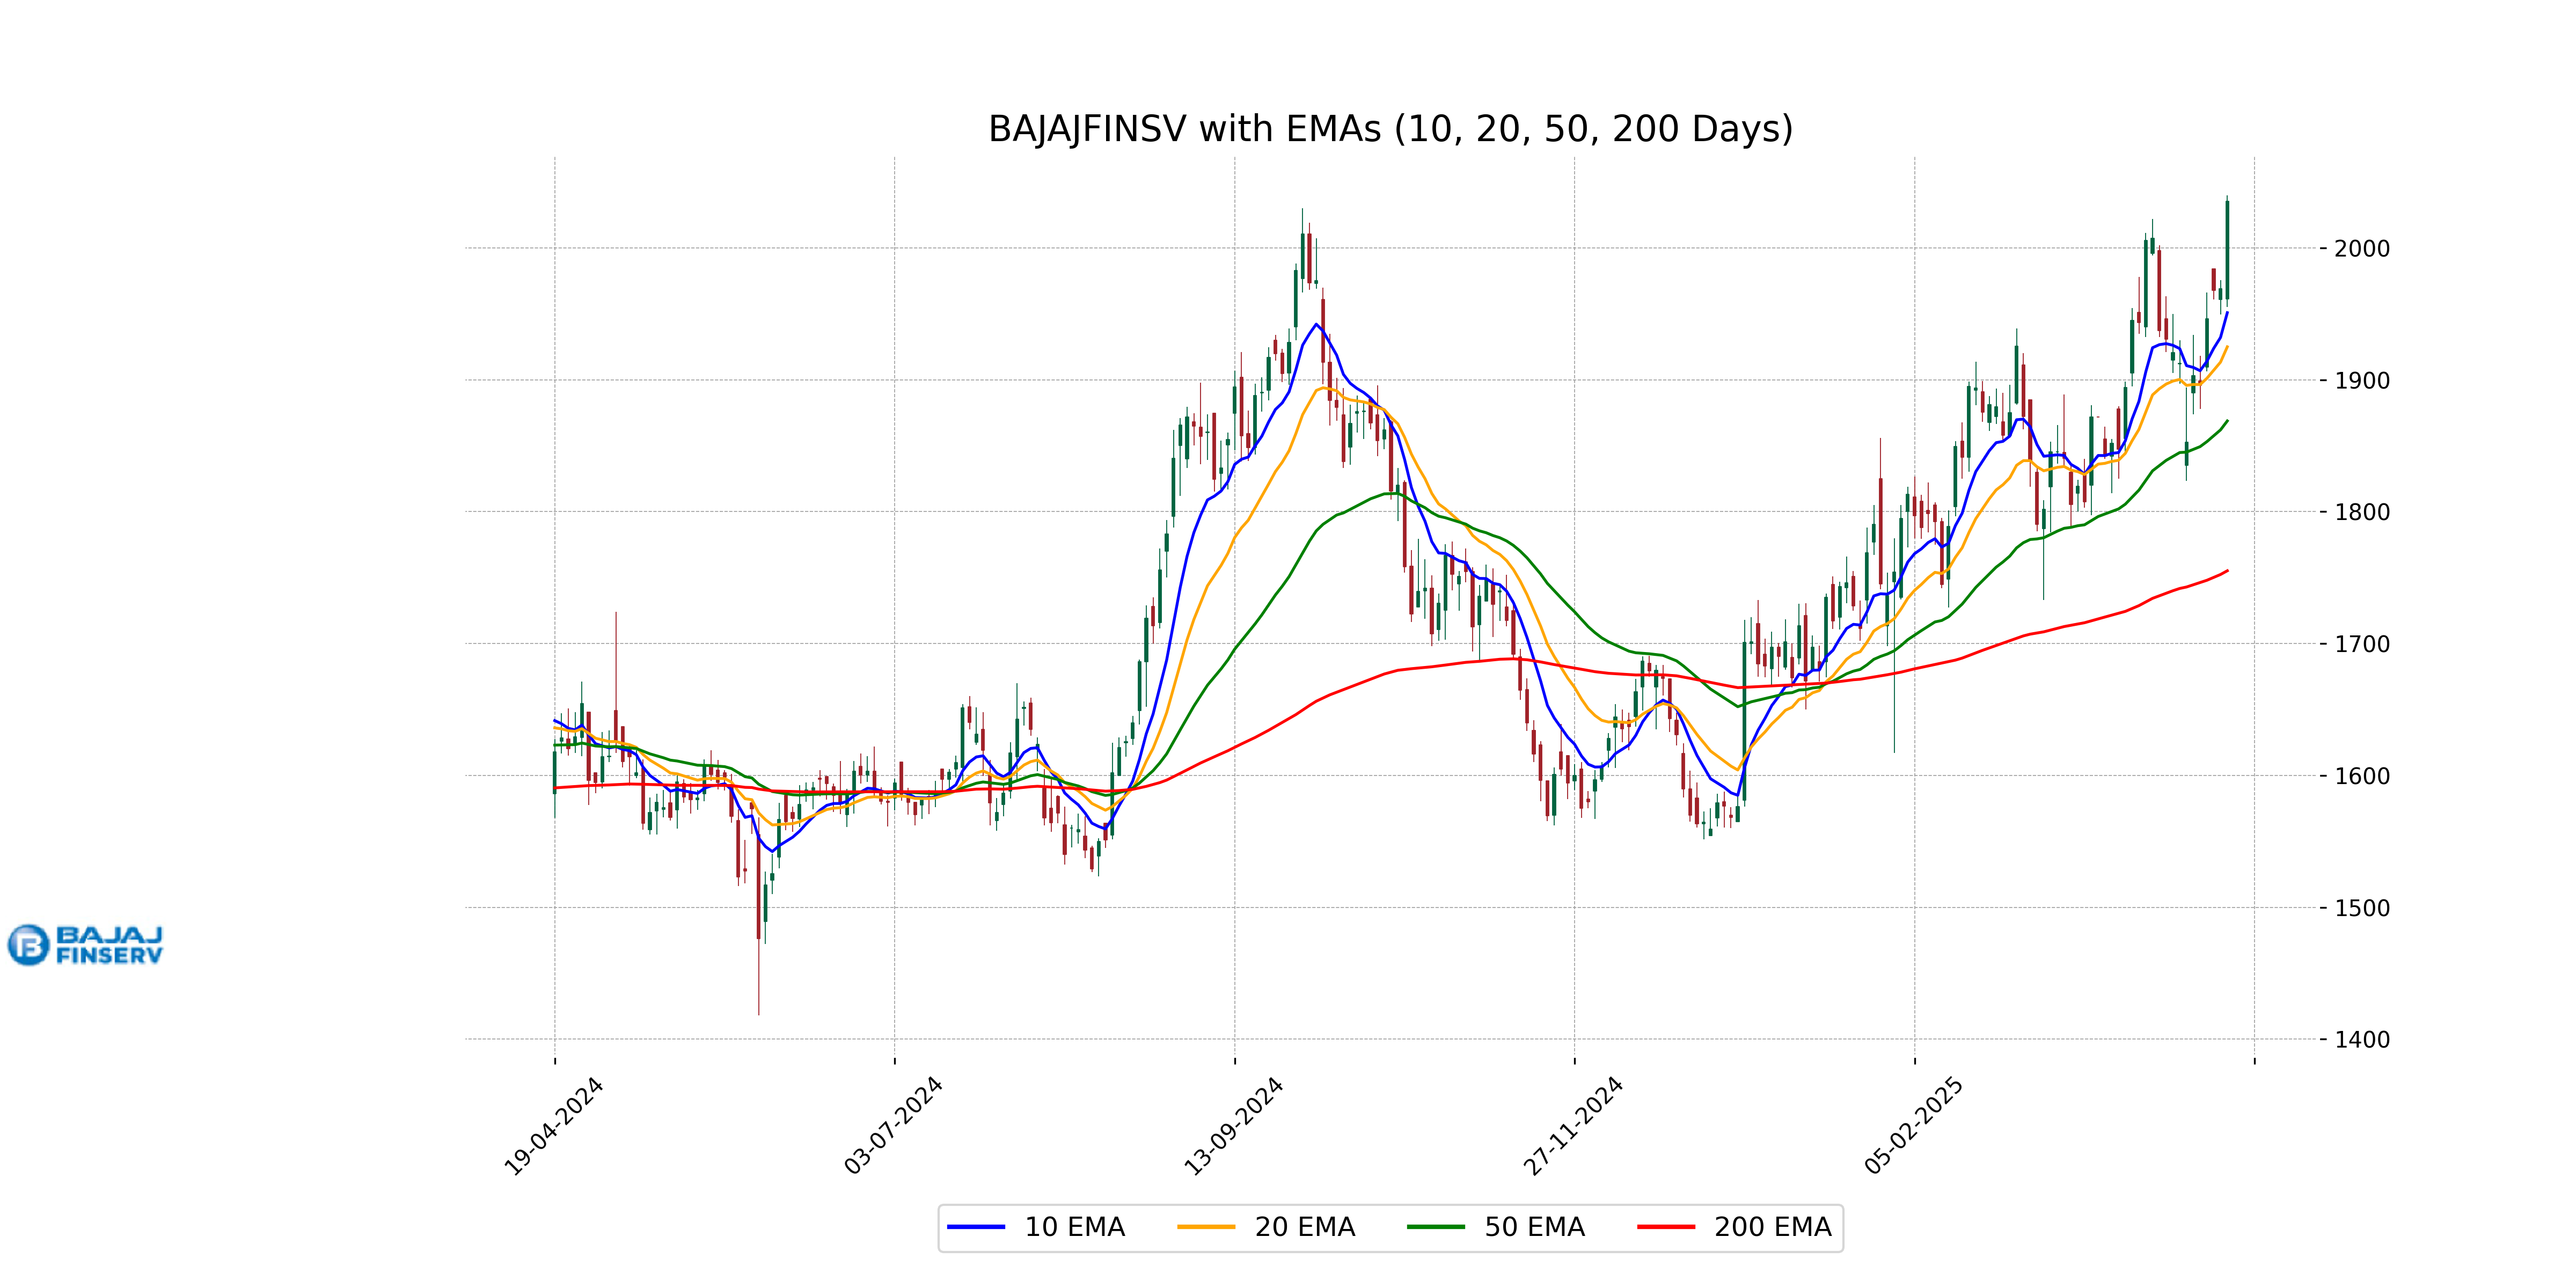
Relationship with Key Moving Averages
Bajaj Finserv's current close price of 2035.30 is above its 10-day, 20-day, 50-day, and 200-day exponential moving averages (EMAs), which are 1950.86, 1924.98, 1868.78, and 1755.16 respectively. This indicates a strong upward momentum in the stock price, well above all the key moving averages.
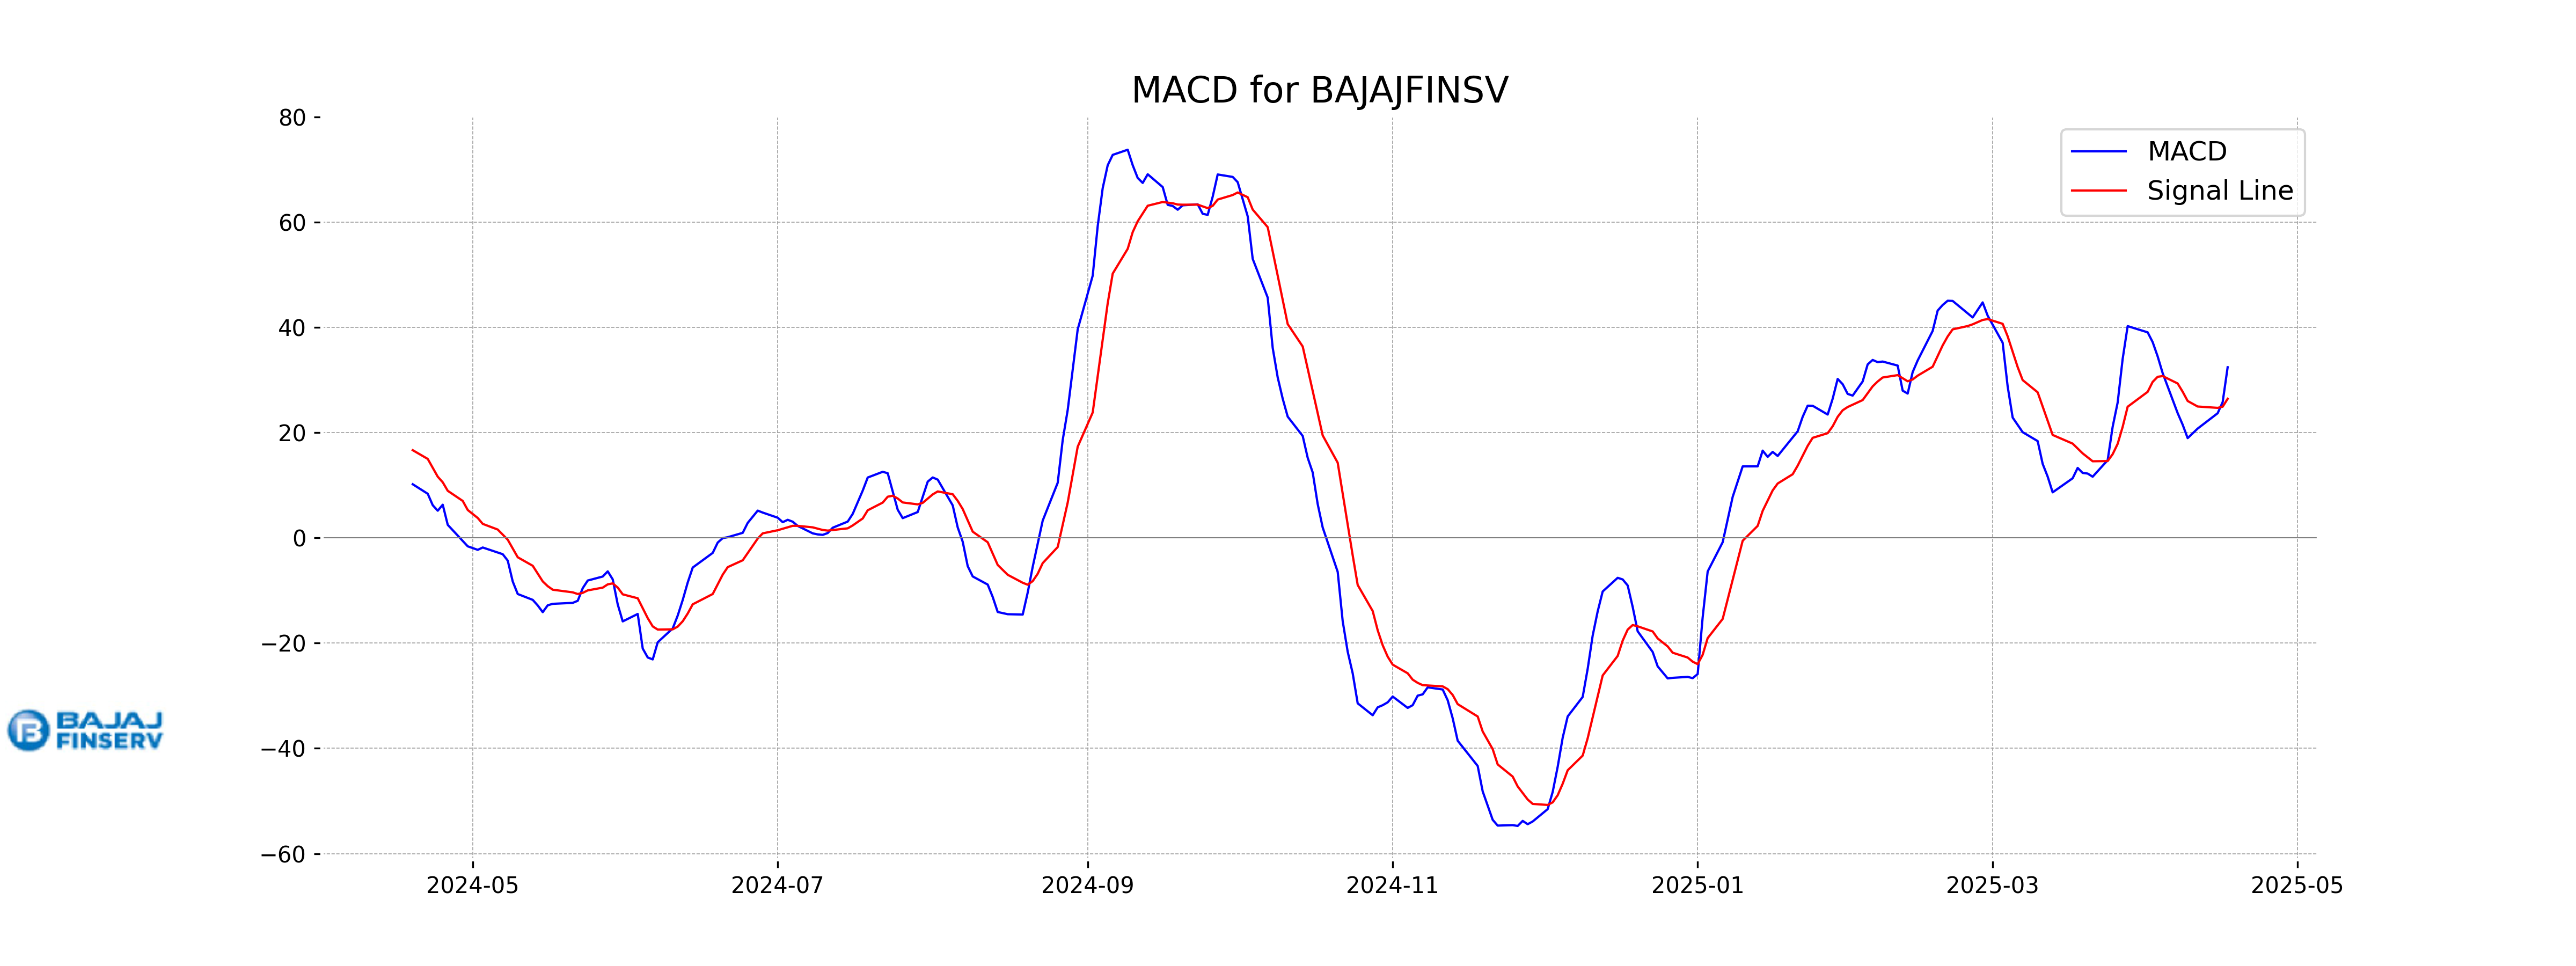
Moving Averages Trend (MACD)
Bajaj Finserv MACD Analysis: The MACD line is at 32.42, while the signal line is at 26.42, indicating a bullish crossover. This suggests upward momentum in the stock's price, supported by a positive MACD histogram.
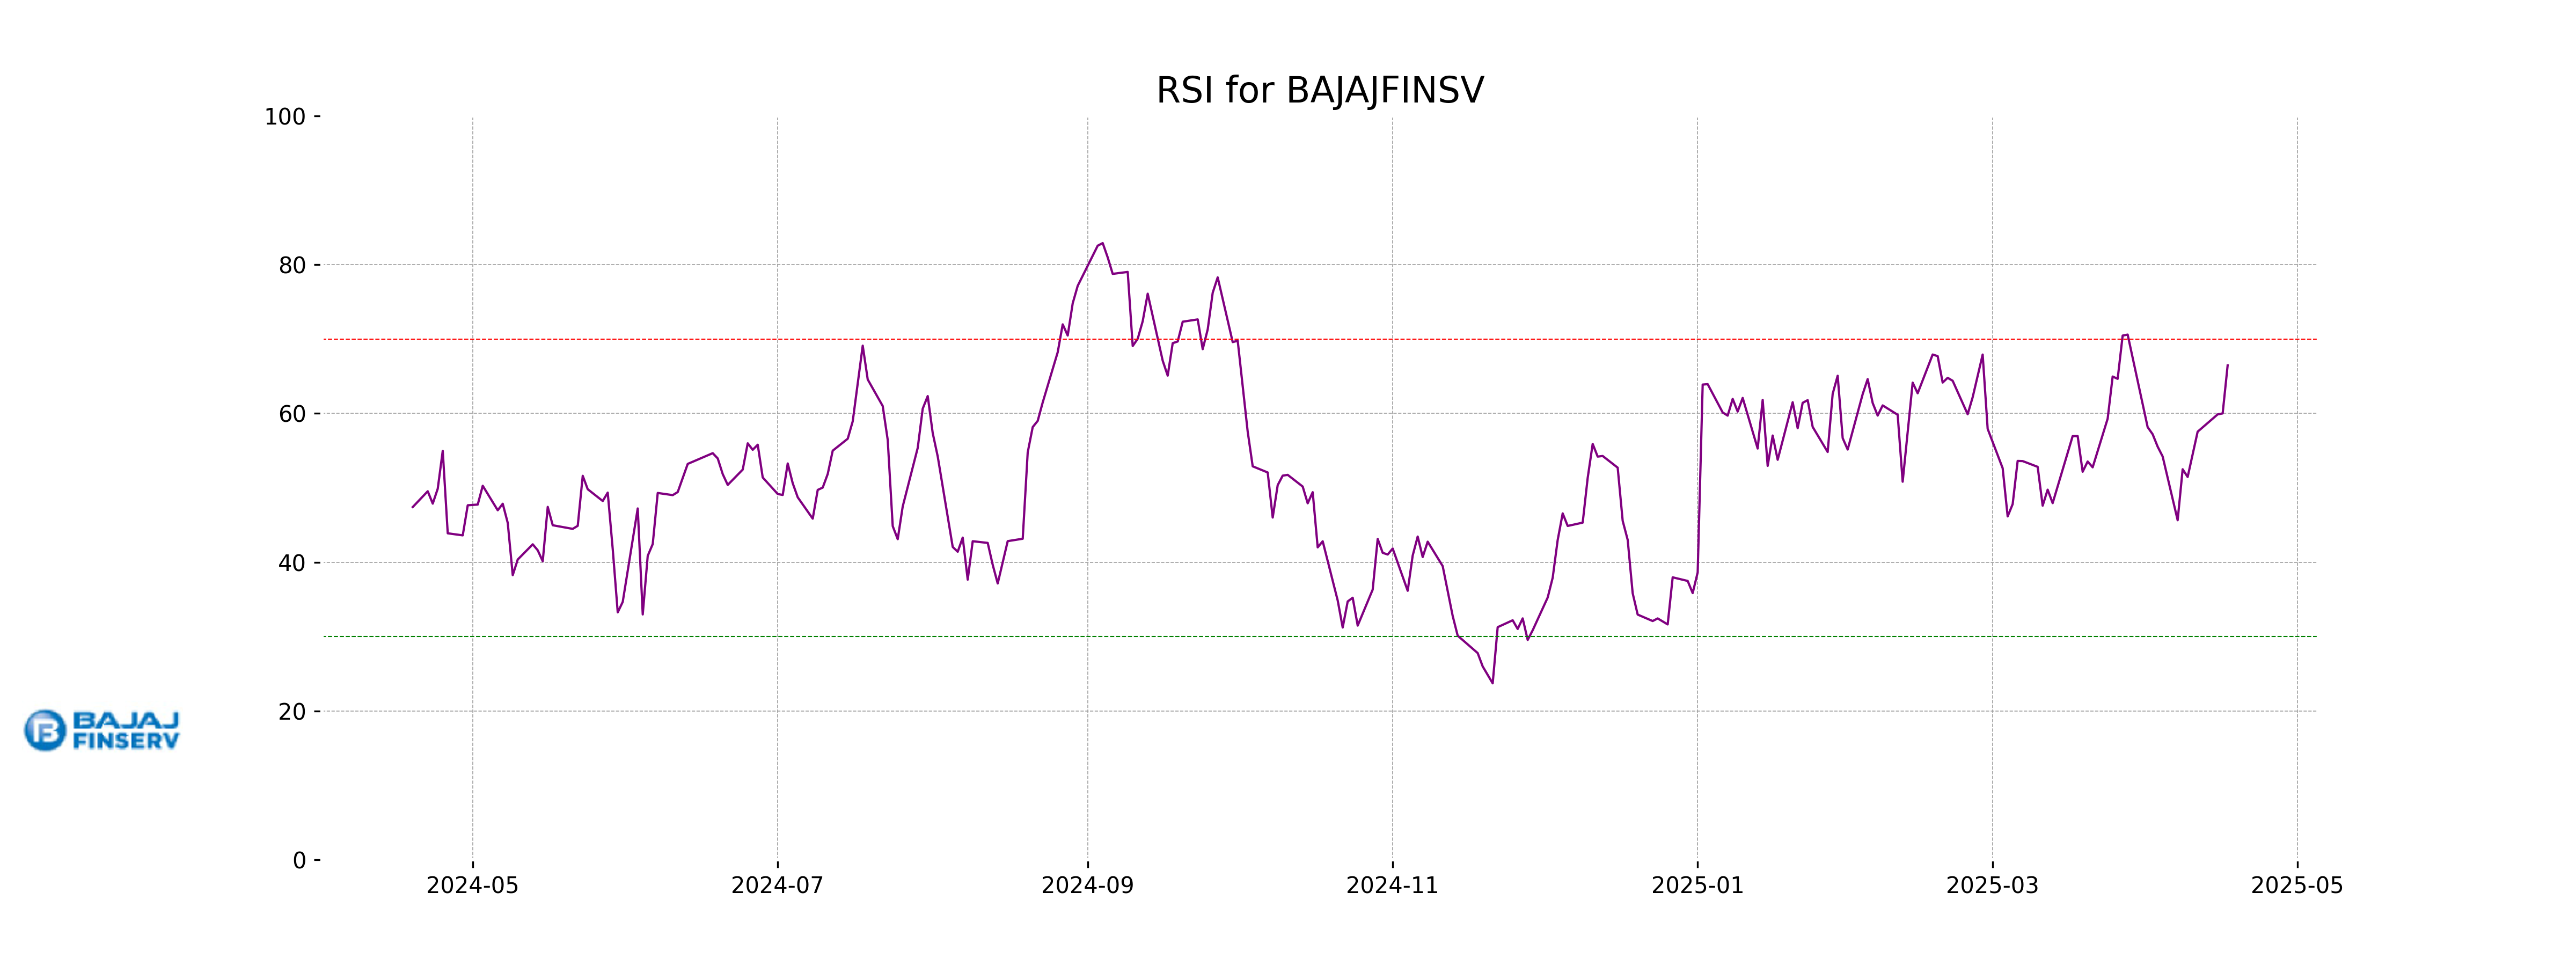
RSI Analysis
Bajaj Finserv's Relative Strength Index (RSI) is at 66.47, which suggests that the stock is nearing the overbought territory typically considered to be above 70. Investors should watch for potential pullbacks or consolidations as the RSI approaches these higher levels.
Analysis for Bharti Airtel - April 18, 2025
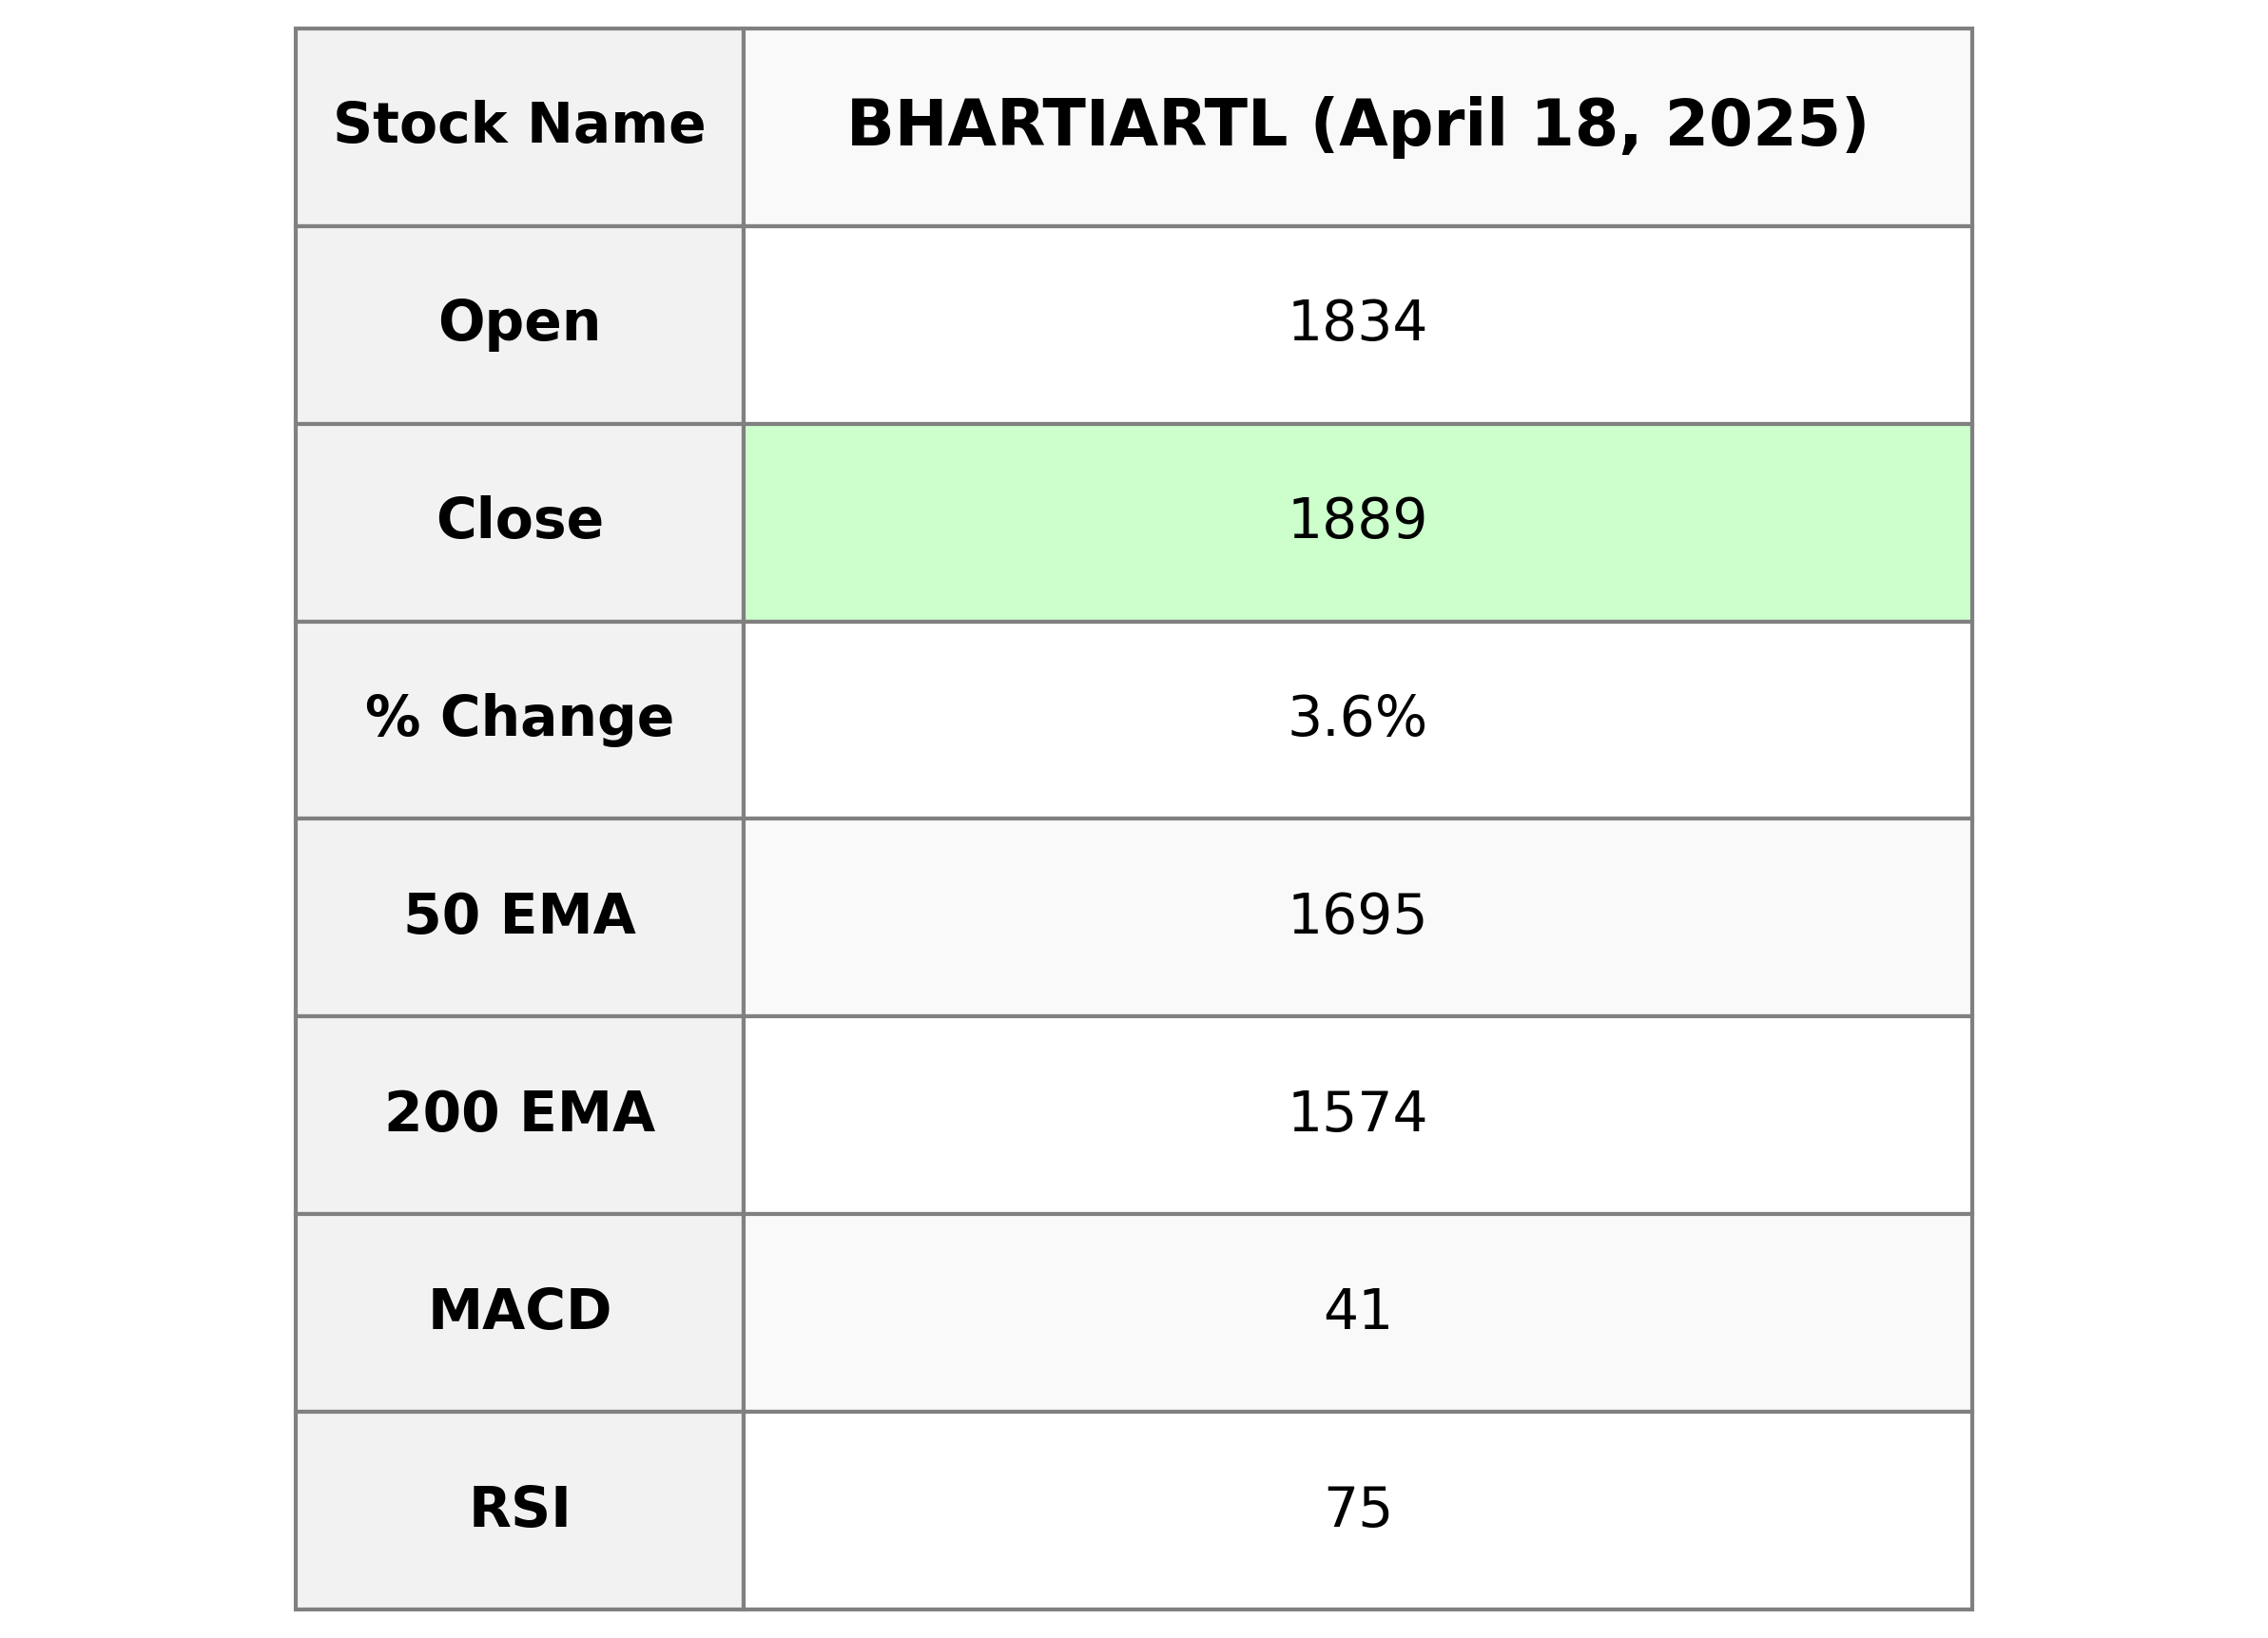
Bharti Airtel experienced a notable performance, with its stock closing at 1889.10 INR, marking a 3.65% increase from its previous close. The stock displayed strength with a high RSI of 74.79 and a MACD indicating positive momentum above its signal line. Additionally, it showed a solid market presence with a Market Cap of 11,323.70 billion INR, operating within the robust Telecom Services industry in India.
Relationship with Key Moving Averages
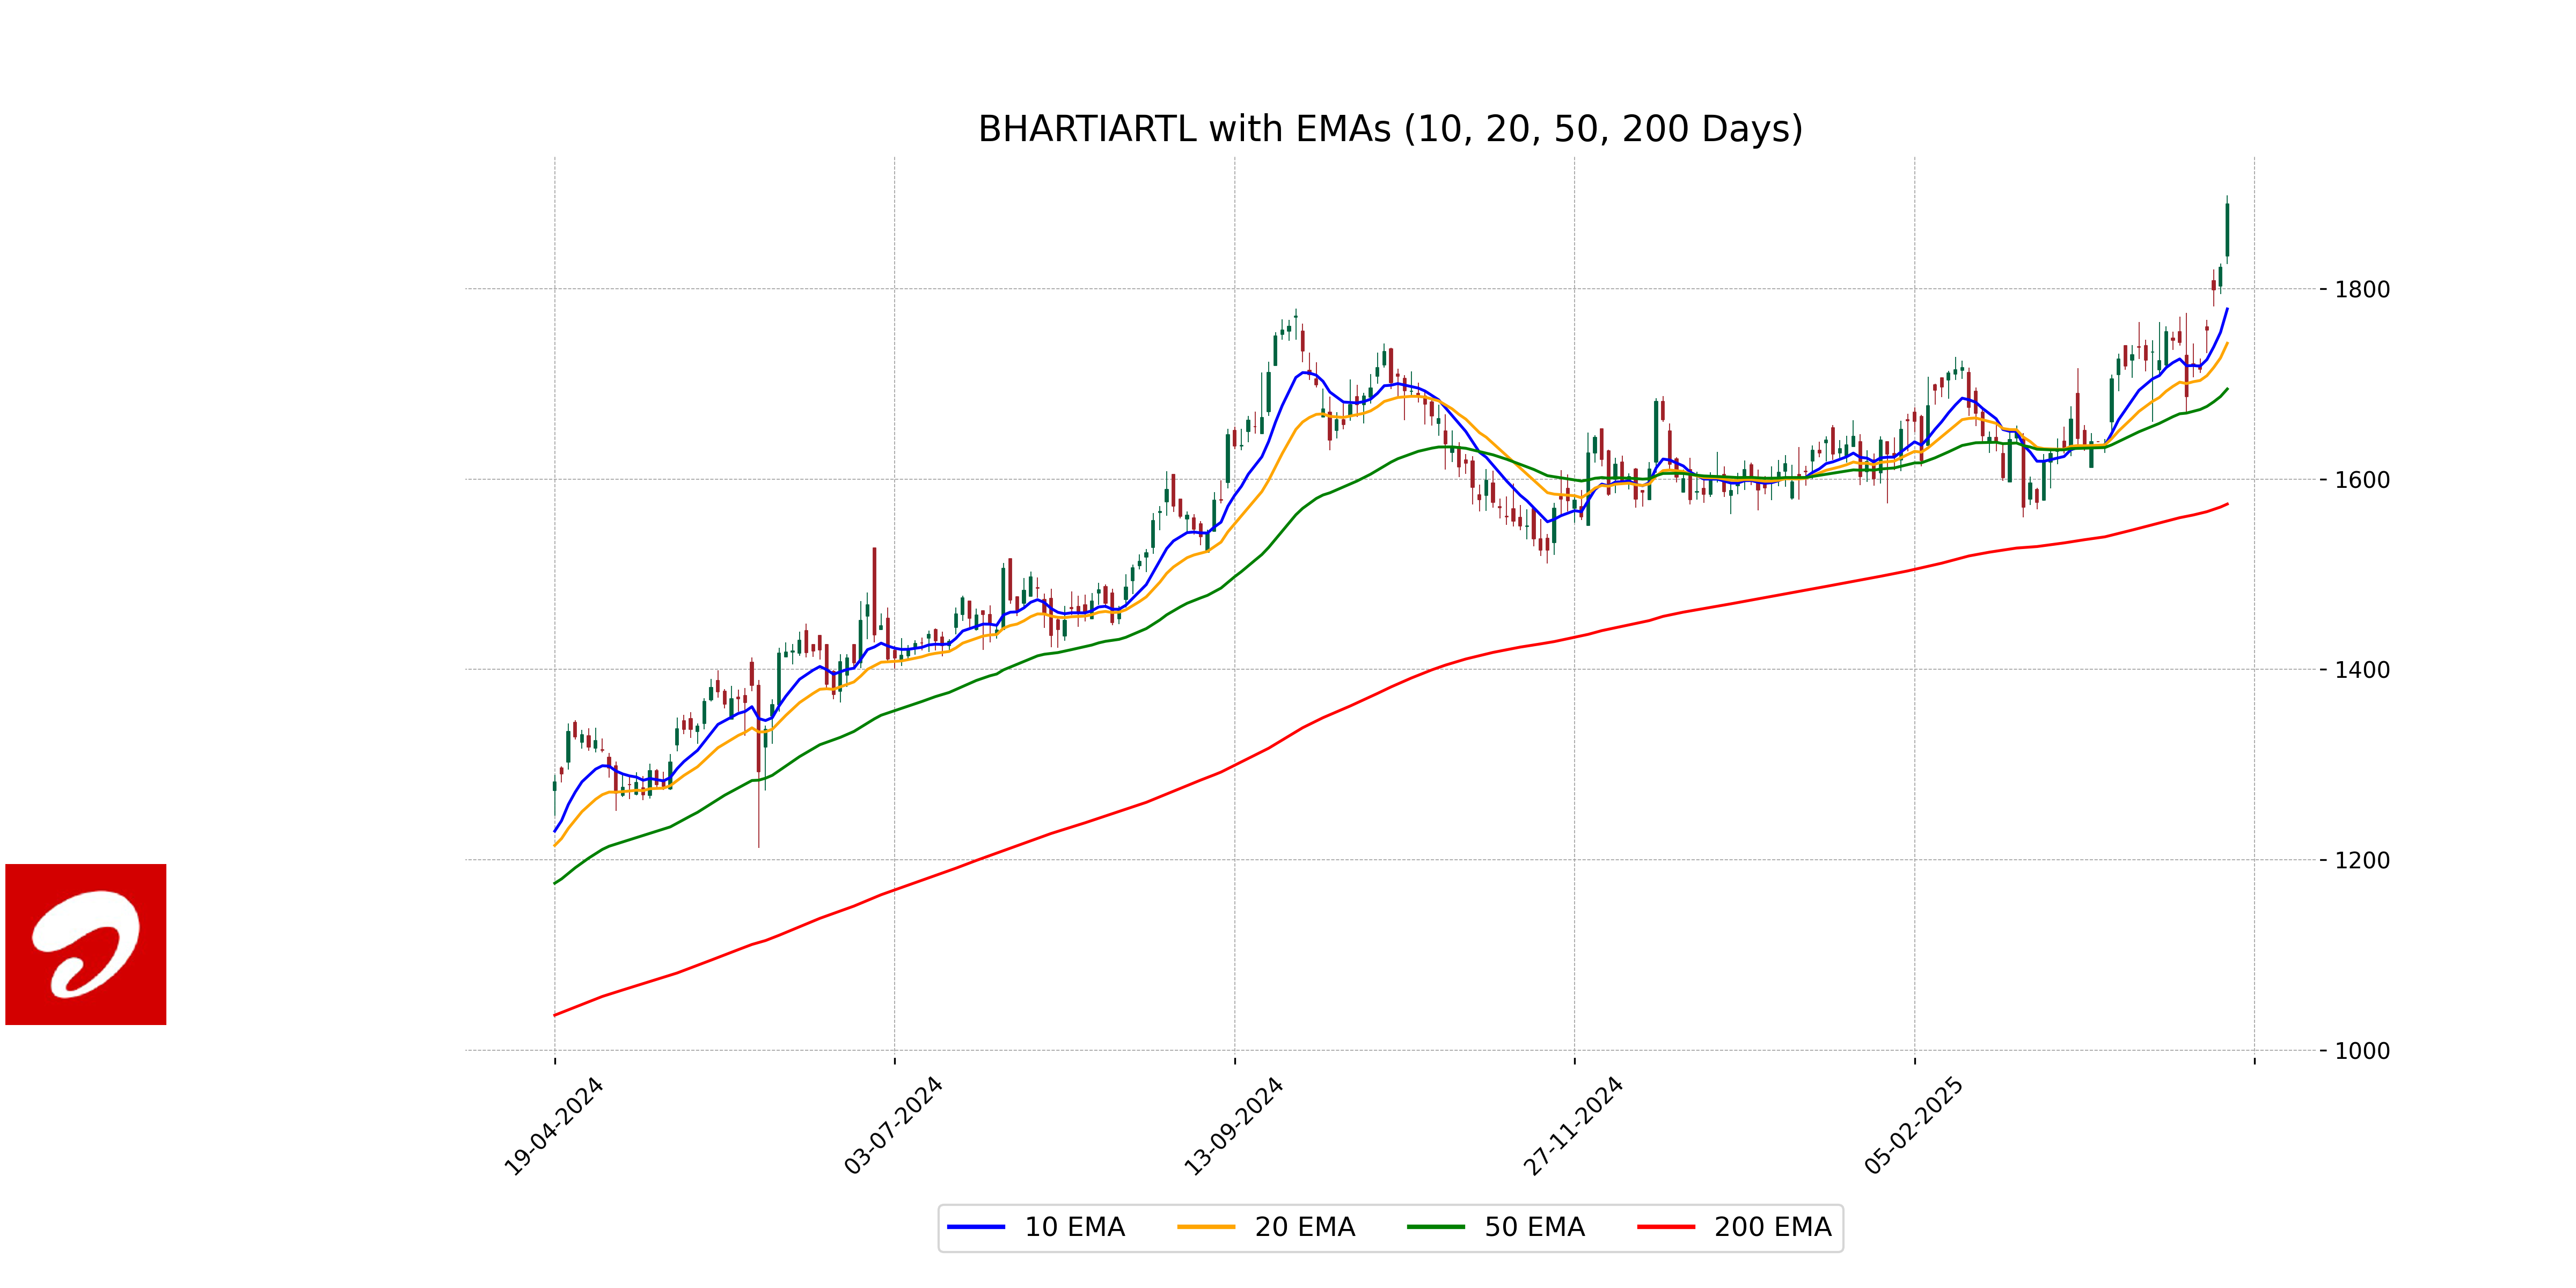
Bharti Airtel's closing price of 1889.10 is significantly above its 50 EMA (1694.56) and 200 EMA (1573.74), indicating a strong upward trend. Additionally, the price is also above the 10 EMA (1778.59) and 20 EMA (1742.59), reinforcing its bullish momentum.
Moving Averages Trend (MACD)
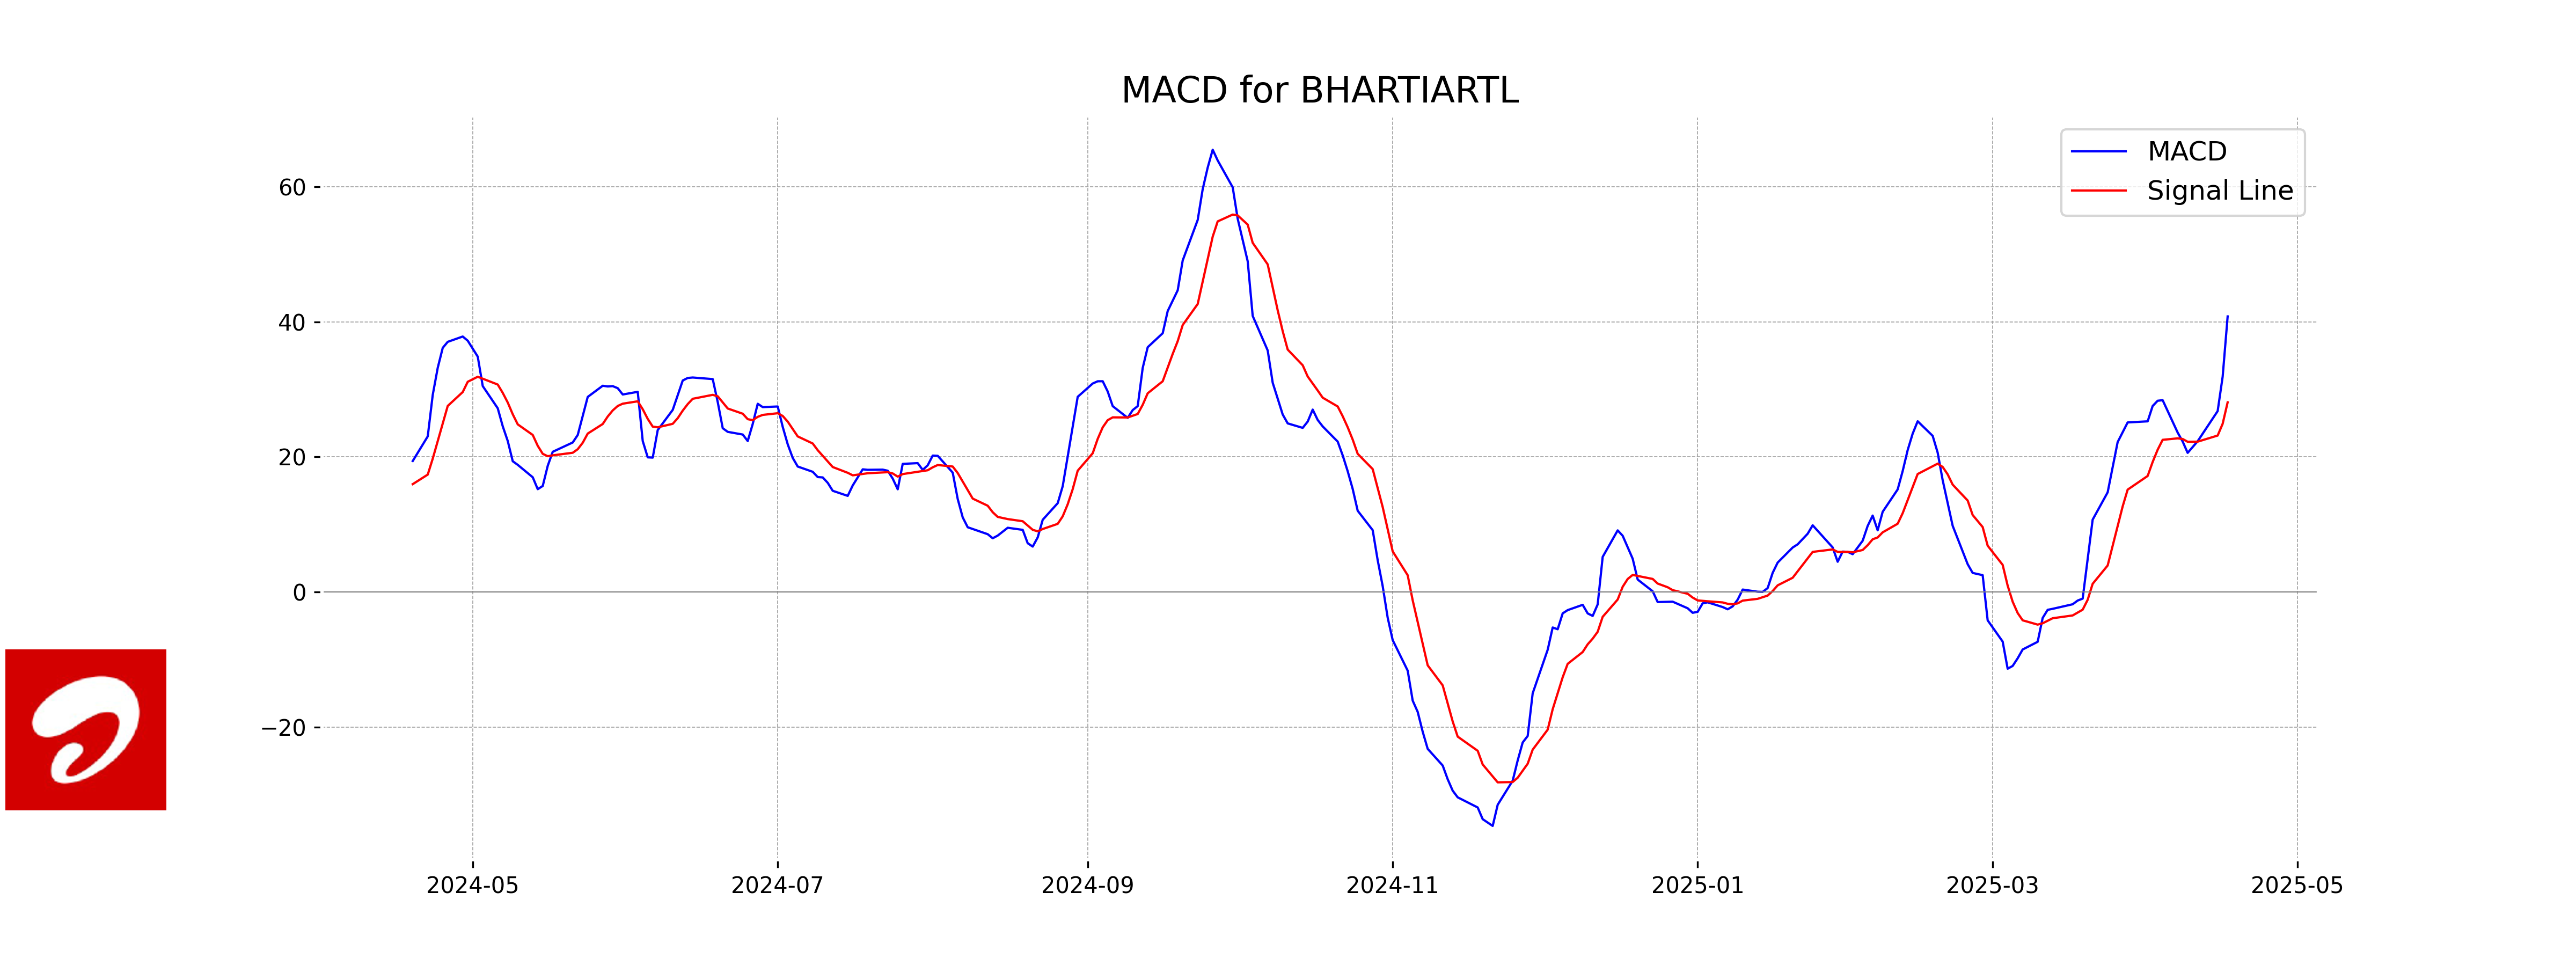
MACD Analysis for Bharti Airtel: The MACD line for Bharti Airtel is at 40.80, which is above the MACD Signal line at 28.08. This suggests a bullish momentum as the stock experiences an upward trend, indicating increasing buying interest.
RSI Analysis
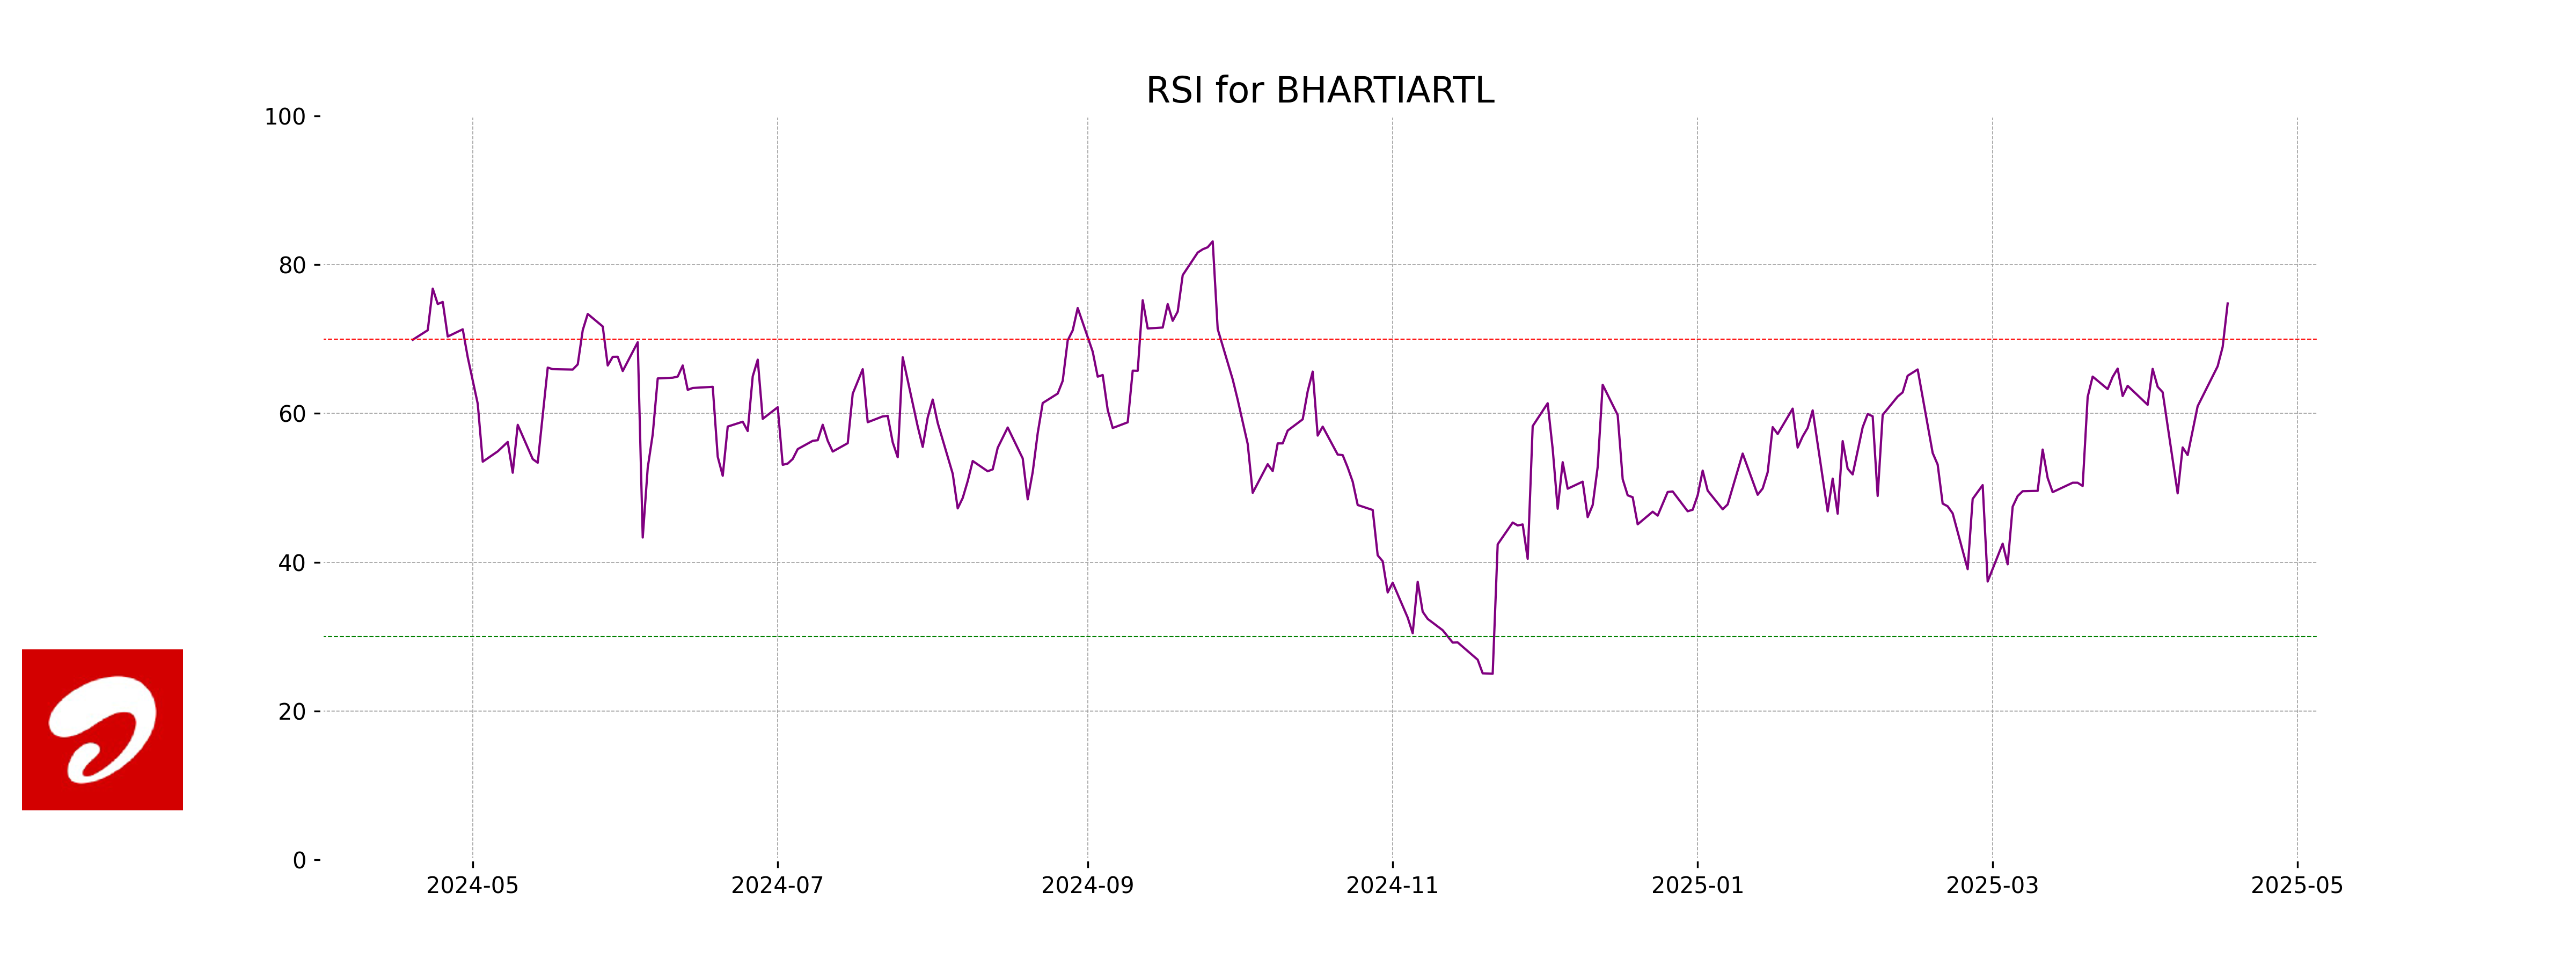
The RSI (Relative Strength Index) for Bharti Airtel is 74.79, indicating that the stock is currently in an overbought condition. This suggests that the stock might be due for a price correction or consolidation. Investors should be cautious and consider this metric along with other indicators before making trading decisions.
Analysis for ICICI Bank - April 18, 2025
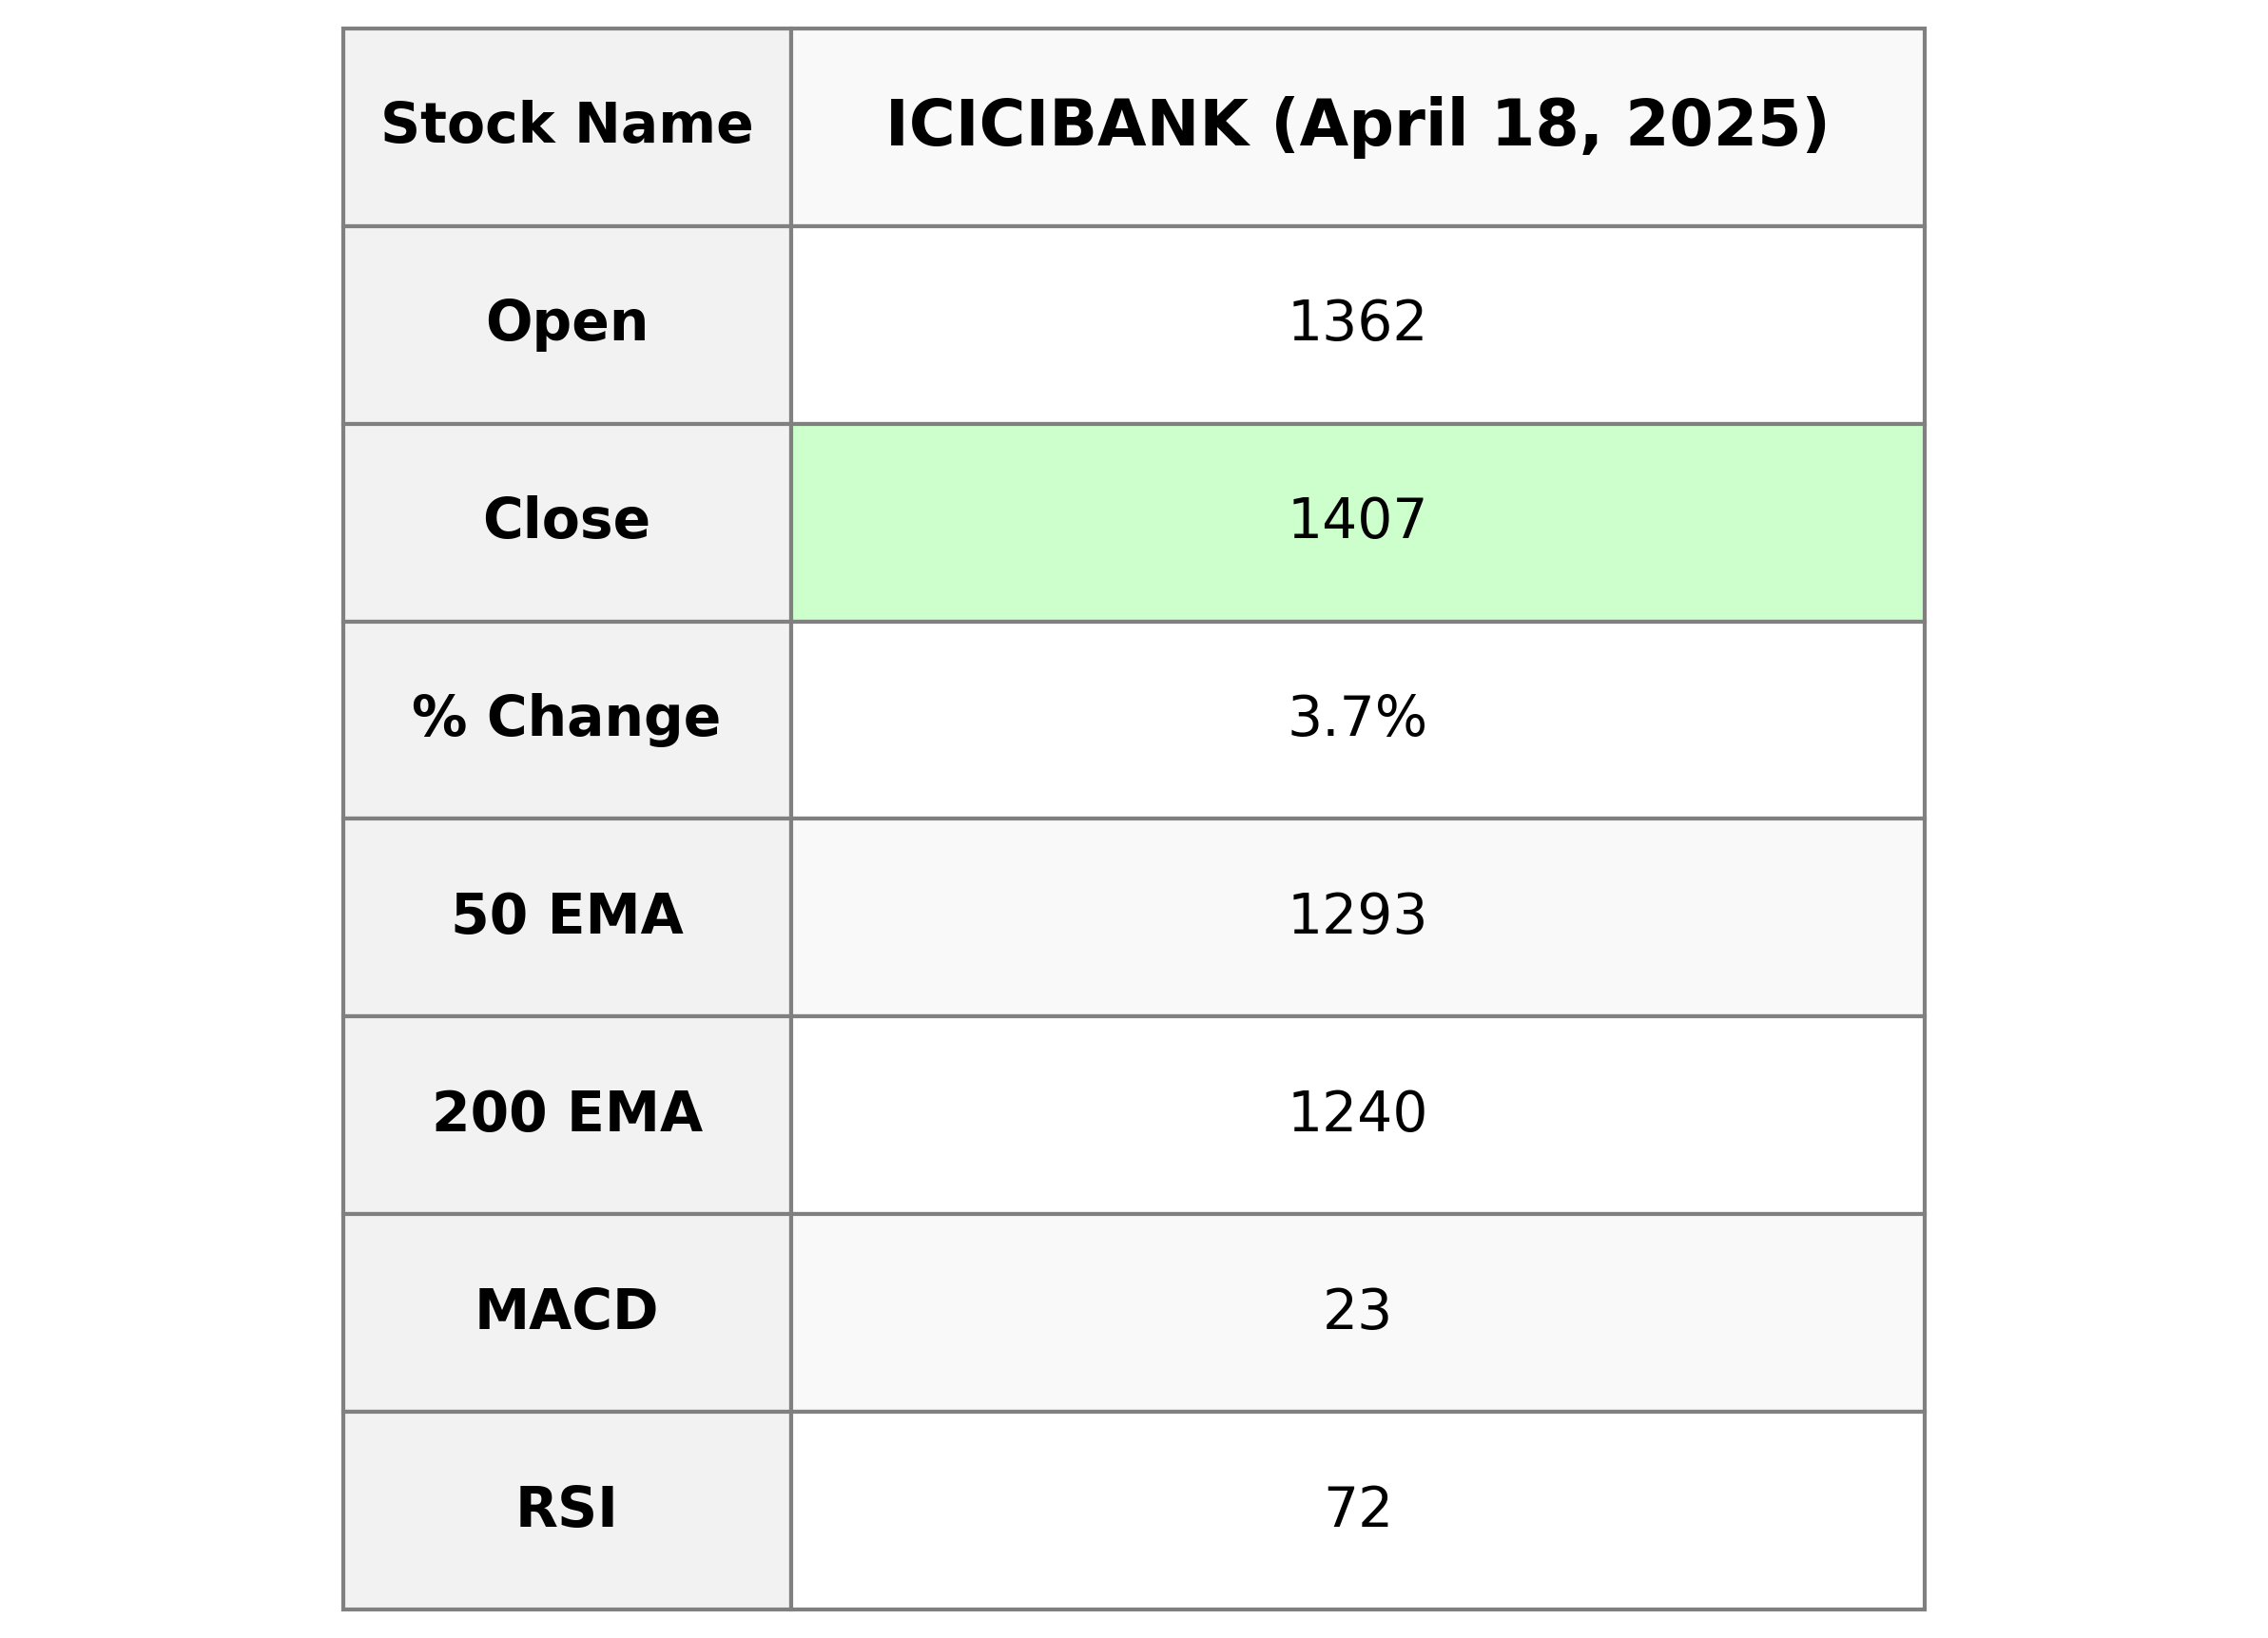
ICICI Bank showed a strong performance with a close of 1406.70, marking a 3.71% increase from the previous close. The stock traded with a high volume, and its RSI of 72.06 indicates overbought conditions. The bank's financial metrics include a PE ratio of 20.49 and an impressive market cap.
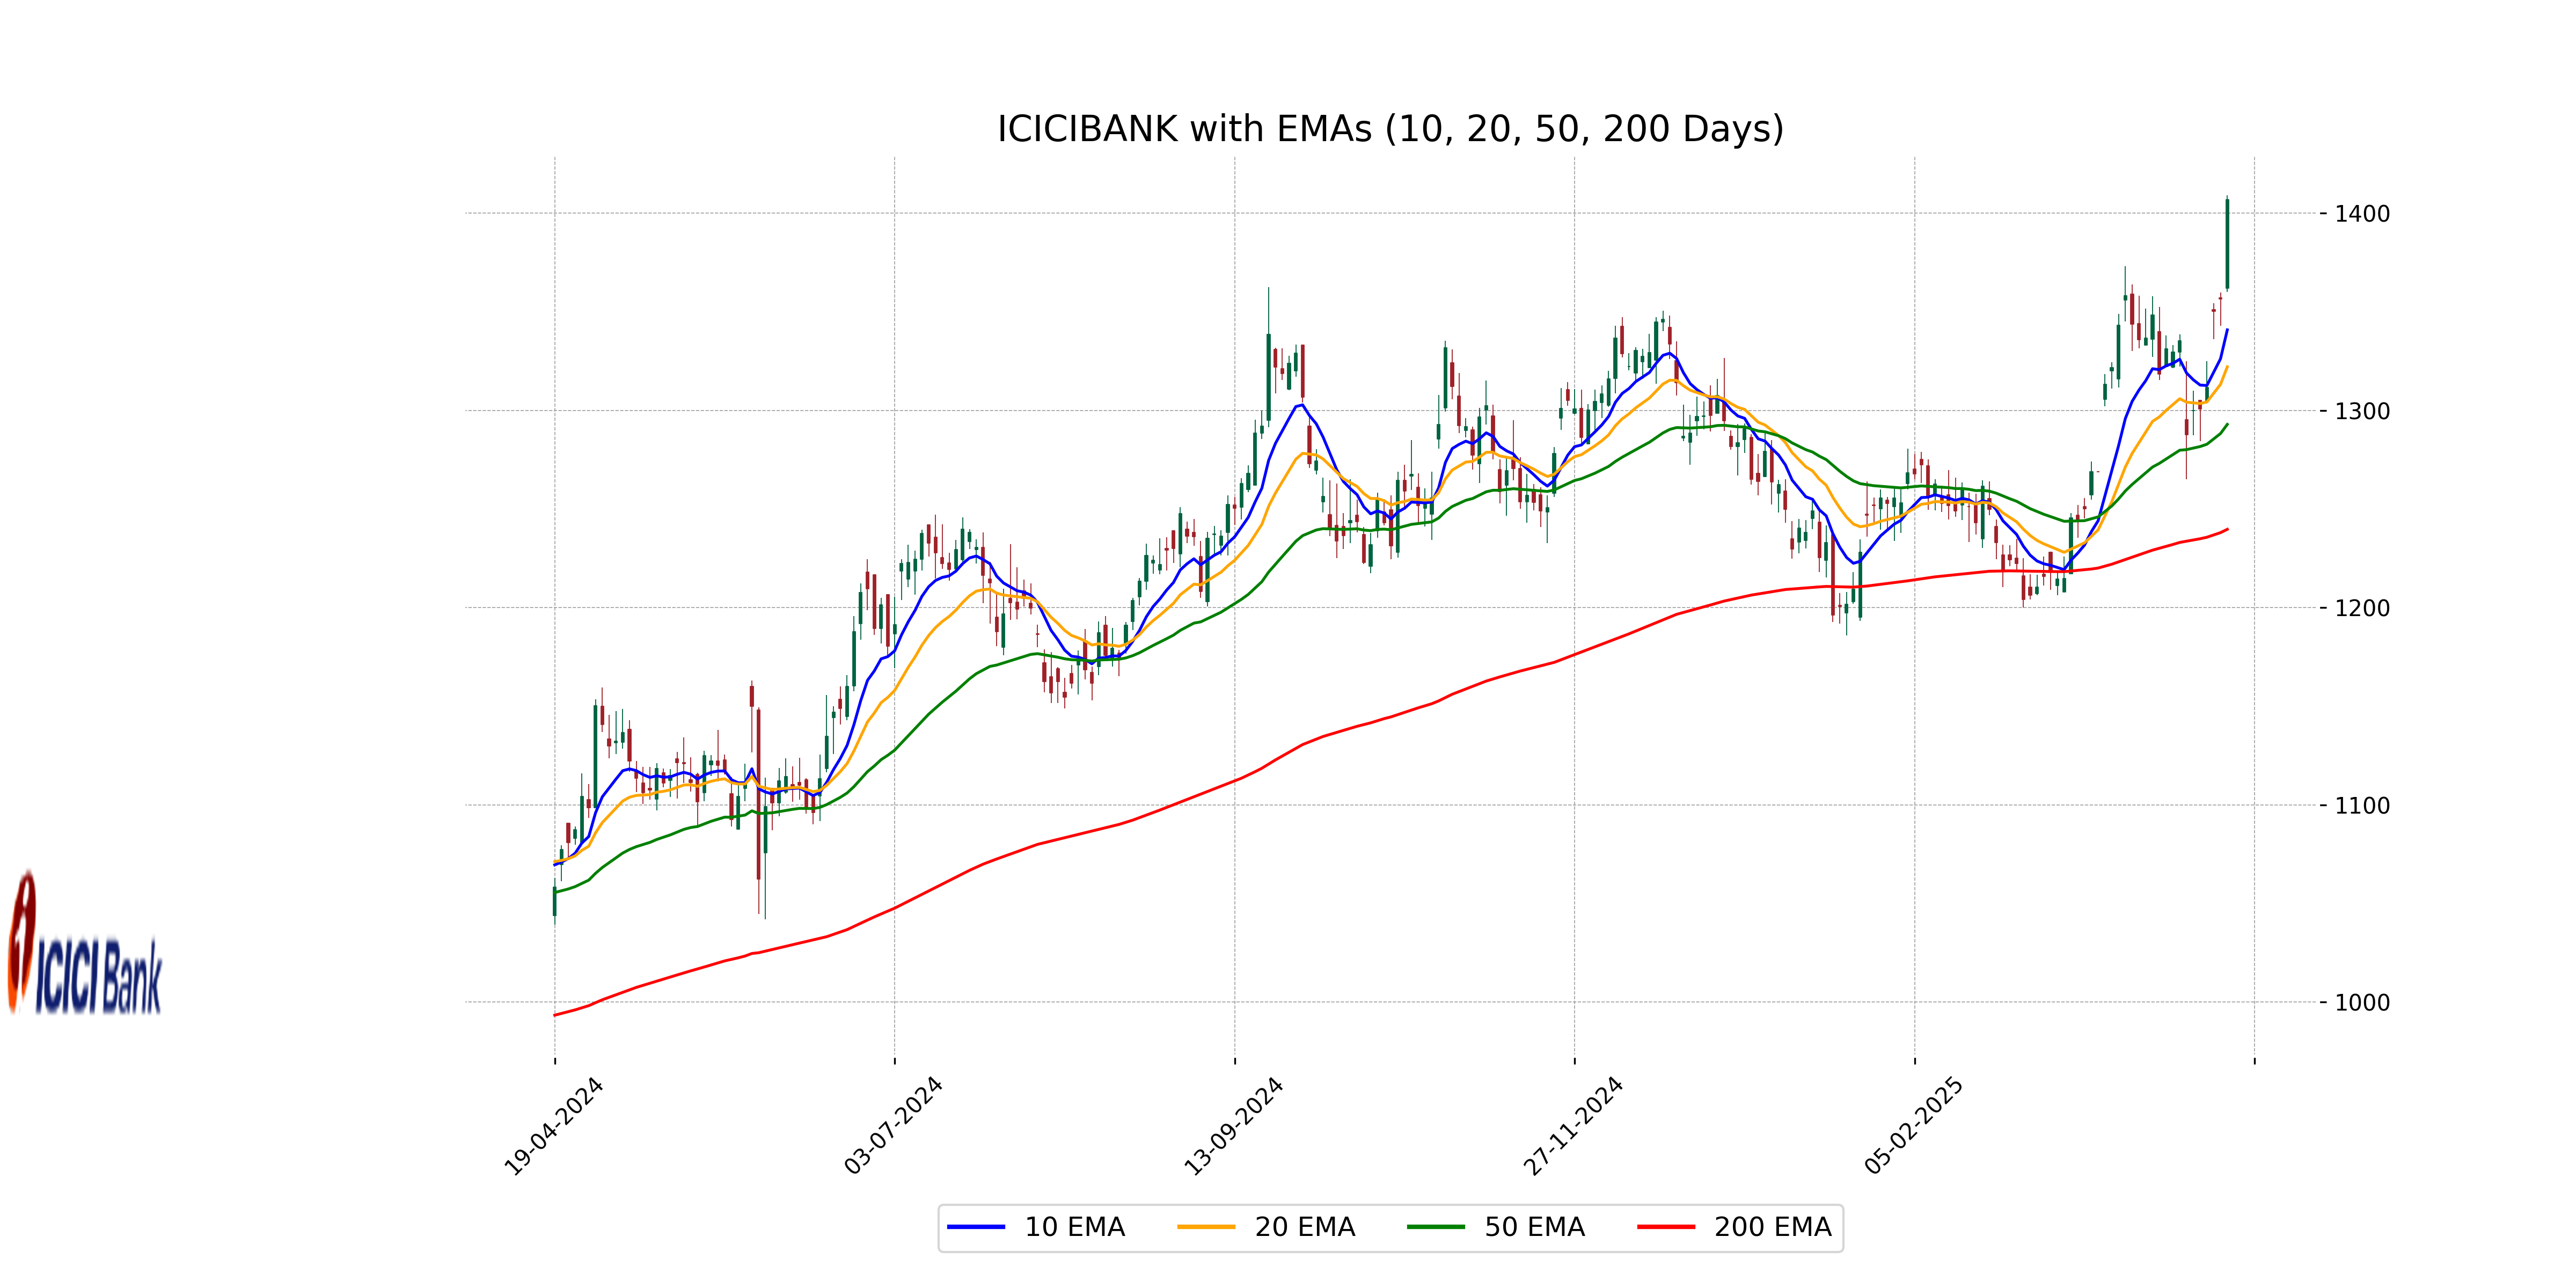
Relationship with Key Moving Averages
ICICI Bank's current close price of 1406.70 is above its 50-day EMA of 1292.89 and 200-day EMA of 1239.68, indicating a bullish trend. Additionally, it is also above the 10-day EMA of 1340.80 and 20-day EMA of 1322.07, suggesting strong short-term momentum.
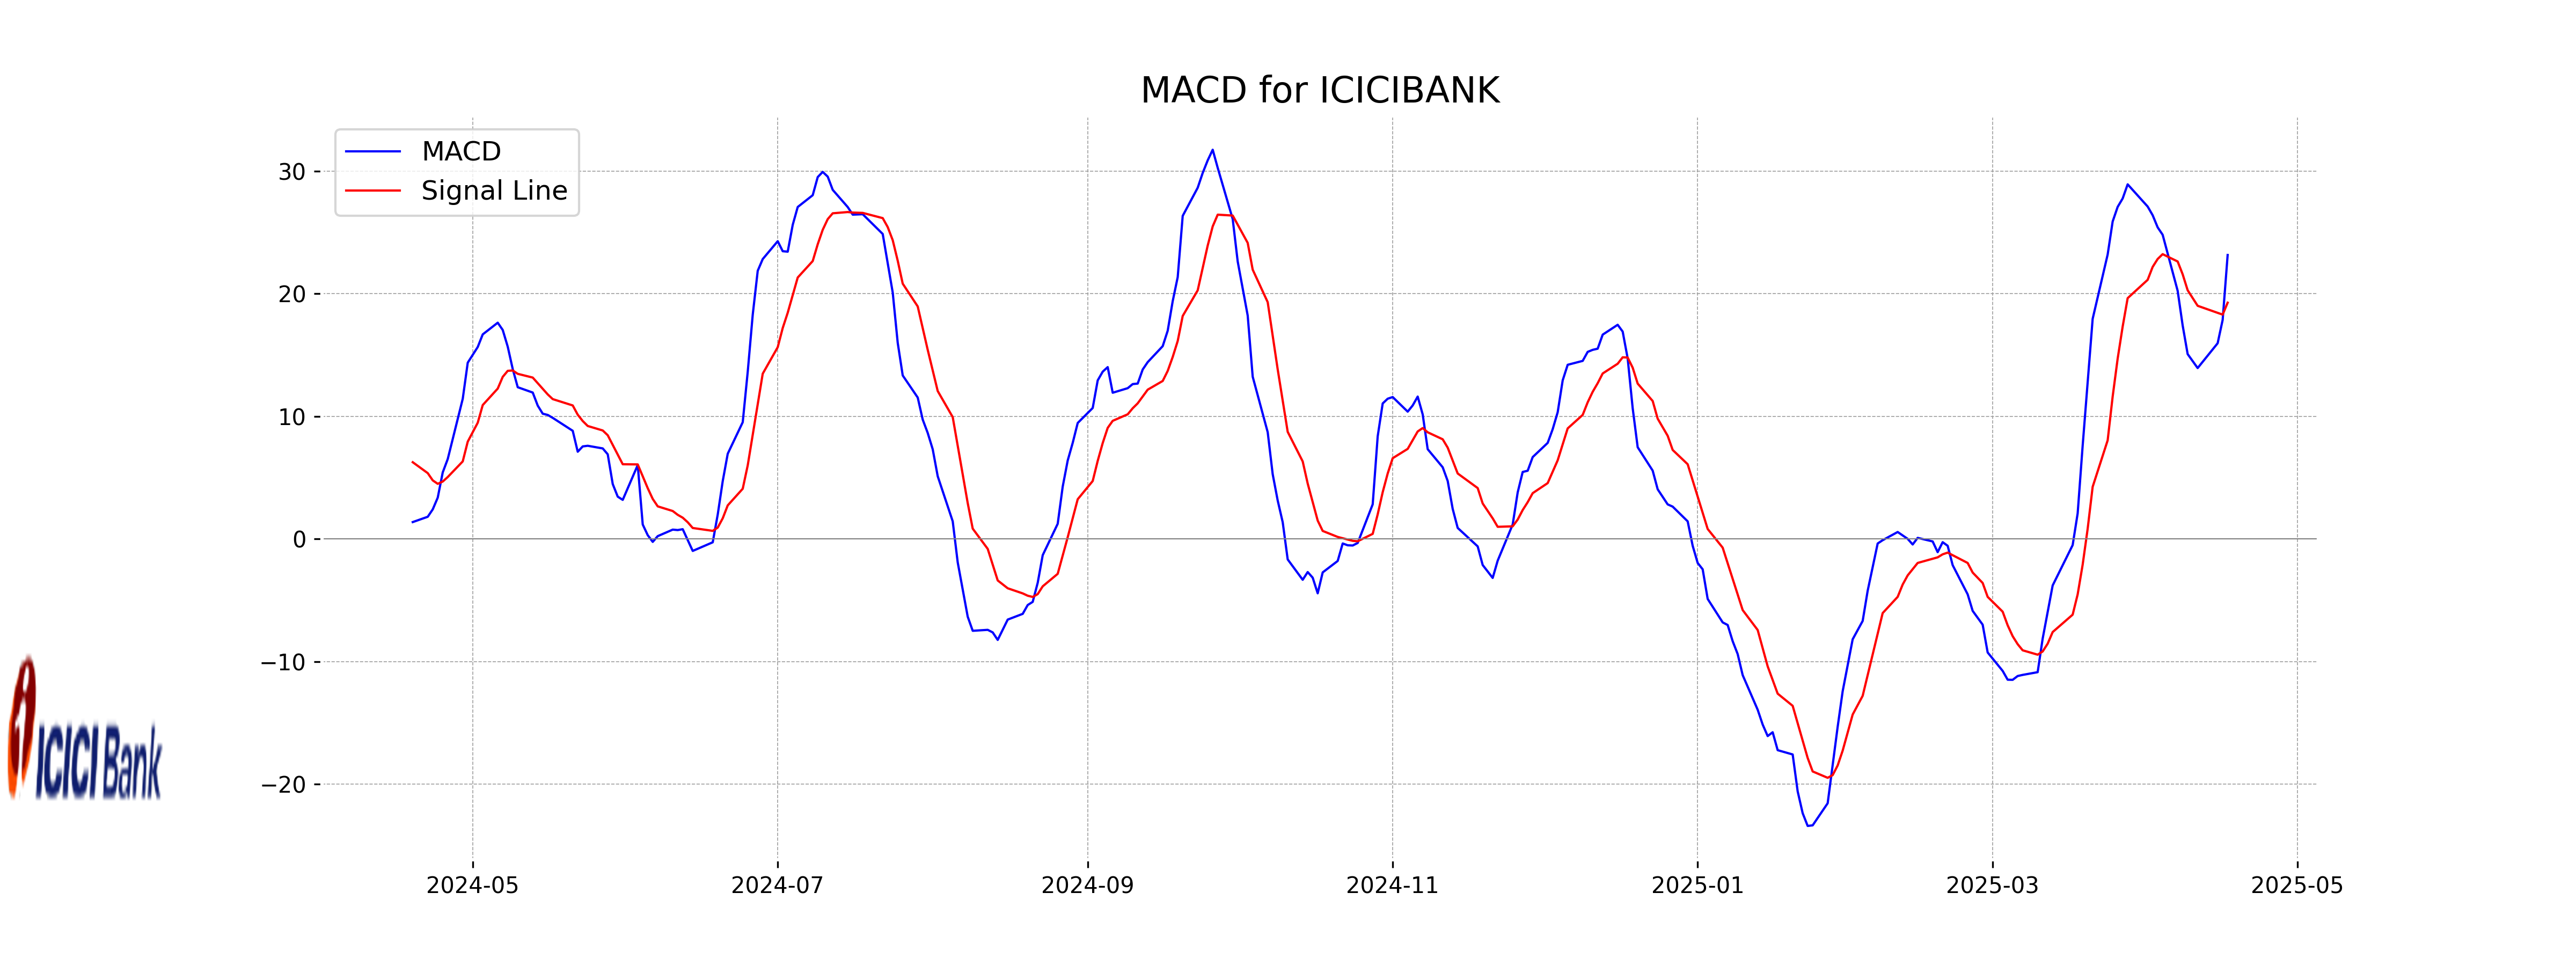
Moving Averages Trend (MACD)
The MACD value for ICICI Bank is 23.15, which is above the MACD Signal value of 19.26. This indicates a bullish momentum as the MACD is higher than the signal line, suggesting that the stock price may continue to rise.
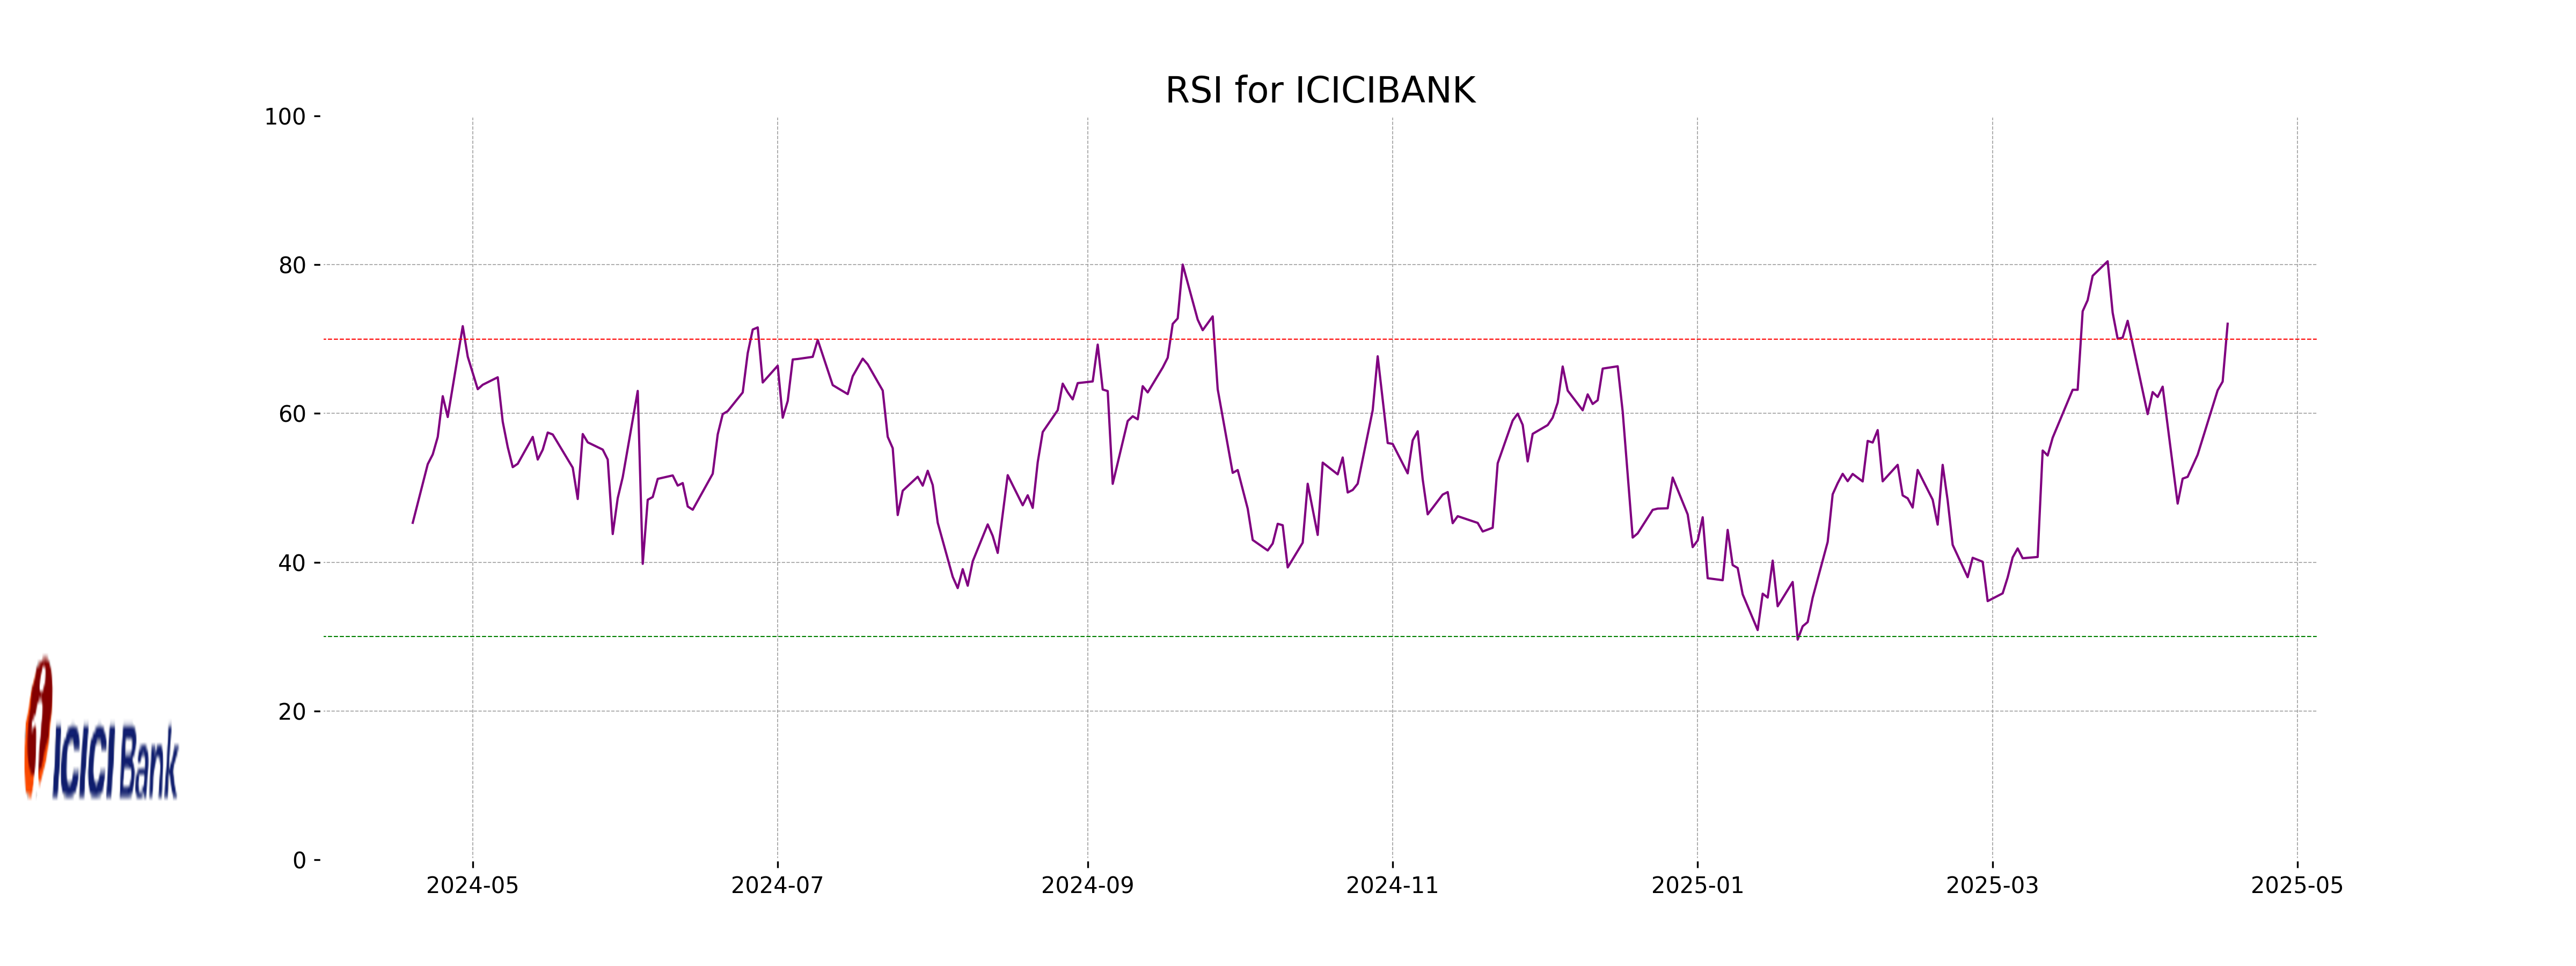
RSI Analysis
## RSI Analysis for ICICI Bank The RSI for ICICI Bank is 72.06, indicating that the stock may be entering the overbought territory. This suggests a potential for a price correction or consolidation in the near term. Investors should be cautious and consider other factors before making decisions.
Analysis for SUN Pharma - April 18, 2025
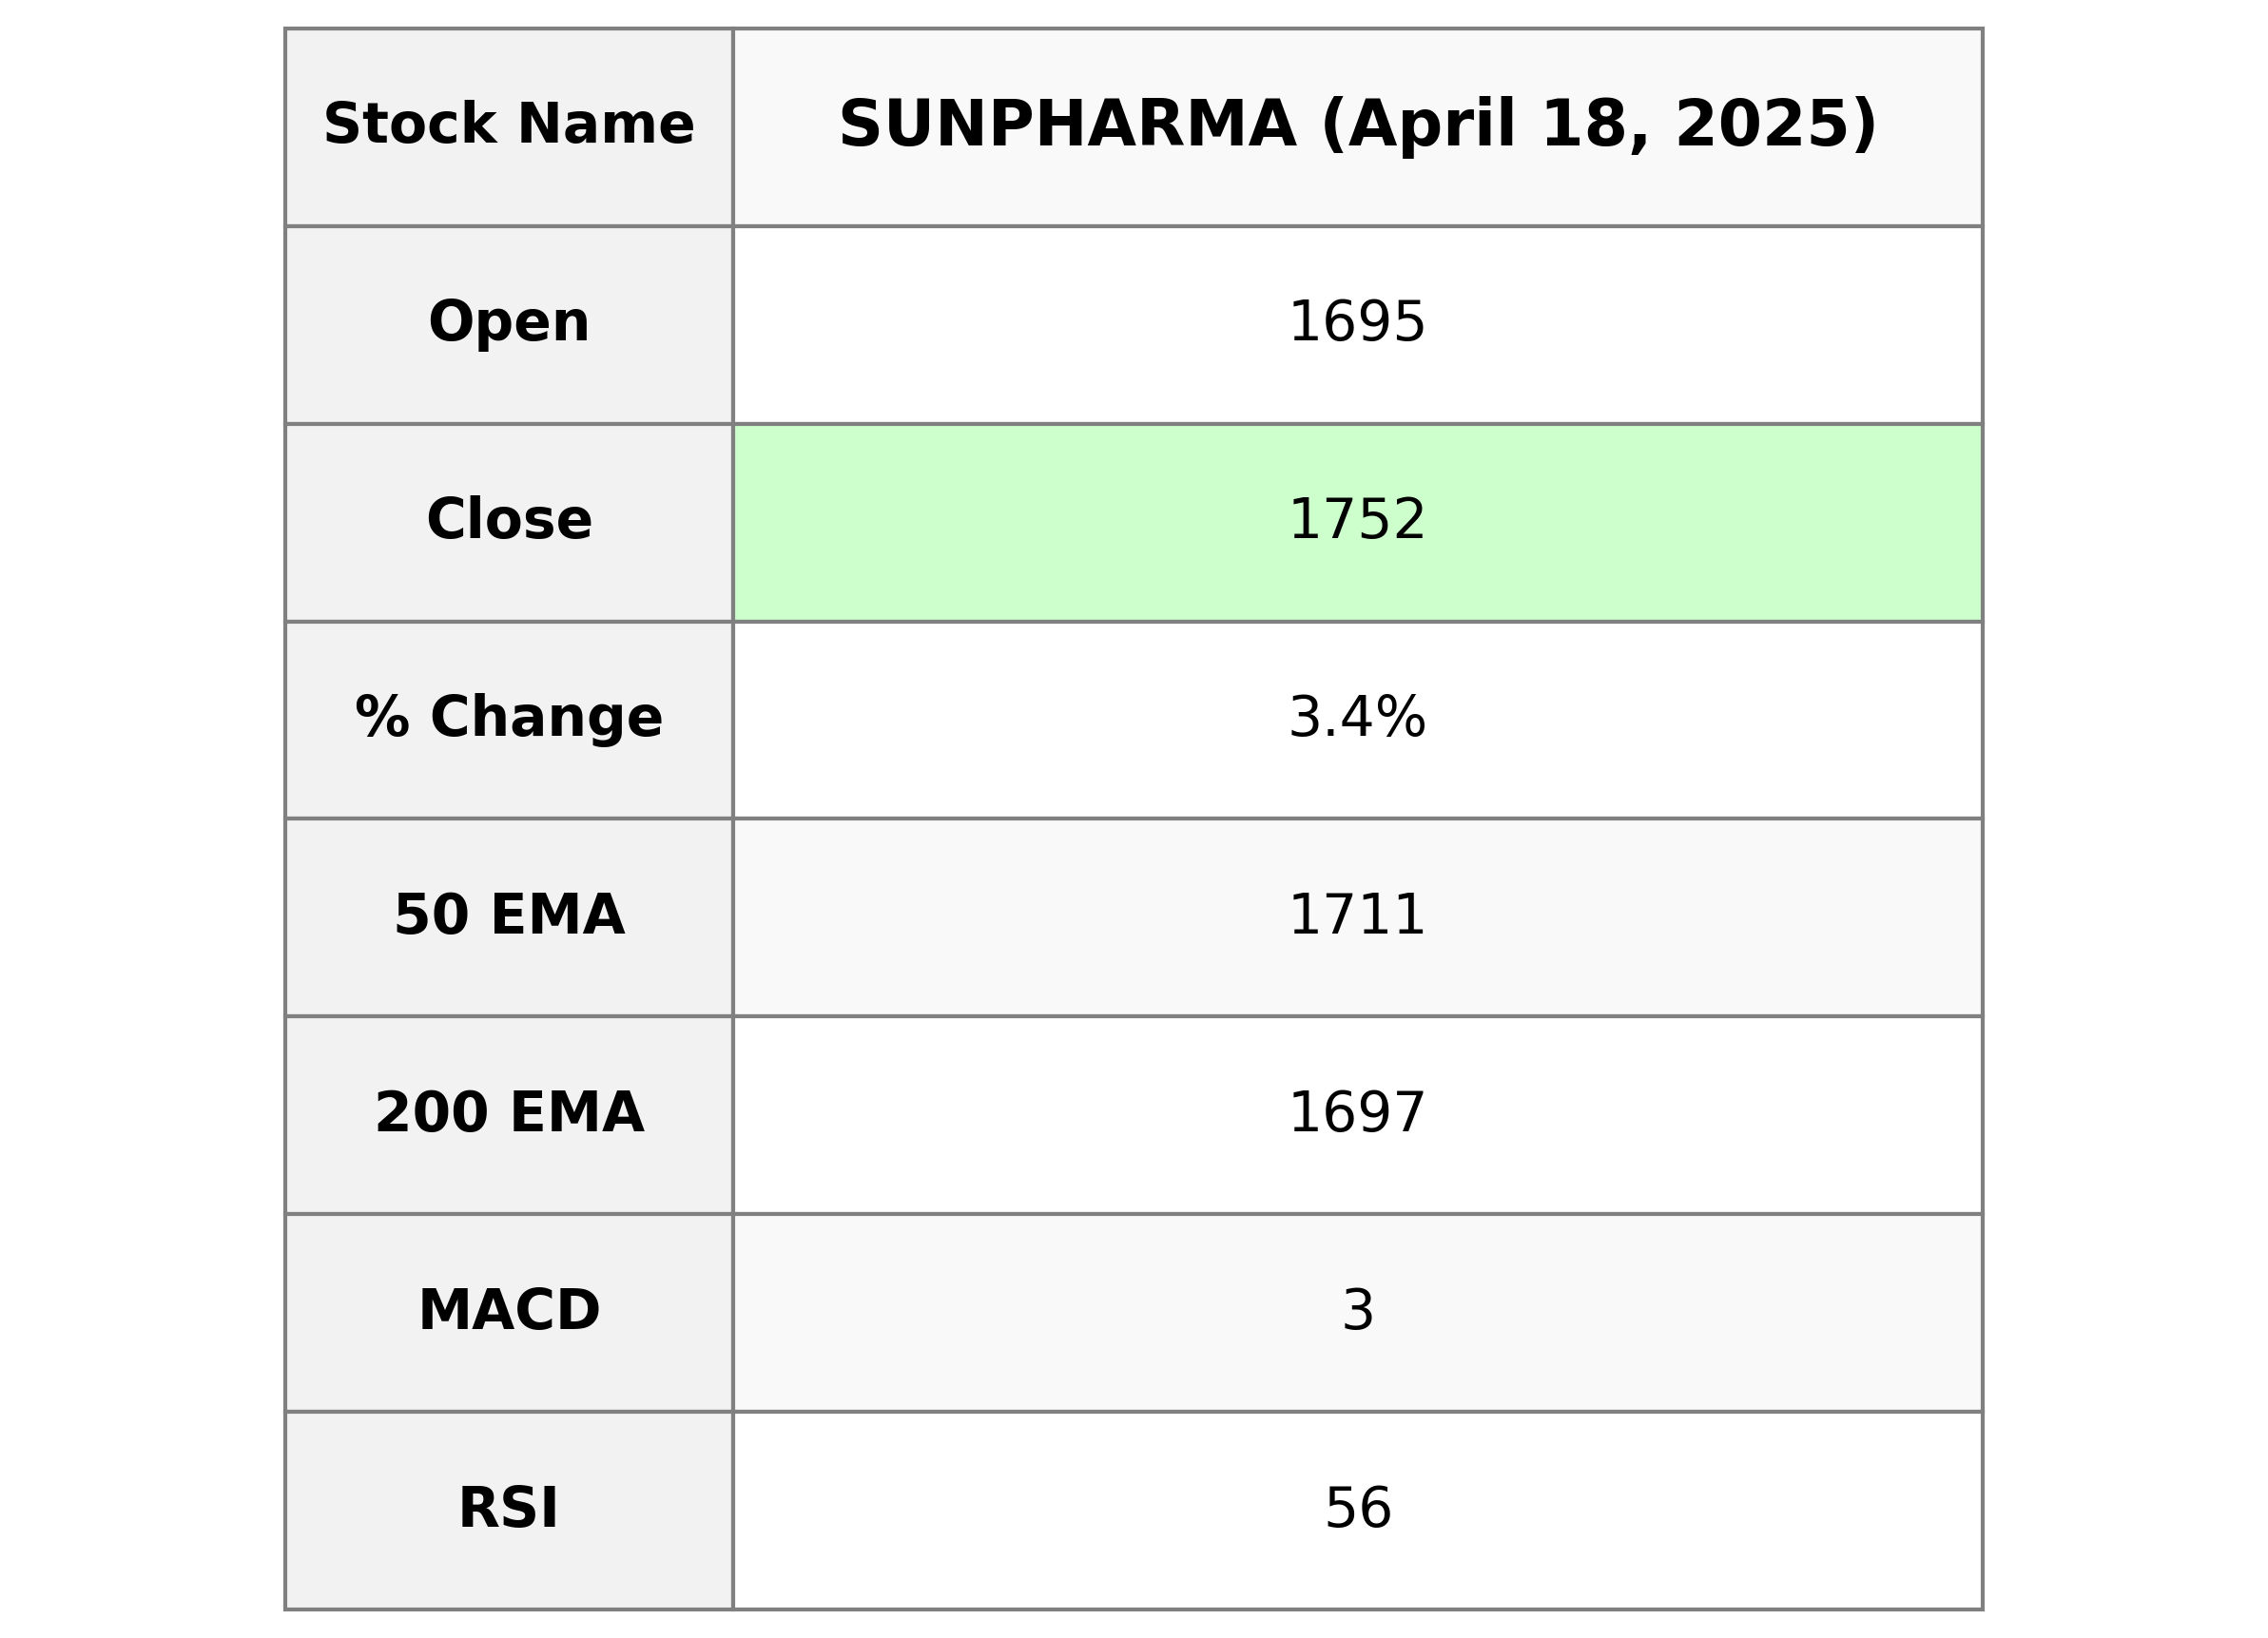
SUN Pharma experienced a positive performance with its stock closing at 1751.5, which is a 3.45% increase from the previous close of 1693.1. The stock showed a significant upward movement with a points change of 58.4 and a trading volume of 2,683,908. The company's market cap stands at 4,202,426,531,840, with a PE Ratio of 36.77 and EPS of 47.64, indicating strong earnings potential within the Healthcare sector, specifically in Drug Manufacturers - Specialty & Generic in India.
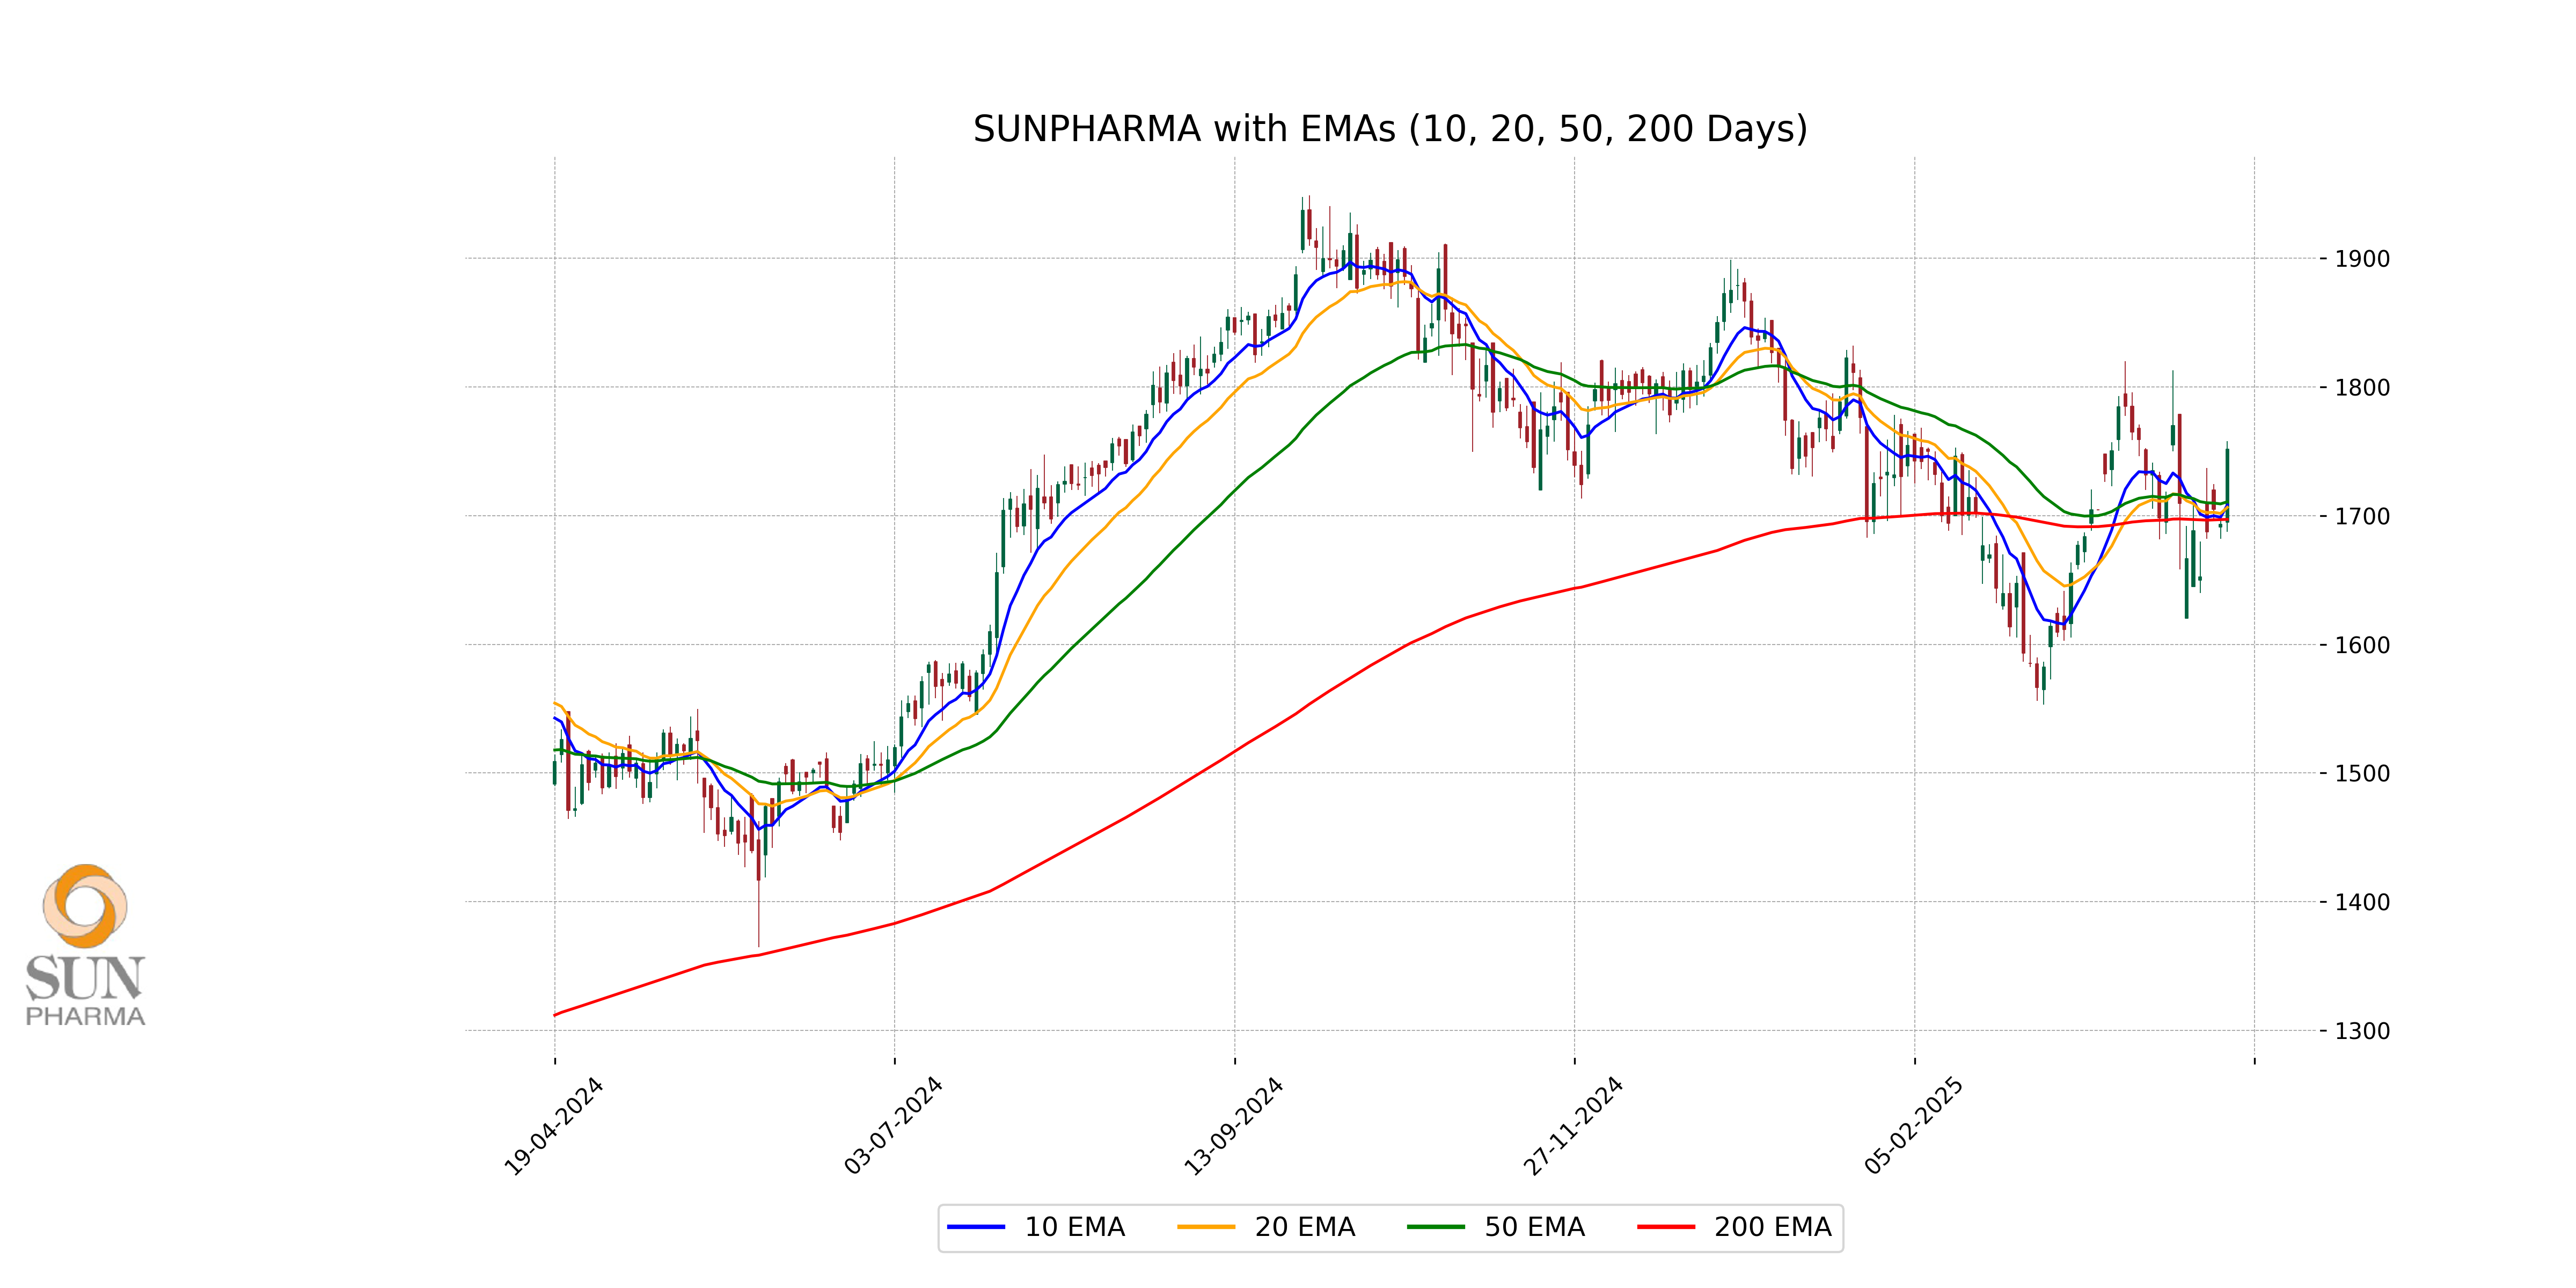
Relationship with Key Moving Averages
SUN Pharma's closing price of 1751.5 is above its key moving averages: 50 EMA at 1710.74, 200 EMA at 1697.06, and 10 EMA at 1708.26. This indicates a bullish trend as the stock price is performing well above its short-term, medium-term, and long-term averages.
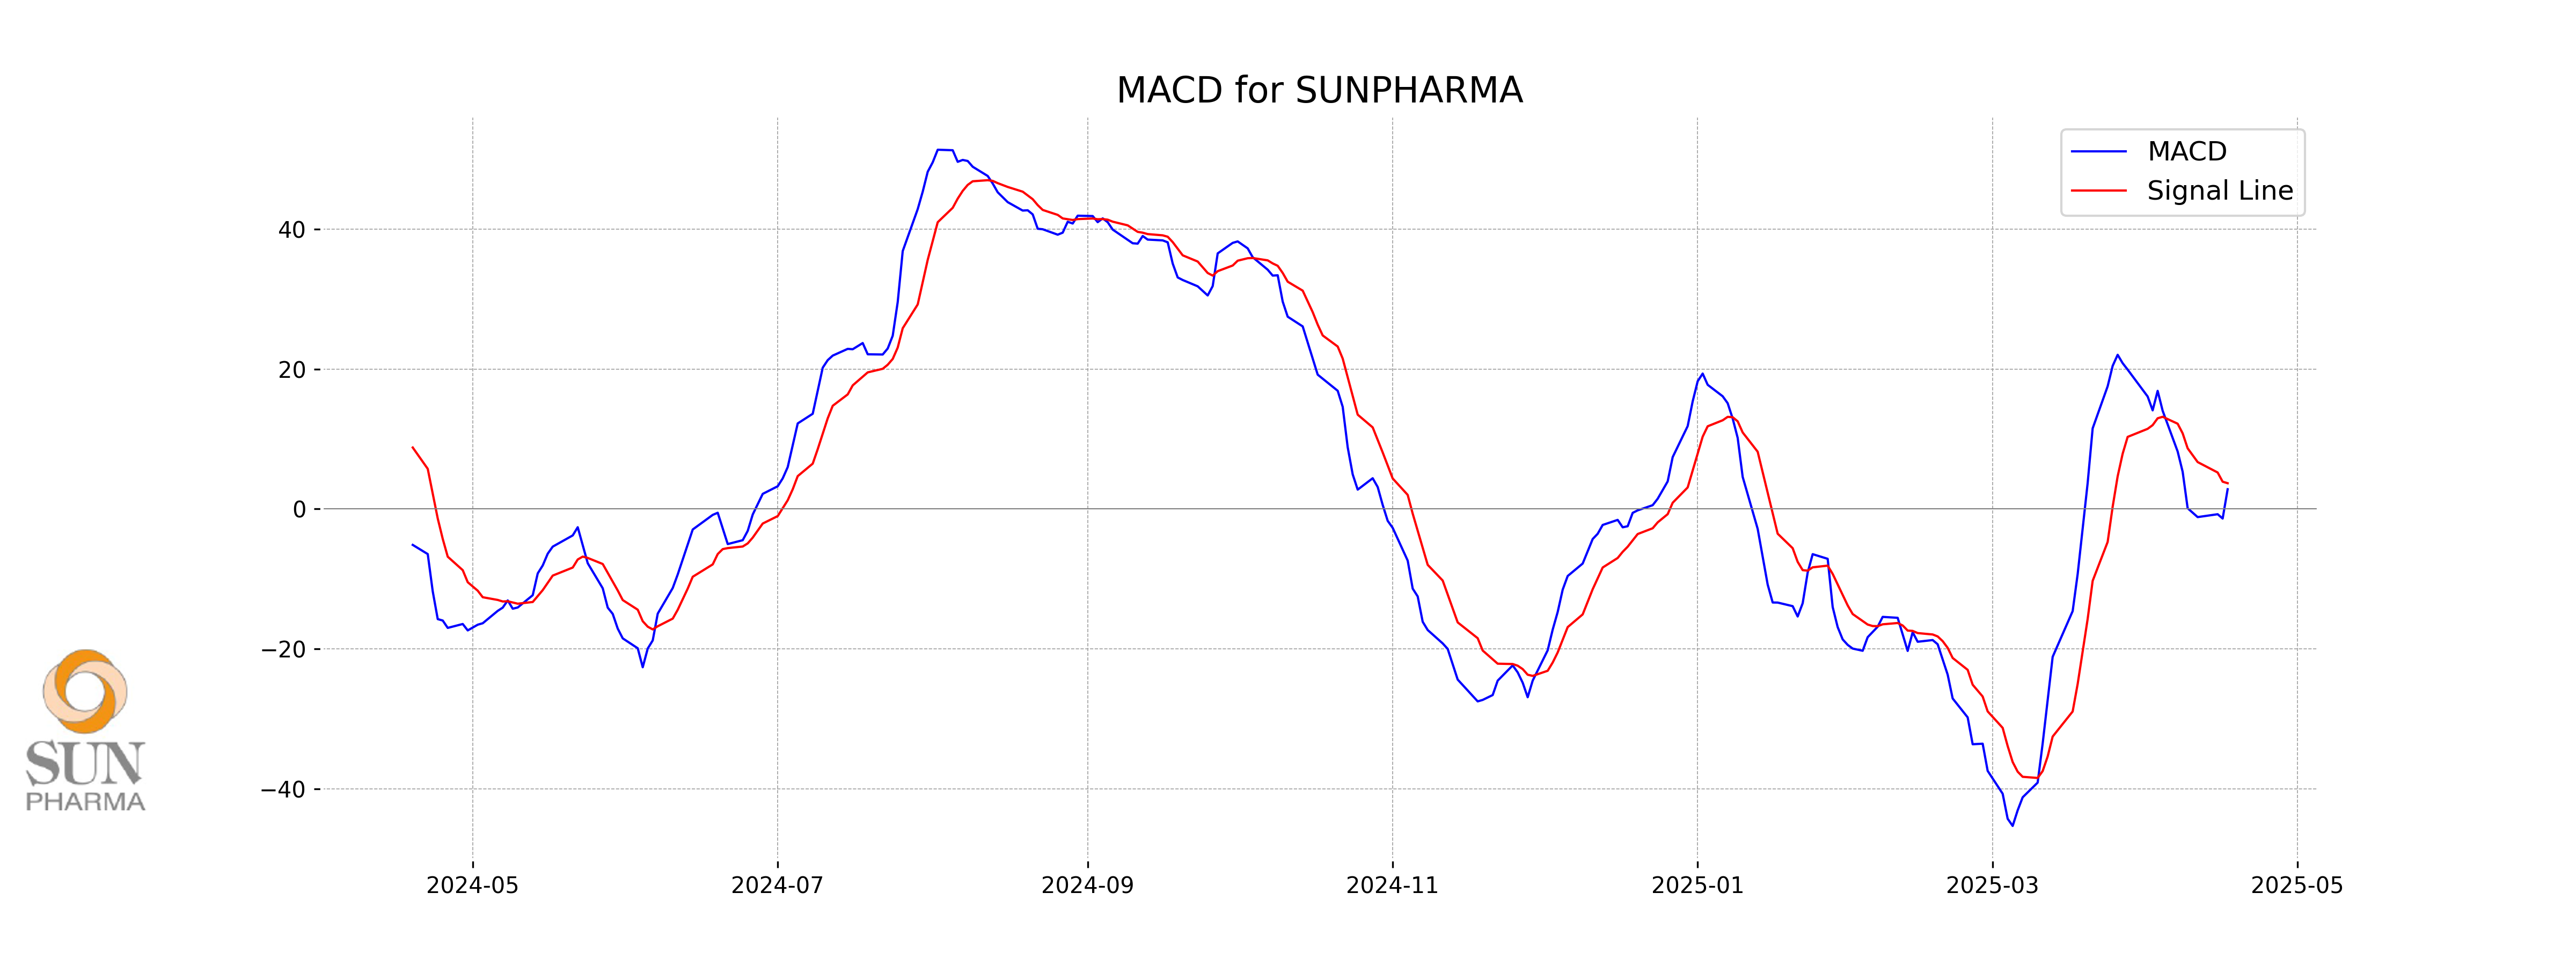
Moving Averages Trend (MACD)
- SUN Pharma: The MACD line is at 2.81, while the signal line is slightly higher at 3.67. This configuration suggests a bearish crossover, indicating potential for short-term downward momentum unless the MACD line crosses above the signal line.
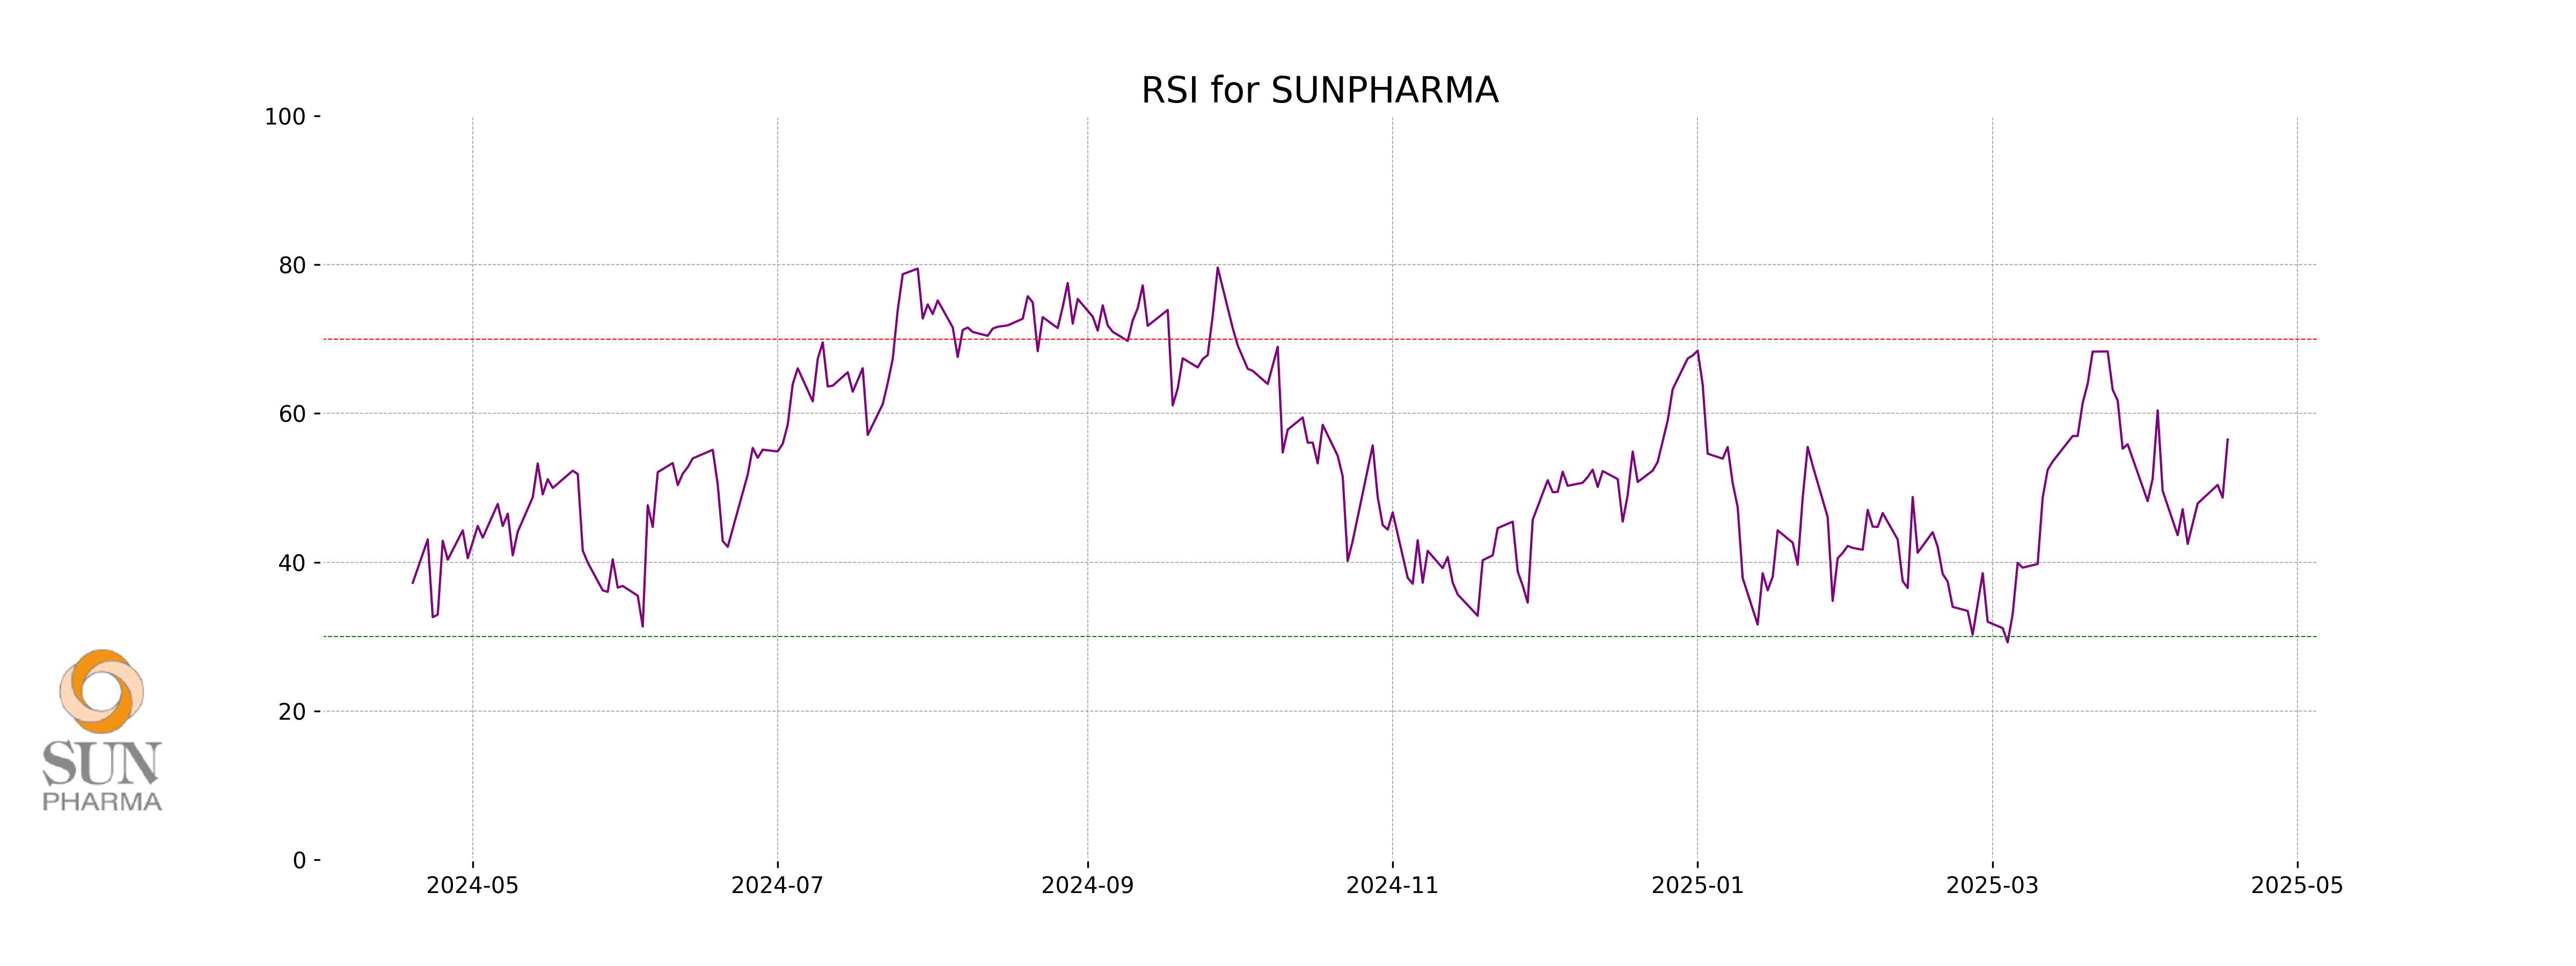
RSI Analysis
The Relative Strength Index (RSI) for Sun Pharma is at 56.48. This suggests that the stock is currently in a neutral range, indicating neither overbought nor oversold conditions. Typically, an RSI above 70 indicates overbought, while below 30 suggests oversold conditions.
Up Next
NSE Nifty 50 Top gainers: What are the 5 Biggest Stock gainers Today April 18, 2025

Rupee breaches 91-mark against US dollar for first time in intra-day trade

Microsoft commits USD 17.5 billion investment in India: CEO Satya Nadella

CBI books Anil Ambani's son, Reliance Home Finance Ltd. in Rs 228 crore bank fraud case

RBI raises FY26 GDP growth projection to 7.3 pc

RBI trims policy interest rate by 25bps to 5.25pc, loans to get cheaper

More videos

Rupee slumps to all-time low of 90.25 against US dollar in intra-day trade

Reliance completes merger of Star Television Productions with Jiostar

India to lead emerging market growth with 7pc GDP rise in 2025: Moody’s

Nifty hits record high after 14 months; Sensex nears all-time peak

Reliance stops Russian oil use at its only-for-export refinery to comply with EU sanctions

ED attaches fresh assets worth over Rs 1,400 cr in case against Anil Ambani's Reliance Group

India signs one-year deal to import 2.2 million tonnes of LPG from US

India International Trade Fair begins at Pragati Maidan amid tight security

Stock markets decline in initial trade on foreign fund outflows, weak Asian peers

Amazon to lay off 30,000 office workers amid AI-driven cost cuts