


Highlights
Latest news

Indian cricket prodigy Vaibhav Suryavanshi honoured with 'Pradhan Mantri Rashtriya Bal Puraskar'

AAP Gujarat chief Isudan Gadhvi calls BJP allegations against MLA Chaitar Vasava as politically driven

Aditya Dhar's 'Dhurandhar' earns over Rs 1000 crore at box office

Australia lead England by 46 after 20 wickets fall on crazy day at MCG

Delhi HC asks Centre to respond on plea seeking GST cut on air purifiers amid worsening air quality

Congress pays tribute to former PM Manmohan Singh on first death anniversary

Ruled out of last two Ashes Tests, Cummins sets sights on T20 World Cup in Feb

CEO among three held for gangrape of woman IT firm manager in Udaipur
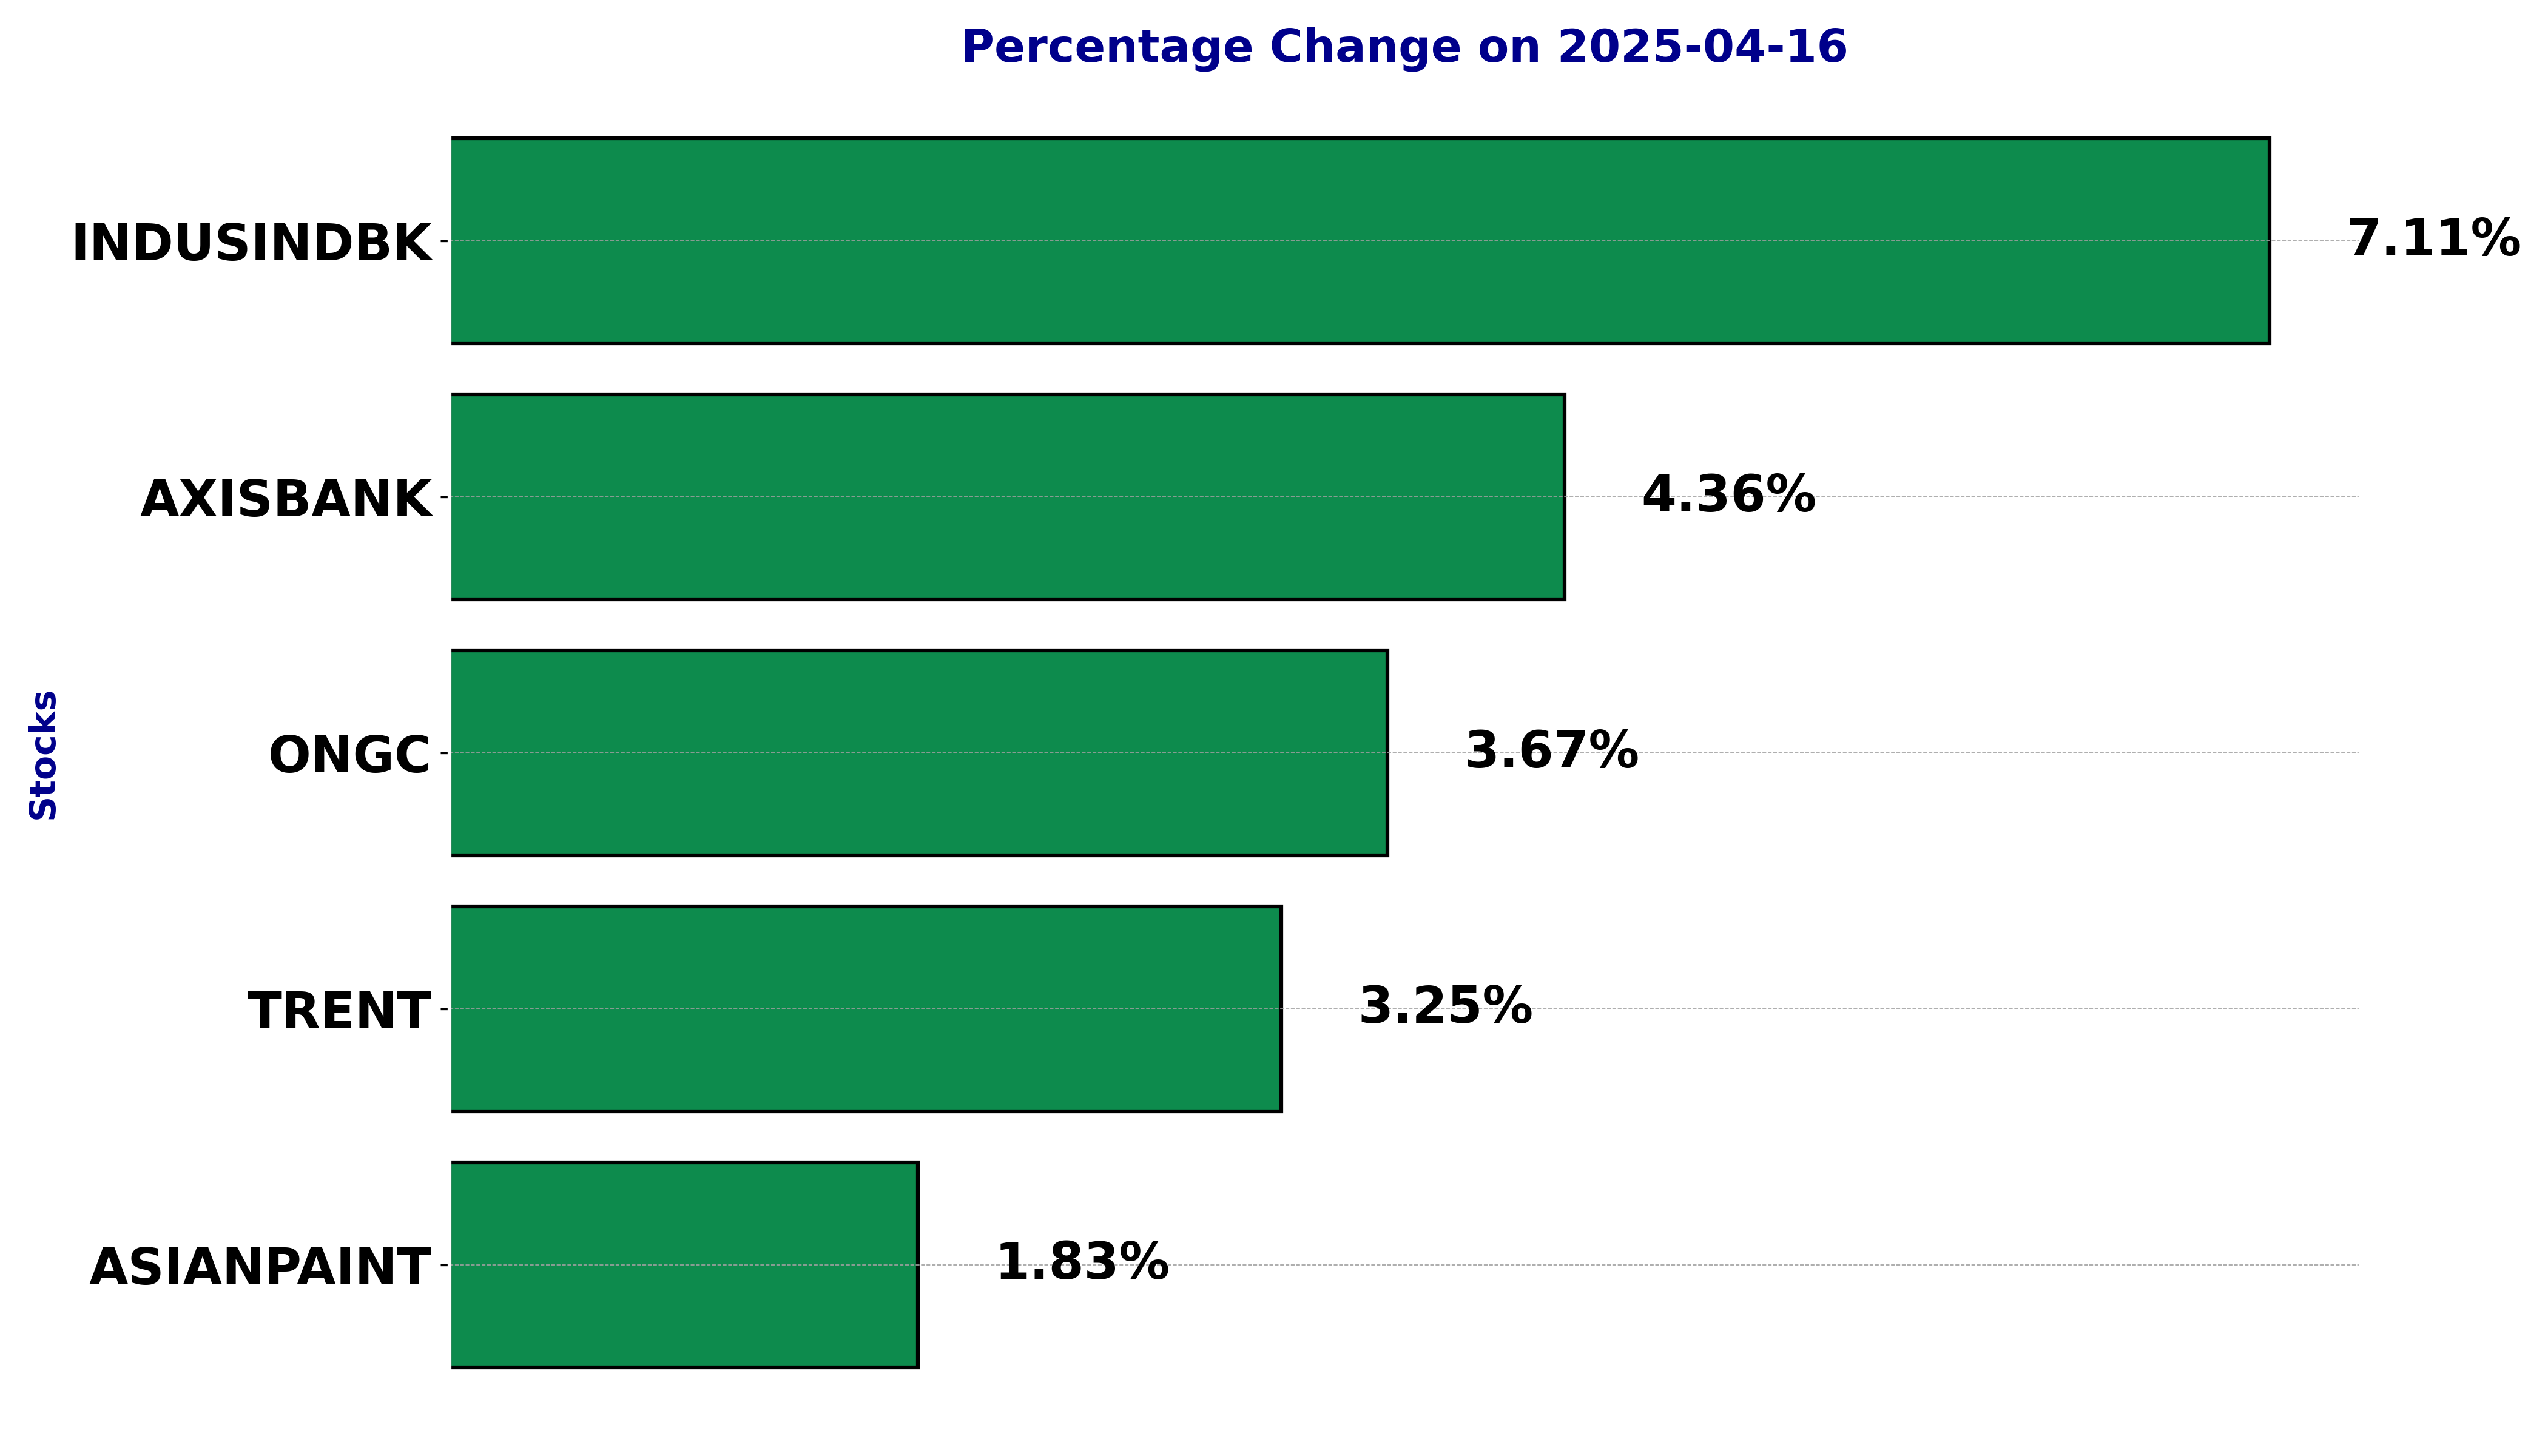
NSE Nifty 50 Top gainers: What are the 5 Biggest Stock gainers Today April 16, 2025


In this article, we will explore the technical indicators of some of the high-performing stocks on the Indian stock market, including ASIANPAINT, AXISBANK, INDUSINDBK, ONGC, and TRENT.
By looking at these stocks through the lens of key technical factors, we aim to better understand their price movements, trends, and potential future performance.
Analysis for Asian Paints - April 16, 2025
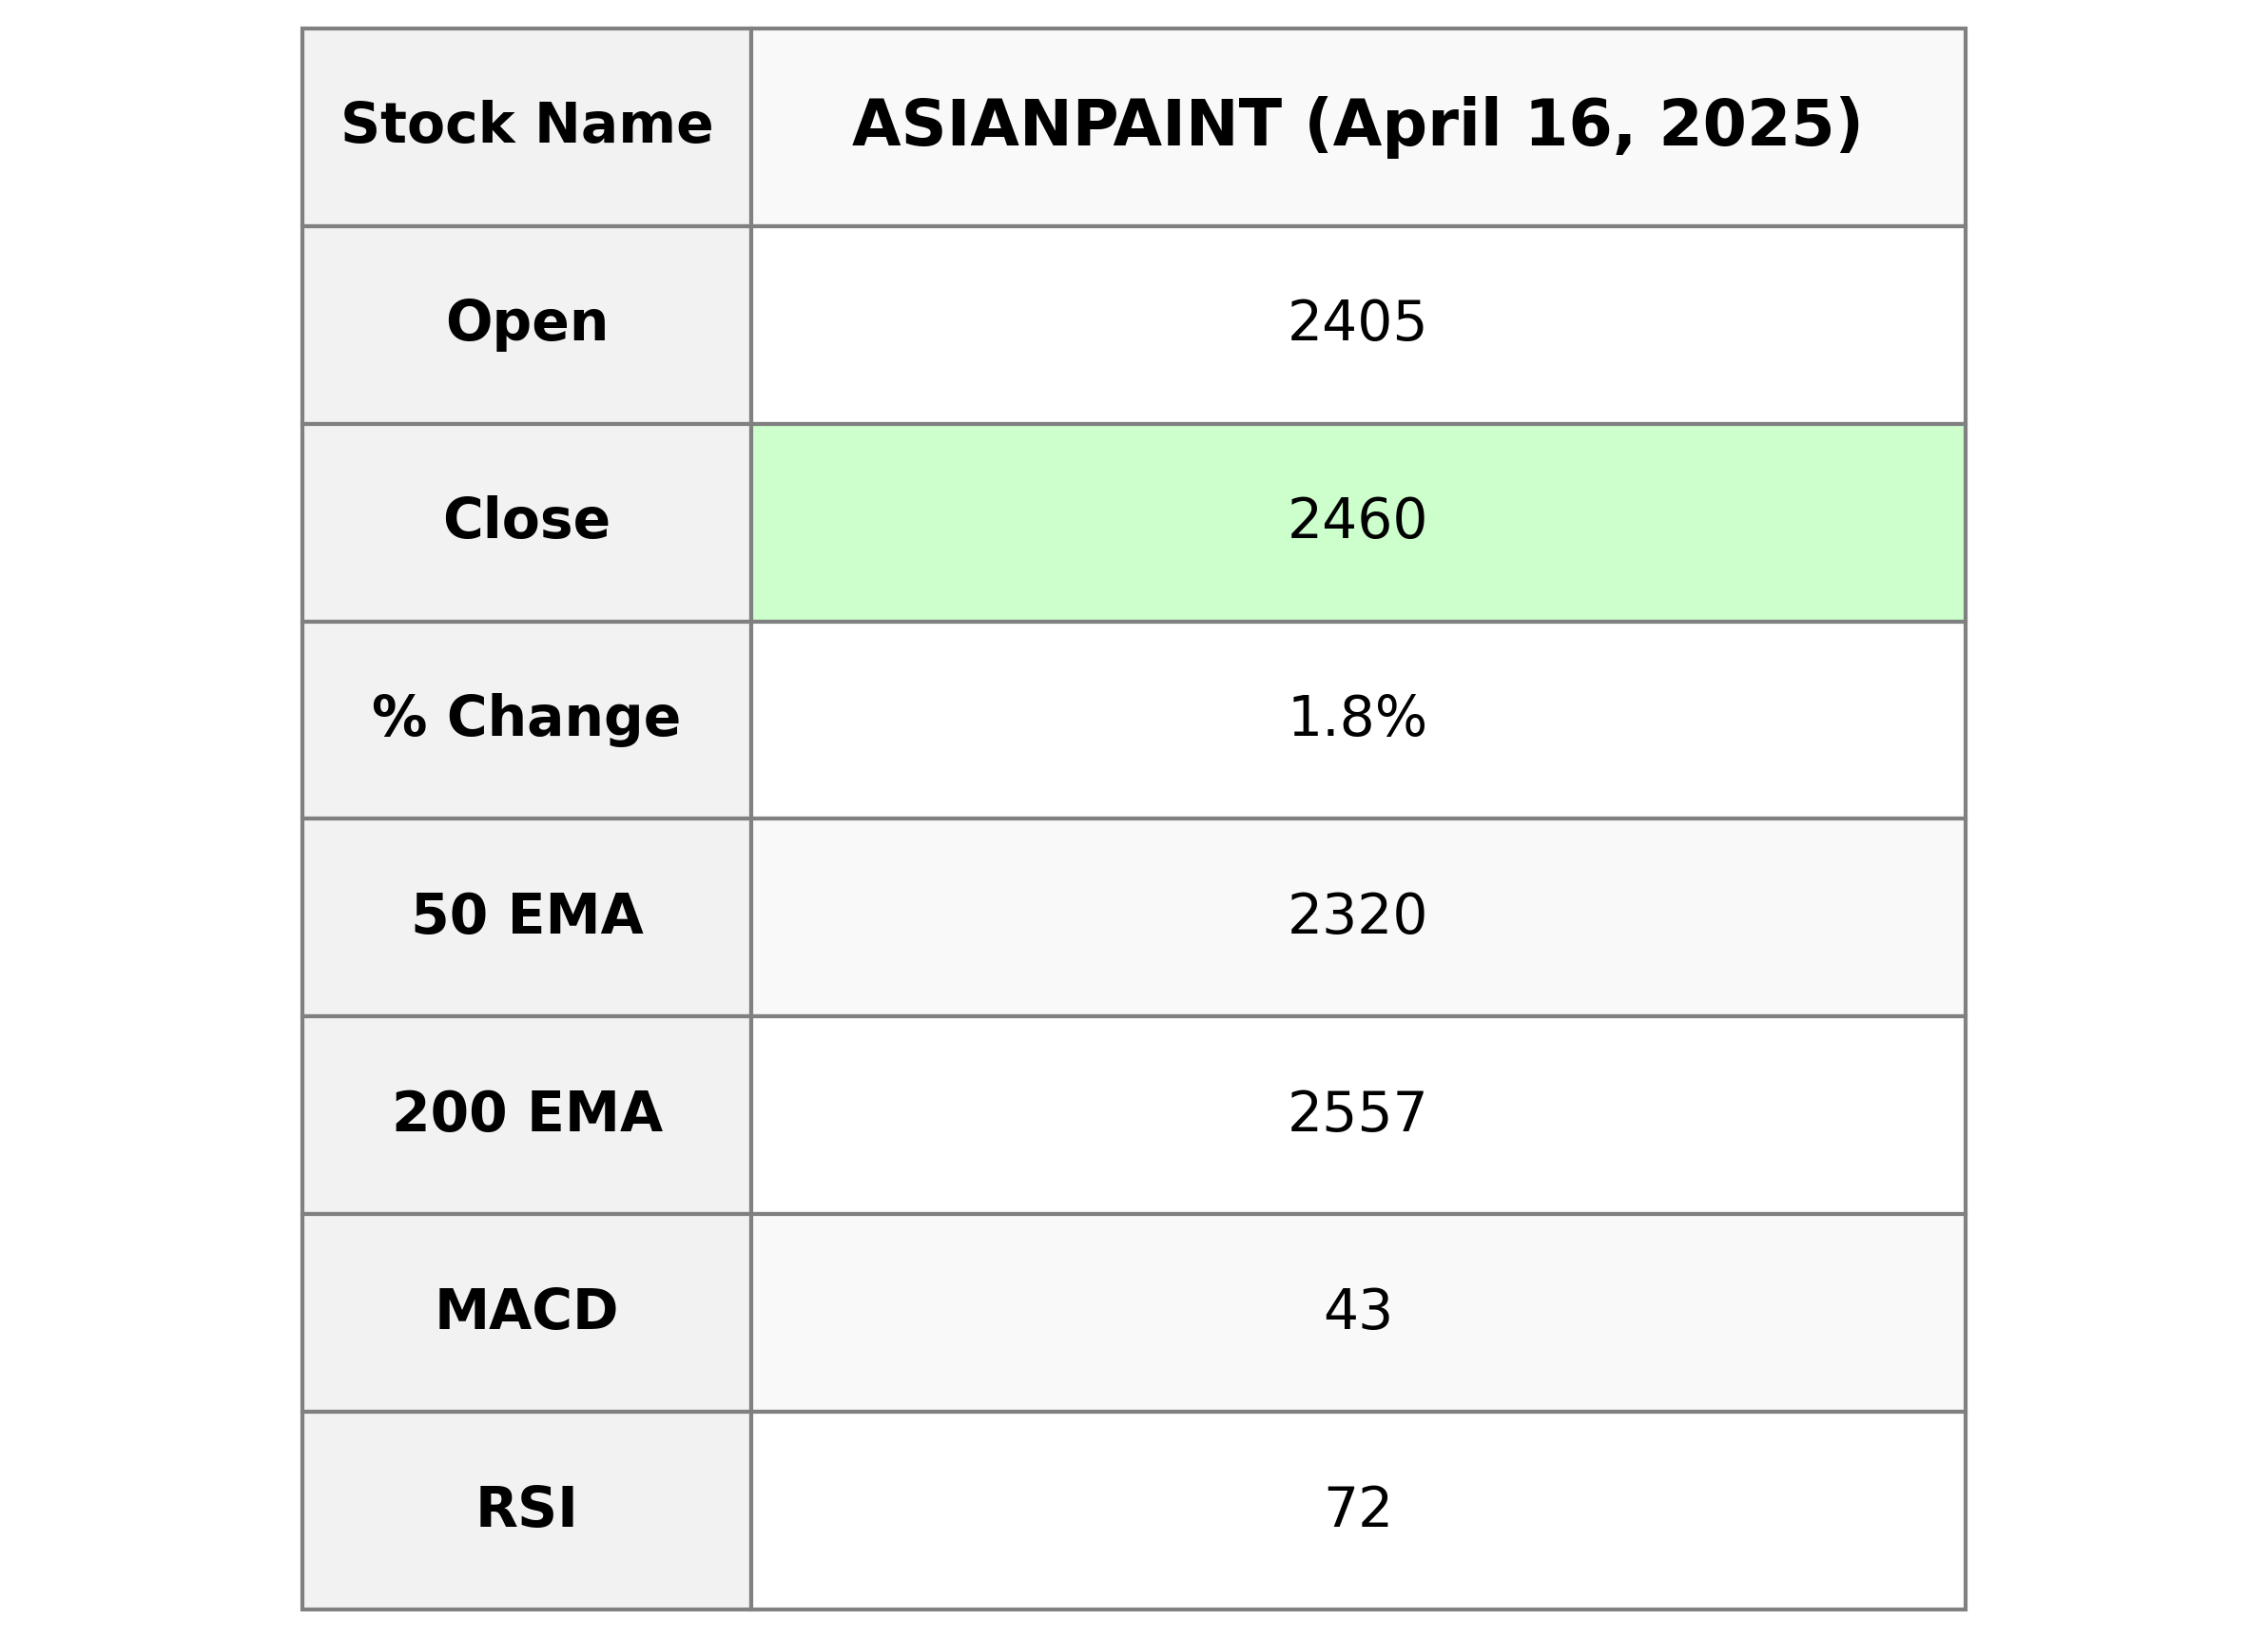
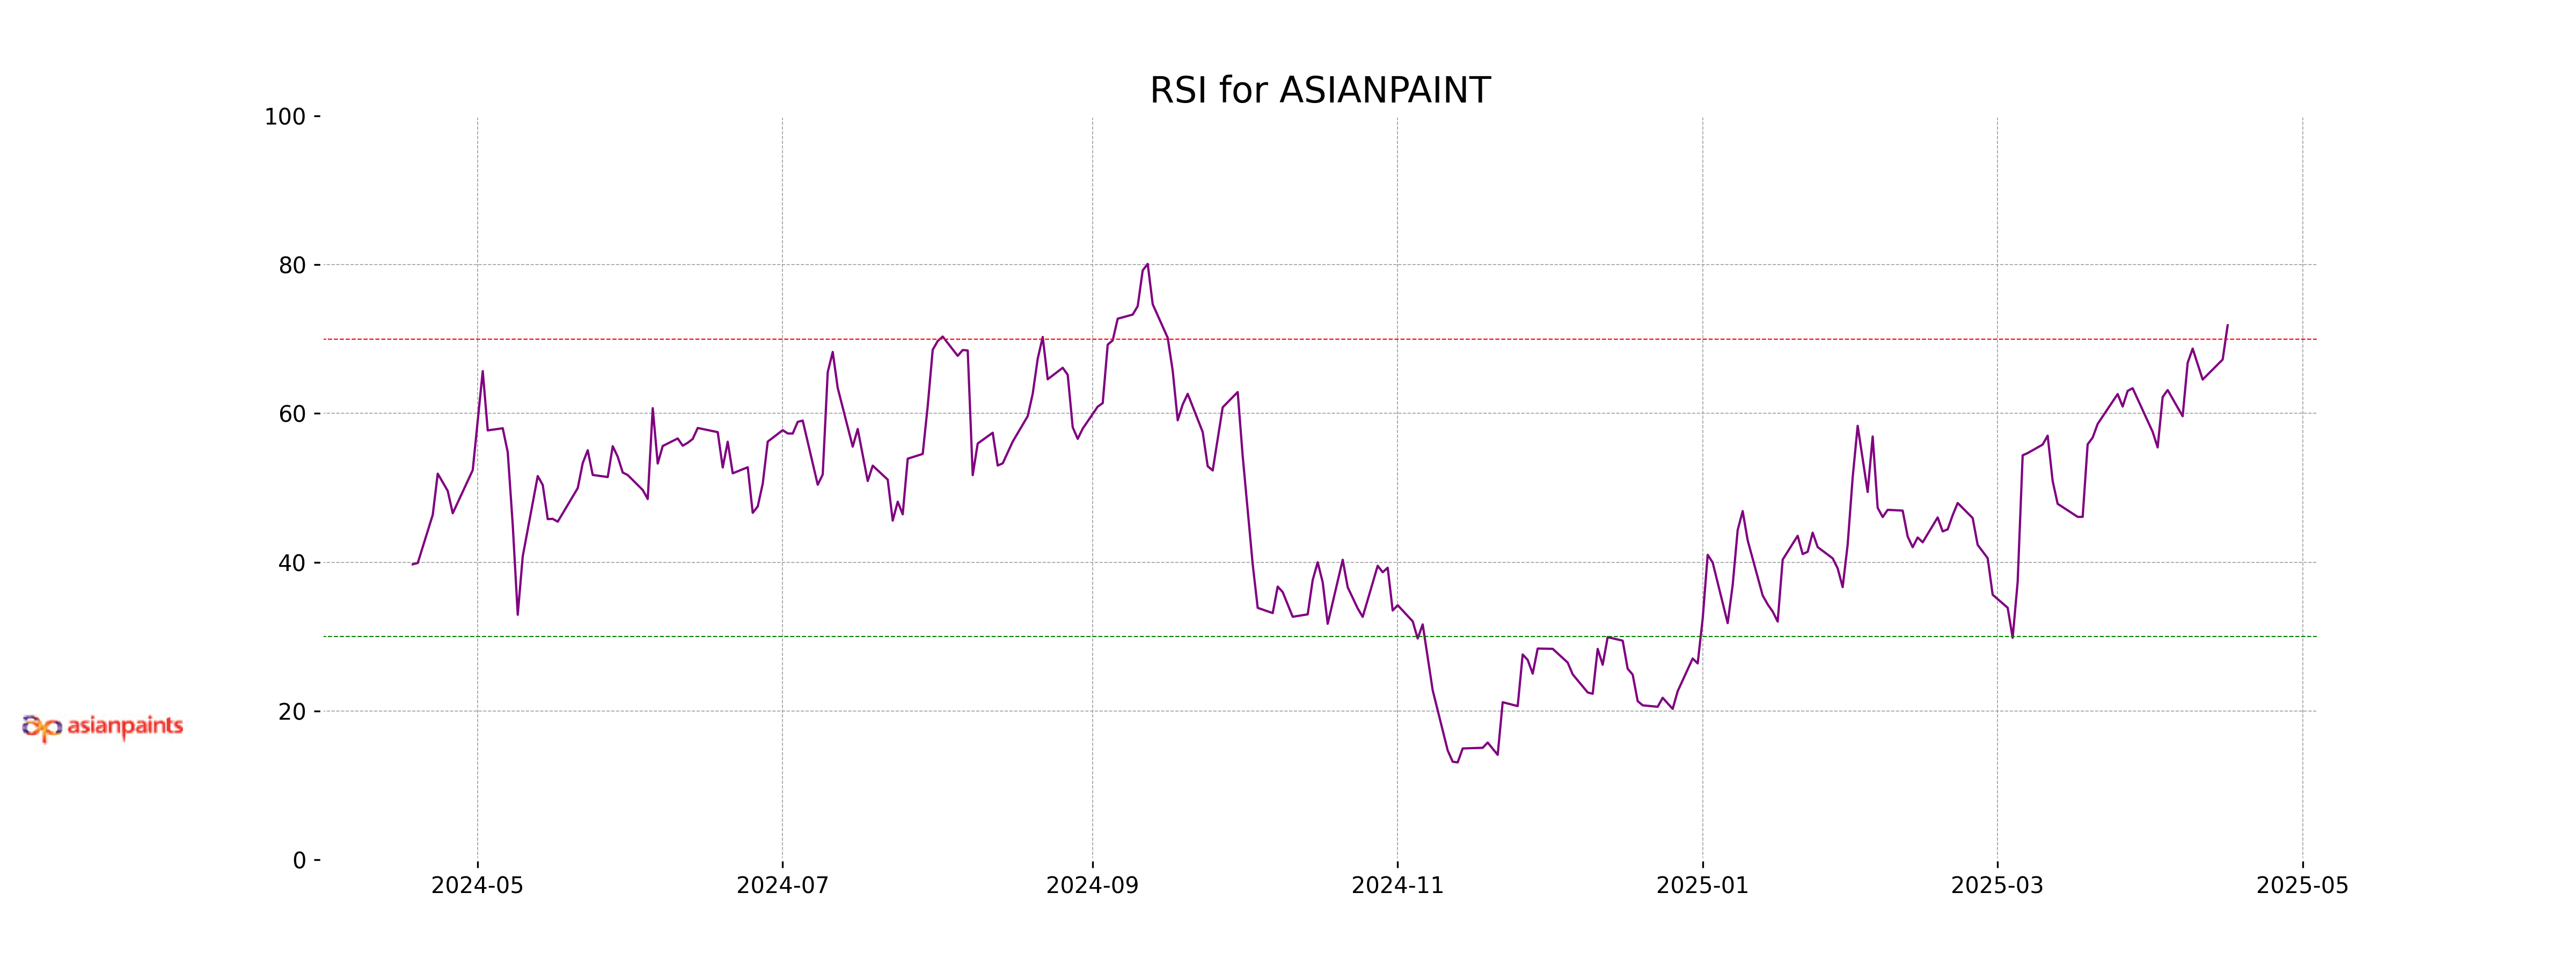
Asian Paints experienced a notable performance, opening at 2405.10 and closing at 2459.90, reflecting a percentage change of 1.83% with a points change of 44.20. The company, residing in the Basic Materials sector within the Specialty Chemicals industry, showcases an RSI of 71.85, indicating bullish momentum, while outperforming its 50 and 10 EMA but trading below the 200 EMA.
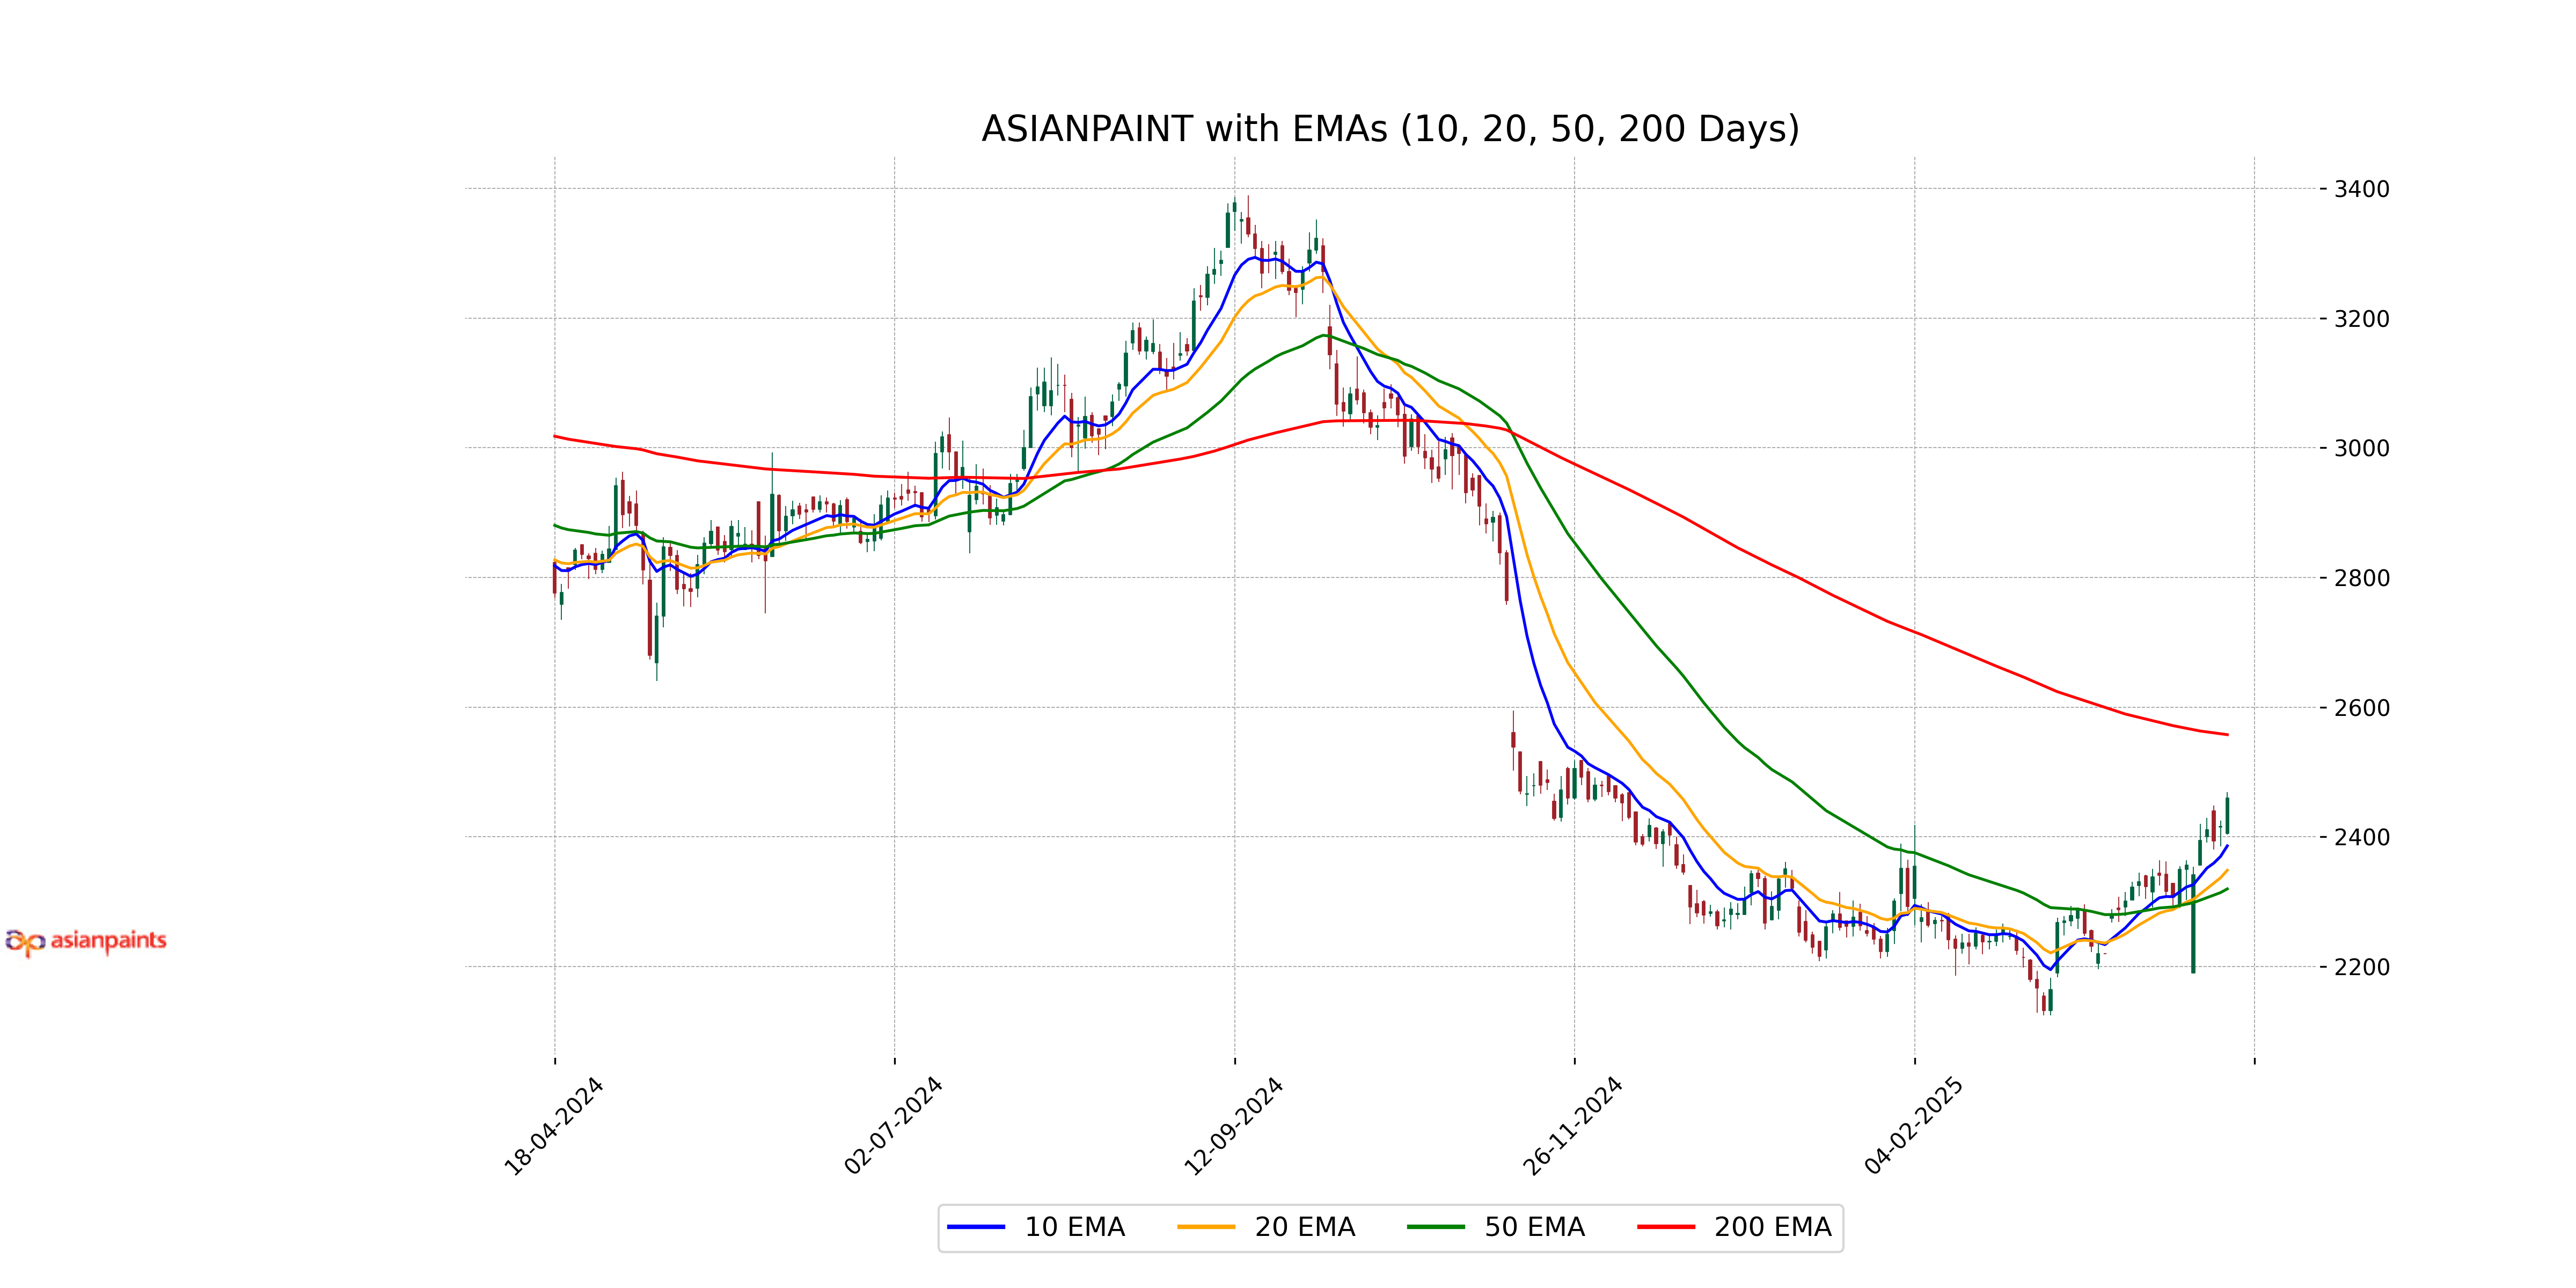
Relationship with Key Moving Averages
Asian Paints' closing price of 2459.90 is above its 50-day EMA of 2319.55 and 10-day EMA of 2385.95, indicating a short-term bullish trend. However, its closing price is below the 200-day EMA of 2557.47, suggesting an overall bearish trend in the longer term.
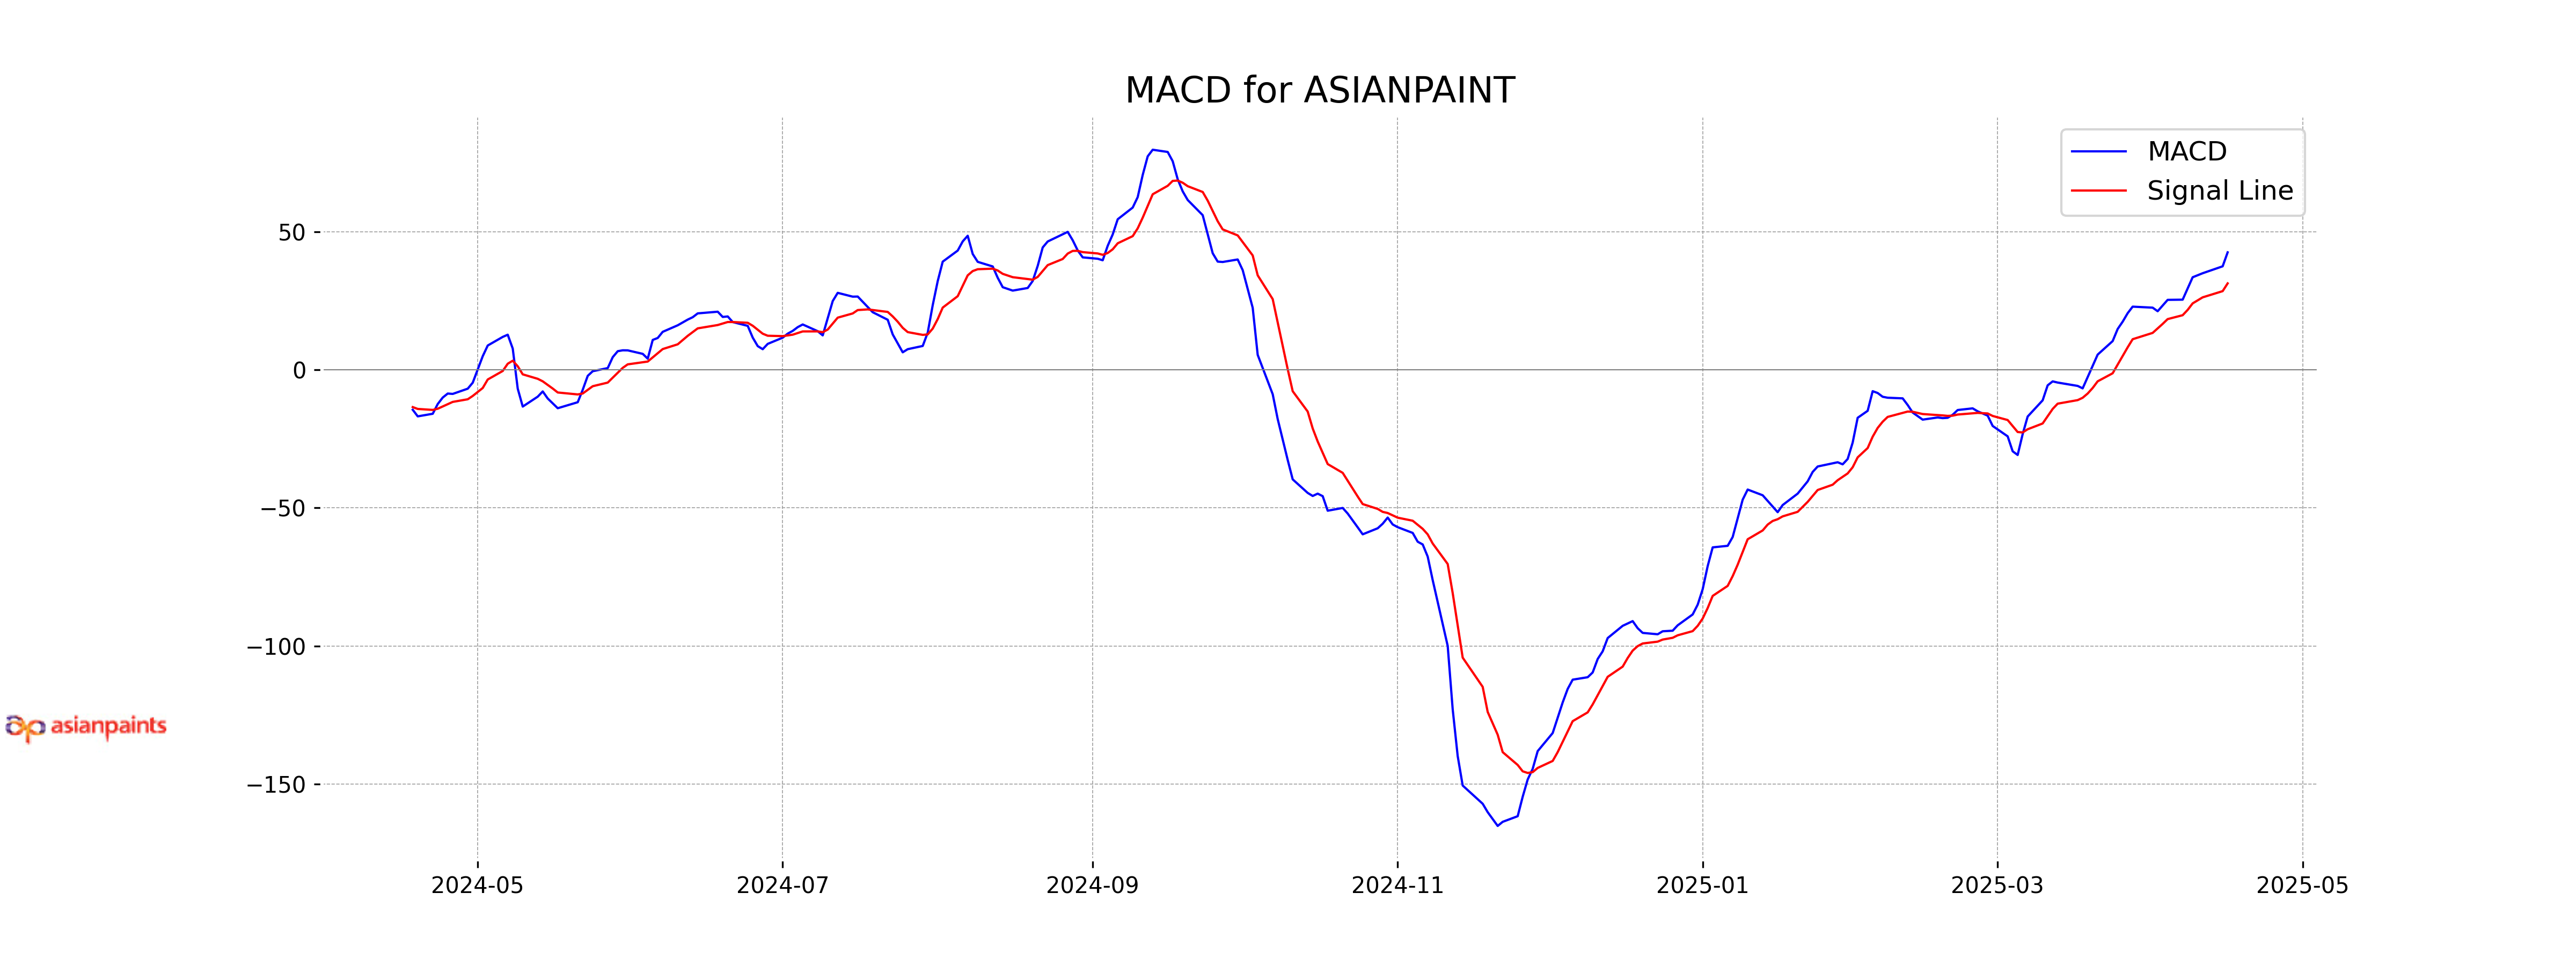
Moving Averages Trend (MACD)
According to the data, Asian Paints has a MACD value of 42.57, with a MACD Signal of 31.33. This indicates that the stock is experiencing a bullish momentum, as the MACD is above the signal line and the histogram difference represents a positive trend.
RSI Analysis
RSI Analysis for Asian Paints: The Relative Strength Index (RSI) for Asian Paints is at 71.85, indicating that the stock is in the overbought territory. This suggests a potential for a price correction or a pullback in the near term.
Analysis for Axis Bank - April 16, 2025
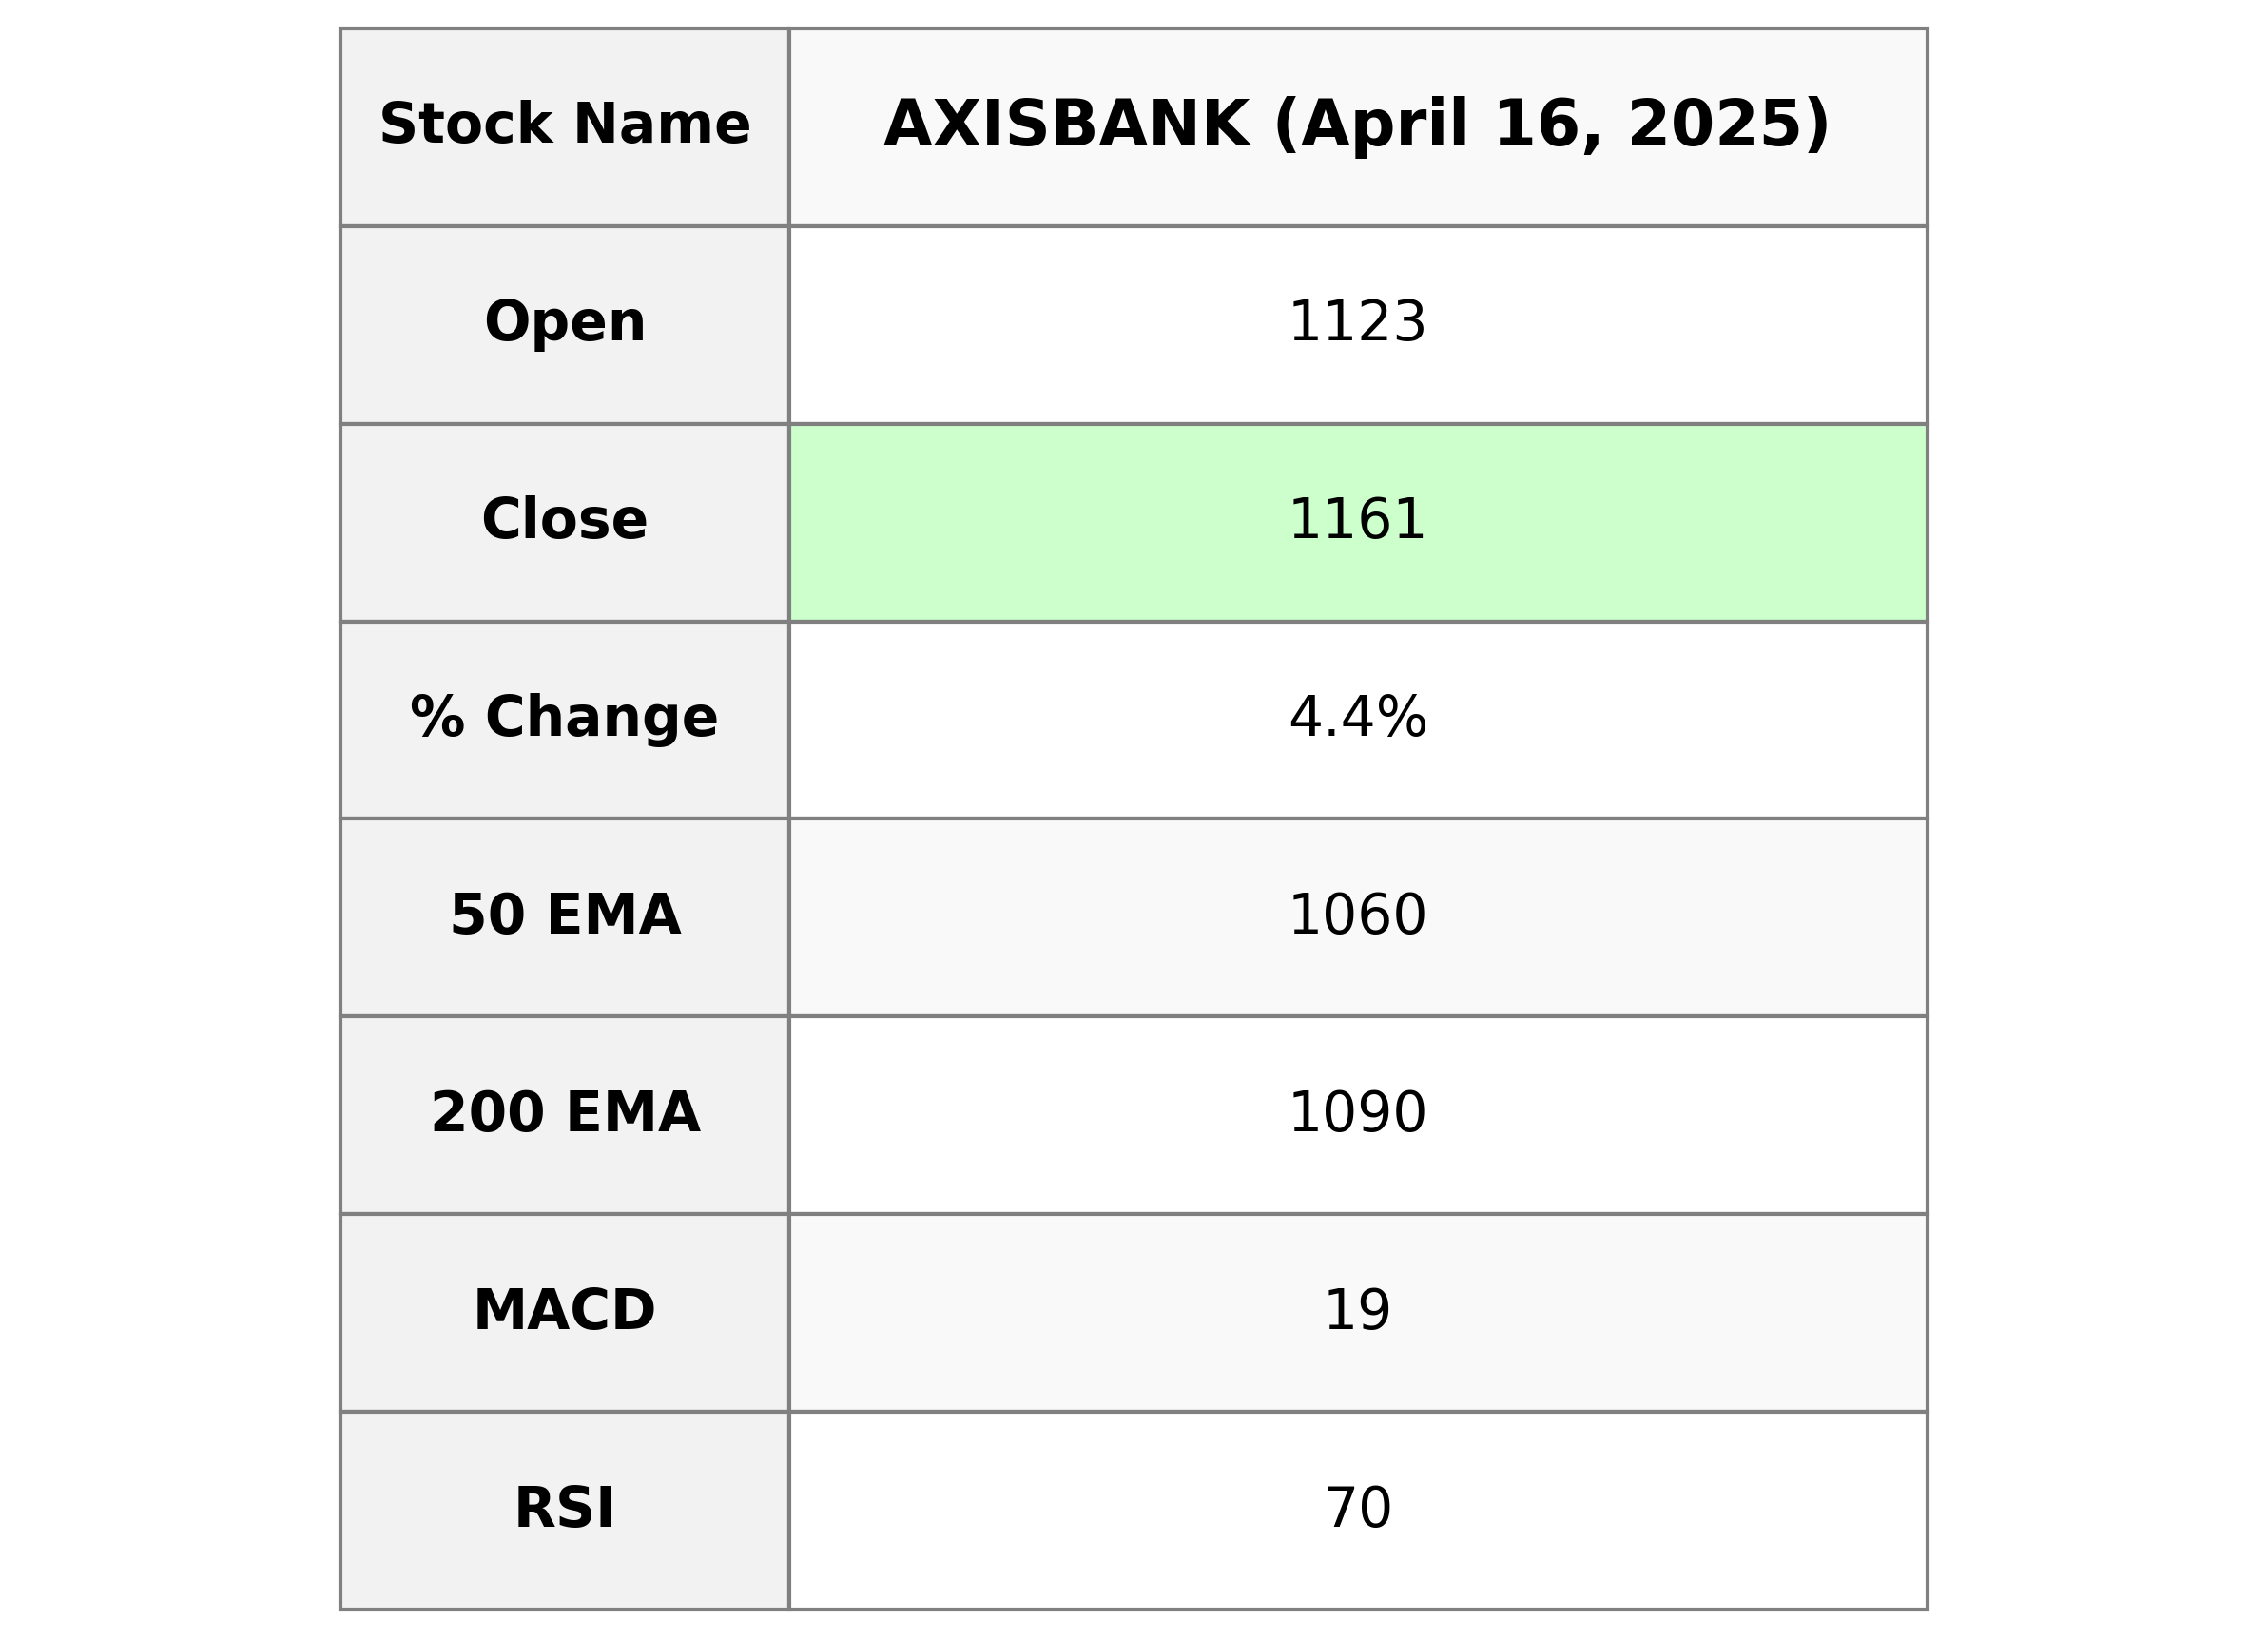
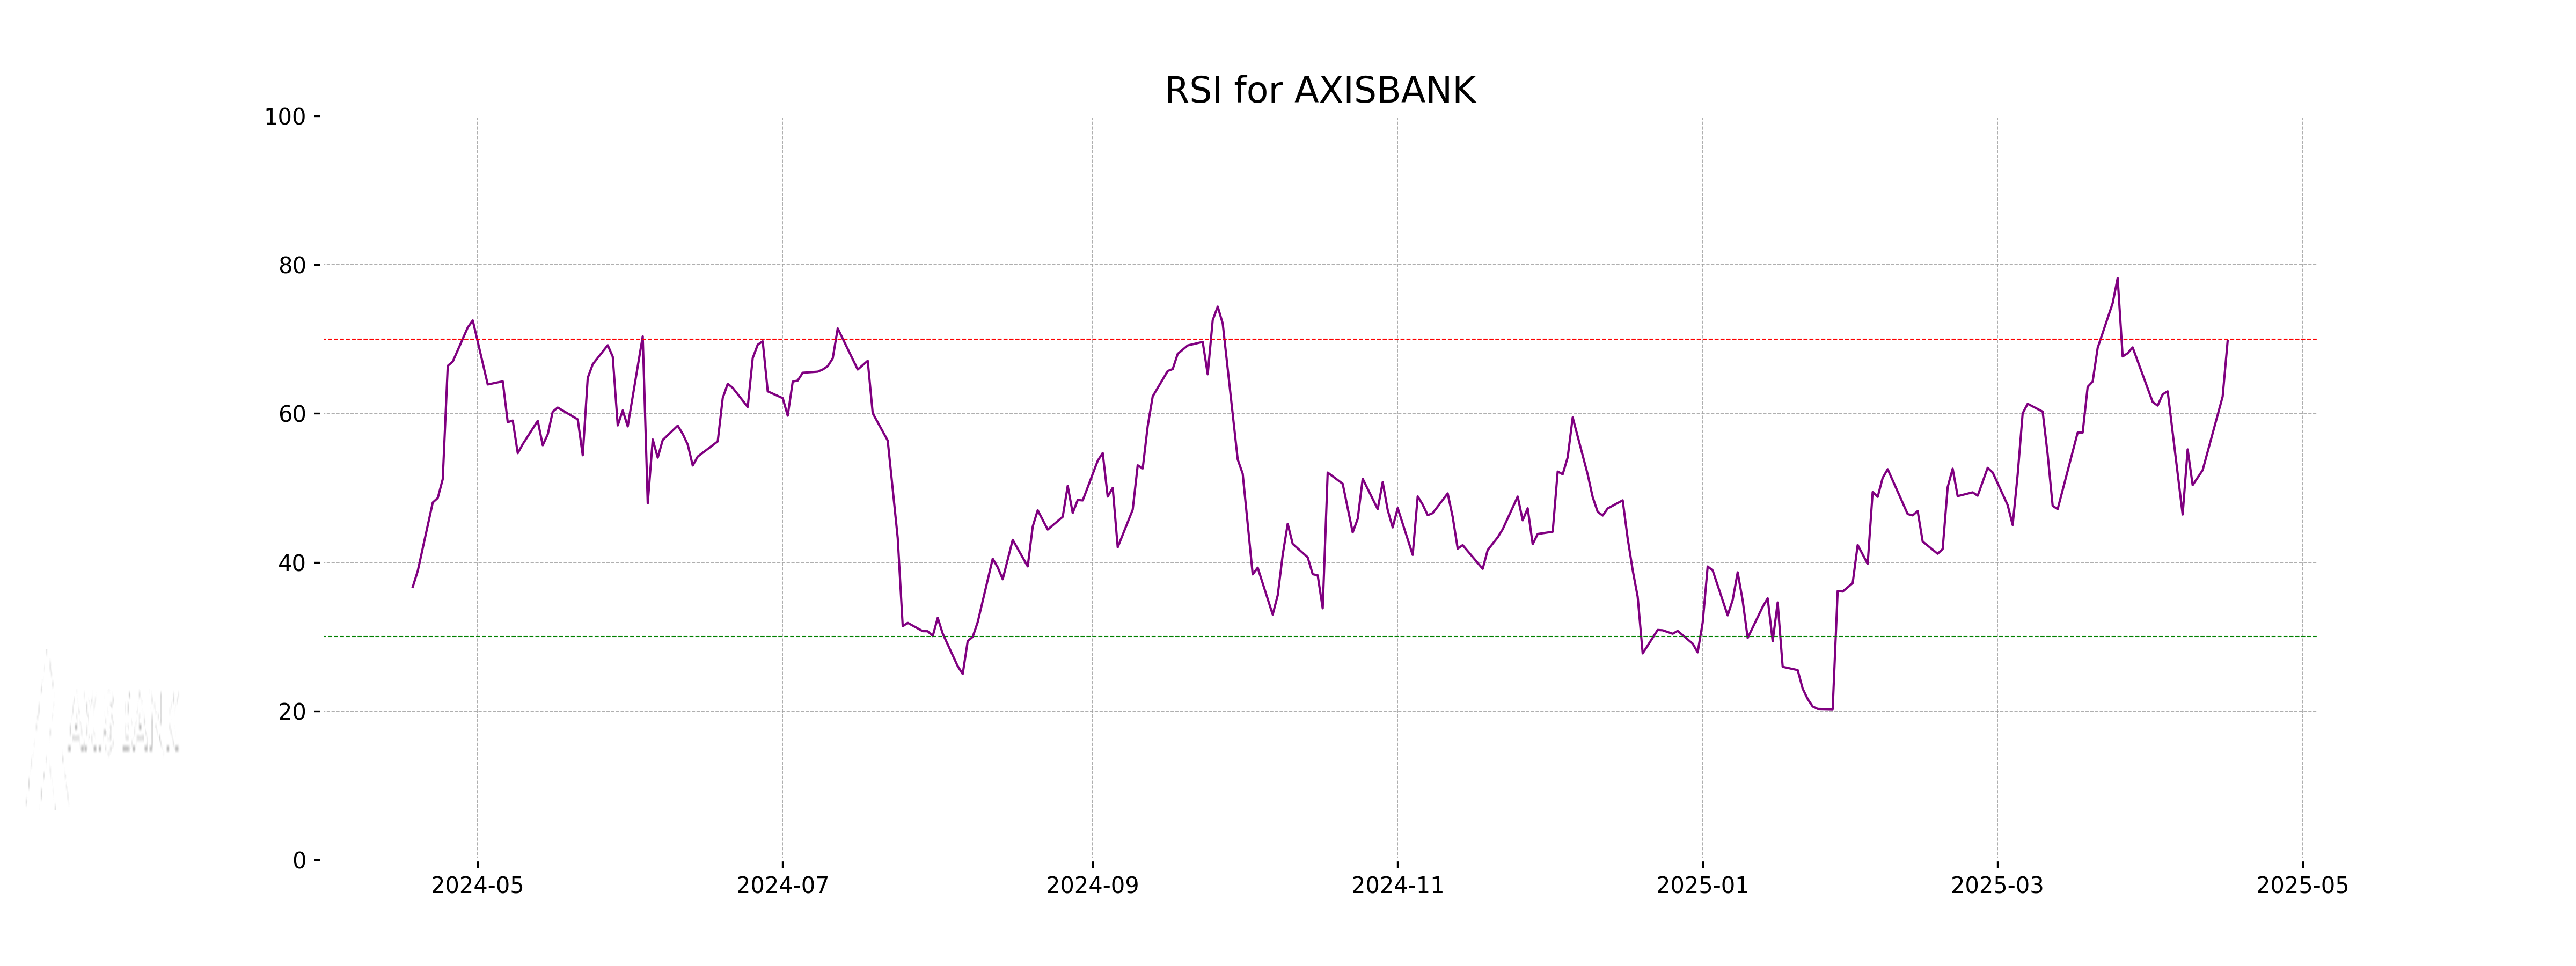
### Axis Bank Performance Axis Bank experienced a notable increase, closing at 1161.30, up by 4.36% from its previous close of 1112.80, with a significant volume of 12,835,706 shares. The stock's RSI is at 69.76, indicating it is close to overbought conditions, and it also shows a positive momentum with a MACD above its signal line at 19.25.
Relationship with Key Moving Averages
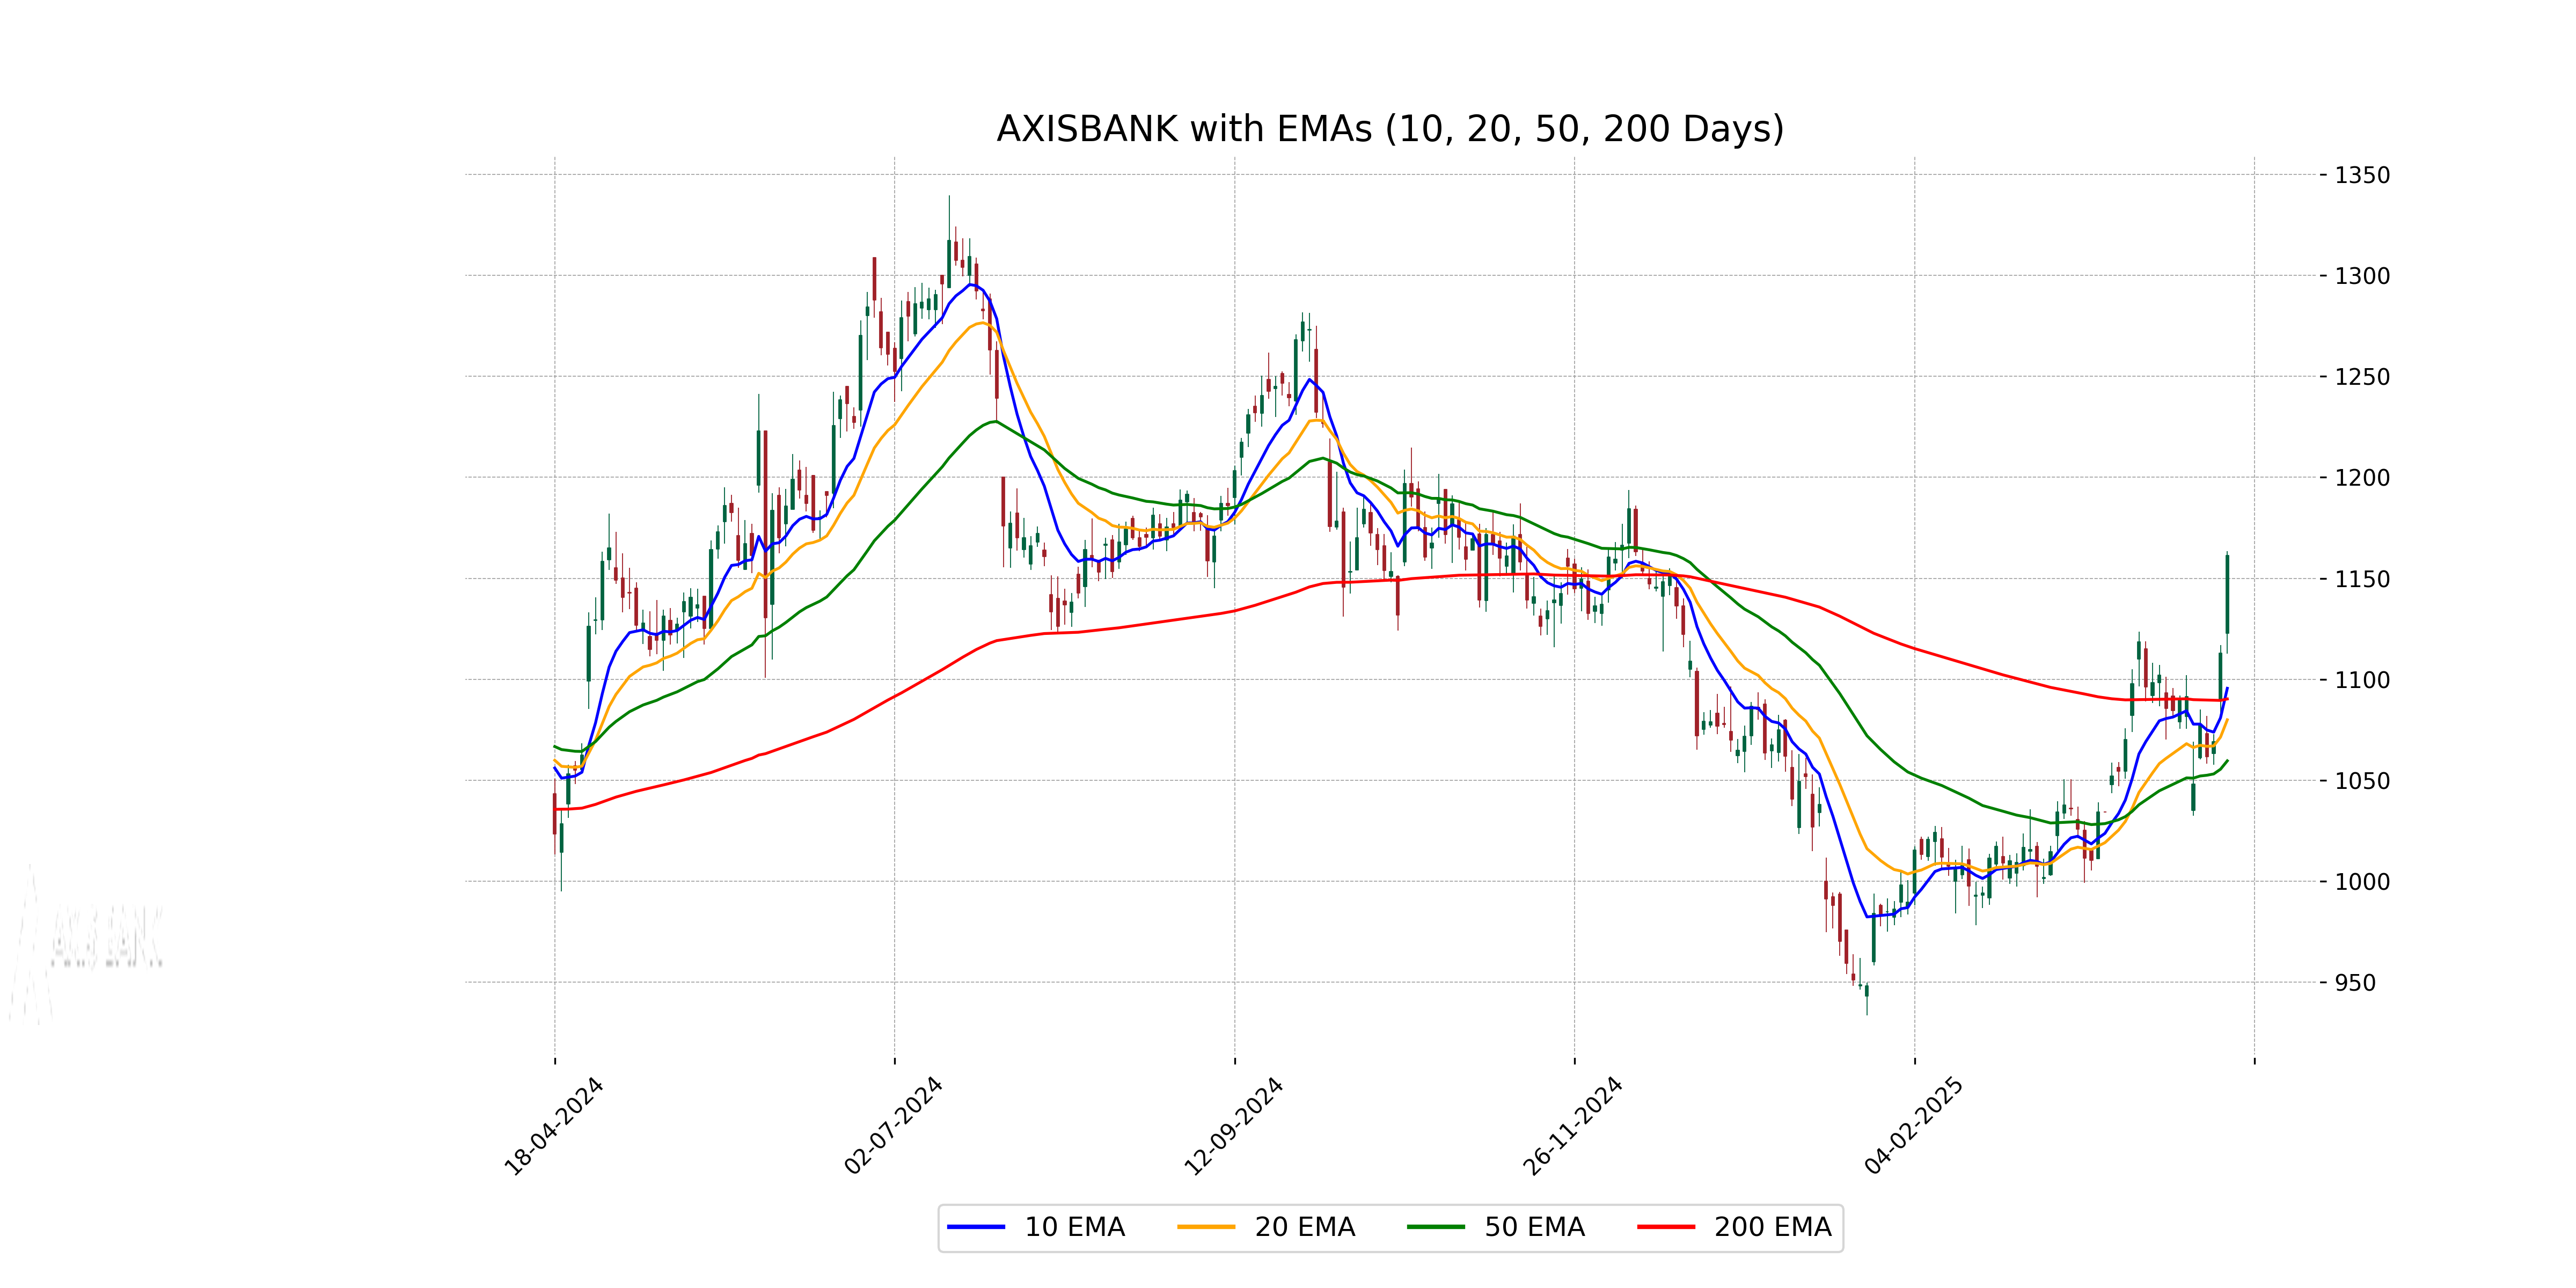
Axis Bank's current closing price of 1161.30 is above all key moving averages, with the 50 EMA at 1059.54, the 200 EMA at 1090.19, and the 10 EMA at 1095.48, indicating a strong upward momentum in the stock. This suggests bullish tendencies as the stock is trading above both its short-term and long-term moving averages.
Moving Averages Trend (MACD)
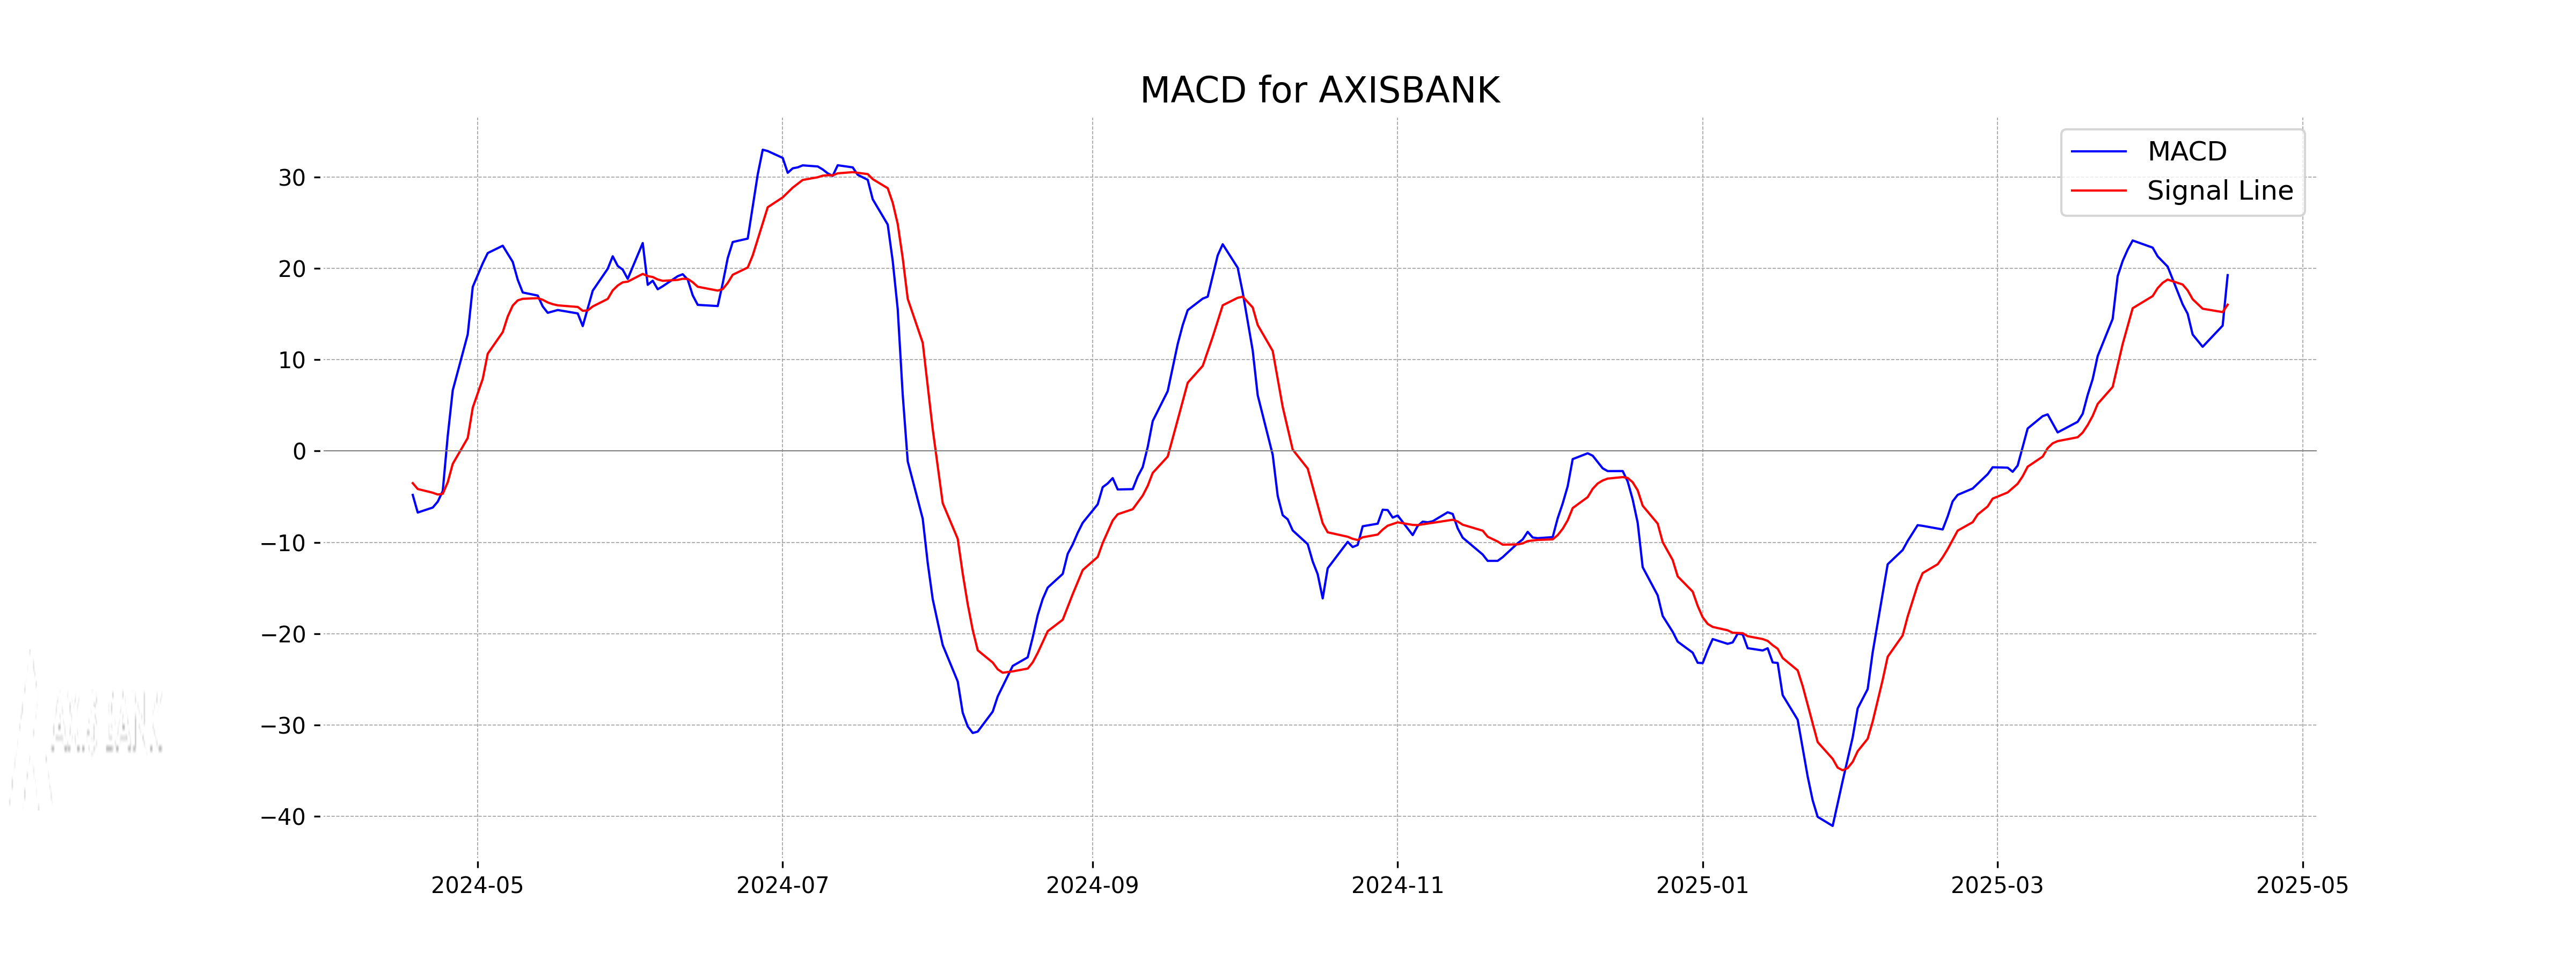
MACD Analysis for Axis Bank: The MACD for Axis Bank is 19.25, with a signal line of 16.02, indicating a bullish trend as the MACD line is above the signal line. This suggests upward momentum in the stock, which is further corroborated by the RSI value of 69.76, hinting at a near overbought condition.
RSI Analysis
RSI Analysis for Axis Bank: Axis Bank's RSI (Relative Strength Index) is at 69.76, which is close to the overbought threshold of 70. This indicates that the stock is nearing overbought conditions, suggesting that it may be due for a pullback or consolidation. Investors should monitor the RSI closely for potential trend reversals.
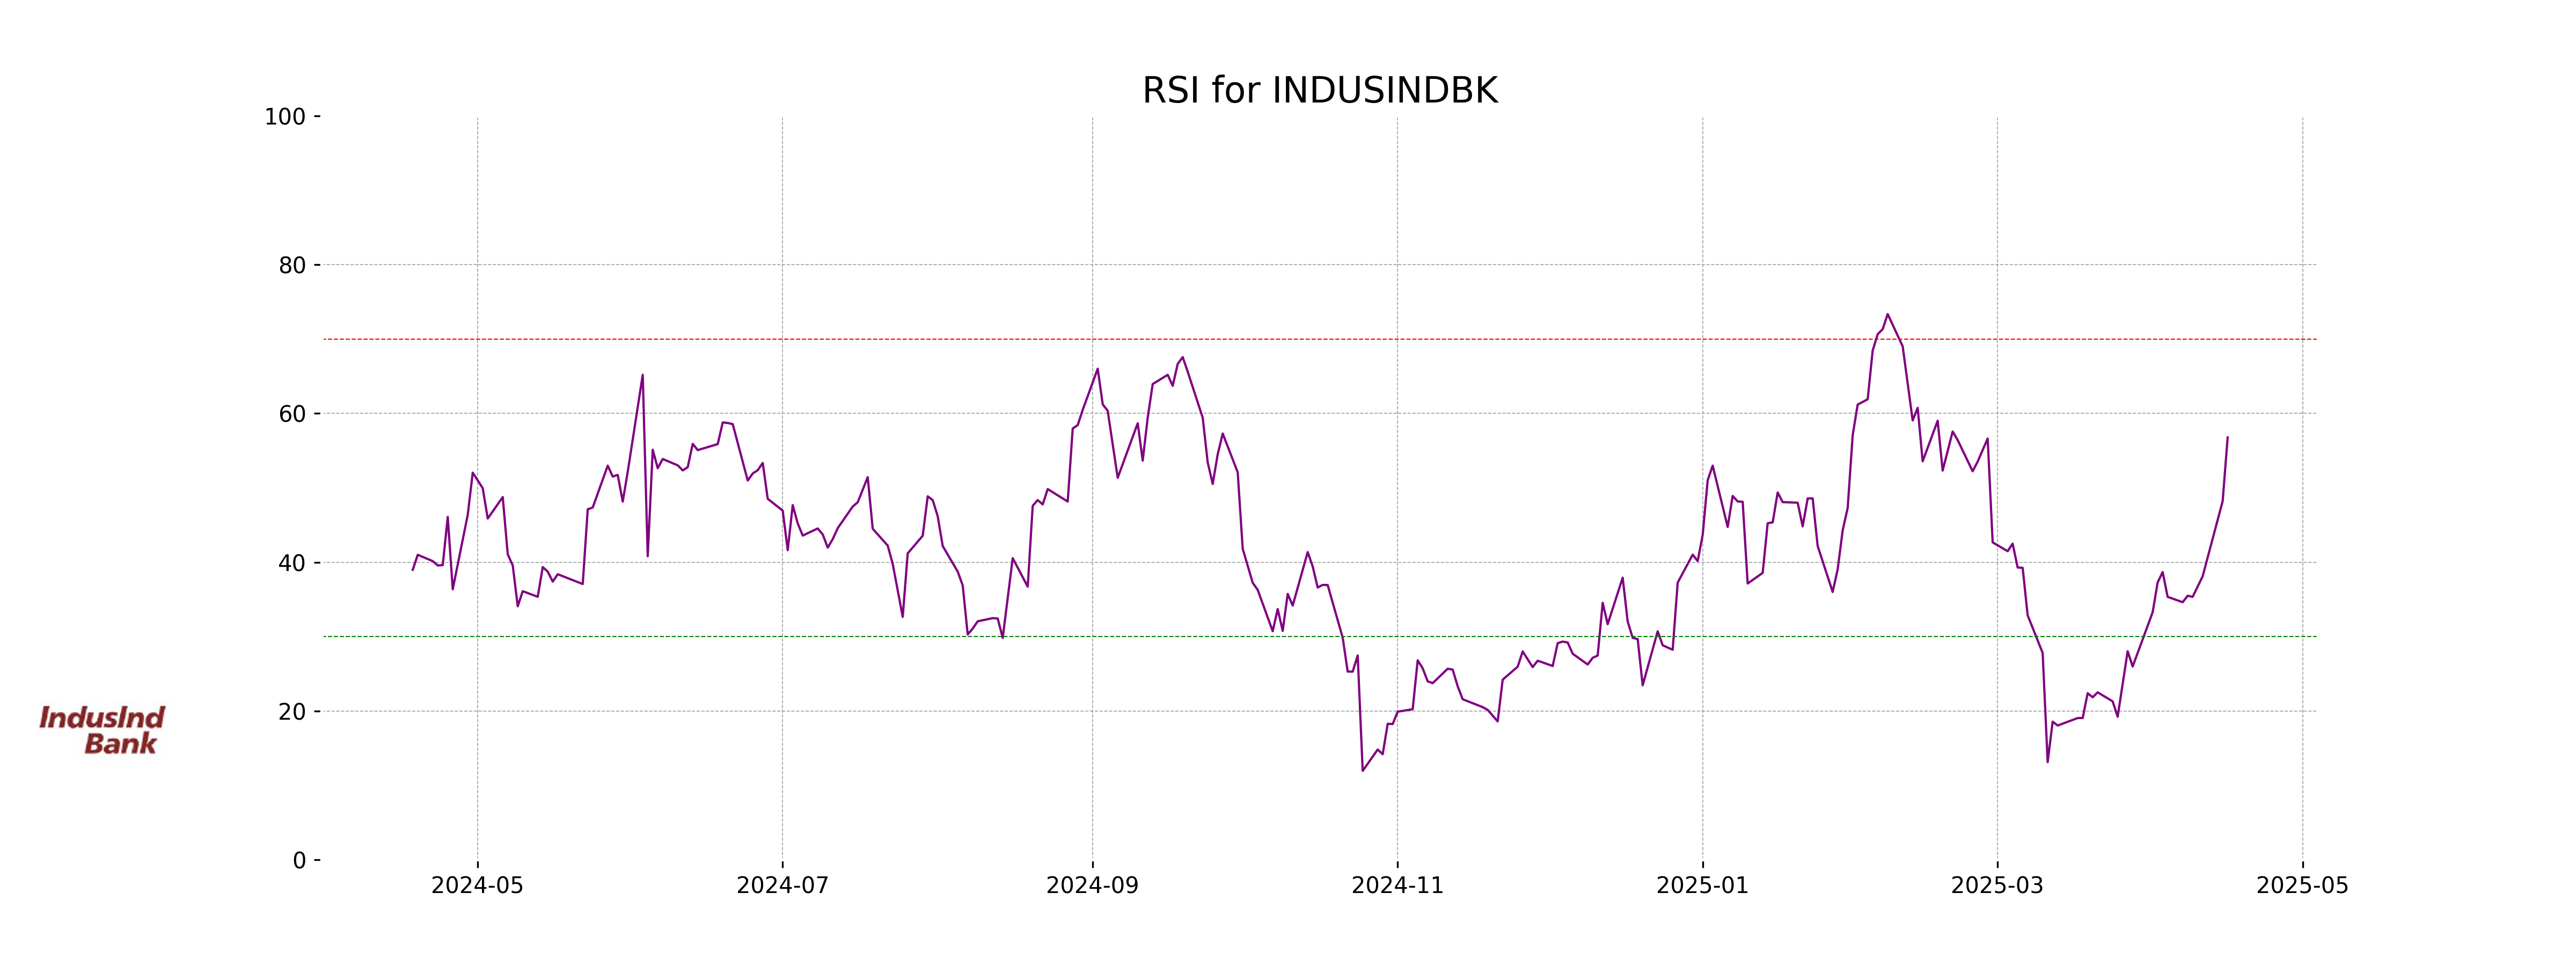
Analysis for IndusInd Bank - April 16, 2025
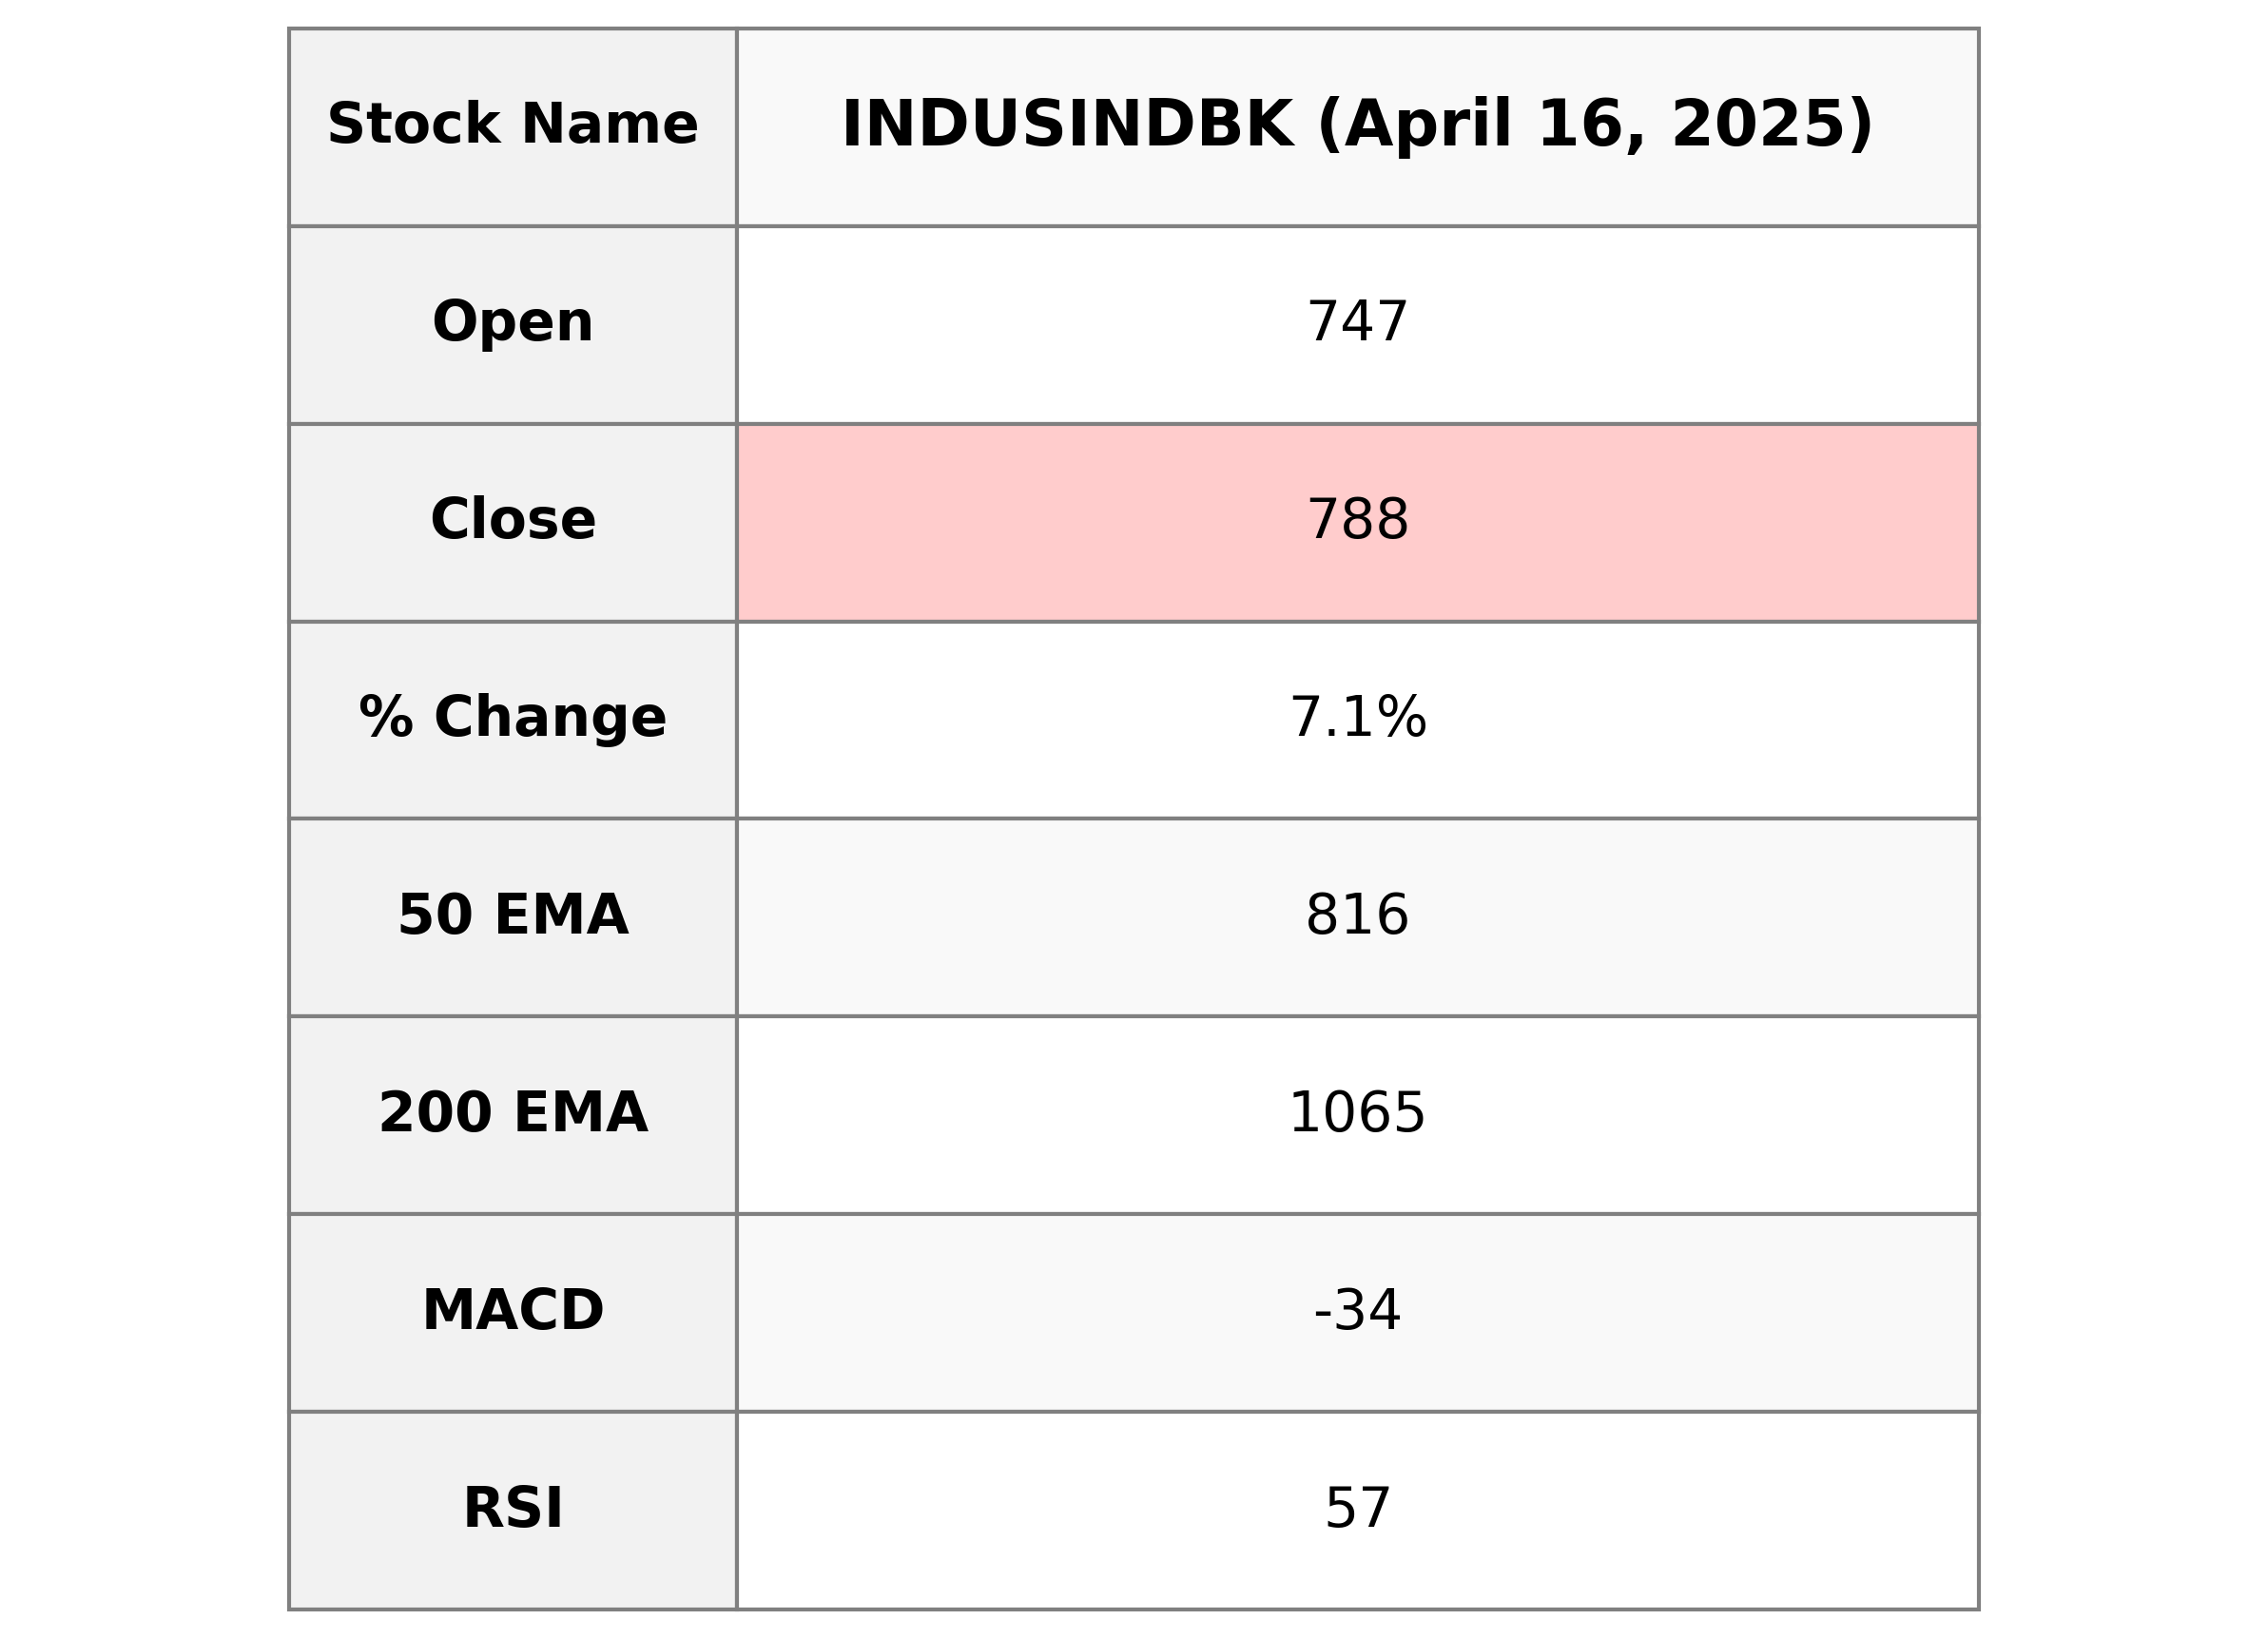
IndusInd Bank showed a strong performance with a closing price of 788.25, marking a 7.11% increase from its previous close. The stock observed a high trading volume of 31,250,868, highlighting significant investor interest. Despite the positive momentum, its 50-day and 200-day EMAs indicate it is trading below its average trends, with the current market context reflected in the MACD and RSI indicators. IndusInd Bank has a market capitalization of 614.09 billion INR and a PE ratio of 8.47, positioned within the financial services sector in India.
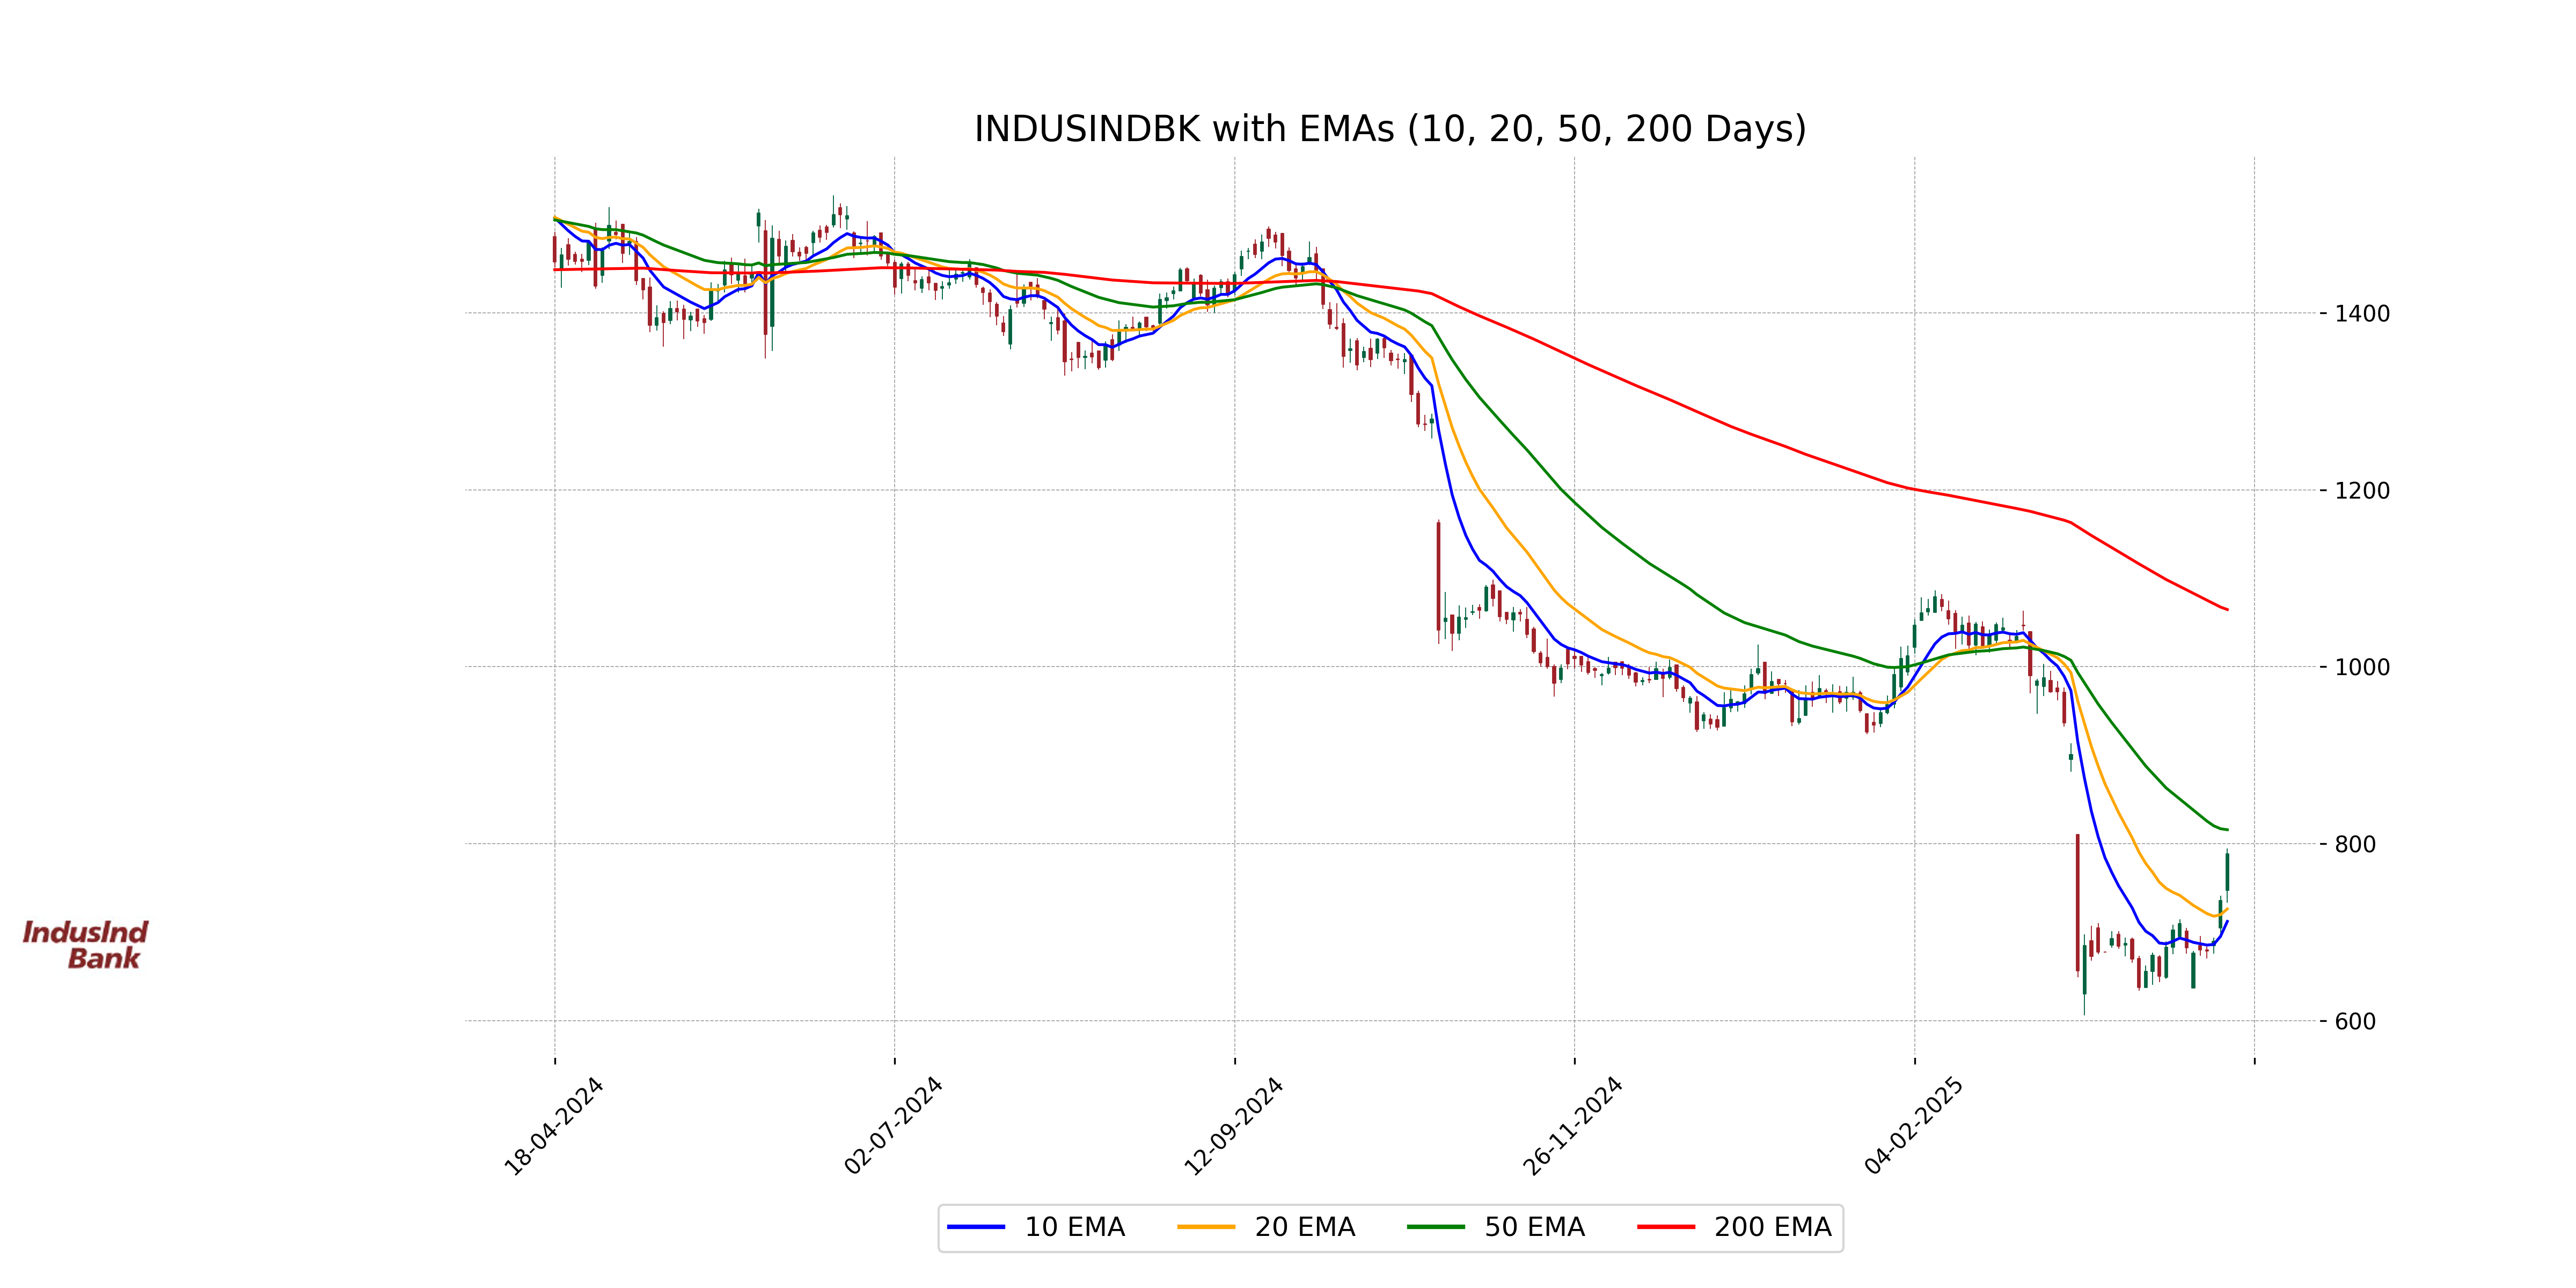
Relationship with Key Moving Averages
IndusInd Bank's current stock price of 788.25 is trading below its 50-day EMA of 815.74 and significantly below its 200-day EMA of 1064.76, indicating potential short and long-term downward trends. However, the stock is trading above its 10-day and 20-day EMAs, suggesting some recent positive momentum.
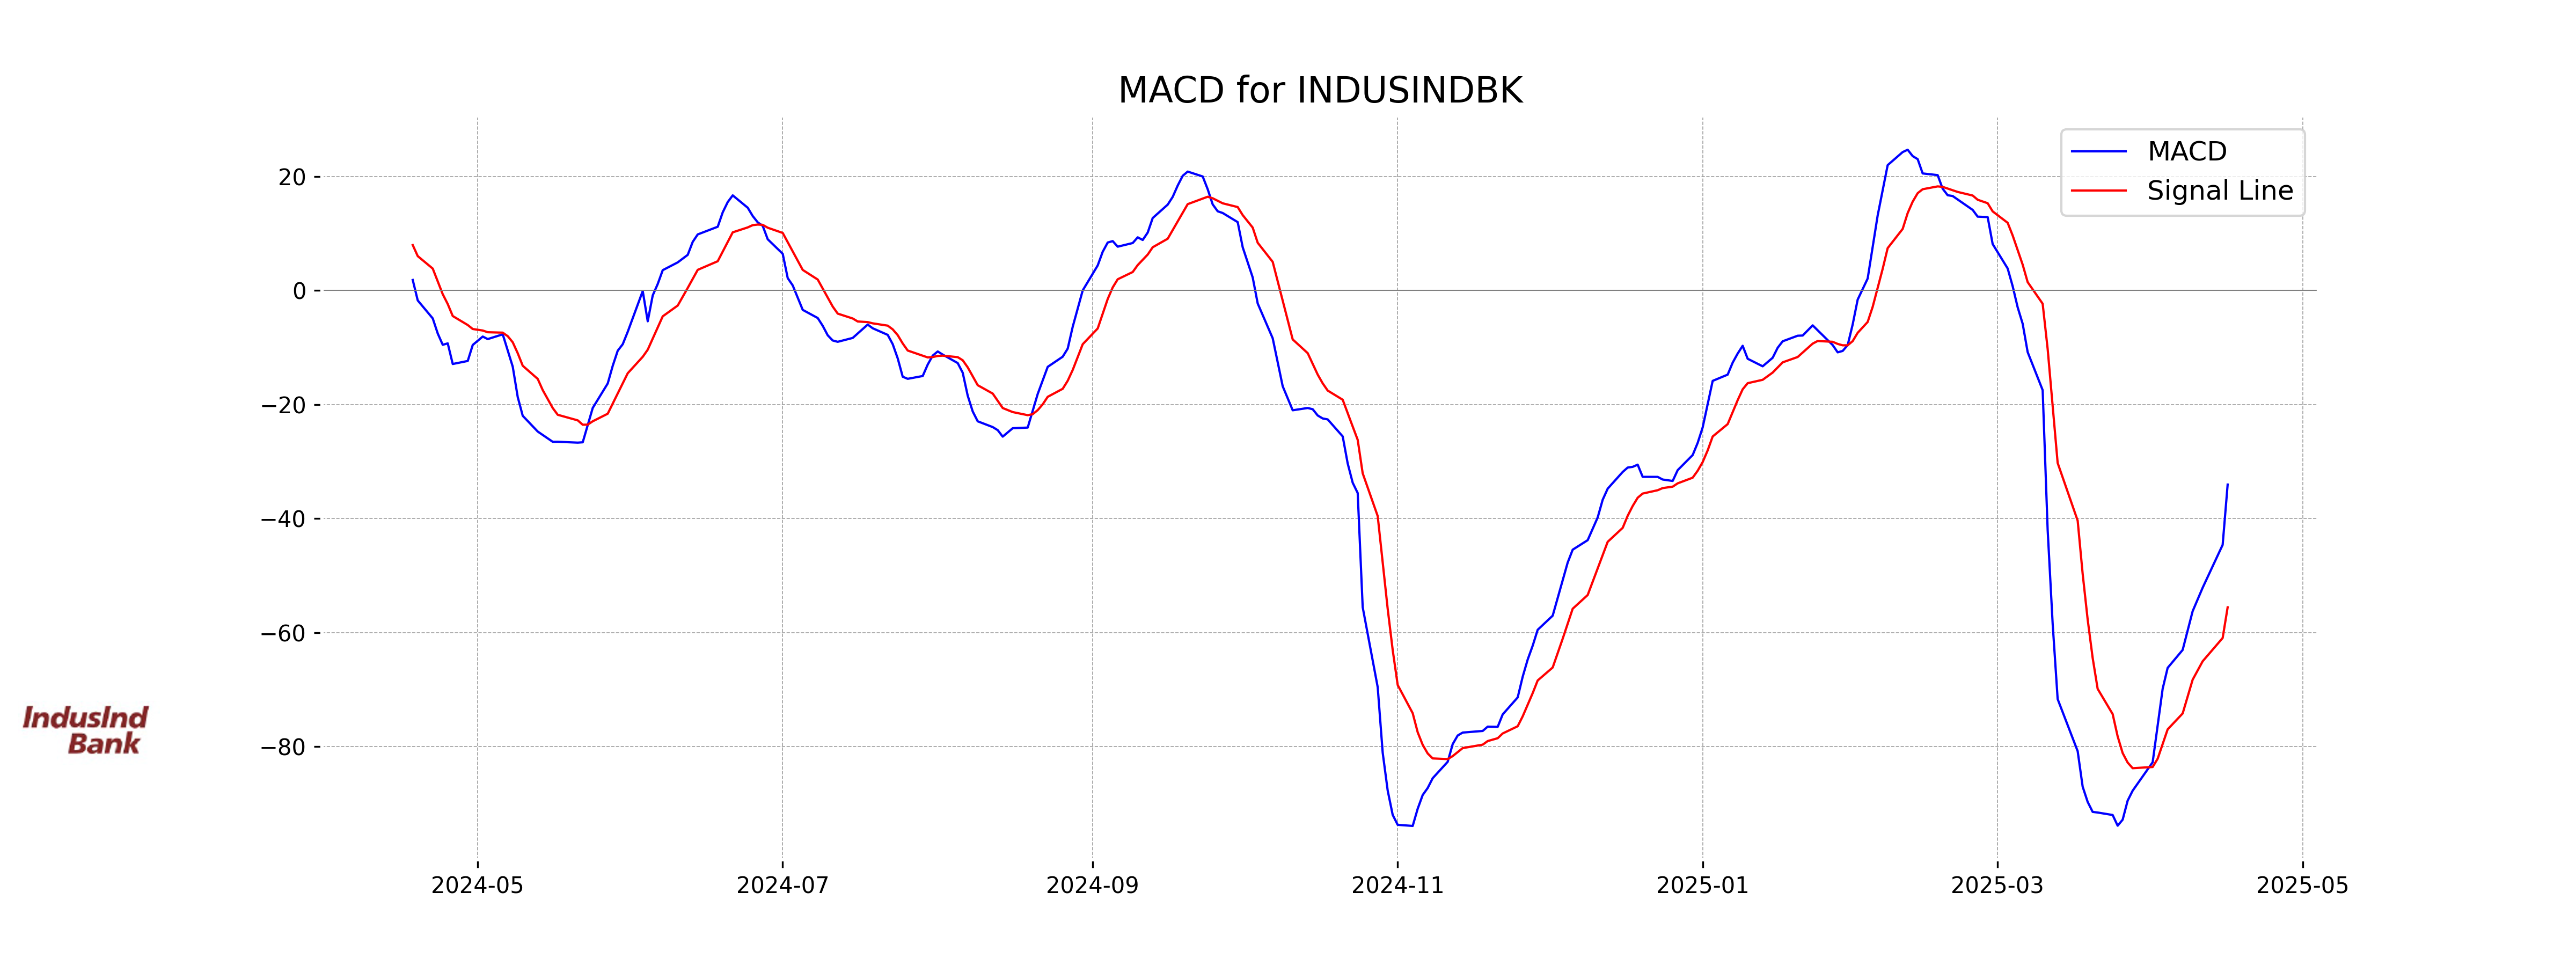
Moving Averages Trend (MACD)
The current MACD for IndusInd Bank is -34.03, while the MACD Signal is -55.56, indicating a bullish crossover likely due to recent upward momentum in the stock price. This suggests a potential buy signal as the MACD is moving closer to converging with the Signal line.
RSI Analysis
The RSI for IndusInd Bank is 56.78, suggesting a neutral market stance. This value indicates neither overbought nor oversold conditions, suggesting a stable price movement in the near term.
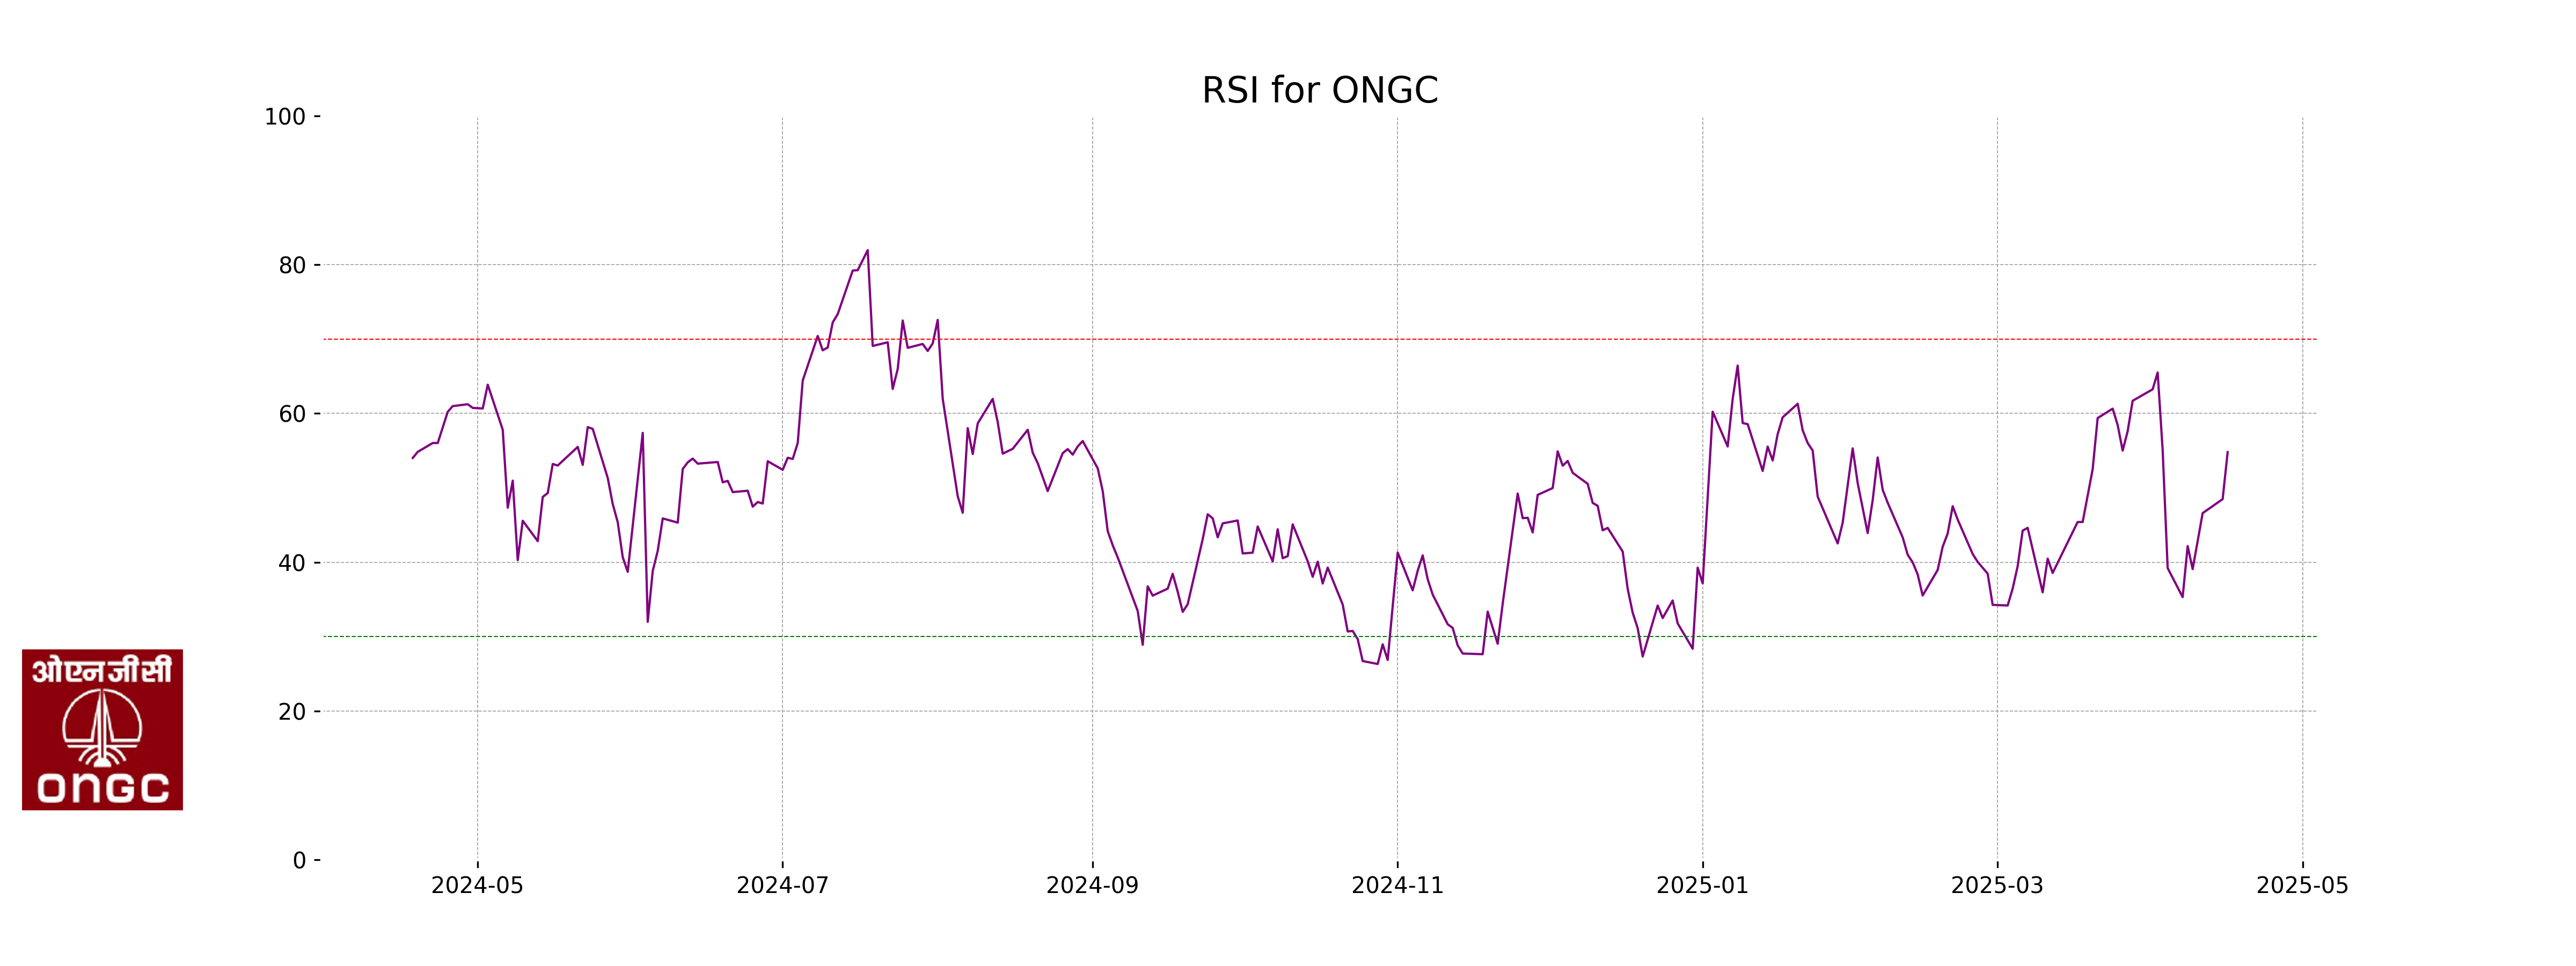
Analysis for ONGC - April 16, 2025
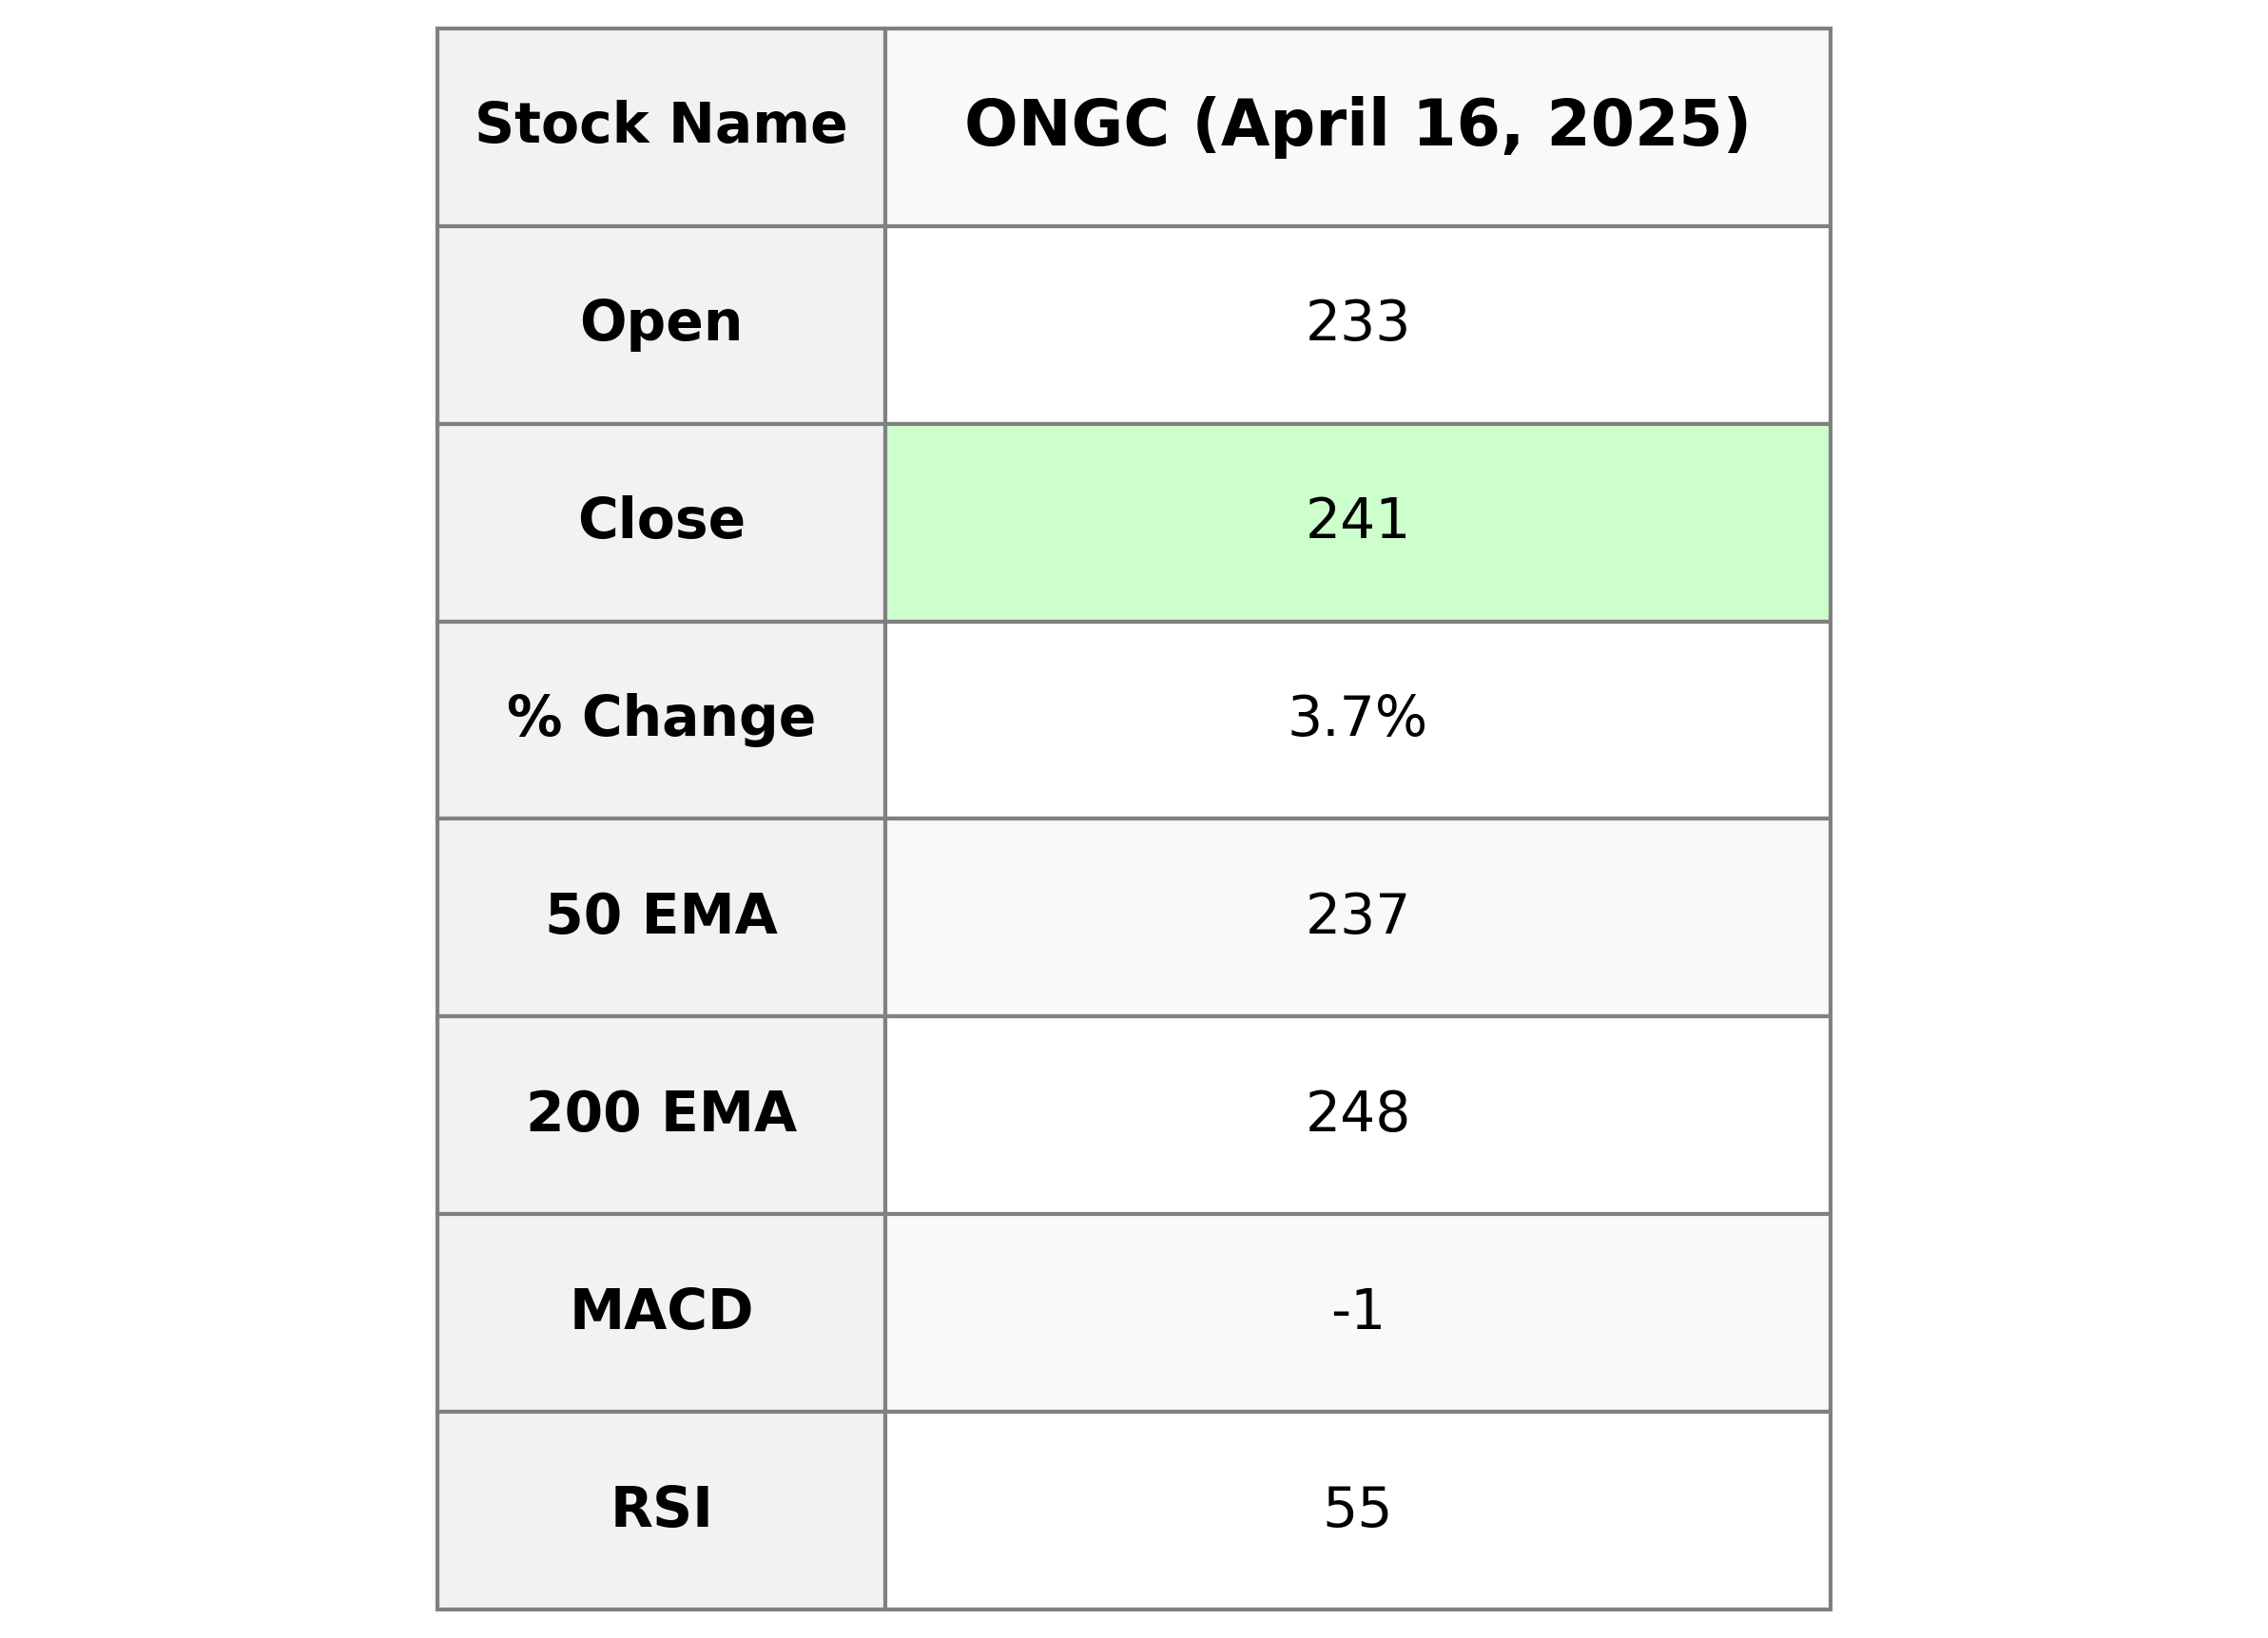
### Stock Name: ONGC Performance Overview: ONGC showed a strong performance with a closing price of 241.22, up from the previous close of 232.69, marking a notable percentage change of 3.67%. The company is part of the Energy sector in the Oil & Gas Integrated industry in India. The relative strength index (RSI) is moderate at 54.80, indicating neither overbought nor oversold conditions, while the moving averages suggest a current bearish signal with the MACD below the signal line. The market cap stands at a significant 3,035.4 billion INR, with a price-to-earnings (PE) ratio of 7.78 and an earnings per share (EPS) of 31.02.
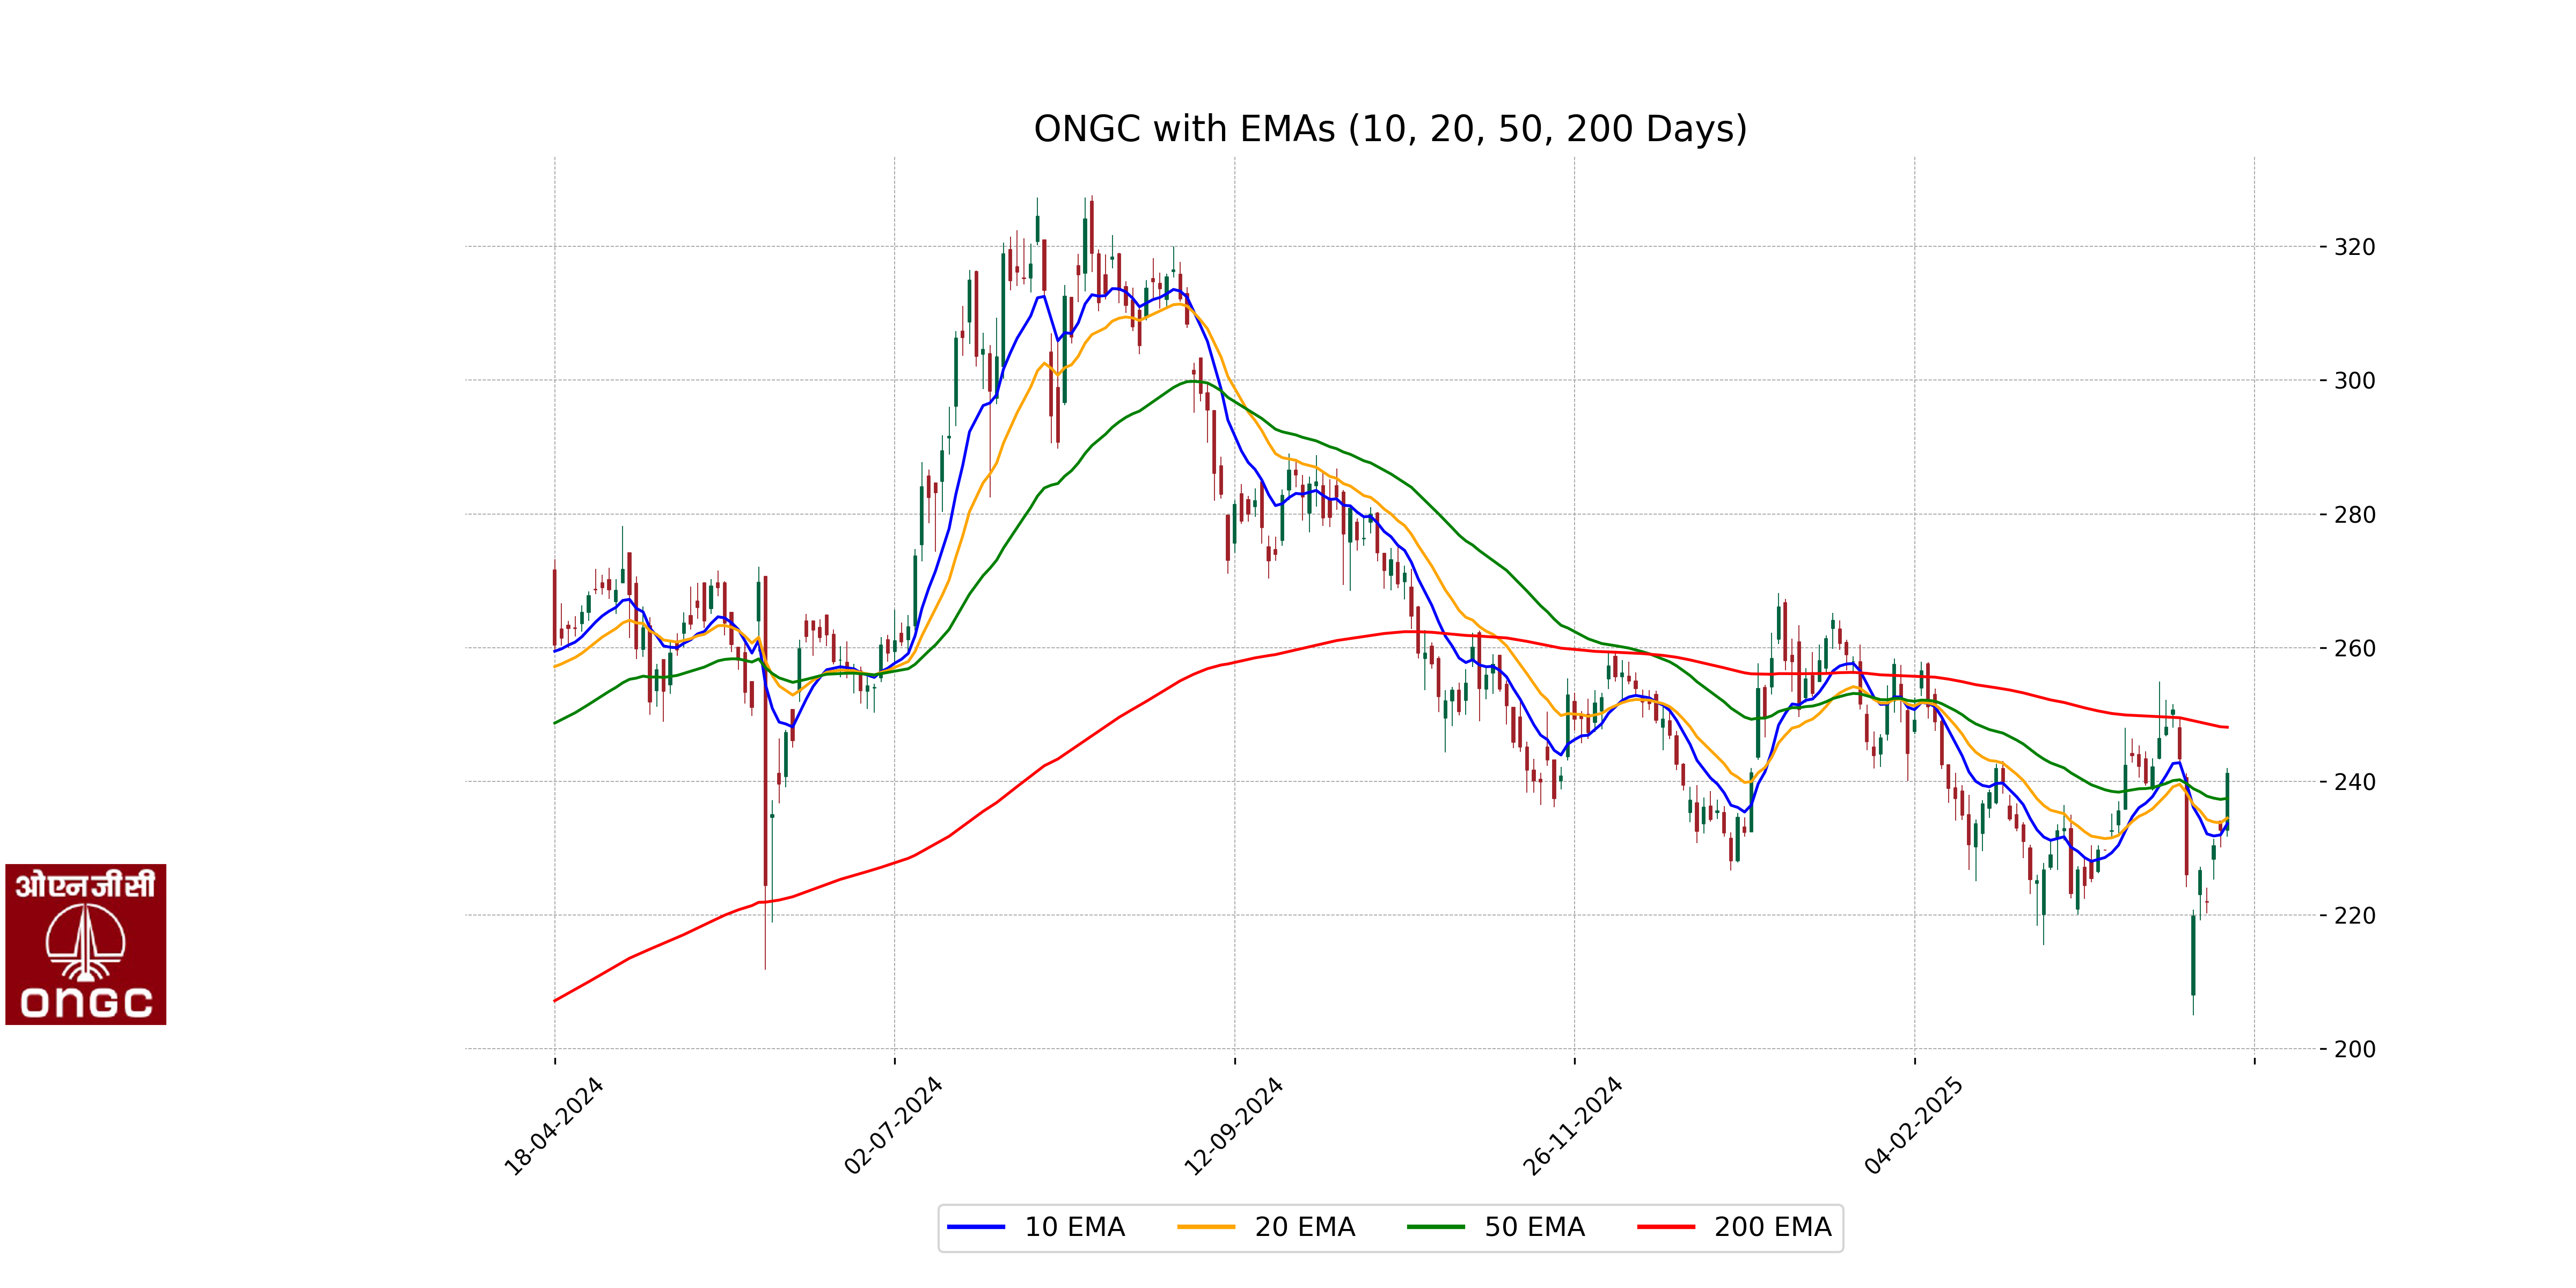
Relationship with Key Moving Averages
The current closing price of ONGC is 241.22, which is above the 50-day EMA of 237.44 but below the 200-day EMA of 248.08. This indicates a short-term bullish sentiment while the longer-term trend remains bearish.
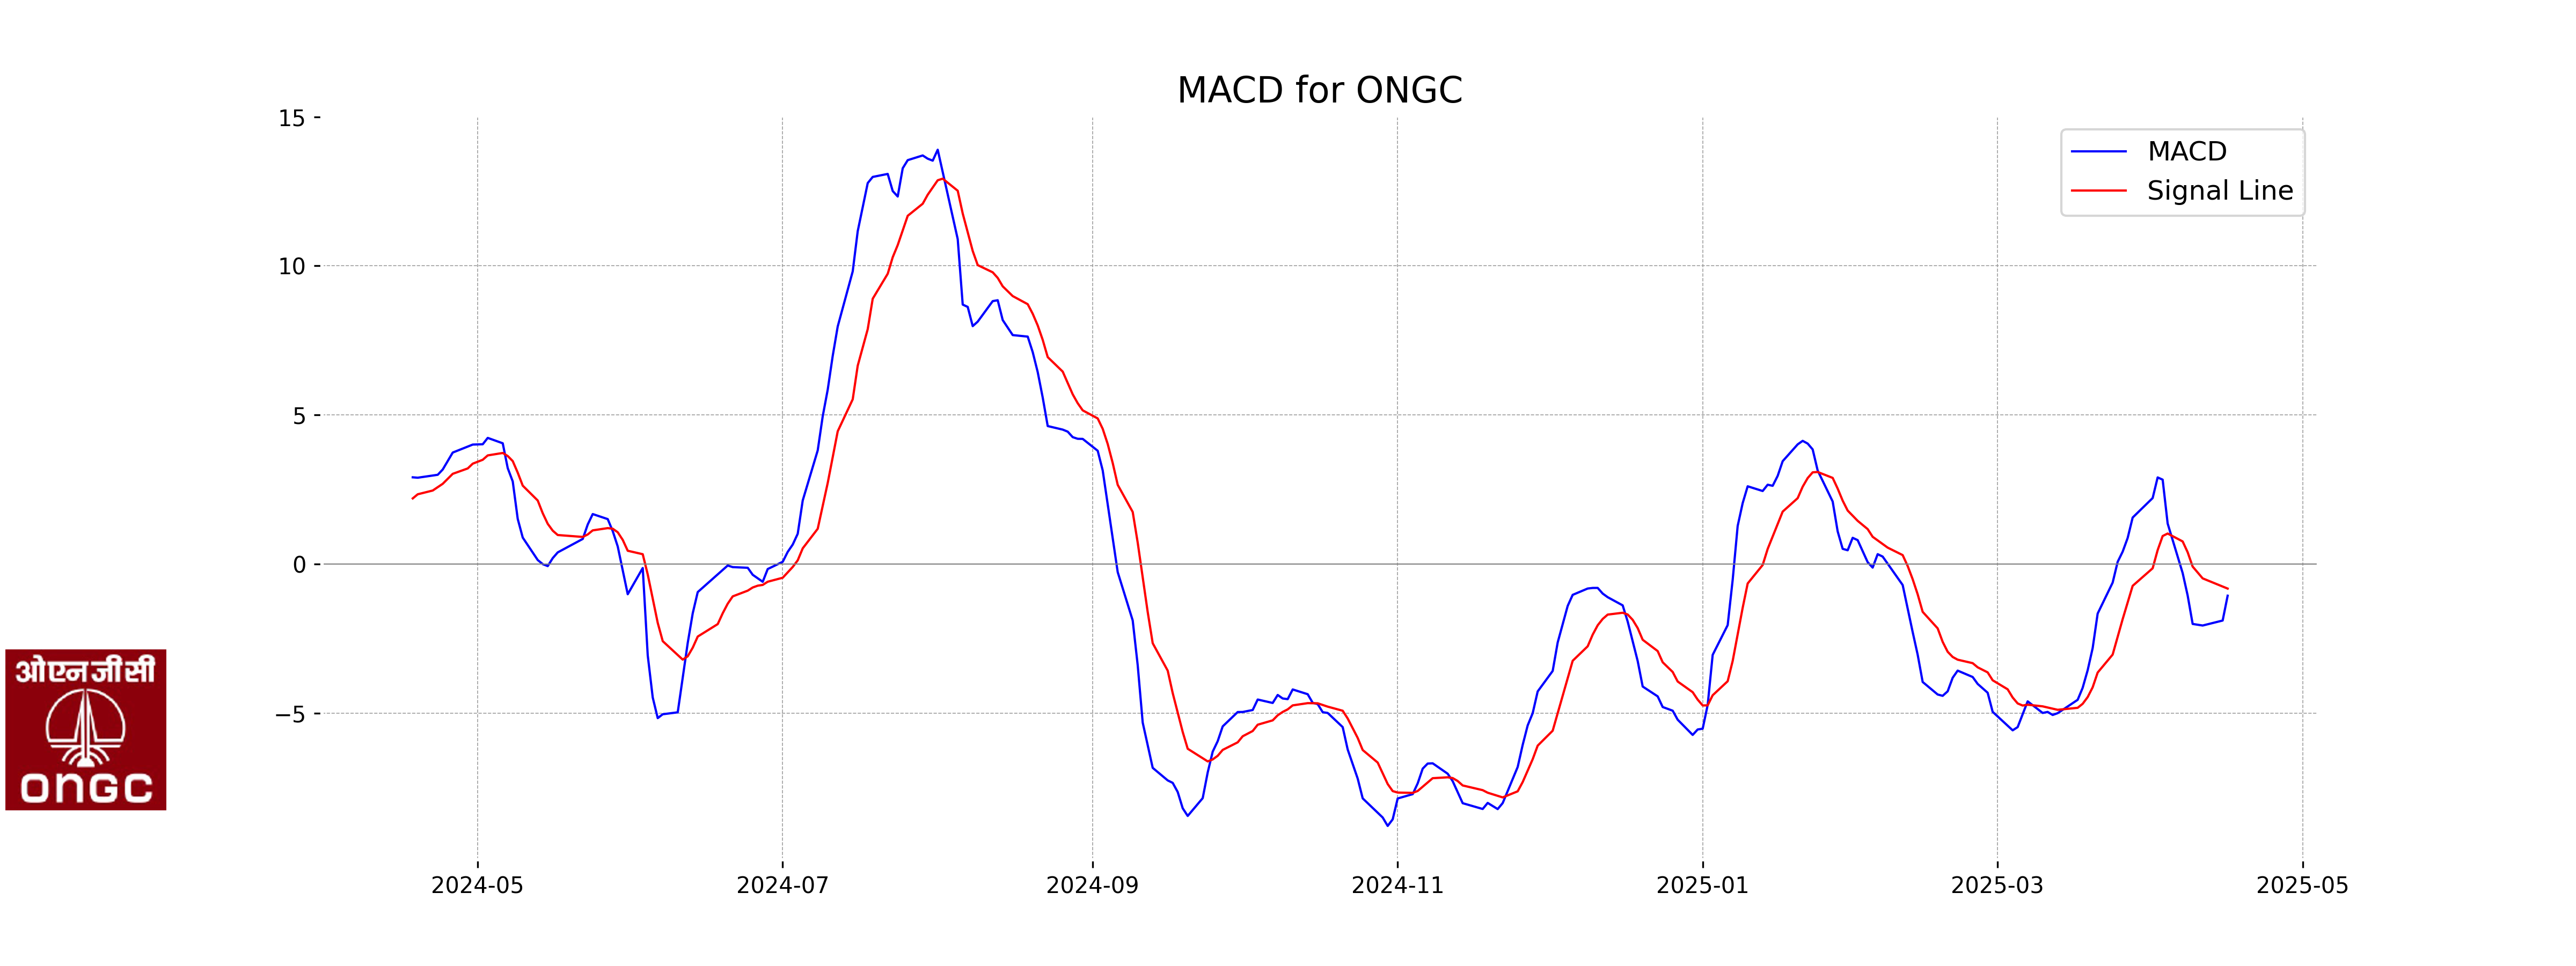
Moving Averages Trend (MACD)
Based on the analysis, ONGC's MACD value of -1.0634 is lower than its MACD Signal of -0.8247, which might indicate a bearish trend or signal a potential change in momentum. However, it's important to consider other factors such as market conditions and additional indicators before making trading decisions.
RSI Analysis
The Relative Strength Index (RSI) for ONGC is 54.80, which indicates a neutral market position. It suggests that the stock is neither overbought nor oversold, allowing room for further price movement in either direction. With an RSI close to 50, it's generally seen as balanced and does not show a strong trend either way.
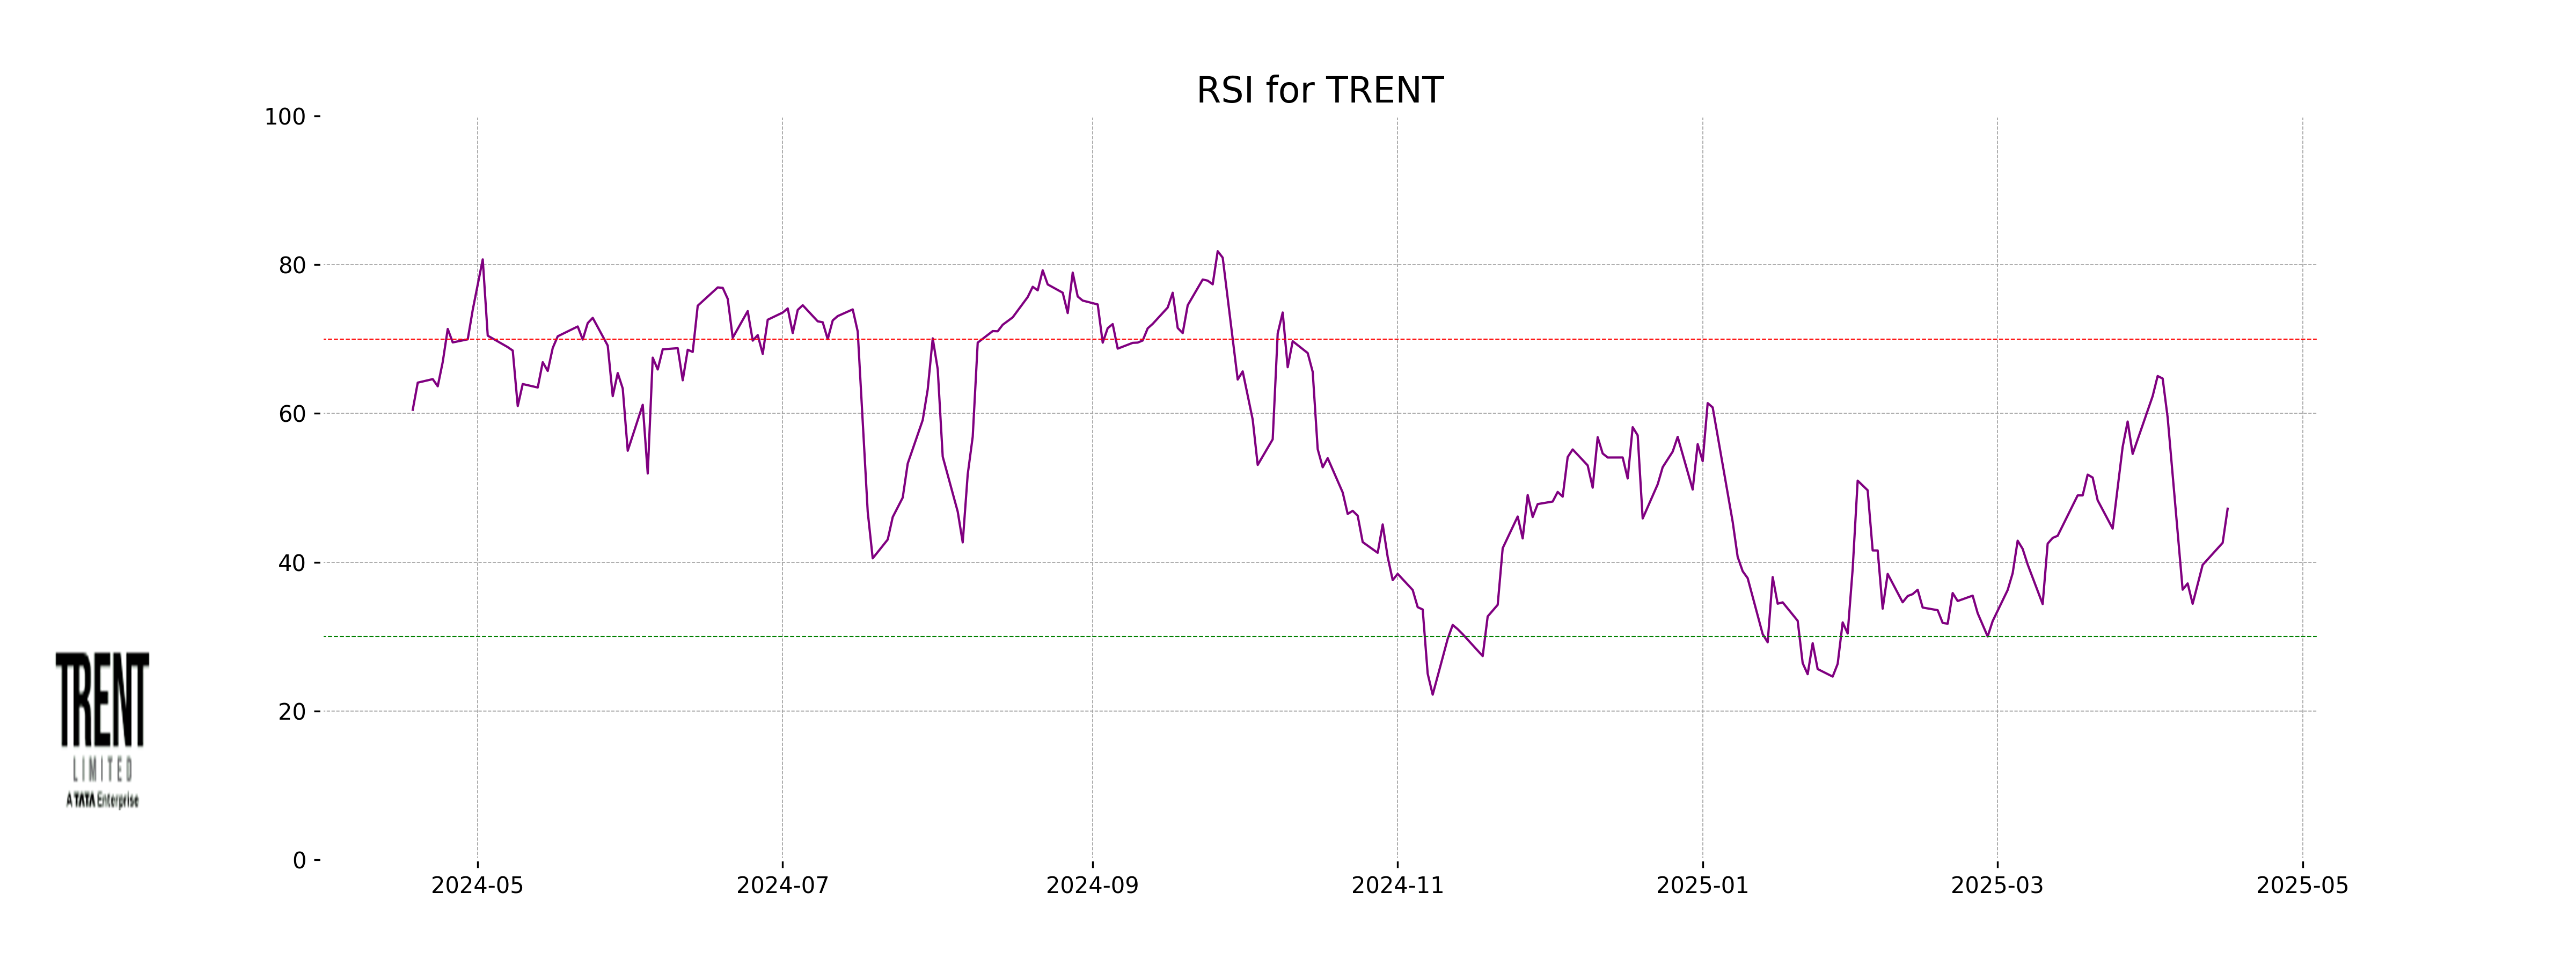
Analysis for Trent - April 16, 2025
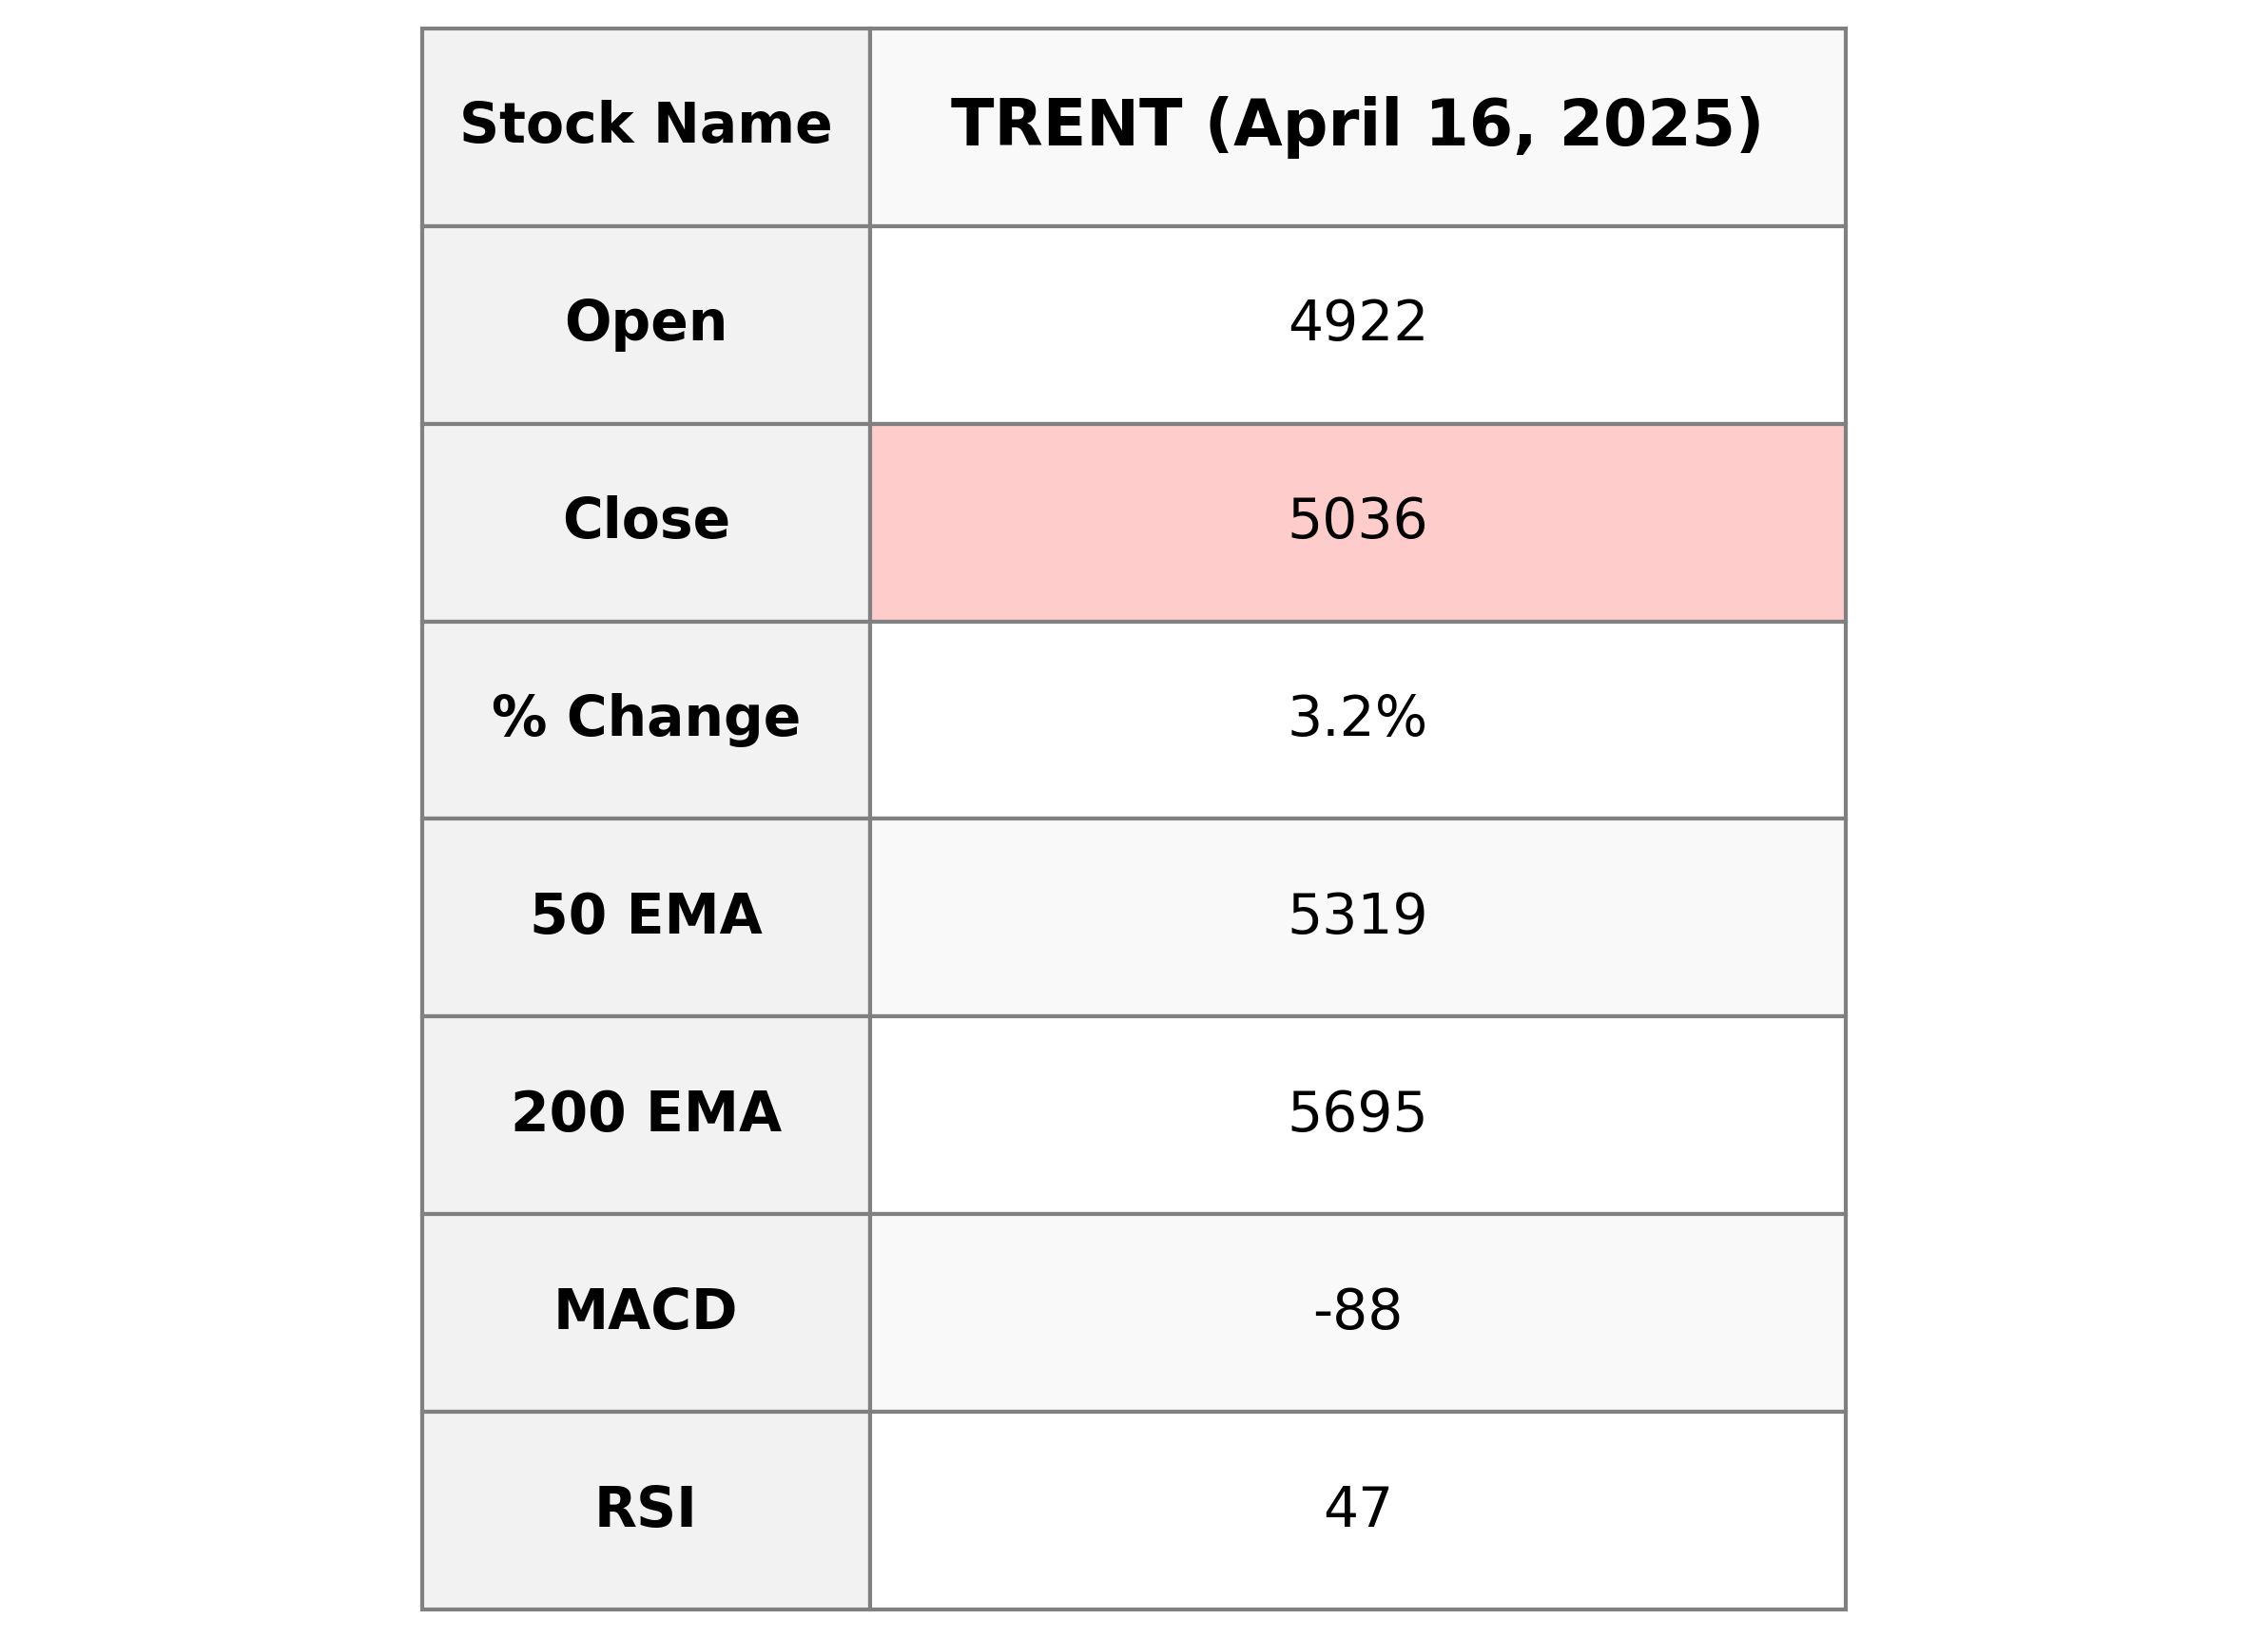
Trent Performance: Trent witnessed a noticeable increase in its stock price, closing at 5035.5, which represents a 3.25% change from the previous close of 4877.0. Despite the positive movement, the stock is currently trading below its 50-day and 200-day EMAs, indicating a potential downtrend. The RSI value of 47.20 suggests a neutral momentum, while the negative MACD highlights bearish sentiment. The company's market cap stands at 1.79 trillion INR, with a PE ratio of 93.03, highlighting its significant valuation in the apparel retail sector within the Consumer Cyclical industry in India.
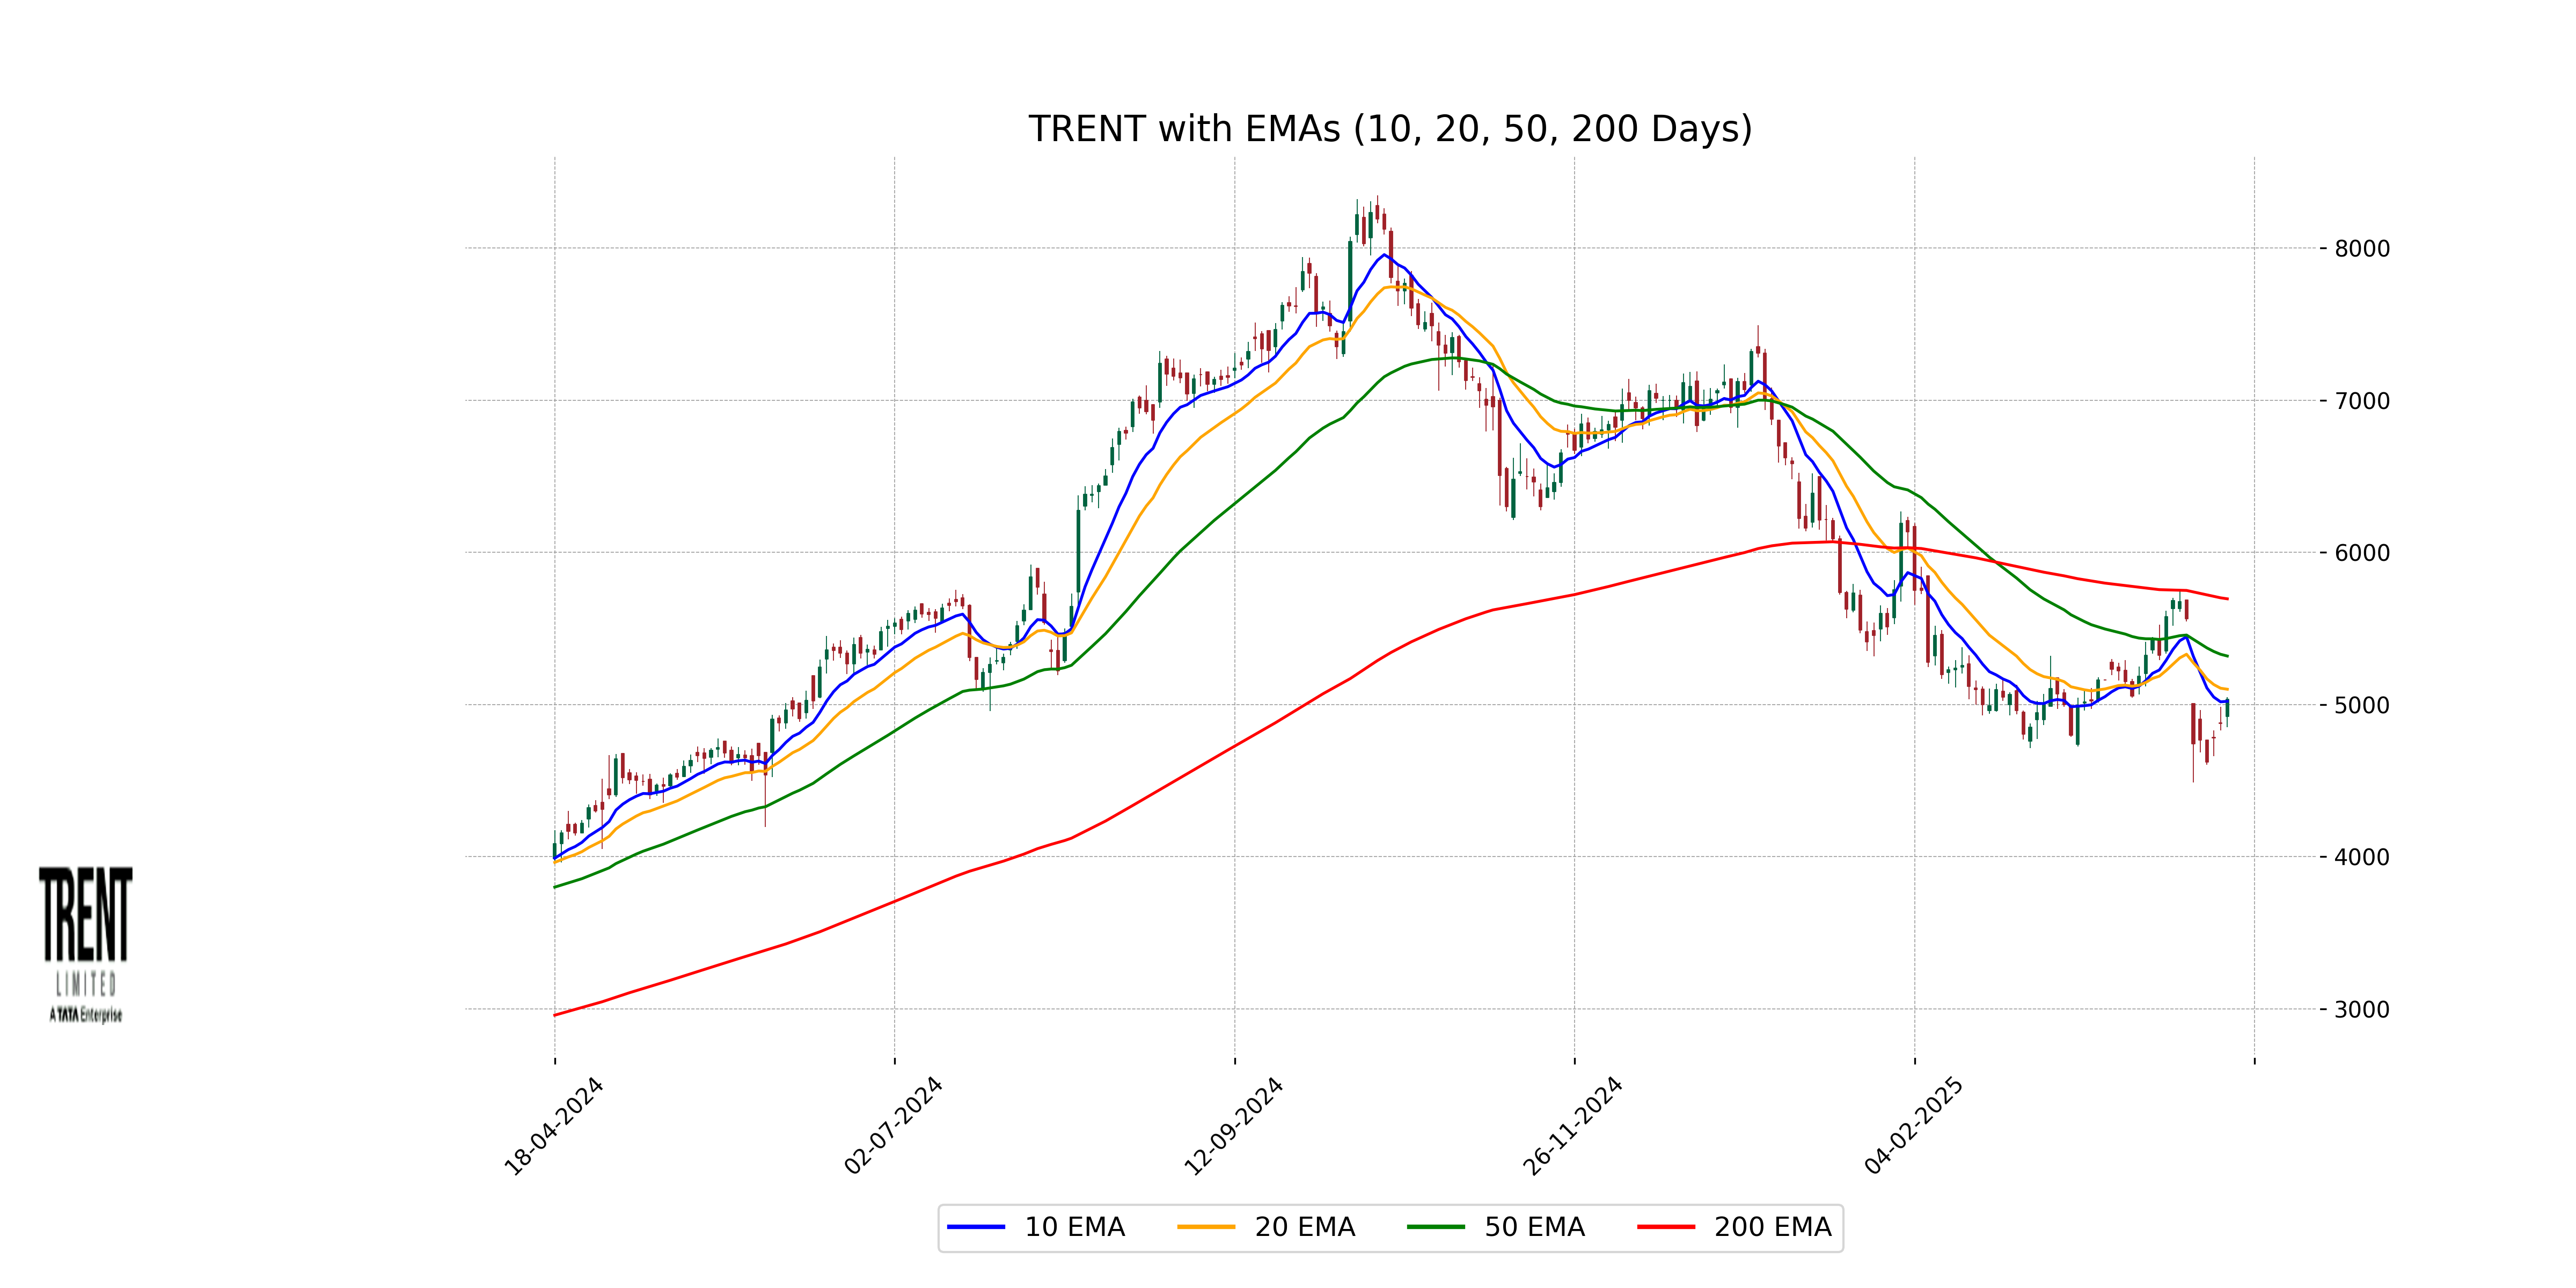
Relationship with Key Moving Averages
Trent's current closing price of 5035.5 lies below both its 50-day EMA at 5318.58 and 200-day EMA at 5694.52, indicating a potential bearish trend. However, the price is slightly above its 10-day EMA of 5020.85, suggesting recent upward momentum.
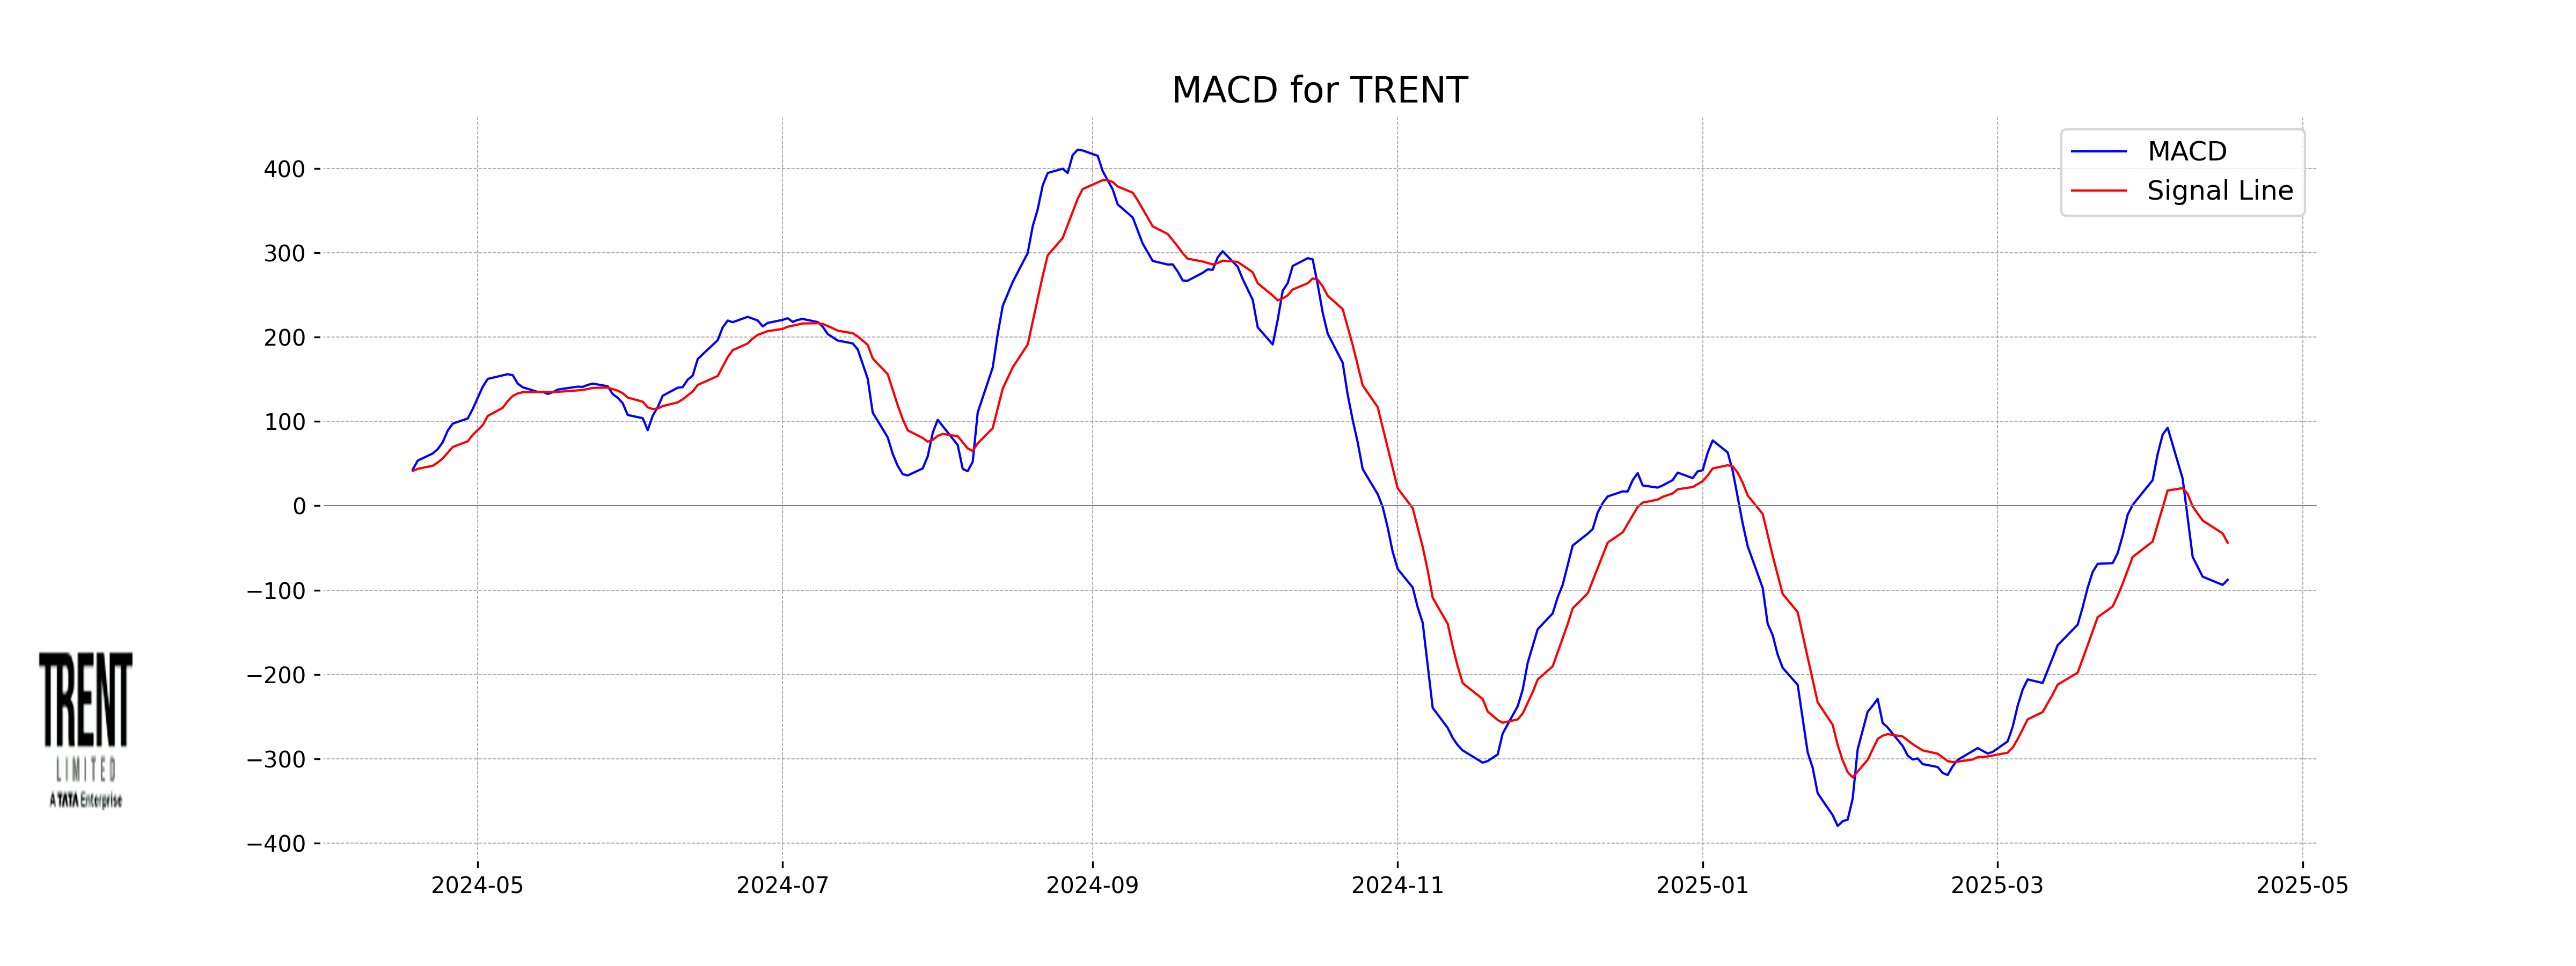
Moving Averages Trend (MACD)
The MACD for Trent stands at -87.74, indicating a bearish trend given that it is below the MACD Signal line, which is at -43.74. This suggests that the stock may currently be experiencing downward momentum, and traders might look for further confirmation before deciding on any positions.
RSI Analysis
Trent's RSI is 47.20, indicating it is nearing the lower end of the balanced spectrum. This suggests that the stock is neither overbought nor oversold, hinting at a potential stabilization or a change in trend.
Up Next
NSE Nifty 50 Top gainers: What are the 5 Biggest Stock gainers Today April 16, 2025

India revamps tax regime in 2025, new I-T Act to take effect from April 1

New Zealand commits USD 20 bn investment in India under FTA in 15 yrs; on lines of EFTA pact

India, New Zealand conclude FTA talks; pact to offer duty-free access, USD 20 bn FDI

FTA with New Zealand to significantly deepen bilateral economic engagement: Govt

Rupee breaches 91-mark against US dollar for first time in intra-day trade

More videos

Microsoft commits USD 17.5 billion investment in India: CEO Satya Nadella

CBI books Anil Ambani's son, Reliance Home Finance Ltd. in Rs 228 crore bank fraud case

RBI raises FY26 GDP growth projection to 7.3 pc

RBI trims policy interest rate by 25bps to 5.25pc, loans to get cheaper

Rupee slumps to all-time low of 90.25 against US dollar in intra-day trade

Reliance completes merger of Star Television Productions with Jiostar

India to lead emerging market growth with 7pc GDP rise in 2025: Moody’s

Nifty hits record high after 14 months; Sensex nears all-time peak

Reliance stops Russian oil use at its only-for-export refinery to comply with EU sanctions

ED attaches fresh assets worth over Rs 1,400 cr in case against Anil Ambani's Reliance Group