


Highlights
- IndusInd Bank sees short-term gains, long-term bearish trend
- Maruti Suzuki shows neutral momentum with slight recovery
- Tata Consumer surges, enters overbought territory with strength
Latest news

Indian cricket prodigy Vaibhav Suryavanshi honoured with 'Pradhan Mantri Rashtriya Bal Puraskar'

AAP Gujarat chief Isudan Gadhvi calls BJP allegations against MLA Chaitar Vasava as politically driven

Aditya Dhar's 'Dhurandhar' earns over Rs 1000 crore at box office

Australia lead England by 46 after 20 wickets fall on crazy day at MCG

Delhi HC asks Centre to respond on plea seeking GST cut on air purifiers amid worsening air quality

Congress pays tribute to former PM Manmohan Singh on first death anniversary

Ruled out of last two Ashes Tests, Cummins sets sights on T20 World Cup in Feb

CEO among three held for gangrape of woman IT firm manager in Udaipur
Top 5 Nifty 50 gainers today – April 2, 2025: Biggest stock moves


In this article, we will explore the technical indicators of some of the high-performing stocks on the Indian stock market, including INDUSINDBK, MARUTI, TATACONSUM, and TITAN.
By looking at these stocks through the lens of key technical factors, we aim to better understand their price movements, trends, and potential future performance.

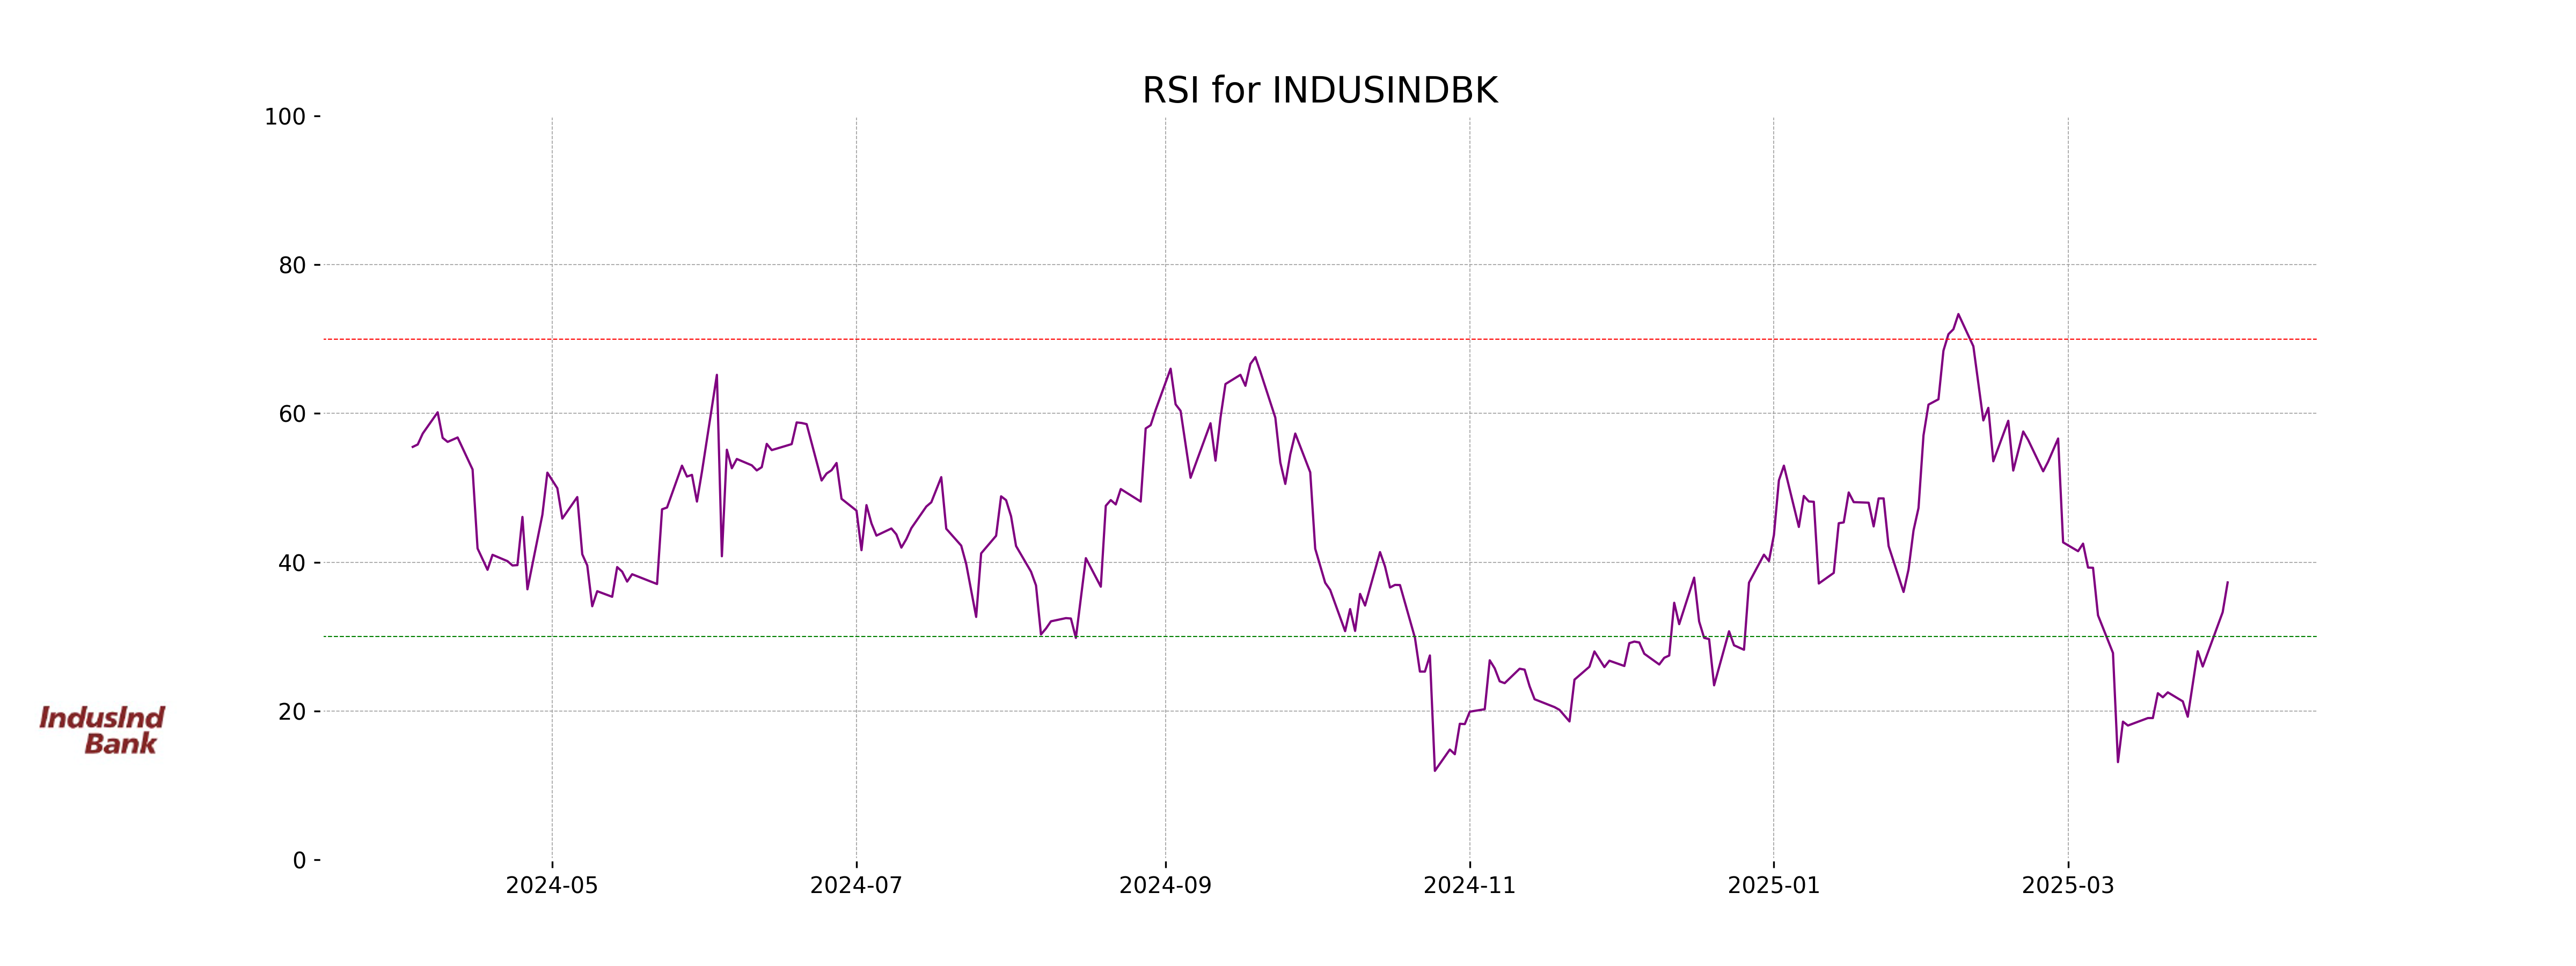
Analysis for IndusInd Bank - April 02, 2025

IndusInd Bank showed a positive trading session with its closing price at 702.45, marking a 2.89% increase. The stock has an RSI of 37.28, indicating it's near oversold territory, and a market cap of 547.25 billion INR, ranking it in the financial services sector, specifically regional banks in India. Despite a low PE ratio of 7.55 and an EPS of 93.05, the stock's trading volume was notable at 14.99 million.

Relationship with Key Moving Averages
IndusInd Bank's current closing price of 702.45 is below its 50-day EMA of 856.70 and 200-day EMA of 1094.78, indicating a bearish trend over those periods. However, it is above the 10-day EMA of 689.56, suggesting a potential short-term upward movement.
Moving Averages Trend (MACD)
For IndusInd Bank, the MACD is at -76.31, with a MACD Signal of -82.12. This indicates a bearish trend as the MACD is below the signal line, suggesting that the stock may be experiencing downward momentum.

RSI Analysis
The RSI value for IndusInd Bank is 37.28, which indicates that the stock is currently in the oversold territory. This suggests that the stock may be undervalued, presenting a potential buying opportunity if other indicators align with this analysis.
Analysis for Maruti Suzuki - April 02, 2025

Maruti Suzuki opened at 11481.10 and closed at 11716.10, reflecting a positive change of 2.05% with a points change of 235. The current RSI of 45.95 indicates a moderately sold condition, while the MACD of -126.25 suggests a potential bearish momentum. The stock's performance is backed by a market cap of approximately 3.68 trillion INR, a PE ratio of 25.32, and EPS of 462.69. It operates in the Consumer Cyclical sector, specifically within Auto Manufacturers, in India.

Relationship with Key Moving Averages
Maruti Suzuki closed at 11716.10, slightly below its 20-day EMA of 11763.14 and under its 50-day EMA of 11898.33. The close is slightly above the 10-day EMA of 11674.78, signifying short-term strength, yet it remains below longer-term EMA indicators, indicating the presence of slight downward momentum over the broader period.
Moving Averages Trend (MACD)
The MACD for Maruti Suzuki is -126.25, which is above the MACD Signal of -142.09. This indicates a potential bullish crossover, suggesting that momentum might be shifting towards a positive trend. However, further confirmation from other indicators would be beneficial, as the current value is still negative.

RSI Analysis
The RSI (Relative Strength Index) for Maruti Suzuki is 45.95, which suggests that the stock is neither overbought nor oversold. It indicates a neutral momentum, suggesting a balanced position in its current trading range.

Analysis for Tata Consumer - April 02, 2025

Tata Consumer exhibited a robust market performance with a closing price of 1062.70, marking a 7.10% increase from the previous close of 992.25. The stock traded on high volume with significant interest, indicated by a strong RSI of 72.90, suggesting overbought conditions. With a MACD of 6.63 and market cap of over 1 trillion INR, the company remains a significant player in the Consumer Defensive sector, particularly within the Packaged Foods industry.

Relationship with Key Moving Averages
Tata Consumer's current price of 1062.70 is above its 50-day EMA of 980.34 and 200-day EMA of 1017.86, indicating a strong upward trend in the stock. The price also exceeds the 10-day EMA of 990.40 and 20-day EMA of 980.96, further reinforcing the bullish momentum.
Moving Averages Trend (MACD)
MACD Analysis for Tata Consumer: Tata Consumer's MACD value of 6.63 indicates a robust bullish momentum, suggesting that the stock's upward movement is likely to continue. With the MACD significantly above its signal line at -3.75, it confirms strong buying pressure in the recent trading sessions.

RSI Analysis
The RSI (Relative Strength Index) for Tata Consumer is 72.90, indicating that the stock is in the overbought territory. This suggests that the stock price has been rising significantly and might be due for a pullback or consolidation.

Analysis for Titan Company - April 02, 2025

Titan Company experienced a significant increase in its stock price with a rise of 3.73%, closing at 3098.45 from the previous close of 2986.95. The stock showed strong performance, with a solid volume of 1,674,598. Despite the positive price movement, the RSI is around 48.75, suggesting the stock is not yet overbought, and the MACD indicates a slightly bearish momentum.

Relationship with Key Moving Averages
Titan Company's stock closed at 3098.45, which is below its 50-day EMA (3176.96) and 200-day EMA (3326.98), indicating potential bearish momentum in the short to medium term. However, it is close to its 20-day EMA (3090.81) and above its 10-day EMA (3068.66), suggesting some recent upward movement.
Moving Averages Trend (MACD)
MACD Analysis for Titan Company: The MACD value for Titan Company is -37.85, while the MACD Signal is -46.53. The MACD is above the MACD Signal, which suggests a potential bullish trend or a reduction in bearish momentum.

RSI Analysis
The RSI (Relative Strength Index) for Titan Company is at 48.75, which is considered to be in the neutral range. This indicates that the stock is neither in the oversold nor overbought territory, suggesting there is no clear momentum direction in the stock price based on RSI alone.

Up Next
Top 5 Nifty 50 gainers today – April 2, 2025: Biggest stock moves

India revamps tax regime in 2025, new I-T Act to take effect from April 1

New Zealand commits USD 20 bn investment in India under FTA in 15 yrs; on lines of EFTA pact

India, New Zealand conclude FTA talks; pact to offer duty-free access, USD 20 bn FDI

FTA with New Zealand to significantly deepen bilateral economic engagement: Govt

Rupee breaches 91-mark against US dollar for first time in intra-day trade

More videos

Microsoft commits USD 17.5 billion investment in India: CEO Satya Nadella

CBI books Anil Ambani's son, Reliance Home Finance Ltd. in Rs 228 crore bank fraud case

RBI raises FY26 GDP growth projection to 7.3 pc

RBI trims policy interest rate by 25bps to 5.25pc, loans to get cheaper

Rupee slumps to all-time low of 90.25 against US dollar in intra-day trade

Reliance completes merger of Star Television Productions with Jiostar

India to lead emerging market growth with 7pc GDP rise in 2025: Moody’s

Nifty hits record high after 14 months; Sensex nears all-time peak

Reliance stops Russian oil use at its only-for-export refinery to comply with EU sanctions

ED attaches fresh assets worth over Rs 1,400 cr in case against Anil Ambani's Reliance Group