


Highlights
- Sensex rises 0.28% but shows neutral momentum
- Nifty Metal outperforms with sharp 1.82% surge
- Mixed trends across Auto, Energy, FMCG, IT sectors
Latest news

Haier Launches HQLED P7 Pro Series TVs With Google Gemini, 50W Audio And AI Picture Enhancements

Nothing's Latest Pokémon Teasers Hint At New Hardware, RCB Collaboration May Also Be In The Works

OnePlus N6 Set To Debut With Massive 8,000mAh Battery And Long-Term Performance Focus

Roblox Introduces Age-Based Accounts for Younger Users, Expands Parental Controls Globally

IIFL Capital Launches Algo Marketplace with Over 100 Ready-Made Strategies

LUMIQ Raises INR 50 Crore Pre-Series B to Become the AI Decision Layer for Financial Services

Tay Keith, producer behind Travis Scott's 'Sicko Mode' dies at 29

GenAI could lift realty sales velocity by up to 50%, speed up launches by 30%: Report
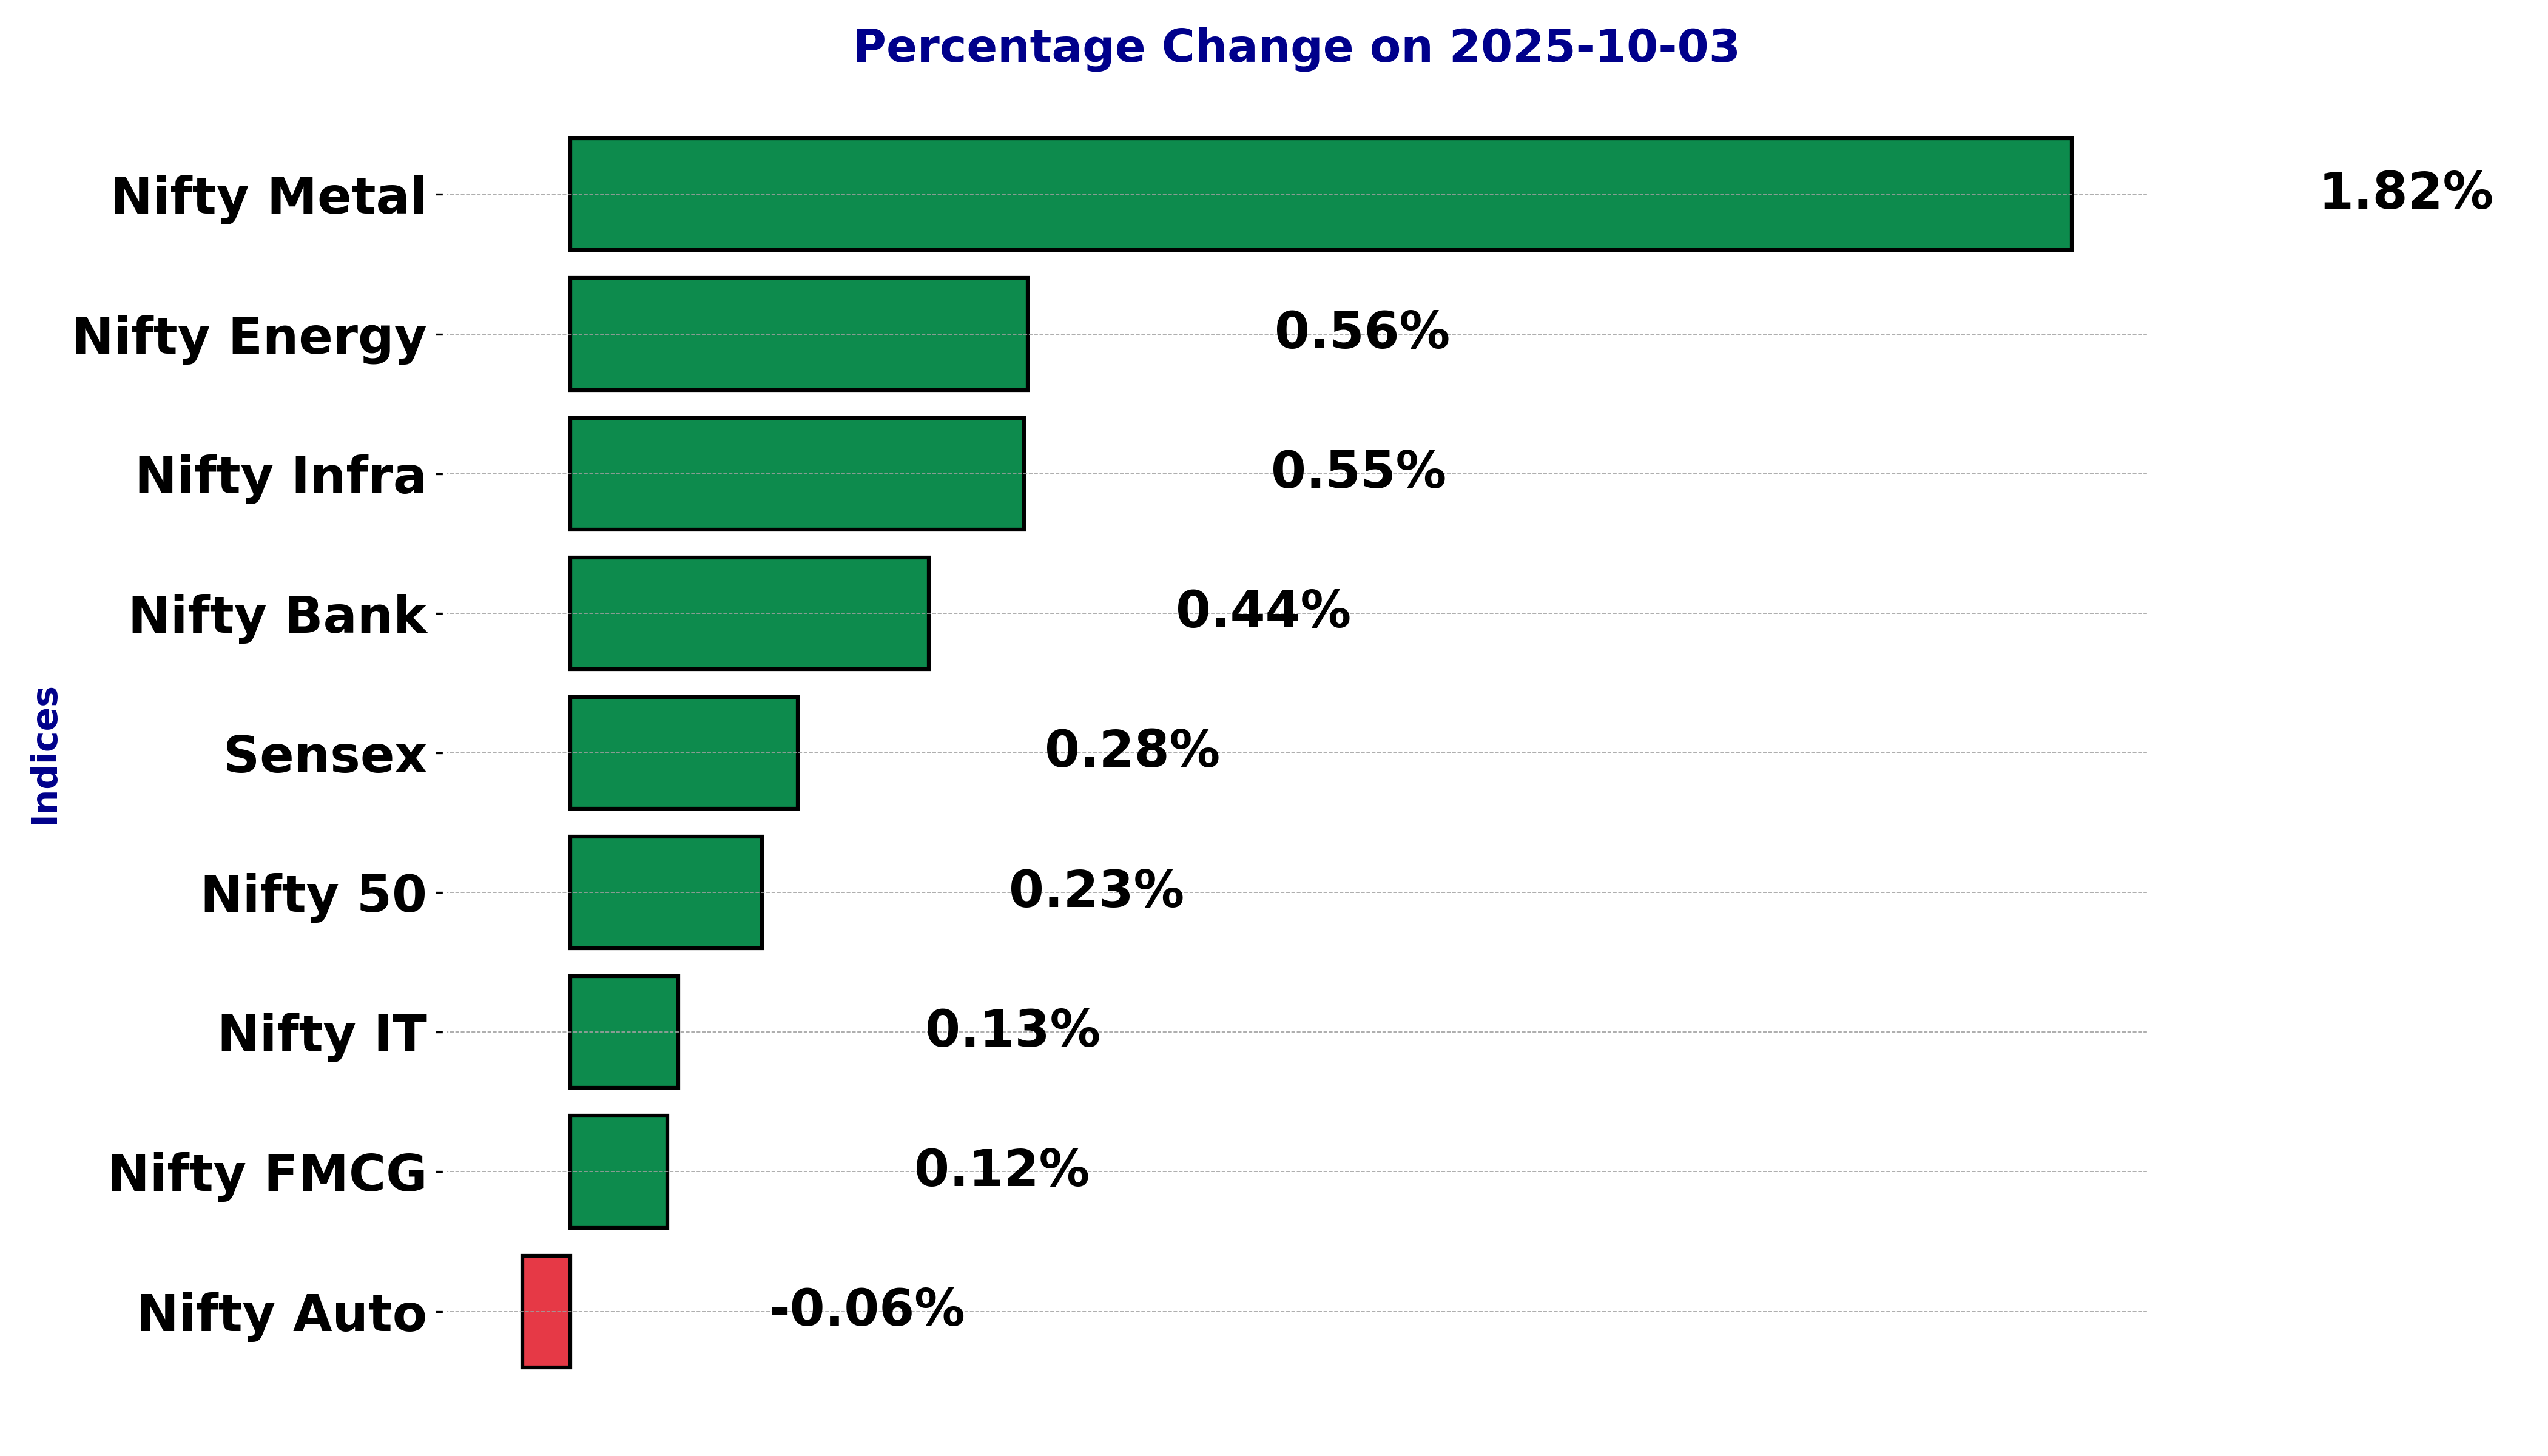
Indian stock market sector-wise performance today - October 3, 2025


In today's stock market performance (Friday - October 3, 2025) , several sectors and indices exhibited notable changes, reflecting a diverse set of movements across the market.
Starting with the Sensex, it showed a modest appreciation with an increase of 0.28%, indicating a slight uptick in overall market sentiment.
The Nifty Auto sector, however, observed a minor decline of 0.06%, showing relative stability with only a slight negative movement. On the other hand, the Nifty Energy sector emerged as a positive performer with a significant increase of 0.56%. This positive momentum suggests increased investor interest or favorable news within the energy sector.
The Nifty FMCG sector demonstrated marginal positive movement, with a gain of 0.12%, hinting at a steady consumer demand and market stability.
The Infra sector also reported a rise of 0.55%, aligning with the overall positive sentiment seen in other parts of the stock market. The Nifty IT sector displayed a small increase of 0.13%, suggesting slight gains amidst potential challenges in the technology sphere.
Most notably, the Nifty Metal sector witnessed the sharpest change, with an impressive rise of 1.82%. This substantial increase highlights heightened investor confidence and potential demand spikes or favorable policy developments affecting the metal industry.
Lastly, the Bank sector showed a positive change as well, increasing by 0.44%. This indicates robust banking activity and possibly investor optimism regarding financial institutions.
The broader Nifty index recorded a gain of 0.23%, reflecting an overall encouraging market environment despite variations across different sectors. Focusing on the remarkable rise in the Nifty Metal sector, such a considerable change can be attributed to multiple factors, including potential increases in commodity prices, announcements regarding infrastructure projects, or policy shifts that benefit metal producers.
The strong demand for metal-related products, whether owing to global market dynamics or domestic industrial growth, likely played a significant role in this sector's performance.
In summary, the day's stock market performance is marked by a mix of modest gains and notable movements, with the Nifty Metal sector standing out due to its substantial increase, indicating a powerful impact on investor strategies and market perceptions.
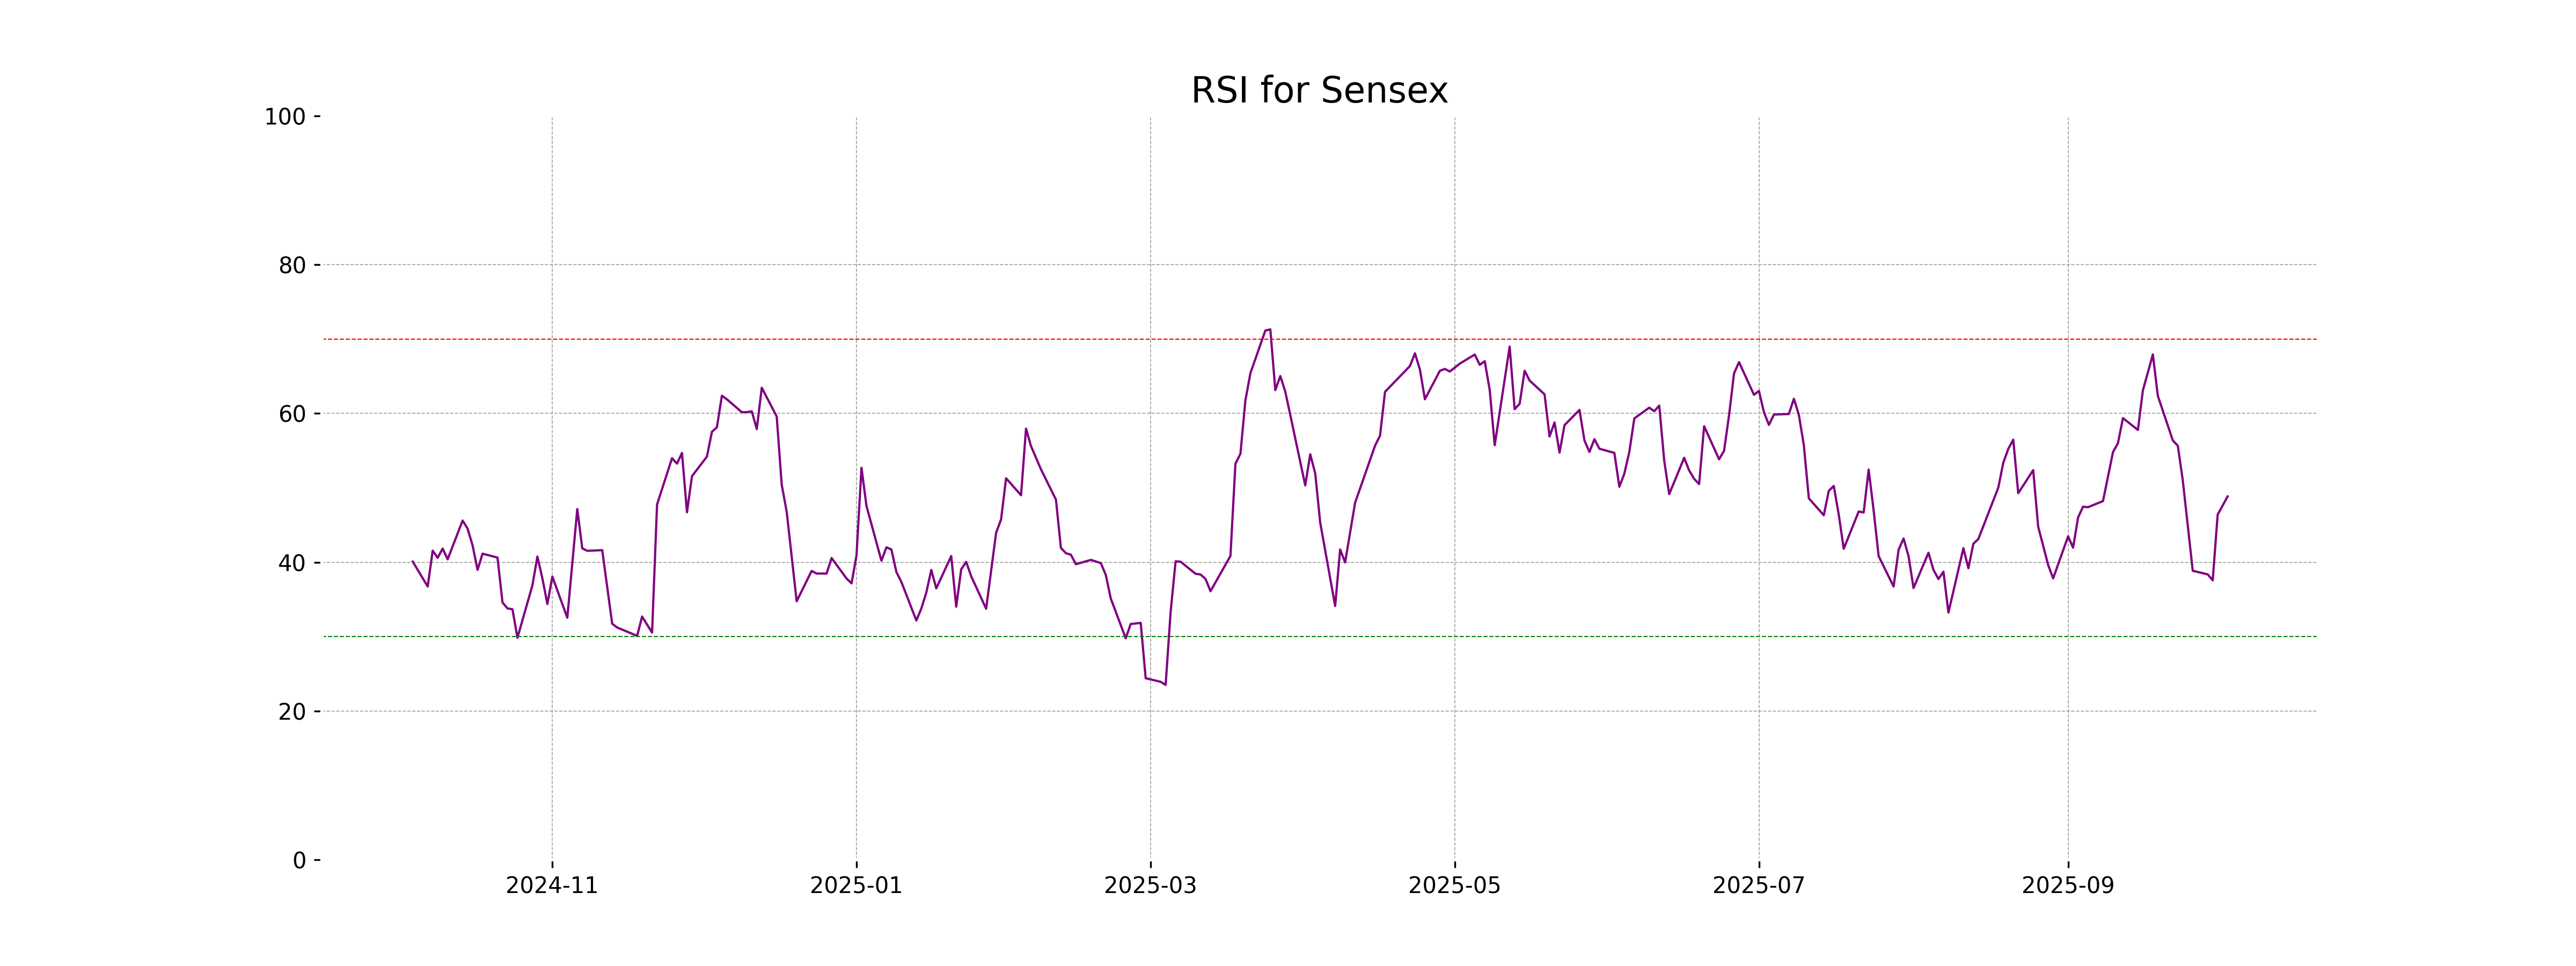
Analysis for Sensex - October 03, 2025
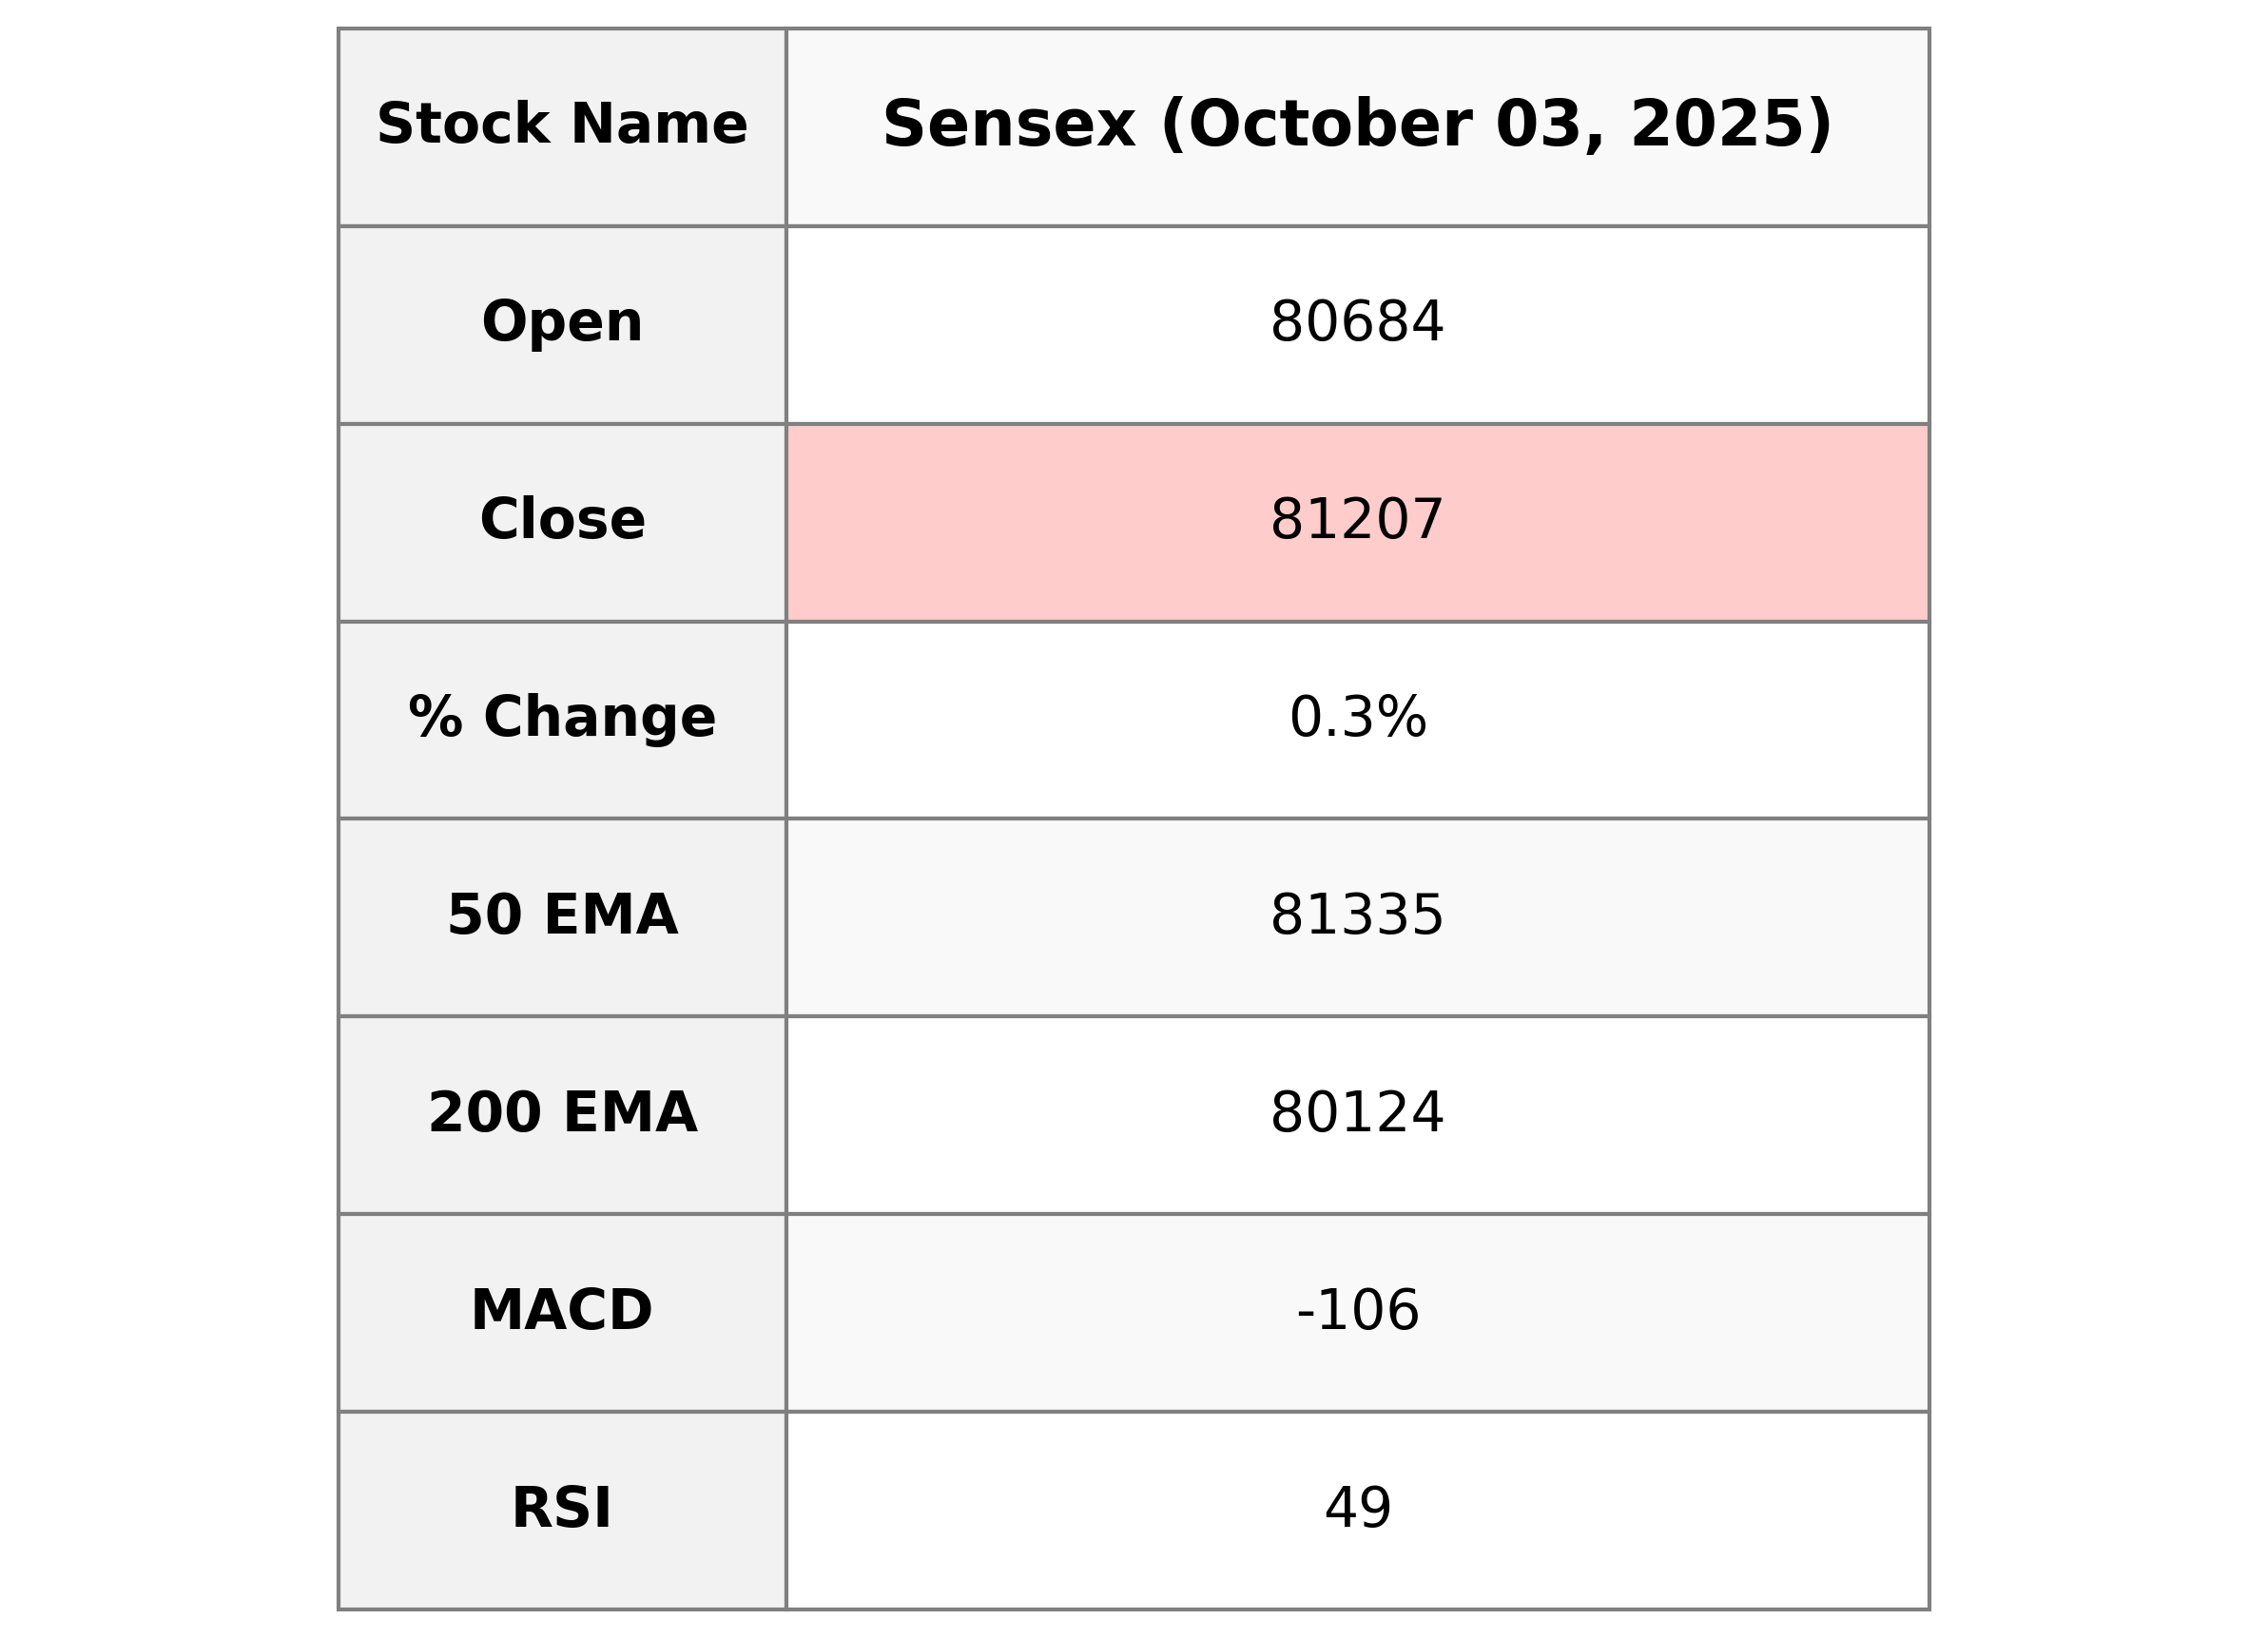
Sensex opened at 80,684.14 and closed at 81,207.17, marking a rise of approximately 0.28% with a points change of 223.86. Despite closing higher, the Relative Strength Index (RSI) is at 48.85, suggesting a neutral momentum, and the Moving Average Convergence Divergence (MACD) is negative, indicating a potential bearish trend.
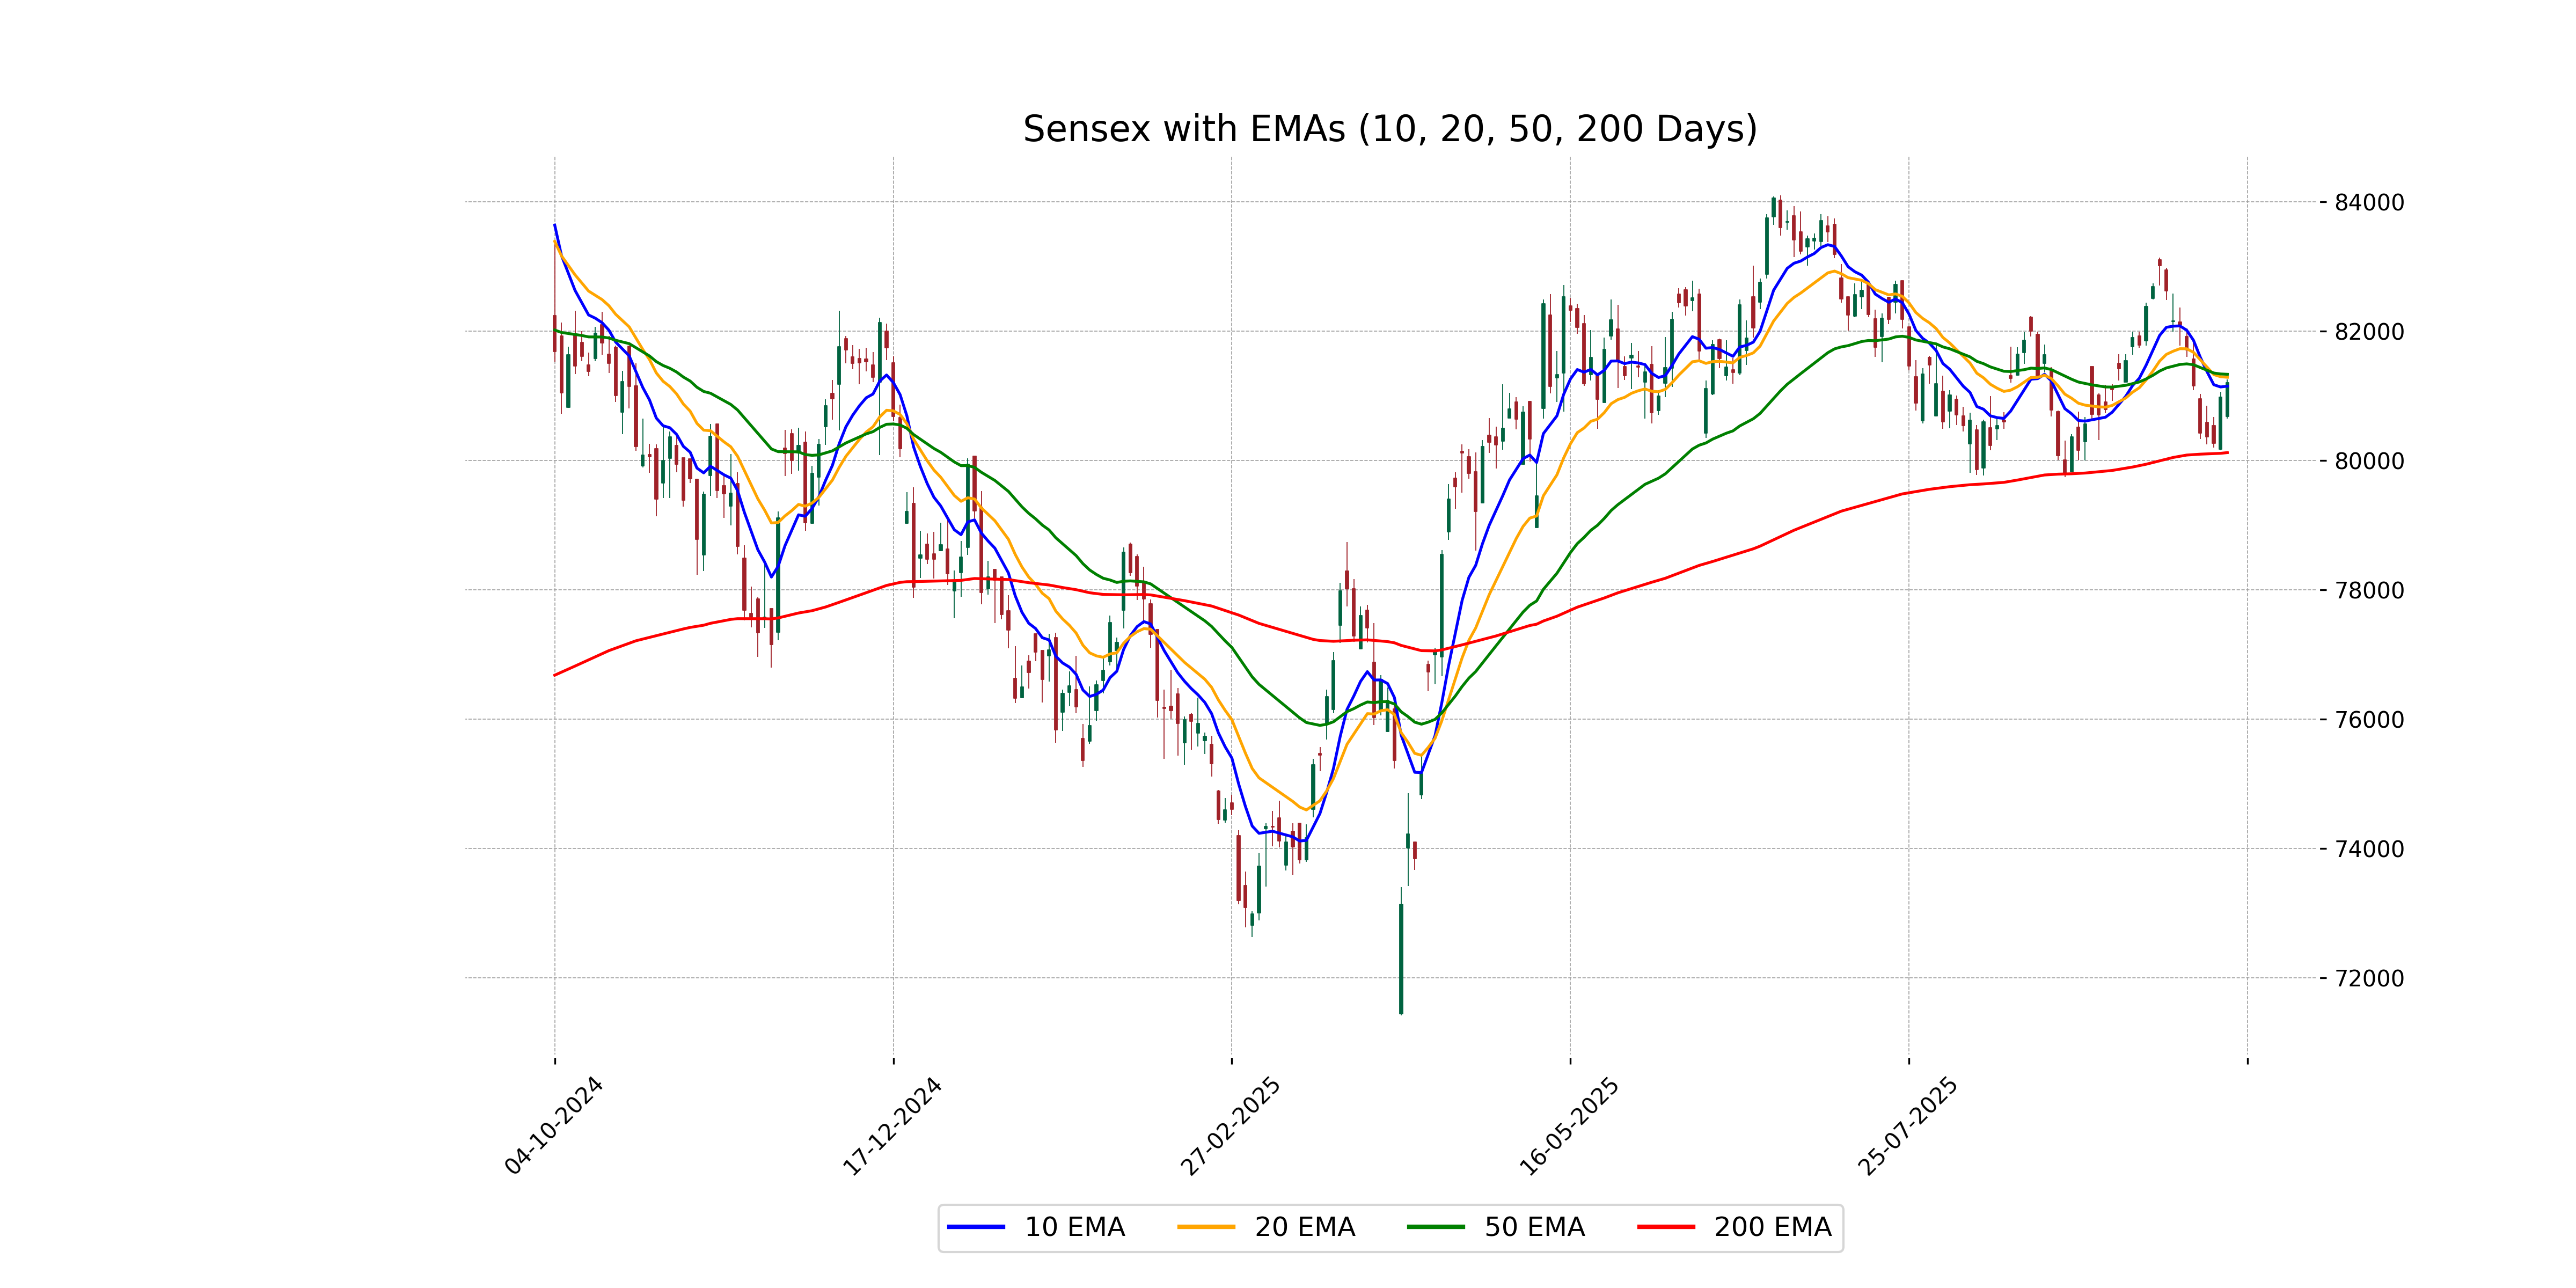
Relationship with Key Moving Averages
The closing value of Sensex at 81,207.17 is below its 50-day EMA of 81,335.39 and 20-day EMA of 81,289.45, but above the 200-day EMA of 80,124.30. This indicates a short-term bearish sentiment, though the longer-term trend remains above critical moving averages.
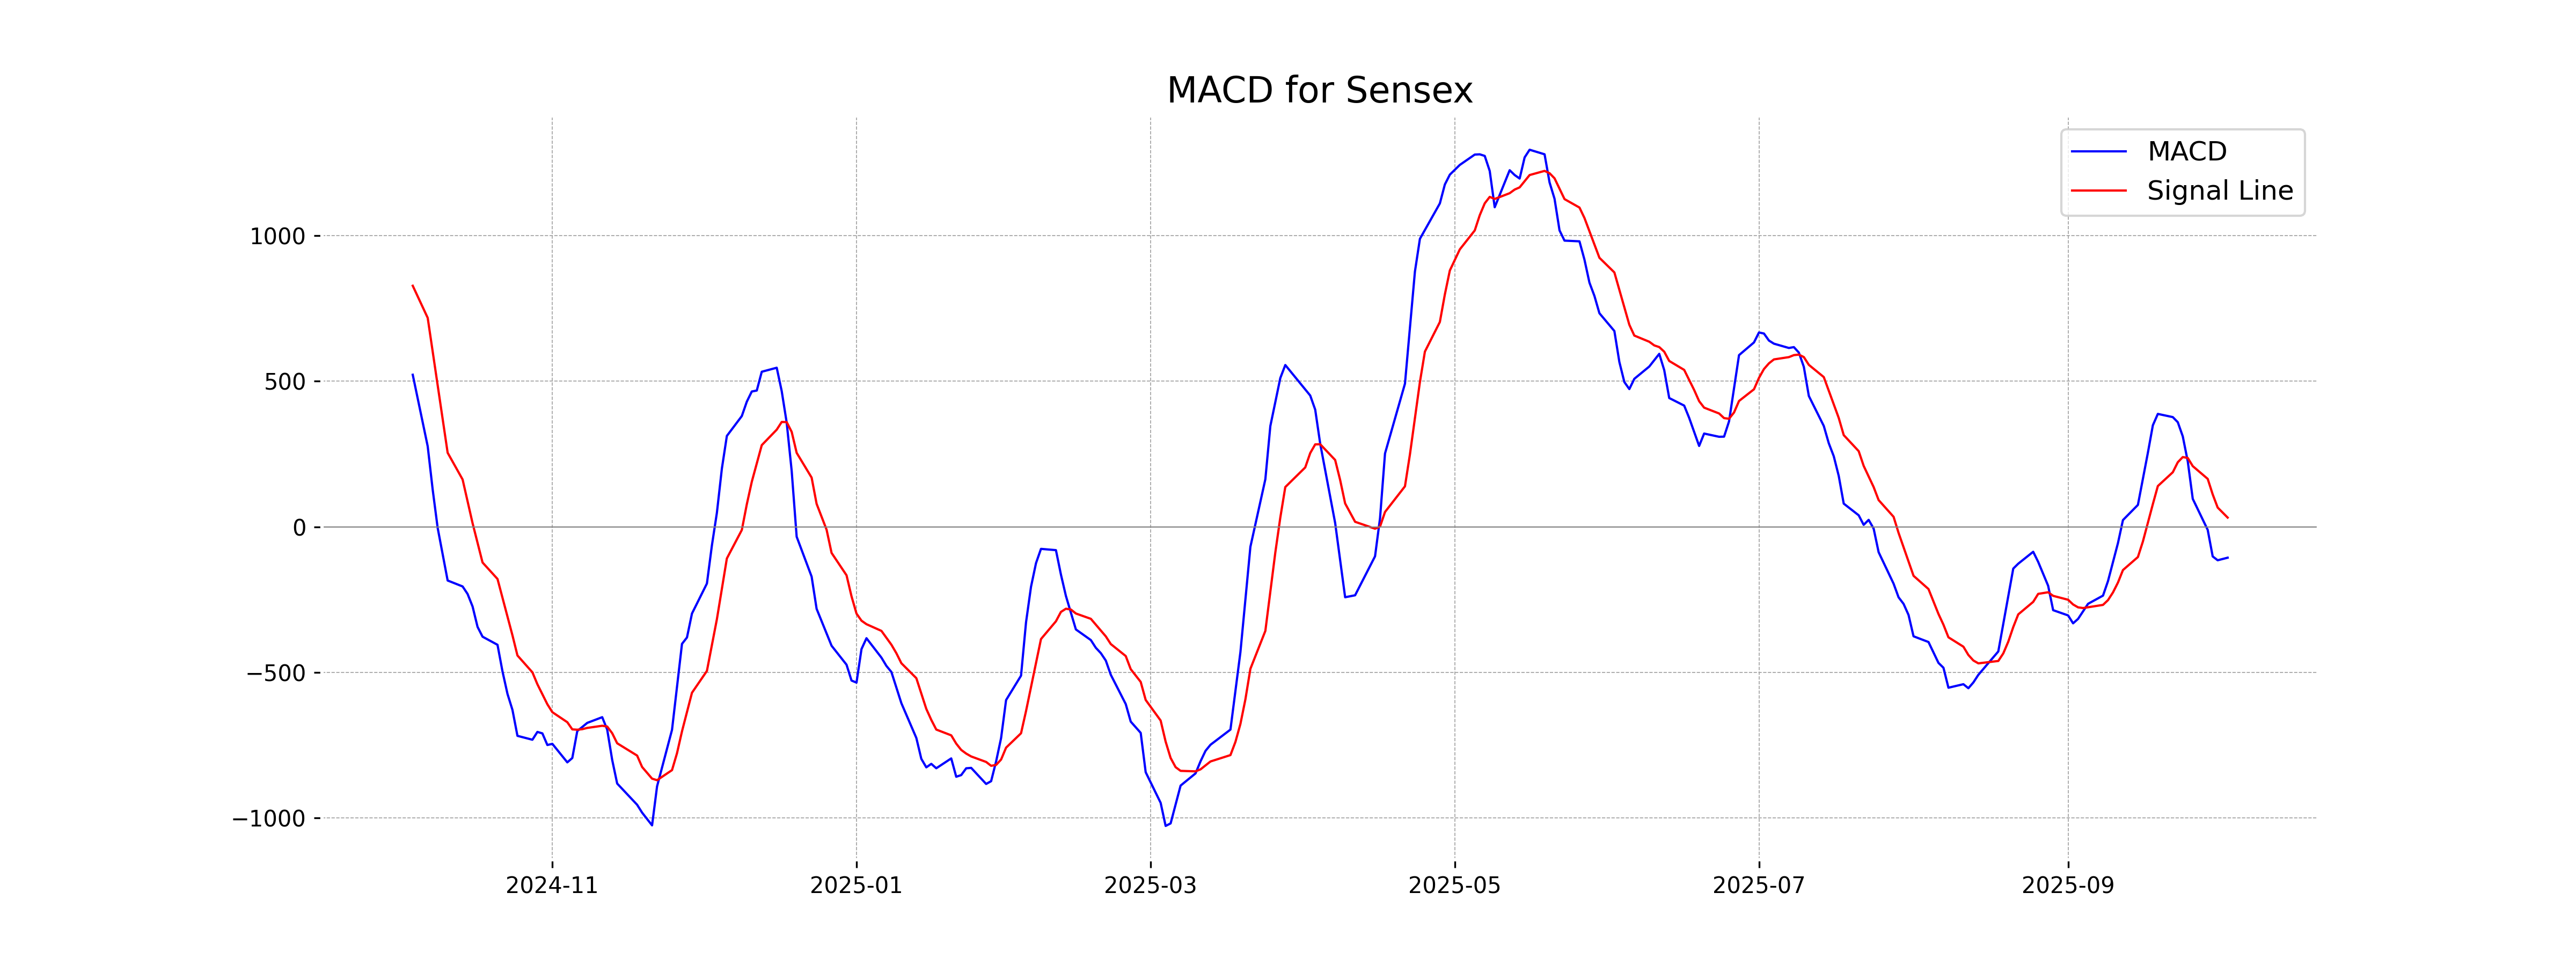
Moving Averages Trend (MACD)
MACD Analysis for Sensex: The MACD value of -106.15 is below the MACD Signal line at 31.57, suggesting a bearish momentum or downward trend in the market. This indicates that recent price movements may continue to be negative unless a reversal occurs.
RSI Analysis
The RSI for Sensex is currently at 48.85, indicating a neutral position close to the midpoint of the typical 0 to 100 scale. It neither suggests an overbought nor oversold condition, implying that the price isn't showing significant bullish or bearish momentum at this time.
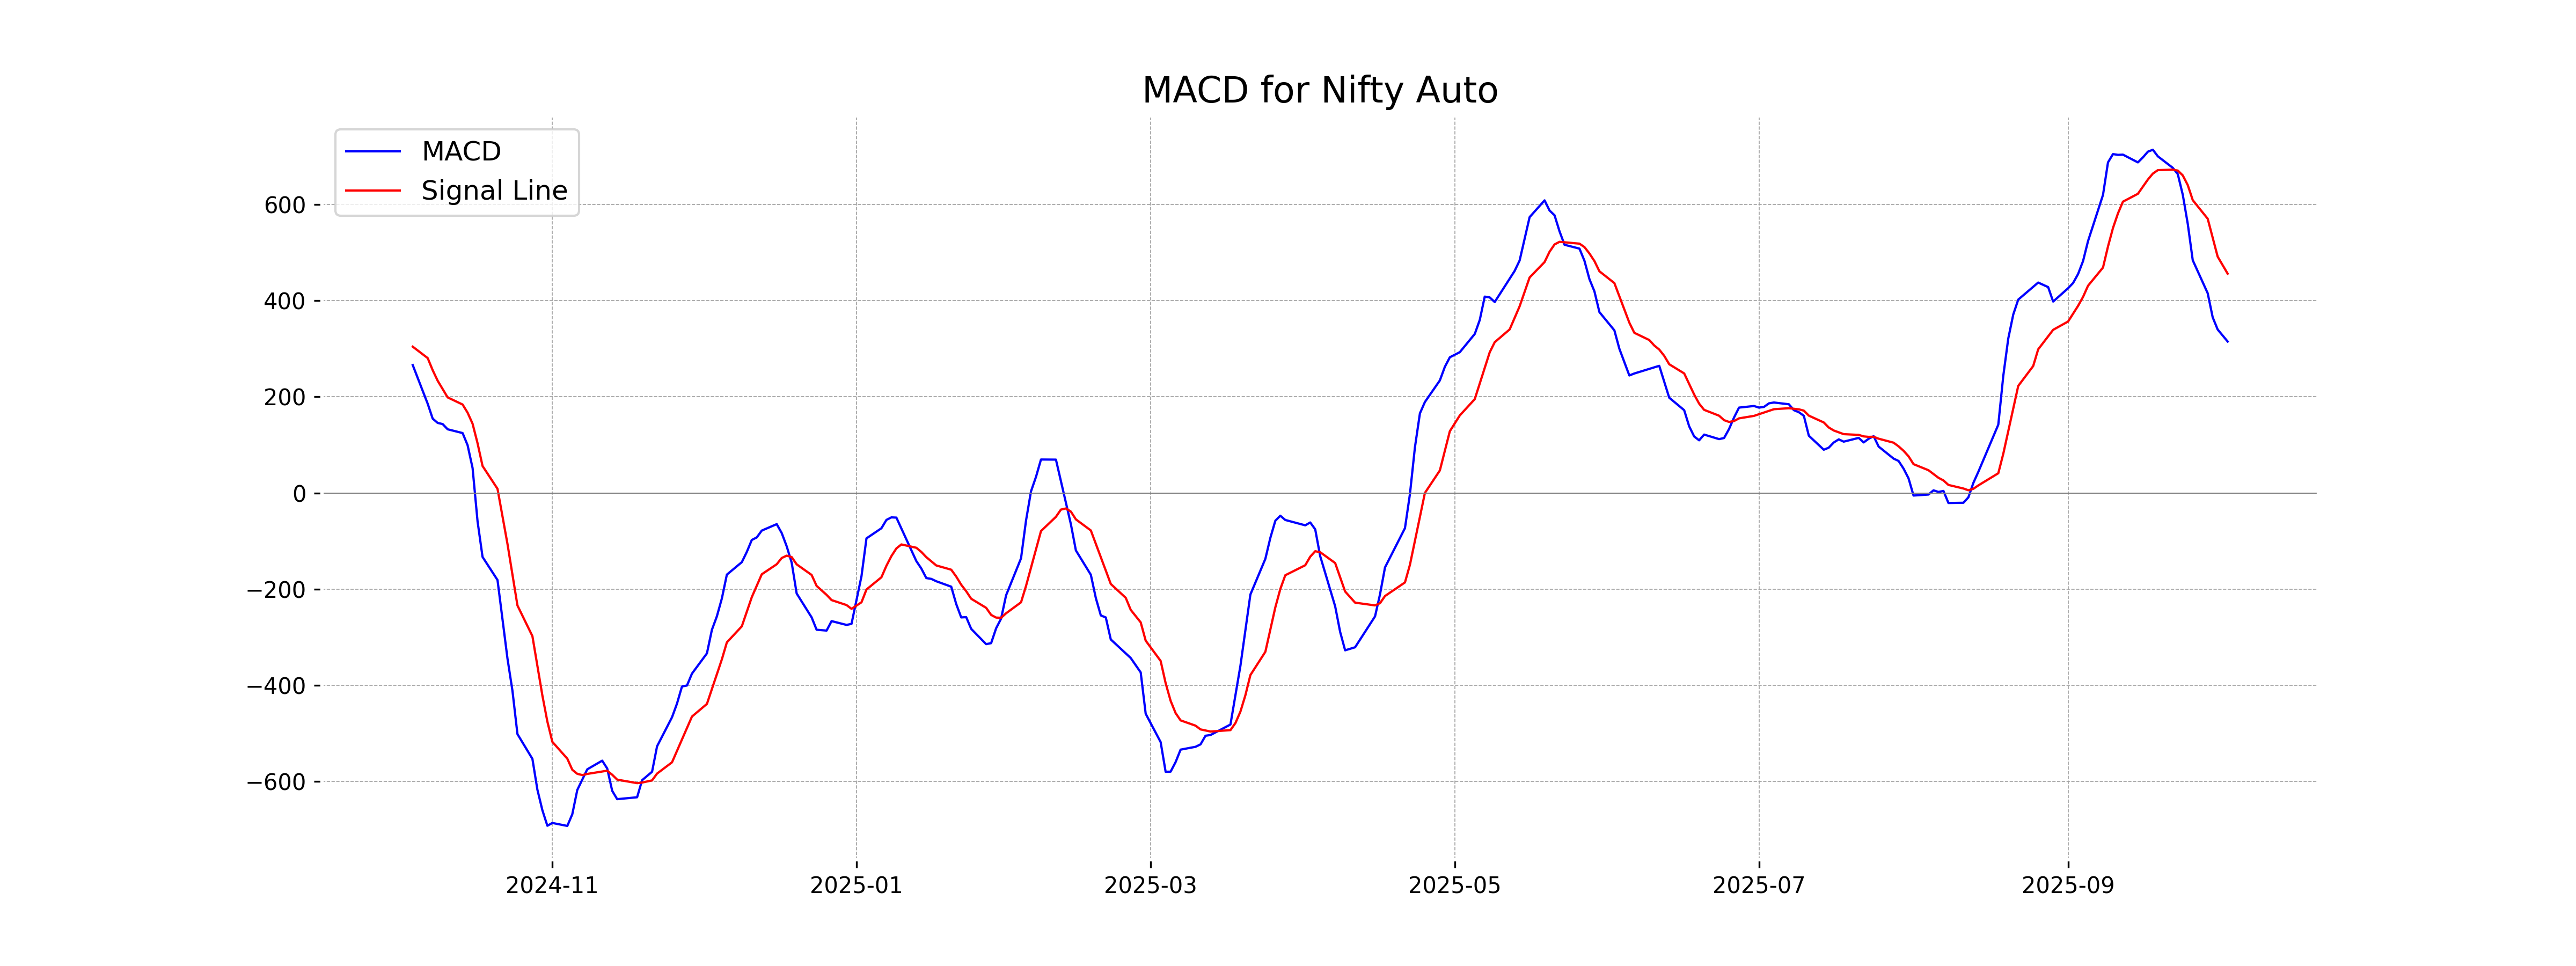
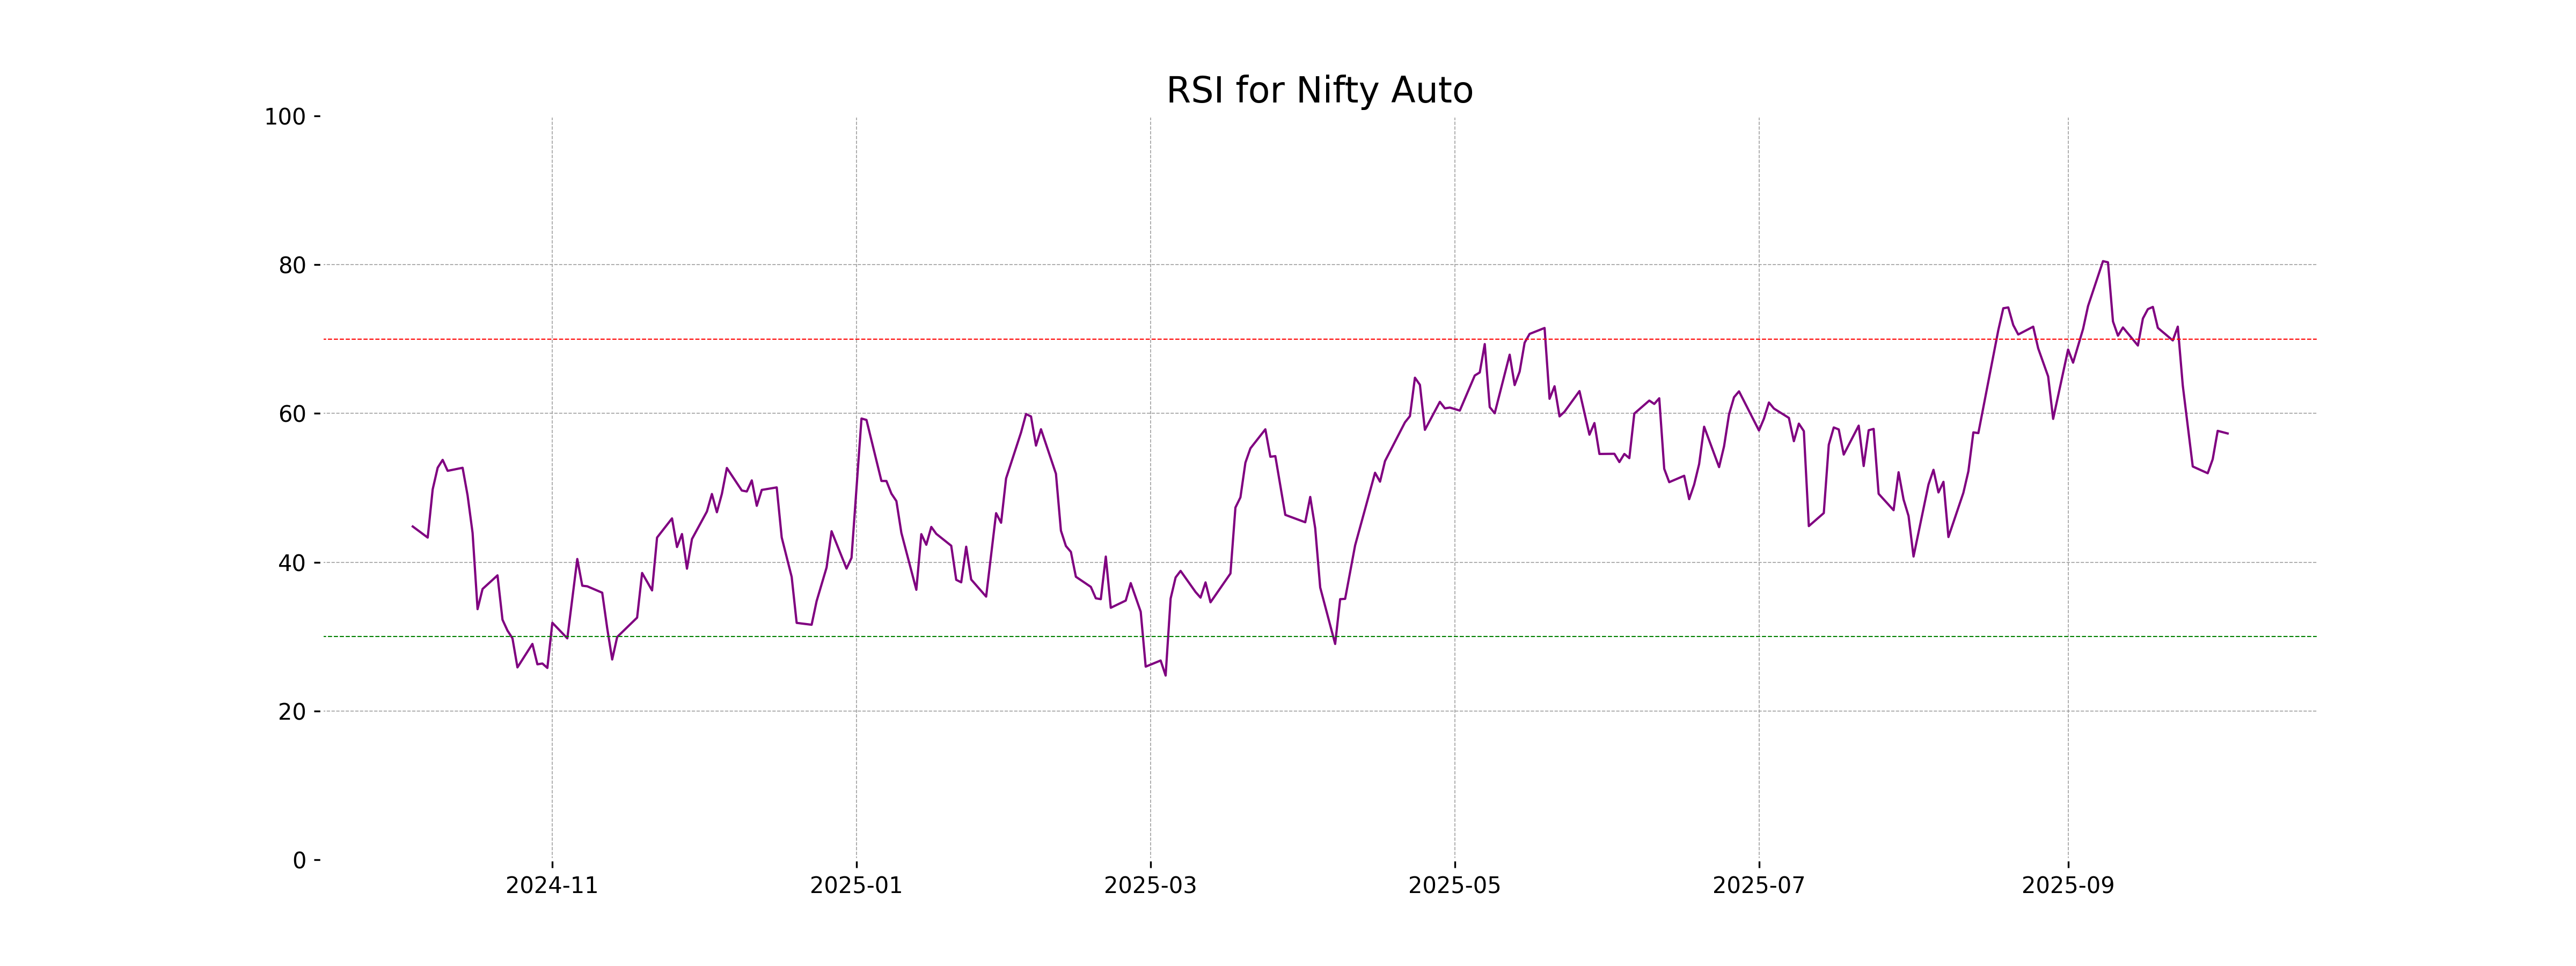
Analysis for Nifty Auto - October 03, 2025

Nifty Auto Performance: On the specified trading day, Nifty Auto opened at 26,771.25 and closed slightly lower at 26,753.10, reflecting a minor decrease of 0.058% with a points change of -15.55. Despite the decline, the Relative Strength Index (RSI) stood at 57.31, indicating a moderately strong market condition. The MACD line was below the signal line, which may suggest bearish momentum.

Relationship with Key Moving Averages
Nifty Auto is currently trading slightly above both its 10-day EMA of 26757.05 and significantly above its 50-day and 200-day EMAs, which are 25766.32 and 24051.59, respectively. This suggests a moderately bullish trend, as the current price of 26753.10 indicates strength above key longer-term moving averages.
Moving Averages Trend (MACD)
MACD Analysis for Nifty Auto: The MACD for Nifty Auto is currently at 315.02, which is below its signal line of 456.15, suggesting a bearish trend. This indicates potential selling pressure or that the current upward momentum might be weakening.
RSI Analysis
Based on the data provided, the RSI for Nifty Auto is 57.31. This indicates a neutral position, suggesting the index is neither overbought nor oversold at the current level. Typically, an RSI value between 30 and 70 is considered neutral.
Analysis for Nifty Energy - October 03, 2025
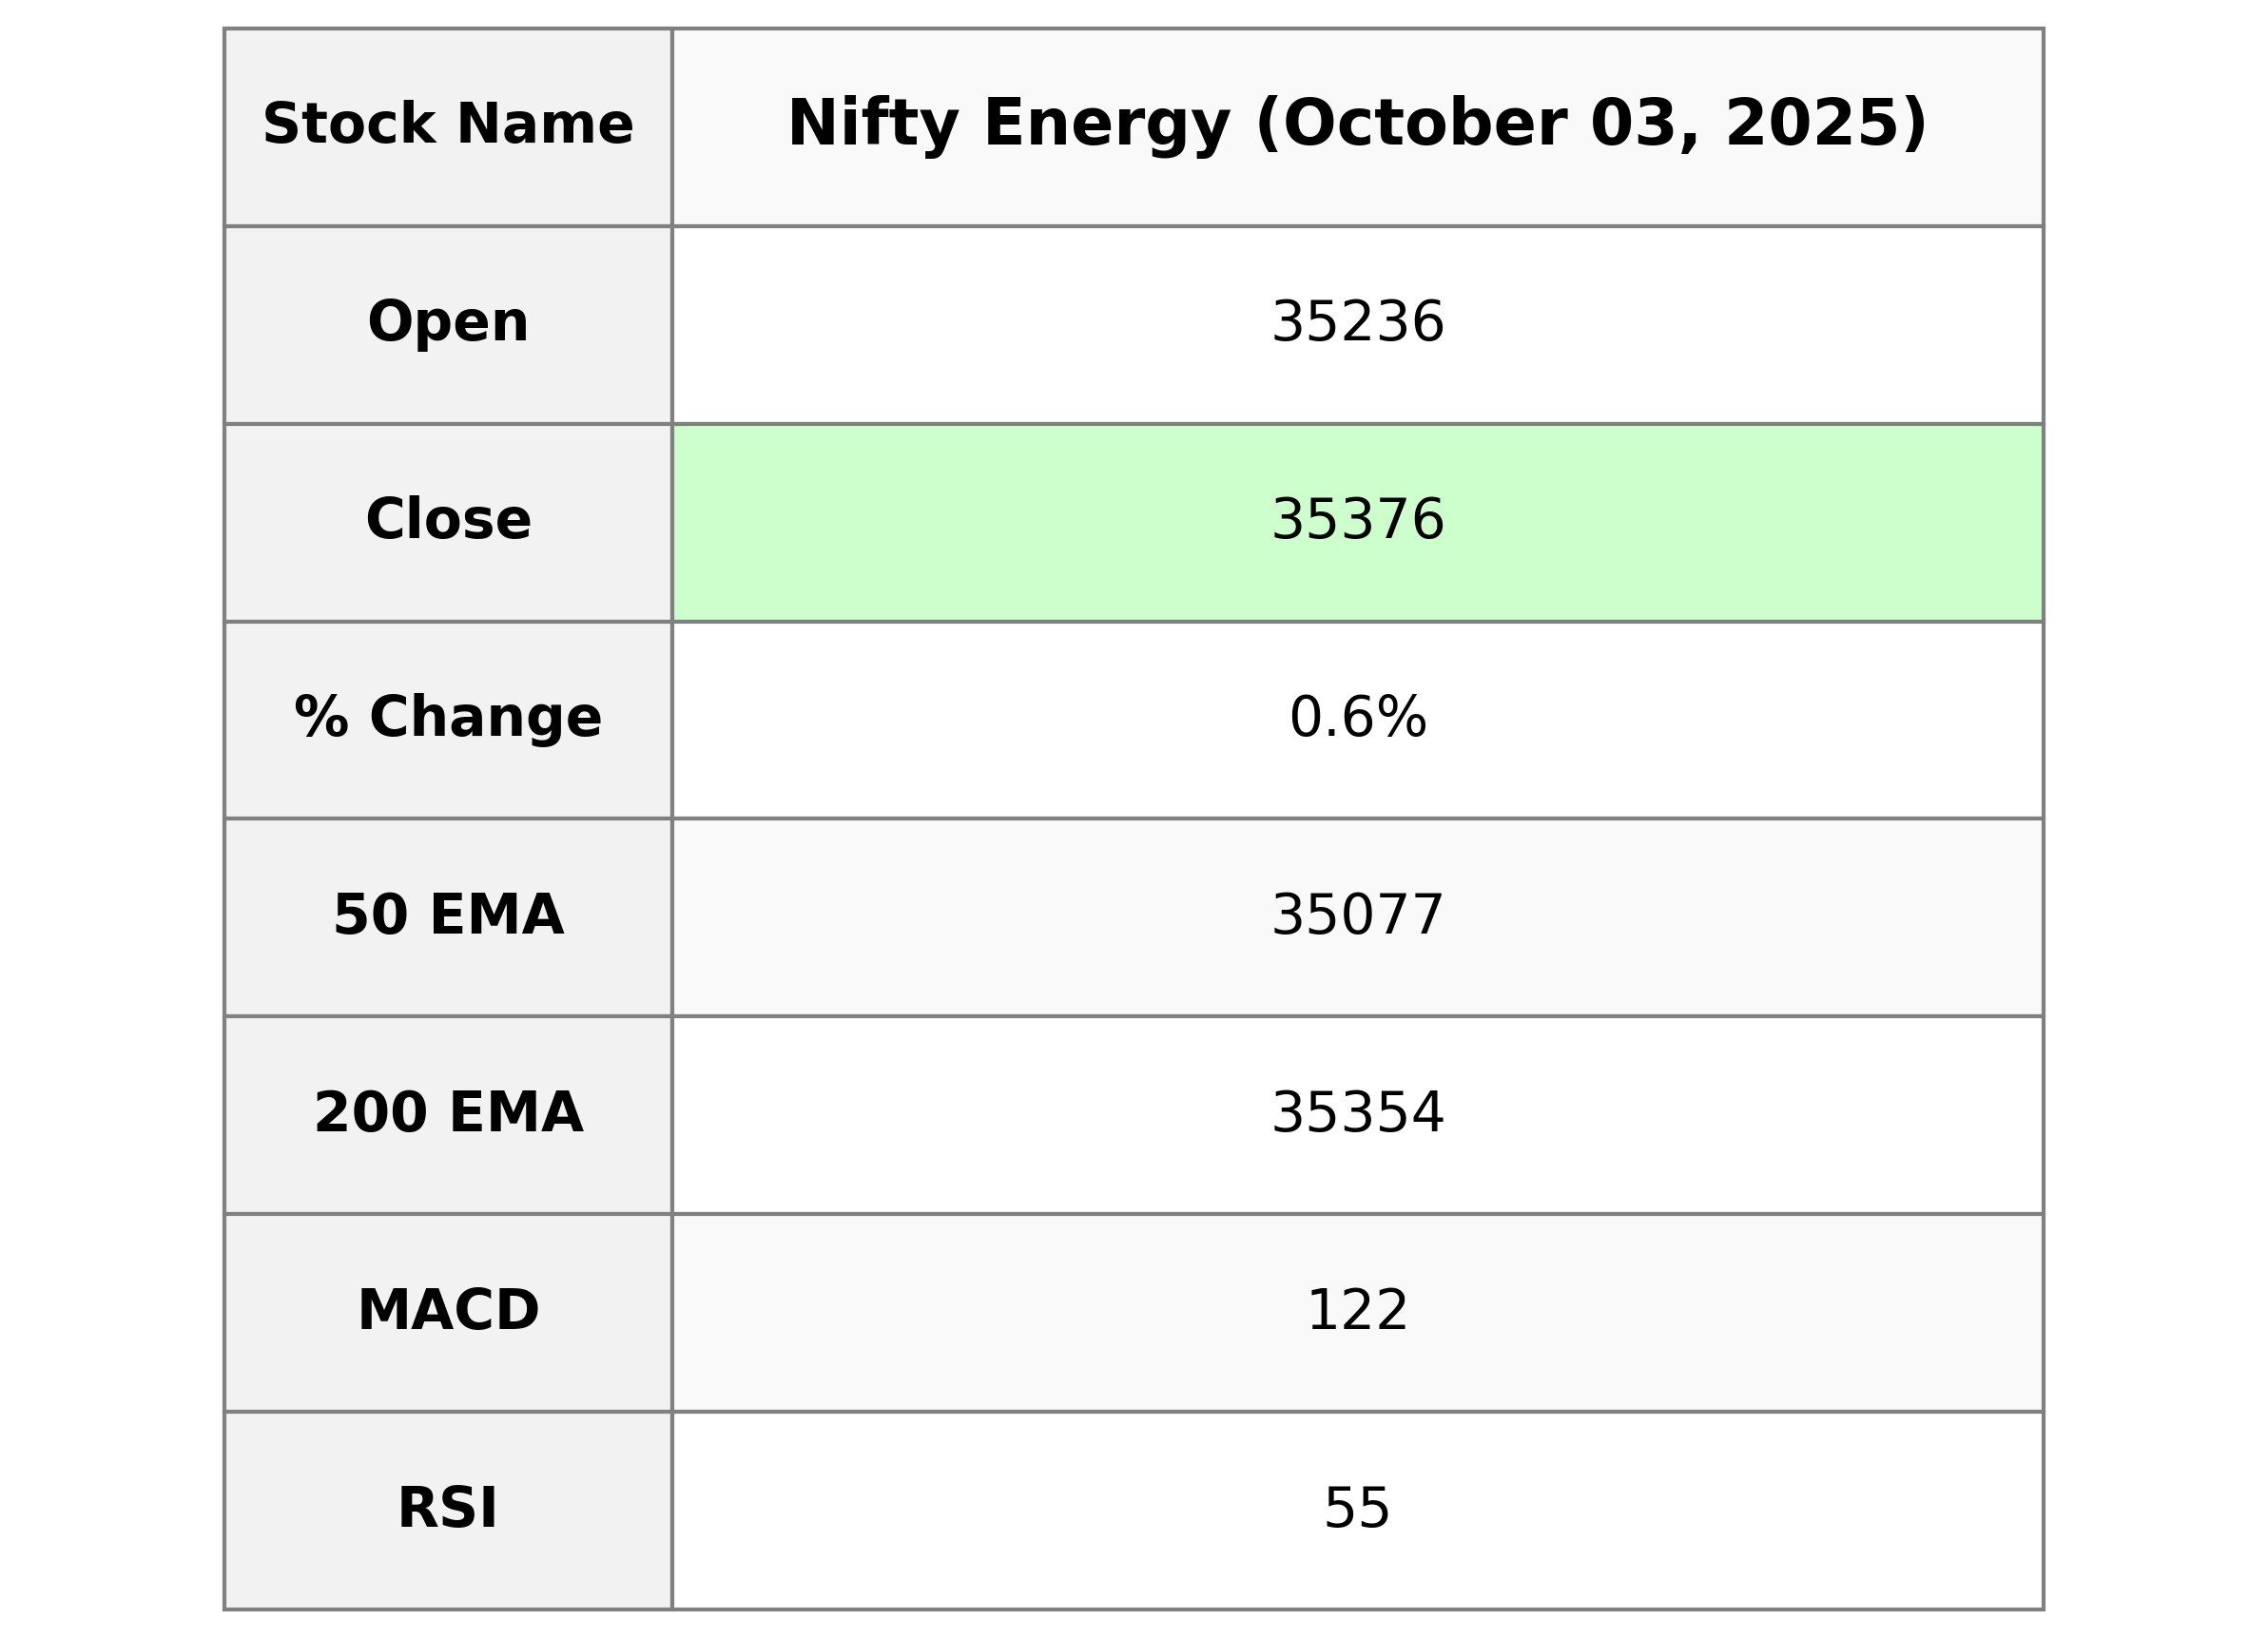
Nifty Energy opened at 35,236.25 and closed at 35,375.90, marking a 0.56% increase from its previous close of 35,180.35, with a points change of 195.55. The RSI stands at 55.23, indicating a generally neutral momentum, while the MACD is slightly below its signal line, suggesting a mild bearish divergence.
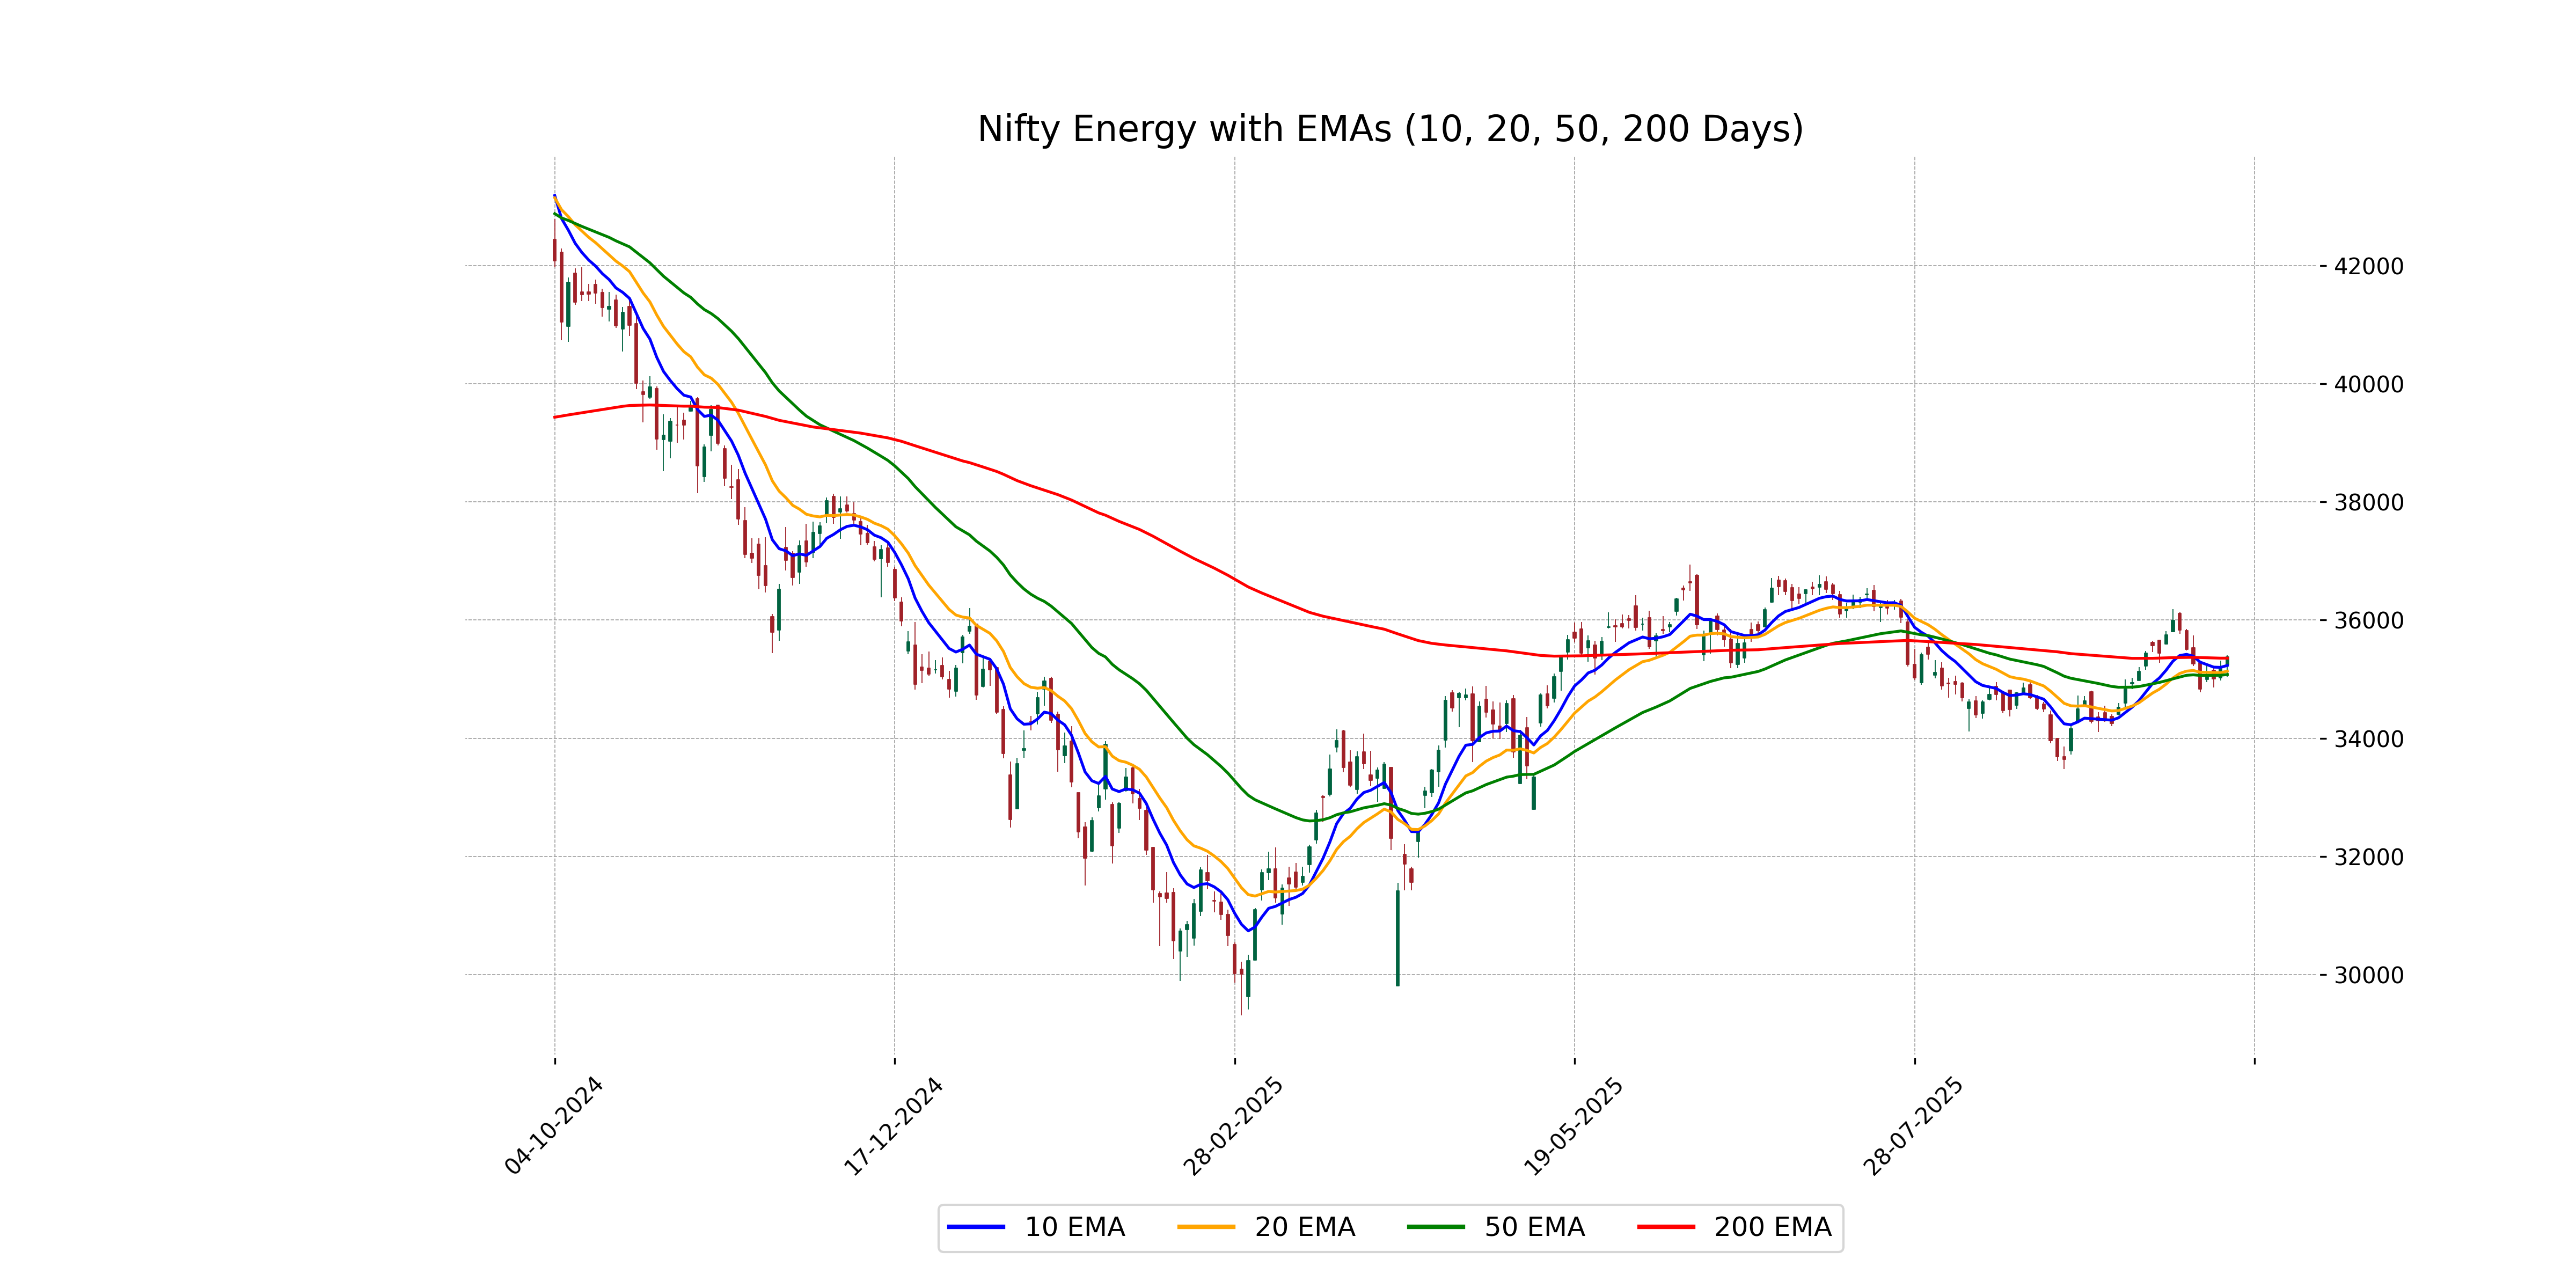
Relationship with Key Moving Averages
The closing price of Nifty Energy at 35,375.90 is above the 50-day EMA of 35,077.01, indicating a potential bullish trend. However, it is slightly below the 200-day EMA of 35,354.48, suggesting a level of caution. The 10 and 20-day EMAs are also below the current closing price, reinforcing near-term upward momentum.
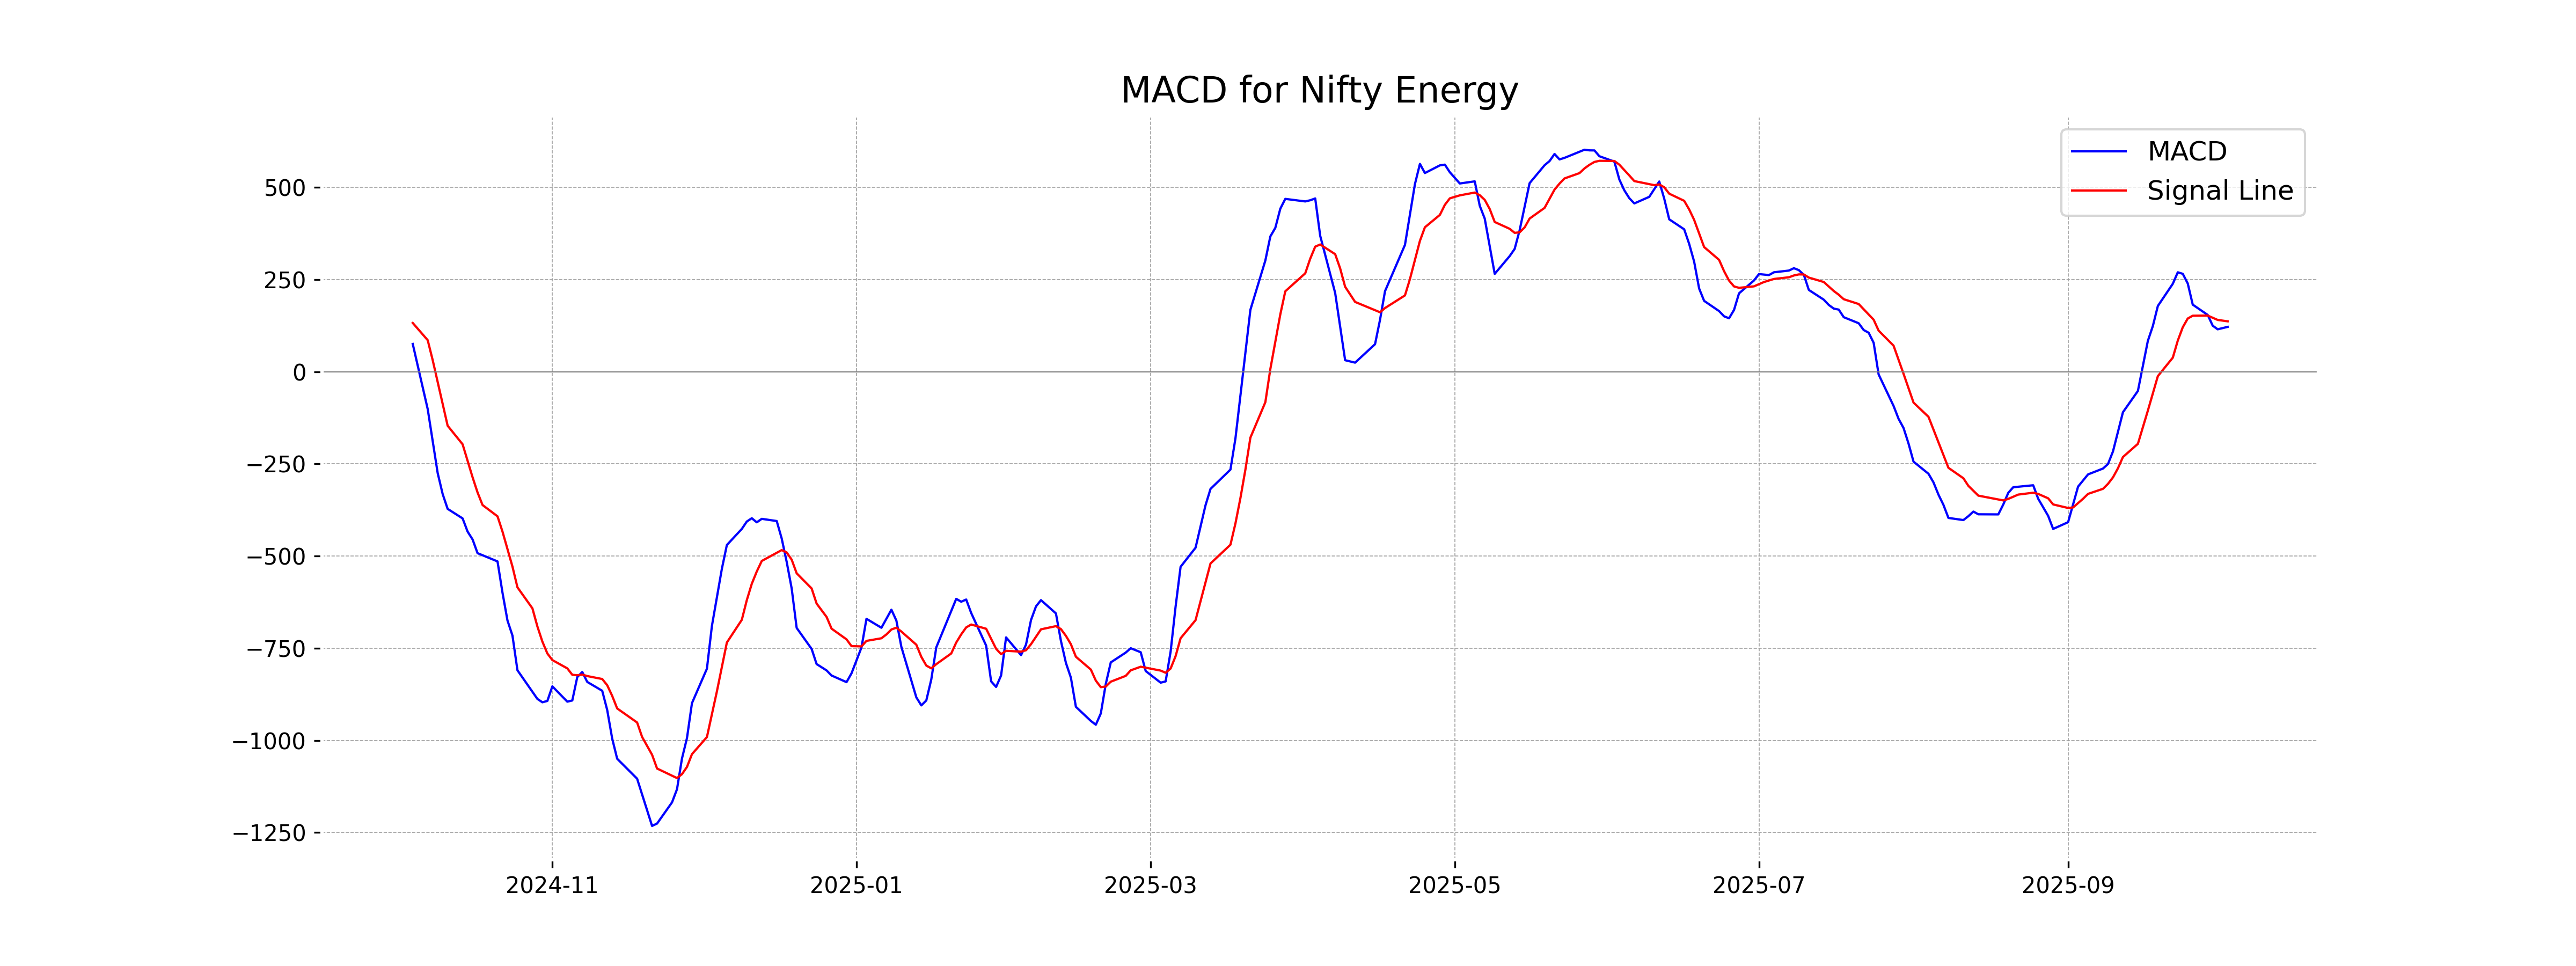
Moving Averages Trend (MACD)
Based on the data for Nifty Energy, the MACD line is at 121.65, which is below the MACD signal line of 136.73. This indicates a potential bearish signal as the MACD attempts to cross below the signal line, suggesting potential downward momentum in the stock price.
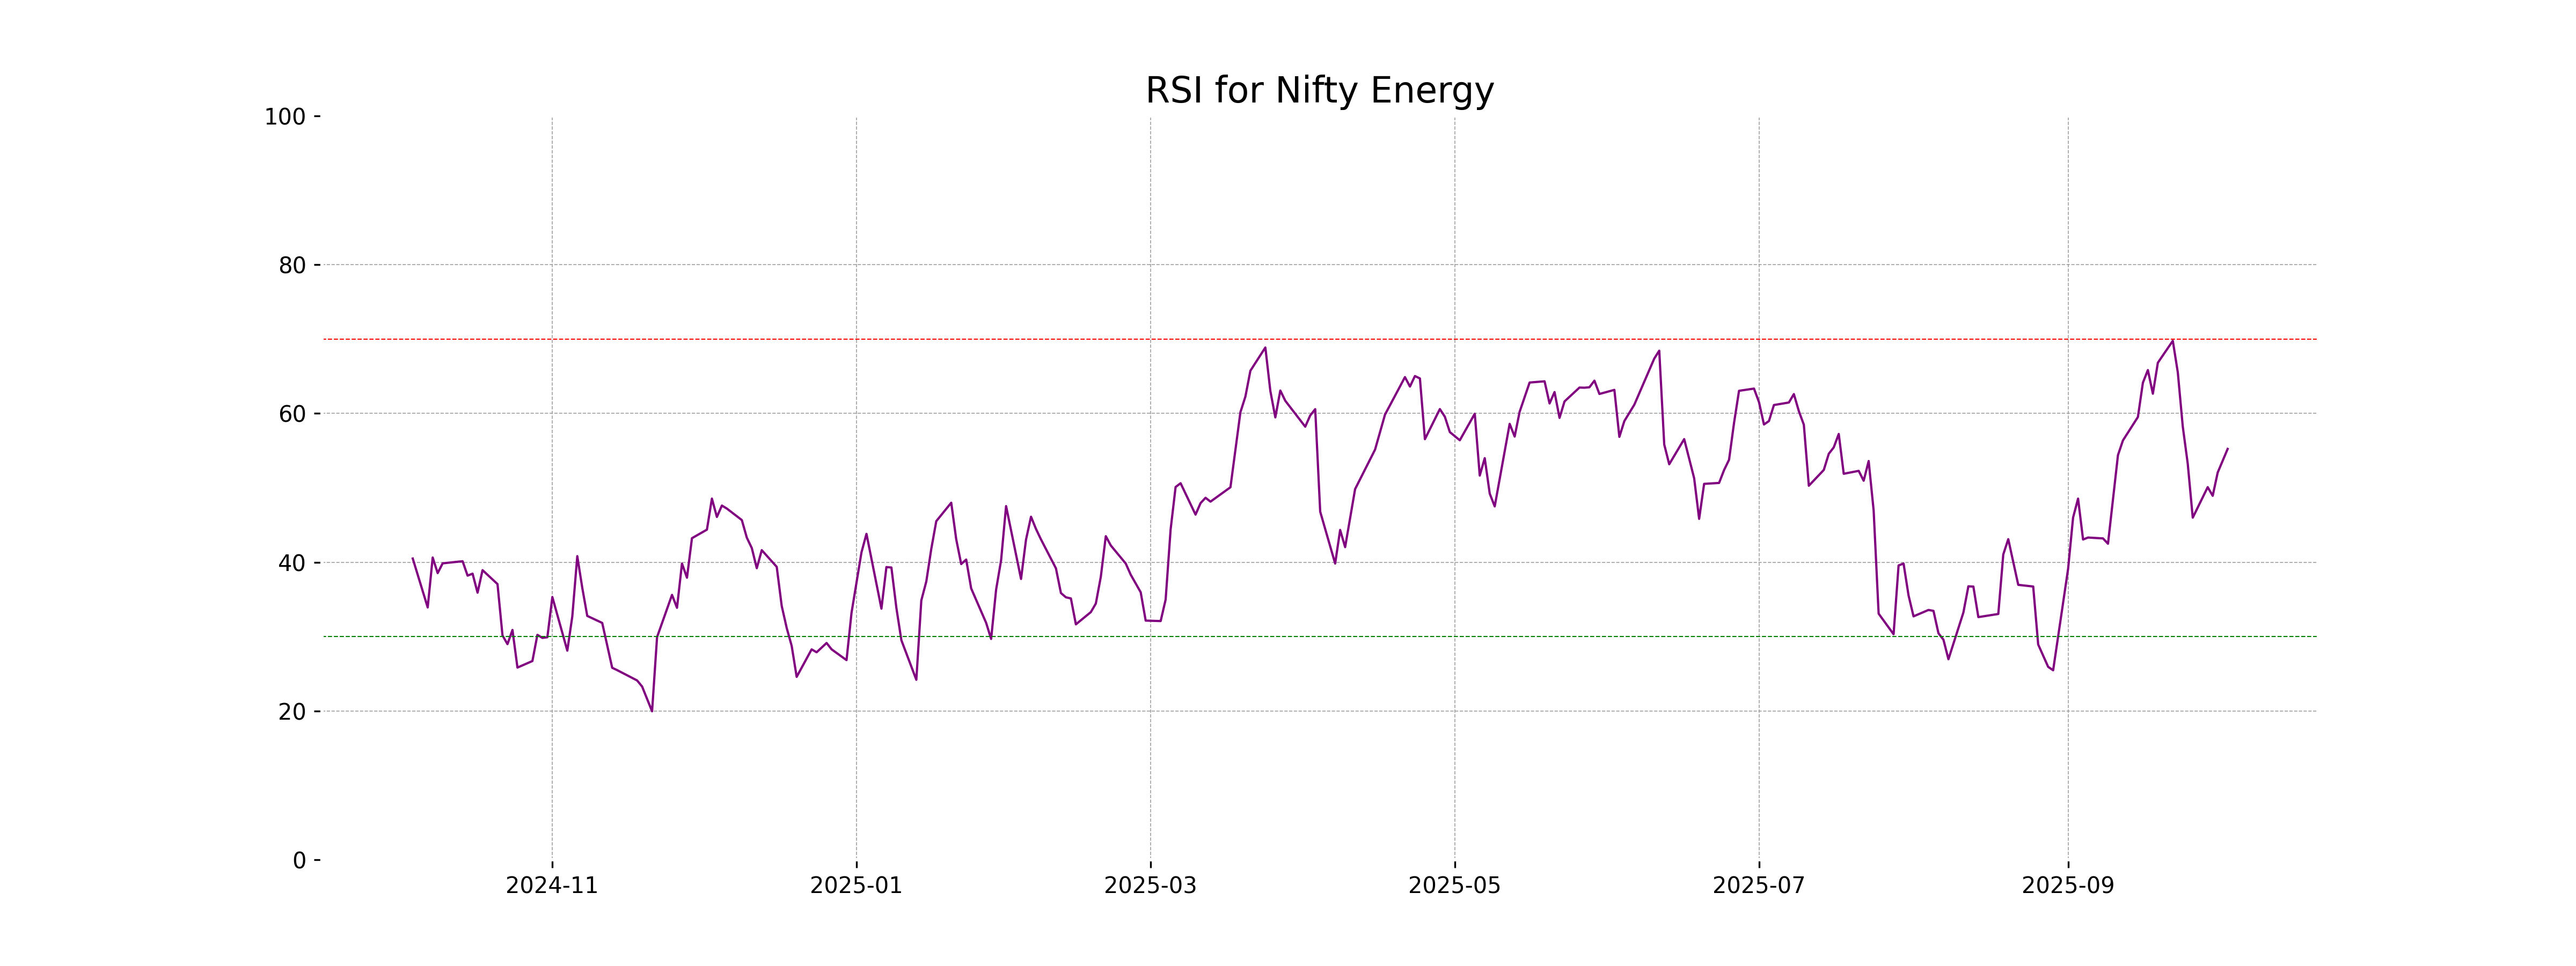
RSI Analysis
The RSI for Nifty Energy is 55.23, indicating a neutral position. It suggests that the stock is neither overbought nor oversold at the current levels, allowing for potential movement in either direction depending on market trends.
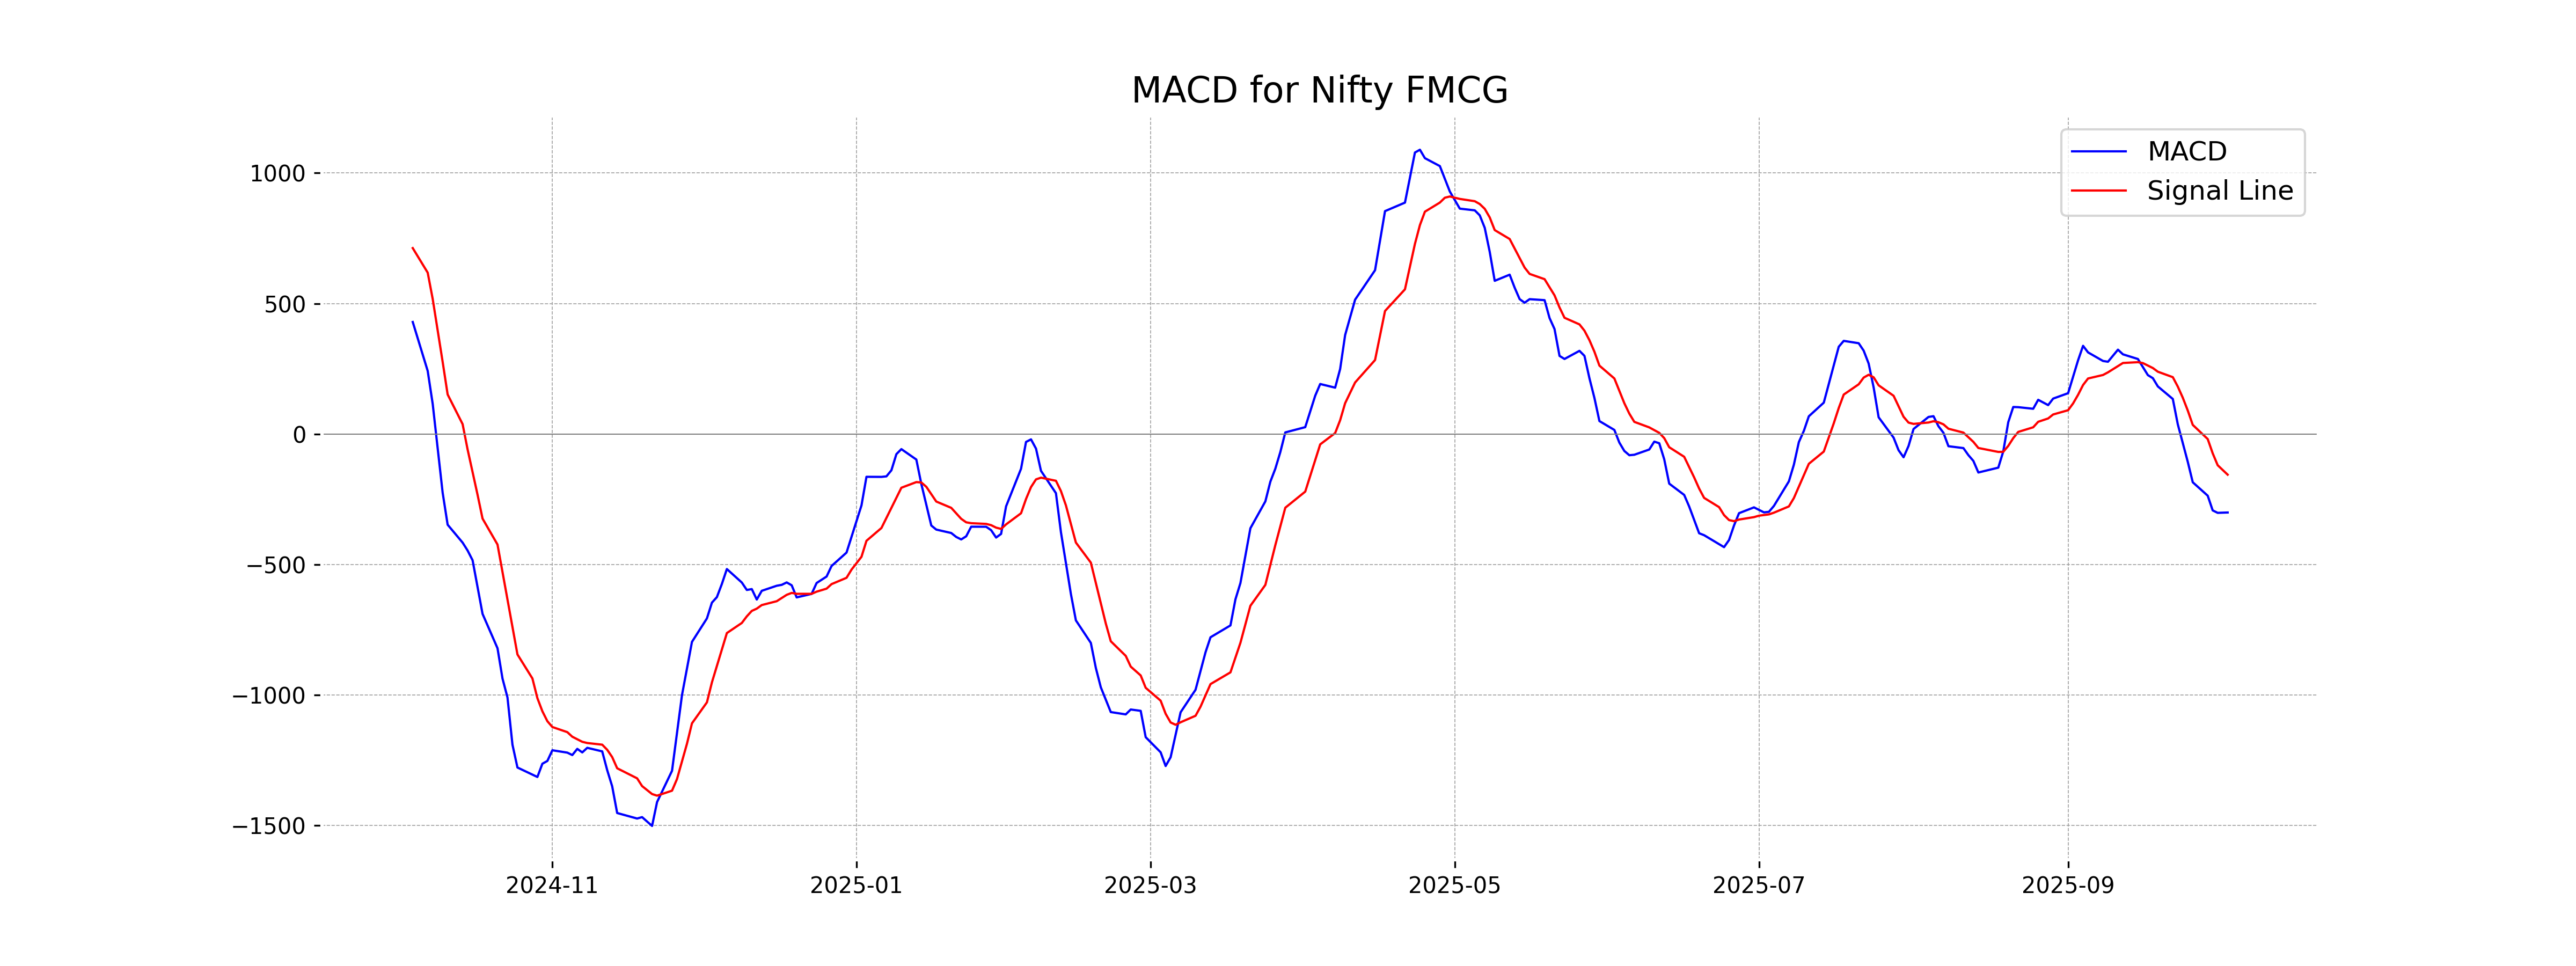
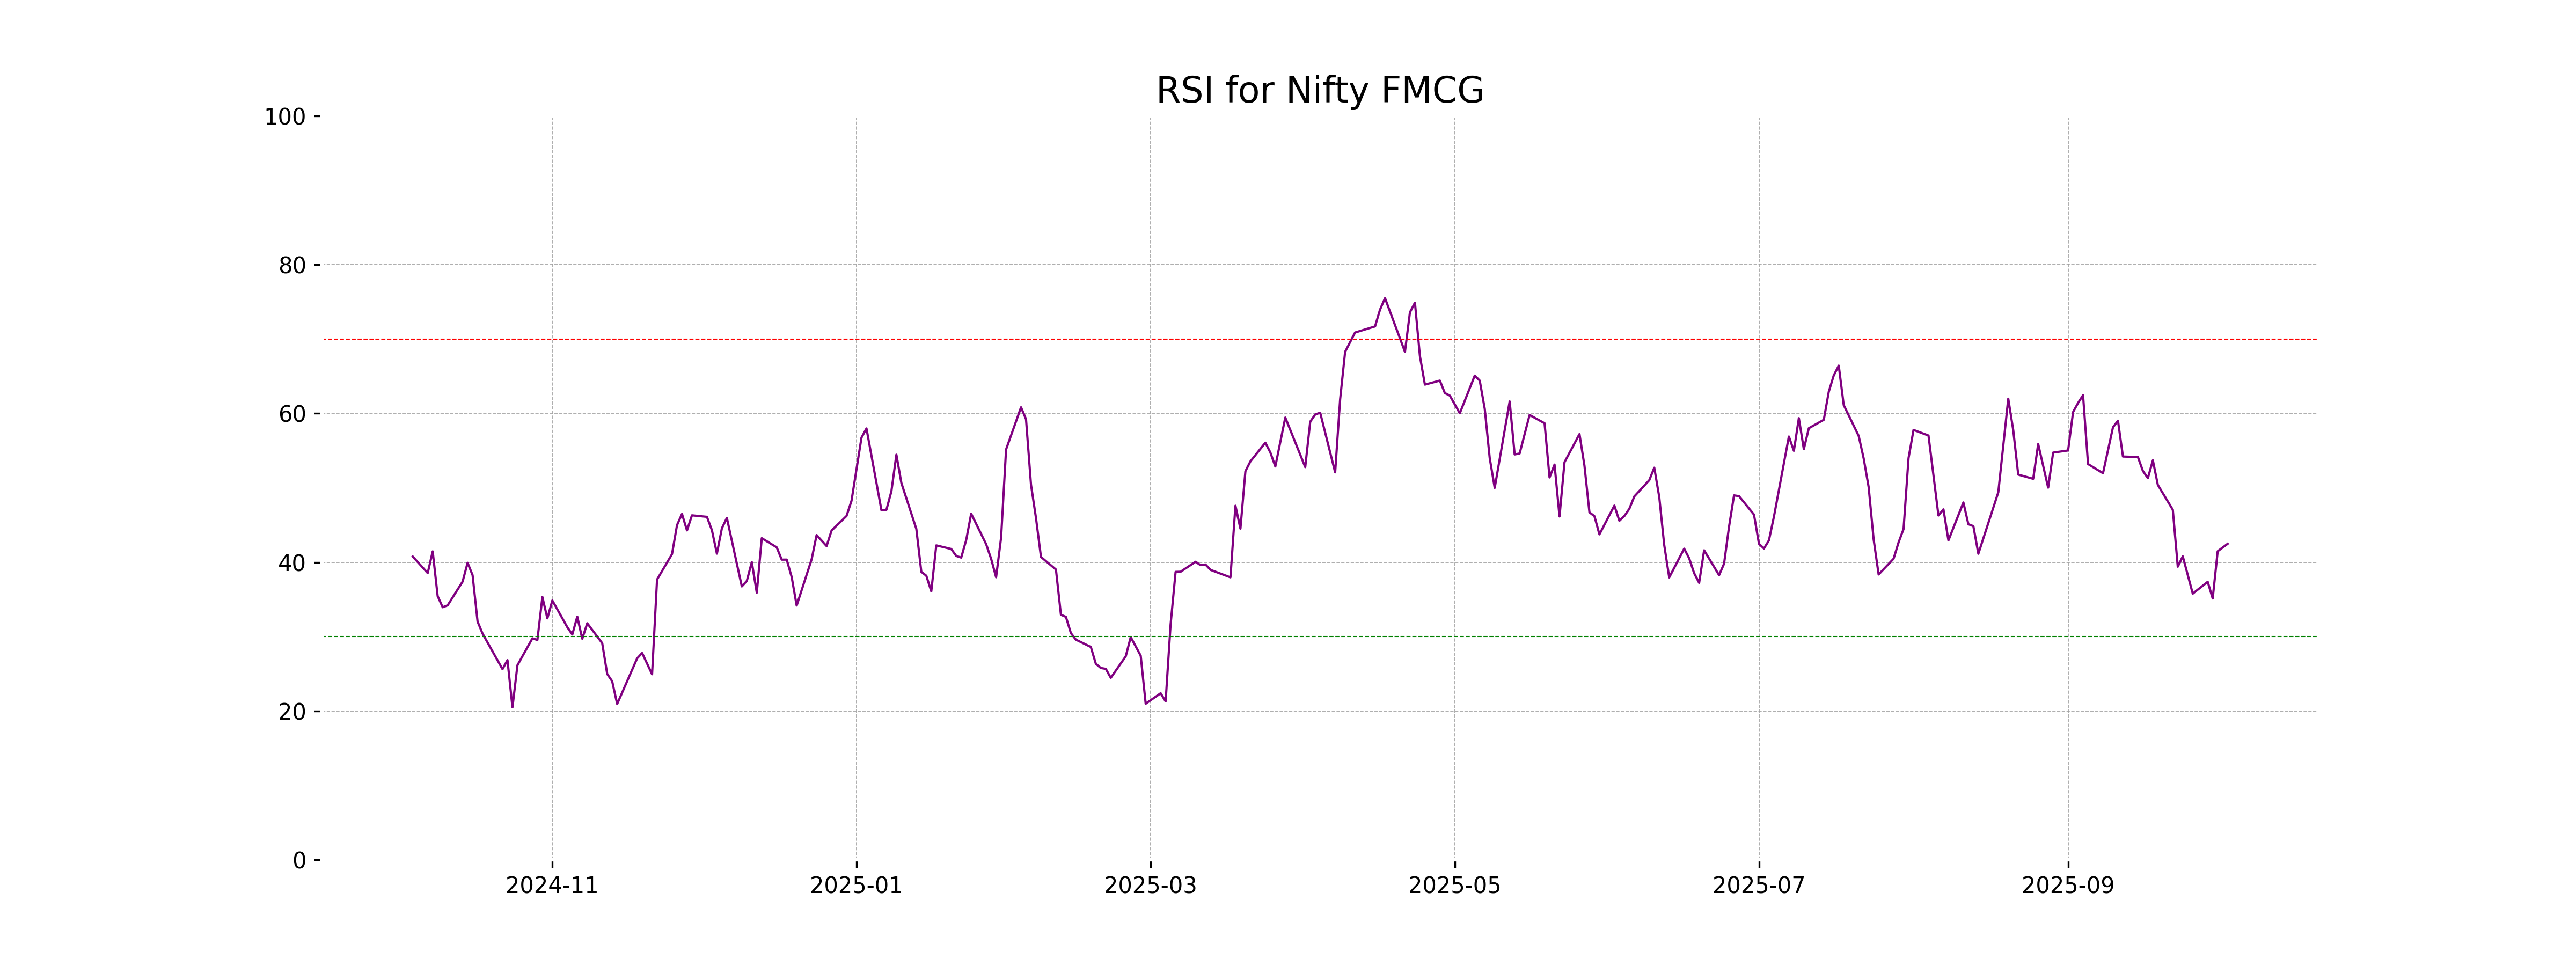
Analysis for Nifty FMCG - October 03, 2025
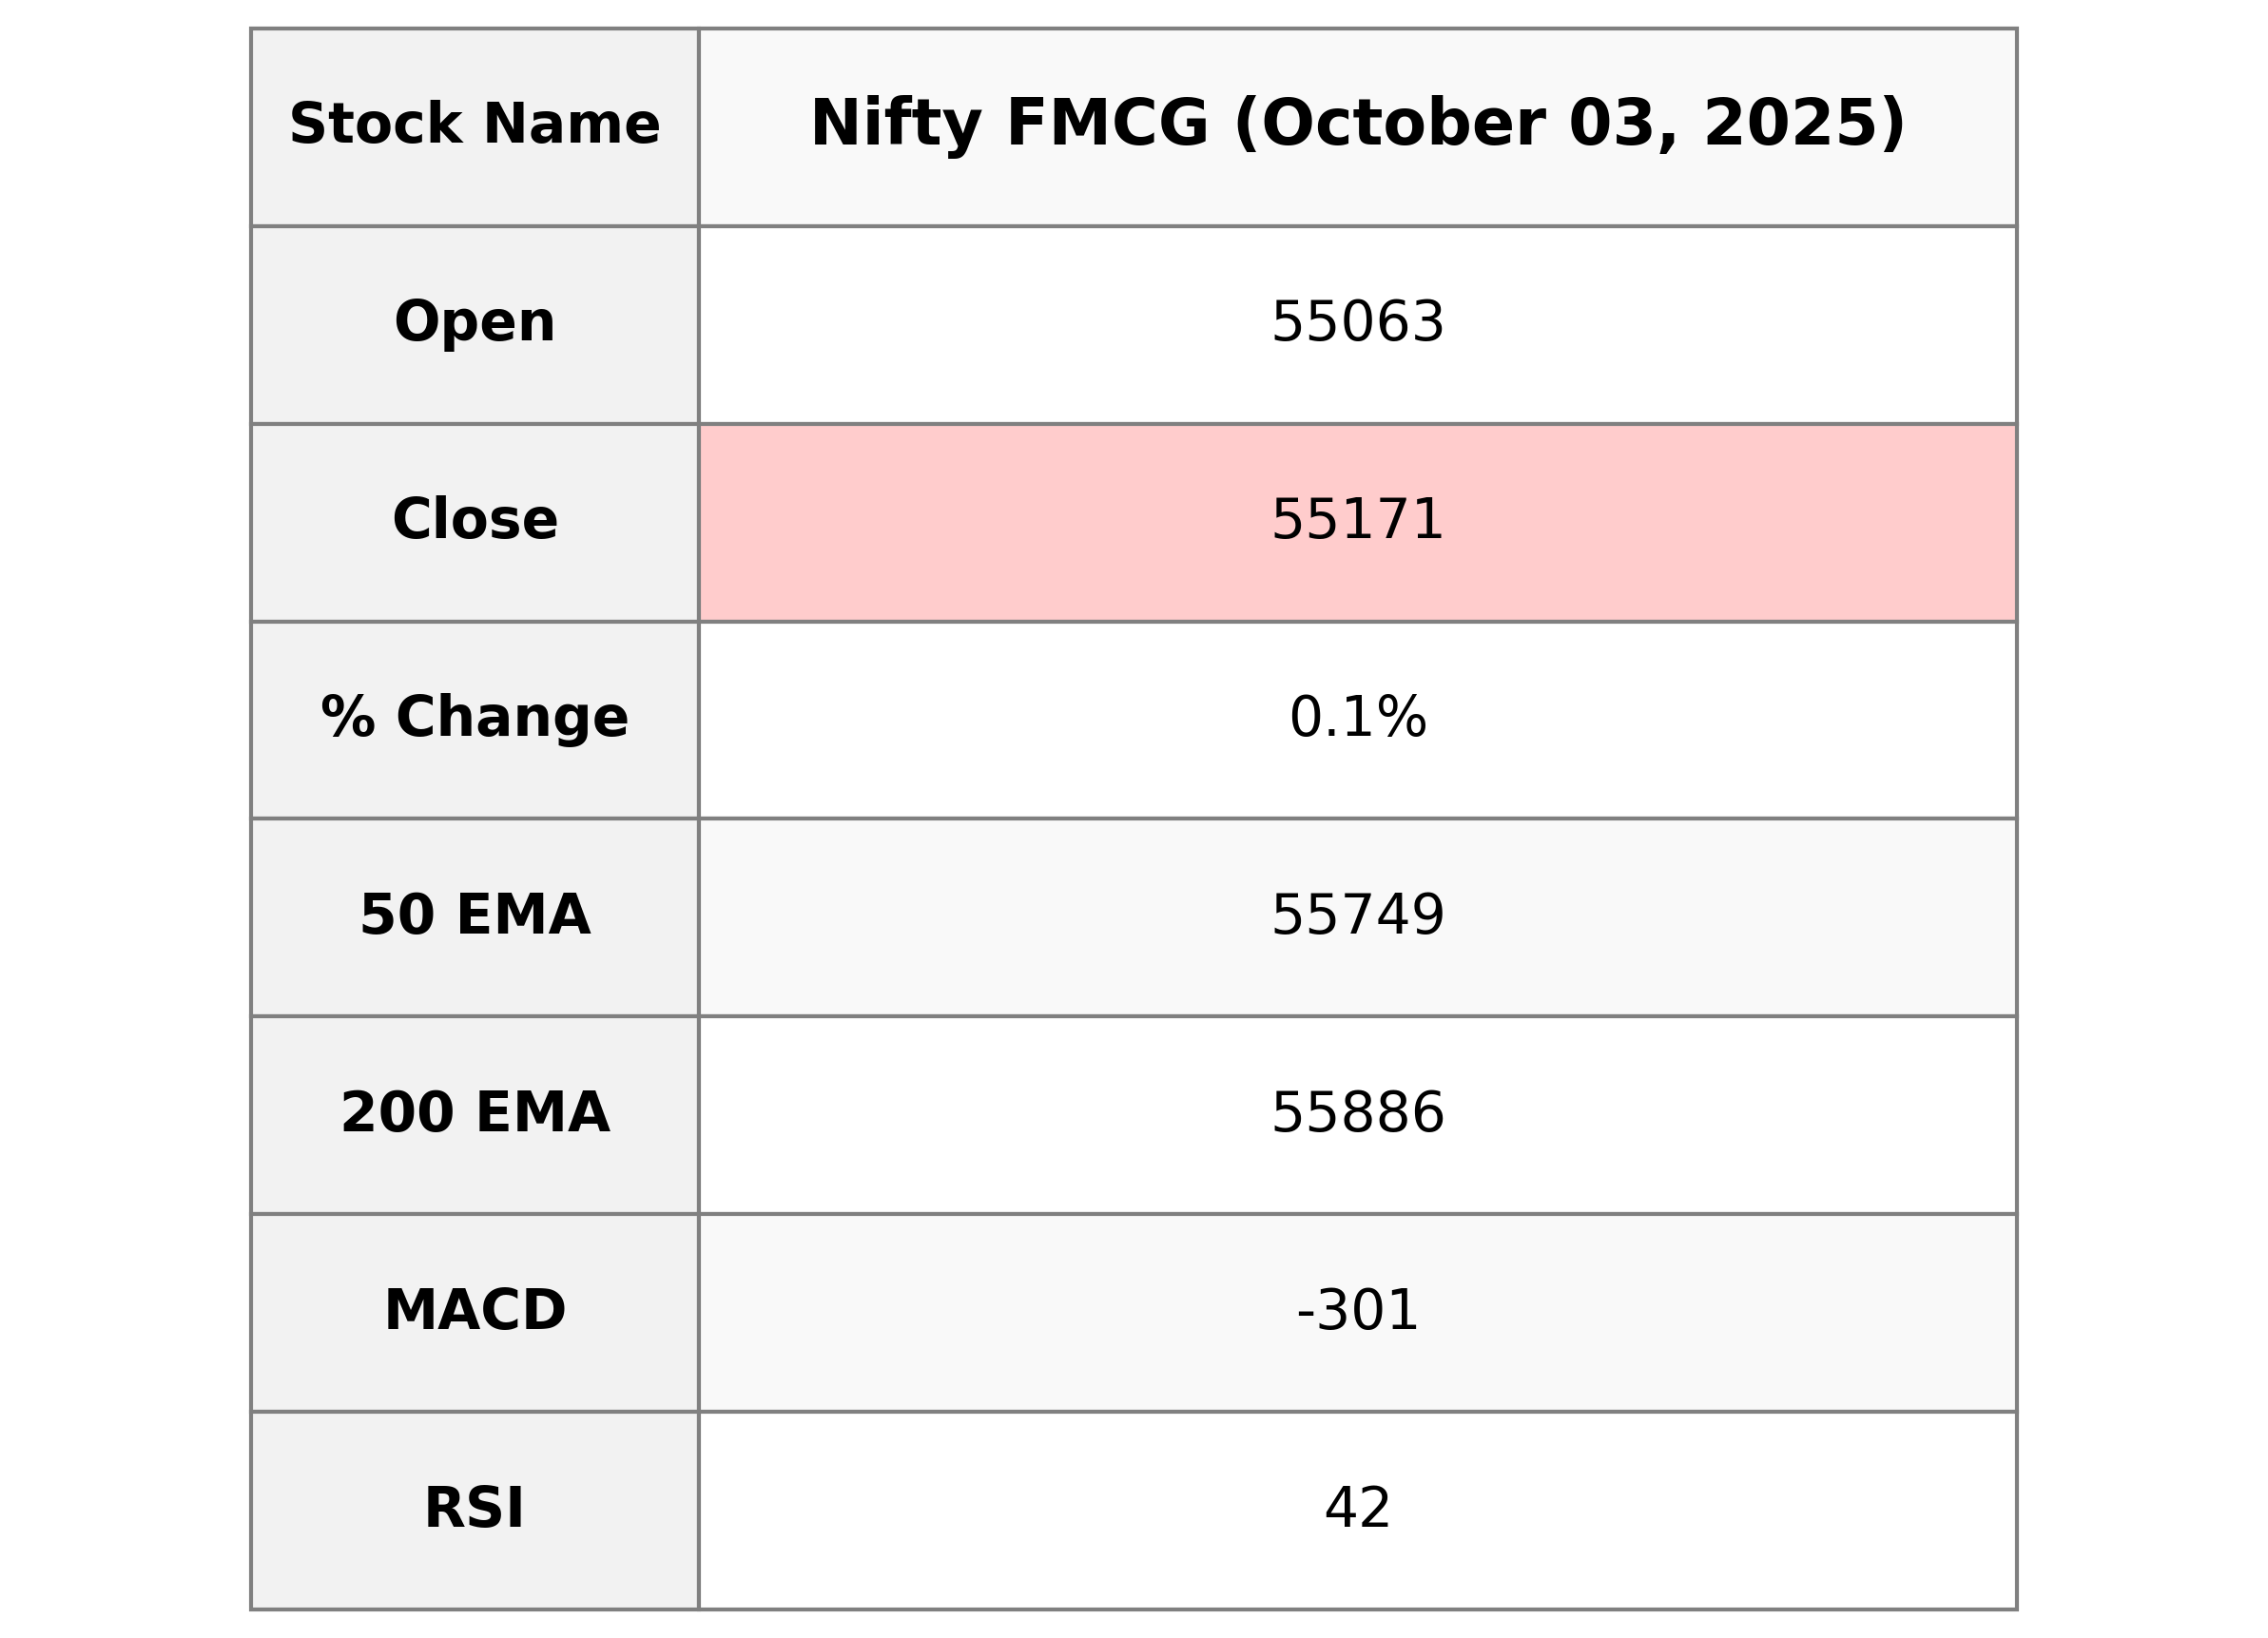
Nifty FMCG opened at 55062.95, reached a high of 55213.05, and closed at 55170.60. The index showed a slight increase with a % Change of 0.12%. The technical indicators suggest bearish momentum, with an RSI of 42.48 and a negative MACD of -300.55, indicating potential weakness in the current trend.
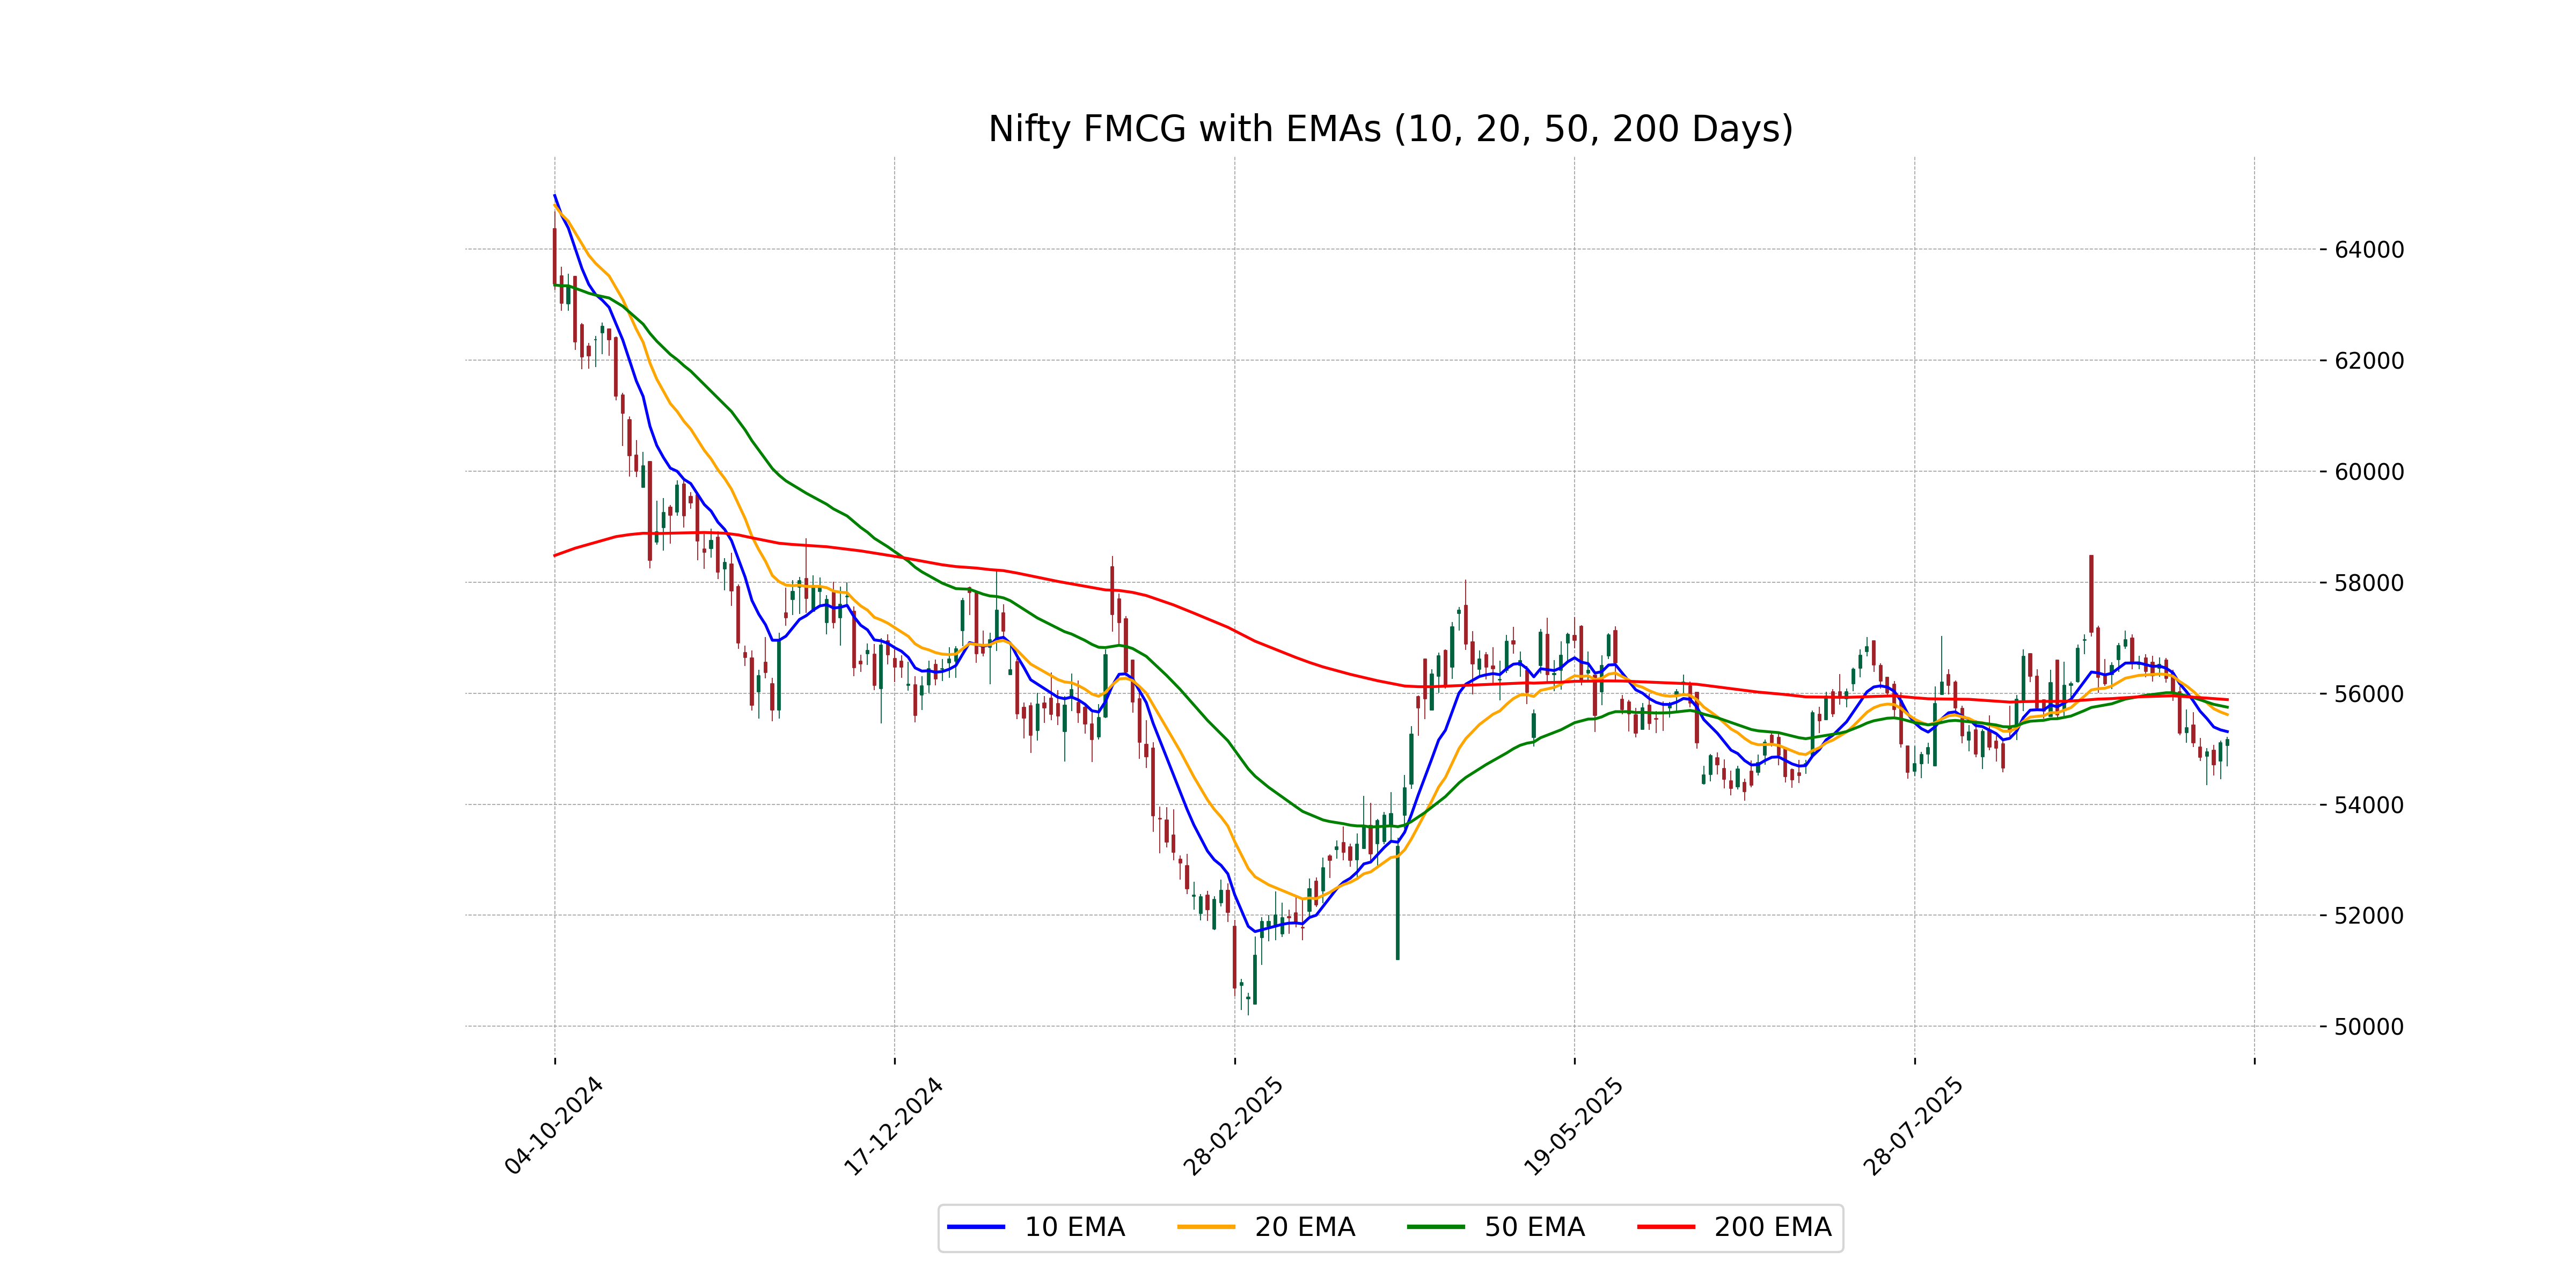
Relationship with Key Moving Averages
The closing price of Nifty FMCG at 55,170.60 is below its 50-day EMA of 55,749.46 and 200-day EMA of 55,885.53, indicating a bearish trend in the short and long term. It is, however, close to its 10-day EMA of 55,309.31, suggesting recent price movements have been near shorter-term averages.
Moving Averages Trend (MACD)
The MACD for Nifty FMCG is at -300.55 while the MACD Signal is at -155.62. This suggests a bearish momentum as the MACD is below its signal line, indicating potential weakness in the current trend.
RSI Analysis
The RSI for Nifty FMCG is at 42.48, indicating that it is nearing the lower neutral zone. This suggests that the index is not yet oversold, but caution should be exercised as it approaches the 30 mark, which would imply a potential buying opportunity if it continues to decrease.
Analysis for Nifty Infra - October 03, 2025
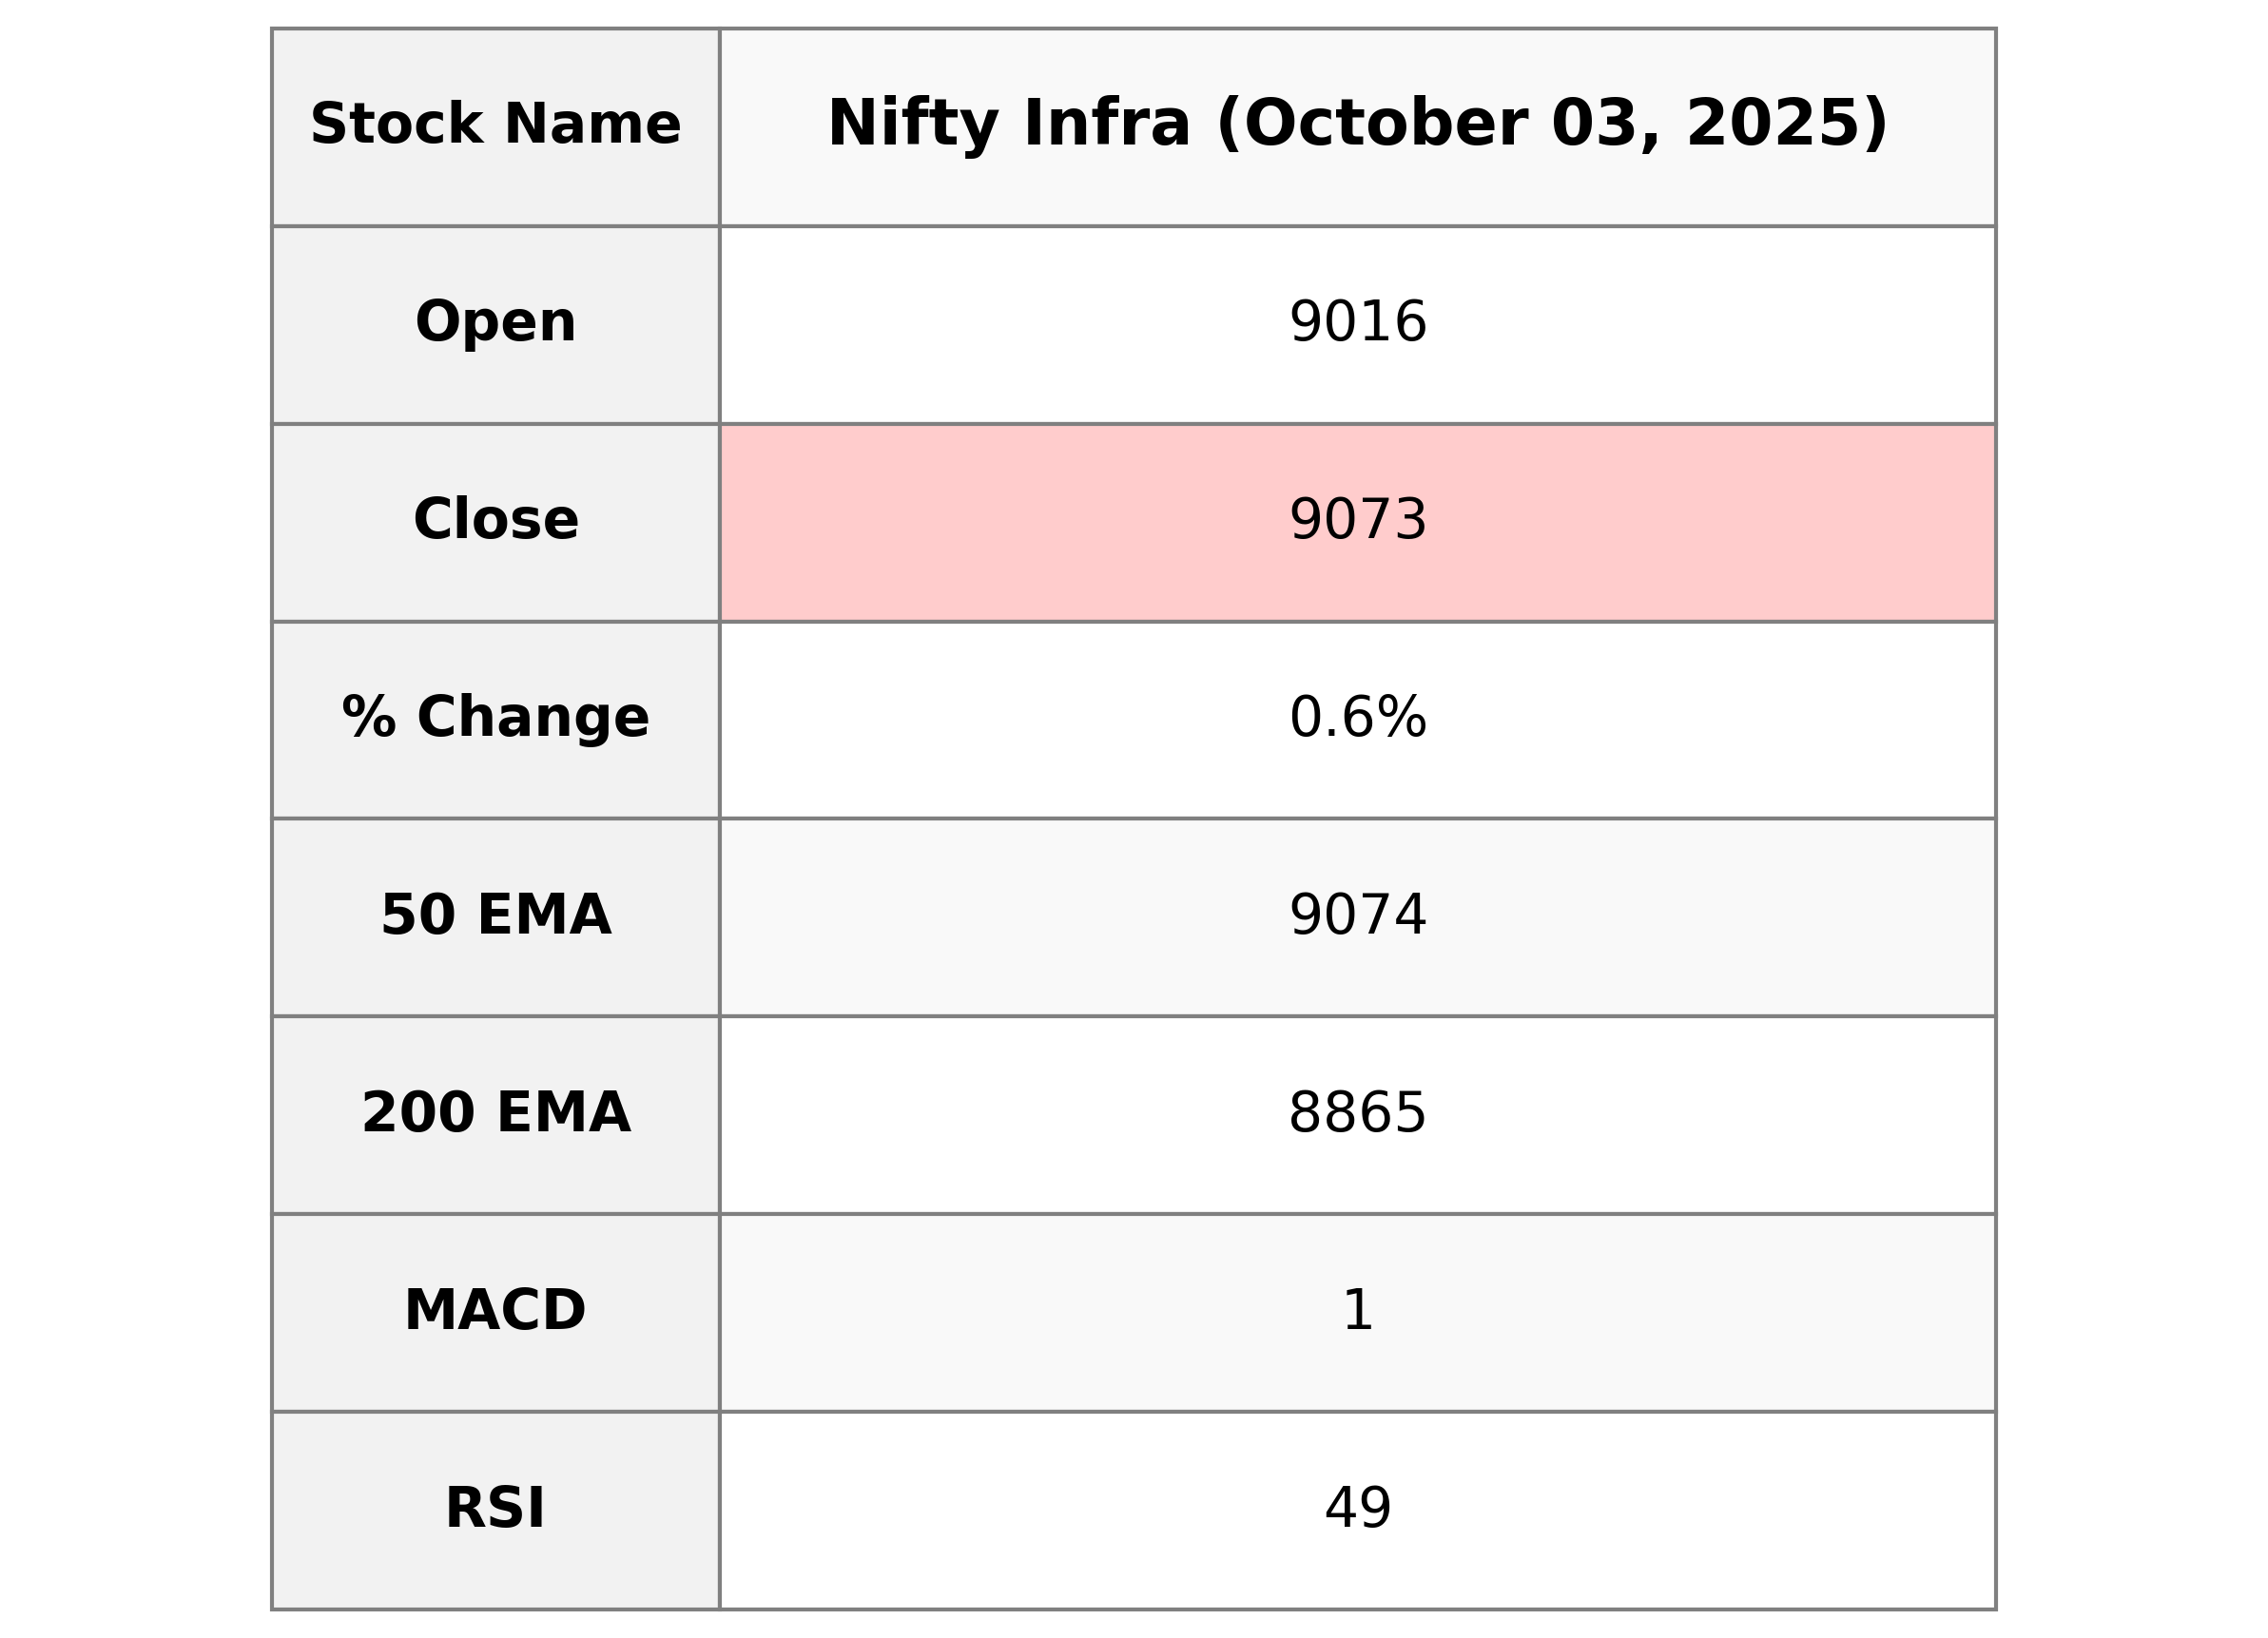
# Nifty Infrastructure Performance The Nifty Infrastructure index opened at 9016.05 and closed at 9072.85, showing a positive movement with a points change of 49.80 and a percentage change of 0.55%. The index experienced a day high of 9078.85 and a low of 9001.55. The 50 EMA and 20 EMA are close to the closing price, with the RSI at 49.29 indicating a somewhat neutral market momentum.
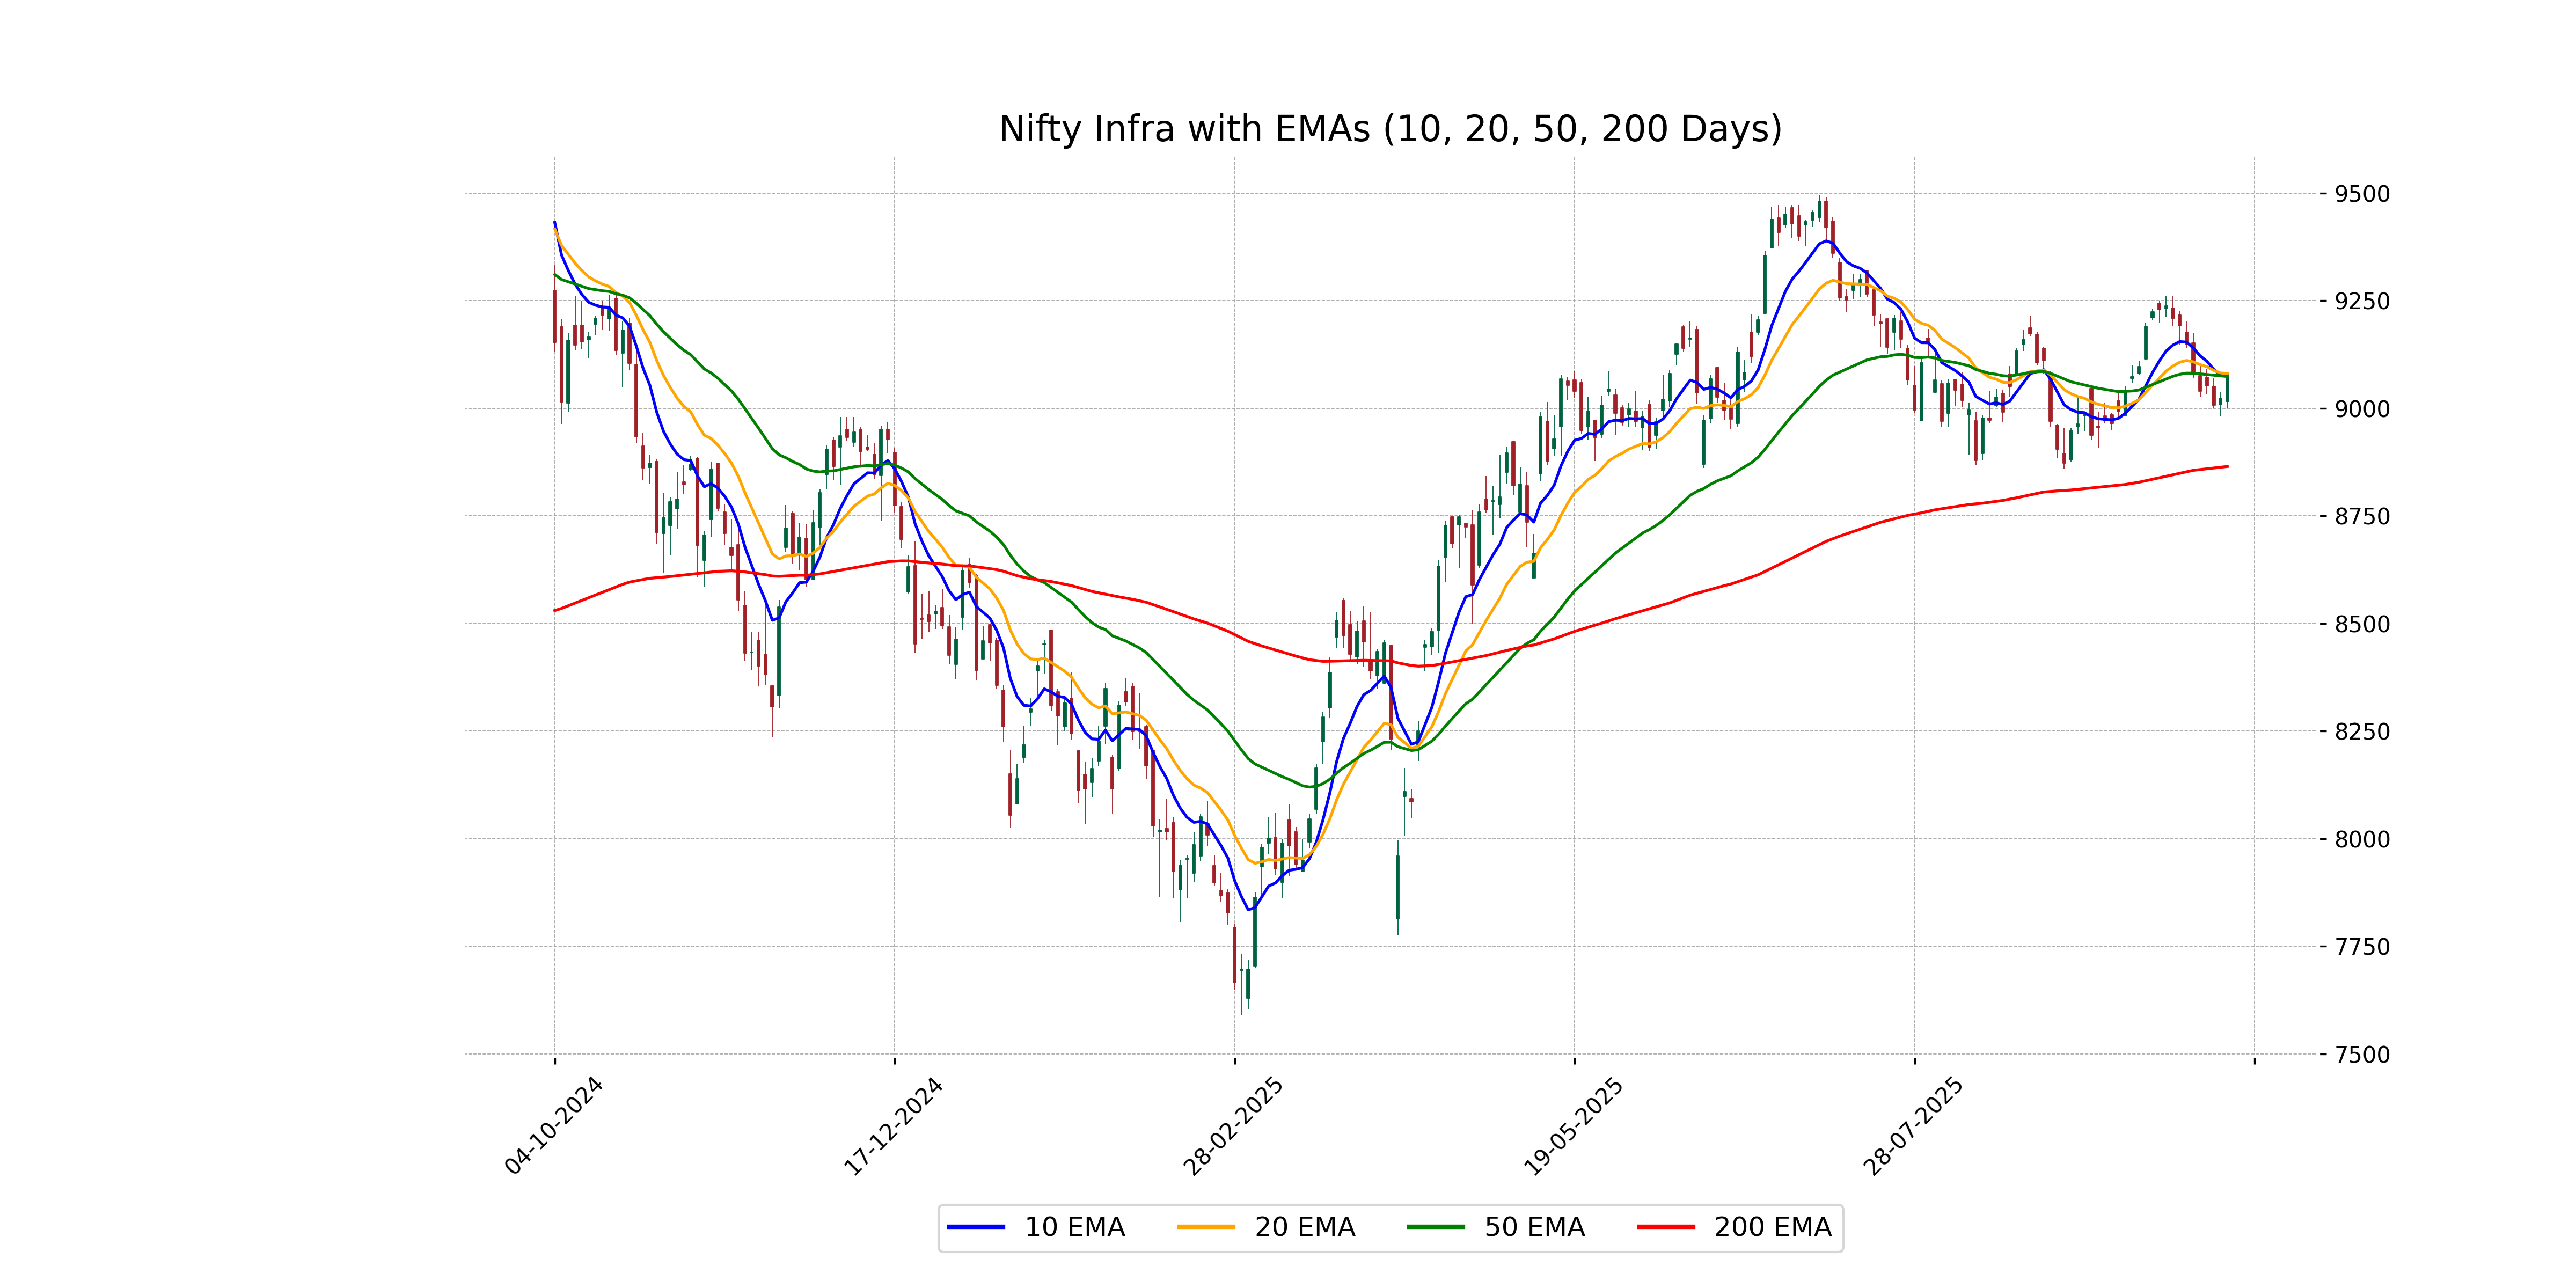
Relationship with Key Moving Averages
Nifty Infra closed at 9072.85, slightly below its 10-day EMA of 9077.40 and 20-day EMA of 9081.22, indicating a near-term weakness. However, it is positioned just below the 50-day EMA of 9074.05, suggesting a potential support zone. The 200-day EMA at 8864.97 remains significantly lower, reflecting a sustained long-term uptrend.
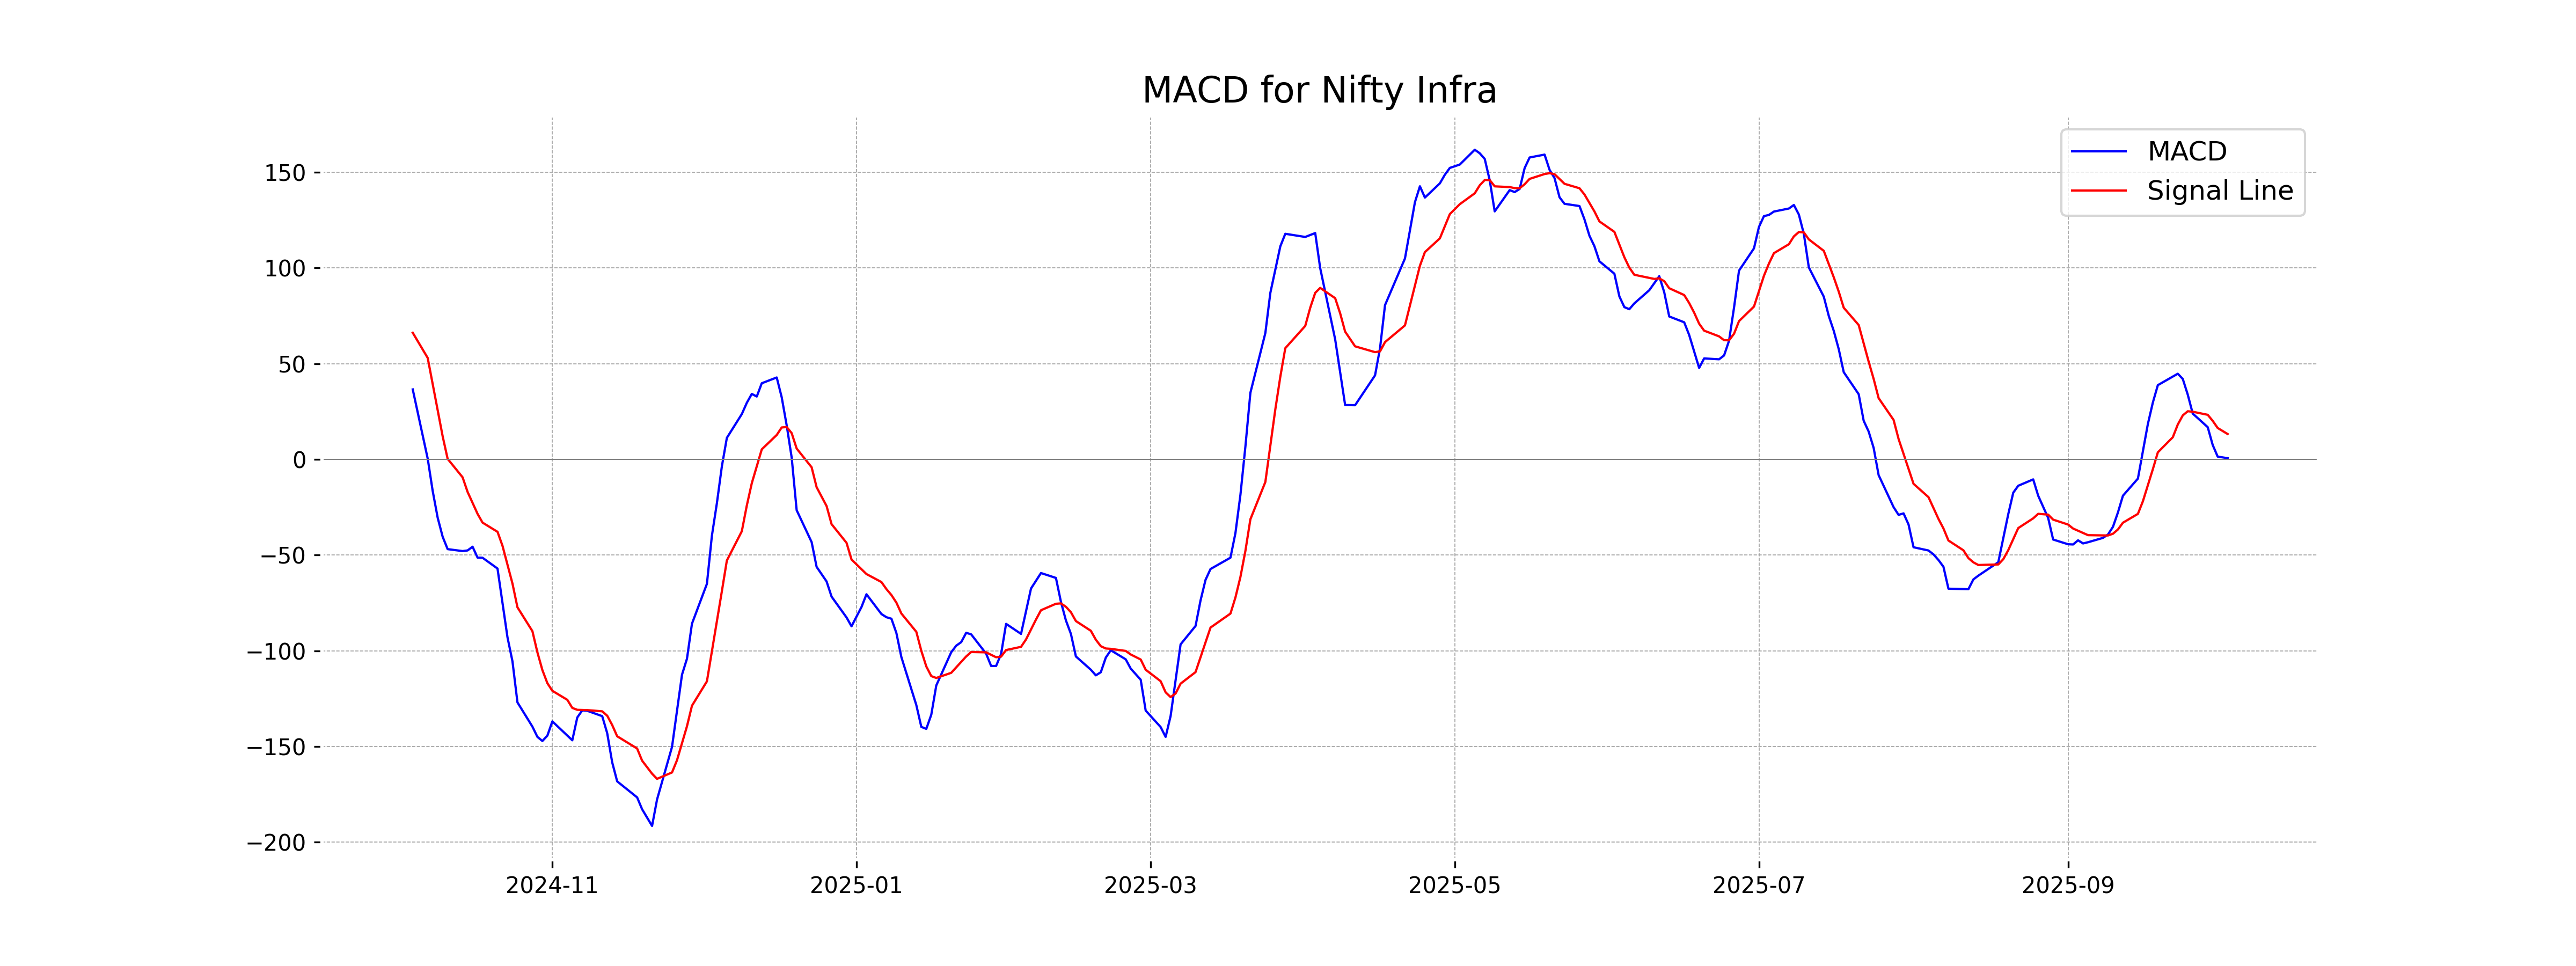
Moving Averages Trend (MACD)
Nifty Infra has a MACD value of 0.60, which is significantly below the MACD Signal of 13.23. This suggests a bearish momentum, as the MACD line is below the Signal line, indicating potential selling pressure. Additionally, other technical indicators such as the RSI at 49.29 suggest a neutral to slightly bearish sentiment.
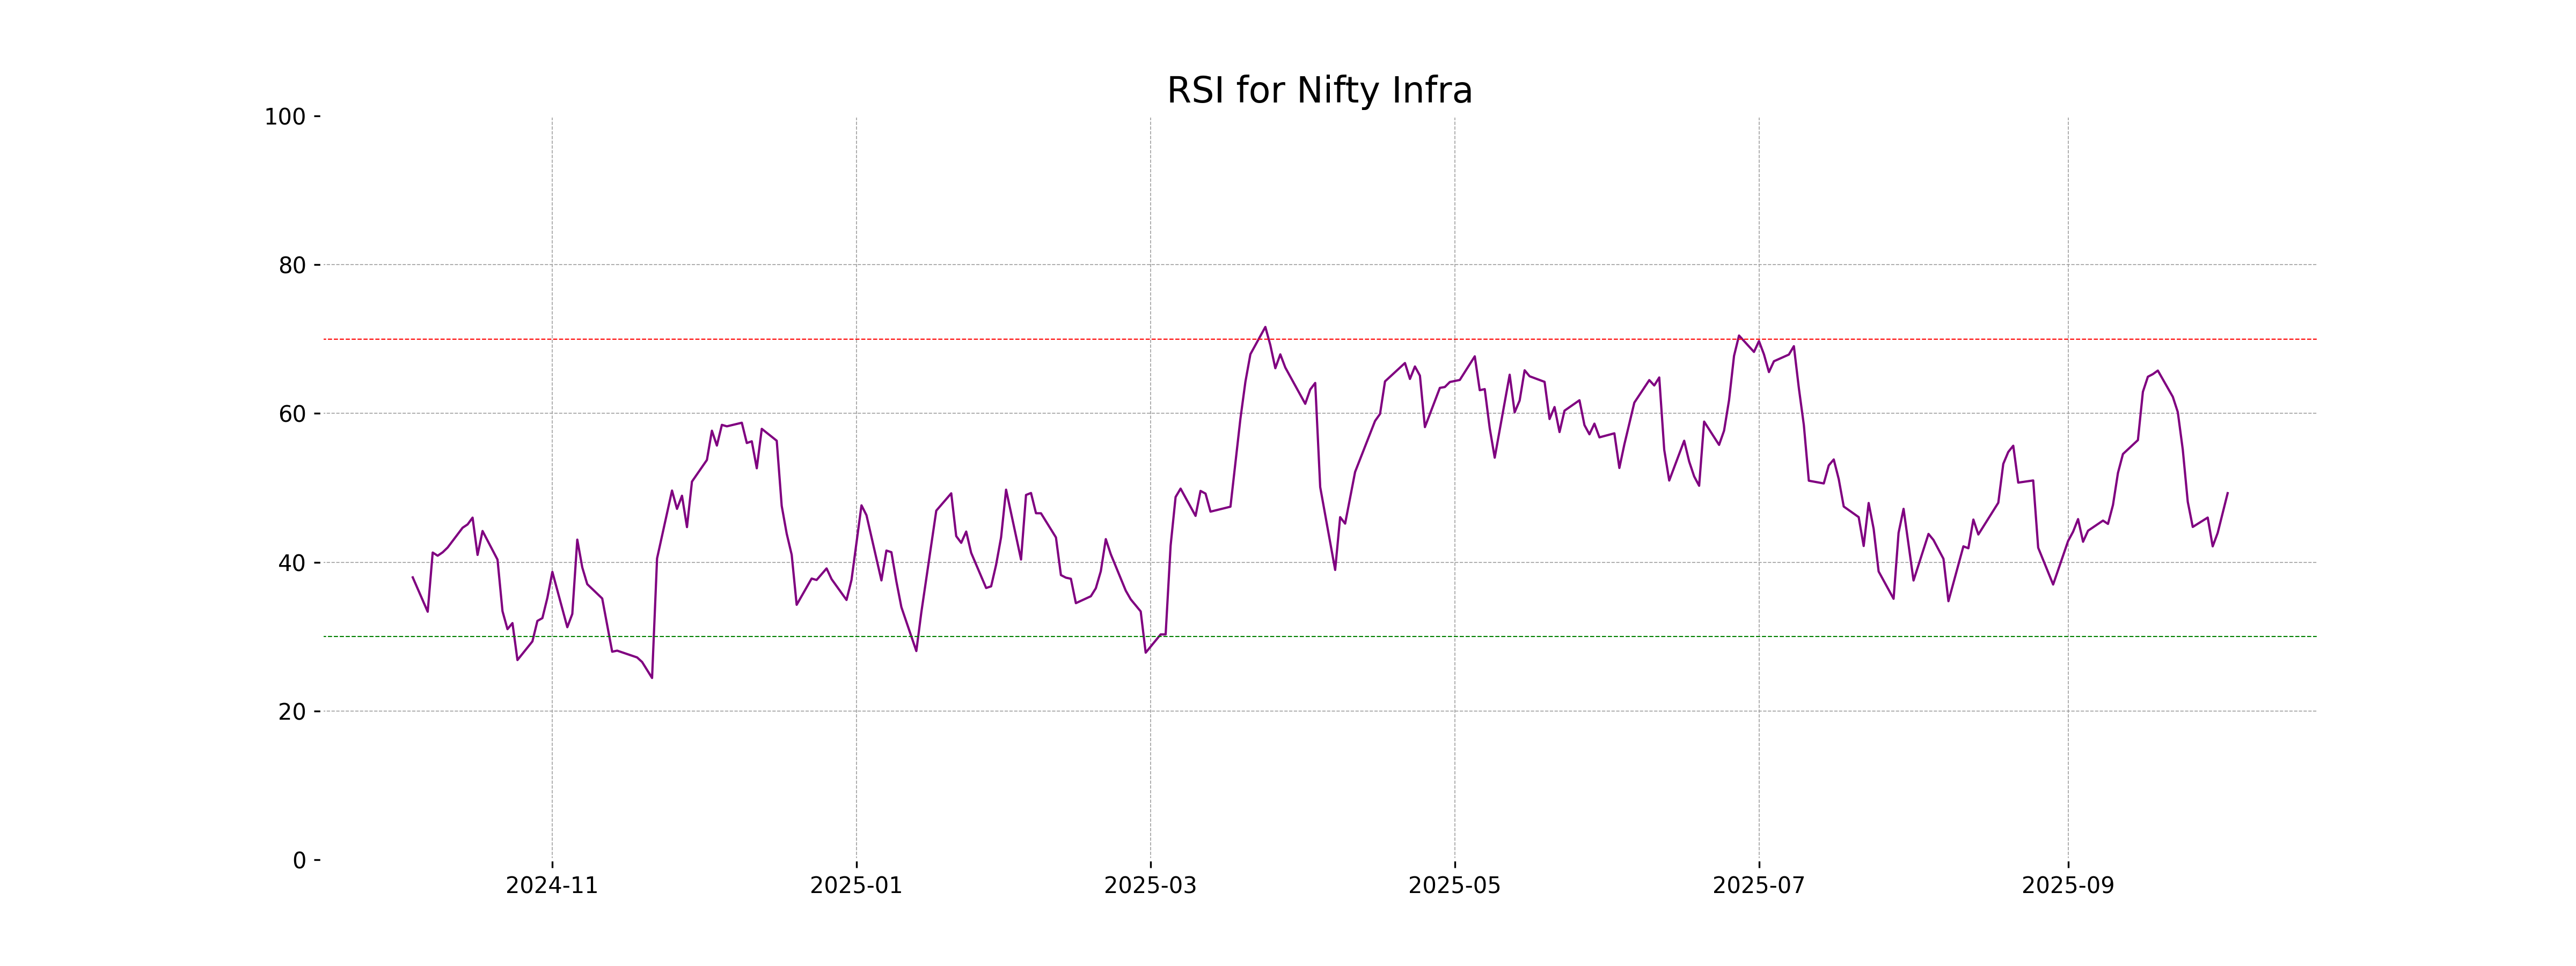
RSI Analysis
The Relative Strength Index (RSI) for Nifty Infra is currently at 49.29, which is close to the midpoint of the 0-100 scale. This indicates a neutral trend, suggesting neither overbought nor oversold conditions. Investors might look for additional indicators to determine future price movement direction.
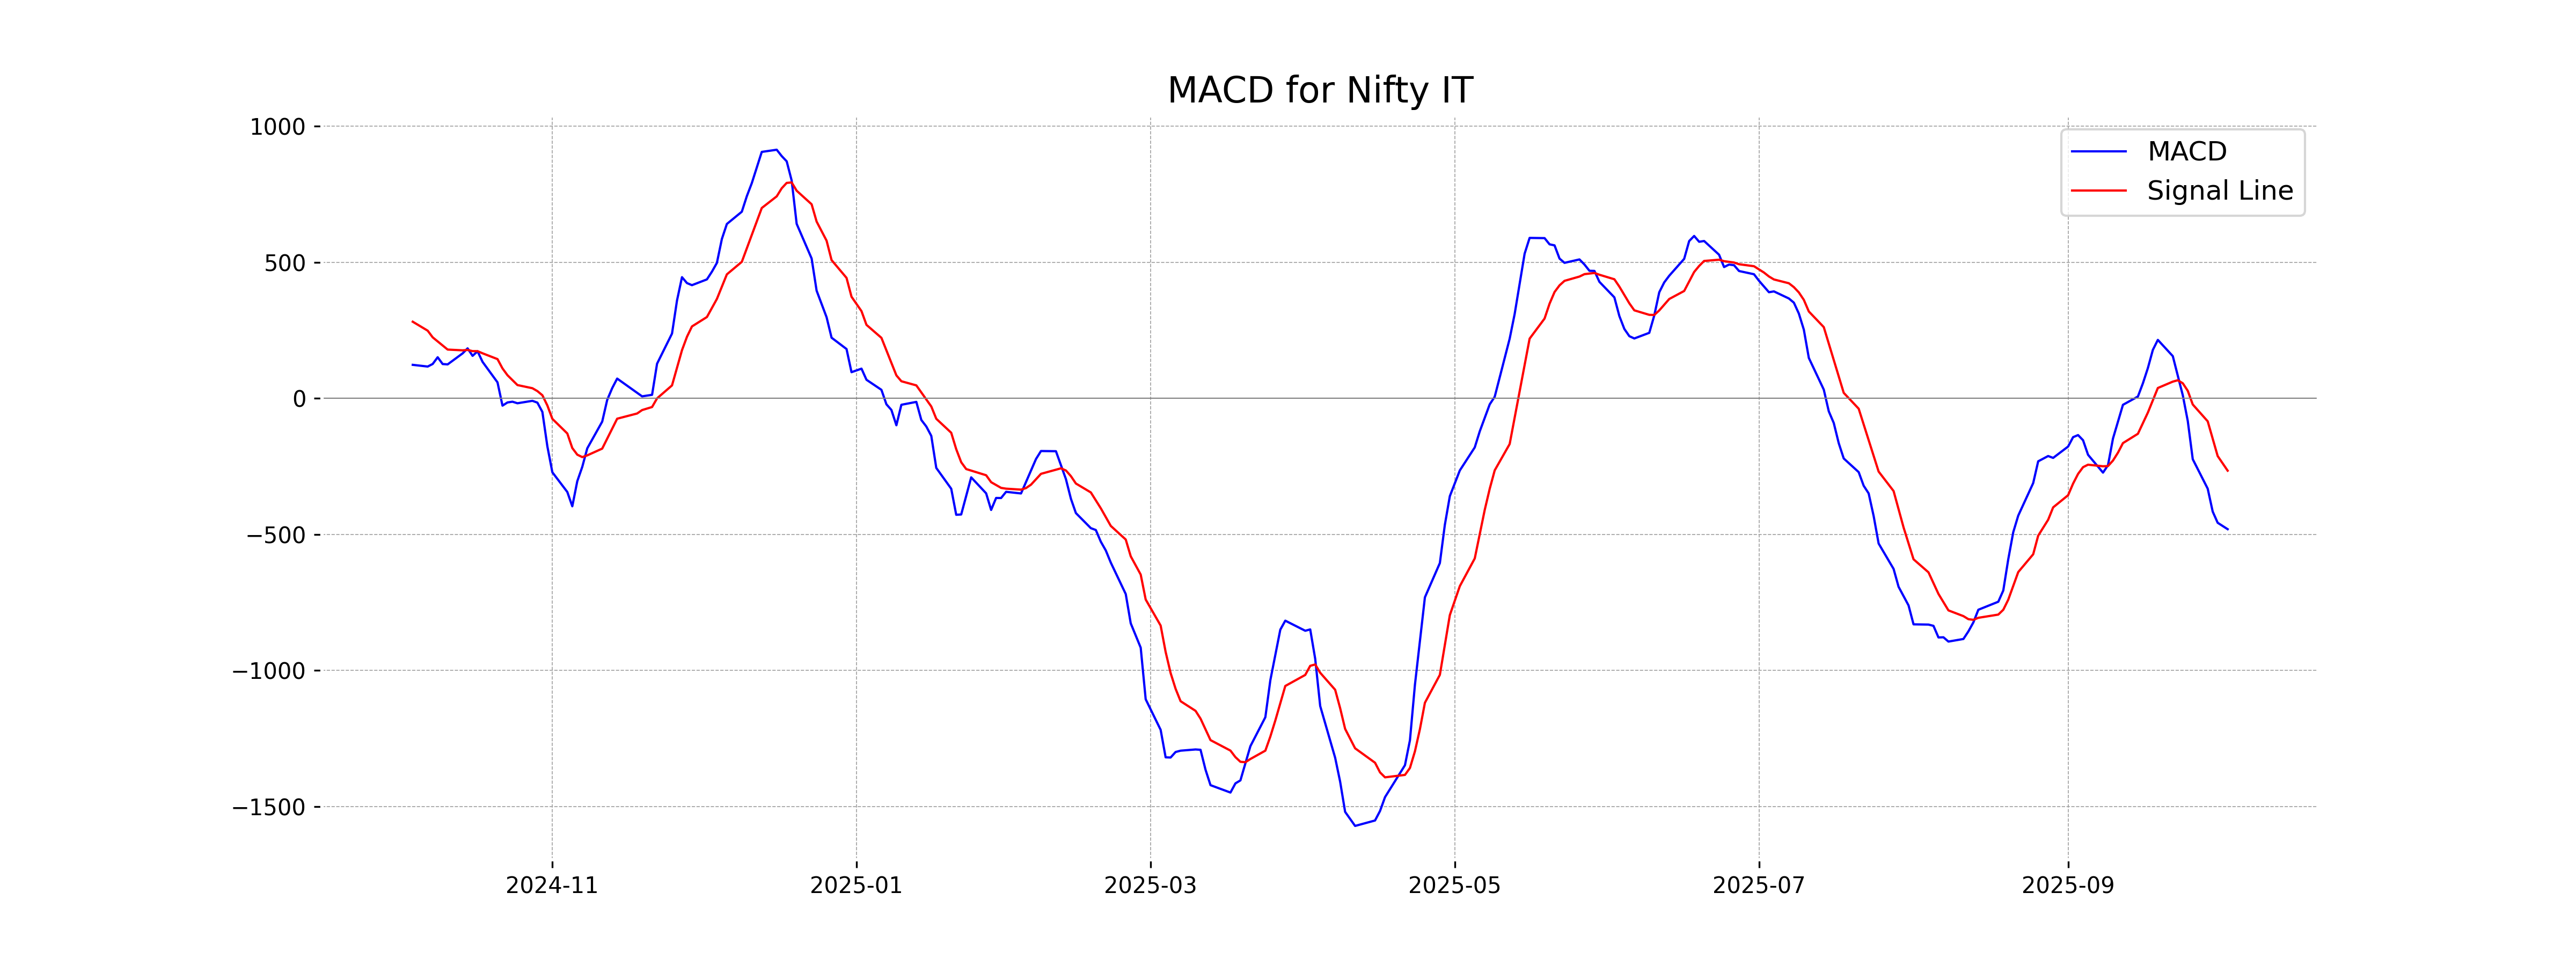
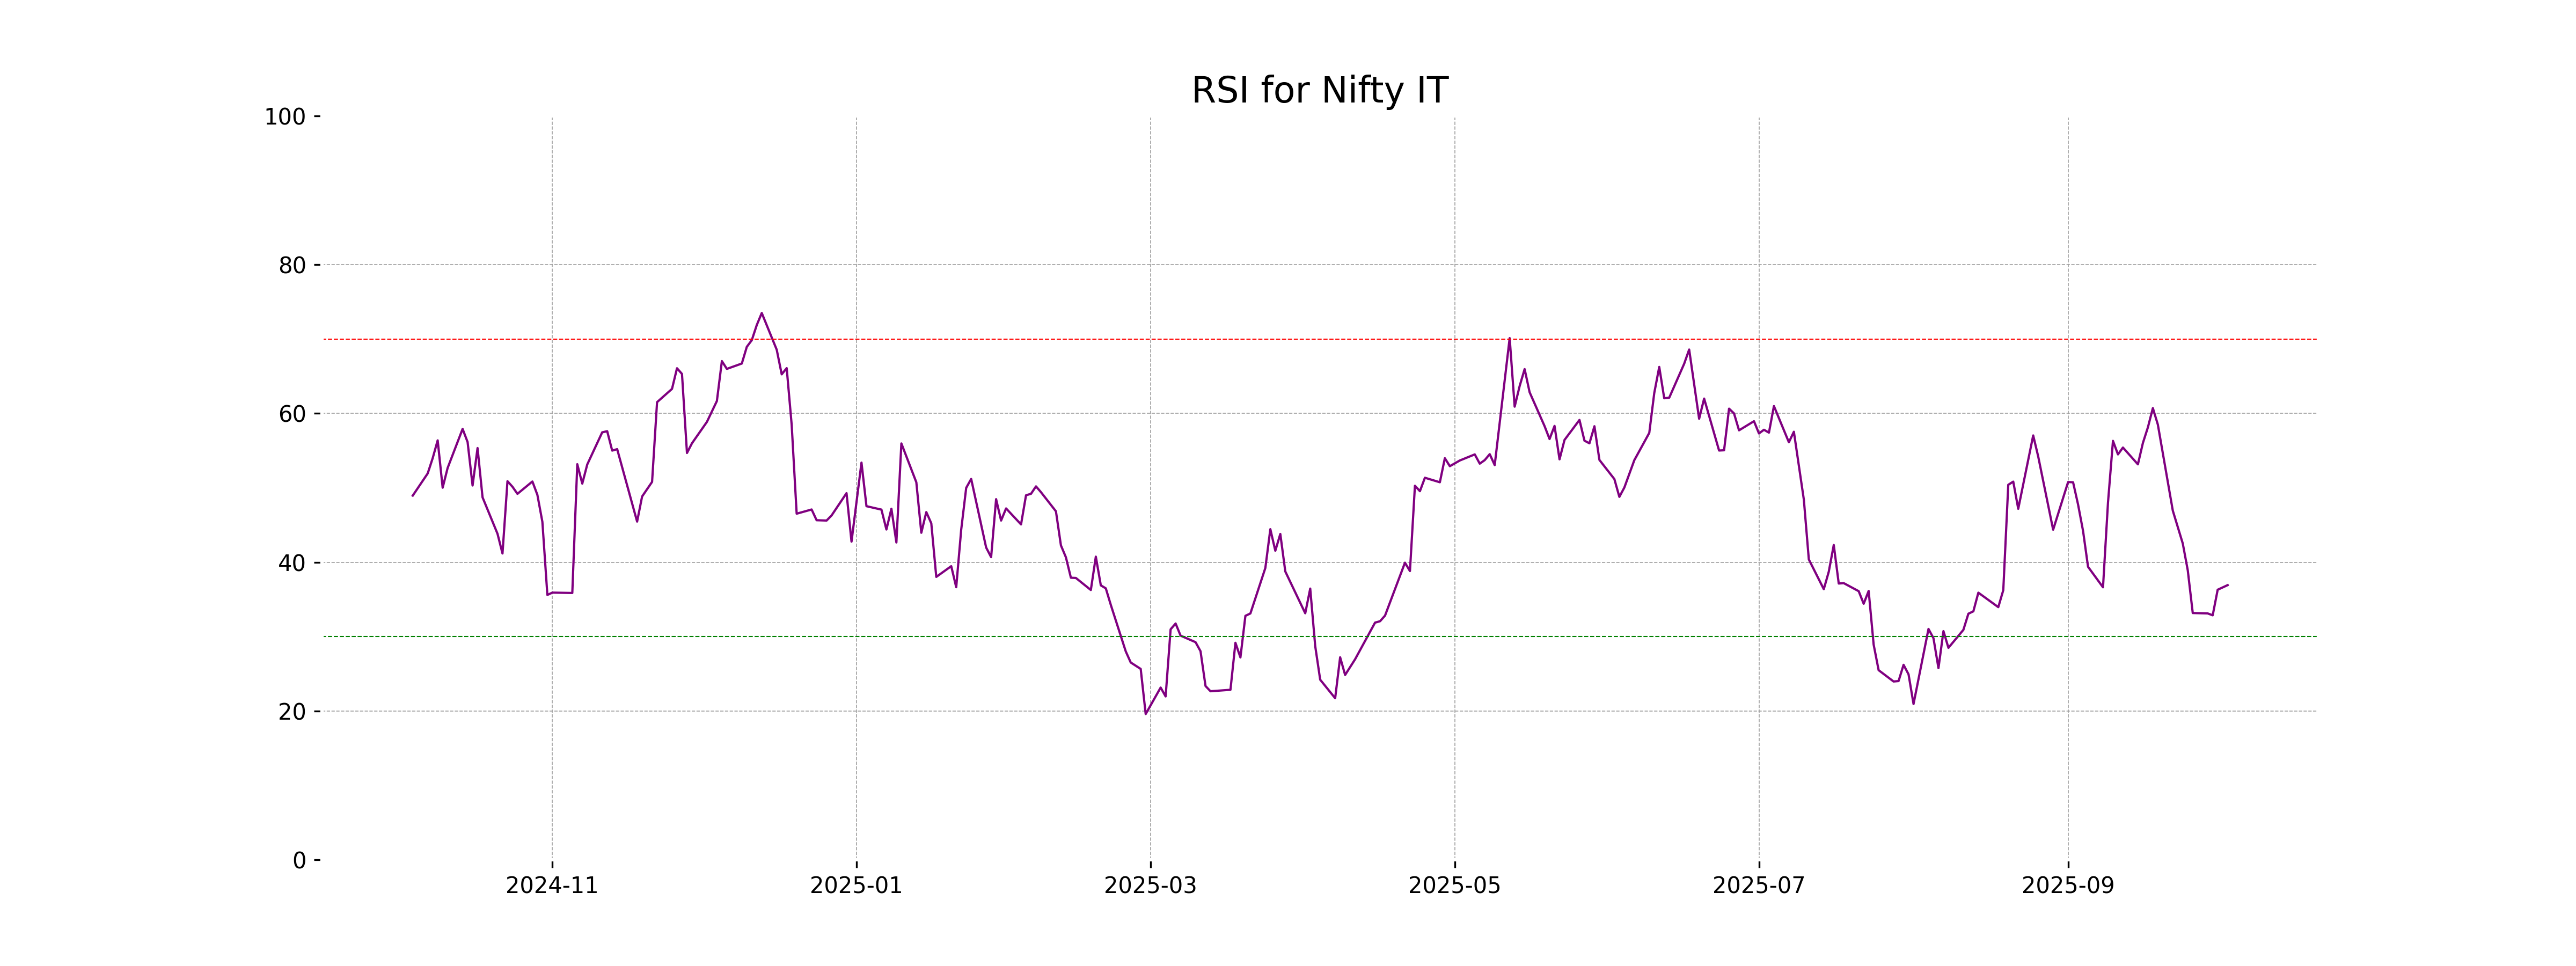
Analysis for Nifty IT - October 03, 2025

Nifty IT opened at 33,921.10 and closed at 33,949.75 with a slight increase of 0.13% from the previous close of 33,905.20. The index experienced a points change of 44.55. The RSI is at 36.92, indicating weak momentum, while the MACD suggests a bearish trend with a value of -480.72 compared to the signal line at -265.67.
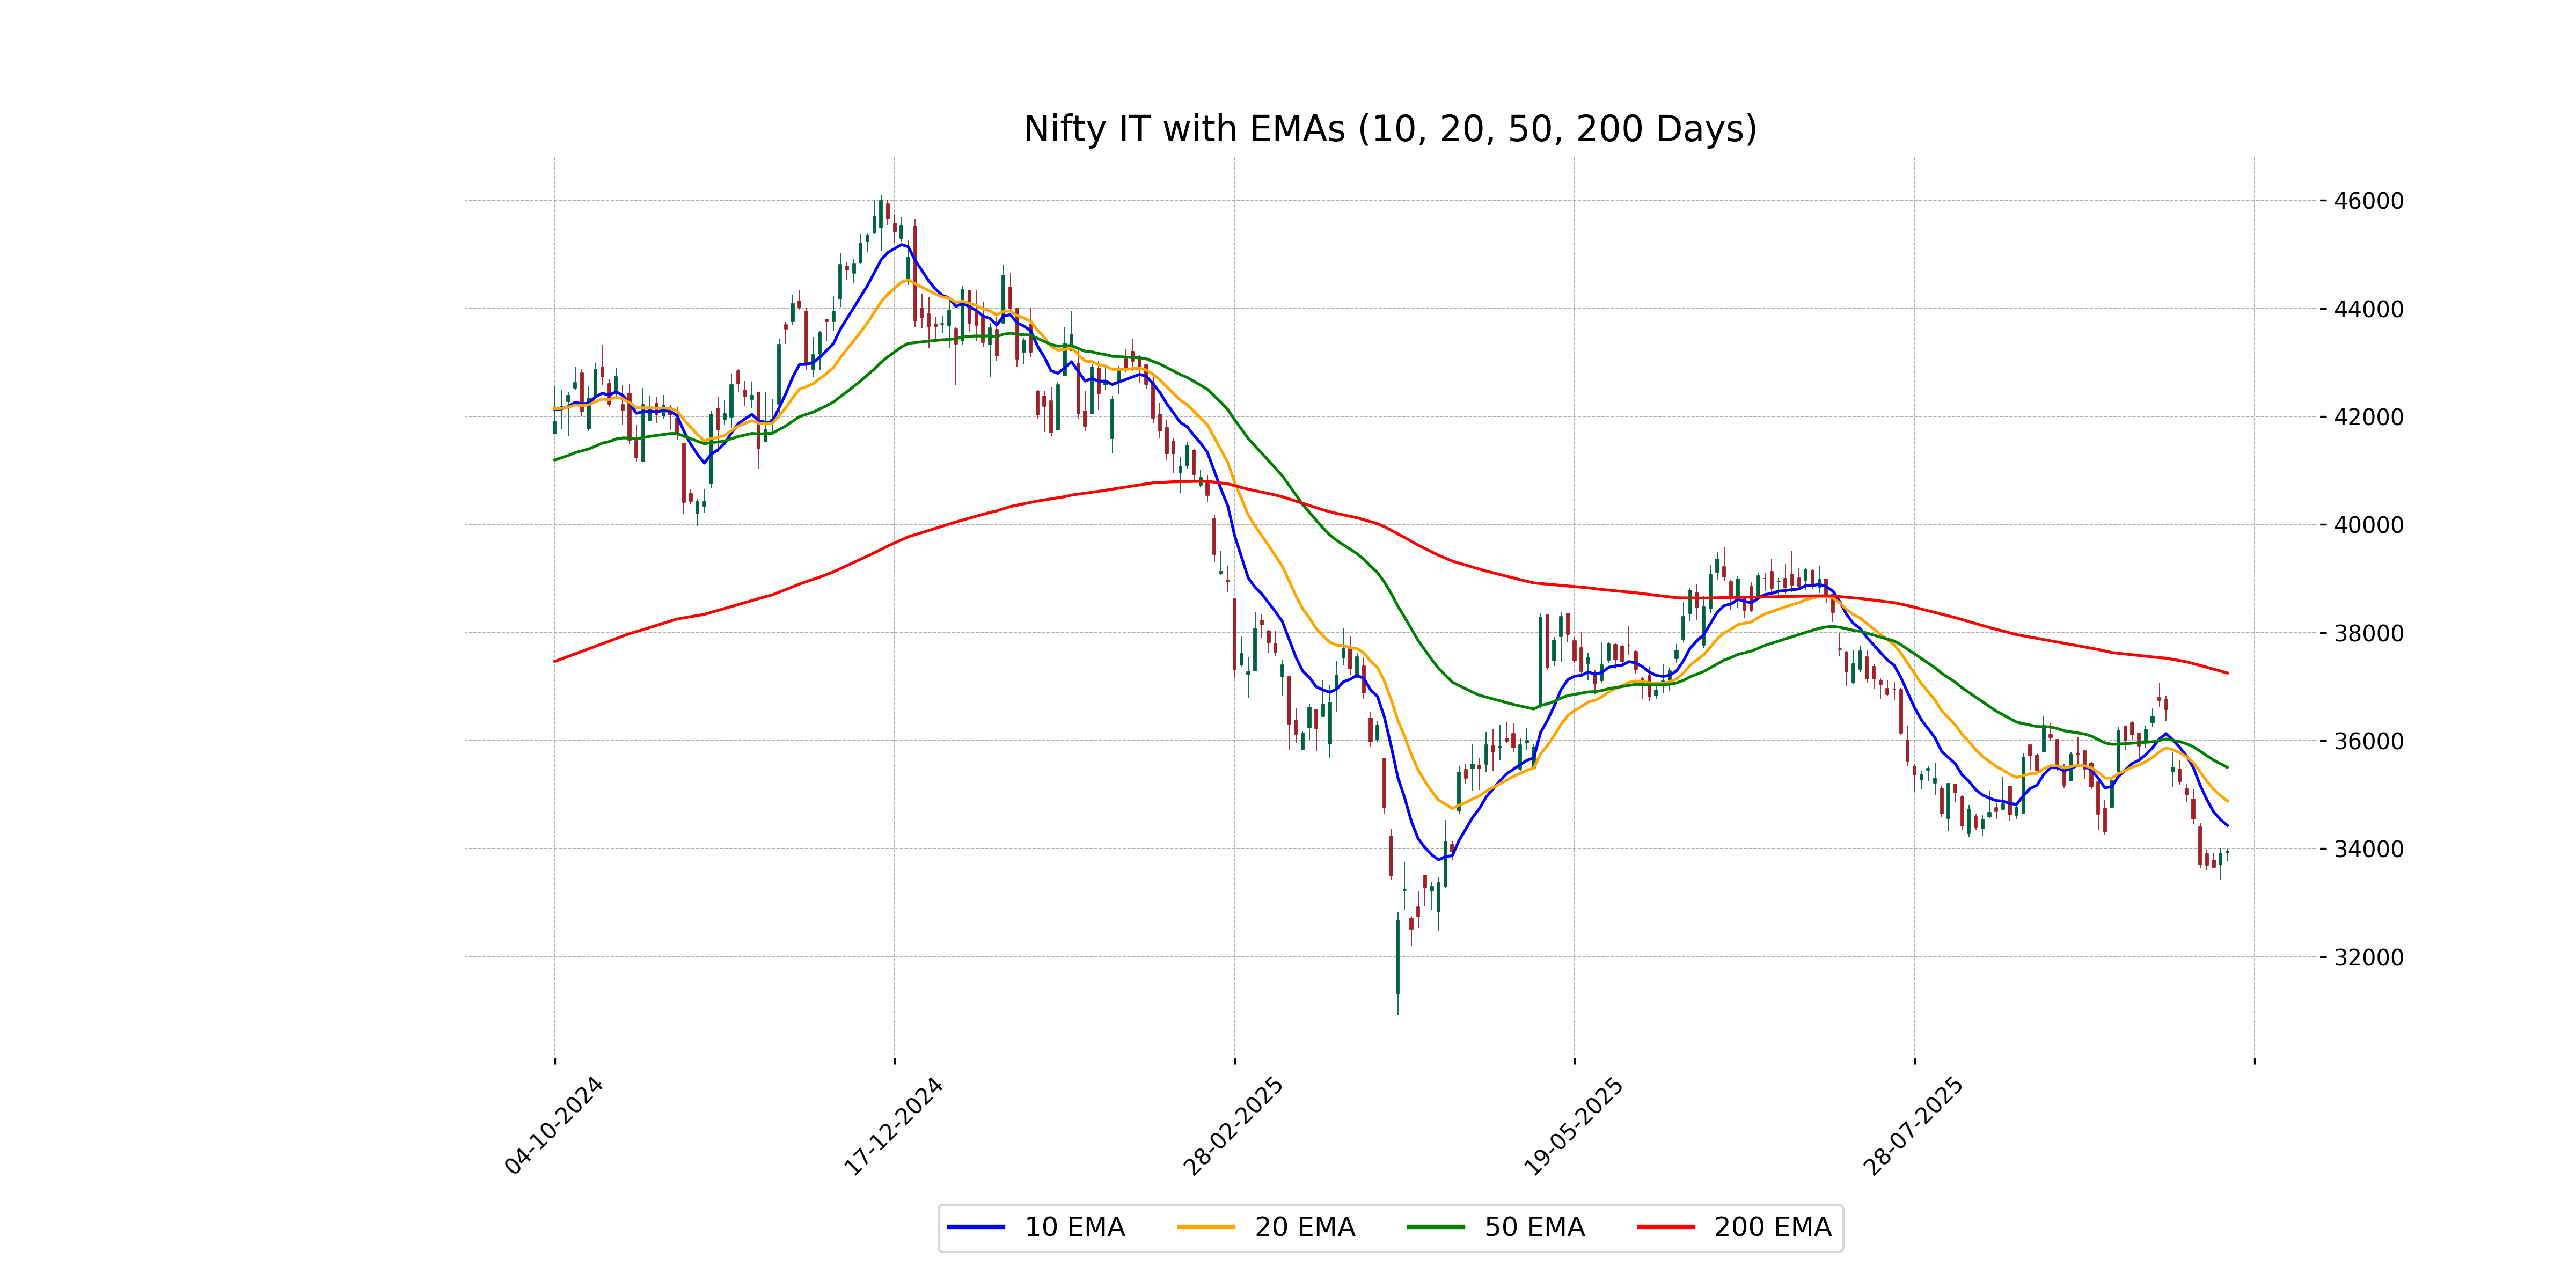
Relationship with Key Moving Averages
The Nifty IT index closed at 33,949.75, which is below its 10-day, 20-day, 50-day, and 200-day exponential moving averages (EMAs) of 34,431.12, 34,884.57, 35,506.40, and 37,251.82 respectively. This positioning suggests a bearish trend as the index is trading below key moving average levels.
Moving Averages Trend (MACD)
Based on the data provided, Nifty IT has a negative MACD value of -480.72, which is below its MACD Signal line of -265.67. This indicates a bearish momentum for the index, suggesting that the recent price trend might continue downwards.
RSI Analysis
The RSI for Nifty IT is currently at 36.92, indicating that the index is approaching the oversold region. This suggests increased selling pressure, and if the trend continues, it may present a buying opportunity as the index nears or crosses the oversold threshold of 30.
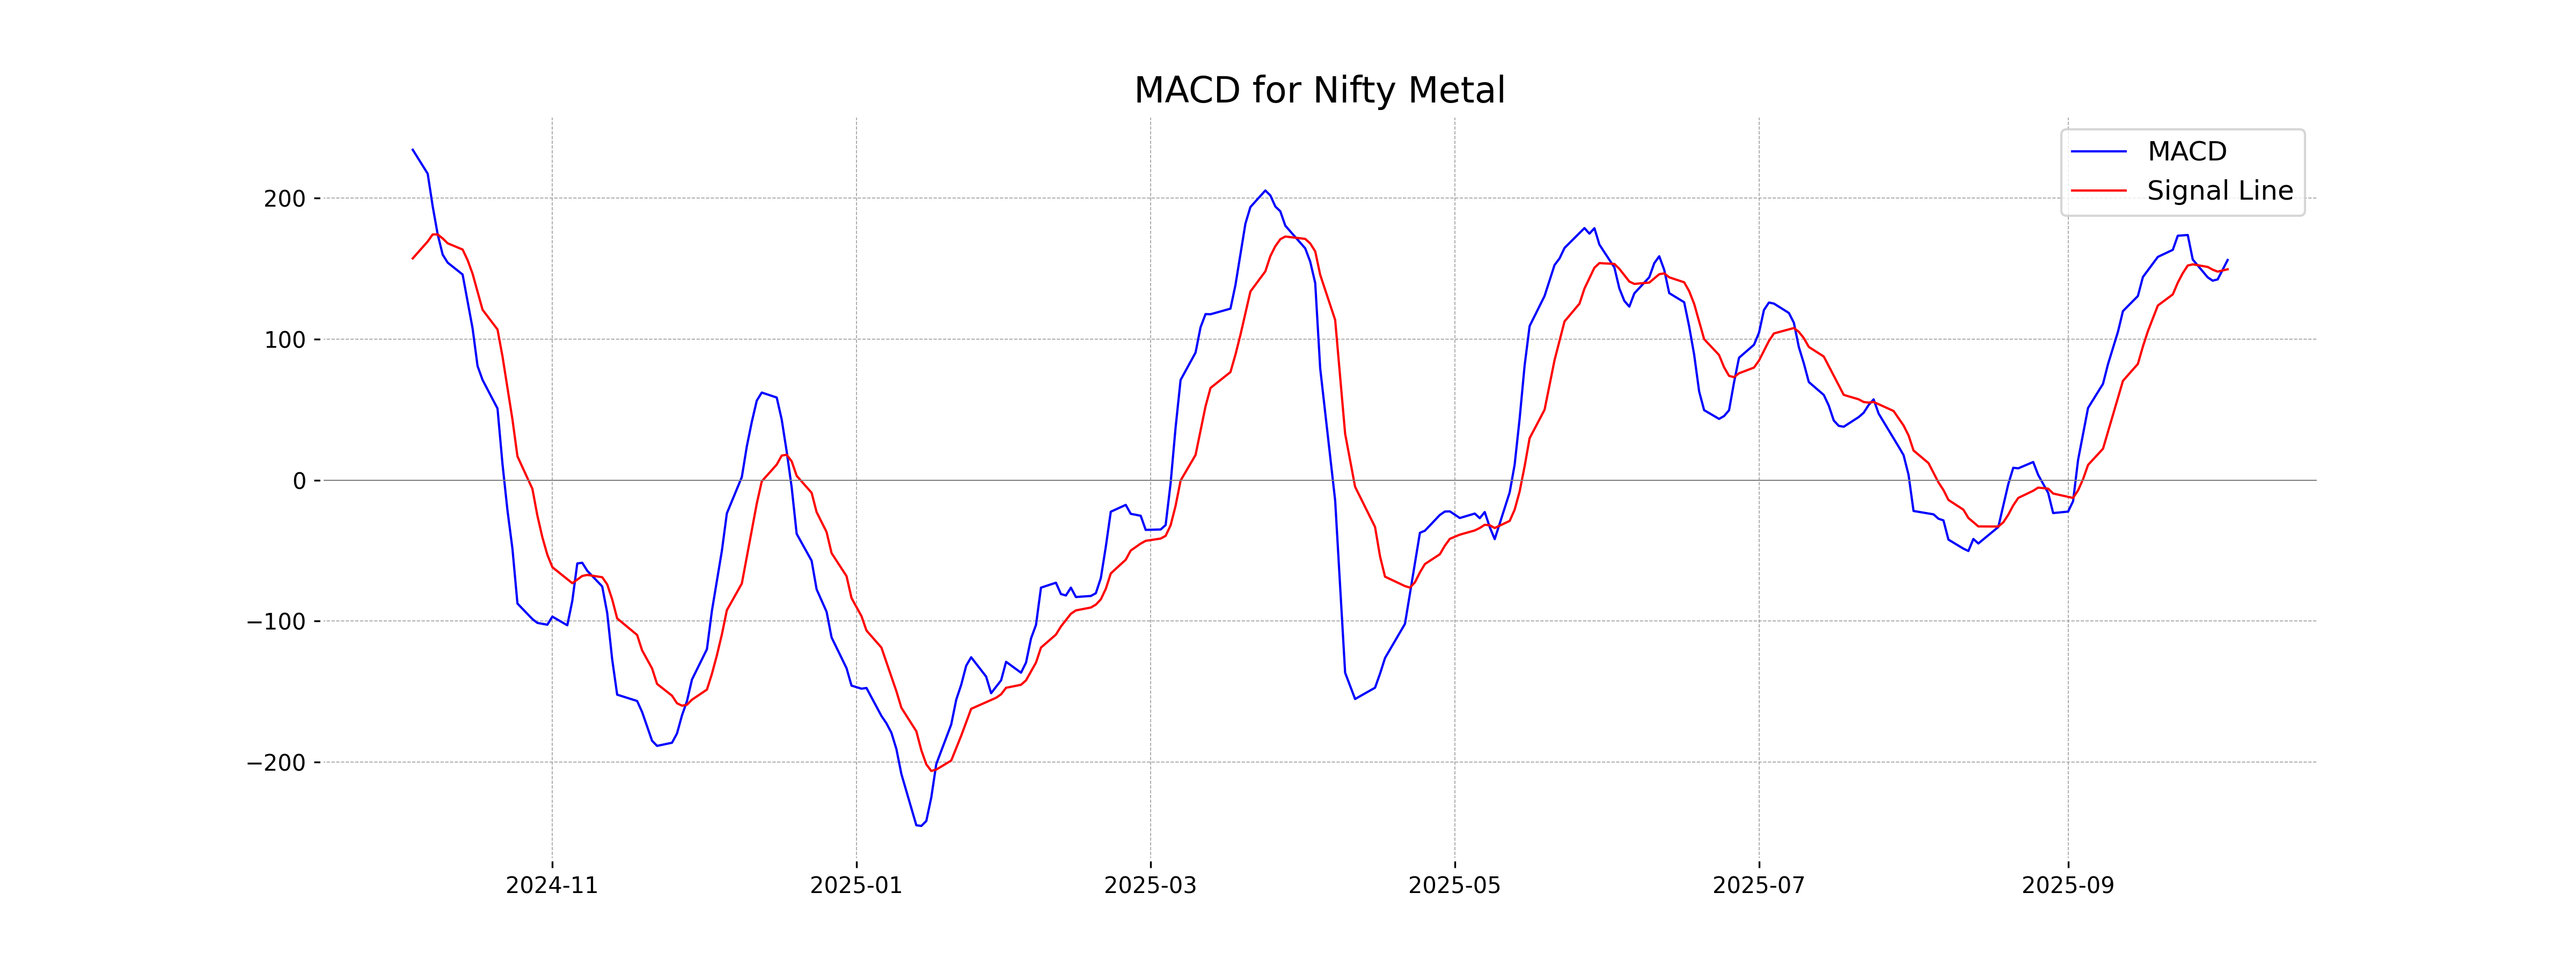
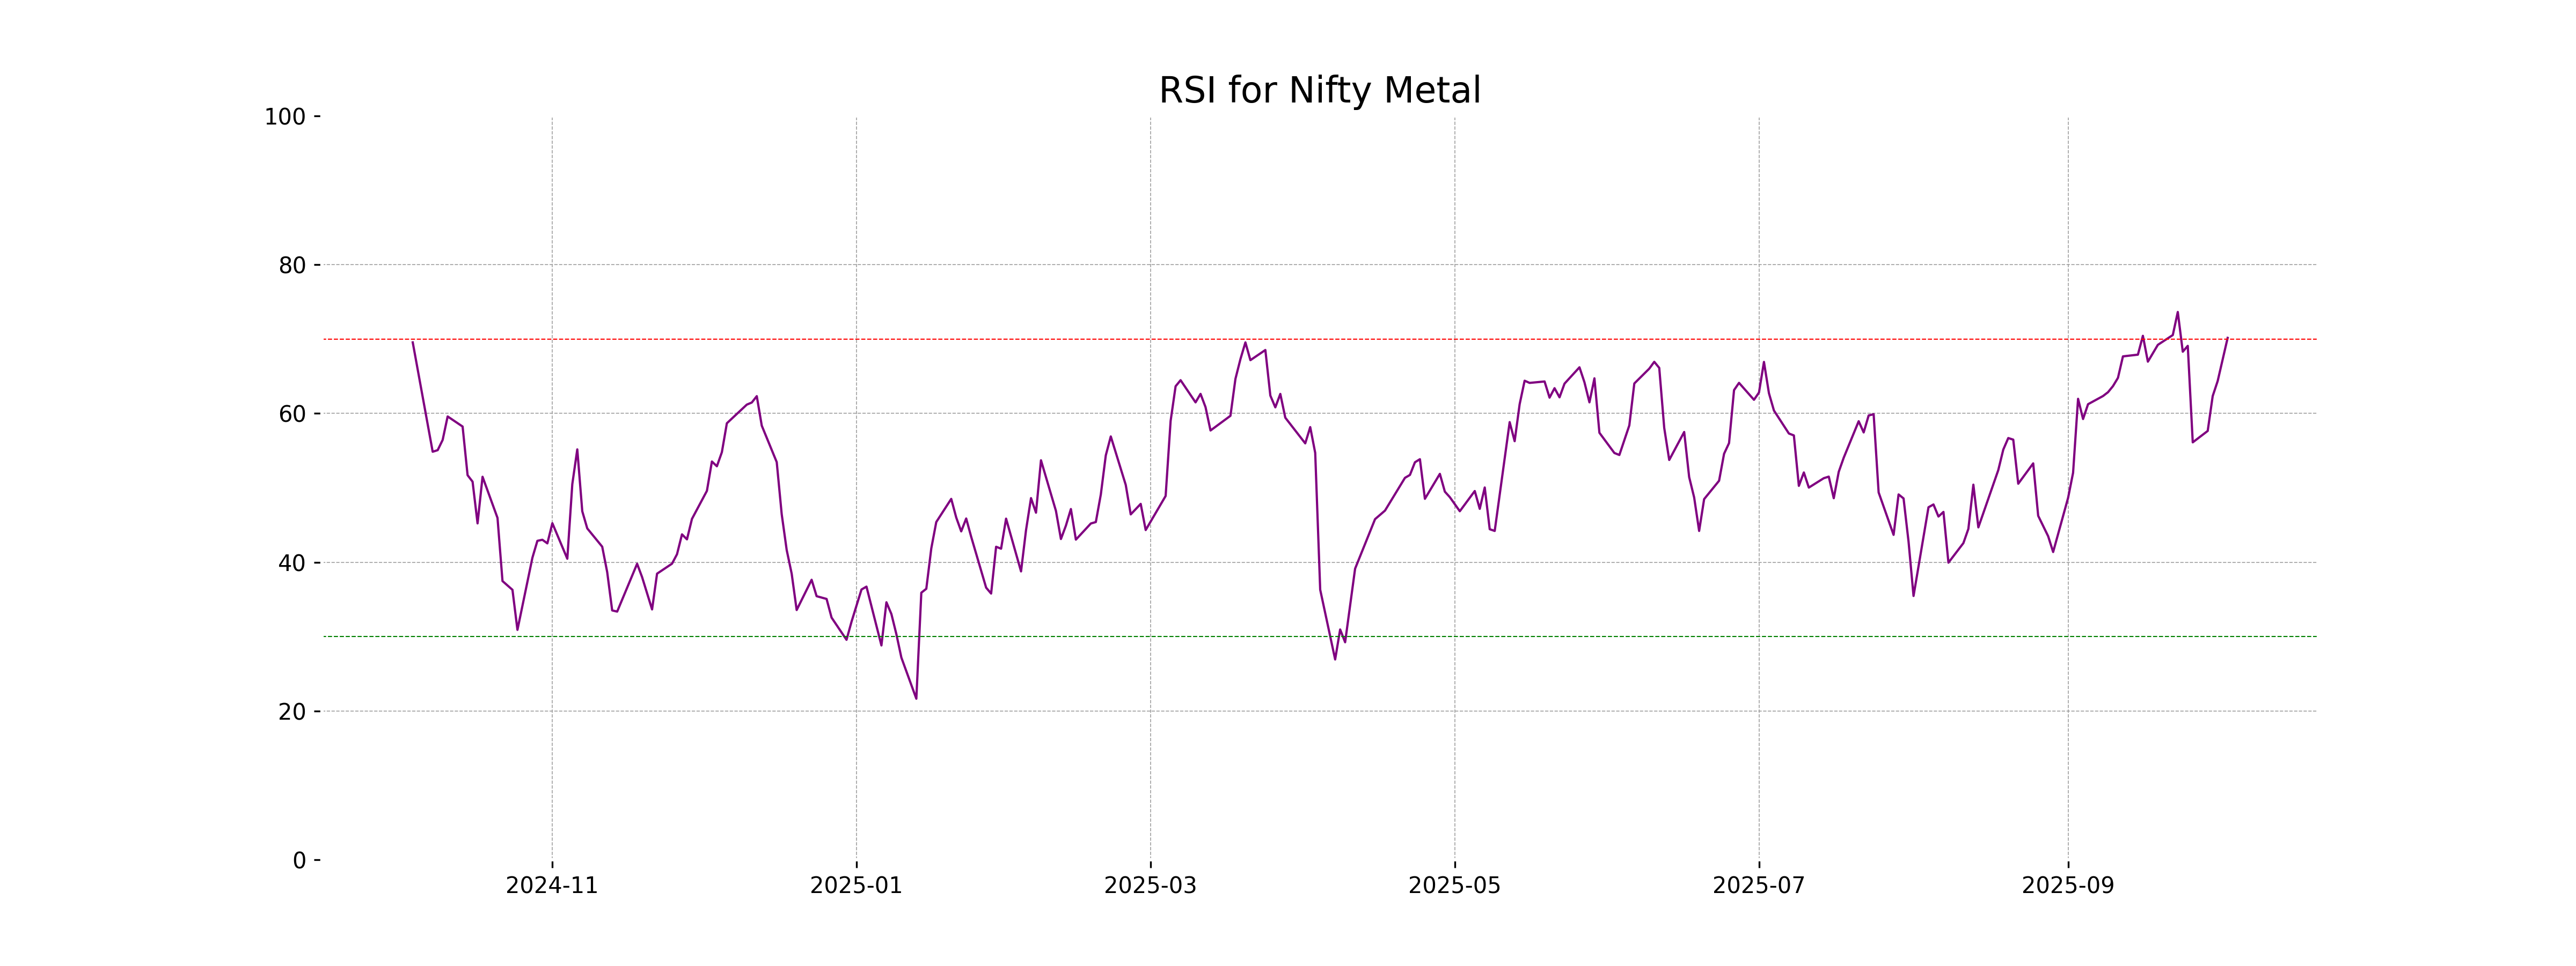
Analysis for Nifty Metal - October 03, 2025
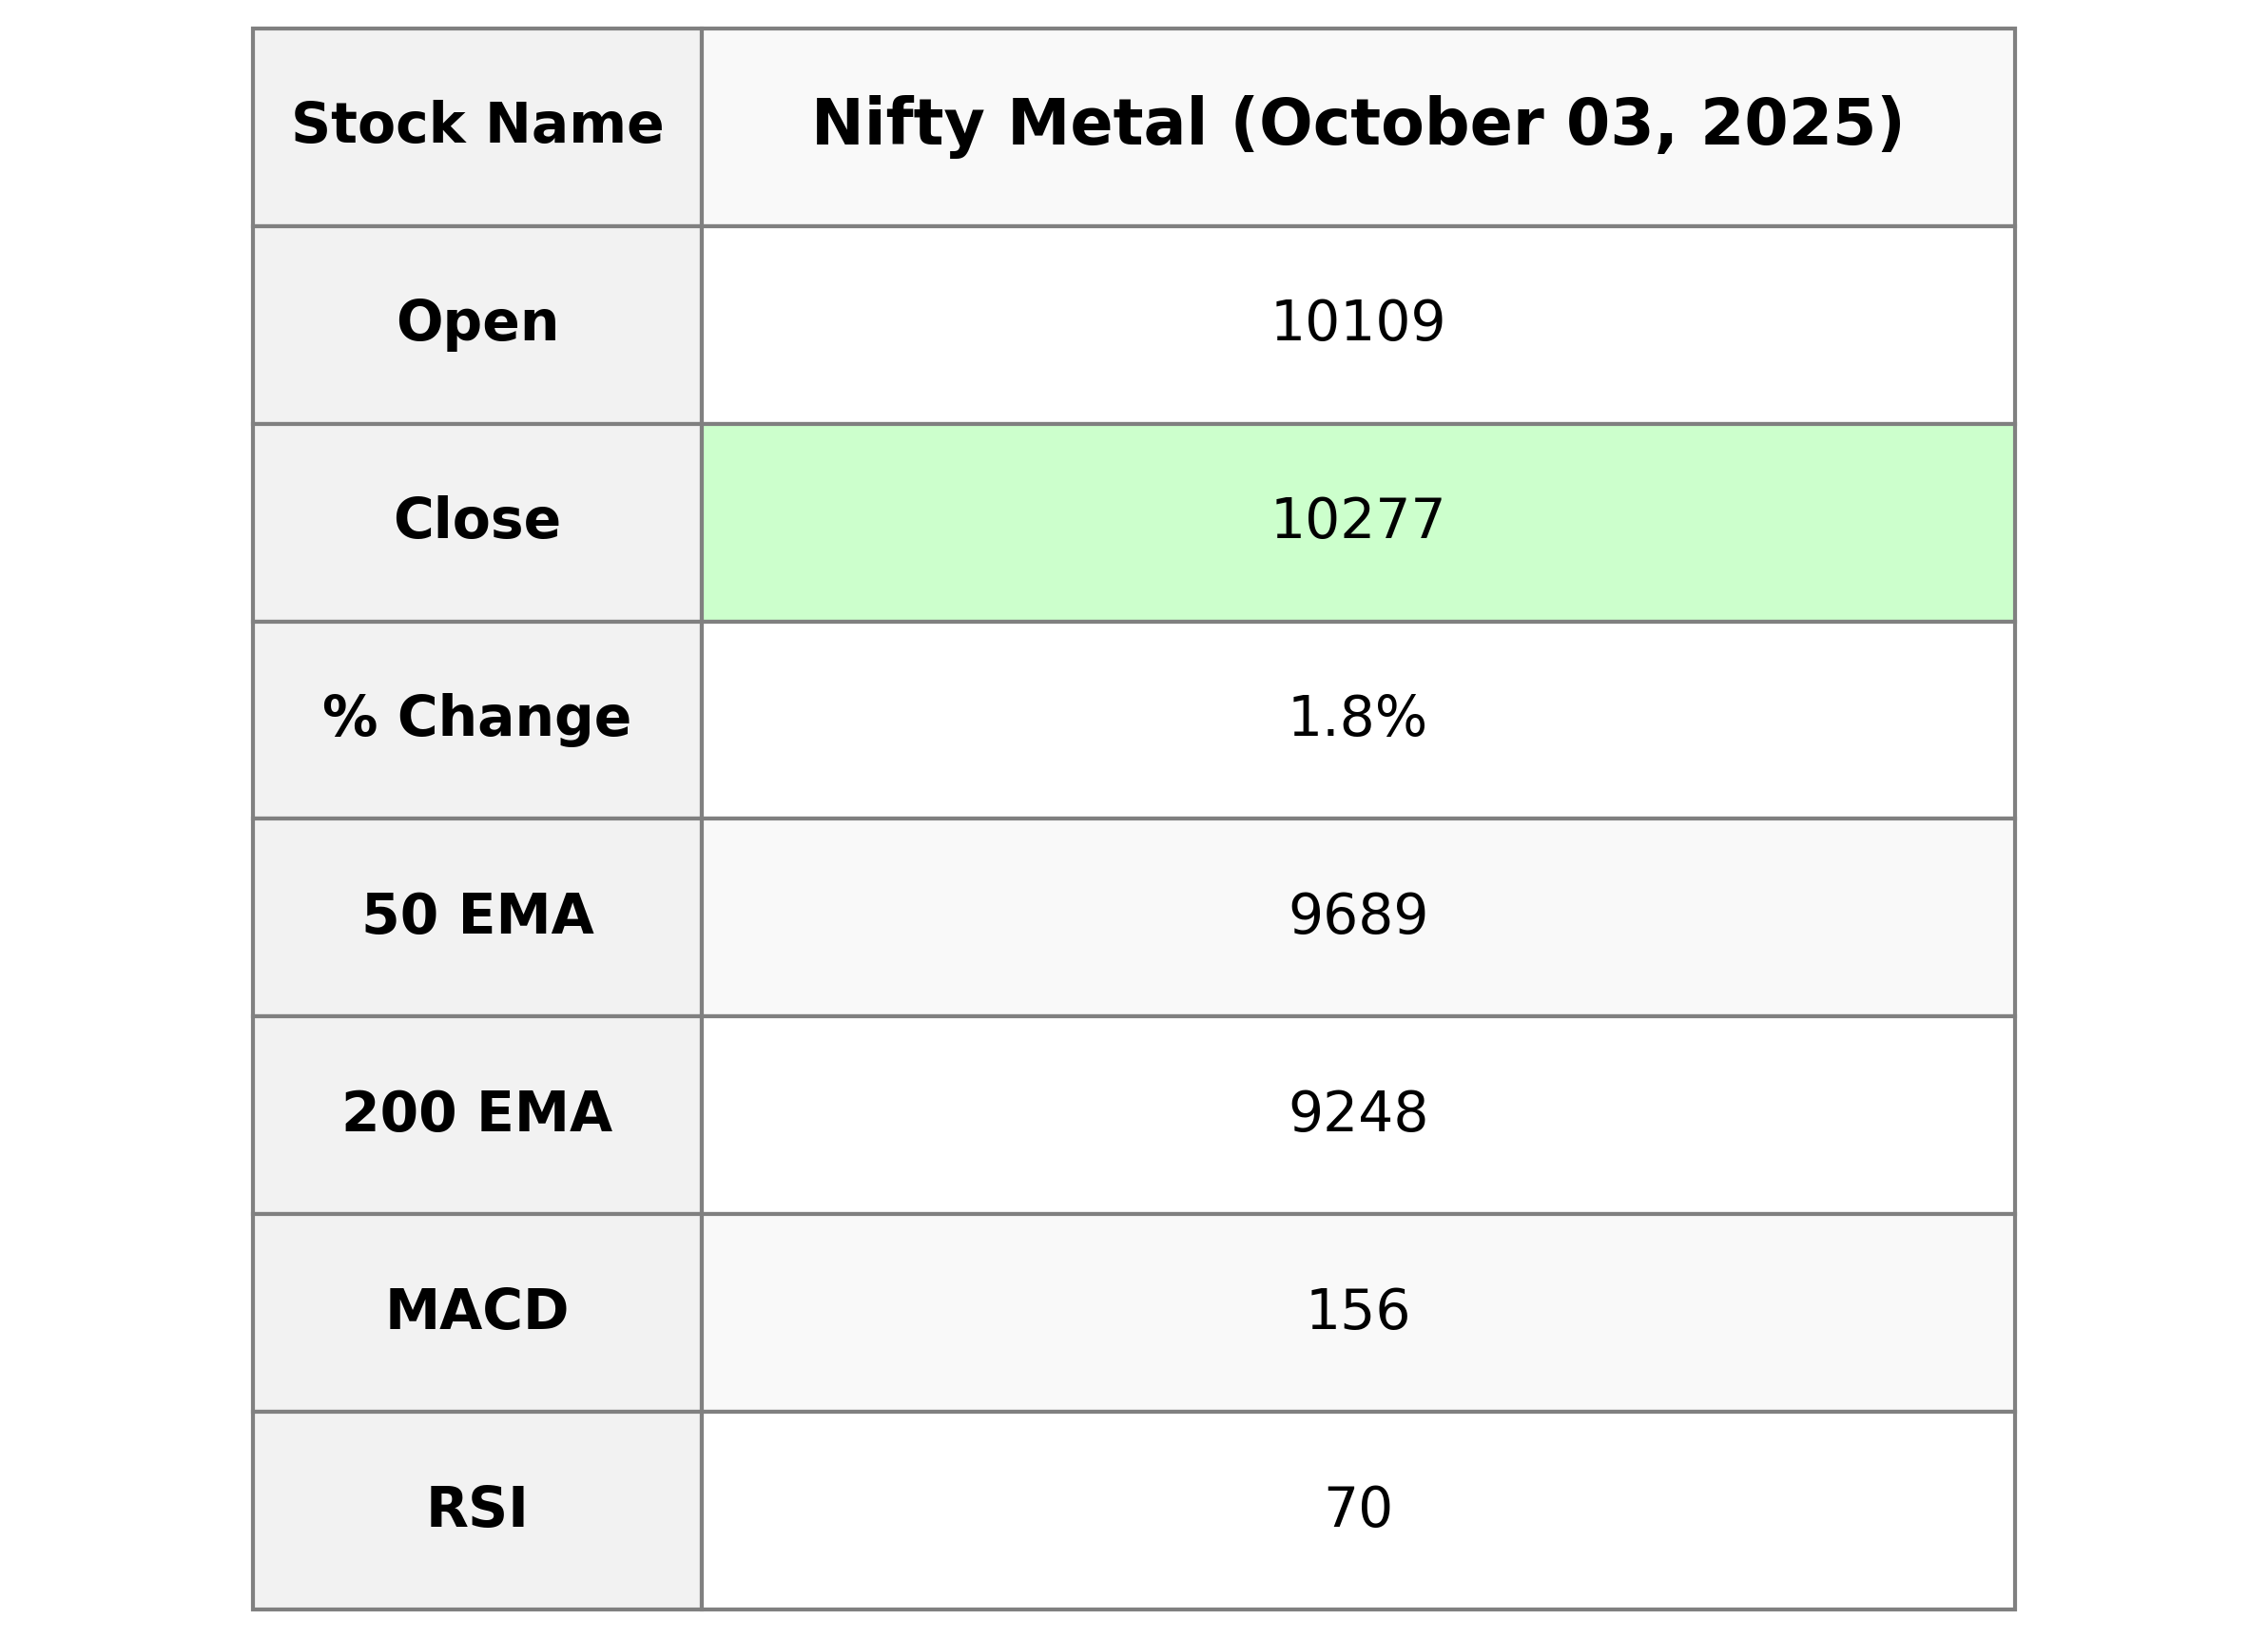
Nifty Metal opened at 10108.90 and closed at 10277.10, showing a significant uptrend with a 1.82% change from the previous close of 10092.95. The relative strength index (RSI) is at 70.16, indicating a strong momentum. The MACD indicates a slightly bullish trend with a value above the signal line.
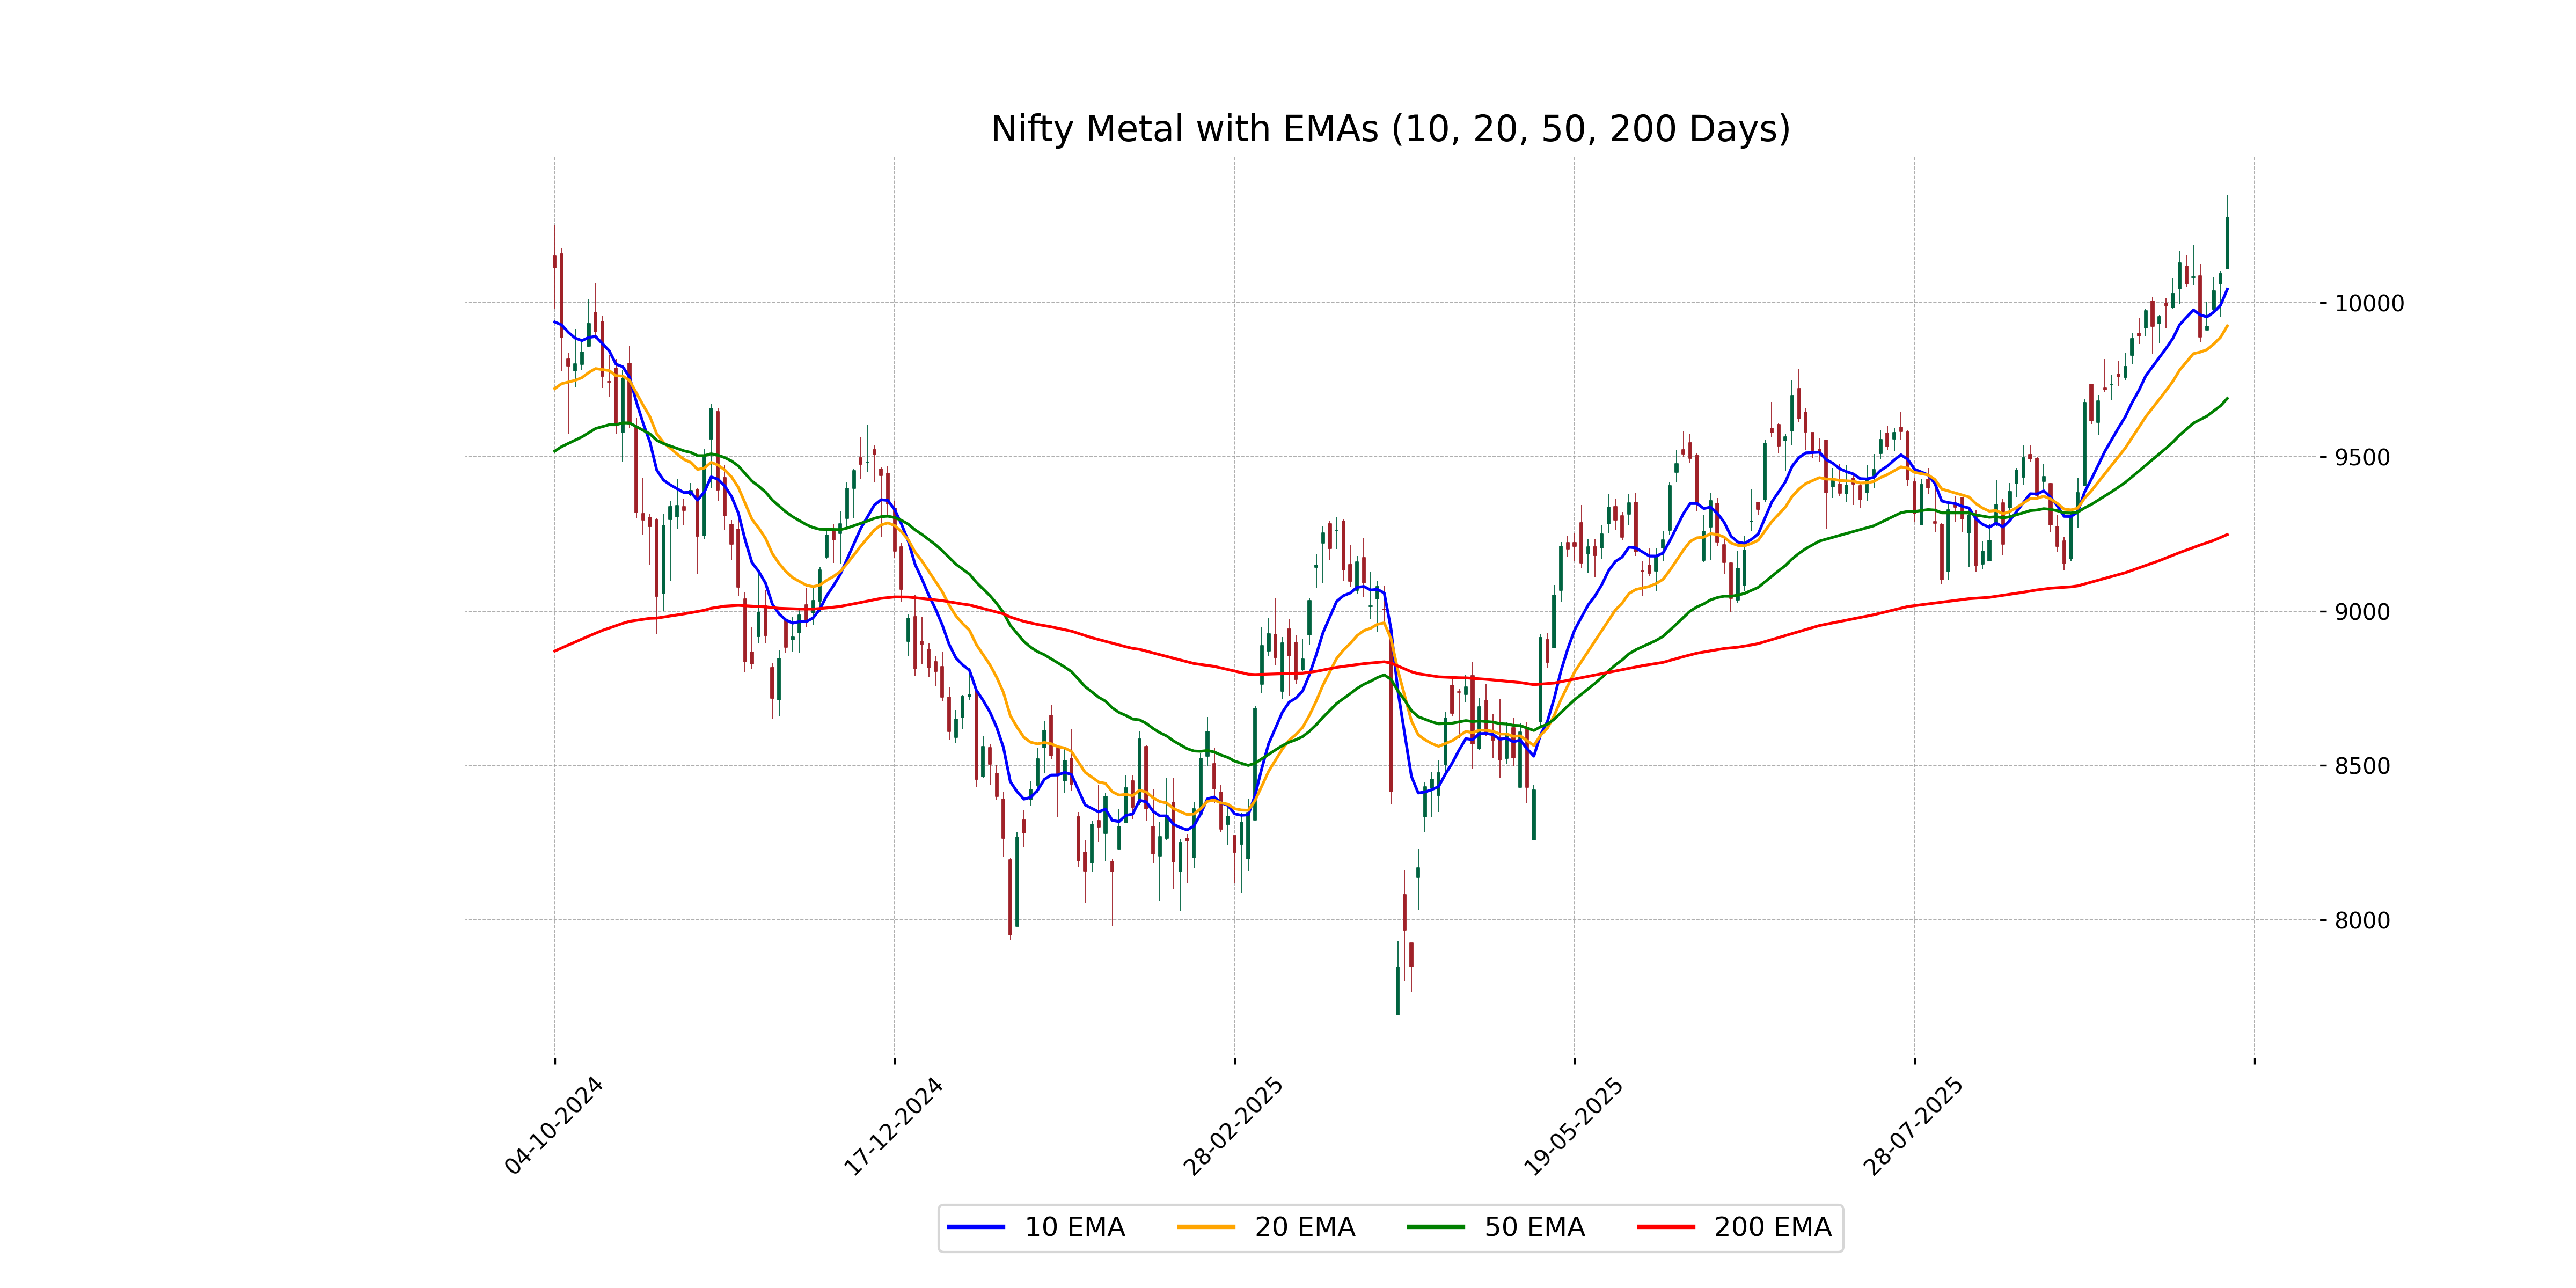
Relationship with Key Moving Averages
The closing price of Nifty Metal is above its 10 EMA at 10,043.36, 20 EMA at 9,924.33, 50 EMA at 9,689.37, and 200 EMA at 9,248.21, indicating a strong bullish trend. Additionally, the RSI value of 70.16 suggests it may be in overbought territory.
Moving Averages Trend (MACD)
The MACD for Nifty Metal is showing positive momentum as it is above the signal line, with a MACD value of 156.22 compared to a signal line of 149.61. This suggests a bullish trend and potential continued upward movement in the stock.
RSI Analysis
The RSI for Nifty Metal is 70.16, indicating that the index is in the overbought territory. This suggests that there might be a potential for a downward correction or consolidation in the near term. However, as with any technical indicator, it's important to consider it alongside other data and market conditions for a comprehensive analysis.
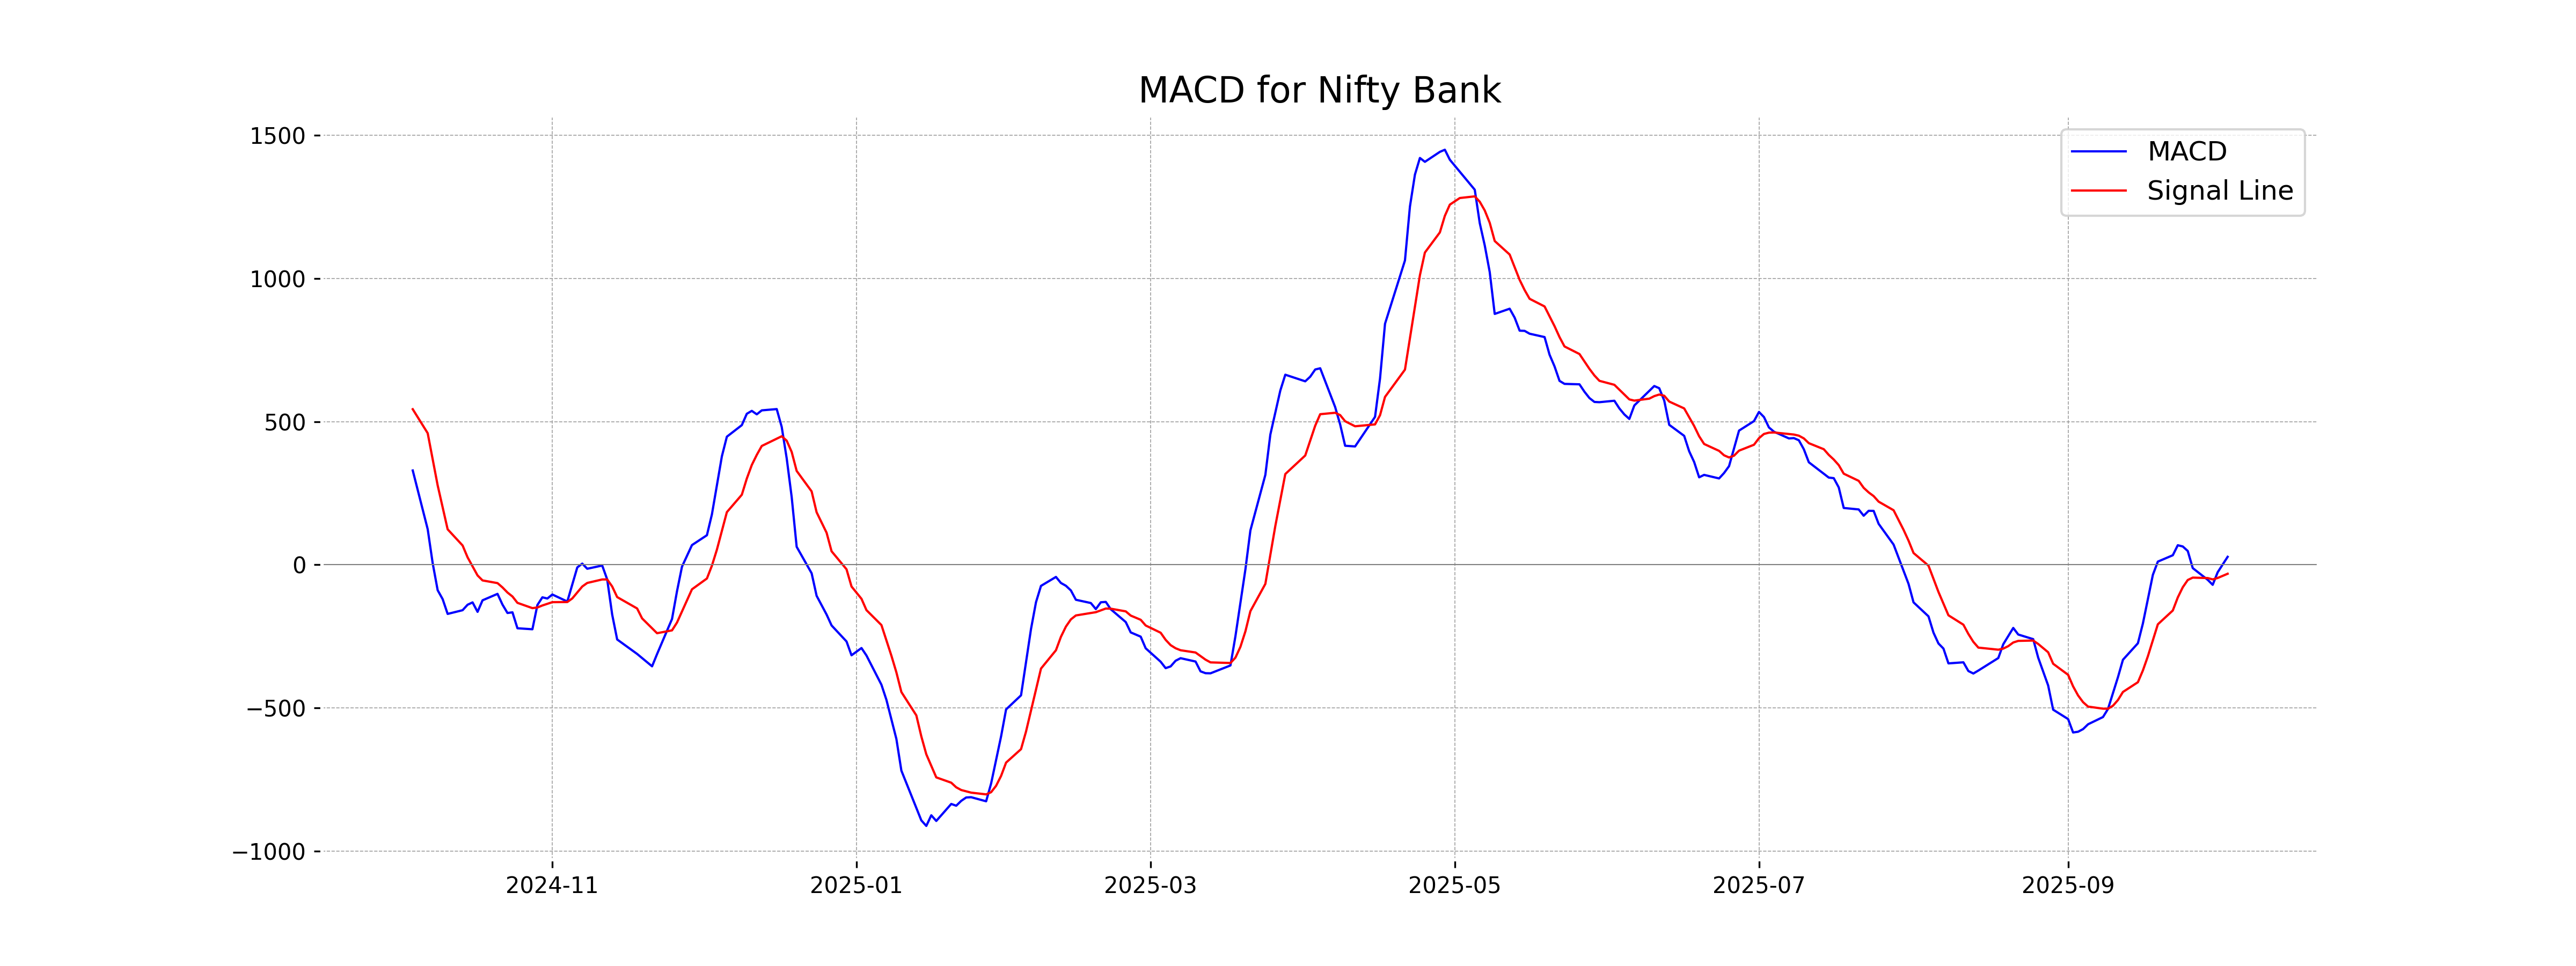
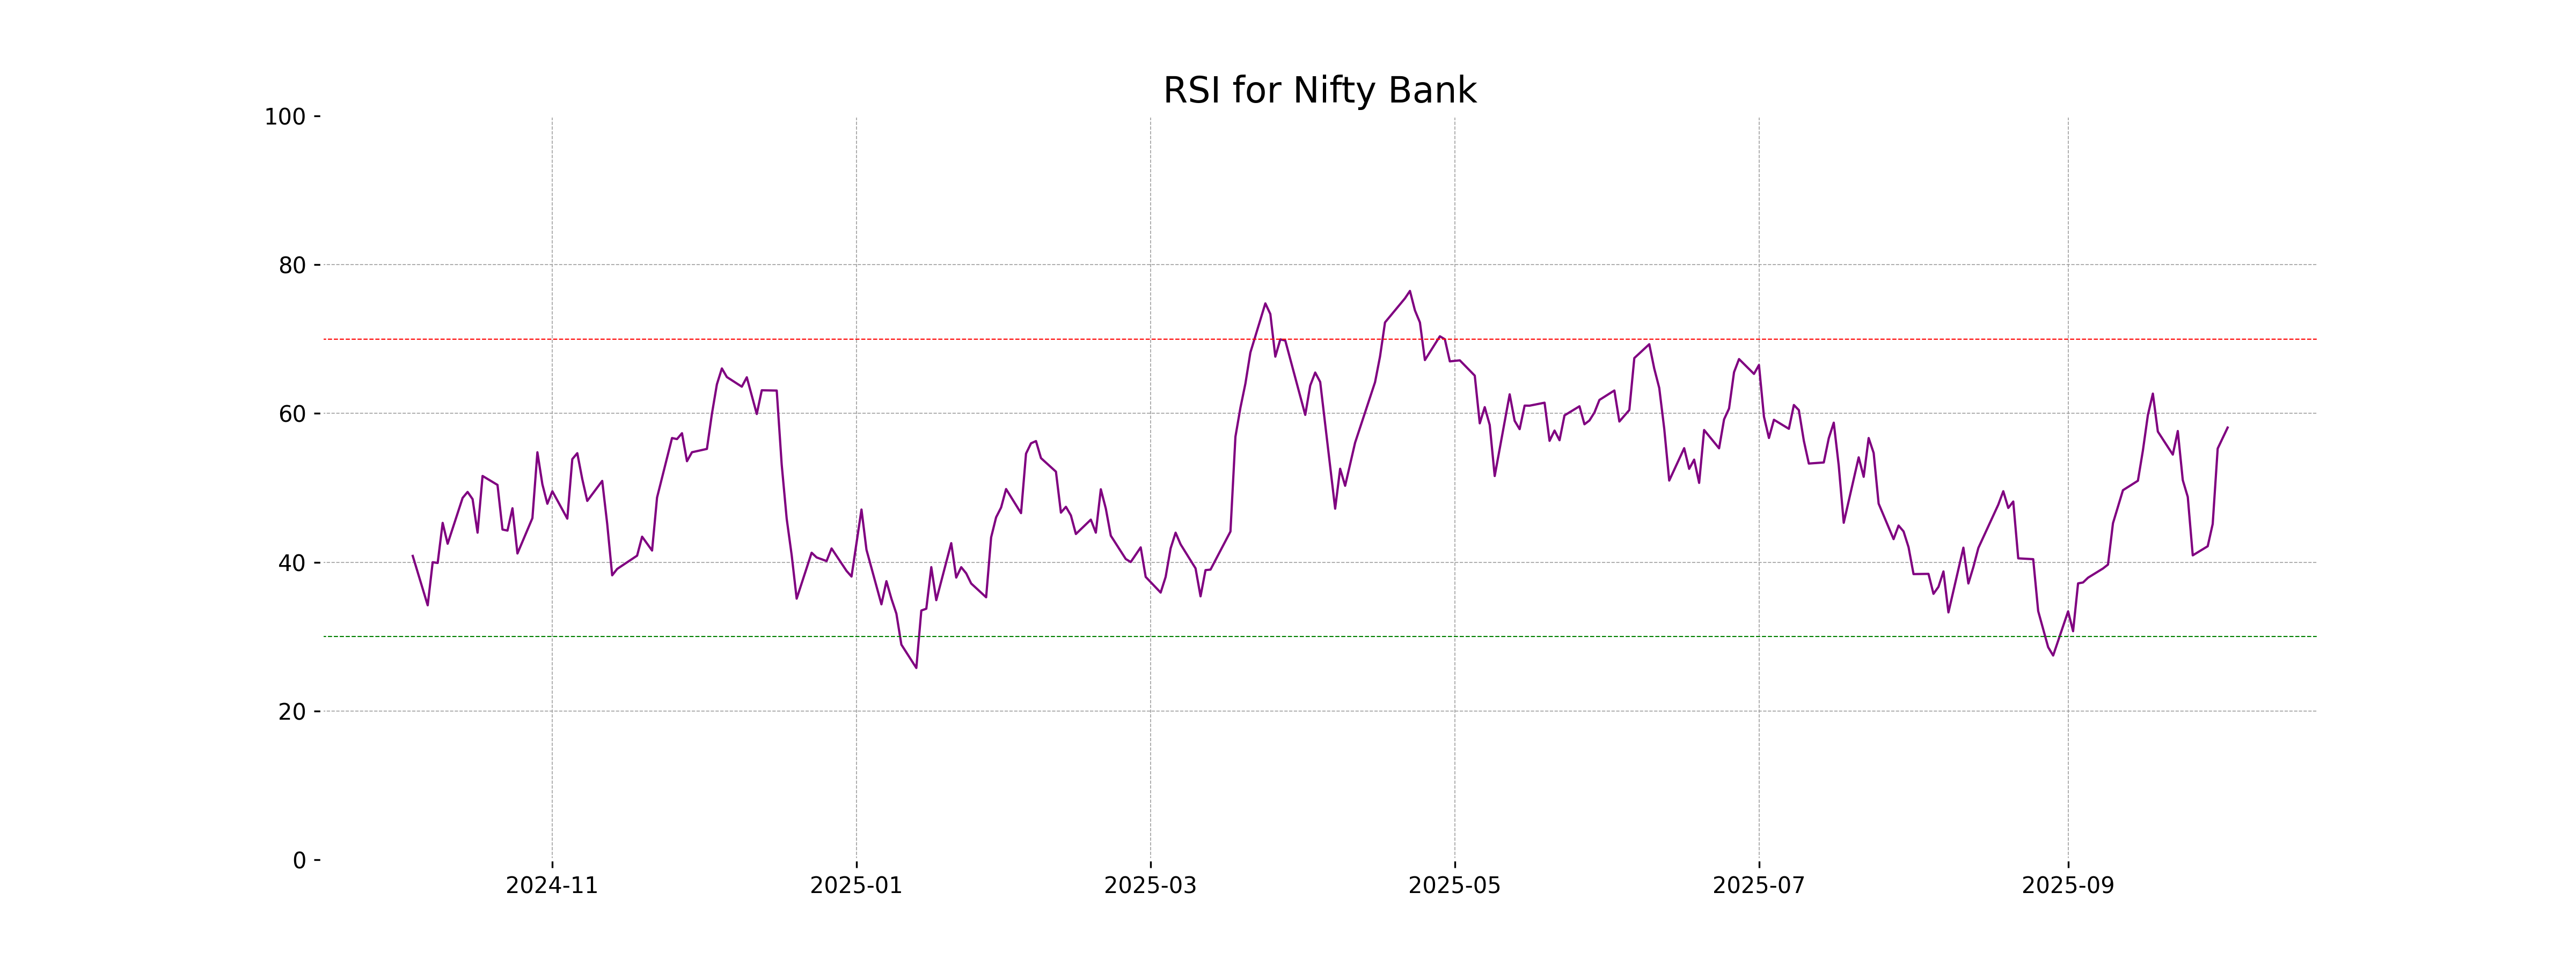
Analysis for Nifty Bank - October 03, 2025
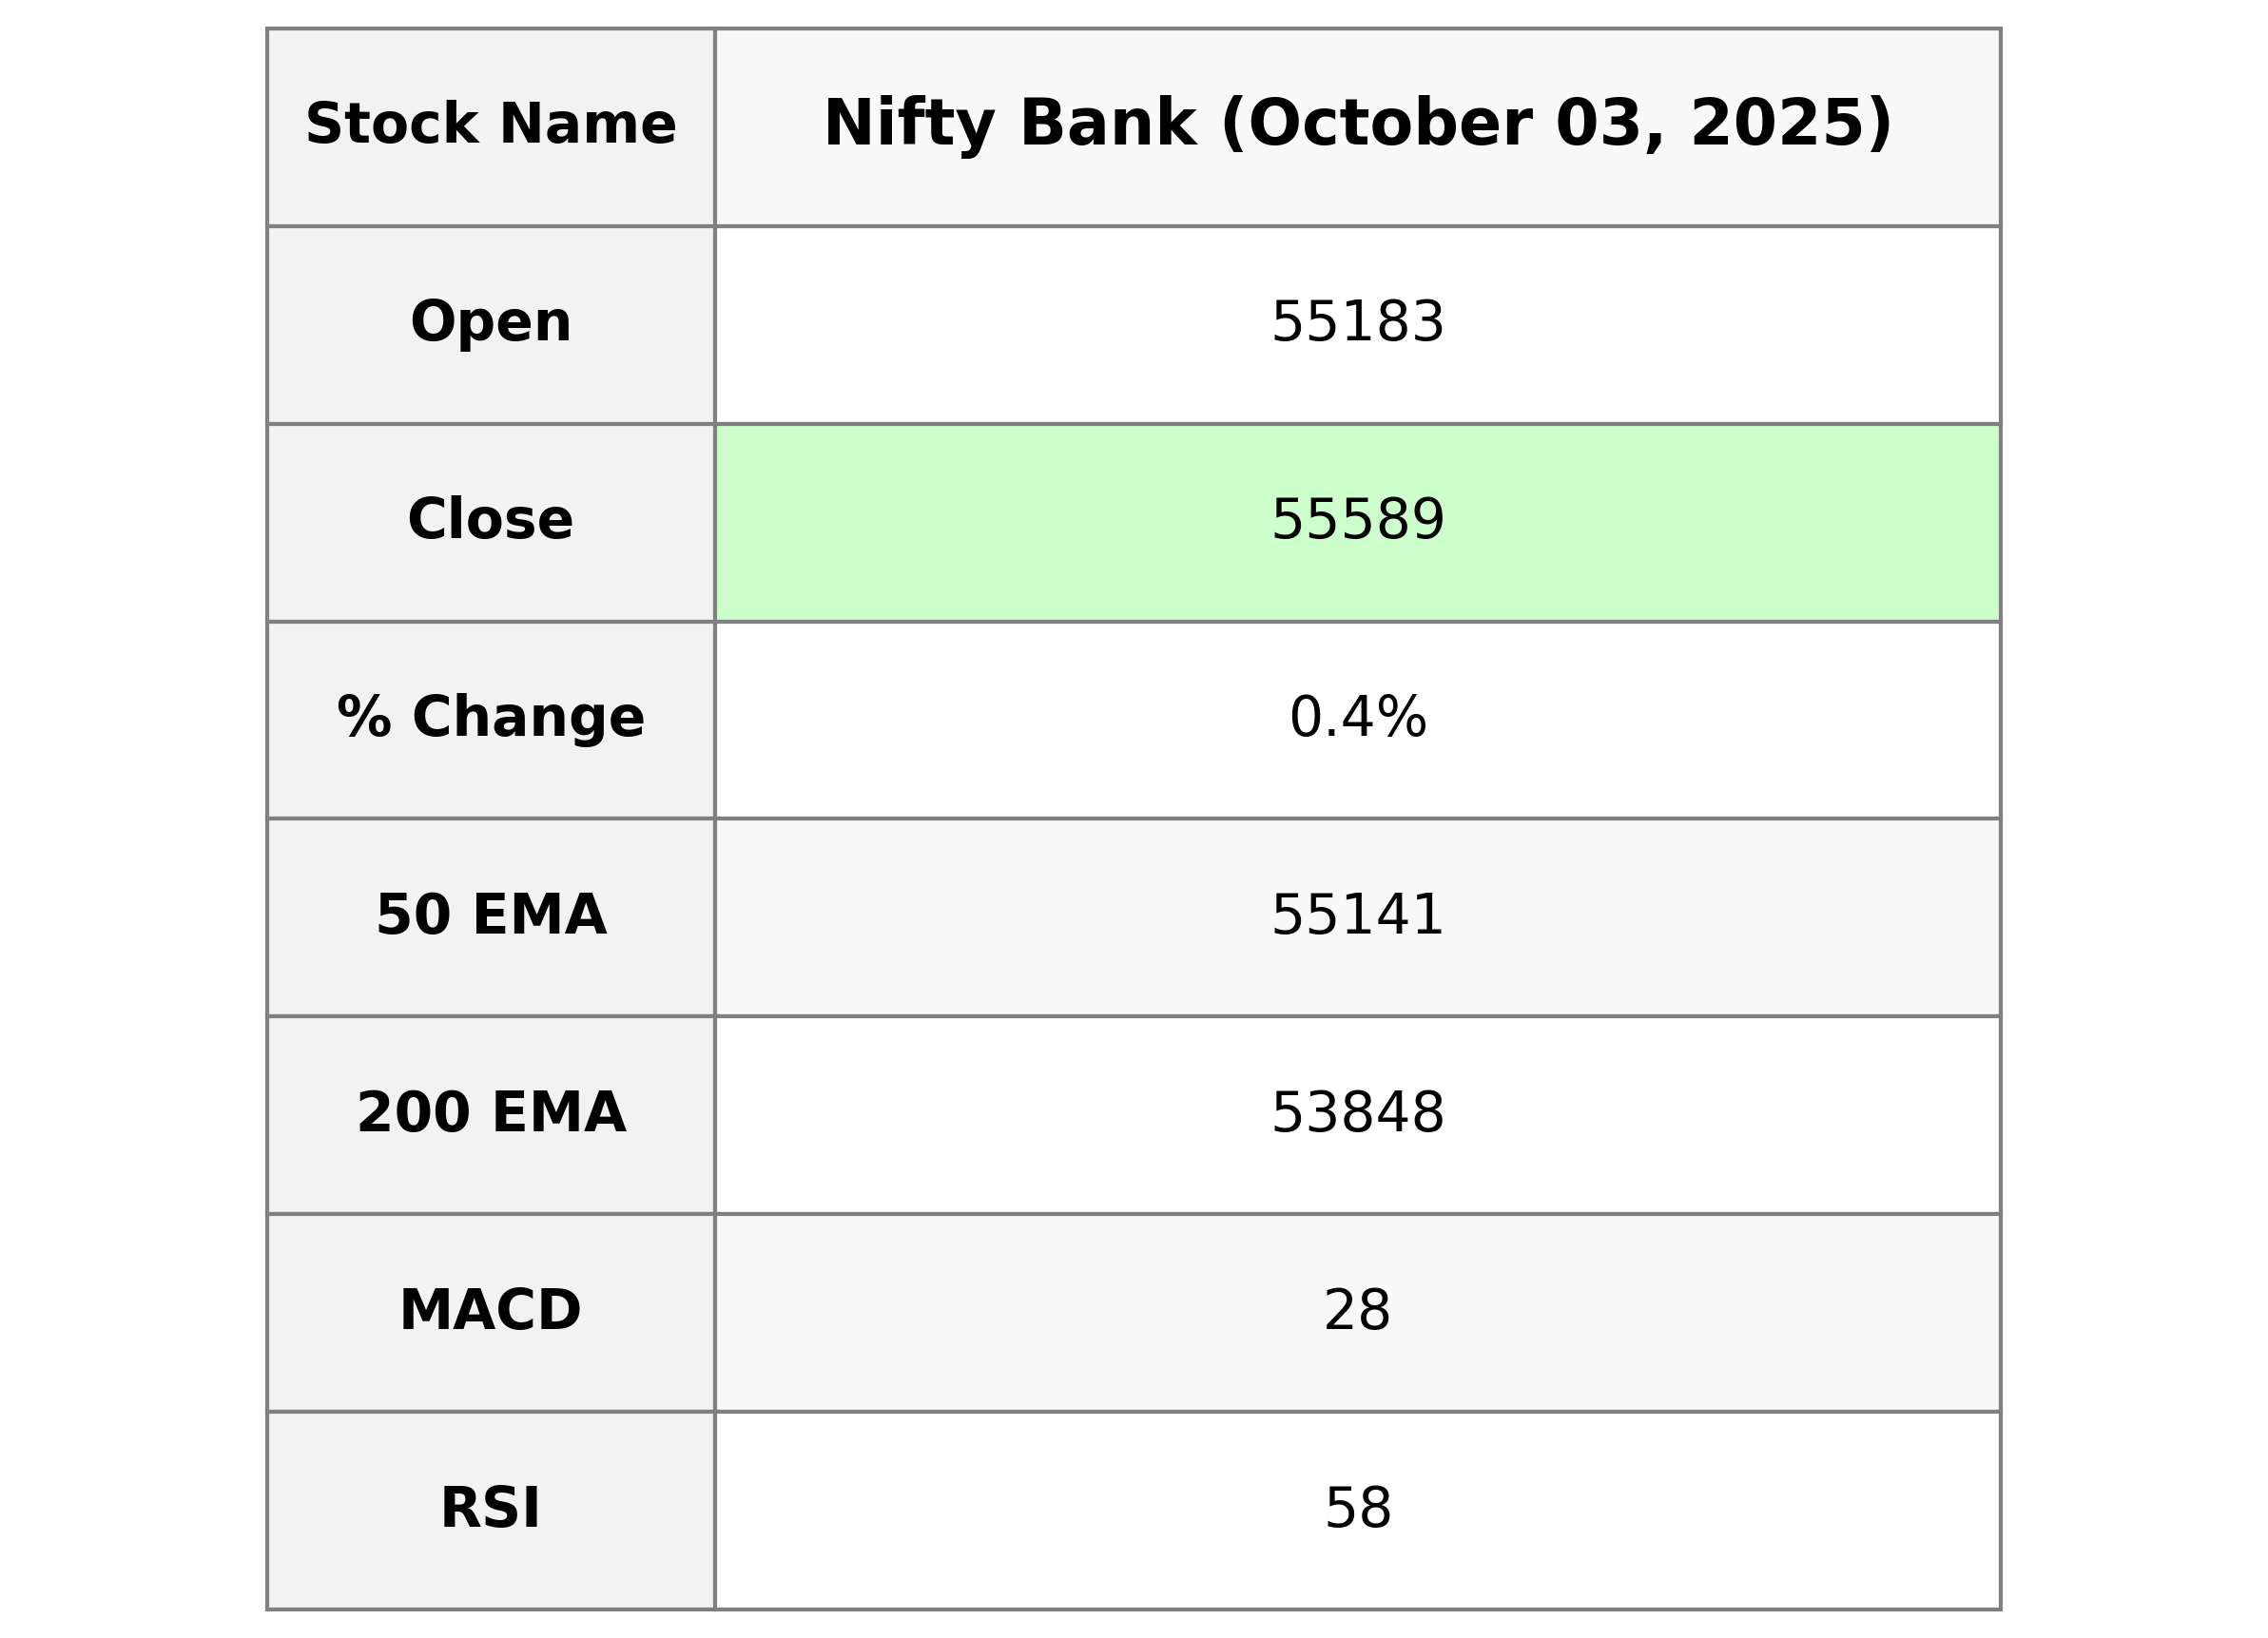
Nifty Bank opened at 55,182.60 and closed at 55,589.25, reflecting a positive change of 0.44% or 241.30 points from the previous close of 55,347.95. The intraday high was 55,616.45, with a low of 55,177. The Relative Strength Index (RSI) indicates moderate strength at 58.10, and the Moving Average Convergence Divergence (MACD) suggests a bullish sentiment with a value of 27.97 over the signal of -31.14.
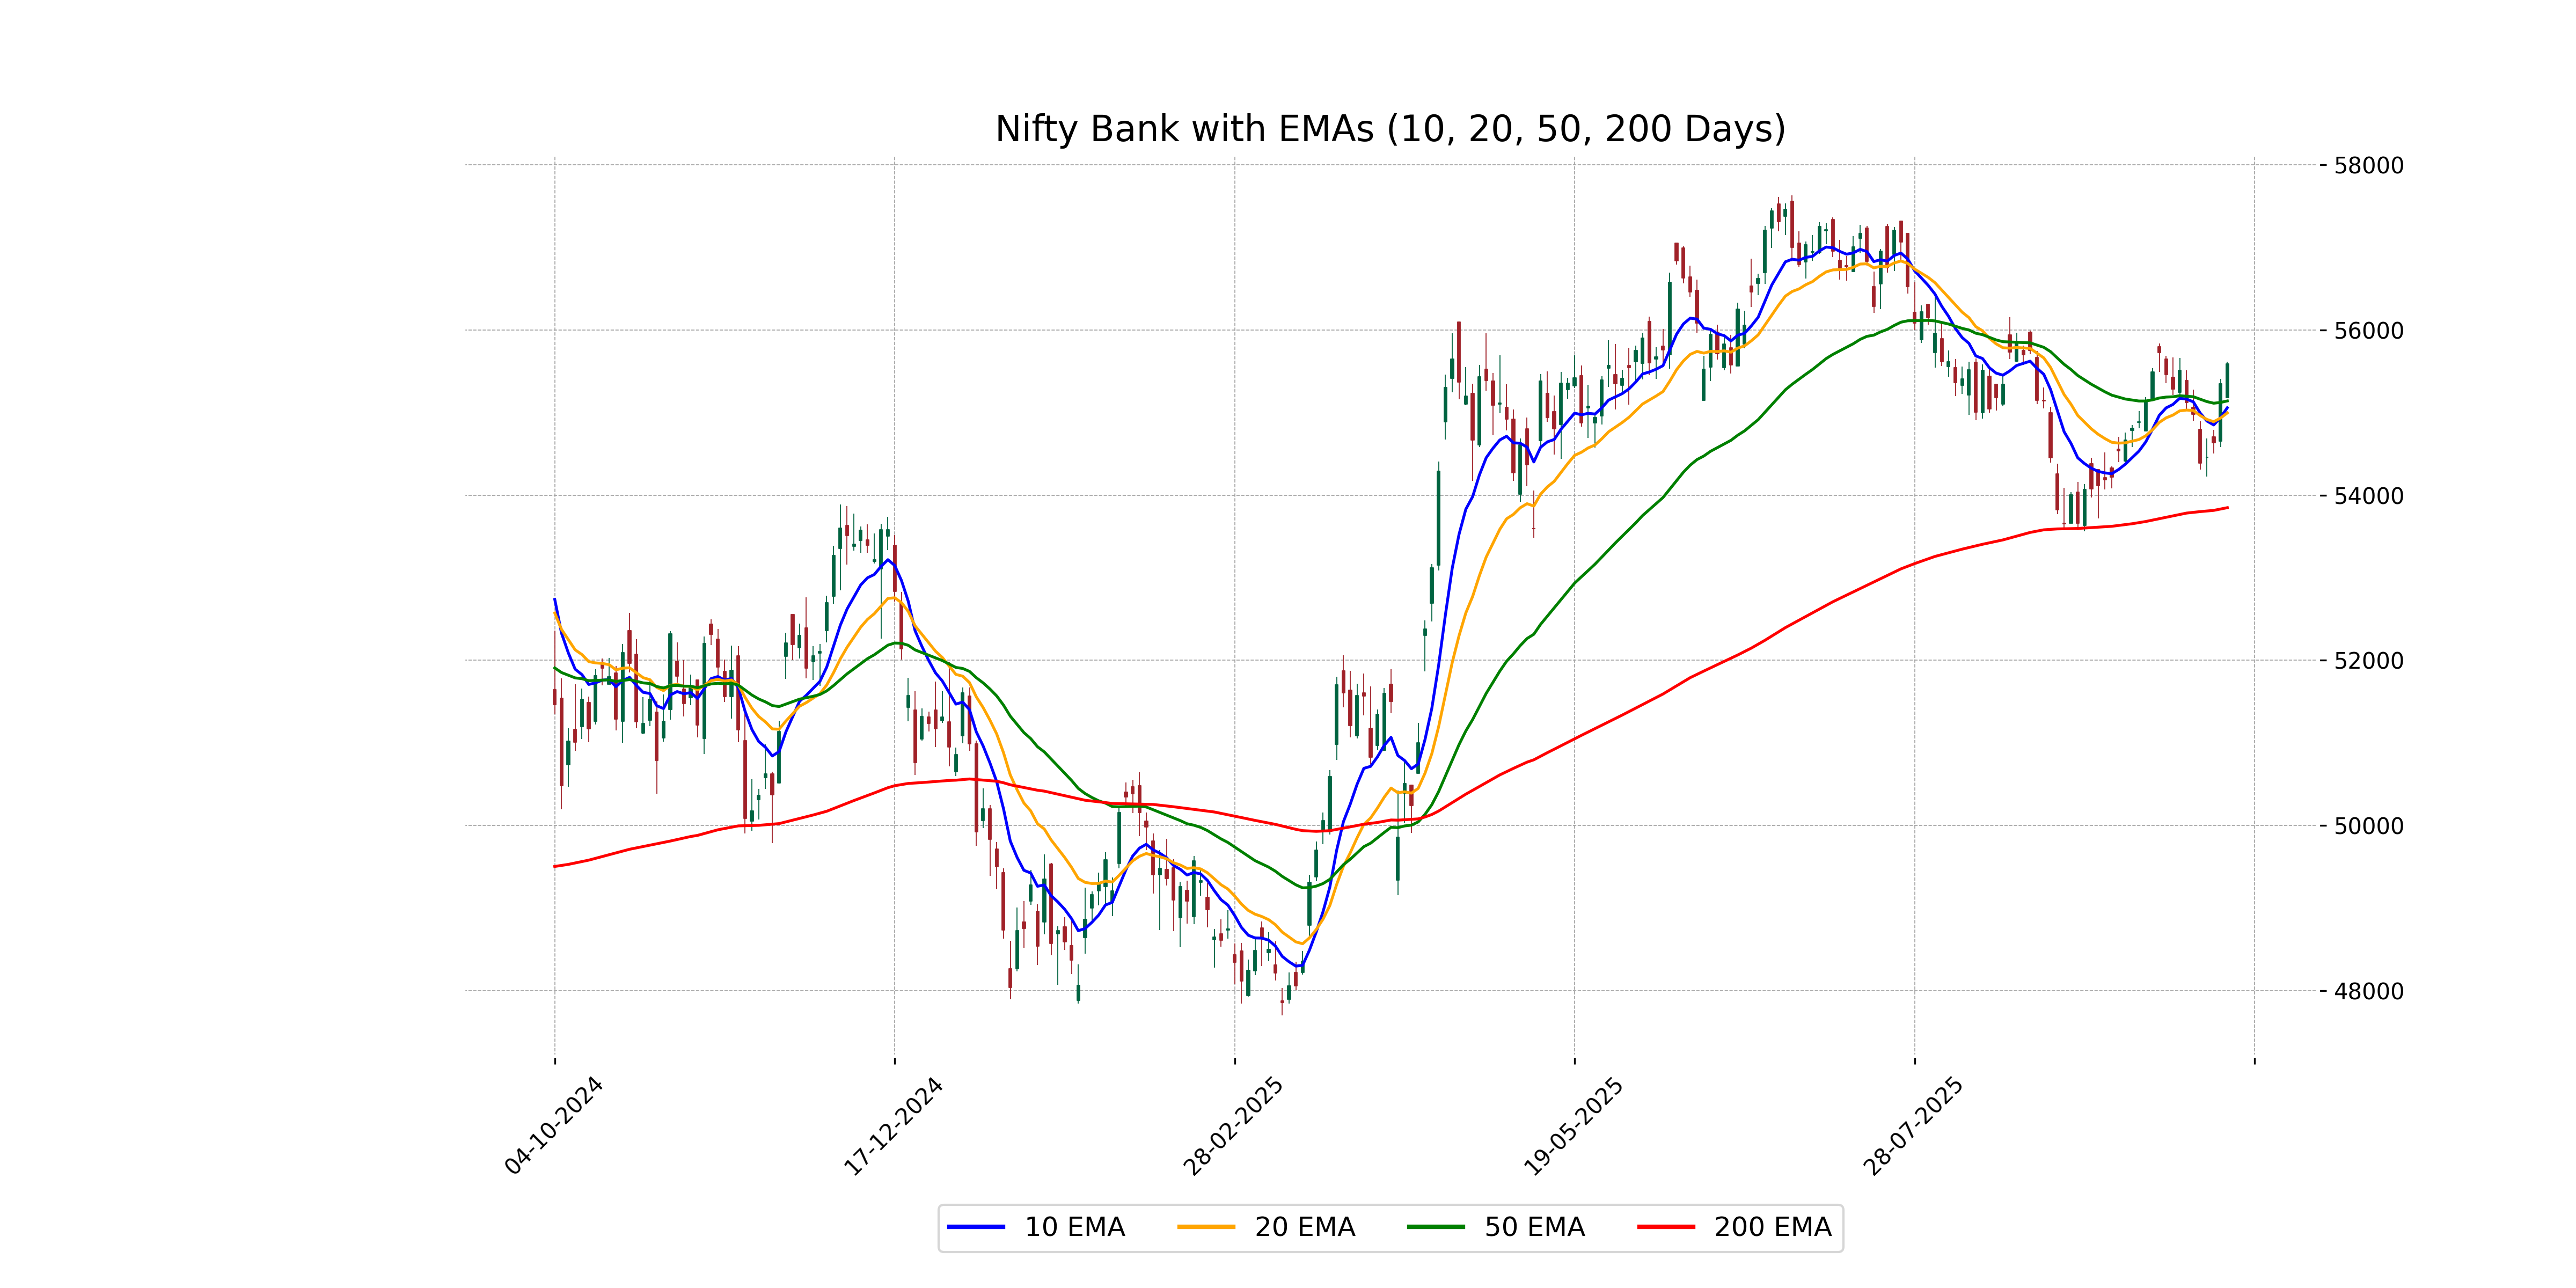
Relationship with Key Moving Averages
The Nifty Bank closed at 55589.25, above its 50-day EMA of 55141.09, indicating a potential upward momentum. The close is also above the 10-day EMA of 55058.73 and the 20-day EMA of 54996.14, suggesting short-term bullishness.
Moving Averages Trend (MACD)
The MACD value for Nifty Bank is 27.97, which is above the MACD Signal of -31.14. This suggests a bullish trend, indicating potential upward momentum. The positive MACD value compared to the signal line could imply that the stock may continue to rise in the near term.
RSI Analysis
The RSI (Relative Strength Index) for Nifty Bank is at 58.10, which suggests a neutral to slightly bullish momentum. An RSI above 50 typically indicates more buying interest, though it is still below the overbought threshold of 70, suggesting potential room for further upward movement without being overbought.
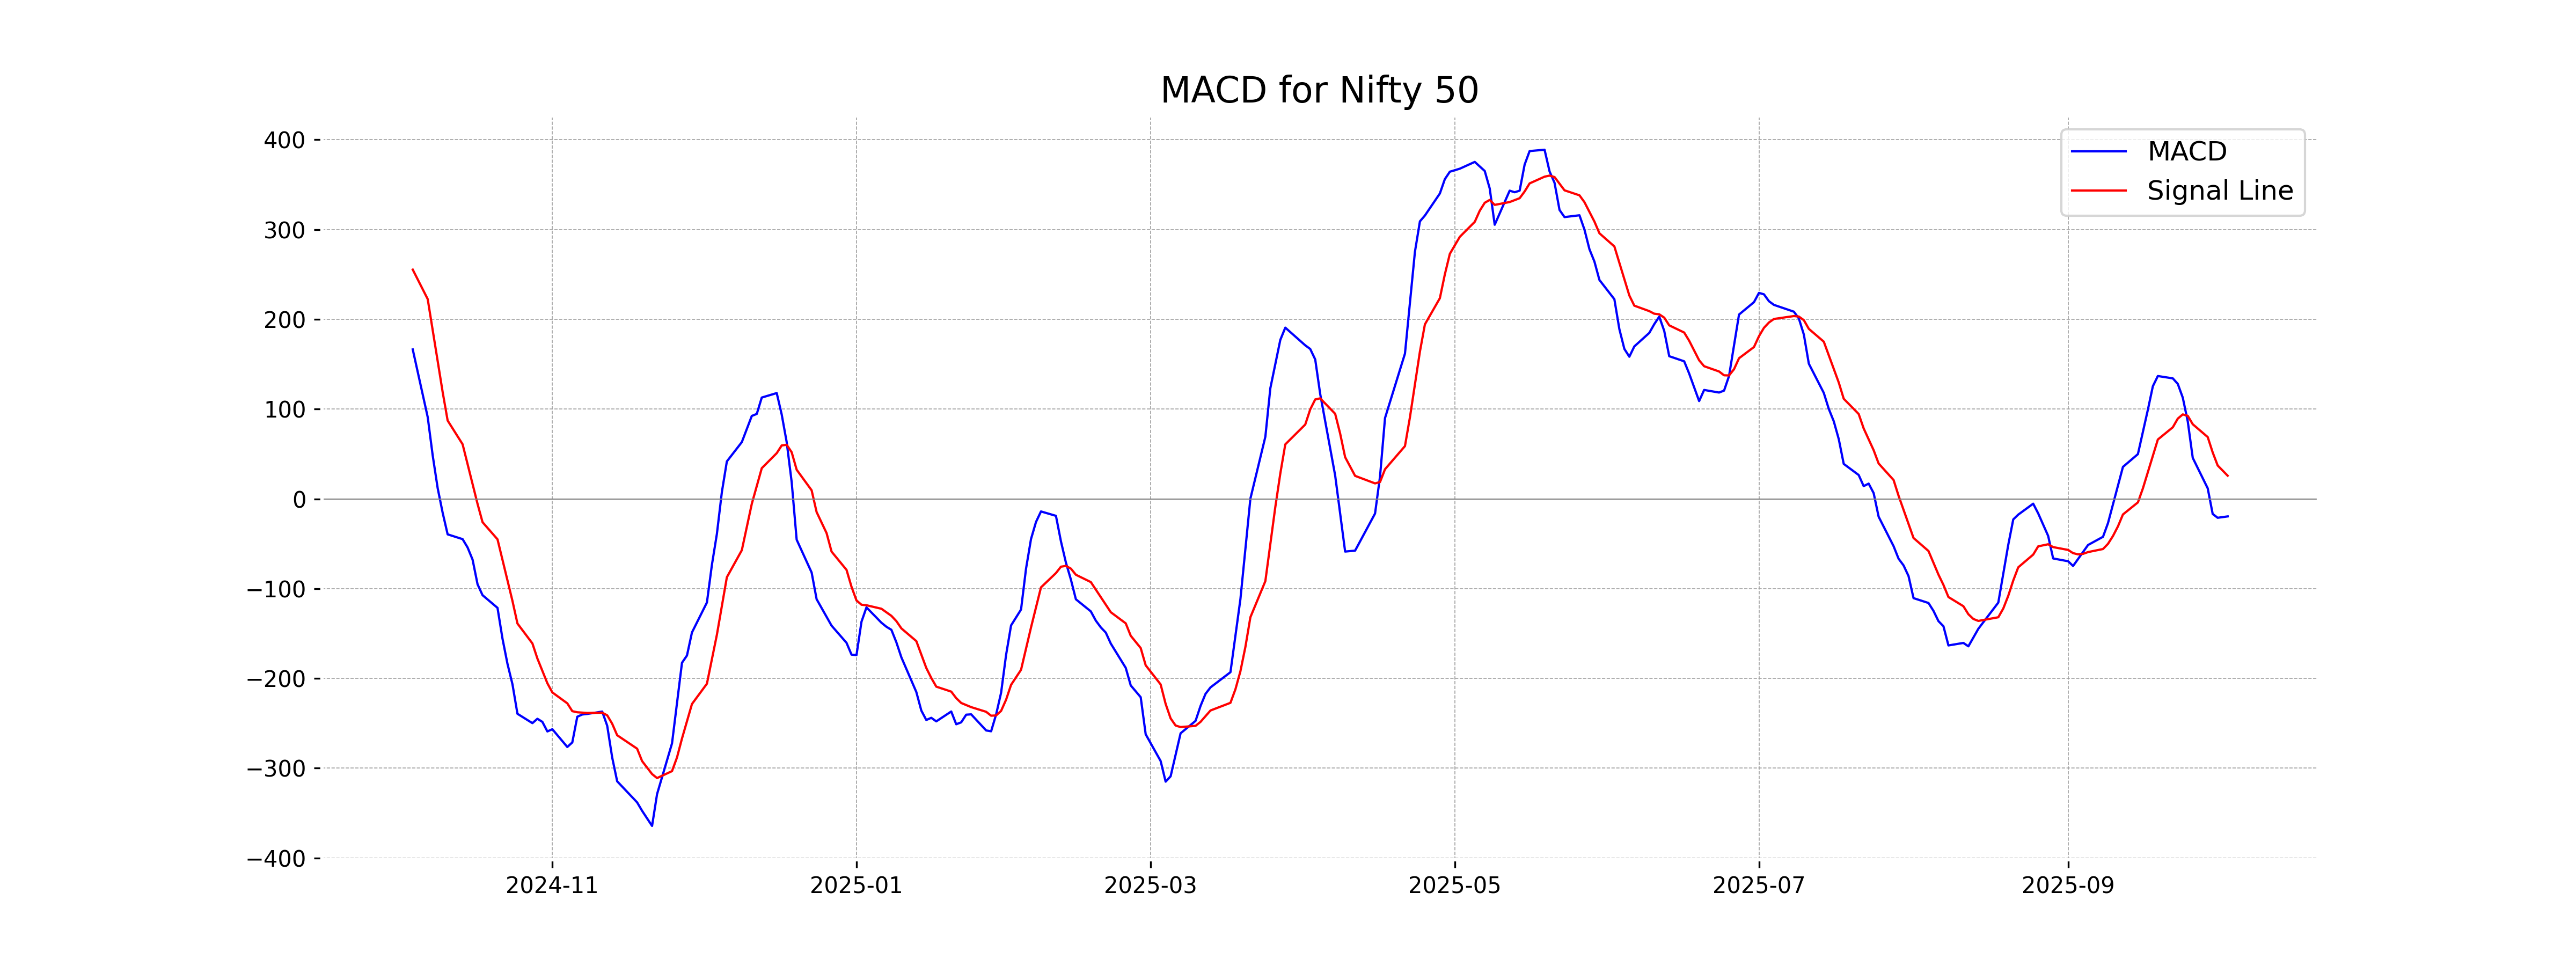
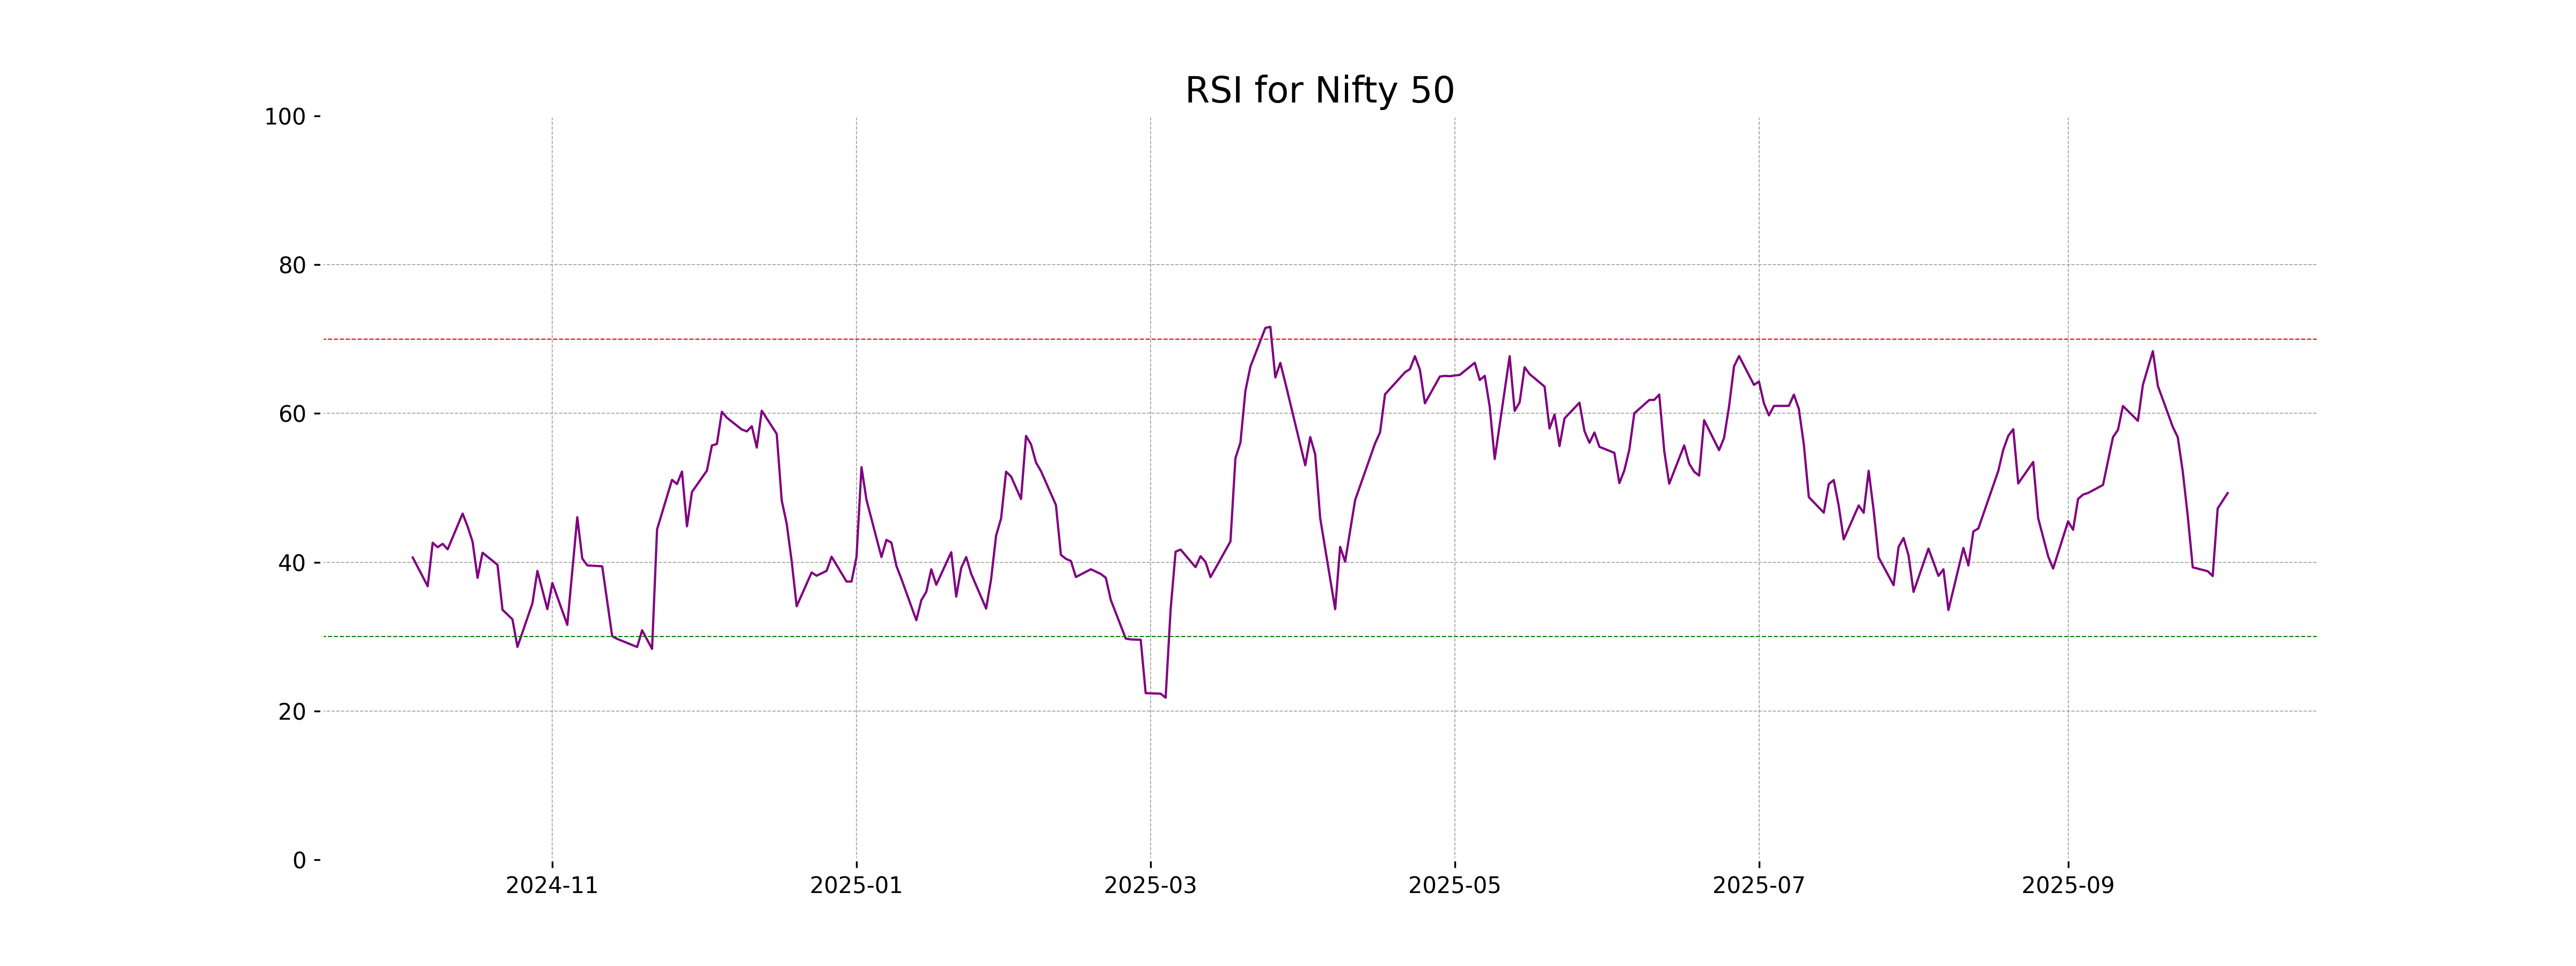
Analysis for Nifty 50 - October 03, 2025
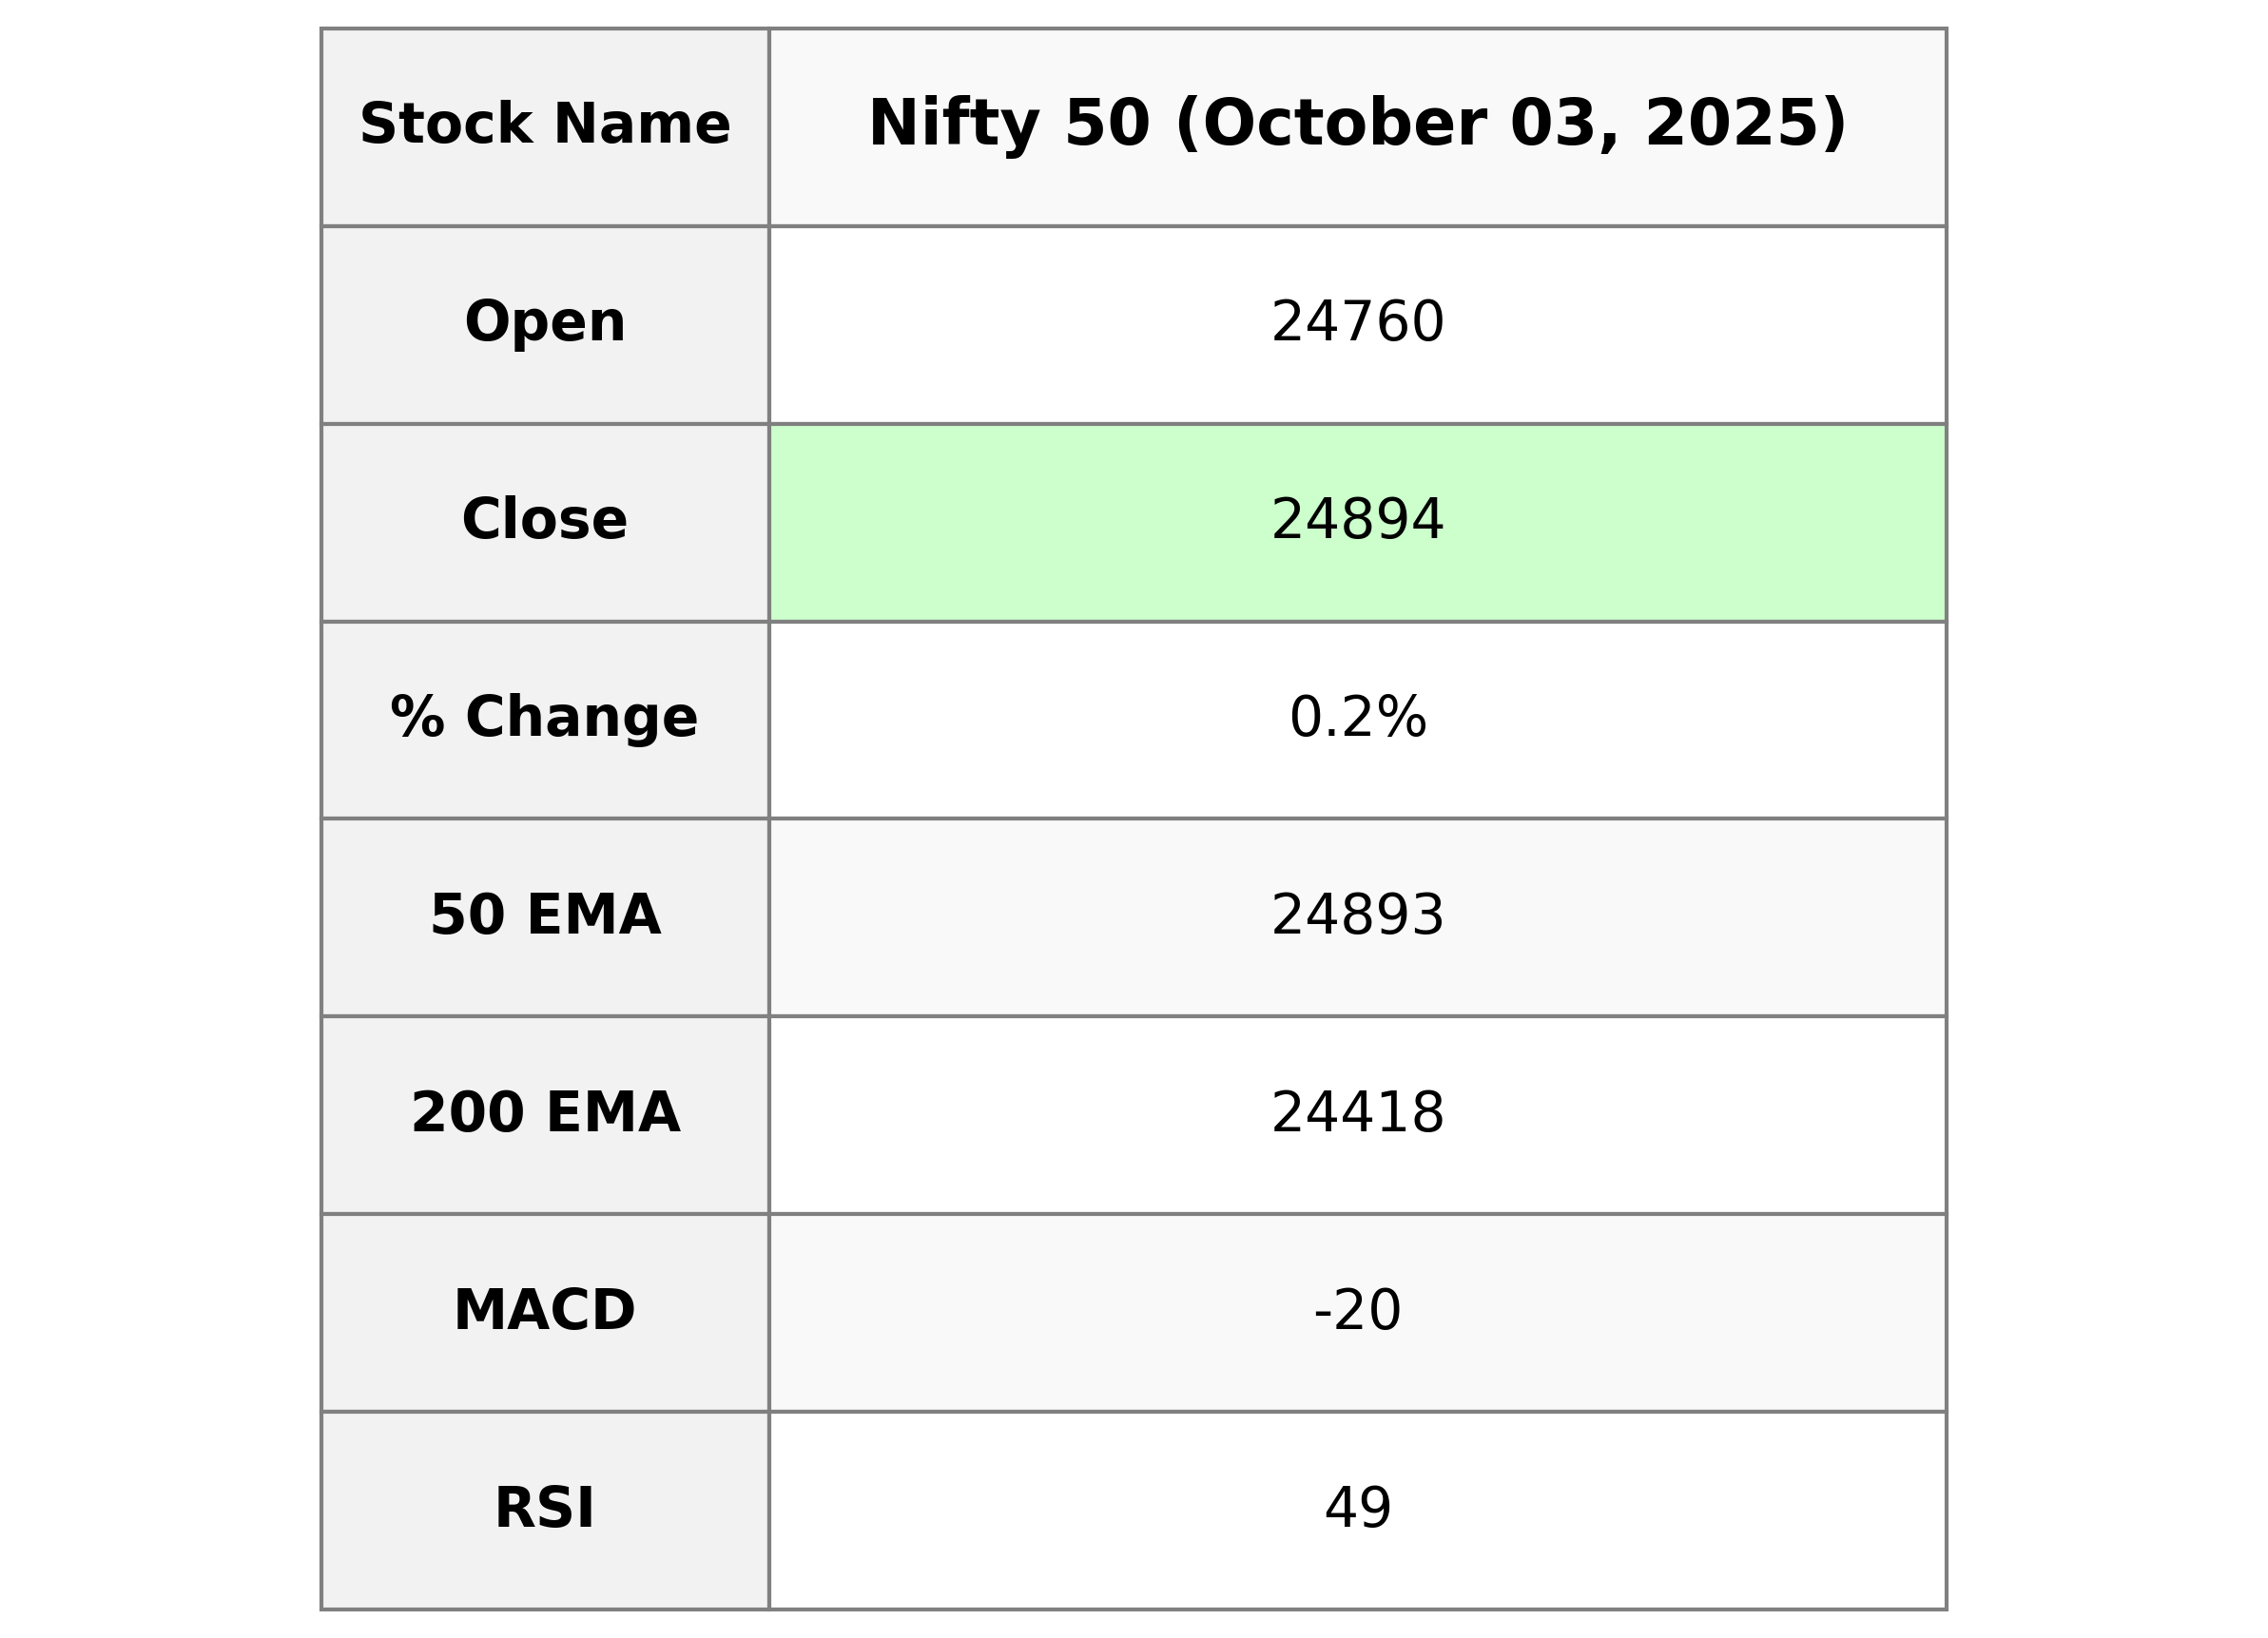
The Nifty 50 index opened at 24,759.55 and closed at 24,894.25, marking a slight increase of 0.23%. The index had a day's high of 24,904.80 and a low of 24,747.55. Despite the positive close, the MACD indicates bearish momentum, and the RSI is at 49.29, suggesting a neutral trend.
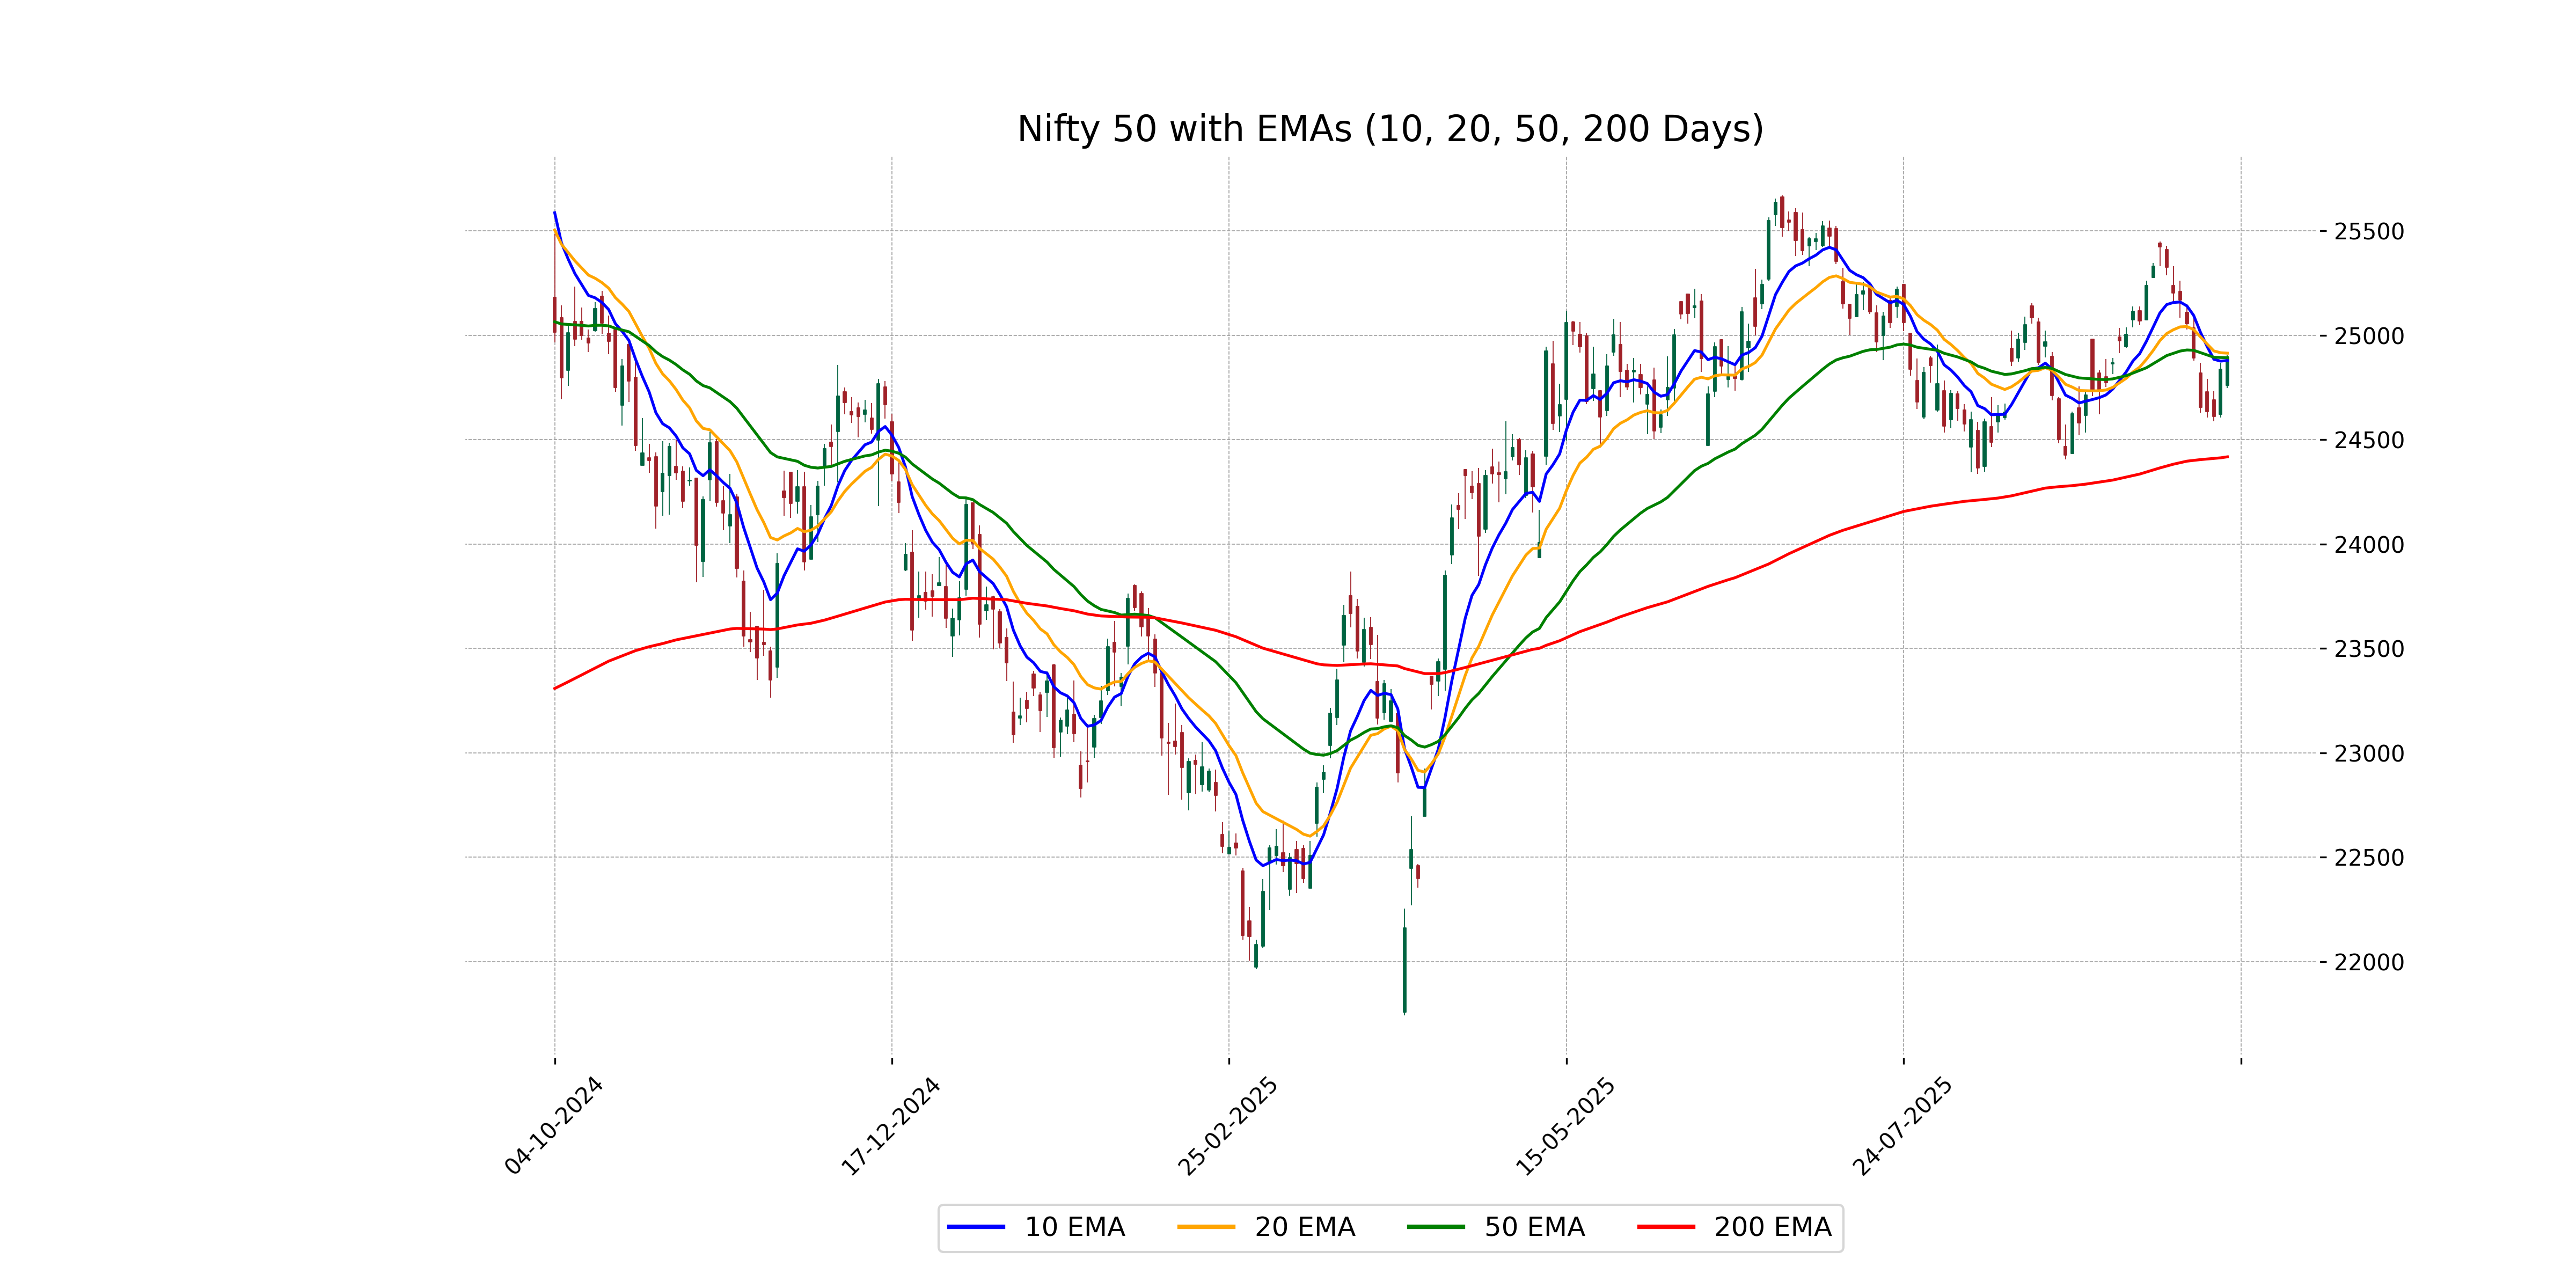
Relationship with Key Moving Averages
The Nifty 50 closed at 24,894.25, which is slightly above its 50-day EMA of 24,892.57 but below its 20-day EMA of 24,914.39. This suggests a neutral position relative to short-term trends but might indicate potential resistance near the 20-day EMA.
Moving Averages Trend (MACD)
The Nifty 50 has a negative MACD of -19.56, suggesting a bearish trend as the MACD is below the signal line, which stands at 25.80. However, the relatively close range between the MACD and the signal line indicates the potential for a reversal or consolidation in the near future.
RSI Analysis
Based on the RSI value of 49.29 for Nifty 50, the index is approaching a neutral position, as it is close to the midpoint of the typical 30 to 70 range used for RSI. This suggests that the market is neither overbought nor oversold, indicating a balance in buying and selling pressures at present.
Up Next

Indian stock market sector-wise performance today - October 3, 2025

Honda Activa 6G: Everything You Need to Know Before Buying

How much does a ULIP plan really cost? A break-down of all charges

Centre plans to borrow Rs 8.20 lakh cr from market in first half of FY27

Reliance denies buying Iranian oil amid US sanctions waiver

Premium petrol price up Rs 2, industrial diesel up Rs 22; no change in normal petrol, diesel rates

More videos

India's GDP expected to register over 8 pc growth in Sep-Dec: Report

Govt announces seven measures to help boost exports

RBI keeps interest rates on hold after US trade deal boosts outlook

RBI proposes to compensate customers up to Rs 25,000 loss due to fraud

RBI raises GDP growth projection of Q1, Q2 of FY27

RBI pauses rate cuts, retains interest rate at 5.25 pc

Rupee jumps 122 paise to close at 90.27 against US dollar on India-US trade deal

Stock markets cheer India-US trade deal: Sensex, Nifty surge 2.5 pc

UPI transactions hit record high of Rs 230 lakh crore in 2025-26 till Dec: Govt

Explained: India-US trade deal, tariffs and trade benefits