


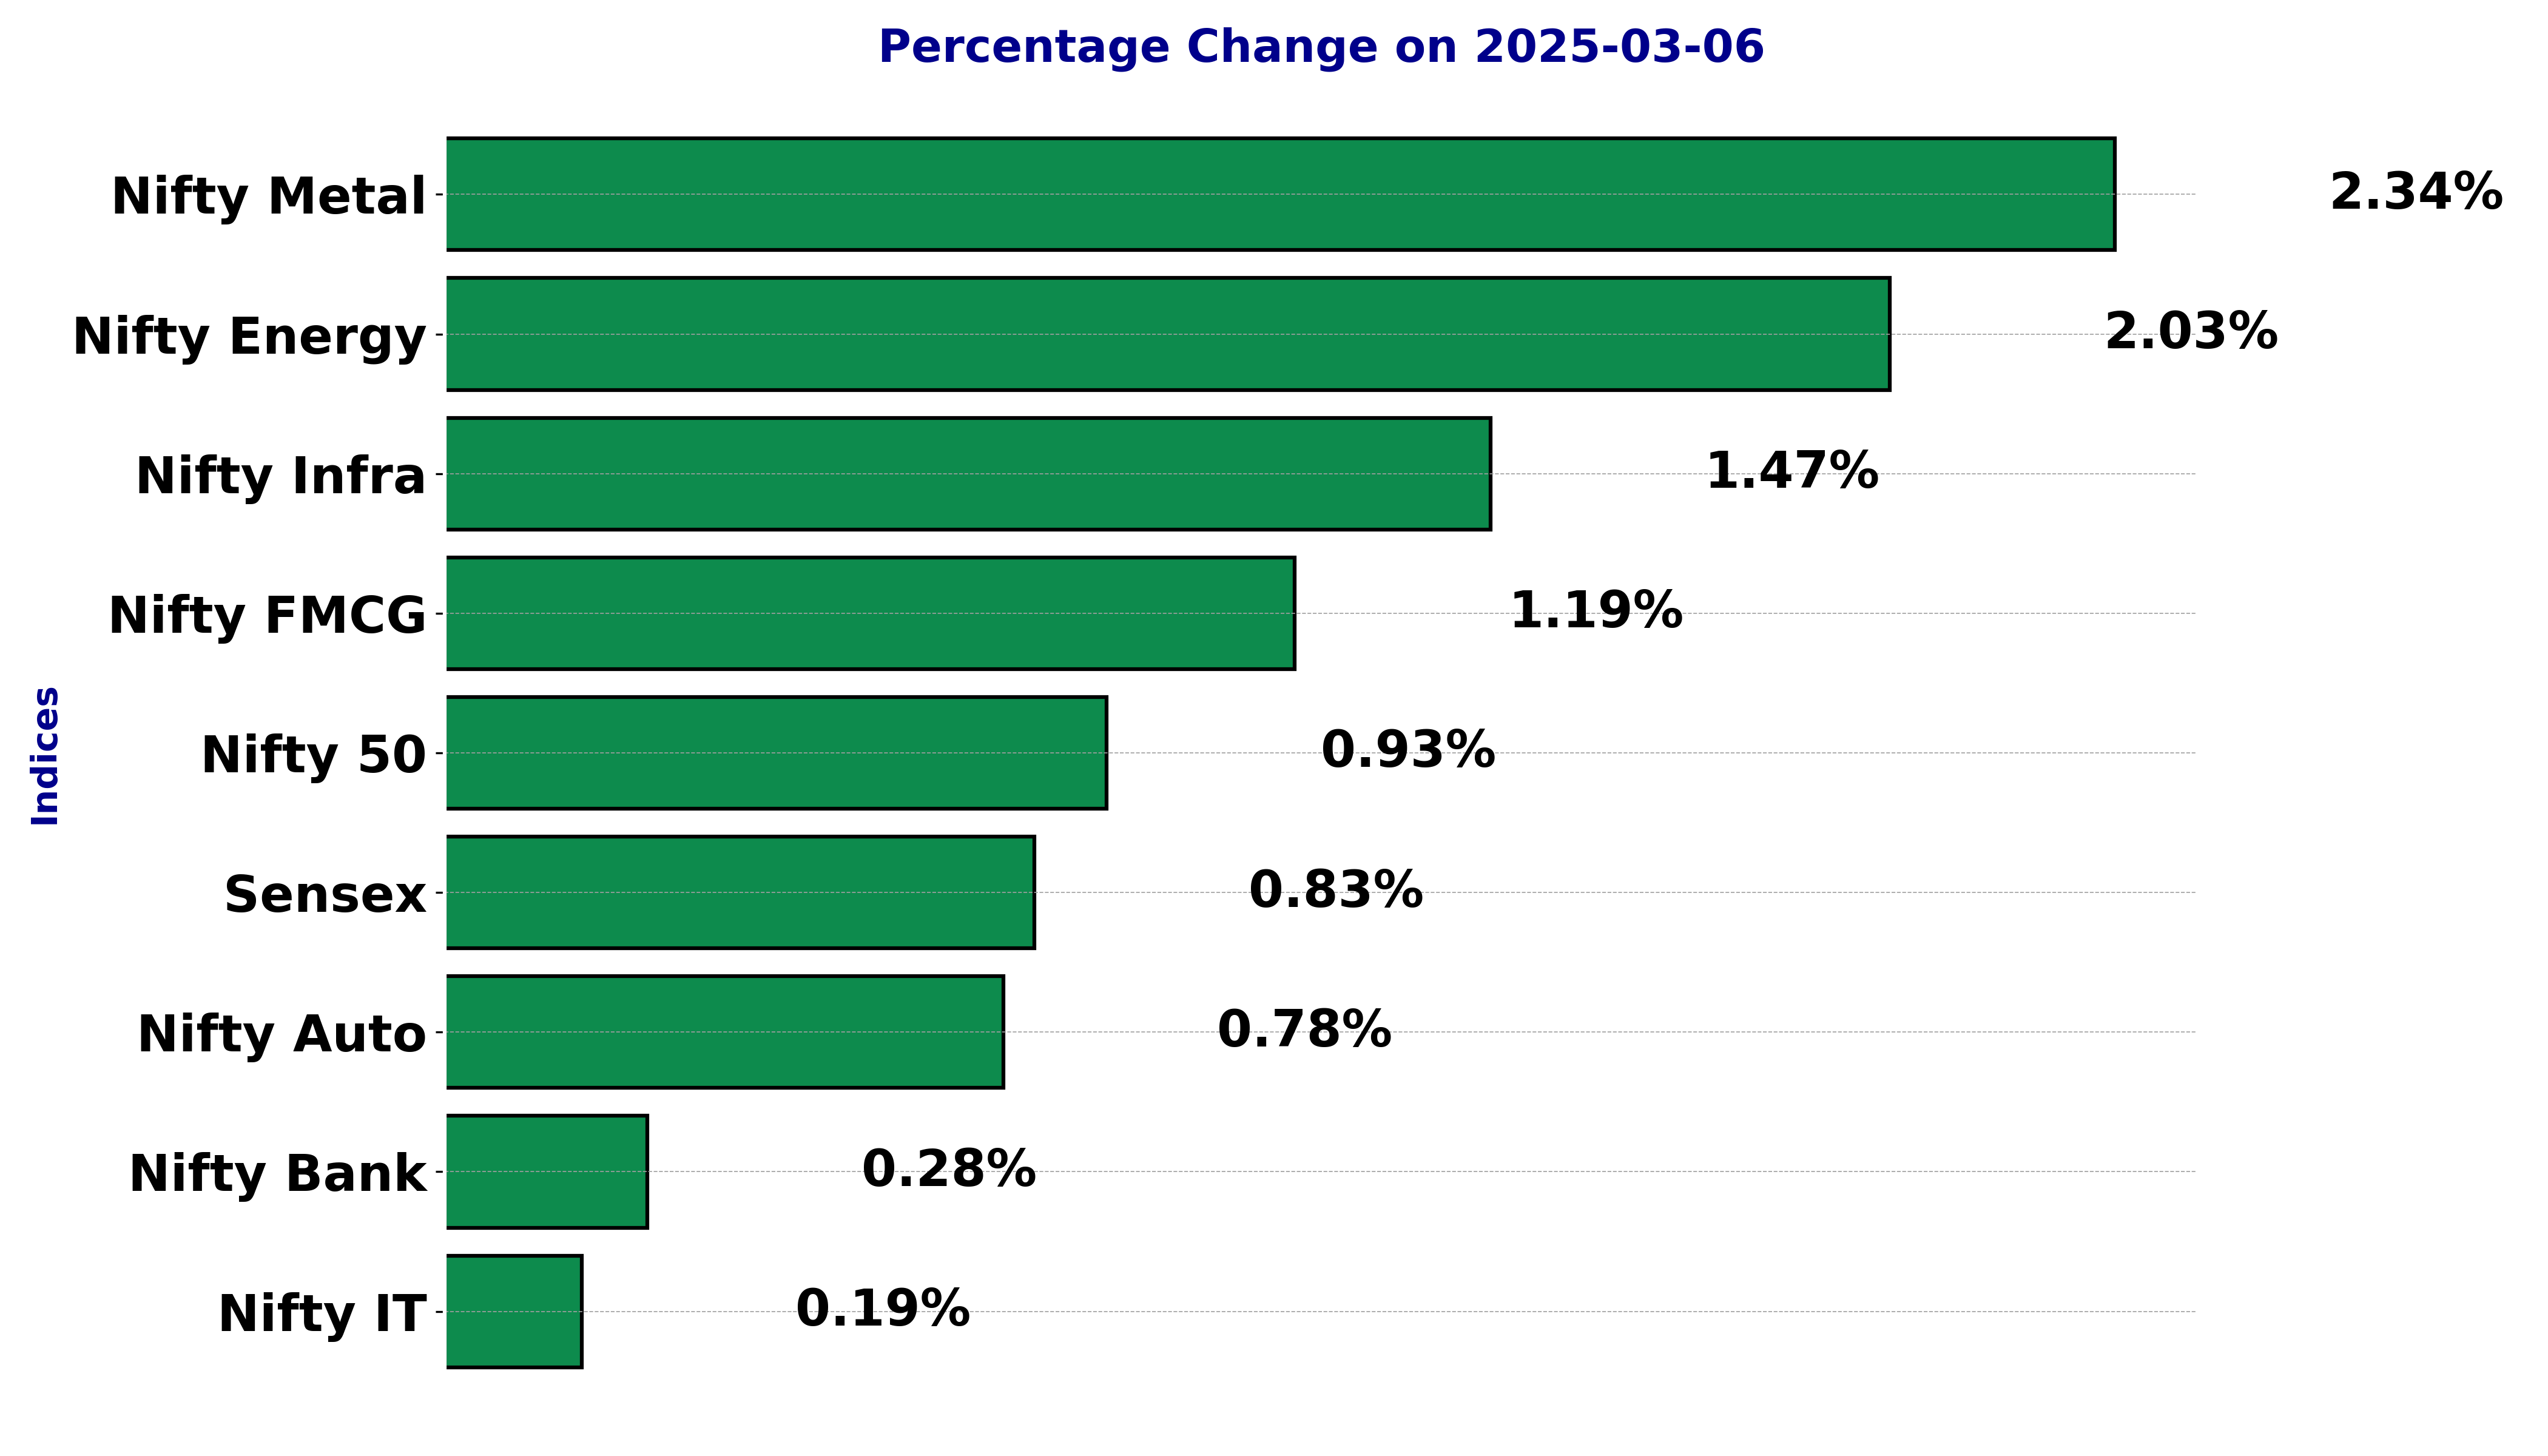
Highlights
- Nifty Metal tops with a 2.34% gain; bullish trend evident
- Nifty Energy surges 2.03% exhibiting strong momentum
- Nifty FMCG rises 1.19%, reflecting positive sentiment
Latest news

Samsung Galaxy A57 & A37 Review: Safe Upgrades or Missed Opportunity?

Trust-based governance, Jan Vishwas Bill will decriminalise minor offences, boosts ease of doing business: Piyush Goyal
, Marking a New Era for Inclusive Sport")
India Set to Launch Korfball Premier League (KPL), Marking a New Era for Inclusive Sport

"It belongs to all Dogras": Kathua's Thakur Khajoor Singh after receiving Sahitya Akademi Award

fischer Strengthens Production in Asia: New Production Sites in India and China

Punjab Carbonic Limited Files DRHP With SEBI, NSE and BSE

Cupid Limited Deploys Rs 82.88 crore as Strategic Investment into Baazar Style Retail Limited

Selena Gomez to direct 'Wizards Beyond Waverly Place' finale, series ends this summer
Indian stock market sector-wise performance today - March 06, 2025


On Wednesday (February 6, 2025), the stock market showcased a range of movements across various sectors and indices.
Notably, Nifty Metal emerged as the standout performer, recording a significant percentage change of 2.34%. This surge indicates a strong demand in the metal sector, potentially driven by positive developments or favorable market conditions influencing metal prices.
Furthermore, Nifty Energy followed closely with a commendable increase of 2.03%. This upswing might be attributed to fluctuations in global energy prices or advancements within the sector, sparking investor interest.
Meanwhile, Nifty FMCG experienced a 1.19% rise, reflecting a steady demand for fast-moving consumer goods. The growth in this sector suggests consumer confidence and robust sales figures.
Nifty Infrastructure reported a 1.47% growth, potentially indicating increased infrastructure spending or government initiatives that have buoyed market sentiment.
On the other hand, Nifty IT, representing the technology sector, saw a modest growth of only 0.19%. This slight increase could be due to mixed investor sentiments or external factors impacting technology companies.
In the financial realm, Nifty Bank experienced a slight advancement of 0.28%, signifying stable performance yet cautious investor outlook towards banks and financial institutions.
The broader Nifty 50 index recorded a healthy uptick of 0.93%. This reflects overall positive market sentiment, with several sectors contributing to the day's gains.
In contrast, the BSE Sensex marked an increase of 0.83%, slightly underperforming compared to its counterpart, Nifty.
This indicates selective buying in certain sectors while others remained subdued. The market's movements, led by Nifty Metal, suggest an optimistic outlook for sectors poised to benefit from economic tailwinds or specific policy measures.
This nuanced performance highlights varying investor positions and sector-specific influences shaping the day's trading dynamics.
Analysis for Sensex - March 06, 2025
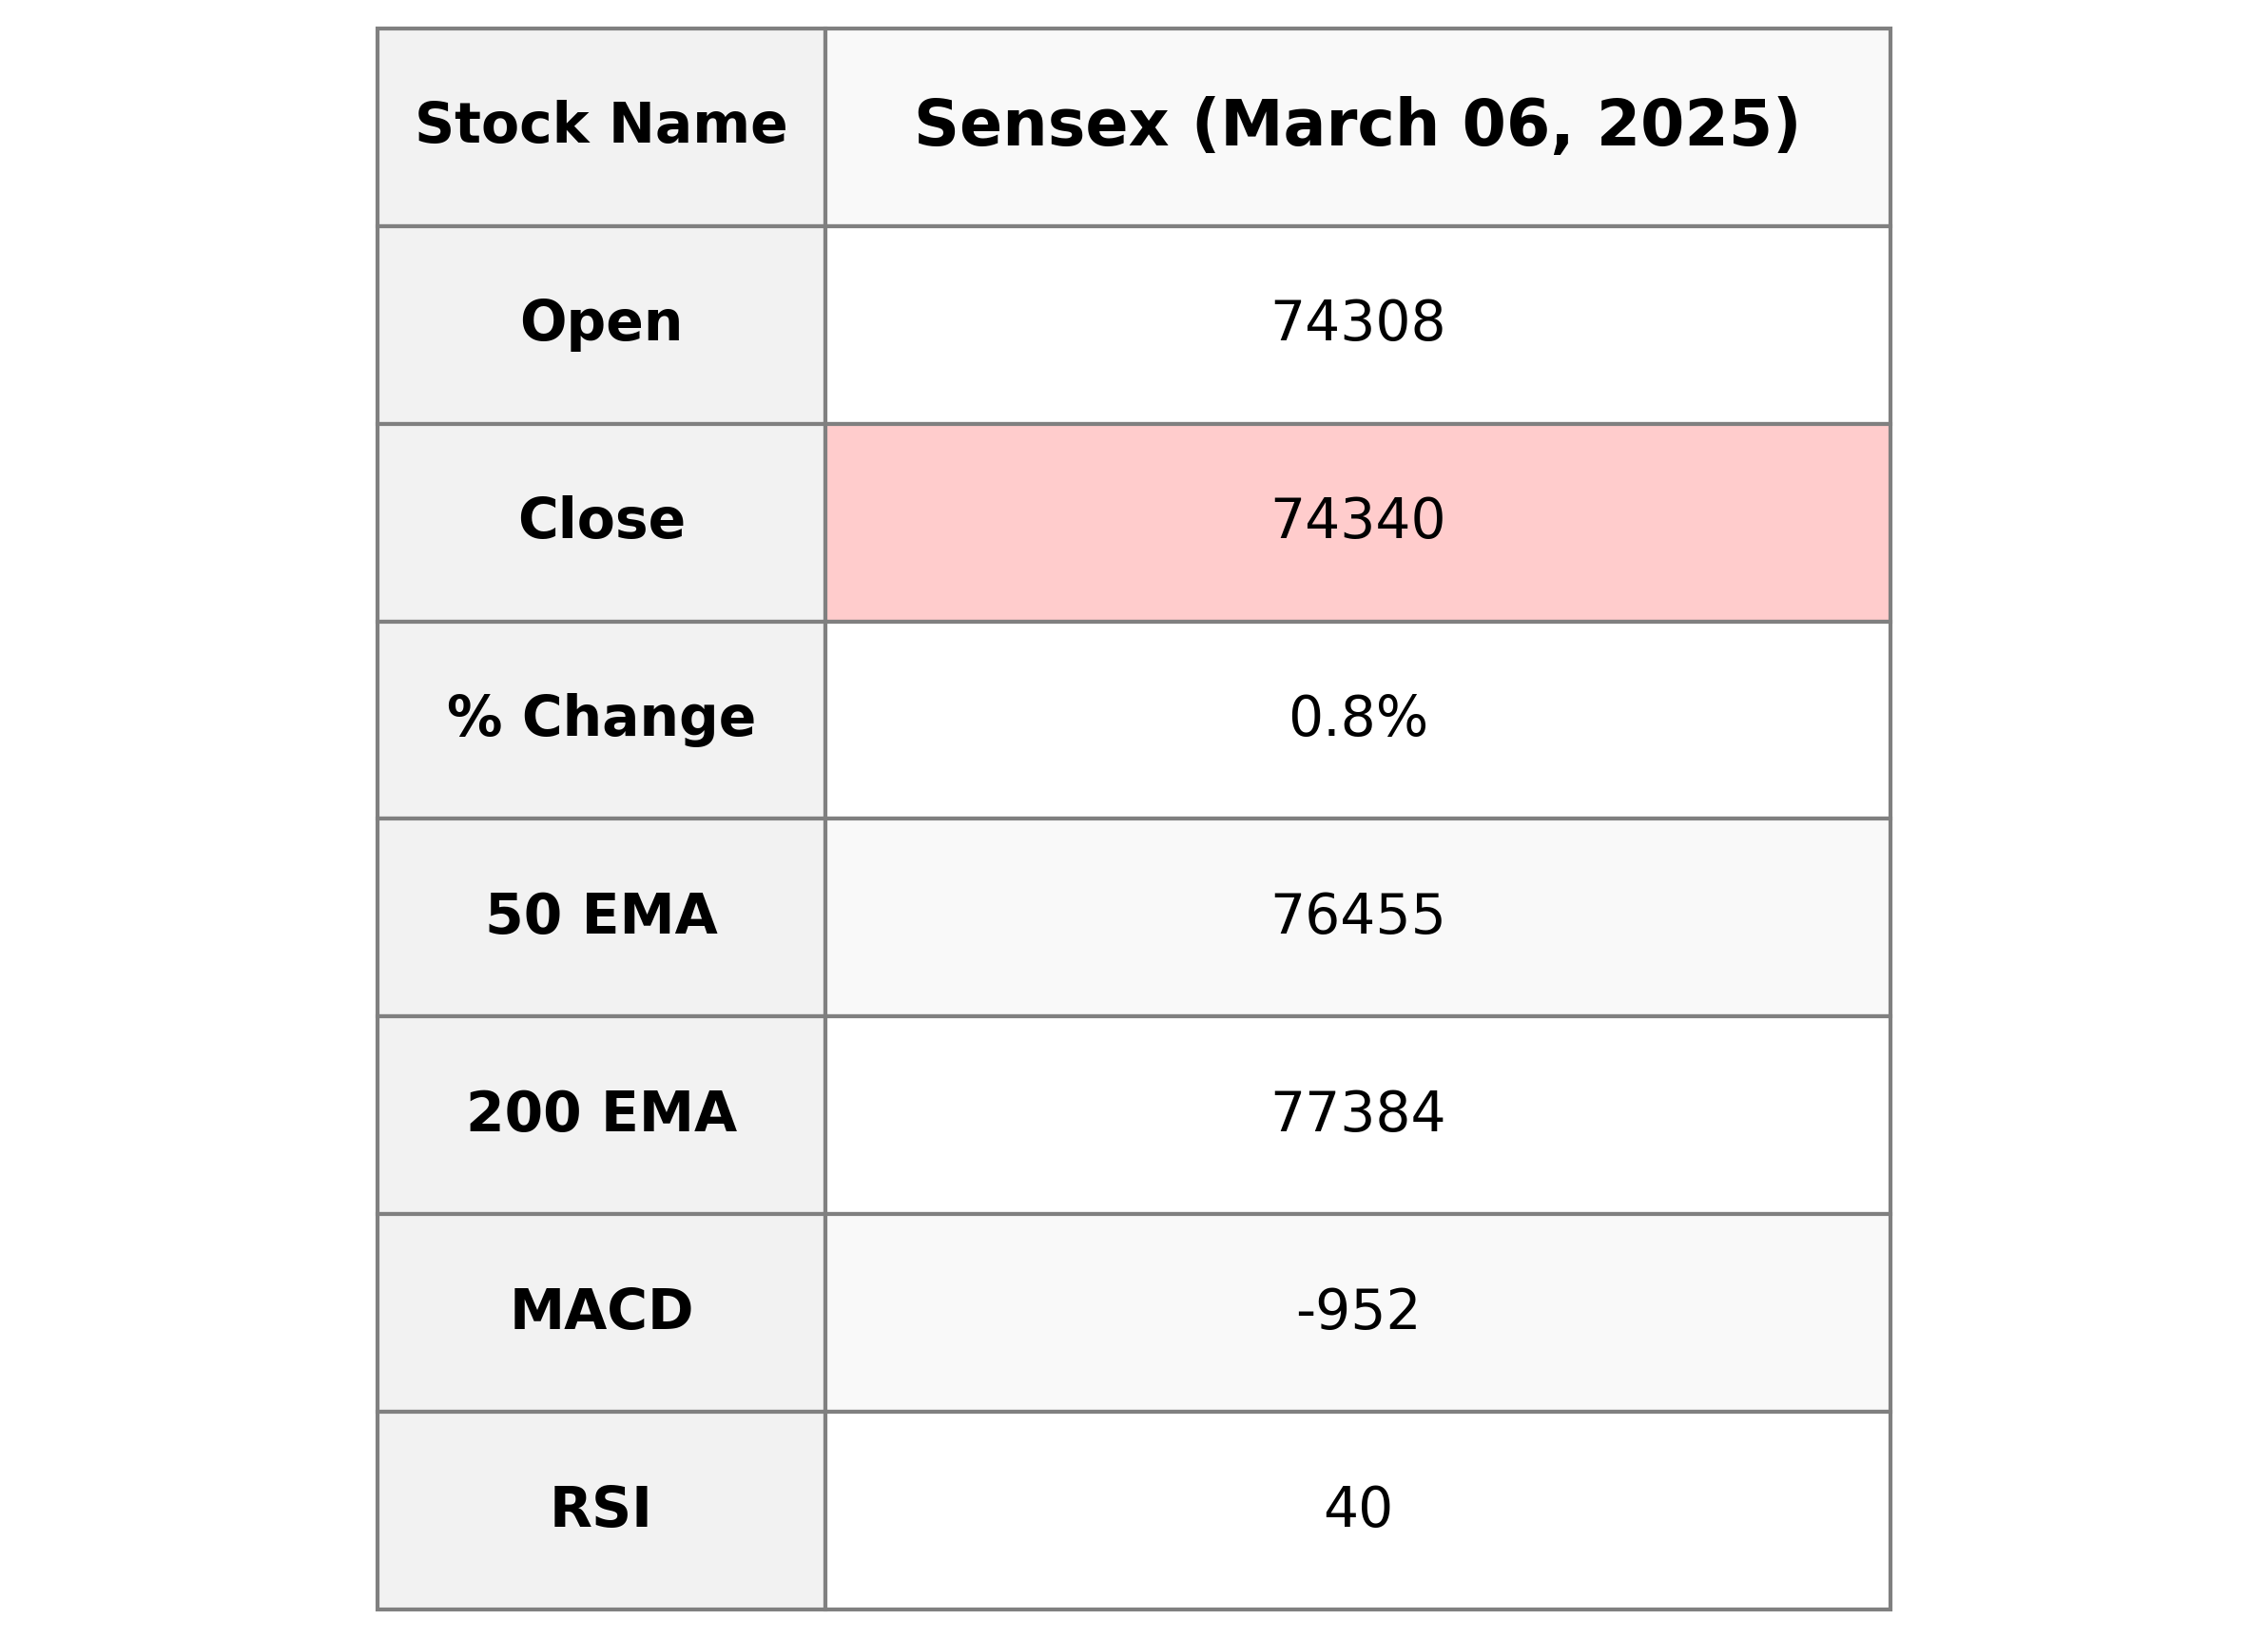
Sensex Performance Overview: The Sensex opened at 74,308.30, experienced a high of 74,390.80, and closed at 74,340.09, marking a gain of 0.83% with a points change of 609.87 from the previous close. The RSI of 40.12 indicates bearish momentum, while the negative MACD suggests the current trend may continue downward. Trading volume details are unavailable.

Relationship with Key Moving Averages
The Sensex closed at 74,340.09, which is below its 50 EMA of 76,454.95 and 200 EMA of 77,384.32, indicating a bearish trend in the short to medium term. However, it is trading slightly above its 10 EMA of 74,255.80, suggesting a potential short-term support.
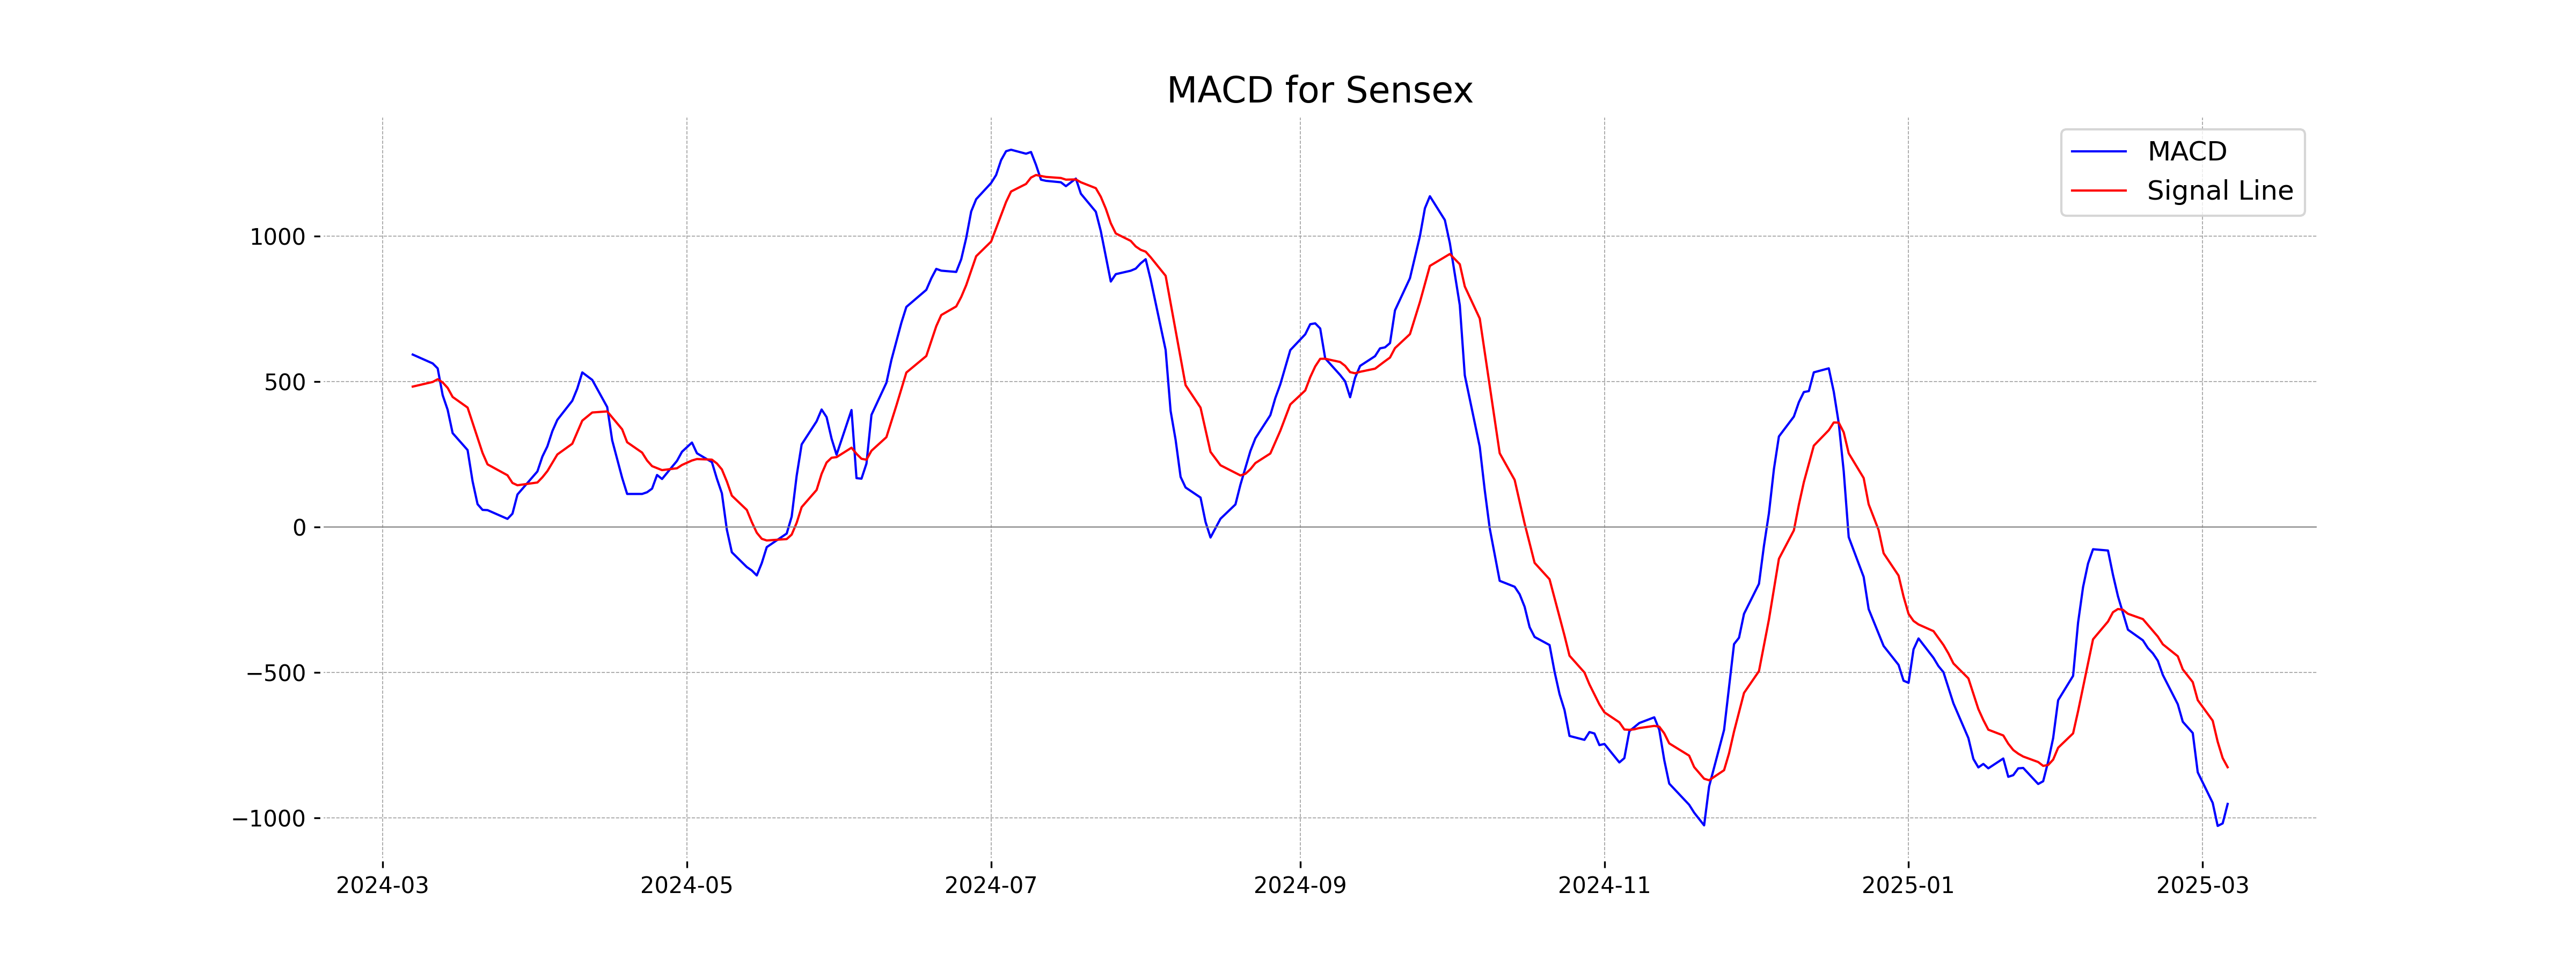
Moving Averages Trend (MACD)
The MACD for Sensex is negative, with a value of -951.55, which is below the MACD Signal line at -825.45. This indicates a bearish trend as the MACD line is moving further away from the signal line. Combined with an RSI of 40.12, sentiment seems to lean towards selling pressure.
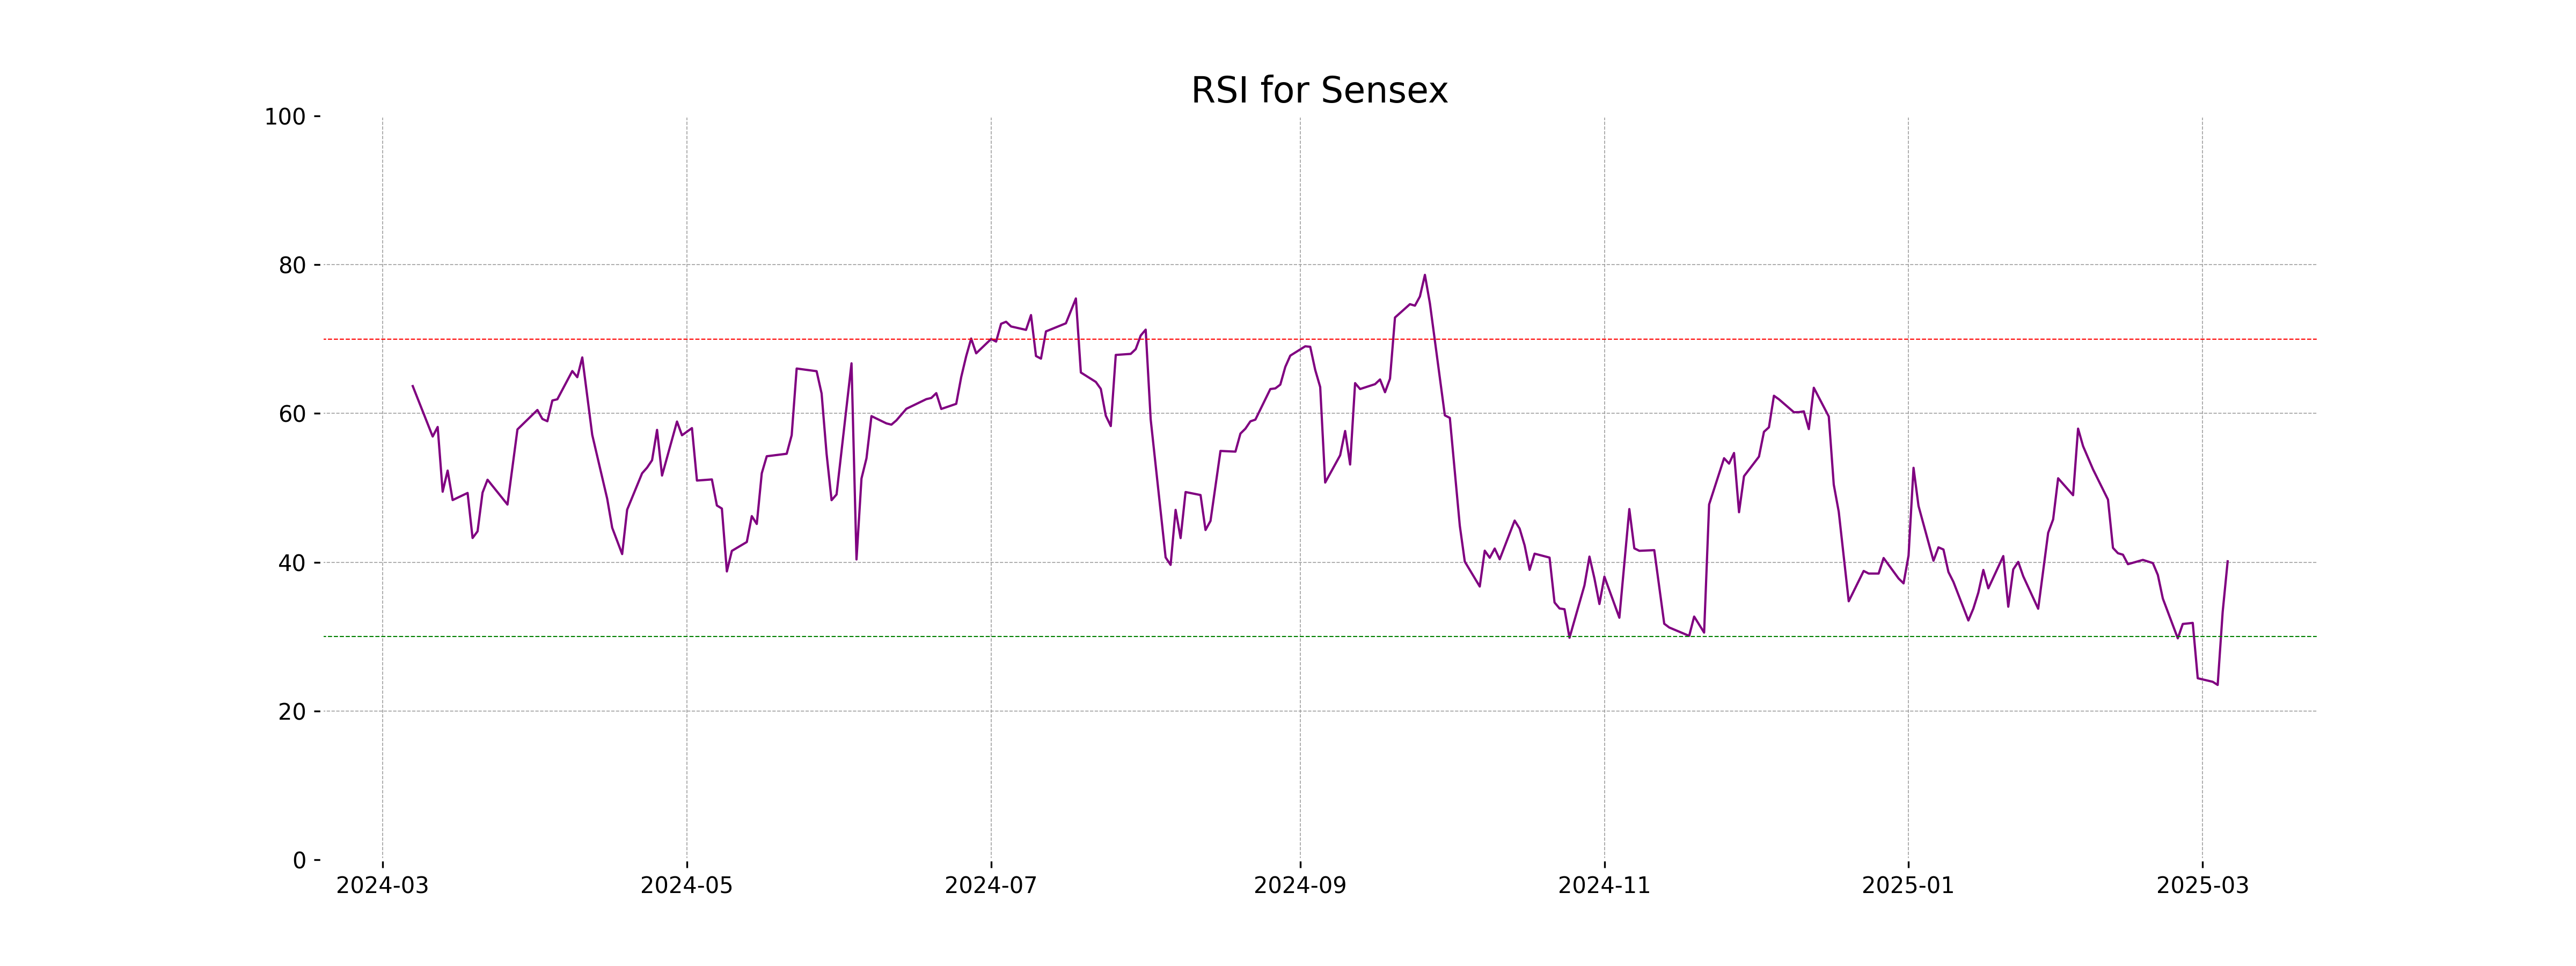
RSI Analysis
The RSI for Sensex is 40.12, indicating that the stock is neither overbought nor oversold, suggesting neutrality in momentum. An RSI below 50 typically signals bearish momentum, which may indicate potential for downward movement unless it trends upward past the mid-level.
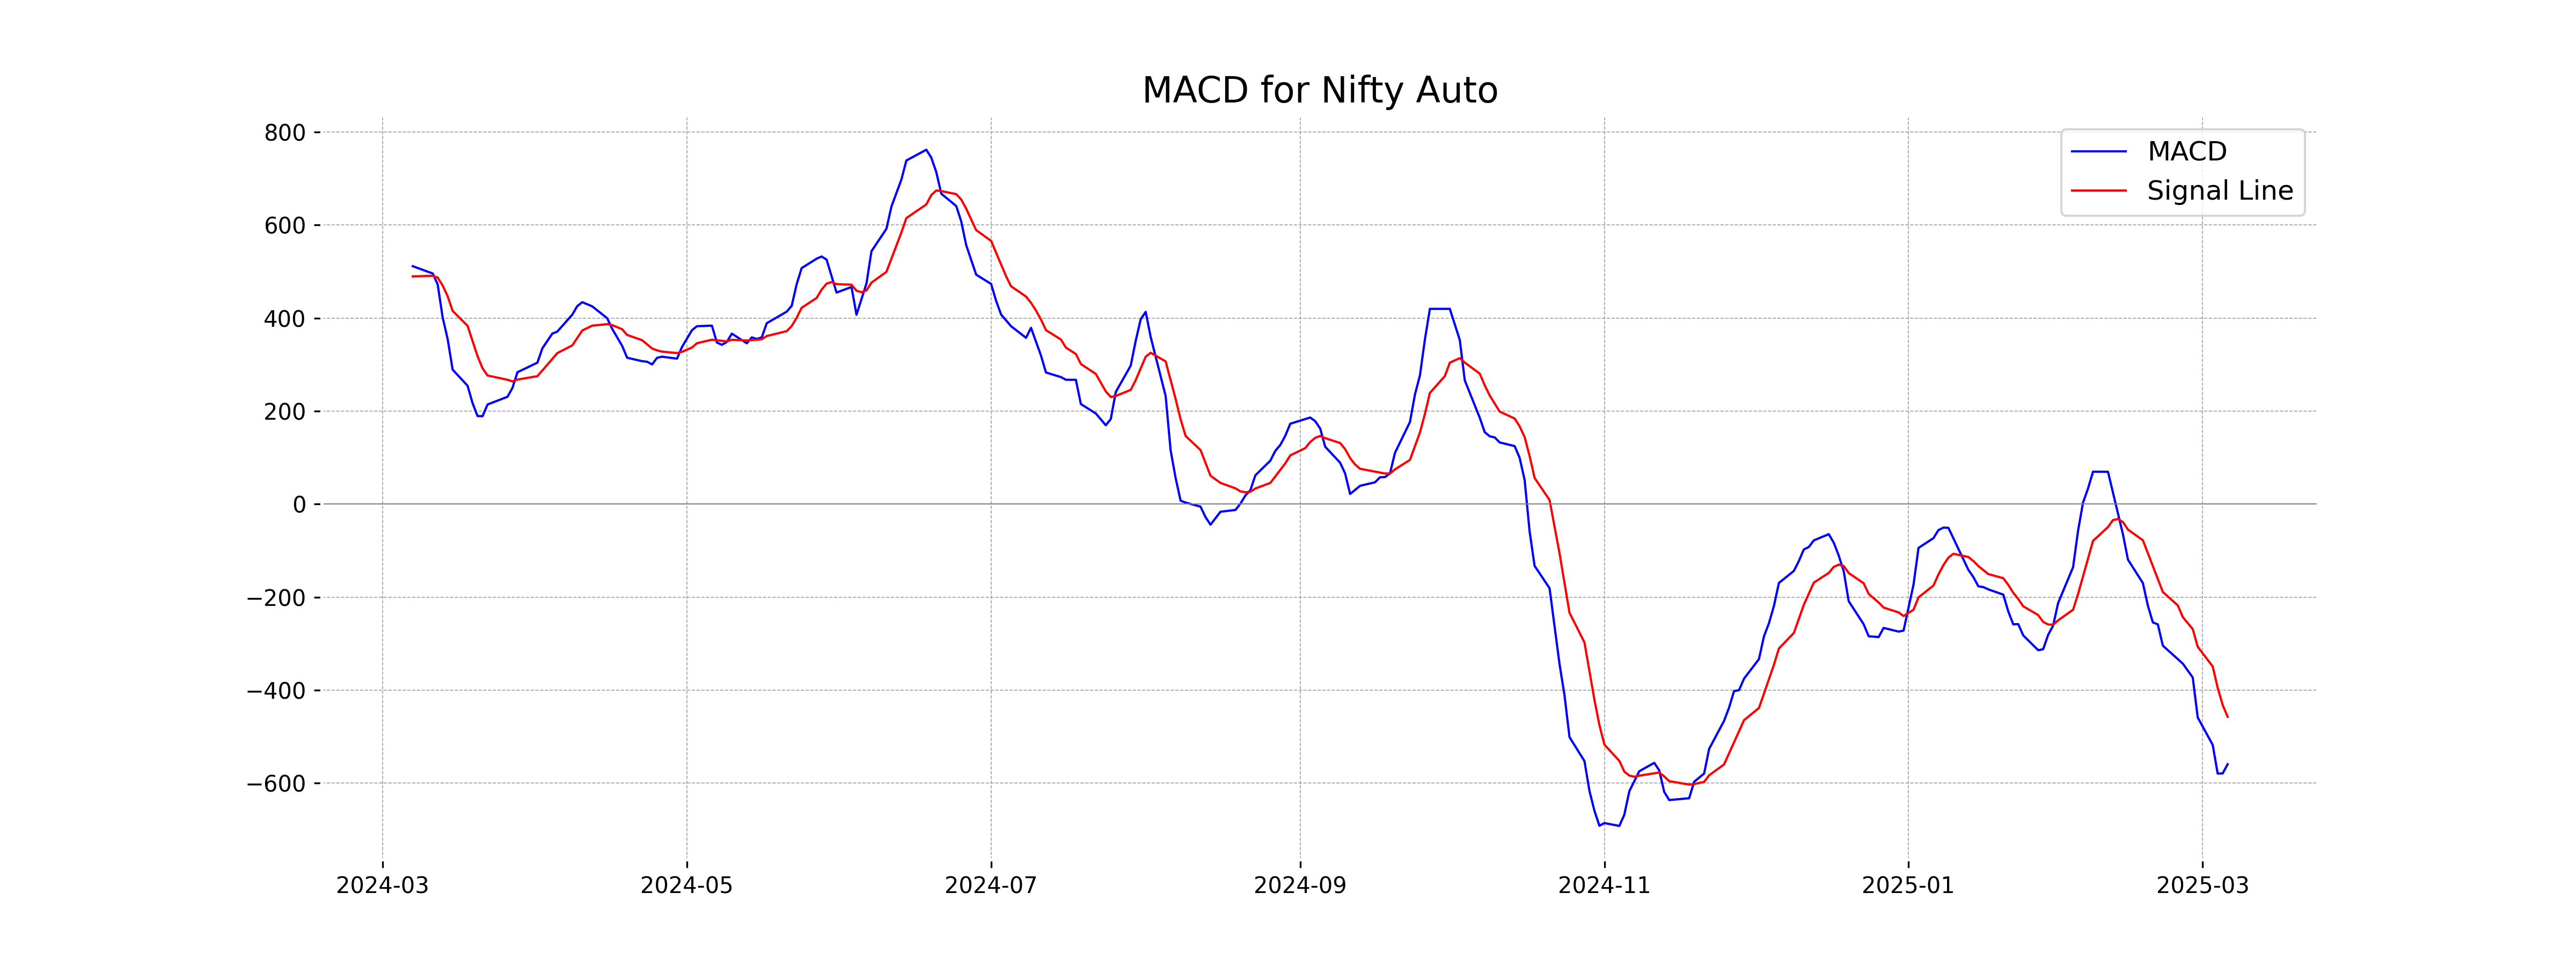
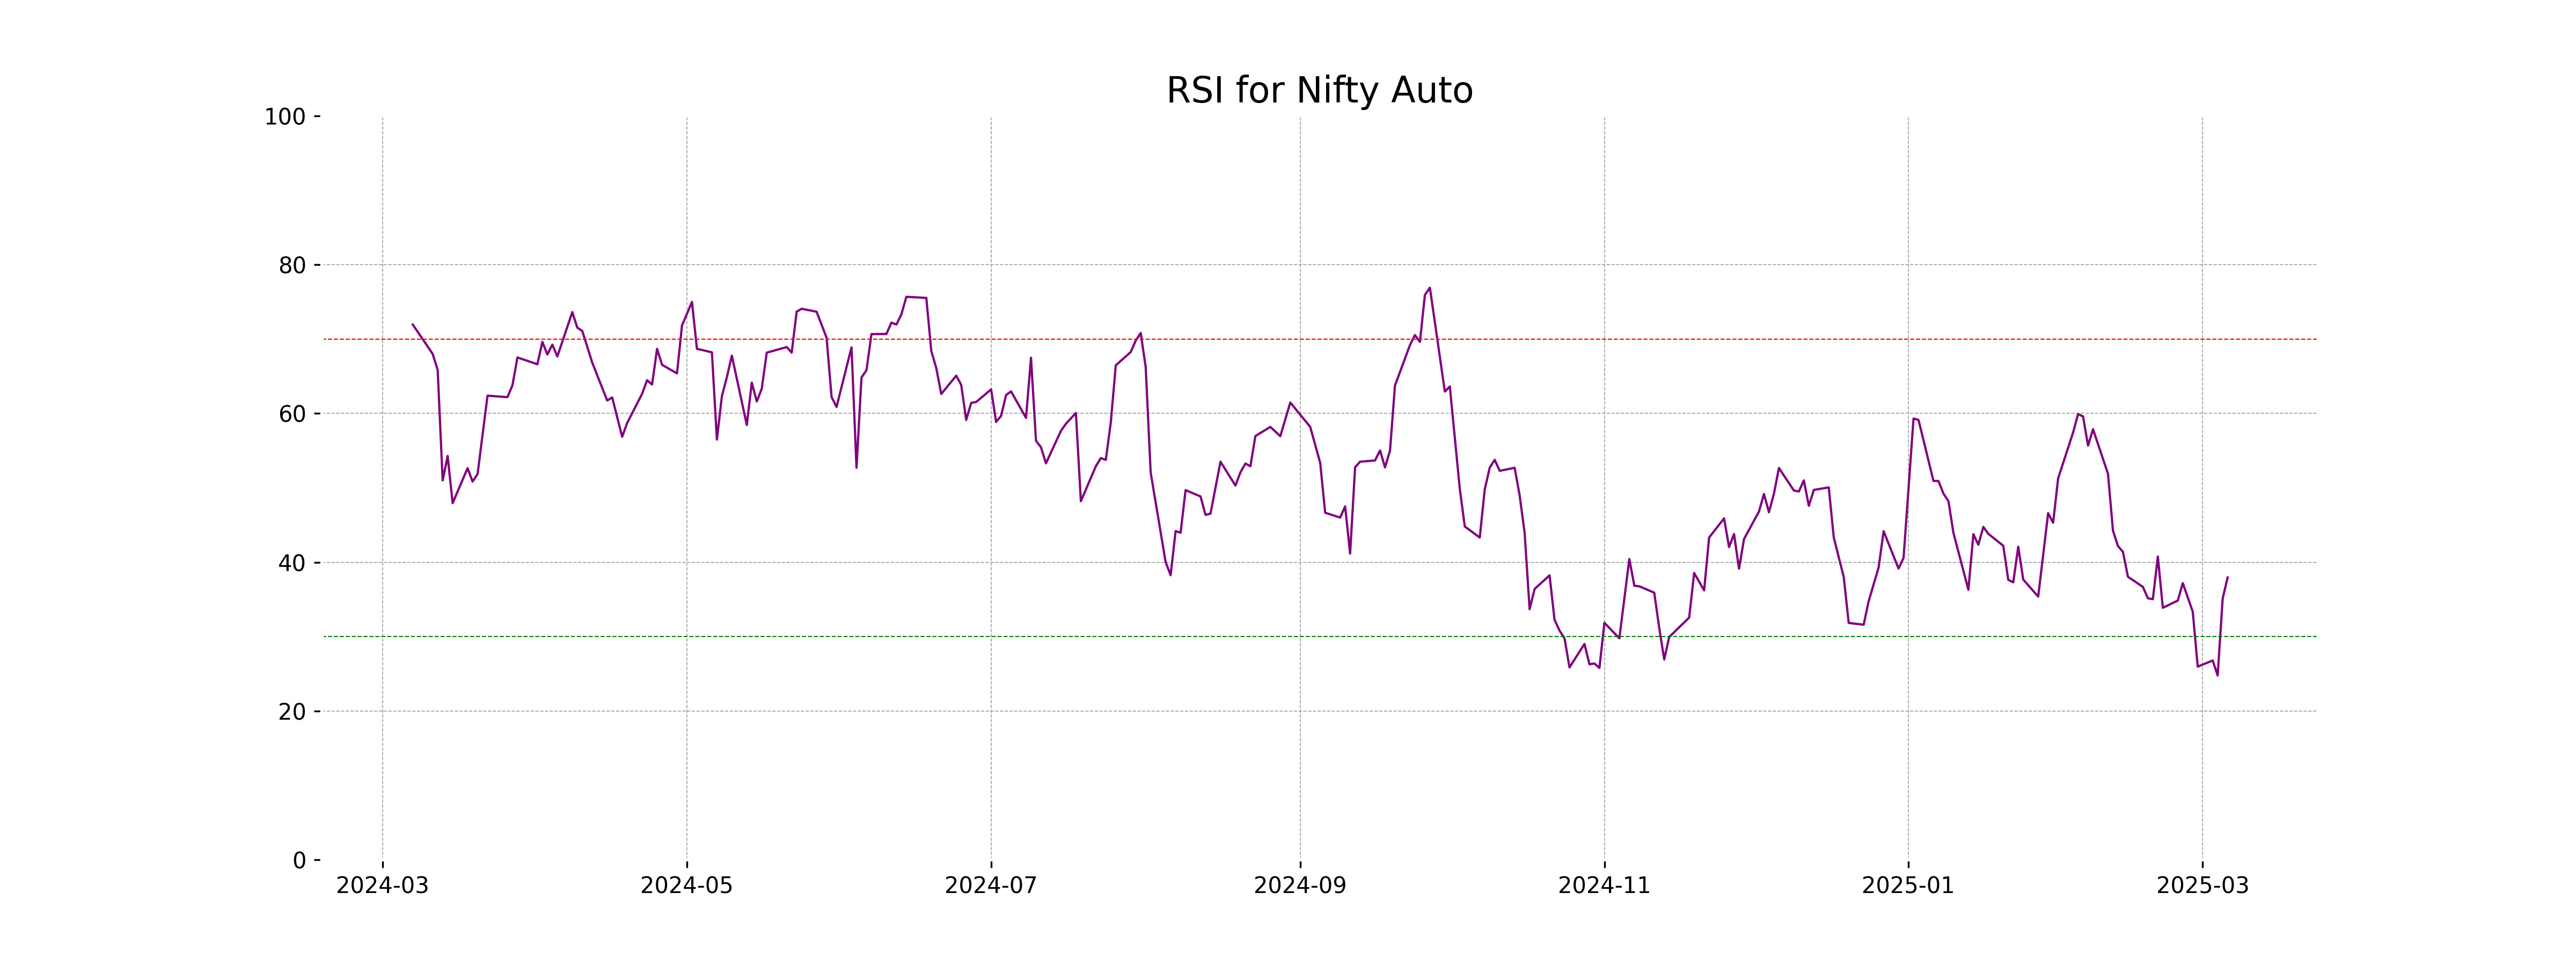
Analysis for Nifty Auto - March 06, 2025
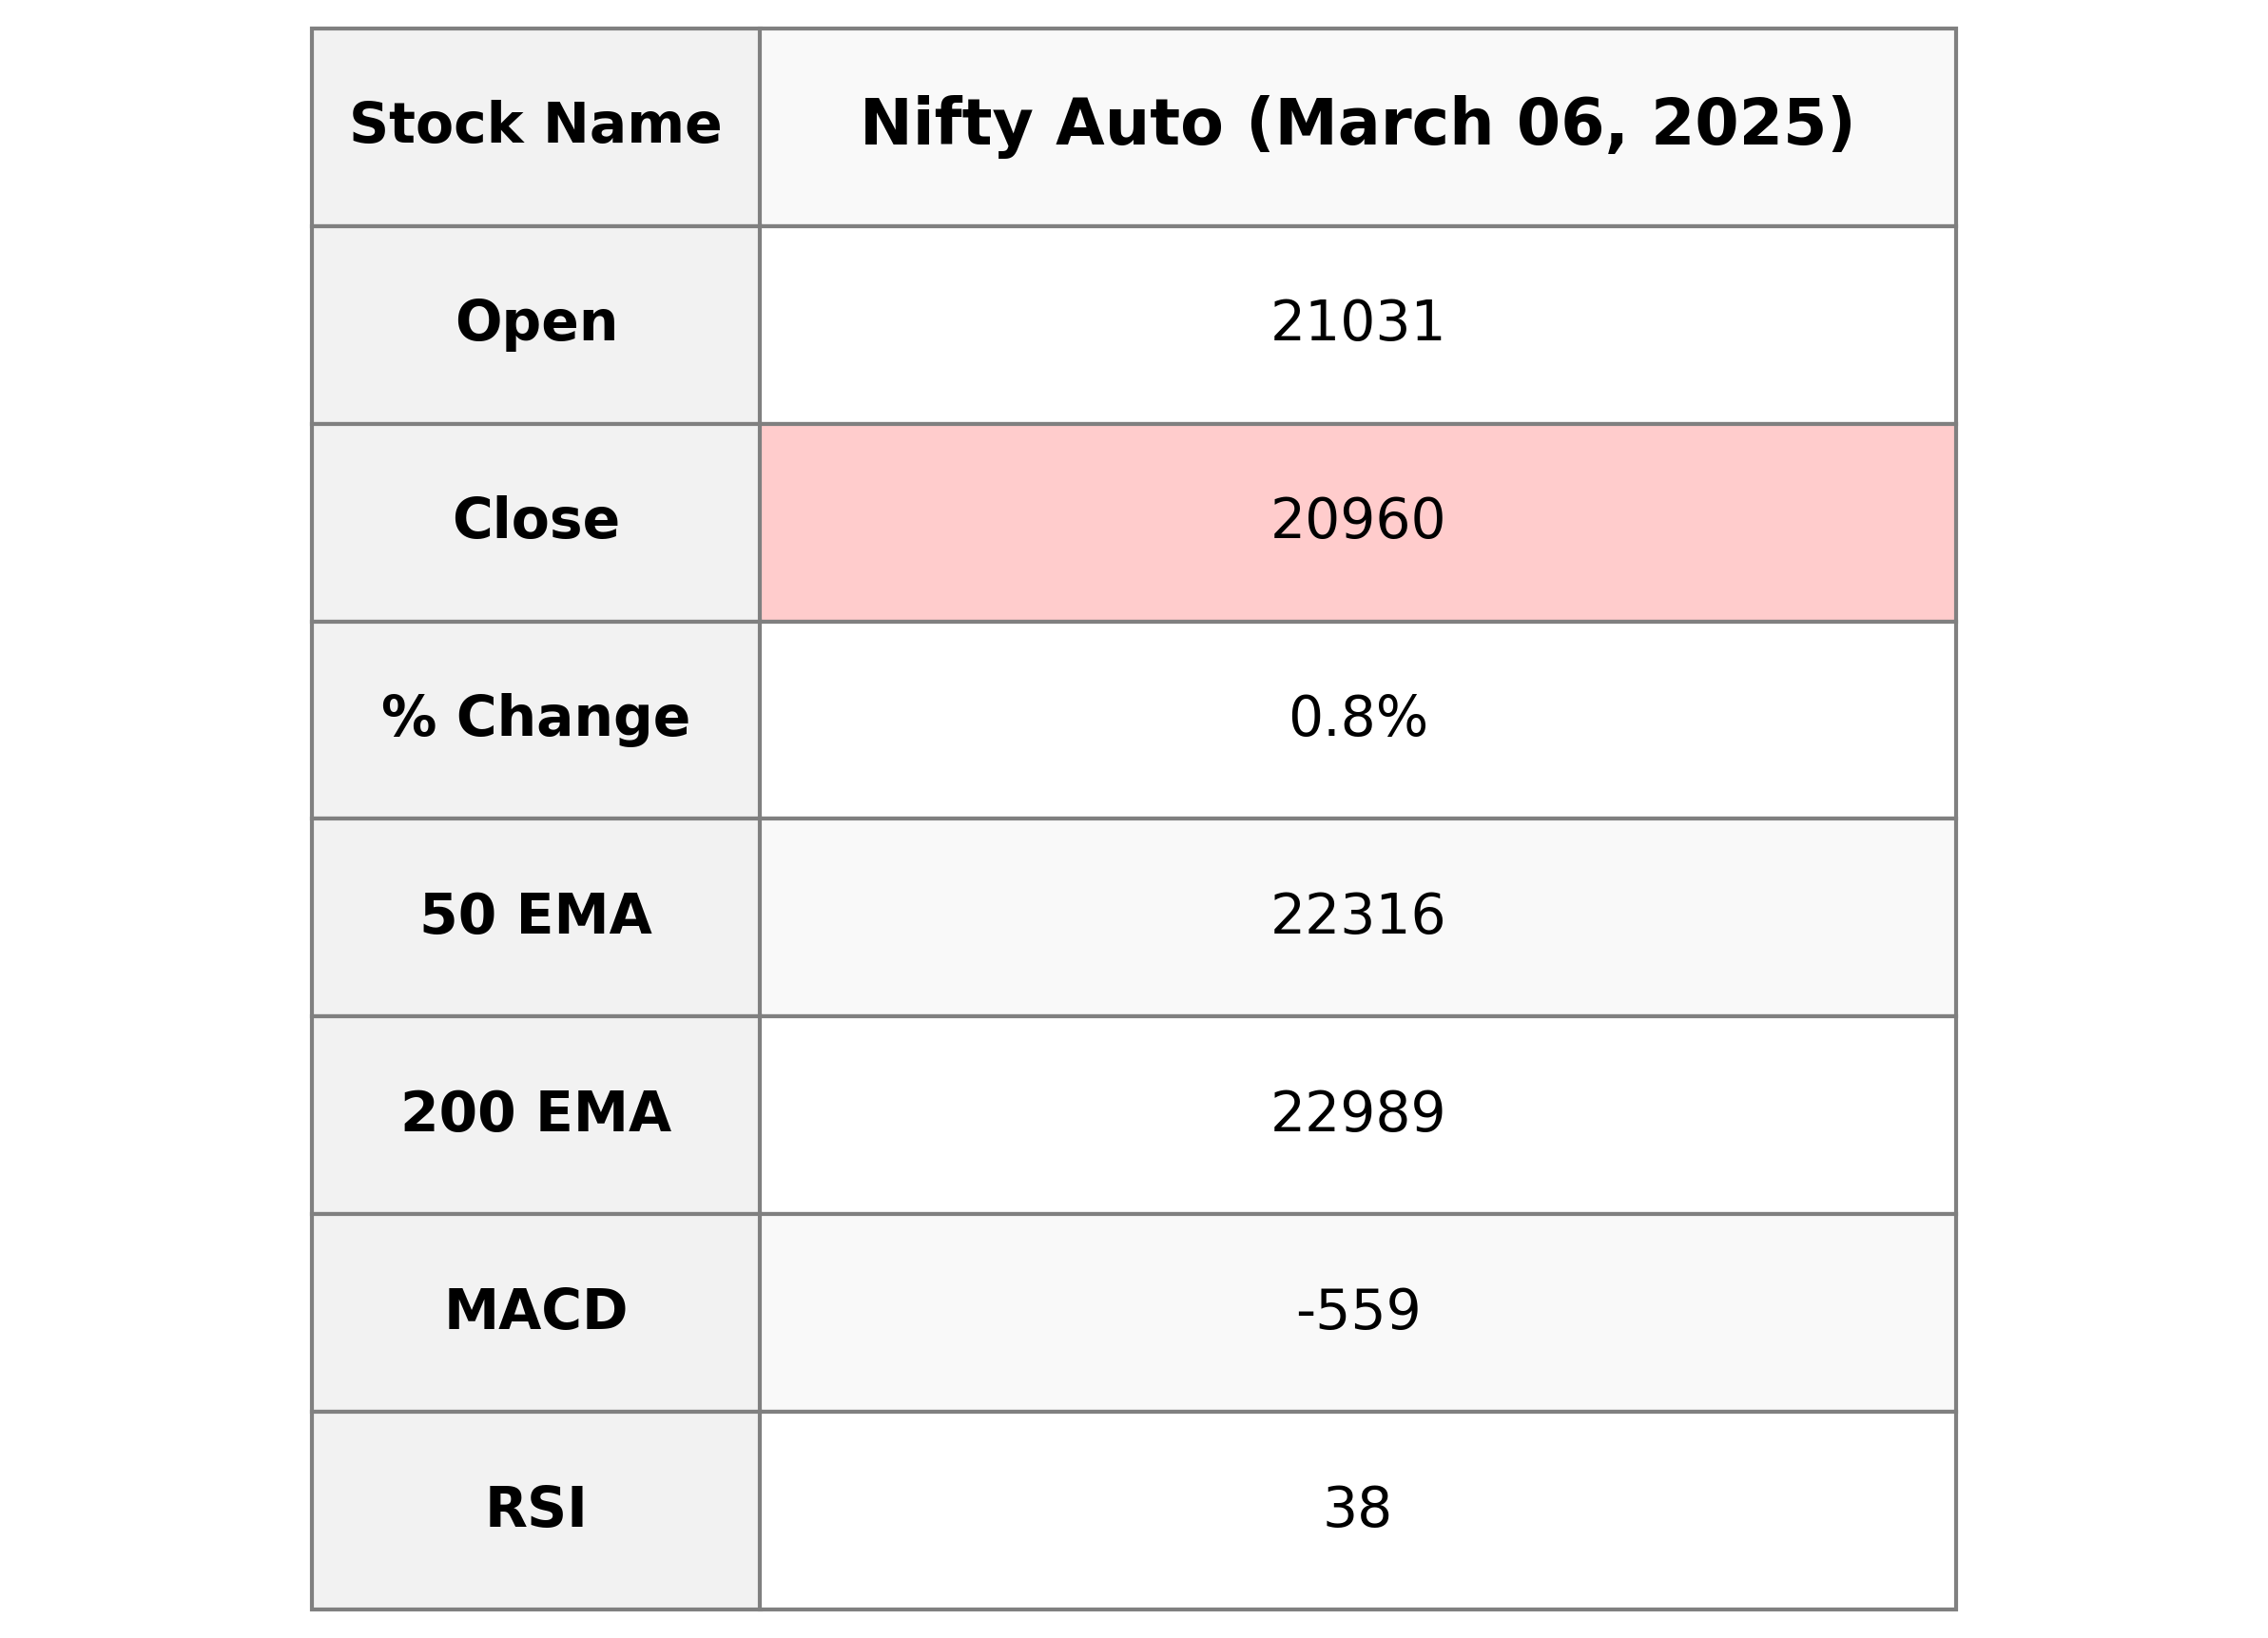
### Nifty Auto Performance The Nifty Auto index opened at 21,030.70 and closed at 20,959.70, showing a positive change of 0.78% with a point increase of approximately 162.95. Despite the recent gain, the RSI at 37.95 suggests the index is nearing an oversold condition. The negative MACD value indicates a continuing downtrend, though the index is trading below both its 50 and 200 EMA, reflecting a bearish trend.
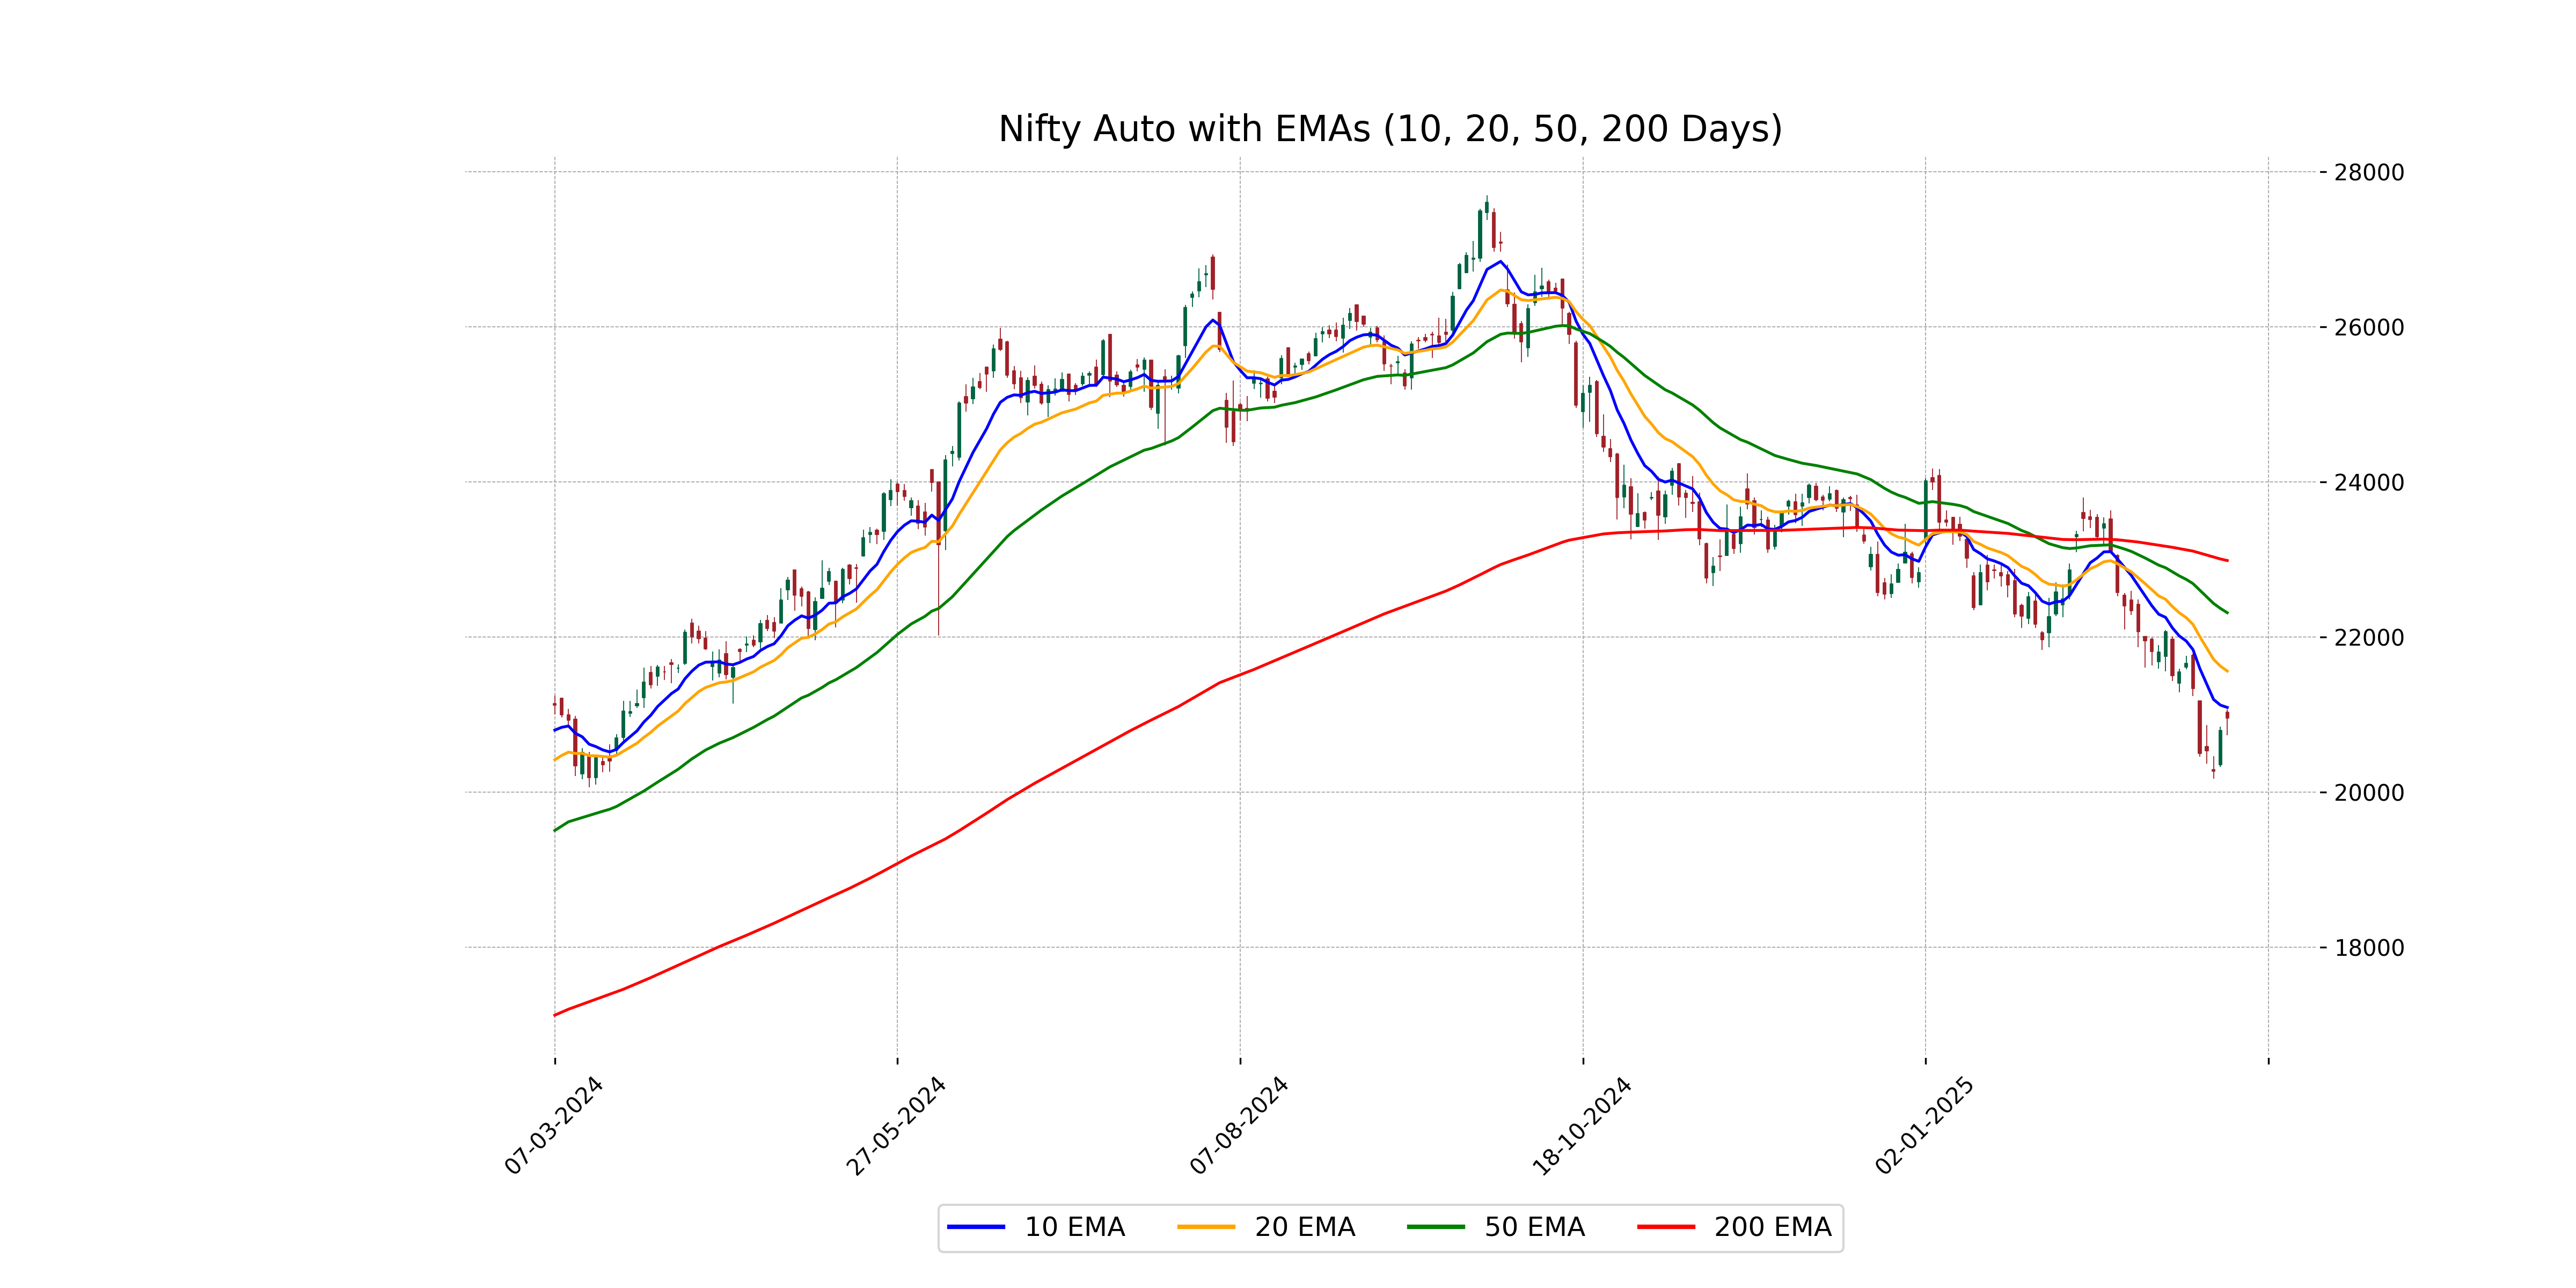
Relationship with Key Moving Averages
The closing price of Nifty Auto is 20959.70, which is below the 50-day EMA of 22316.22 and the 200-day EMA of 22988.96, indicating a bearish trend. It is close to the 10-day EMA of 21094.70, suggesting potential short-term resistance around this level.
Moving Averages Trend (MACD)
Nifty Auto's MACD value is -559.46, which is below its MACD Signal of -457.52. This negative MACD indicates a bearish trend as the MACD line is below the signal line, suggesting potential downward momentum in the stock market.
RSI Analysis
The RSI (Relative Strength Index) for Nifty Auto is 37.95, which indicates that the stock may be approaching oversold territory, as RSI values below 30 generally suggest this. However, since it is above 30, it may not yet confirm an oversold condition, but it is getting close. This could signal a potential opportunity for a bullish reversal if buyers step in.
Analysis for Nifty Energy - March 06, 2025
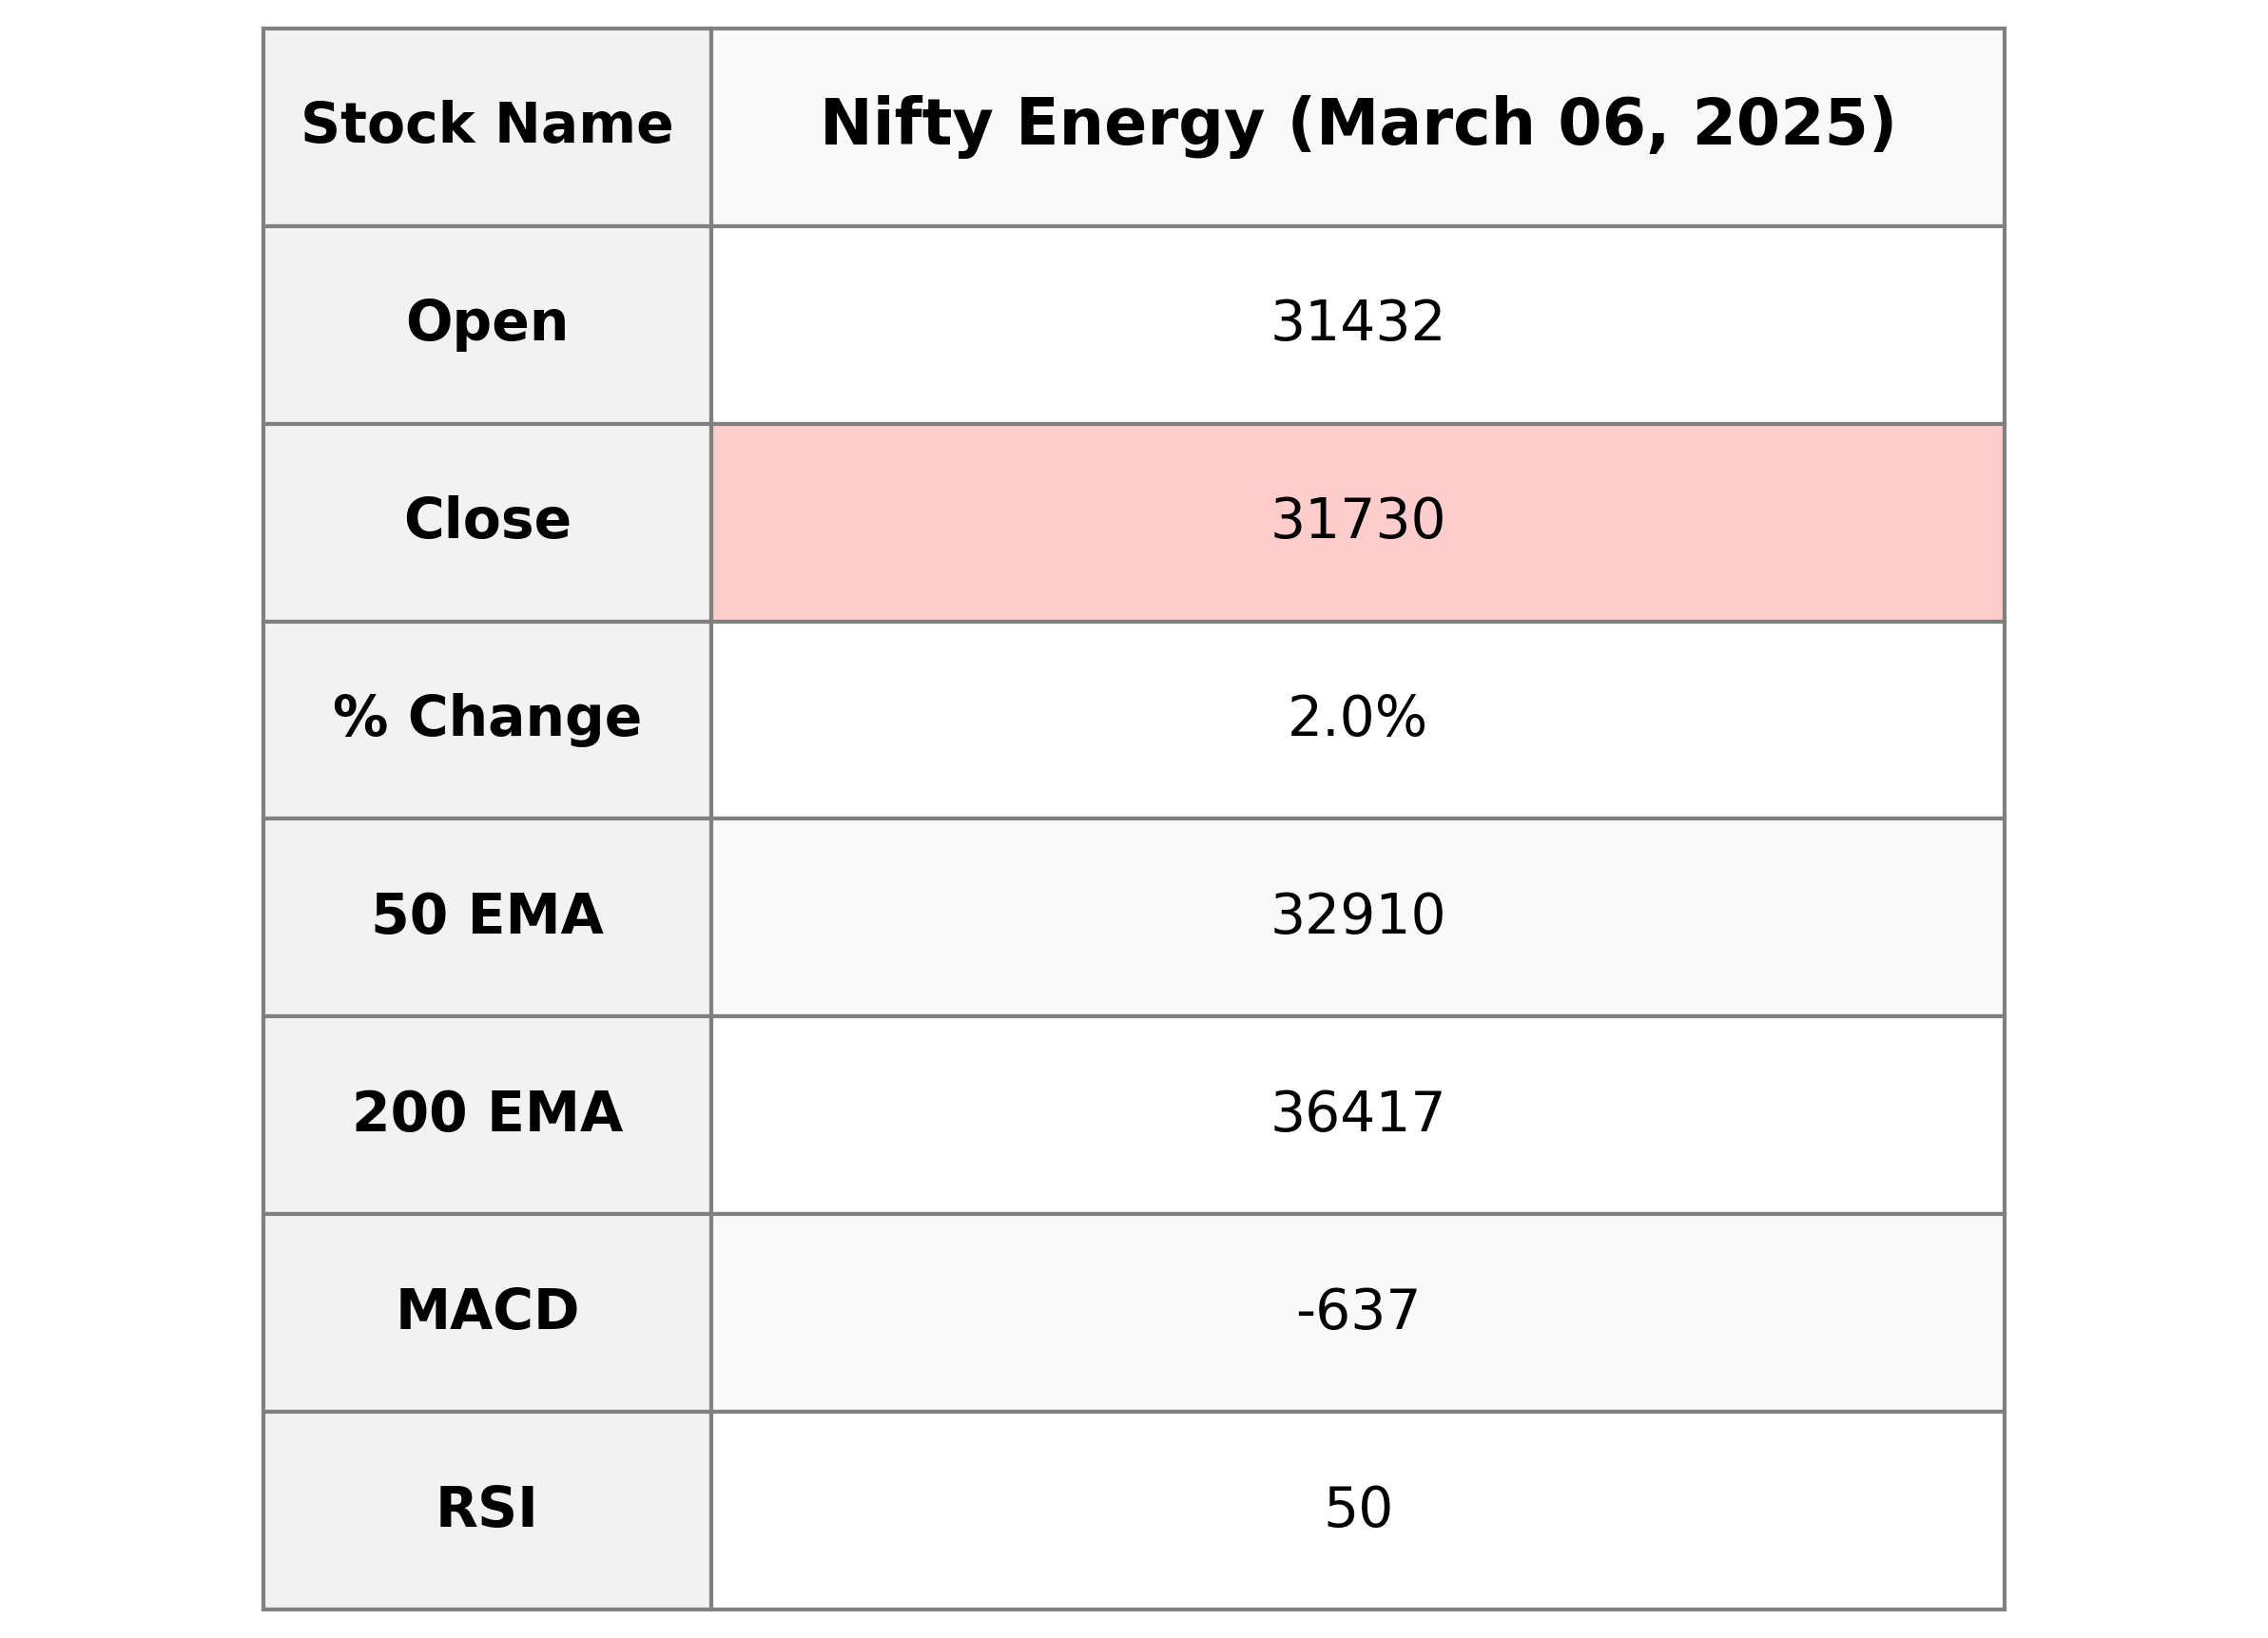
Nifty Energy Performance: Nifty Energy opened at 31,431.80, reached a high of 31,782.55, and closed at 31,729.85. The index experienced a 2.03% increase from the previous close, with a points change of 630.40. The current Relative Strength Index (RSI) is at 50.11, indicating a neutral momentum, while the MACD value suggests a recovering trend.
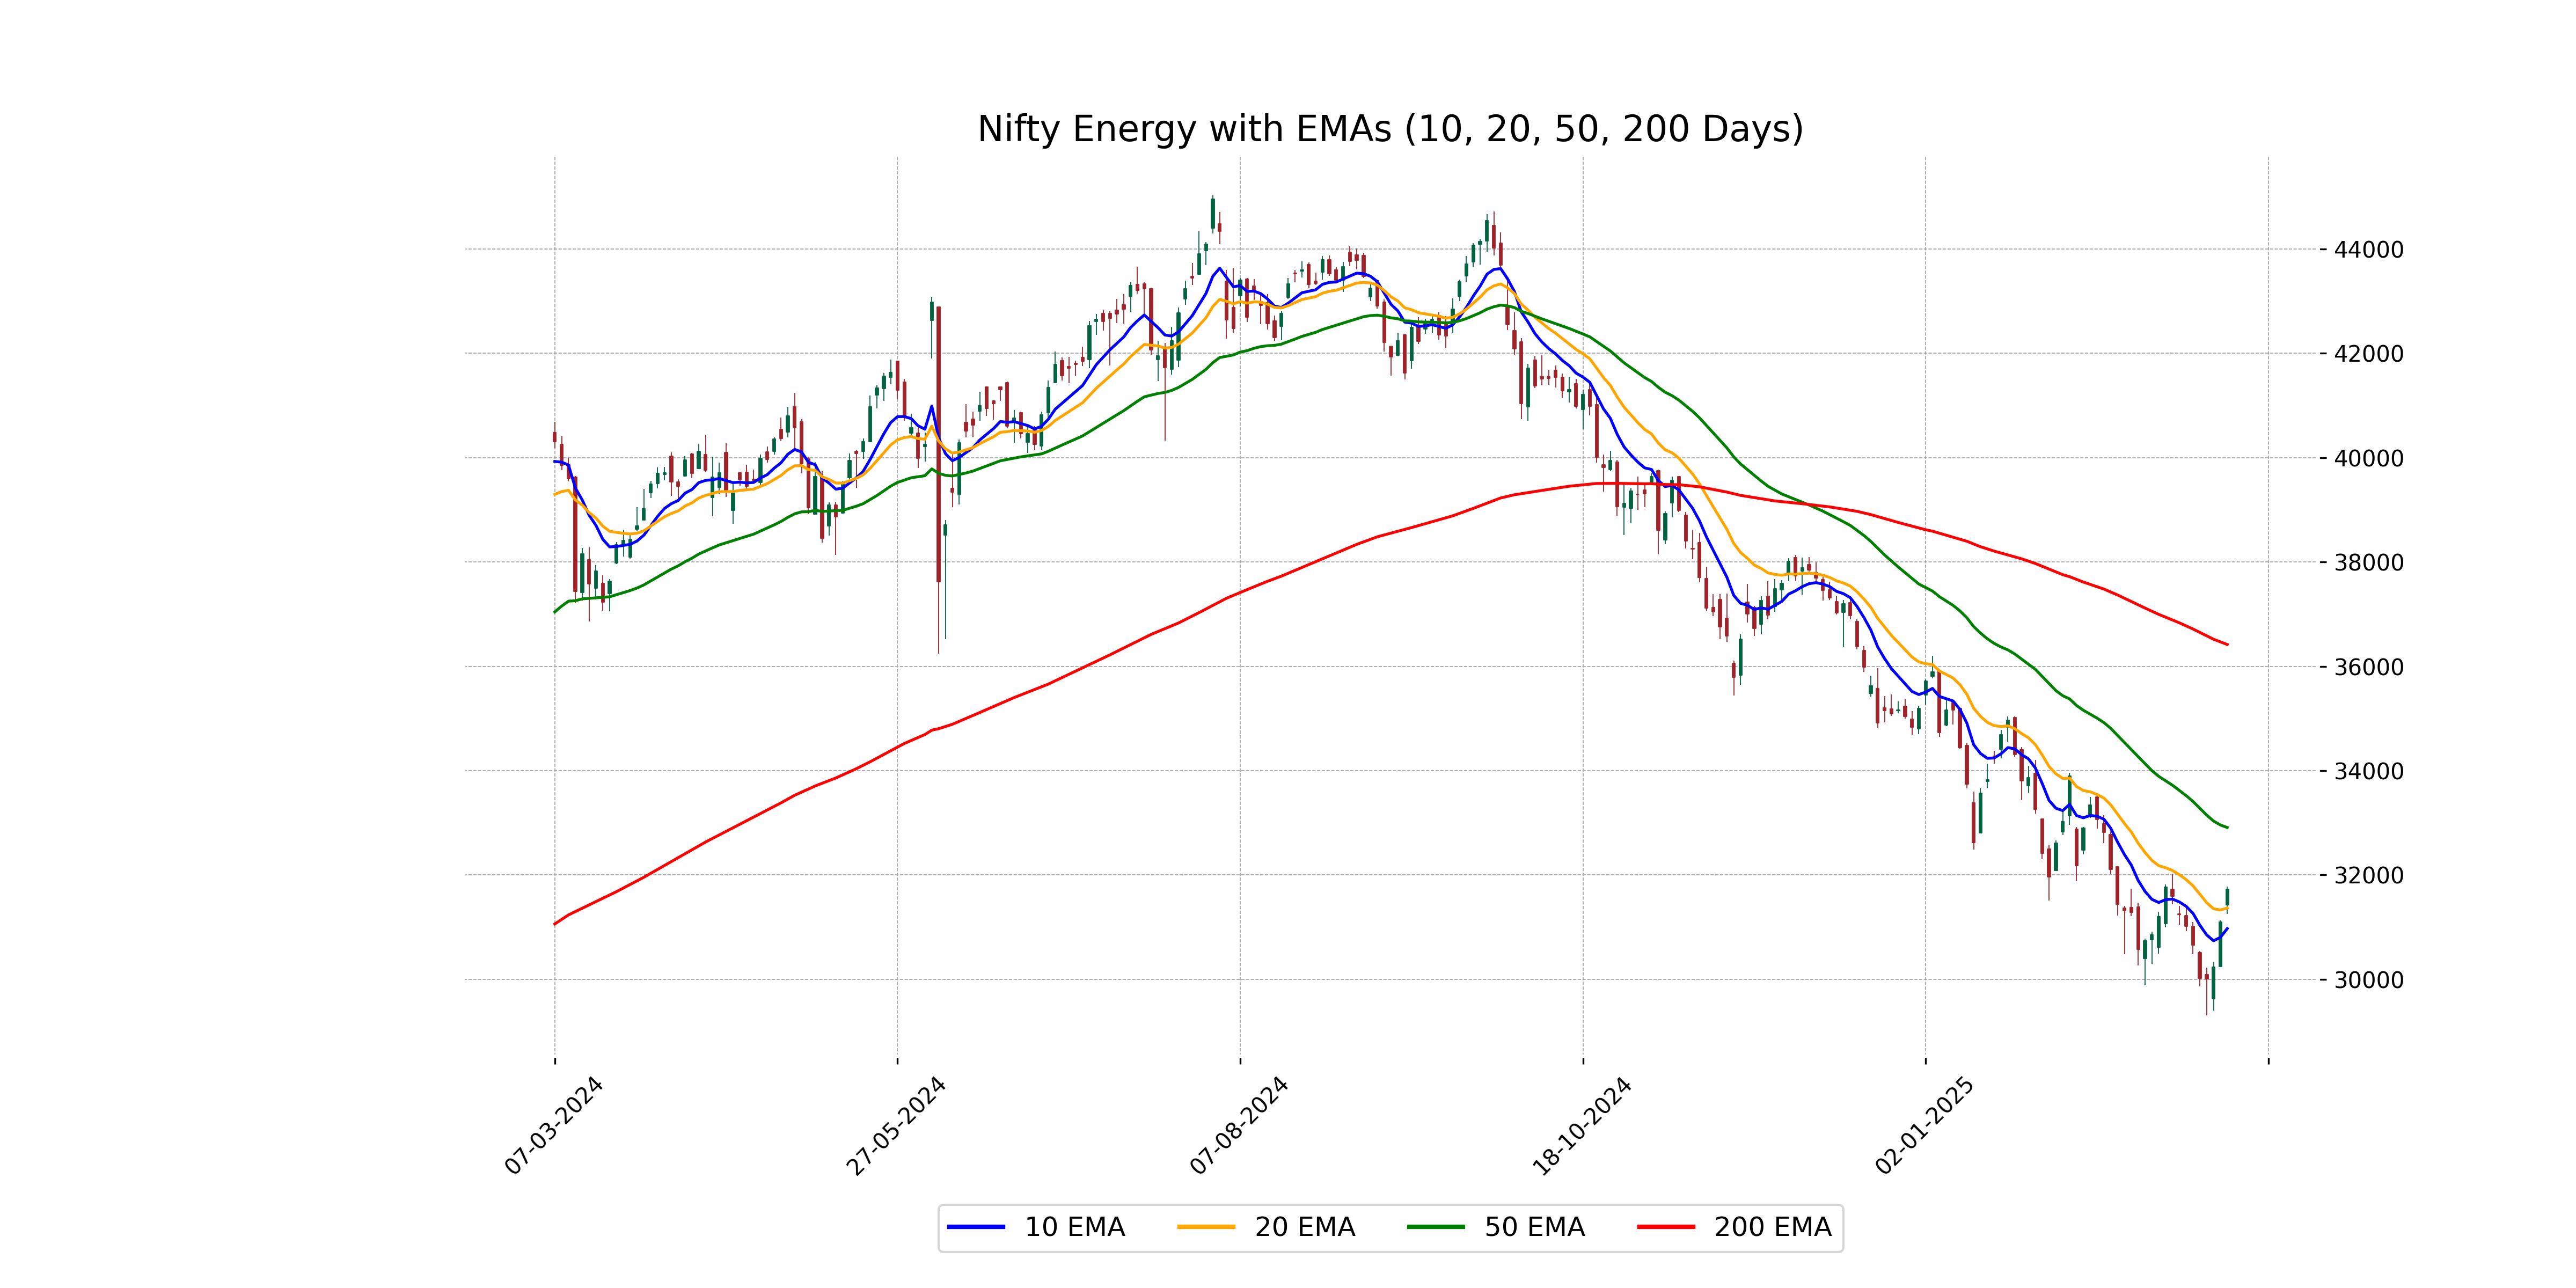
Relationship with Key Moving Averages
The closing price of Nifty Energy, which is 31729.85, is below its 50 EMA at 32909.87 and 200 EMA at 36417.39, indicating a bearish trend in the longer term. However, the closing price is above the 10 EMA at 30973.19 and 20 EMA at 31366.83, suggesting potential short-term bullish momentum.
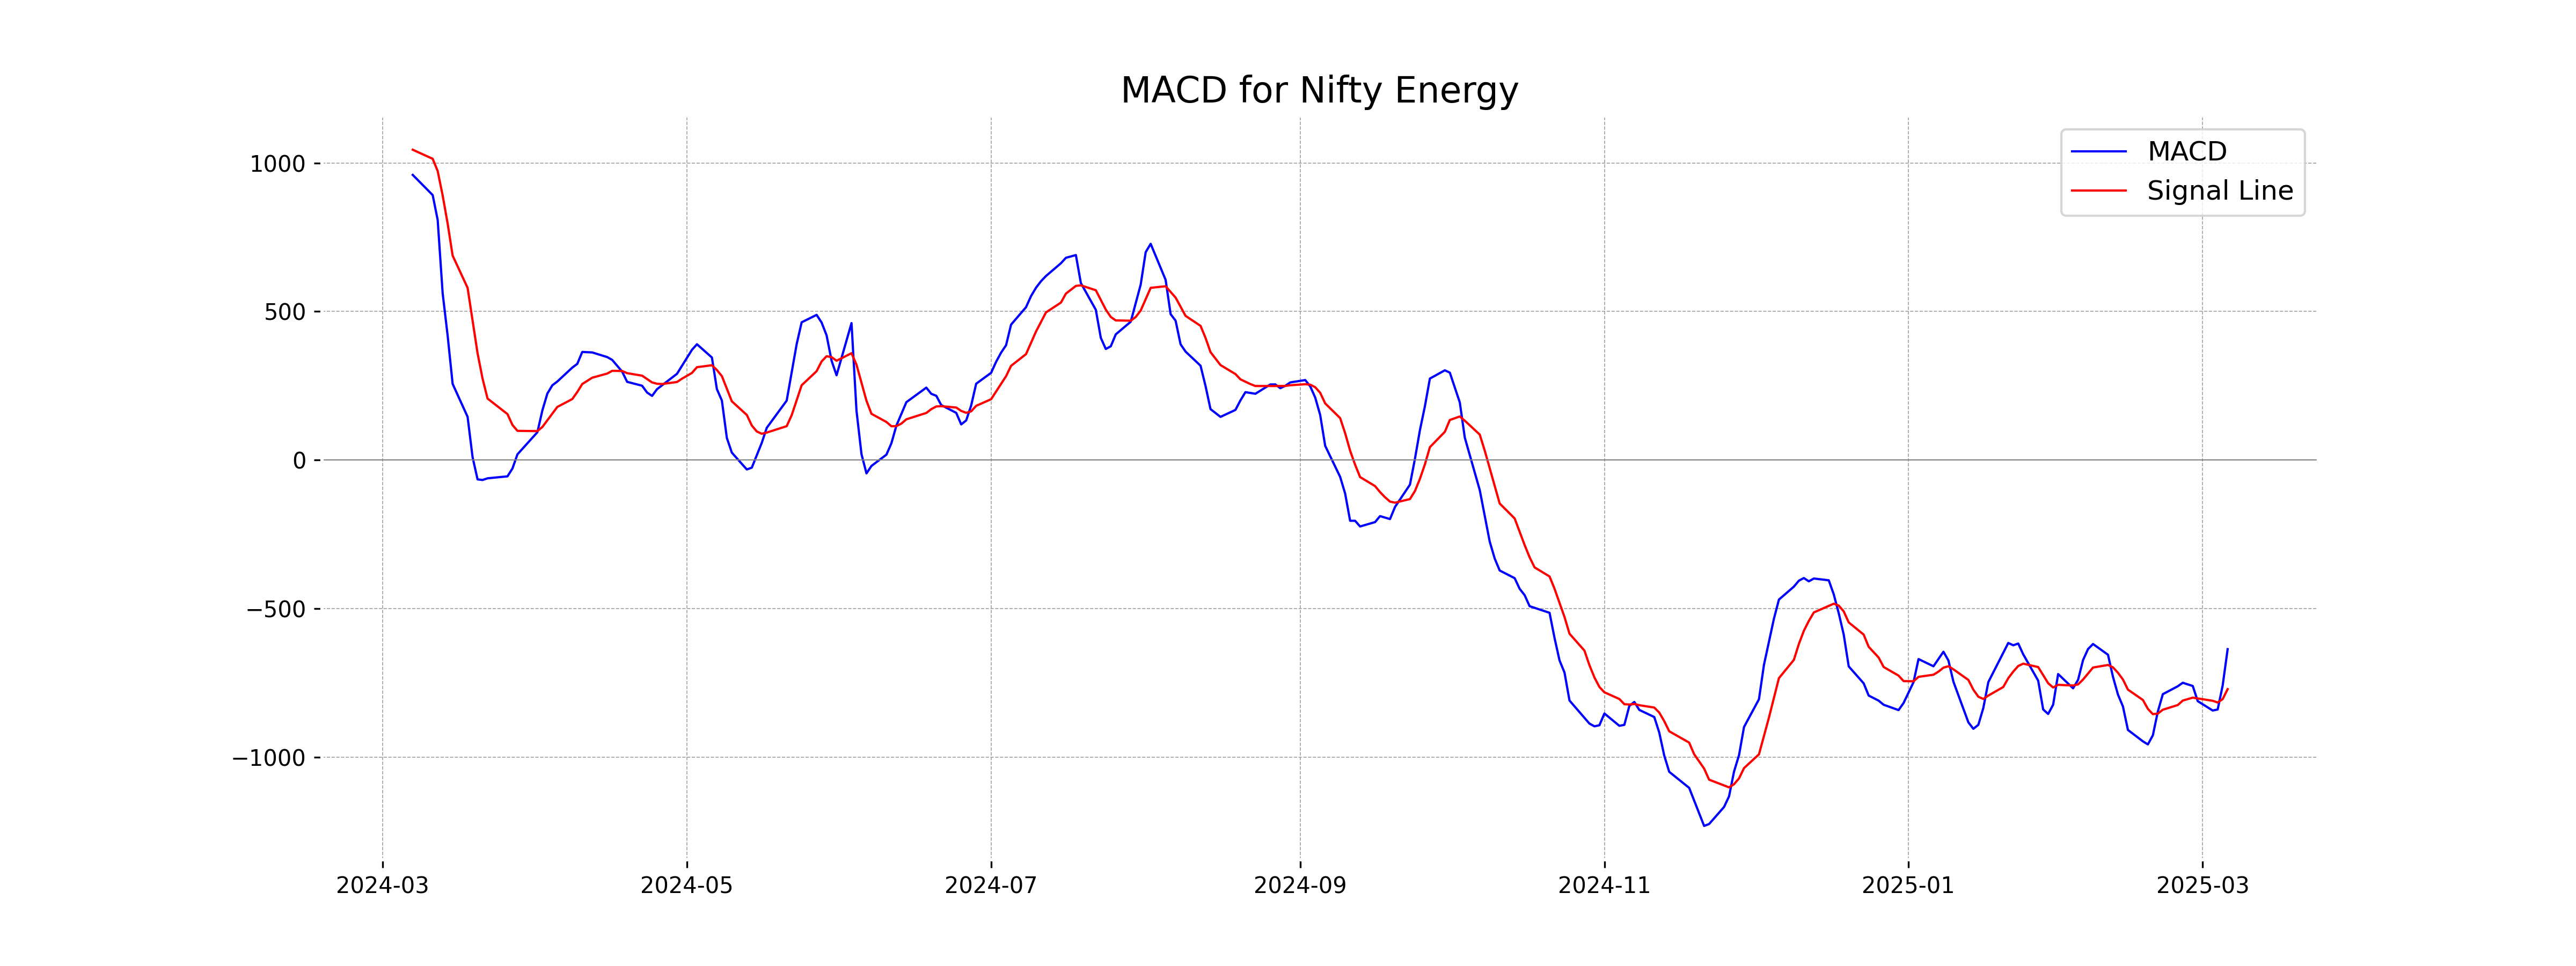
Moving Averages Trend (MACD)
The MACD value for Nifty Energy is -636.75, while the MACD Signal is -771.29, indicating a positive divergence between the MACD line and its signal line. This suggests potential bullish momentum, as the MACD line is moving upwards relative to the signal line.
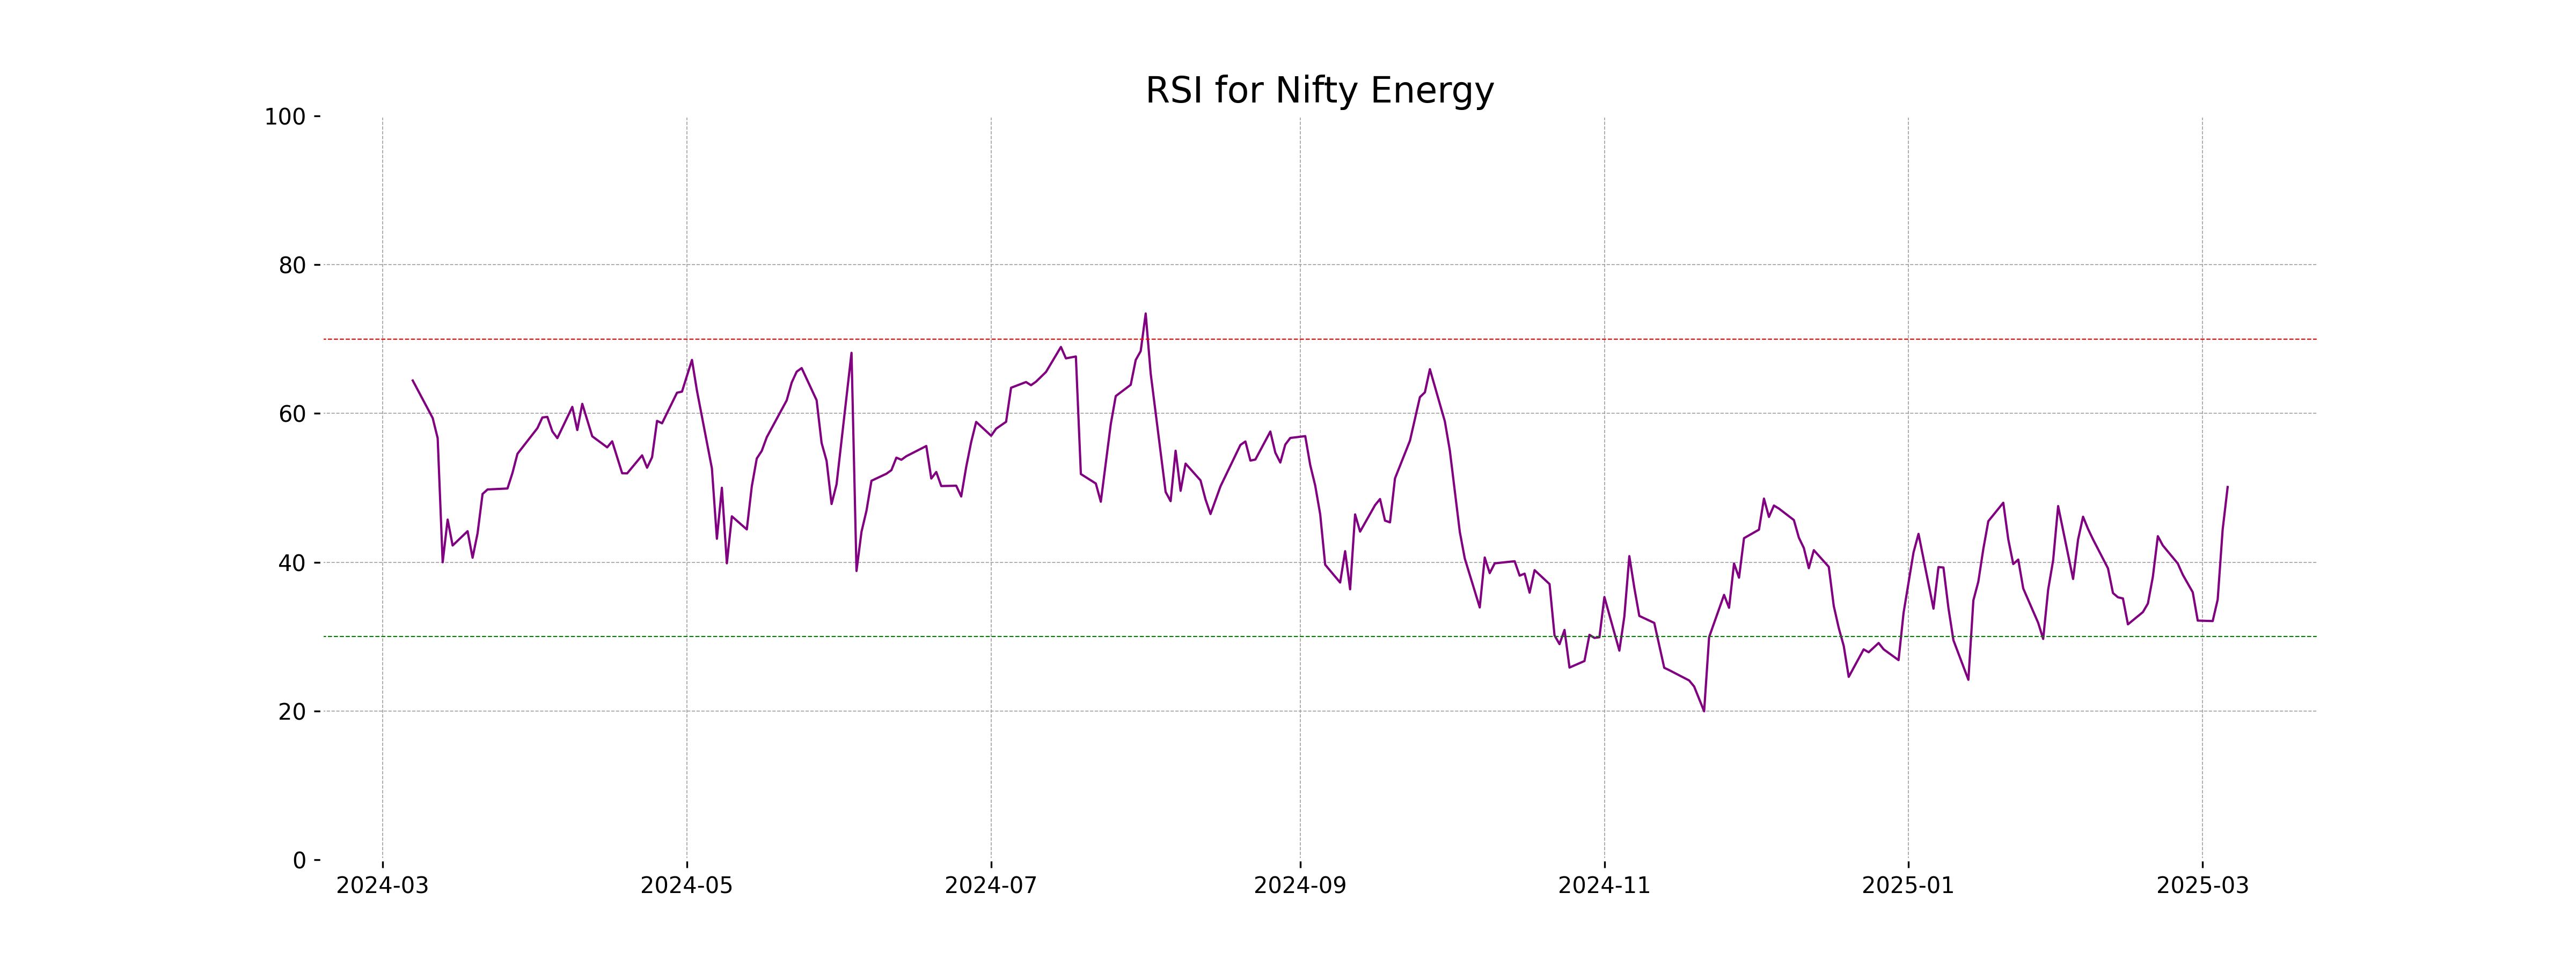
RSI Analysis
The Relative Strength Index (RSI) for Nifty Energy is 50.11, indicating that the stock is in a neutral zone. This suggests that the stock is neither overbought nor oversold, and there may not be a strong buying or selling pressure at this point.
Analysis for Nifty FMCG - March 06, 2025
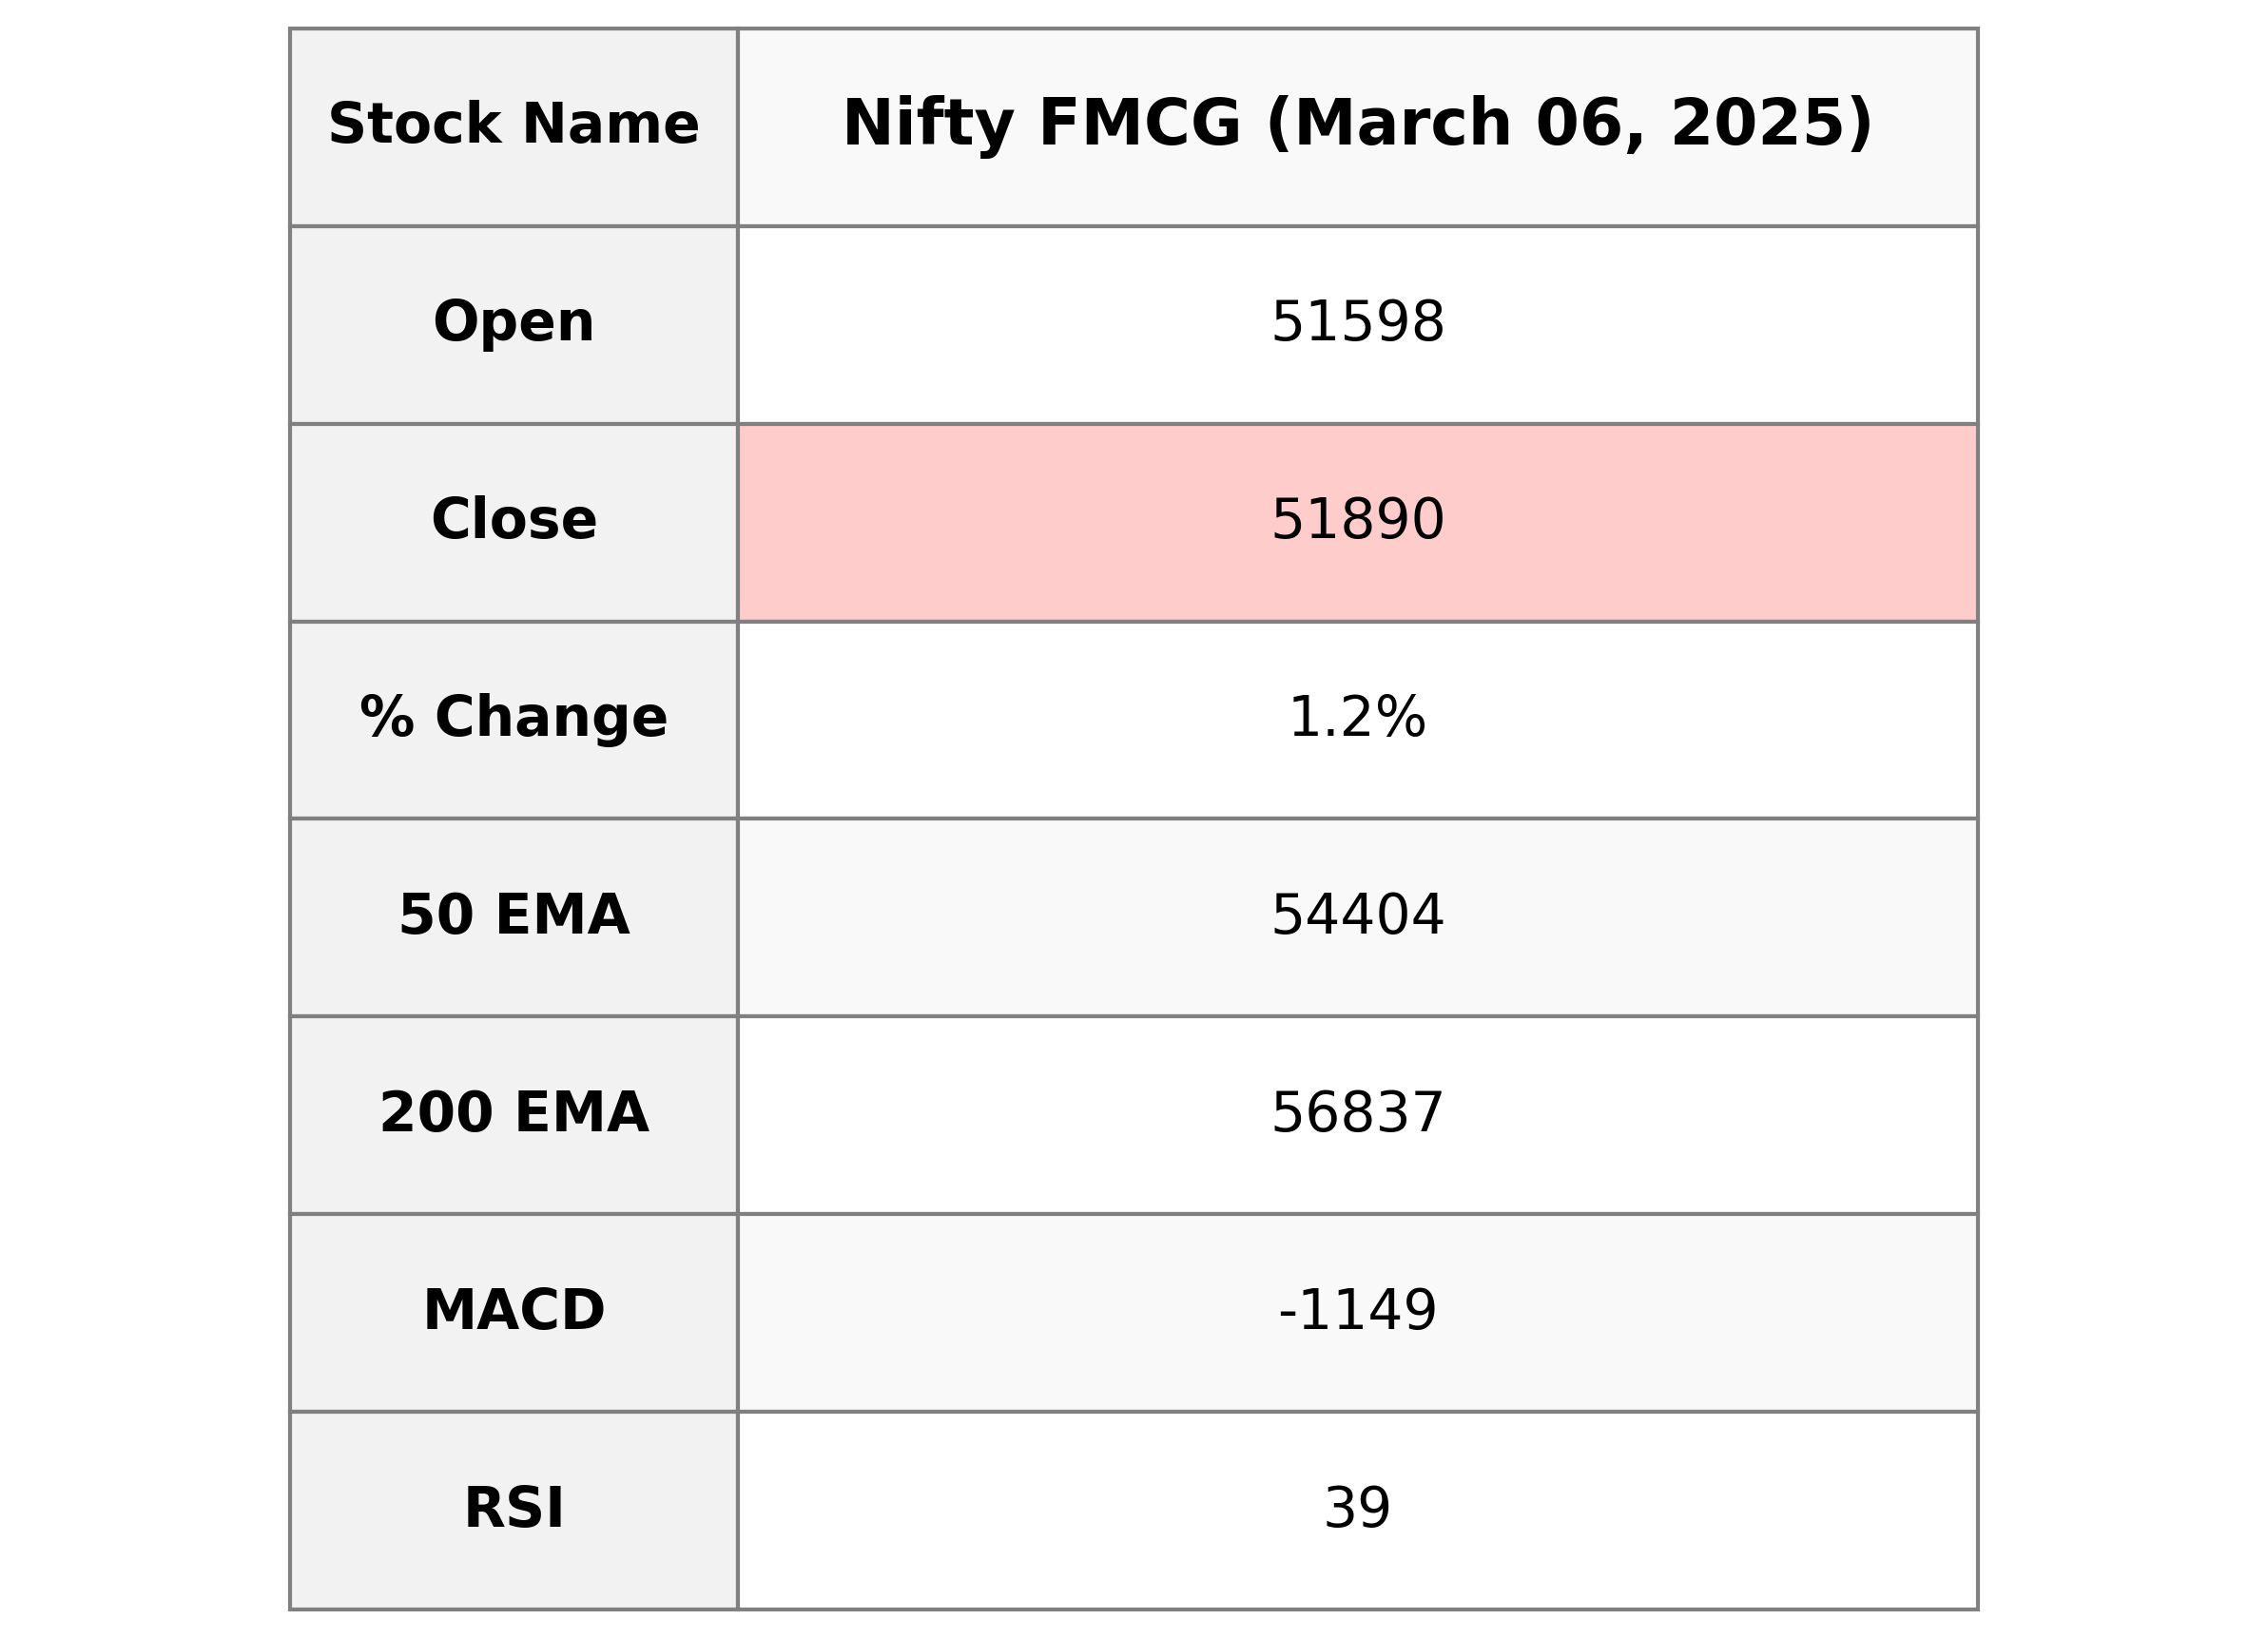
Nifty FMCG Performance Description: Nifty FMCG opened at 51,597.55 and closed at 51,890.30, marking a 1.19% increase with a points change of 611.20. The Relative Strength Index (RSI) is at 38.70, indicating weaker market conditions. The Moving Average Convergence Divergence (MACD) is negative at -1149.00, suggesting a bearish trend.
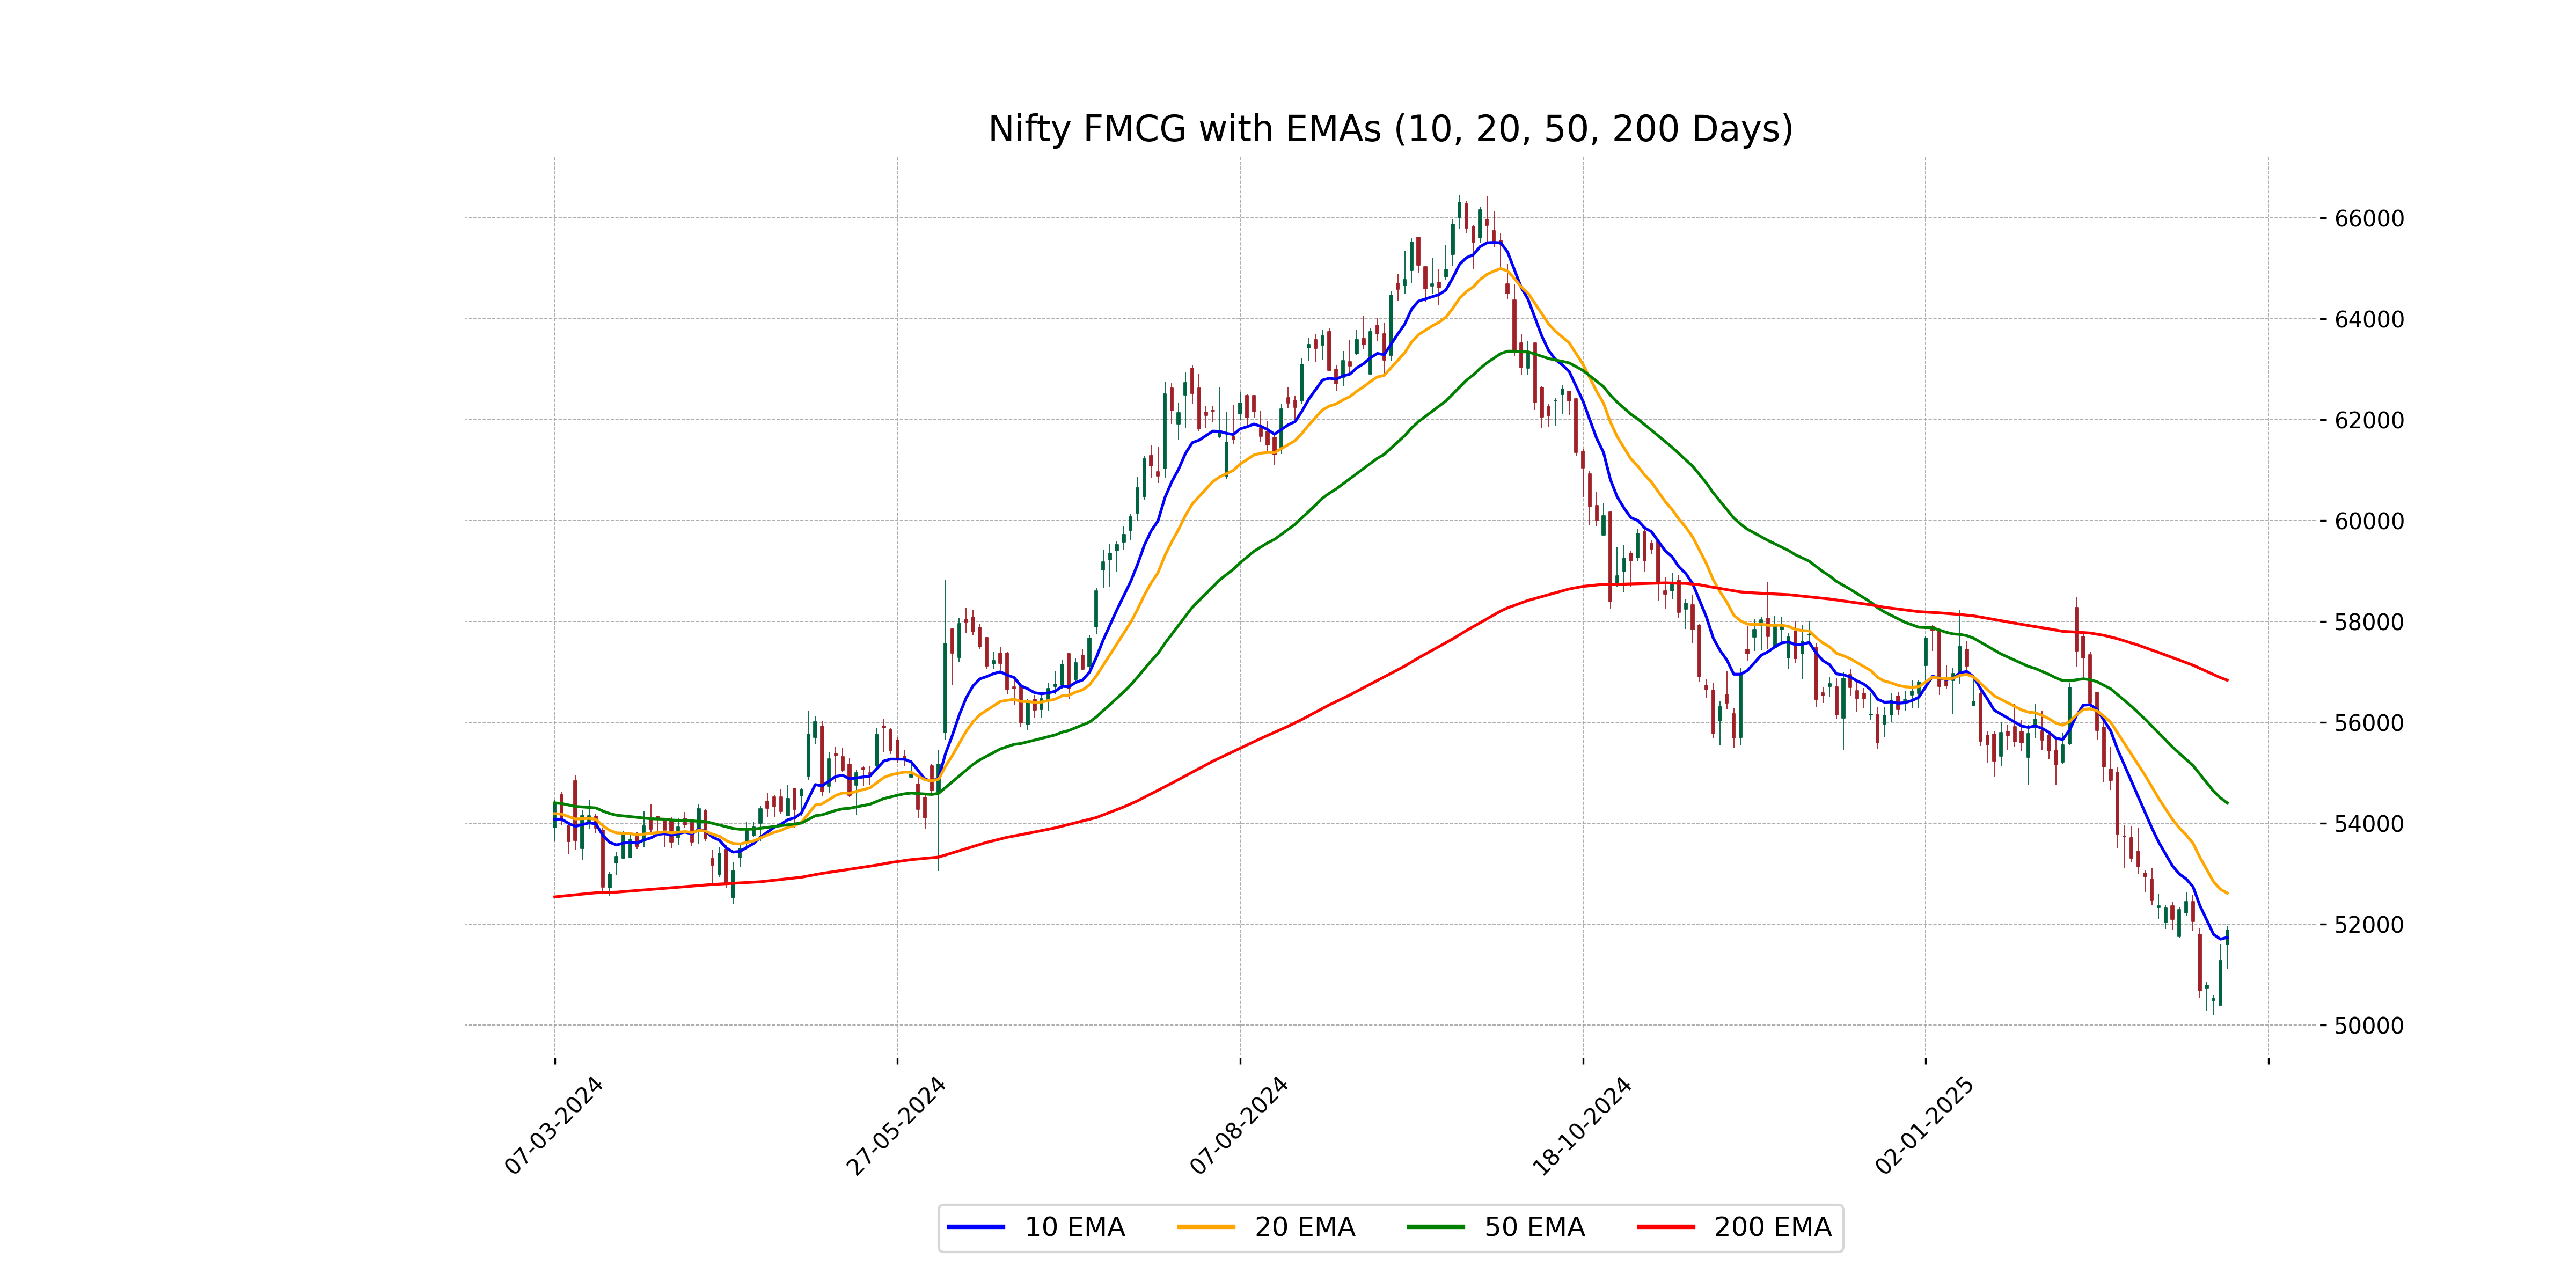
Relationship with Key Moving Averages
Based on the data provided, Nifty FMCG closed at 51890.30, which is above its 10 EMA of 51739.08, indicating a short-term bullish trend. However, it's still below the 20 EMA of 52617.42, 50 EMA of 54403.72, and considerably under the 200 EMA of 56836.65, suggesting a longer-term bearish pressure might persist.
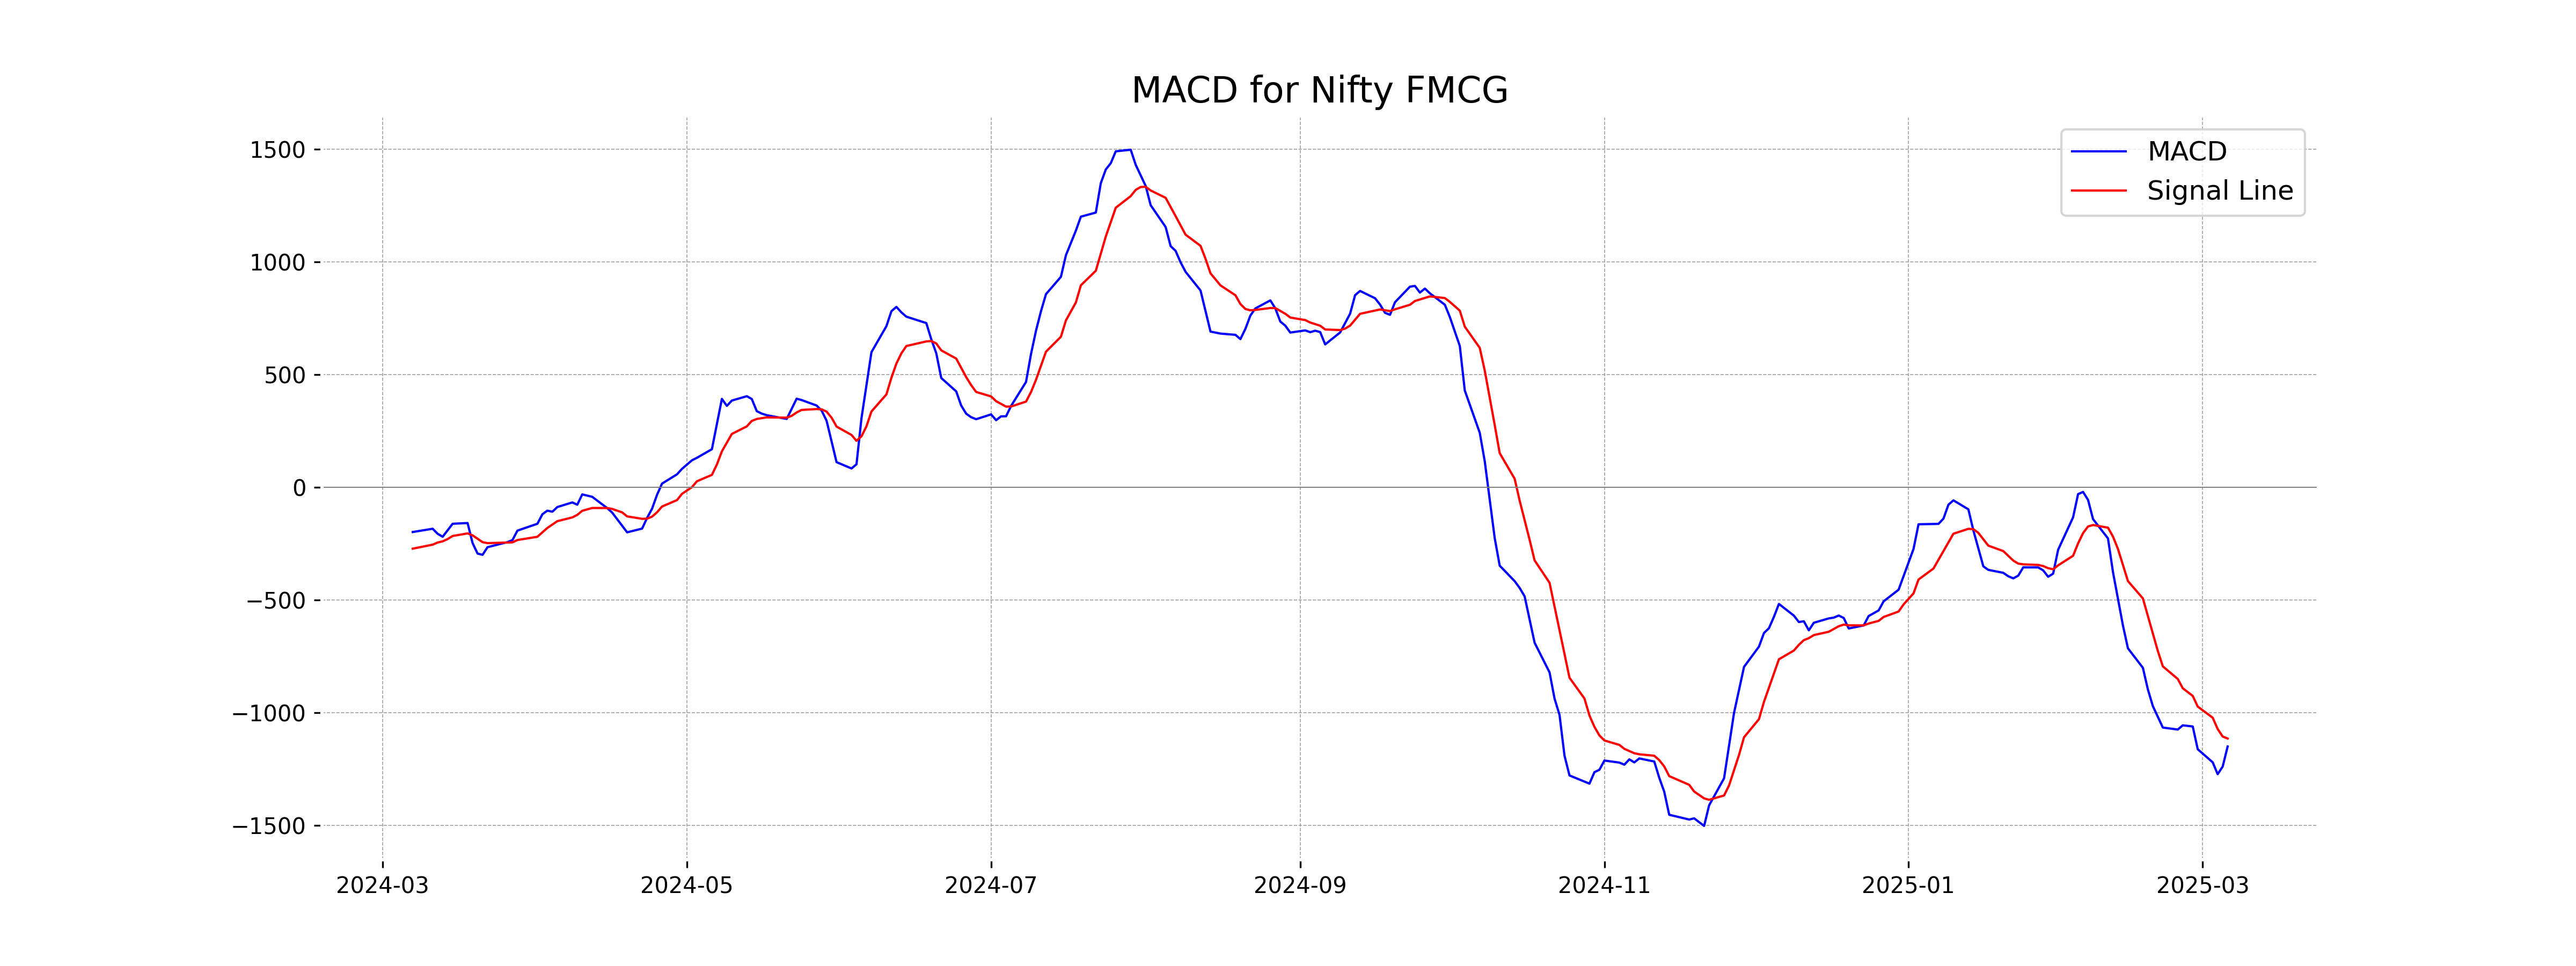
Moving Averages Trend (MACD)
The MACD analysis for Nifty FMCG shows a value of -1149.01, which is below the MACD Signal of -1113.71. This negative divergence suggests a bearish sentiment, indicating potential downward momentum in the market. The RSI value of 38.70 also supports this outlook, reflecting stronger selling pressure.
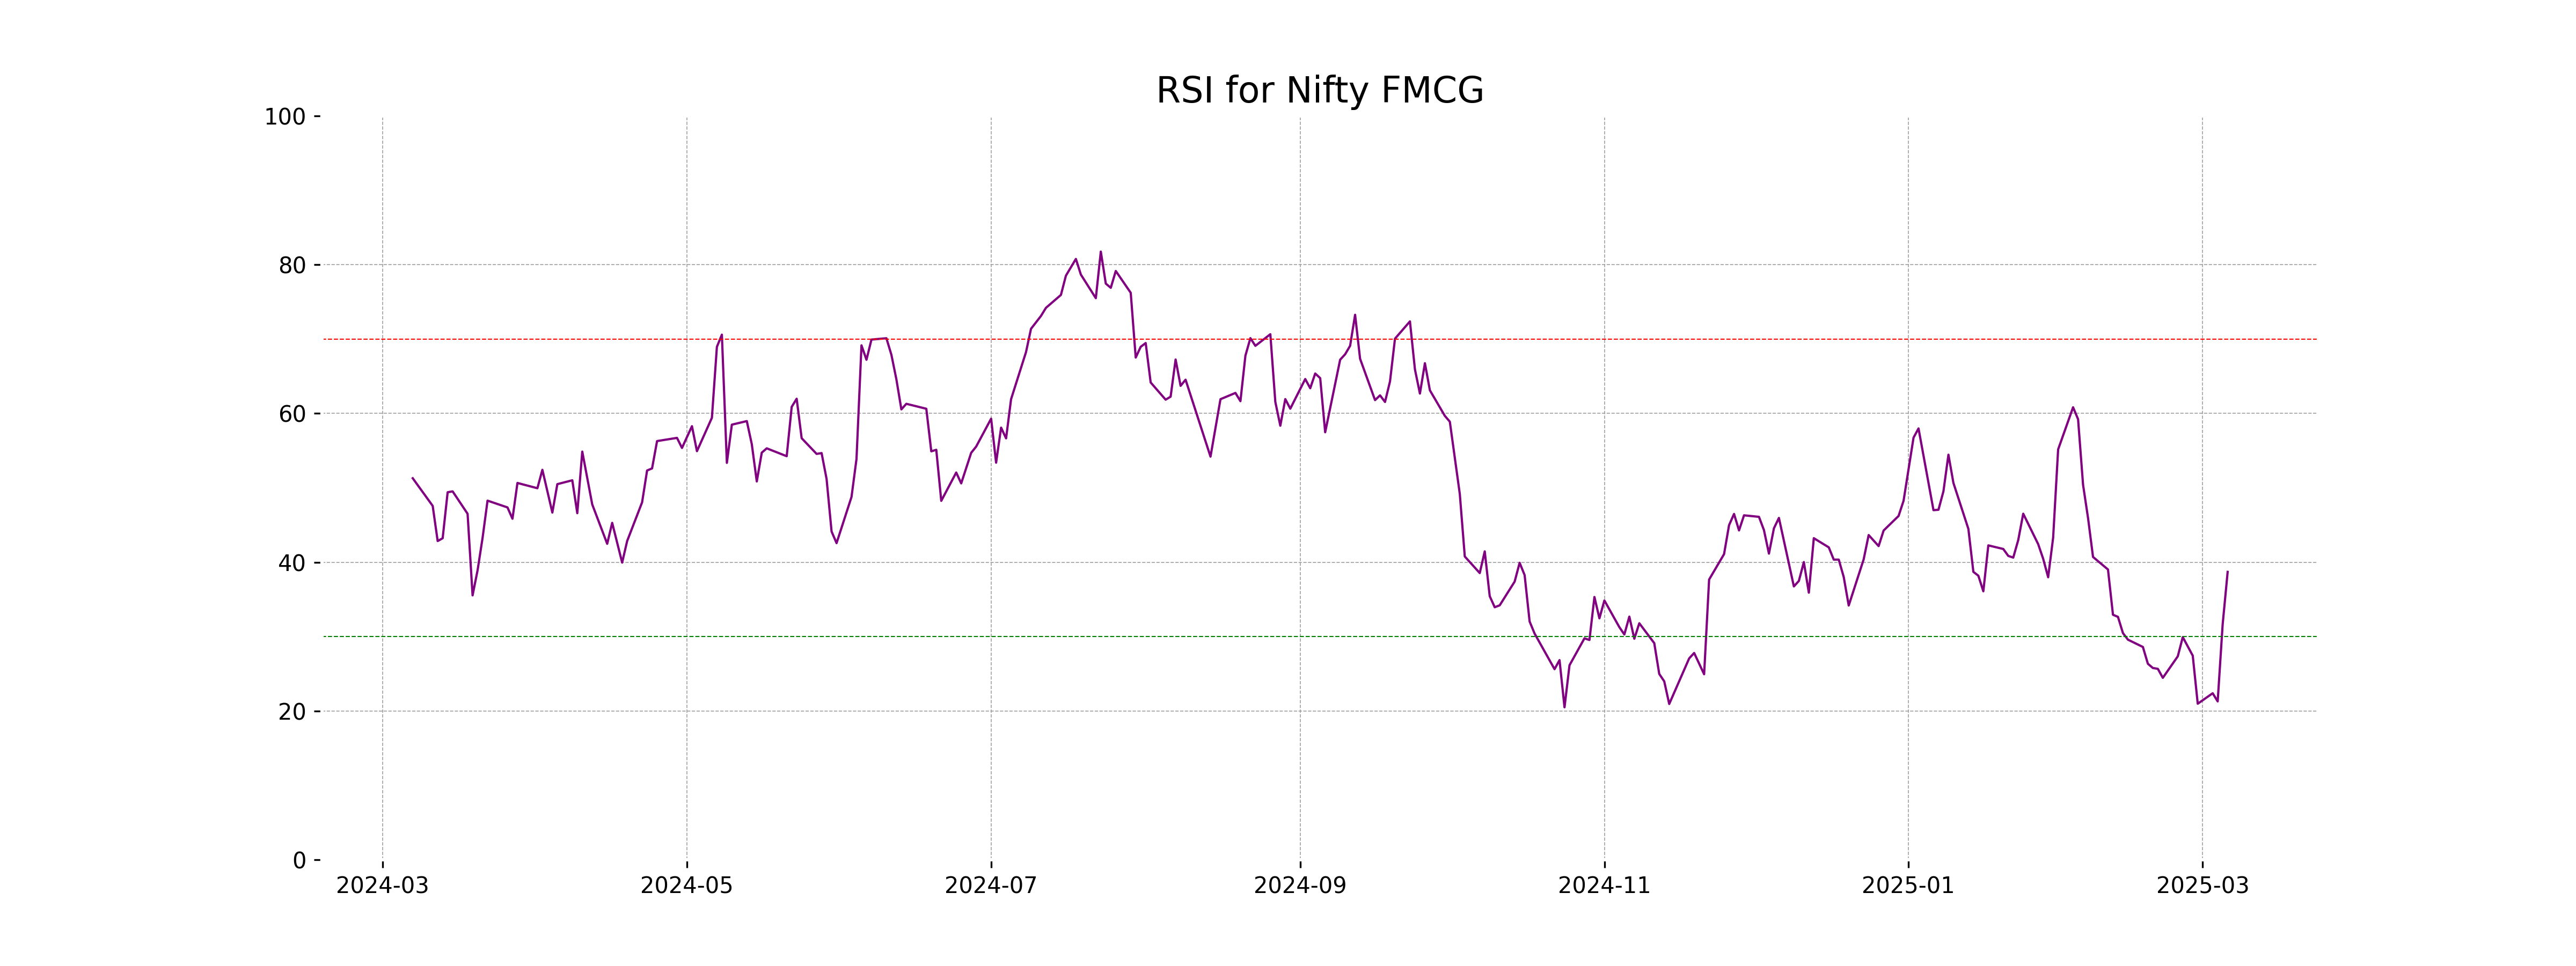
RSI Analysis
Nifty FMCG's RSI is currently at 38.70, which indicates that the stock might be approaching oversold conditions as values below 30 are generally considered oversold. This suggests bearish momentum, but investors may watch for a potential reversal if the RSI turns upward near this level.
Analysis for Nifty Infra - March 06, 2025
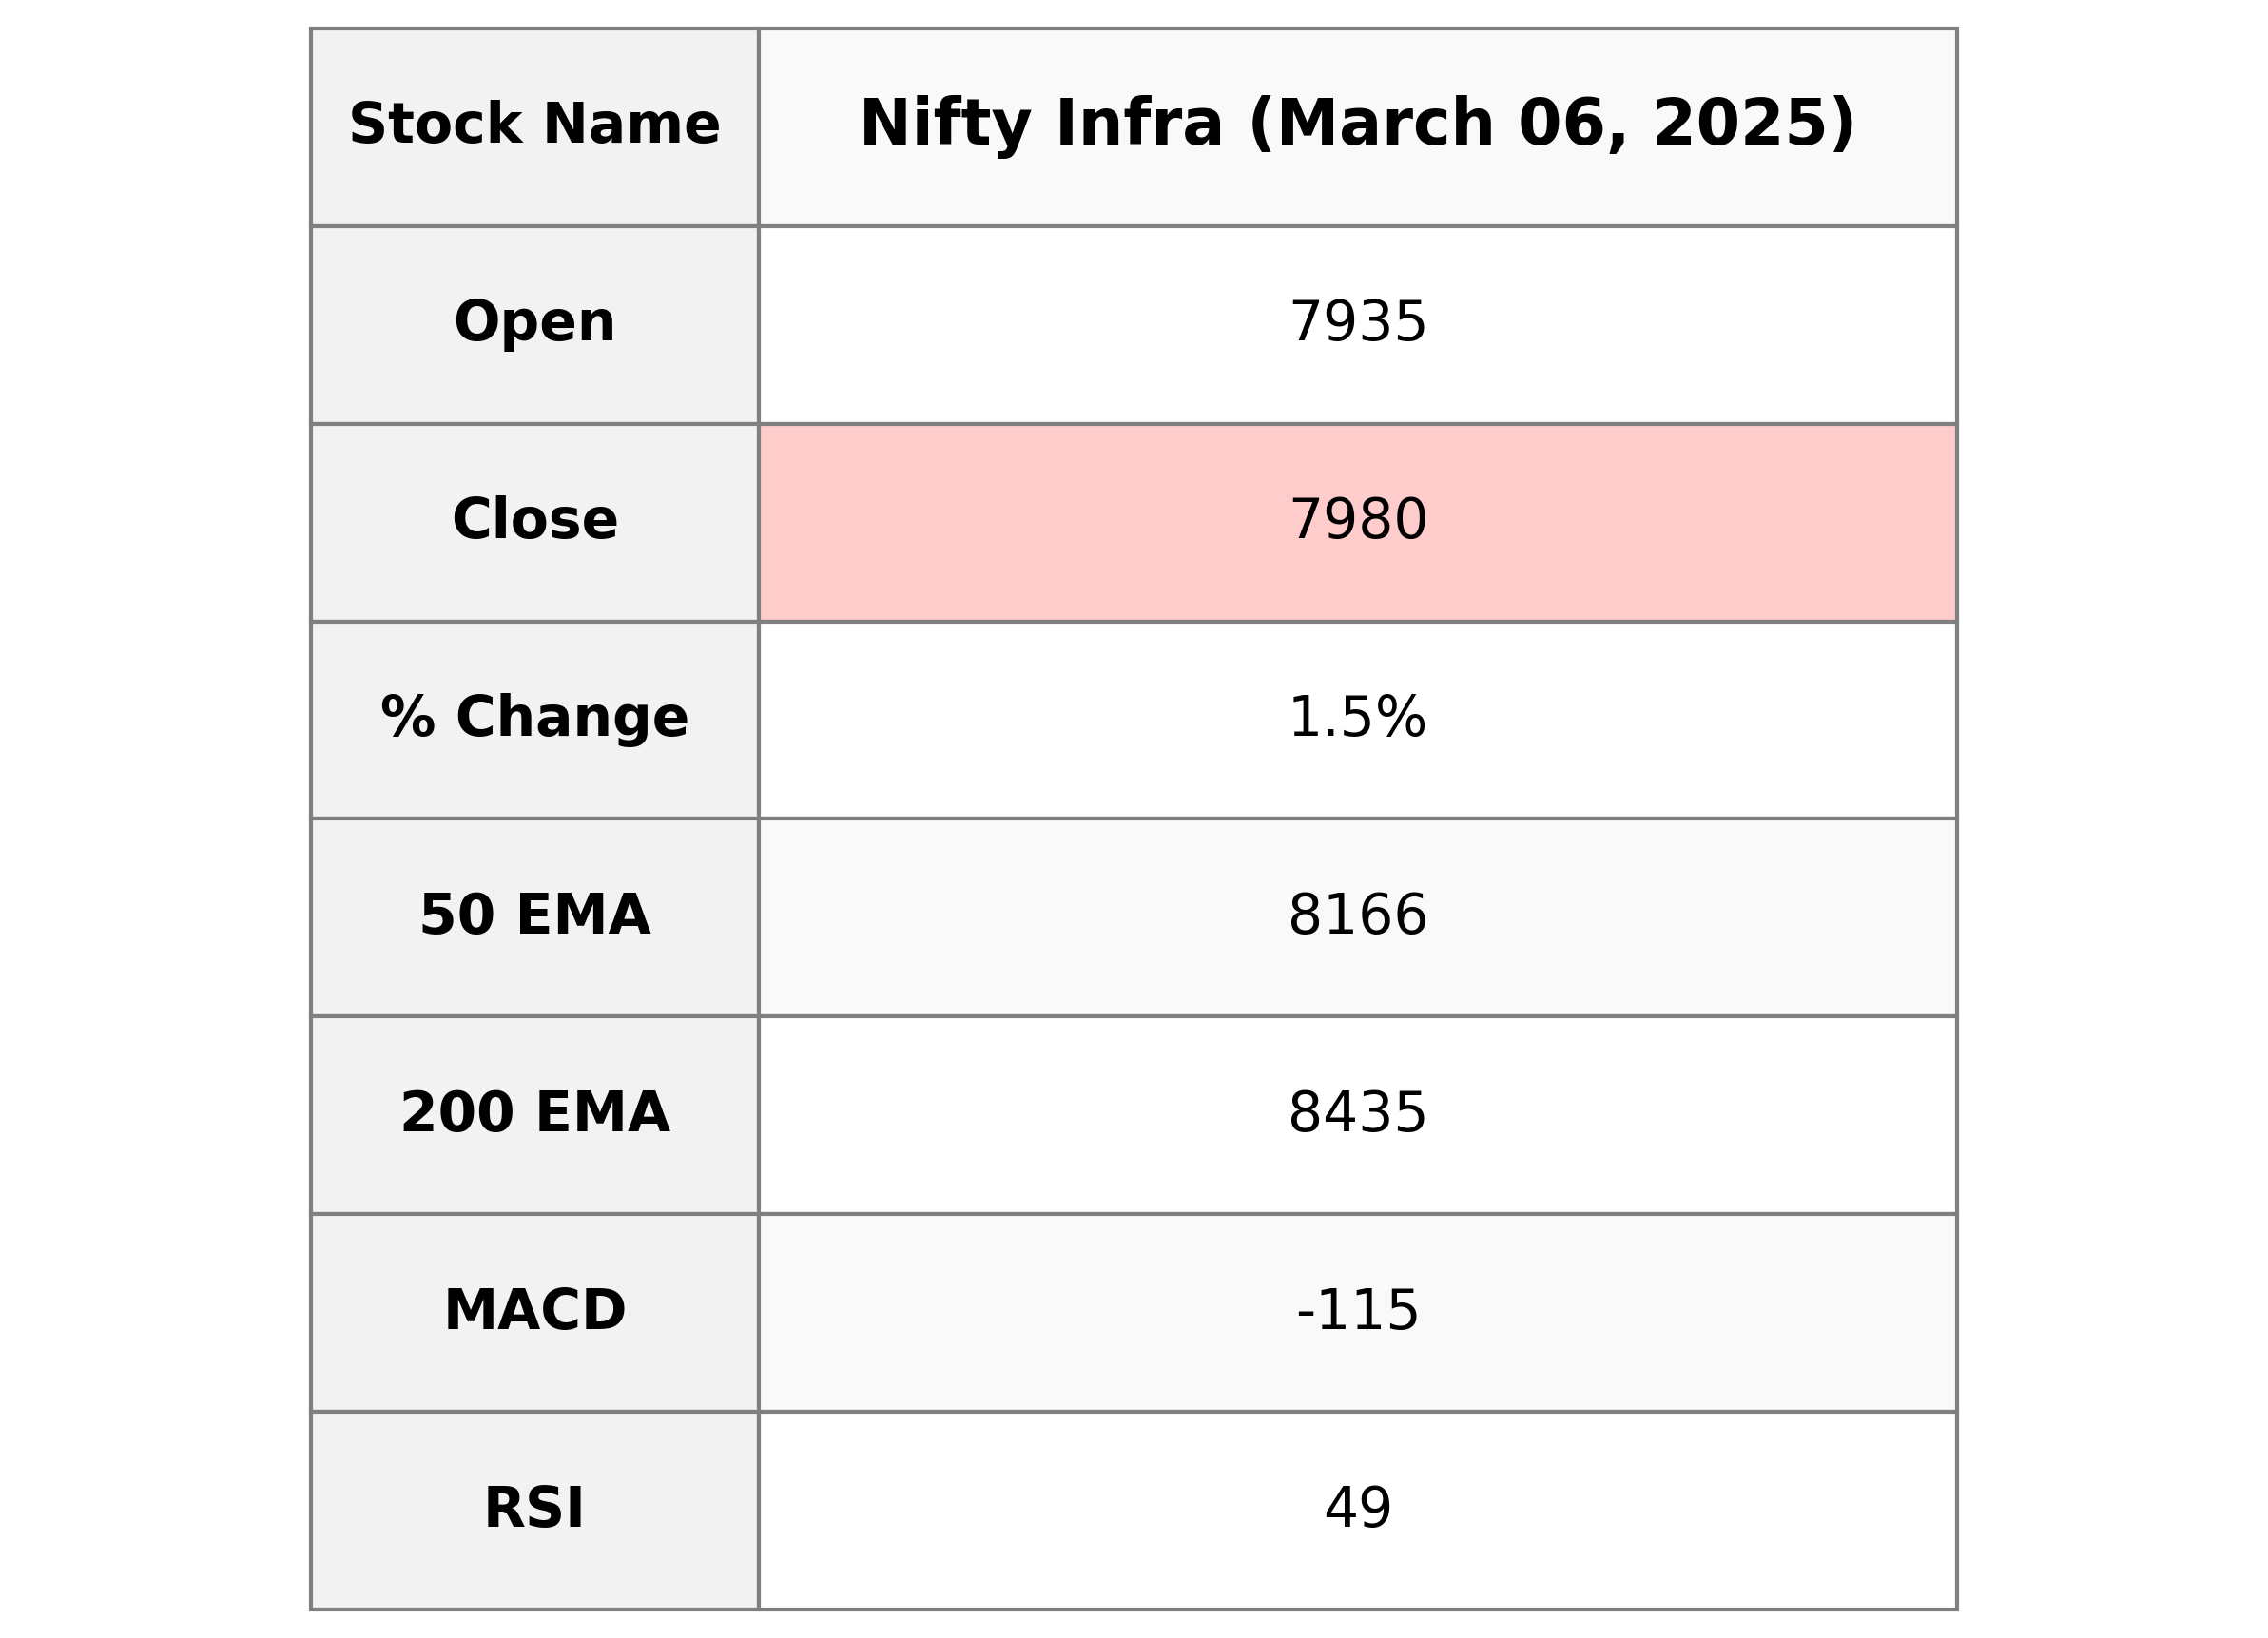
Nifty Infra Performance: Nifty Infra opened at 7935.35 and closed at 7979.55, marking a rise of 1.47% from its previous close. The index demonstrated a notable upward movement with a points change of 115.35, although the RSI indicates a neutral stance at 48.77. Currently, the index is trading below its 50-day and 200-day EMAs, which are at 8166.00 and 8435.13, respectively, suggesting a potential bearish trend in the longer term.
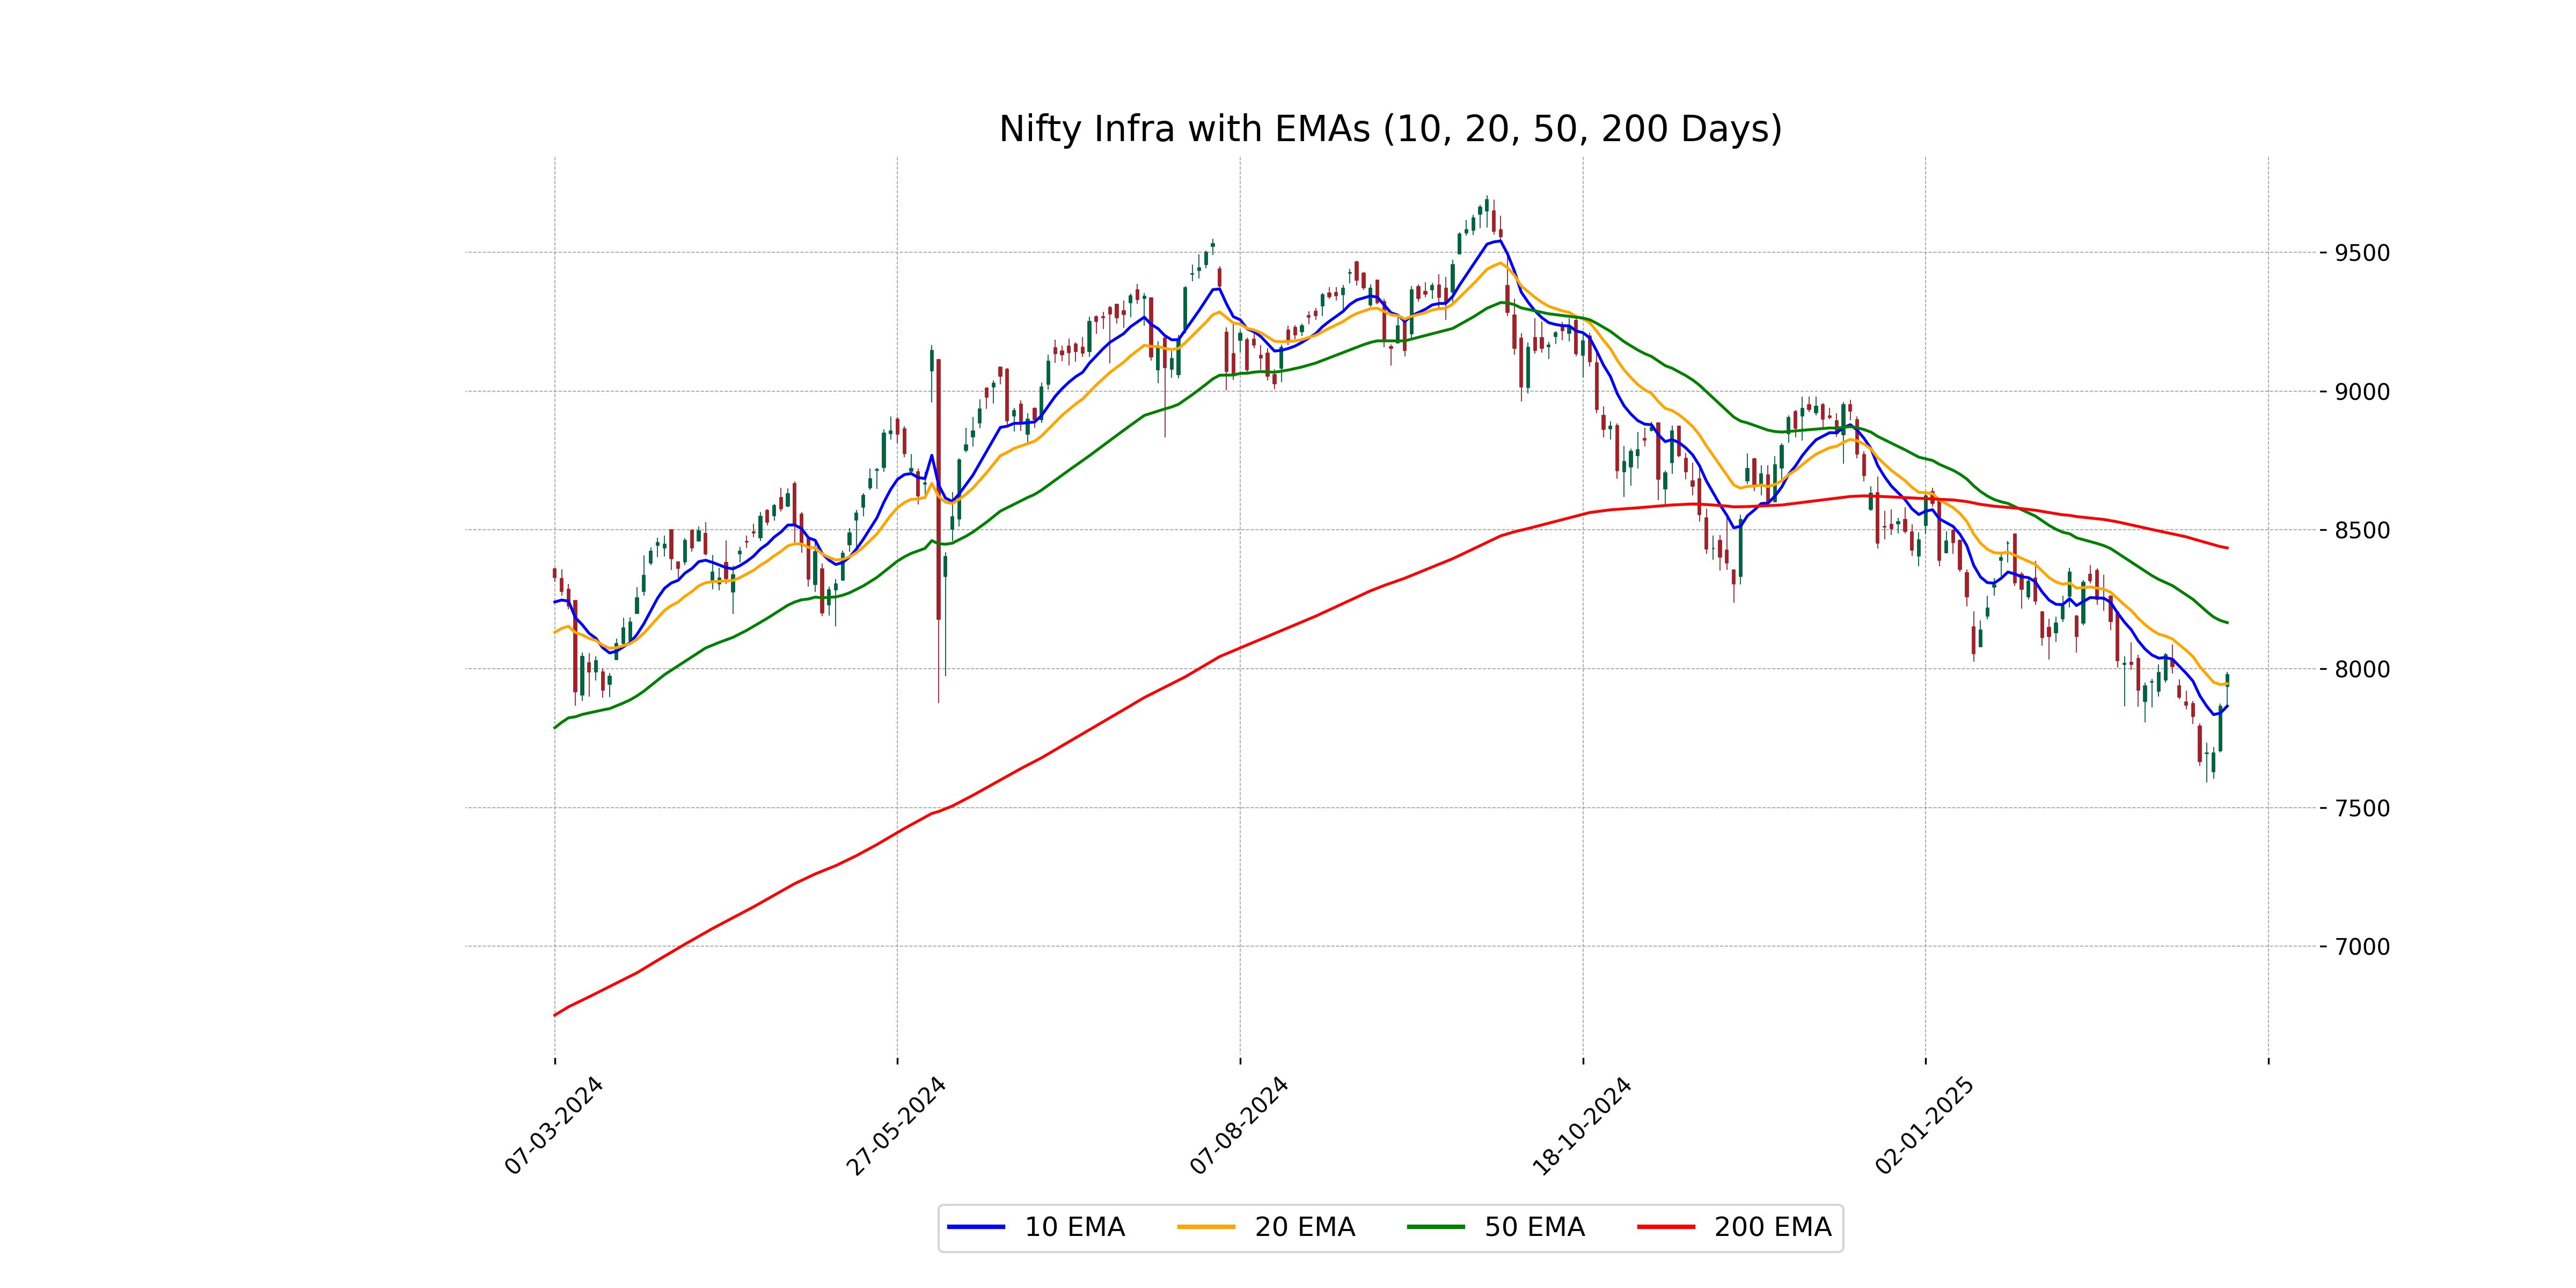
Relationship with Key Moving Averages
Nifty Infra closed at 7979.55, which is slightly above the 10-EMA of 7865.45 but below both the 20-EMA of 7946.43 and the 50-EMA of 8166.00. This shows a short-term bullish momentum as it stays above the 10-EMA, though it remains under pressure compared to the higher averages.
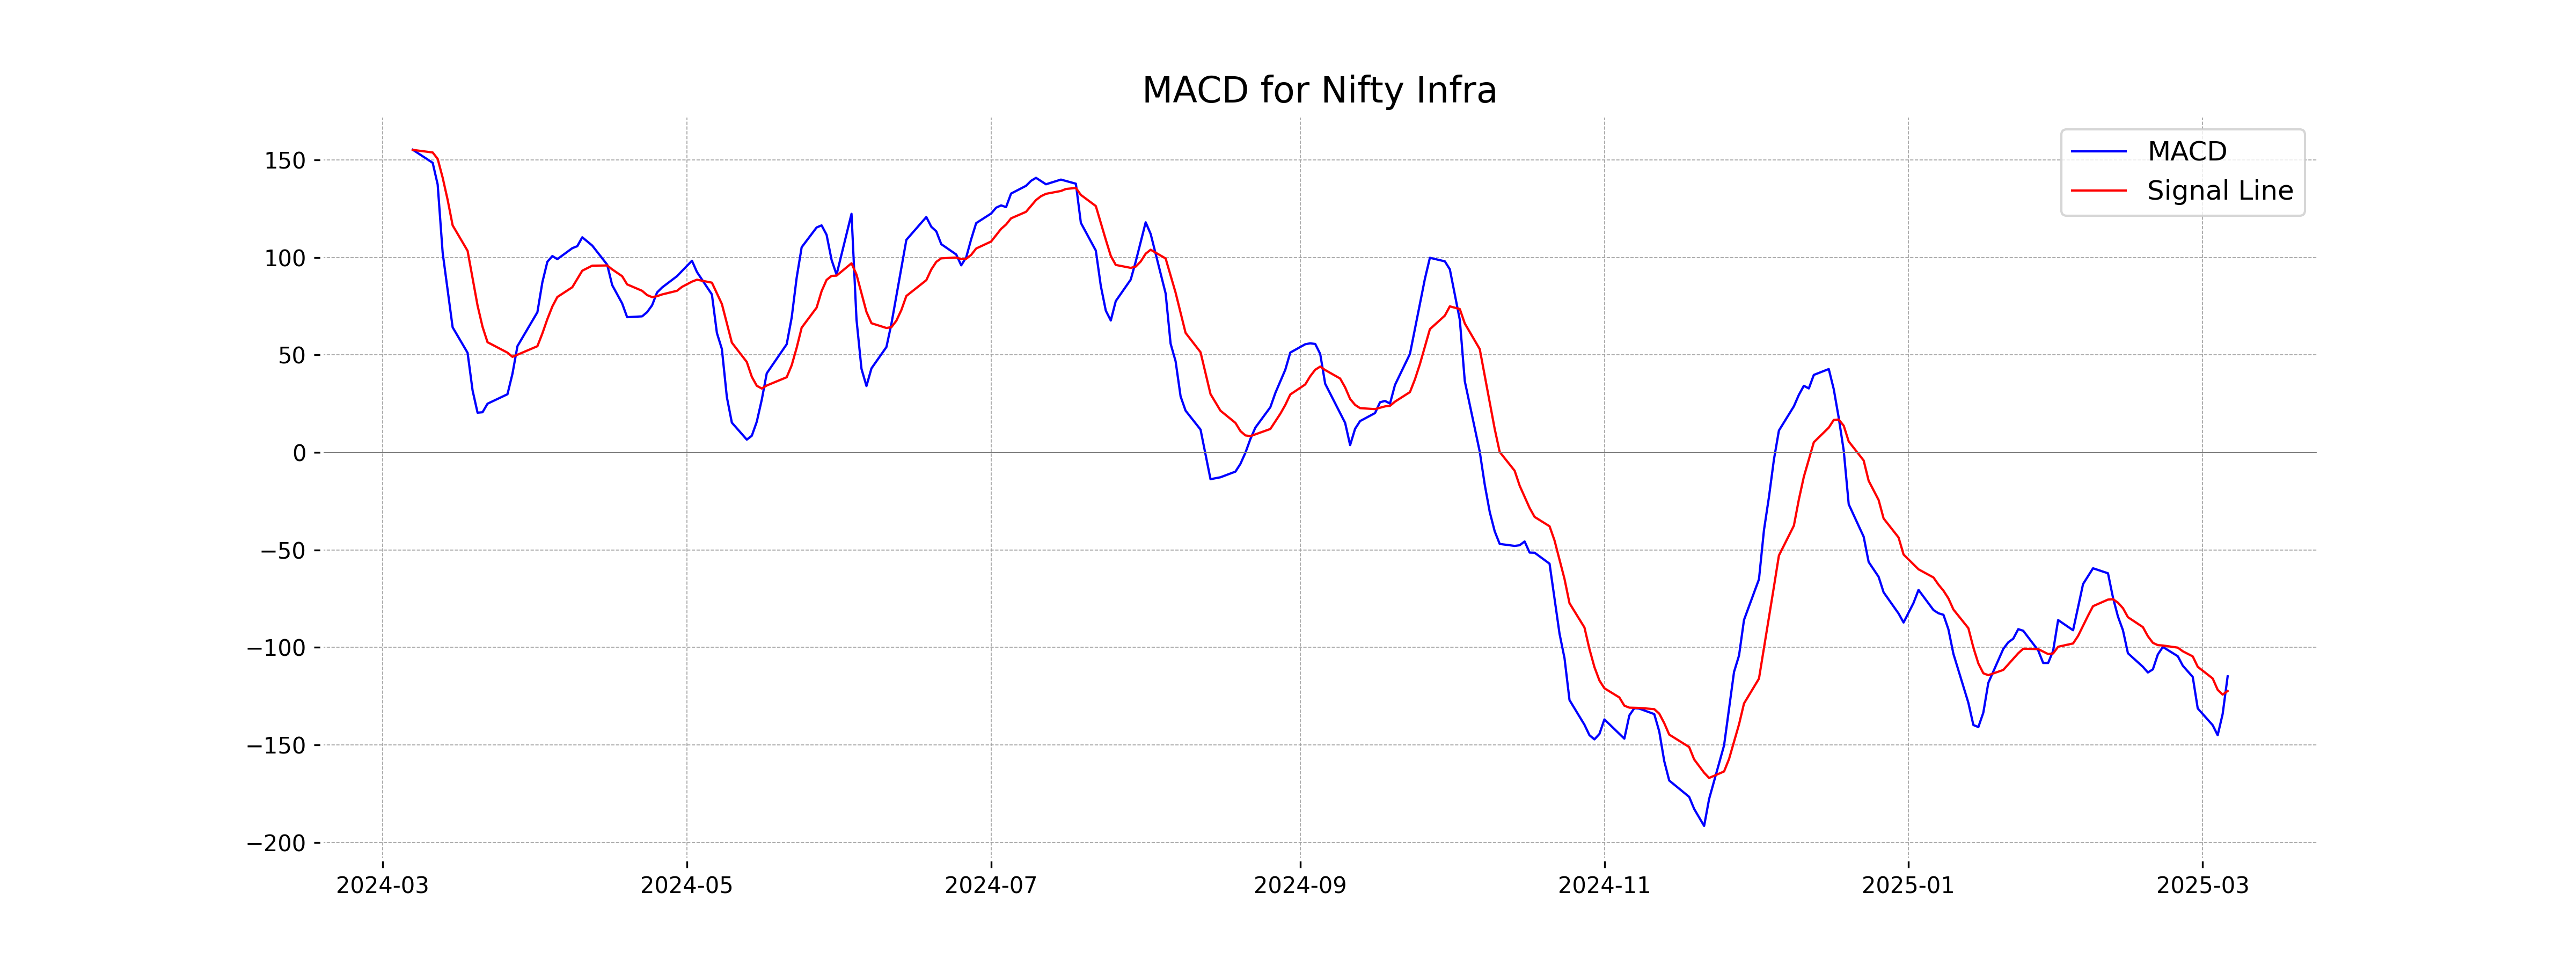
Moving Averages Trend (MACD)
The MACD for Nifty Infra is -114.78, with the signal line at -122.31. Since the MACD is above the signal line, it indicates a potential bullish movement, though it remains negative, suggesting the current trend might still be weak.
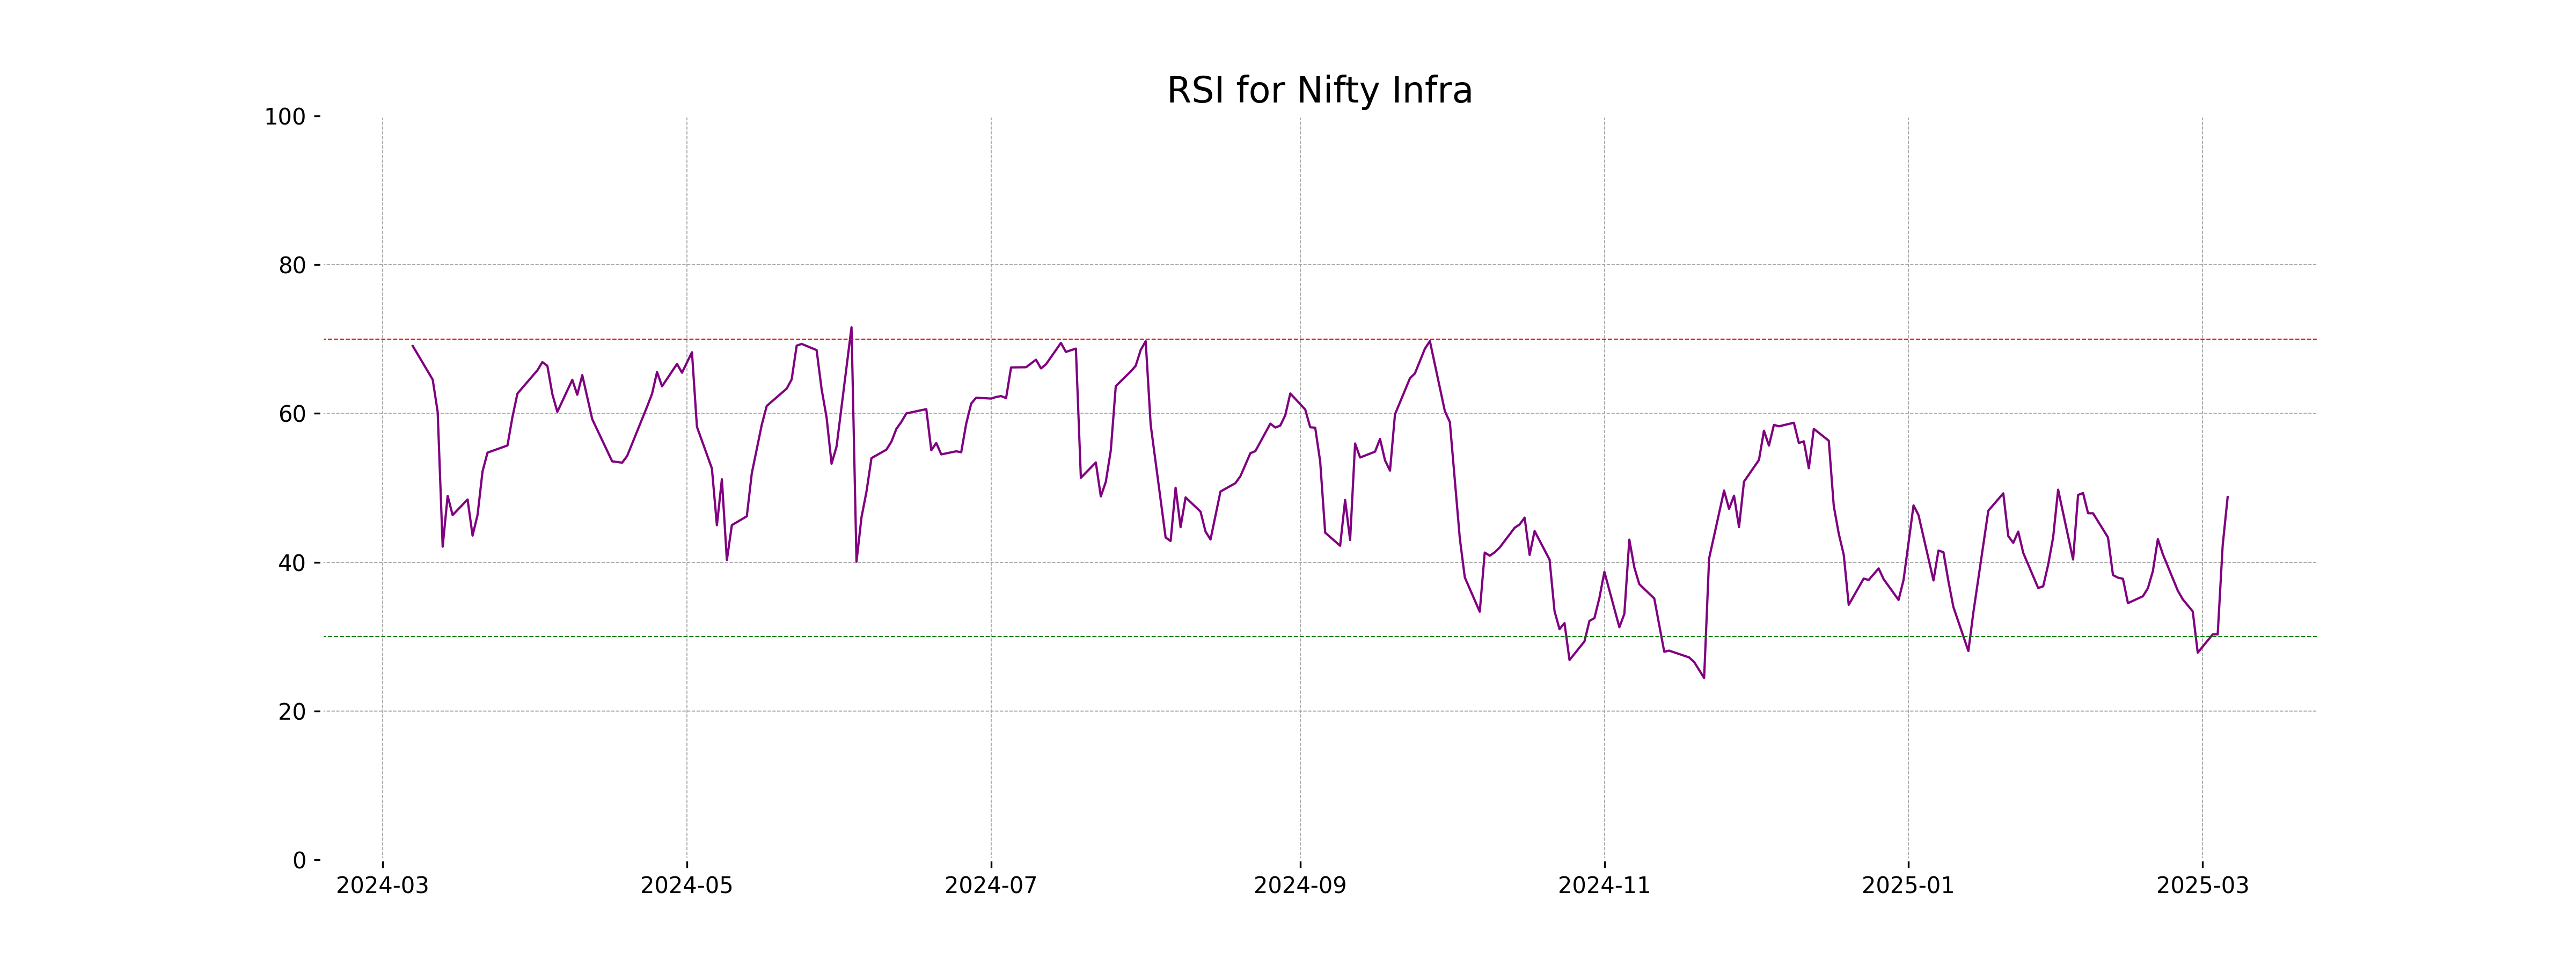
RSI Analysis
Nifty Infra RSI Analysis: The Relative Strength Index (RSI) for Nifty Infra is 48.77, which suggests that the index is near the middle of the RSI scale. This indicates a neutral momentum, implying that there is no strong overbought or oversold condition at present.
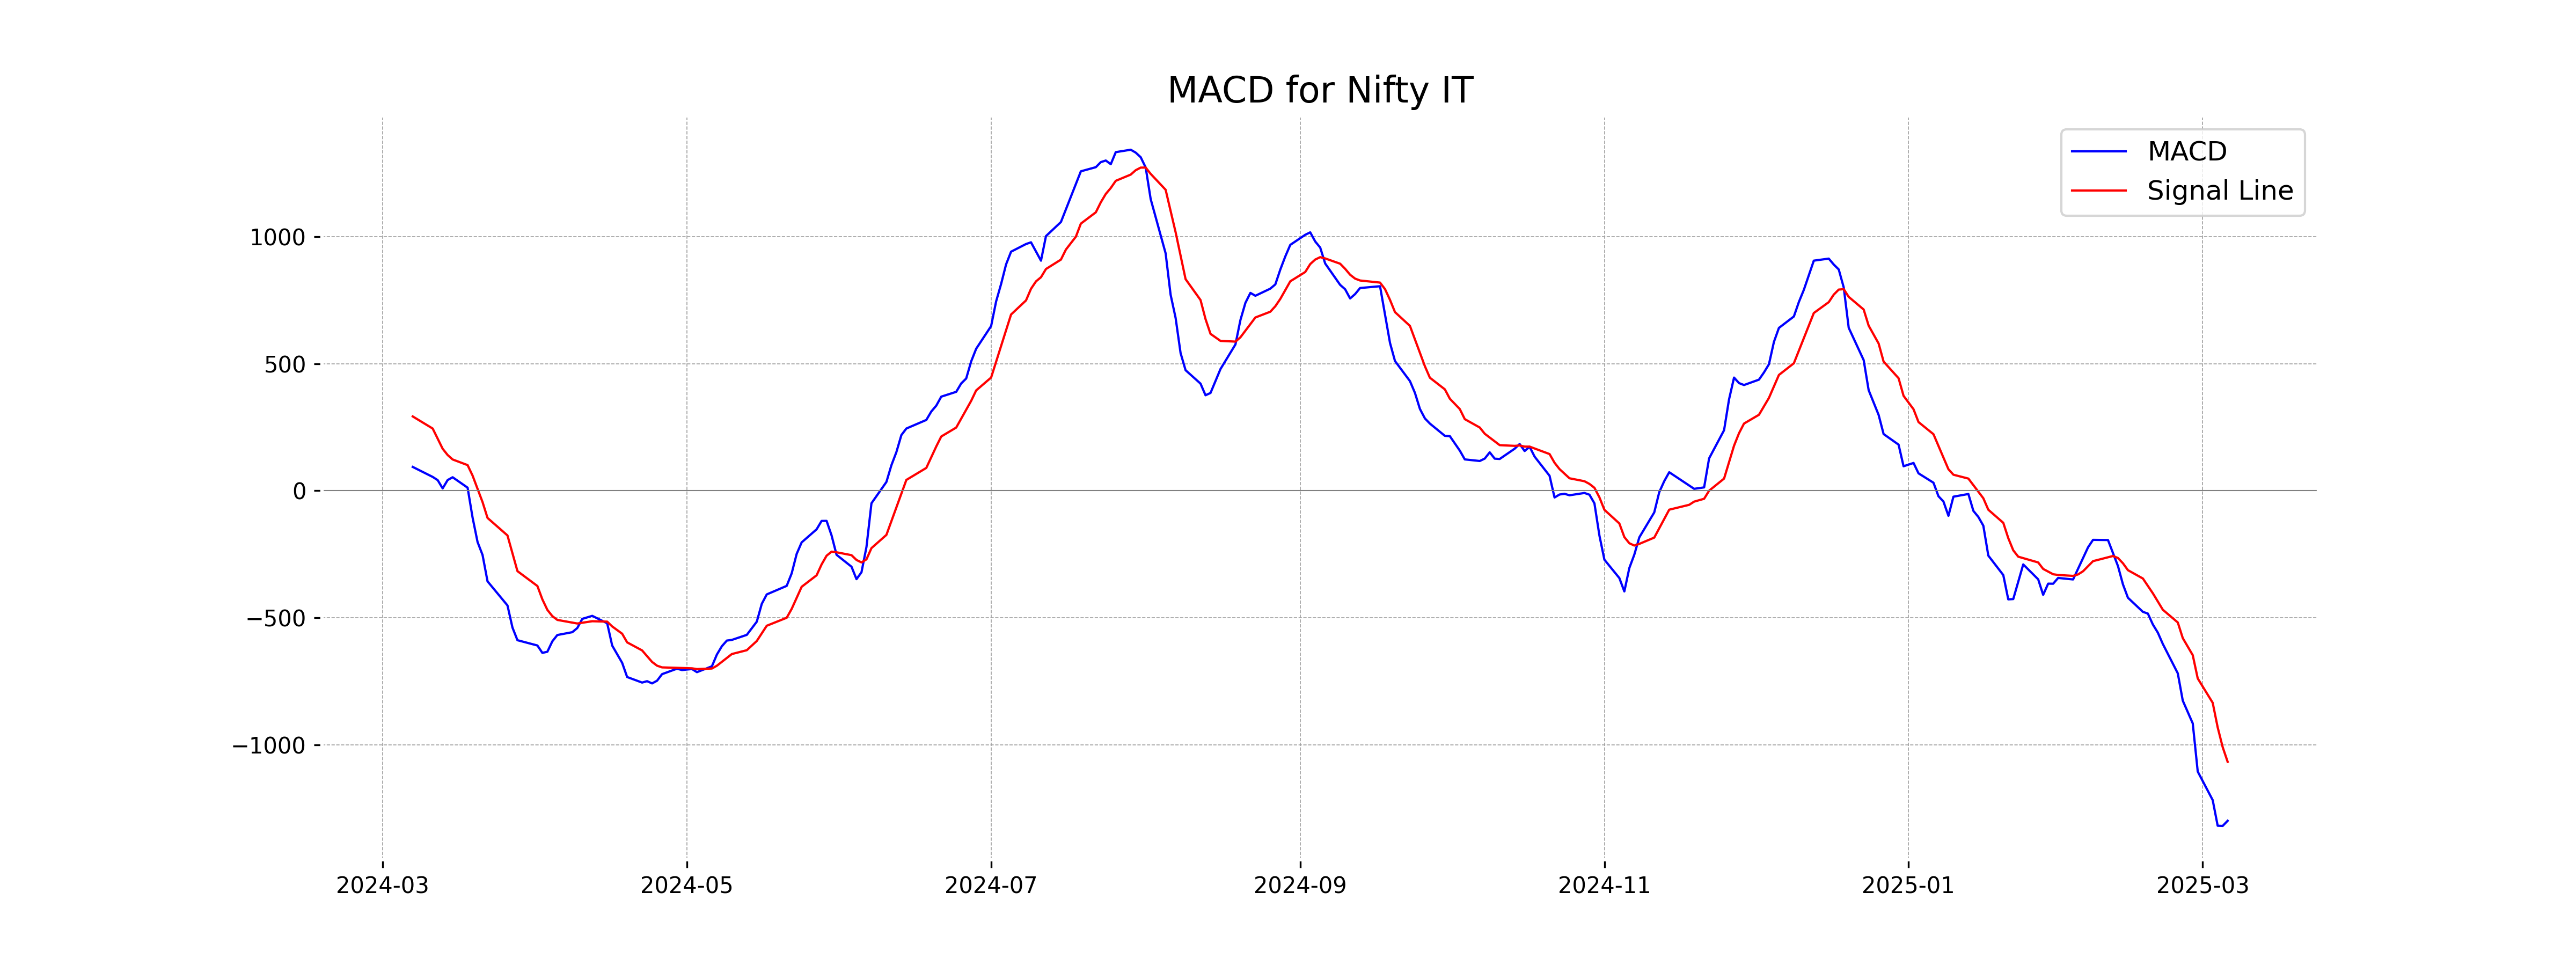
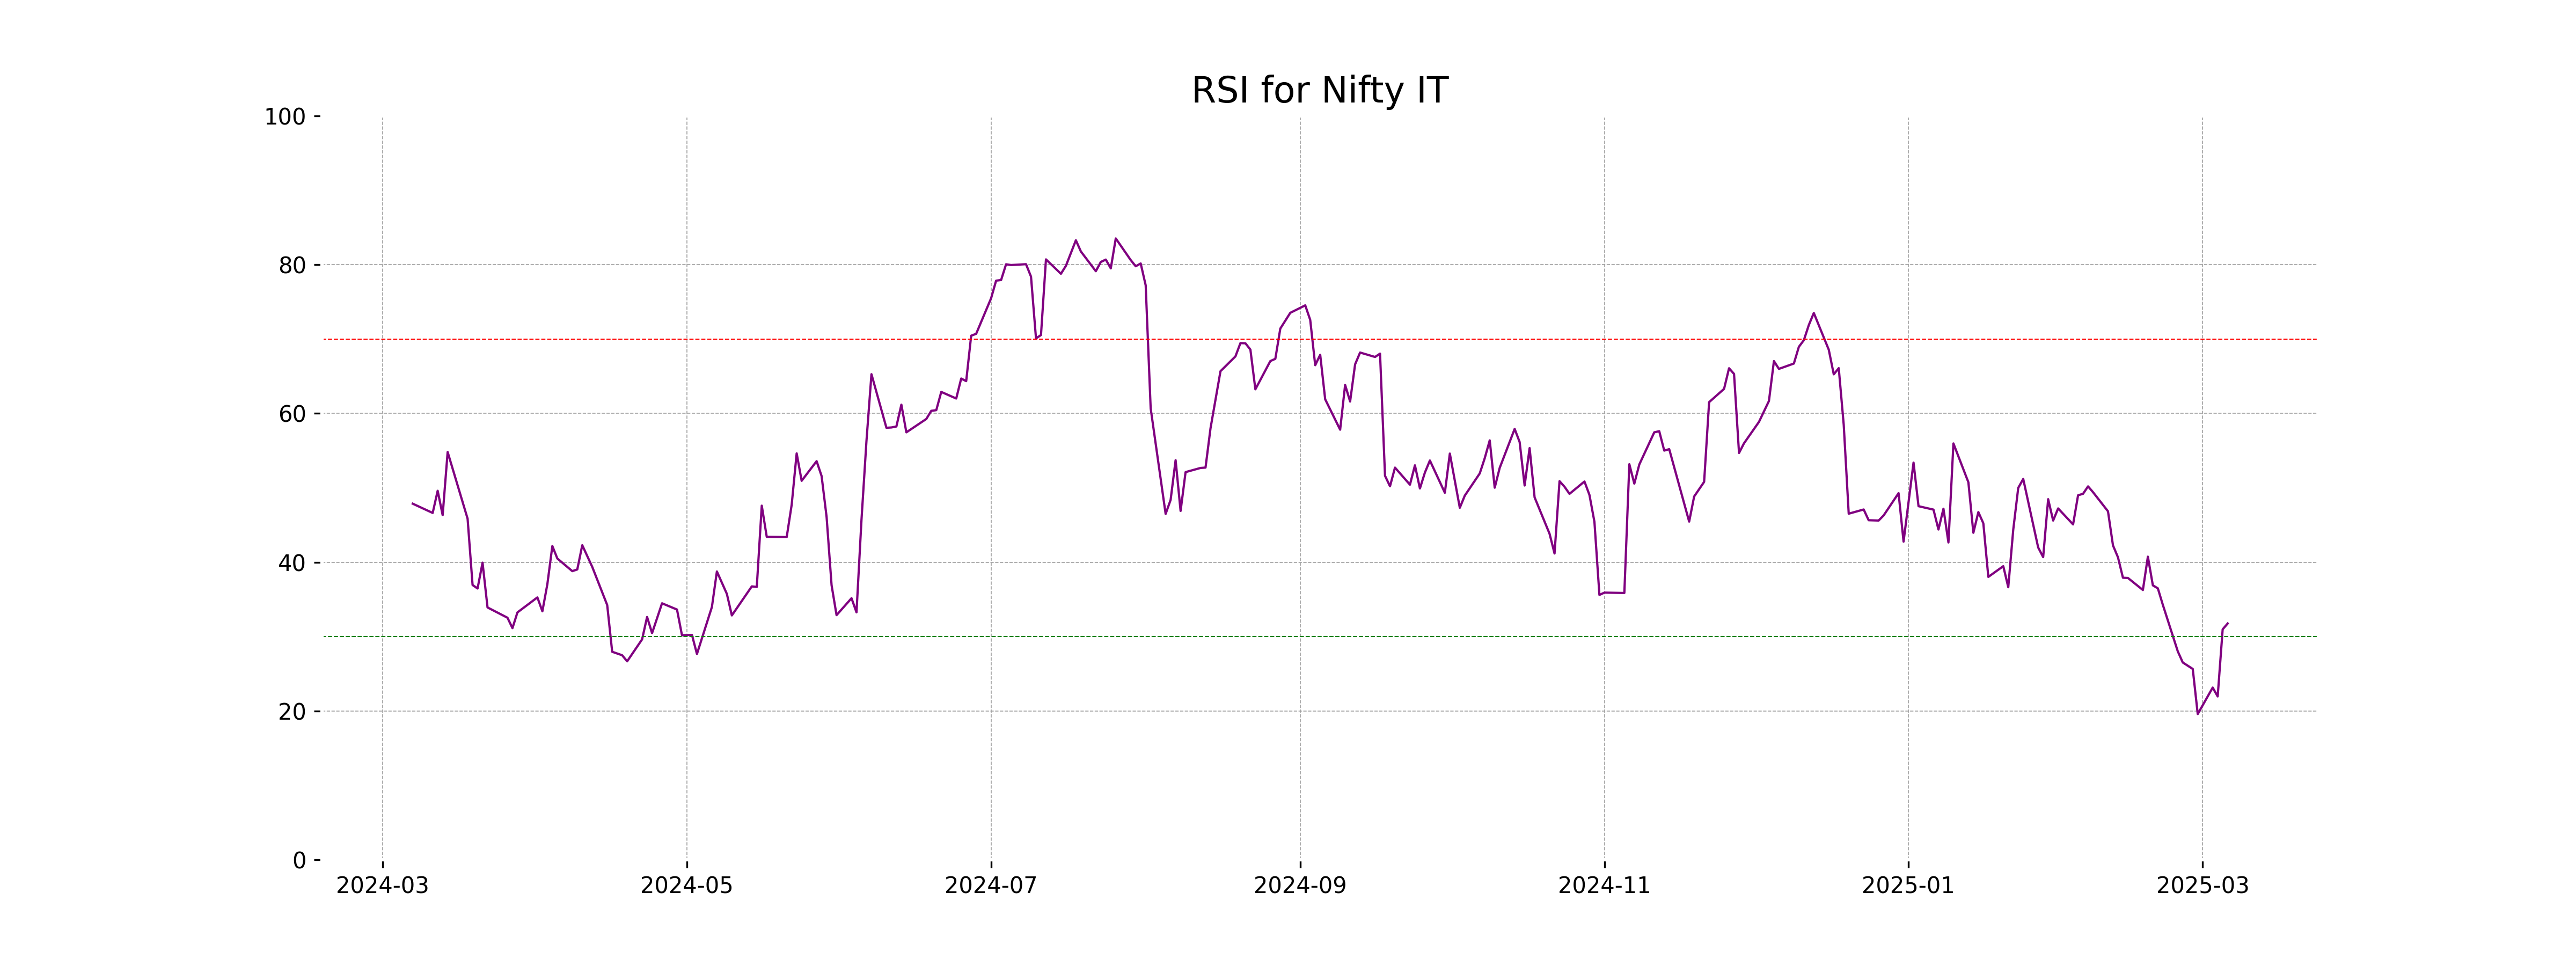
Analysis for Nifty IT - March 06, 2025

Nifty IT opened at 38,226.10 and closed slightly higher at 38,145.30, indicating a modest increase with a percentage change of 0.19%. The RSI is at 31.76, suggesting the index is near oversold conditions, while the MACD value of -1,299.63 indicates a bearish momentum.
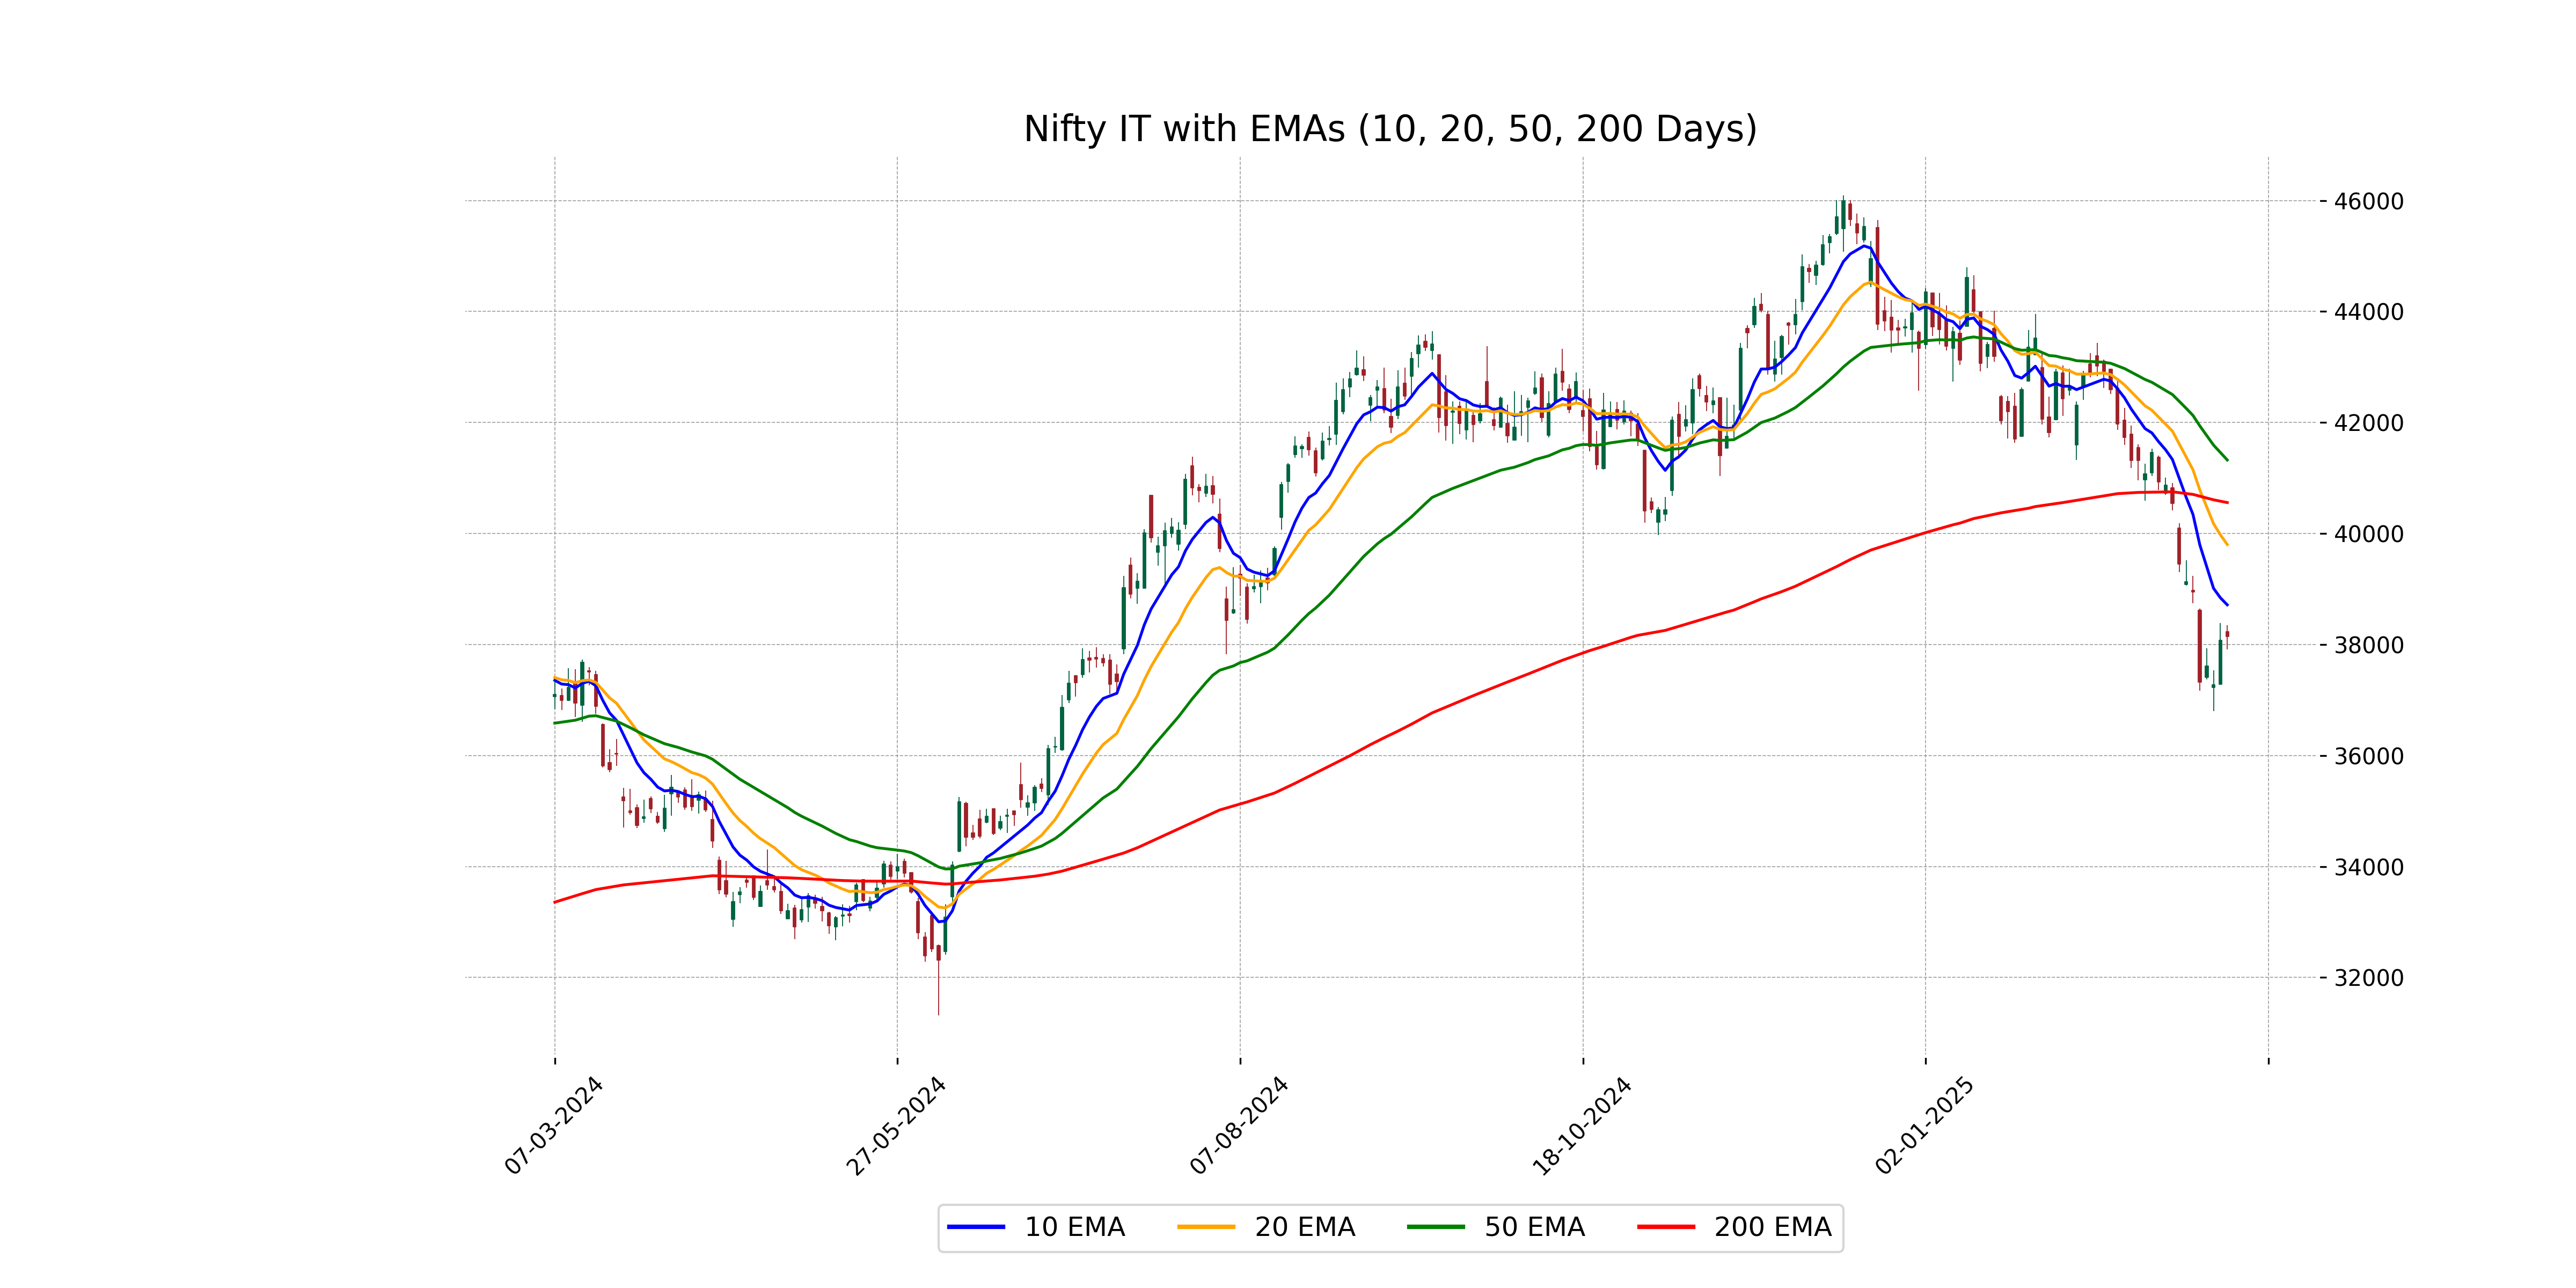
Relationship with Key Moving Averages
The closing price of Nifty IT at 38,145.30 is below its 50 EMA at 41,324.11 and the 200 EMA at 40,556.85, indicating a potential downward trend. Additionally, it is also below the 10 EMA and 20 EMA, suggesting short-term bearish momentum.
Moving Averages Trend (MACD)
The MACD value for Nifty IT is -1299.63, and the MACD signal is -1067.50, indicating a bearish trend. The MACD line is below the signal line, suggesting that the momentum is in favor of sellers. Additionally, the RSI is at 31.76, which may imply that the index is approaching the oversold territory.
RSI Analysis
The RSI value for Nifty IT is 31.76, which is below the standard oversold threshold of 30. This suggests that the index is approaching oversold conditions, indicating potential for a price reversal or consolidation phase if similar trends continue.
Analysis for Nifty Metal - March 06, 2025
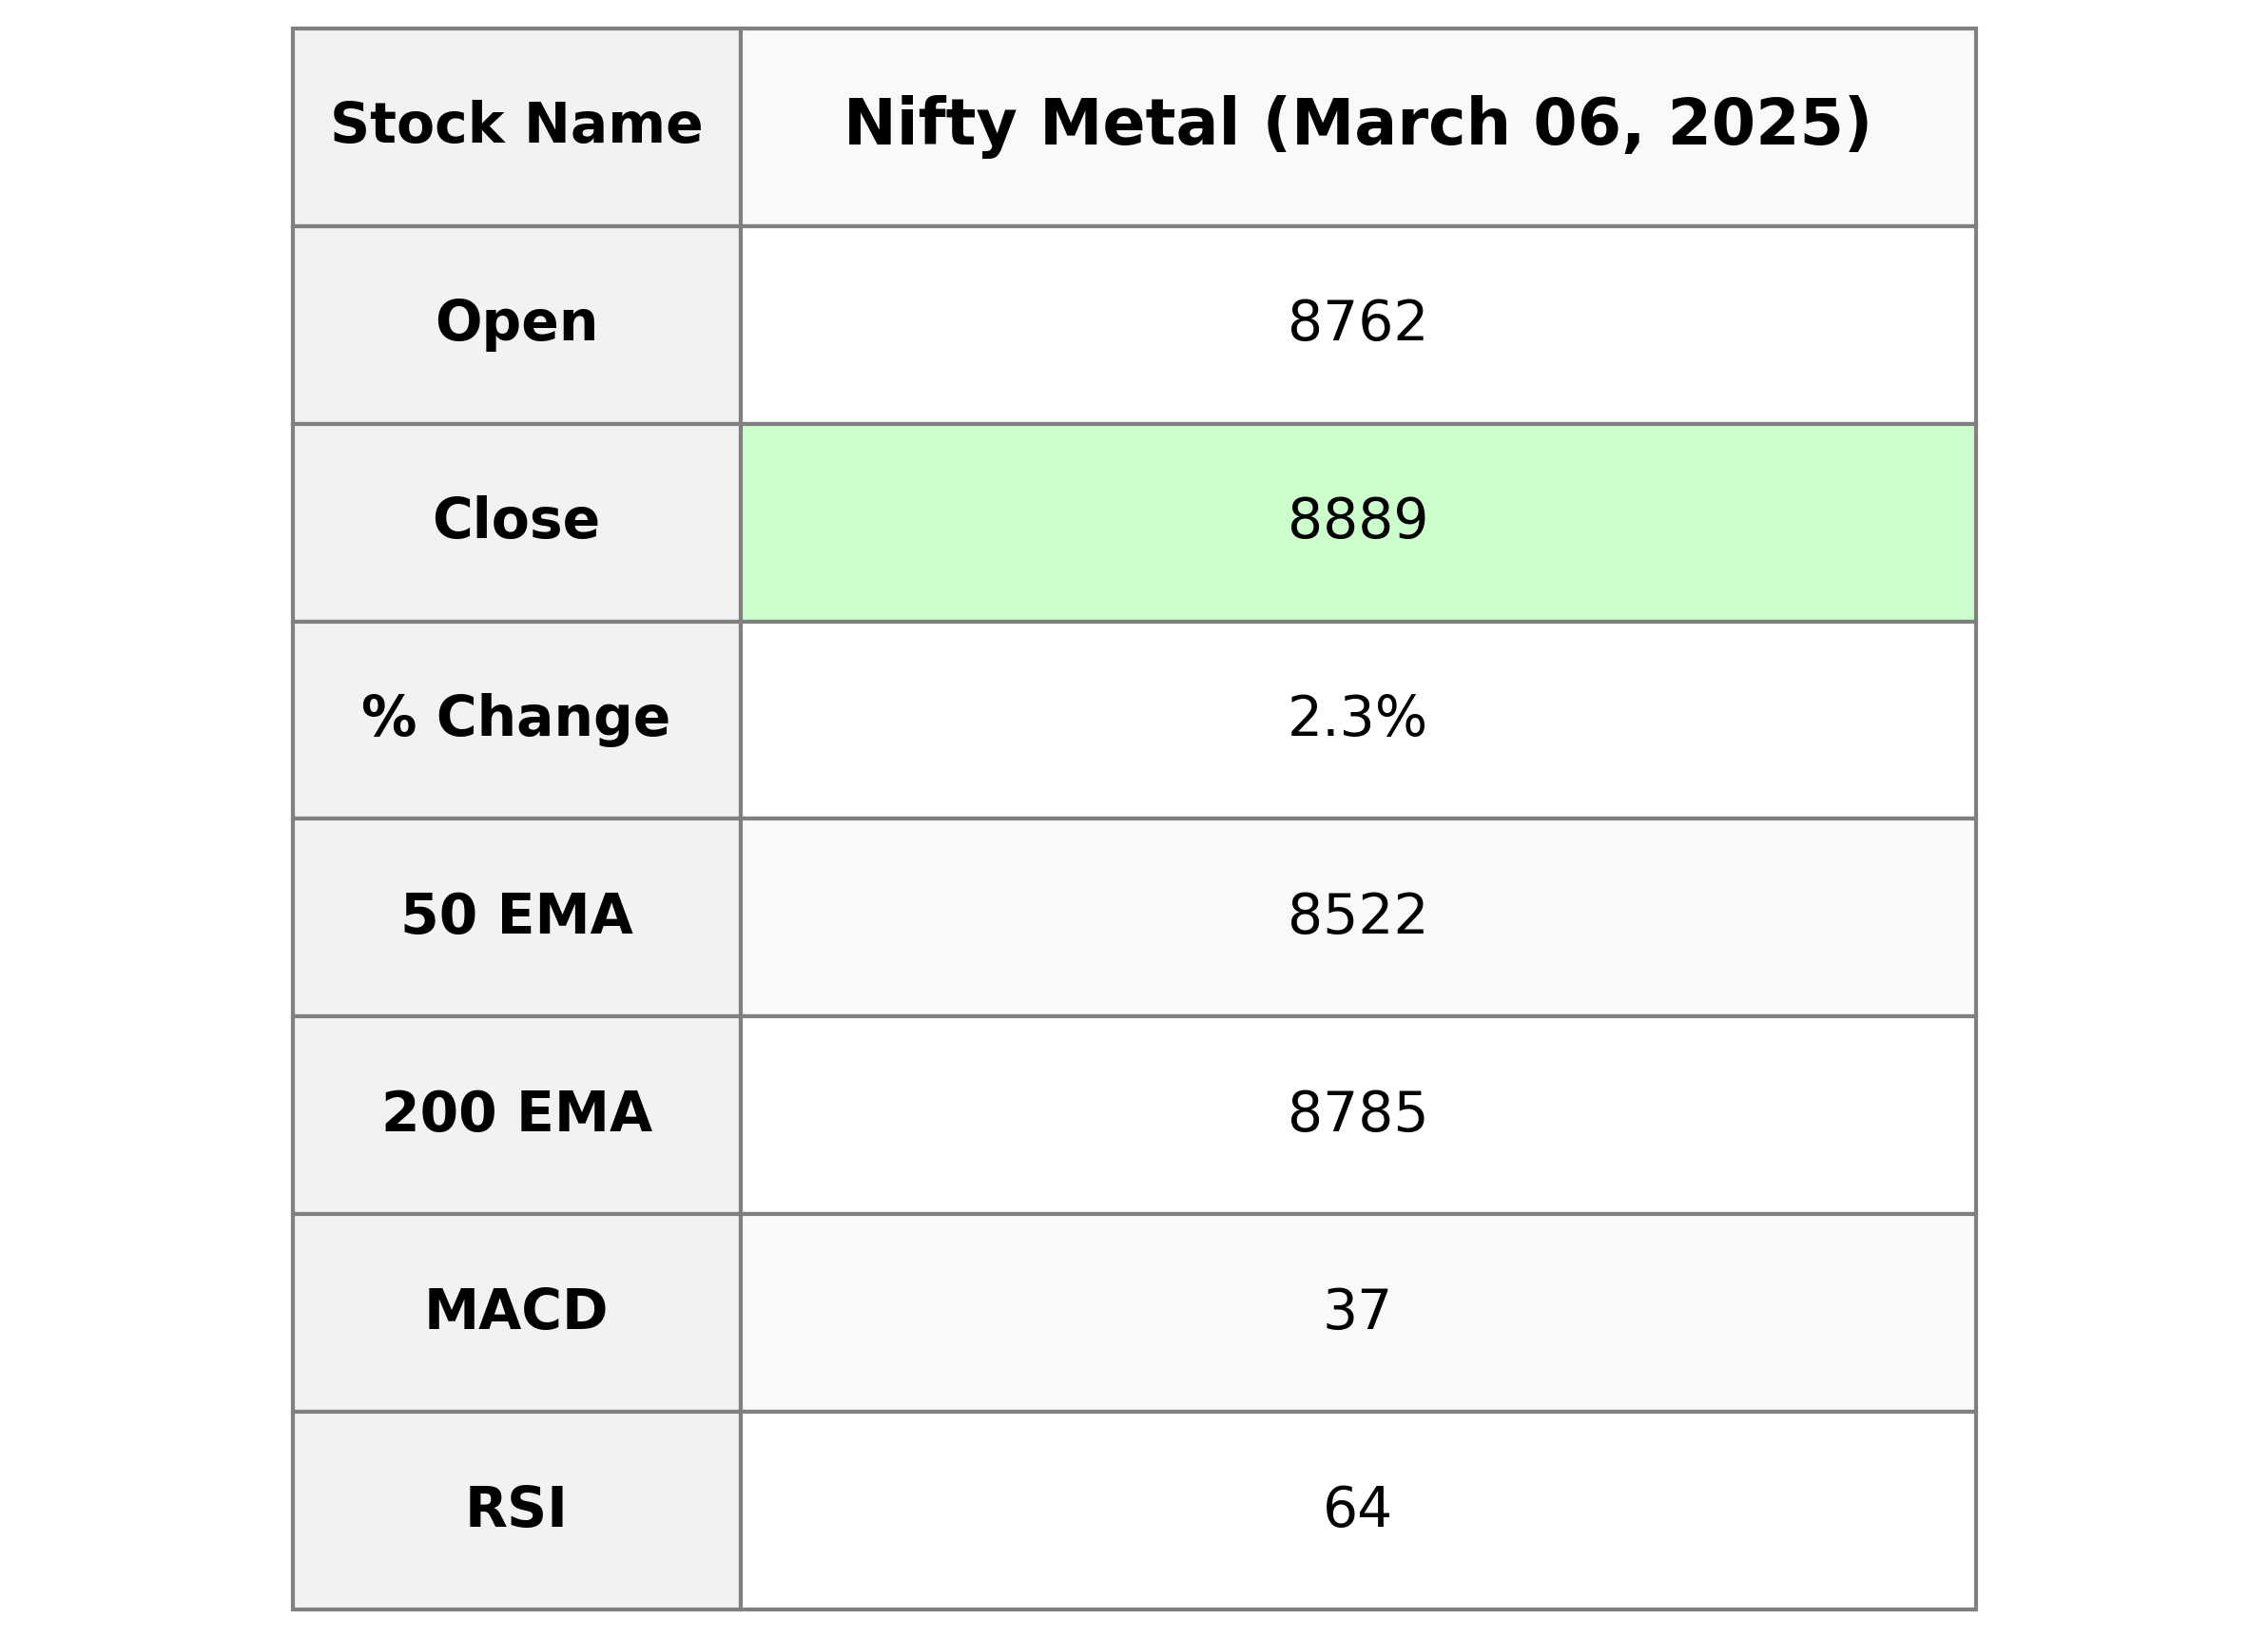
The Nifty Metal index showed a strong performance, closing at 8888.65 after opening at 8762.5. It experienced a percentage change of approximately 2.34% and gained 203.45 points compared to its previous close of 8685.20. The RSI value of 63.65 indicates a bullish momentum in the market.
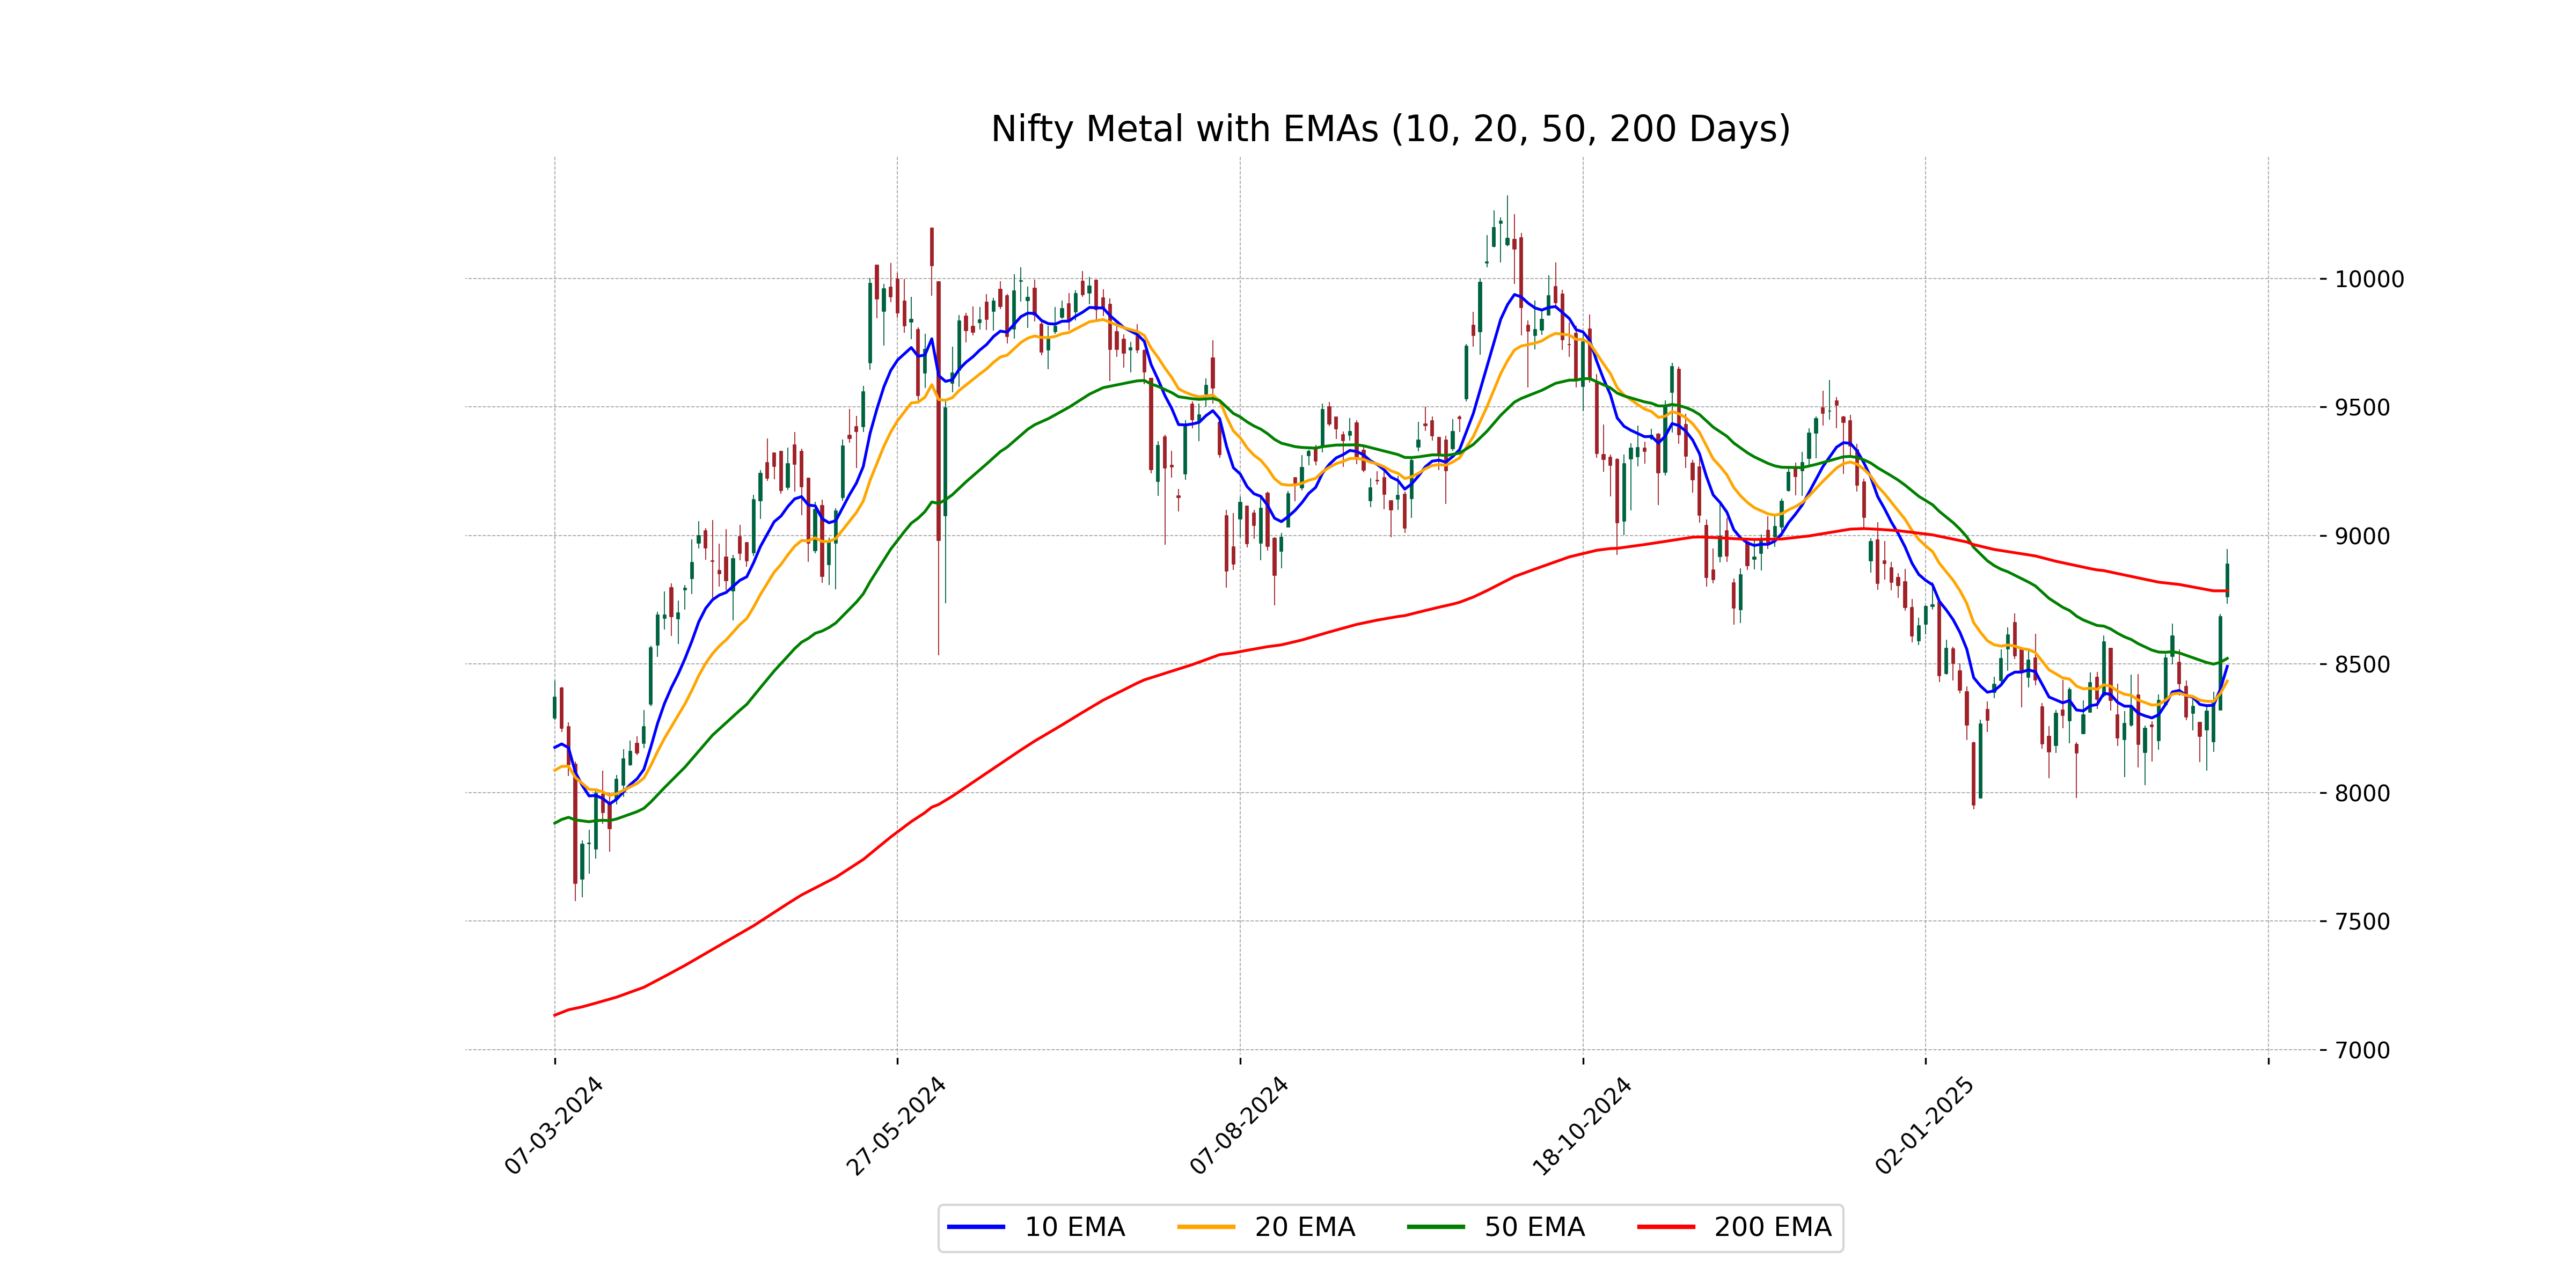
Relationship with Key Moving Averages
Nifty Metal closed above its 50 EMA and 20 EMA, as well as its 200 EMA, indicating a strong uptrend. The current close at 8888.65 is higher than both the 50 EMA (8521.93) and 200 EMA (8784.76), which suggests bullish momentum.
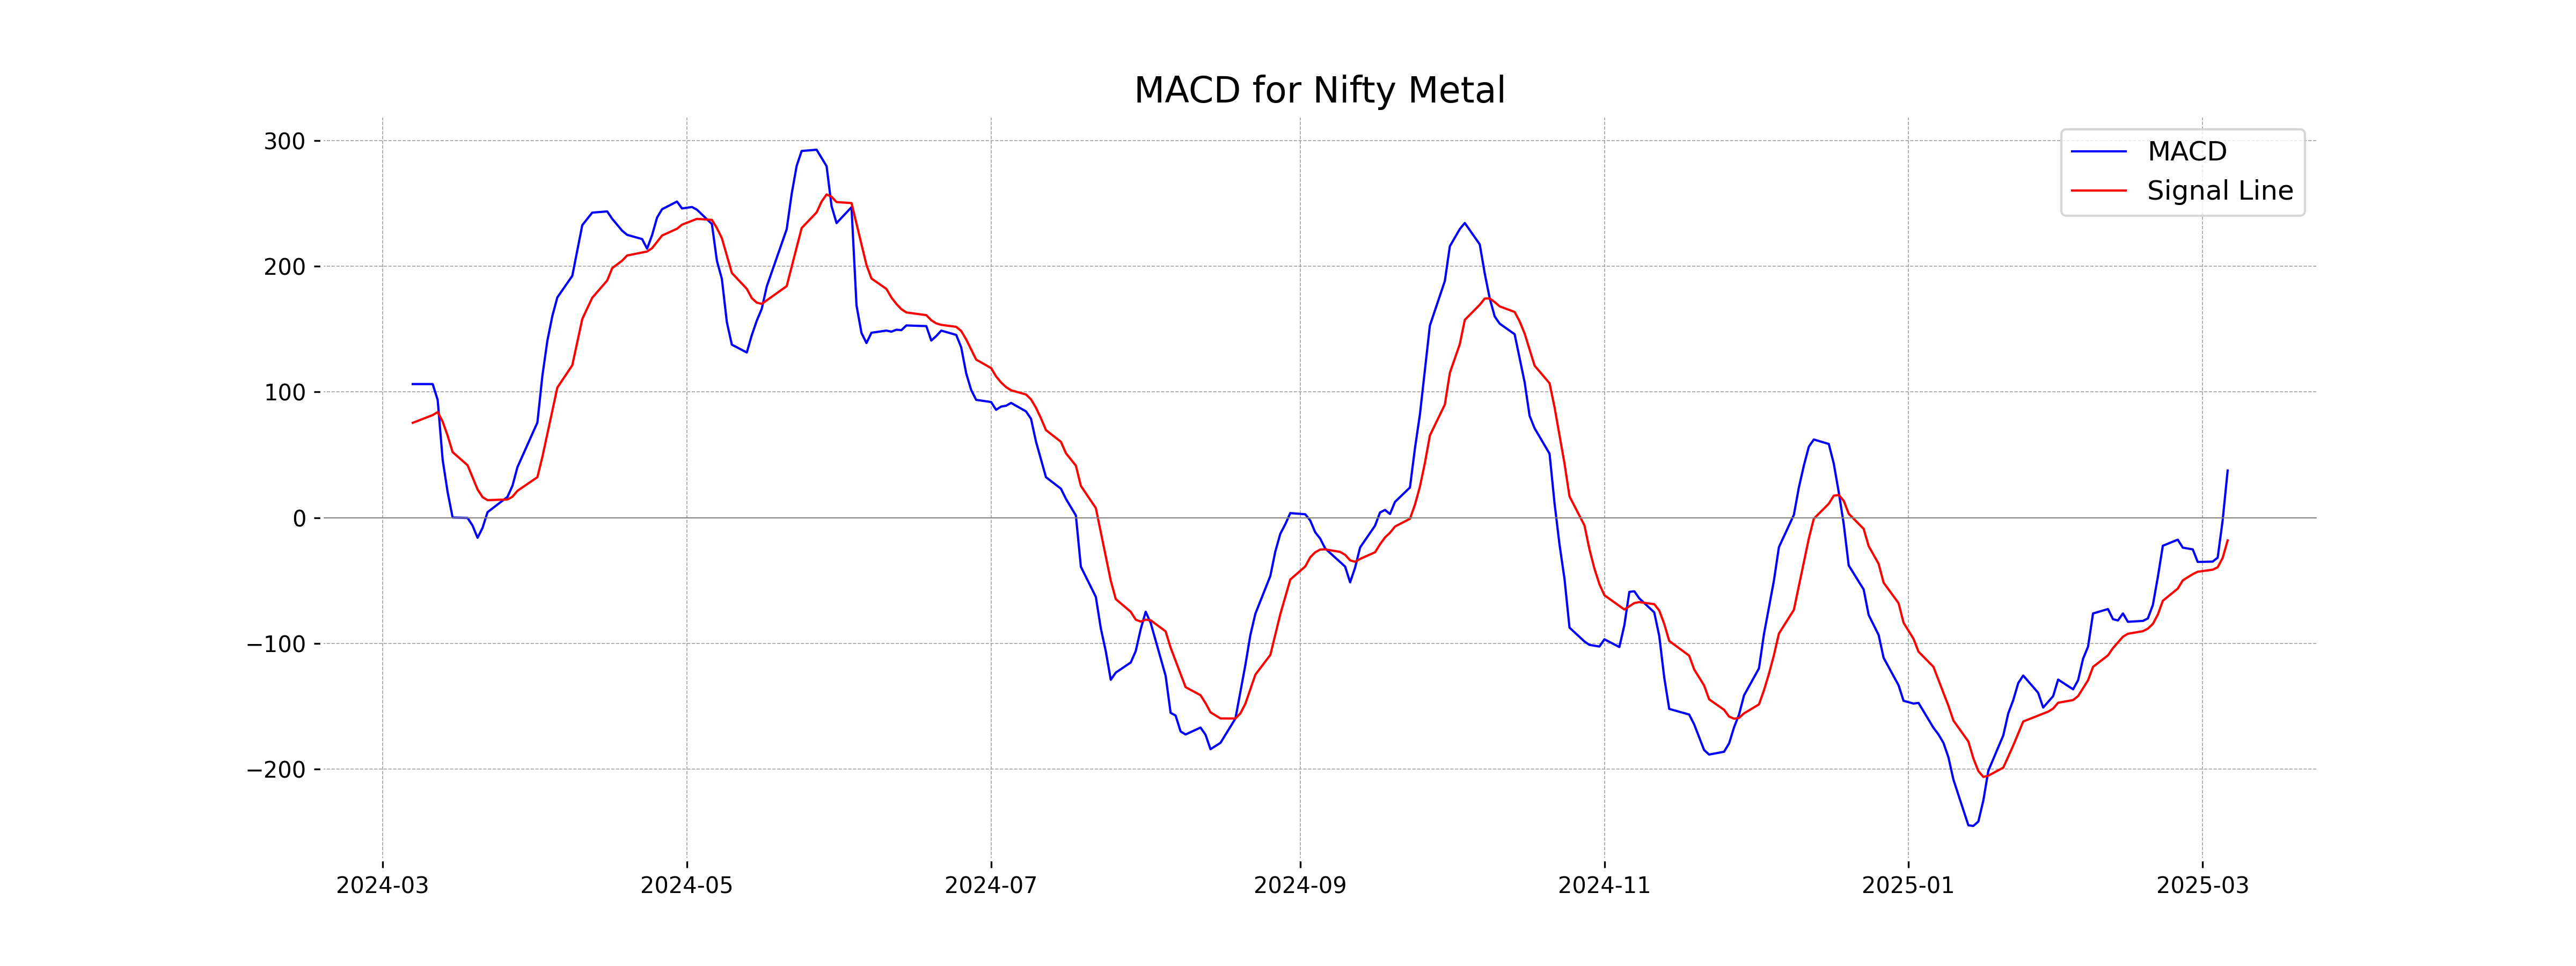
Moving Averages Trend (MACD)
Nifty Metal Analysis: The MACD for Nifty Metal is 37.48, while the MACD Signal is -18.11. The positive MACD above the signal line suggests upward momentum, indicating a potential bullish trend continuation.
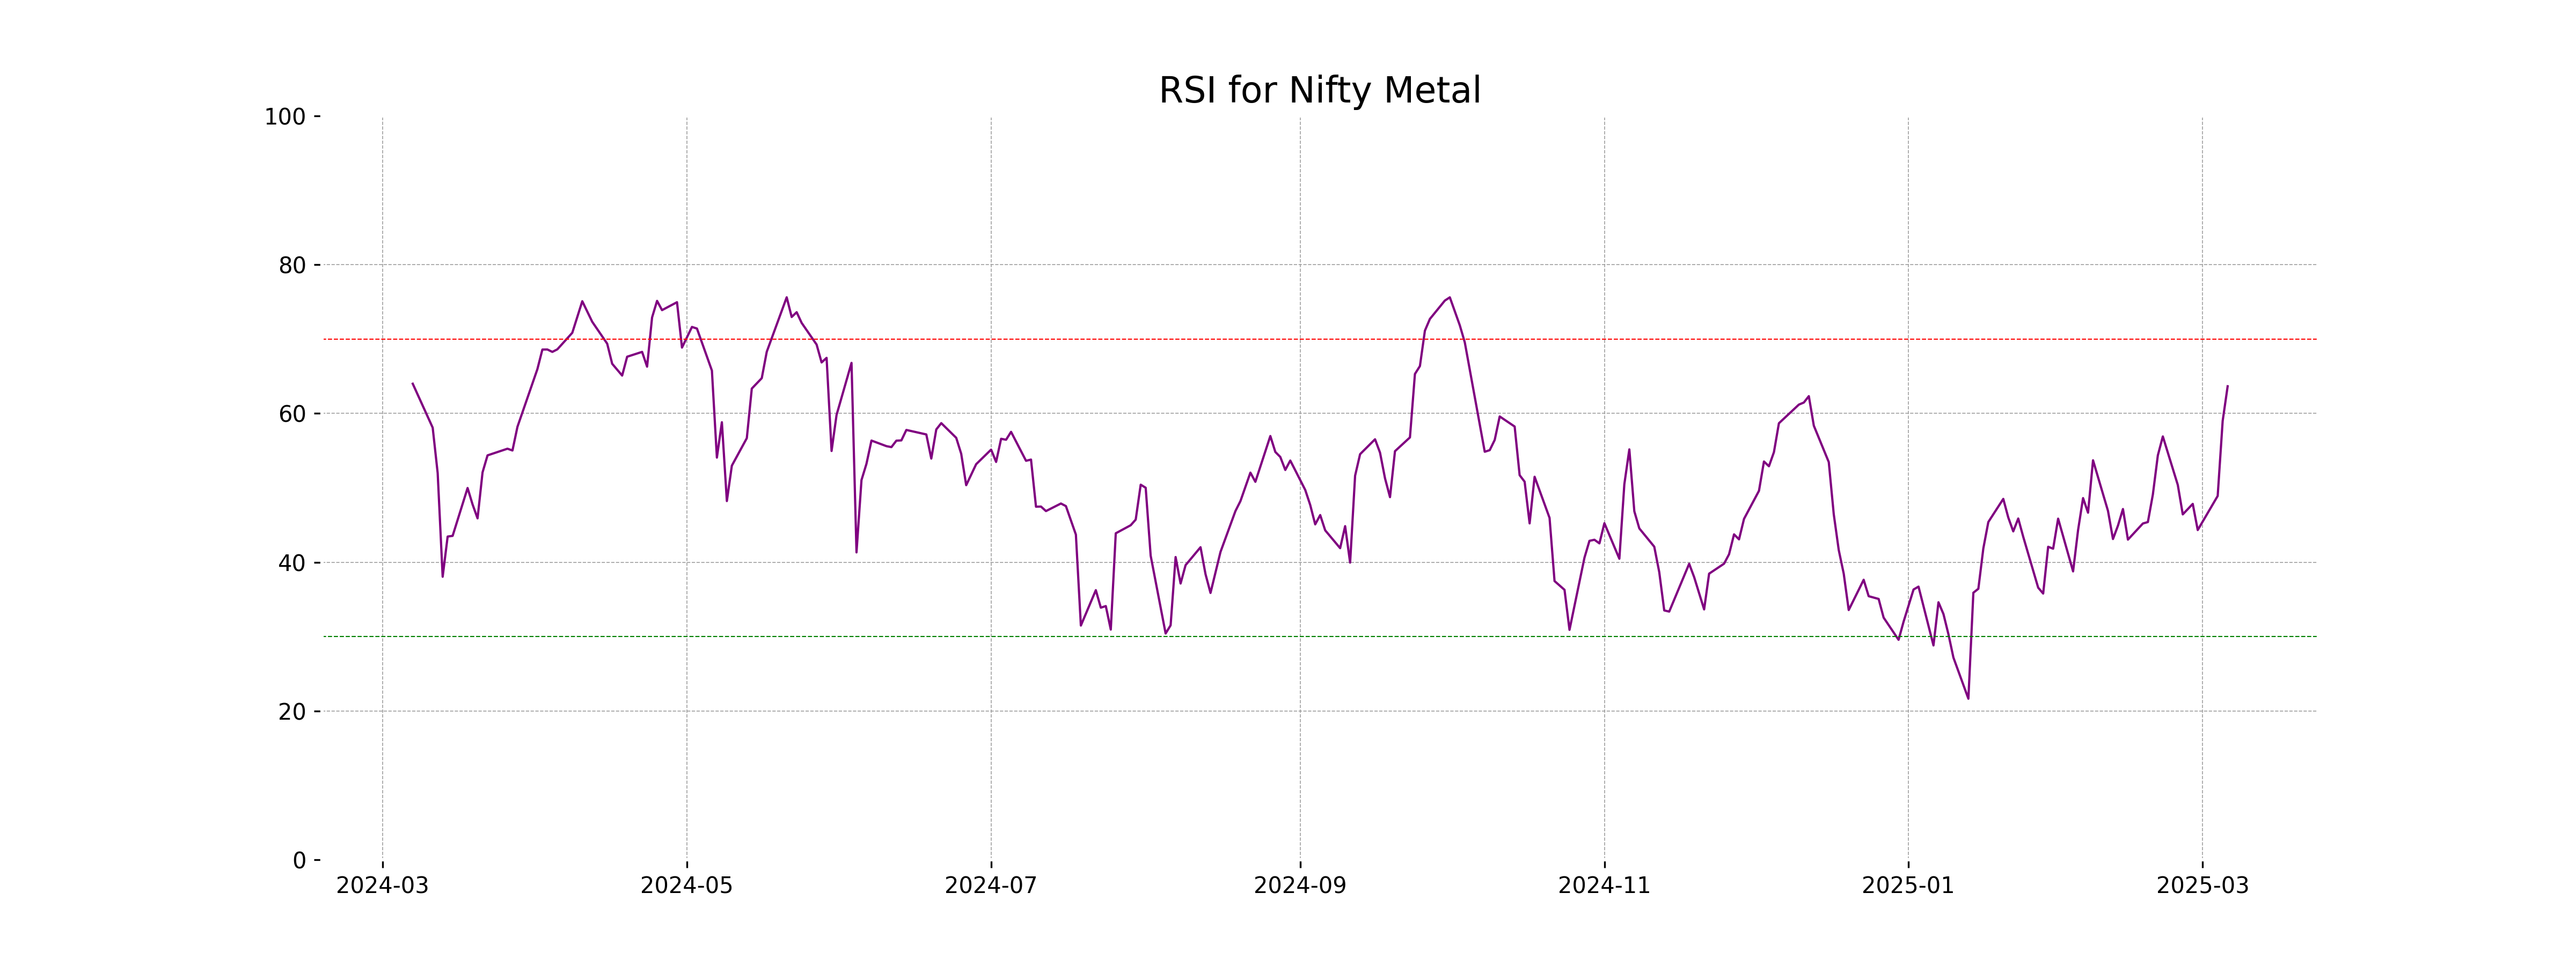
RSI Analysis
The RSI value for Nifty Metal stands at 63.65, which suggests that the index is approaching overbought territory but not yet excessively overvalued. With the RSI above 60, it indicates stronger momentum and potential continuation of the current trend, though investors should watch for signs of a reversal as it nears higher levels.
Analysis for Nifty Bank - March 06, 2025
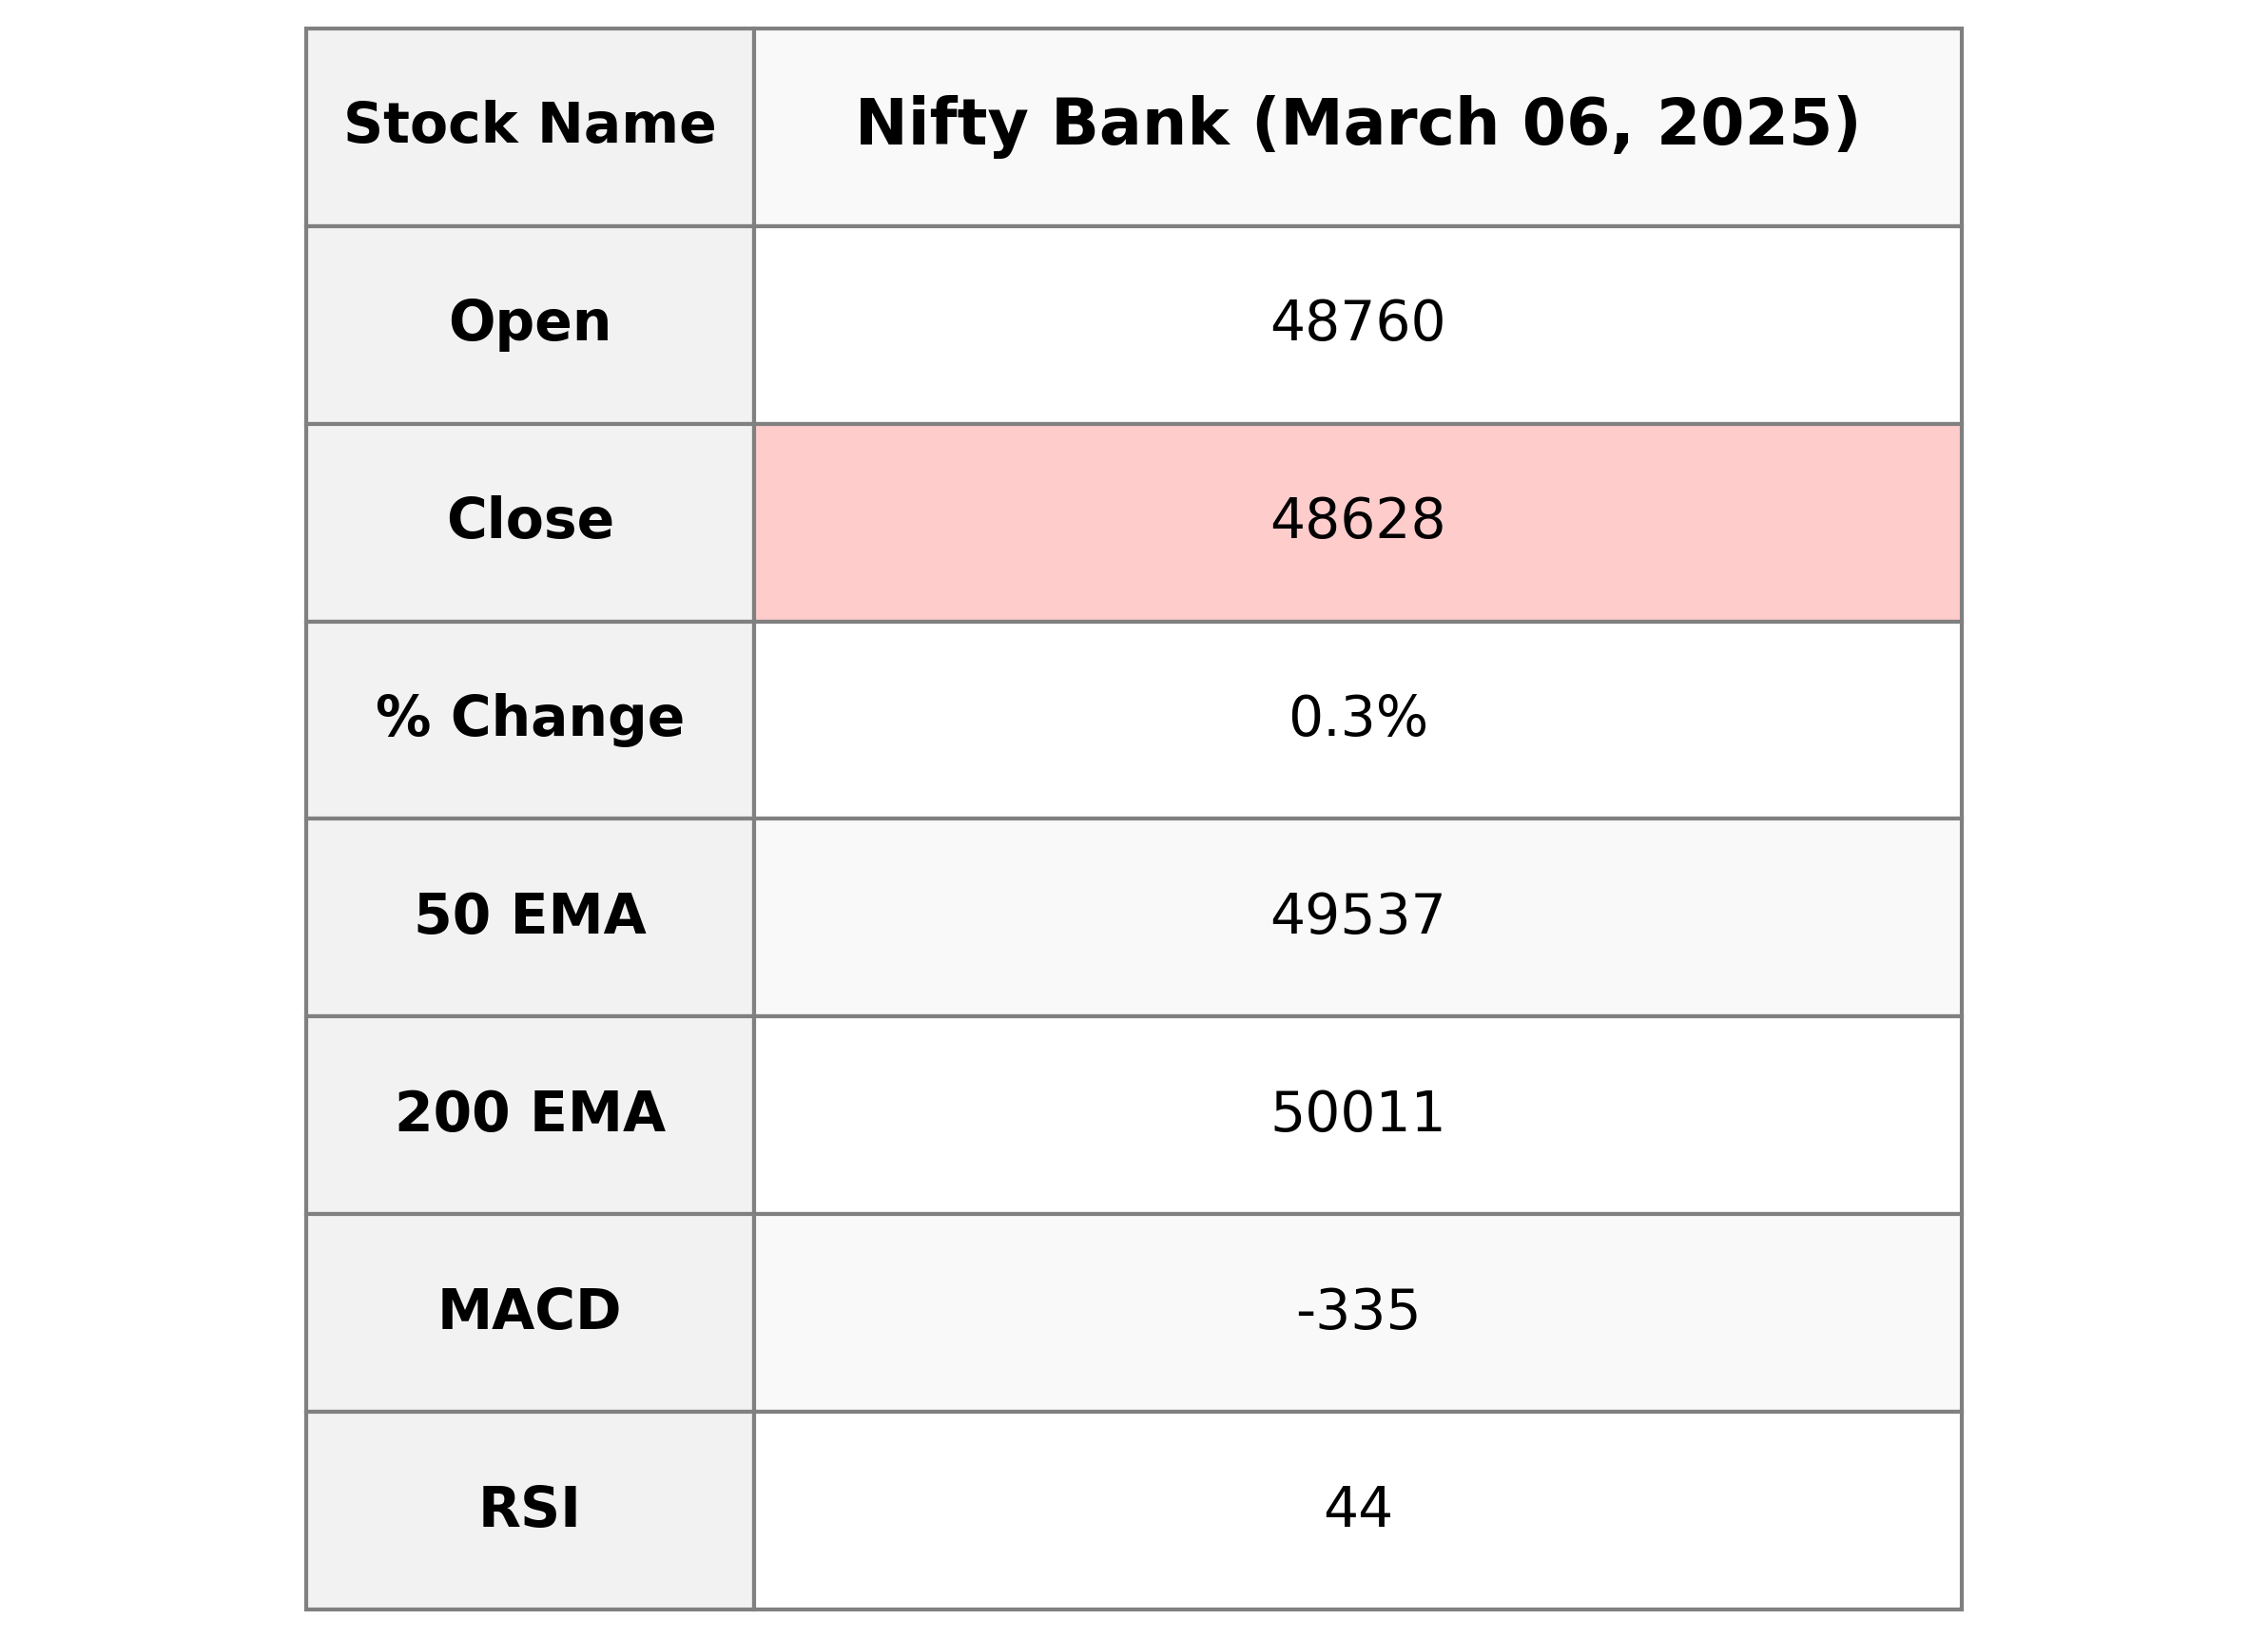
Nifty Bank opened at 48760.0 and closed slightly higher at 48627.7, exhibiting a small positive percentage change of 0.28%. Despite reaching an intraday high of 48839.1, the index faced resistance, reflected by its lower RSI of 43.97, indicating mild bearish momentum. The MACD suggests a bearish trend as it remains below the signal line, and both the short and long-term EMAs are below the 50 and 200-day averages, indicating potential continued weakness.
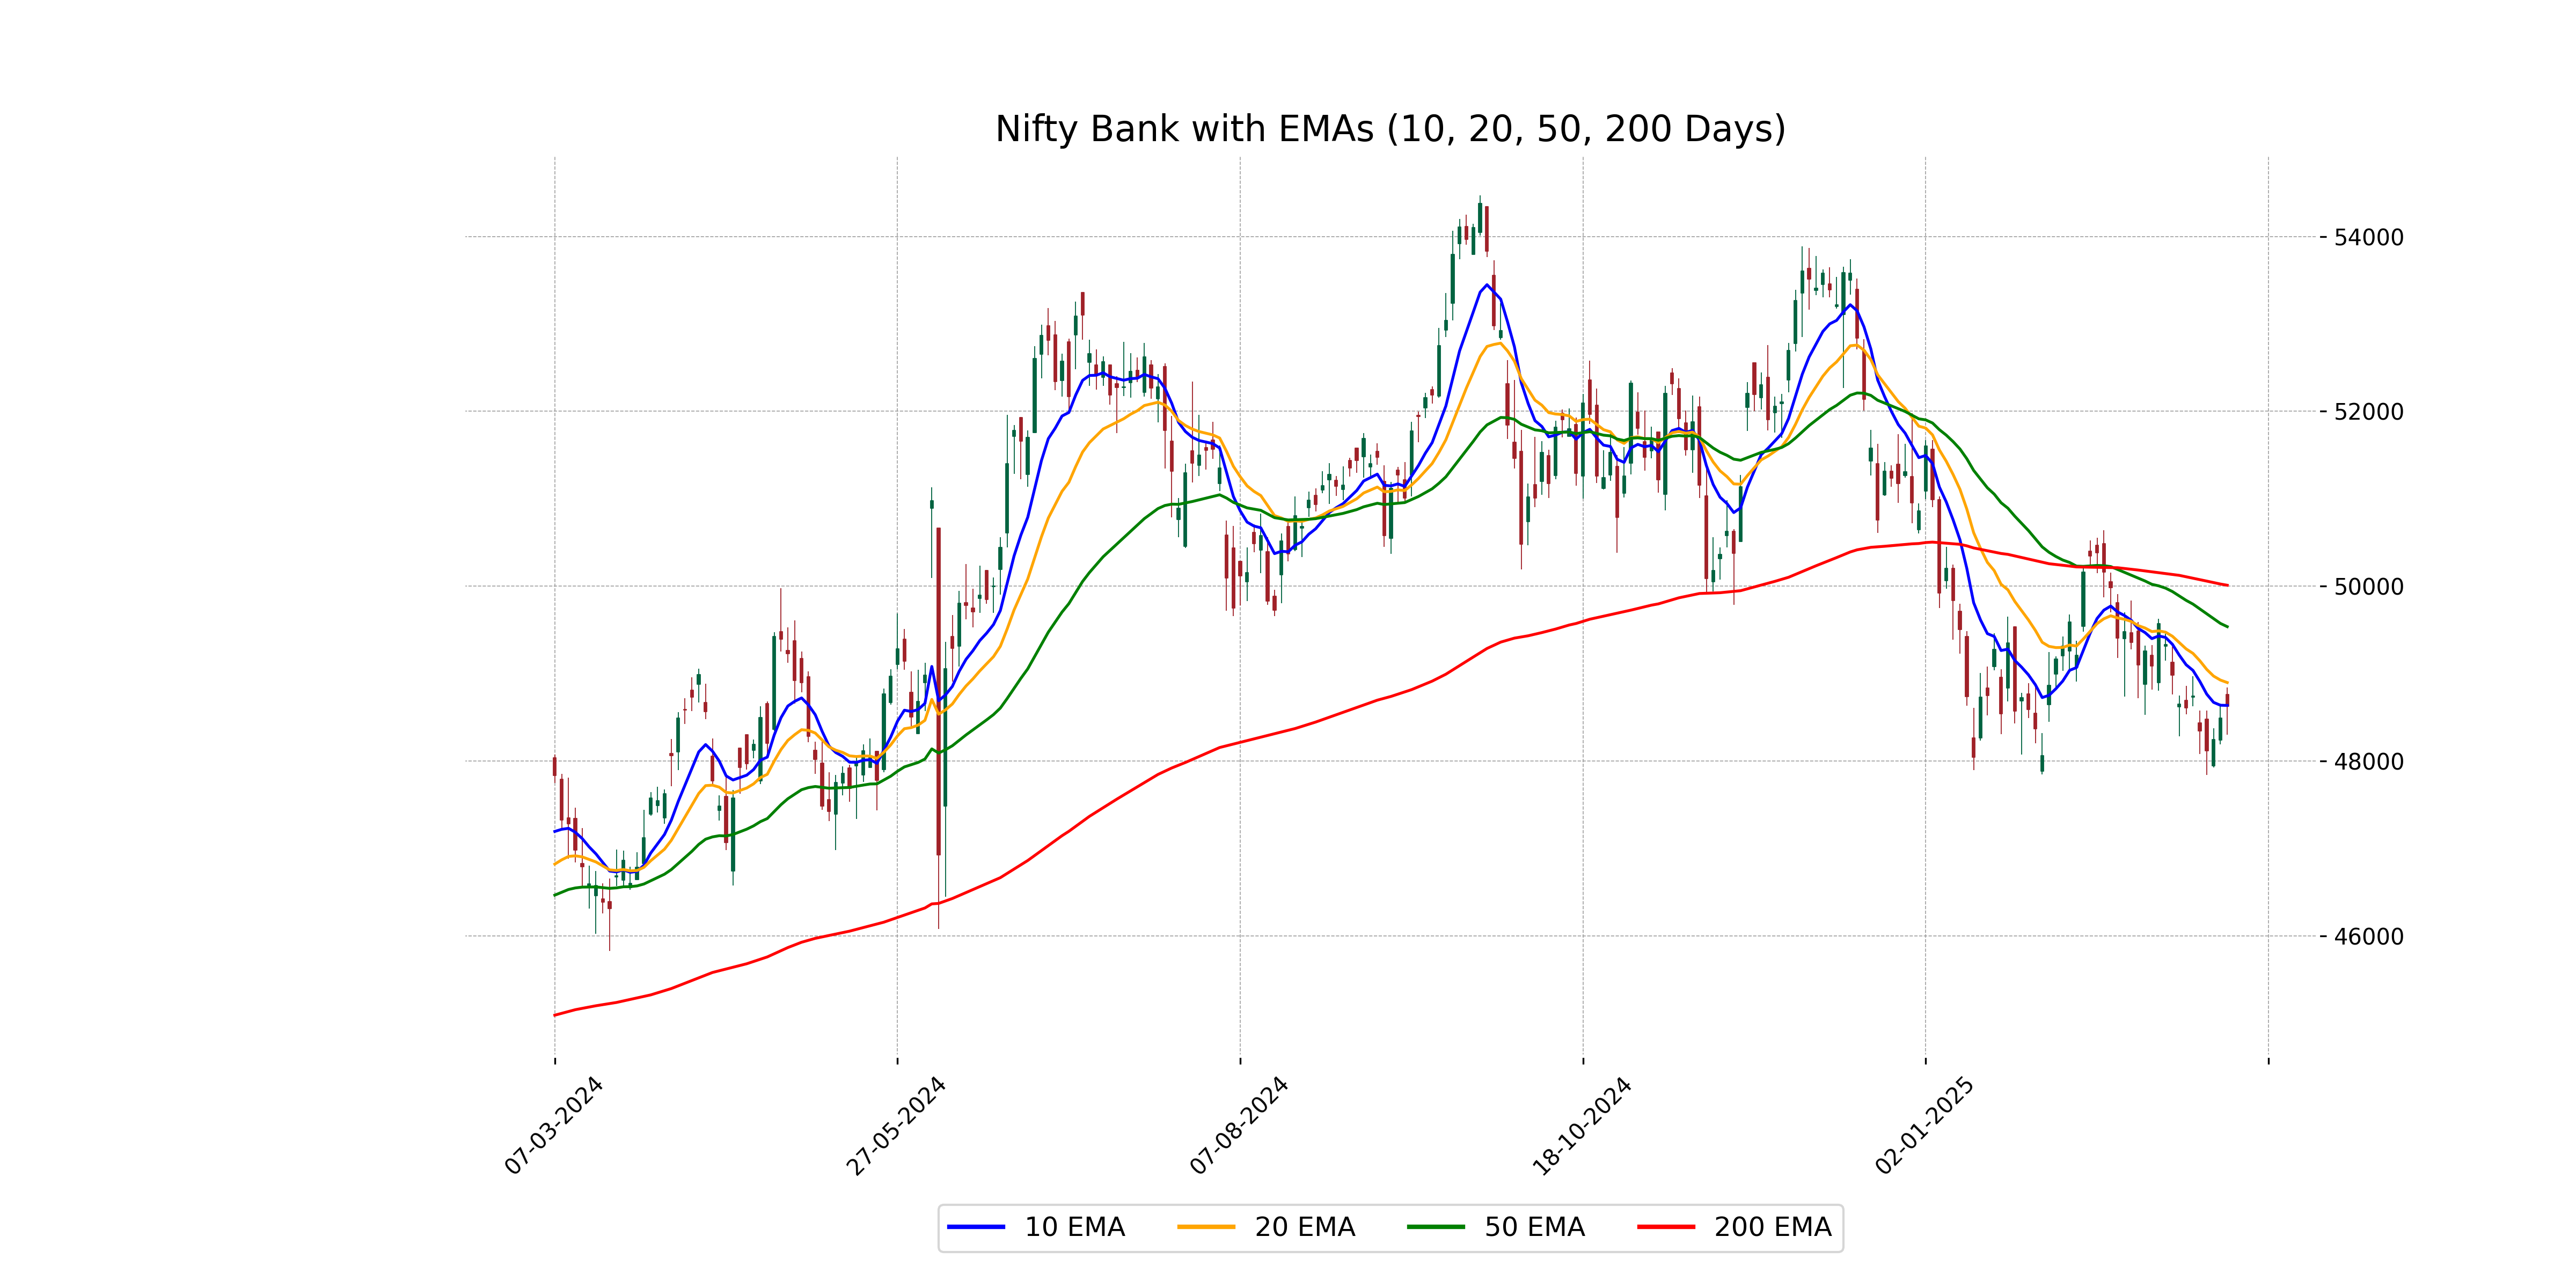
Relationship with Key Moving Averages
The closing price of Nifty Bank at 48,627.70 is below both its 50-day EMA of 49,536.74 and 200-day EMA of 50,010.52, indicating a bearish trend relative to these key moving averages. However, the price is very close to the 10-day EMA of 48,636.23, suggesting recent movement may be less bearish.
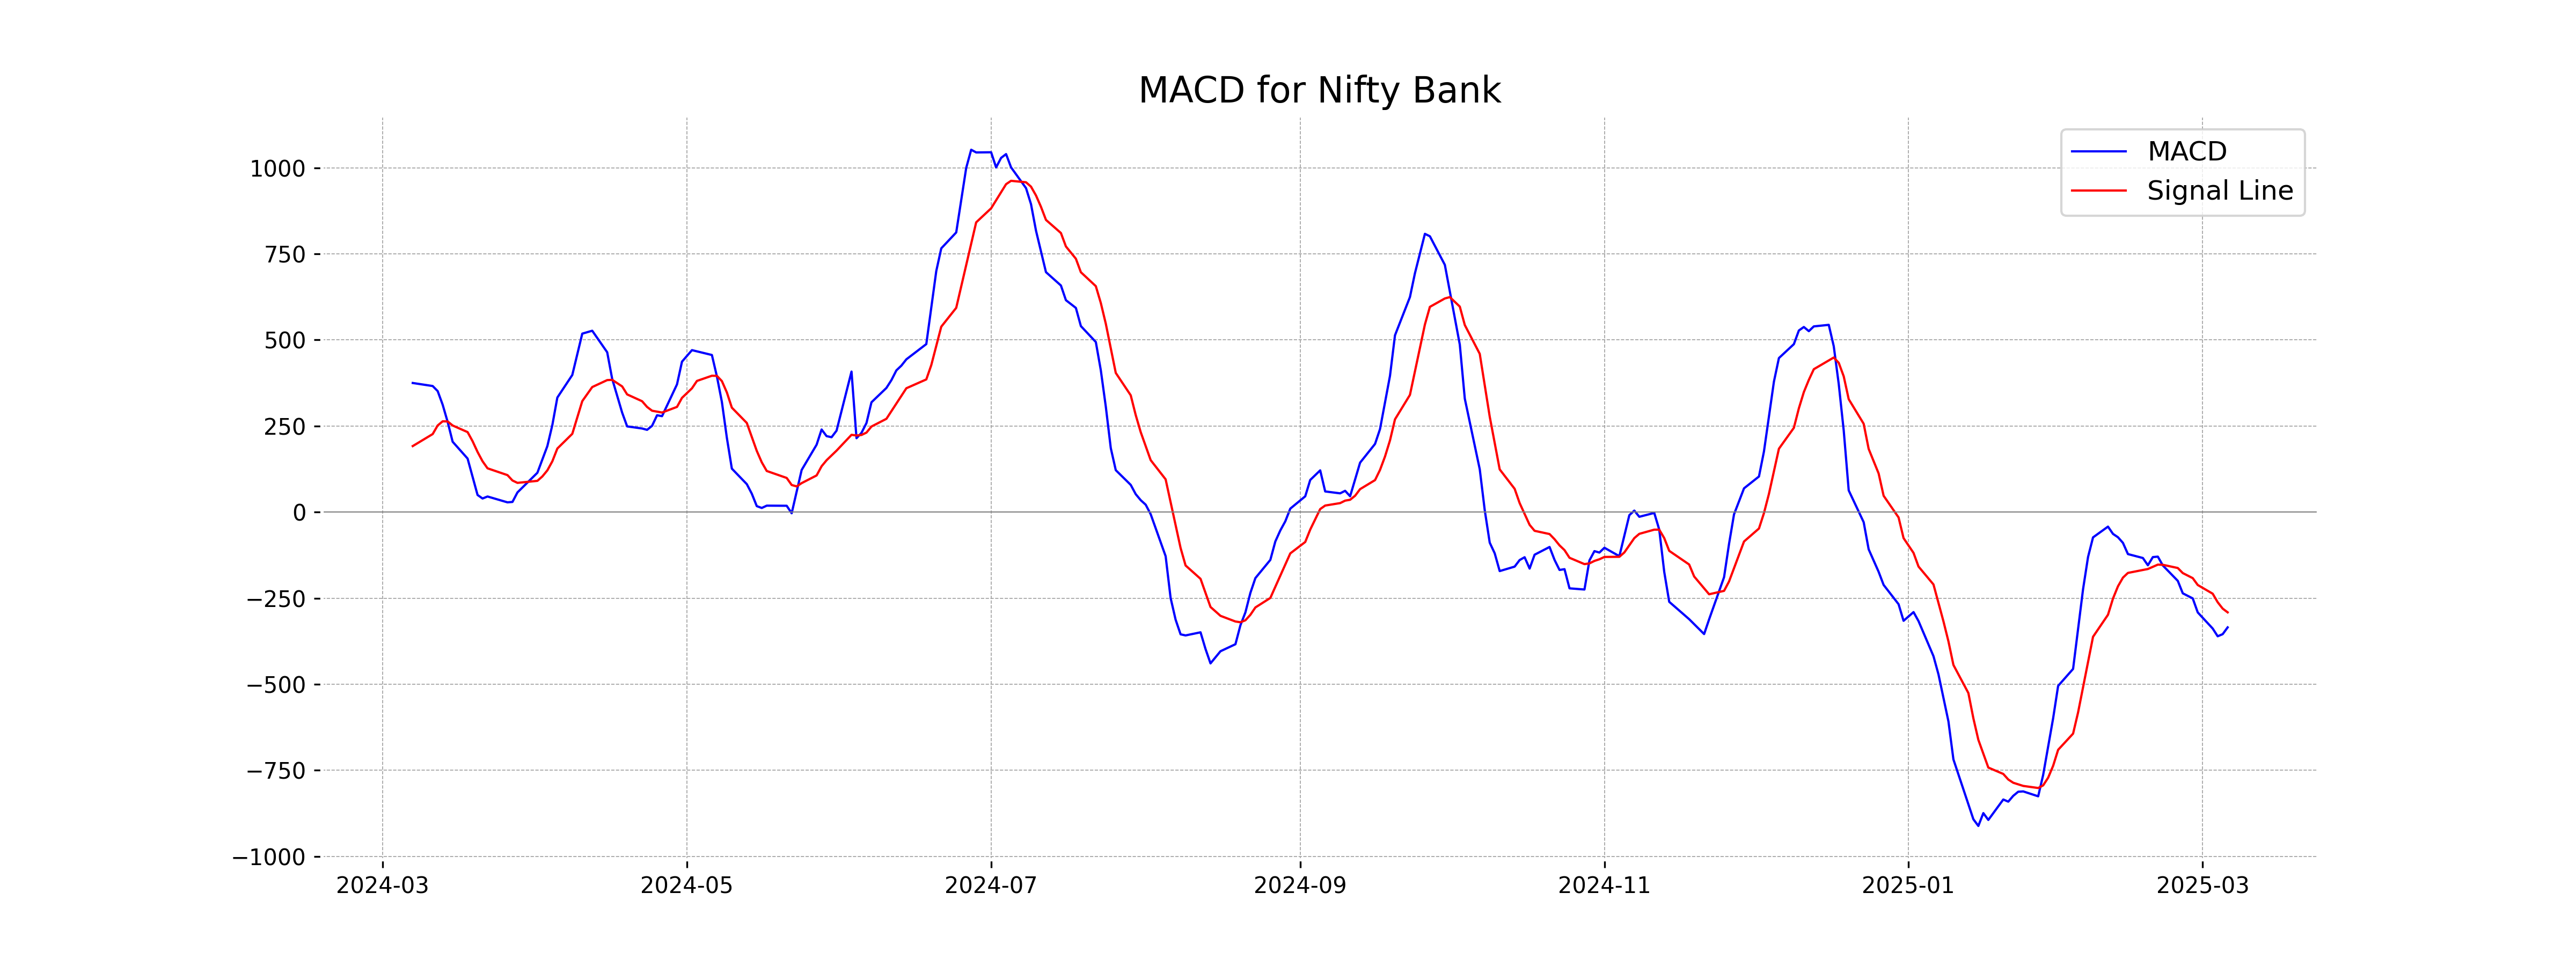
Moving Averages Trend (MACD)
Based on the data provided, Nifty Bank has a MACD of -334.82 and a MACD Signal of -291.24, indicating a bearish trend as the MACD line is below the signal line. This suggests potential downward momentum in the short term.
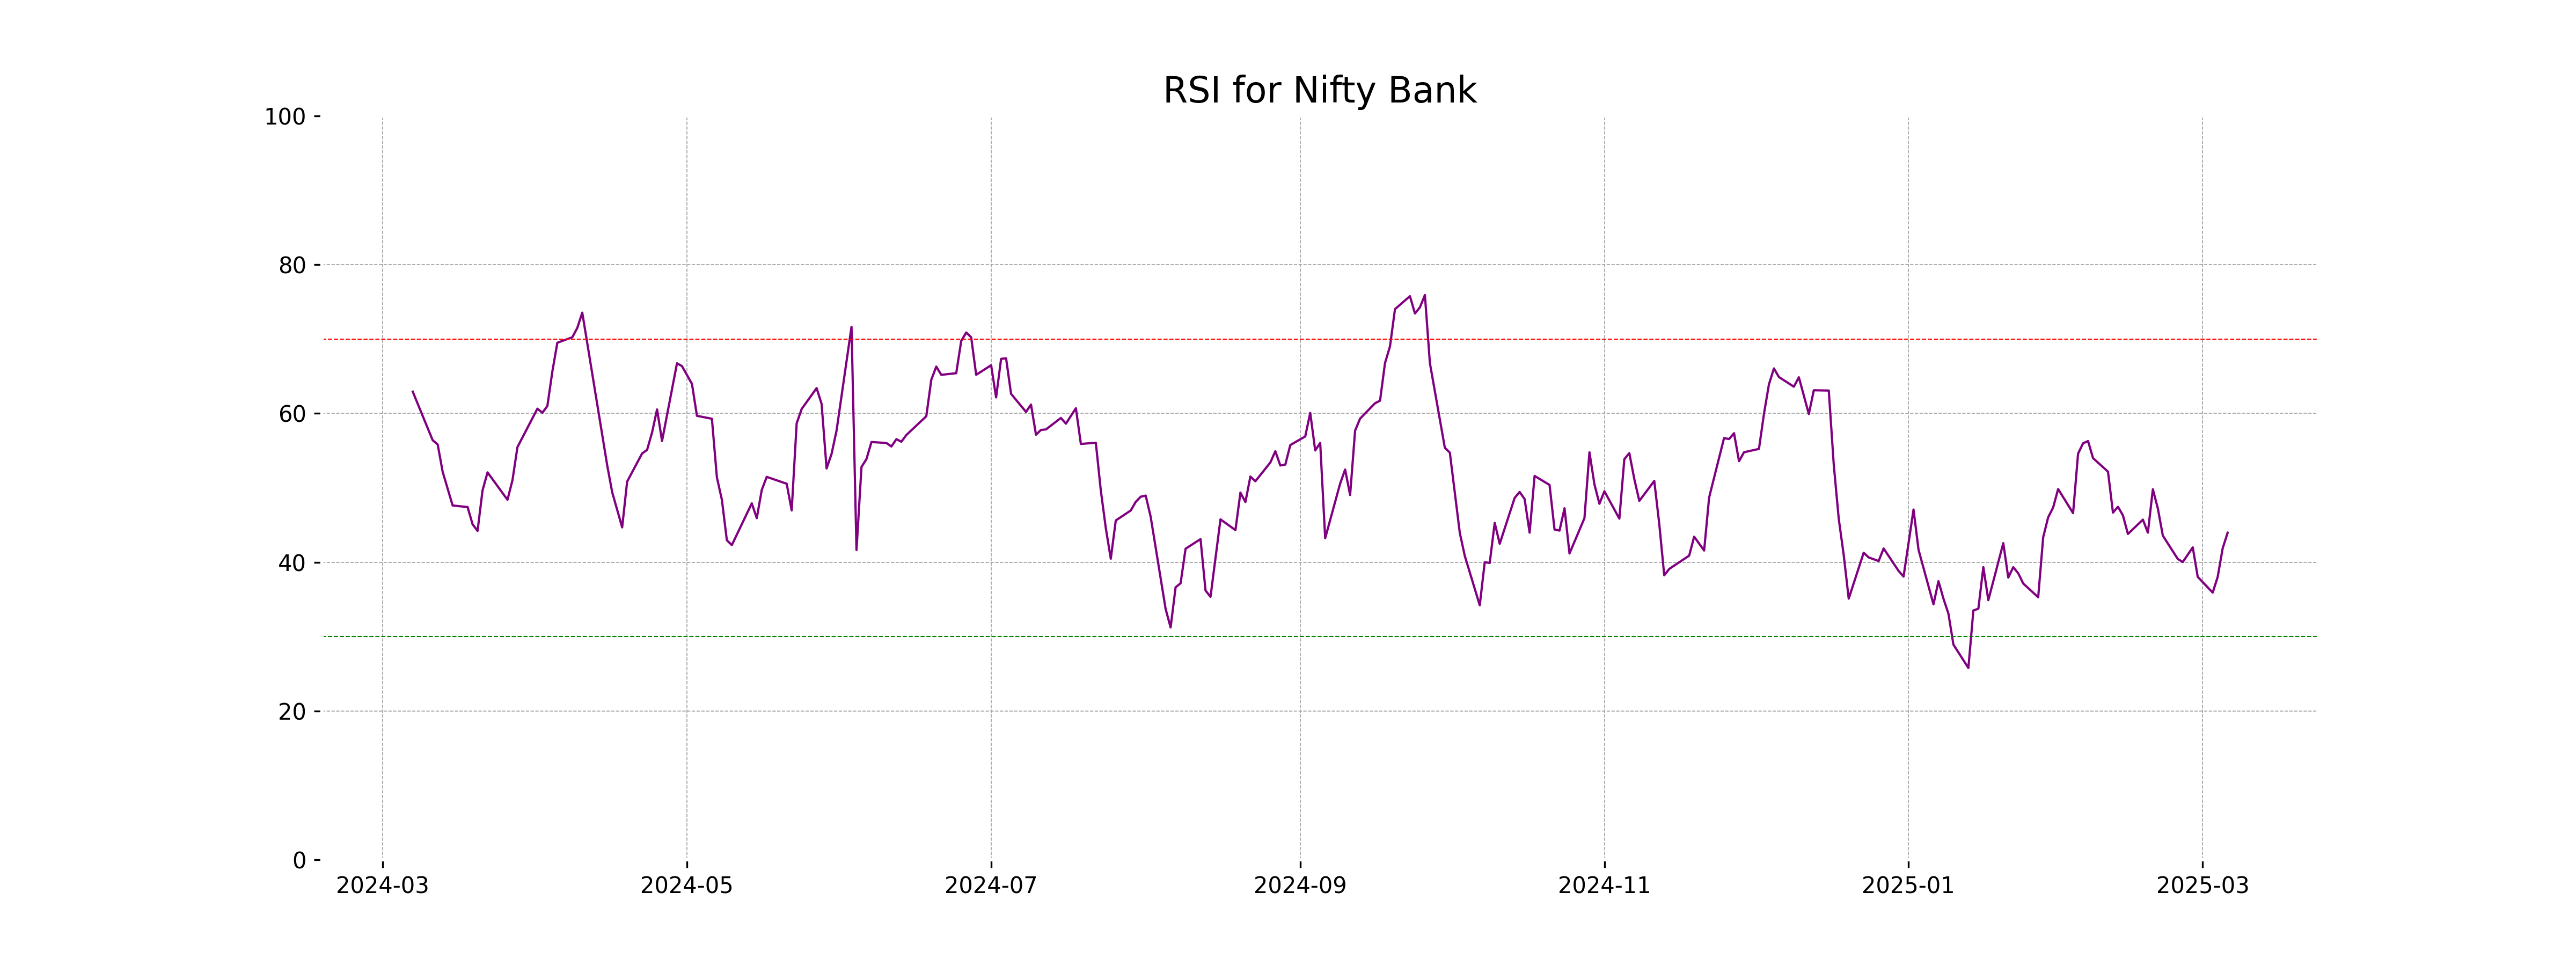
RSI Analysis
The relative strength index (RSI) for Nifty Bank is 43.97, which is below the neutral mark of 50, suggesting potential bearish momentum. An RSI below 30 typically indicates an oversold condition, so Nifty Bank is not in the oversold territory, but it is closer to suggesting a potential weakening in buying pressure.
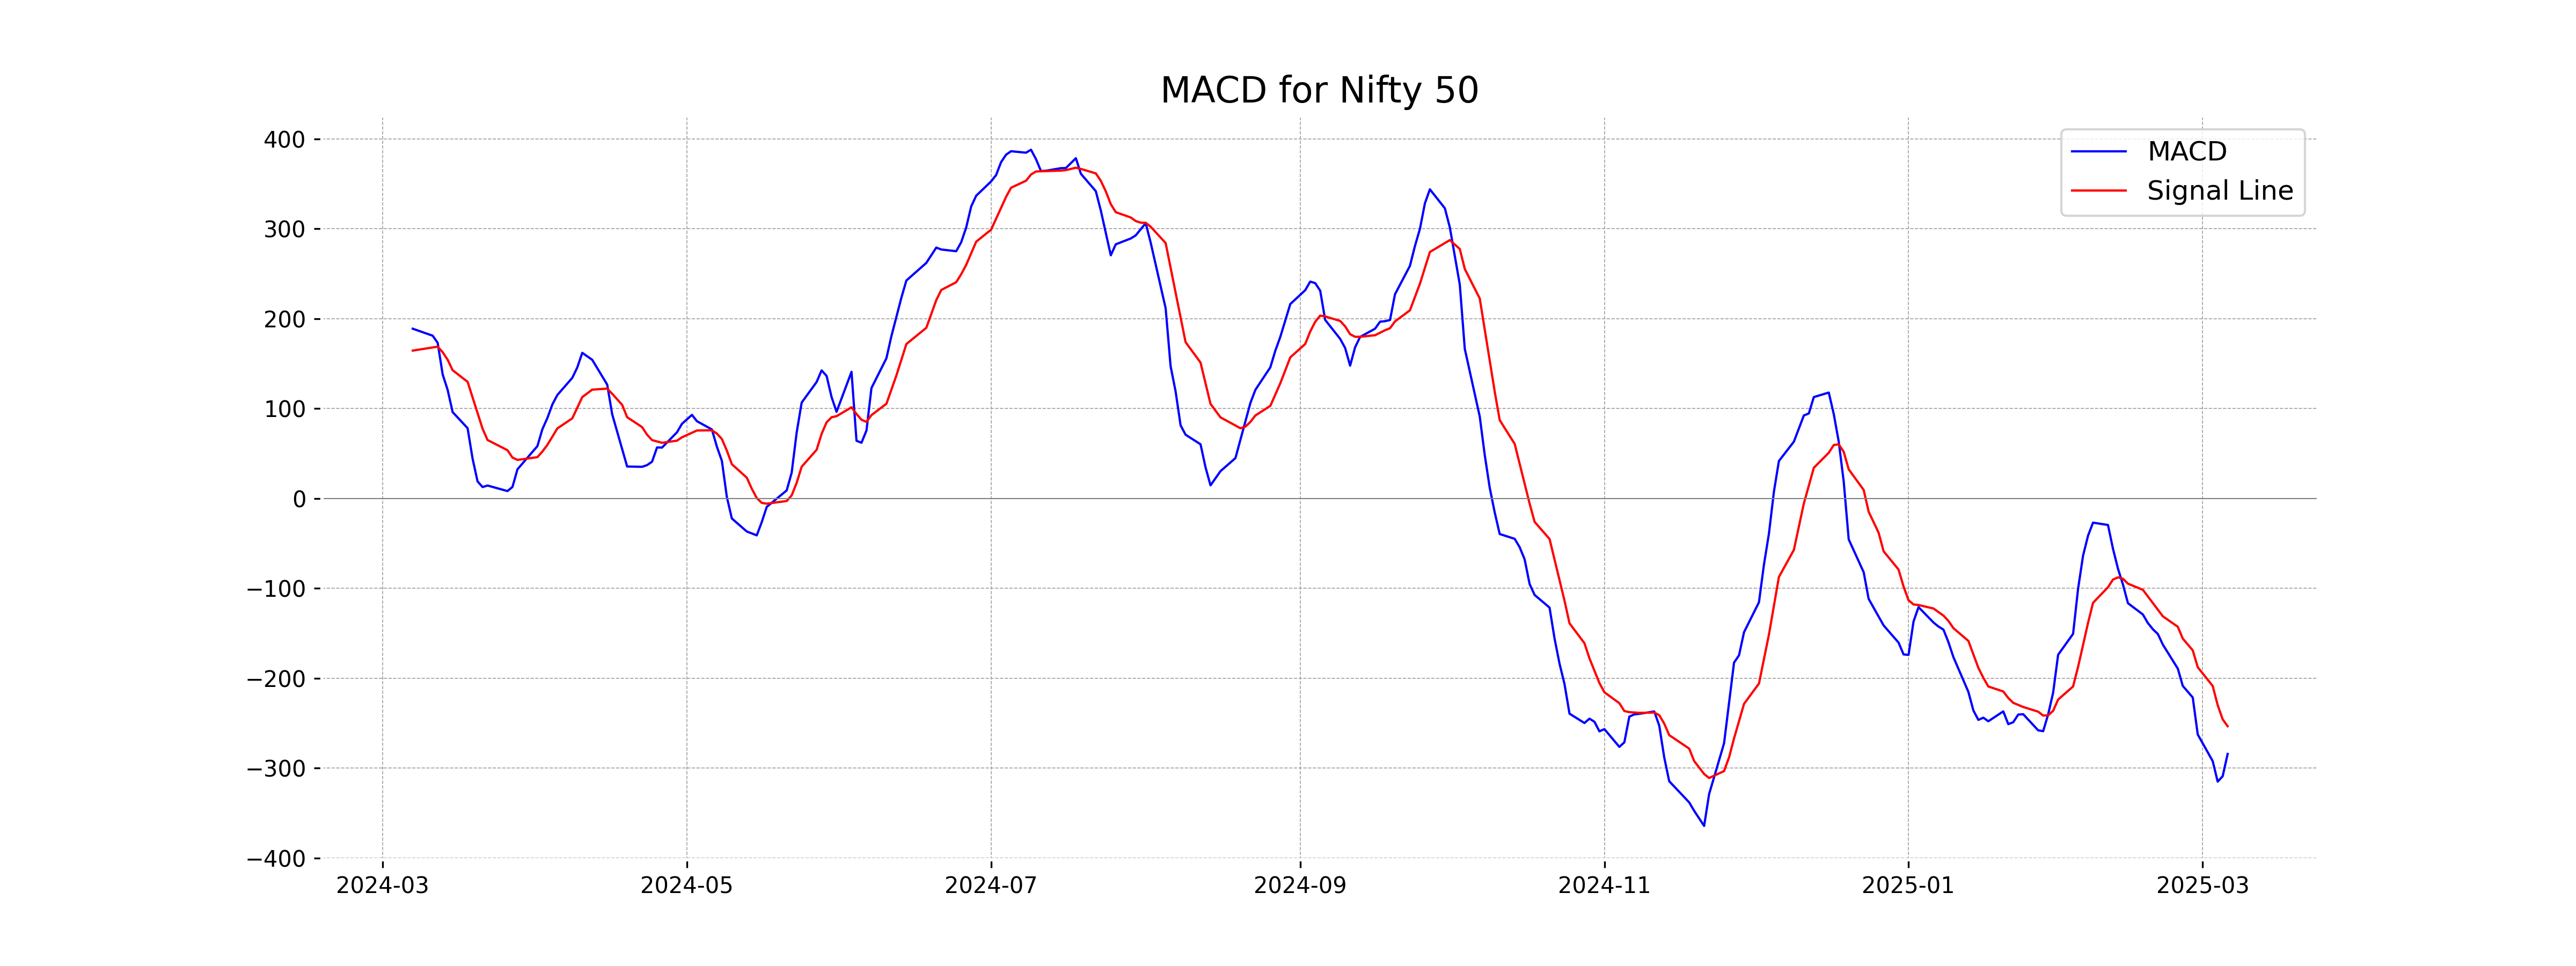
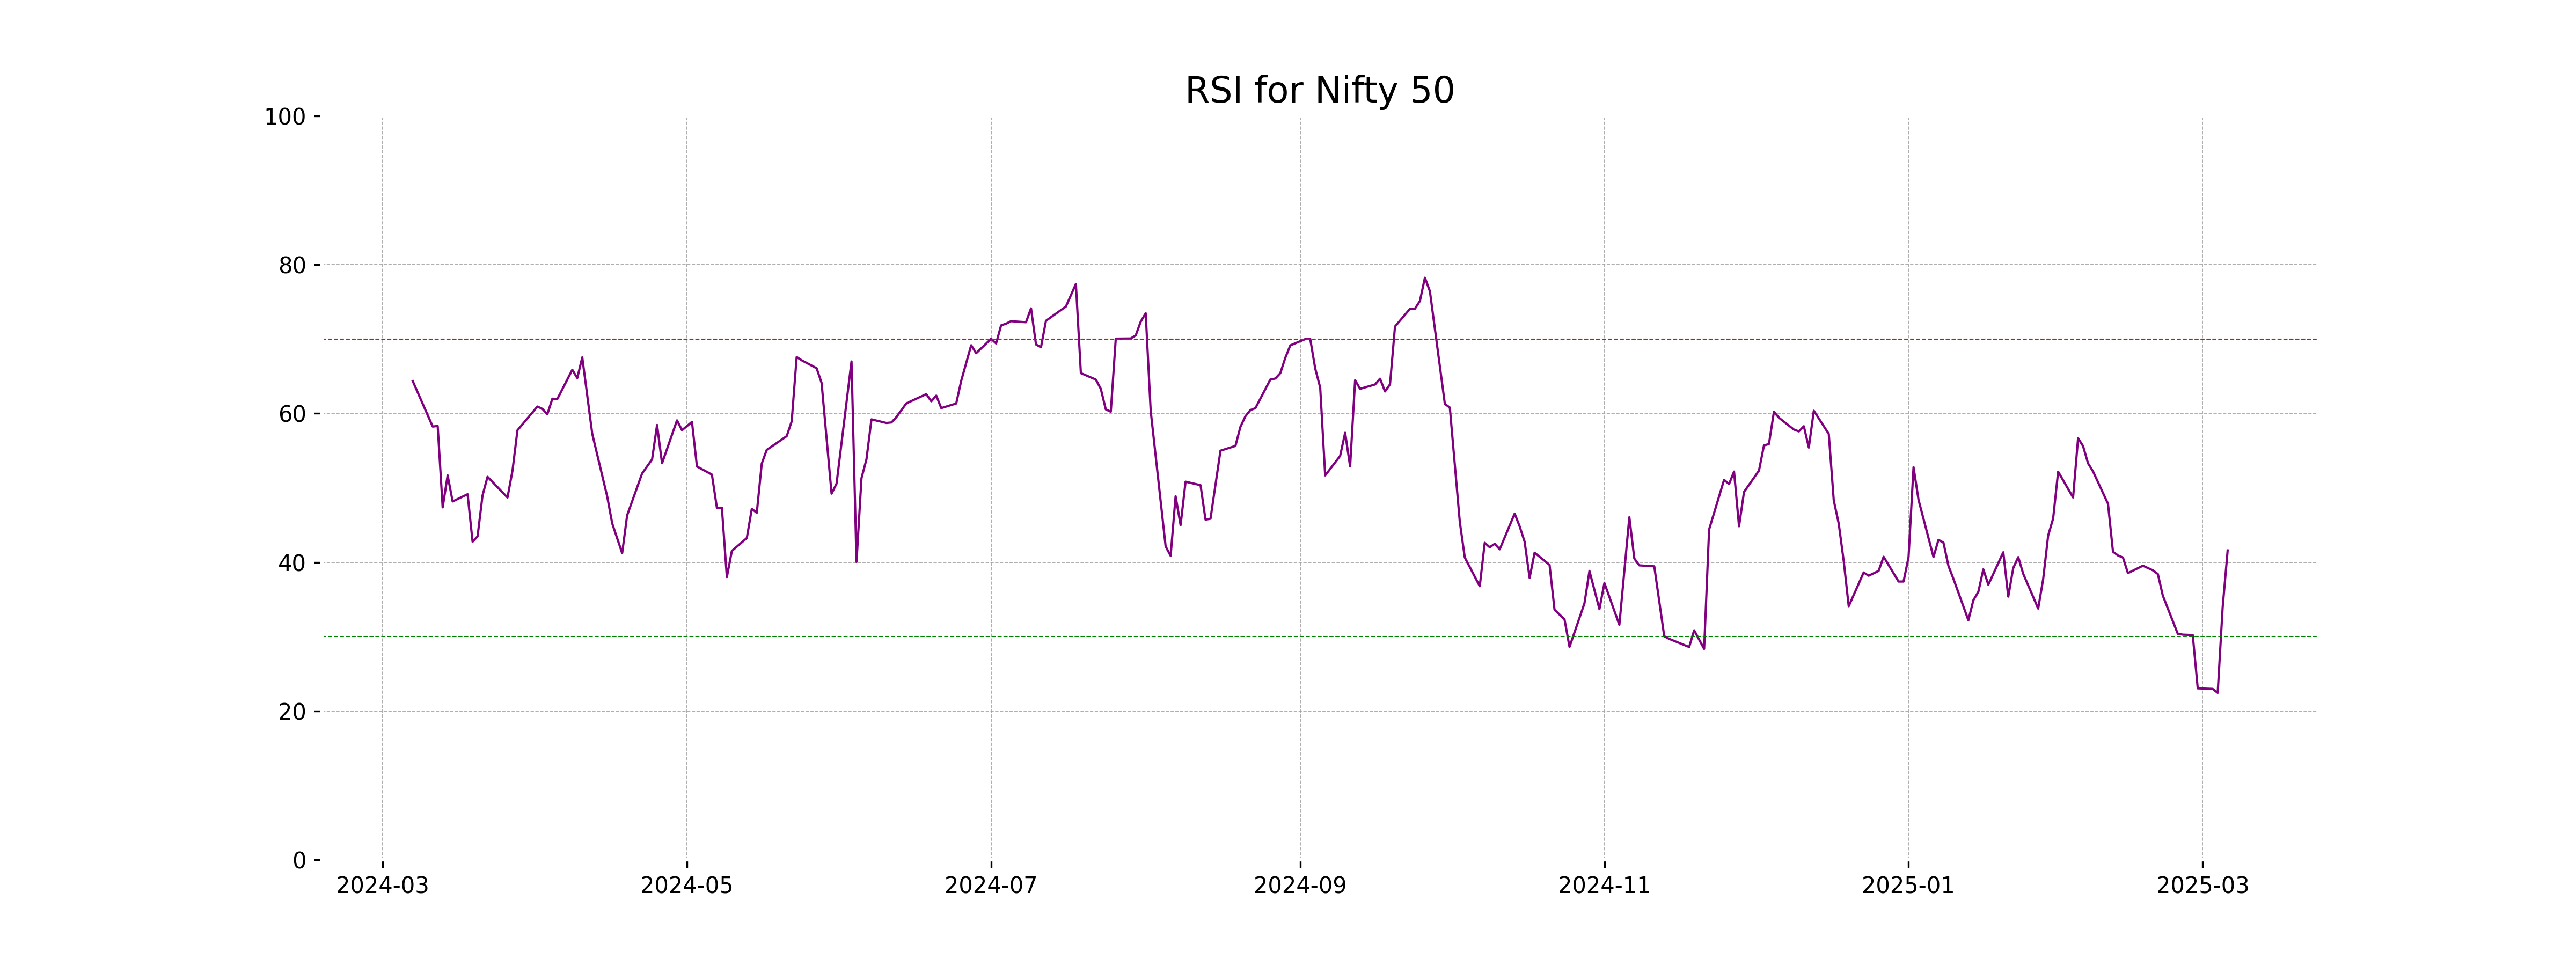
Analysis for Nifty 50 - March 06, 2025

The Nifty 50 index opened at 22,476.35 and closed at 22,544.70, marking a gain of approximately 0.93% with a point change of 207.40. The day's trading saw a high of 22,556.45 and a low of 22,245.85. Despite the rise in closing value, the RSI of 41.59 suggests a weaker momentum, and the negative MACD value indicates potential bearish trends.
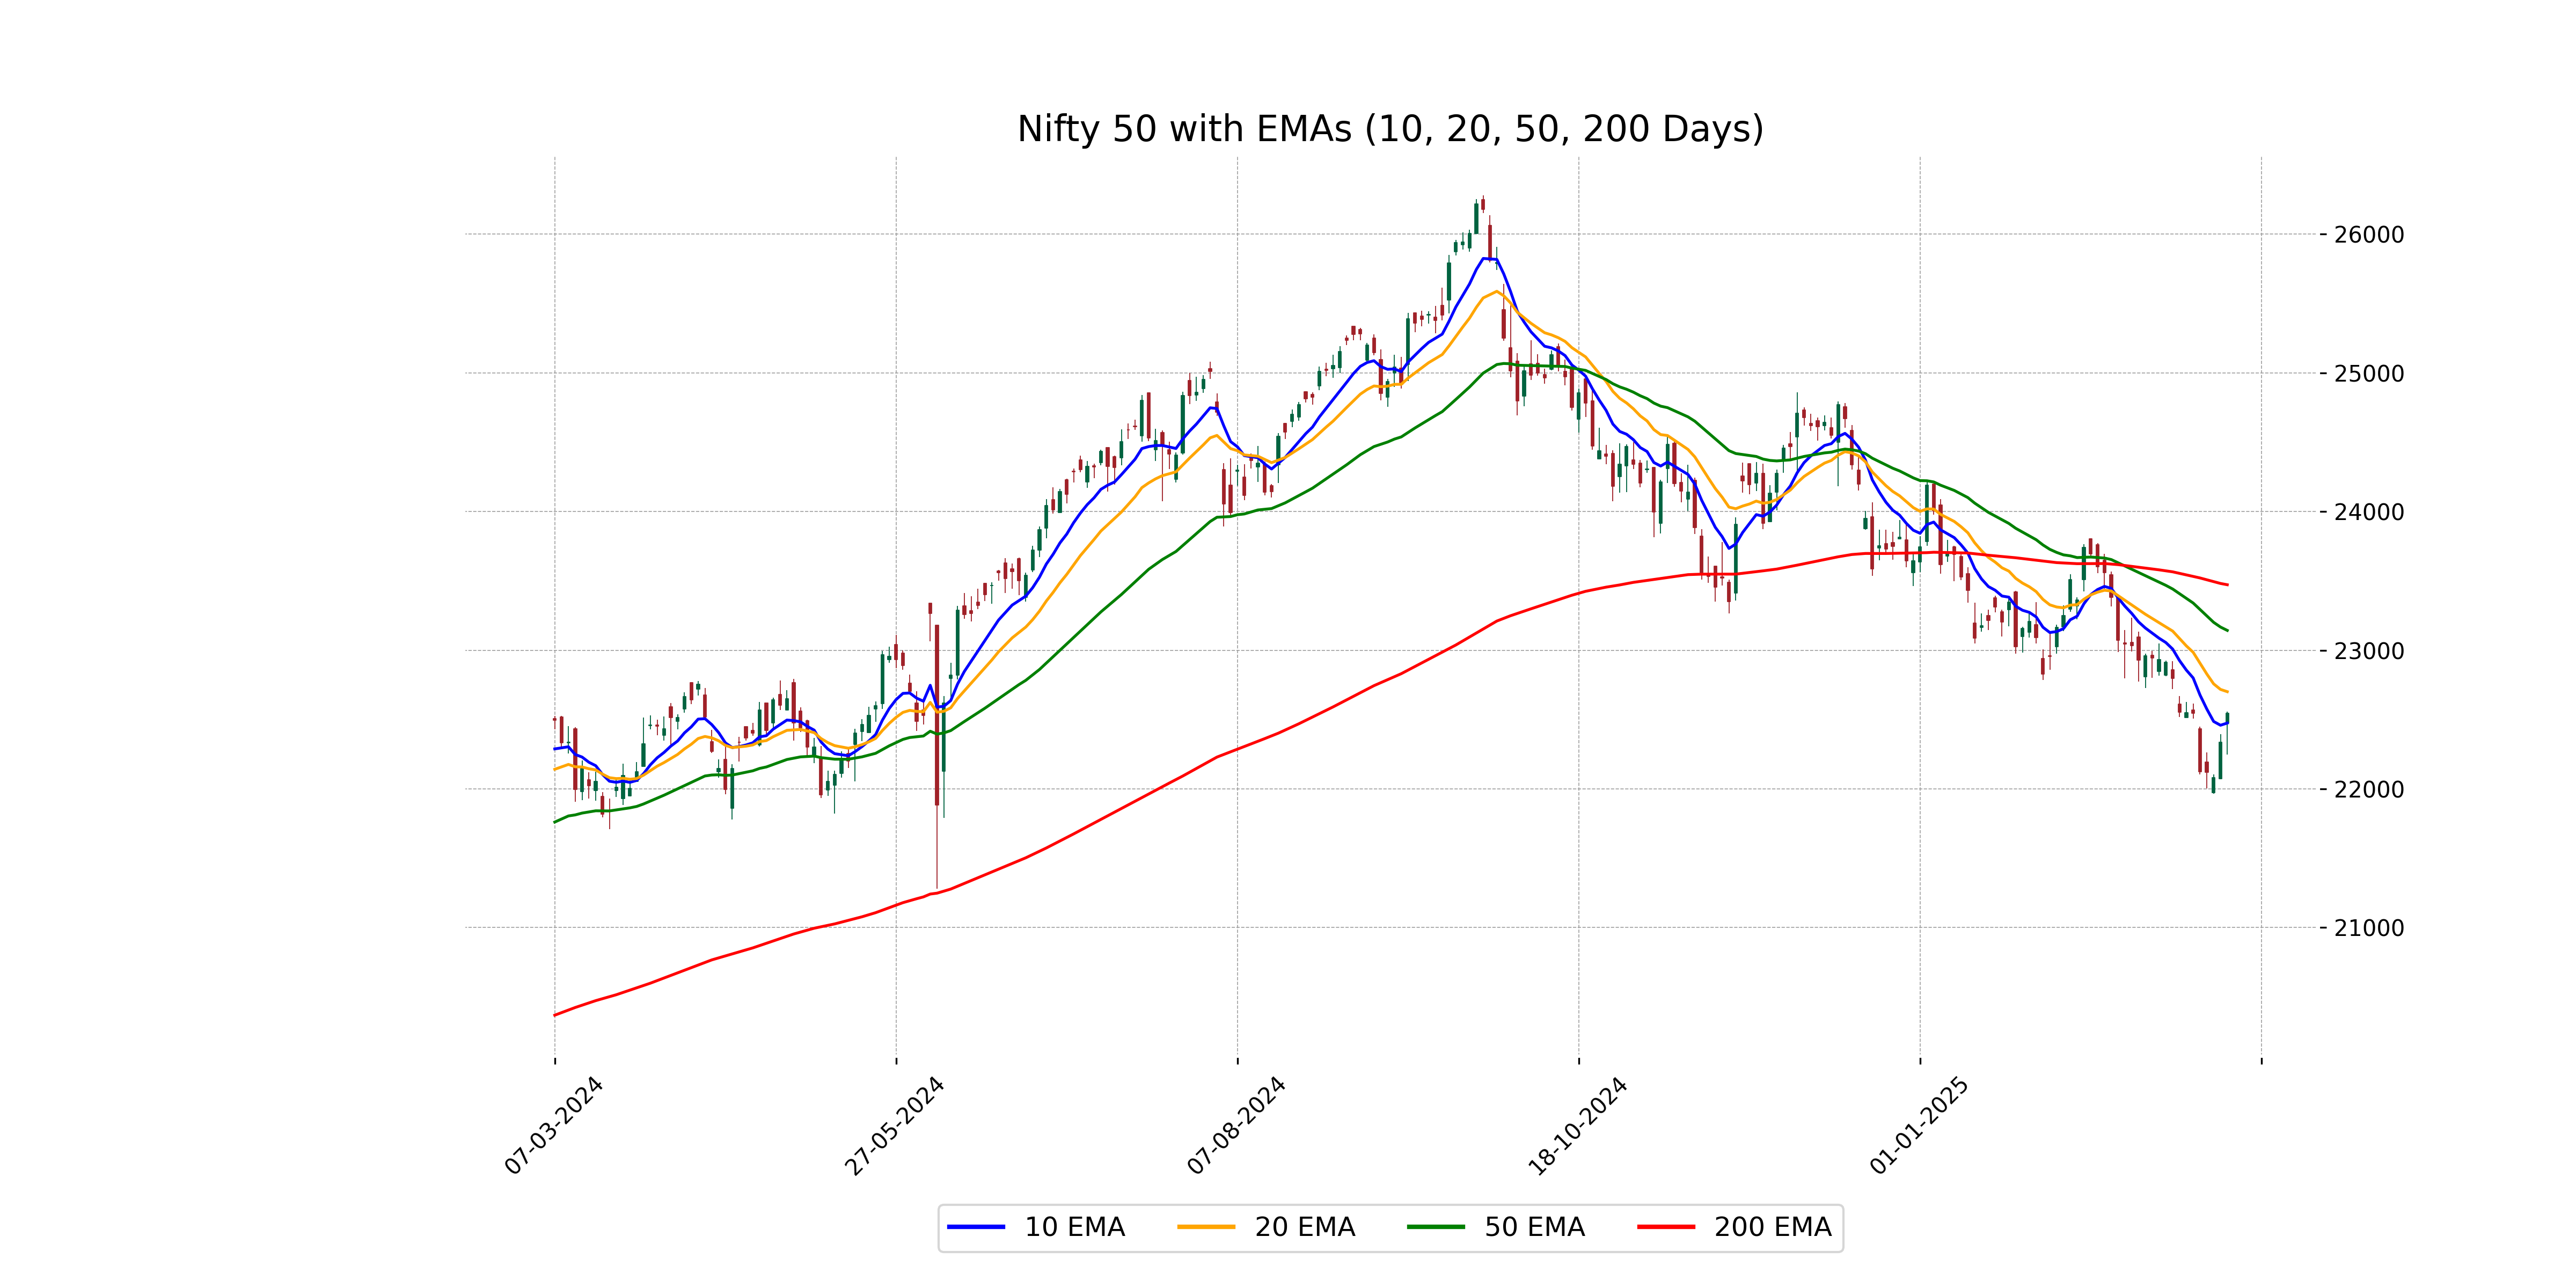
Relationship with Key Moving Averages
The Nifty 50 closed at 22,544.70, slightly above the 10-day EMA of 22,474.61 but below the 50-day EMA of 23,142.45. It is also below the 200-day EMA of 23,471.70, indicating potential downward pressure compared to longer-term trends.
Moving Averages Trend (MACD)
Based on the data, Nifty 50's MACD value of -284.25 is below the MACD Signal value of -253.43. This indicates a bearish trend, suggesting that the market may continue to experience downward momentum in the short term.
RSI Analysis
The RSI (Relative Strength Index) for Nifty 50 is currently at 41.59, indicating it is in the neutral to slightly oversold zone. Generally, an RSI below 30 suggests a stock might be oversold, while above 70 indicates overbought conditions. Nifty 50's RSI suggests it is slightly weak but not yet in the oversold territory.
Up Next
Indian stock market sector-wise performance today - March 06, 2025

Centre plans to borrow Rs 8.20 lakh cr from market in first half of FY27

Reliance denies buying Iranian oil amid US sanctions waiver

Premium petrol price up Rs 2, industrial diesel up Rs 22; no change in normal petrol, diesel rates

India's GDP expected to register over 8 pc growth in Sep-Dec: Report

Govt announces seven measures to help boost exports

More videos

RBI keeps interest rates on hold after US trade deal boosts outlook

RBI proposes to compensate customers up to Rs 25,000 loss due to fraud

RBI raises GDP growth projection of Q1, Q2 of FY27

RBI pauses rate cuts, retains interest rate at 5.25 pc

Rupee jumps 122 paise to close at 90.27 against US dollar on India-US trade deal

Stock markets cheer India-US trade deal: Sensex, Nifty surge 2.5 pc

UPI transactions hit record high of Rs 230 lakh crore in 2025-26 till Dec: Govt

Explained: India-US trade deal, tariffs and trade benefits

Trade deal with US adds momentum to India's growth ambition: Industry leaders

Rupee jumps 119 paise to 90.30 against the US dollar on India-US trade deal