


Highlights
- Nifty Auto saw a drop of -1.31%, losing 268.95 points
- Nifty Energy gained 0.77%, with a 232.10-point increase
- Nifty FMCG declined by -0.52%, falling 262.40 points
Latest news

Gujarat AAP MLA Chaitar Vasava announces Aravalli protection convention on December 23

New Zealand commits USD 20 bn investment in India under FTA in 15 yrs; on lines of EFTA pact

Bihar CM Nitish Kumar, Dy CM Samrat Choudhary call on PM Modi in Delhi

Union Home Minister Amit Shah meets Bihar CM Nitish Kumar in Delhi

National Herald case: Delhi HC seeks Gandhis' reply on ED plea against trial court order

Delhi: Over 2.12 lakh PUC certificates issued in four days as GRAP-IV enforcement intensifies

Assam on high alert in view of fresh unrest in Bangaldesh: Himanta

Oppo Reno 15 Pro Mini First Look & Hands-On: Small Phone, Big Intentions
Indian stock market sector-wise performance today - March 04, 2025


The stock market experienced mixed performance across various indices and sectors on Tuesday (March 4, 2025).
Among the key sectors, Nifty Auto witnessed the most significant decline, with a substantial loss of 1.31%. This underperformance was followed by a 0.90% dip in the Nifty IT index and a 0.51% decrease in the Nifty FMCG sector.
On the other hand, the Nifty Energy and Nifty Metal sectors showed resilience, gaining 0.77% and 0.38%, respectively.
The Nifty Auto sector's downfall was marked by a sharp decline, indicating potential challenges such as supply chain disruptions, rising input costs, or declining consumer demand negatively impacting automotive companies.
Investors appeared concerned about the prospects for growth in this sector, reflected by the notable drop in its performance. Meanwhile, Nifty IT faced pressure, possibly due to global factors impacting technology stocks, such as concerns about rising interest rates or geopolitical tensions affecting the industry.
The FMCG sector’s minor decline might suggest consumer-facing companies are grappling with cost pressures or weakening demand. Conversely, the gains in Nifty Energy and Nifty Metal indicate stronger investor confidence in these sectors.
The Energy sector’s performance might have been driven by rising global oil prices or favorable government policies.
The Metal sector’s positive movement could be attributed to increasing demand for metals and minerals both domestically and internationally, enhancing investor sentiment.
Nifty Bank and Nifty Infra showed minor activity with a 0.27% increase and 0% change, respectively.
Overall, the market presented a mixed scenario, with certain sectors coping with downward pressures while others managed to capitalize on favorable conditions and investor confidence.
Understanding the daily dynamics and global correlations continues to be crucial for investors navigating such unpredictable environments.

Analysis for Sensex - March 04, 2025

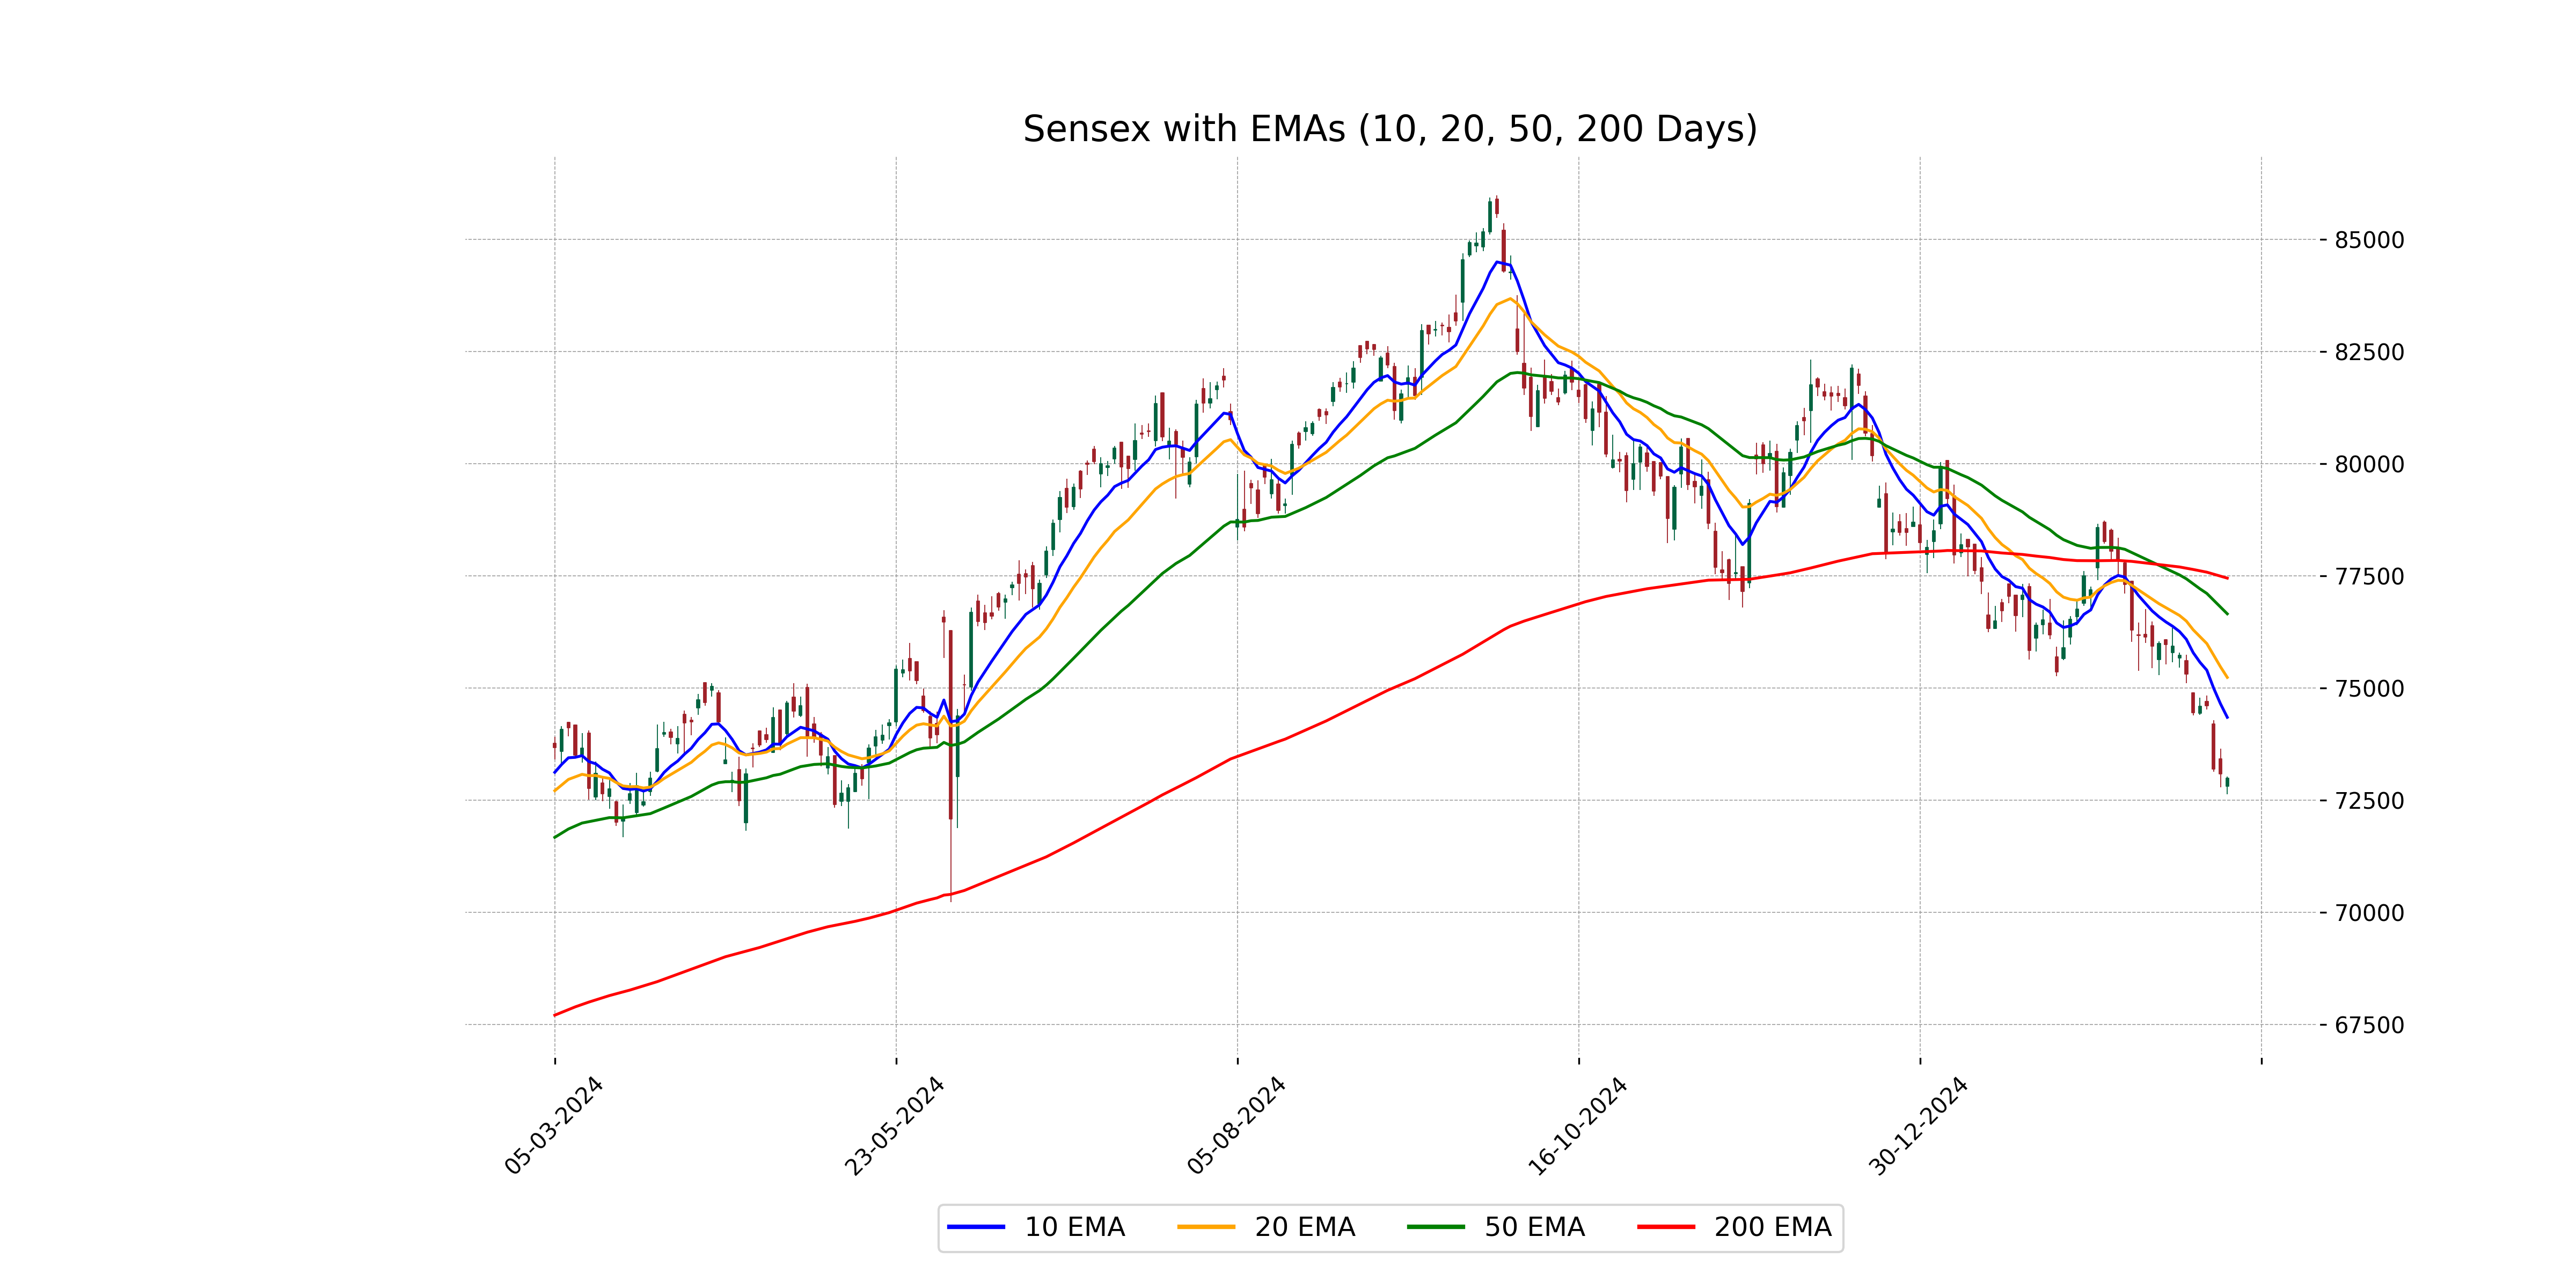
Sensex Performance: The Sensex opened at 72,817 points and closed at 72,989, marking a slight decline from the previous close of 73,085 points with a decrease of 96 points. The percentage change for the day was -0.13%, and the RSI indicates a potential oversold condition with a value of 23.5. Additionally, the MACD is below the signal line, suggesting continued bearish momentum.
Relationship with Key Moving Averages
The Sensex is currently trading below its key moving averages, including the 50-day EMA at 76656.01, the 20-day EMA at 75239.04, and the 10-day EMA at 74349.71. This indicates a bearish trend, as the current close of 72989.93 is lower than all these EMAs.
Moving Averages Trend (MACD)
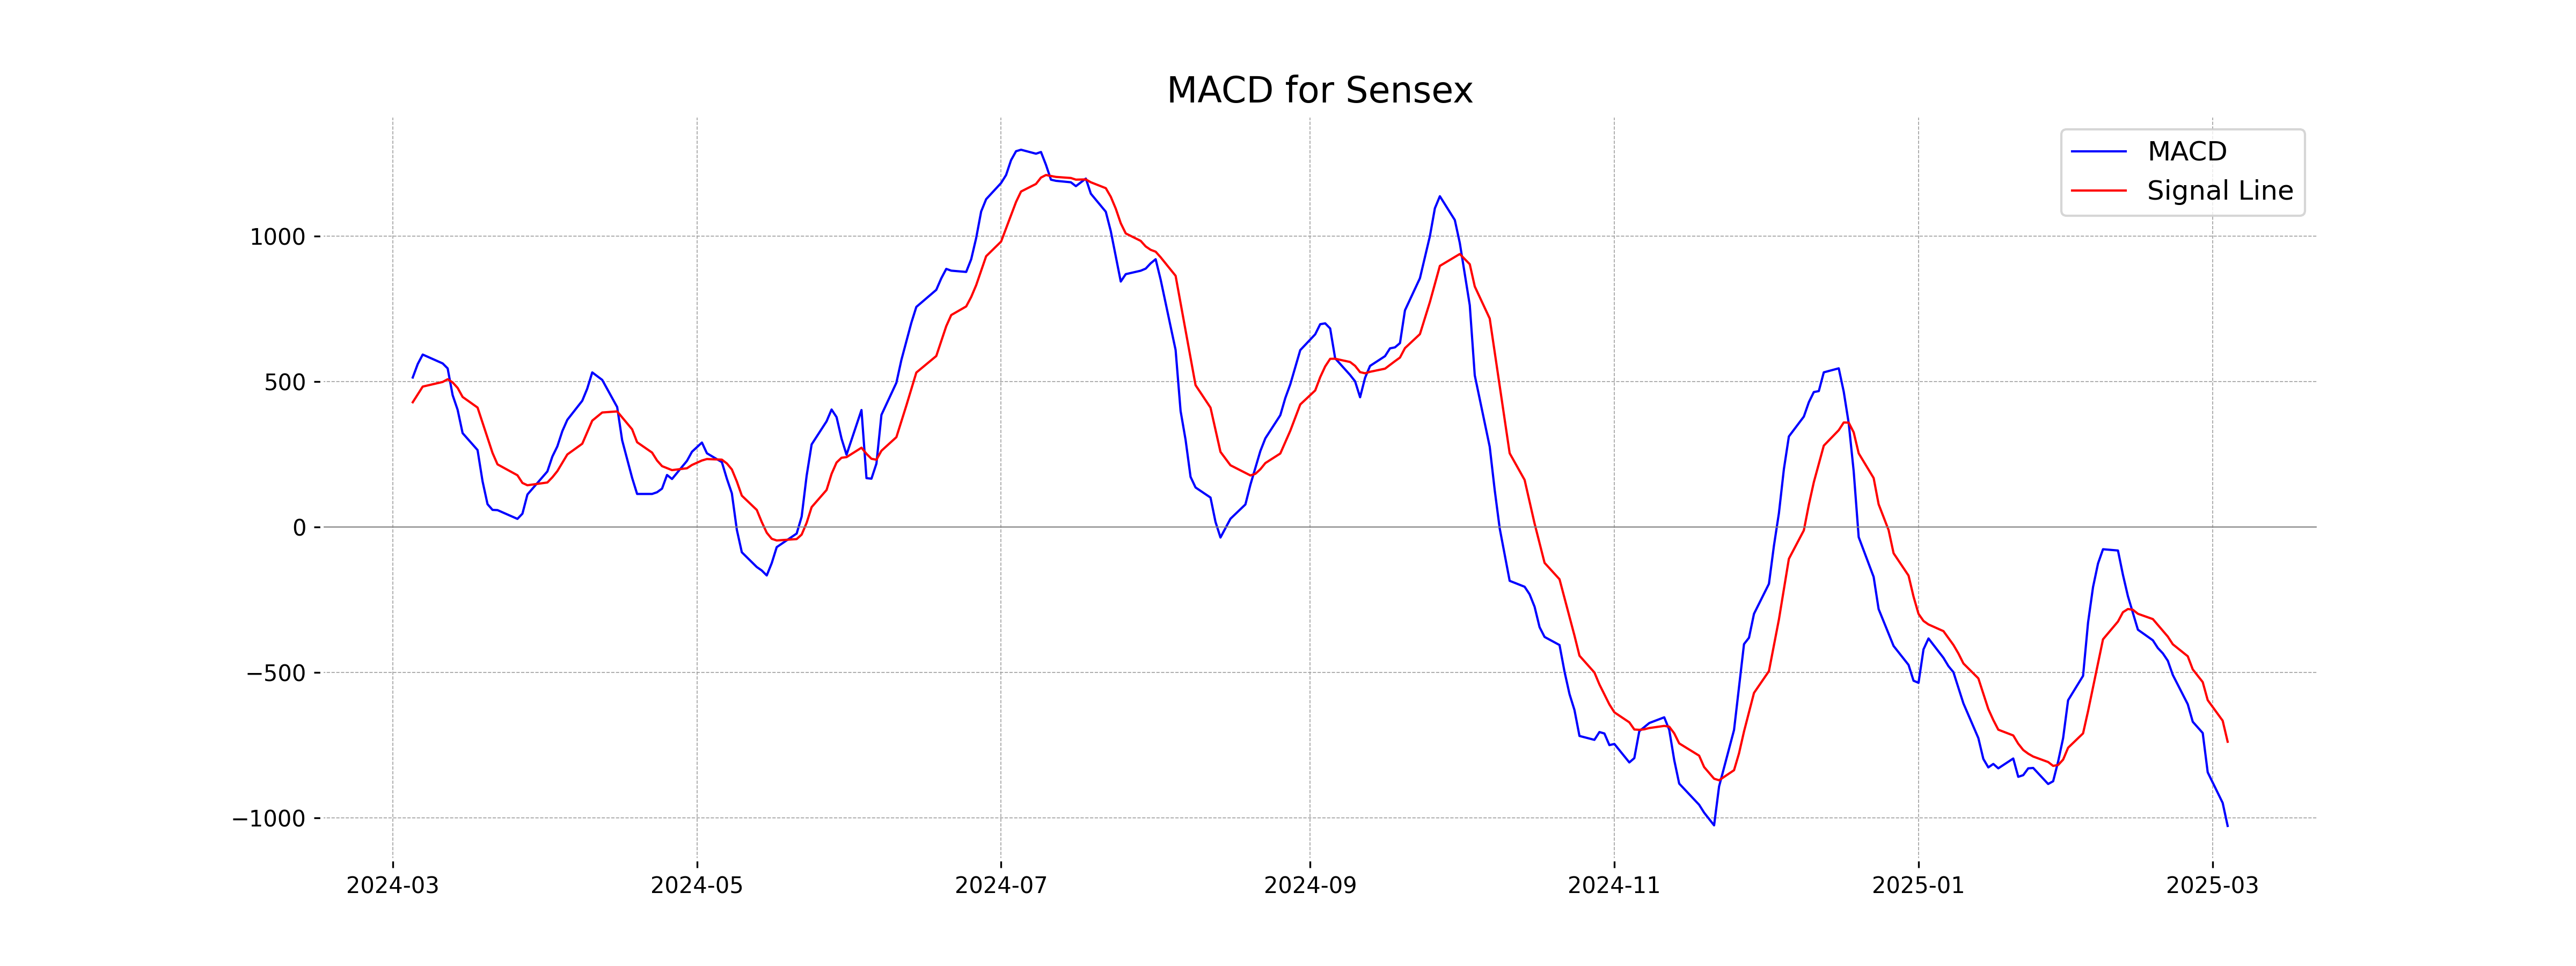
Based on the data given for Sensex, the MACD is significantly below the MACD Signal line, with a value of -1027.26 compared to -737.75. This indicates a bearish momentum, suggesting that the market is experiencing downward pressure. Additionally, the low RSI of 23.50 supports this bearish sentiment.
RSI Analysis
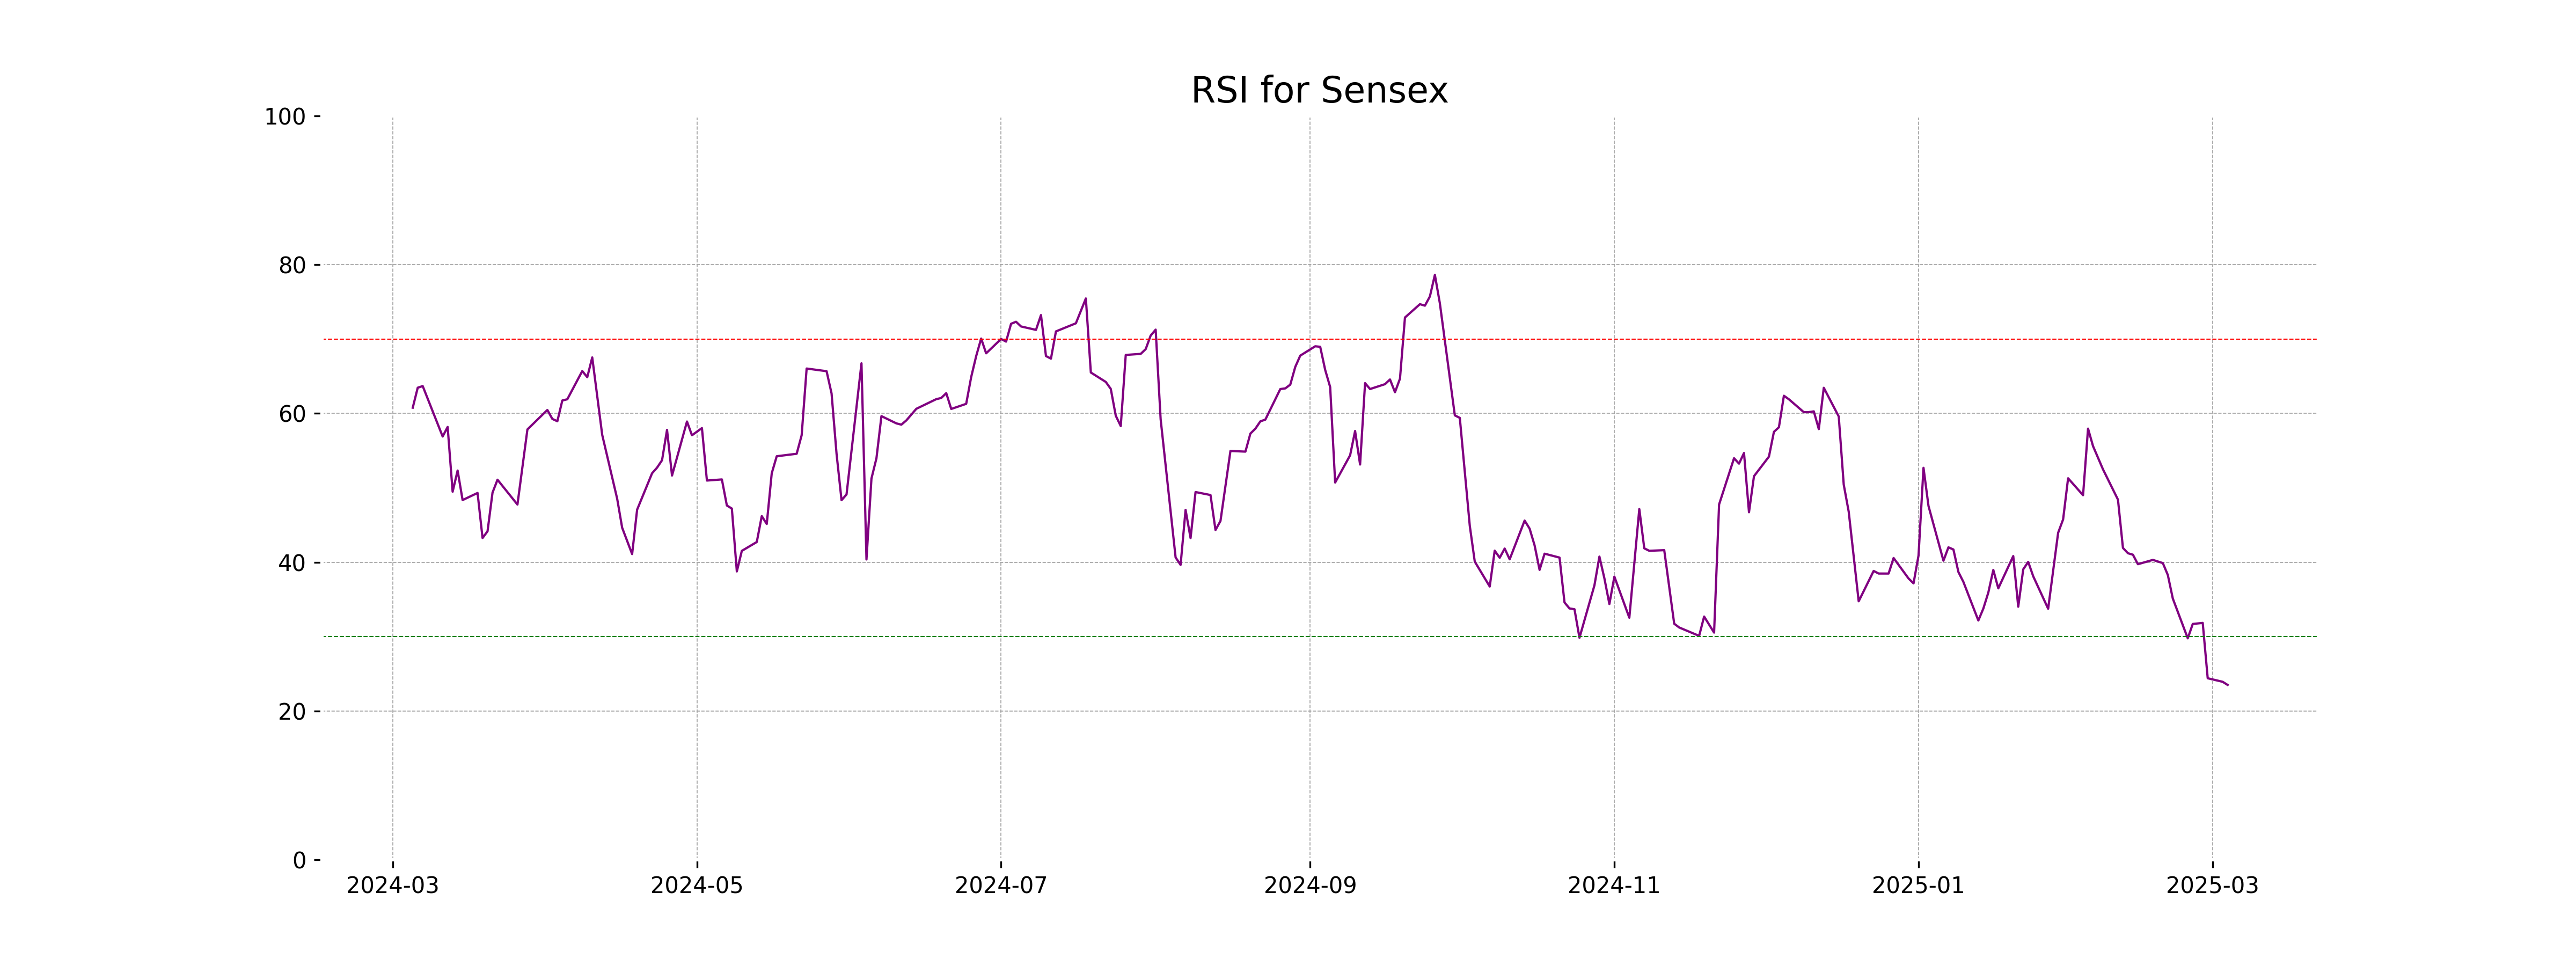
The Relative Strength Index (RSI) for Sensex is 23.50, indicating that the index is in the oversold territory. This suggests a potential buying opportunity as the market may be undervalued, however, it is important to consider other indicators and market conditions before making investment decisions.
Analysis for Nifty Auto - March 04, 2025
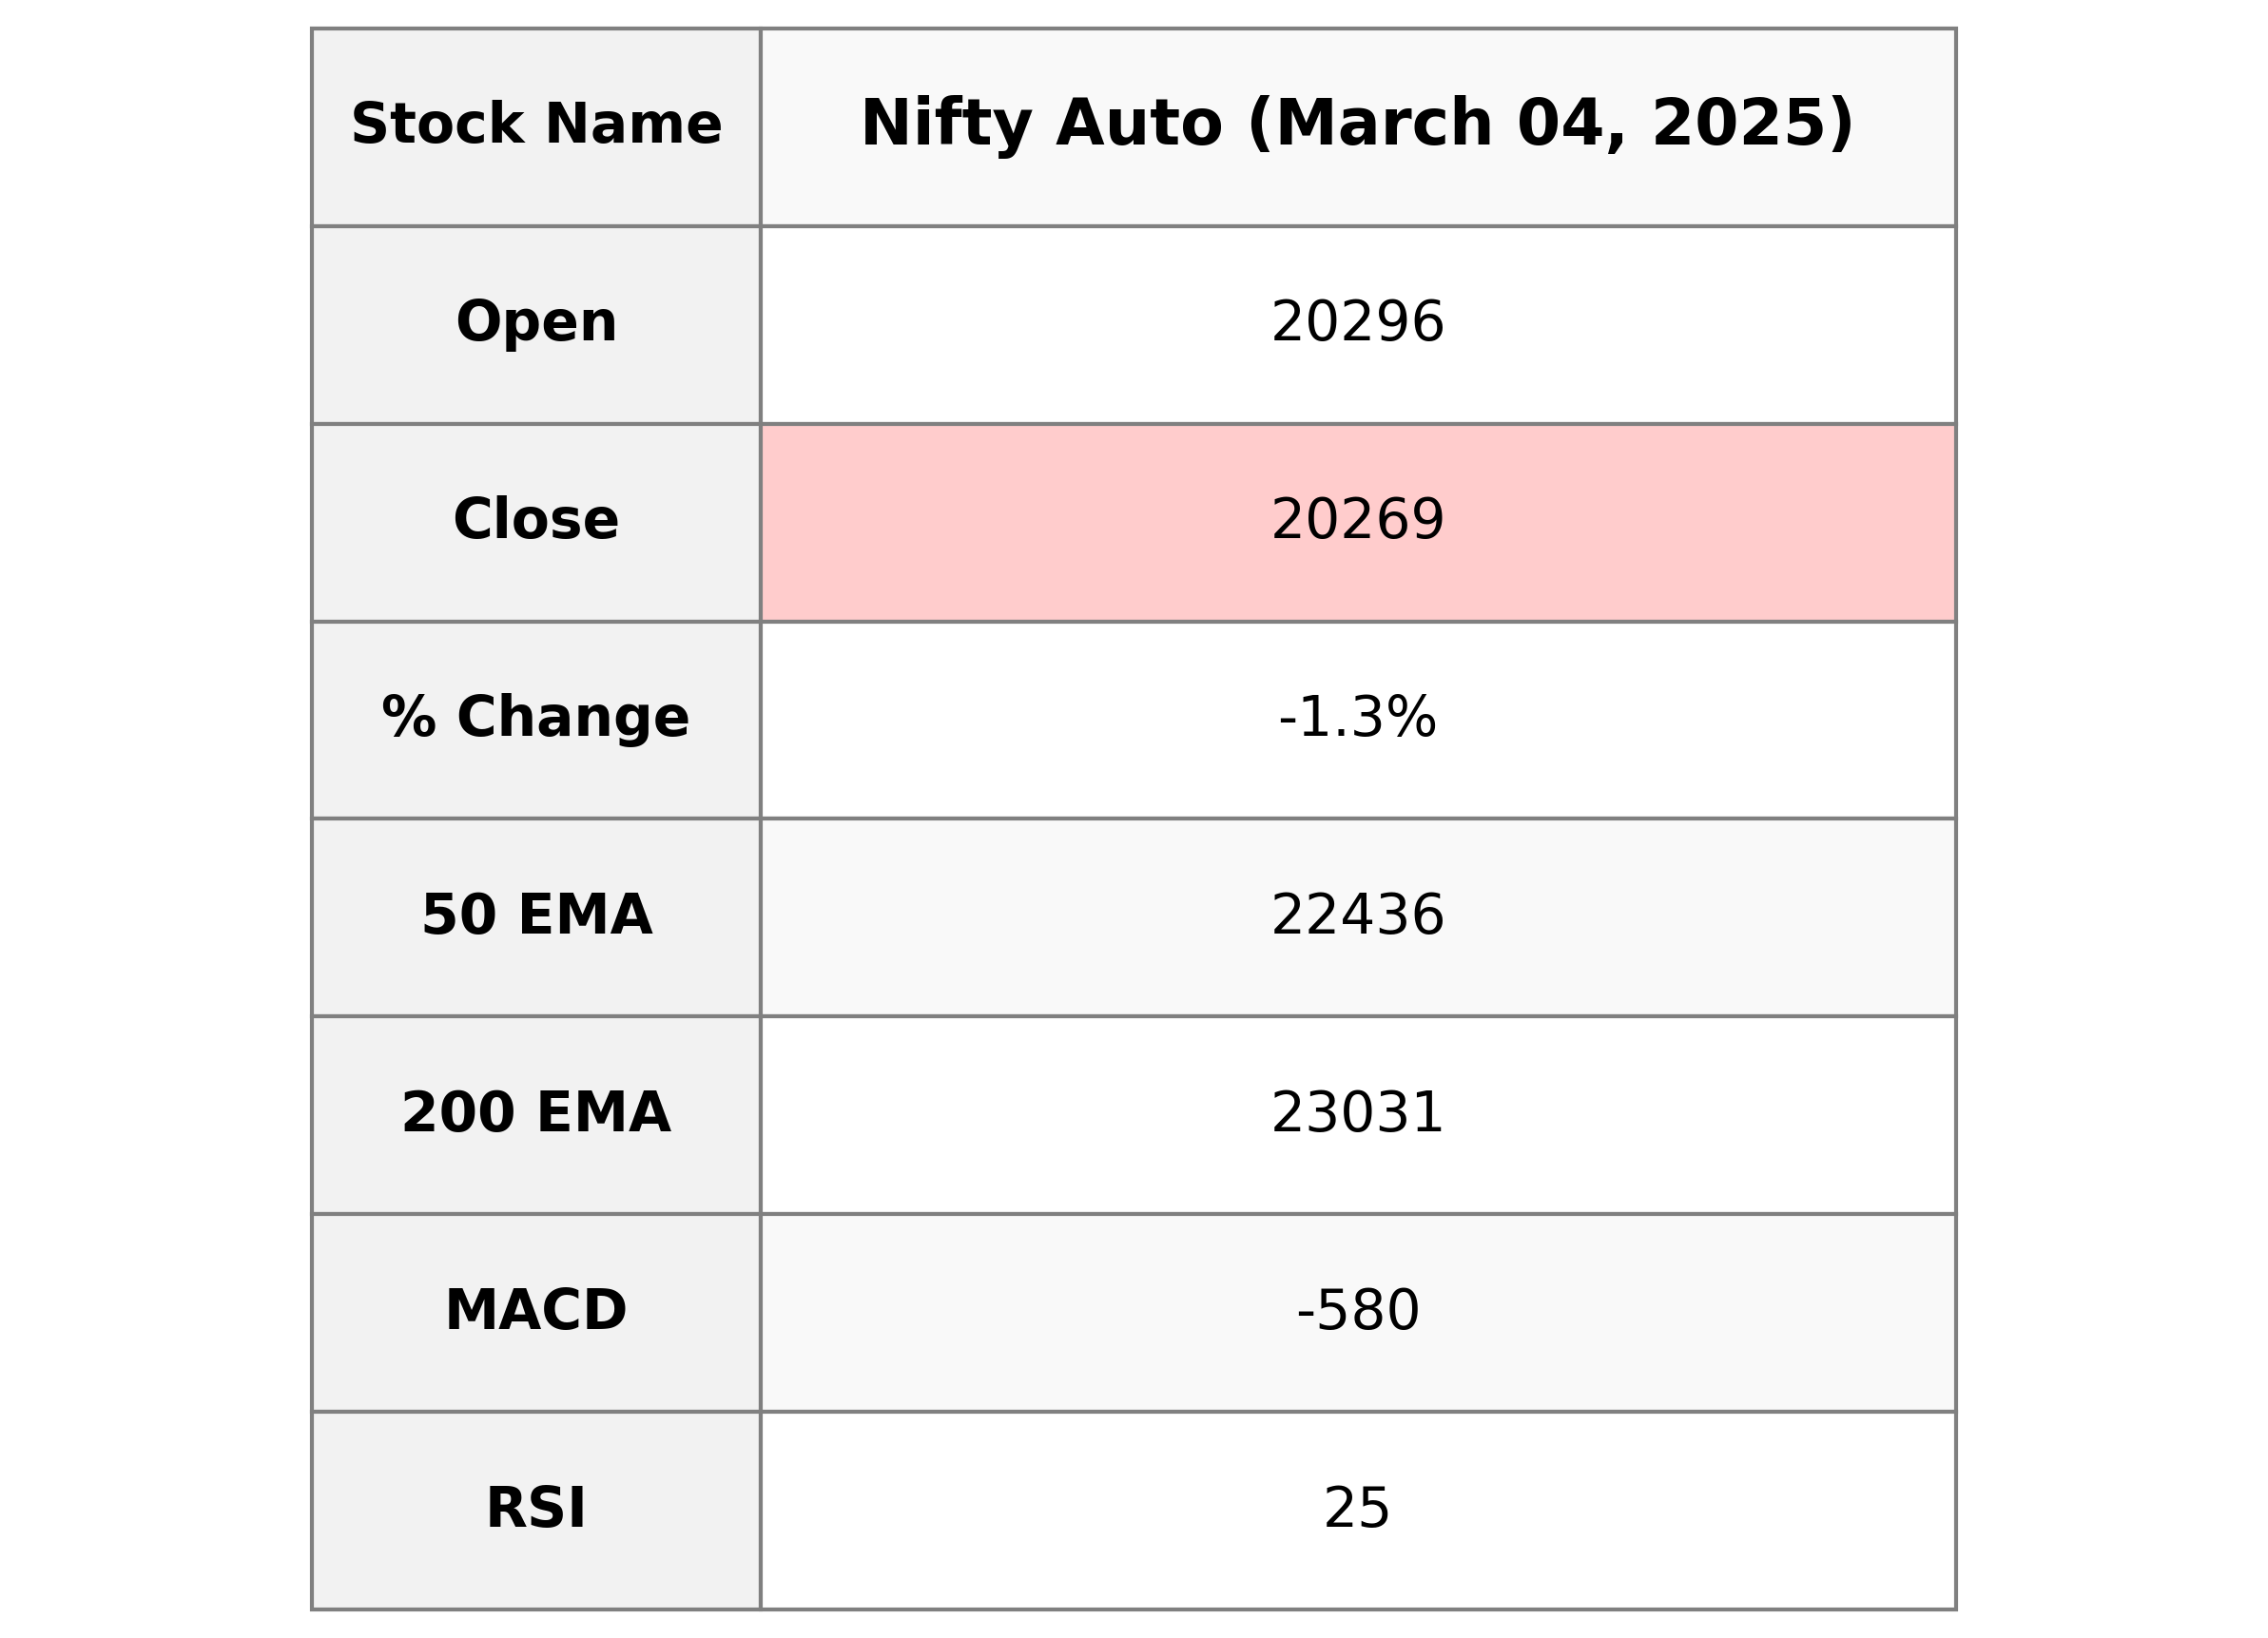
Nifty Auto opened at 20295.80 and closed at 20269.20, experiencing a decline of 1.31% from the previous closing value of 20538.15. The index hit a high of 20462.80 and a low of 20174.85. Technical indicators reveal a bearish trend, with the RSI at 24.76 and the MACD significantly below its signal line.
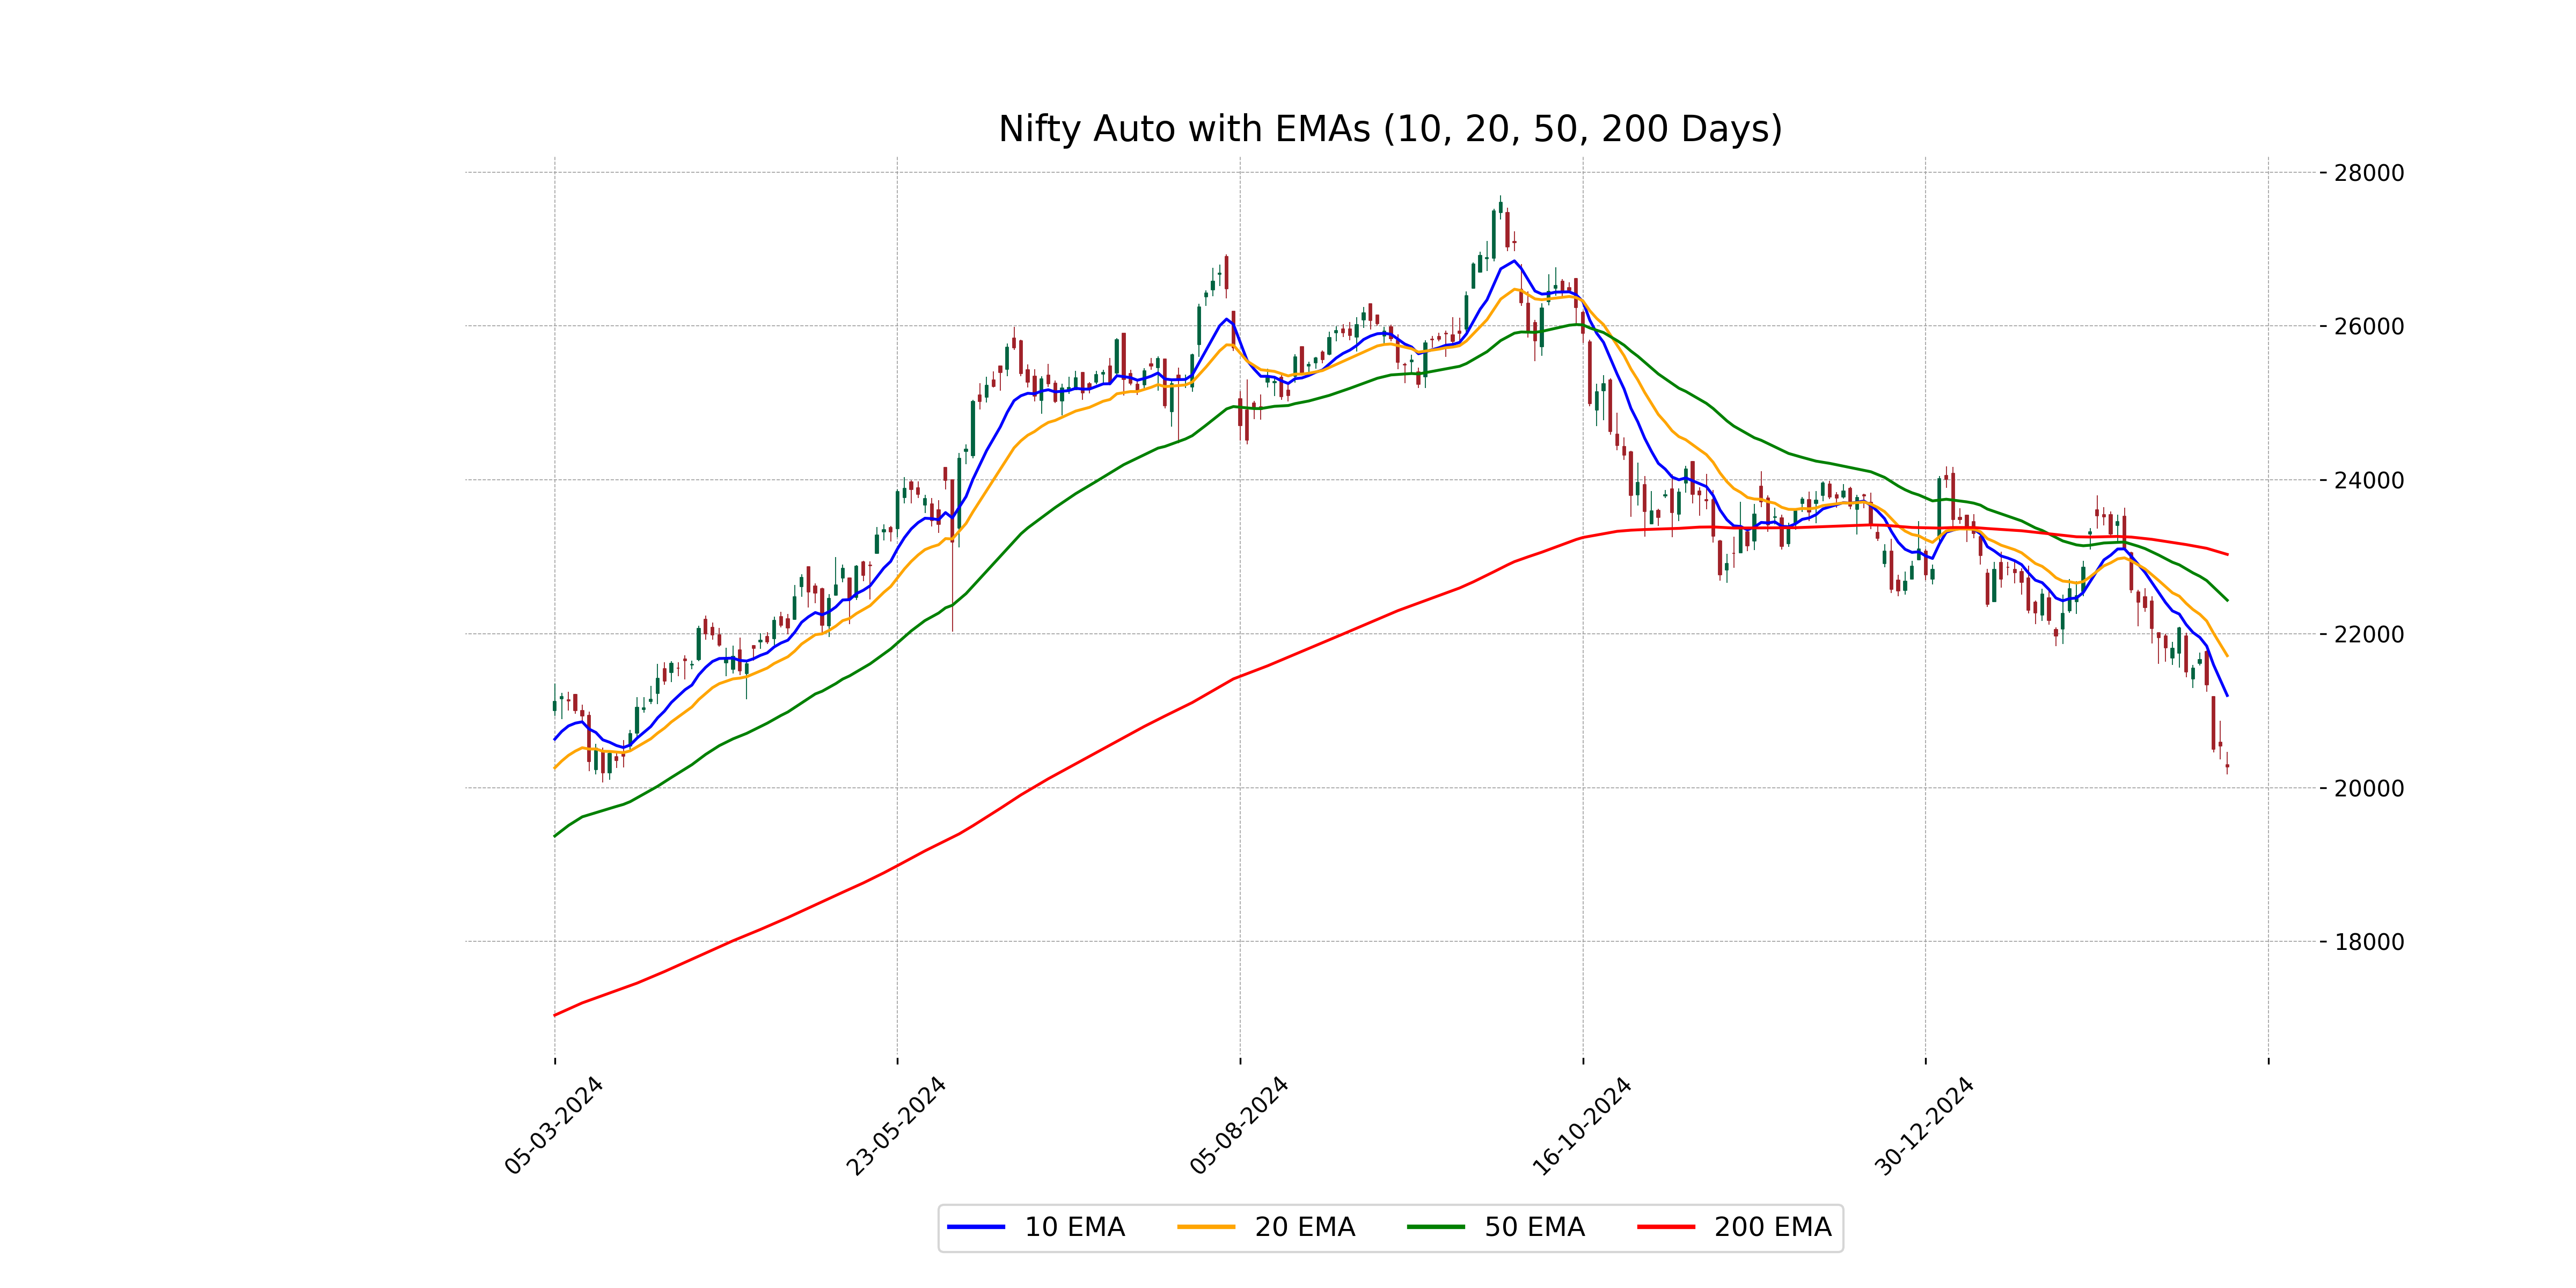
Relationship with Key Moving Averages
Nifty Auto closed below its 10 EMA, 20 EMA, 50 EMA, and 200 EMA. The index is indicating a bearish trend as it is trading significantly below these key moving averages, with an RSI of 24.76 suggesting it is in oversold territory.
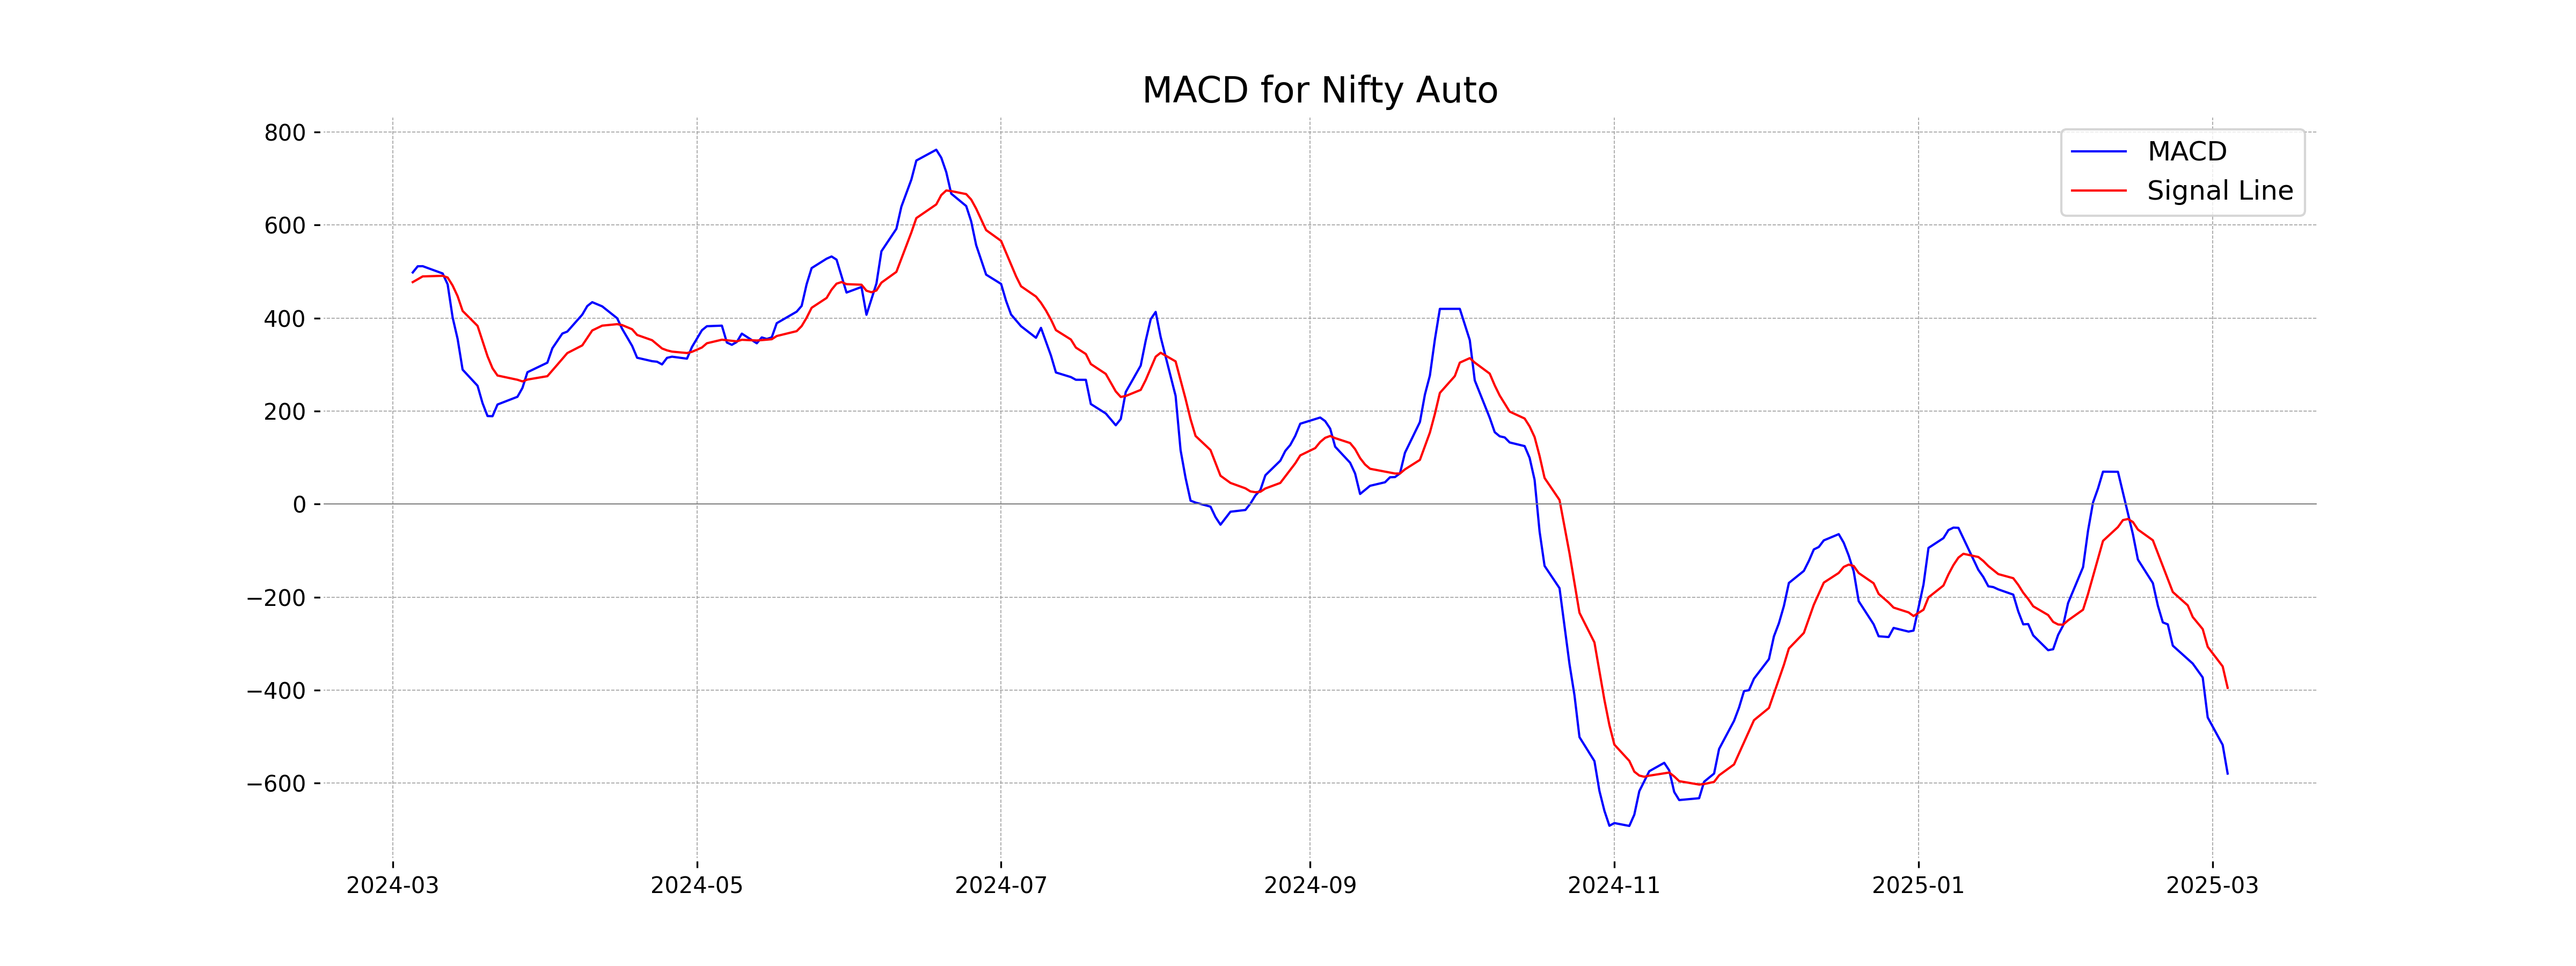
Moving Averages Trend (MACD)
MACD Analysis for Nifty Auto: The MACD for Nifty Auto is currently negative at -579.61, which is significantly below the MACD Signal of -395.21. This suggests a bearish trend in the stock, indicating that the selling pressure is stronger than the buying pressure.
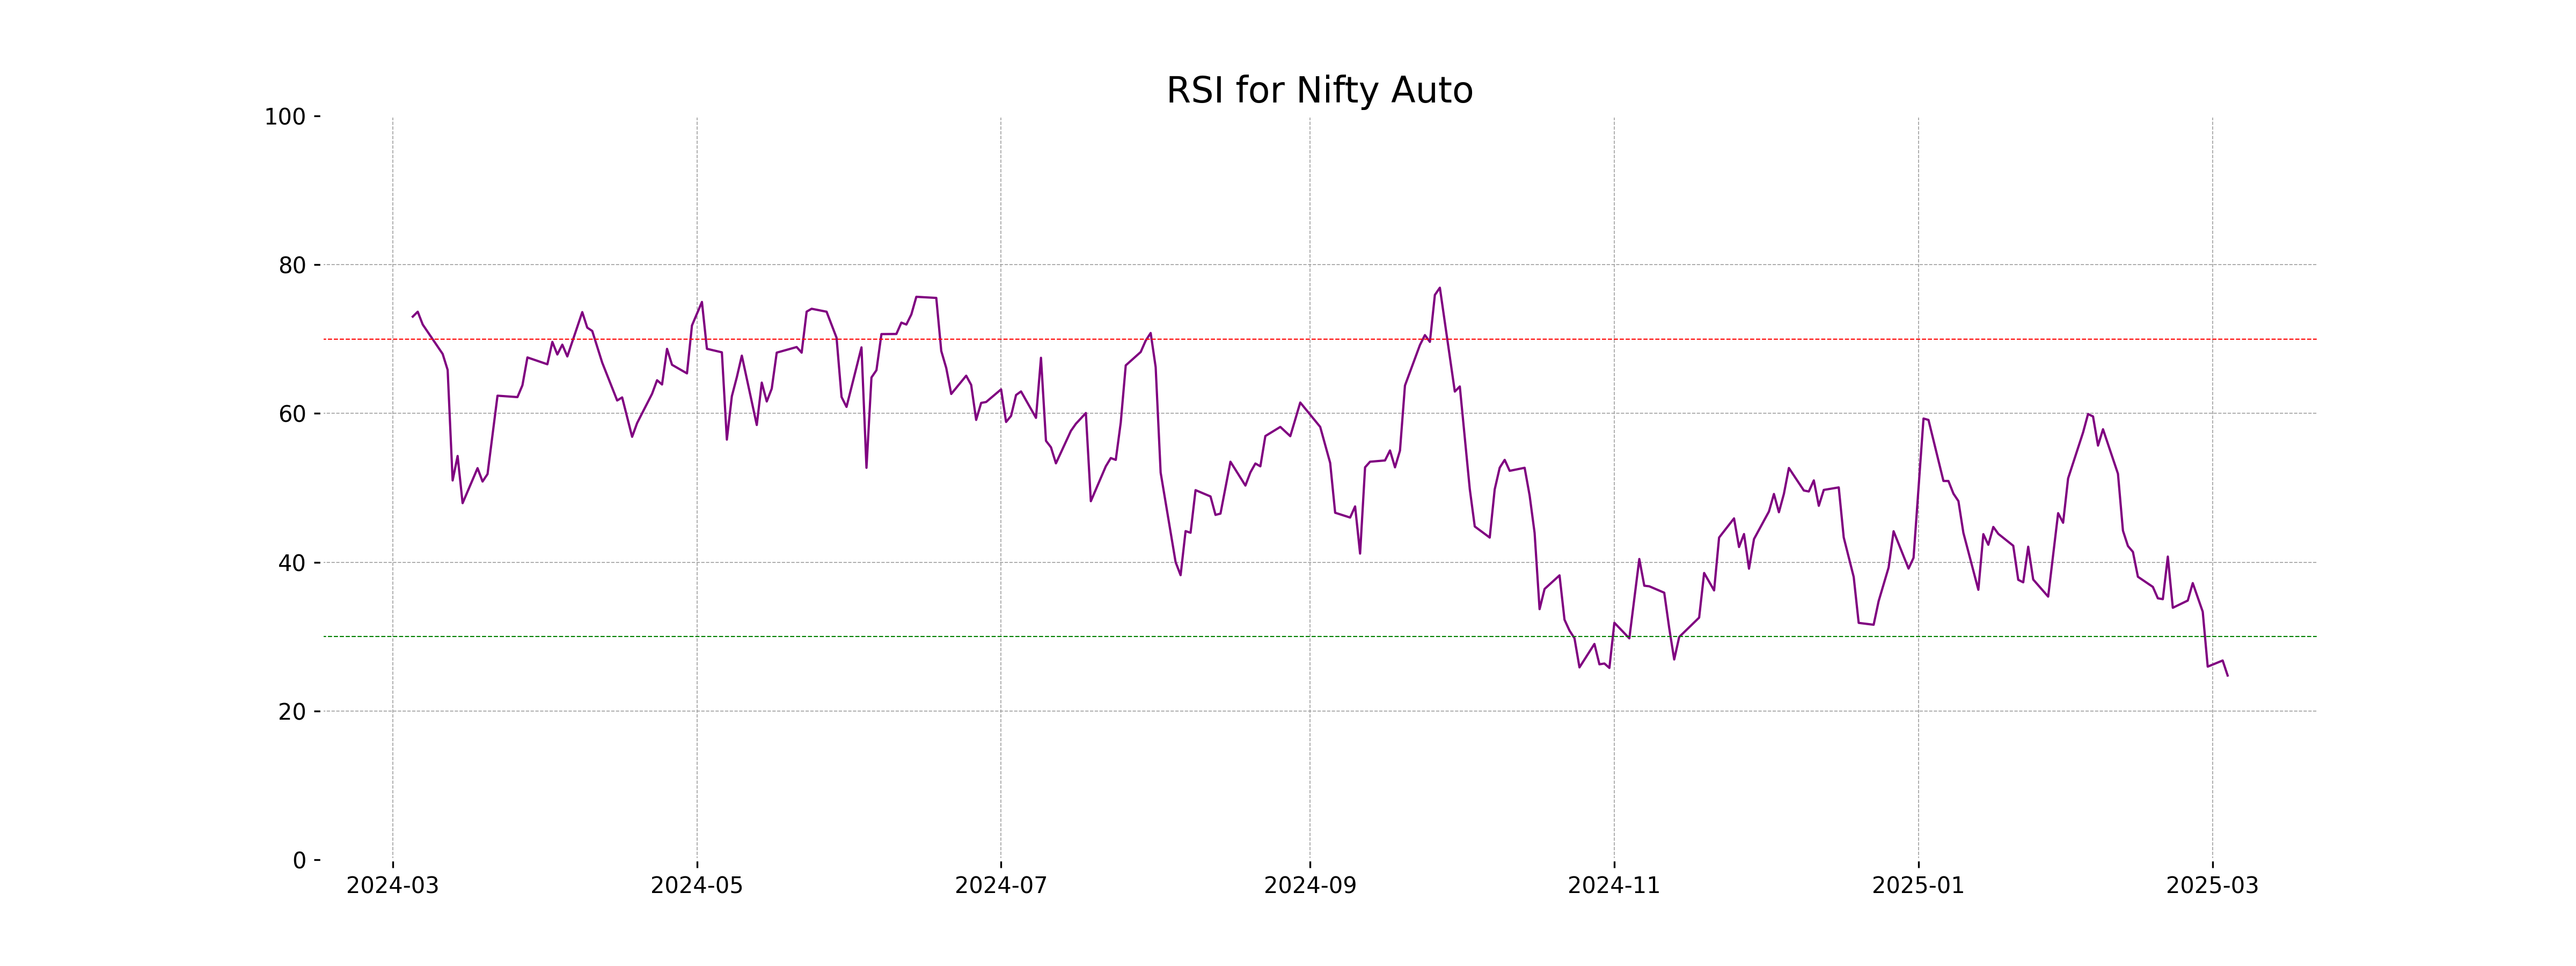
RSI Analysis
The RSI (Relative Strength Index) for Nifty Auto is 24.76, which indicates that it is currently in the oversold territory. This suggests that the index may be experiencing downward pressure, and a potential price reversal could be on the horizon if buying interest increases.
Analysis for Nifty Energy - March 04, 2025
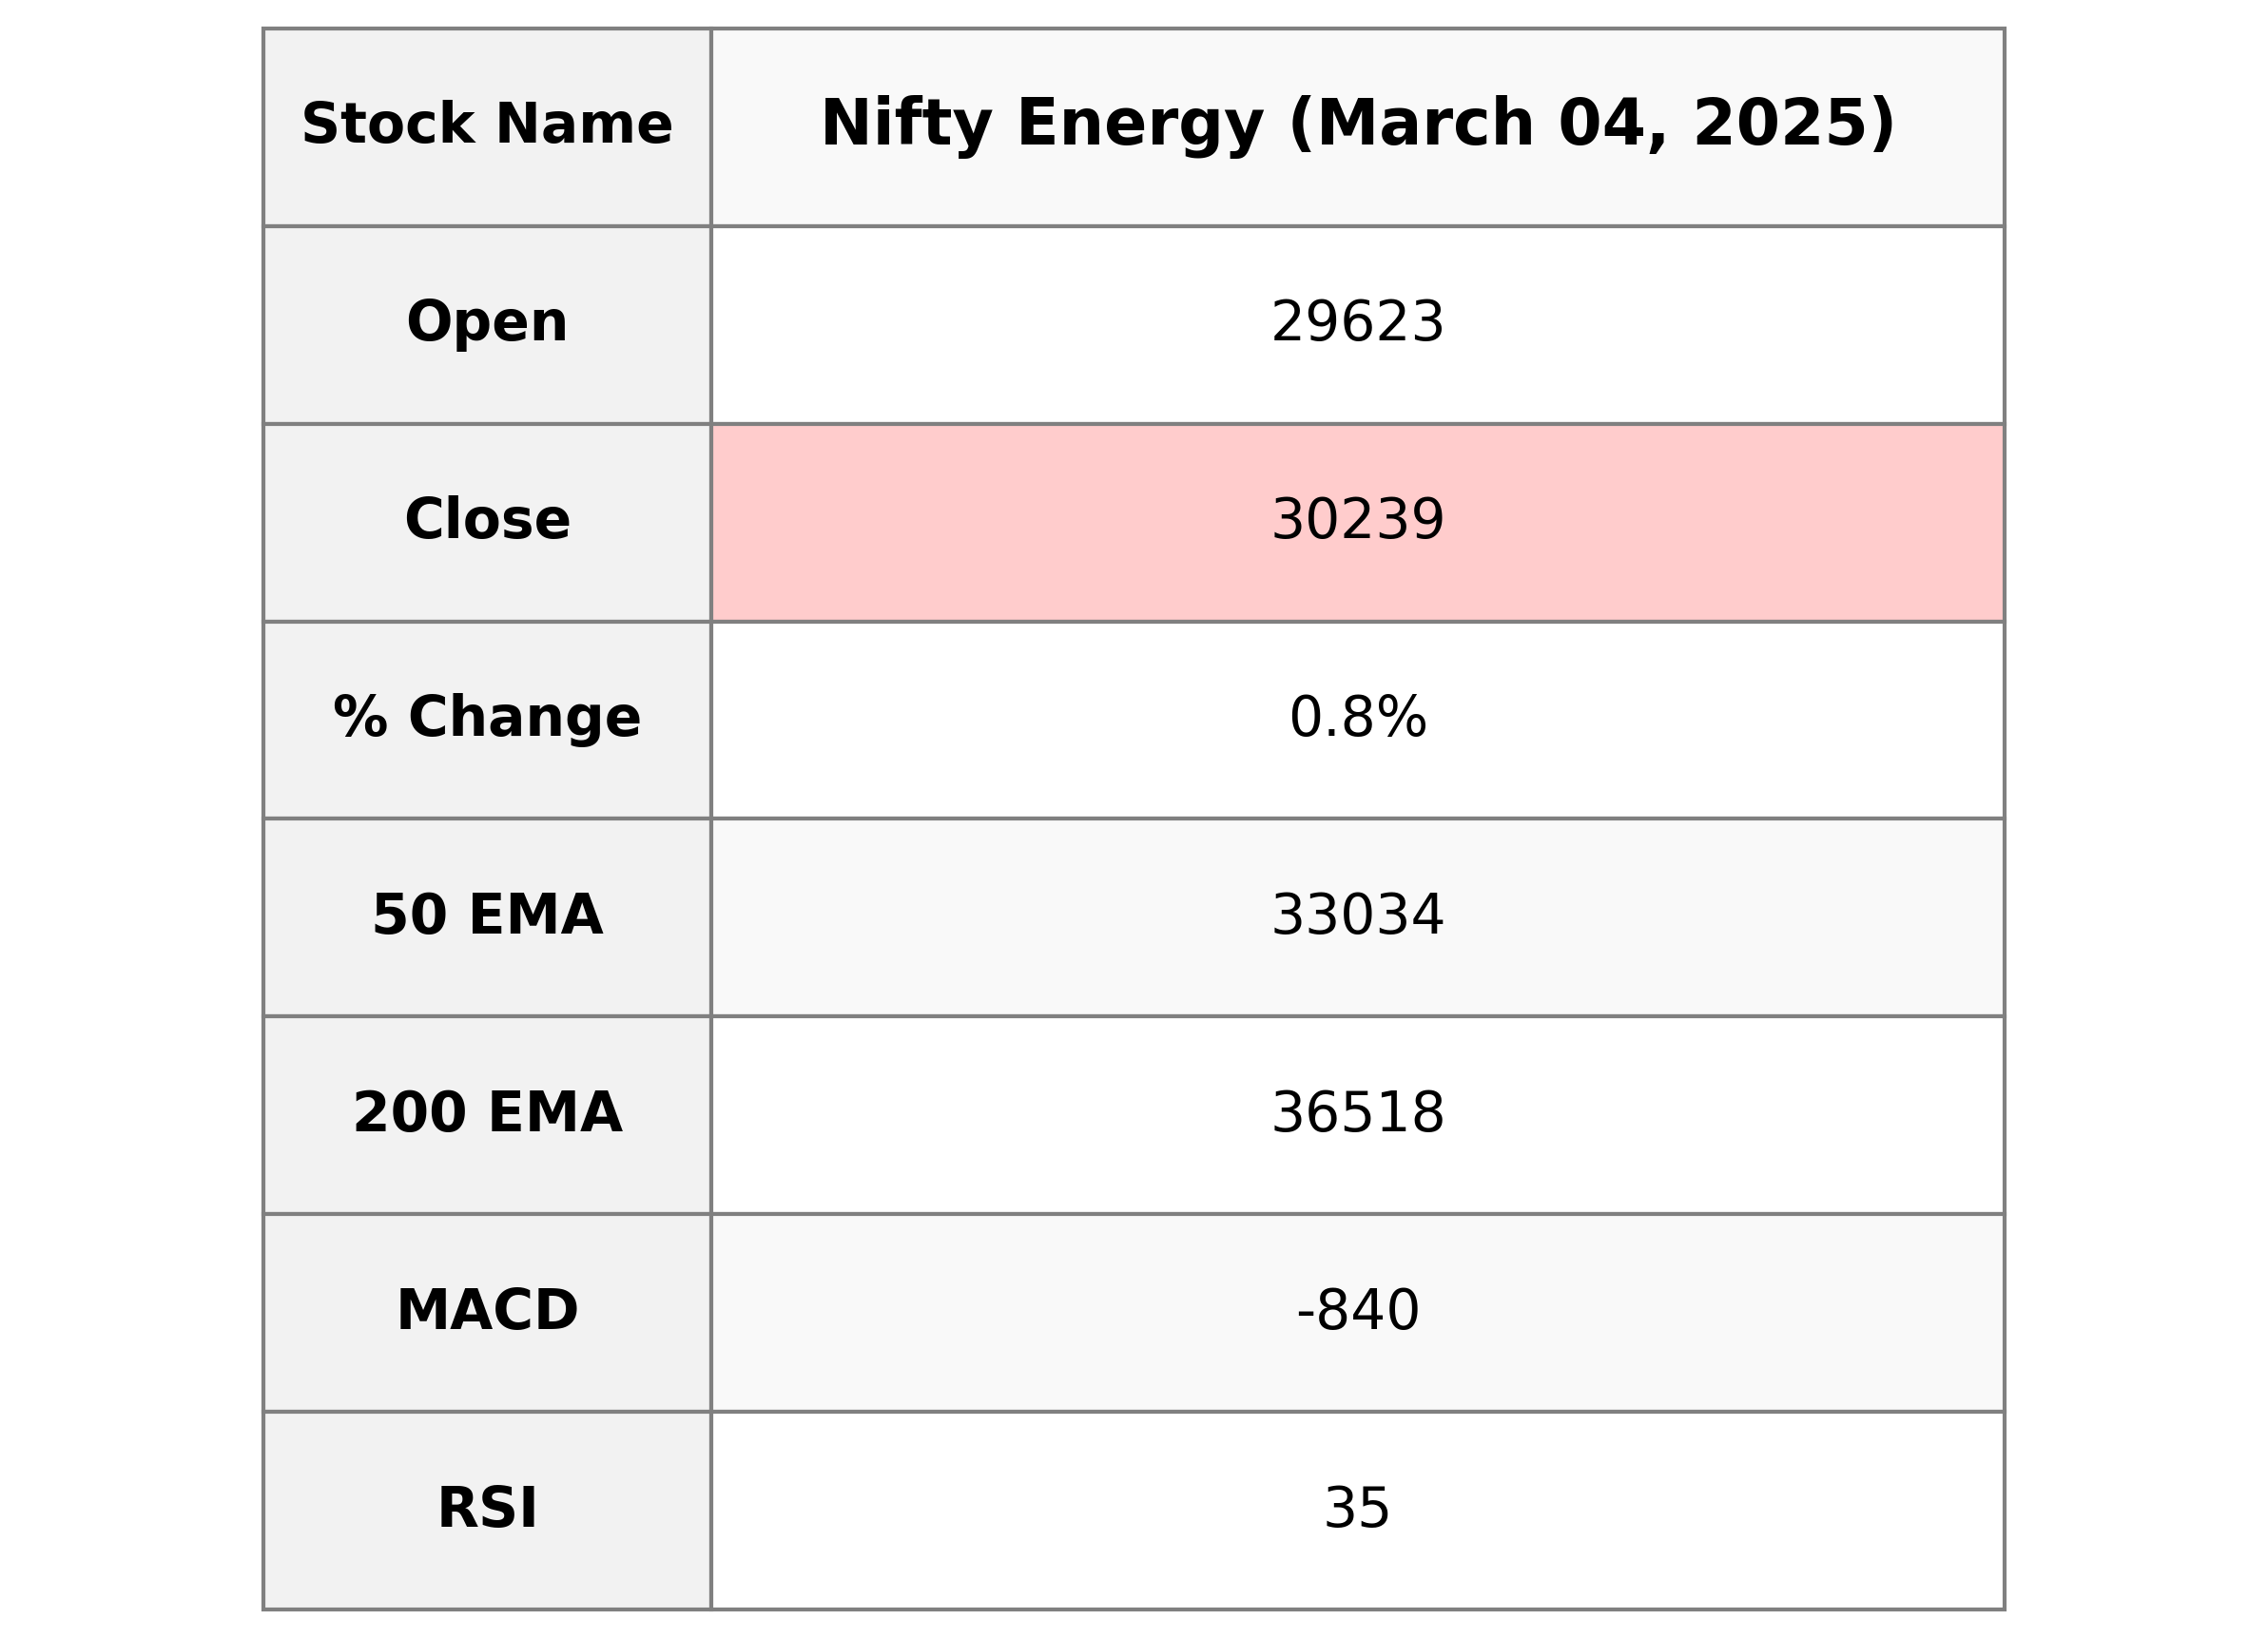
Nifty Energy Performance: Nifty Energy opened at 29,623.30 and closed at 30,239.15, showing a percentage change of 0.77% with a points change of 232.10. The index faced fluctuations, reaching a high of 30,334.25 and a low of 29,406.60. The RSI stands at 34.97, indicating possible oversold conditions, while the MACD is -839.89, suggesting bearish momentum.
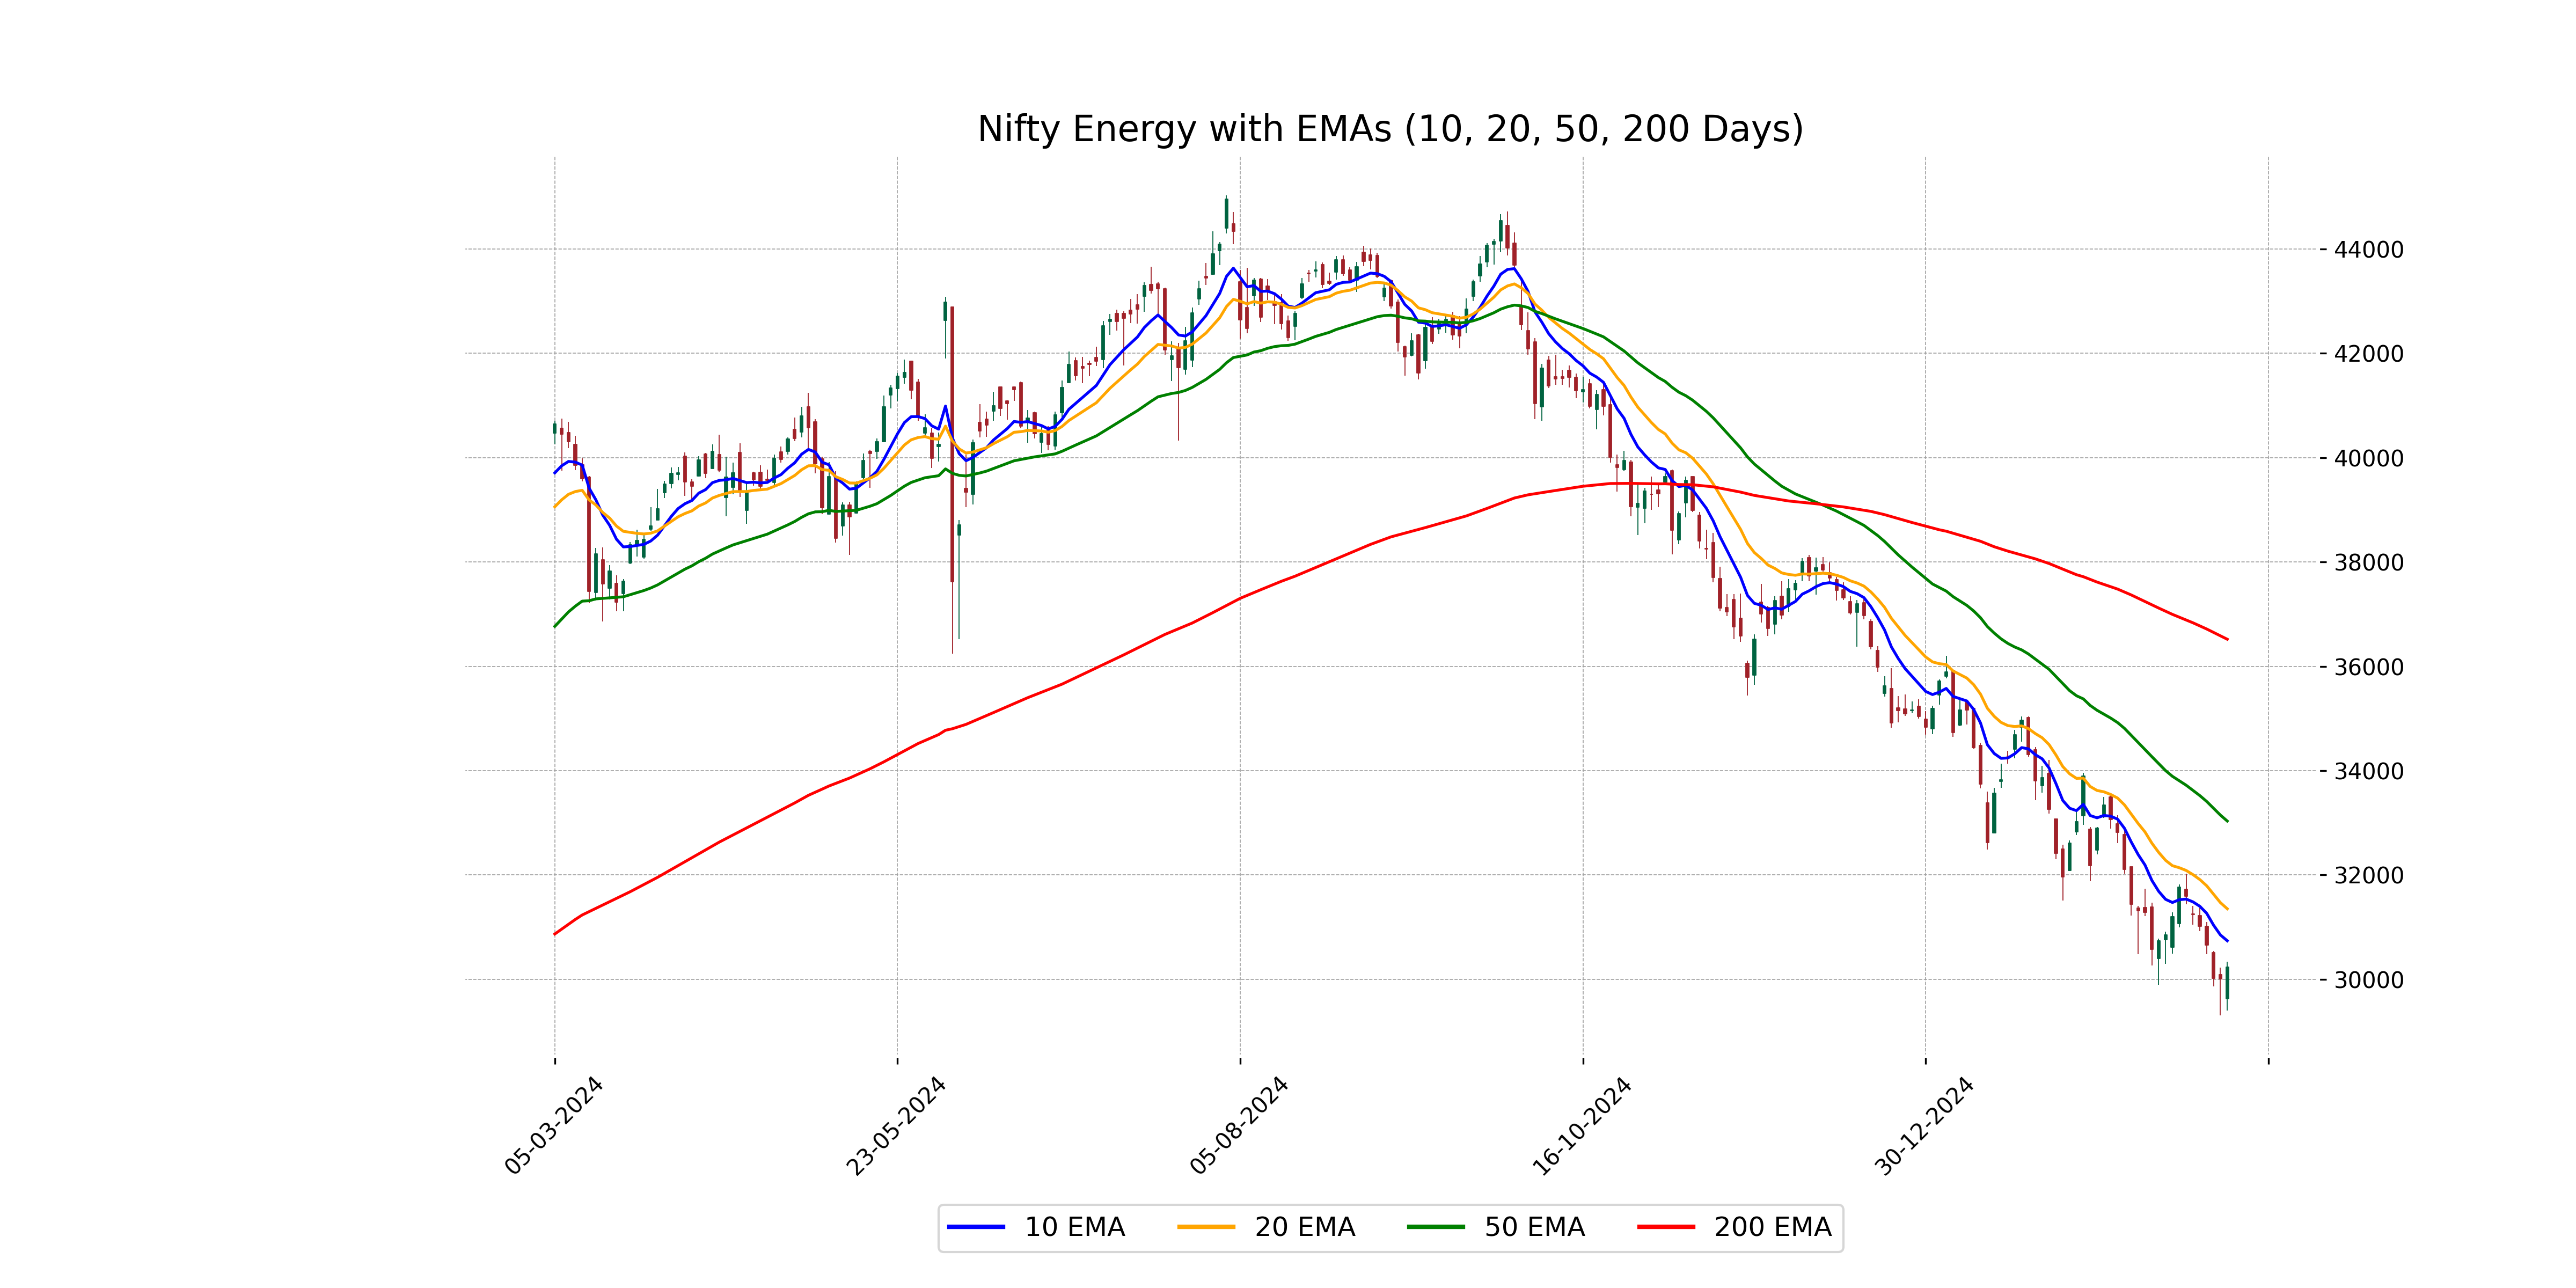
Relationship with Key Moving Averages
Nifty Energy closed at 30239.15, which is below all its key moving averages (50 EMA at 33033.89, 200 EMA at 36518.30, and 10 EMA at 30739.62). This indicates a bearish trend as the current price is lower than these averages, suggesting potential market weakness.
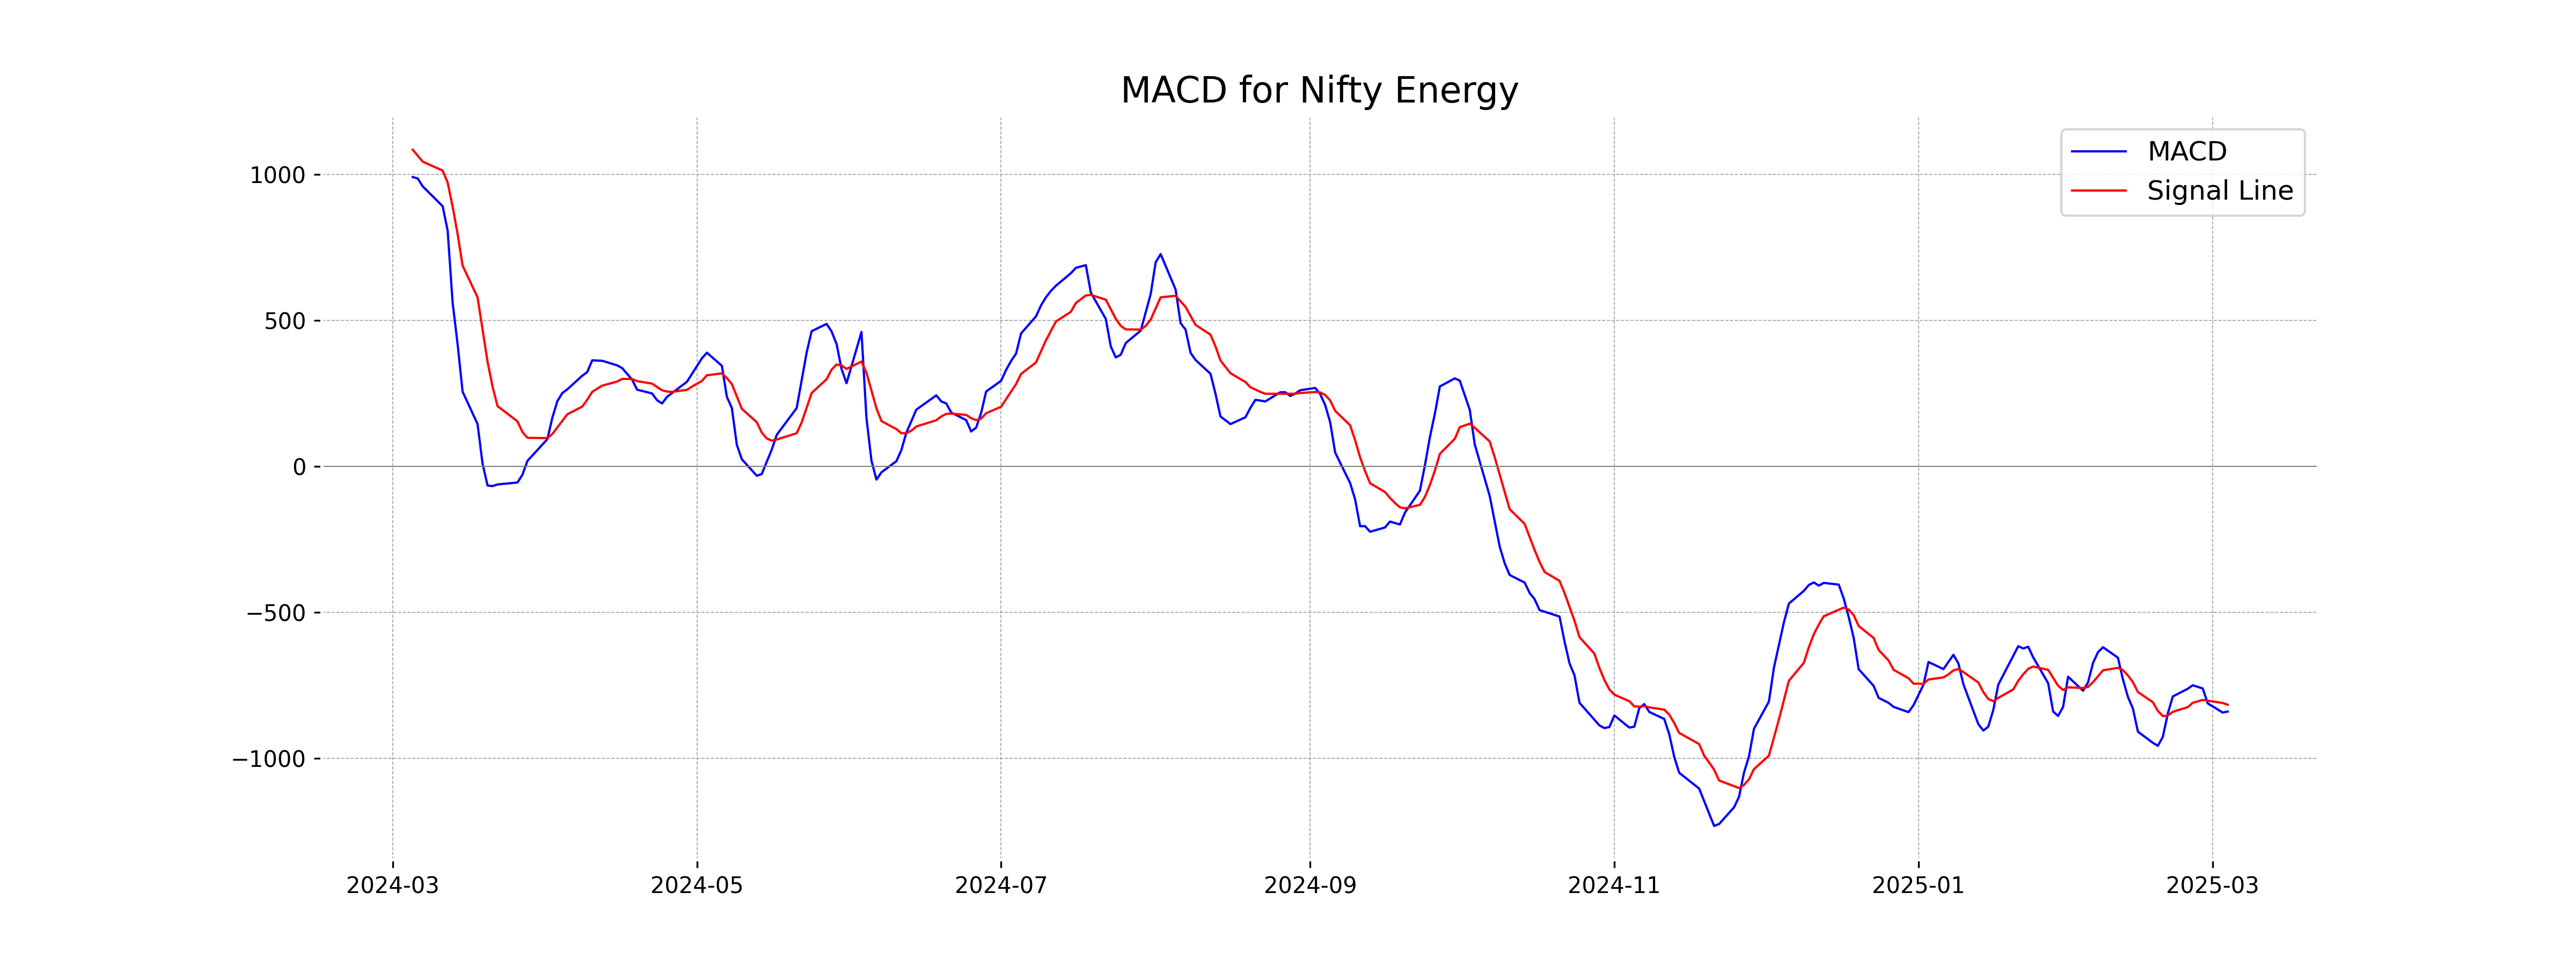
Moving Averages Trend (MACD)
The MACD for Nifty Energy is -839.89, with the MACD Signal at -816.40, indicating a bearish trend as the MACD is below the signal line. This suggests selling pressure in the current market conditions. The low RSI of 34.97 further supports a bearish outlook.
RSI Analysis
The RSI for Nifty Energy is 34.97, which suggests that the index is approaching oversold territory. This indicates potential undervaluation or an upcoming reversal, as RSI values below 30 typically indicate being oversold. However, it's near enough to consider watching for signs of reversal or stabilization.

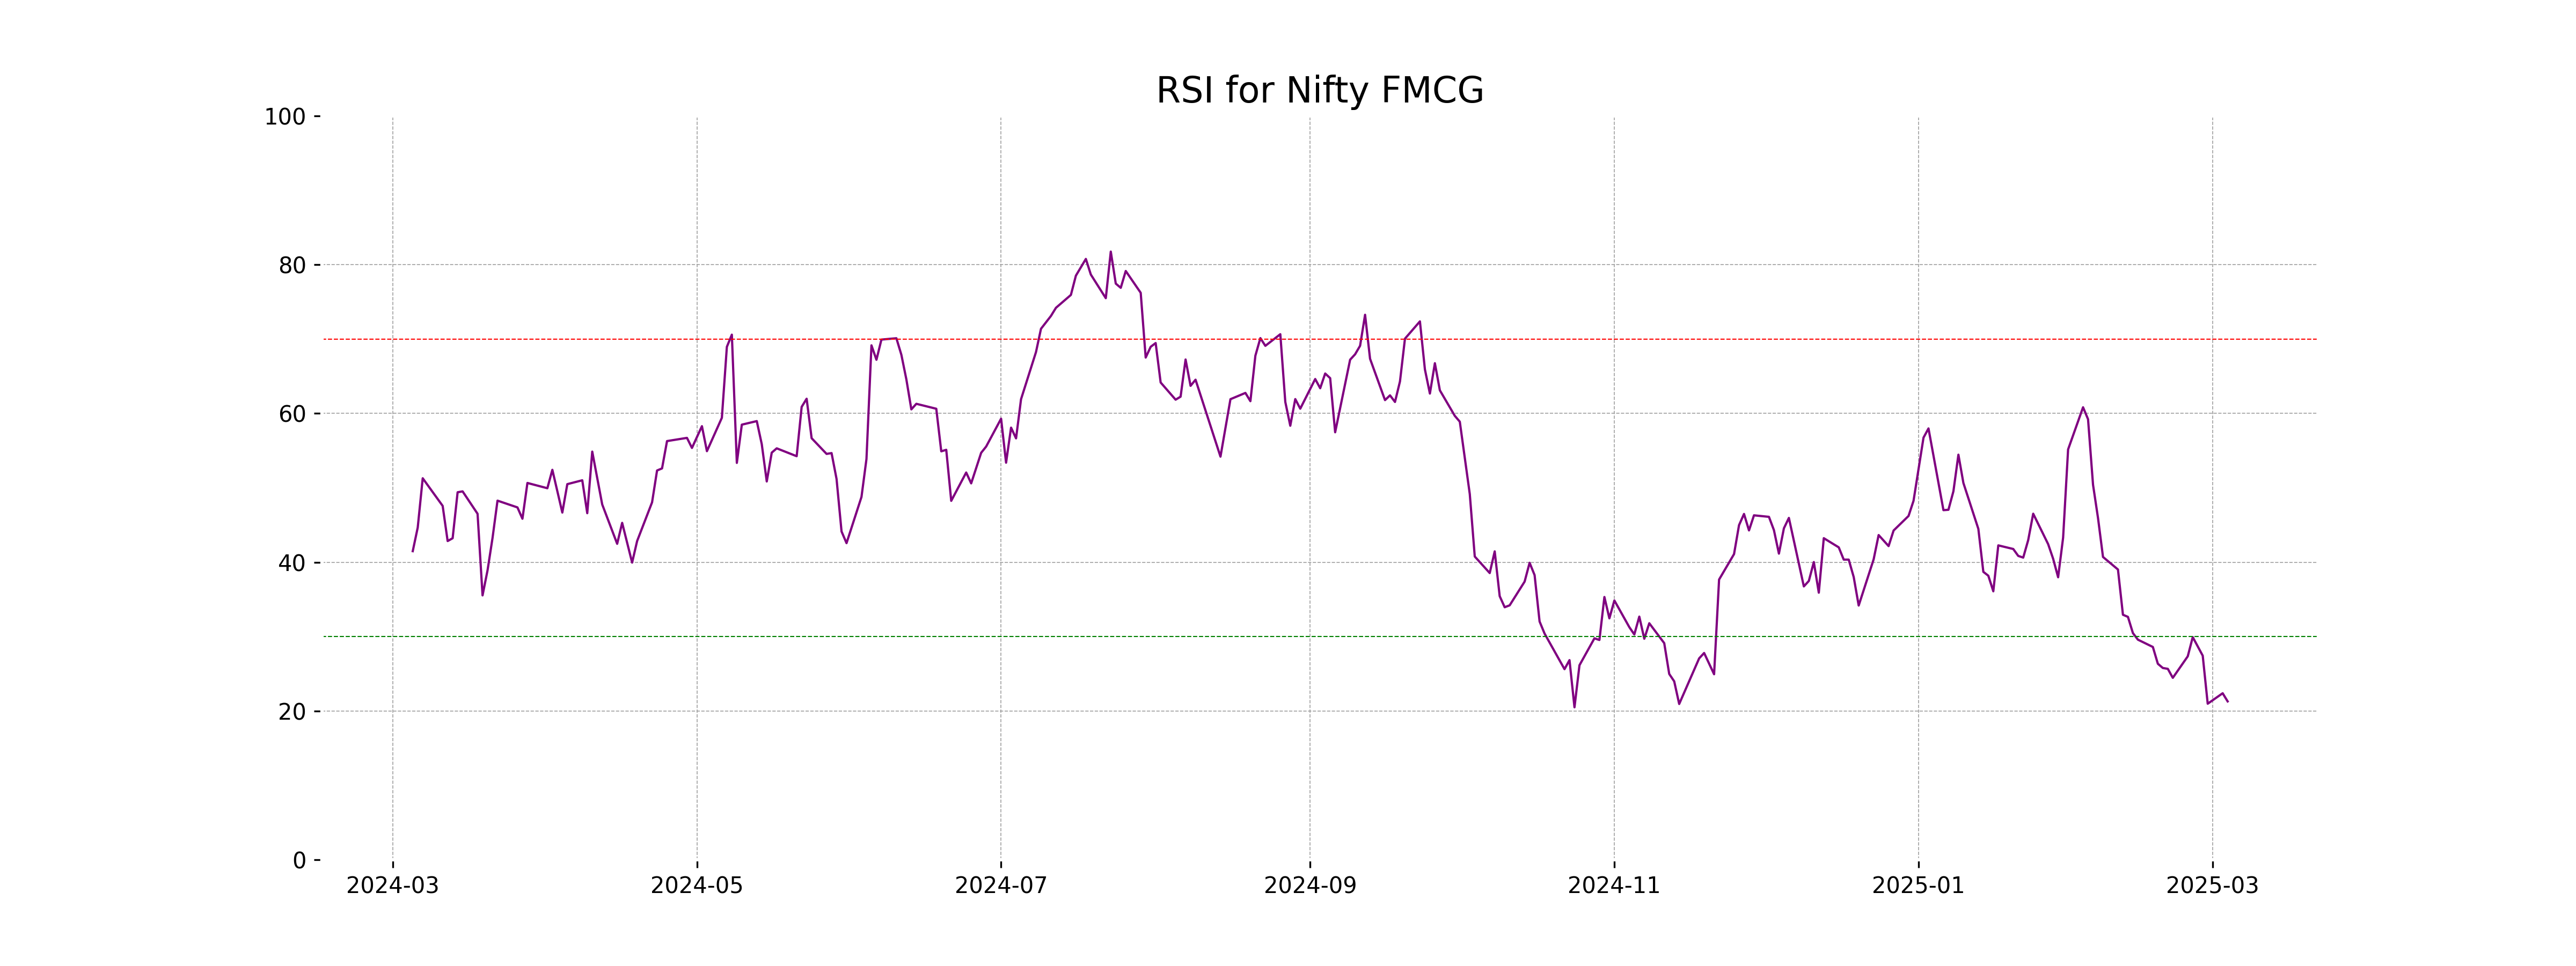
Analysis for Nifty FMCG - March 04, 2025
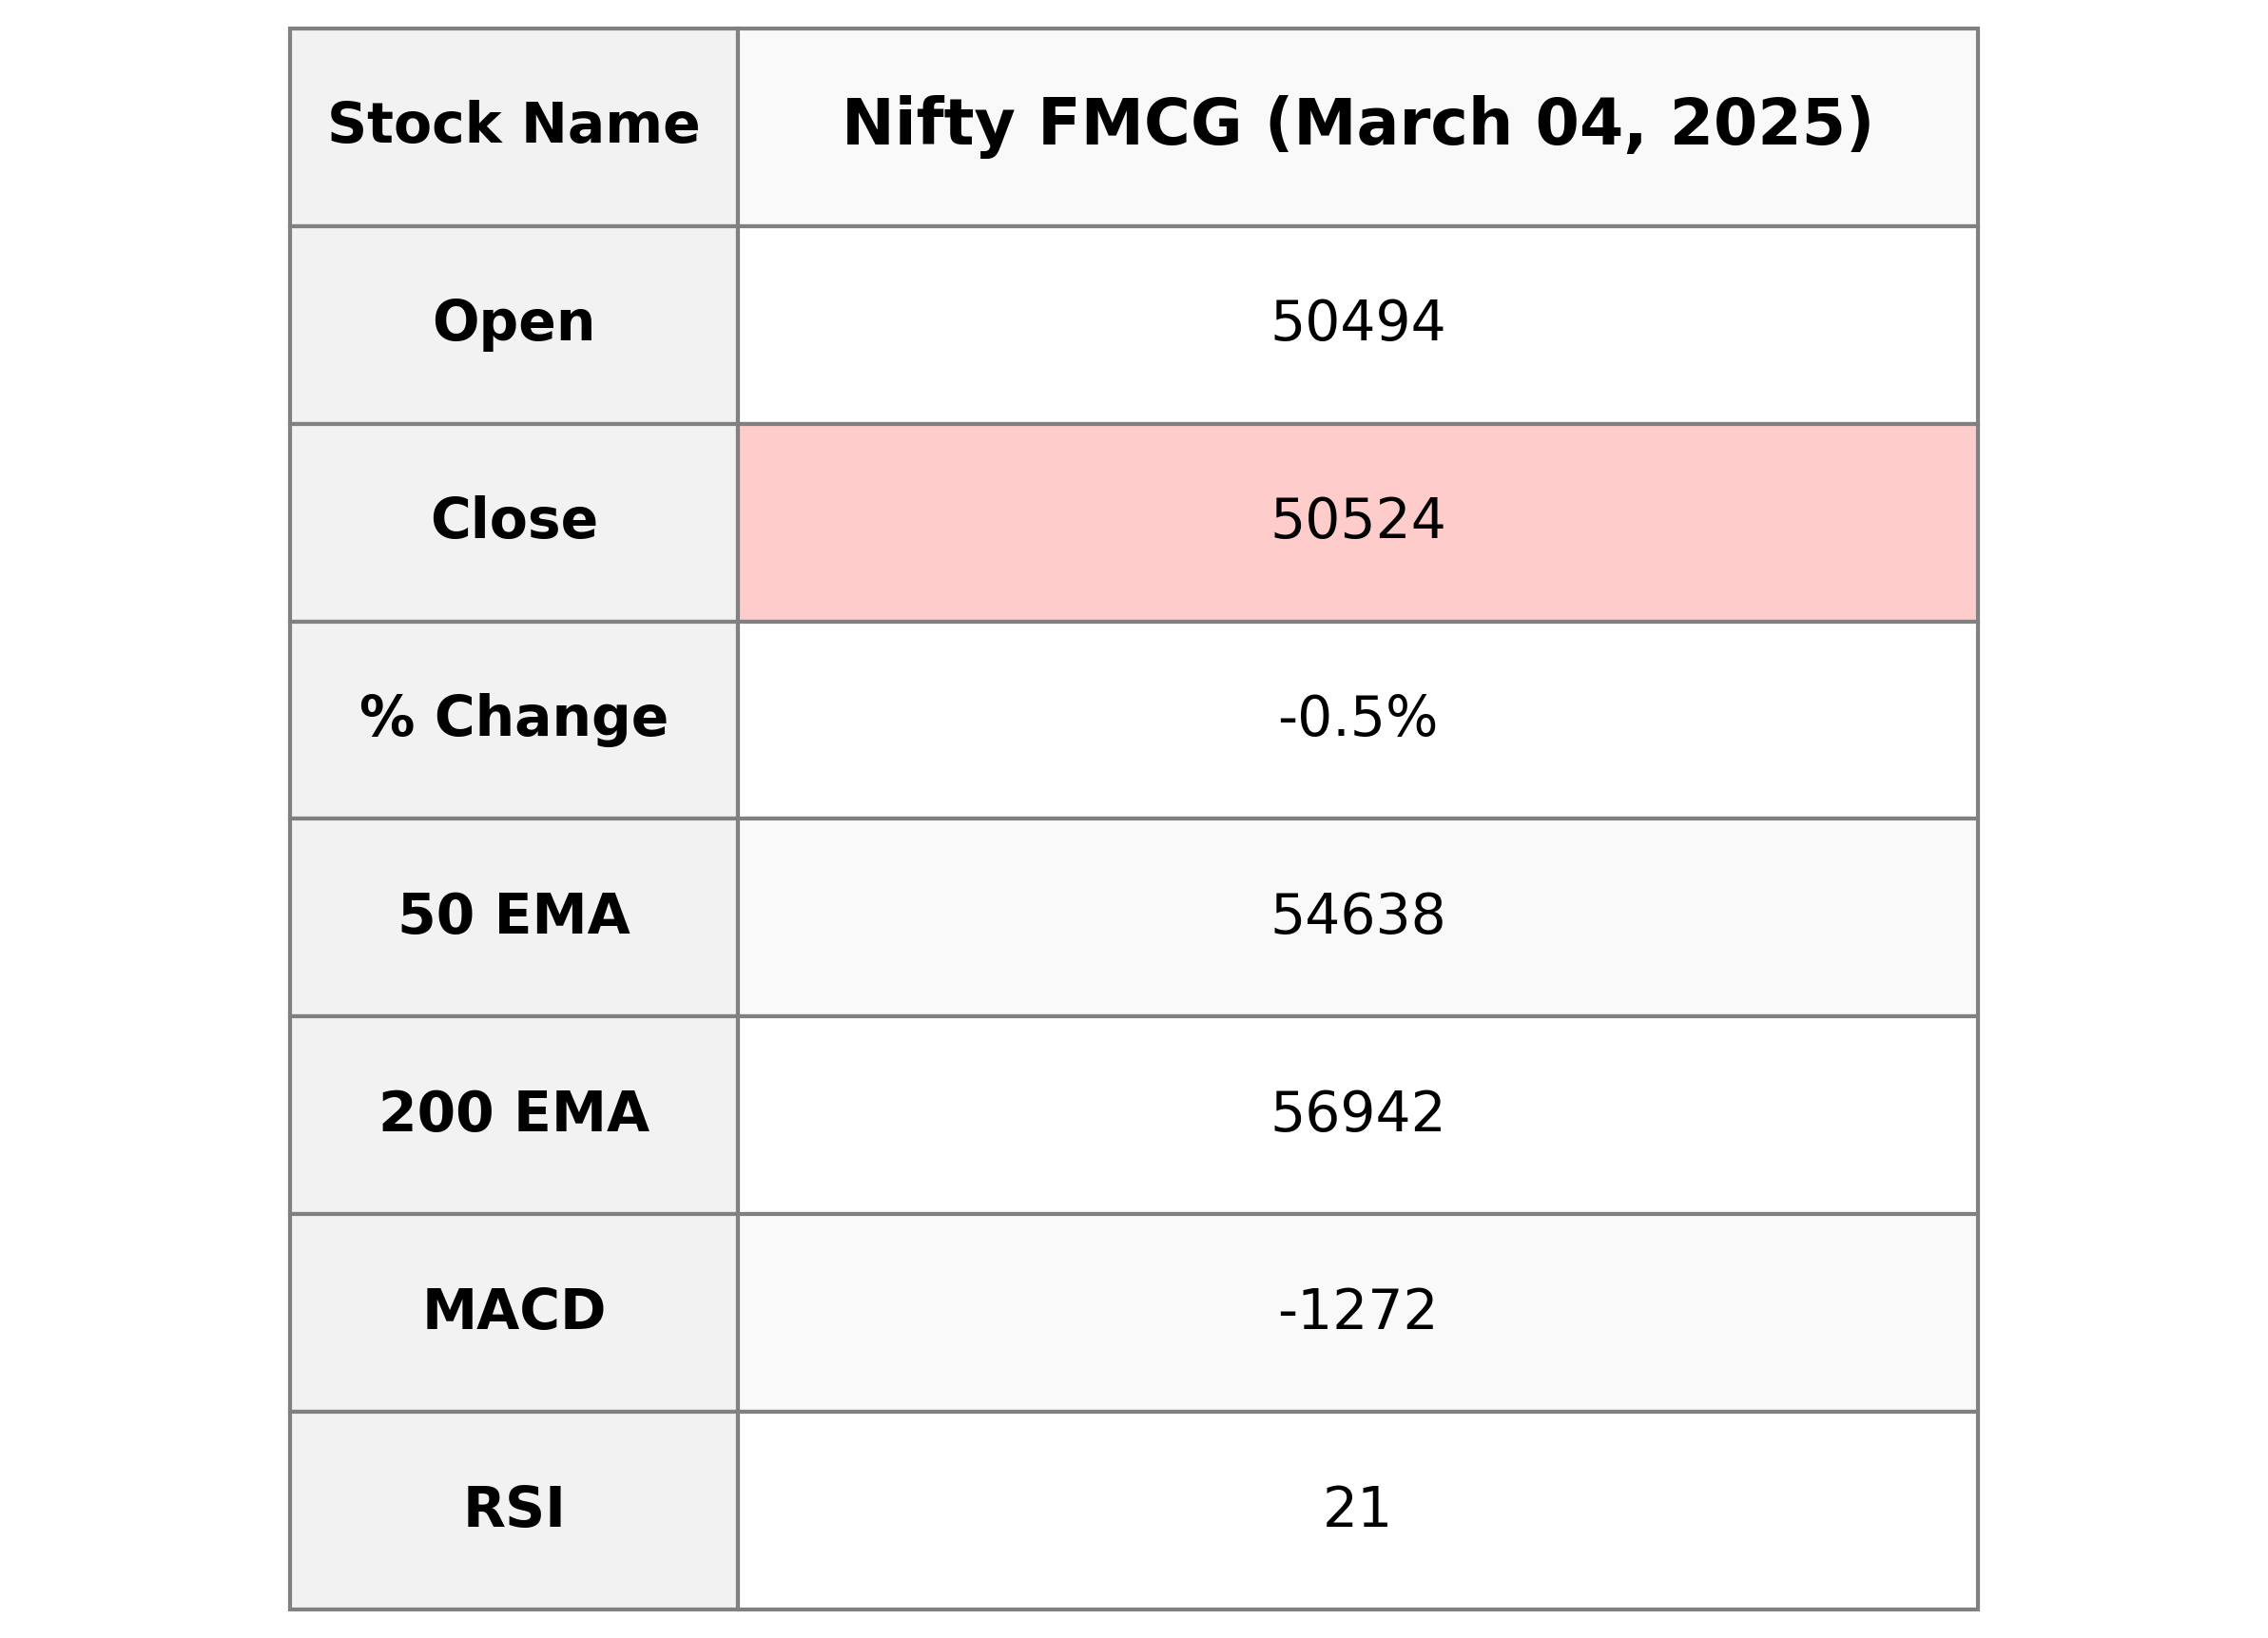
Nifty FMCG Performance: The Nifty FMCG index closed at 50,524.25, experiencing a decline of 0.52% from its previous close. Despite opening at 50,494.30, the index witnessed volatility with a high of 50,602.60 and a low of 50,199.35. Notable technical indicators show a significantly low RSI of 21.29, suggesting the index might be oversold. The MACD value is negative at -1271.76, indicating bearish momentum against the MACD Signal.
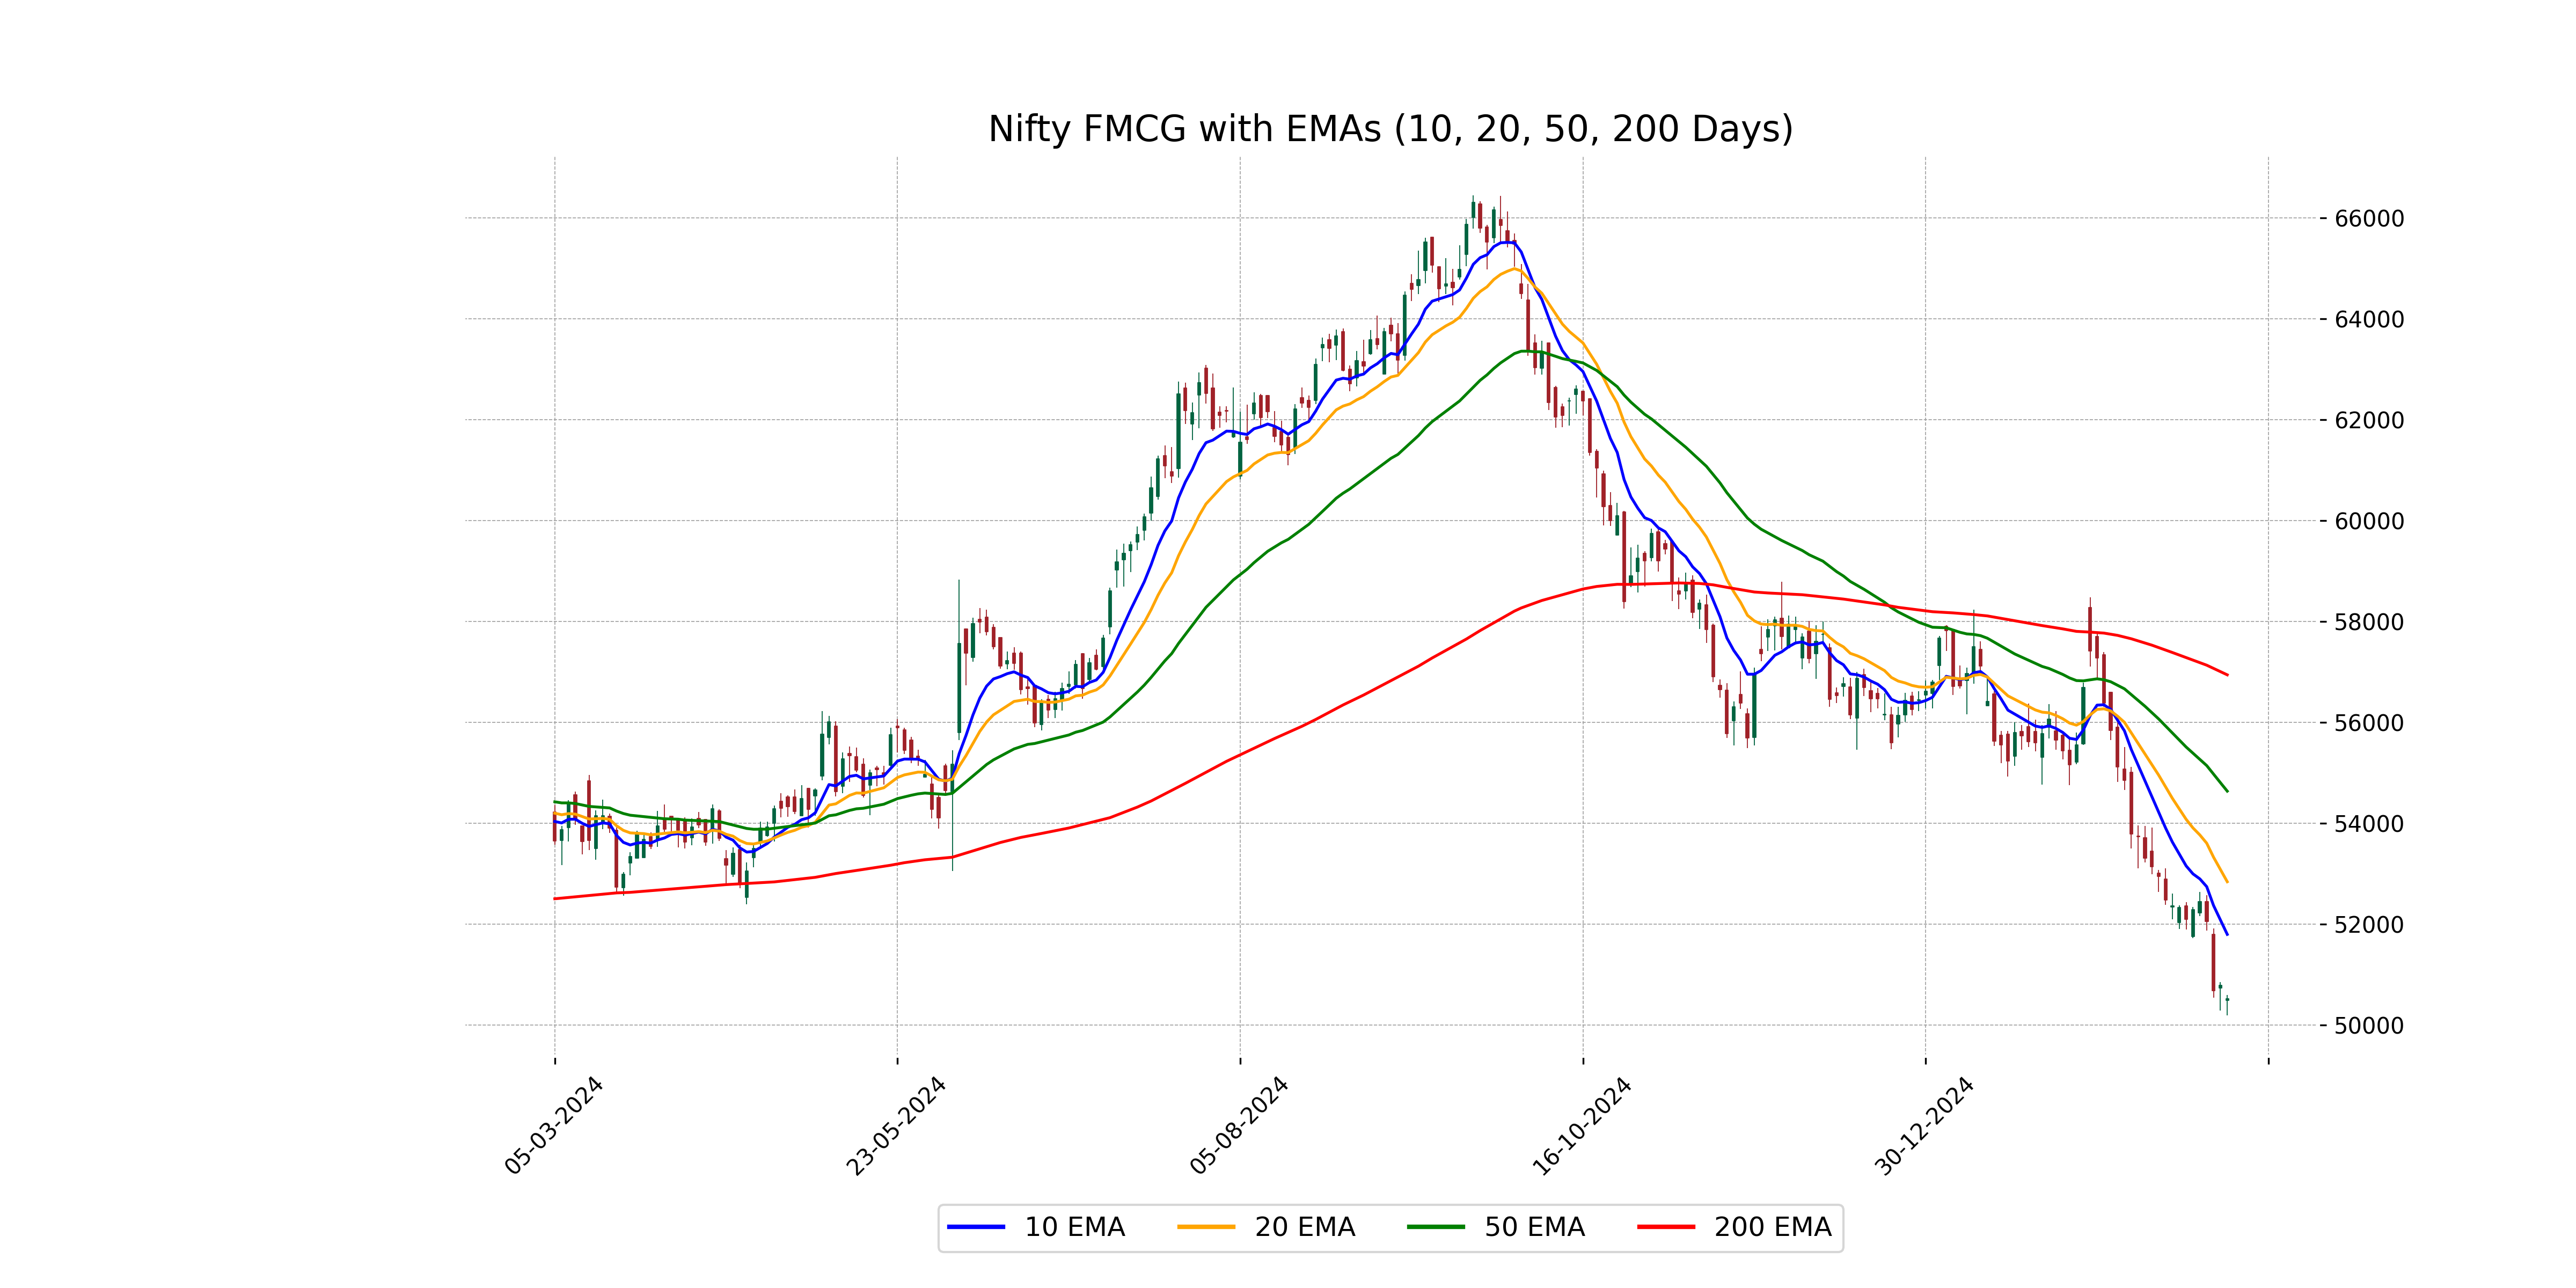
Relationship with Key Moving Averages
The closing price of Nifty FMCG at 50,524.25 is below all its key moving averages, including the 10 EMA at 51,800.23, the 20 EMA at 52,842.89, the 50 EMA at 54,638.03, and the 200 EMA at 56,942.37. This divergence indicates a bearish trend in comparison to recent historical averages.
Moving Averages Trend (MACD)
Based on the provided data, Nifty FMCG shows a bearish trend with a negative MACD value of -1271.76, which is below the MACD Signal line at -1071.56. This indicates a potential downward momentum in the stock price.
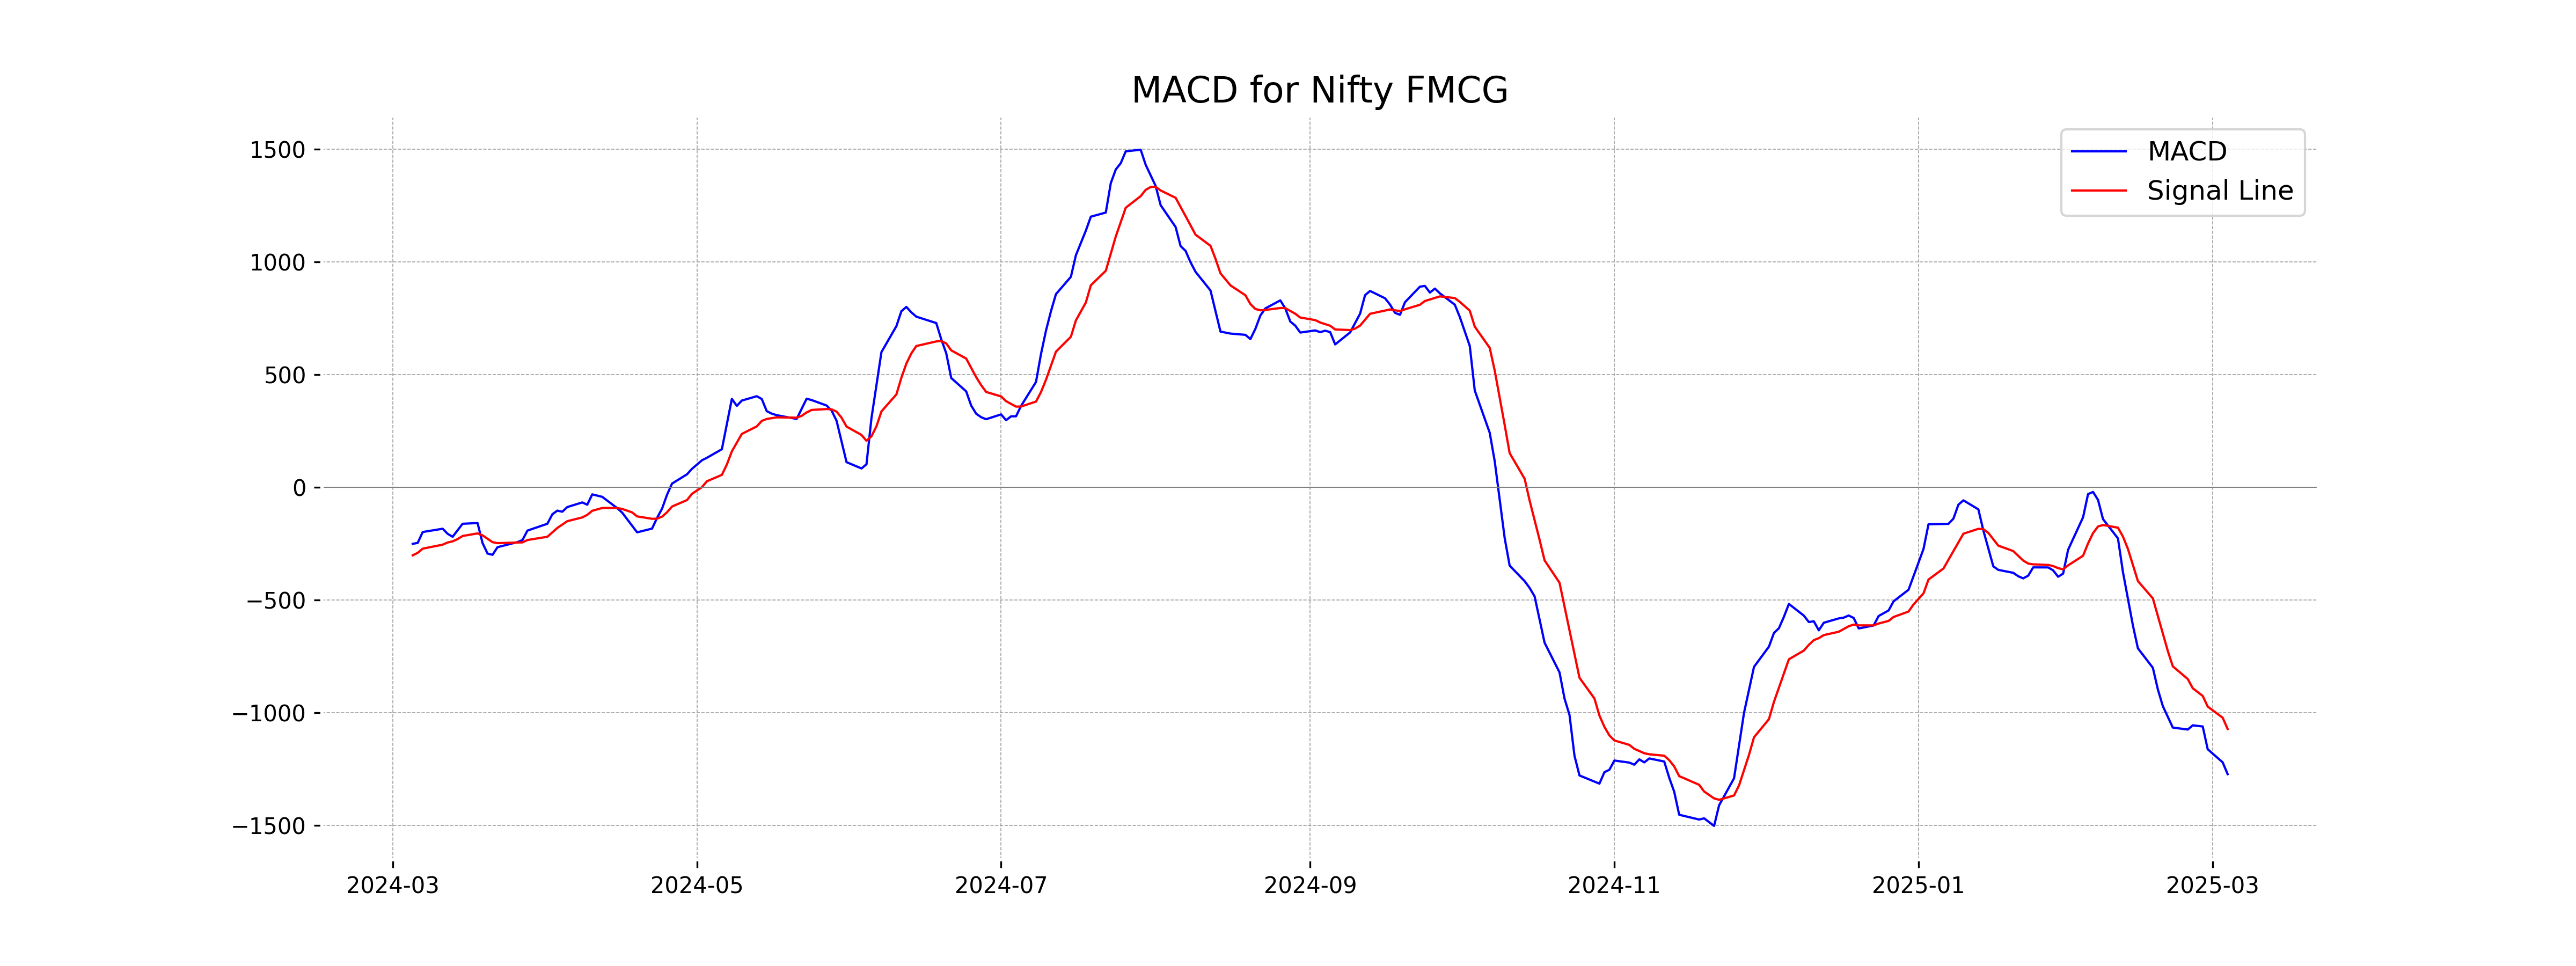
RSI Analysis
The RSI value for Nifty FMCG is 21.29, which indicates that the stock may be in the oversold territory. Typically, an RSI below 30 suggests that the stock might be undervalued and could experience a potential price reversal or buying interest.
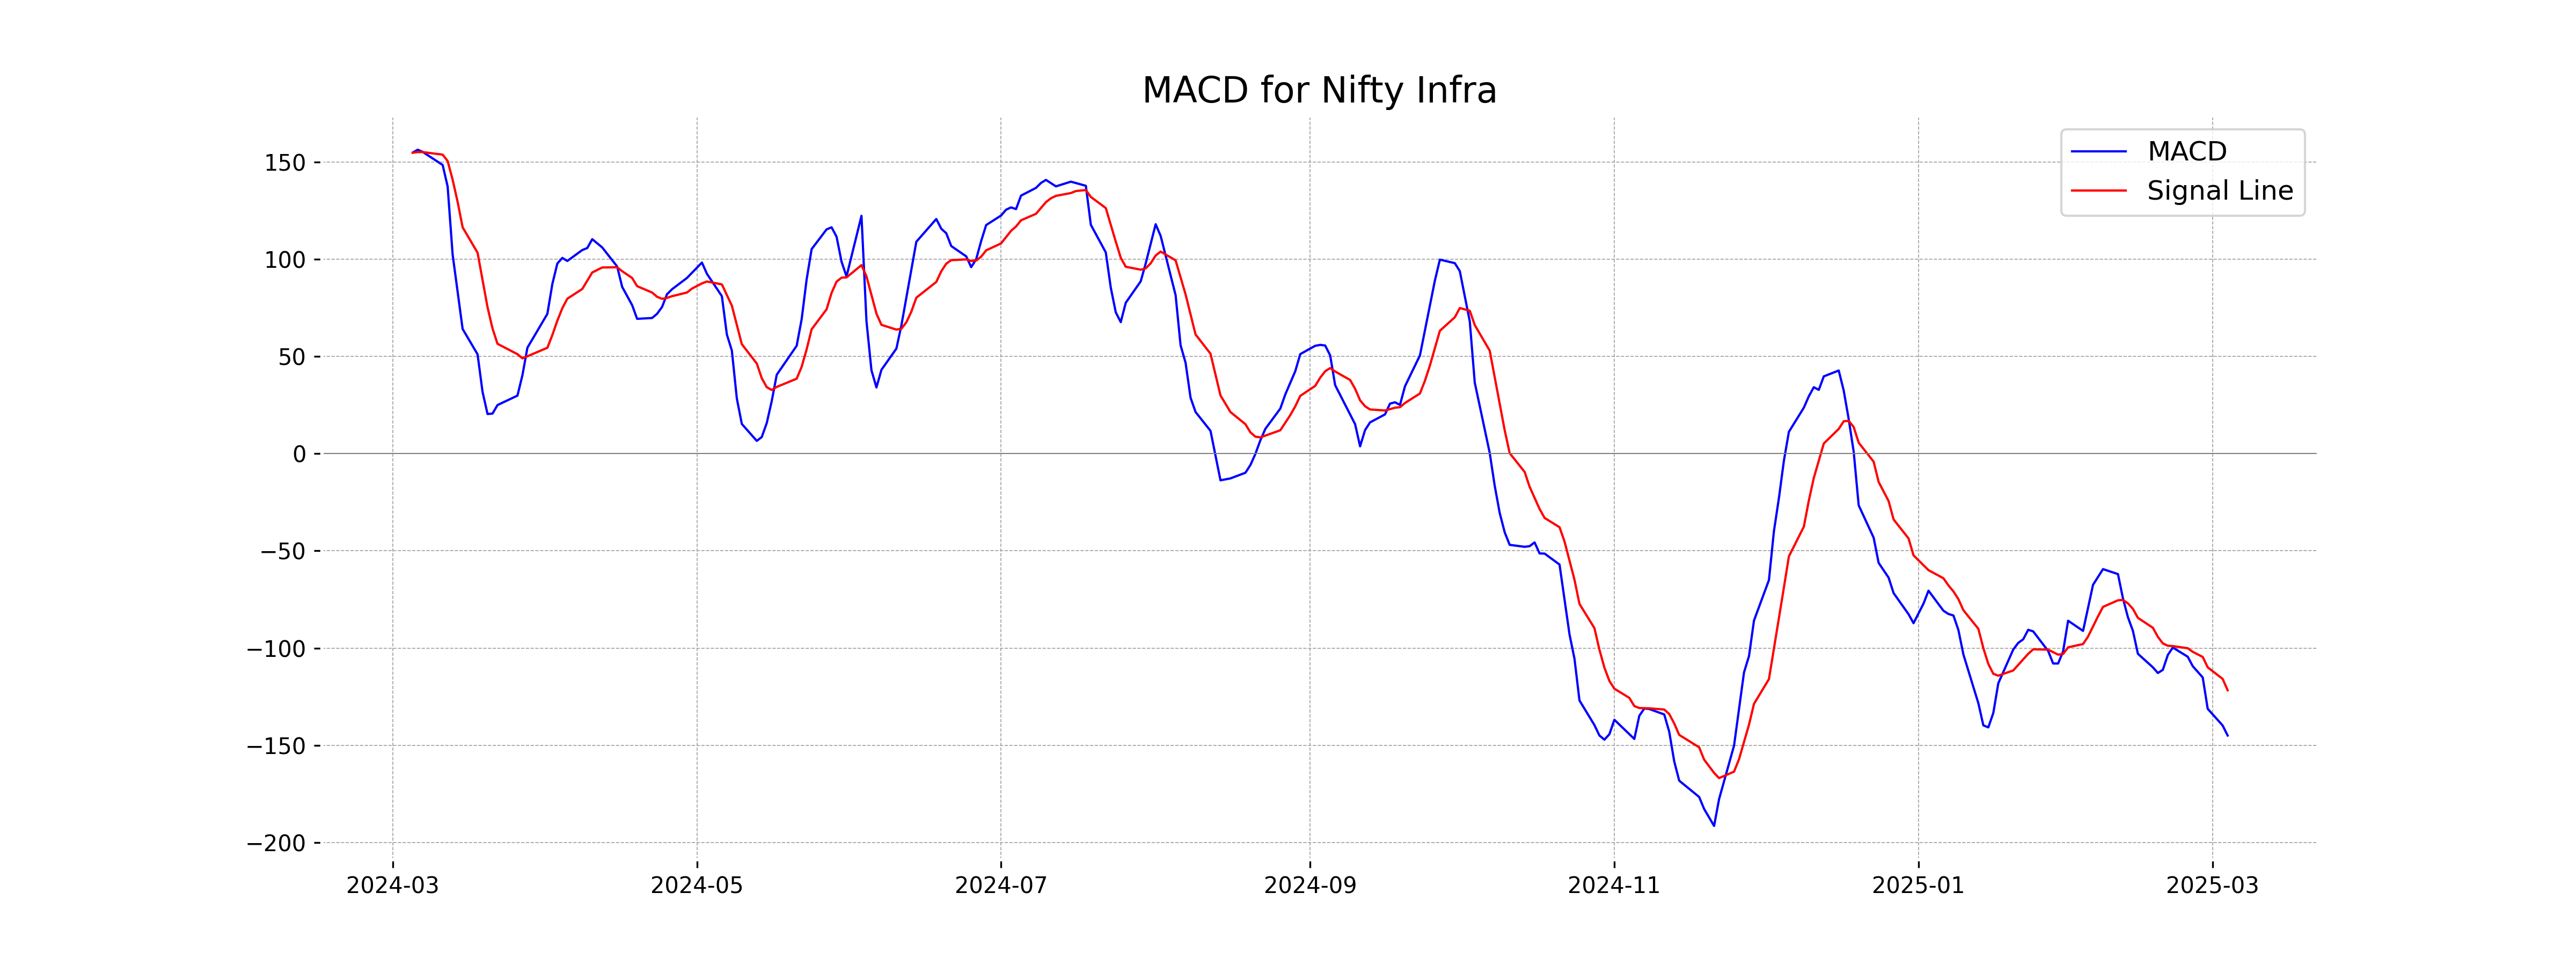
Analysis for Nifty Infra - March 04, 2025
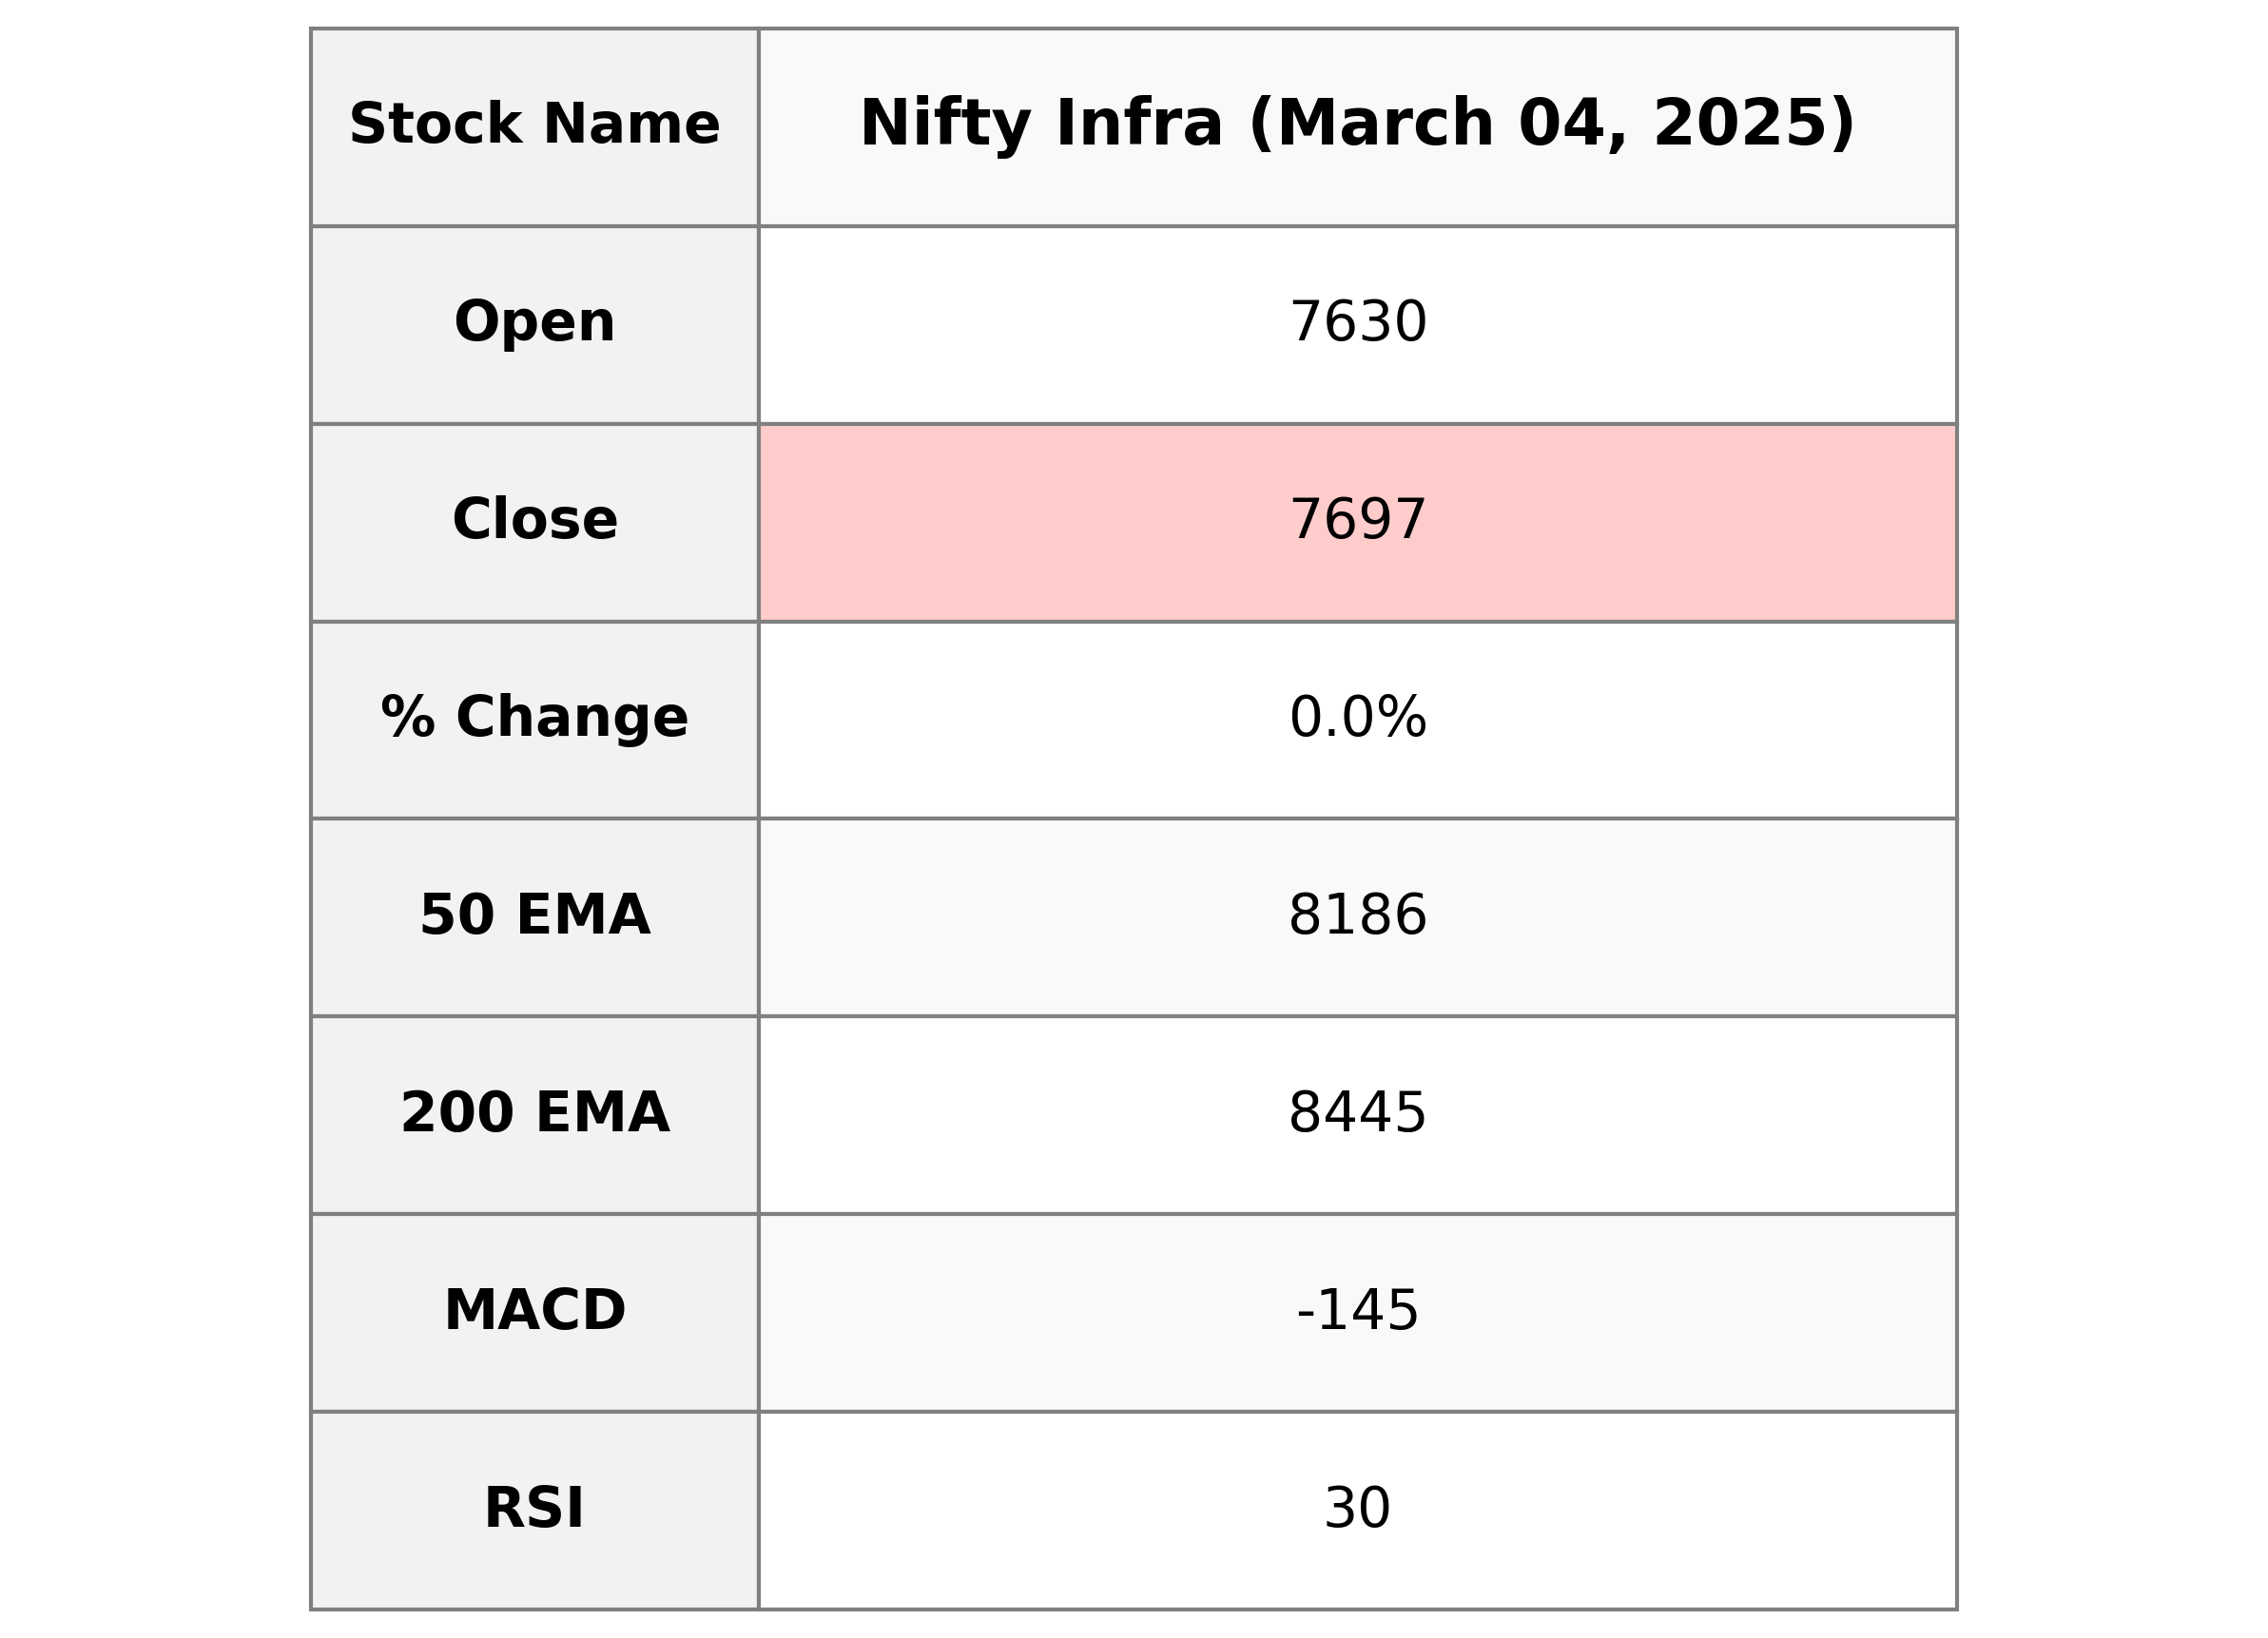
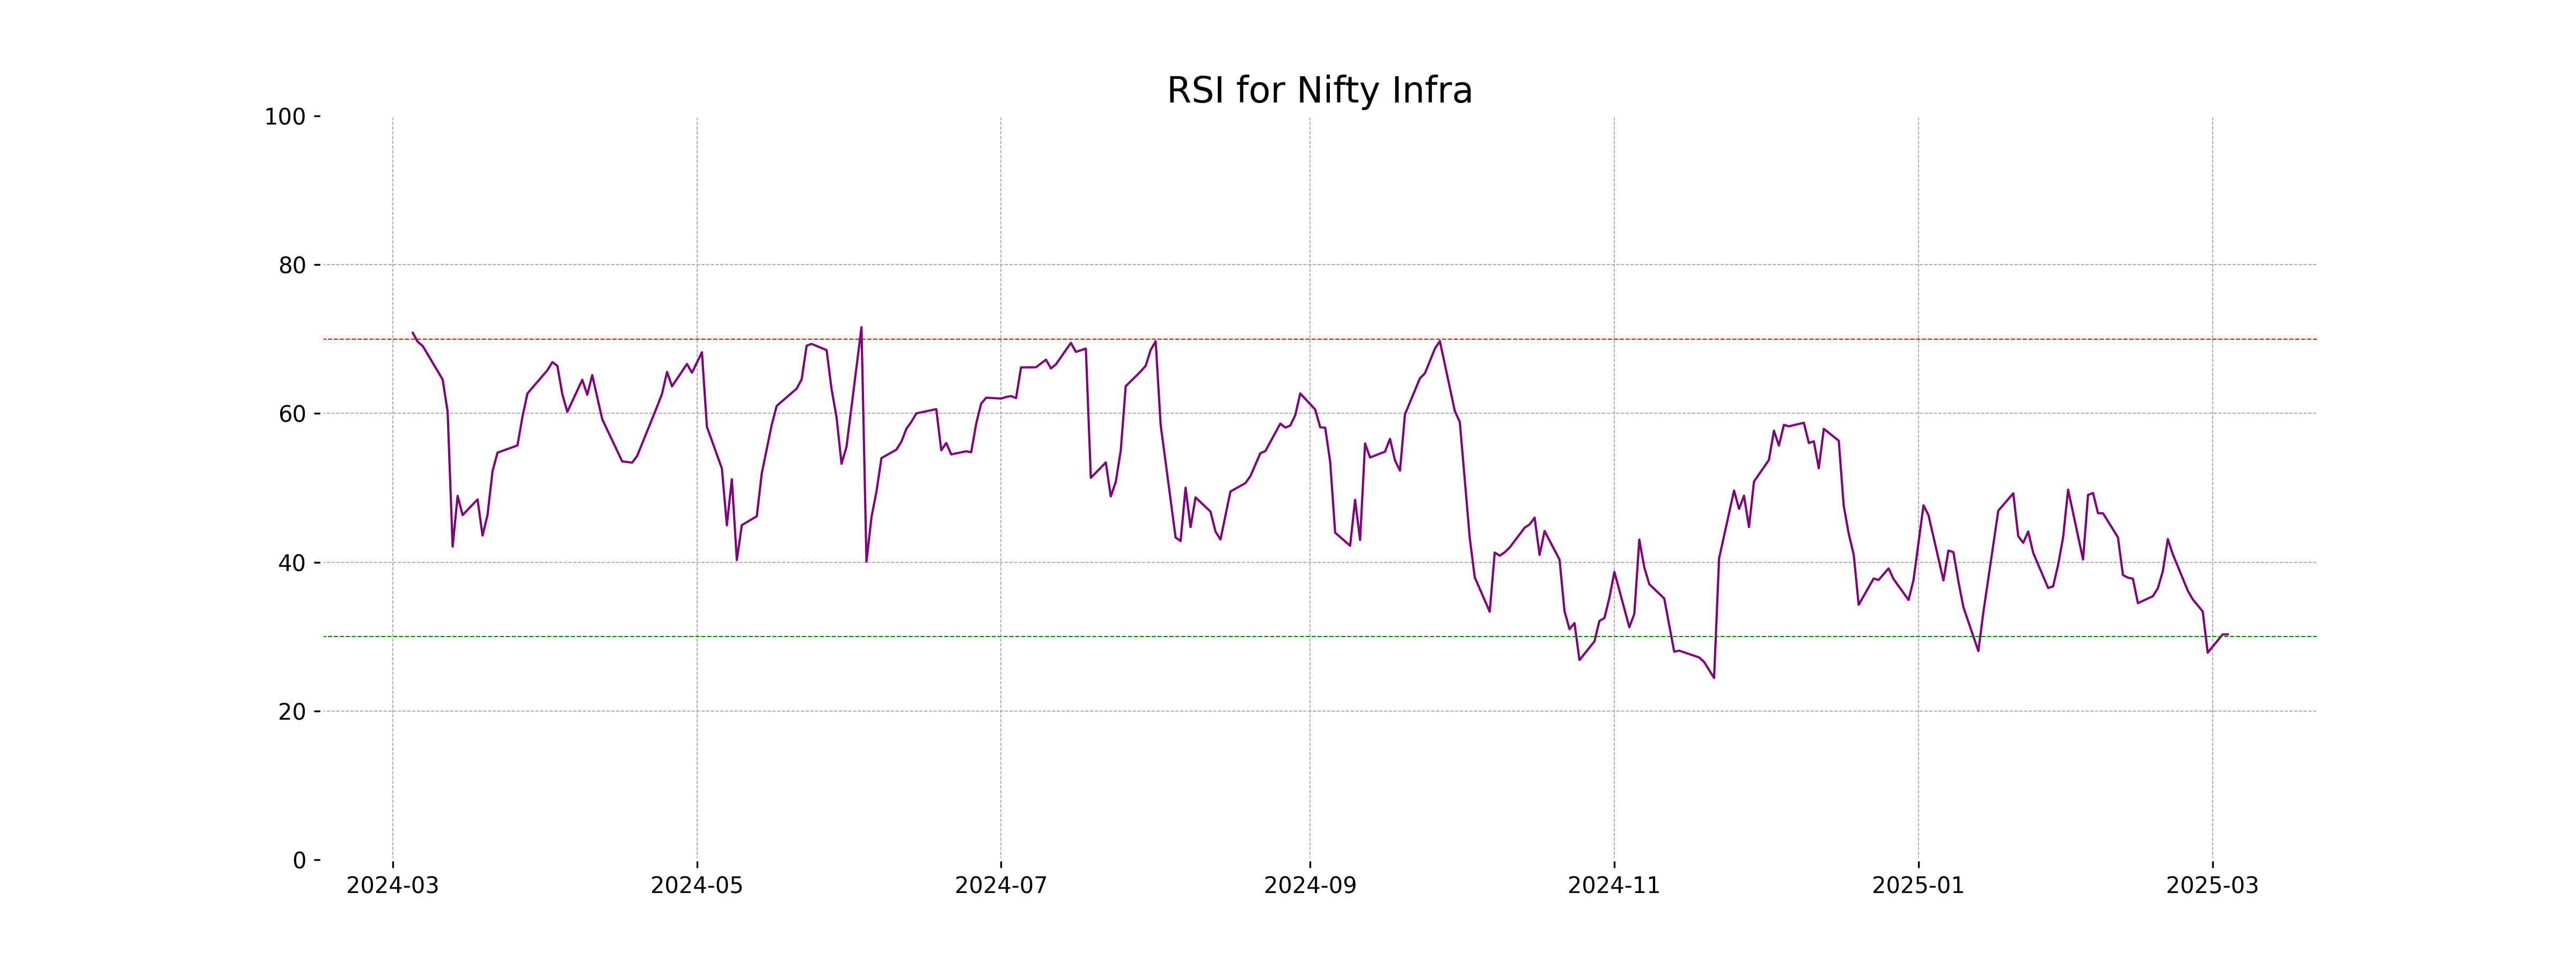
Nifty Infra opened at 7629.90 and had a high of 7718.65, closing at the same price as the previous close, 7697.35, indicating no percentage or points change. The moving averages show the index is below its 50-day and 200-day EMAs. The RSI stands at 30.29, suggesting it might be in the oversold territory, while the MACD is negative, indicating a potential bearish trend.
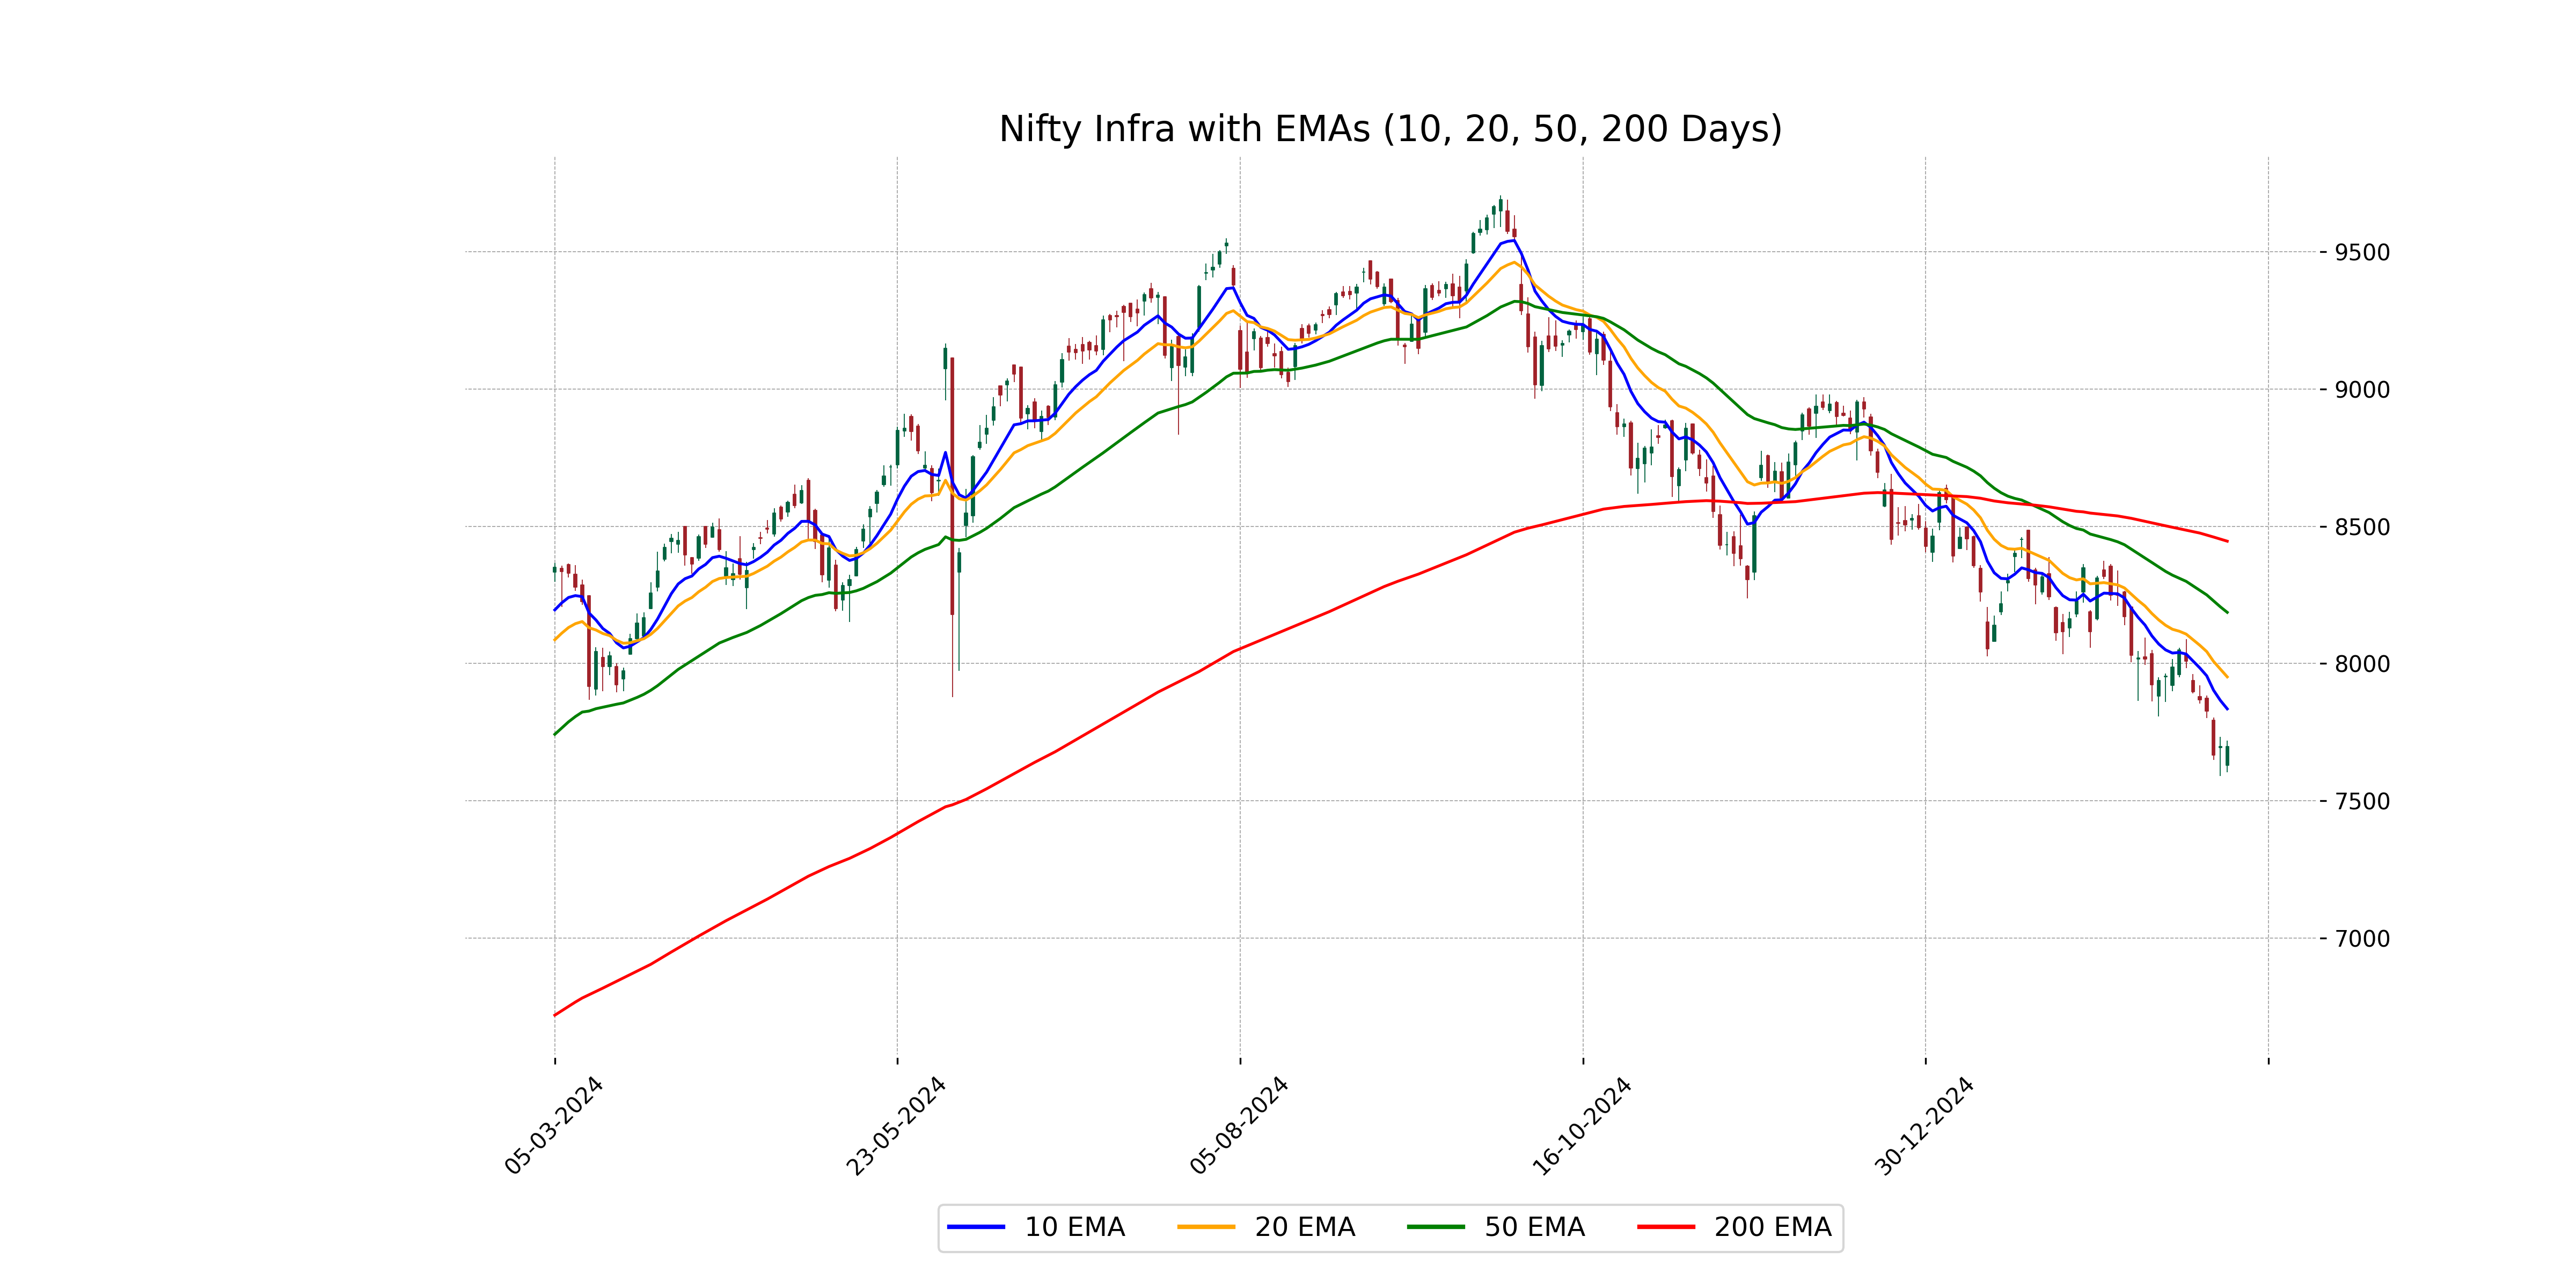
Relationship with Key Moving Averages
Nifty Infra is trading below its key moving averages, including the 50 EMA (8186.24) and 200 EMA (8445.42), indicating a bearish trend. It is also below the 10 EMA (7834.74) and 20 EMA (7951.23), suggesting potential short-term weakness.
Moving Averages Trend (MACD)
MACD Analysis for Nifty Infra: The MACD value is -145.00, which is below the MACD Signal line of -121.72, indicating a potential bearish trend. This suggests that the momentum is in favor of sellers, and there might be continued downward pressure on Nifty Infra.
RSI Analysis
The RSI value for Nifty Infra is 30.29, which suggests that the index is nearing oversold conditions. Generally, an RSI below 30 indicates that an asset may be undervalued or oversold, potentially signaling a buying opportunity for traders.
Analysis for Nifty IT - March 04, 2025
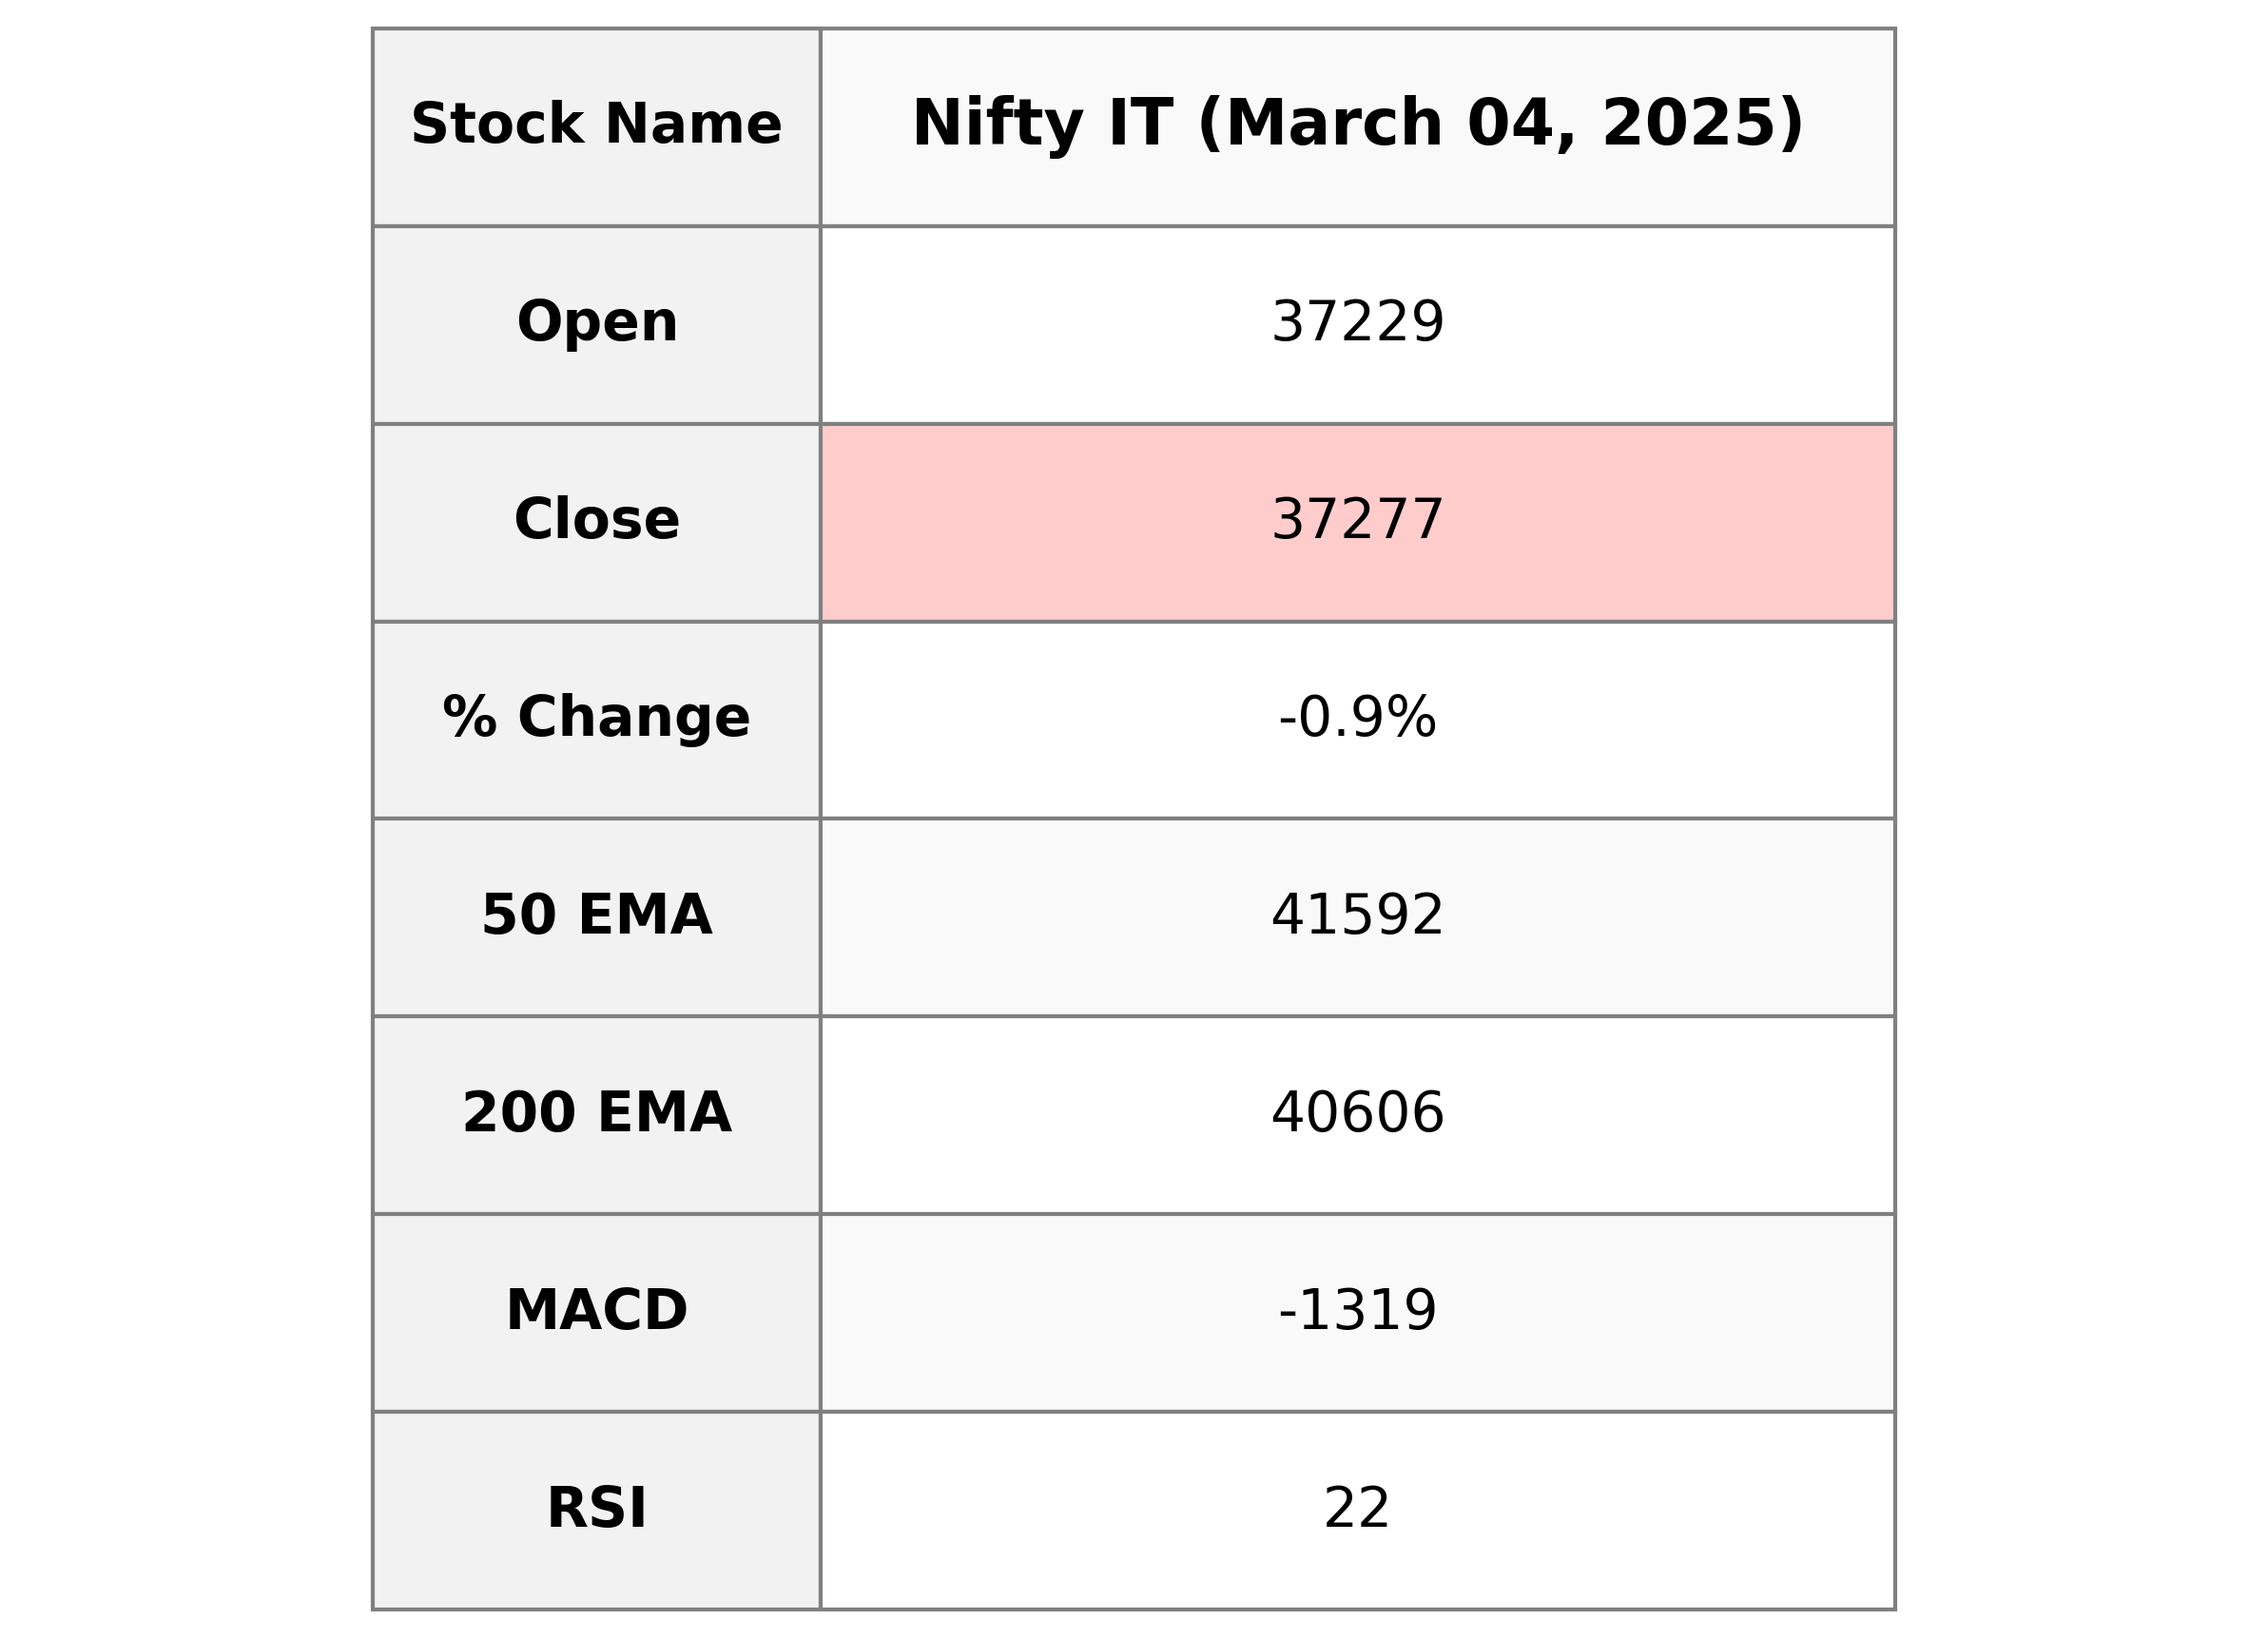
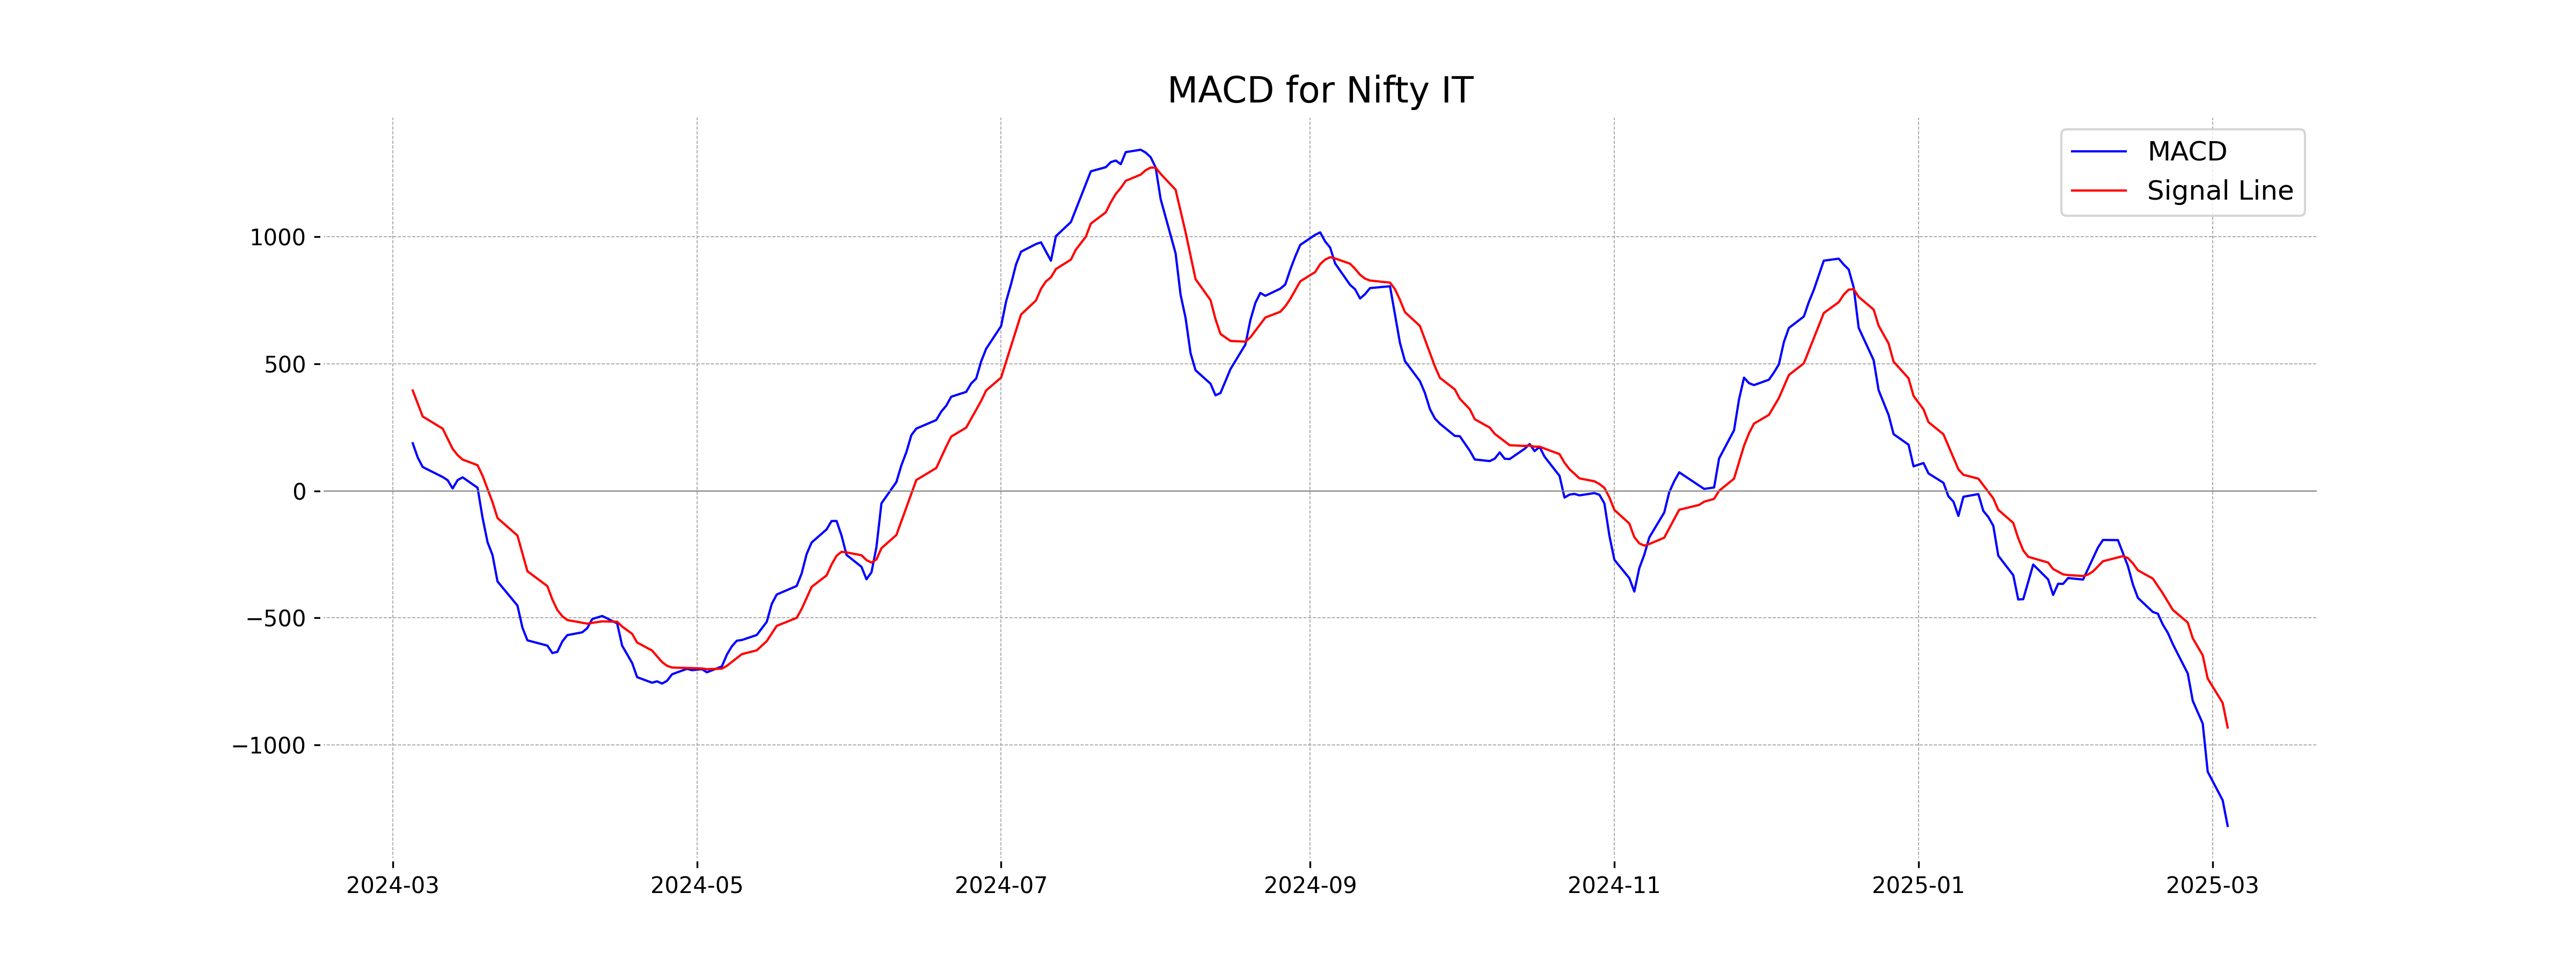
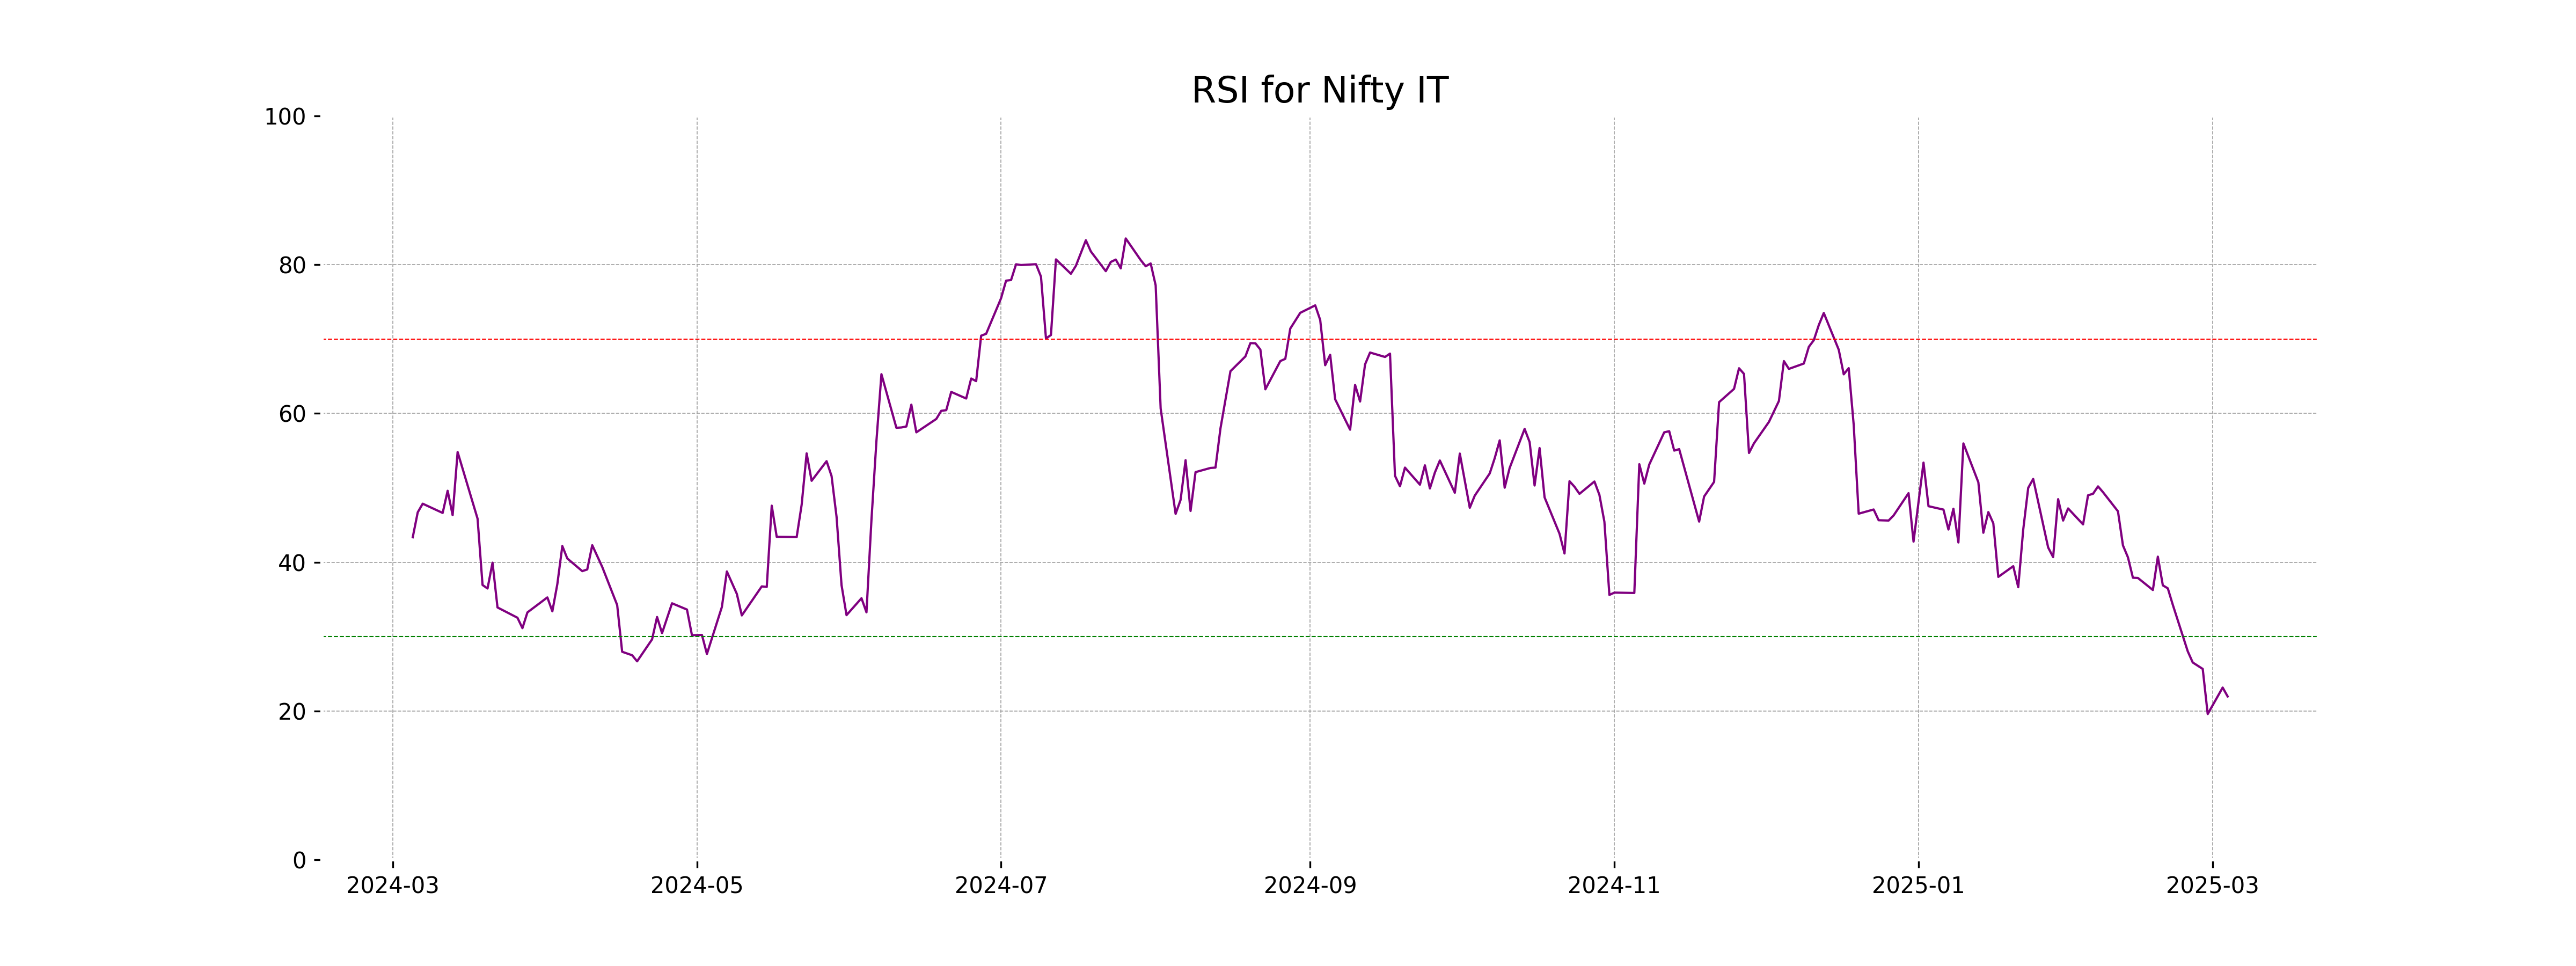
Nifty IT opened at 37228.80 and closed slightly higher at 37276.95, experiencing a points change of -337.5 from its previous close of 37614.45, reflecting a percentage change of -0.90%. The RSI of 21.95 indicates that the index is in the oversold region, which could suggest potential undervaluation.
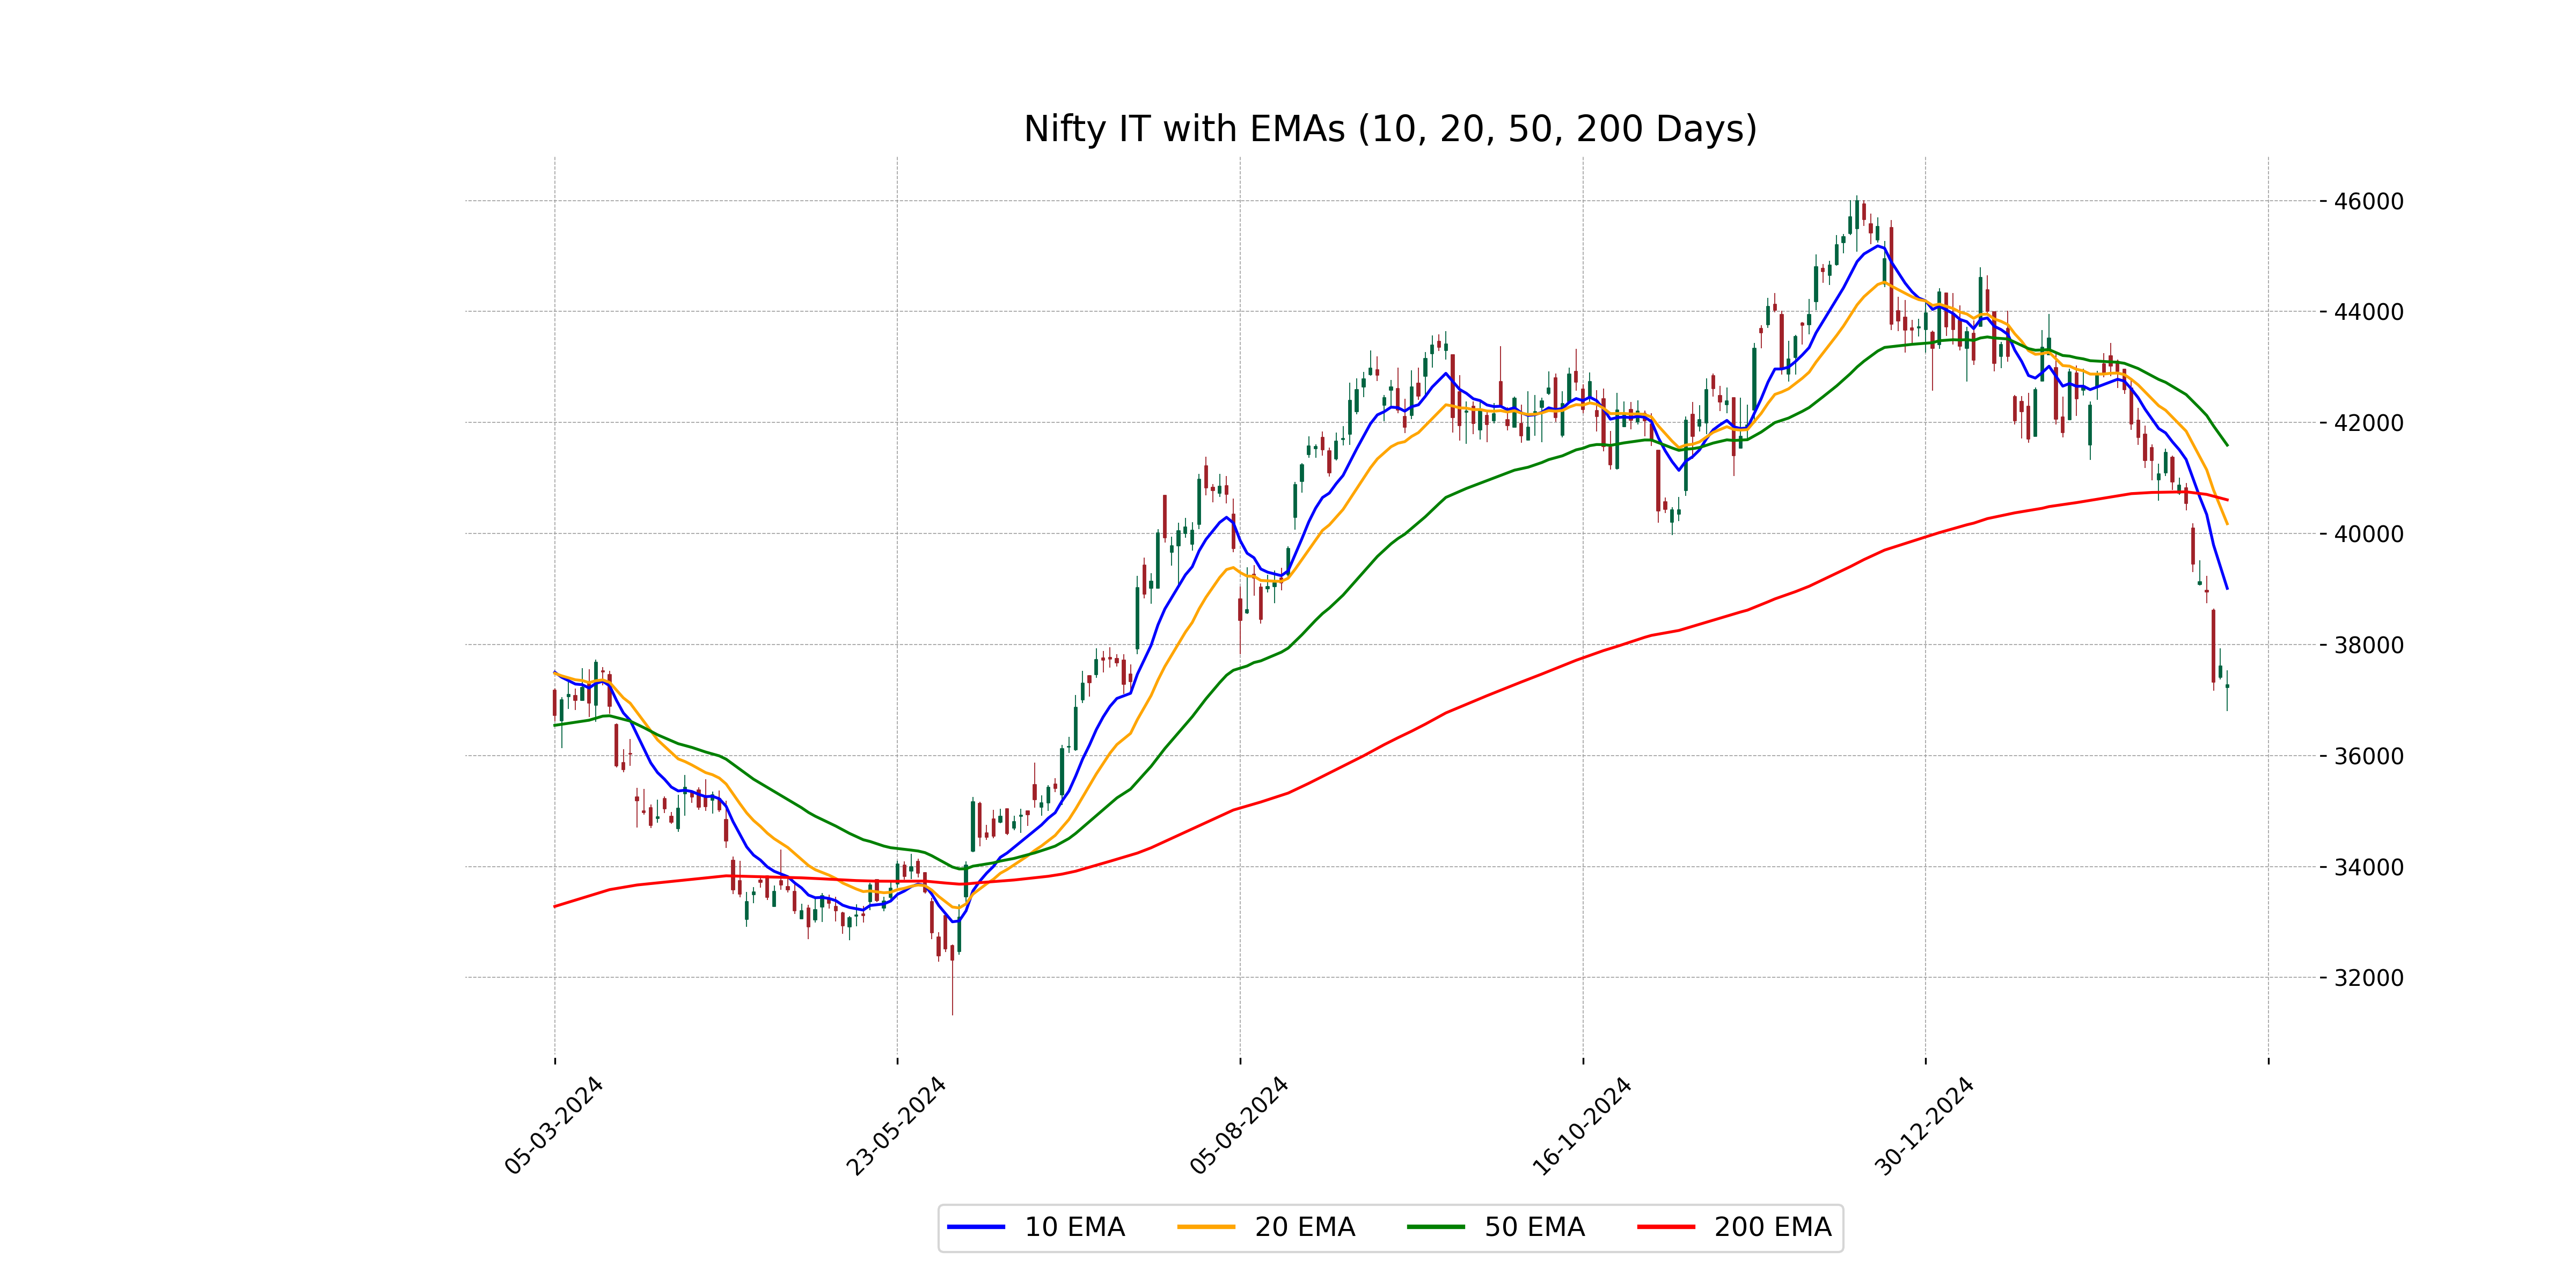
Relationship with Key Moving Averages
Nifty IT closed at 37276.95, which is below all its key moving averages: the 50 EMA (41591.88), 200 EMA (40606.09), 10 EMA (39010.95), and 20 EMA (40175.60). This indicates a bearish trend as it's trading below these key levels.
Moving Averages Trend (MACD)
The MACD value of -1319.26, which is lower than the MACD Signal of -931.84, indicates that Nifty IT is currently in a bearish trend. This suggests that the market sentiment is negative, and the price may continue to fall unless there is a reversal in the trend.
RSI Analysis
The RSI for Nifty IT is 21.95, which indicates that the index is in an oversold condition. Generally, an RSI below 30 suggests that the market may be experiencing downward pressure, potentially signaling a buying opportunity if a reversal occurs.
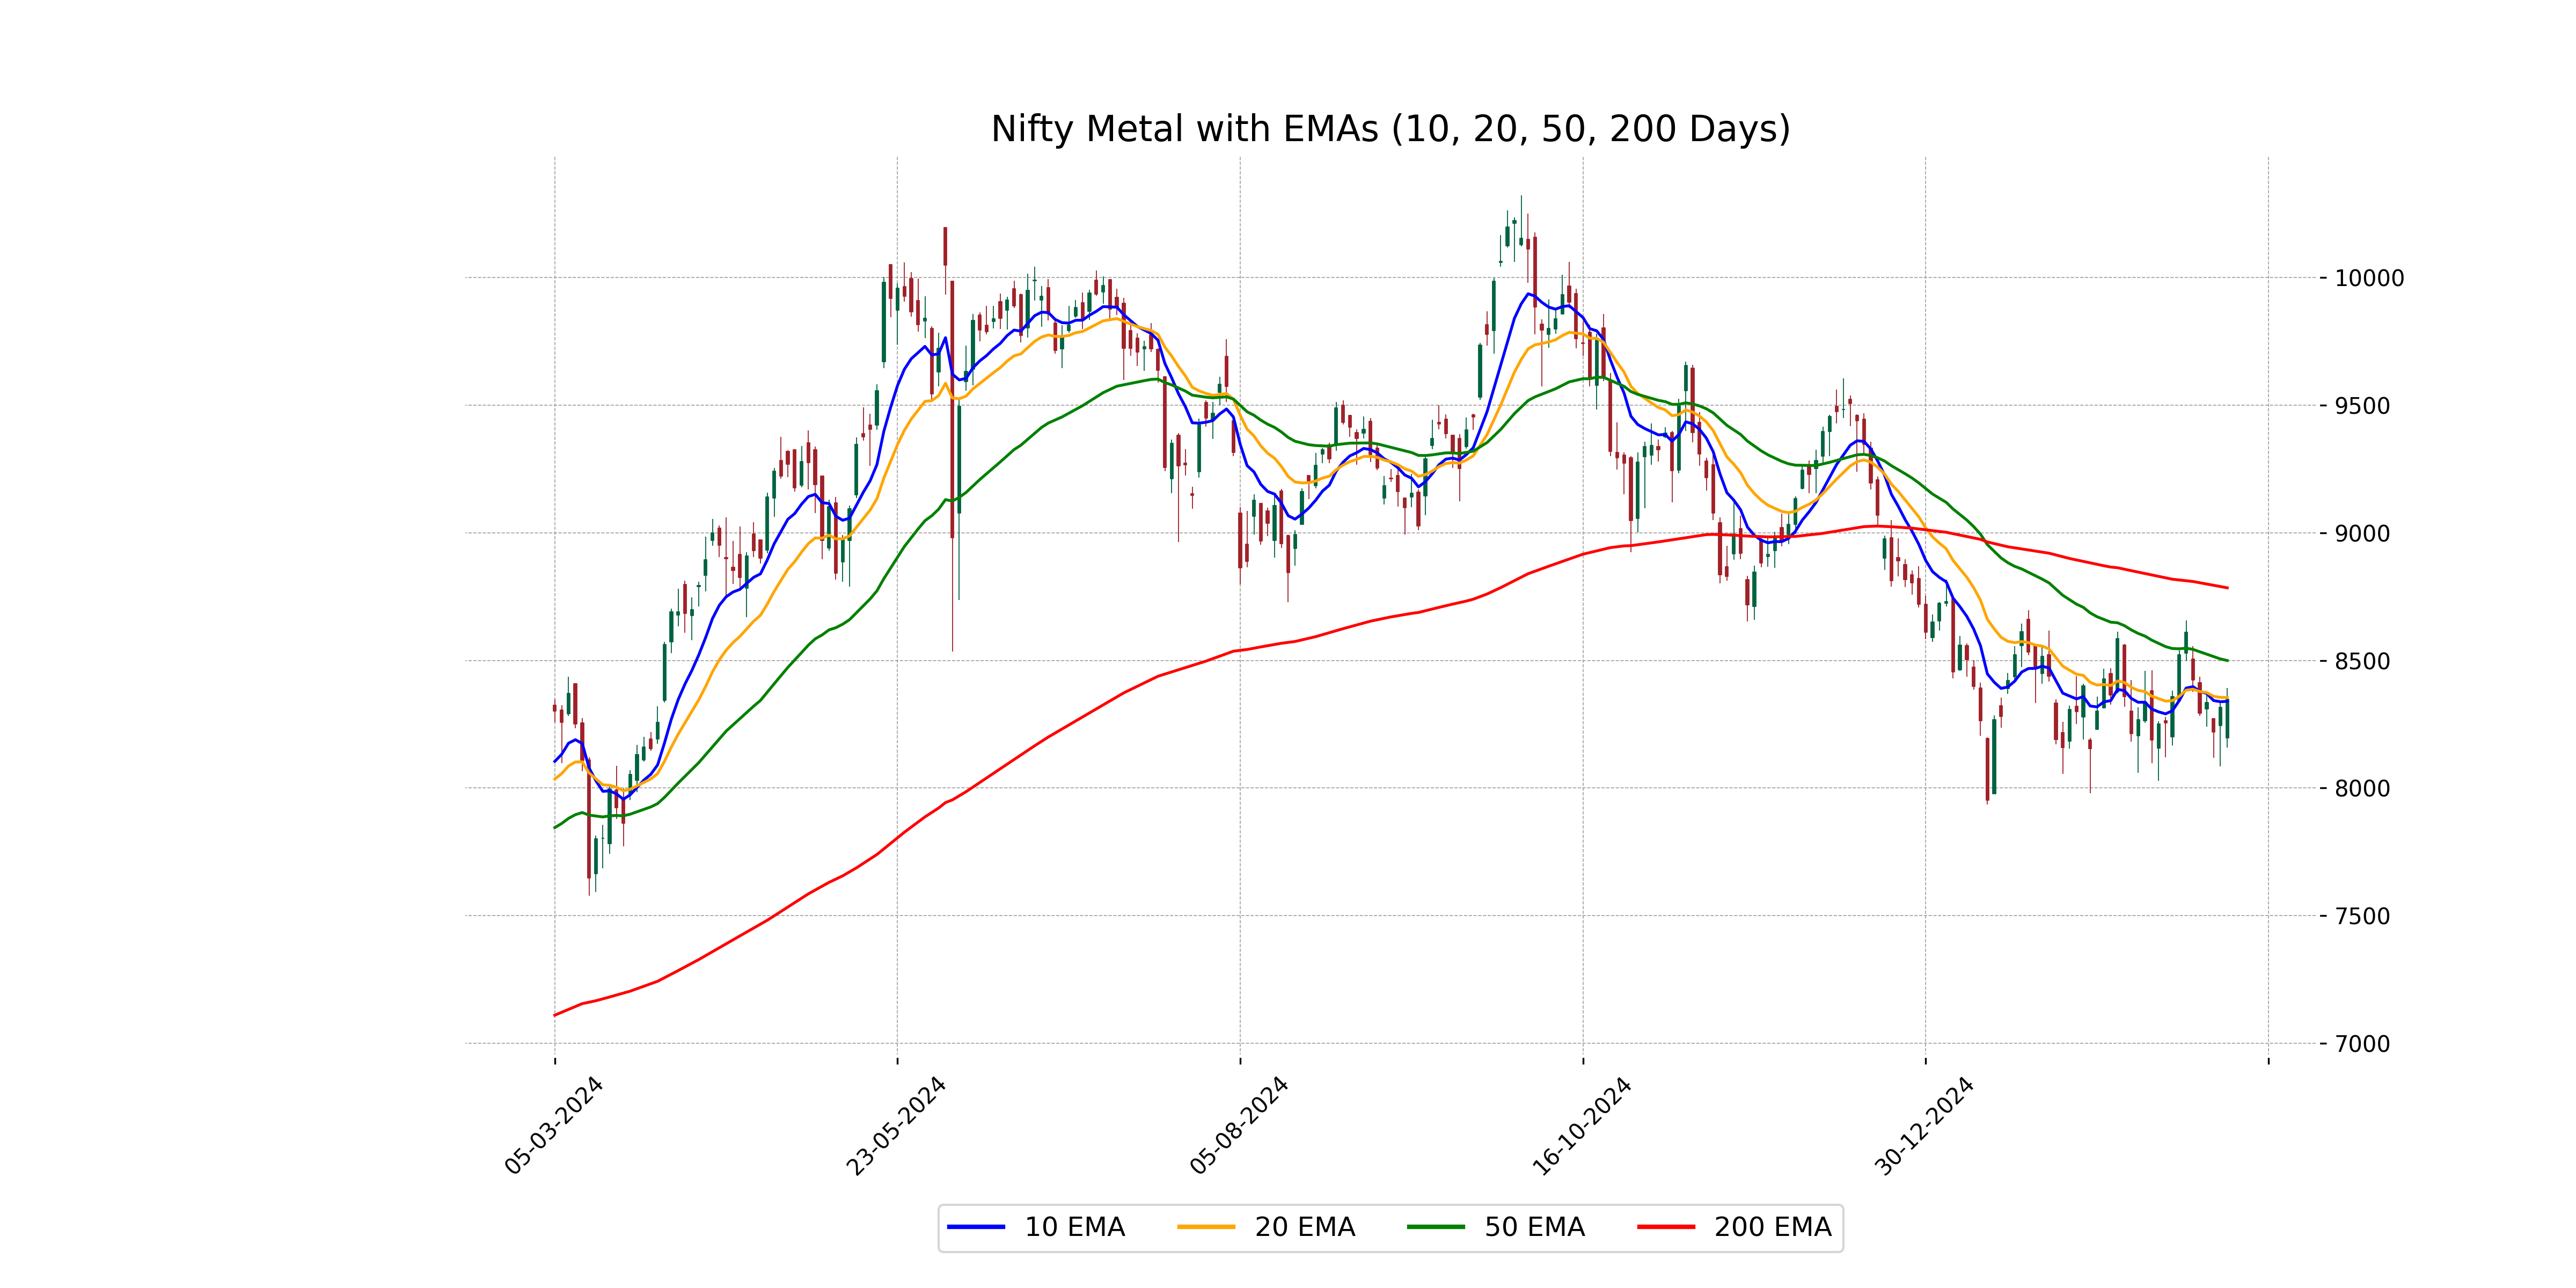
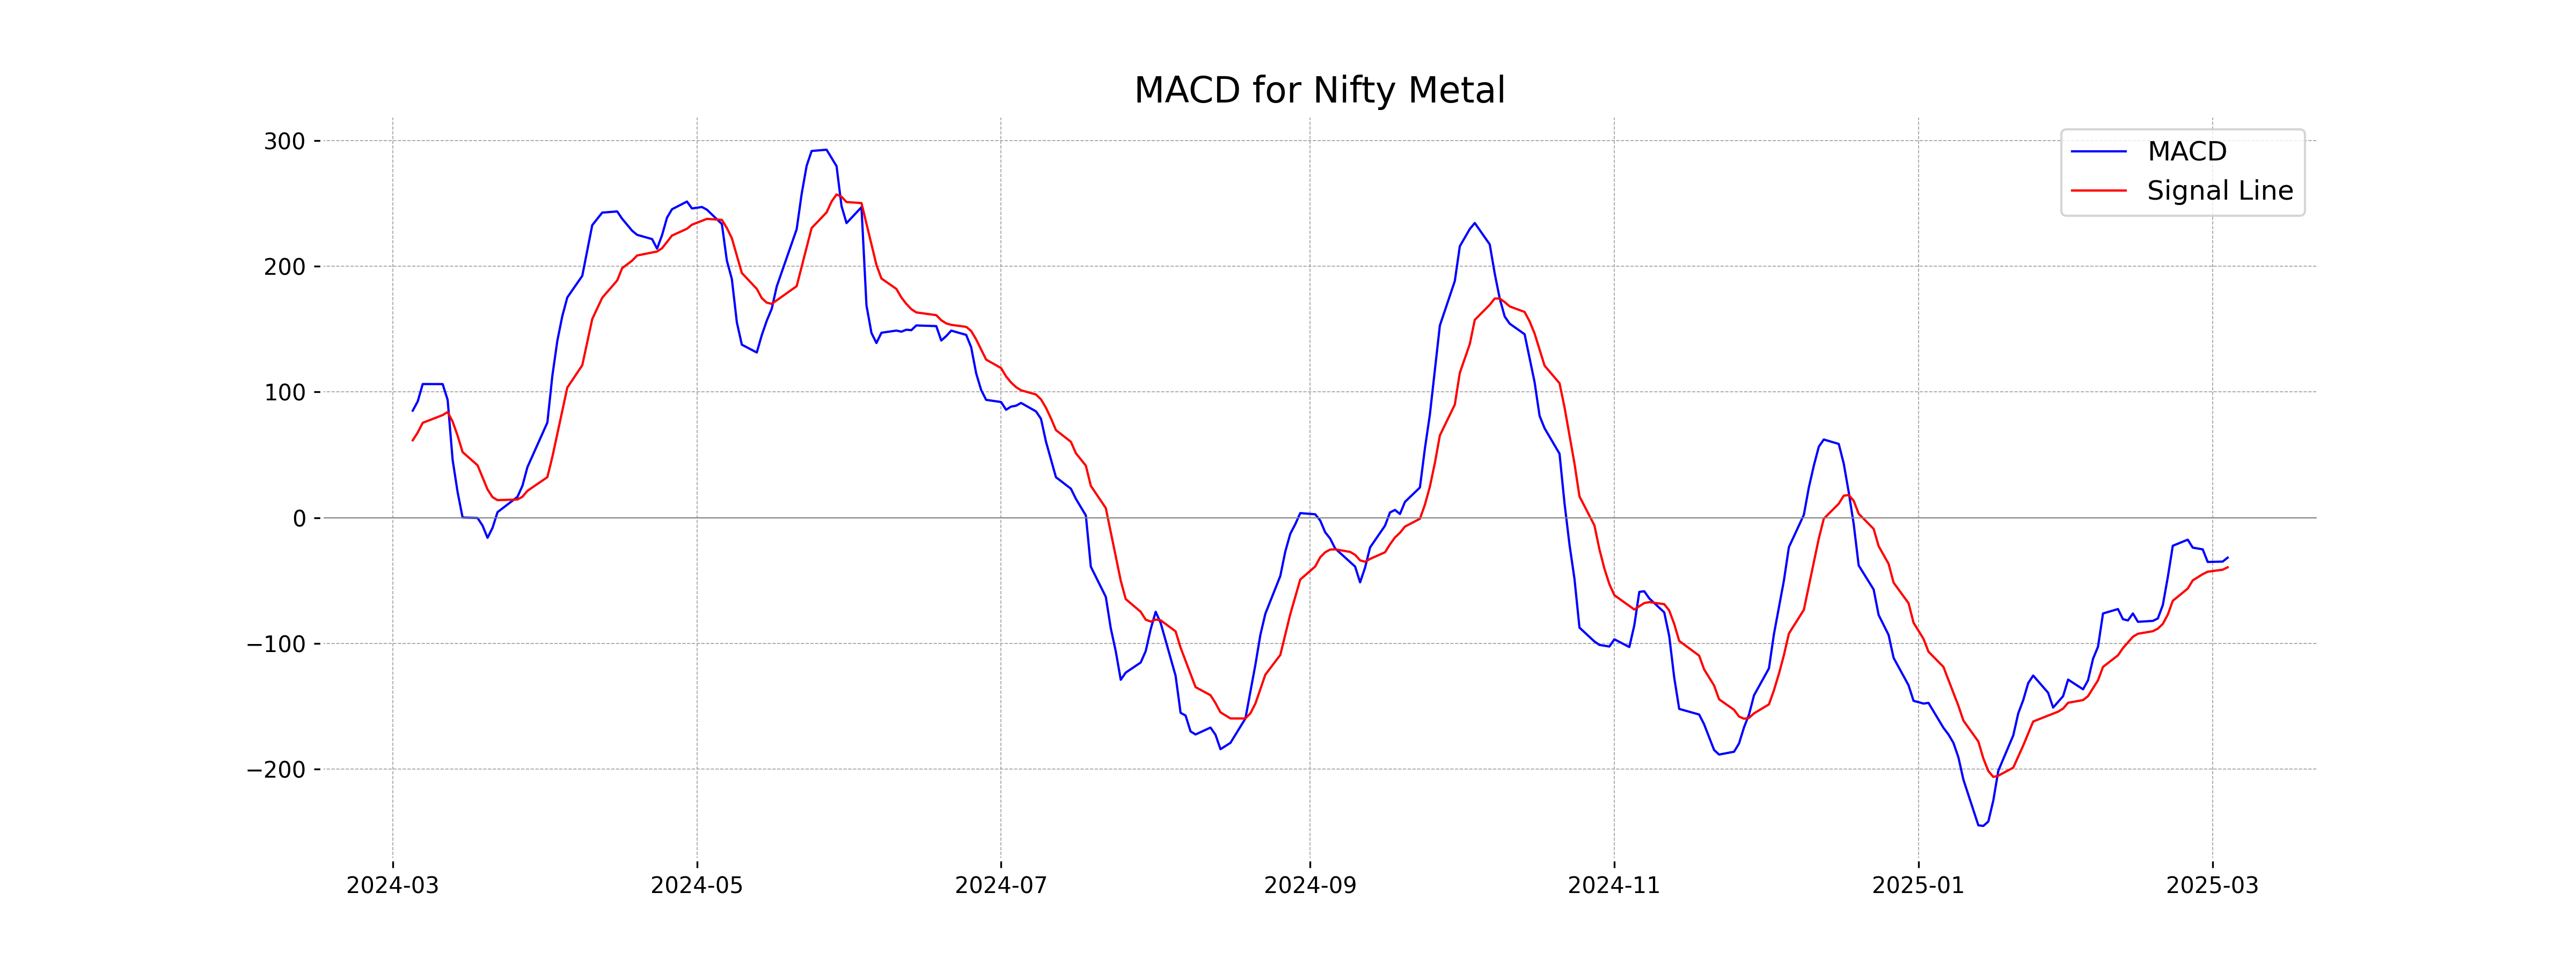
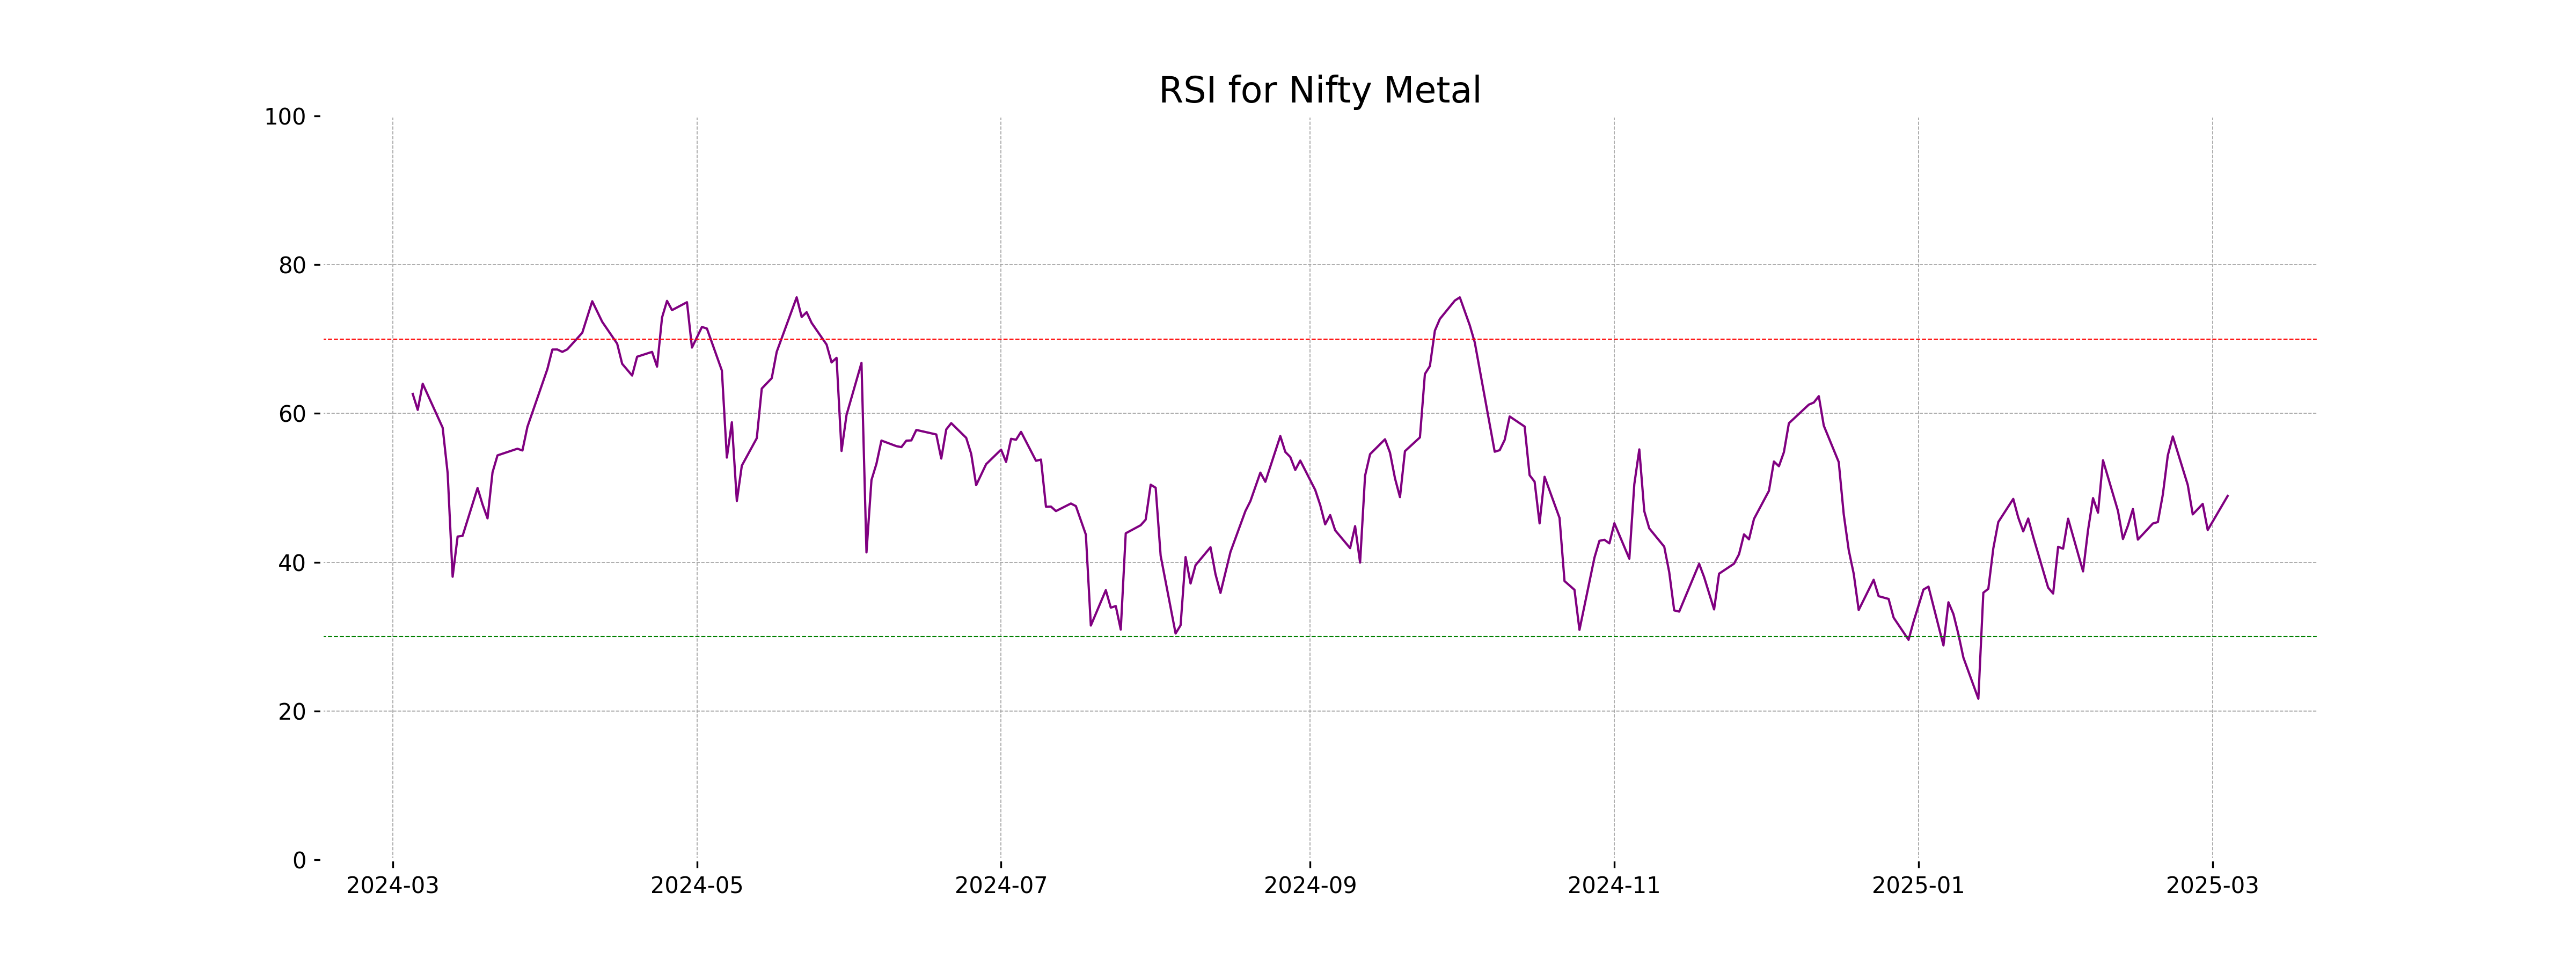
Analysis for Nifty Metal - March 04, 2025
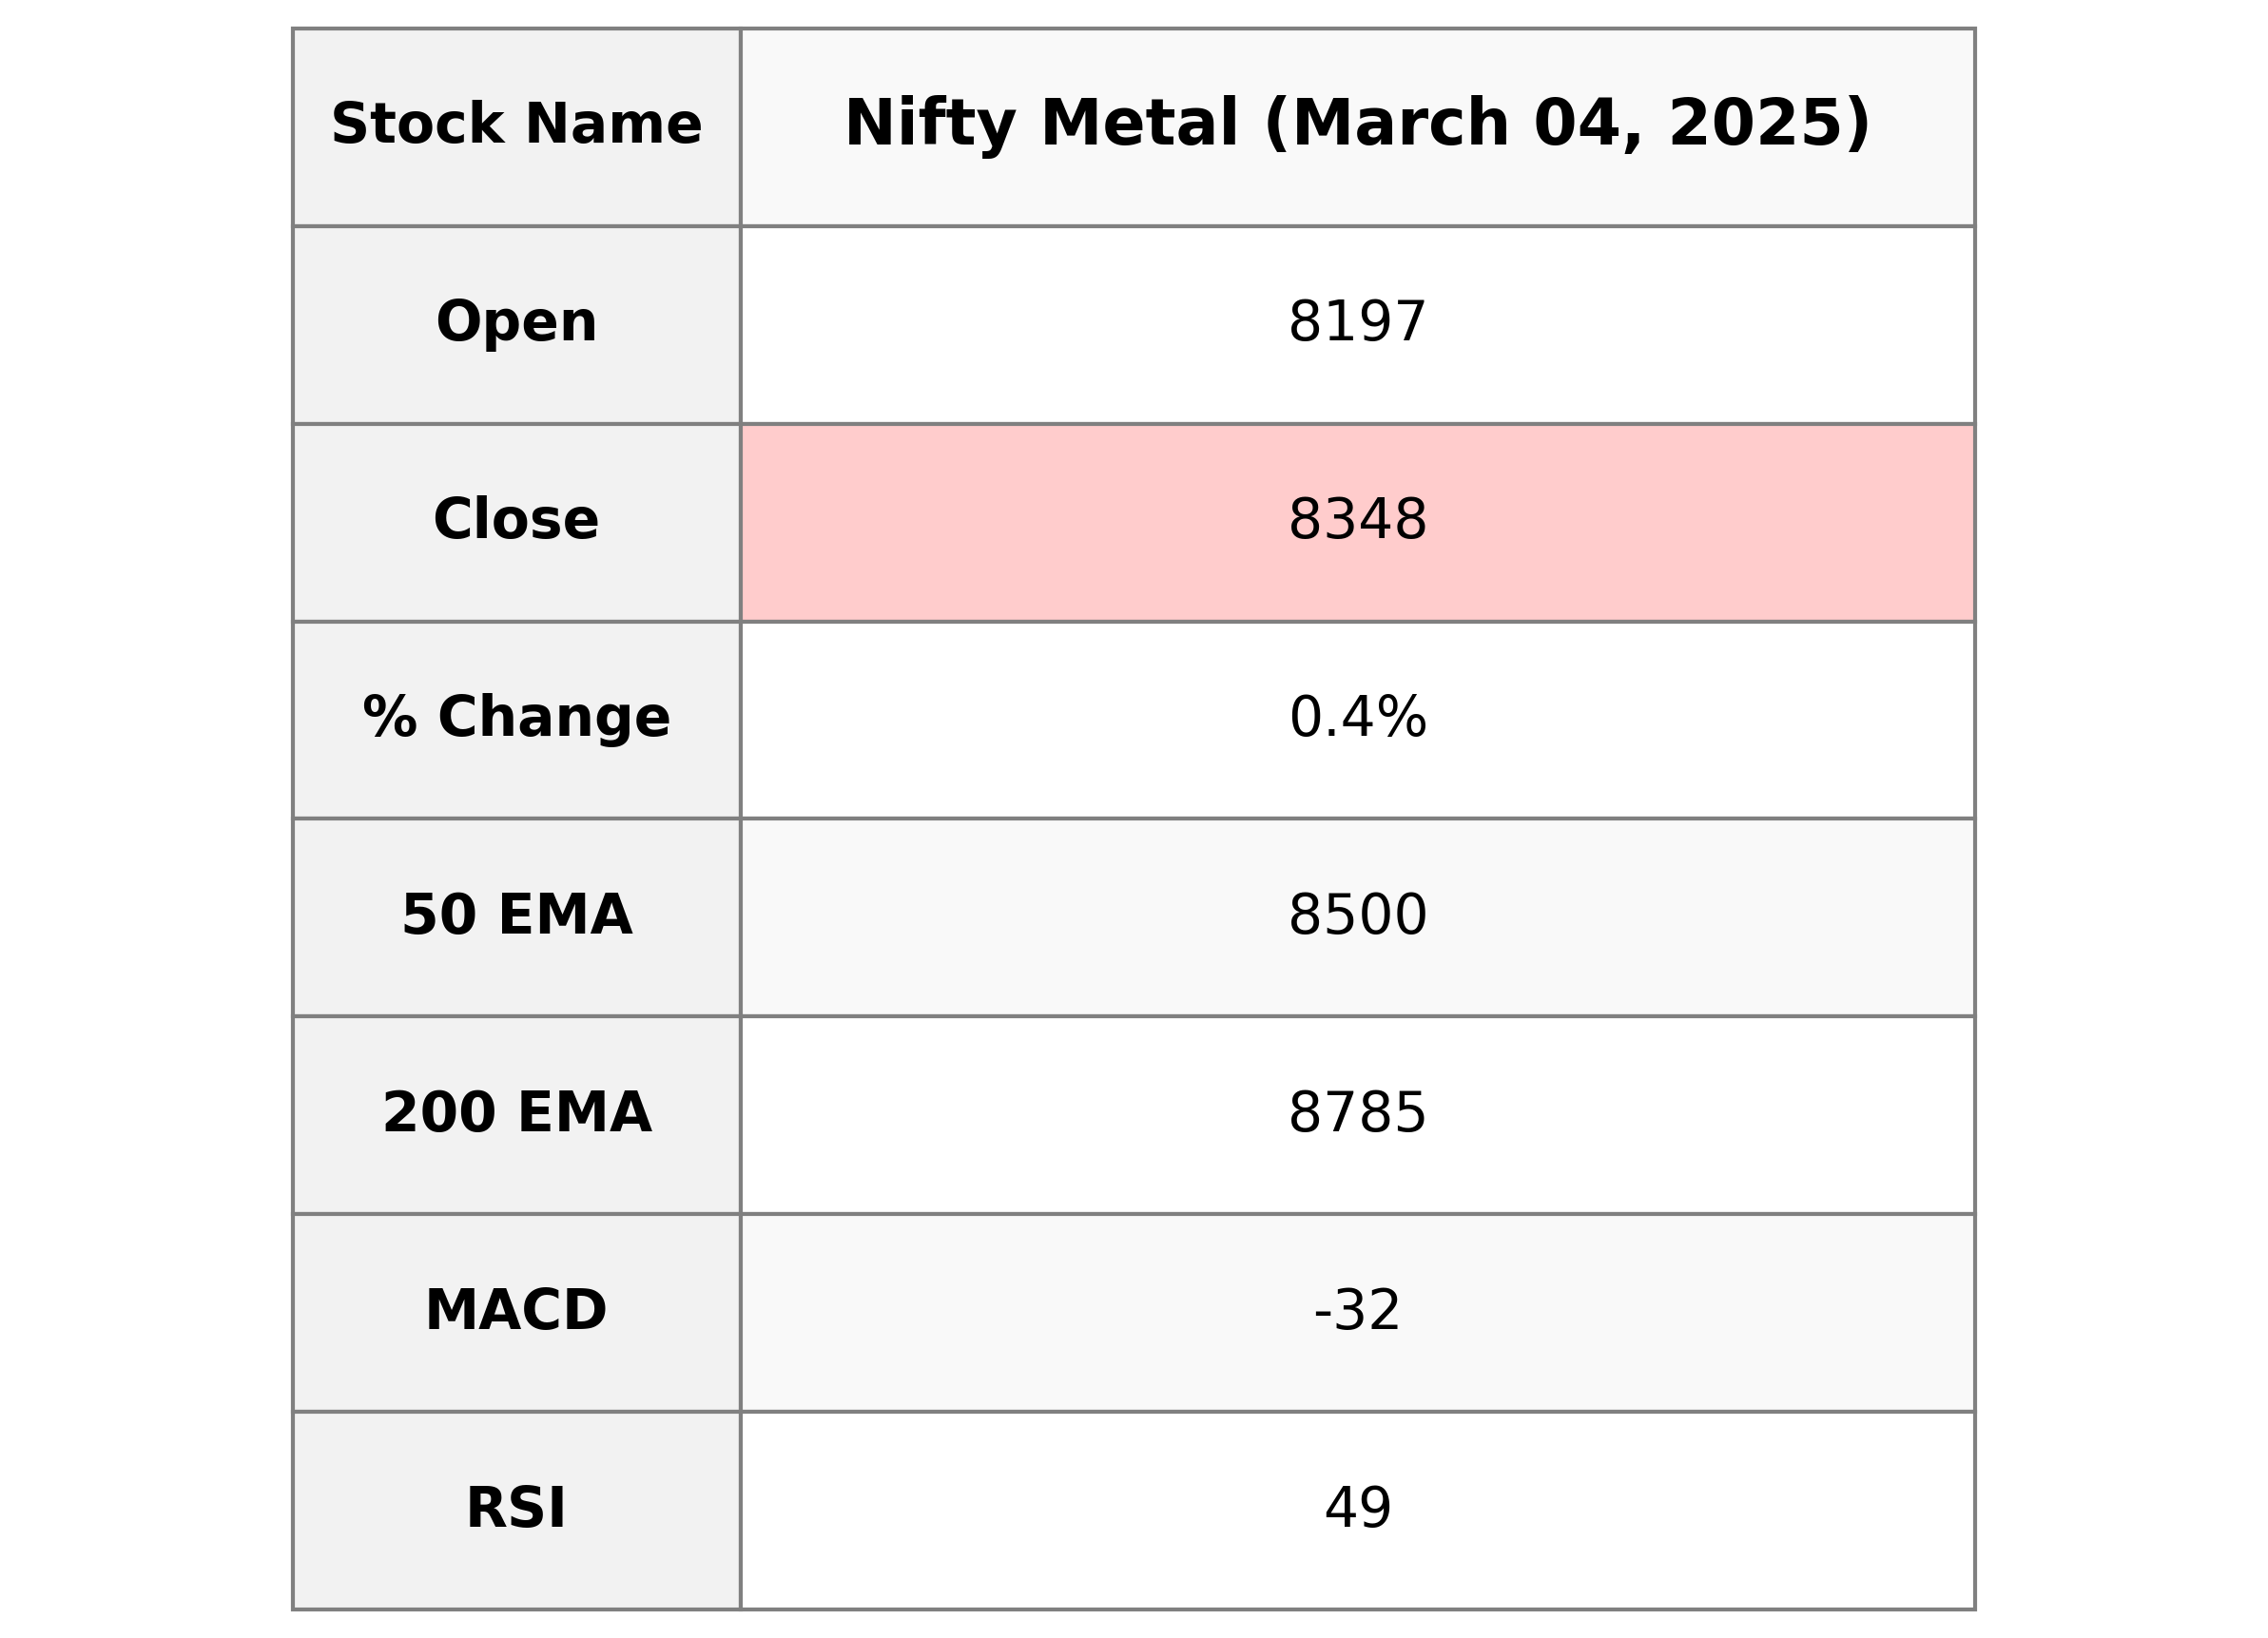
The Nifty Metal index opened at 8197.20, reached a high of 8393.0, and closed at 8347.75. It experienced a slight increase with a 0.38% change from the previous close of 8316.30, signifying a points change of 31.45. The technical indicators show a slight divergence, with the 10, 20, and 50-day EMAs trending below the closing price, and a negative MACD suggesting mild bearish momentum, while the RSI at 48.91 indicates a relatively balanced market sentiment.
Relationship with Key Moving Averages
The closing price of Nifty Metal at 8347.75 is below both its 50 EMA (8499.68) and 200 EMA (8784.63), indicating a potential bearish trend in the medium to long term. However, the close is slightly above the 10 EMA, suggesting some short-term buying pressure.
Moving Averages Trend (MACD)
Nifty Metal's current MACD value of -31.81 is below the MACD Signal line of -39.49, indicating a bearish momentum. This suggests that the downward trend may continue unless there is a significant reversal.
RSI Analysis
The relative strength index (RSI) for Nifty Metal is approximately 48.91, indicating a neutral state, as it is close to the mid-point of 50. This suggests that the index is neither overbought nor oversold at the moment.
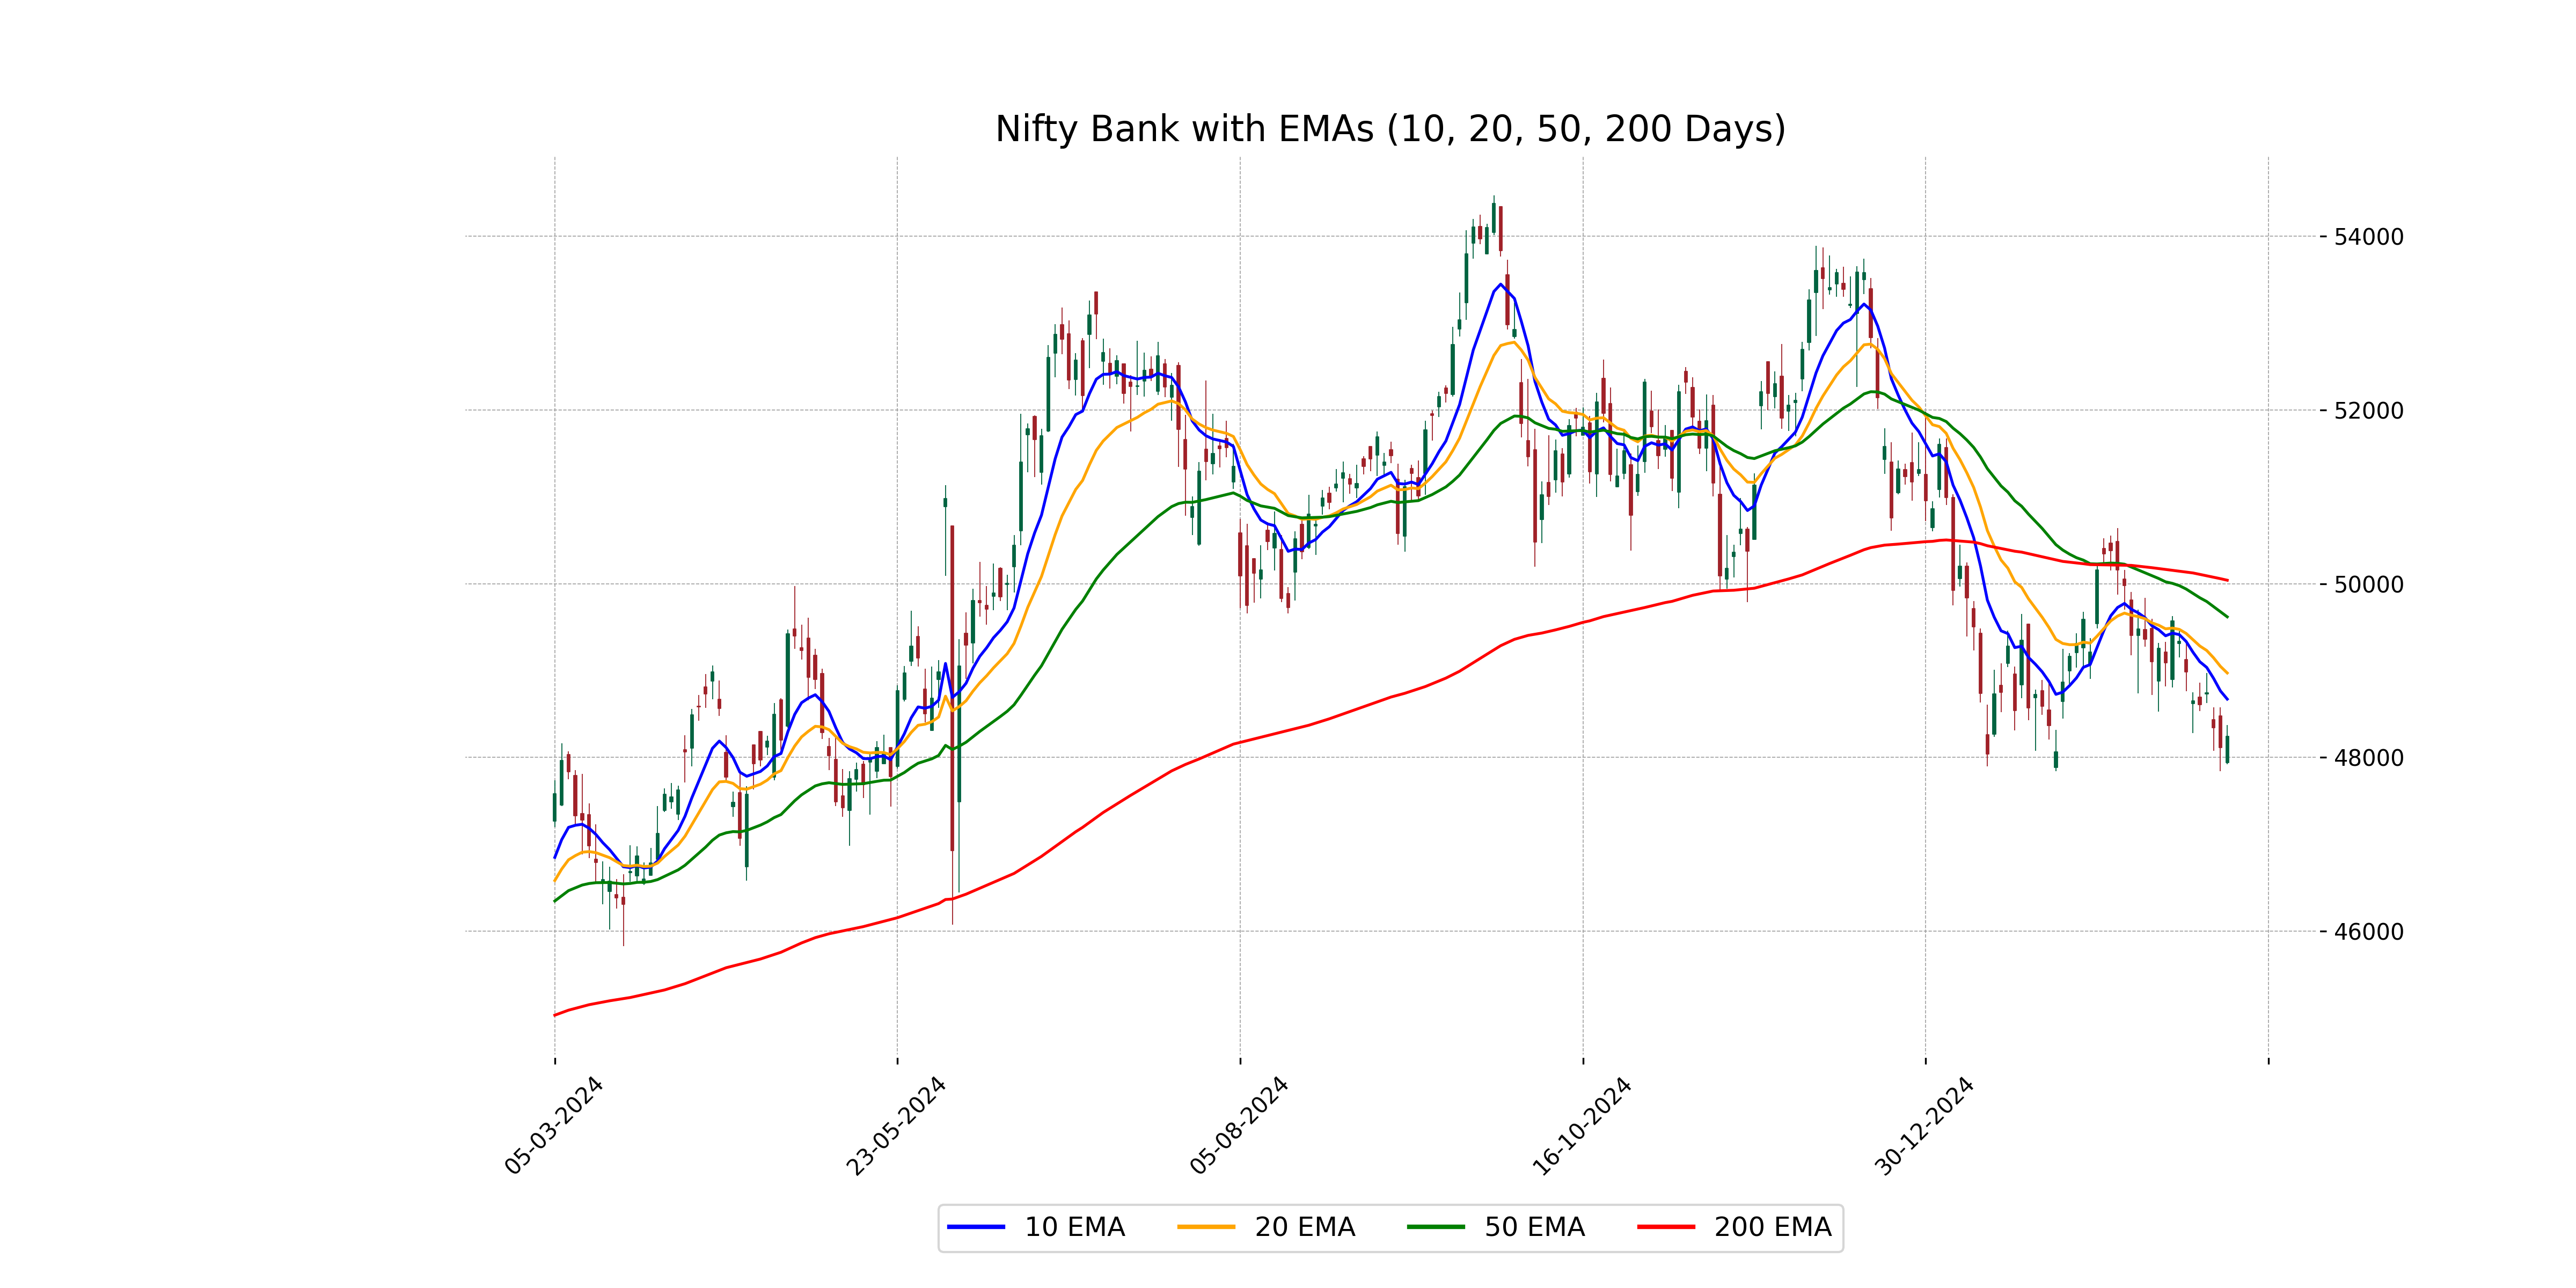
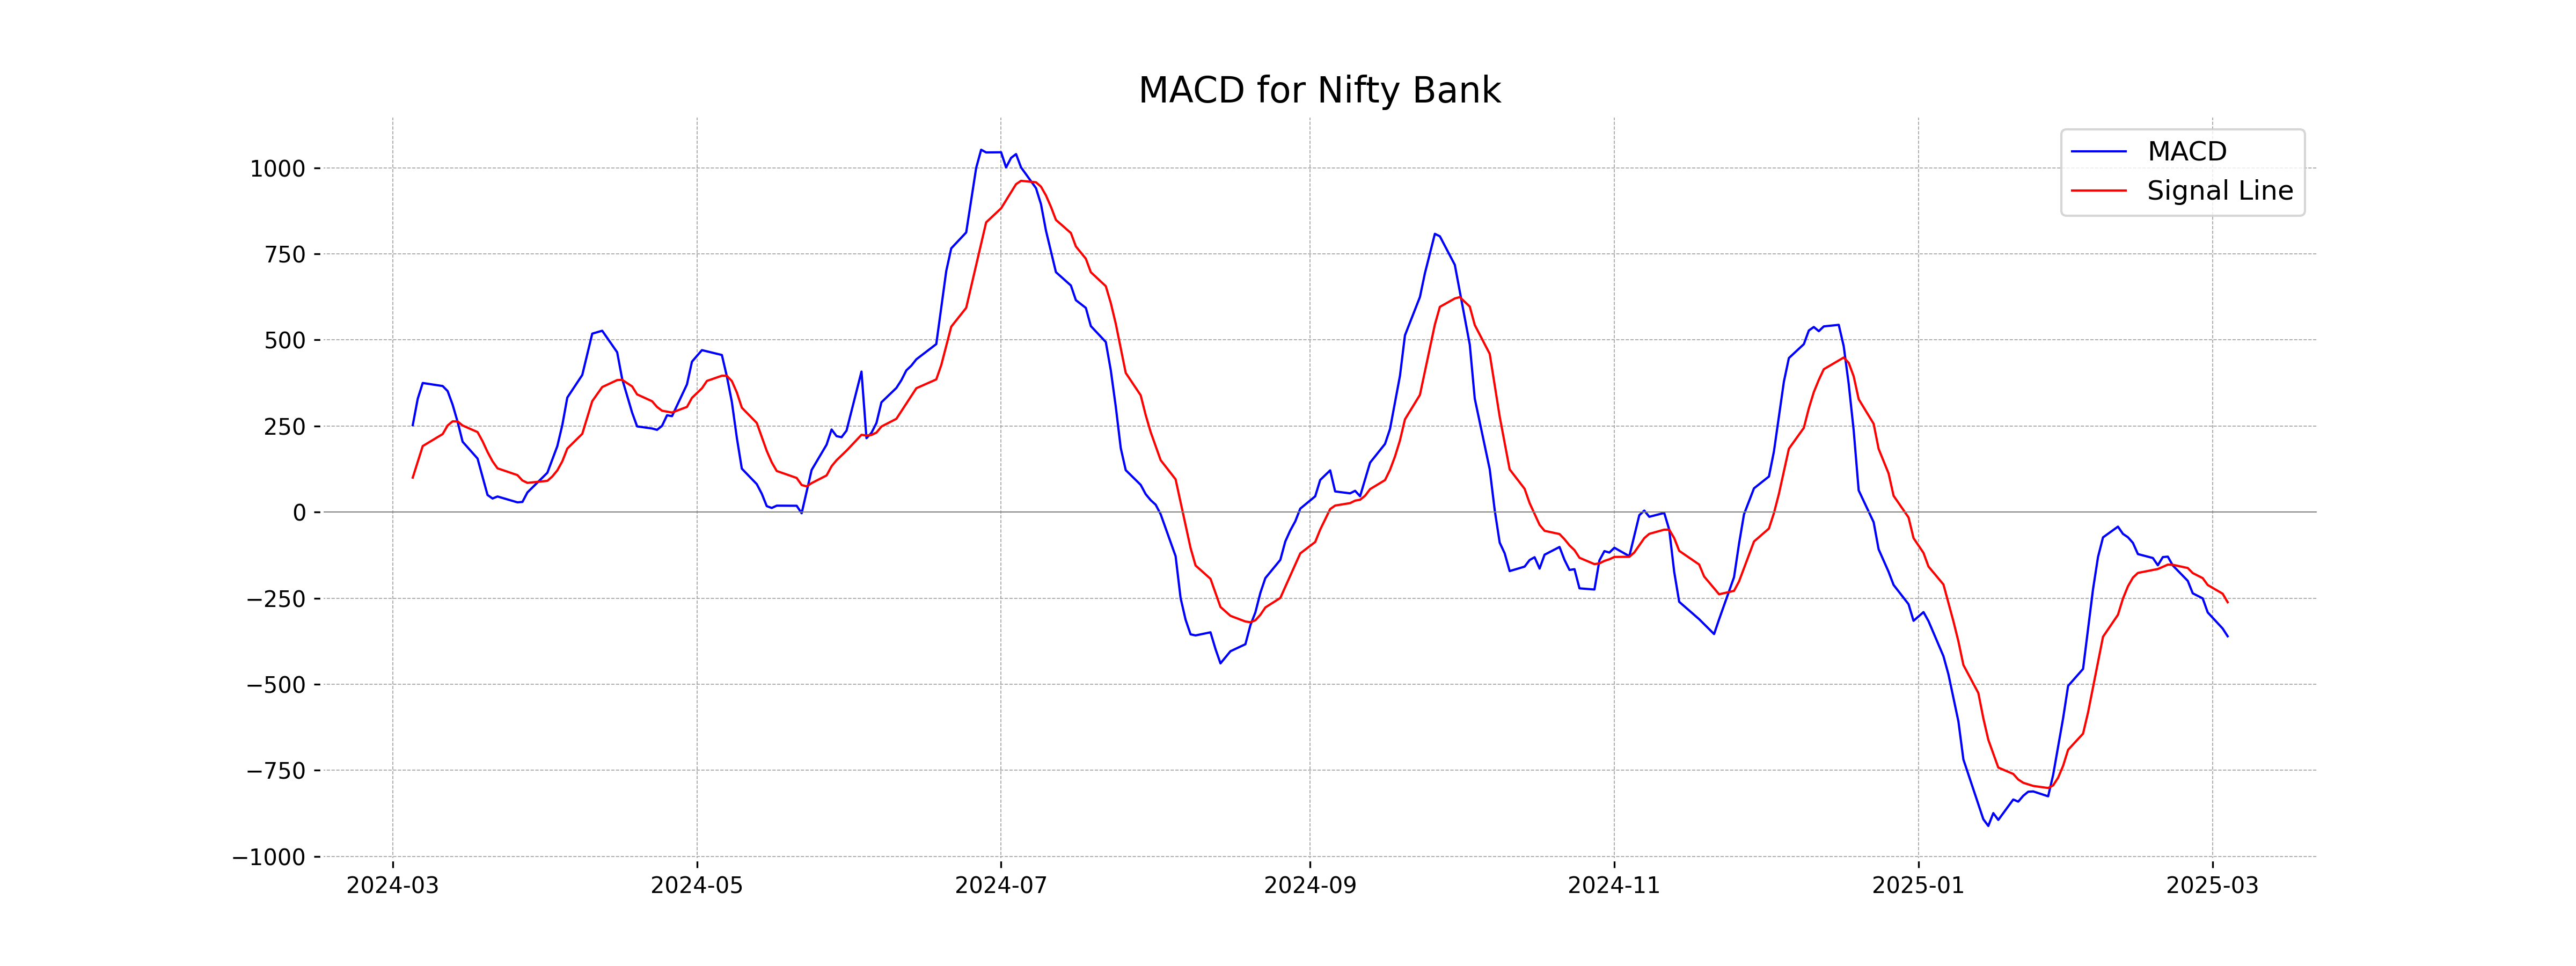
Analysis for Nifty Bank - March 04, 2025
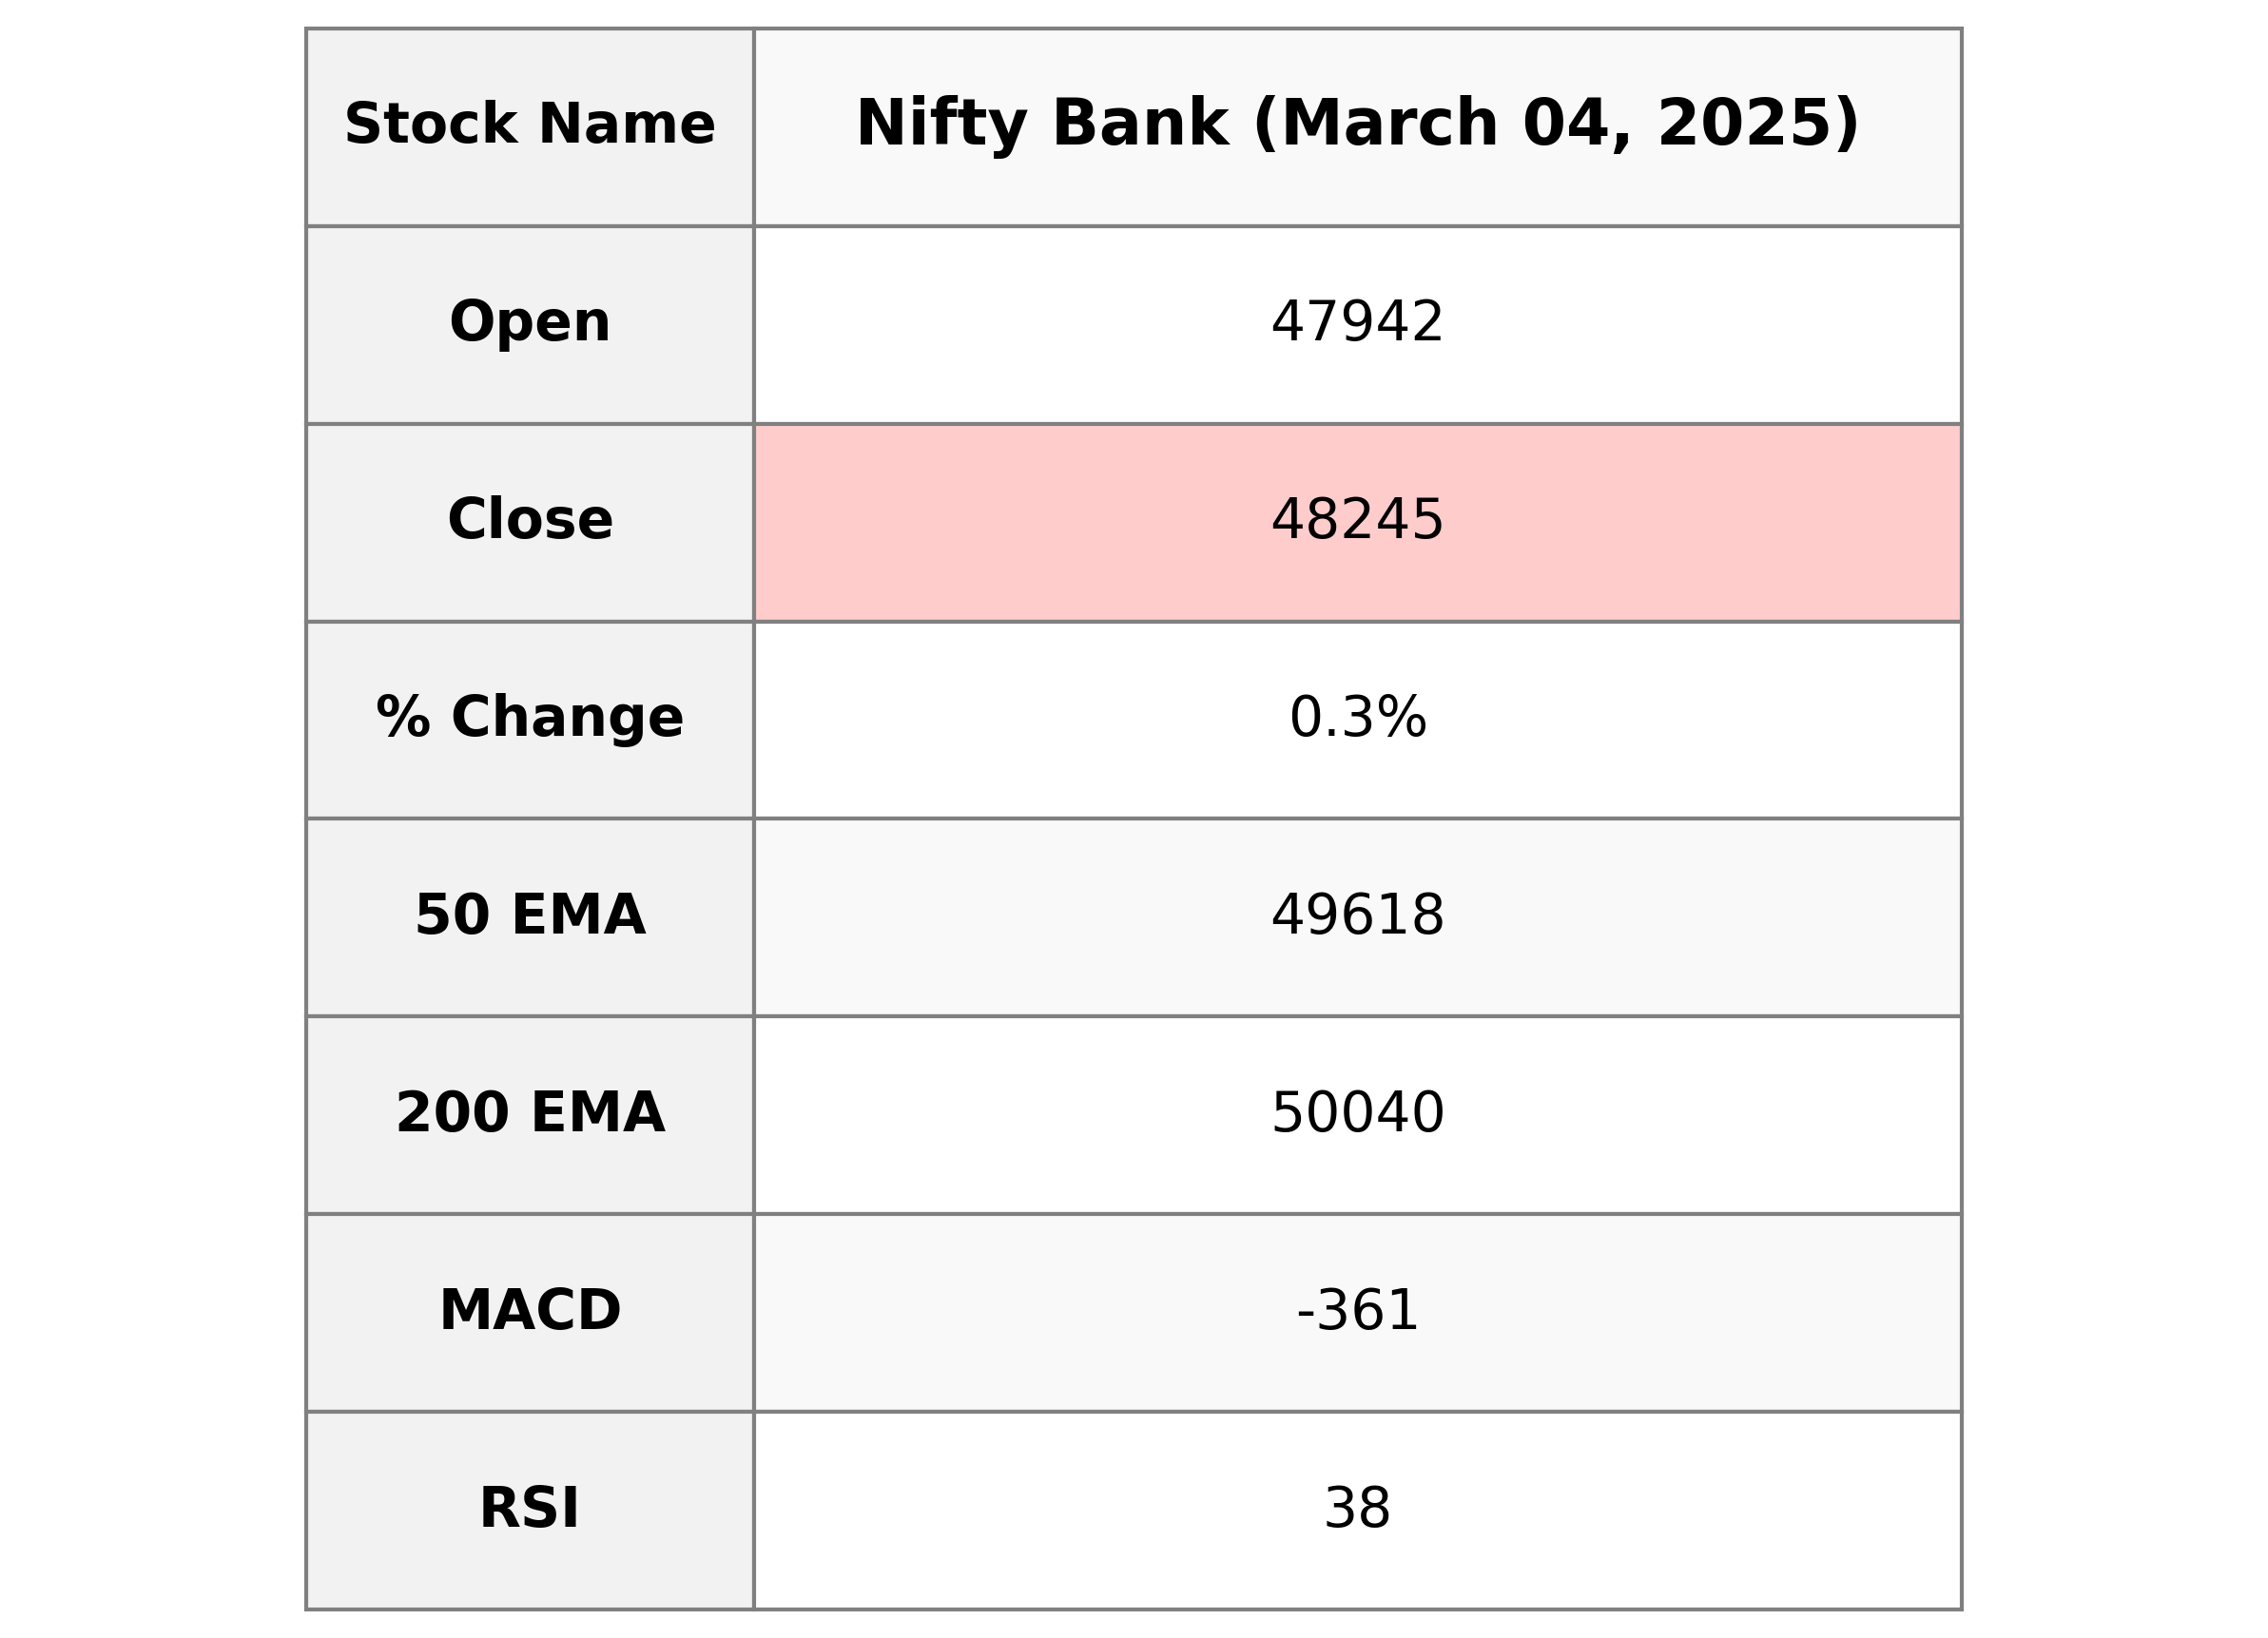
The Nifty Bank index experienced a slight increase with a 0.27% change, closing at 48,245.20 compared to its previous close of 48,114.30. The index is trading below its important exponential moving averages, indicating a bearish trend, and the RSI at 38 suggests it's near the oversold territory.
Relationship with Key Moving Averages
The Nifty Bank closed at 48245.20 which is above its previous close of 48114.30, indicating a slight positive movement. However, it remains below the 50 EMA of 49618.08 and the 200 EMA of 50039.51, suggesting a bearish trend in the short to medium term. The 10 EMA and 20 EMA are closer to the current closing price, indicating potential short-term volatility.
Moving Averages Trend (MACD)
The MACD for Nifty Bank is -360.66, which is below the MACD Signal of -261.78, indicating a bearish momentum. This suggests that the current trend might be downward, and traders might consider this as a potential sell signal or a signal to be cautious with long positions.
RSI Analysis
The current RSI value for Nifty Bank is 38.02, suggesting that the index is in the lower range and may be approaching oversold conditions. Typically, an RSI below 30 is considered oversold, indicating potential for a price reversal or upward momentum.

Analysis for Nifty 50 - March 04, 2025

Nifty 50 opened at 21,974.45 and closed at 22,082.65, experiencing a slight decline of approximately 0.17% from the previous close of 22,119.30. The index's RSI is quite low at 22.43, indicating potential oversold conditions, with a significant gap below its 50-day and 200-day EMA, positioned at 23,200.71 and 23,492.37, respectively.
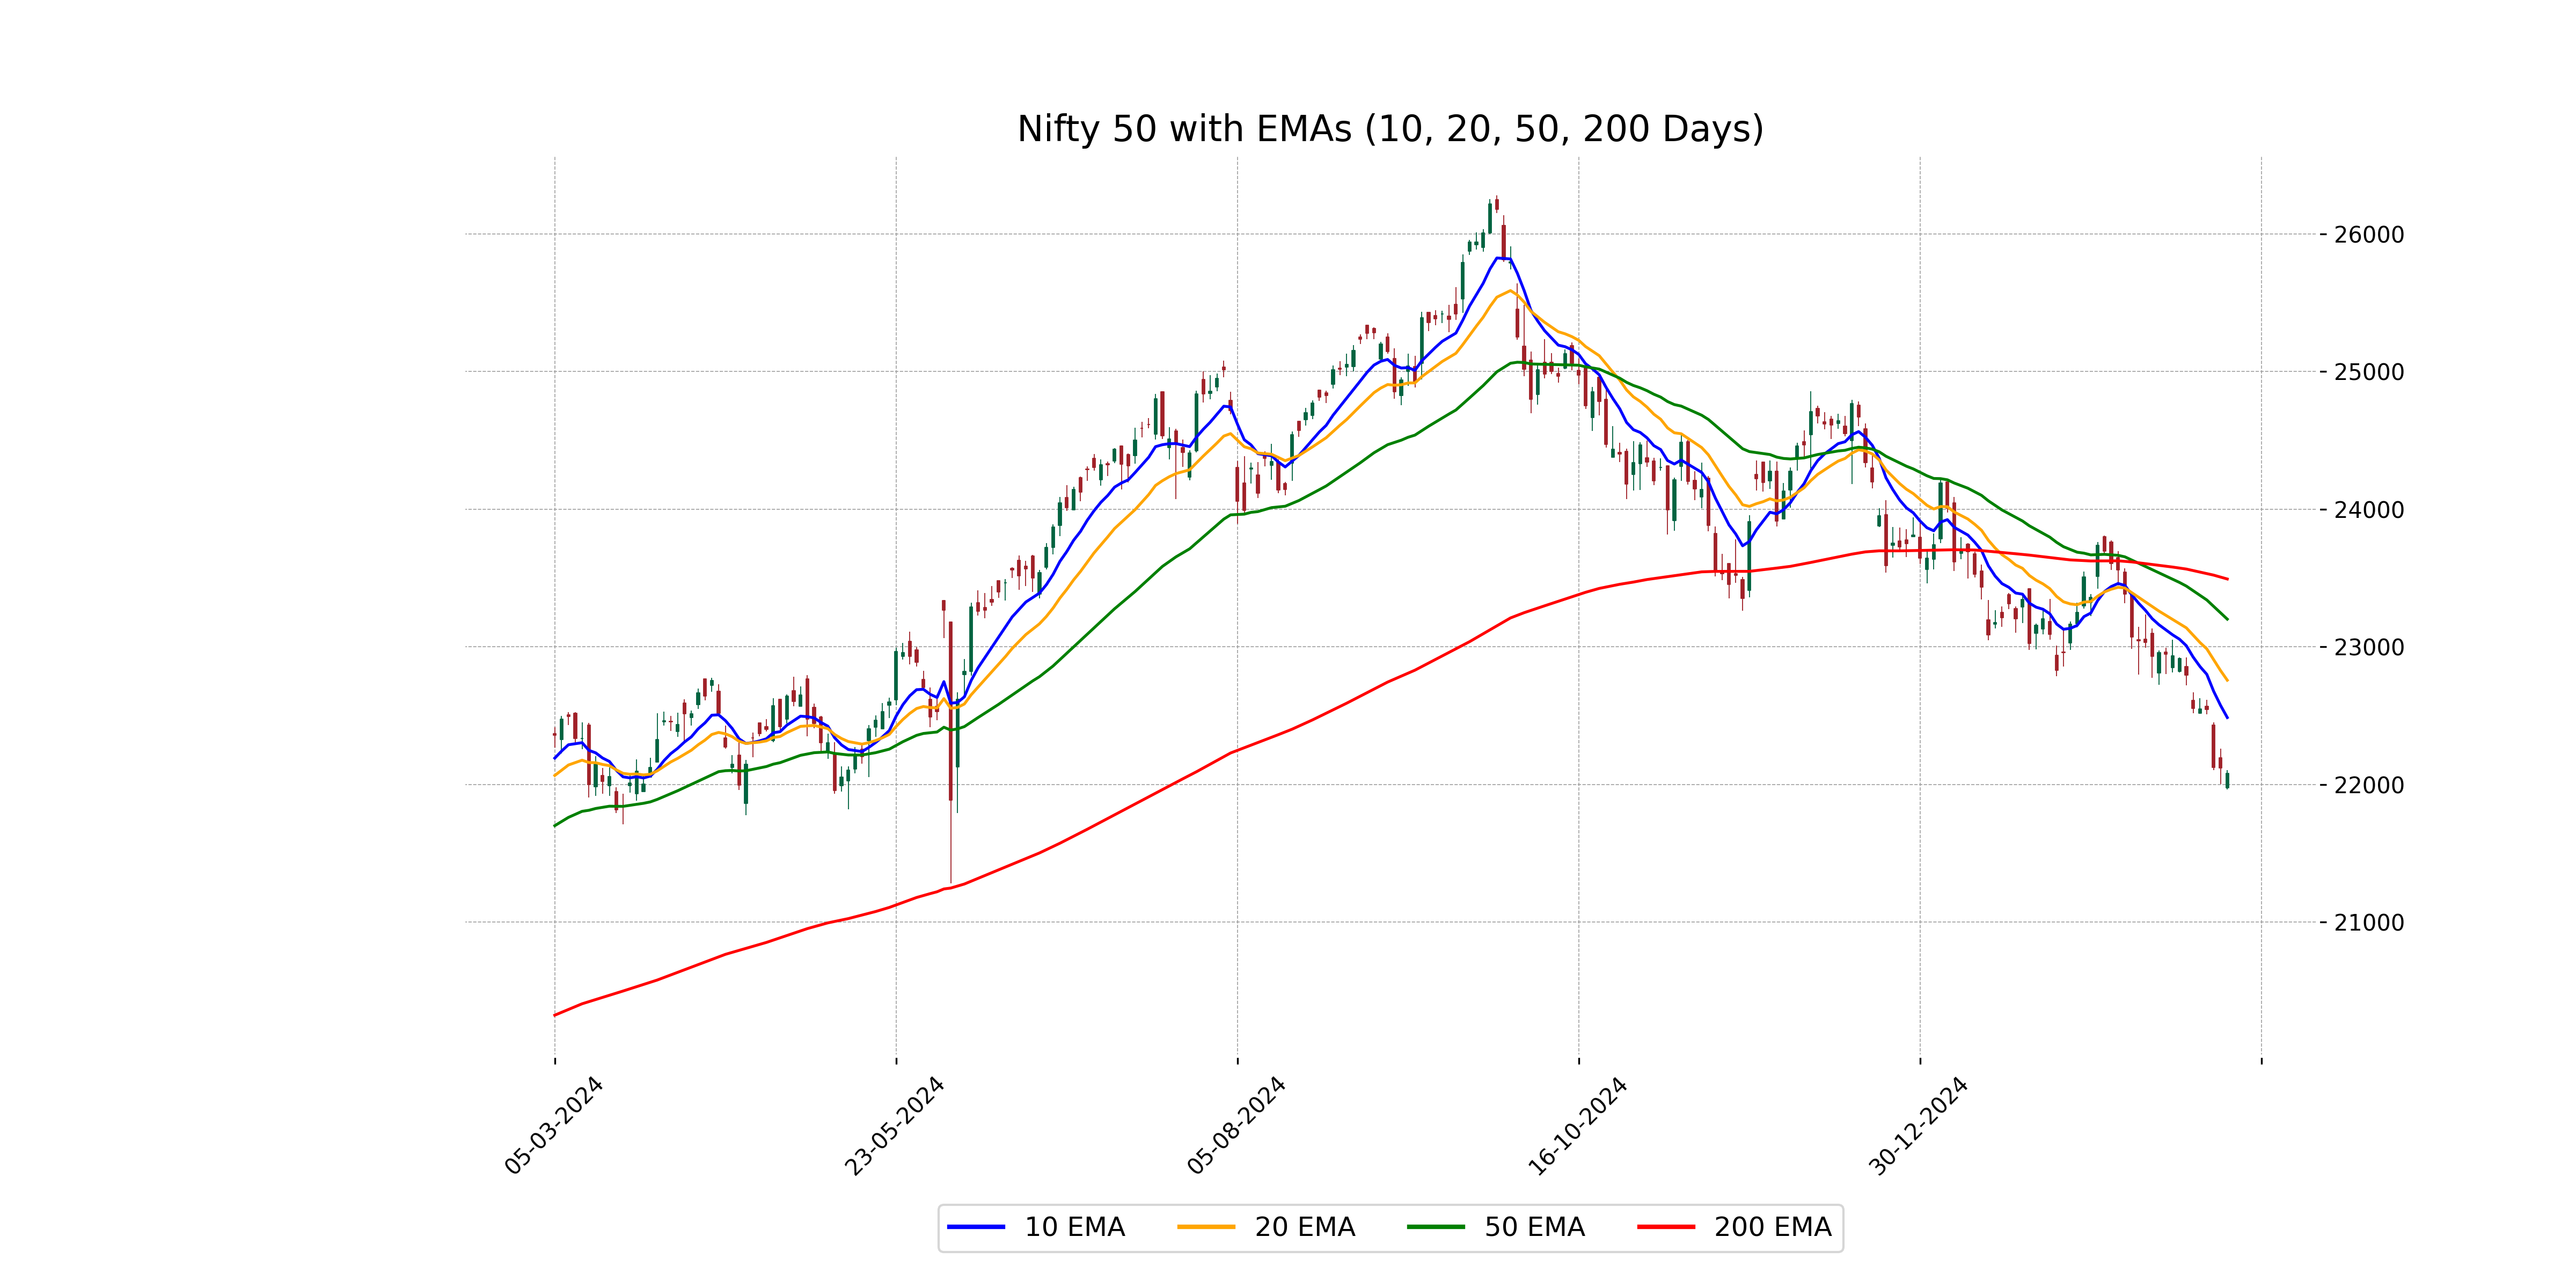
Relationship with Key Moving Averages
Nifty 50 closed at 22082.65, which is below its 10-day EMA of 22486.08, 20-day EMA of 22757.23, 50-day EMA of 23200.71, and 200-day EMA of 23492.37. This indicates a bearish short-term and long-term trend, as the index is trading below all key moving averages.
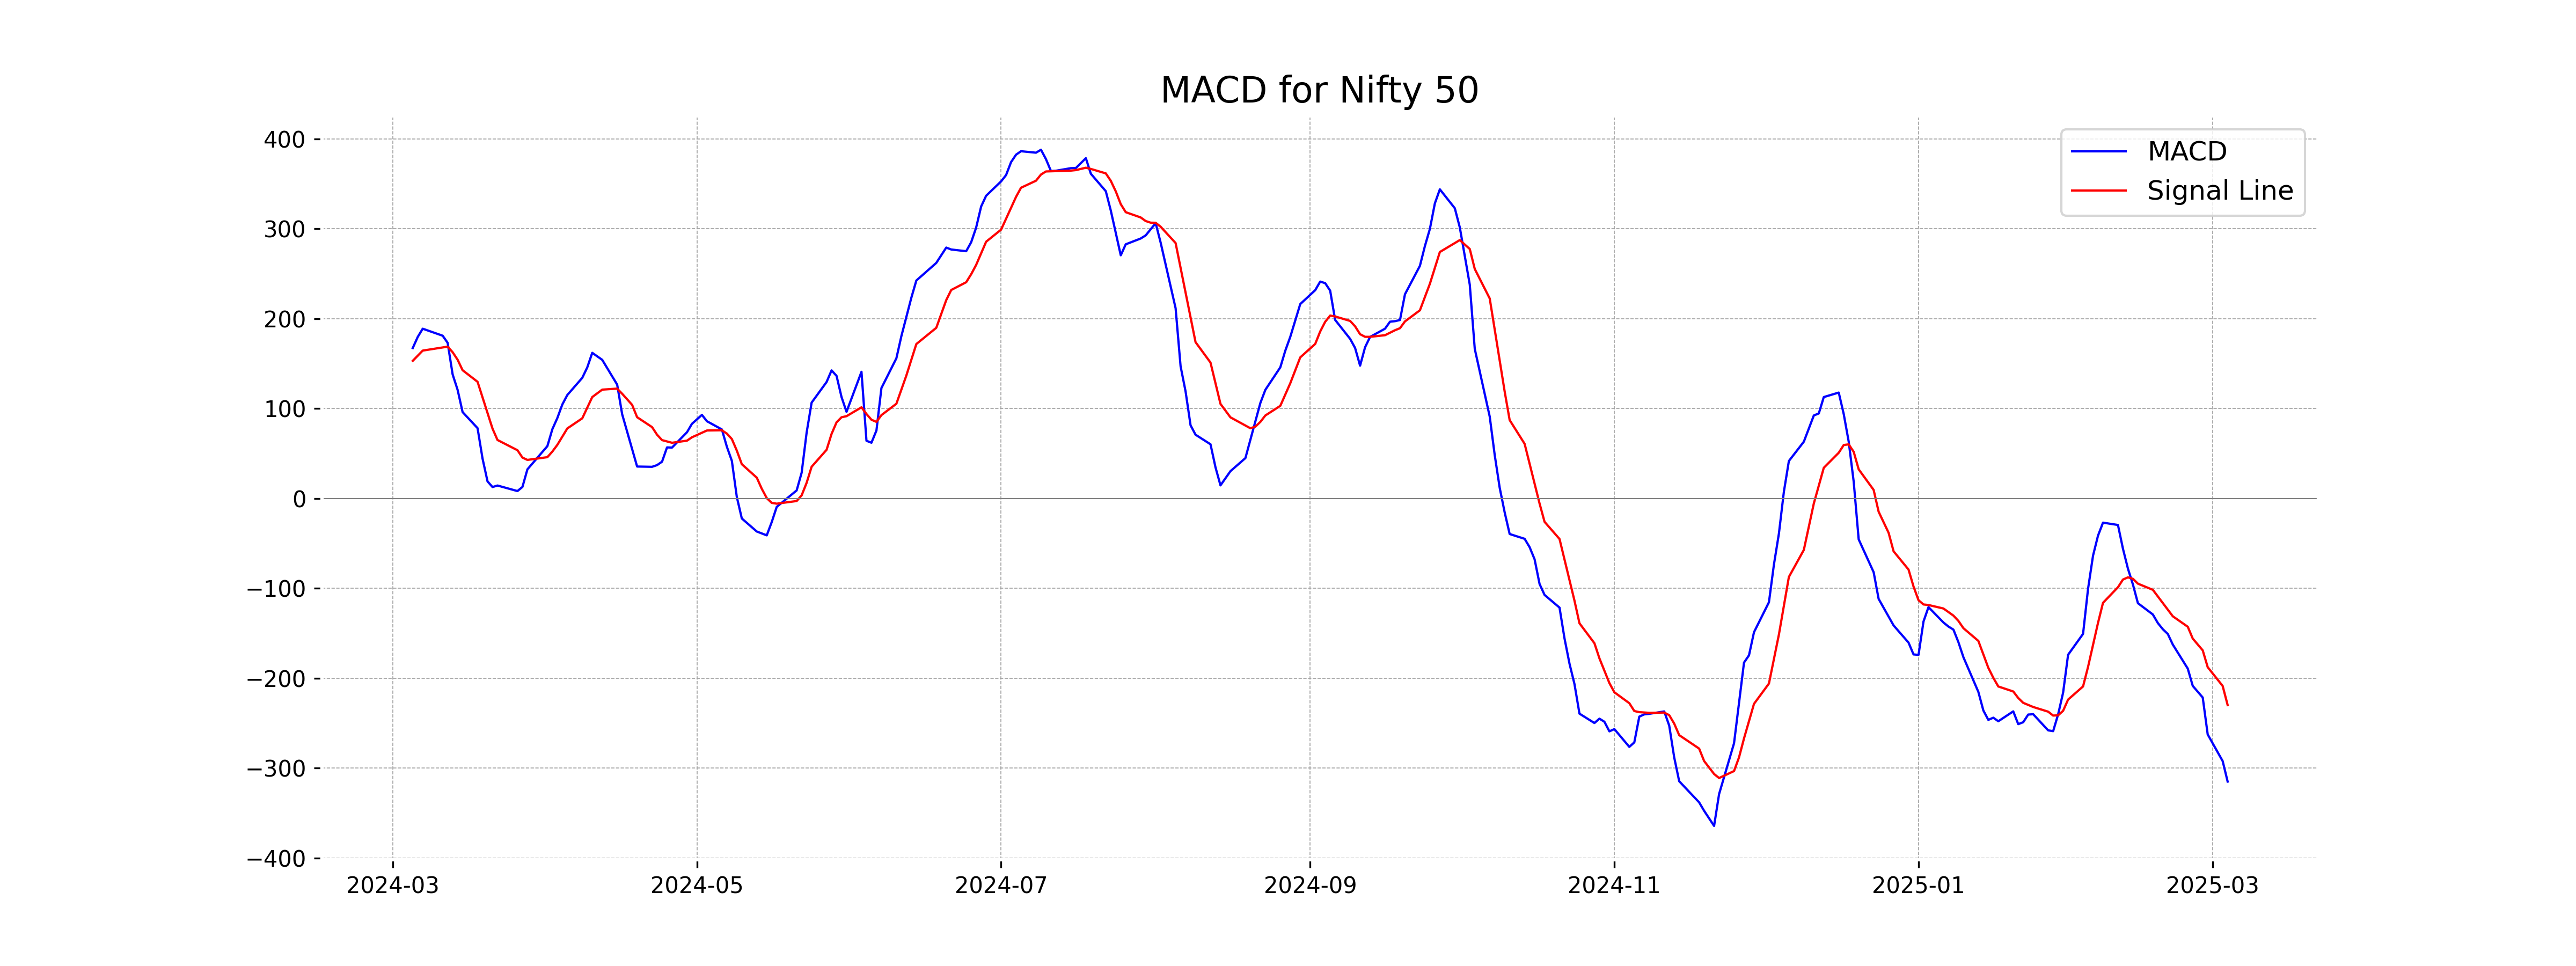
Moving Averages Trend (MACD)
Based on the MACD data provided, the Nifty 50 is experiencing bearish momentum as indicated by the MACD value of -315.05, which is below its signal line at -229.91. This suggests a downtrend in the current market condition for Nifty 50.
RSI Analysis
The current RSI for Nifty 50 is 22.43, indicating that the index is in an oversold condition. This suggests a potential for a price reversal or bounce, as the RSI value is significantly below the typical oversold threshold of 30. Investors should closely monitor any upcoming market movements or news that may impact the index.

Up Next
Indian stock market sector-wise performance today - March 04, 2025

India, New Zealand conclude FTA talks; pact to offer duty-free access, USD 20 bn FDI

FTA with New Zealand to significantly deepen bilateral economic engagement: Govt

Rupee breaches 91-mark against US dollar for first time in intra-day trade

Microsoft commits USD 17.5 billion investment in India: CEO Satya Nadella

CBI books Anil Ambani's son, Reliance Home Finance Ltd. in Rs 228 crore bank fraud case

More videos

RBI raises FY26 GDP growth projection to 7.3 pc

RBI trims policy interest rate by 25bps to 5.25pc, loans to get cheaper

Rupee slumps to all-time low of 90.25 against US dollar in intra-day trade

Reliance completes merger of Star Television Productions with Jiostar

India to lead emerging market growth with 7pc GDP rise in 2025: Moody’s

Nifty hits record high after 14 months; Sensex nears all-time peak

Reliance stops Russian oil use at its only-for-export refinery to comply with EU sanctions

ED attaches fresh assets worth over Rs 1,400 cr in case against Anil Ambani's Reliance Group

India signs one-year deal to import 2.2 million tonnes of LPG from US

India International Trade Fair begins at Pragati Maidan amid tight security