


Highlights
- Nifty Metal highest gainer with 1.18% rise
- Bank Nifty most significant drop at -0.48%
- Nifty IT up by 0.79%, showing recovery
Latest news

Shakti Group Strengthens Focus on Northeast India, Showcases Integrated Clean Energy Solutions at Product Launch Meet in Guwahati

These Are Australia's Best Workplaces in Finance and Insurance

Rockwell Automation Singapore Site Named a World Economic Forum Global Lighthouse

The Earthshot Prize and Alana Expand Partnership to India With Design for Change to Empower Young Indian Environmental Changemakers

enParadigm Helps Hospitality Enterprise Save ₹6.5 Crore Through Its AI-Led Hiring Platform

Markets opens on strong note as falling crude, global optimism lift sentiment, Sensex up 400 points, Nifty opens above 24,000

Jacob Elordi, Jon Bernthal, Jenna Ortega among 529 new Academy members eligible to vote for Oscars

India's office market remains cautious despite resilient demand and selective rental gains: Report
Indian stock market sector-wise performance today - March 03, 2025


The stock market witnessed a day of mixed performances across various sectors and indices on Monday (March 03, 2025).
The standout performances came from Nifty Metal, which surged ahead with a notable percentage change of 1.18%.
This indicates a strong bullish movement in the metal sector, with investors showing increased interest, possibly due to favorable economic policies or rising commodity prices boosting sentiment in this area.
On the other hand, Nifty Bank experienced a decline of 0.48%, marking a significant pullback in the banking sector. This drop could be attributed to concerns surrounding rising interest rates or economic uncertainties impacting lending activities.
Nifty IT showed resilience with a sound increase of 0.79%, as tech stocks rallied, potentially due to strong quarterly earnings reports from leading companies in the sector, which has sustained investor confidence amid broader market turbulence.
The Nifty Auto index nudged up slightly by 0.19%, indicating a cautiously optimistic outlook among automotive investors possibly fueled by sales data pointing to recovery trends post-pandemic.
Conversely, the SENSEX recorded a minor dip of 0.15%, reflecting general apprehension or profit-booking by investors.
Meanwhile, Nifty witnessed a very slight decline of 0.02%, maintaining stability in the face of minor market jitters. Nifty FMCG mirrored this moderate upward trend with a 0.19% gain, as consumer goods continue to demonstrate resilience backed by steady demand.
Nifty Infrastructure showcased a healthy rise of 0.41%, which may result from governmental infrastructure initiatives boosting investor sentiment in the sector. Equally subdued was the Nifty Energy index, which saw a marginal decline of 0.04%, as fluctuating energy prices create a cautious outlook for the sector.
The market movements underscore a diverse and dynamic day, driven by sector-specific catalysts and broader economic indicators.
The metal sector, in particular, stands out as the day's top performer, possibly reflecting global demand shifts or currency fluctuations favoring the industry.
Meanwhile, the banking and energy sectors faced challenges, pointing to underlying economic concerns that warrant close monitoring in future sessions.

Analysis for Sensex - March 03, 2025

Sensex Performance: The Sensex opened at 73,427.65 and closed slightly lower at 73,085.94, marking a decrease of 112.16 points or a 0.15% drop. The Relative Strength Index (RSI) indicates a bearish sentiment at approximately 23.92, suggesting the market is in an oversold condition. Additionally, the Moving Average Convergence Divergence (MACD) value is -948.00, which is below its signal line, also pointing towards a sustained bearish trend.

Relationship with Key Moving Averages
The Sensex closed at 73,085.94, which is below the 10 EMA at 74,651.88, the 20 EMA at 75,475.78, the 50 EMA at 76,805.64, and the 200 EMA at 77,496.14. This indicates a bearish trend as the closing price is below all key moving averages.
Moving Averages Trend (MACD)
MACD Analysis for Sensex: The MACD value of -948.00, which is lower than the MACD Signal of -665.38, indicates a bearish momentum in the Sensex. This suggests that the stock index may experience continued downward pressure in the short term.

RSI Analysis
The Relative Strength Index (RSI) for Sensex is at 23.92, which suggests that the index is currently in the oversold territory. This may indicate a potential buying opportunity, as stocks or indices are often considered oversold when the RSI falls below 30.

Analysis for Nifty Auto - March 03, 2025

Nifty Auto Performance: The Nifty Auto index opened at 20,591.5 and closed at 20,538.15, showing a slight increase of 0.193% with a points change of 39.55. Despite this marginal gain, the RSI stands at a low 26.79, indicating potential oversold conditions, while the negative MACD suggests bearish momentum.

Relationship with Key Moving Averages
The current close of Nifty Auto at 20538.15 is below its 50-day EMA of 22524.31, 200-day EMA of 23059.01, 10-day EMA of 21403.89, and 20-day EMA of 21866.88, indicating a bearish trend with respect to these key moving averages. Additionally, the MACD of -517.87 is below the MACD Signal of -349.11, suggesting continued downward momentum.
Moving Averages Trend (MACD)
The MACD for Nifty Auto is at -517.87, with the MACD Signal at -349.11, indicating a strong bearish momentum. This suggests that selling pressure might be prevalent, as the MACD line is significantly below the signal line.

RSI Analysis
The RSI value for Nifty Auto is 26.79, which suggests that it is in the oversold territory. This may imply potential buying opportunities if the trend reverses. However, further analysis of other indicators is recommended before making any investment decisions.

Analysis for Nifty Energy - March 03, 2025

Nifty Energy opened at 30,091.90, reached a high of 30,219.80, and closed slightly lower at 30,007.05, marking a minor decrease of -0.04%. The low was recorded at 29,313.20. The RSI stands at 32.09, showing a weak market sentiment, while the MACD indicates a bearish momentum with a value of -843.27.

Relationship with Key Moving Averages
The Nifty Energy index closed at 30,007.05, which is below its 10-day EMA of 30,850.83, 20-day EMA of 31,469.96, 50-day EMA of 33,147.96, and 200-day EMA of 36,581.35. This indicates a bearish trend, as the current price is below key moving averages.
Moving Averages Trend (MACD)
{'MACD Analysis': 'Nifty Energy is currently in a bearish trend as indicated by the negative MACD value of -843.27 and the MACD line being below the signal line at -810.53. This suggests continued downward momentum in the stock.'}

RSI Analysis
The RSI for Nifty Energy is 32.09, which indicates that it is nearing the oversold territory. This suggests a potential for a price reversal or a buying opportunity if the trend reverses. Typically, an RSI below 30 is considered oversold.

Analysis for Nifty FMCG - March 03, 2025

Nifty FMCG opened at 50,739.75, reaching a high of 50,856.80 and a low of 50,287.90 before closing at 50,786.65. The index experienced a slight increase with a % change of 0.193% and a points change of 97.65 from the previous close of 50,689.00. The RSI indicates an oversold condition at 22.38, while the MACD is bearish at -1,219.26 compared to its signal line at -1,021.51.

Relationship with Key Moving Averages
The Nifty FMCG index closed at 50786.65, which is below its 50-day EMA of 54805.94 and its 200-day EMA of 57006.72, indicating a bearish trend. It is also lower than the 10-day EMA of 52083.78 and the 20-day EMA of 53086.95, suggesting that the index is currently underperforming compared to its recent averages.
Moving Averages Trend (MACD)
MACD Analysis for Nifty FMCG: The MACD value of -1219.26, which is below the MACD Signal line of -1021.51, indicates a strong bearish sentiment. This suggests that the current trend is downward and the momentum could continue to favor sellers in the near term.

RSI Analysis
The RSI for Nifty FMCG is at 22.38, which indicates that the index is in the oversold territory. An RSI below 30 typically suggests that the stock or index may be undervalued and could potentially be due for a price reversal or upward correction.

Analysis for Nifty Infra - March 03, 2025

The Nifty Infra index opened at 7694.60, reaching a high of 7733.35 and a low of 7589.95, before closing at 7697.35. It registered a slight gain of 0.41% with a points change of 31.80 from the previous close of 7665.55. The RSI is at 30.29, indicating potential oversold conditions, while the MACD suggests bearish momentum with a value of -139.86.

Relationship with Key Moving Averages
The closing price of Nifty Infra is 7697.35, which is below the 50-day EMA of 8206.19 and the 200-day EMA of 8452.90, indicating a bearish trend. Additionally, the 10-day EMA (7865.27) and the 20-day EMA (7977.95) are also above the current closing price.
Moving Averages Trend (MACD)
Nifty Infra is showing a bearish signal based on its MACD analysis. The MACD value of -139.86 is below the MACD Signal of -115.90, indicating a potential downtrend momentum. Additionally, the RSI is at 30.29, which suggests that the index may be oversold.

RSI Analysis
The RSI for Nifty Infra is at 30.29, indicating that the index is approaching oversold territory. This suggests that it may be undervalued at the moment, and a potential reversal could occur if buying pressure increases.

Analysis for Nifty IT - March 03, 2025

Nifty IT opened at 37408.65 and closed at 37614.45, marking a positive change of 0.79% for the day with a points increase of 296.15. The RSI indicates a bearish sentiment with a value of 23.15, and the MACD line is below the signal line, suggesting a continued bearish divergence.

Relationship with Key Moving Averages
The current close value of Nifty IT, at 37,614.45, is below its 10-day EMA of 39,396.29, 20-day EMA of 40,480.72, 50-day EMA of 41,768.00, and 200-day EMA of 40,639.45, indicating a bearish trend in comparison to key moving averages. The RSI value of 23.15 suggests that the stock is in the oversold territory, while the negative MACD of -1218.20 further reinforces the bearish sentiment.
Moving Averages Trend (MACD)
The MACD for Nifty IT is currently at -1218.20, which is below its signal line at -834.99. This negative divergence suggests that the stock is showing bearish momentum, indicating a potential downtrend. The low RSI of 23.15 further supports this bearish outlook, suggesting the stock is oversold.

RSI Analysis
The RSI (Relative Strength Index) for Nifty IT is at 23.15, indicating that the index is in the oversold territory. This suggests that the index might be undervalued currently, and there could be a potential for a price reversal if RSI moves above 30.

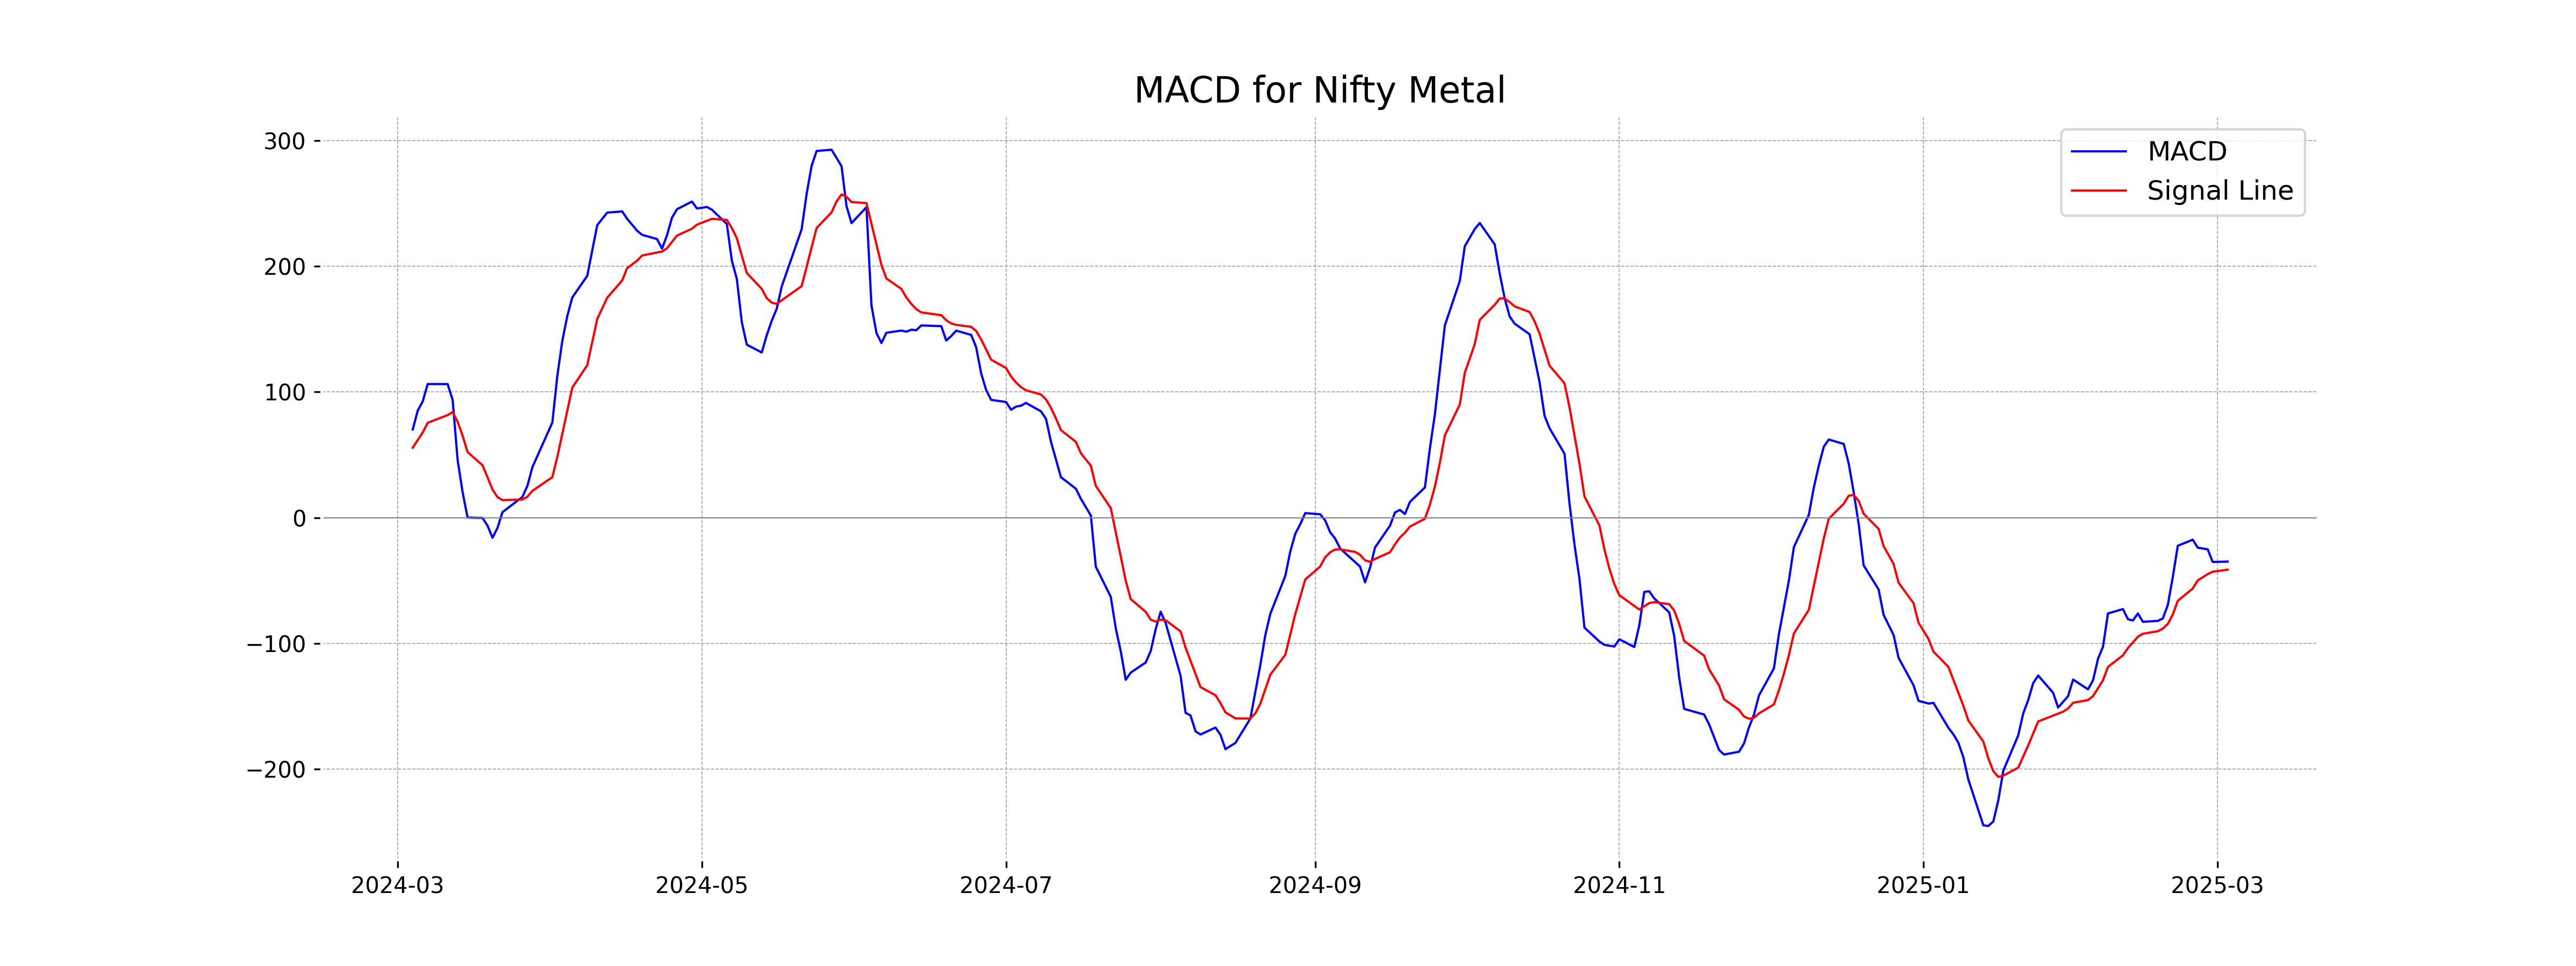
Analysis for Nifty Metal - March 03, 2025

Nifty Metal opened at 8244.70 and closed higher at 8316.30, indicating a gain with a percentage change of 1.18% from the previous close of 8219.25. RSI stands at 47.80, suggesting a neutral momentum. The MACD is at -34.95 with a slightly lower MACD Signal at -41.41, indicating a mild bearish sentiment, while the 50 and 200 EMA indicate a longer-term bearish trend.

Relationship with Key Moving Averages
Nifty Metal closed at 8316.30, slightly below its 10 EMA of 8338.10 and 20 EMA of 8355.23, indicating a short-term downward momentum. The index is also trading below its 50 EMA of 8505.89 and 200 EMA of 8788.98, suggesting a longer-term bearish trend.
Moving Averages Trend (MACD)
Nifty Metal MACD Analysis: The MACD value for Nifty Metal is -34.95, with a signal line of -41.41. Since the MACD line is above the signal line, it indicates a potential bullish crossover, suggesting that the downtrend might be weakening. Traders should observe for further confirmation of an upward trend.
RSI Analysis
RSI Analysis for Nifty Metal: The RSI of 47.80 suggests that Nifty Metal is currently in the neutral zone. It is neither oversold nor overbought, indicating a balanced momentum in the current market conditions.

Analysis for Nifty Bank - March 03, 2025

Nifty Bank opened at 48478.60 and closed at 48114.30, experiencing a decrease of approximately 0.48% or 230.40 points from the previous close. The Relative Strength Index (RSI) is at 35.92, indicating potential bearish sentiment. The MACD value is below its signal line, further suggesting a negative momentum.

Relationship with Key Moving Averages
Based on the given data, Nifty Bank's closing price of 48114.30 is below its 50 EMA of 49674.12 and 200 EMA of 50057.38, indicating a bearish trend. Additionally, the 10 EMA of 48765.69 and 20 EMA of 49048.31 are also above the closing price, suggesting short-term downward momentum.
Moving Averages Trend (MACD)
The MACD value for Nifty Bank is -338.24, which is below the MACD Signal line at -237.05. This indicates a bearish momentum, suggesting that the stock might continue to face downward pressure in the short term.

RSI Analysis
The current RSI value for Nifty Bank is 35.92, indicating that it is approaching the oversold region. This suggests that the stock may be experiencing downwards pressure and could potentially be undervalued at this point. Traders often use an RSI below 30 as a signal that the security may be oversold.

Analysis for Nifty 50 - March 03, 2025

Nifty 50 performance shows a slight decline, with a closing value of 22119.30, marking a decrease of 0.02% or -5.40 points from the previous close. The index experienced a trading range between a high of 22261.55 and a low of 22004.70. Indicators show bearish momentum, demonstrated by a low RSI of 22.97 and a negative MACD of -292.22.

Relationship with Key Moving Averages
The Nifty 50 close value of 22,119.30 is below its 10 EMA of 22,575.74, 50 EMA of 23,246.34, and 200 EMA of 23,506.48, indicating a bearish trend as the current price is lower than key short and long-term moving averages. Additionally, the RSI of 22.97 suggests it might be in the oversold region.
Moving Averages Trend (MACD)
The MACD value for Nifty 50 is significantly below the signal line, indicating a bearish momentum. With the MACD at -292.22 and the signal line at -208.62, the trend suggests a potential continuation of the downward movement unless a positive crossover occurs.

RSI Analysis
Based on the given data, the Nifty 50 has an RSI value of 22.97, indicating it is in an oversold state. Typically, an RSI below 30 suggests potential undervaluation and could signal a buying opportunity depending on other market factors.

Up Next
Indian stock market sector-wise performance today - March 03, 2025

Honda Activa 6G: Everything You Need to Know Before Buying

How much does a ULIP plan really cost? A break-down of all charges

Centre plans to borrow Rs 8.20 lakh cr from market in first half of FY27

Reliance denies buying Iranian oil amid US sanctions waiver

Premium petrol price up Rs 2, industrial diesel up Rs 22; no change in normal petrol, diesel rates

More videos

India's GDP expected to register over 8 pc growth in Sep-Dec: Report

Govt announces seven measures to help boost exports

RBI keeps interest rates on hold after US trade deal boosts outlook

RBI proposes to compensate customers up to Rs 25,000 loss due to fraud

RBI raises GDP growth projection of Q1, Q2 of FY27

RBI pauses rate cuts, retains interest rate at 5.25 pc

Rupee jumps 122 paise to close at 90.27 against US dollar on India-US trade deal

Stock markets cheer India-US trade deal: Sensex, Nifty surge 2.5 pc

UPI transactions hit record high of Rs 230 lakh crore in 2025-26 till Dec: Govt

Explained: India-US trade deal, tariffs and trade benefits