


Highlights
- Nifty Metal surges 1.01%, leads sector gains
- Sensex closes 0.19% higher amid mixed cues
- Auto, bank indices show moderate bullish momentum
Latest news

Energy key to India's national resilience: Sagar Adani

Sajid Nadiadwala banner enters Gujarati cinema with 'Dhabkaaro', film to release on May 1

Louvre Furnishings Group's Global Home Carnival Gains Momentum, Blending Trade, Culture and Holiday Promotions

Strait of Hormuz disruption may push global food prices higher in coming years, warns Economics Professor, Singapore
")
Anondita Medicare Limited- Update on Qualification as Vendor under South Africa Government Tender (RT75-2025)

Liebherr Appliances India Strengthens Its Commitment to India with the Expansion of Its FreshBreeze Range

Delhi HC to pass interim order on Arjun Kapoor's plea seeking personality rights protection

Didn't Get IIT CSE? These B.Tech AI-First Programs Are Competing With IIT-Level Outcomes
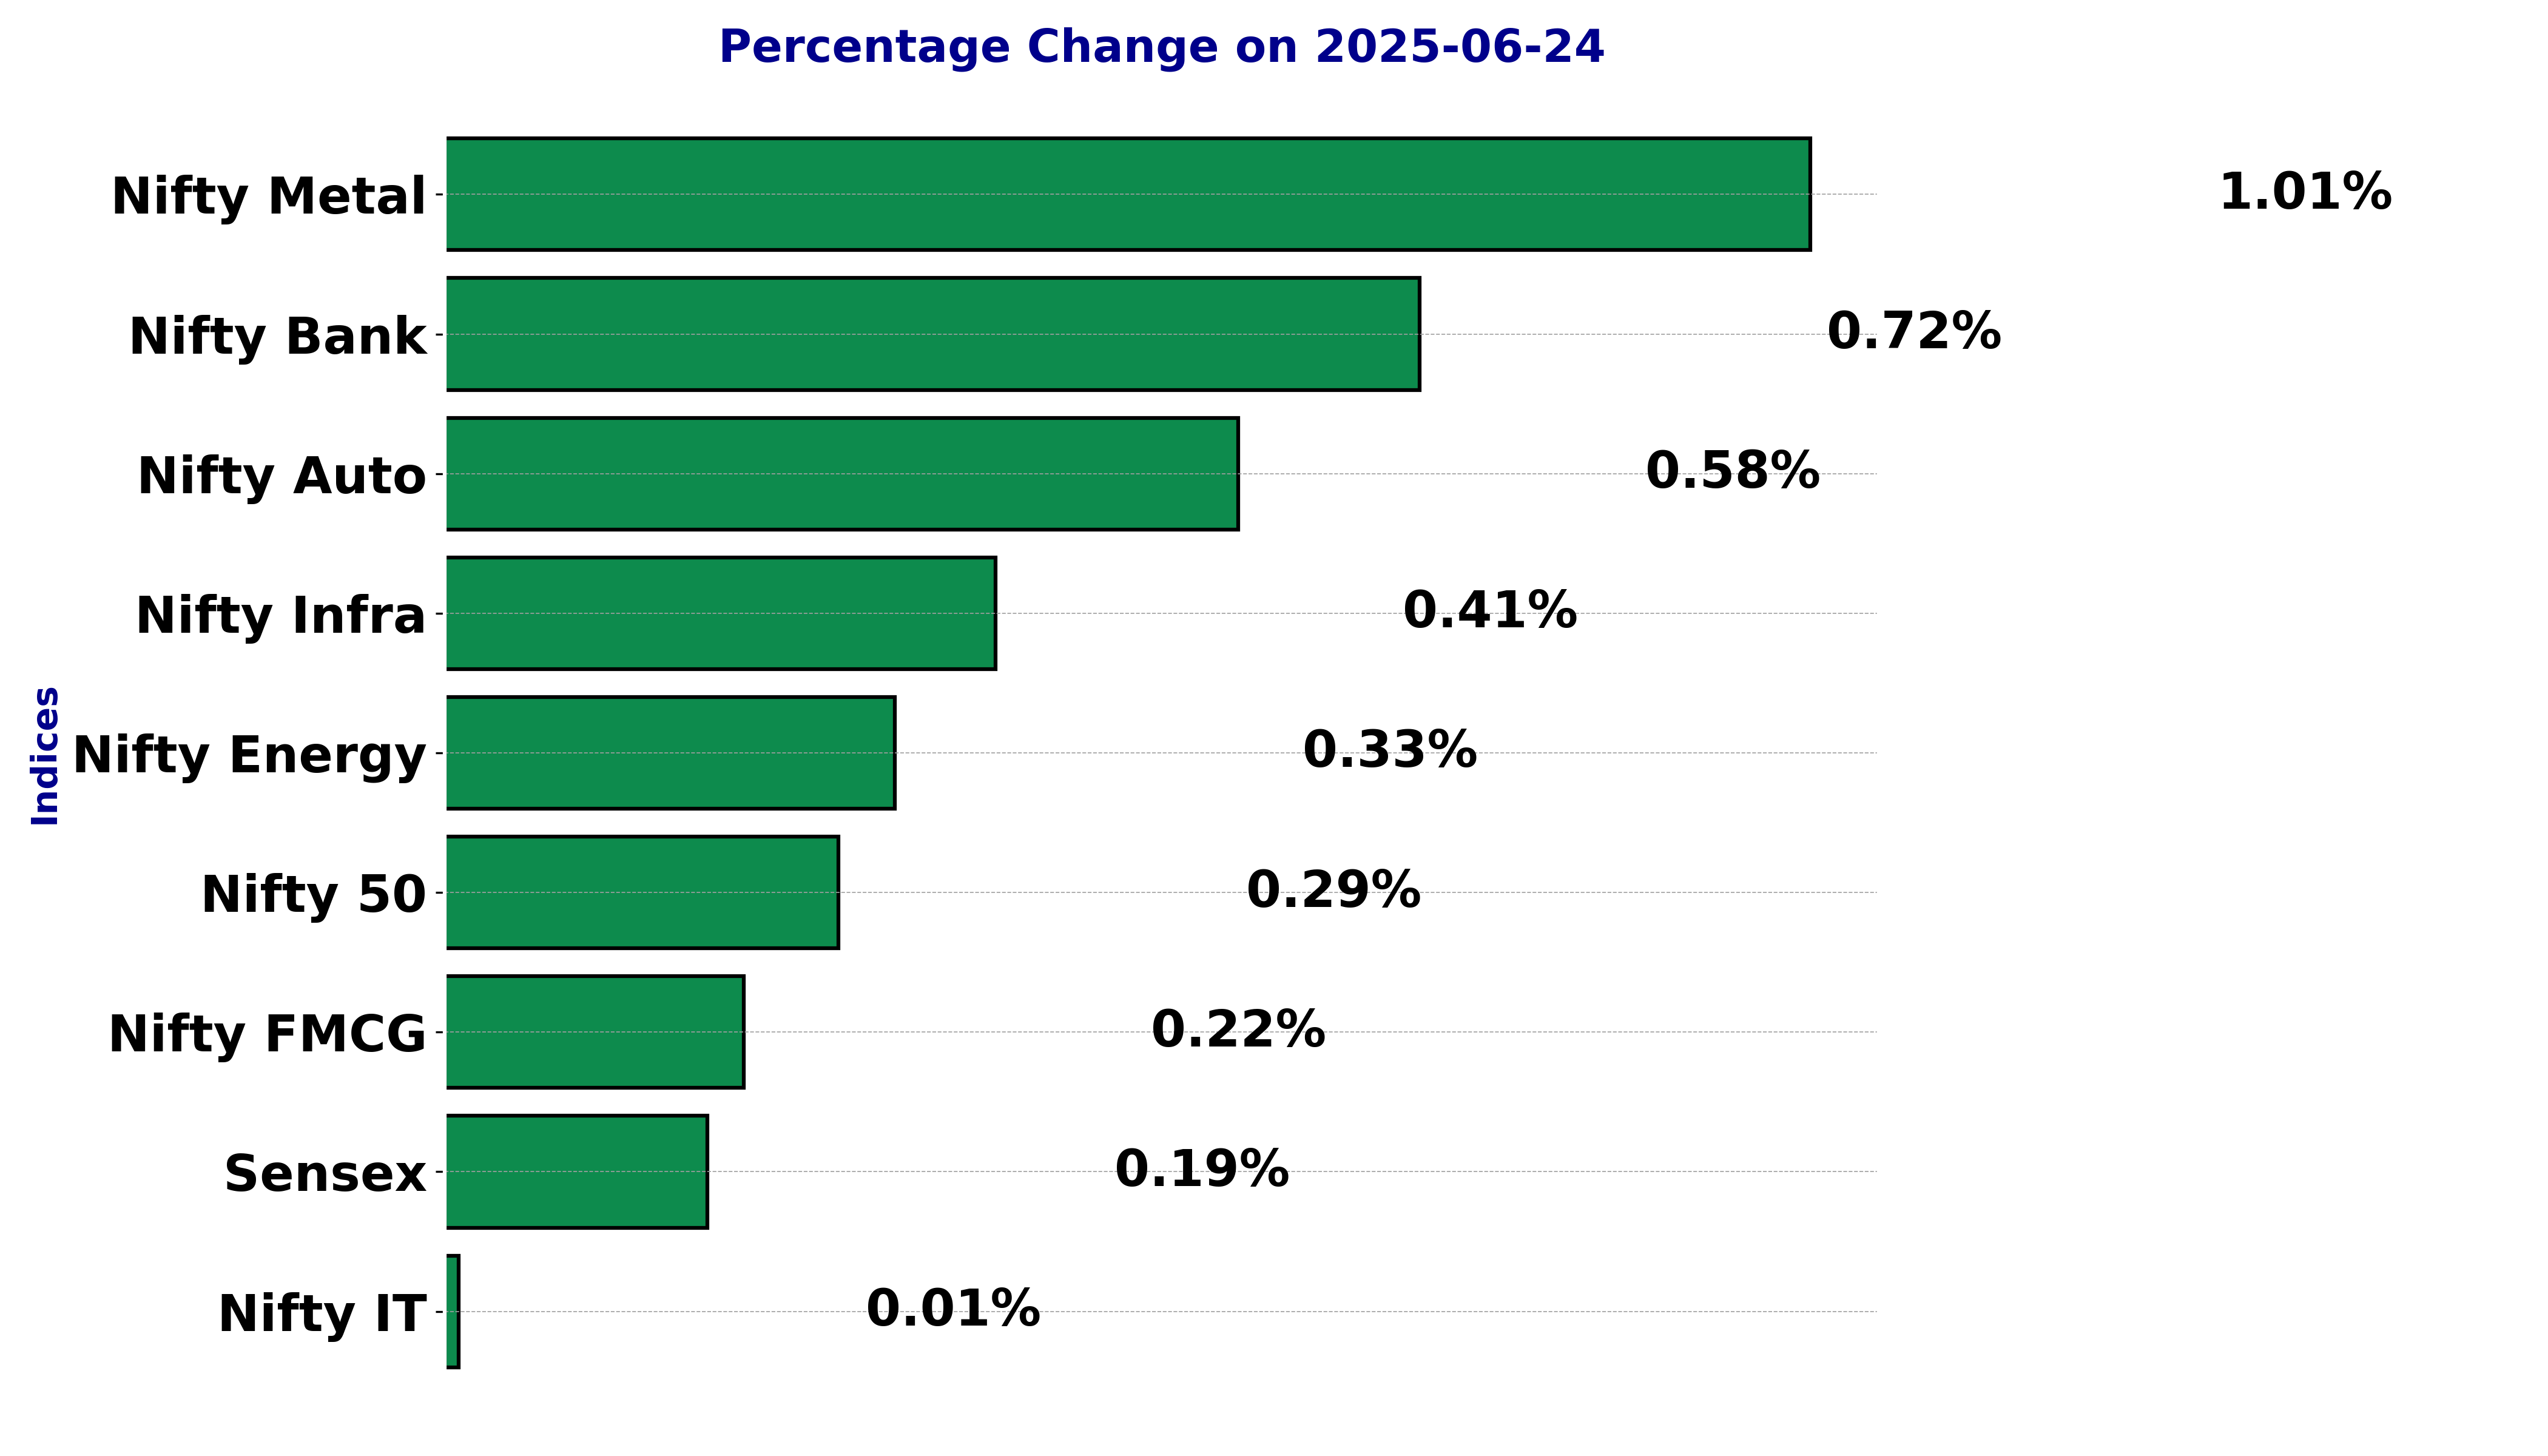
Indian stock market sector-wise performance today - June 24, 2025


The stock market on Tuesday (June 24, 2025) experienced varied performances across different sectors and indices, with some notable changes observed.
The BSE Sensex opened at 81,704.07, reaching a high of 83,018.15 before closing at 82,055.10. This represented a modest increase of 0.19% from its previous close.
The Nifty Auto index saw a positive movement with a significant gain of 0.58%. It opened at 23,670.95 and managed to close at 23,598.25, showcasing investor optimism in the auto sector.
Meanwhile, the Nifty Energy index also witnessed an upward trend, rising by 0.33%. It highlighted some recovery in the energy market, closing at 35,727.05.
In contrast, the Nifty FMCG index, although experiencing a slight increase of 0.22%, did not perform as robustly as its peers. It closed at 54,346.30, marking a marginal gain, signaling cautious sentiment in the fast-moving consumer goods sector.
The Nifty Infrastructure presented a growth of 0.41%, closing at 9,120.65, suggesting positive sentiment surrounding infrastructure development and investment.
Similarly, the Nifty IT index remained relatively stable with a negligible change of 0.01%, indicating stable performance in the technology sector.
The biggest mover of the day was the Nifty Metal index, which surged by an impressive 1.01%. It closed at 9,291.10, driven by rising demands and potential developments in the metal industry, which evidently attracted investor interest.
Additionally, the Nifty Bank index marked a notable rise of 0.72%, closing at 56,461.90. Banking stocks were in favor, possibly due to expectations of upcoming economic stability measures or favorable earnings reports.
The overall broader market index, Nifty 50, also moved upward, recording an increase of 0.29% to close at 25,044.35, reflecting a generally positive market sentiment across various sectors.
The metal sector, experiencing the day's most significant change, reflected increased investor confidence, which could be attributed to factors such as anticipated government infrastructure projects boosting metal demand, favorable policy announcements, or global commodity price trends.
This upliftment in the metal sector might also be hinting at the stabilization of global economic uncertainties, allowing investors to take bolder positions in metal-driven equities.
Overall, the trading day demonstrated mixed performances with specific sectors prominently indicating strategic investor movements, driven by both domestic and international market influences.
Analysis for Sensex - June 24, 2025
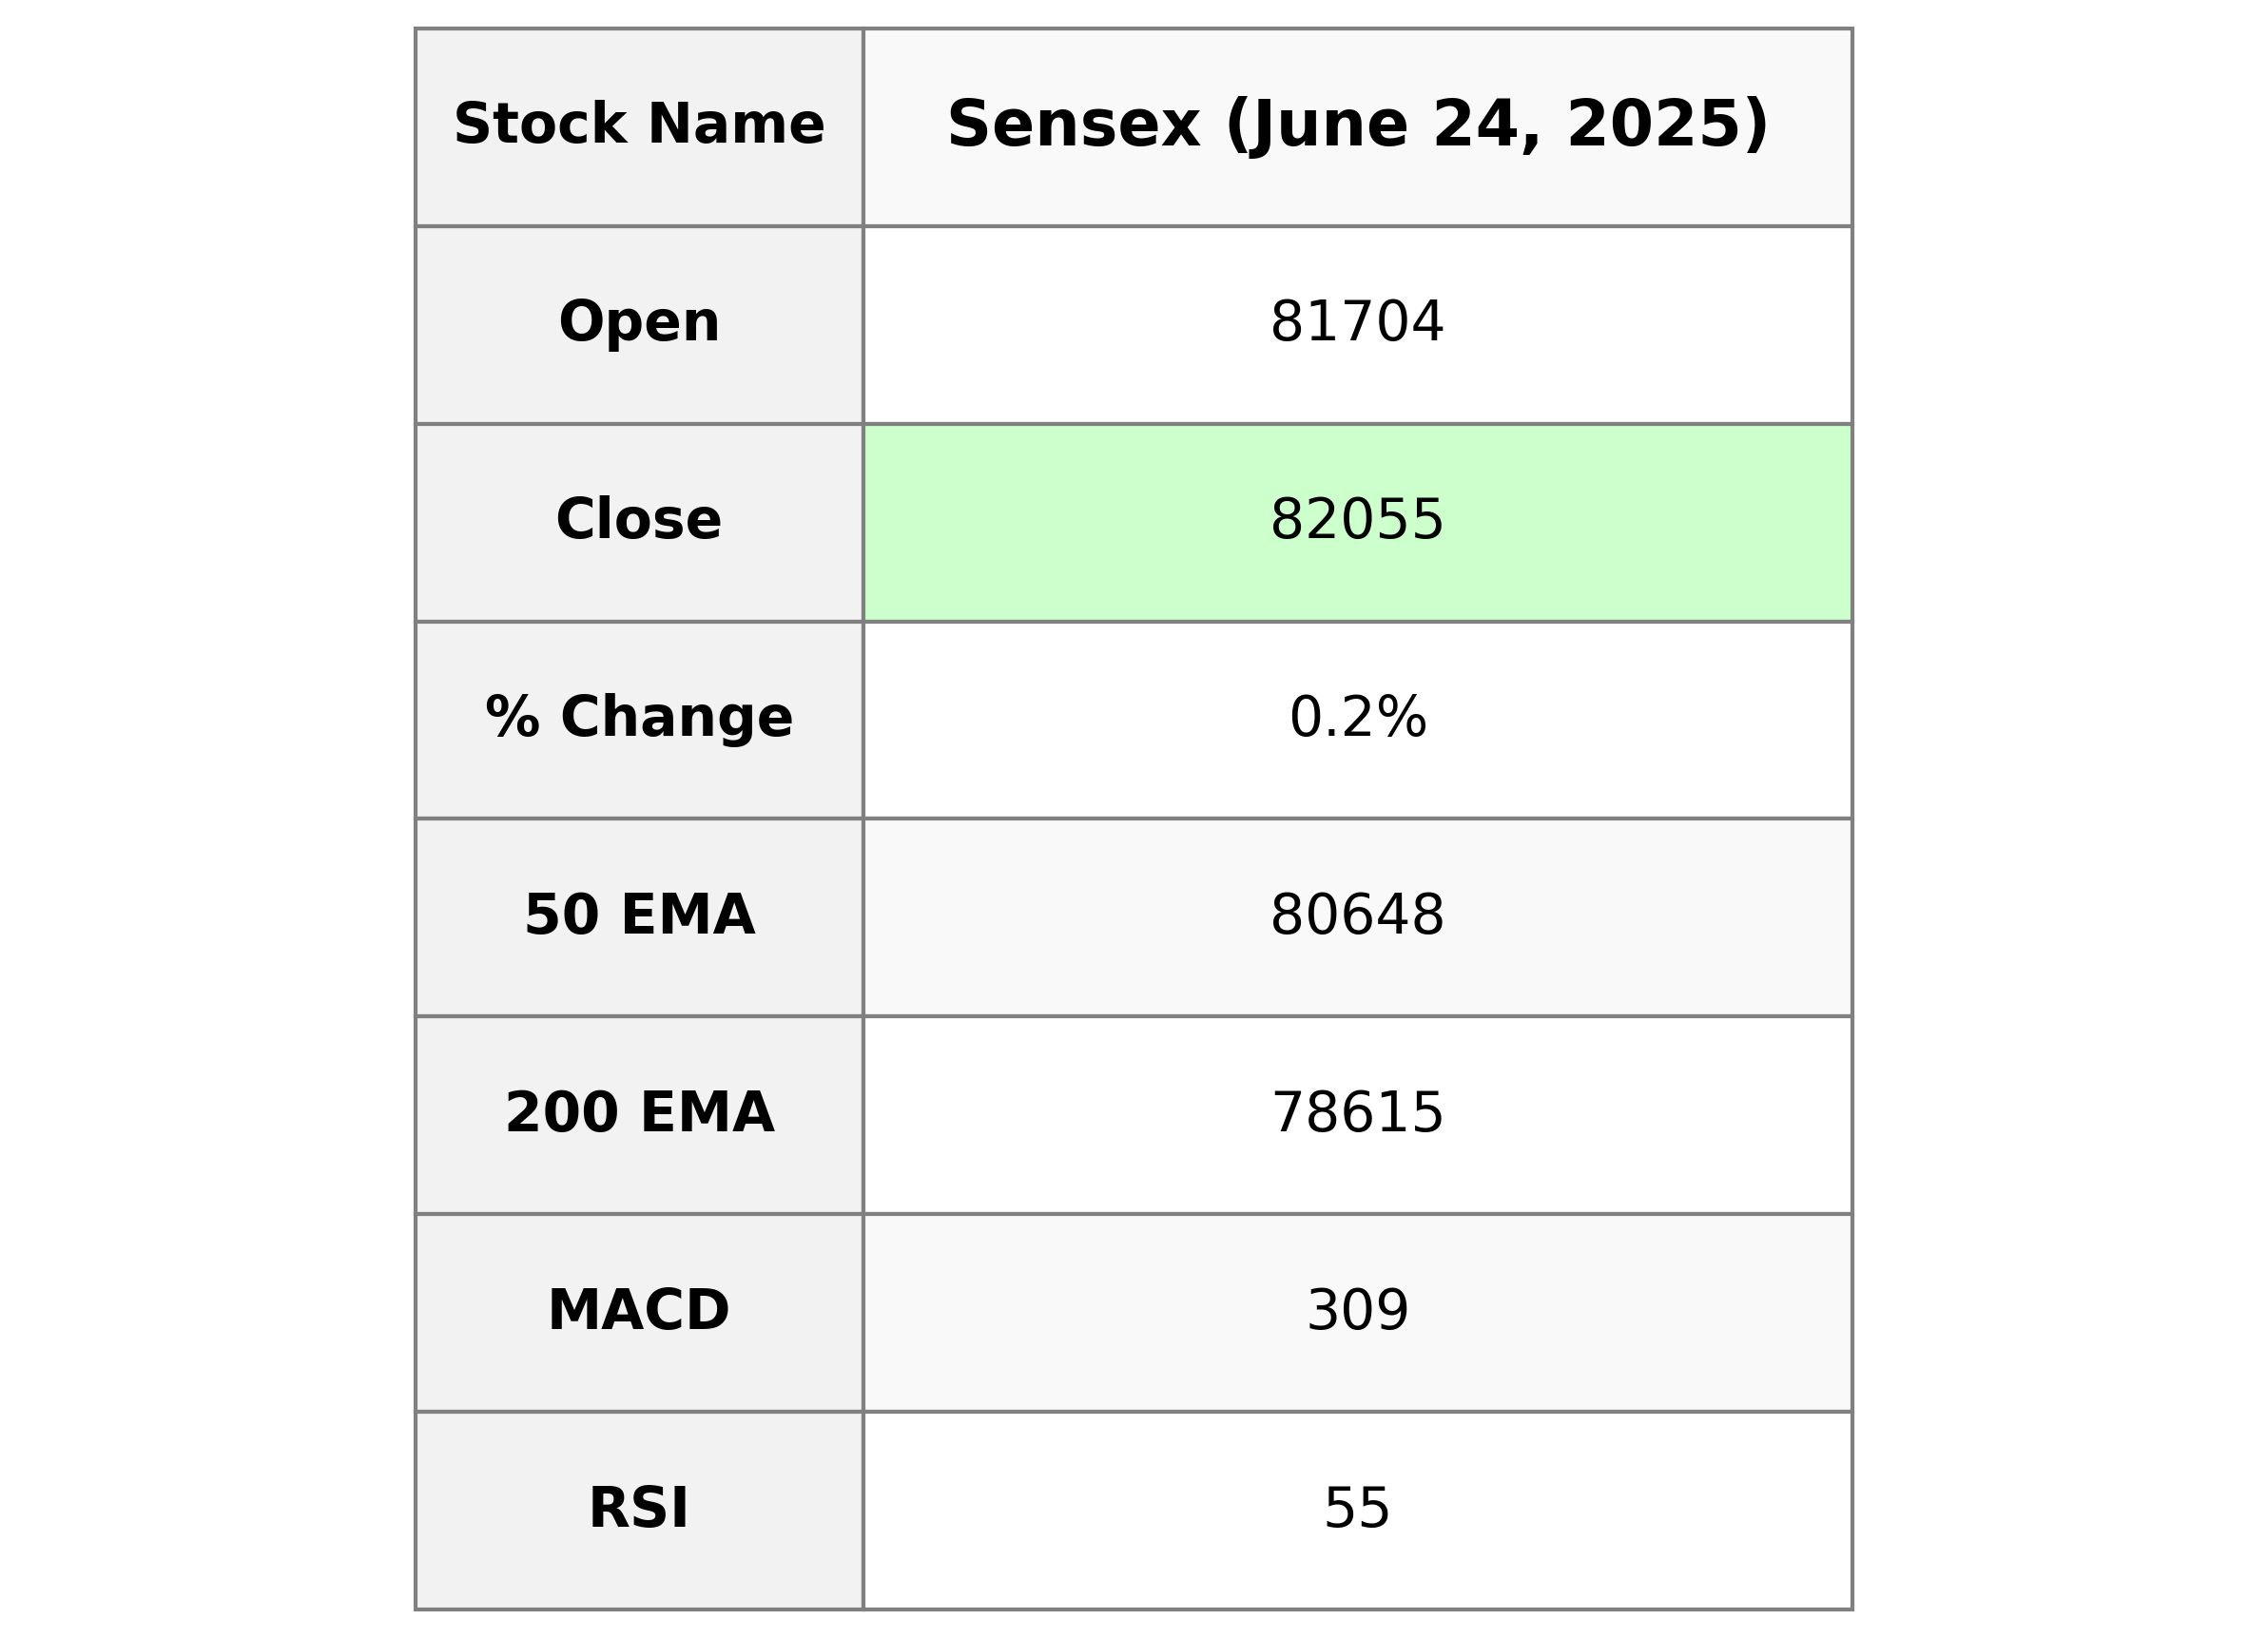
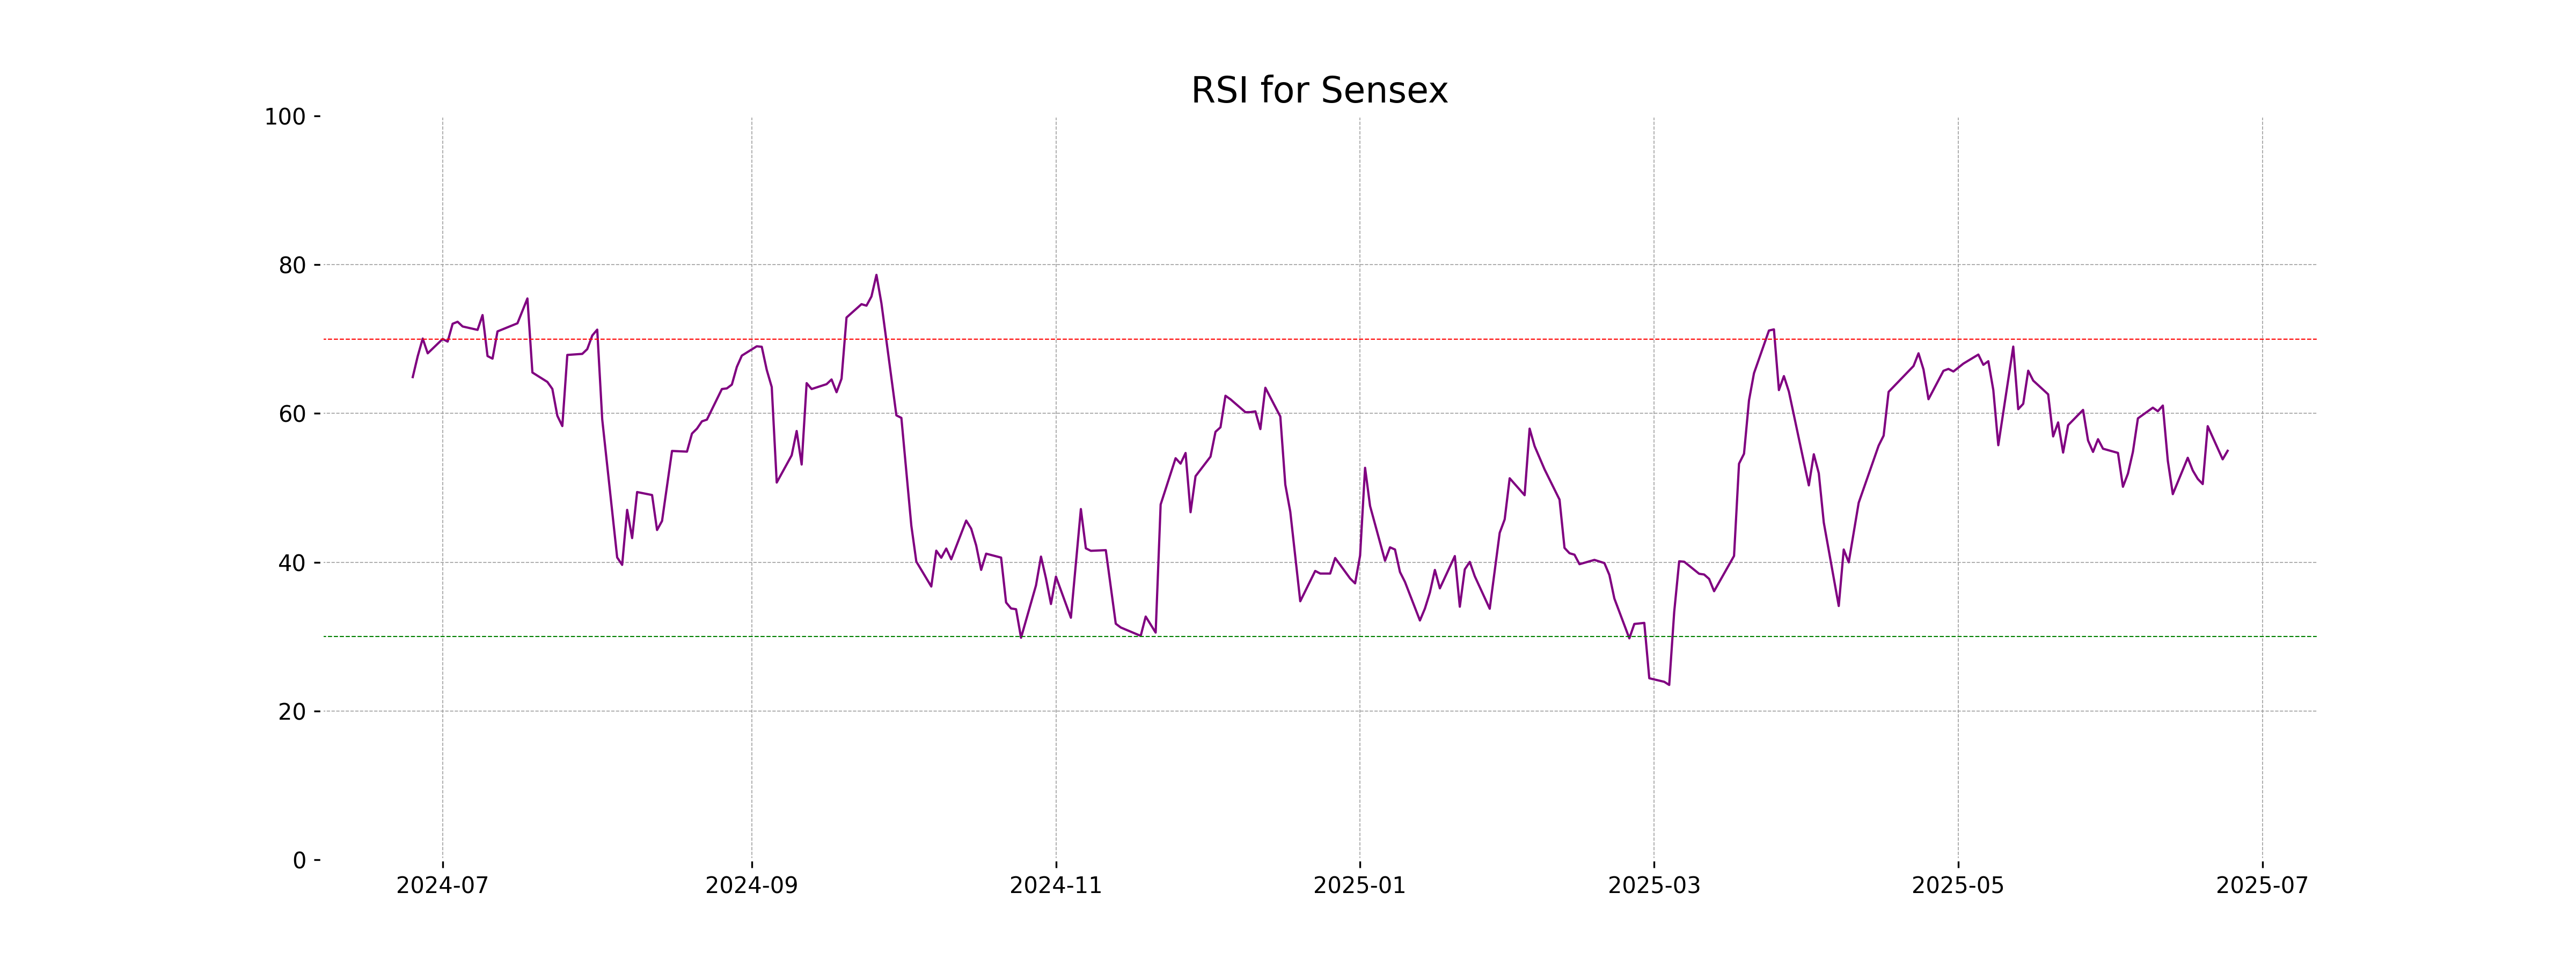
Sensex Performance Summary: On its latest trading day, Sensex opened at 81,704.07, reached a high of 83,018.16, and closed at 82,055.11. This marked a slight increase of 0.19% over the previous close of 81,896.79. The Relative Strength Index (RSI) was at 54.98, indicating a neutral position in terms of market momentum.
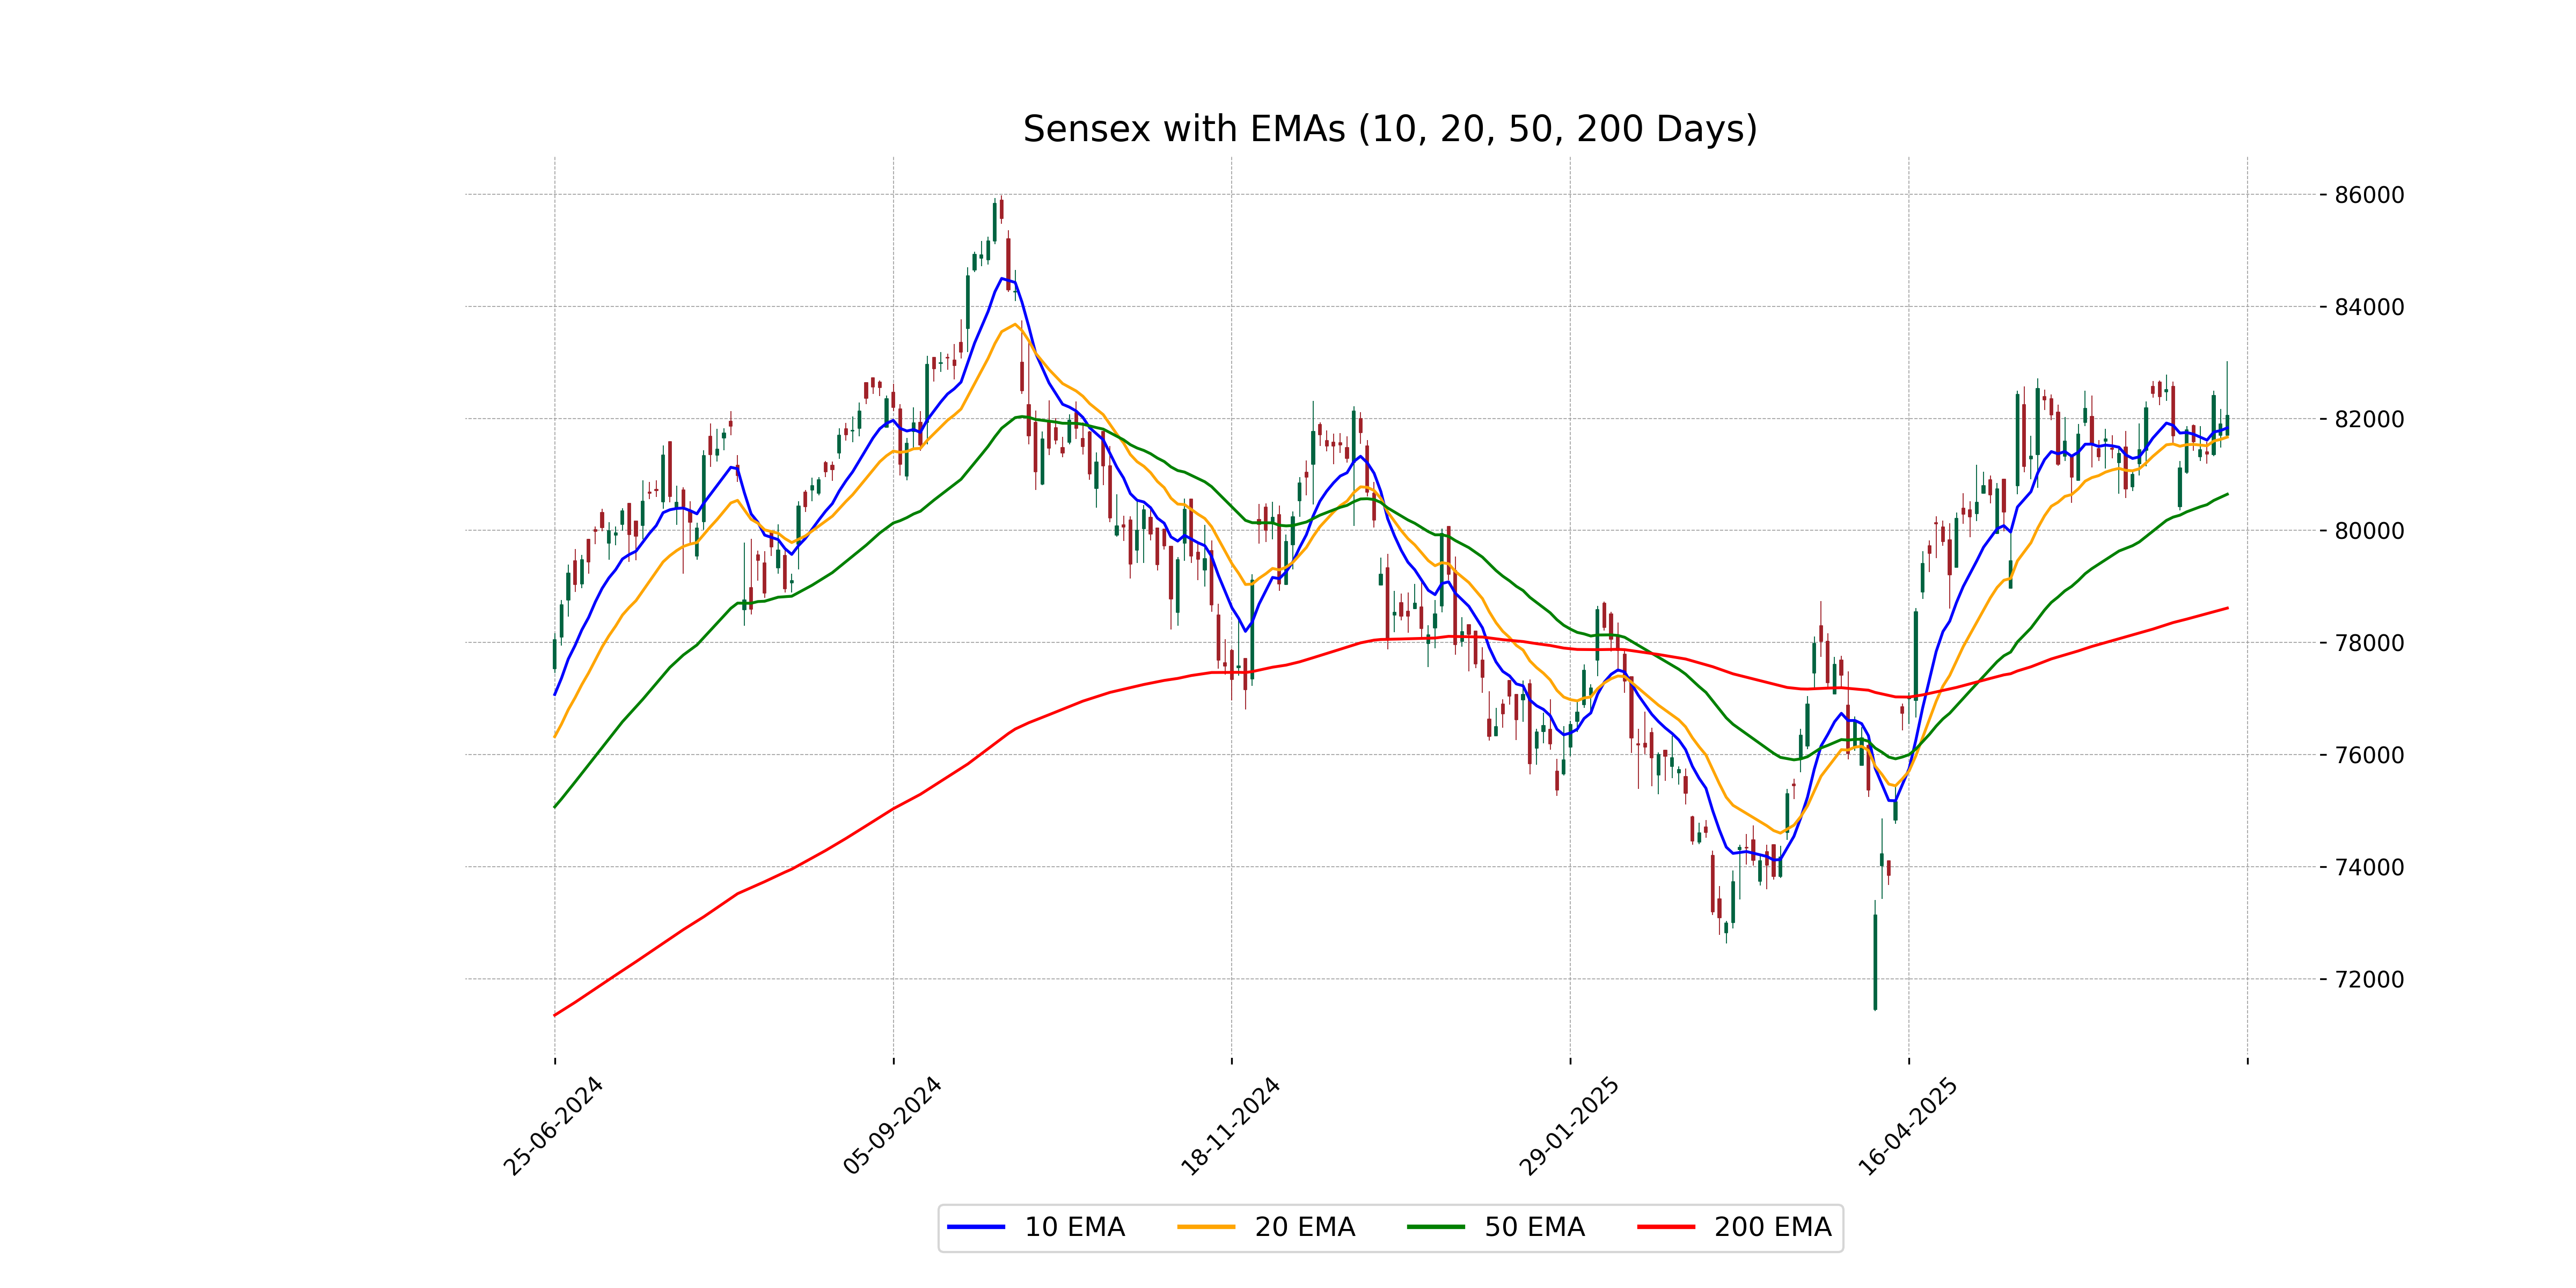
Relationship with Key Moving Averages
The Sensex closed at 82055.11, which is above its 10 EMA of 81832.55 and its 50 EMA of 80647.71, indicating short-term and medium-term bullish momentum. However, it is significantly higher than the 200 EMA of 78615.19, suggesting a strong long-term upward trend.
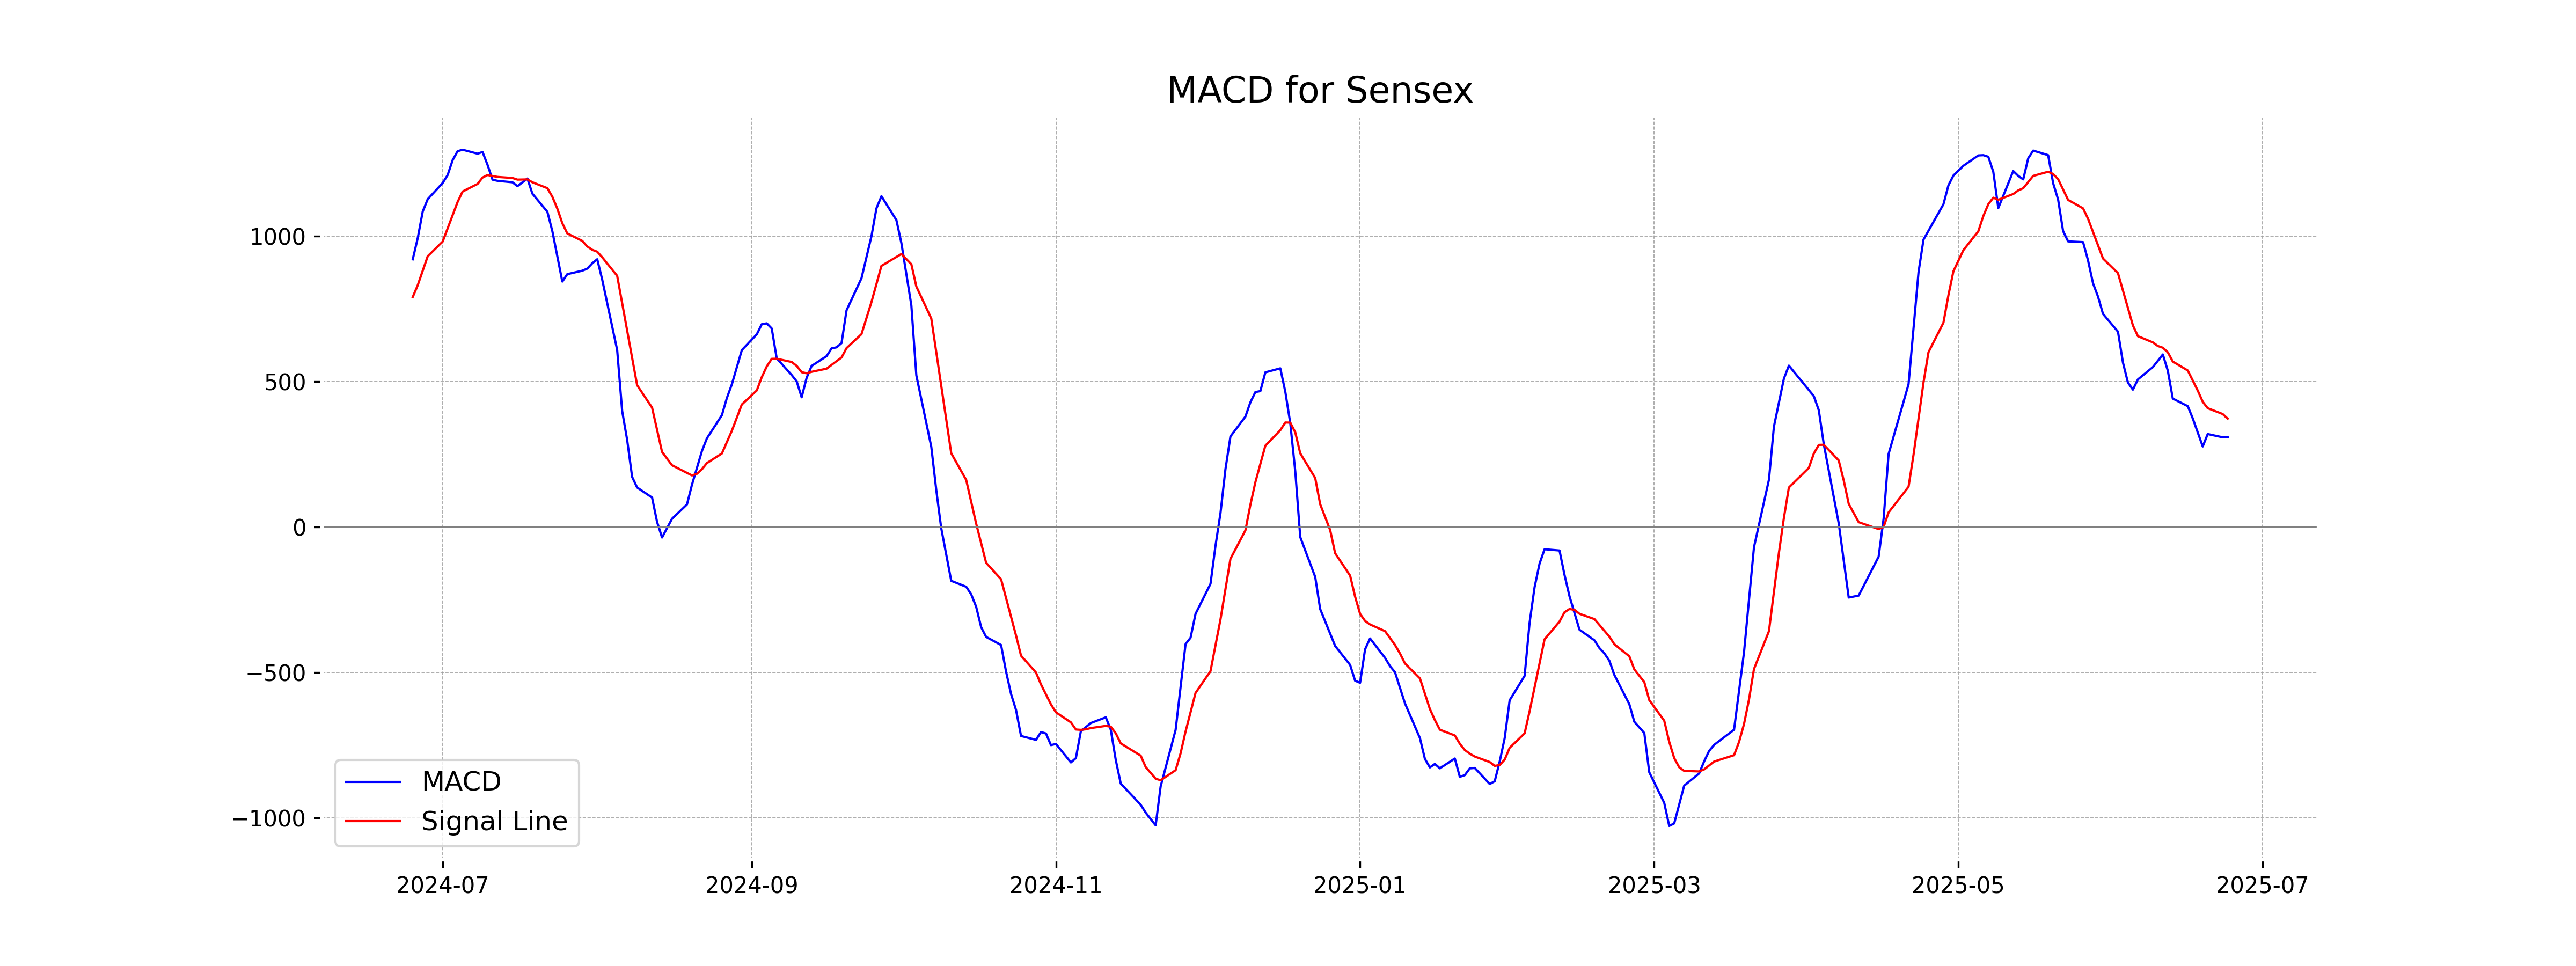
Moving Averages Trend (MACD)
The Sensex's MACD of approximately 309.48 is below its MACD Signal of about 373.17, indicating a bearish divergence, which suggests potential downward momentum. However, the RSI at 54.98 reflects a neutral condition, indicating no strong momentum in either direction.
RSI Analysis
The RSI for Sensex is currently at 54.98, which is in the neutral range, indicating neither overbought nor oversold conditions. This suggests that the market is relatively balanced, with no strong momentum in either direction.
Analysis for Nifty Auto - June 24, 2025
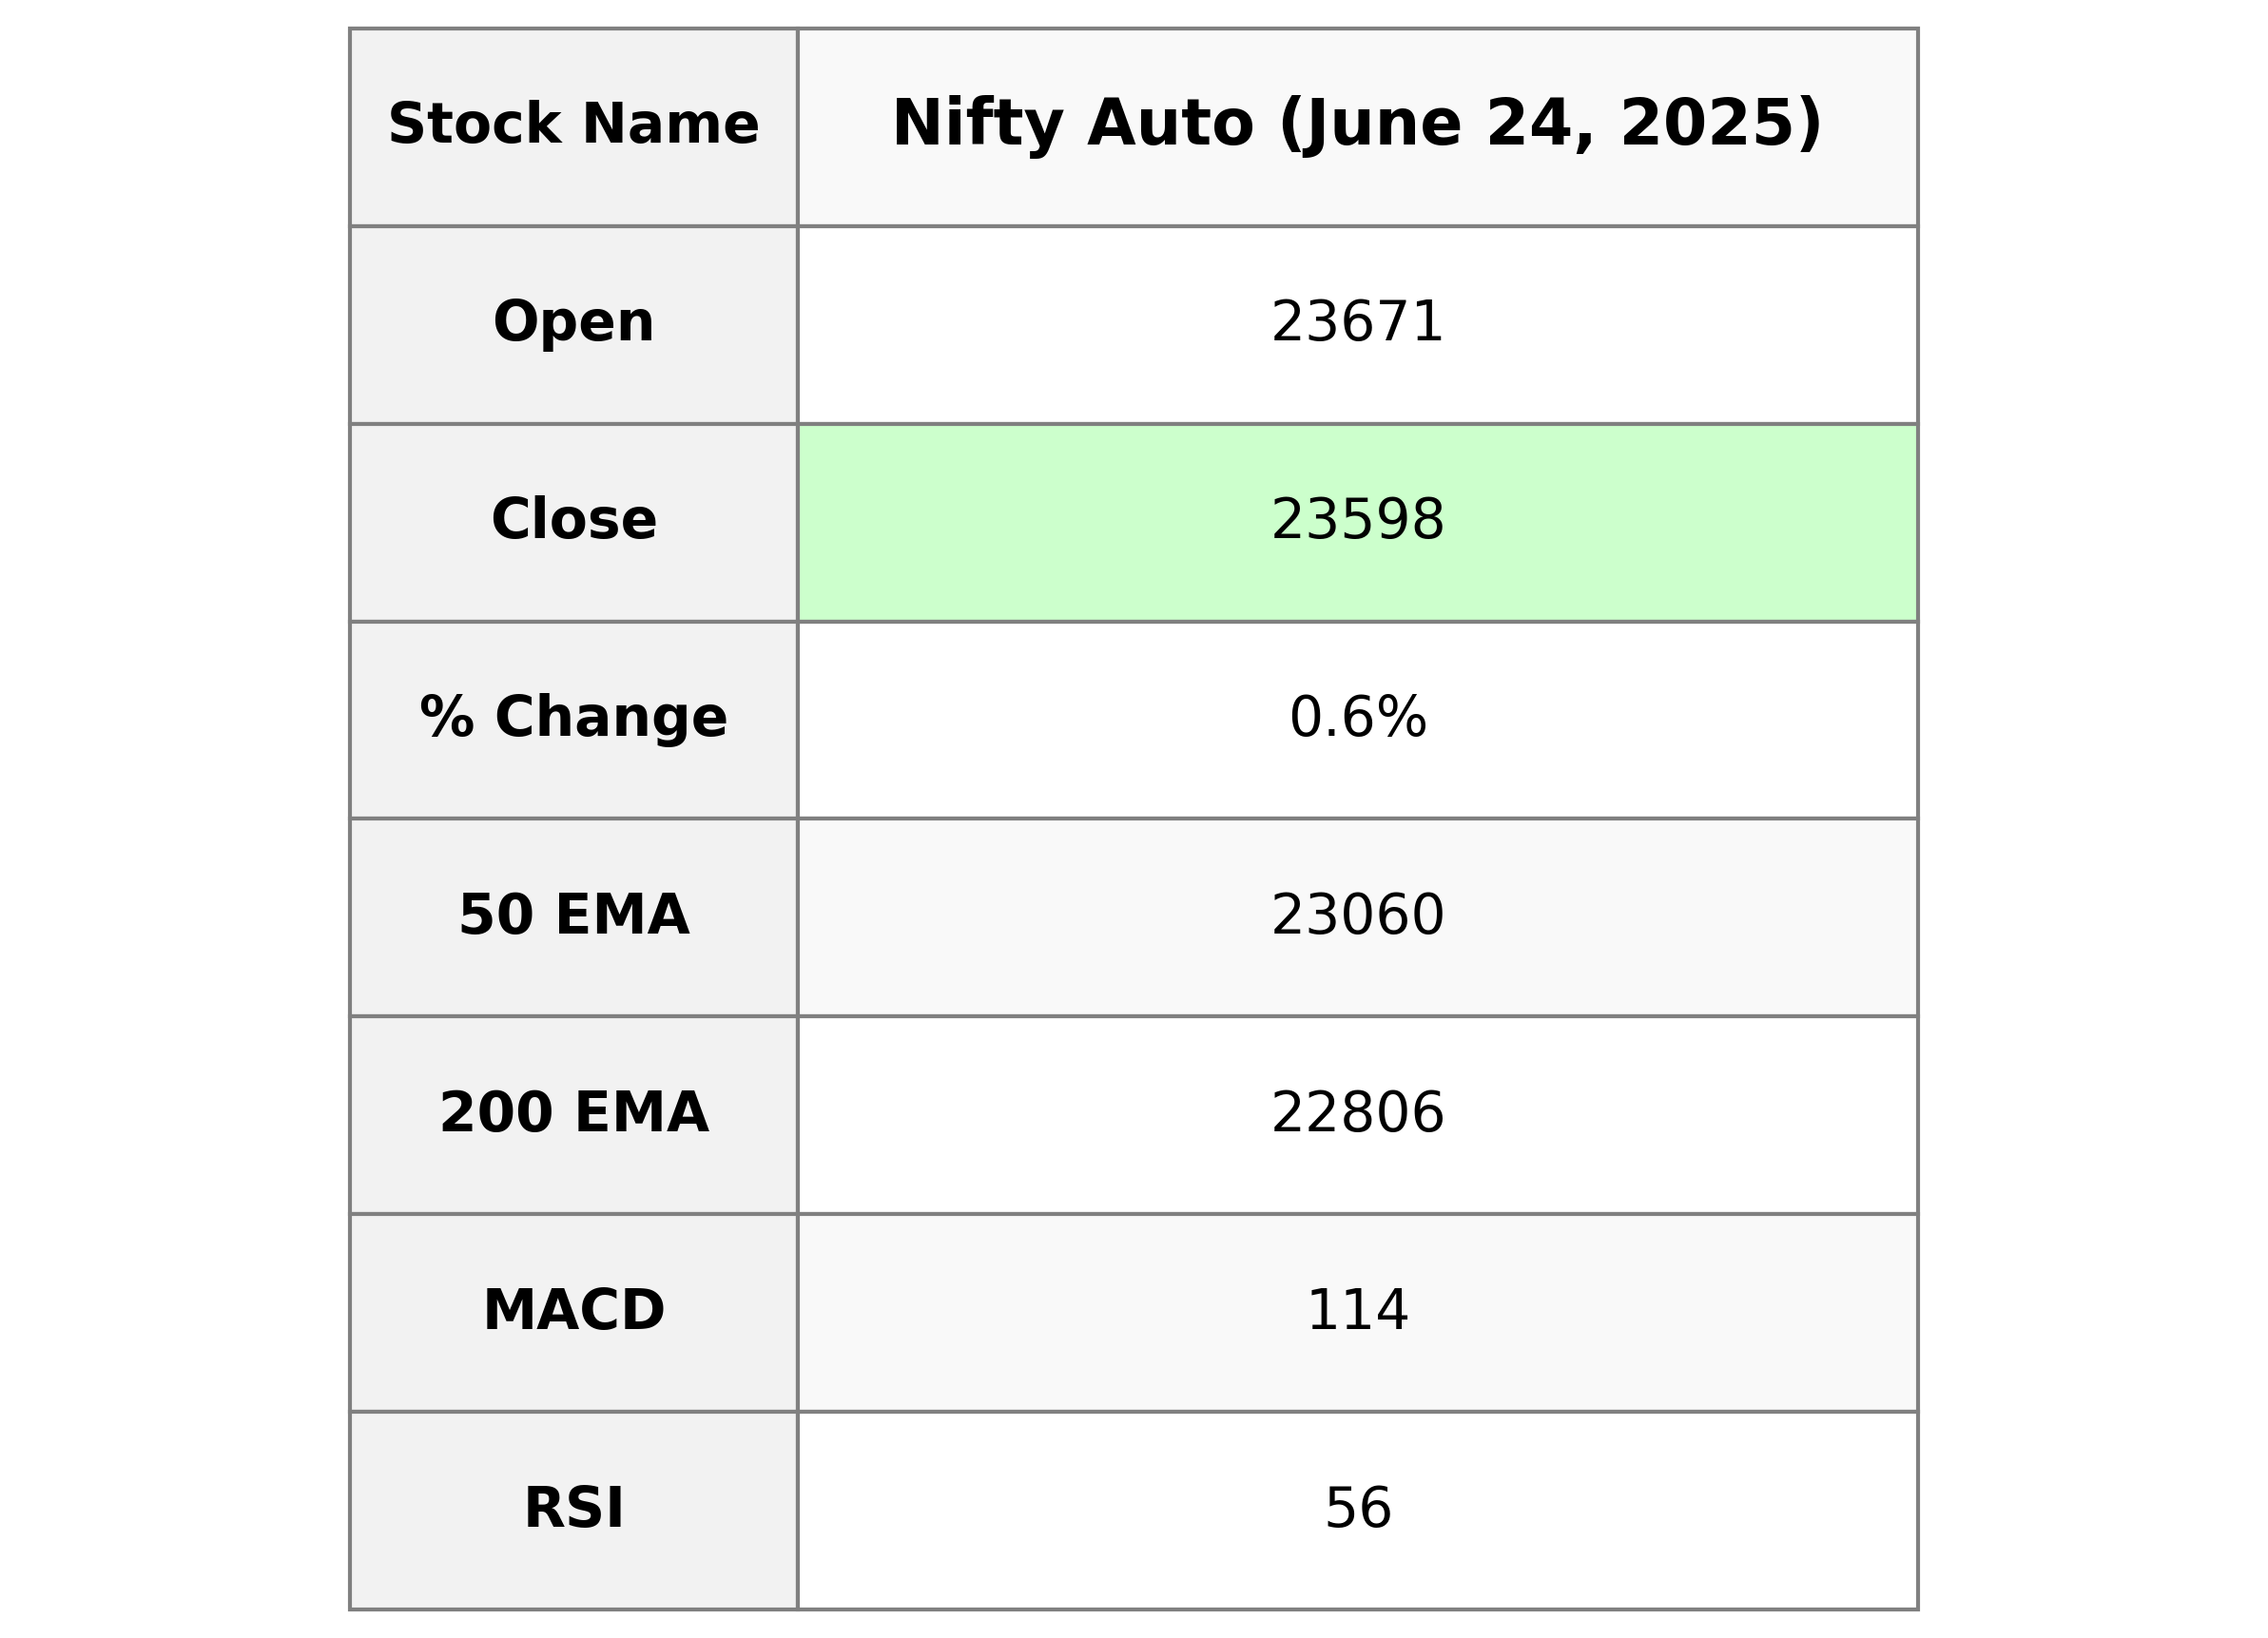
Nifty Auto witnessed a positive movement, closing at 23,598.25 with a gain of 137.10 points from its previous close of 23,461.15, reflecting a percentage change of 0.58%. The index reached a high of 23,885.30 and a low of 23,572.35 during the session. The RSI stands at 55.59, indicating a moderately bullish trend, while the MACD line is below the signal line, suggesting a potential crossover.
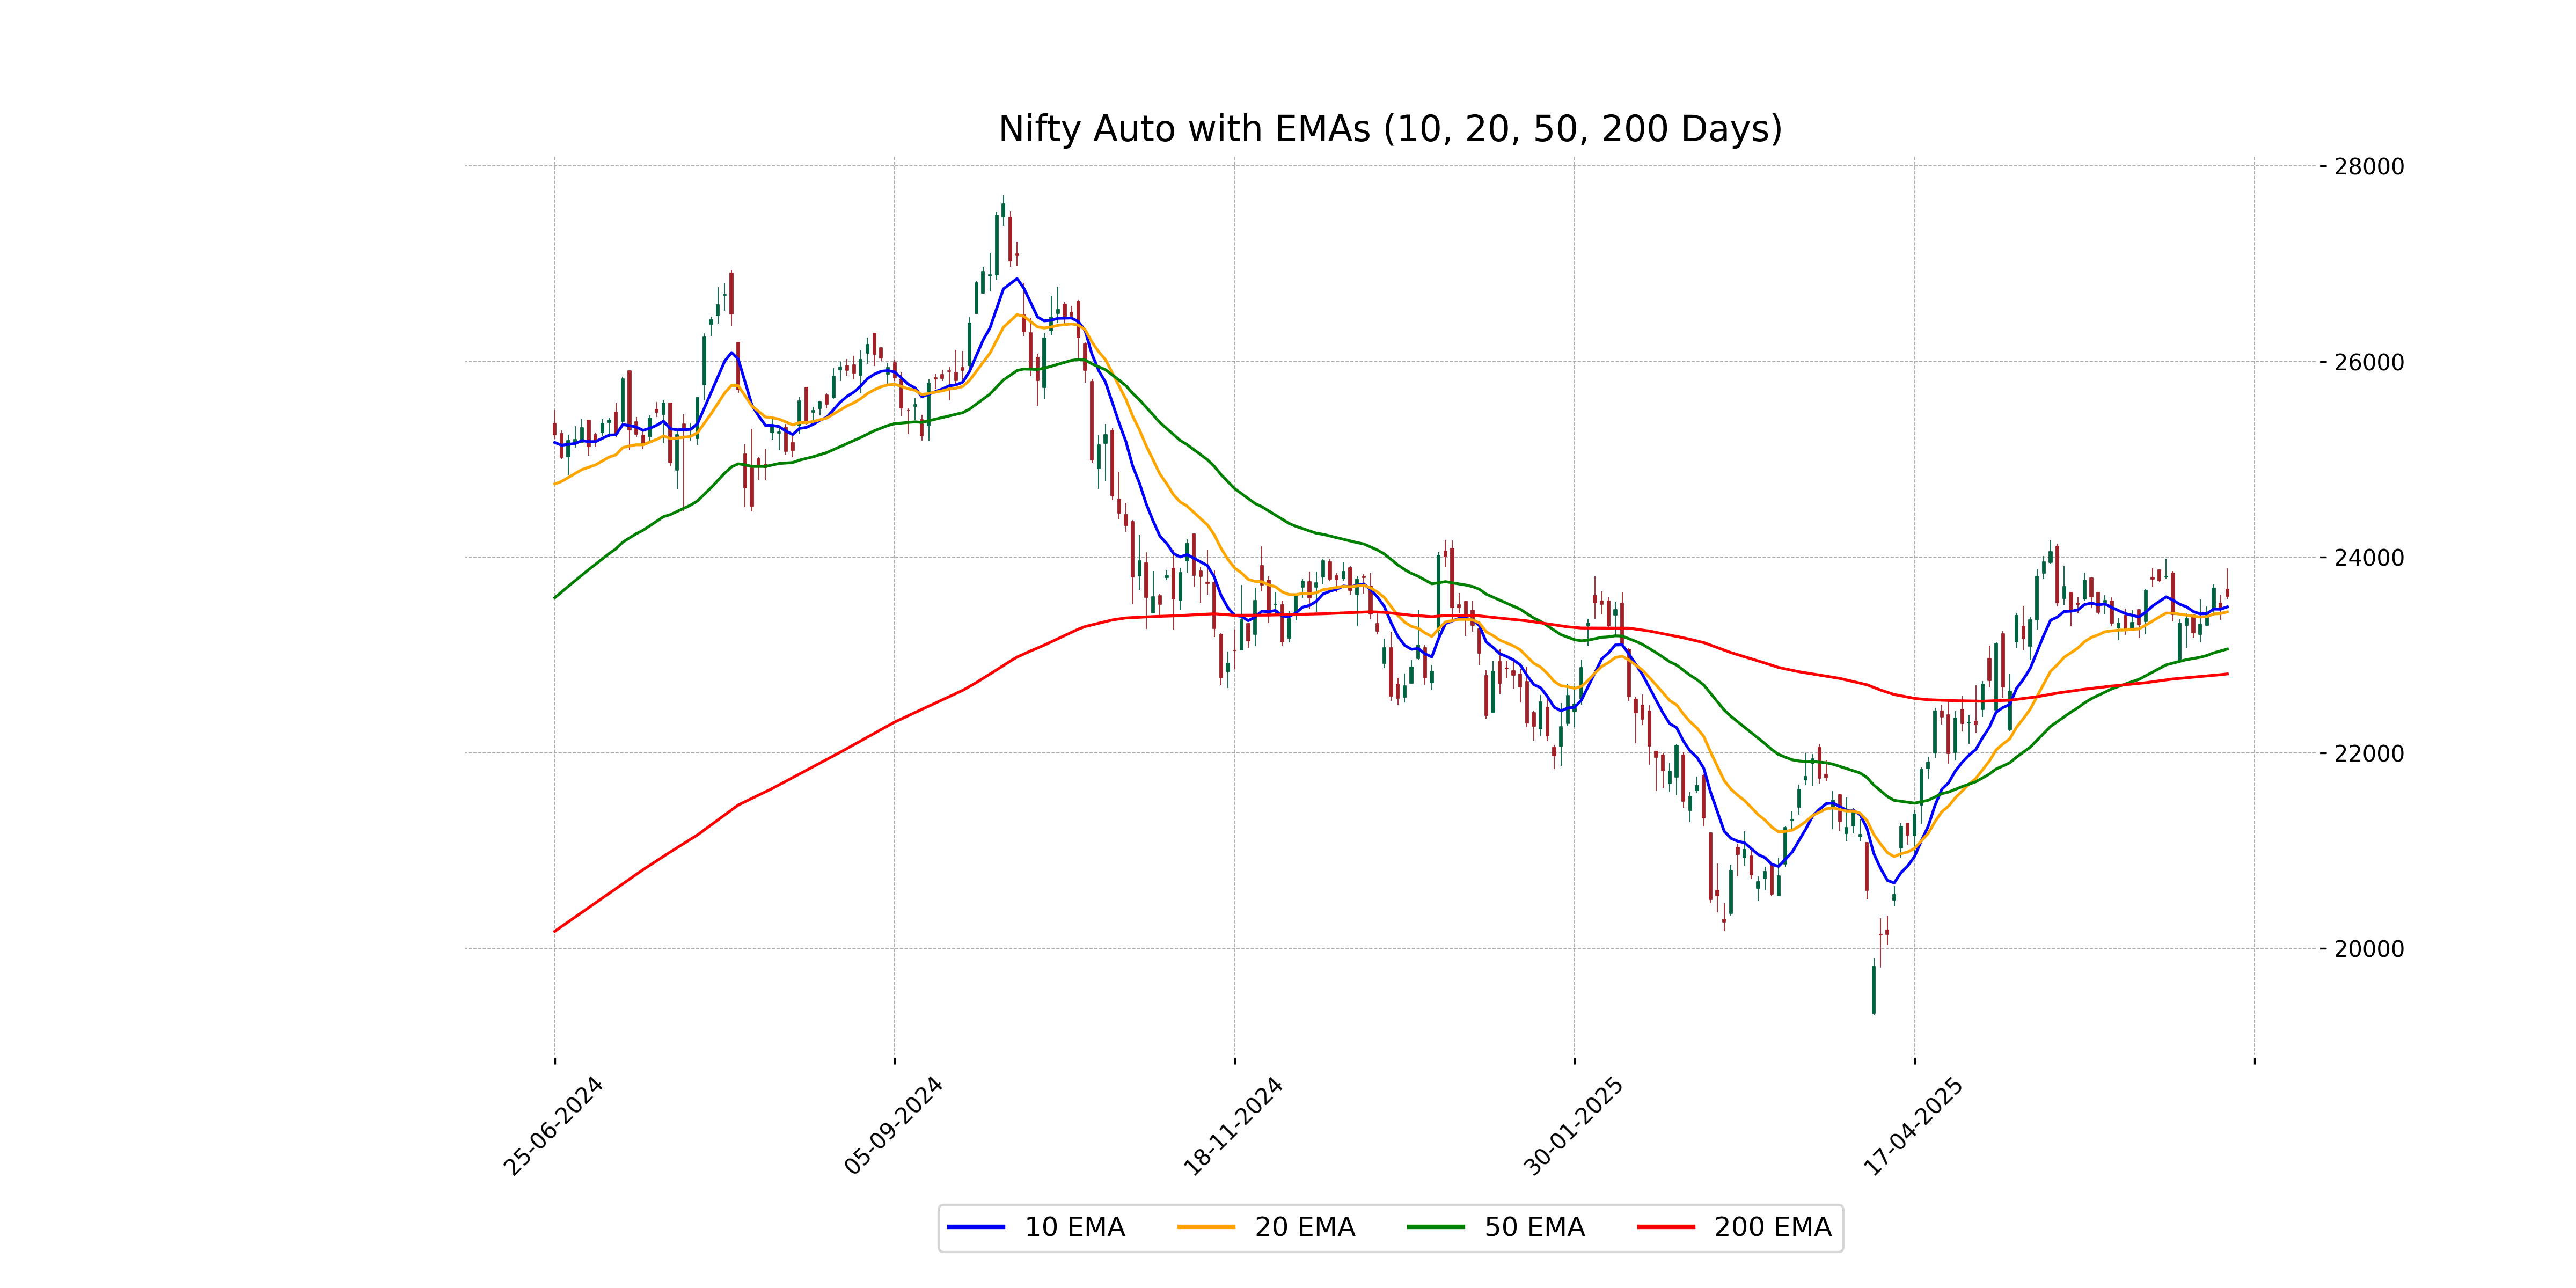
Relationship with Key Moving Averages
Nifty Auto closed at 23,598.25, which is slightly above its 10 EMA of 23,491.20 and well above its 50 EMA and 200 EMA, indicating a potential short-term bullish trend. However, it remains below the MACD signal line, suggesting some bearish momentum may persist.
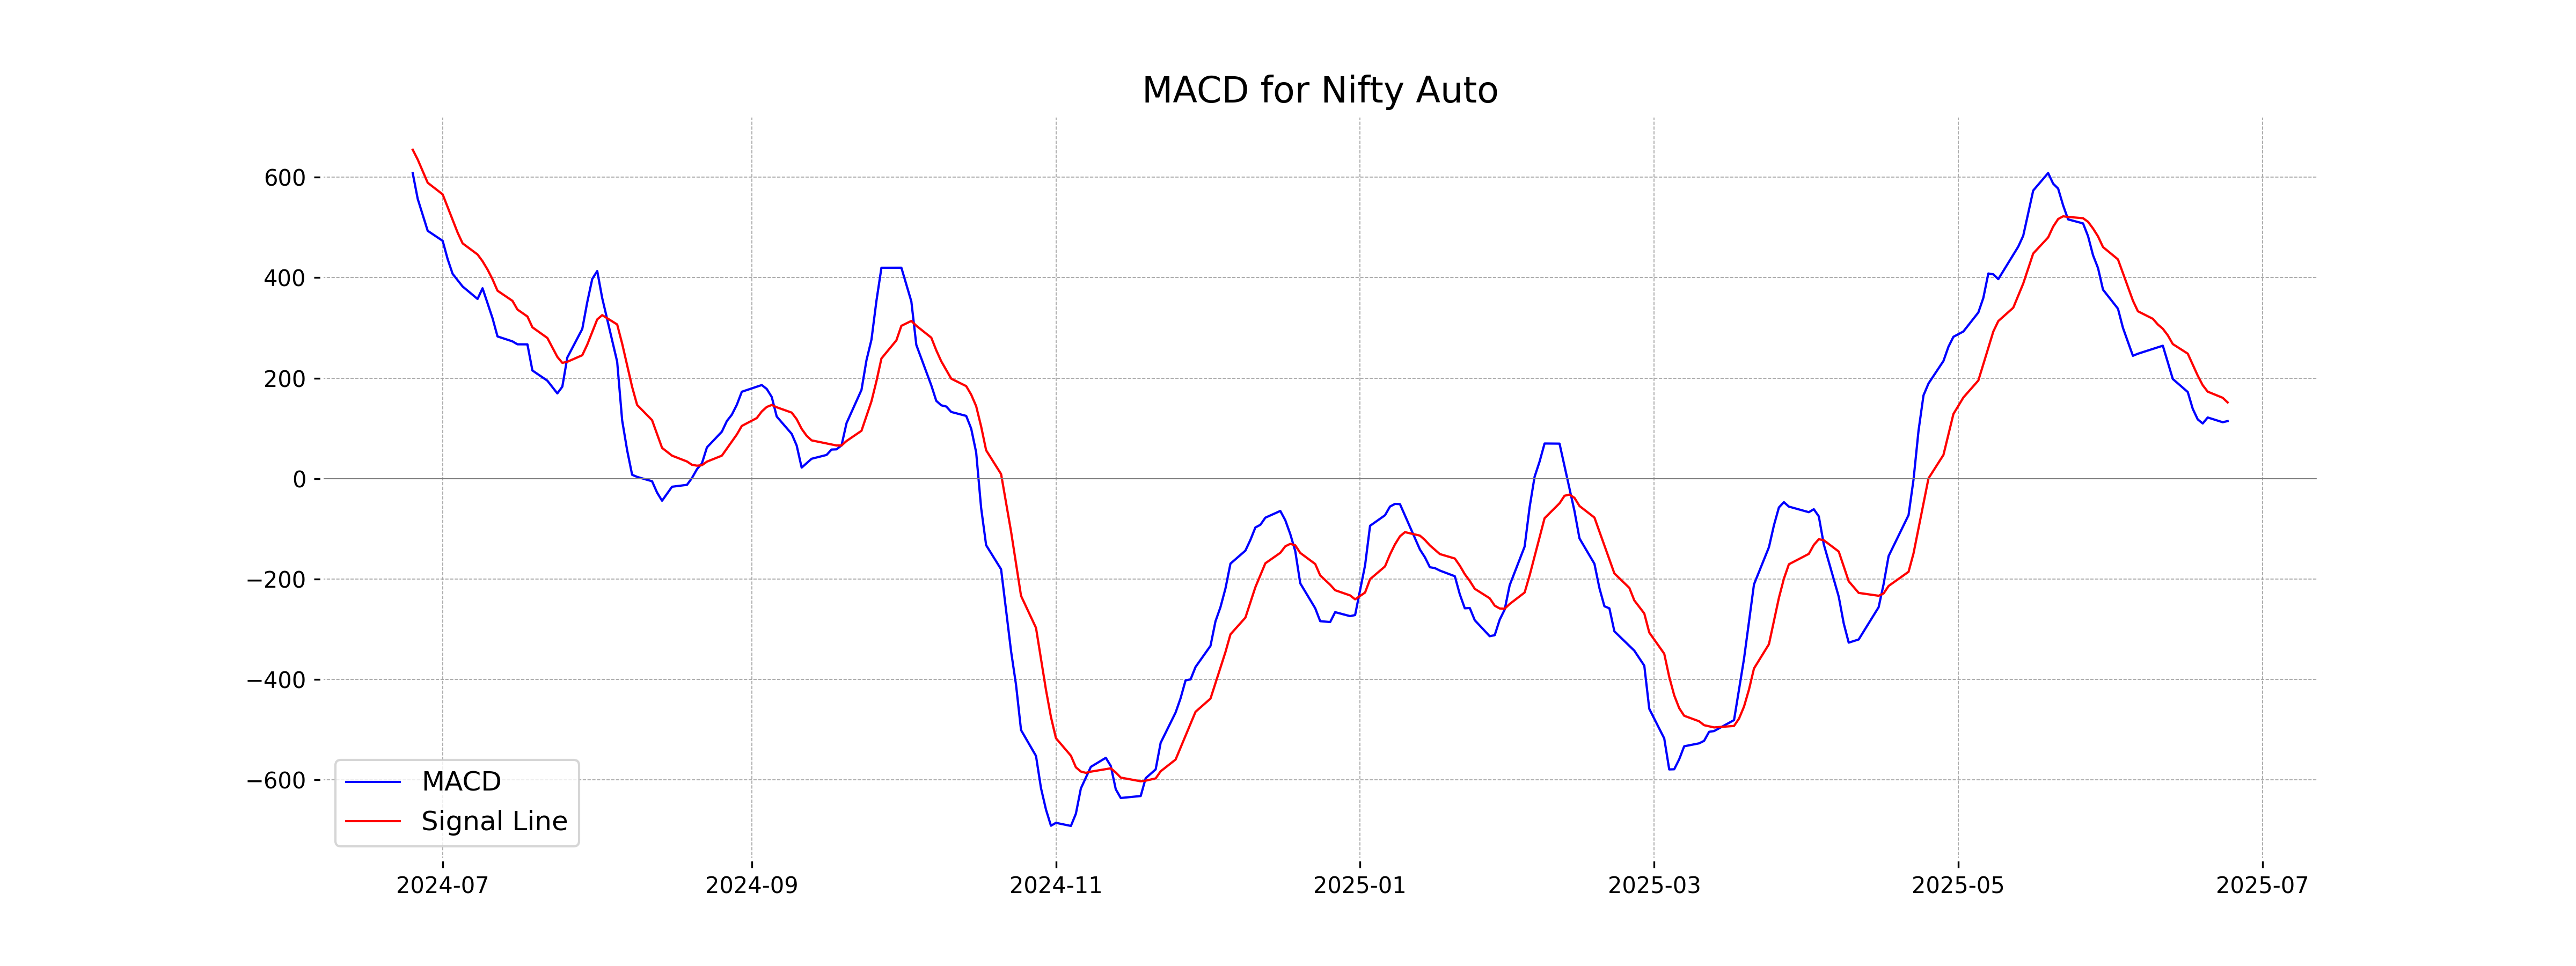
Moving Averages Trend (MACD)
Based on the provided data, the MACD value for Nifty Auto is 114.37, which is below the MACD Signal value of 151.52. This indicates a bearish trend, suggesting a potential downtrend or consolidation phase for Nifty Auto.
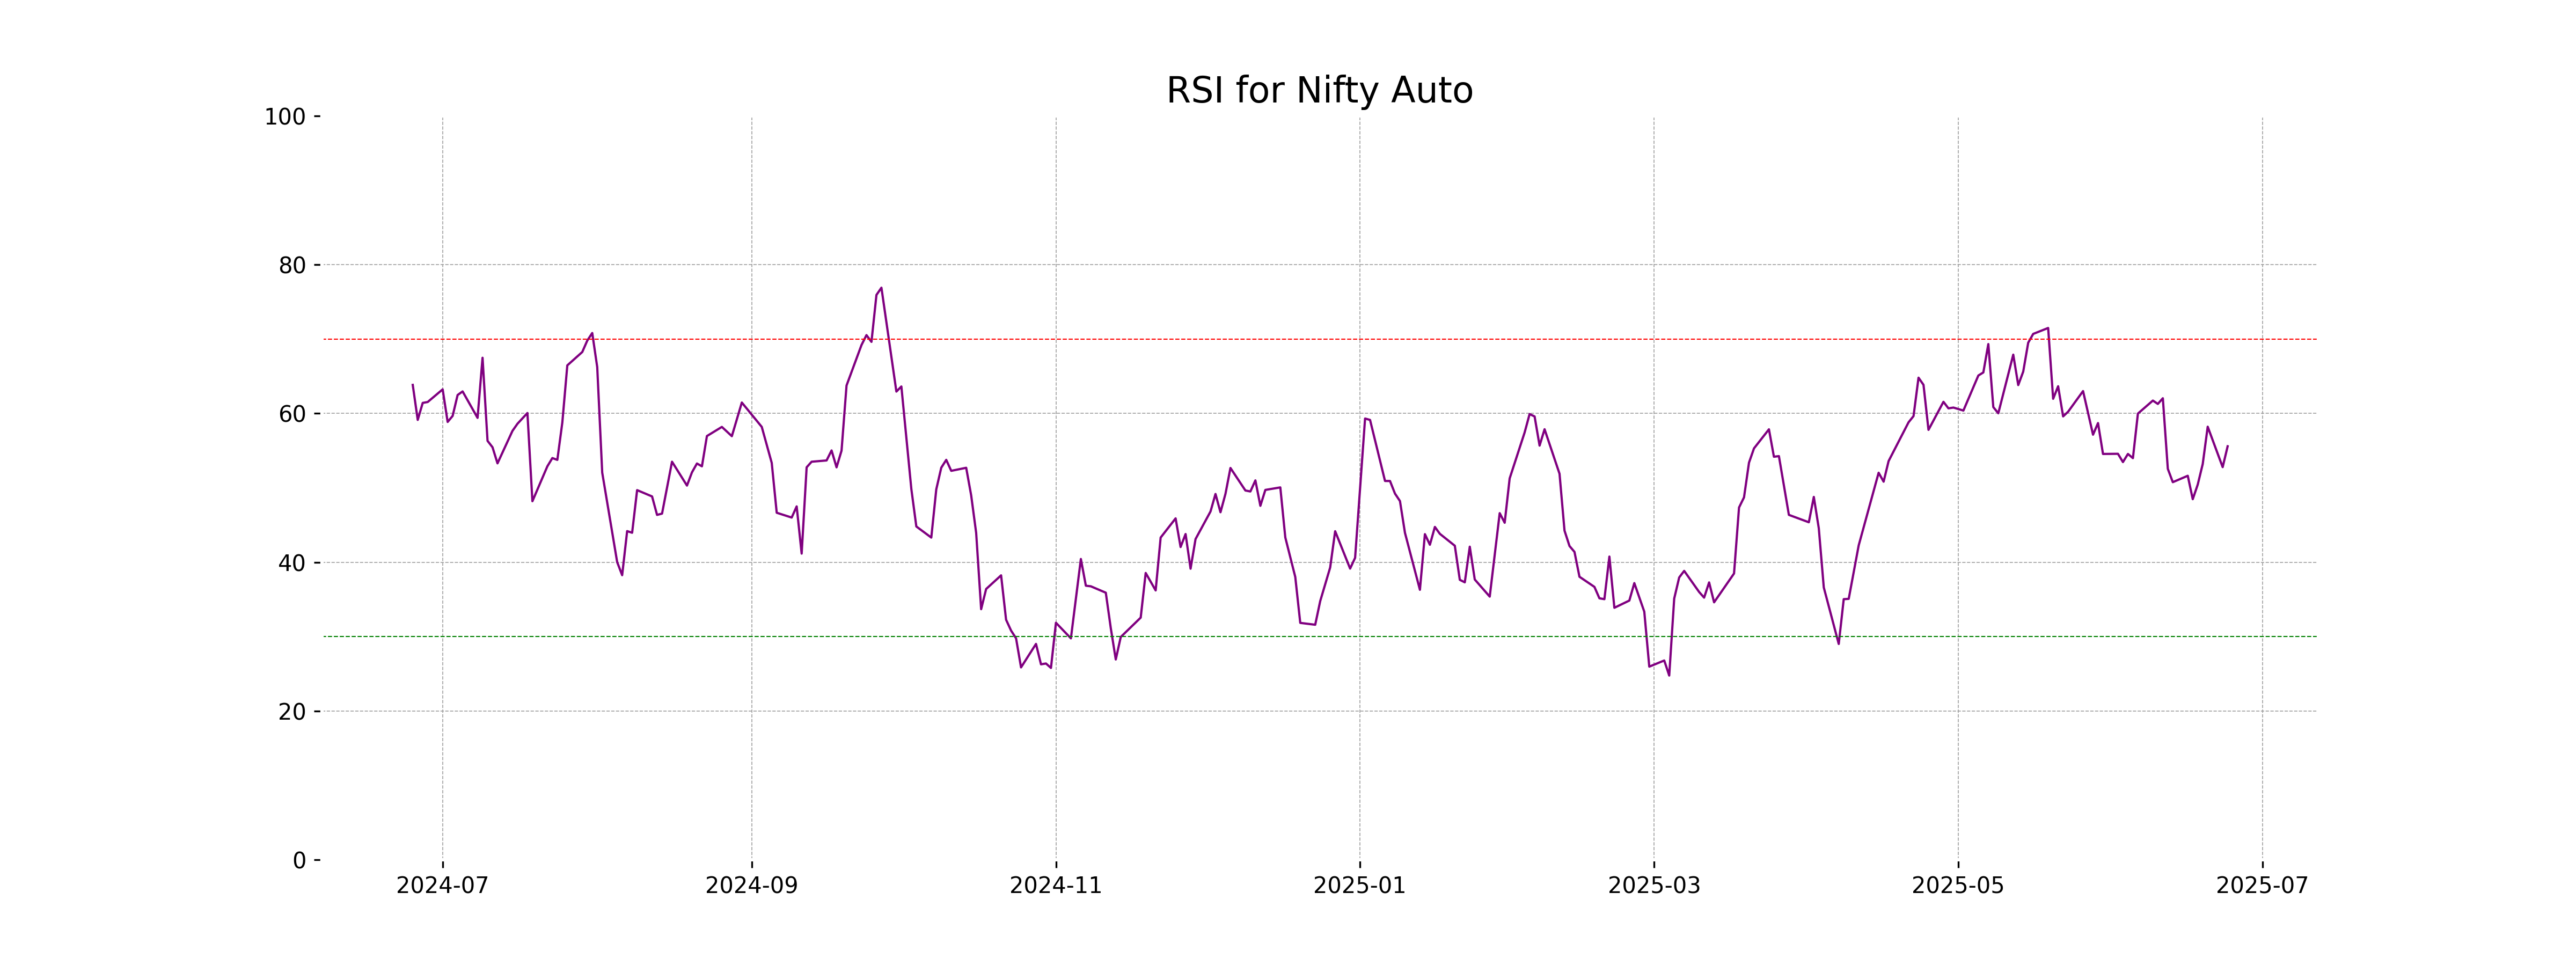
RSI Analysis
RSI Analysis for Nifty Auto: The RSI (Relative Strength Index) of Nifty Auto is 55.59, indicating a neutral stance. An RSI value between 30 and 70 typically suggests that the stock is neither overbought nor oversold, implying potential stability with no immediate strong buying or selling pressures.
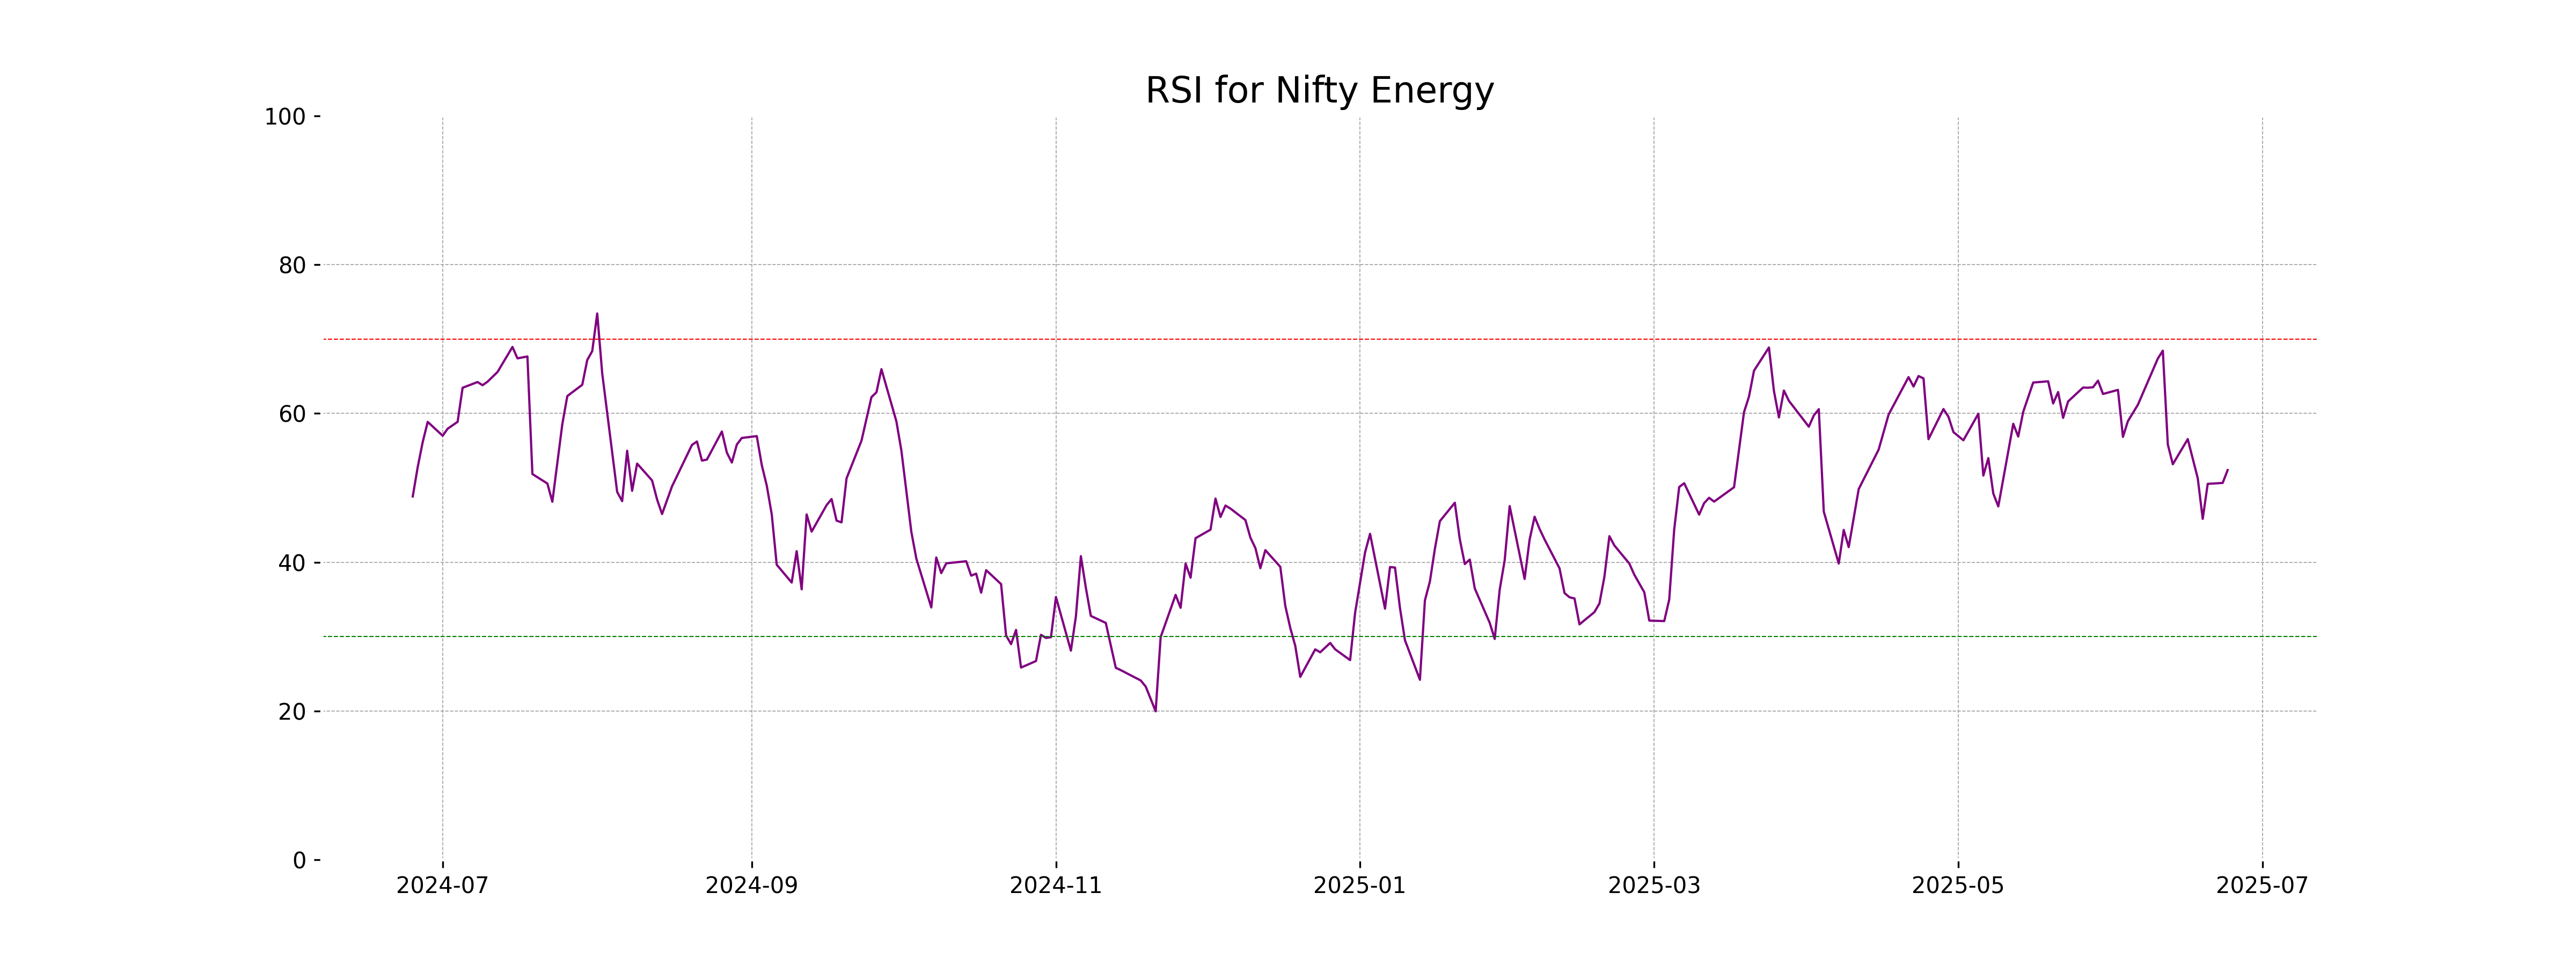
Analysis for Nifty Energy - June 24, 2025
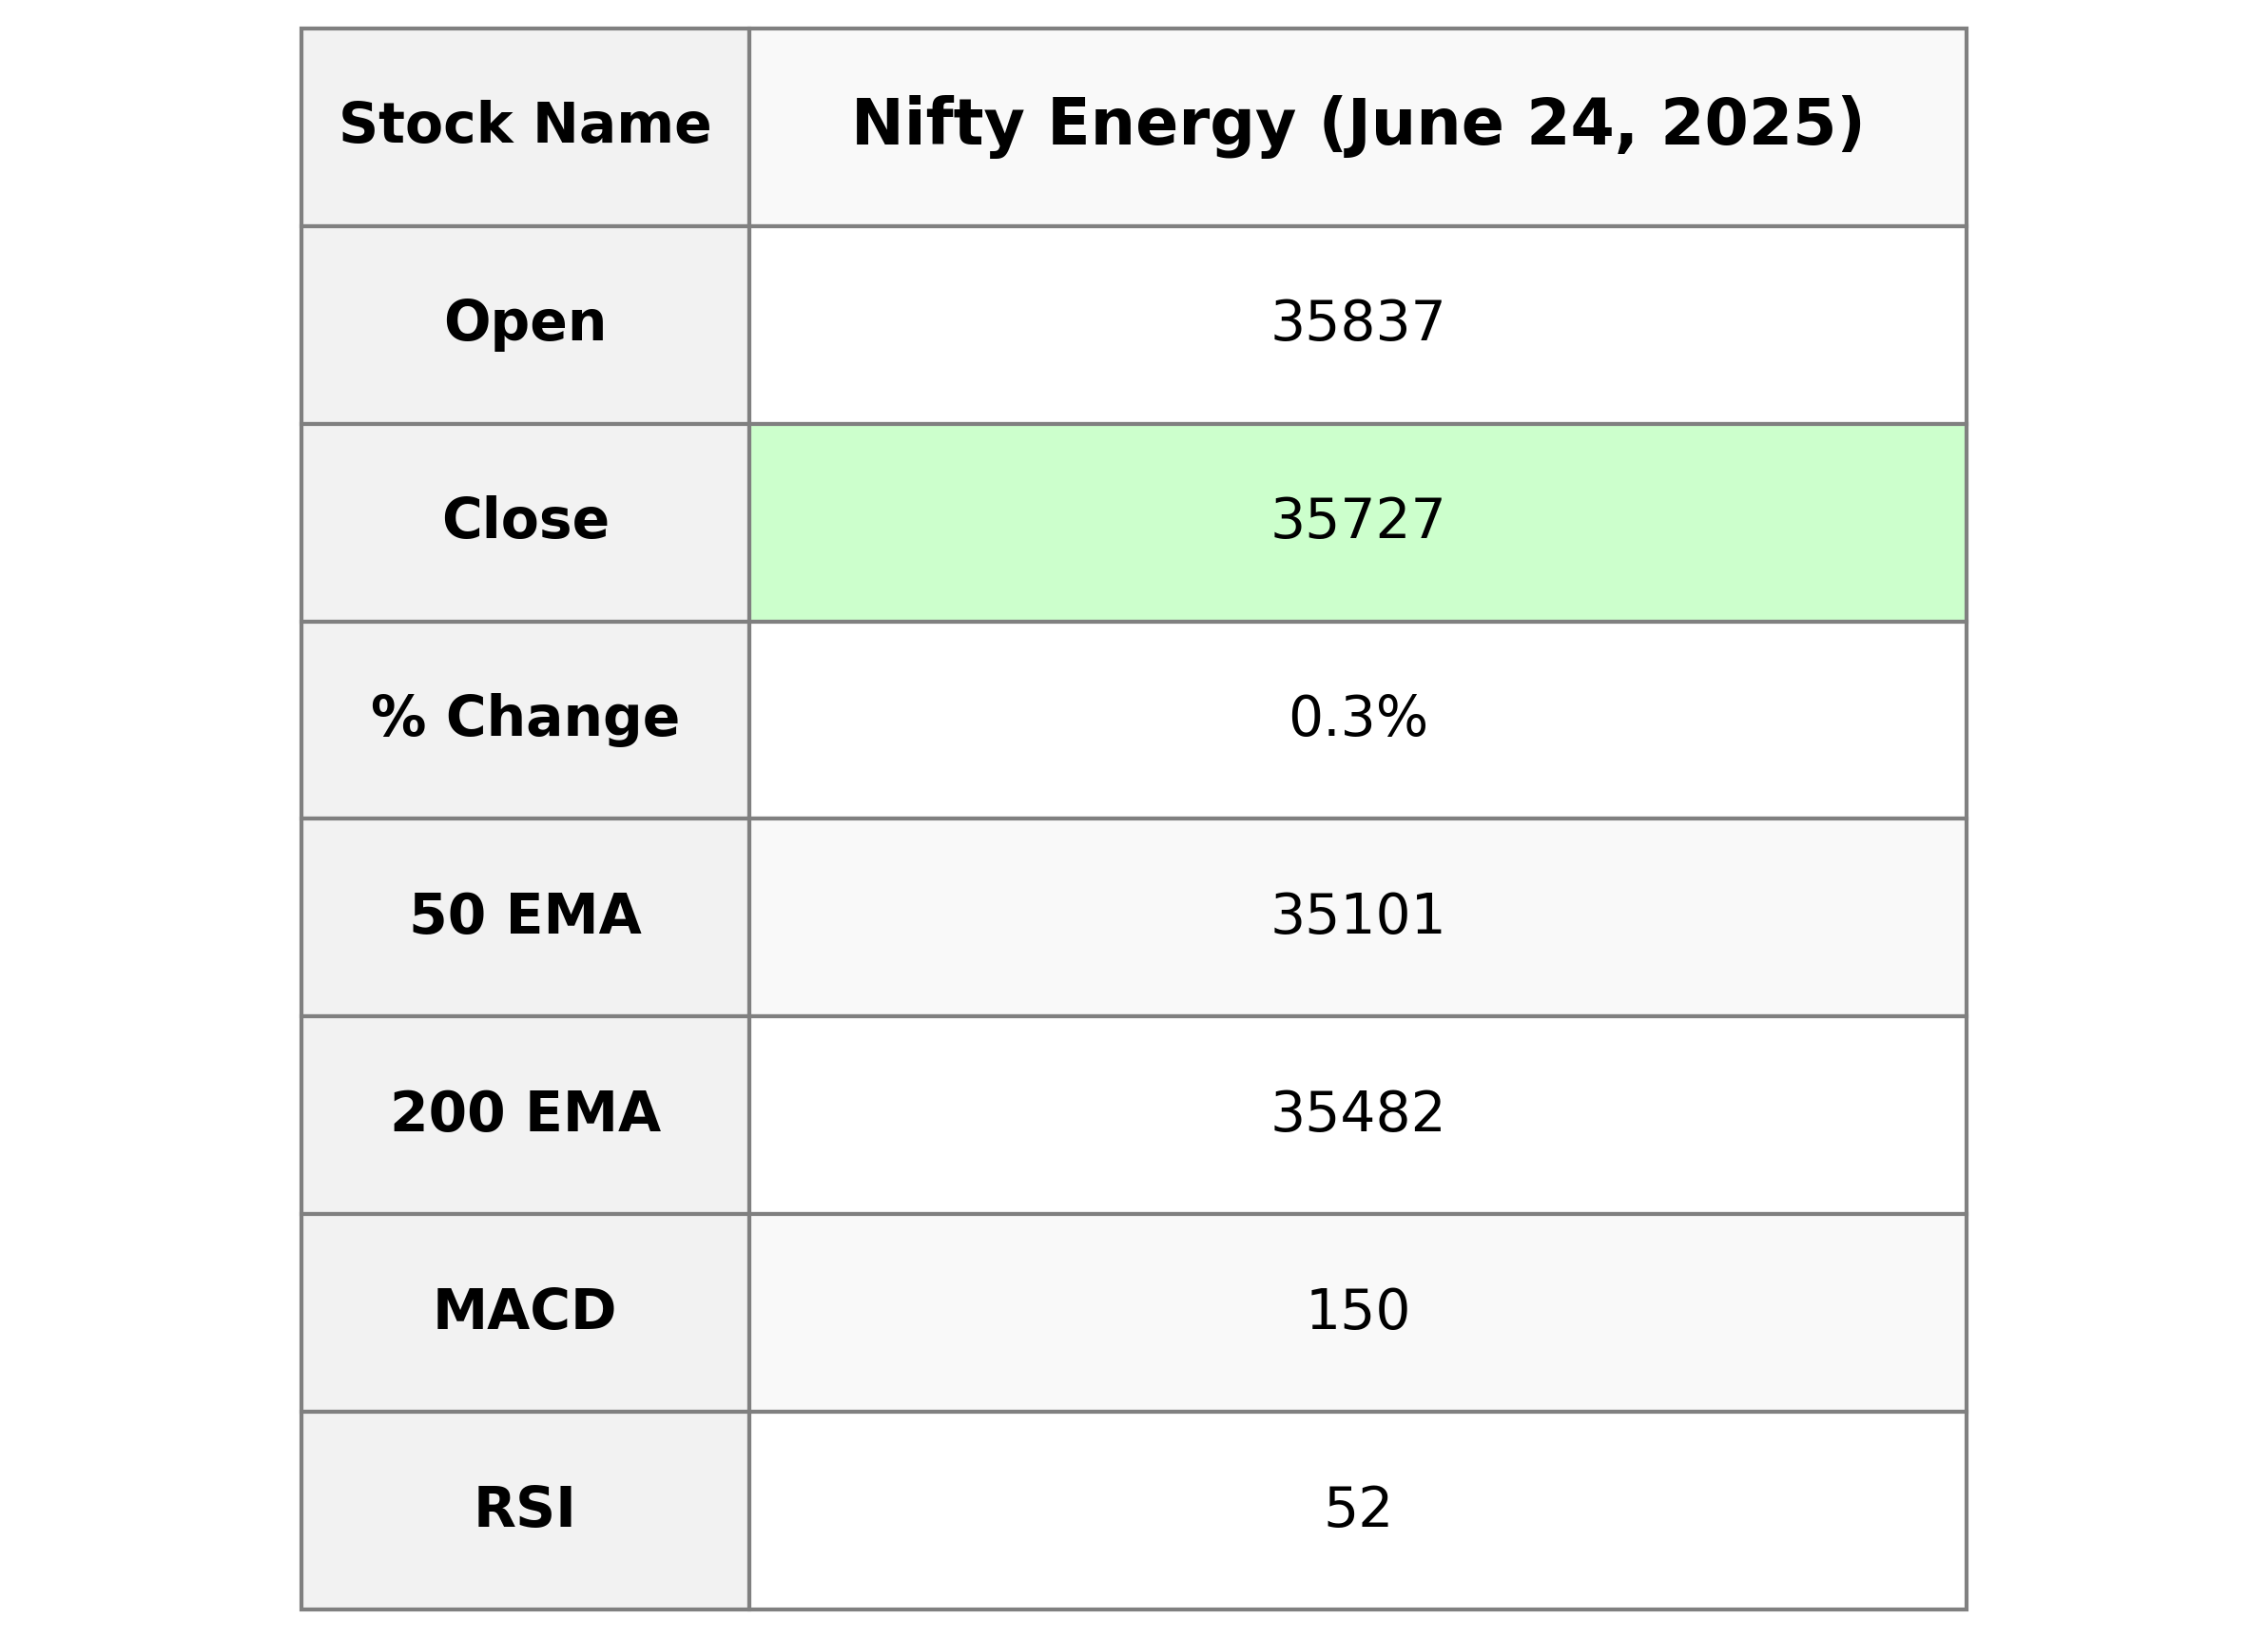
Nifty Energy Performance: On the latest trading day, Nifty Energy opened at 35,836.70, reaching a high of 35,952.80 and a low of 35,627.45, closing at 35,727.05. It experienced a percentage change of 0.33% with a points change of 118.10. The RSI value is 52.39, suggesting a relatively balanced demand and supply, while the MACD value of 150.32 indicates a downward momentum compared to its signal line of 272.80.
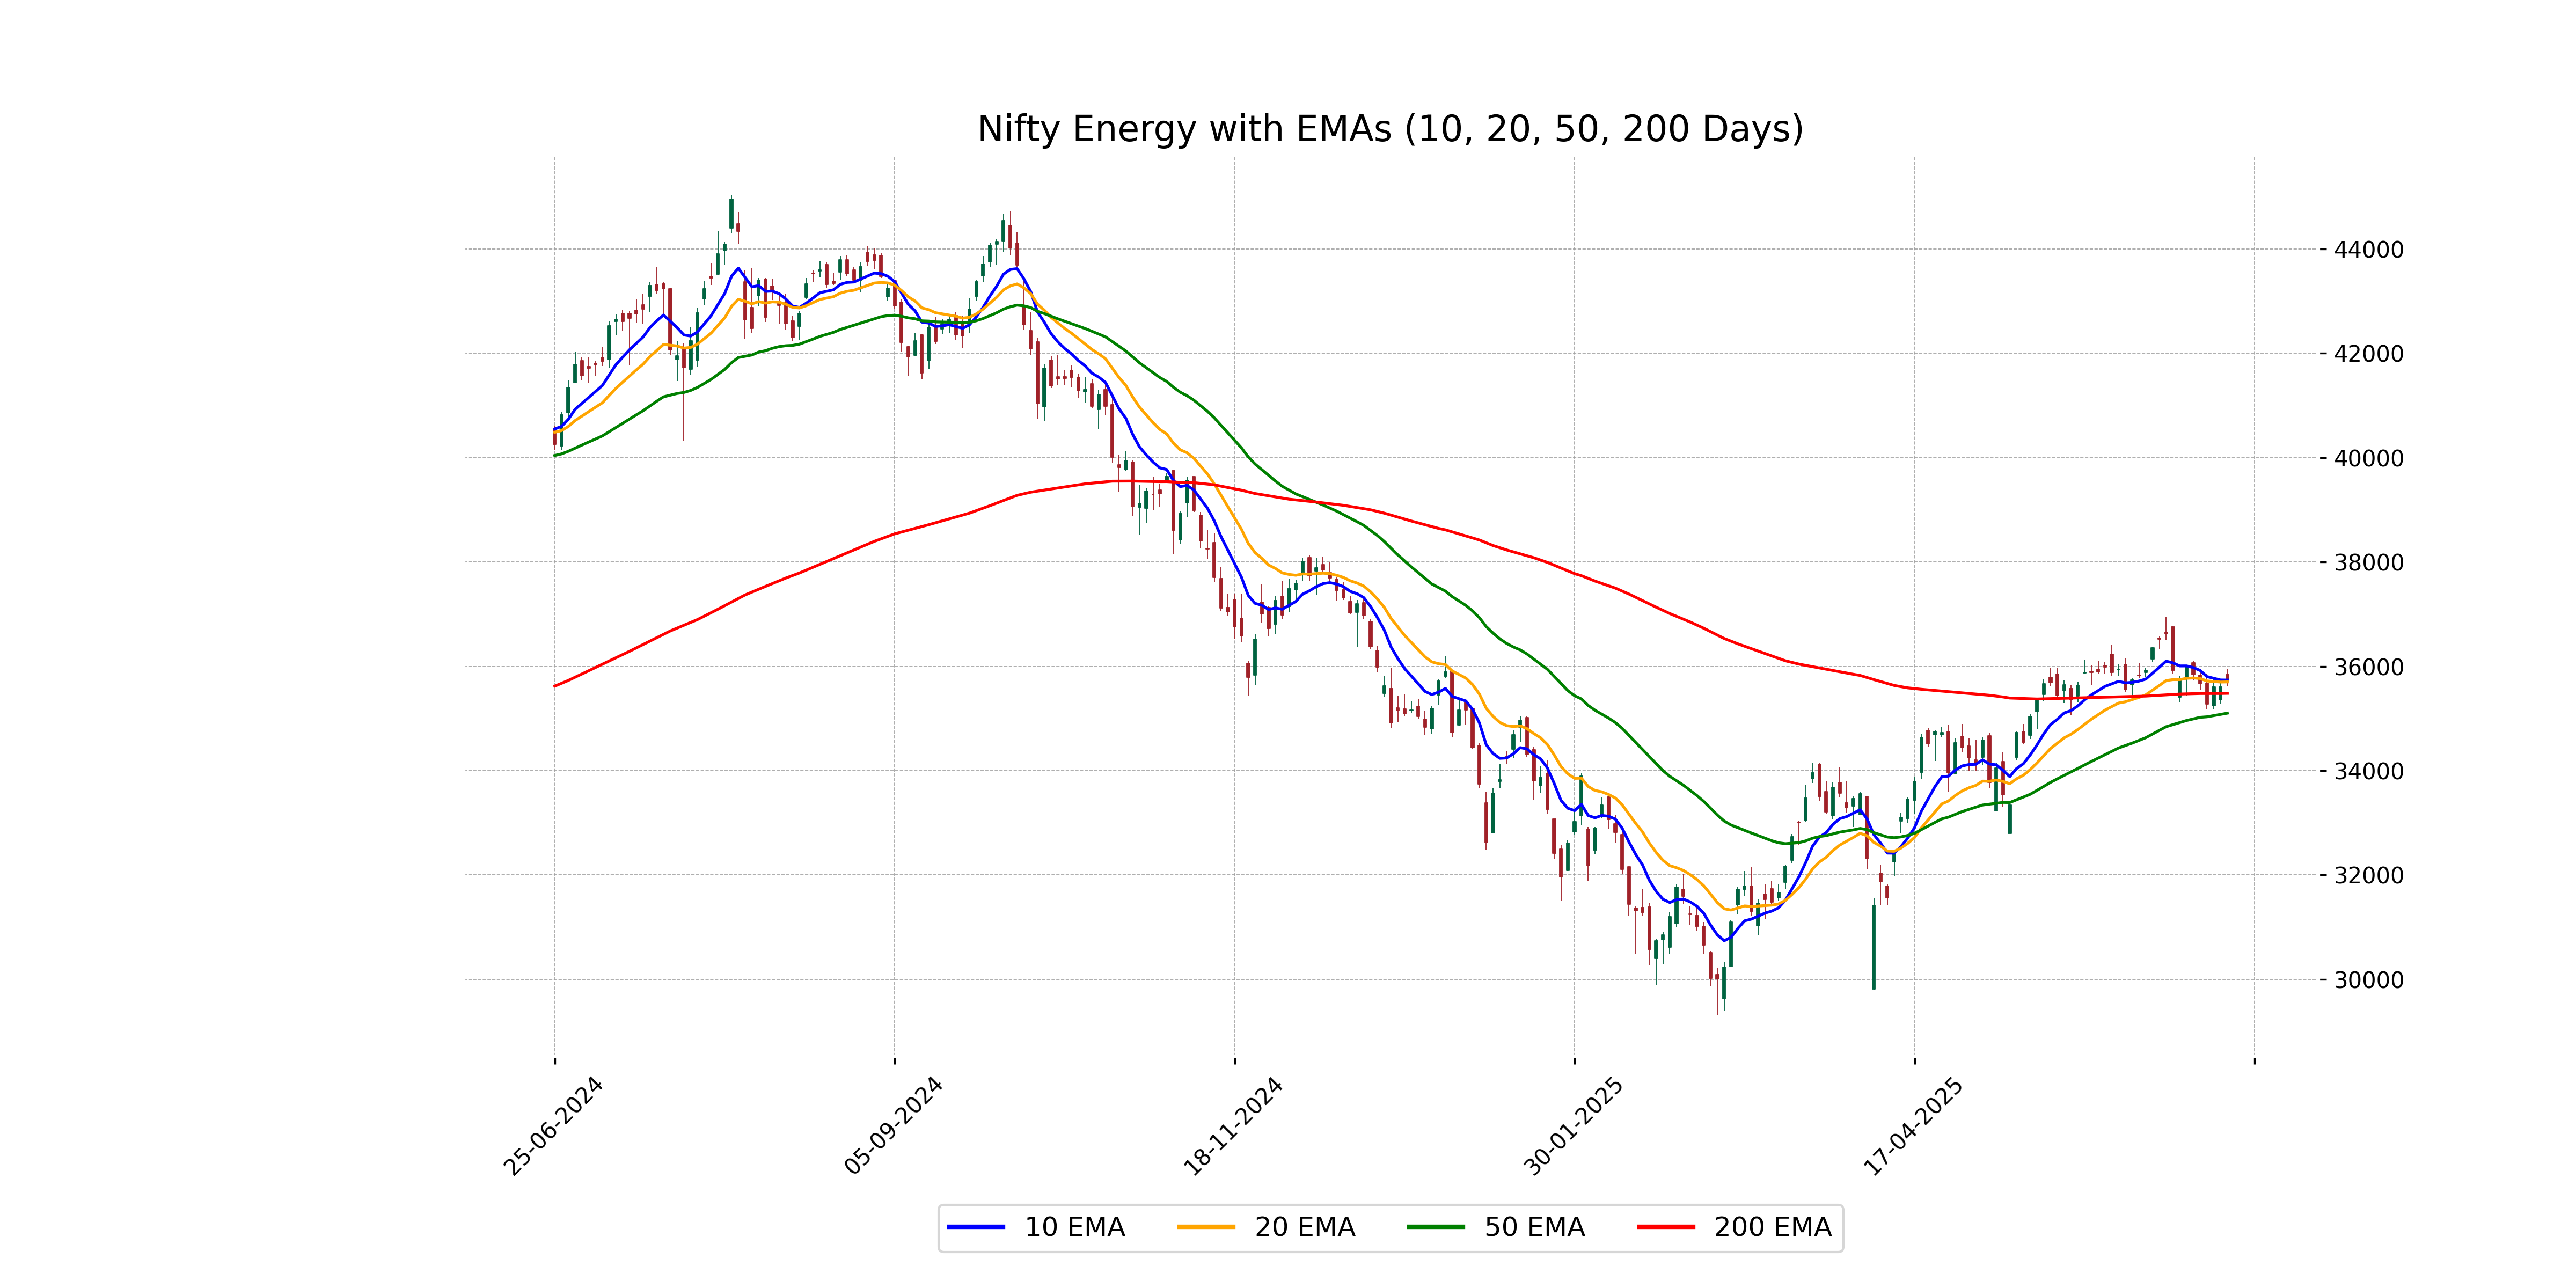
Relationship with Key Moving Averages
The Nifty Energy index closed at 35727.05, which is slightly above its 20-day EMA of 35700.69 but slightly below its 10-day EMA of 35735.37. It's also higher than the 50-day EMA of 35101.13 and the 200-day EMA of 35481.67, indicating a short-term uptrend relative to longer moving averages.
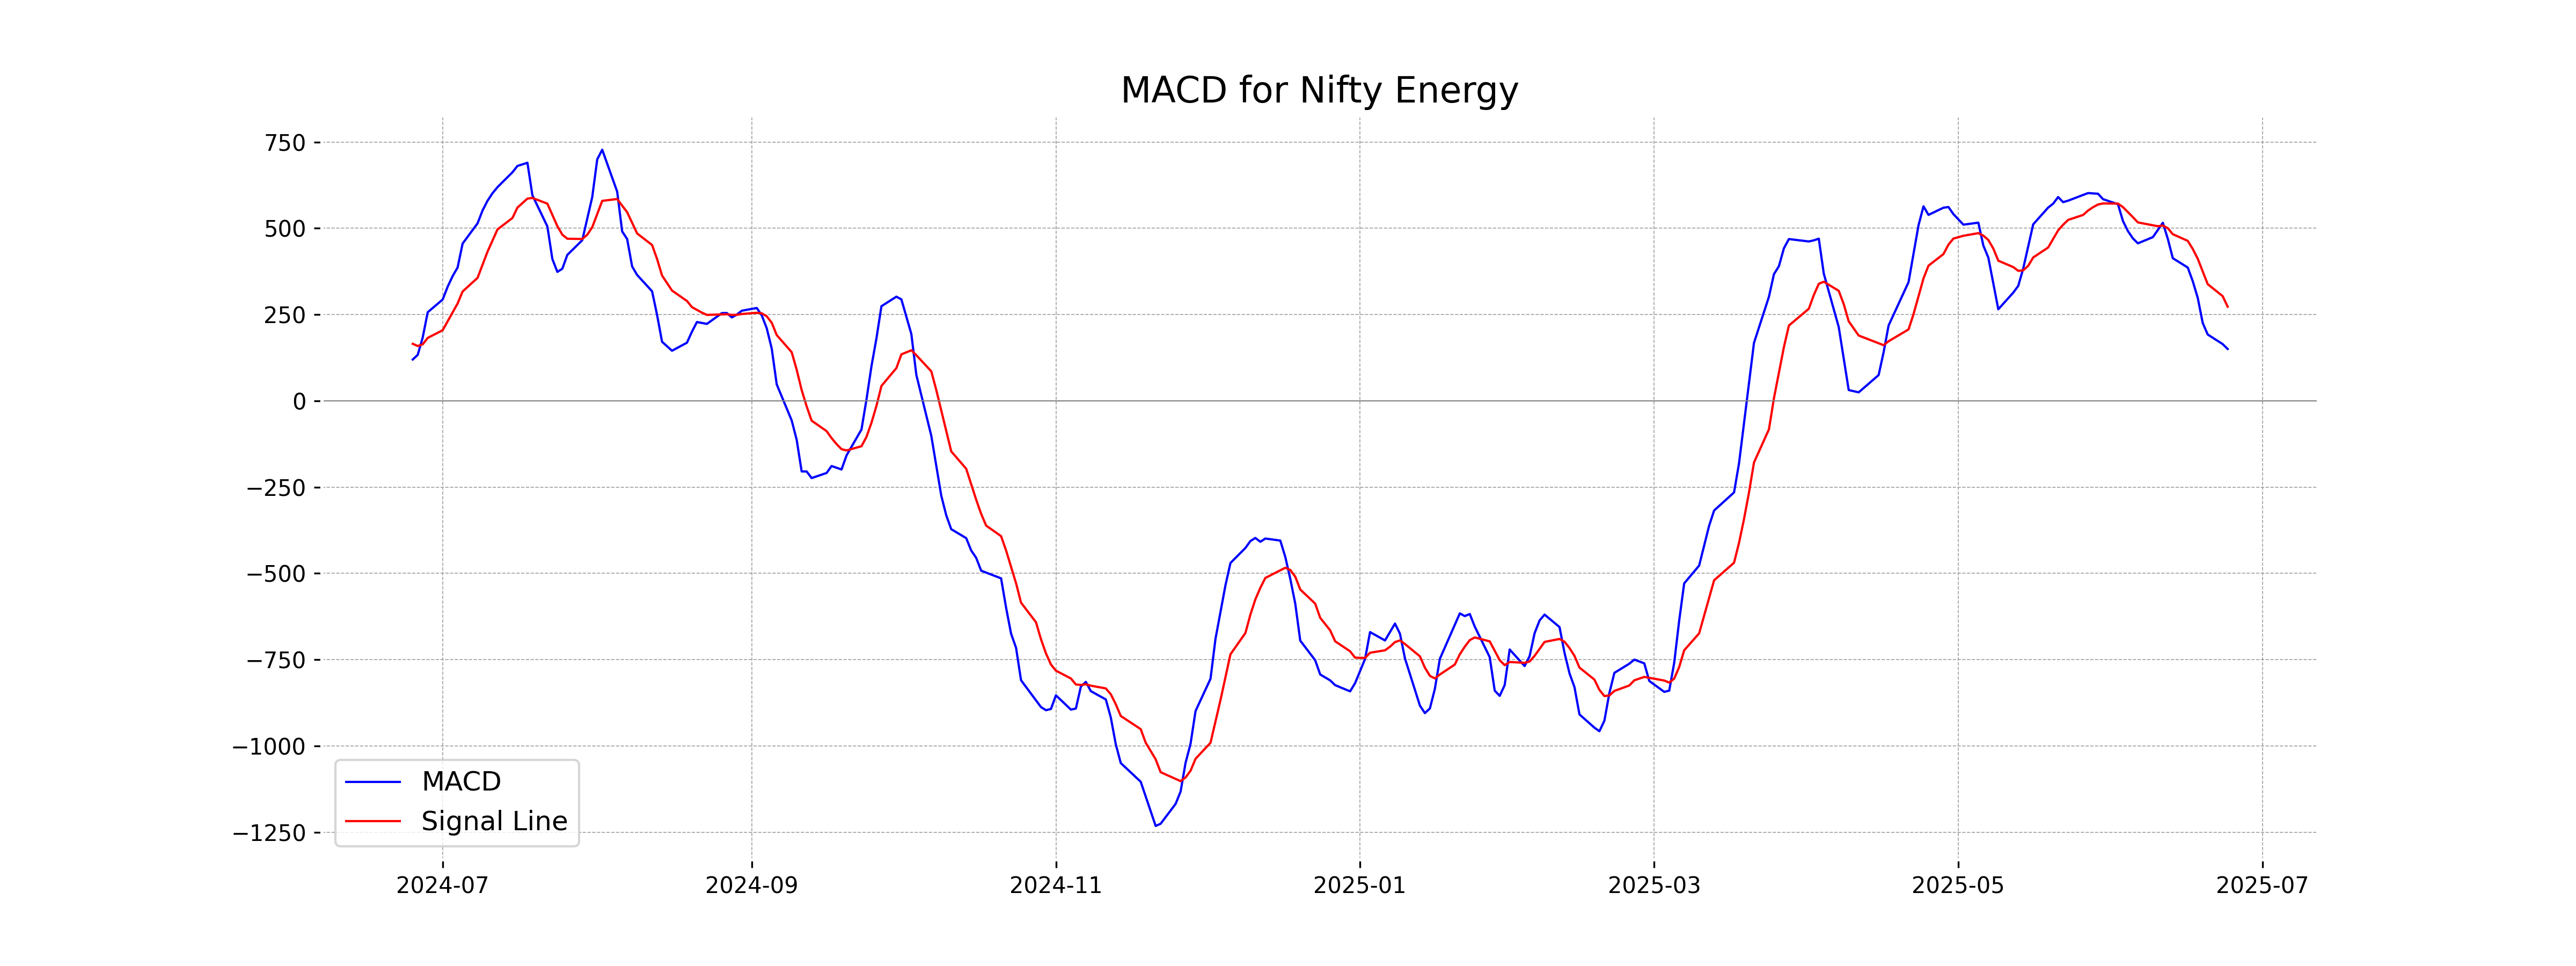
Moving Averages Trend (MACD)
Based on the MACD data for Nifty Energy, the MACD value is 150.32, while the MACD Signal is 272.80. This indicates a bearish signal as the MACD line is below the Signal line, suggesting potential downside momentum.
RSI Analysis
Nifty Energy RSI Analysis: Based on the available data, the Relative Strength Index (RSI) for Nifty Energy is 52.39. This suggests the stock is in a neutral zone, indicating neither overbought nor oversold conditions. Investors may view this as a balanced point where trend continuation in either direction can occur.
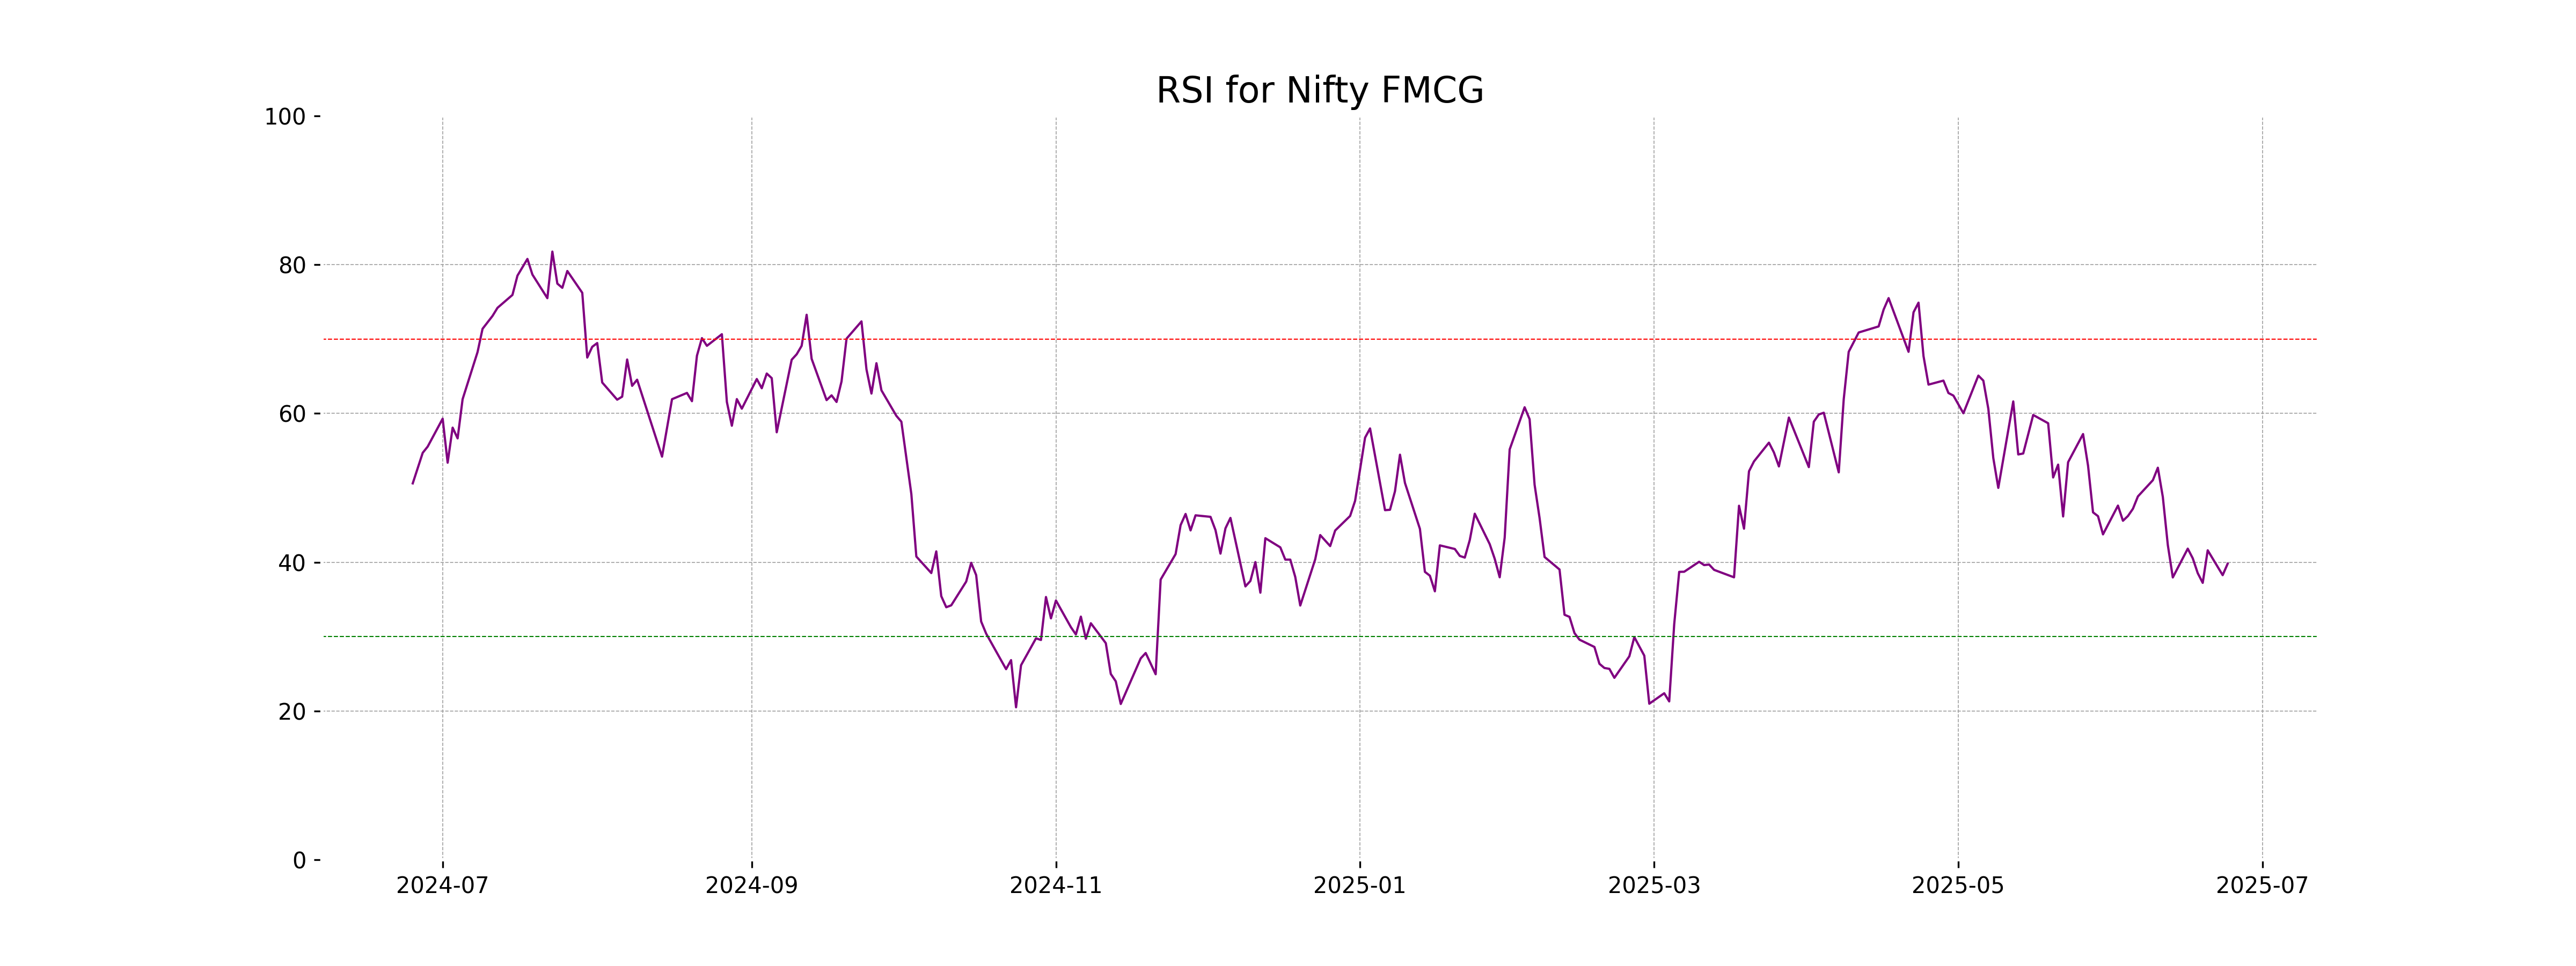
Analysis for Nifty FMCG - June 24, 2025
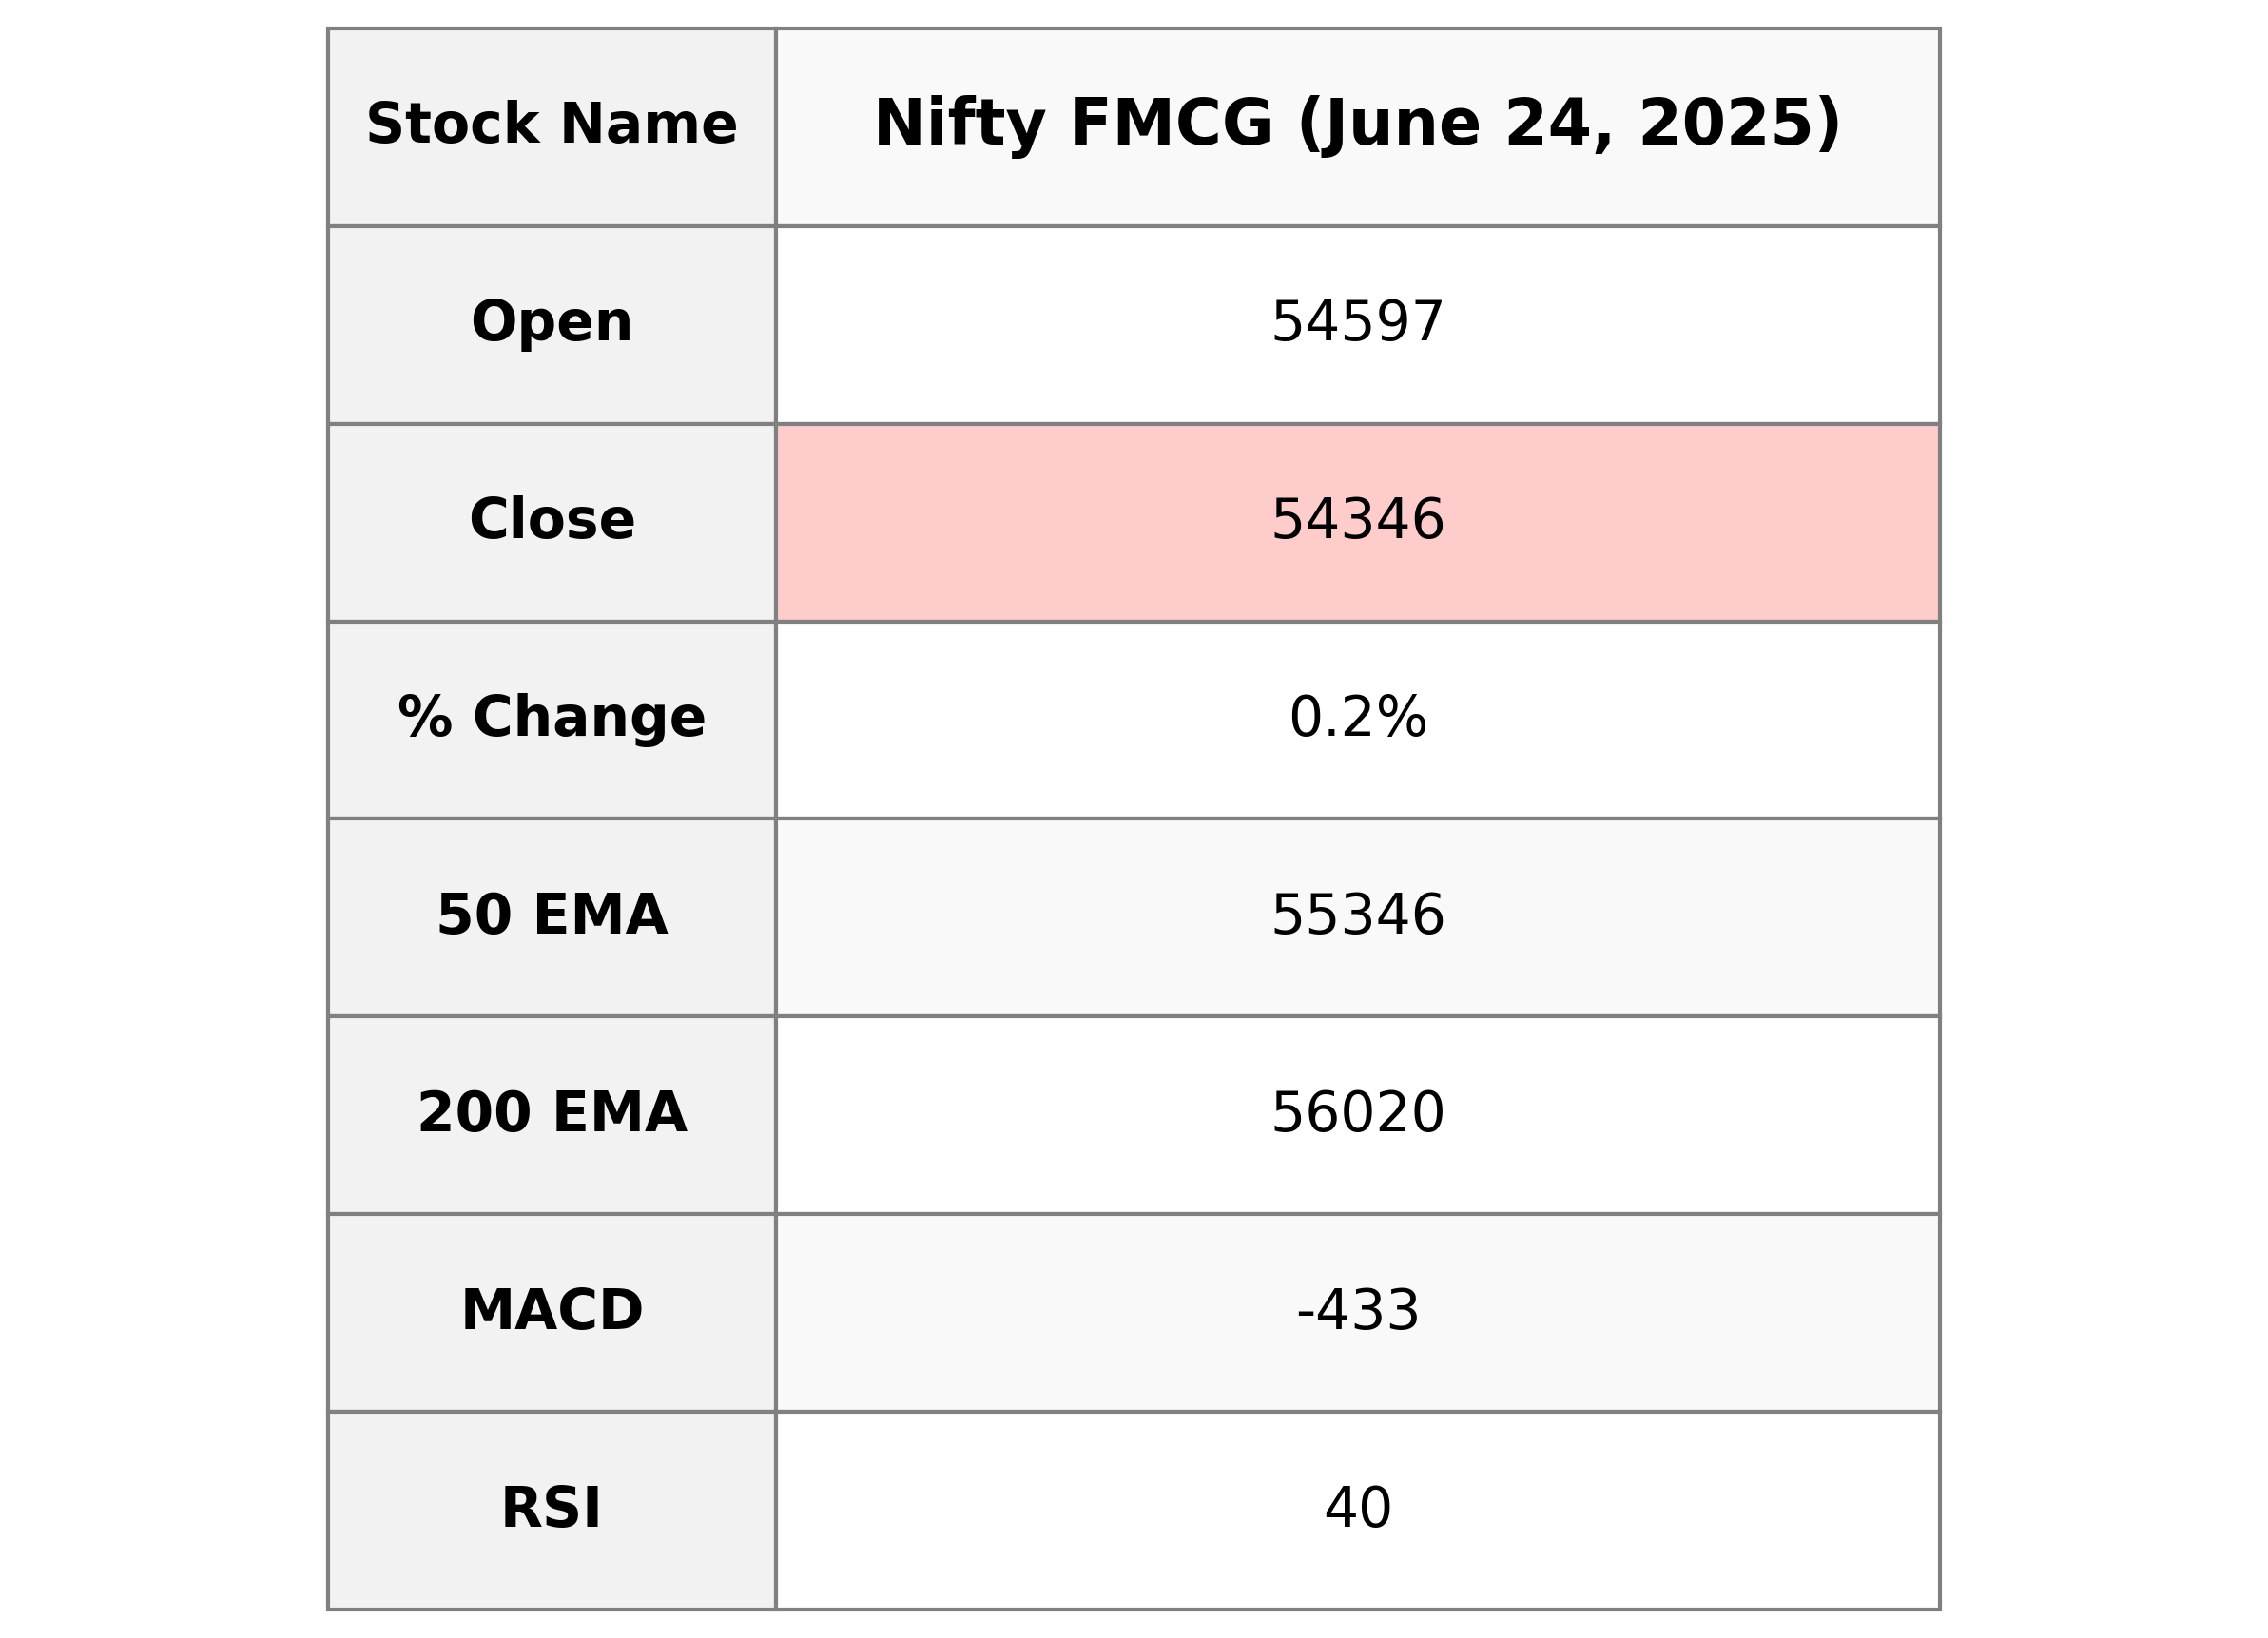
Nifty FMCG Performance Summary: Nifty FMCG opened at 54,597 and closed slightly higher at 54,346, showing a positive change of 0.22%. Although the day's high was 54,792, the index is trading below crucial EMAs with a 10 EMA at 54,707, indicating a bearish sentiment. The RSI of 39.8 suggests that the market is under pressure, and the MACD indicates a bearish trend as it is below the signal line.
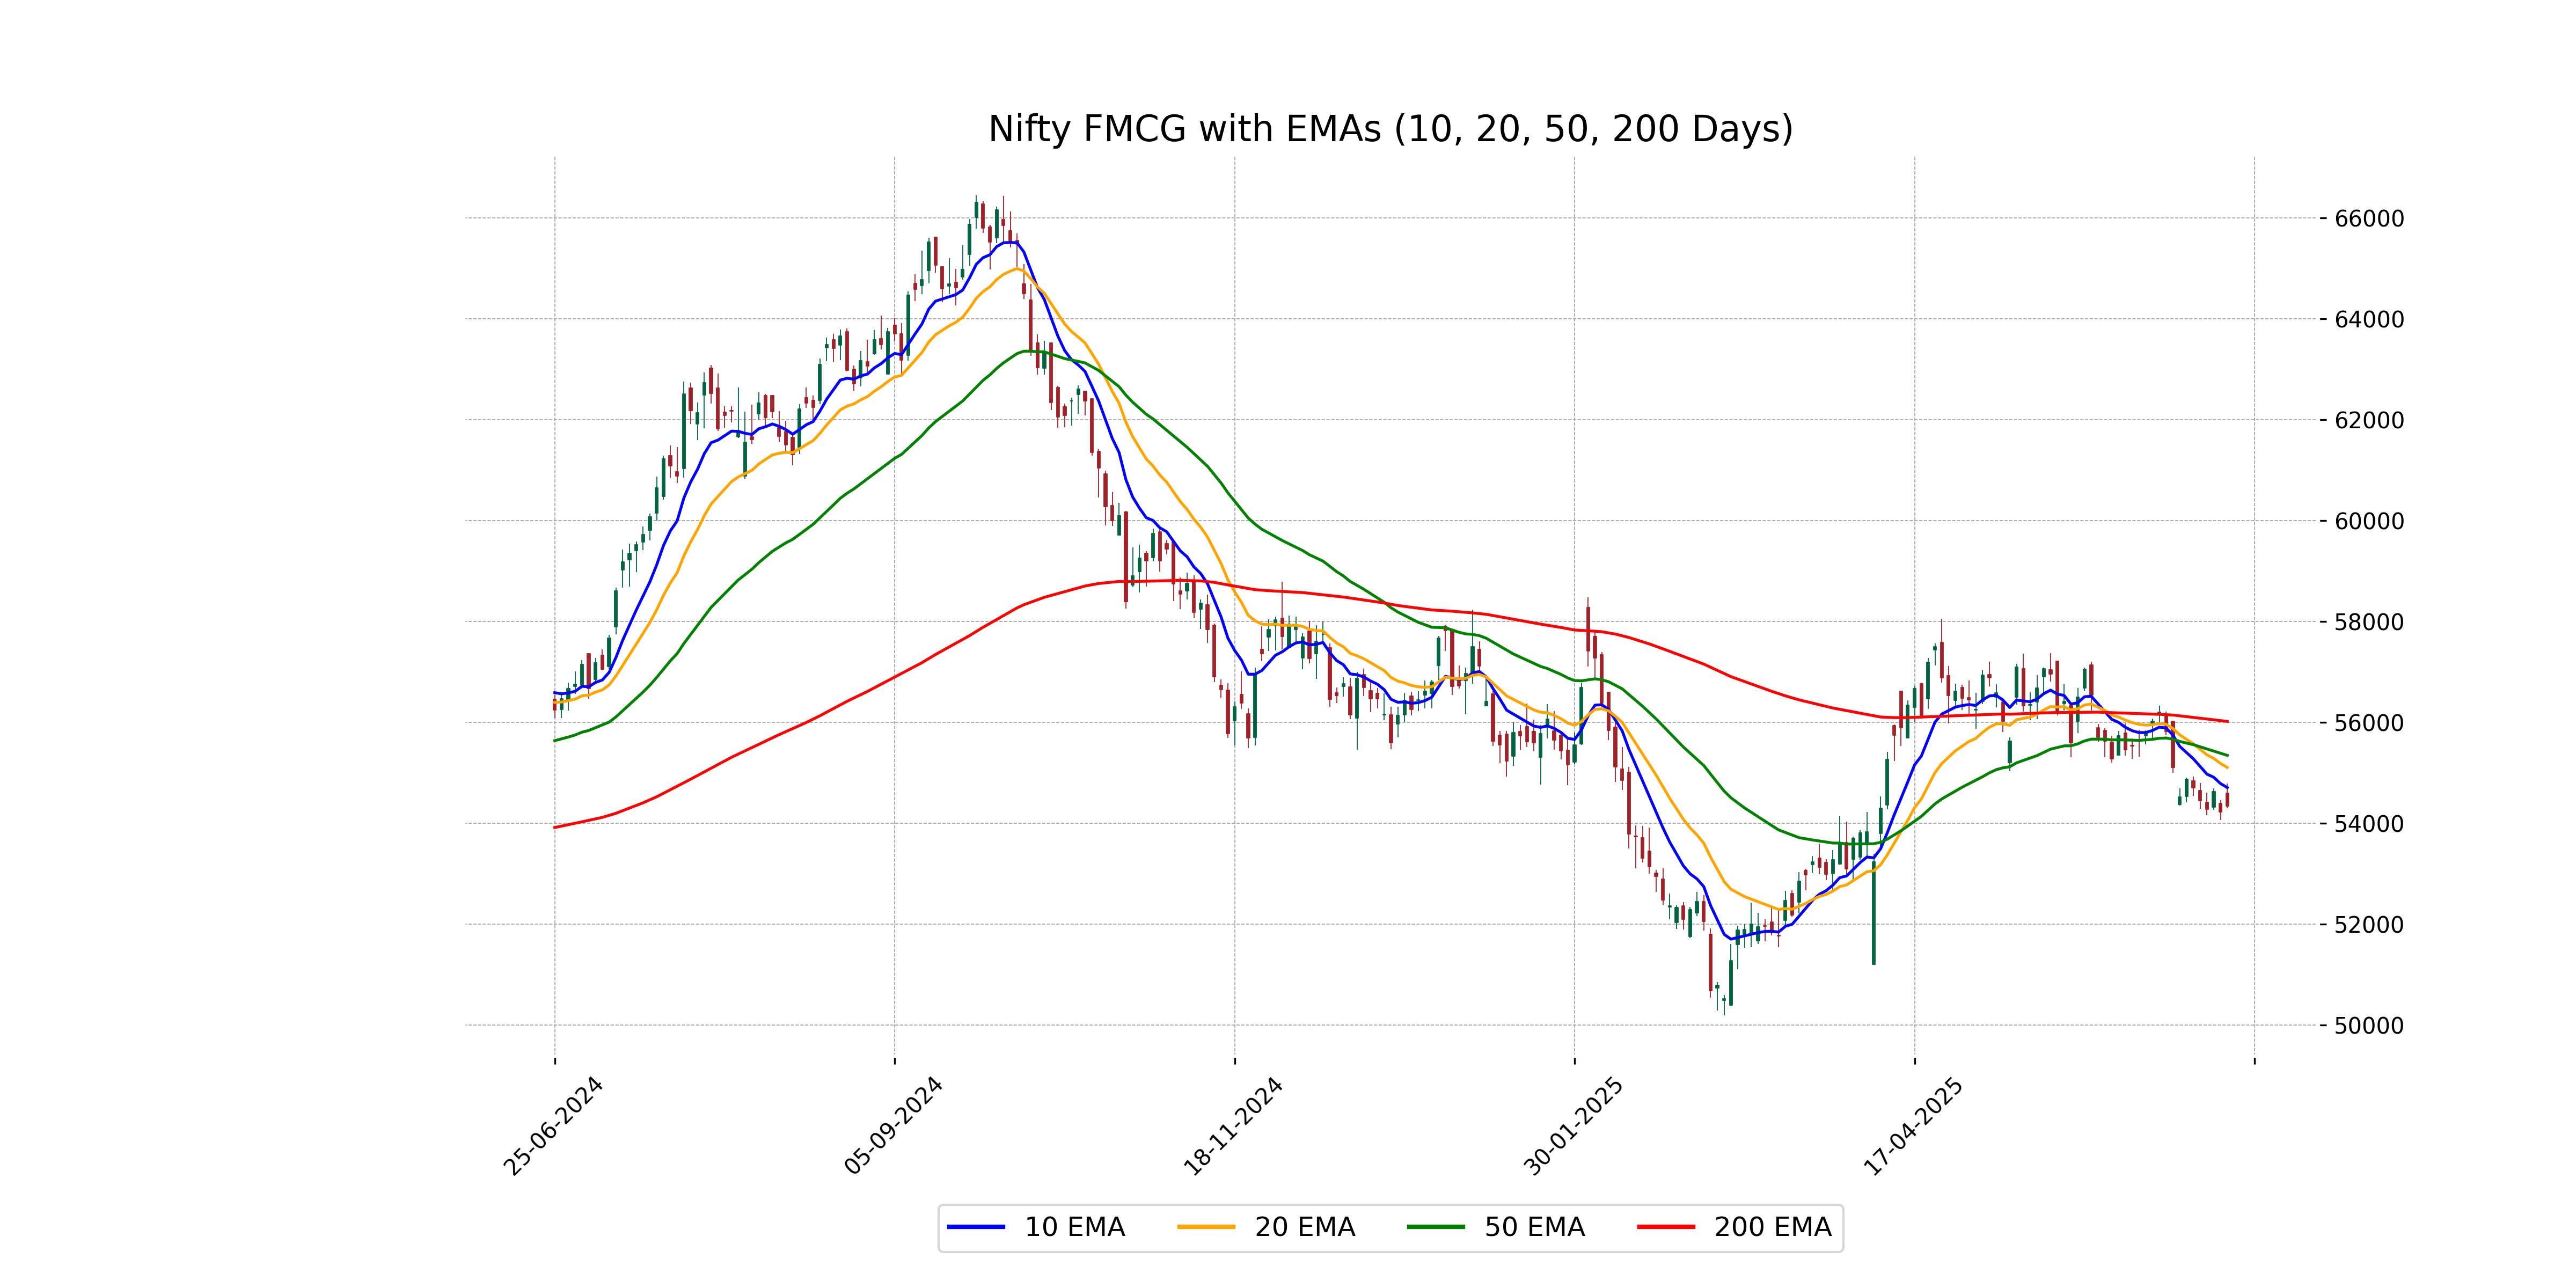
Relationship with Key Moving Averages
Nifty FMCG closed below its 10 EMA, 20 EMA, and 50 EMA, indicating a short to medium-term bearish trend. The close price of 54,346.30 is lower than all these key moving averages, signifying potential downside pressure.
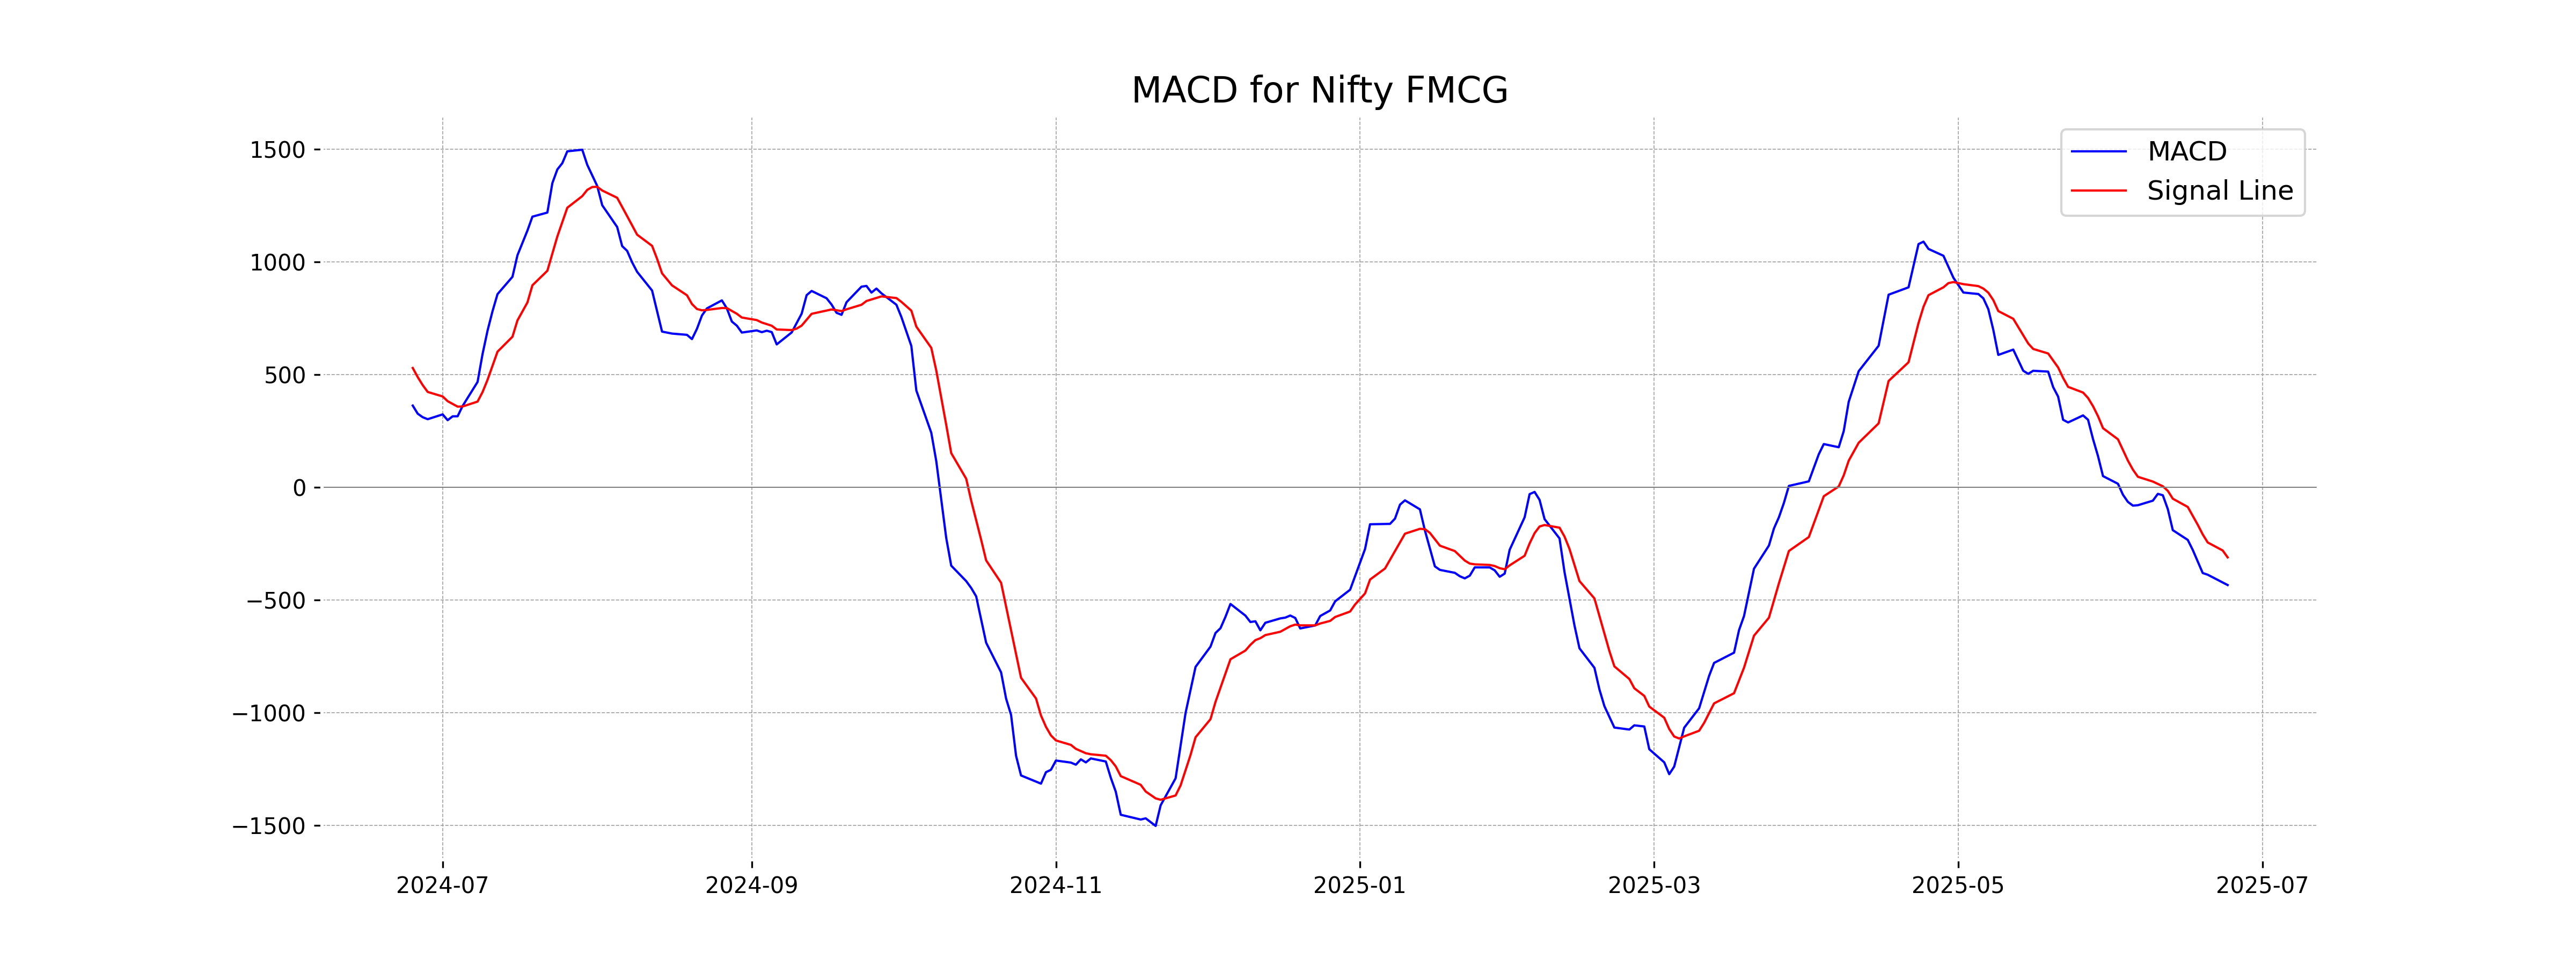
Moving Averages Trend (MACD)
The MACD for Nifty FMCG is negative at -433.26, indicating a bearish trend as it's below the signal line of -310.54. This suggests that the momentum is currently favoring the bears, and a potential further decline in prices could be anticipated unless there is a positive reversal.
RSI Analysis
The RSI for Nifty FMCG is 39.80, indicating that the stock is approaching oversold conditions. This suggests that the stock may be undervalued and could experience a potential reversal or buying opportunity if it continues to decrease. However, it's important to analyze additional indicators and market conditions for a comprehensive assessment.
Analysis for Nifty Infra - June 24, 2025
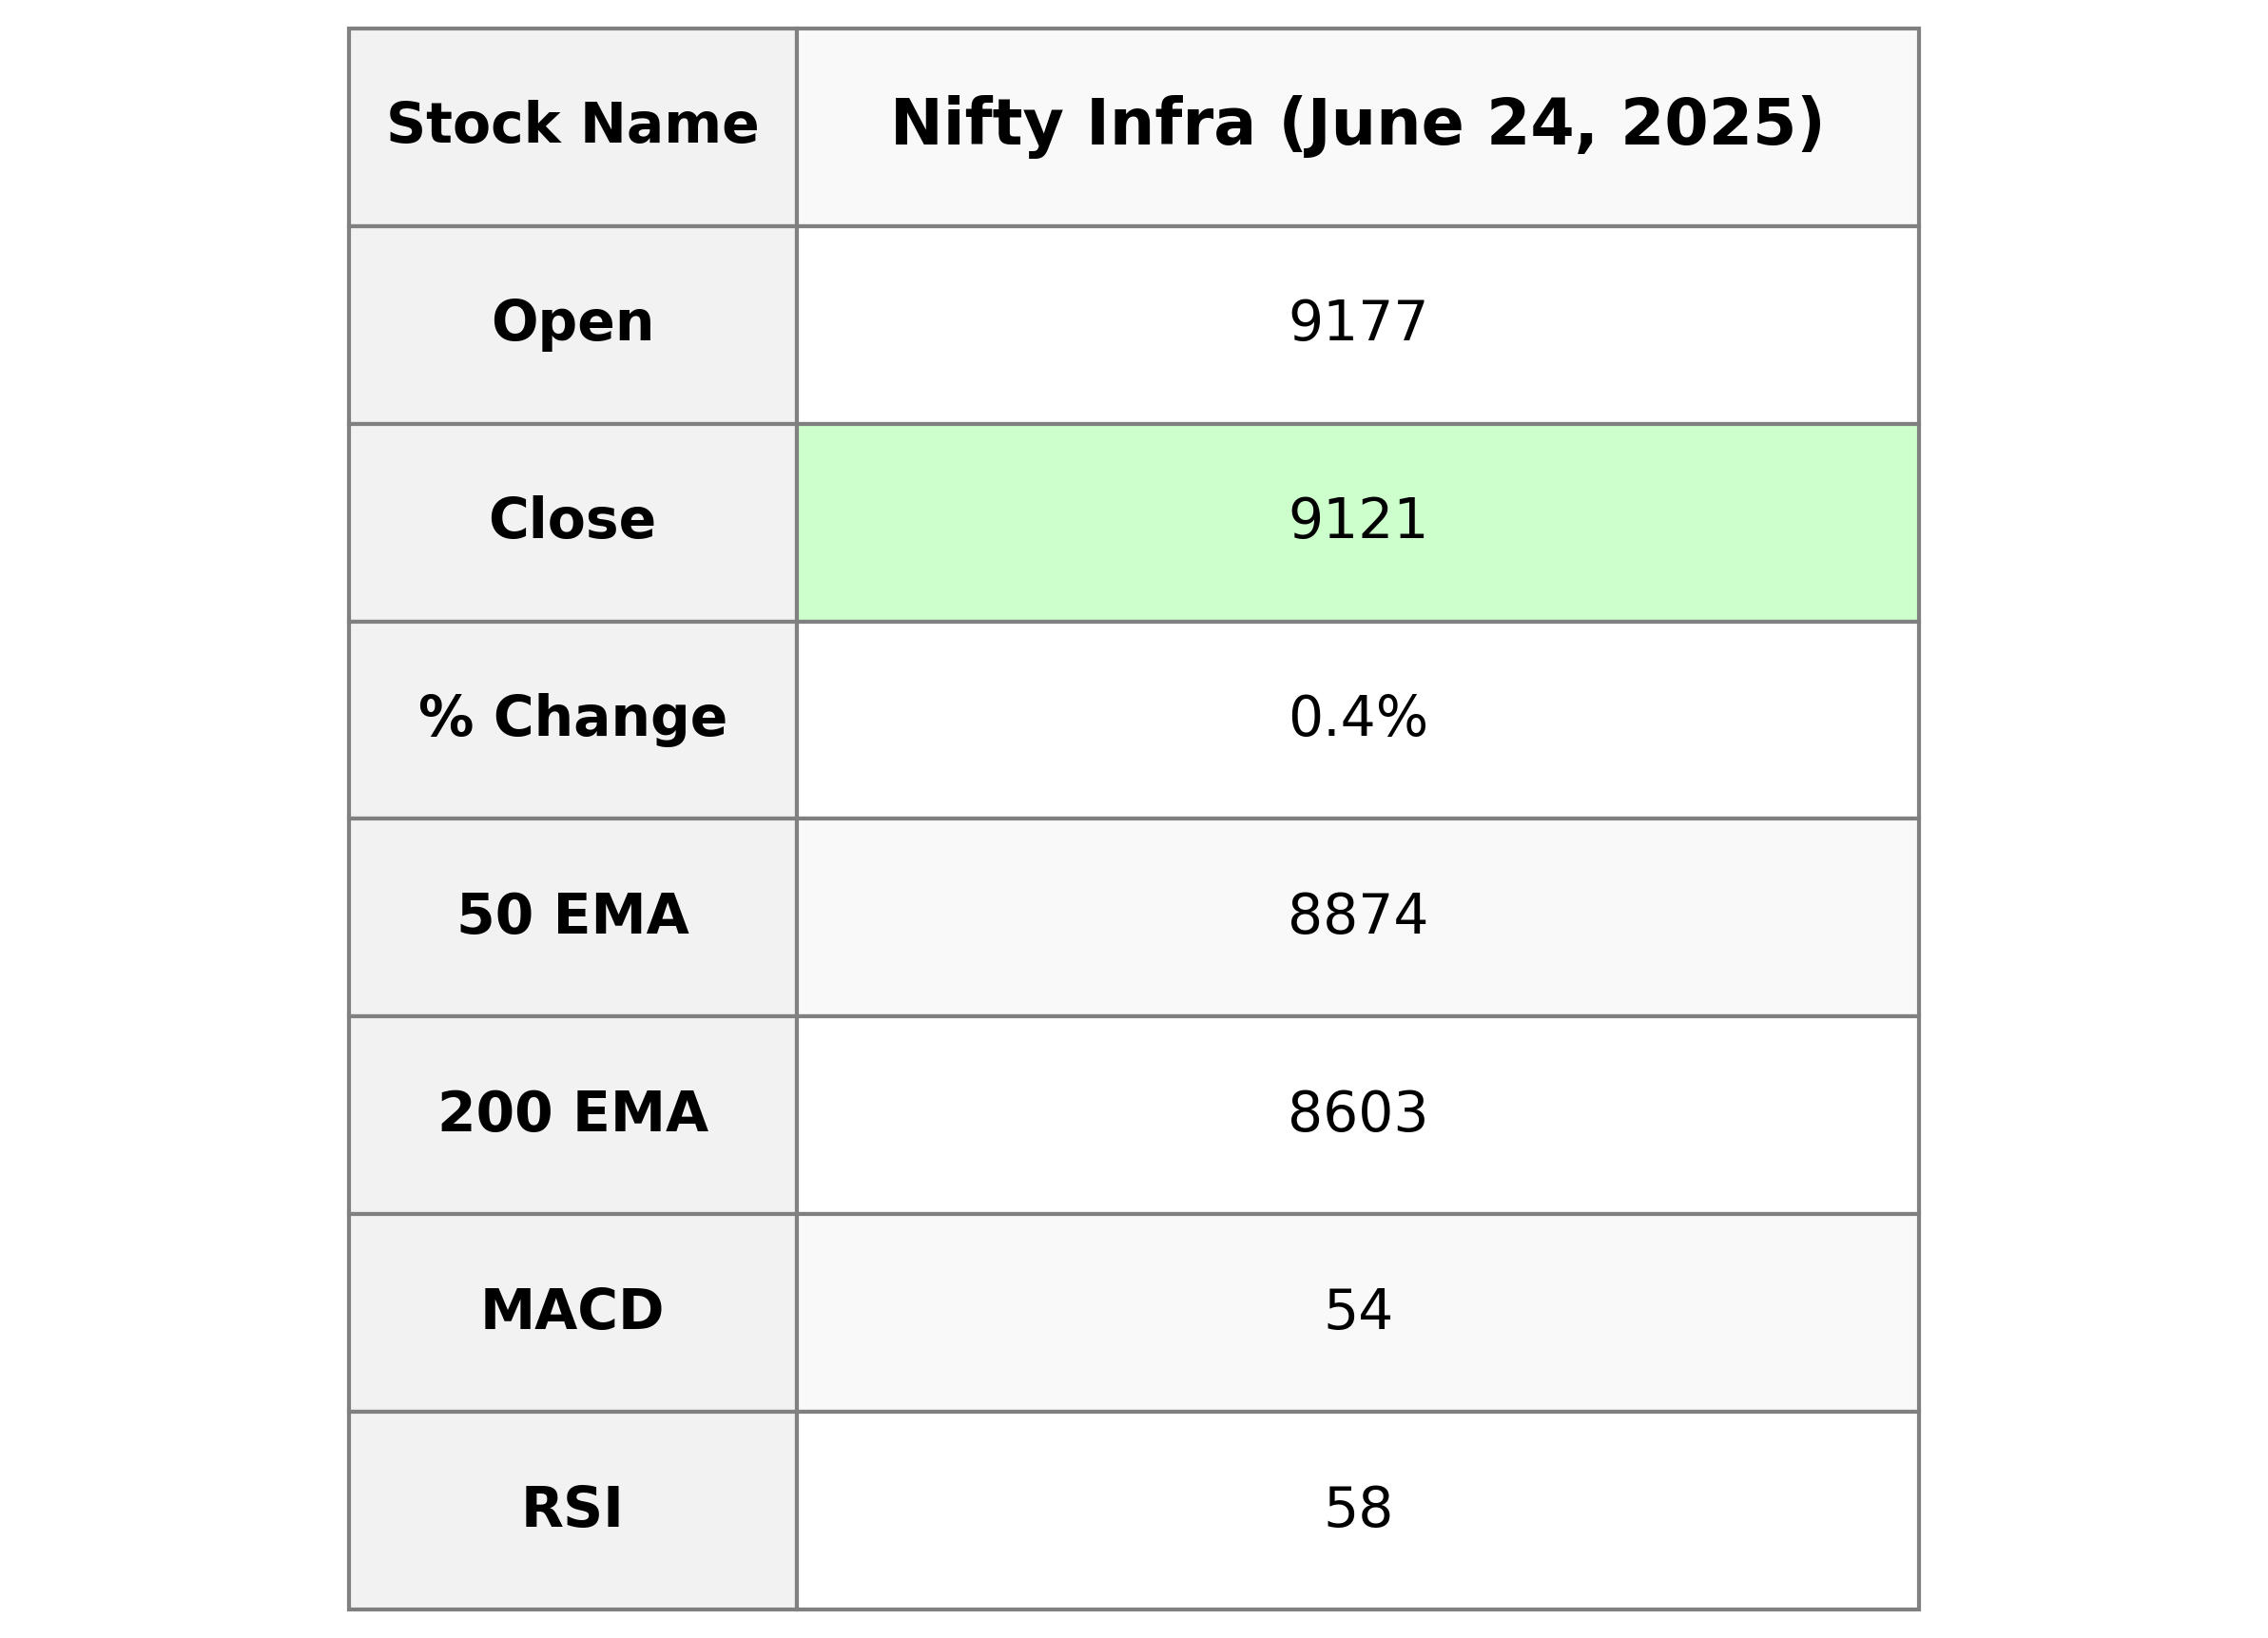
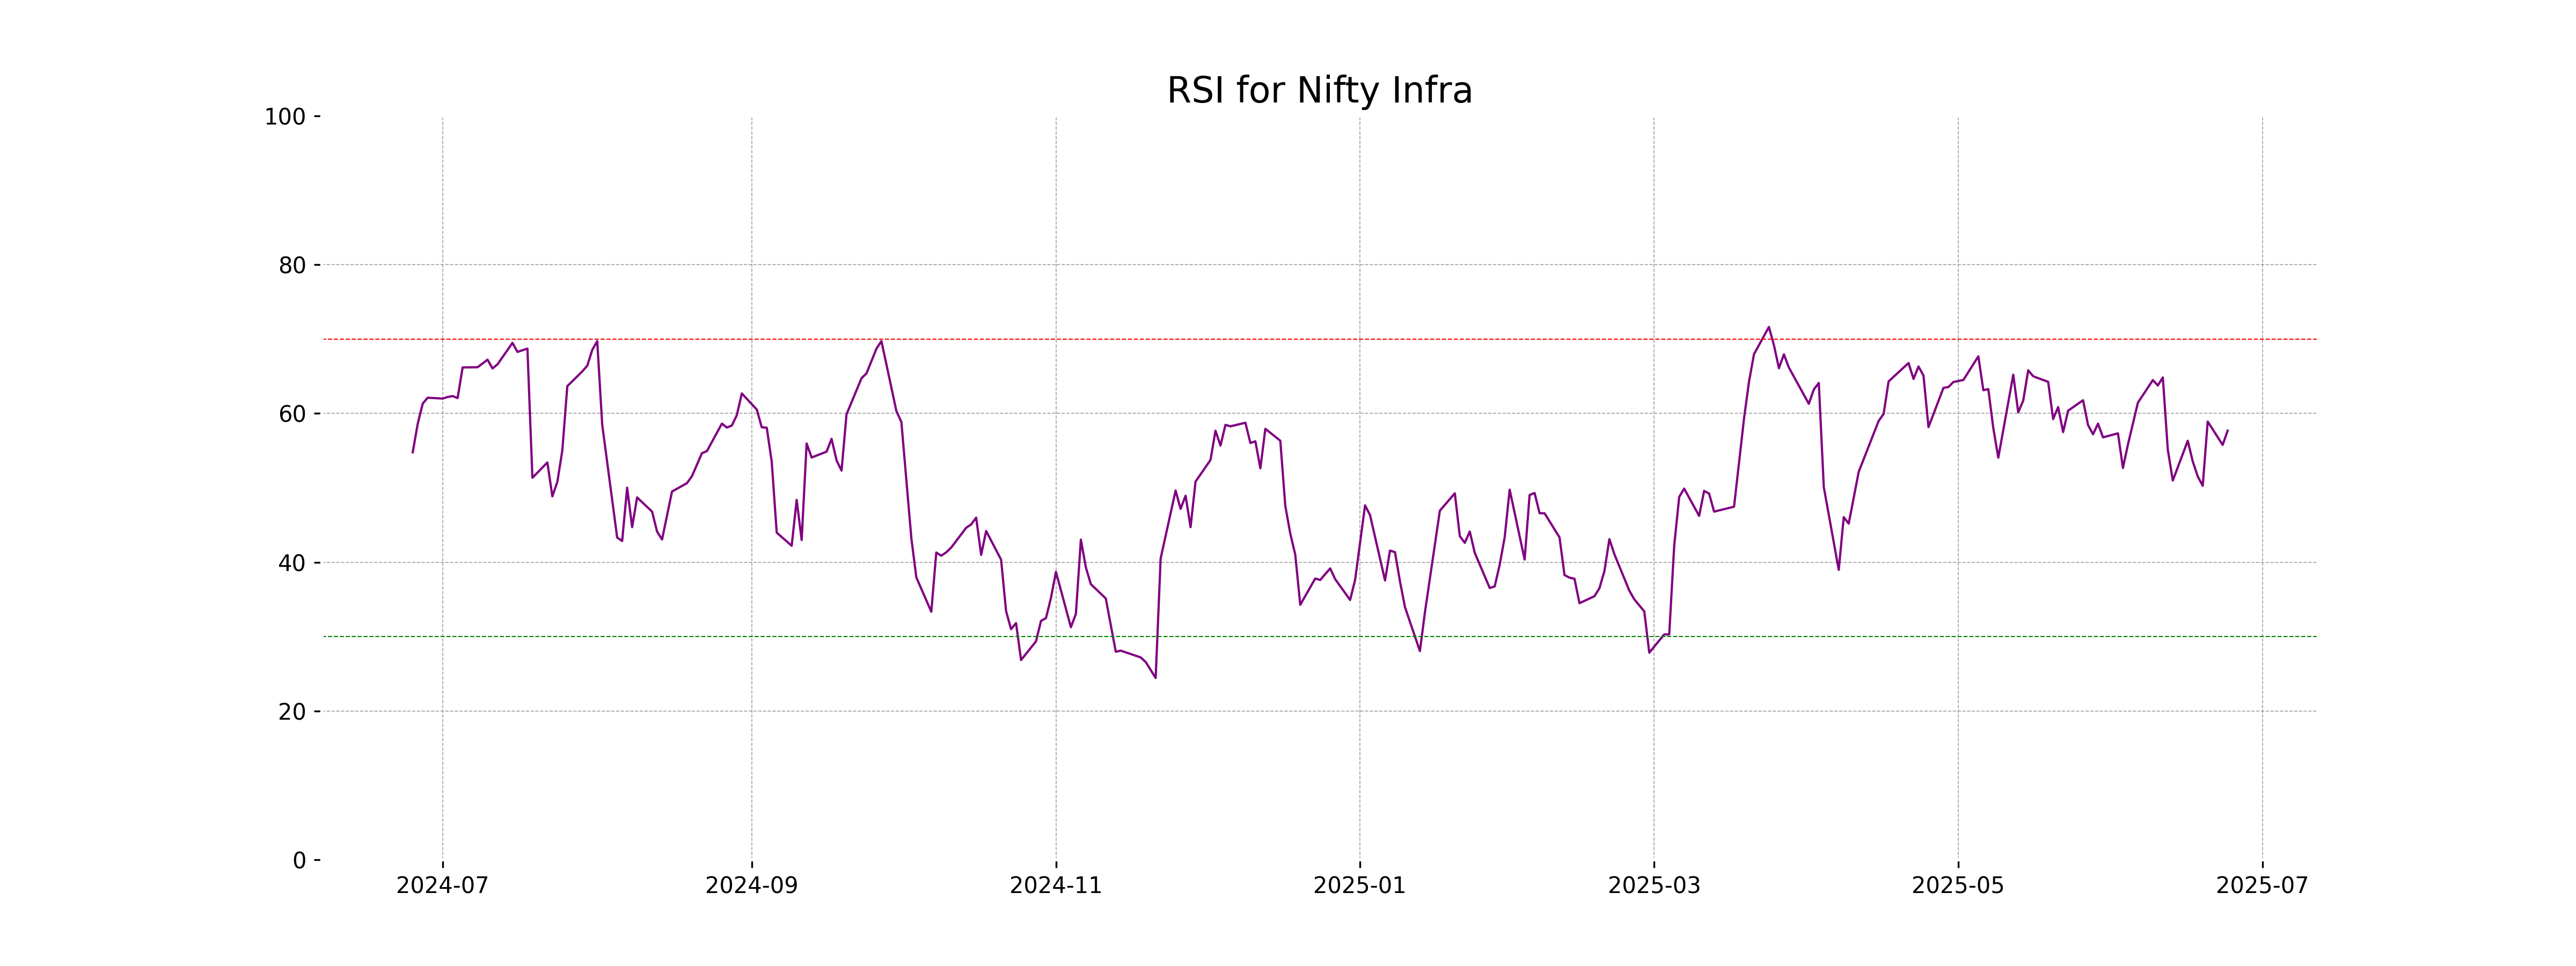
Nifty Infra experienced a slight positive change with an opening of 9176.70 and a closing of 9120.65, reflecting a 0.41% increase from the previous close of 9083.80. This movement is supported by technical indicators like the RSI, which stands at 57.68 suggesting moderate strength in the stock's current trend, and the MACD showing a positive, though slightly declining momentum.
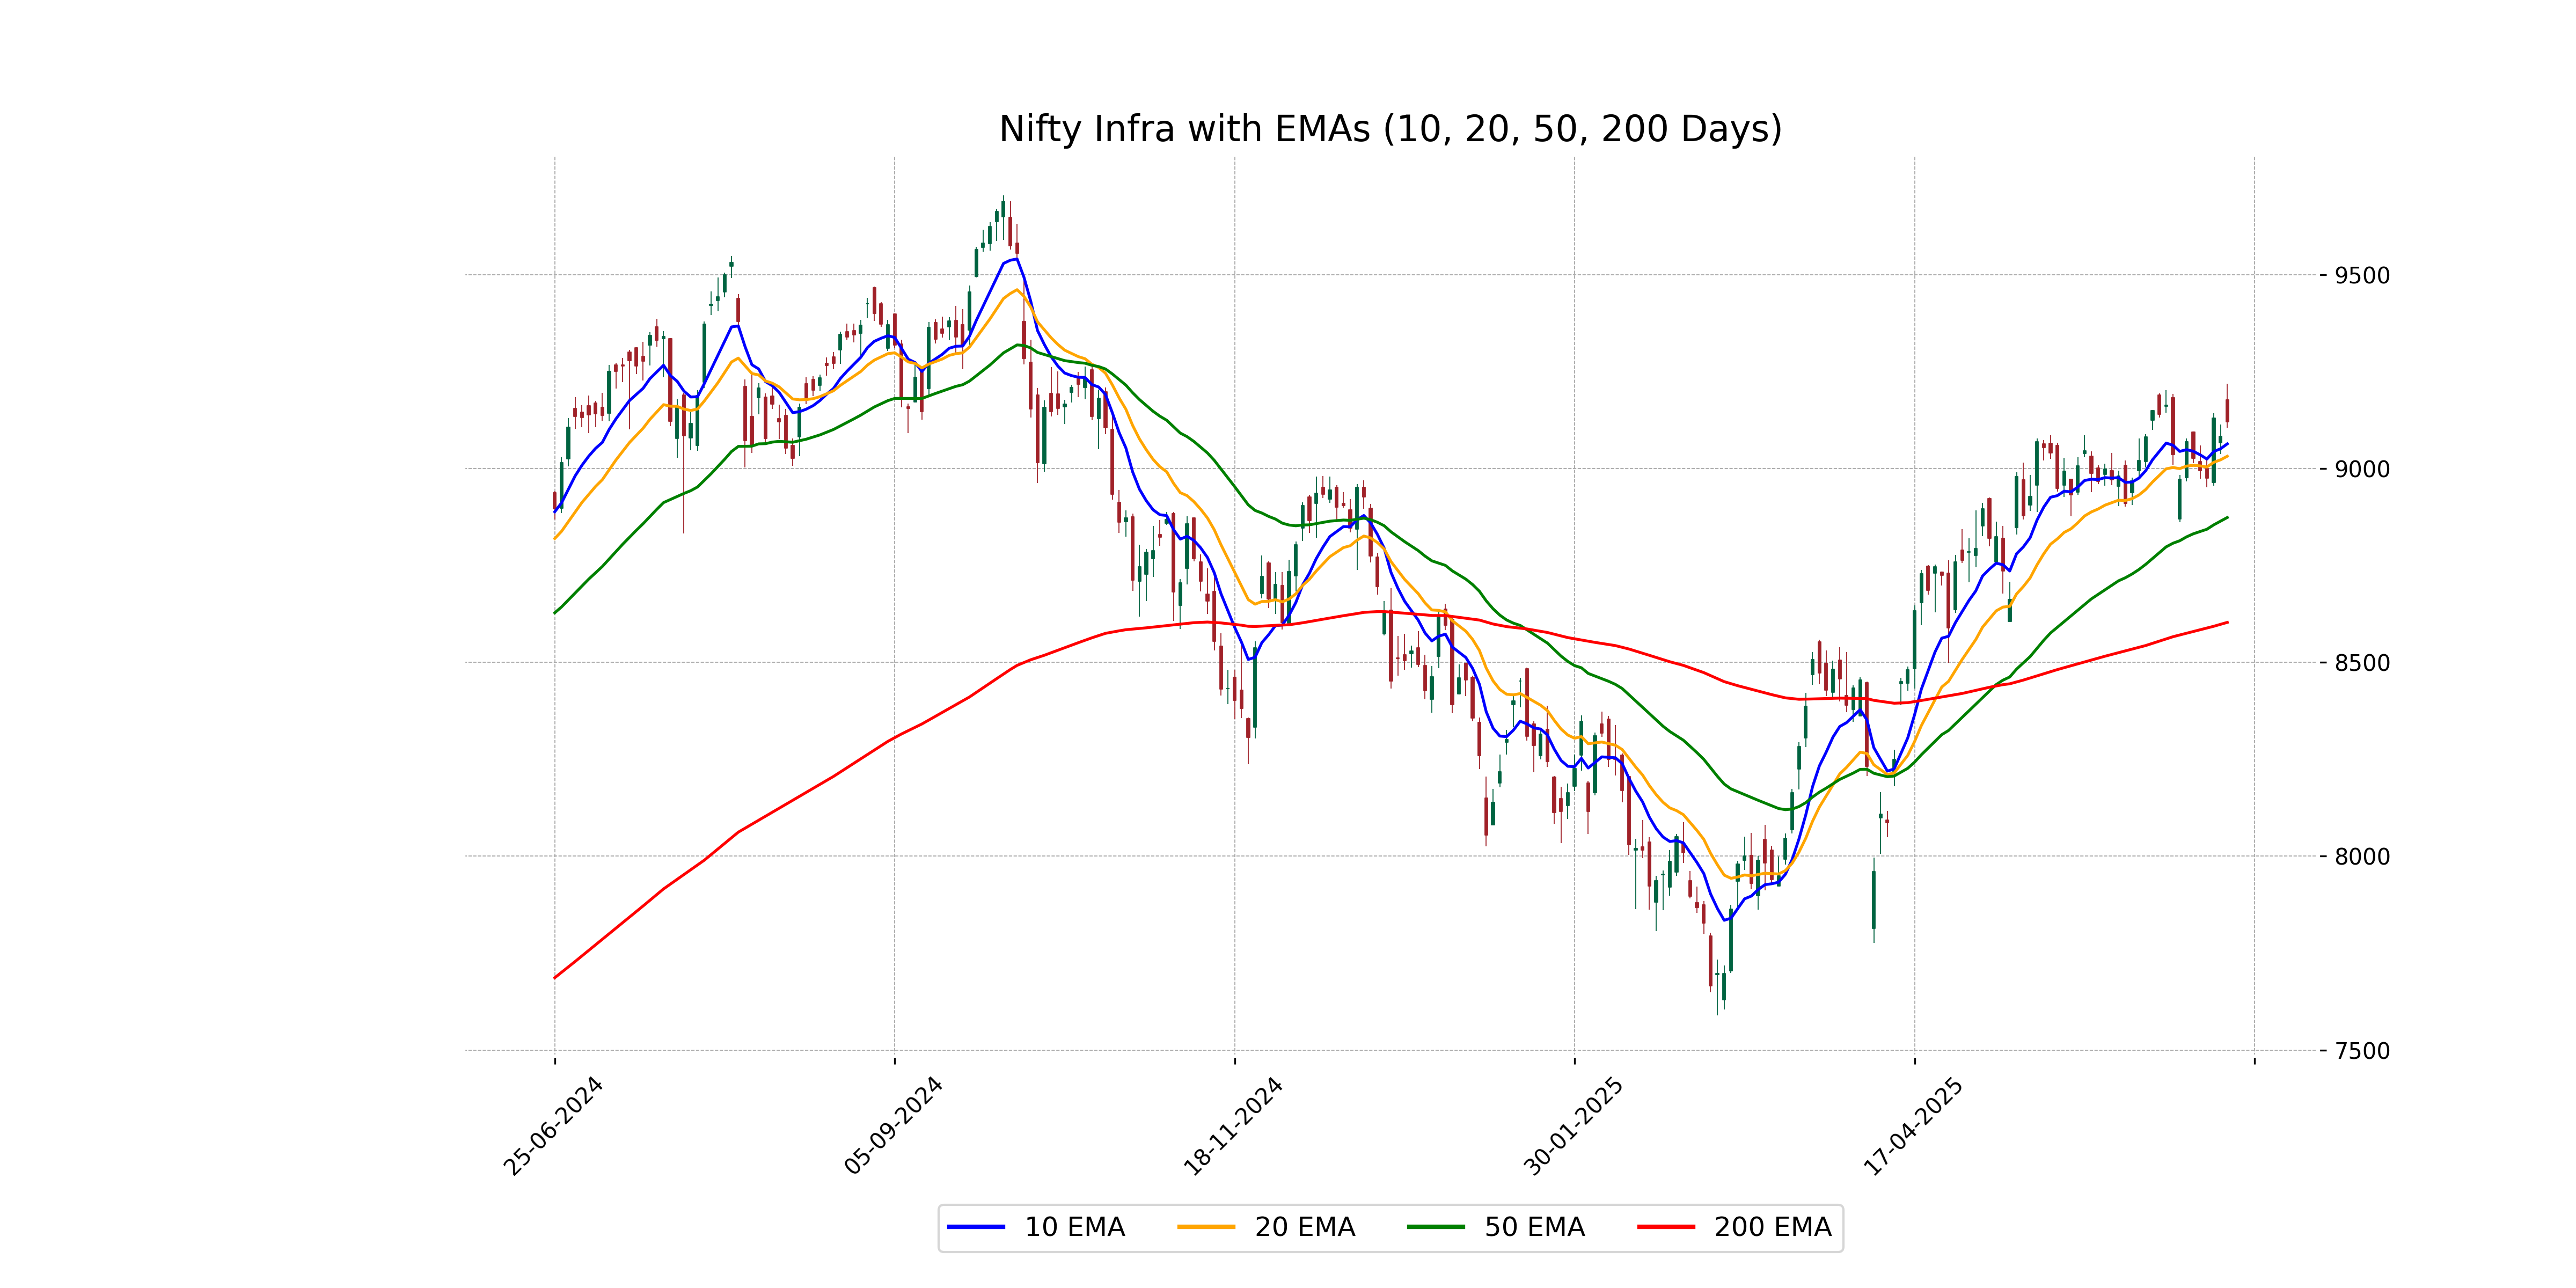
Relationship with Key Moving Averages
The Nifty Infra index closed at 9120.65, which is above its 10-day and 20-day EMAs of 9063.71 and 9031.78, respectively, indicating a potential short-term bullish trend. It also remains above the 50-day and 200-day EMAs of 8873.75 and 8603.19, signaling a continued bullish sentiment in the longer term.
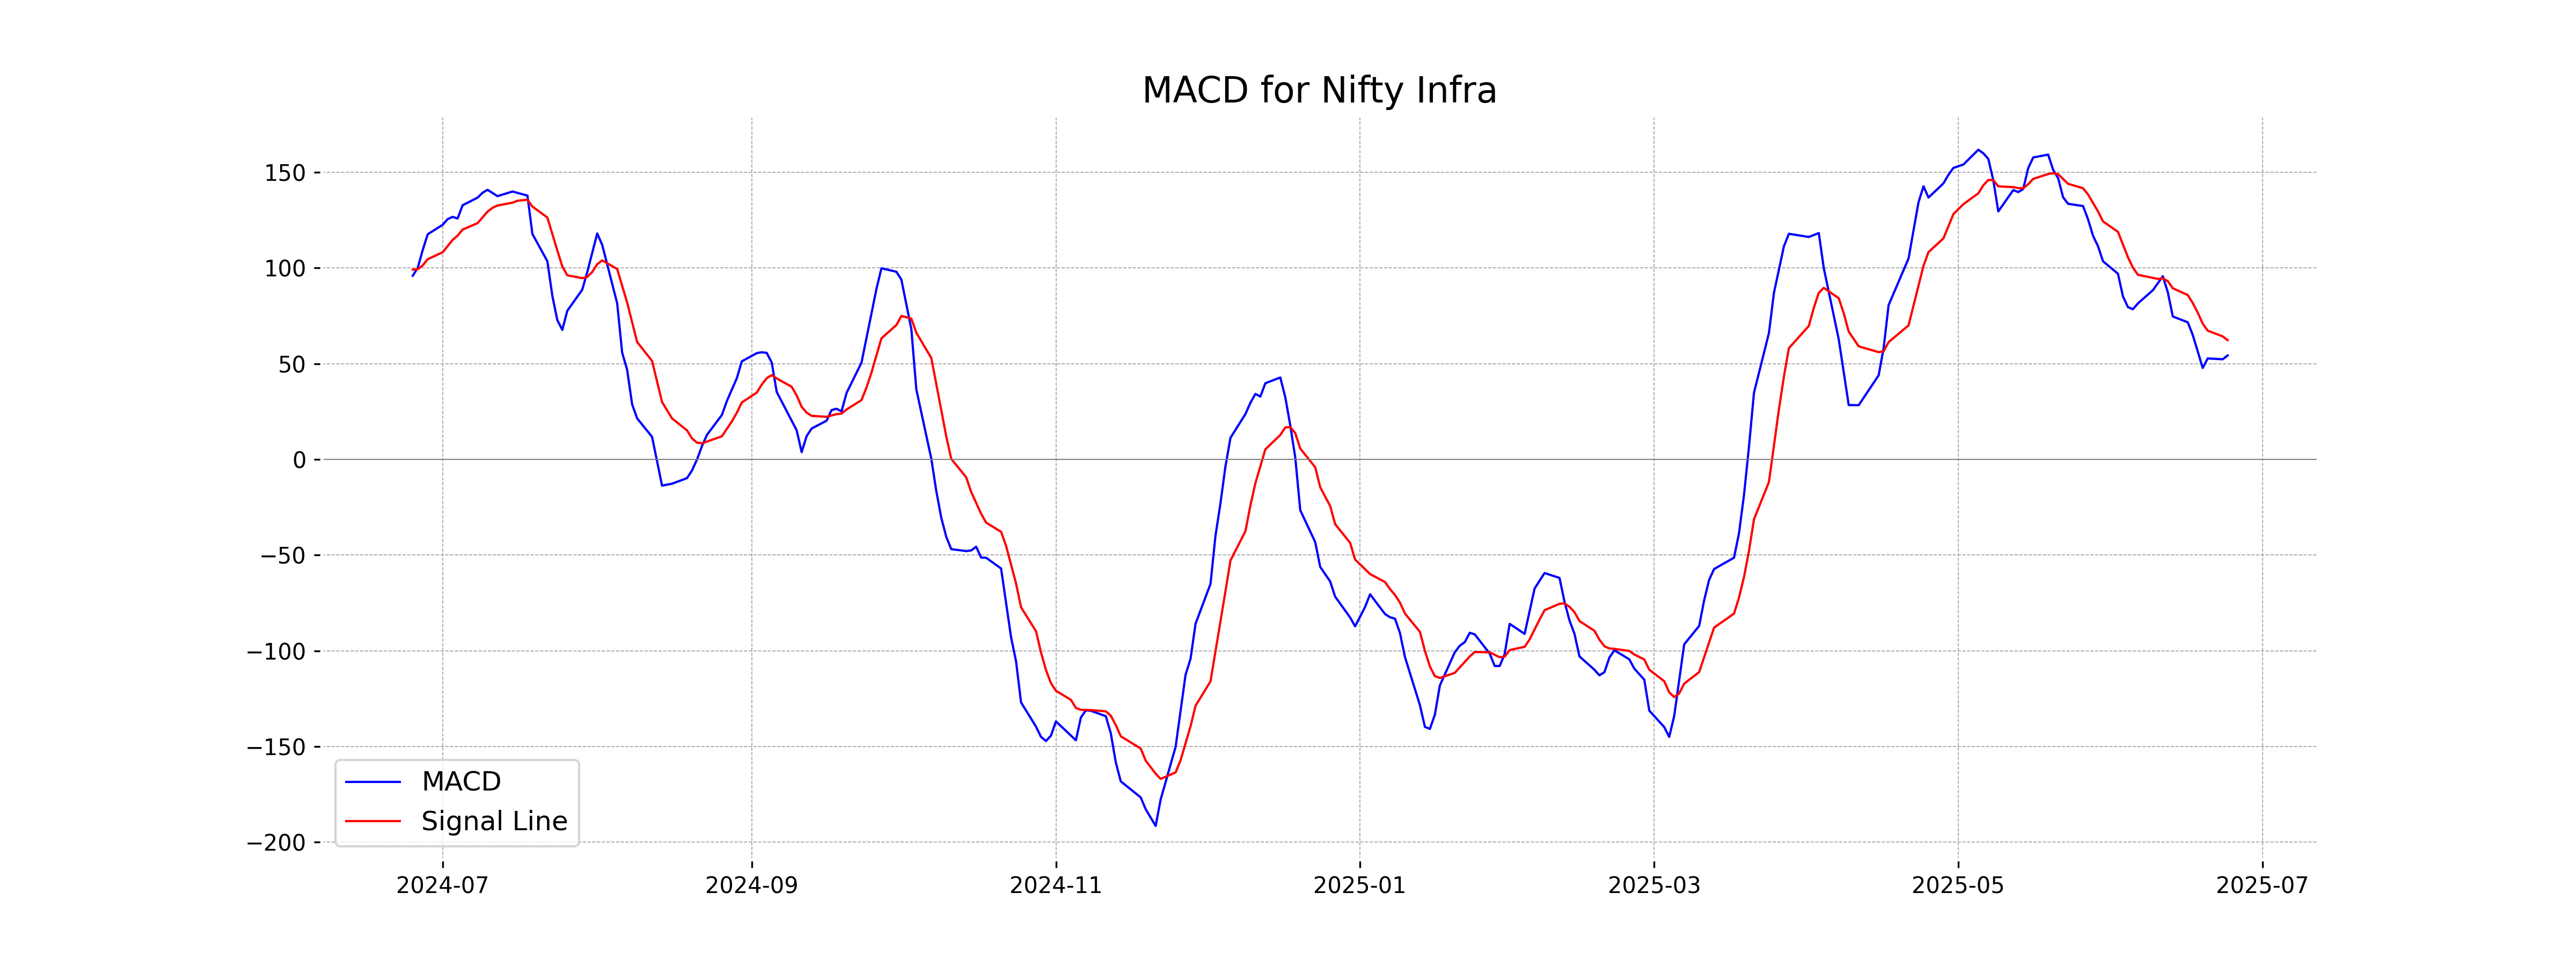
Moving Averages Trend (MACD)
Nifty Infra MACD Analysis: The MACD for Nifty Infra is 54.27, which is below the MACD Signal line of 62.25. This suggests a potential bearish signal, indicating that the stock index might experience downward movement unless a bullish crossover occurs.
RSI Analysis
The RSI for Nifty Infra is 57.68, which indicates a neutral to slightly bullish trend. It is neither in the overbought nor oversold territory, suggesting that the stock price may continue its current trend without significant momentum changes.
Analysis for Nifty IT - June 24, 2025

Nifty IT Performance: The Nifty IT index opened at 38,852.65, reached a high of 38,936.55, and closed at 38,417.95, marking a slight percentage change of 0.01%. The RSI is at 55.05, indicating moderate strength in momentum. The MACD is below the MACD Signal, suggesting a potential bearish signal. Overall, the Nifty IT index shows a minor upward movement but remains near its previous close.
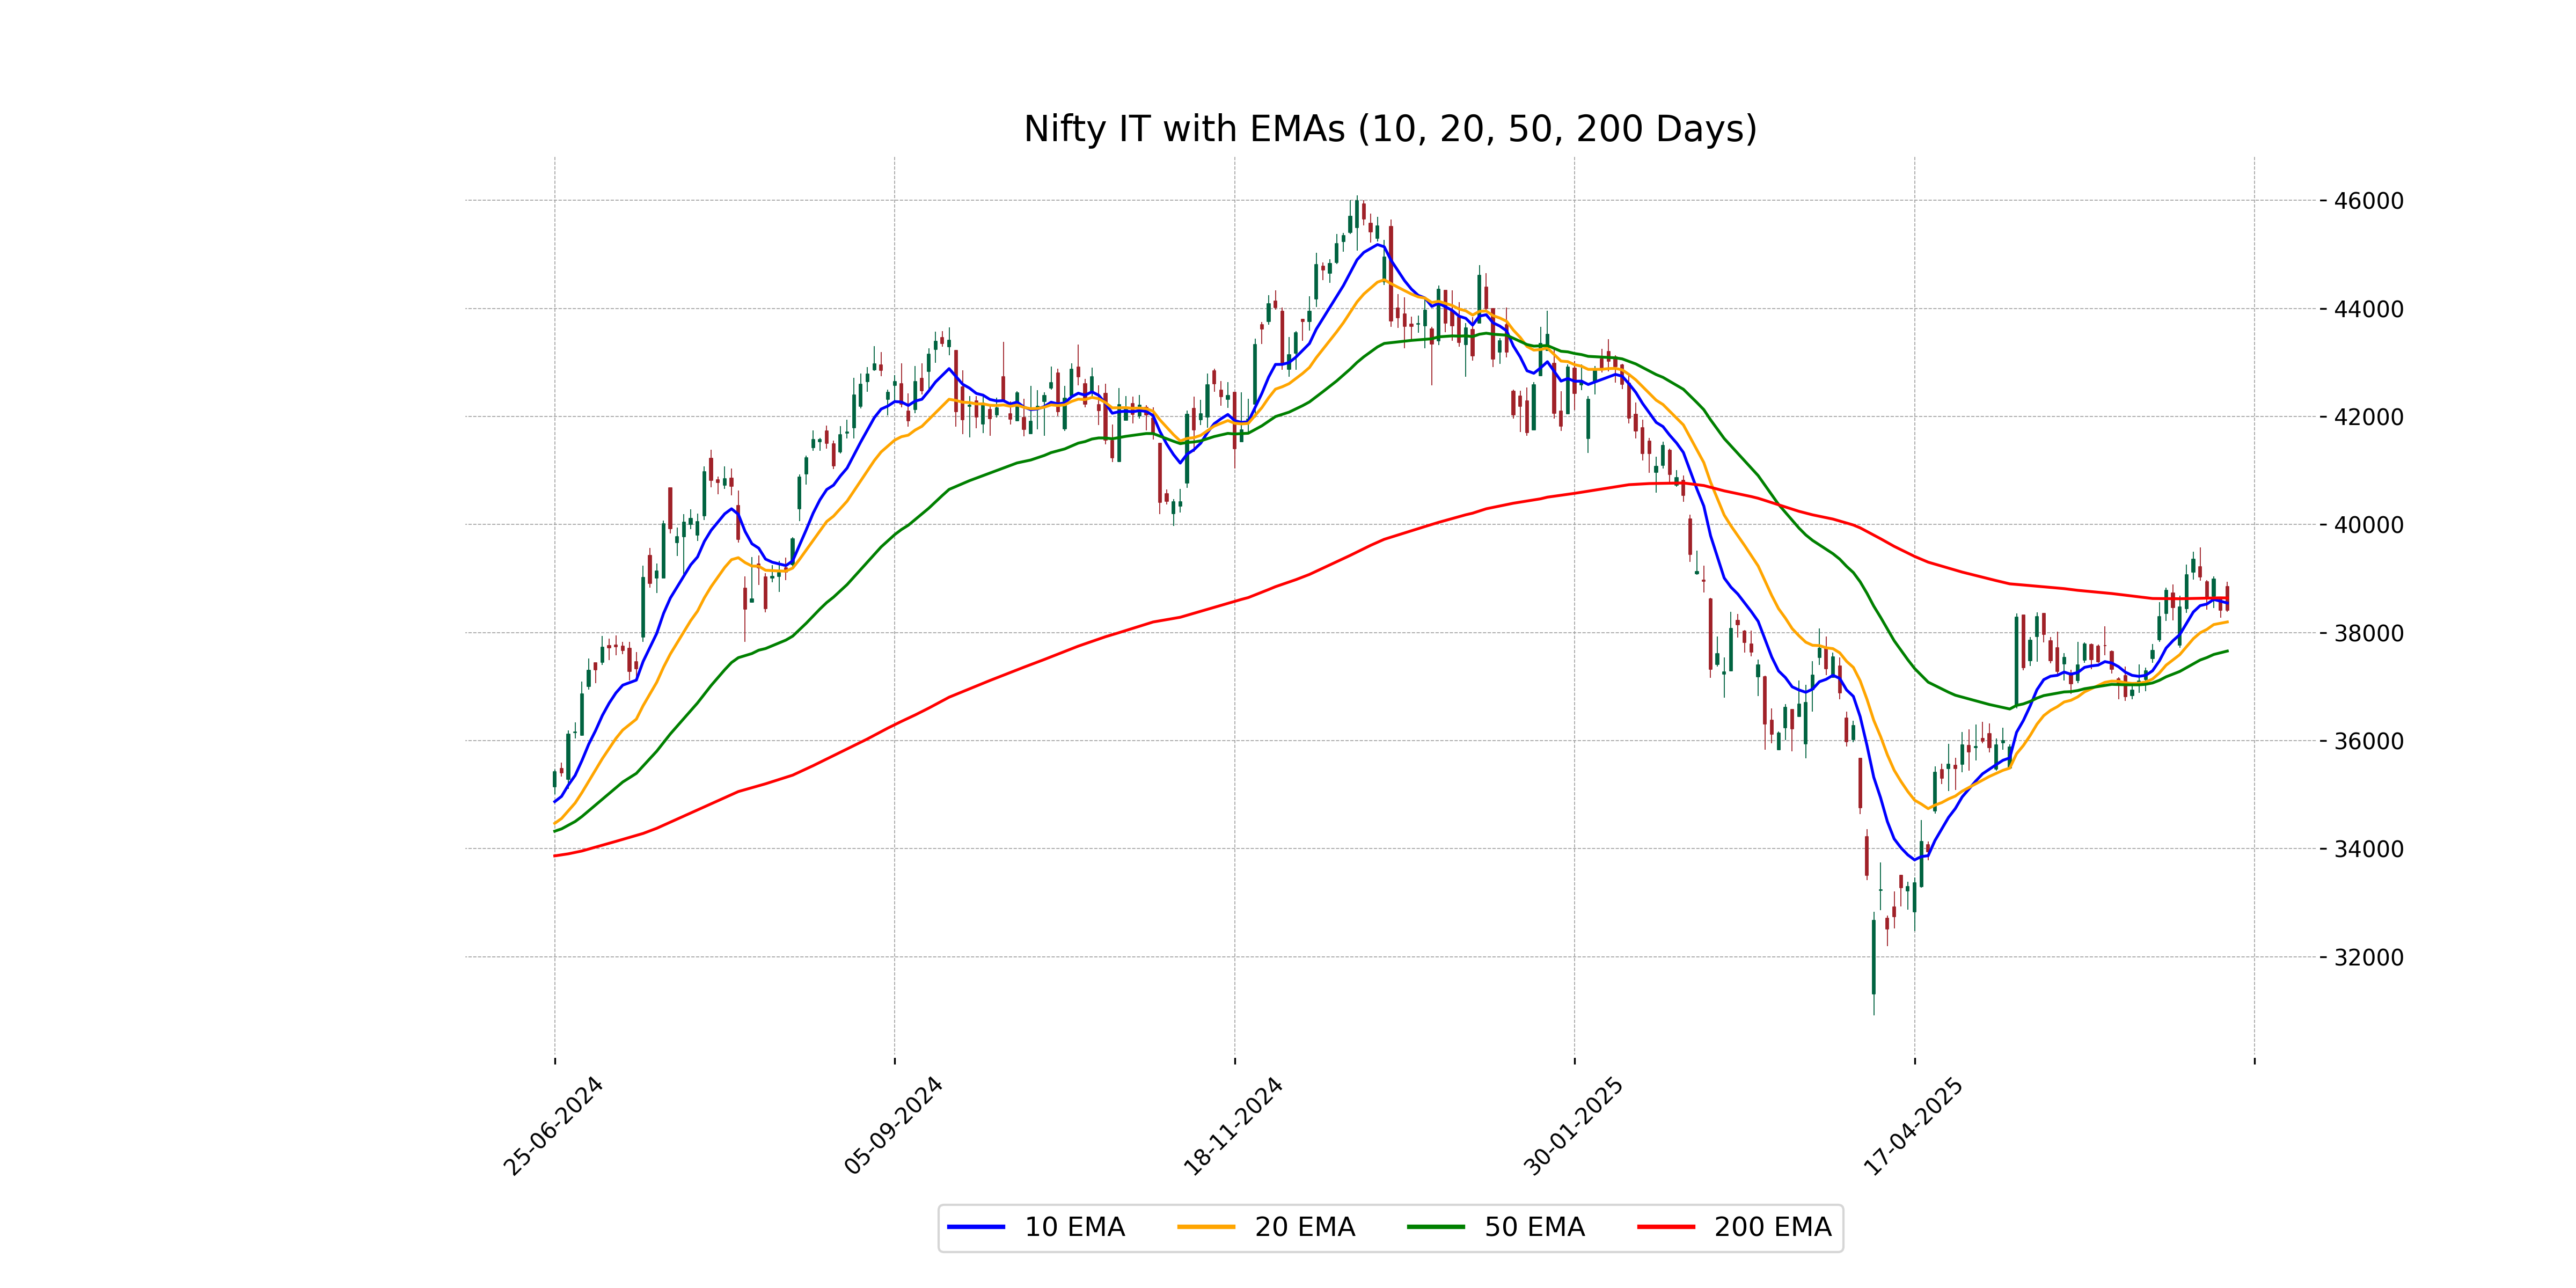
Relationship with Key Moving Averages
The Nifty IT index closed at 38,417.95, which is below the 10-day EMA of 38,548.12, indicating short-term weakness, but above the 50-day EMA of 37,658.16 and slightly above the 200-day EMA of 38,640.89, suggesting a mixed trend with potential support around long-term moving averages. The index's close being near the 200-day EMA could indicate a key support/resistance level.
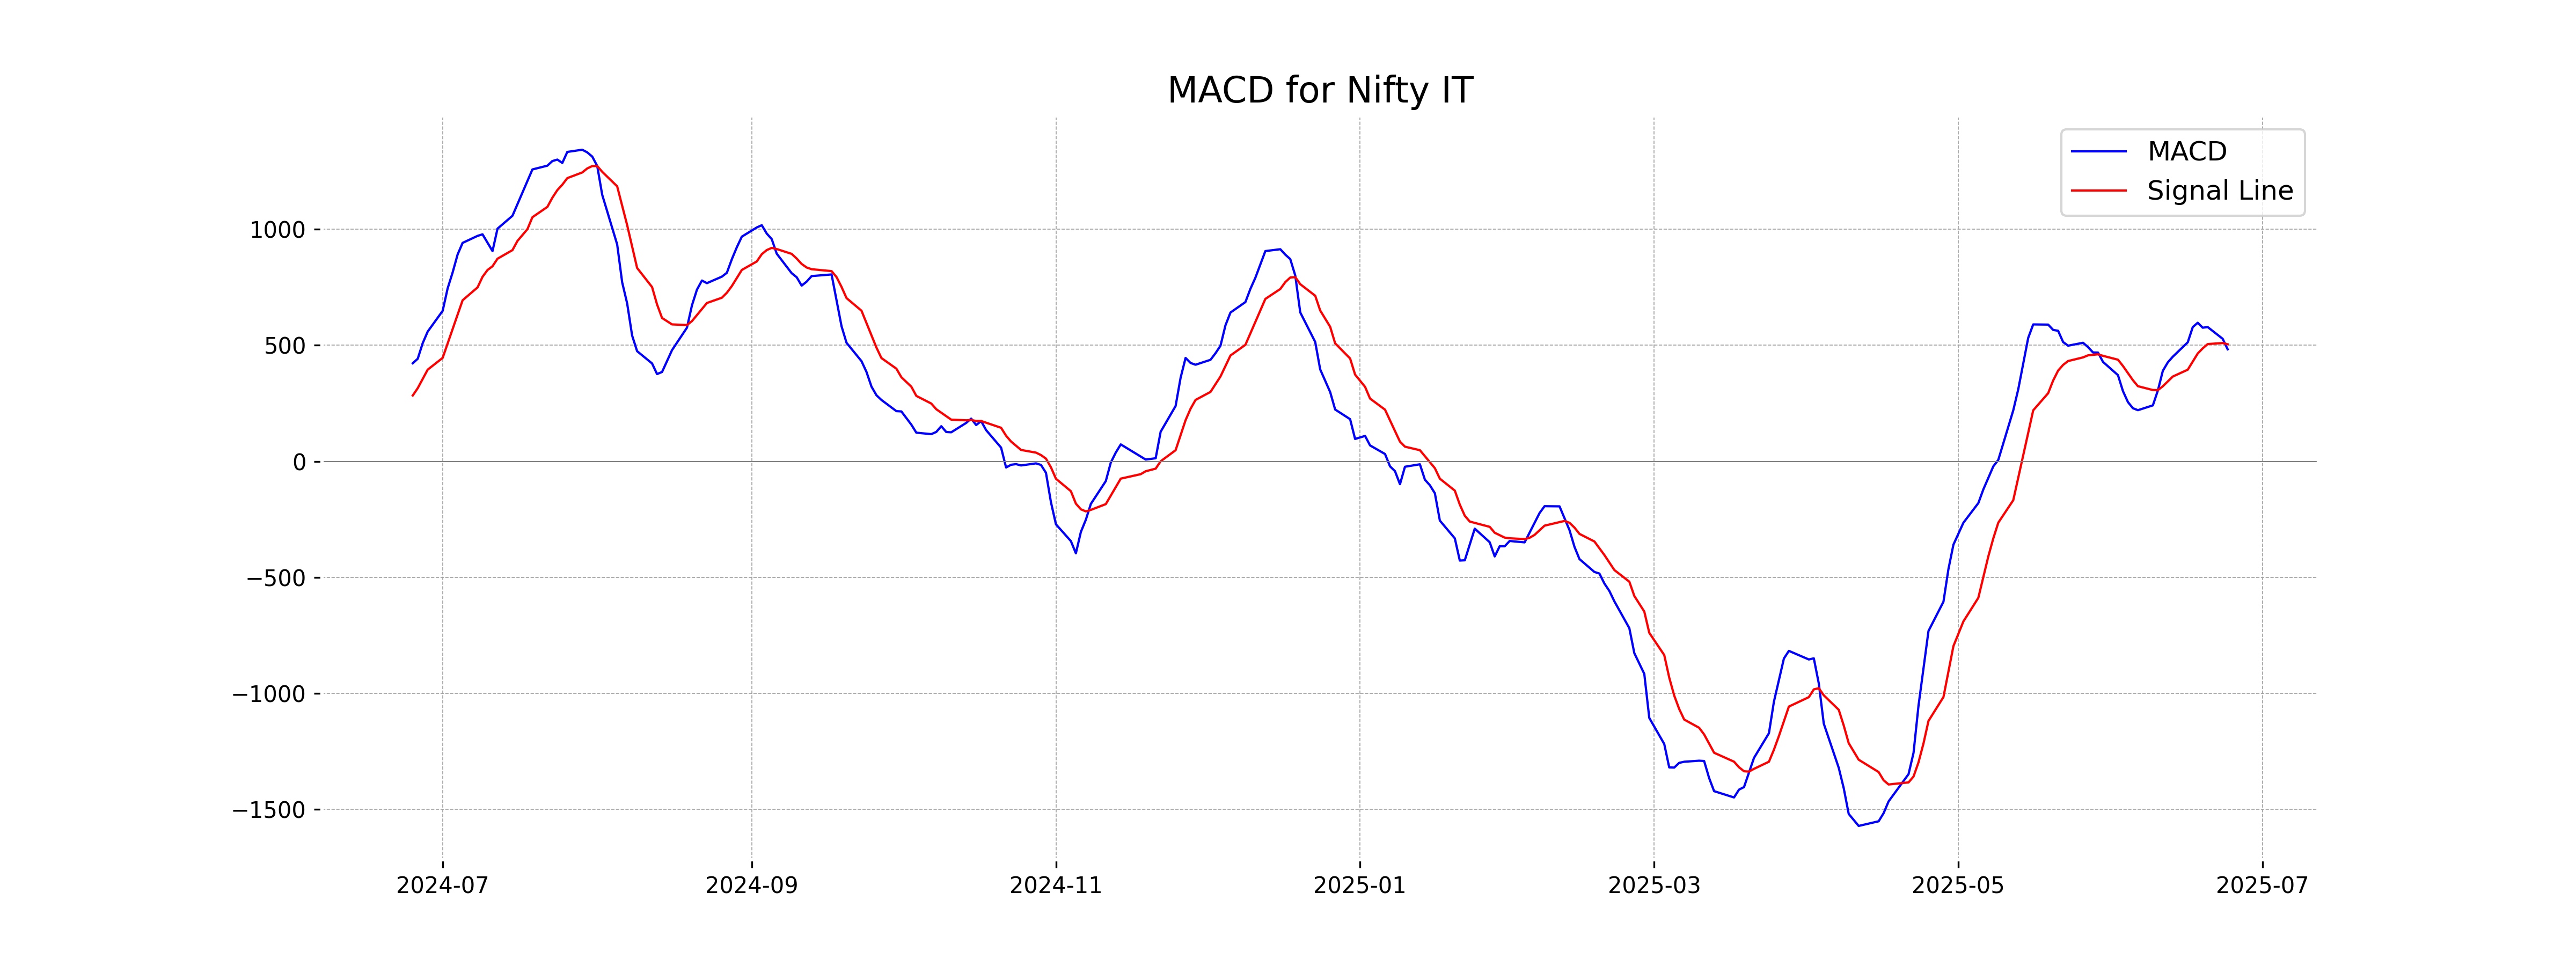
Moving Averages Trend (MACD)
MACD Analysis for Nifty IT: The MACD value of 482.77 is below the MACD Signal line of 504.35, suggesting a bearish trend. This indicates potential continued weakness unless the MACD crosses above the Signal line.
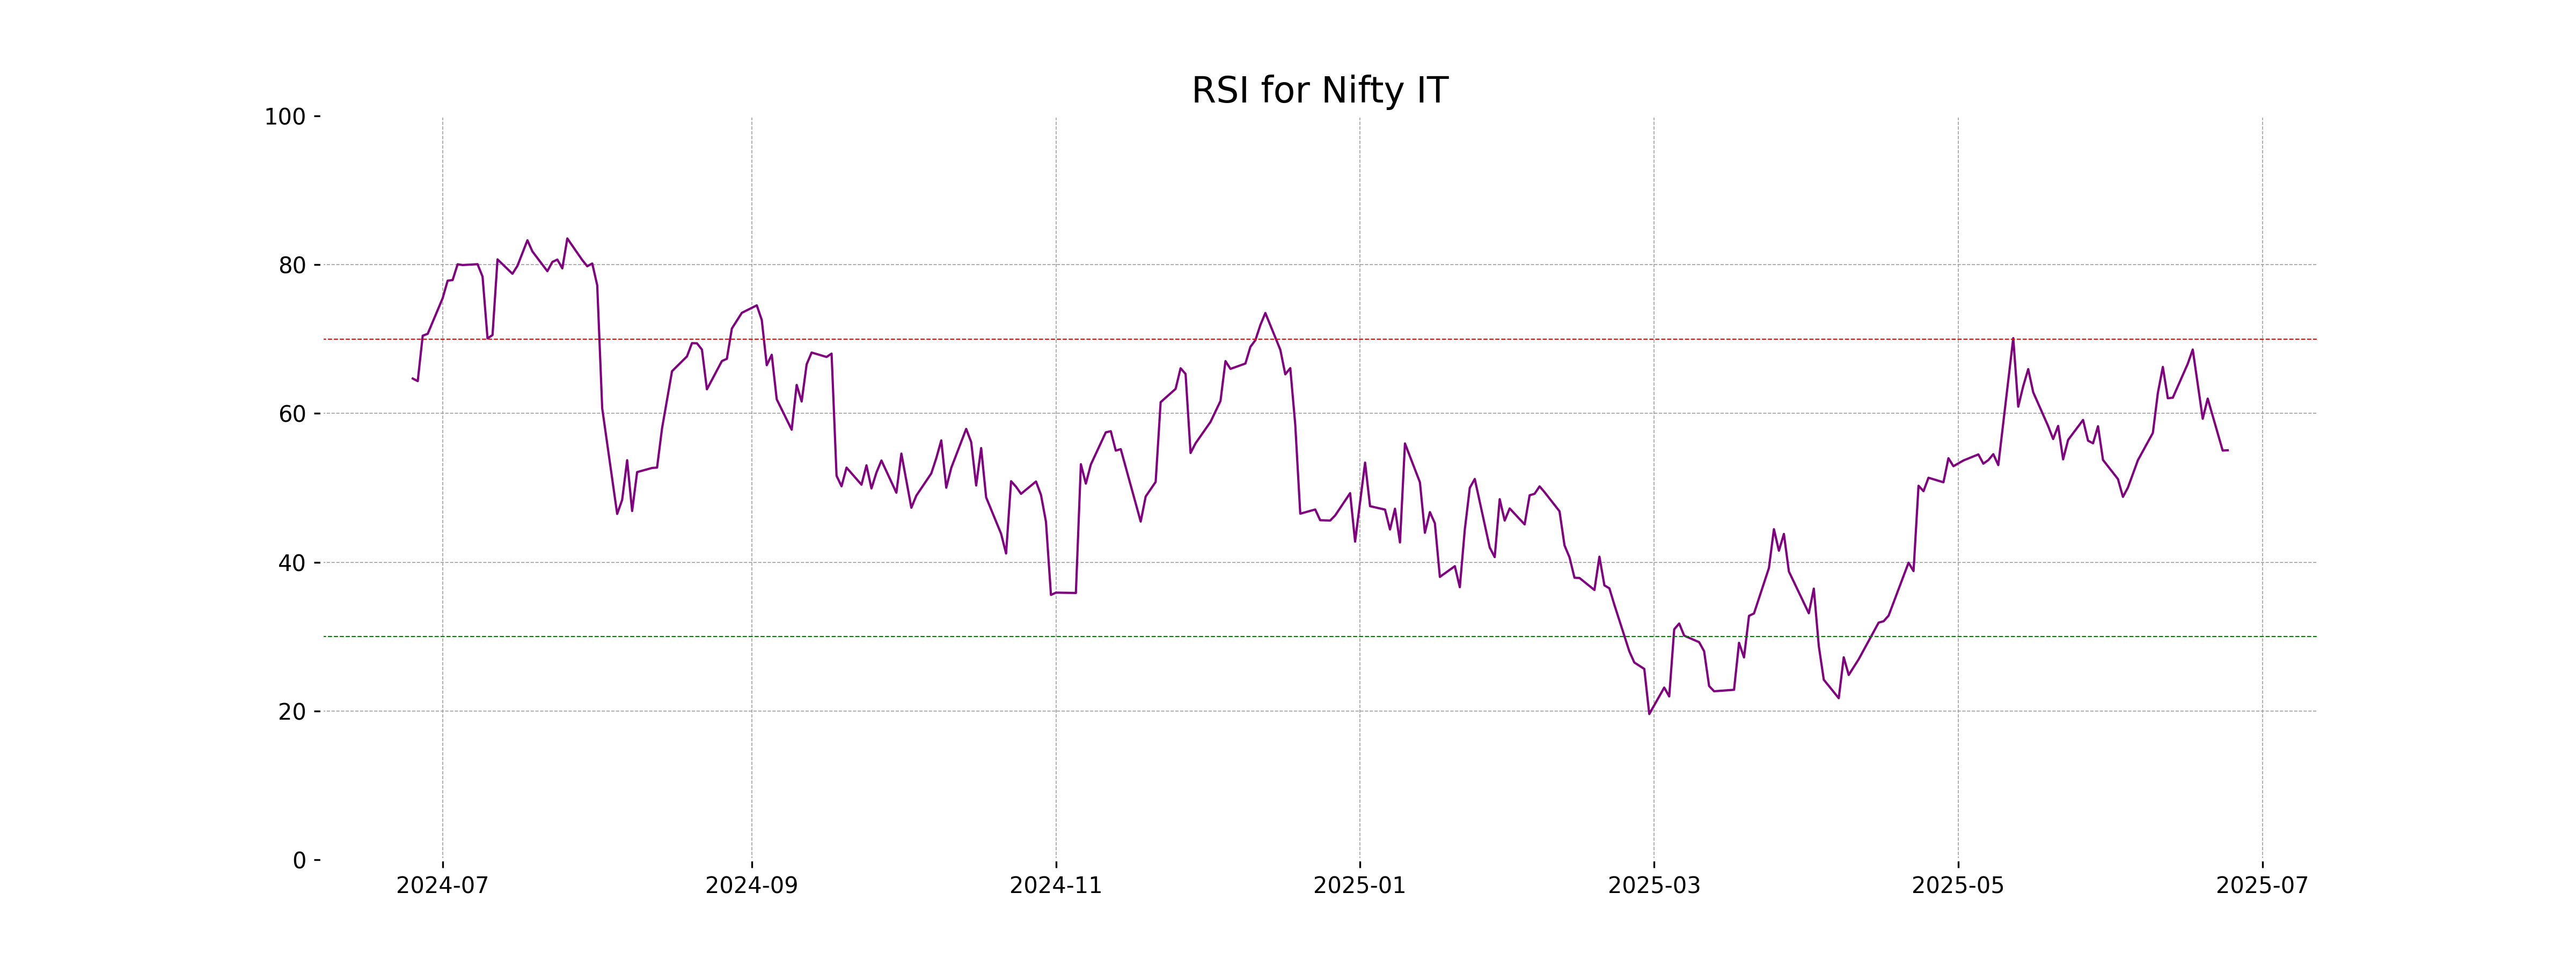
RSI Analysis
The Relative Strength Index (RSI) for Nifty IT is currently at 55.05. This indicates that the stock is in a neutral range, neither overbought nor oversold. Typically, an RSI above 70 suggests overbought conditions, while below 30 indicates oversold.
Analysis for Nifty Metal - June 24, 2025
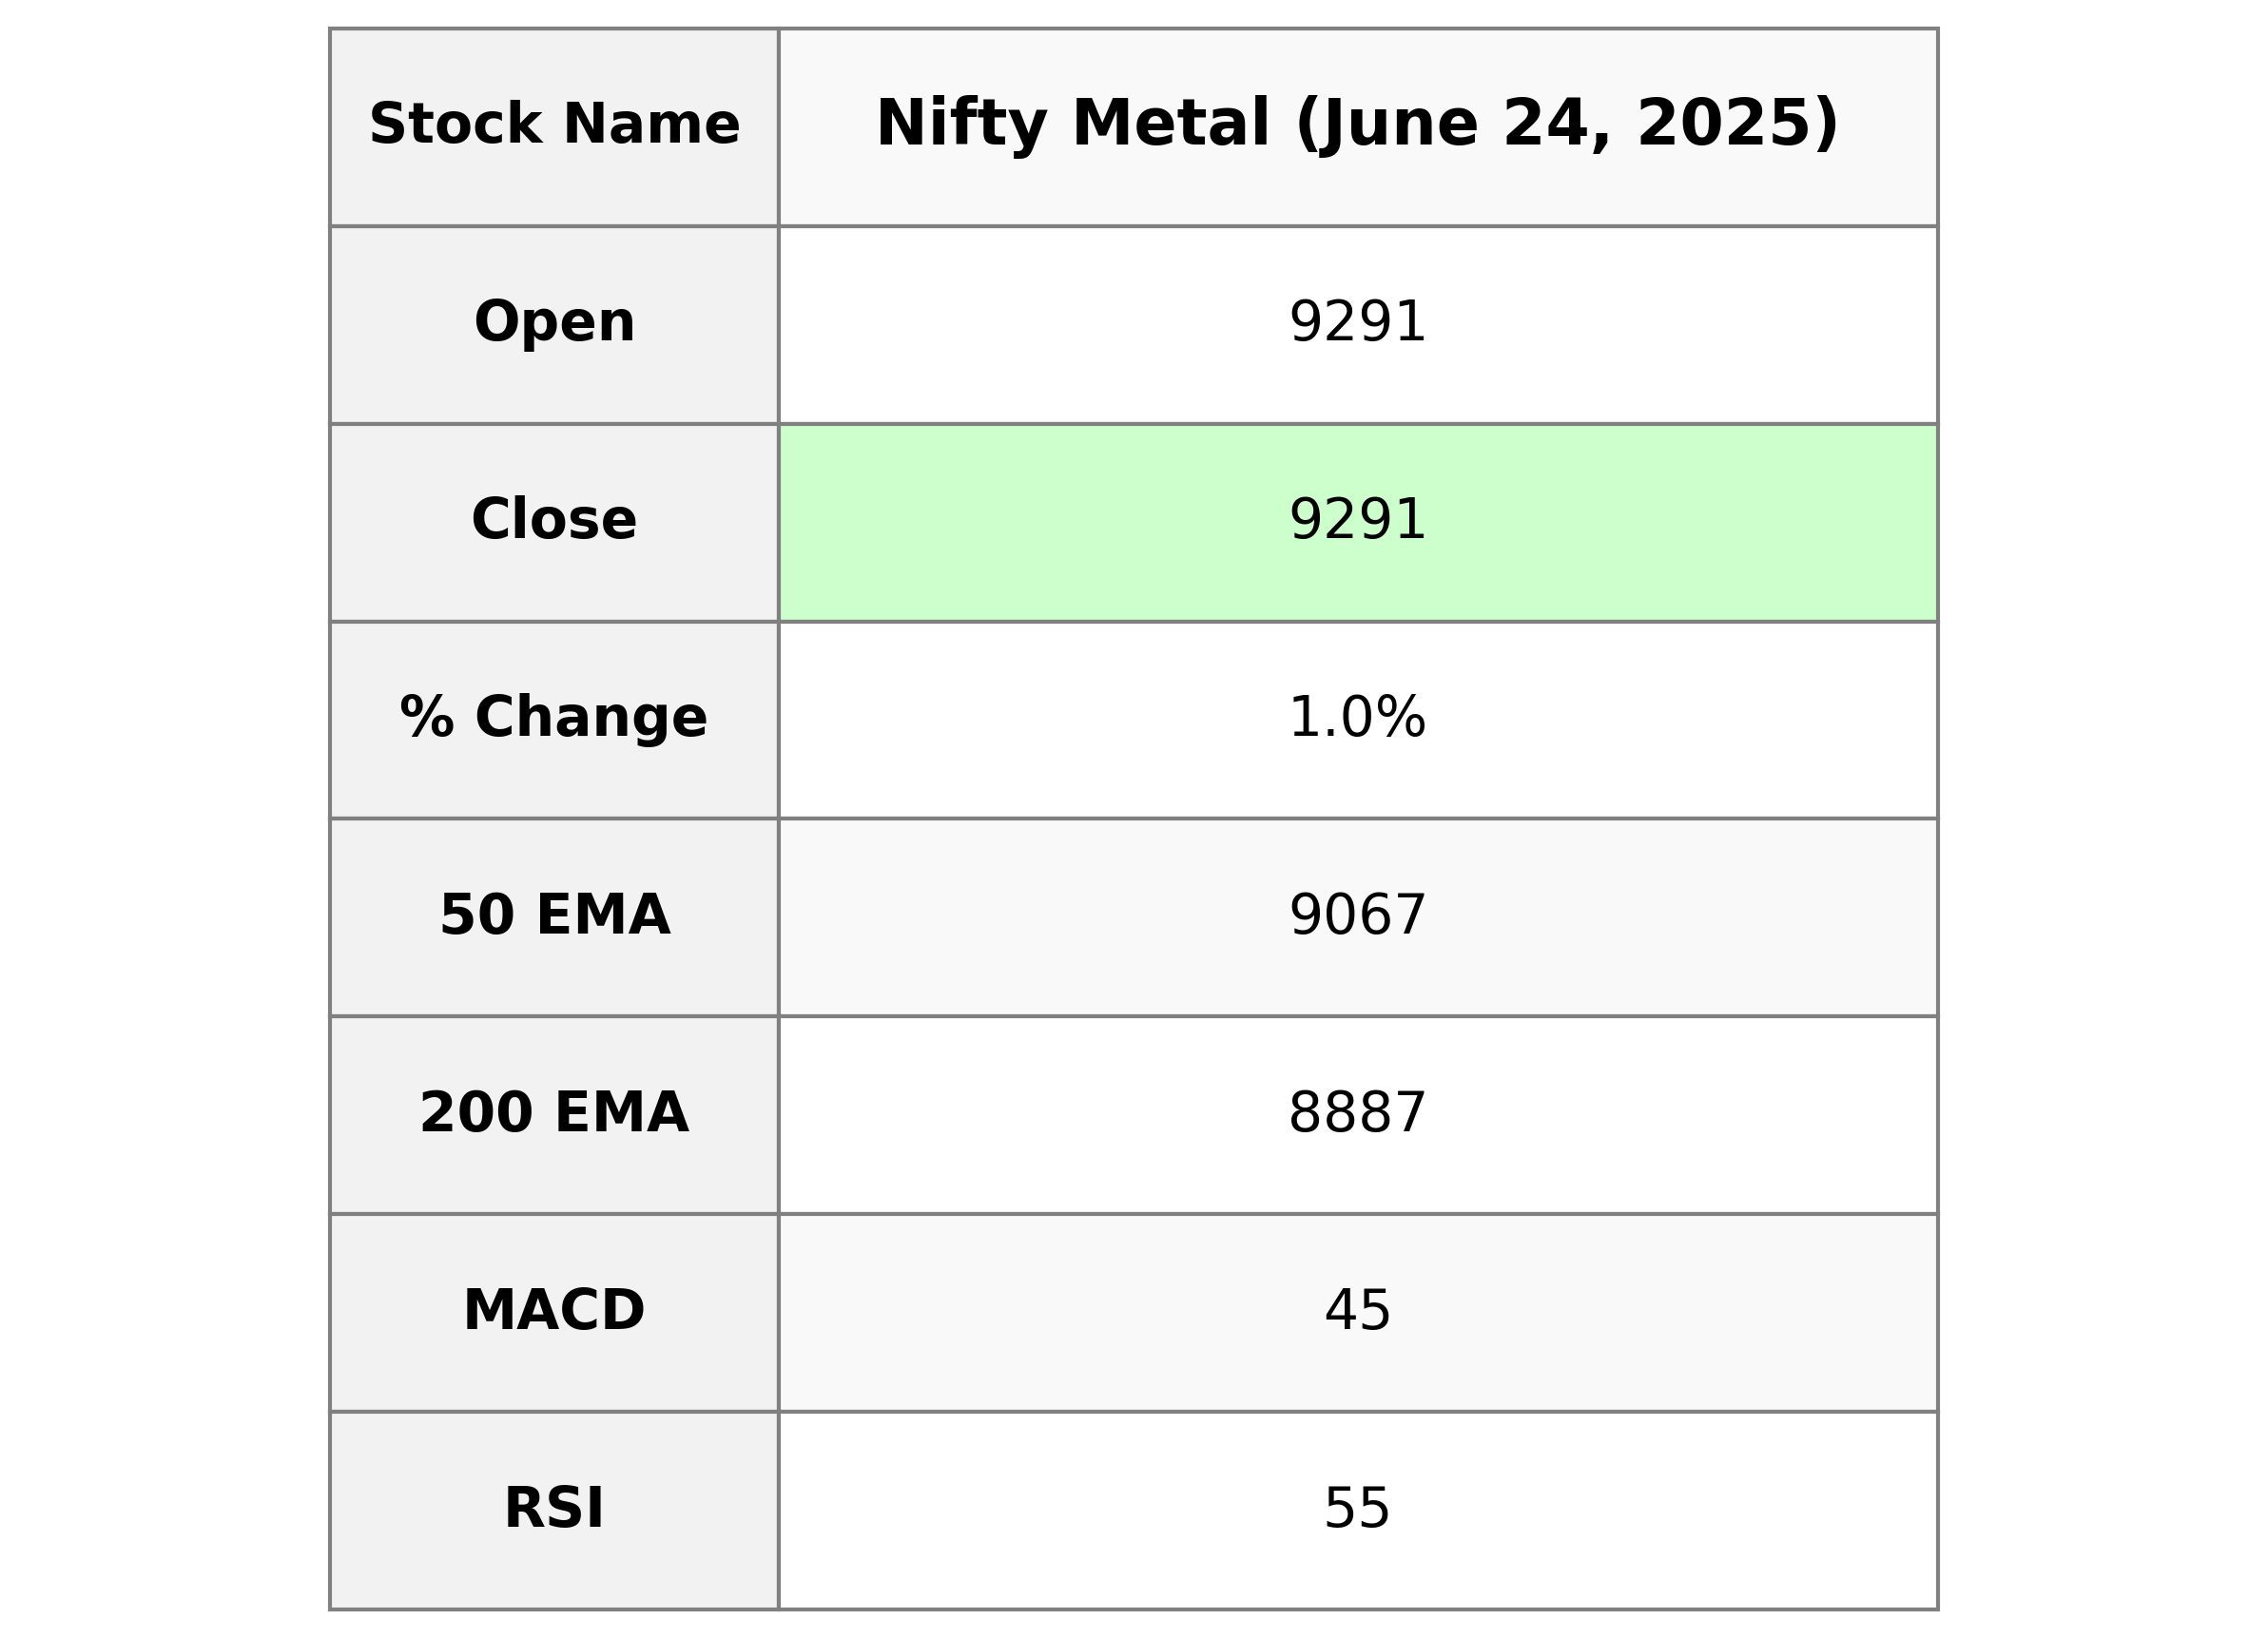
Nifty Metal opened at 9290.70 and closed at 9291.10, marking a positive change of approximately 1.01% compared to the previous close of 9198.55. With an increase of 92.55 points, the index had a high of 9395.70 and a low of 9261.15. The RSI value of 54.58 suggests a neutral momentum, while the MACD indicates a bearish crossover situation.
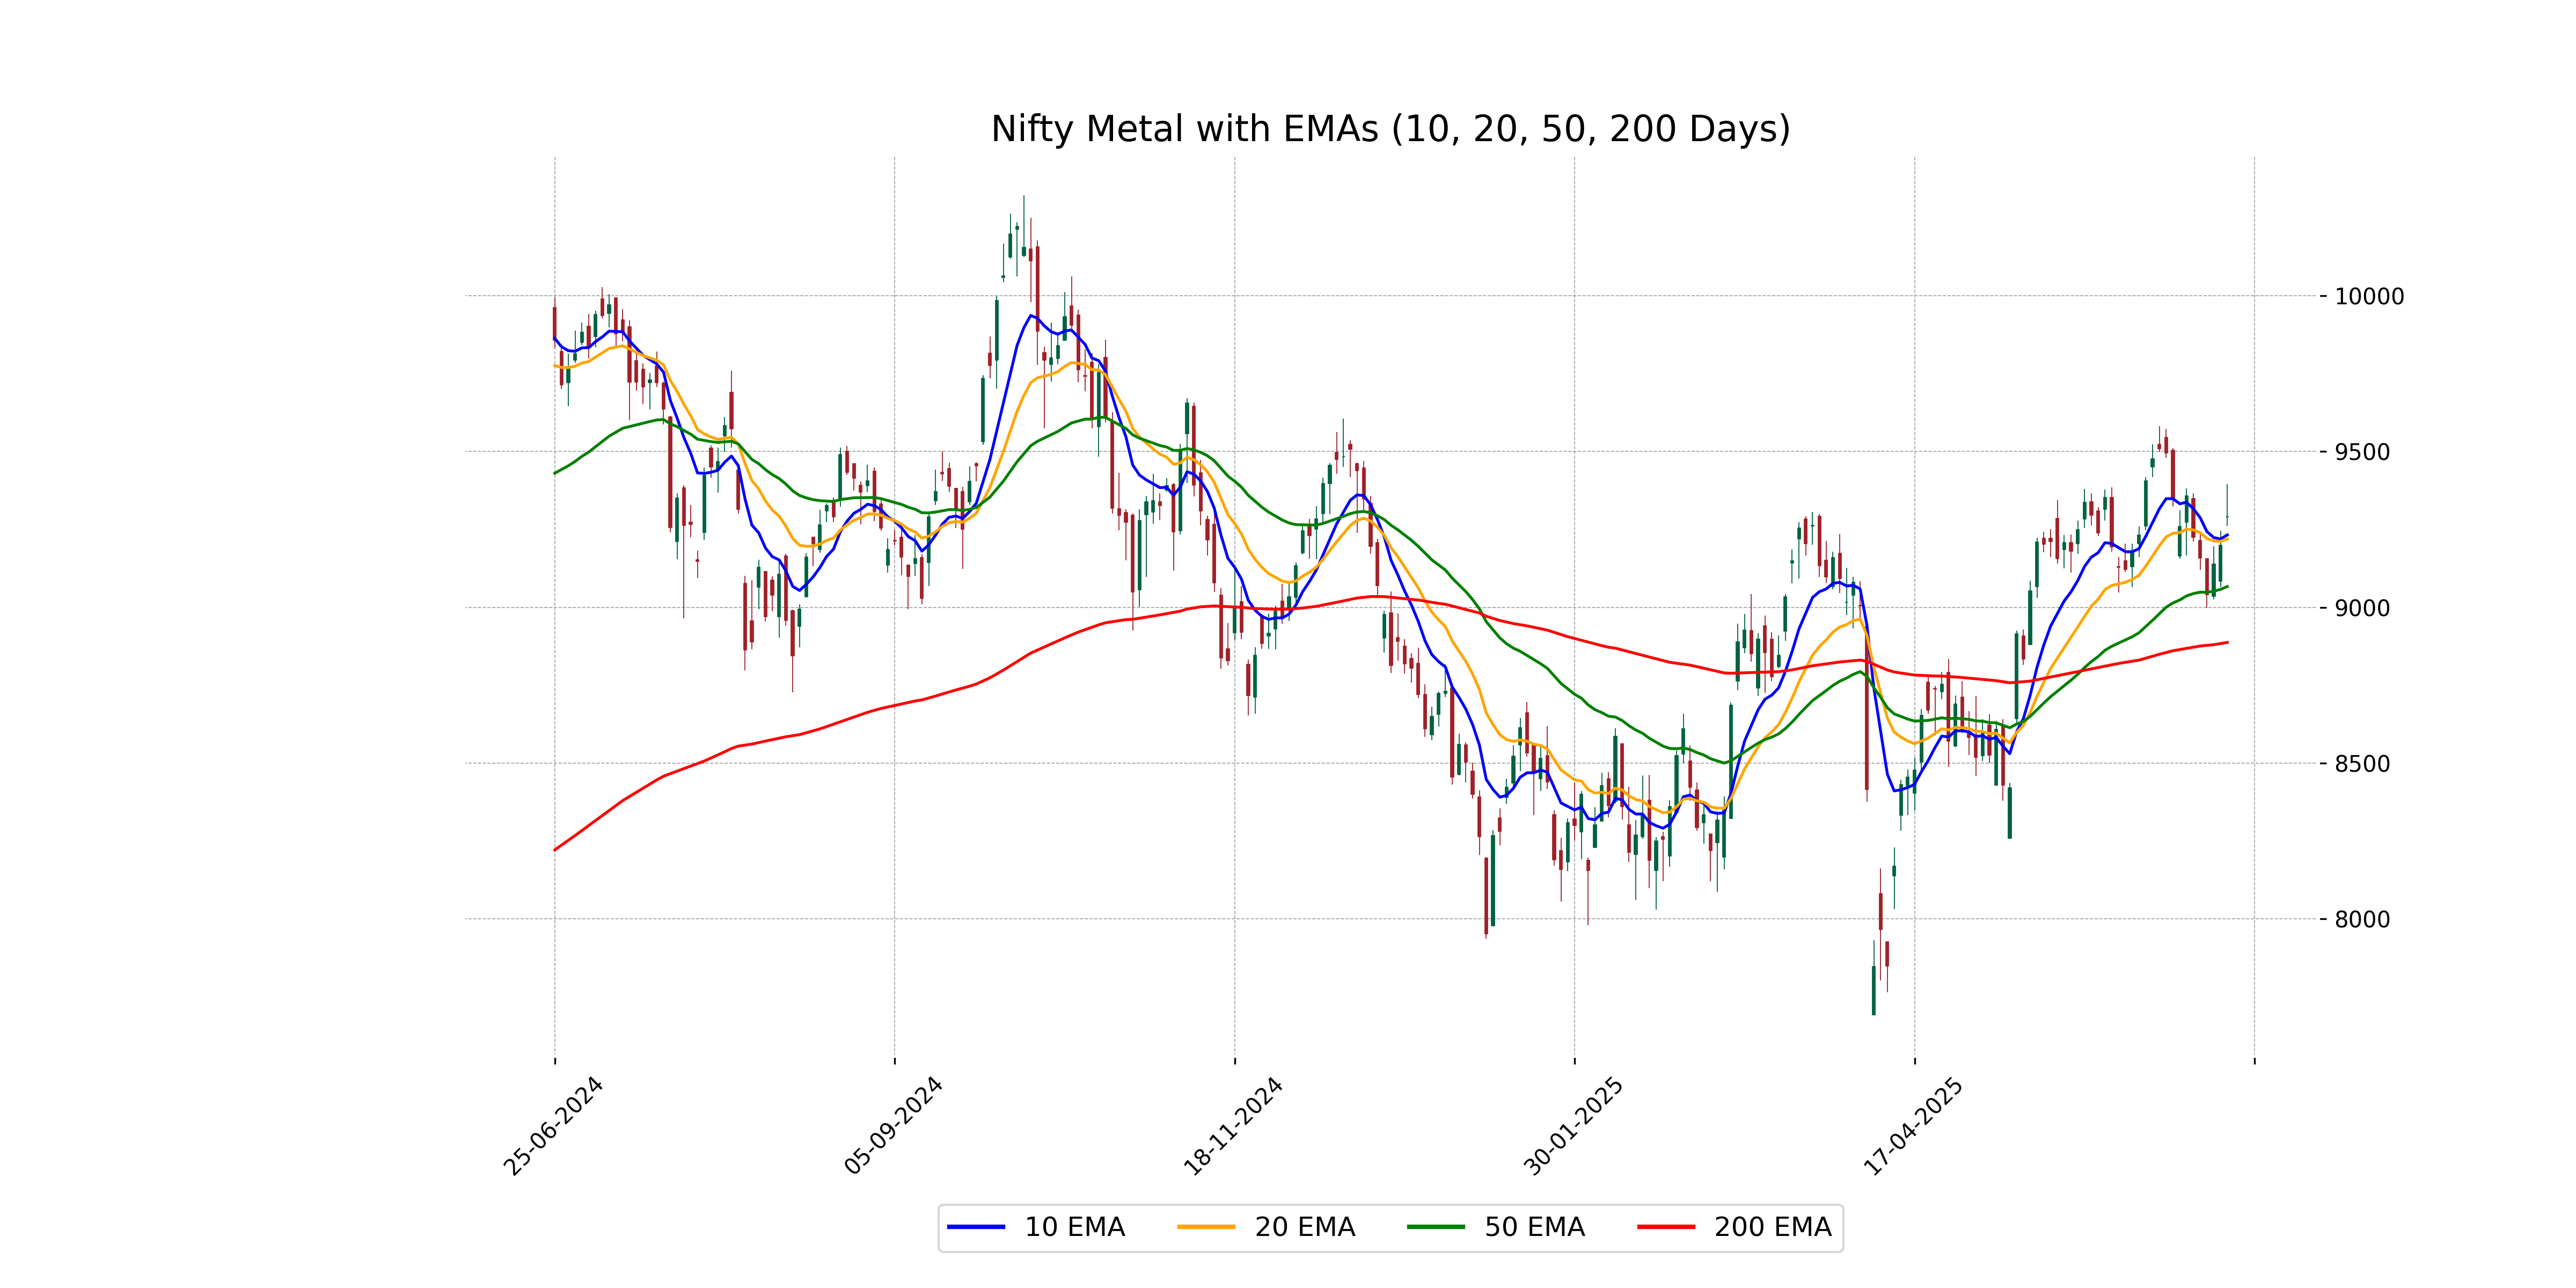
Relationship with Key Moving Averages
Nifty Metal opened above its 10 EMA and 20 EMA, indicating a short-term uptrend. The closing price is also above the 50 EMA and 200 EMA, suggesting a strong bullish sentiment in the medium to long term.
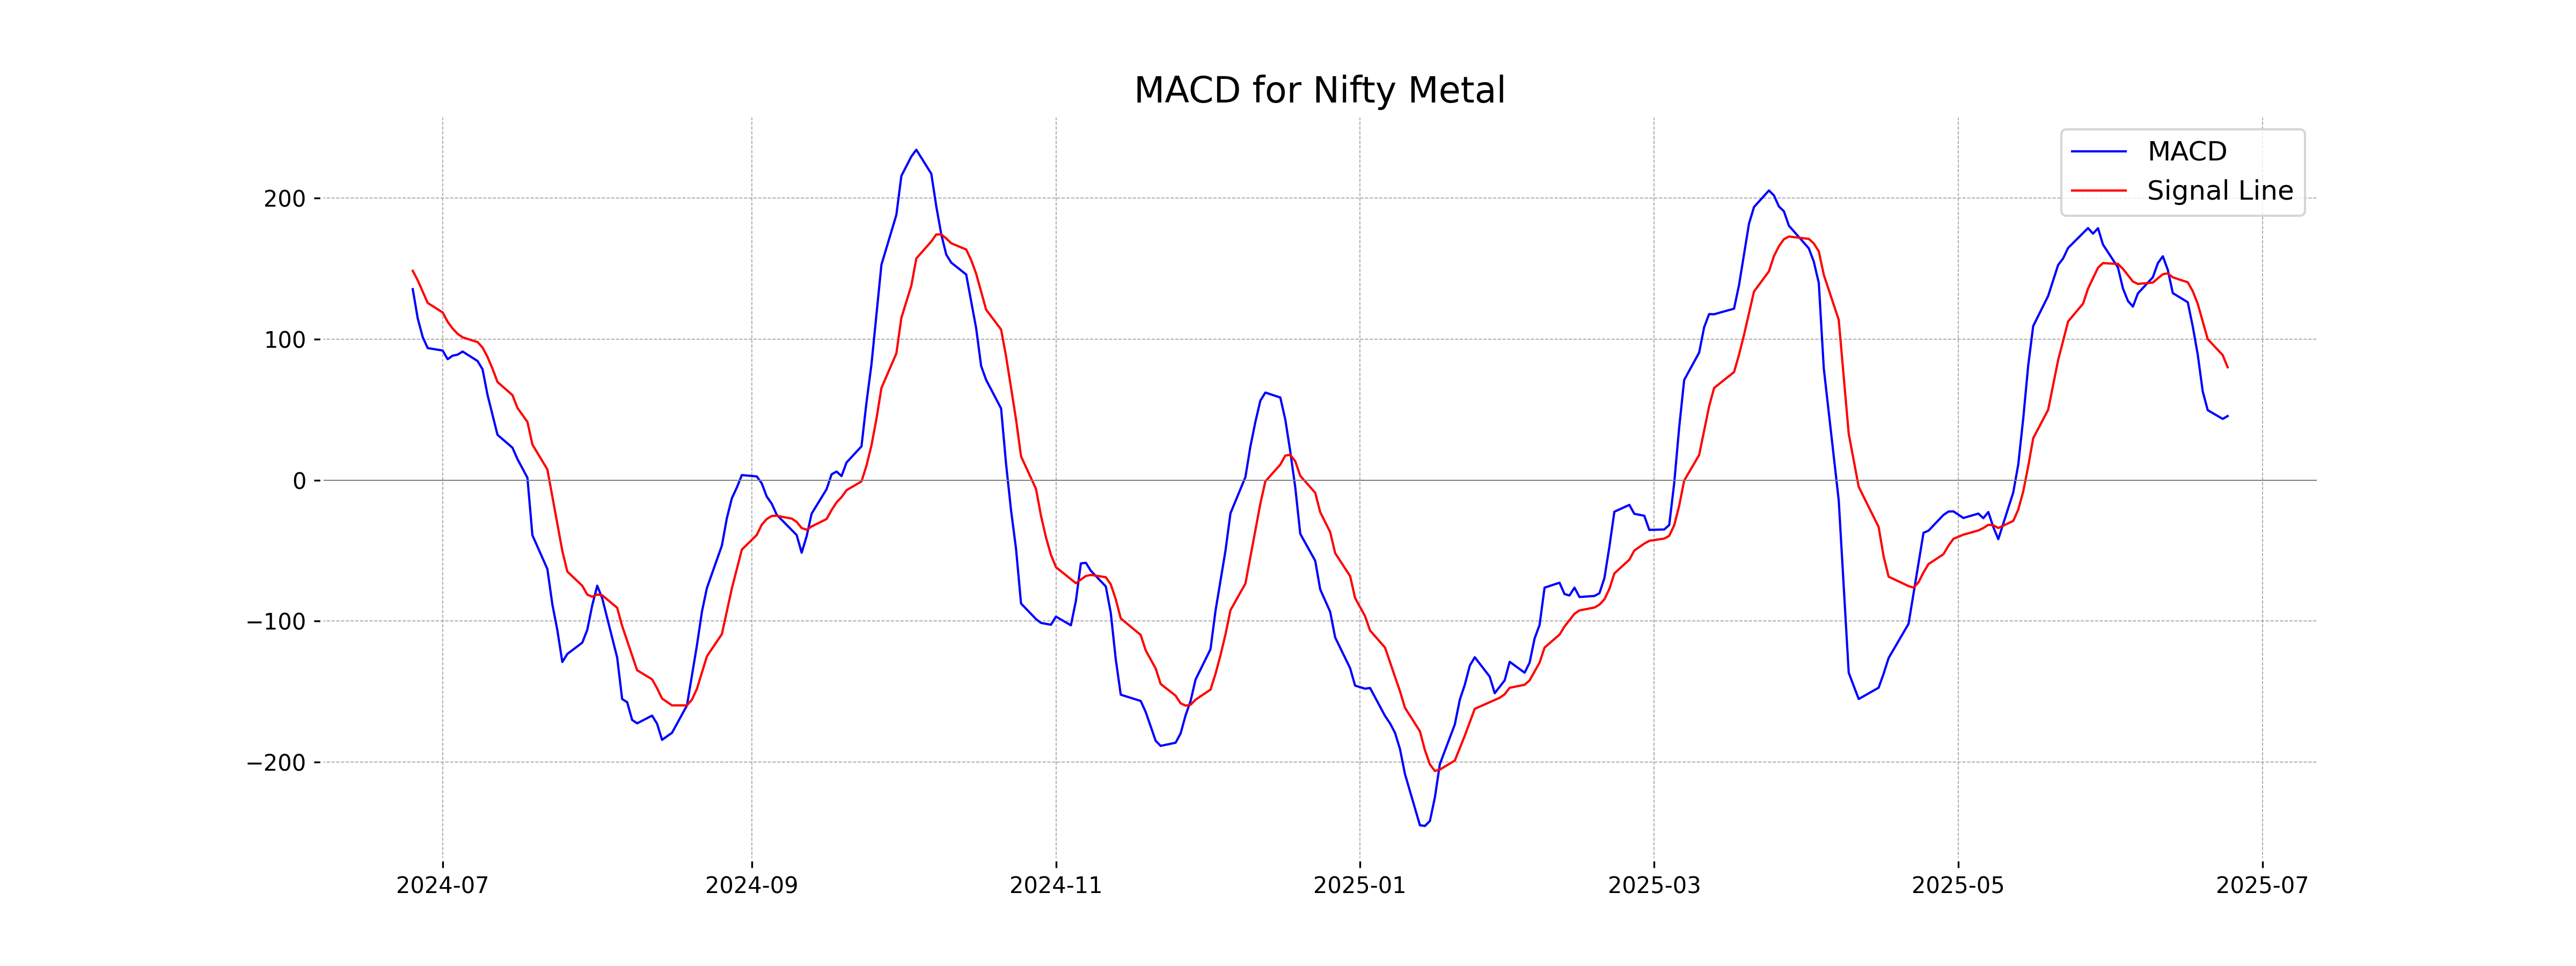
Moving Averages Trend (MACD)
The MACD value for Nifty Metal is 45.49 with a MACD Signal of 80.11, indicating that the MACD line is below the signal line. This suggests potential bearish momentum, but since the difference is not too large, it could be indicating a consolidation phase rather than a strong downtrend.
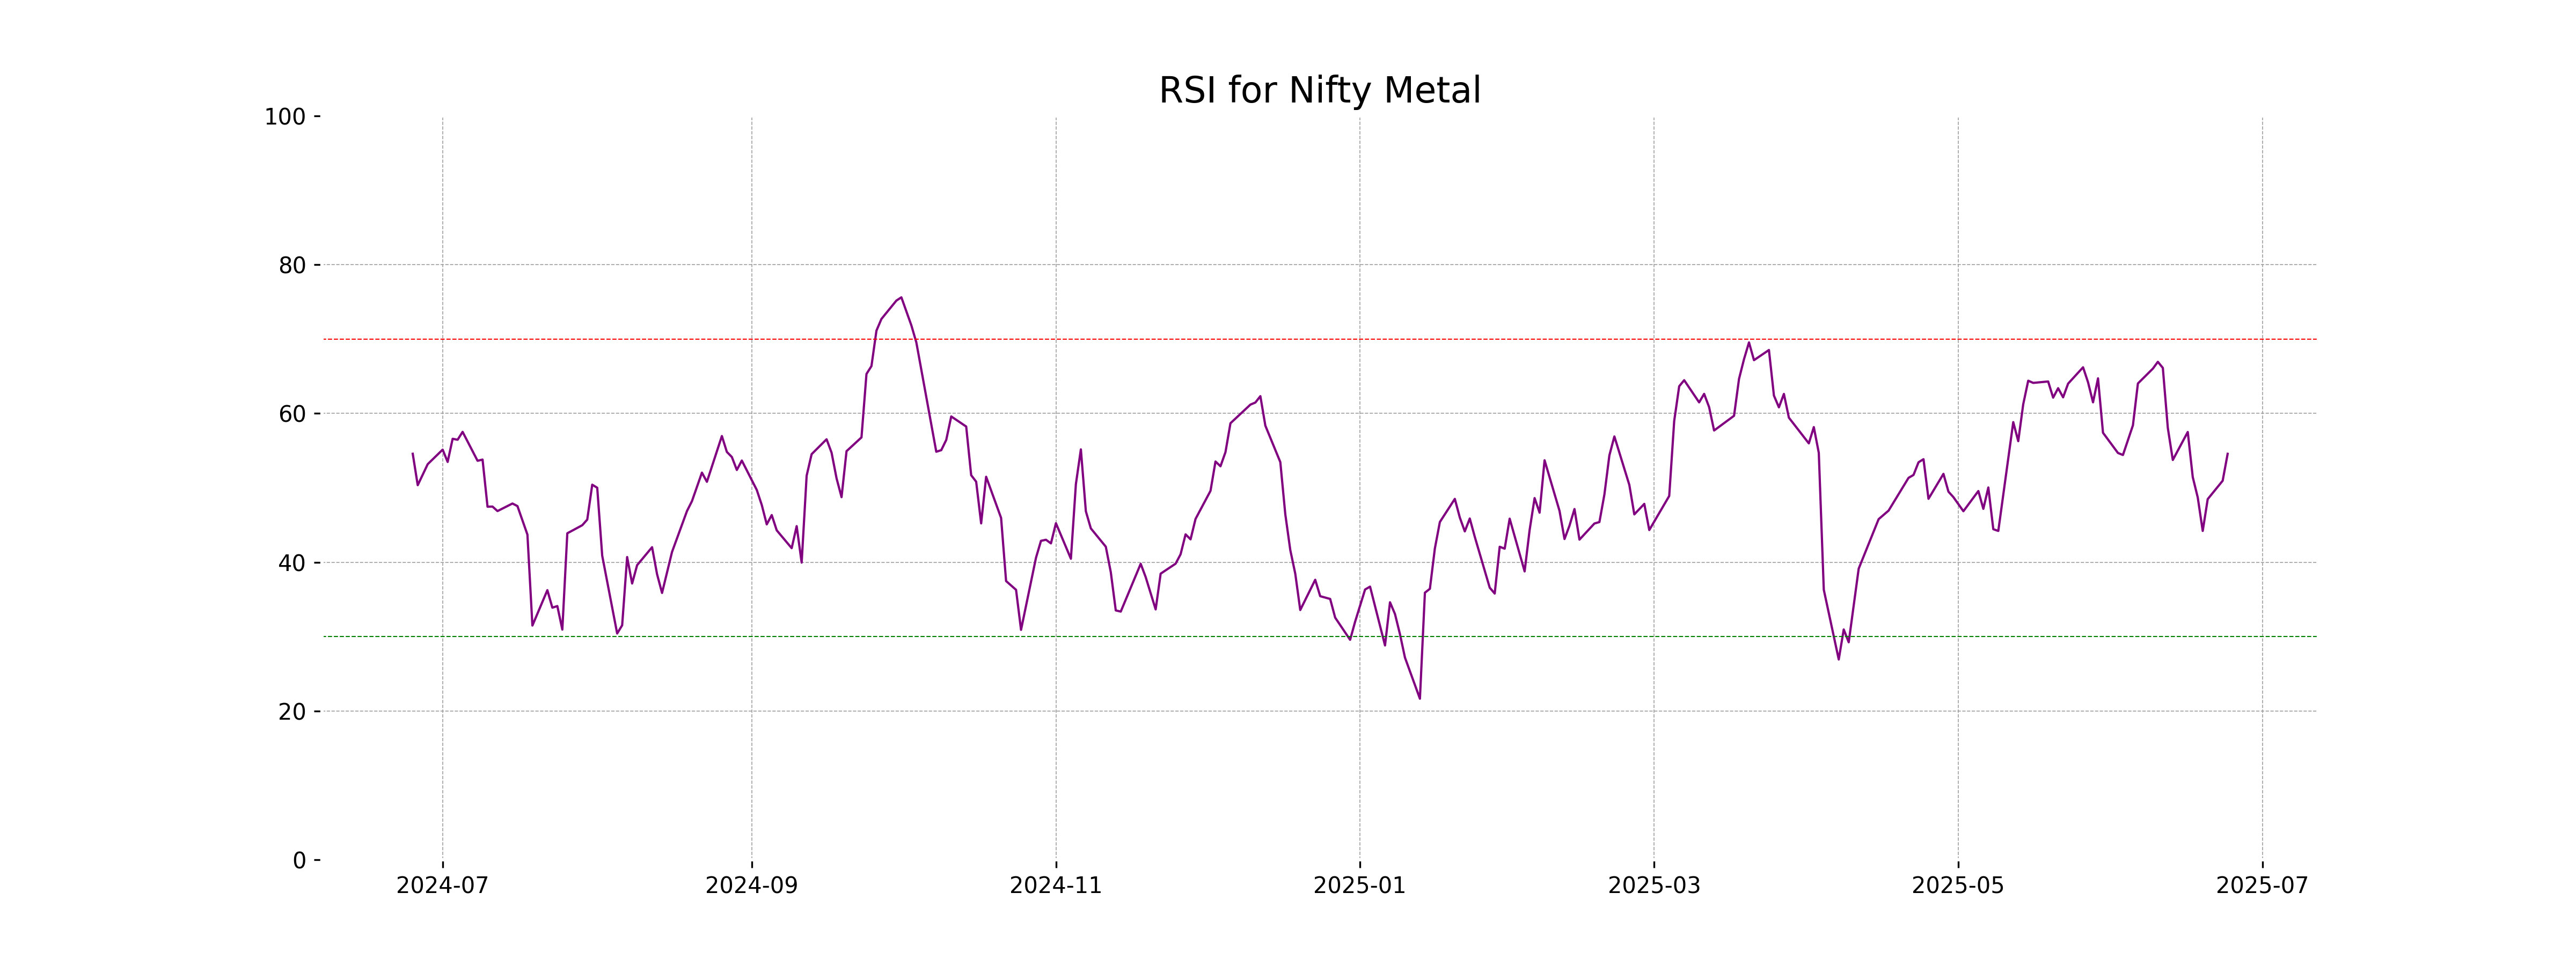
RSI Analysis
The RSI (Relative Strength Index) value for Nifty Metal is 54.58, which suggests that the stock is in a neutral zone, indicating a balance between buying and selling pressures. Typically, an RSI above 70 indicates overbought conditions, while an RSI below 30 points to an oversold market, hence Nifty Metal is currently not exhibiting signs of either extreme.
Analysis for Nifty Bank - June 24, 2025
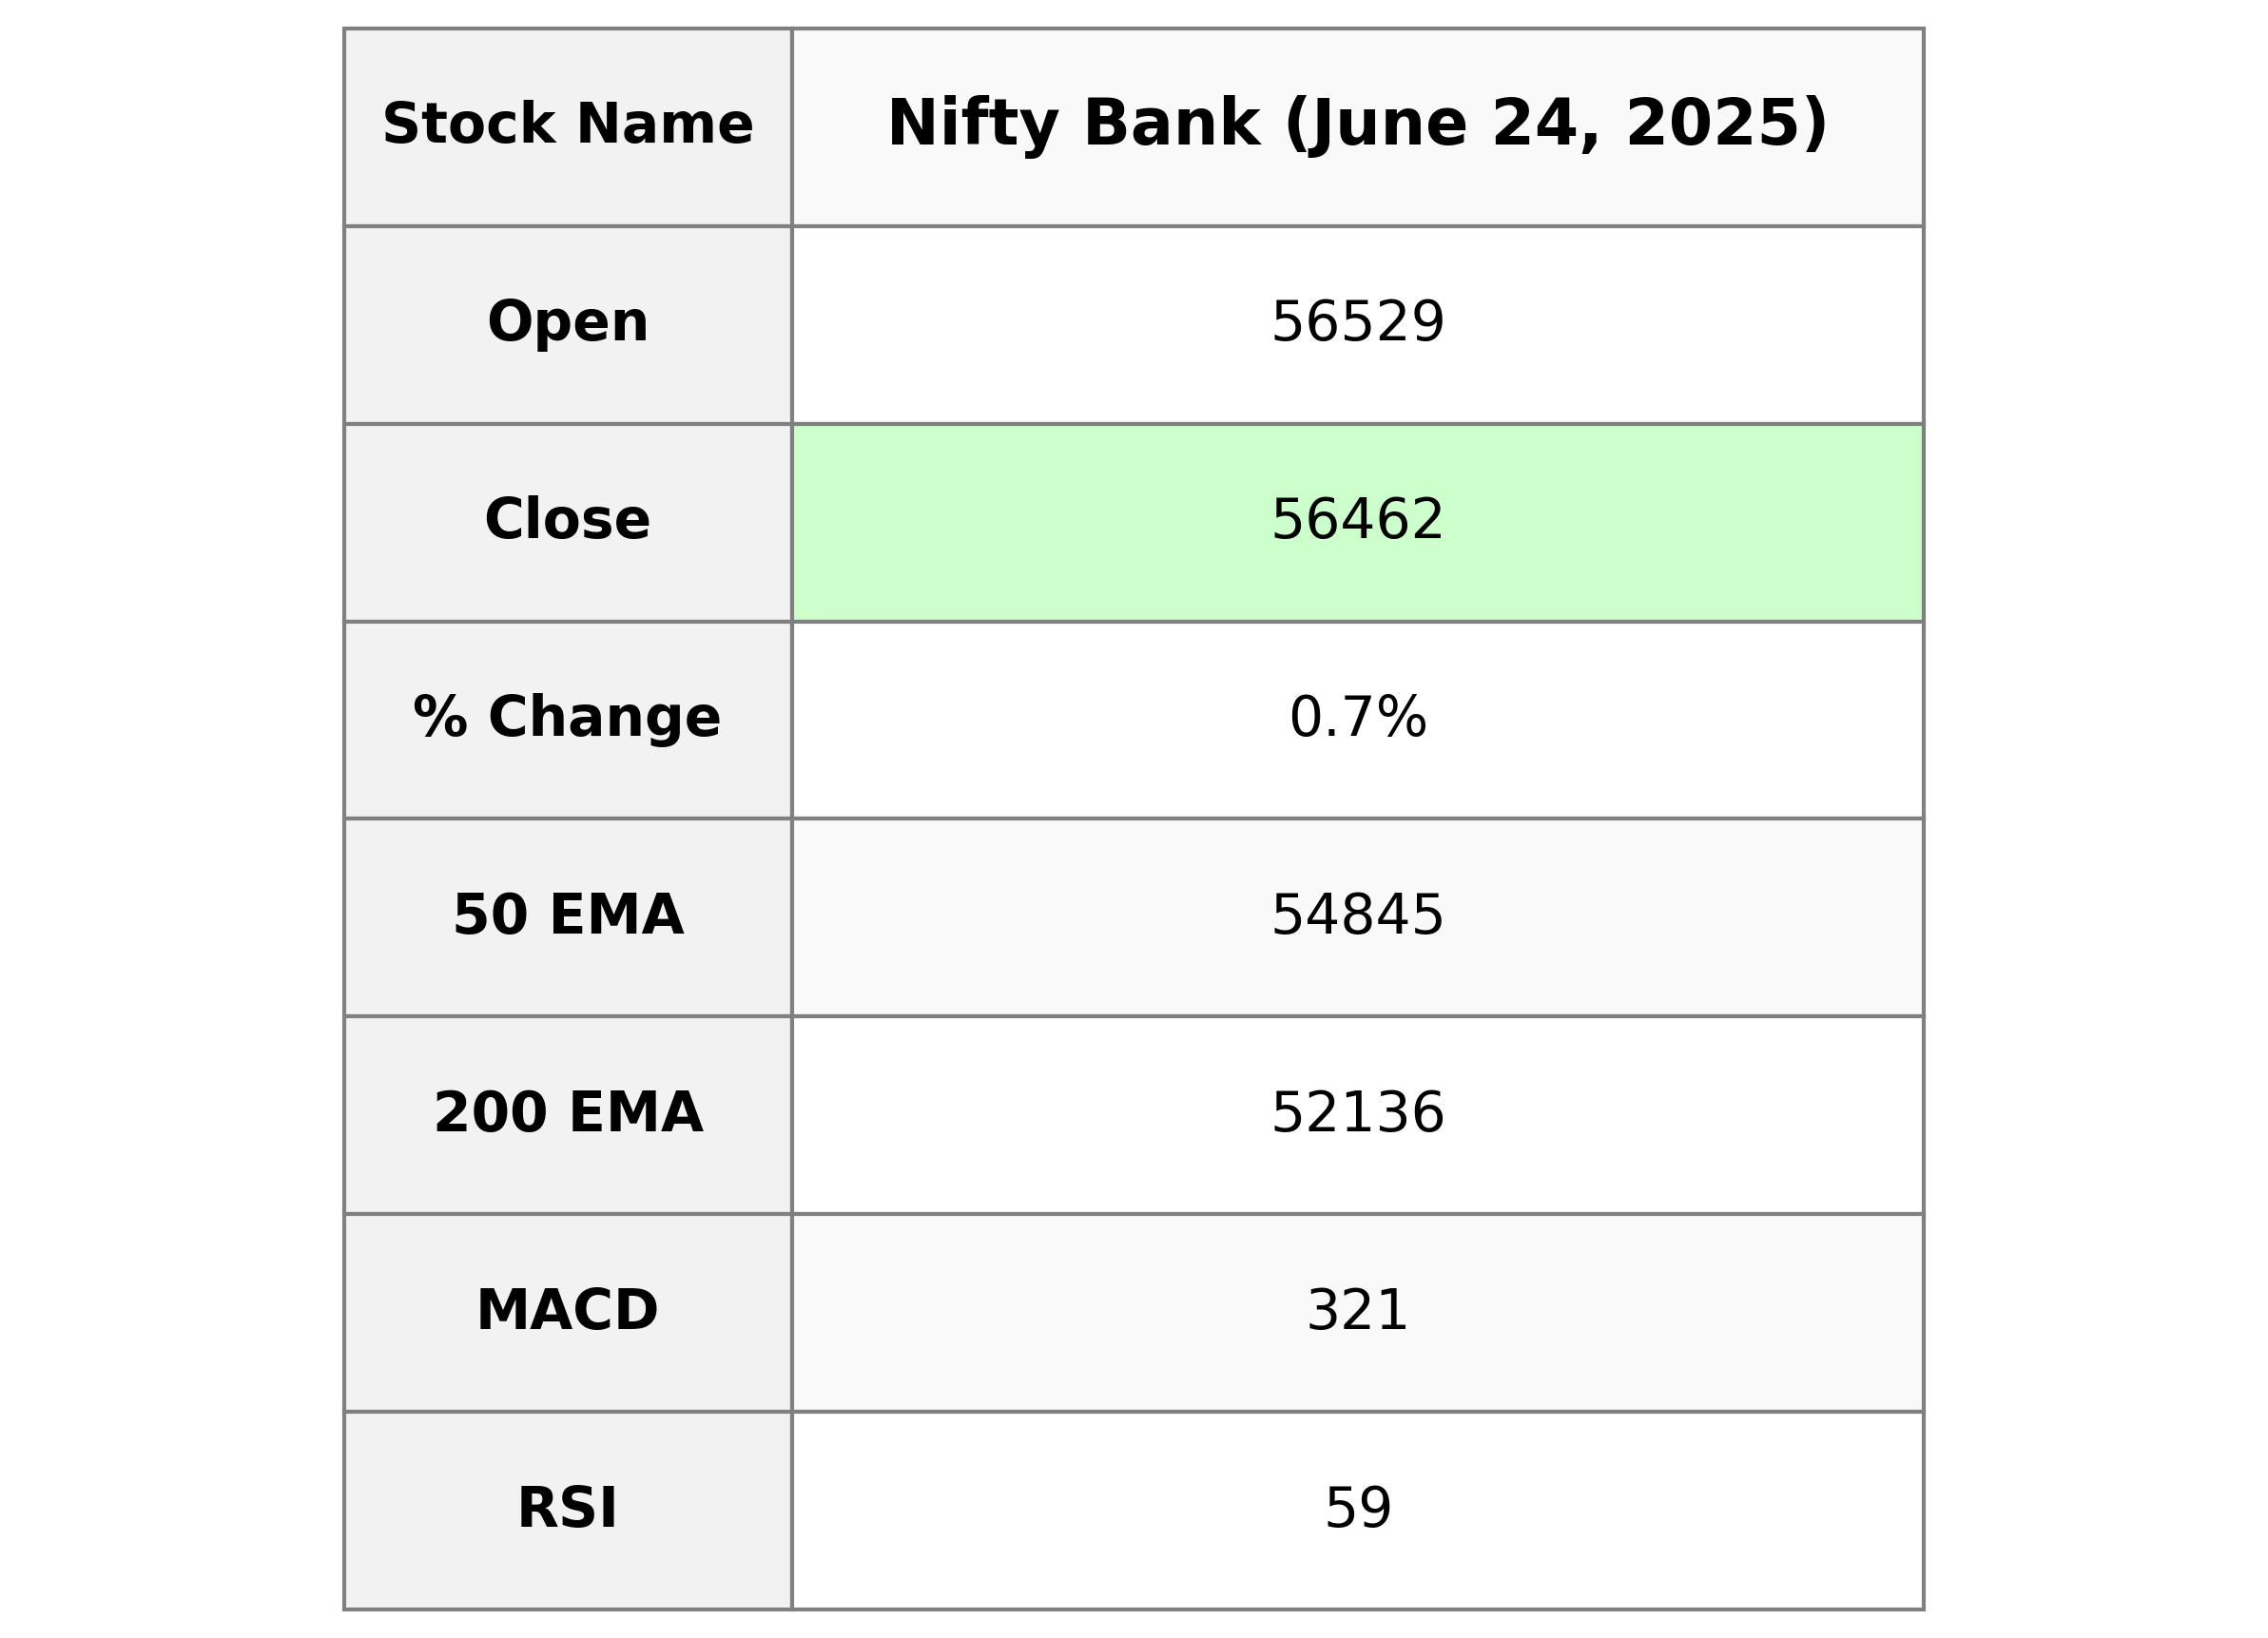
Nifty Bank opened at 56529.45 and closed slightly lower at 56461.90, marking a 0.72% increase in percentage change due to a 402.55 points addition from the previous close. Despite the gain, the RSI stands at 59.20, indicating a moderately strong momentum, while the MACD indicates a bearish divergence with the signal line, suggesting potential caution.
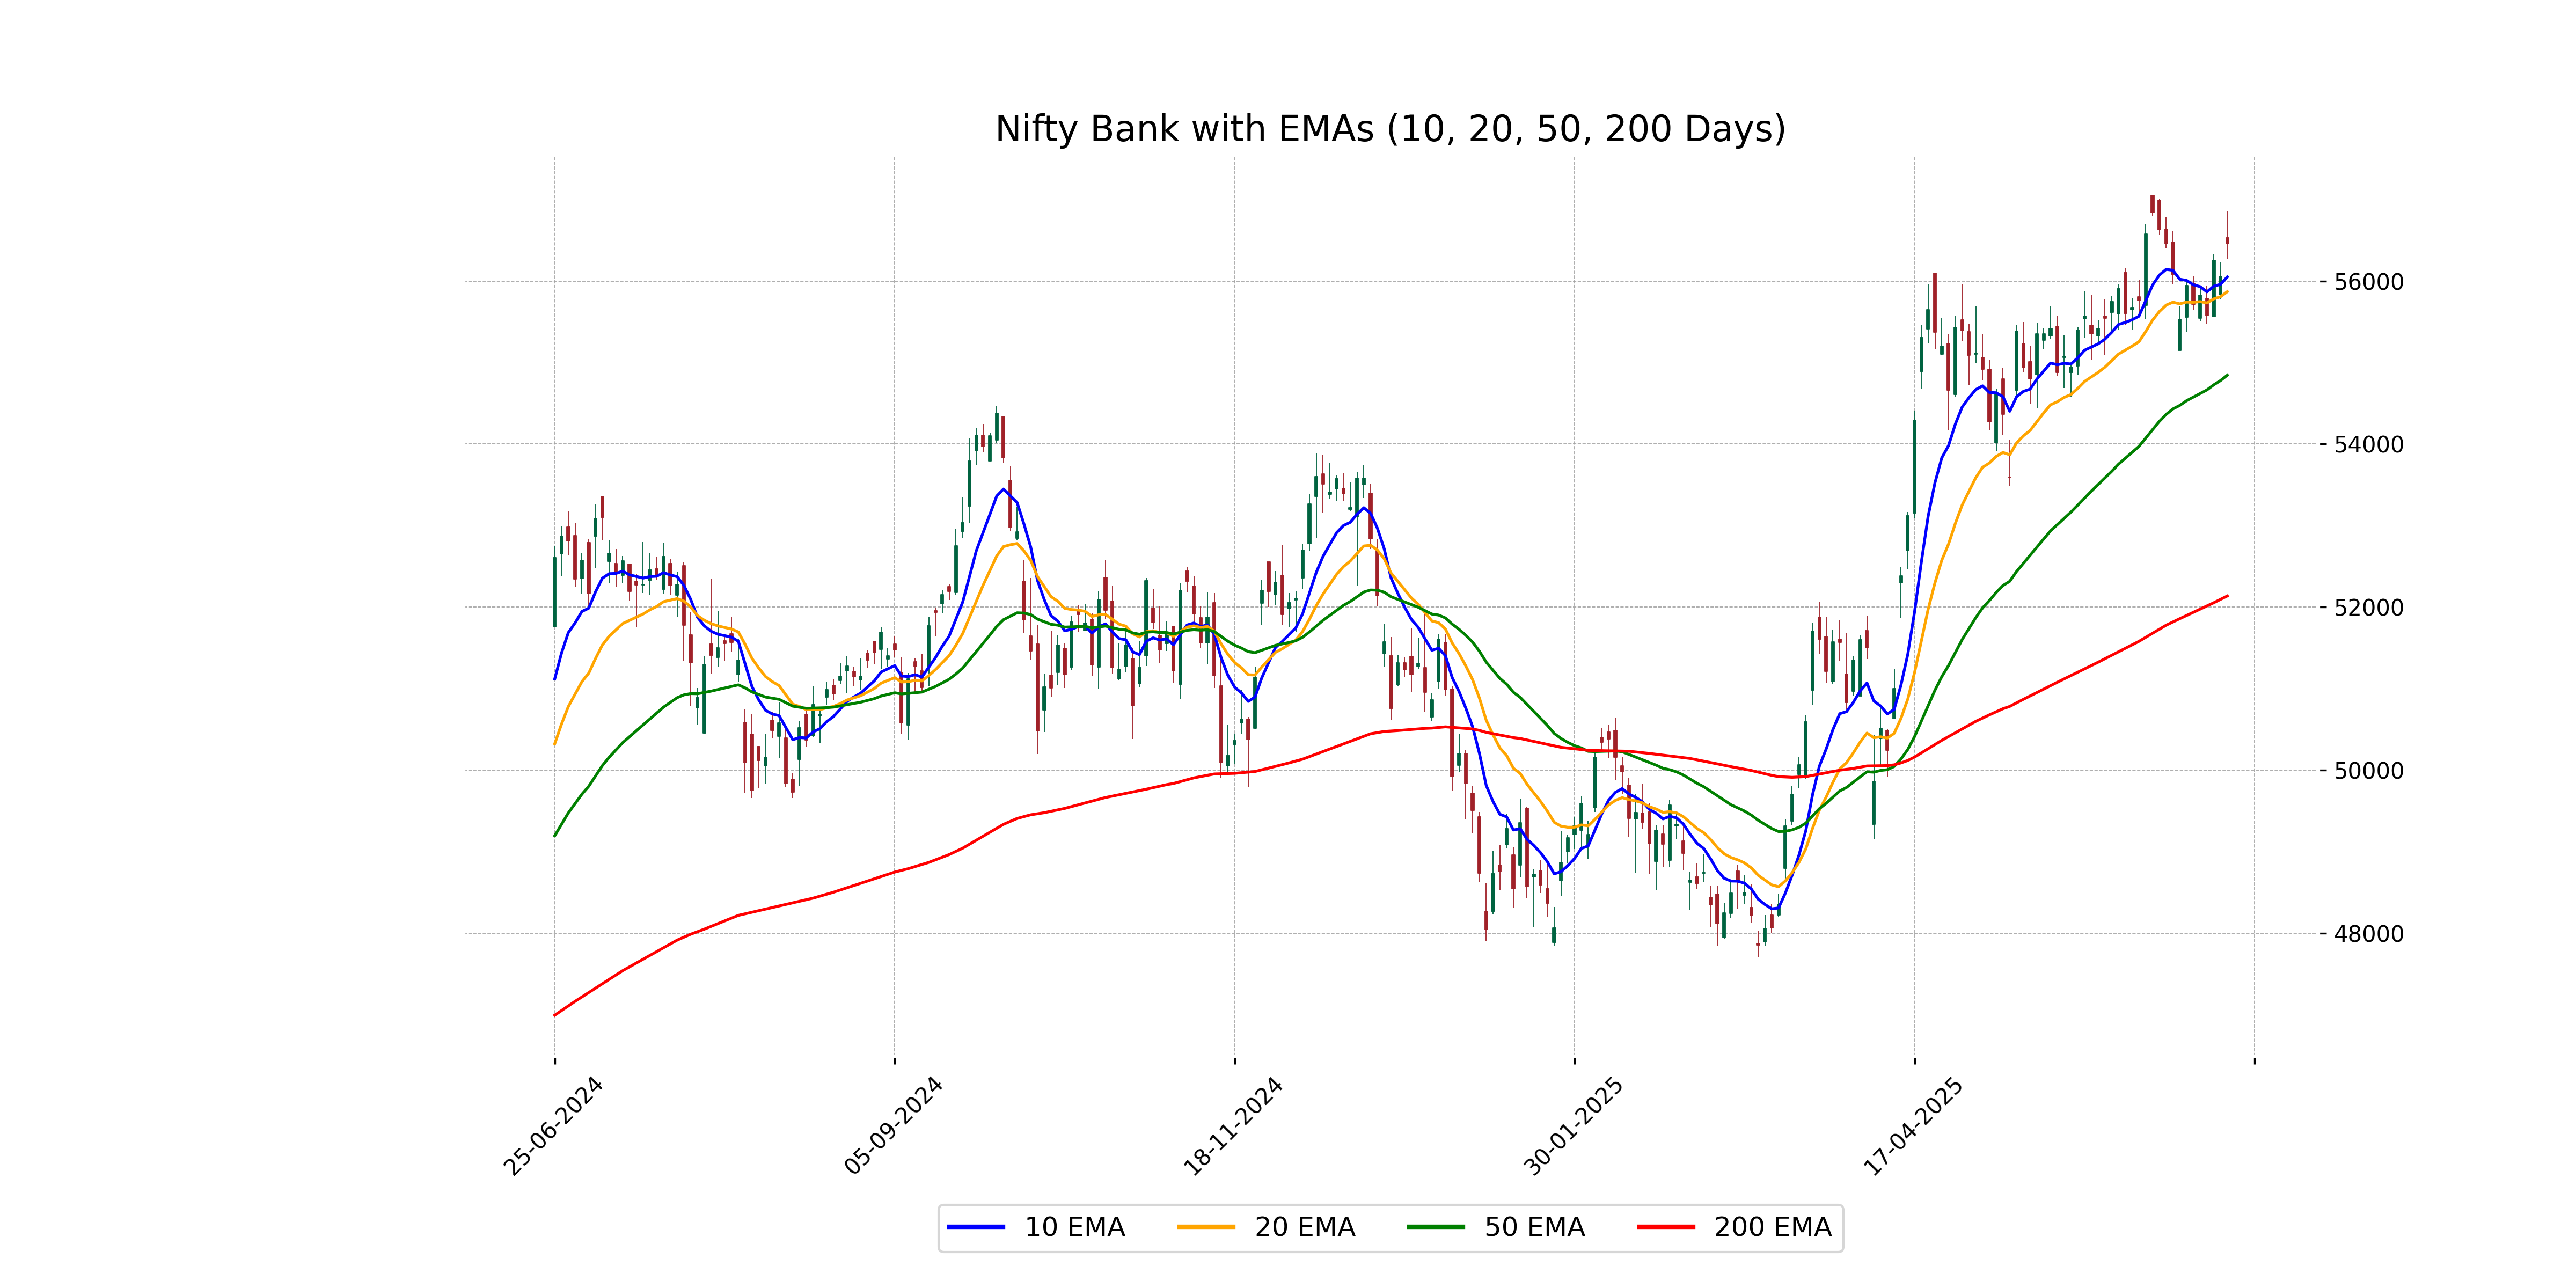
Relationship with Key Moving Averages
The Nifty Bank closed at 56,461.90, which is above its 10 EMA of 56,051.00, 20 EMA of 55,869.98, and significantly above its 50 EMA of 54,844.86, indicating a strong bullish trend. The close is also notably higher than the 200 EMA of 52,135.95, suggesting long-term strength.
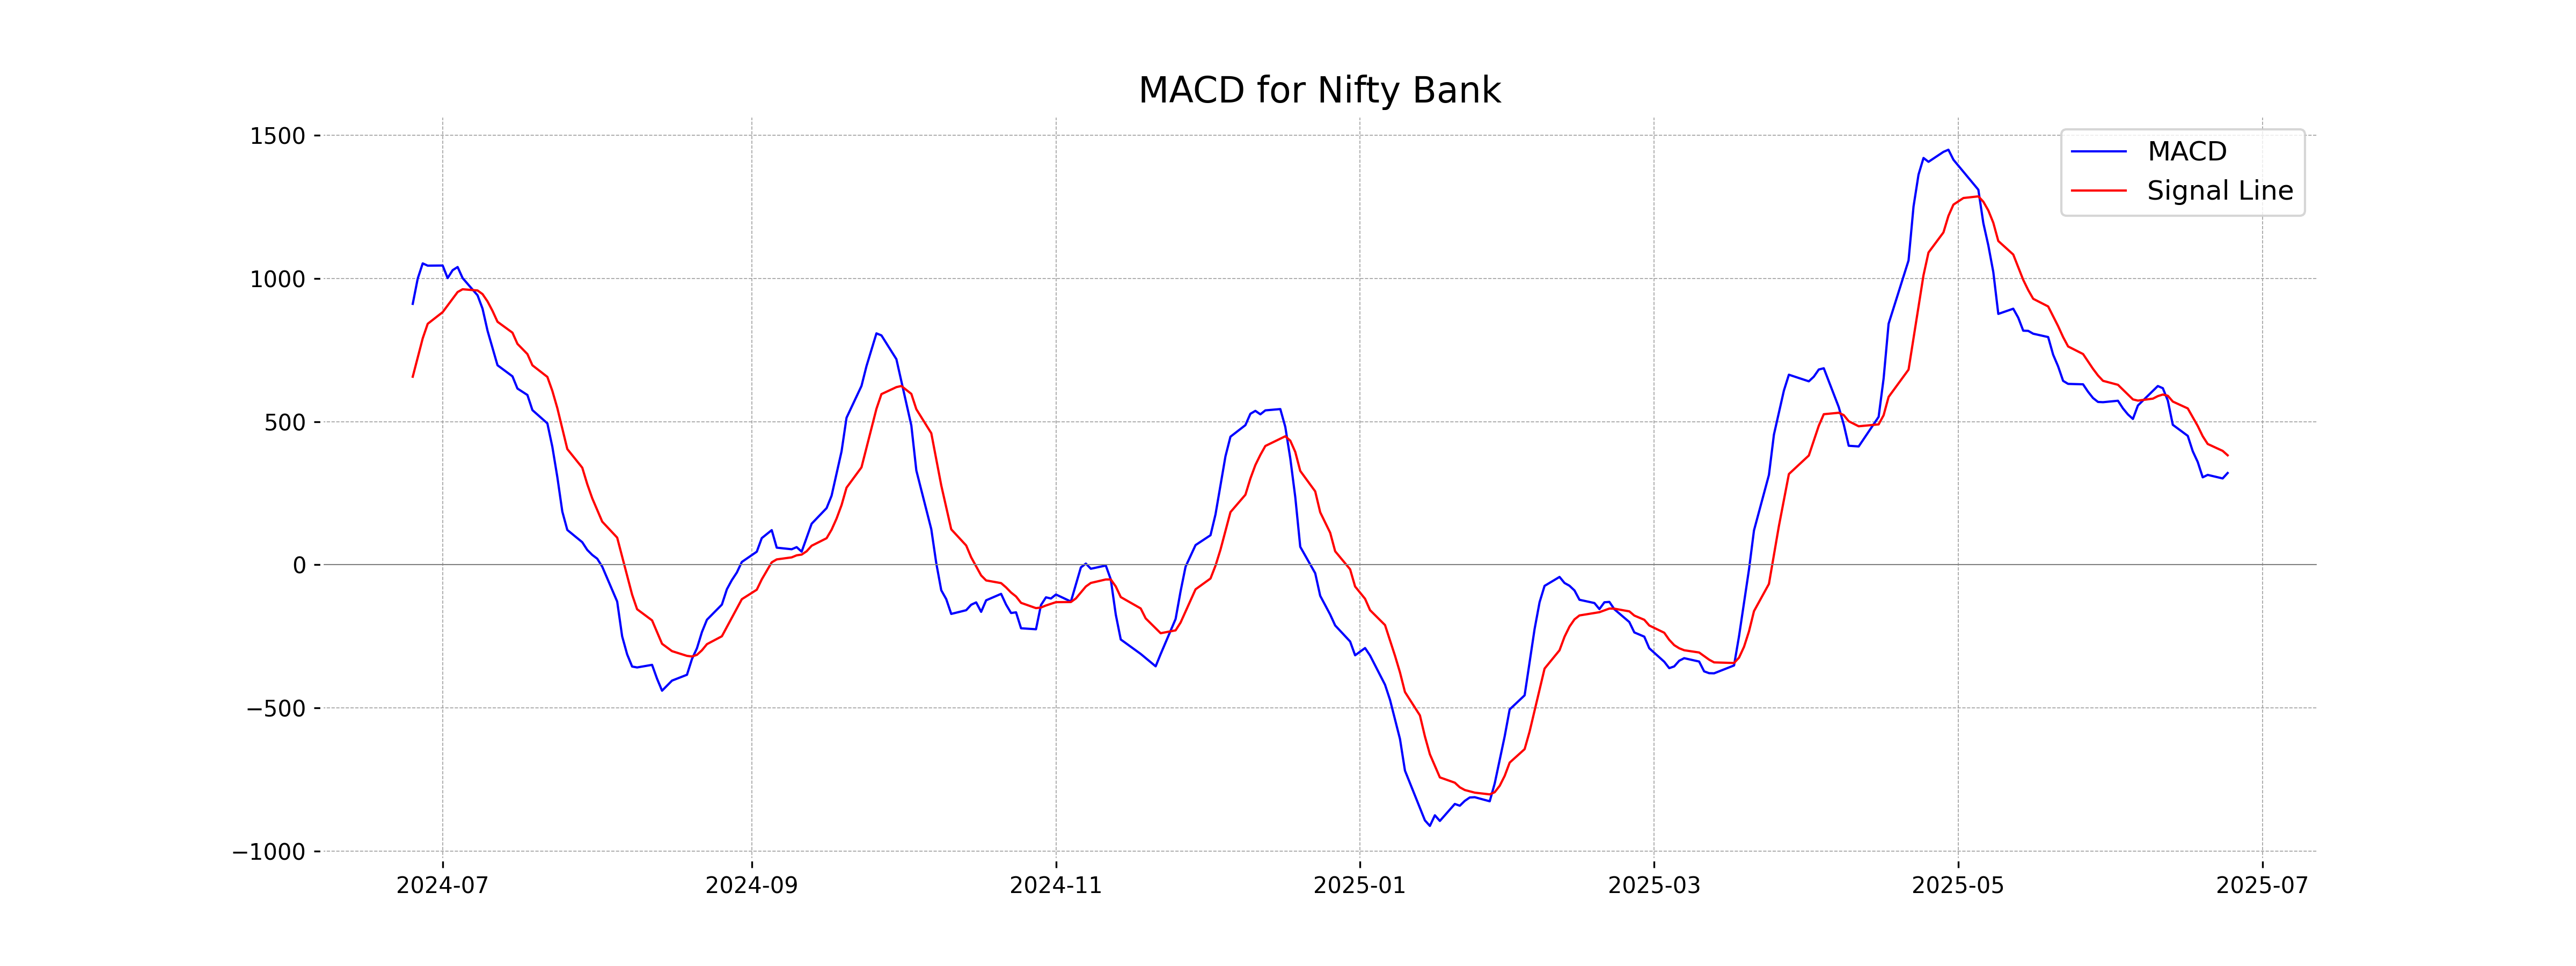
Moving Averages Trend (MACD)
The MACD for Nifty Bank is at 320.58, while the MACD Signal is higher at 382.37. This suggests a bearish signal, as the MACD is below the MACD Signal line, which could indicate a potential downtrend or weakening momentum.
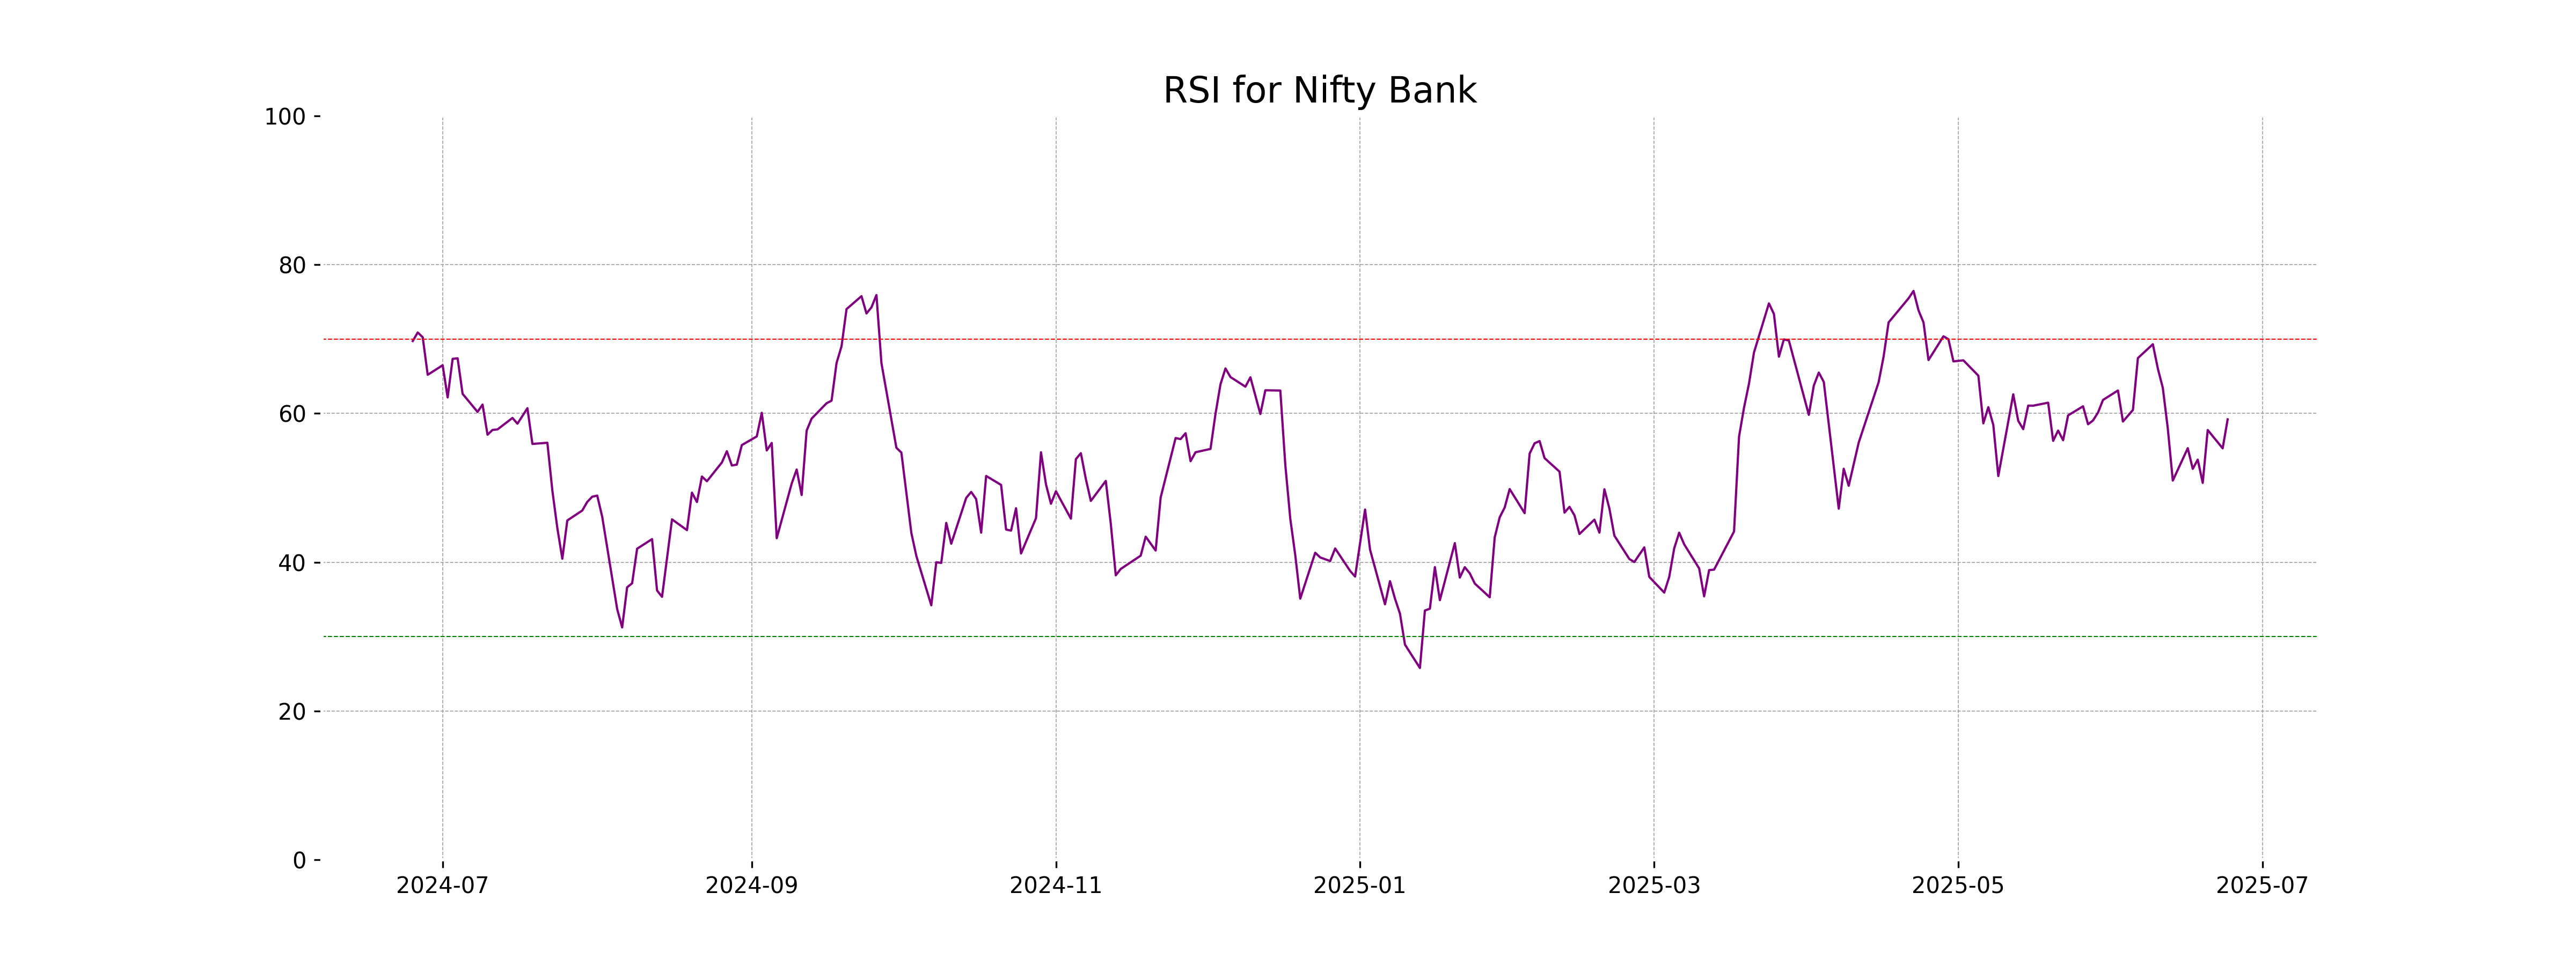
RSI Analysis
The Relative Strength Index (RSI) for Nifty Bank is 59.20, suggesting that the index is in a neutral zone, neither overbought nor oversold. This reading indicates a relatively balanced momentum, allowing for potential room for movement in either direction.
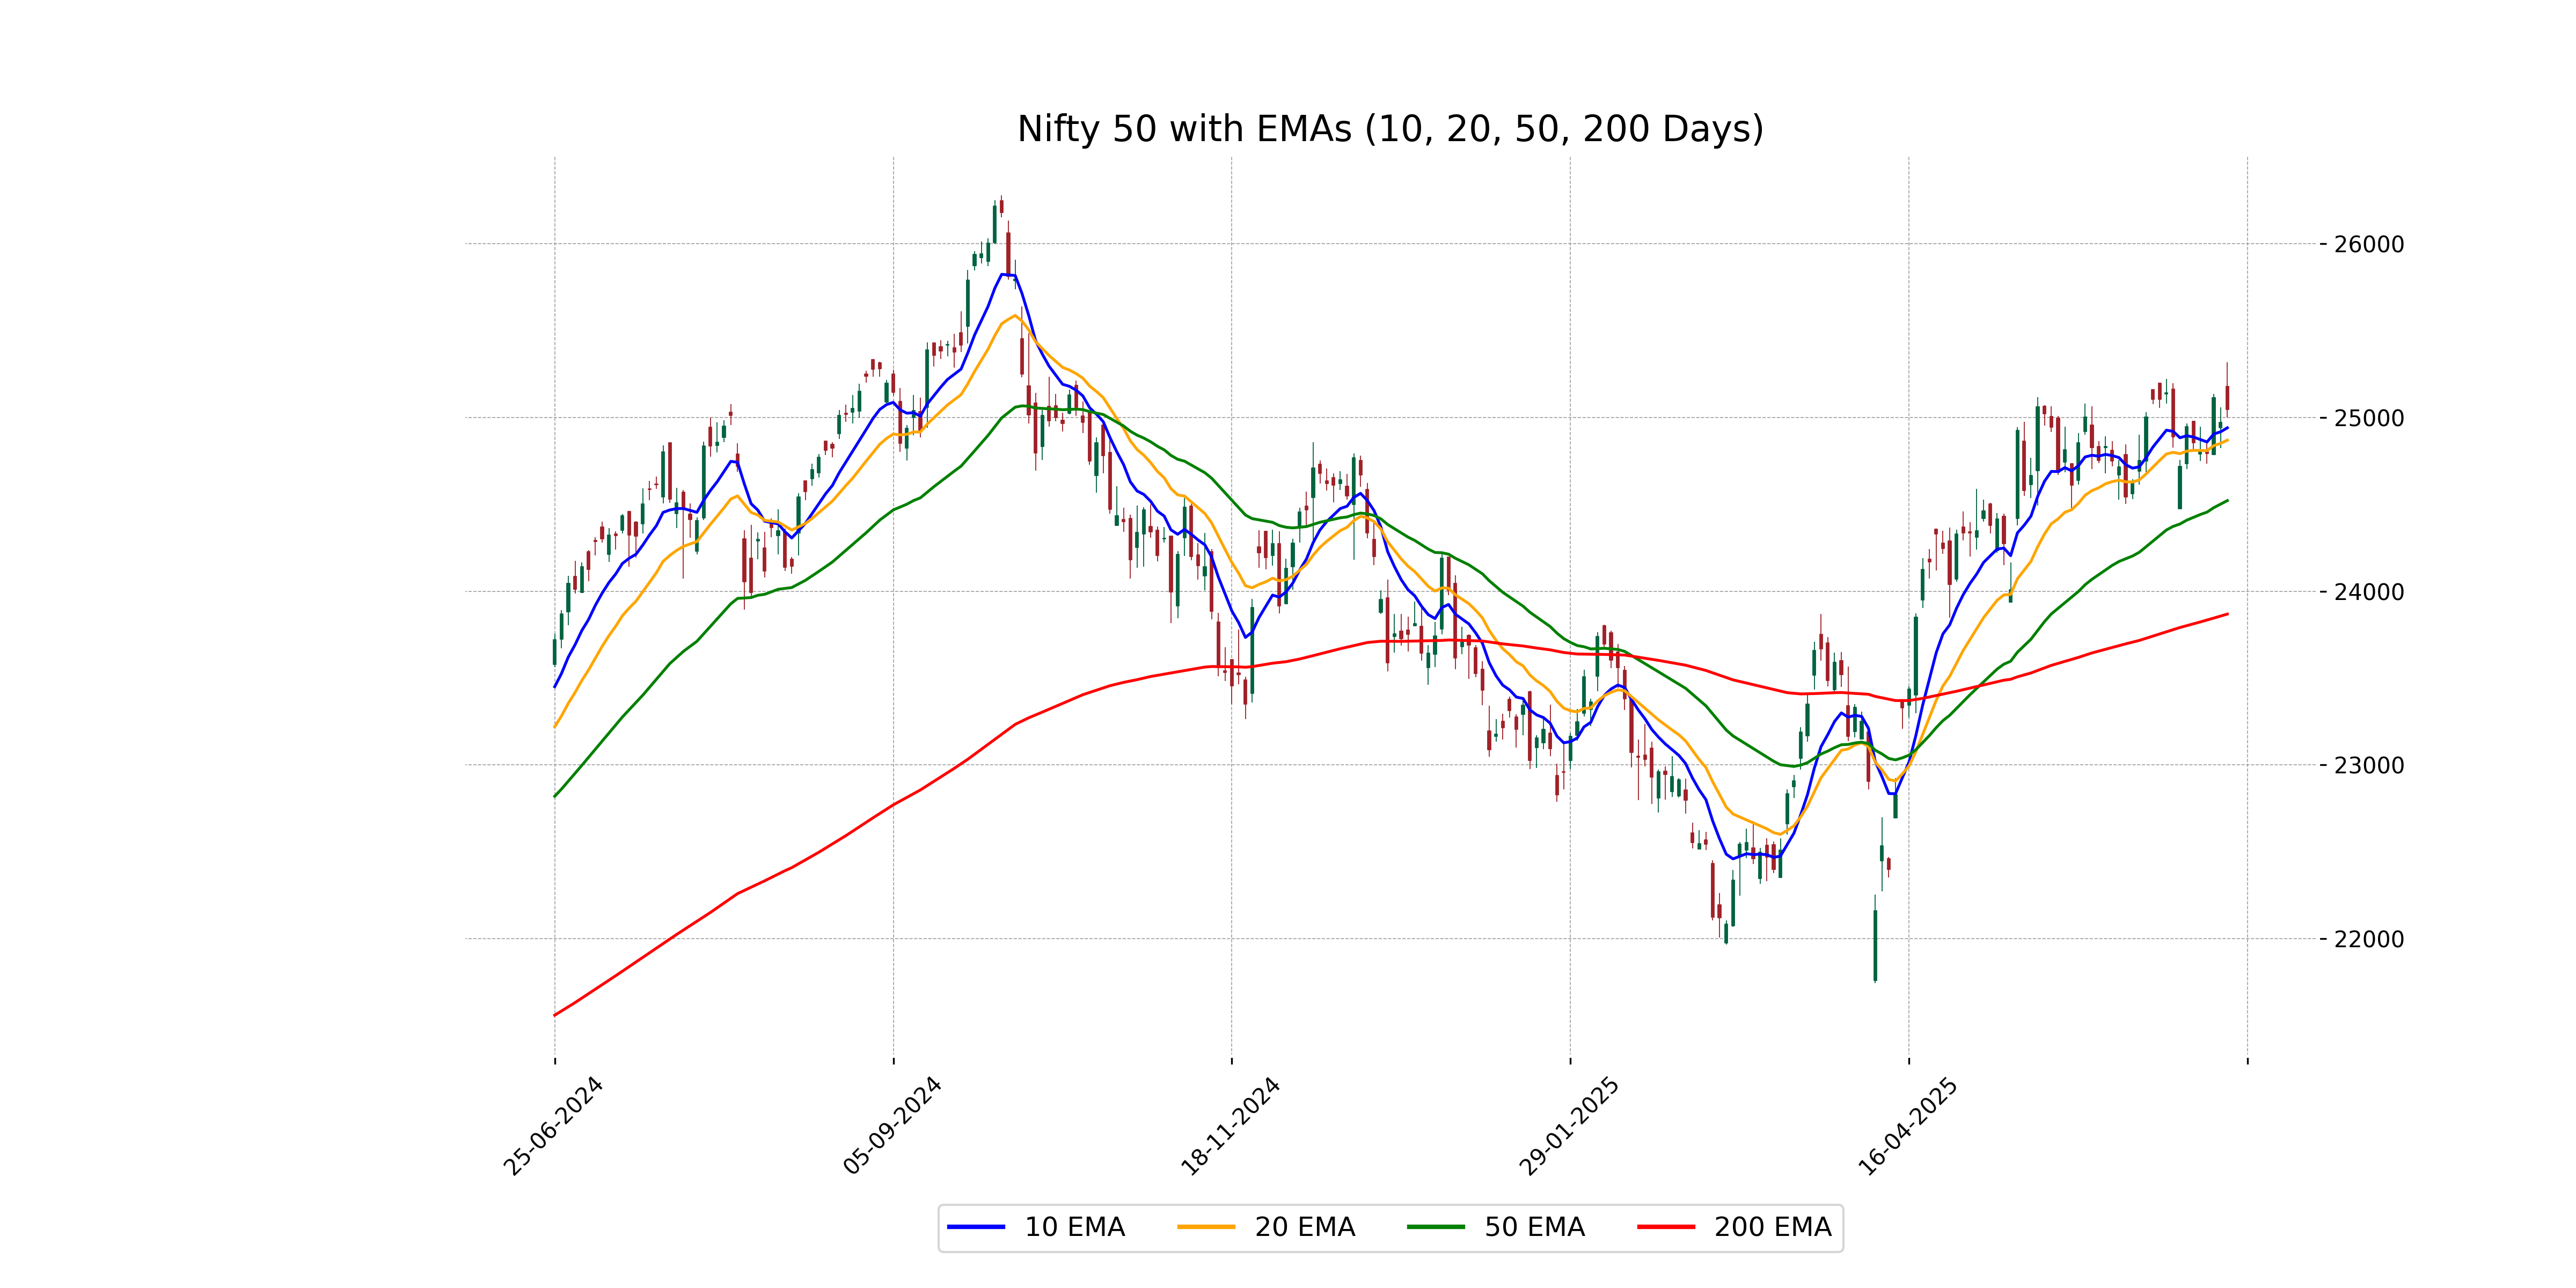
Analysis for Nifty 50 - June 24, 2025
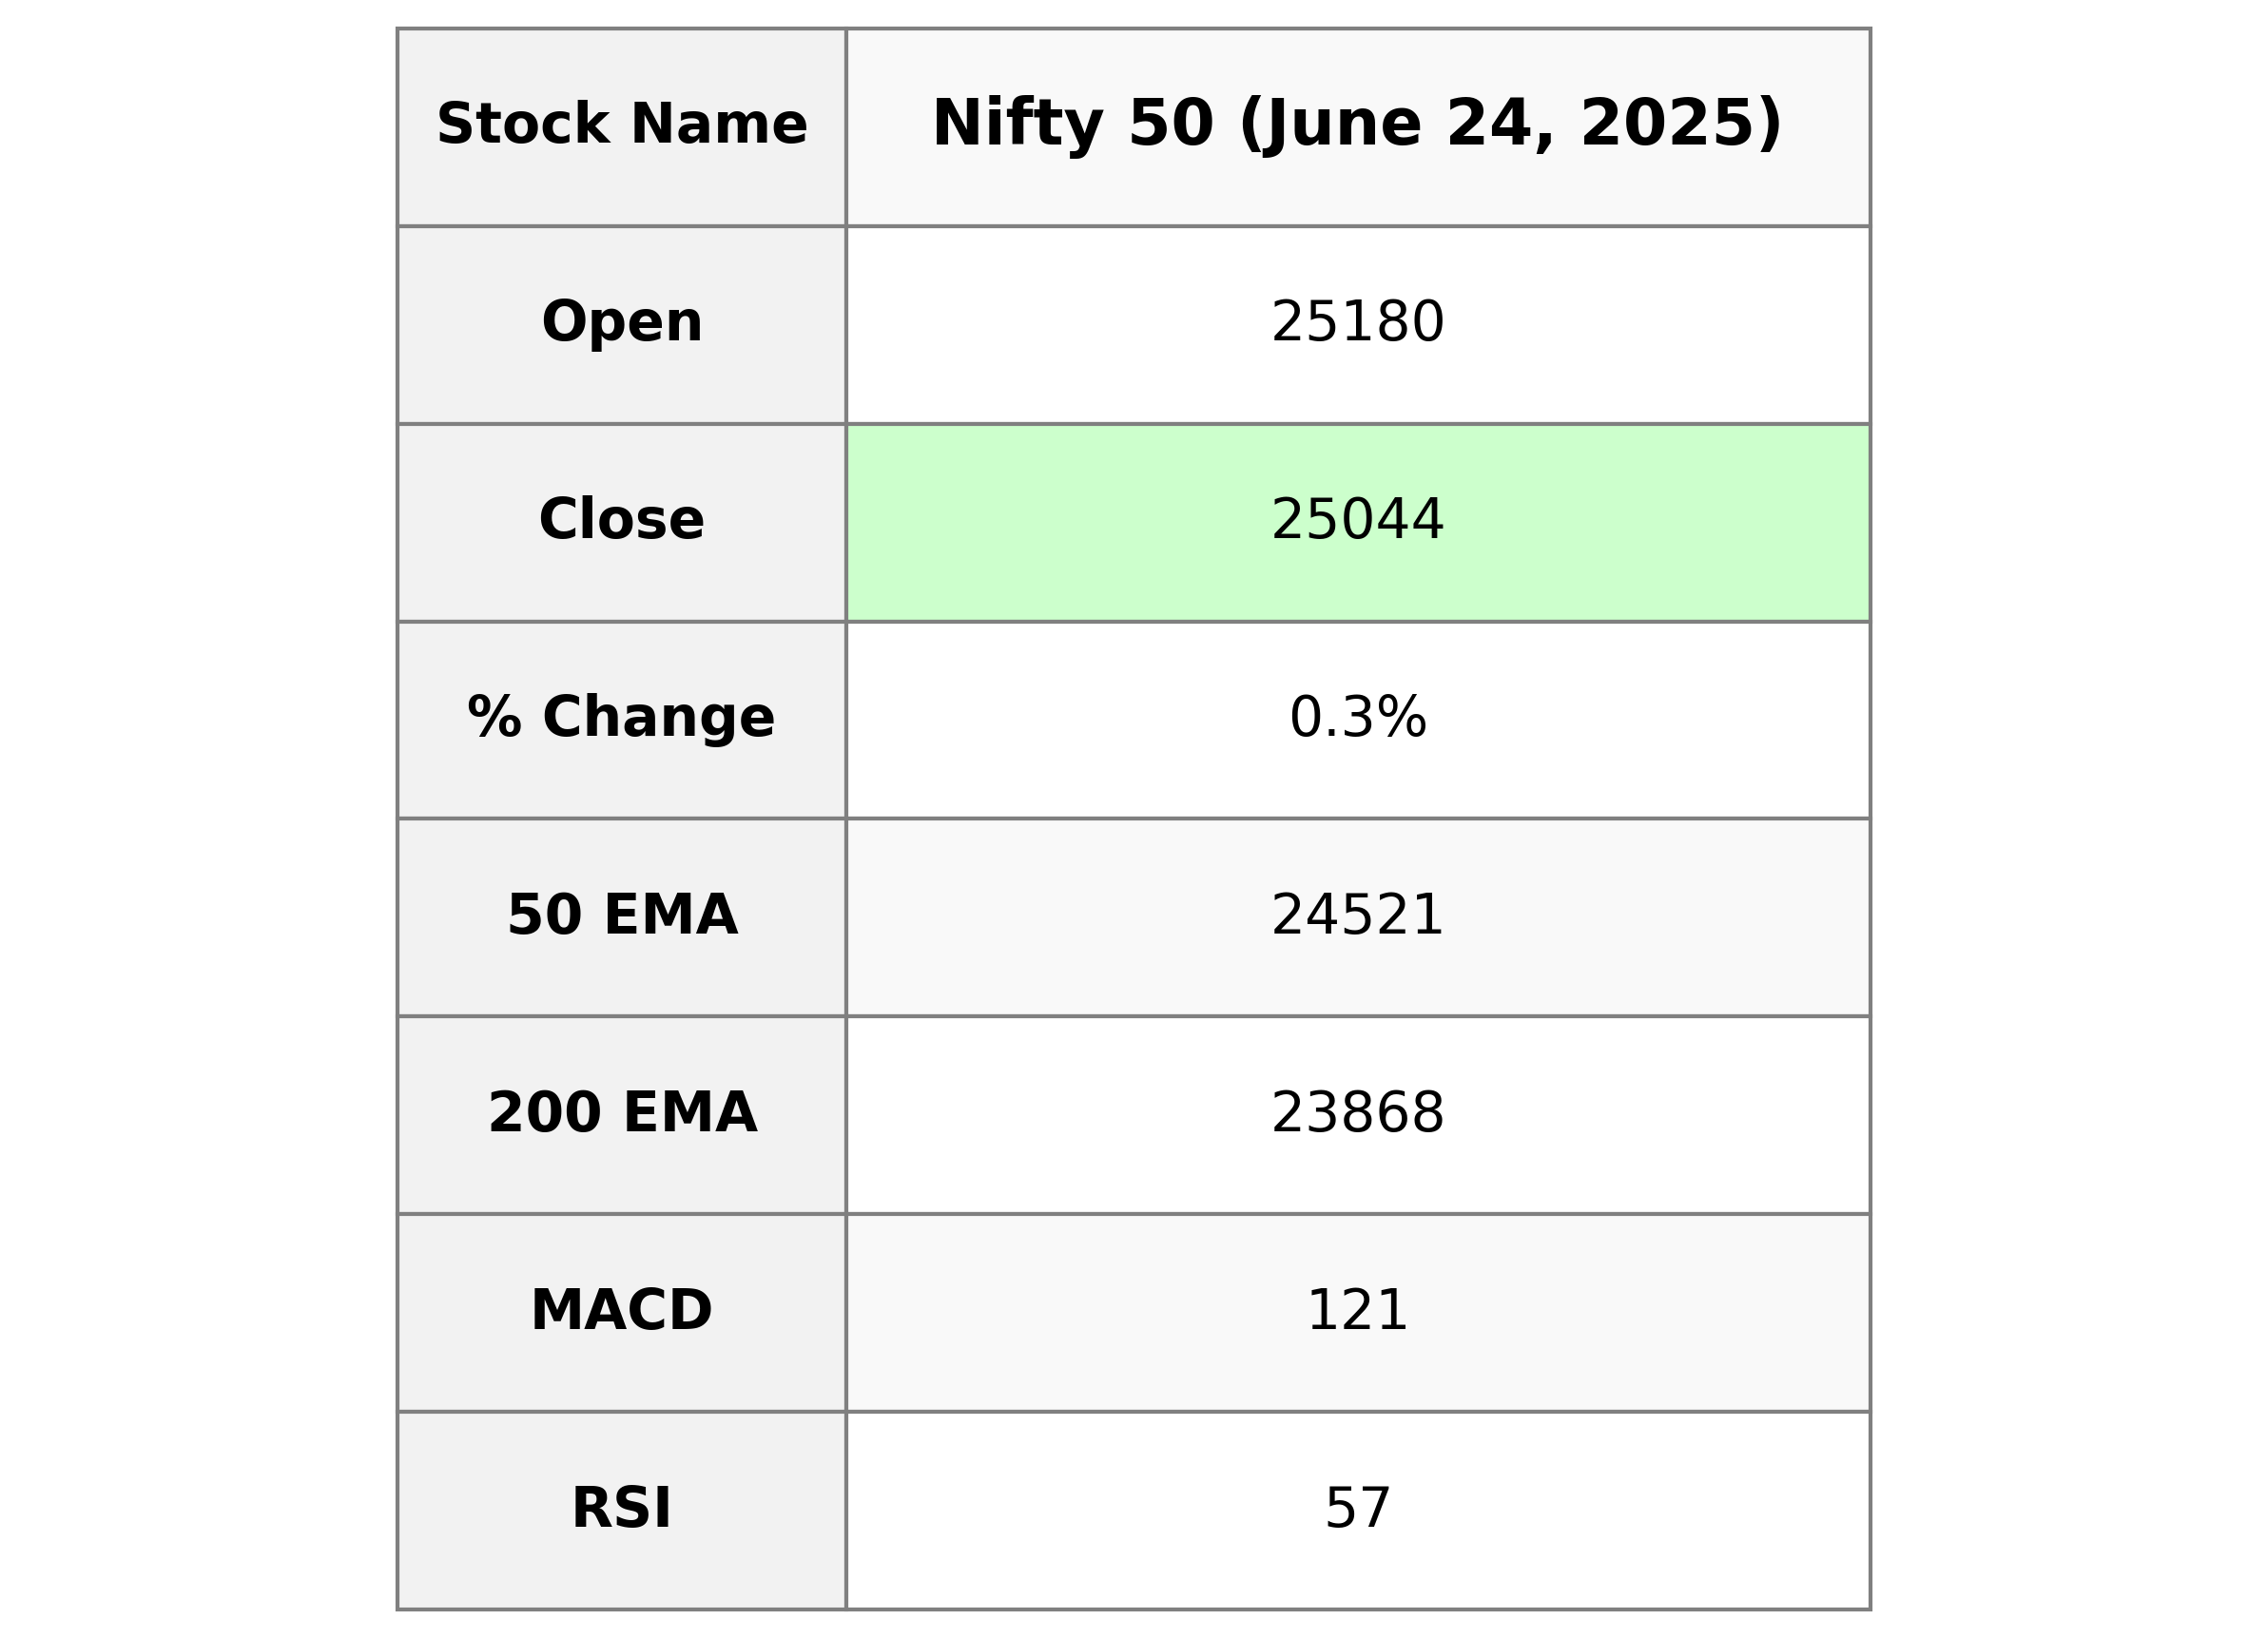
Nifty 50 opened at 25,179.90 and closed at 25,044.35, indicating a small gain with a percentage change of approximately 0.29%. The index saw a high of 25,317.70 and a low of 24,999.70. The 50-day EMA is at 24,521.35, suggesting a bullish trend with the current close above this level. The RSI of 56.71 indicates moderate momentum, though the MACD is below the signal line, suggesting a potential slowdown in the upward trend.
Relationship with Key Moving Averages
Nifty 50's closing price of 25044.35 is above the 50 EMA of 24521.35 and the 200 EMA of 23868.23, indicating a bullish trend on longer time frames. However, its close is slightly above the 10 EMA of 24940.31 and the 20 EMA of 24869.20, suggesting that the index is maintaining a short-term upward momentum as well.
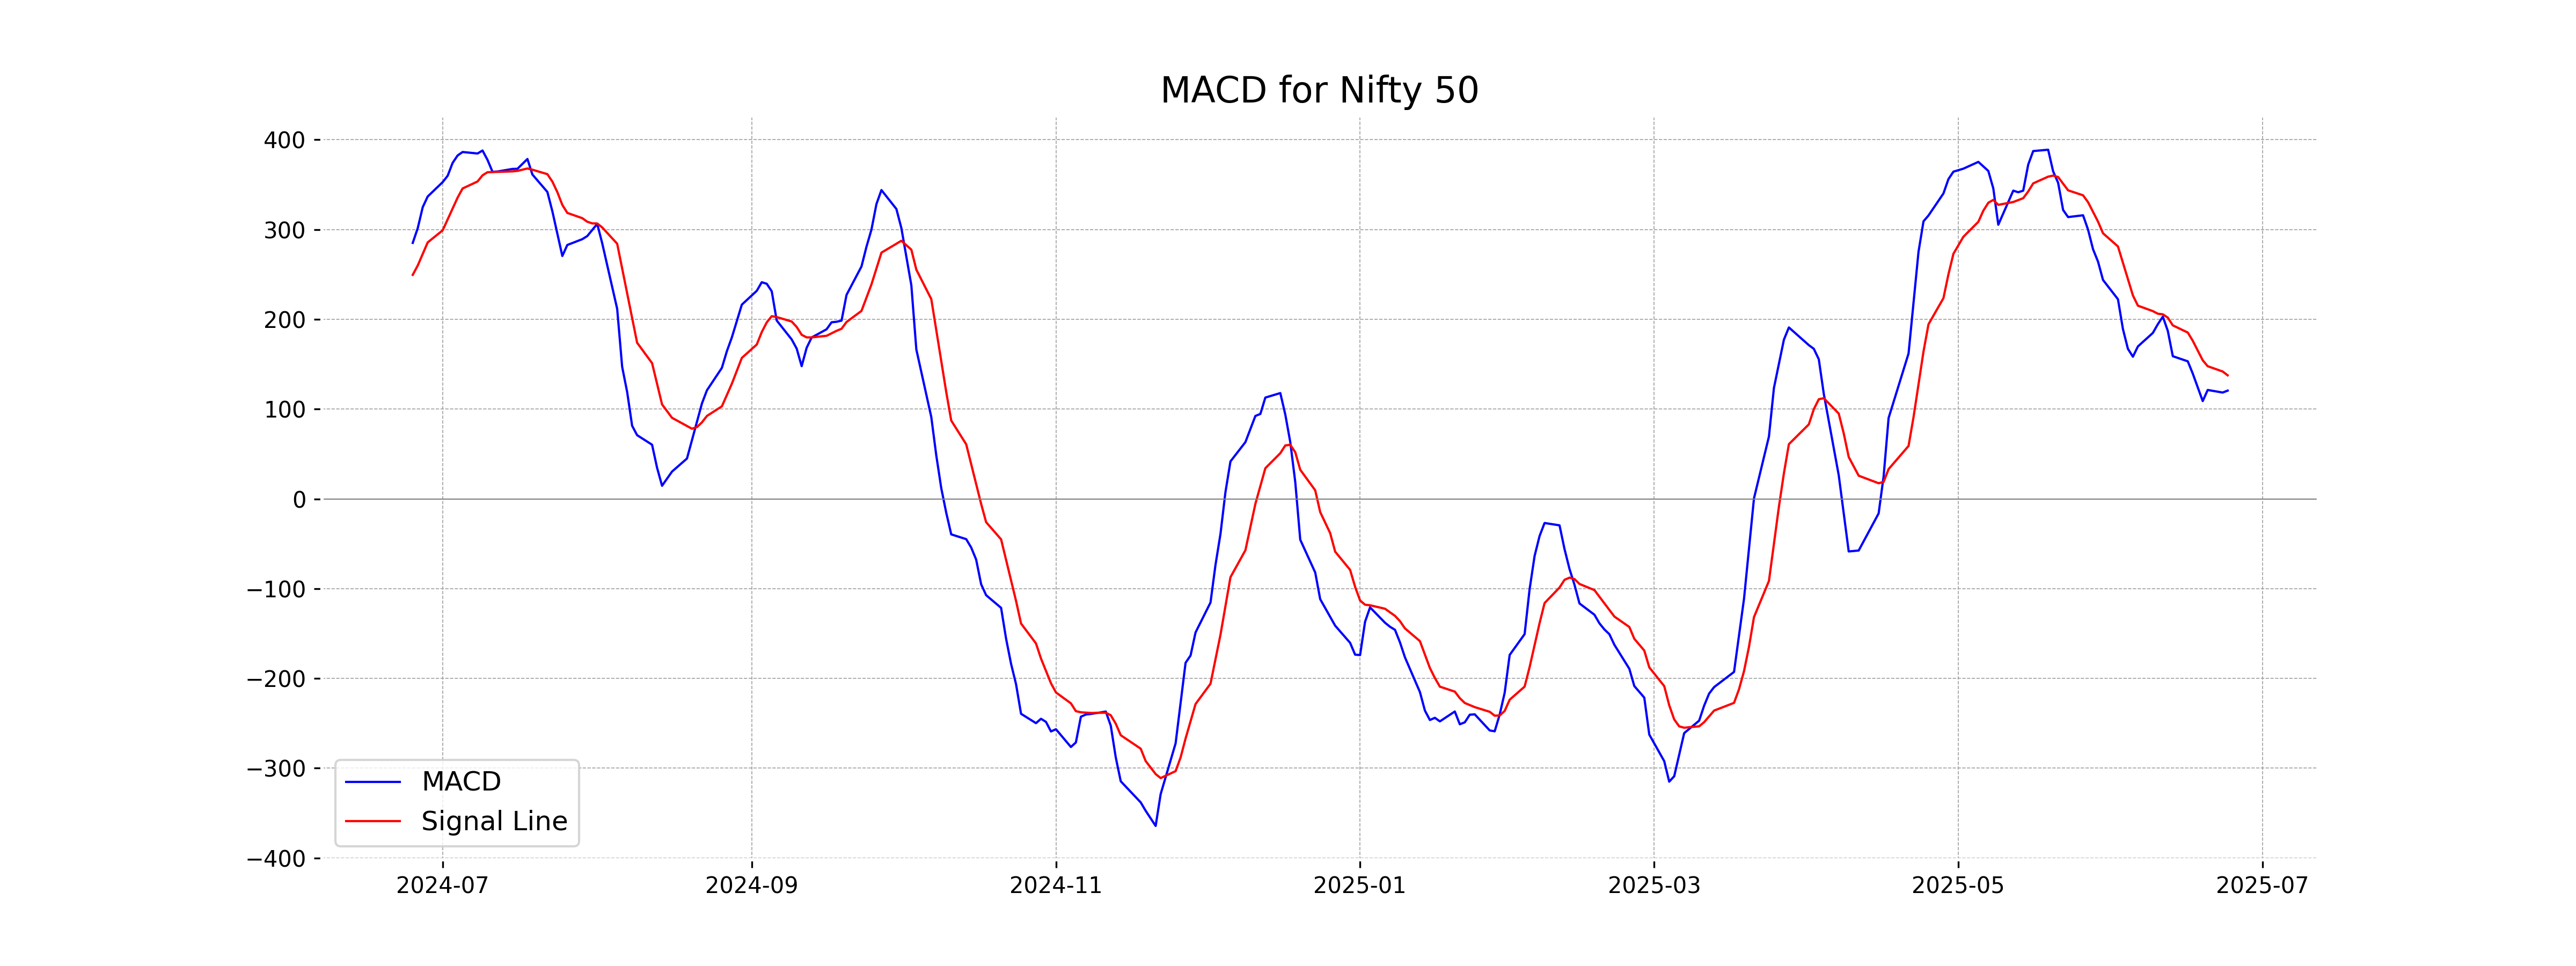
Moving Averages Trend (MACD)
Based on the data provided, the MACD for Nifty 50 is 120.59, which is currently below the MACD Signal of 137.63, indicating a potential bearish trend. Traders might interpret this as a signal for caution, as it suggests that the momentum may be shifting downwards.
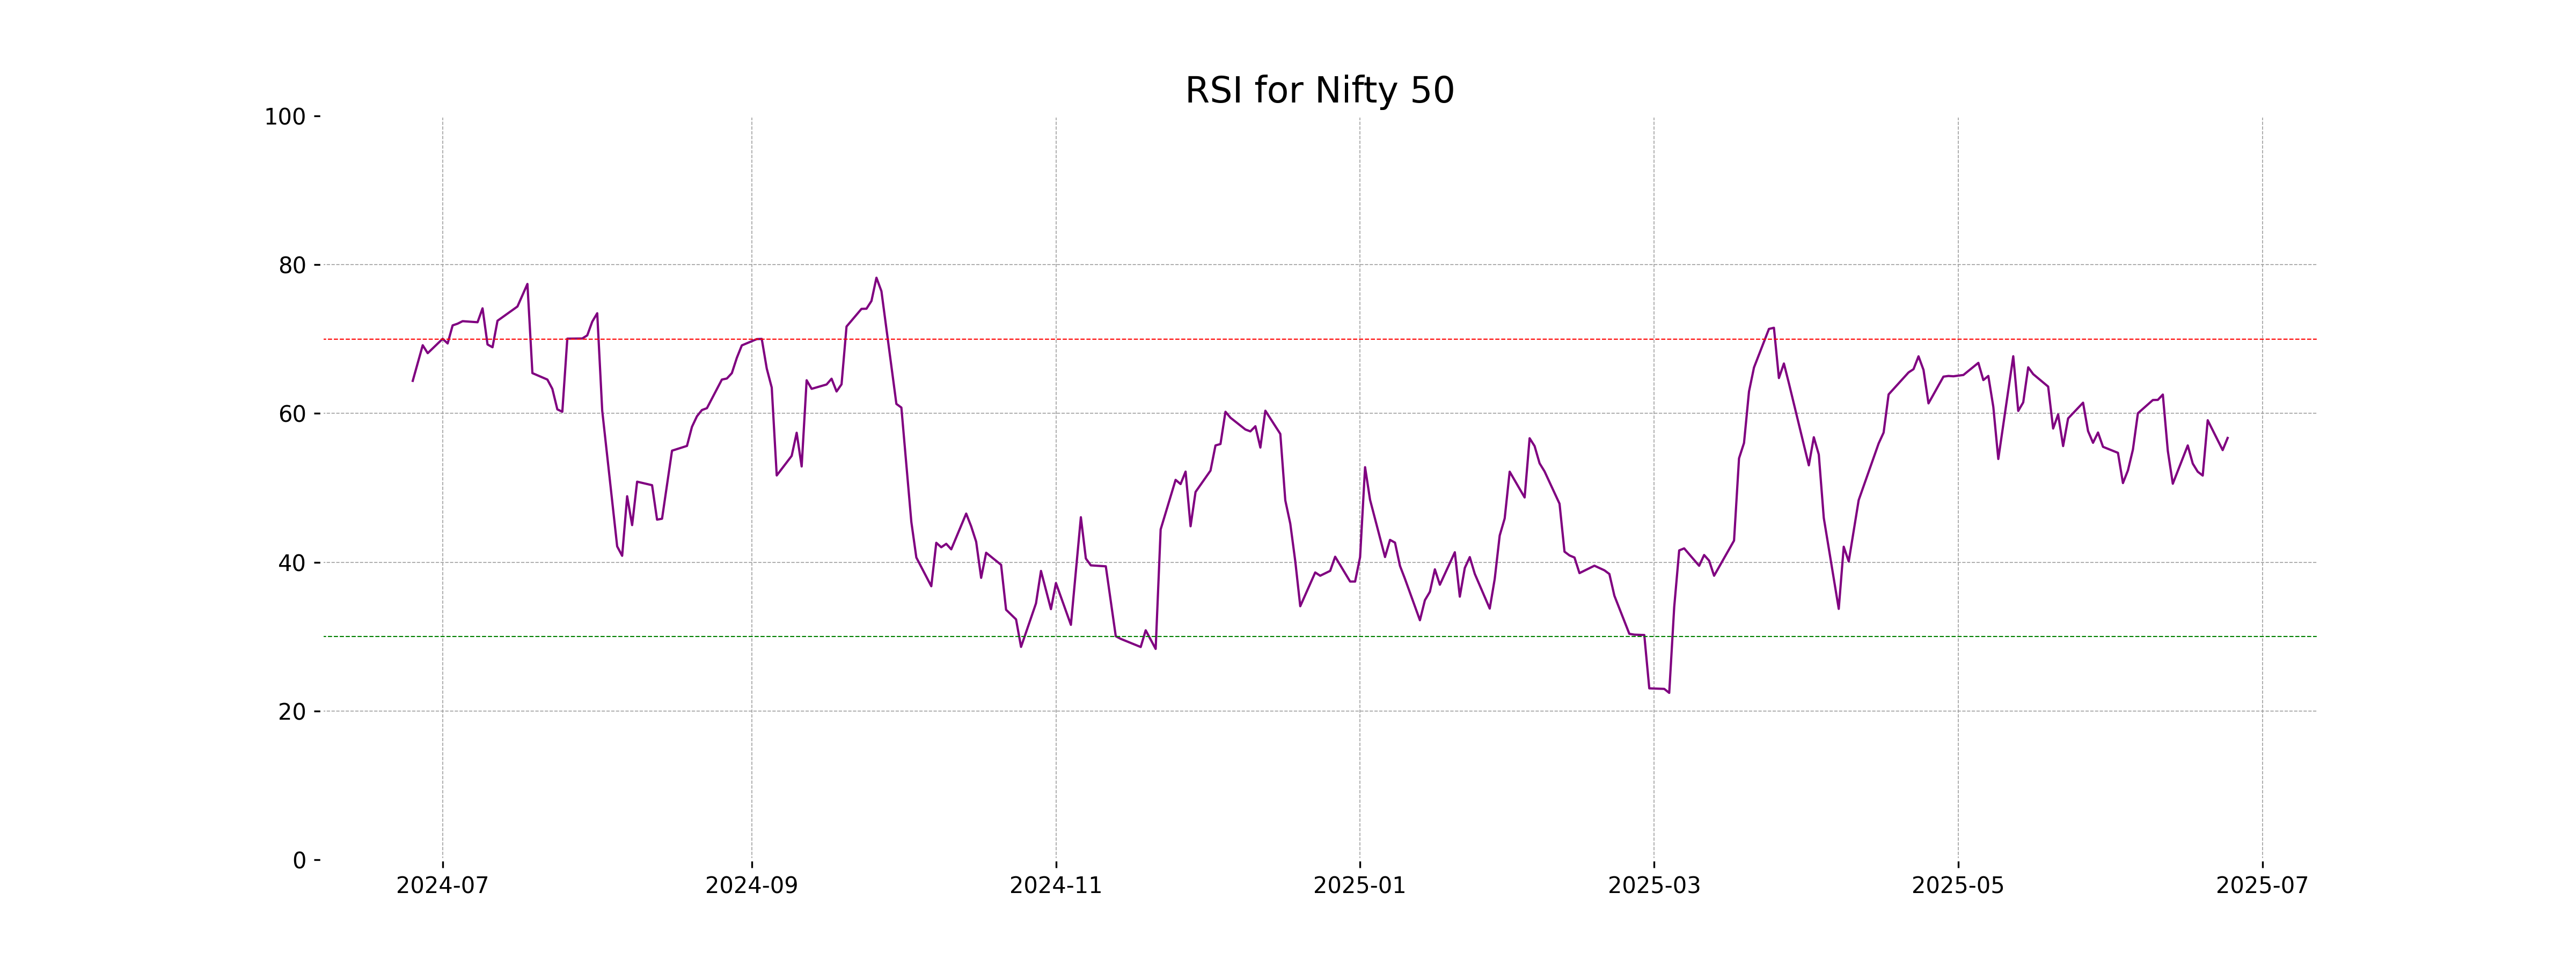
RSI Analysis
The RSI value for Nifty 50 is 56.71, which indicates that the market is in a neutral state. It is neither overbought nor oversold. Investors might consider it a stable condition without extreme buying or selling pressure.
Up Next

Indian stock market sector-wise performance today - June 24, 2025

Centre plans to borrow Rs 8.20 lakh cr from market in first half of FY27

Reliance denies buying Iranian oil amid US sanctions waiver

Premium petrol price up Rs 2, industrial diesel up Rs 22; no change in normal petrol, diesel rates

India's GDP expected to register over 8 pc growth in Sep-Dec: Report

Govt announces seven measures to help boost exports

More videos

RBI keeps interest rates on hold after US trade deal boosts outlook

RBI proposes to compensate customers up to Rs 25,000 loss due to fraud

RBI raises GDP growth projection of Q1, Q2 of FY27

RBI pauses rate cuts, retains interest rate at 5.25 pc

Rupee jumps 122 paise to close at 90.27 against US dollar on India-US trade deal

Stock markets cheer India-US trade deal: Sensex, Nifty surge 2.5 pc

UPI transactions hit record high of Rs 230 lakh crore in 2025-26 till Dec: Govt

Explained: India-US trade deal, tariffs and trade benefits

Trade deal with US adds momentum to India's growth ambition: Industry leaders

Rupee jumps 119 paise to 90.30 against the US dollar on India-US trade deal