


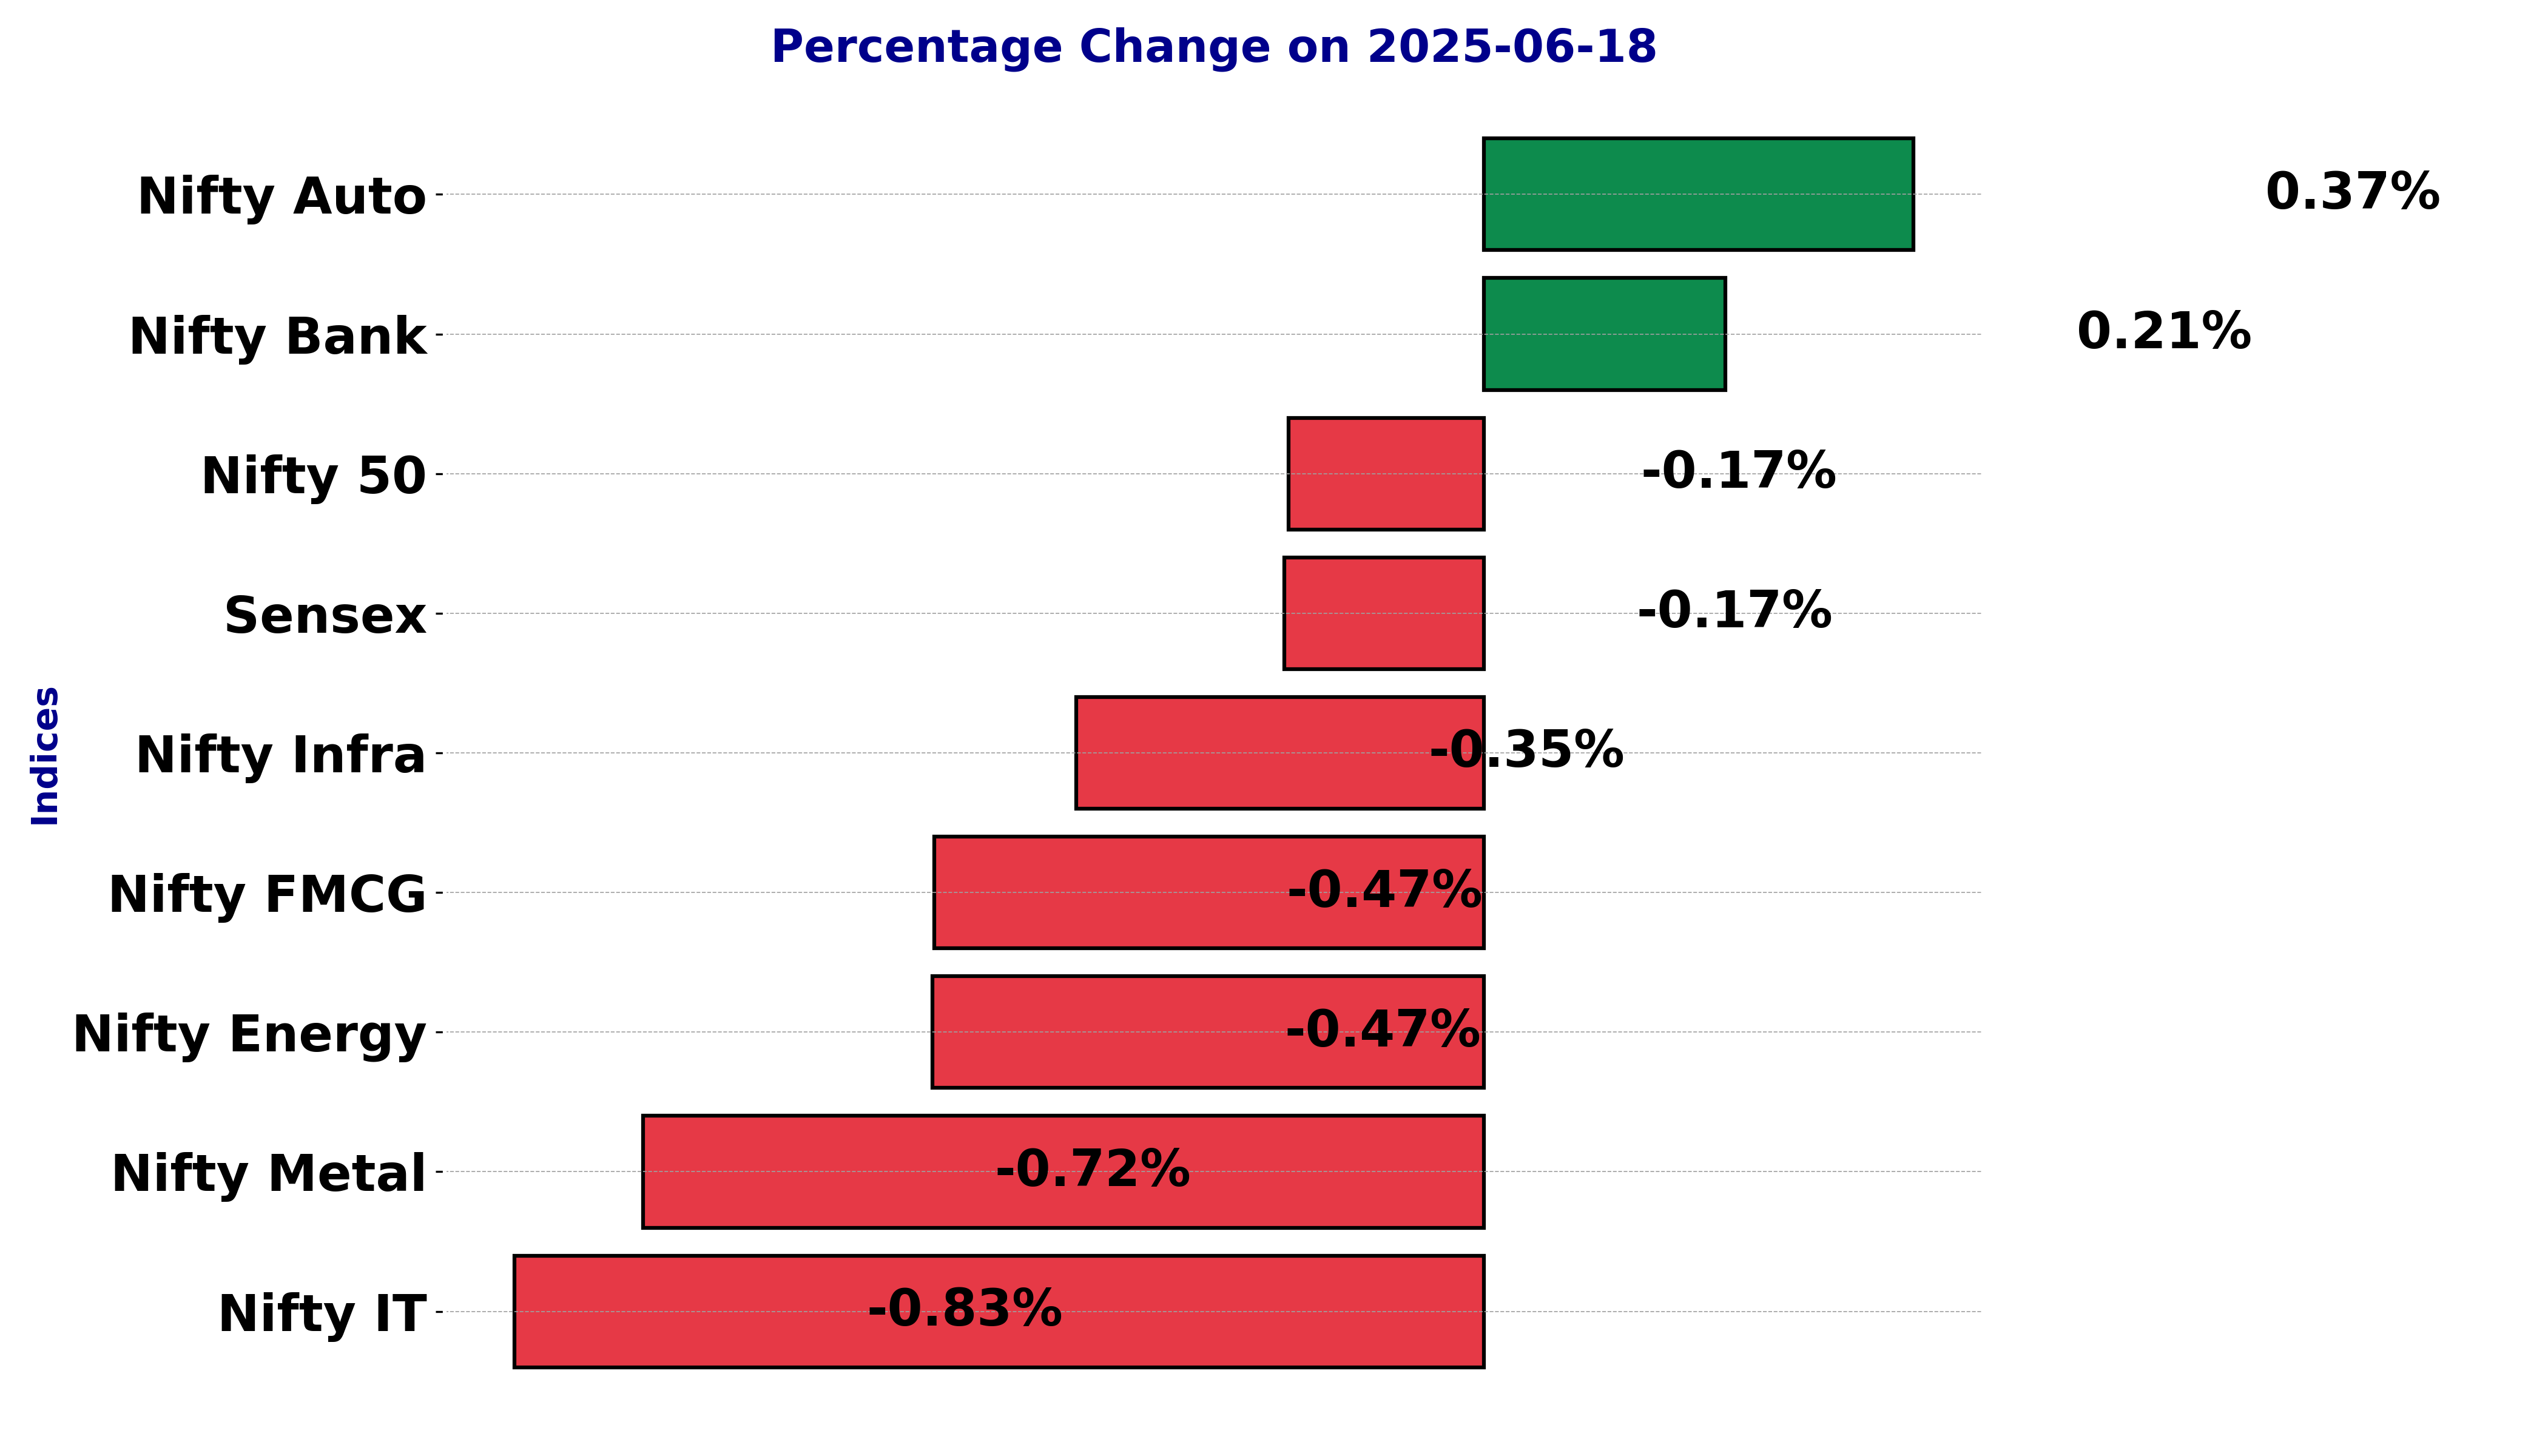
Highlights
- Nifty Auto rises by 0.37% with a gain of 85 points
- Nifty IT leads decline with a drop of 0.83%, losing 325 points
- Nifty FMCG falls by 0.47%, decreasing by 256 points
Latest news

IndiGo to levy fuel charge for domestic, international flights from March 14

Govt warns LPG hoarders of action; urges users to switch to piped cooking gas

Govt ensures uninterrupted LPG supply to households, says no need for panic booking

QuantPower Receives Official Exchange Approval, Strengthening Its Position in India's Algo Trading Ecosystem

Entrepreneur Gopal Dash Baghel Launches "MakeMyBiryani" to Empower Women Through Home-Cooked Food

Russia, China emerging as economic beneficiaries from ongoing West Asia conflict: Jefferies

India's Demat Accounts Cross 21.6 Crore in December 2025, and BlinkX Is Among the Platforms Driving Zero Brokerage Adoption in Tier-2 Cities

Aster DM Healthcare receives overwhelmingly positive shareholder and creditors vote for Aster-QCIL merger
Indian stock market sector-wise performance today - June 18, 2025


The stock market on Wednesday (June 18, 2025) showed a mixed performance with distinct variations across different sectors and indices.
Starting with the benchmark index, BSE Sensex, there was a slight dip by 0.17%, indicating a modest decline in the overall market sentiment. This was reflective of a cautious sentiment among investors.
A closer look at specific sectors reveals that some indices performed better than others.
Nifty Auto recorded a positive shift with an increase of 0.37%, showcasing resilience and possibly driven by positive developments or earnings in the automobile sector.
On the contrary, Nifty IT fell by 0.83%, marking the largest percentage decline among the observed sectors. The downward movement in IT stocks could be attributed to concerns over global technological demand or profit-taking by investors after a period of gains.
Nifty Energy and Nifty FMCG both experienced declines, with Nifty Energy down by 0.47% and Nifty FMCG also dropping by 0.47%. This suggests a pullback in investor confidence in these traditionally strong sectors, possibly due to market-specific news or broader economic indicators suggesting a slowing demand.
Nifty Infra decreased by 0.35%, which illustrates a minor contraction, possibly influenced by slower infrastructure spending or project delays.
Meanwhile, Nifty Metal saw a significant fall of 0.72%, hinting at challenges within the commodities market, including fluctuating metal prices or trade concerns.
However, there was a bright spot with Nifty Bank posting an increase of 0.21%, which might indicate a steady banking sector with optimistic earnings projections or improved financial conditions.
Overall, the most affected sector was Nifty IT. The reduced confidence in IT could stem from multiple factors, including potential regulatory challenges, changes in tech policies, or adjustments in global tech investments.
As the tech industry often acts as a bellwether for innovation and growth, this decline might influence market participants’ views on potential future uncertainties.
In conclusion, while some sectors like Auto and Banking demonstrated growth, others showed signs of decline, reflecting diverse market dynamics and underlying economic conditions influencing each sector differently.
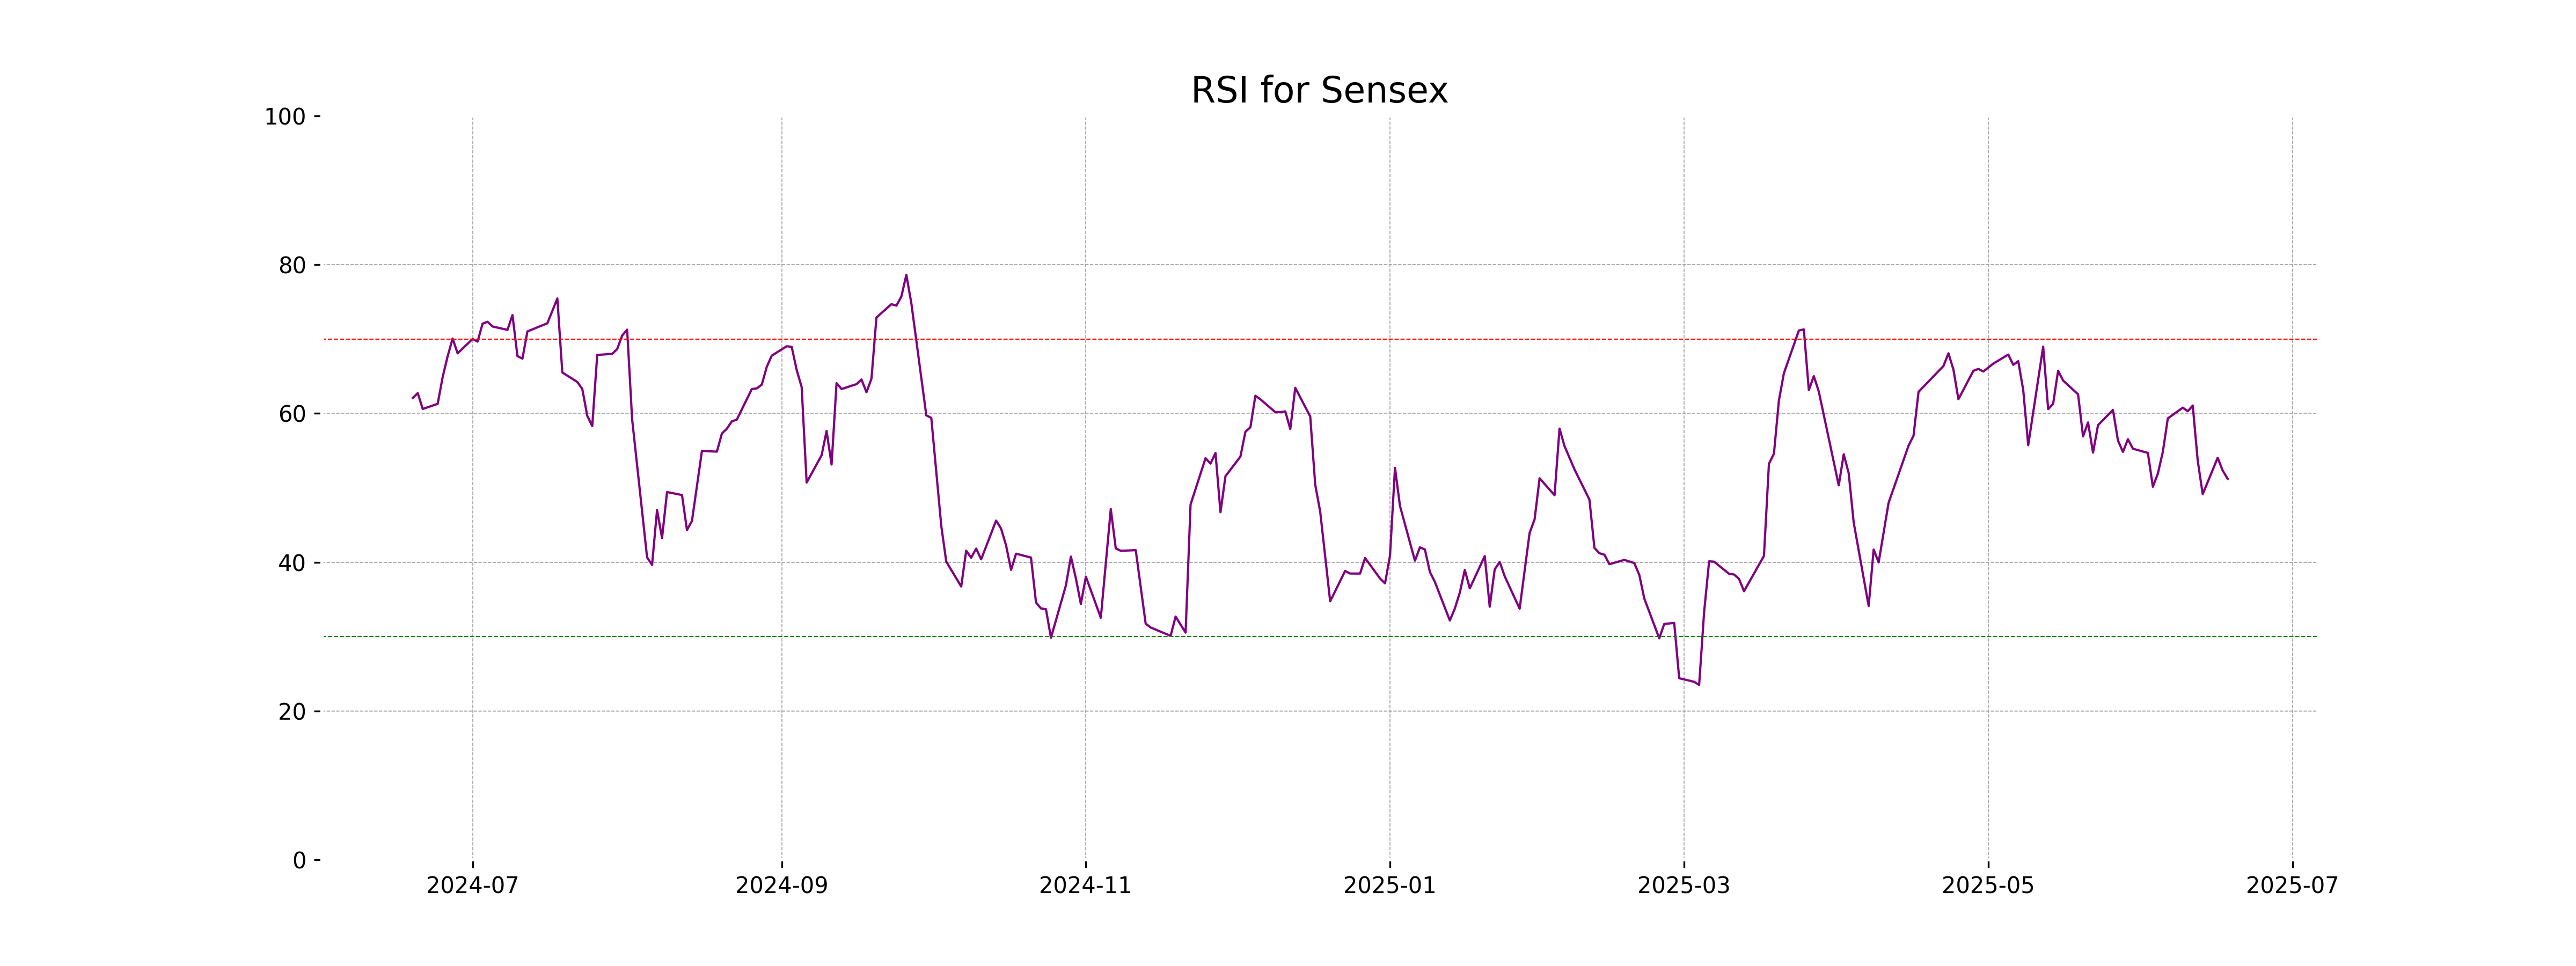
Analysis for Sensex - June 18, 2025
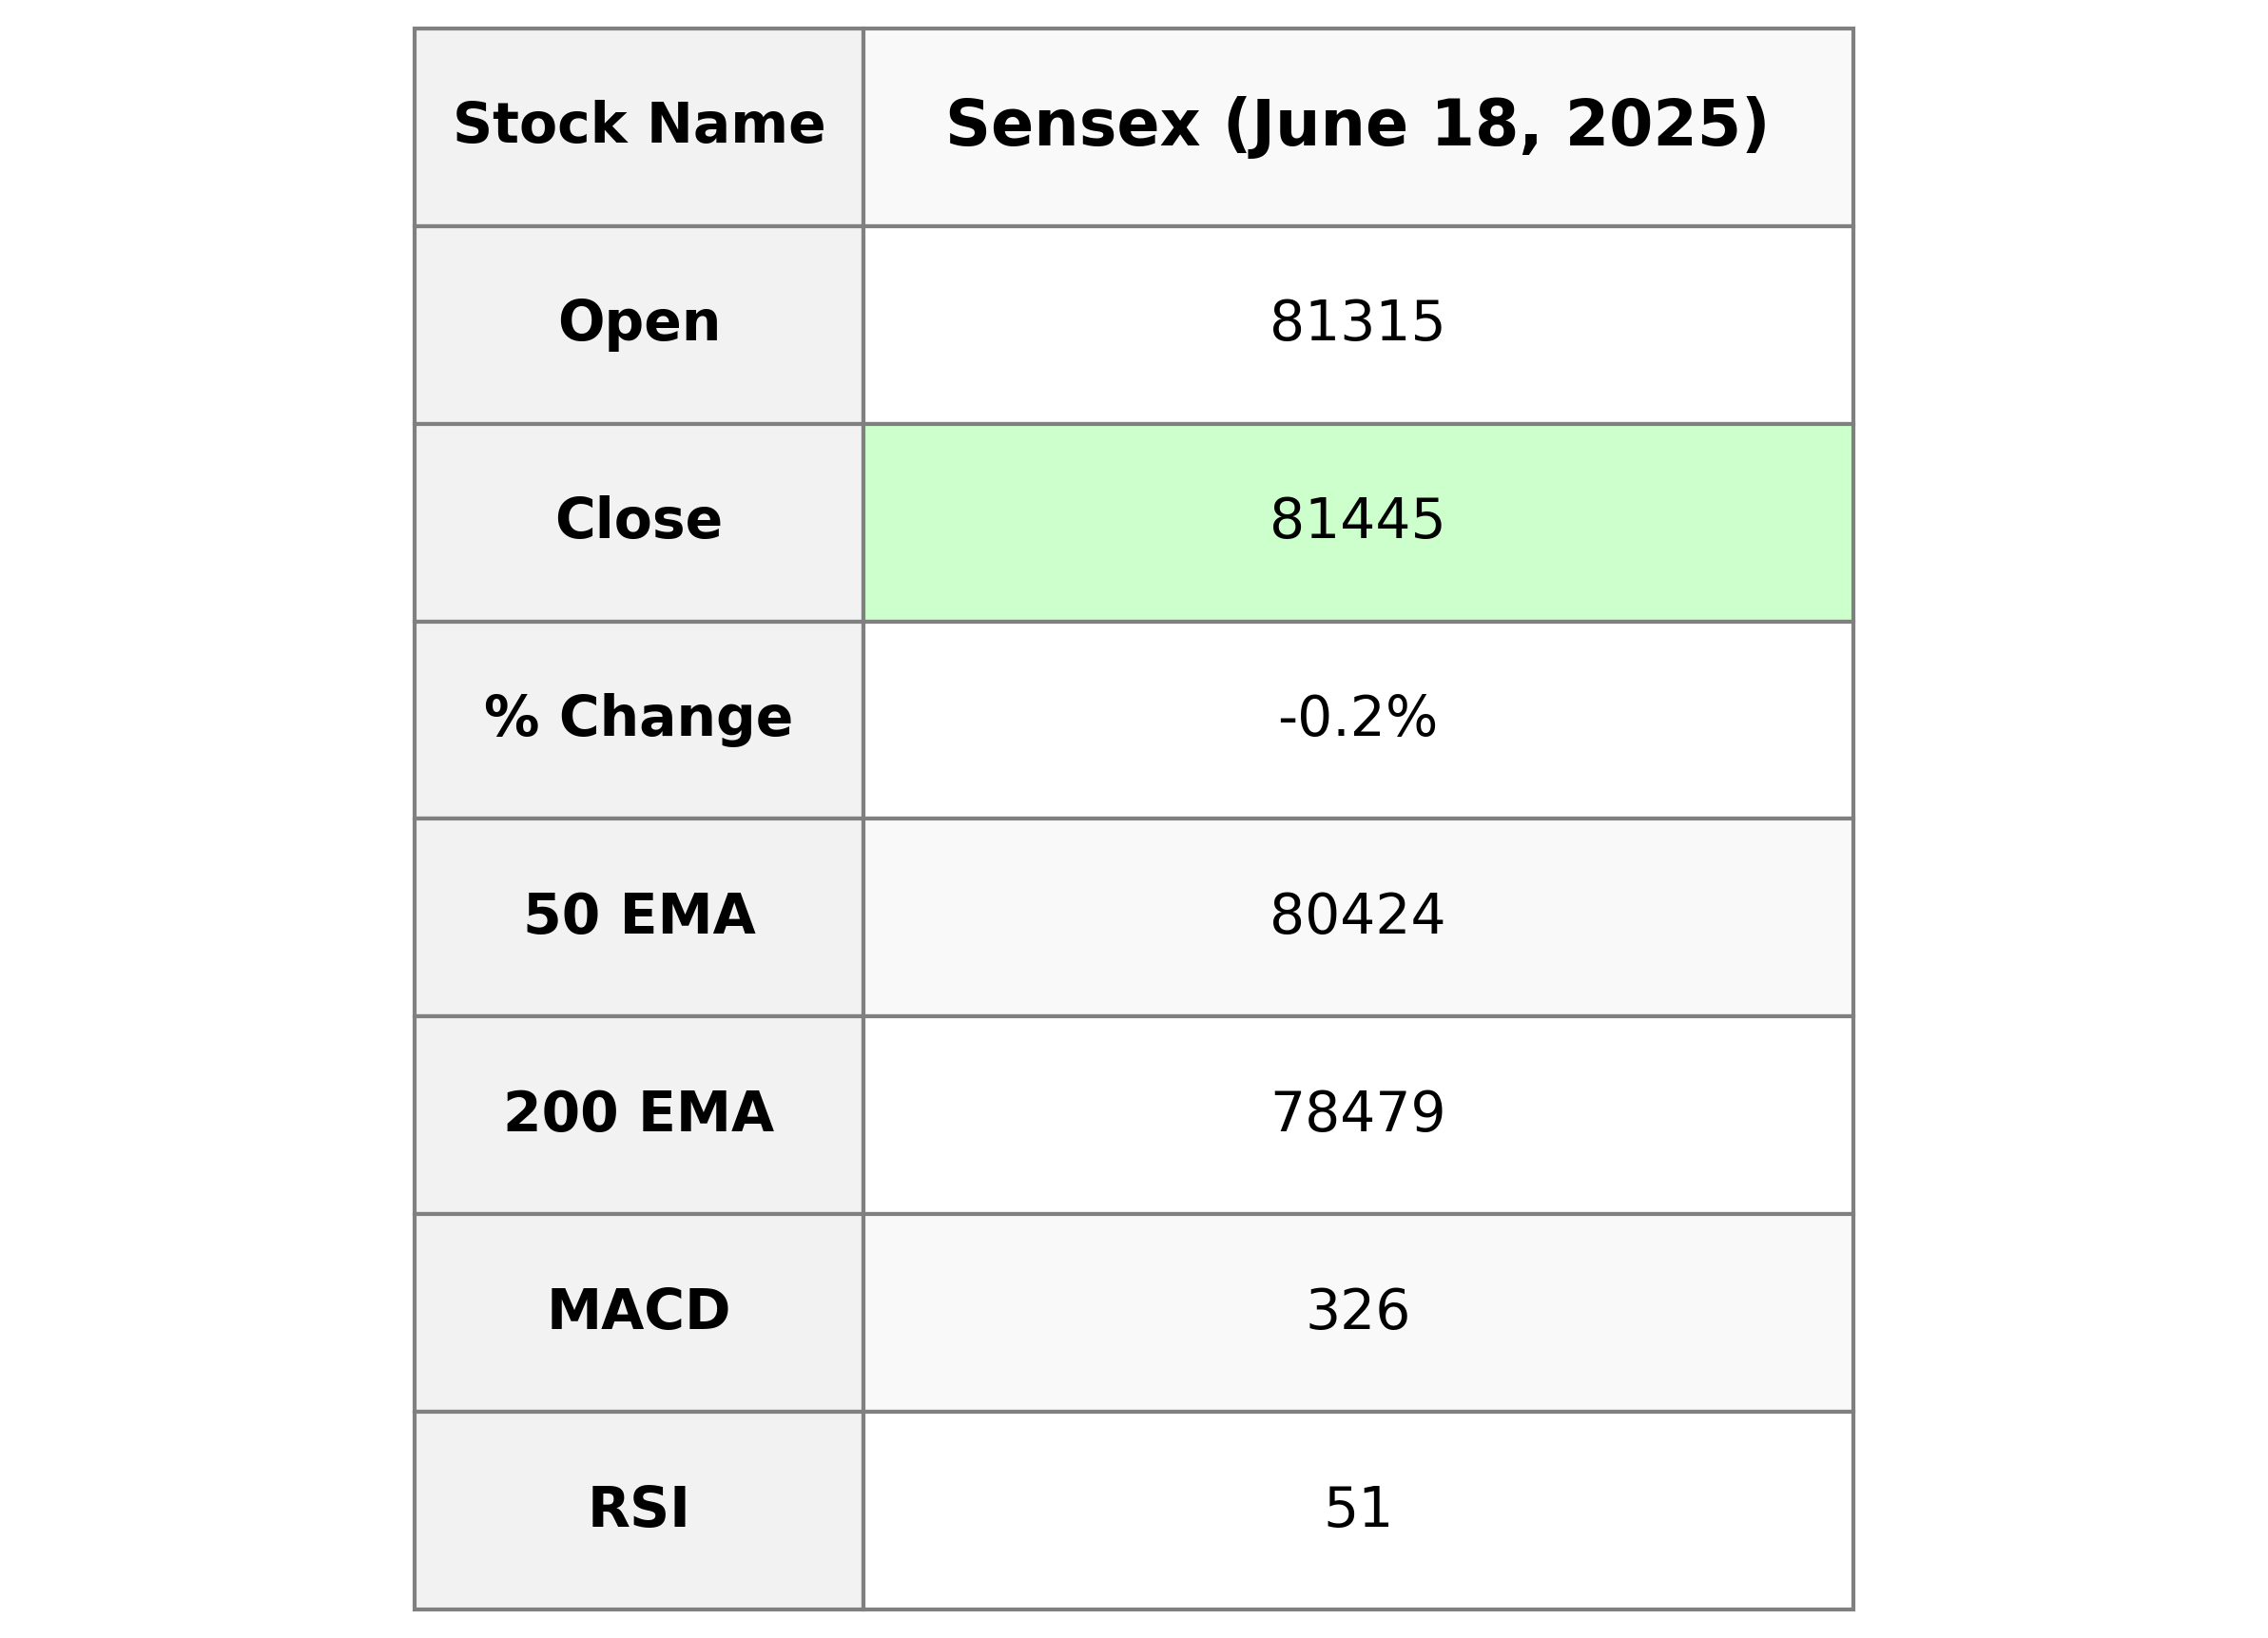
### Stock Performance: Sensex The Sensex opened at 81314.62 and closed slightly lower at 81444.66, marking a decrease of 0.17% with a points change of -138.64. The RSI is at 51.21, indicating a neutral market sentiment. Key moving averages show the index is above the 50 and 200 EMAs, suggesting a bullish trend despite the minor daily decline.
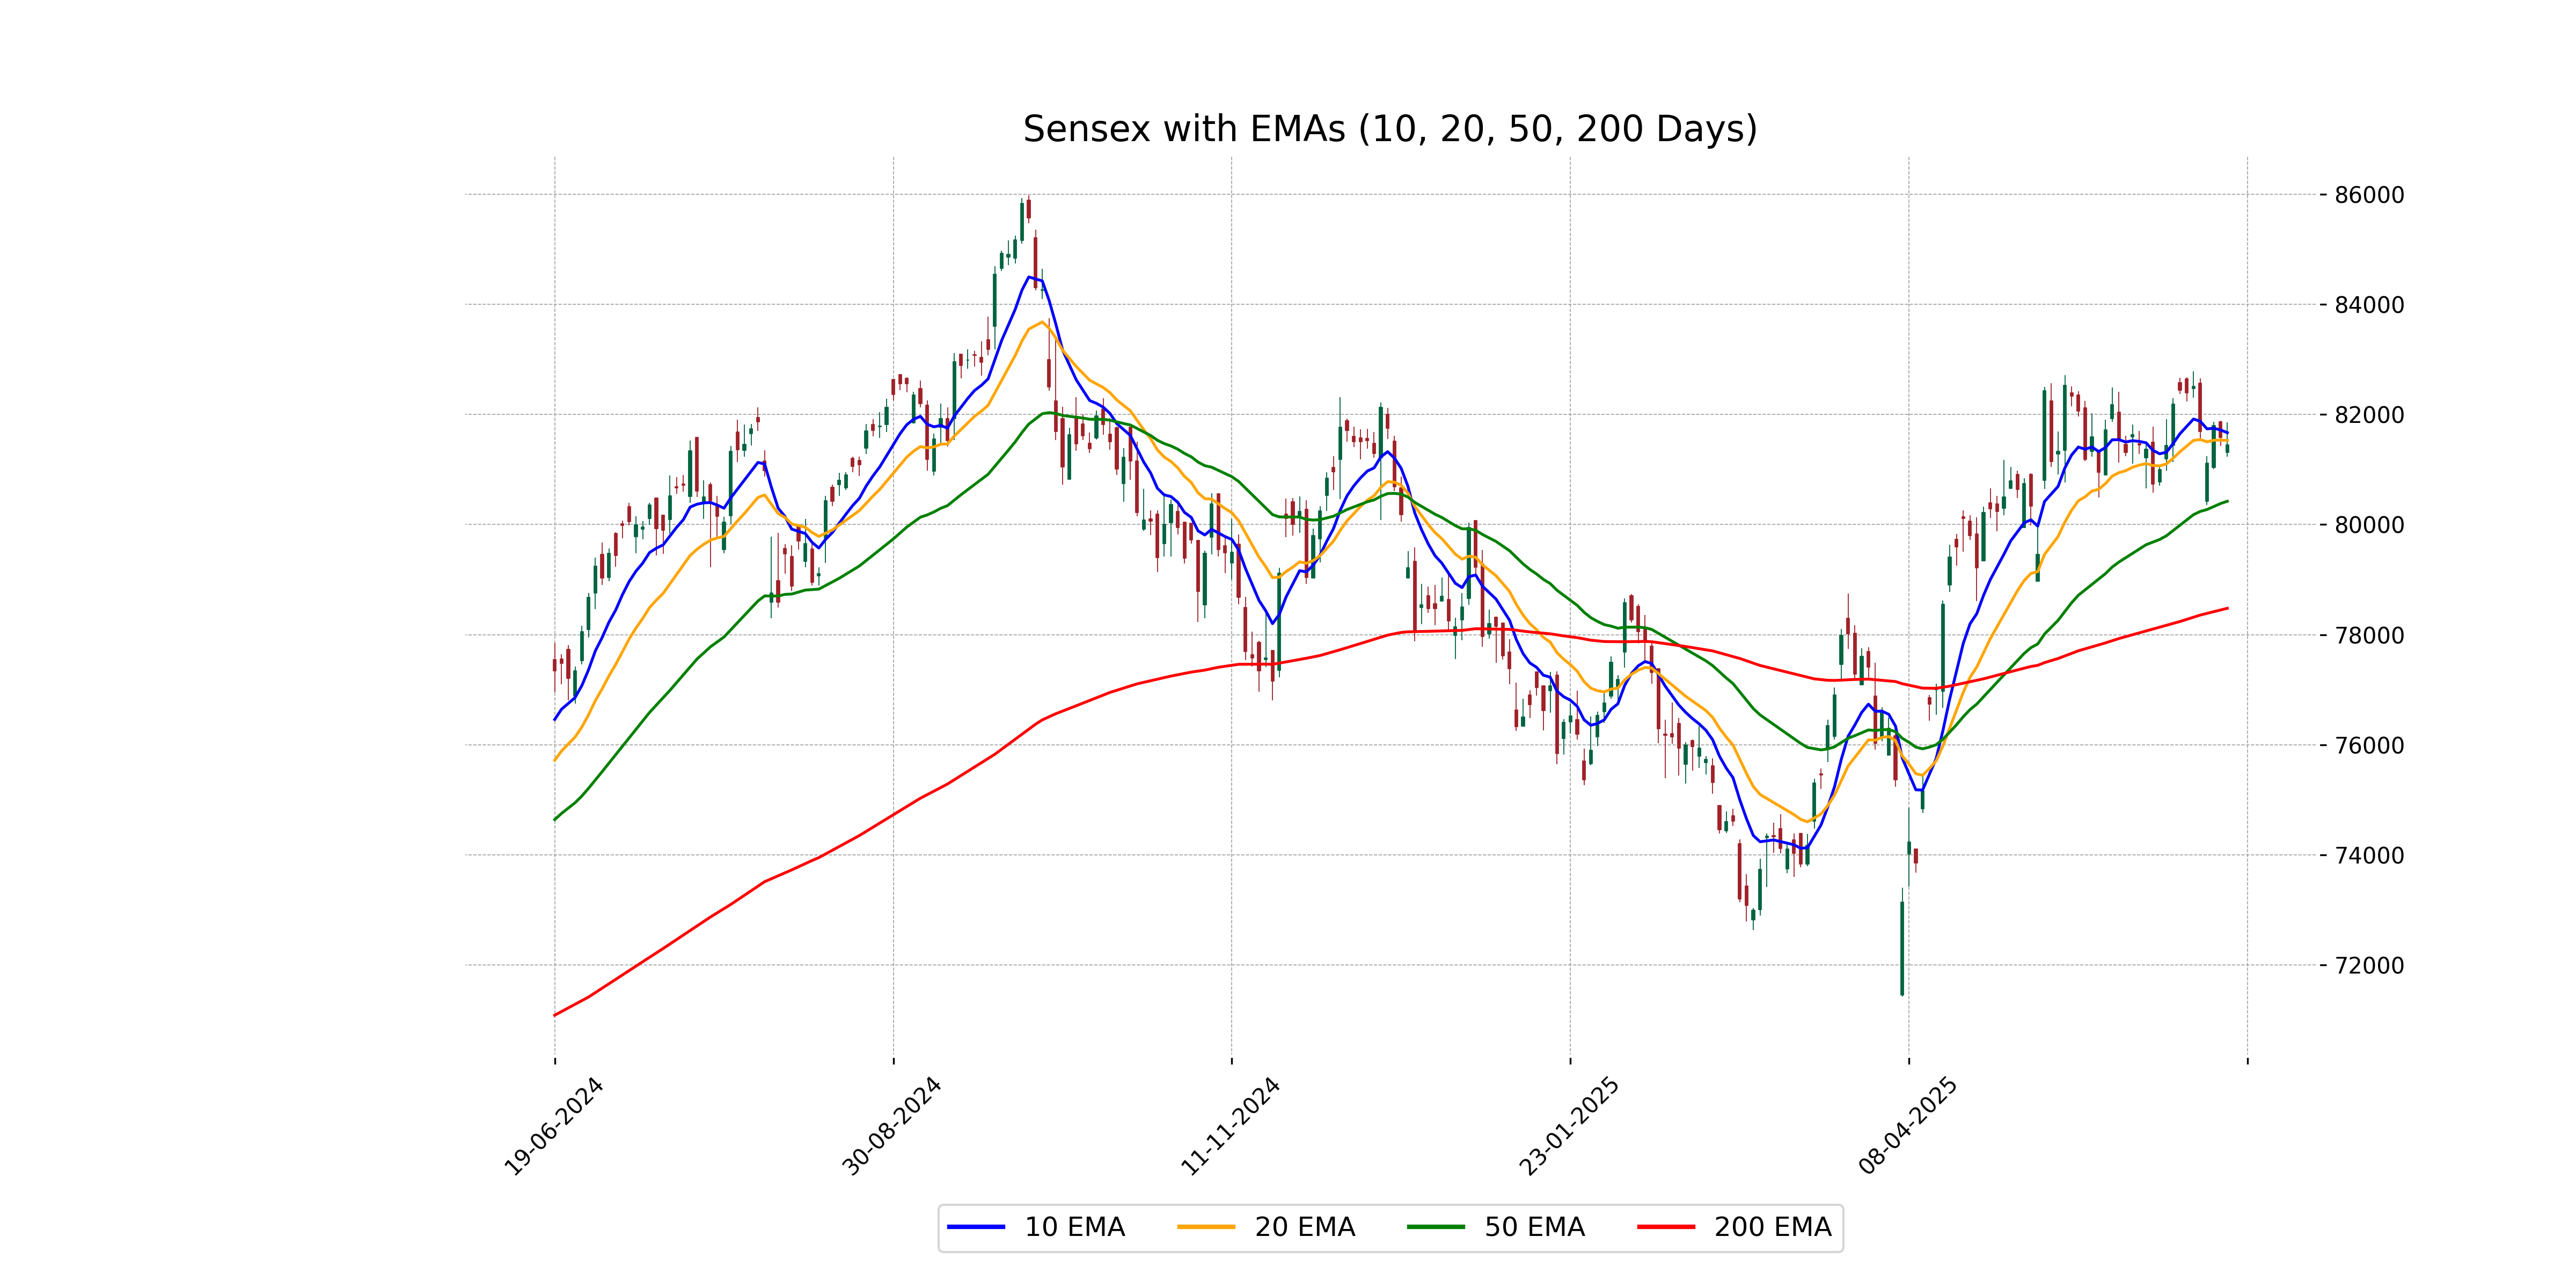
Relationship with Key Moving Averages
The Sensex closed at 81,444.66, slightly below its 10-day EMA of 81,669.18, indicating a short-term bearish sentiment. However, it remains above the 50-day EMA of 80,423.77 and the 200-day EMA of 78,478.64, suggesting a longer-term upward trend.
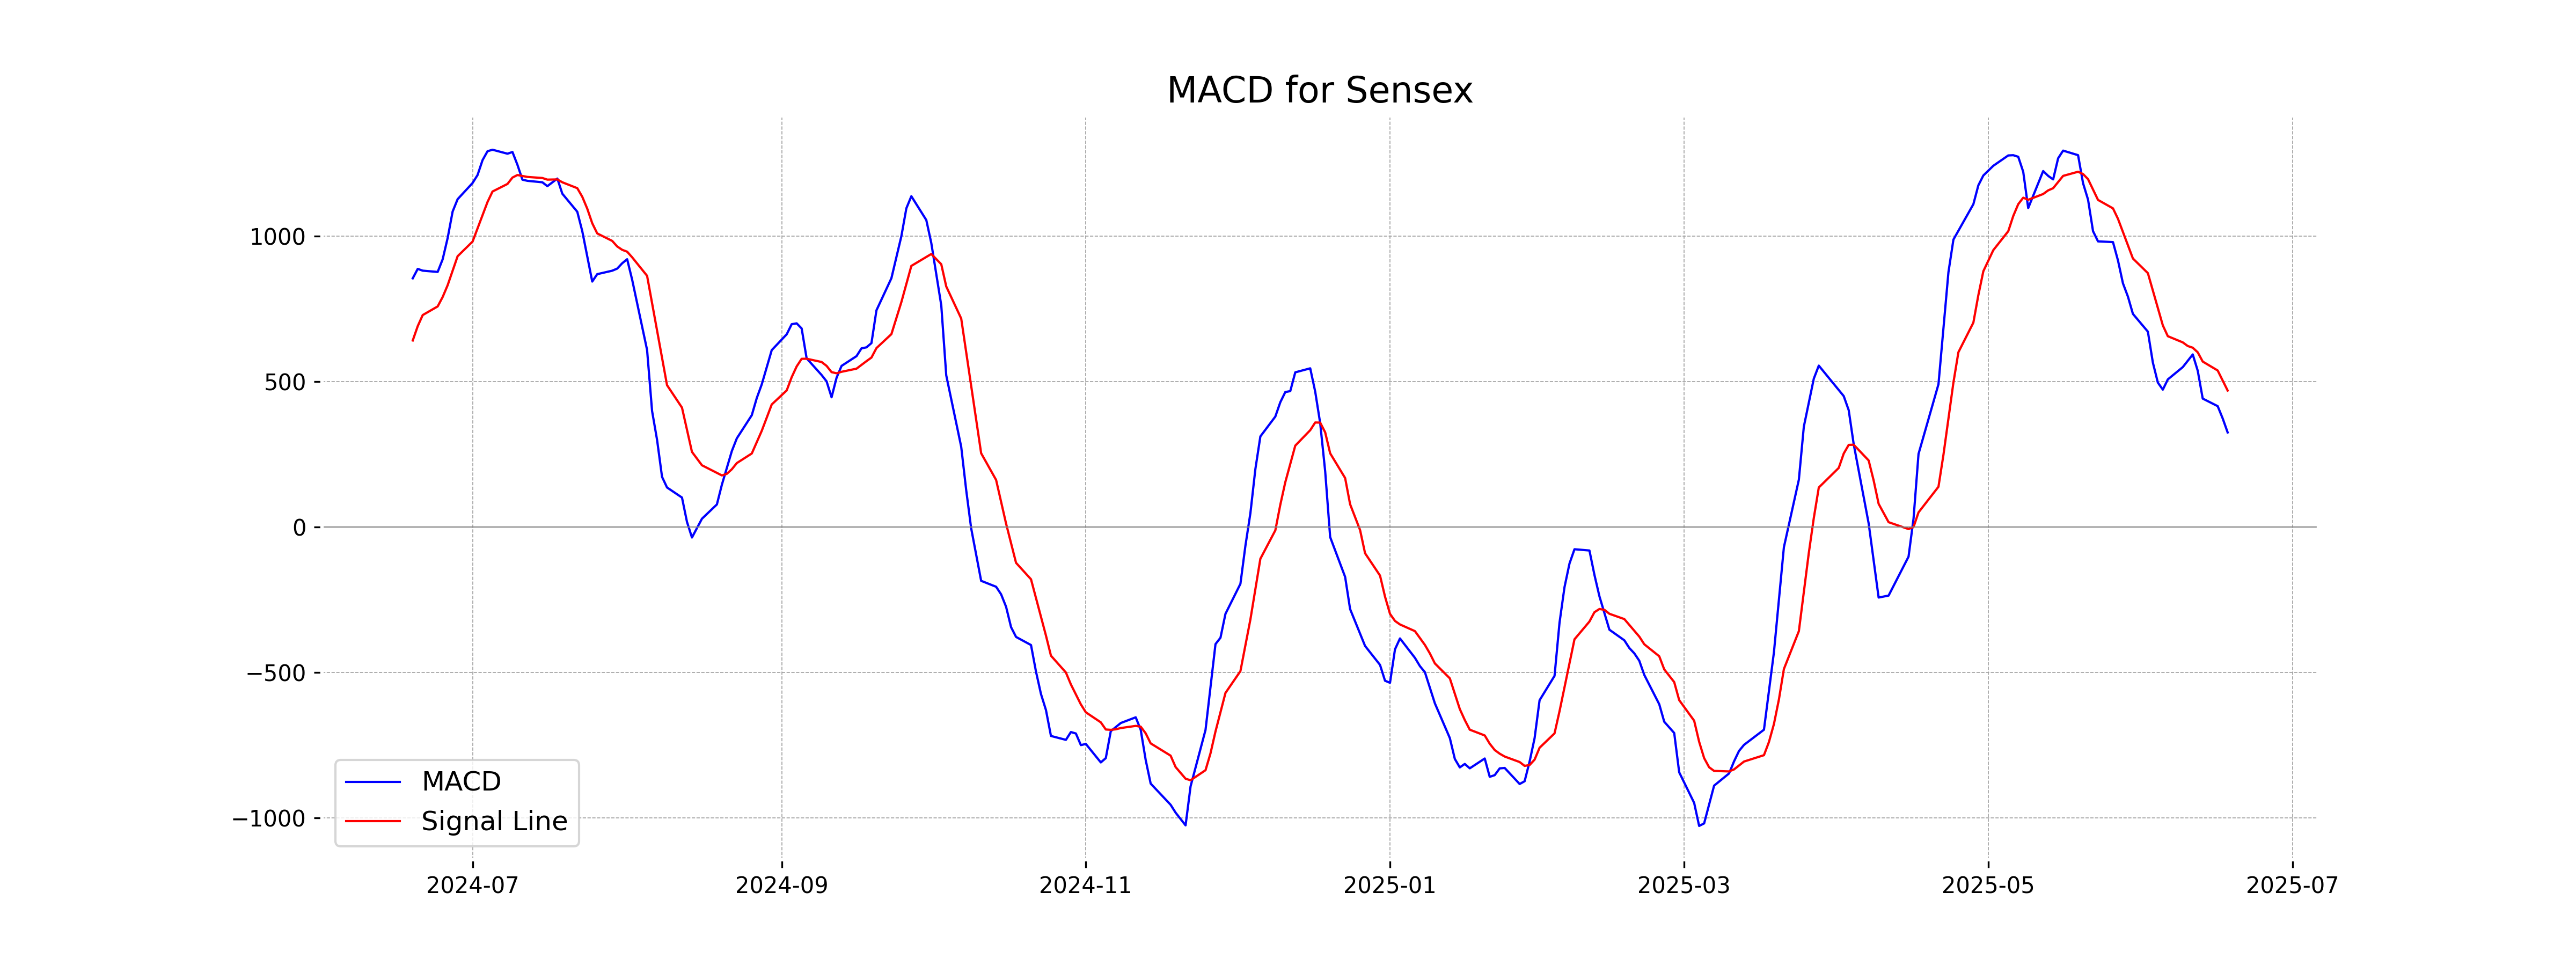
Moving Averages Trend (MACD)
## MACD Analysis for Sensex: The MACD value of 325.73 is below the MACD Signal of 469.78, indicating a bearish momentum in the Sensex. When the MACD is below the Signal line, it often suggests that the downtrend could continue unless market conditions change.
RSI Analysis
The RSI value for Sensex is 51.21, indicating a neutral position in terms of market strength. This suggests that the index is neither in an overbought nor oversold condition, pointing to potential stability in current market trends.
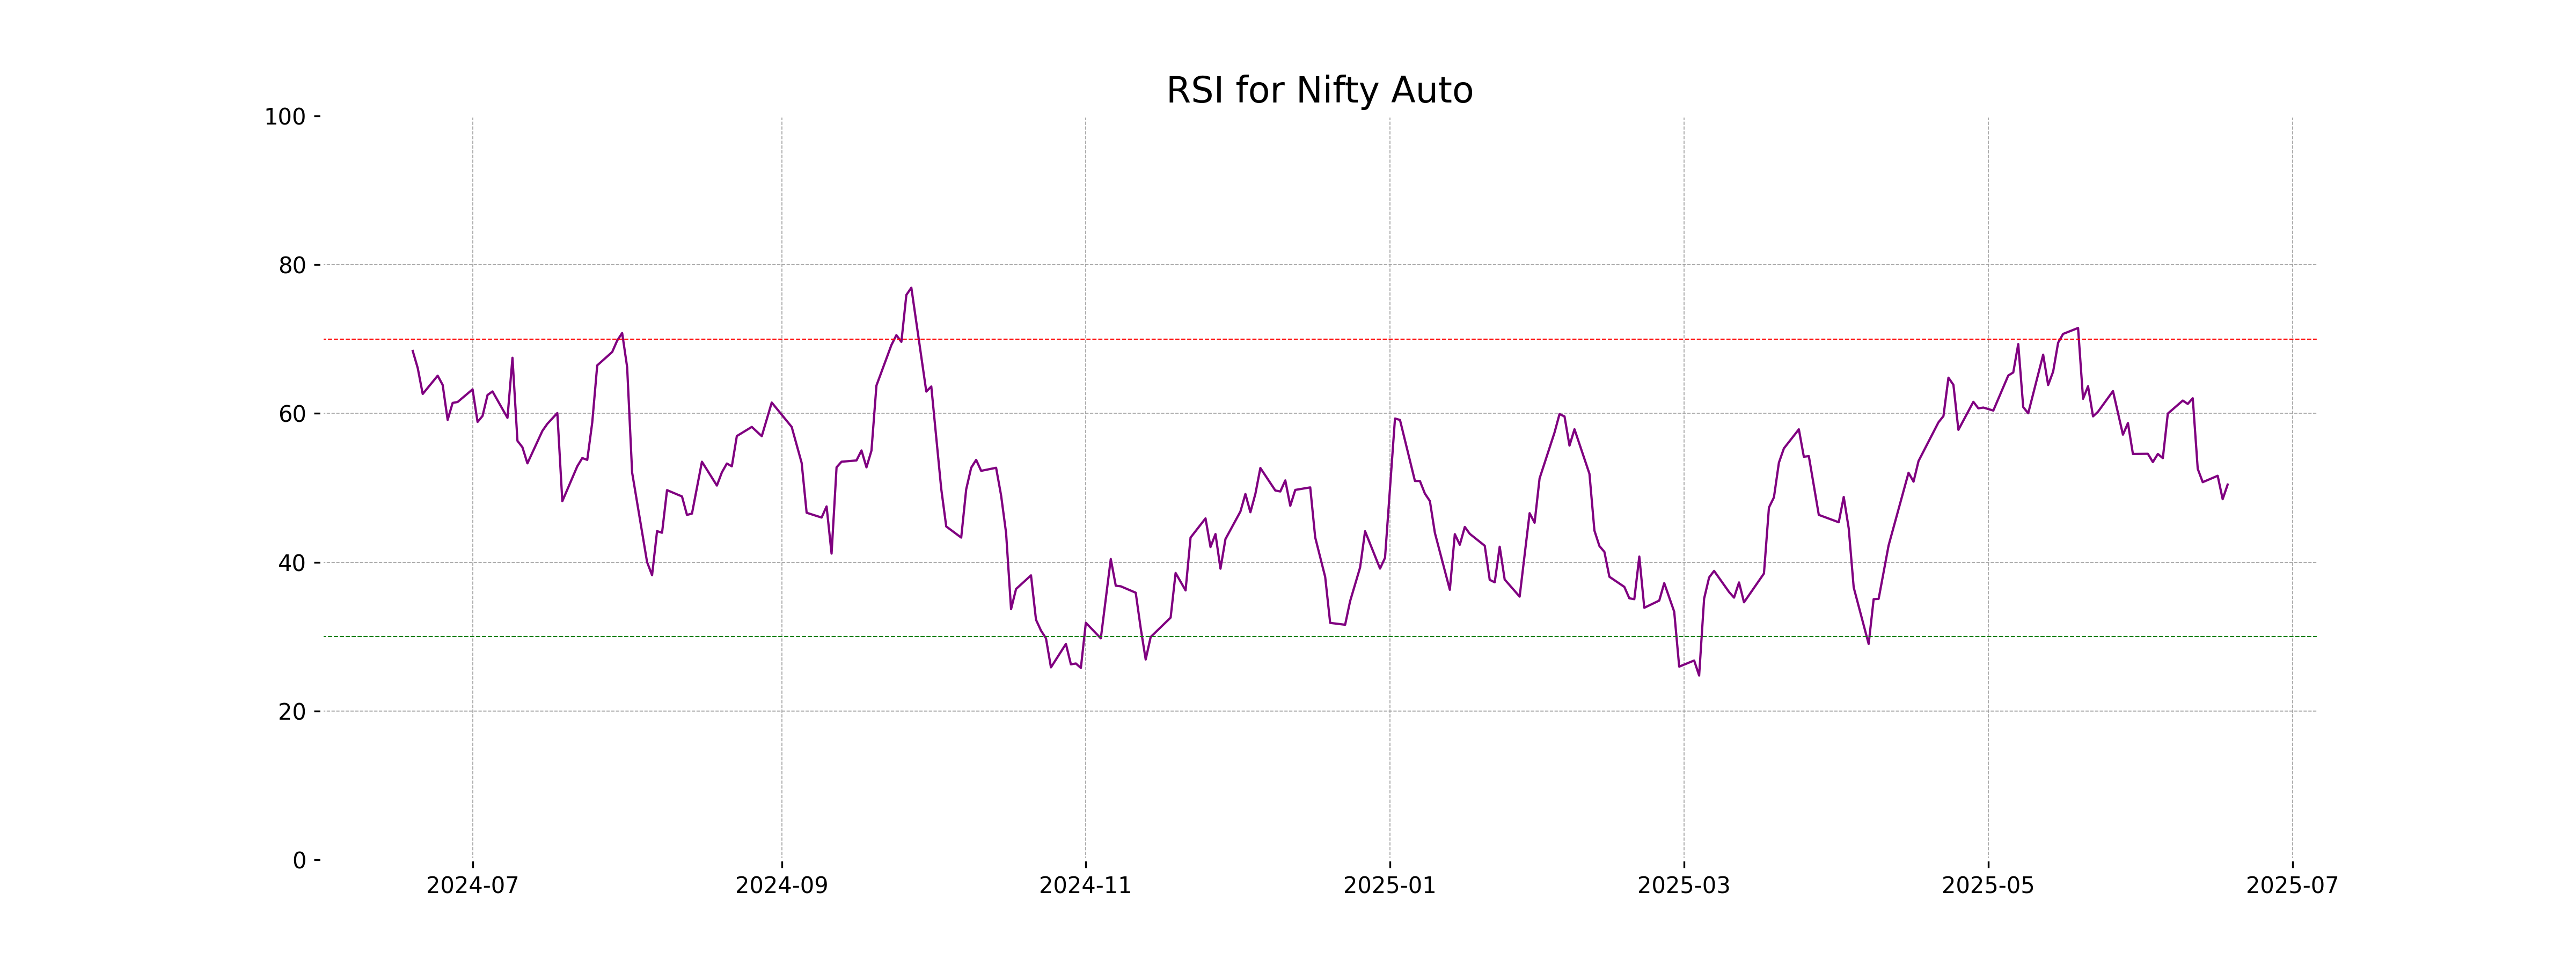
Analysis for Nifty Auto - June 18, 2025
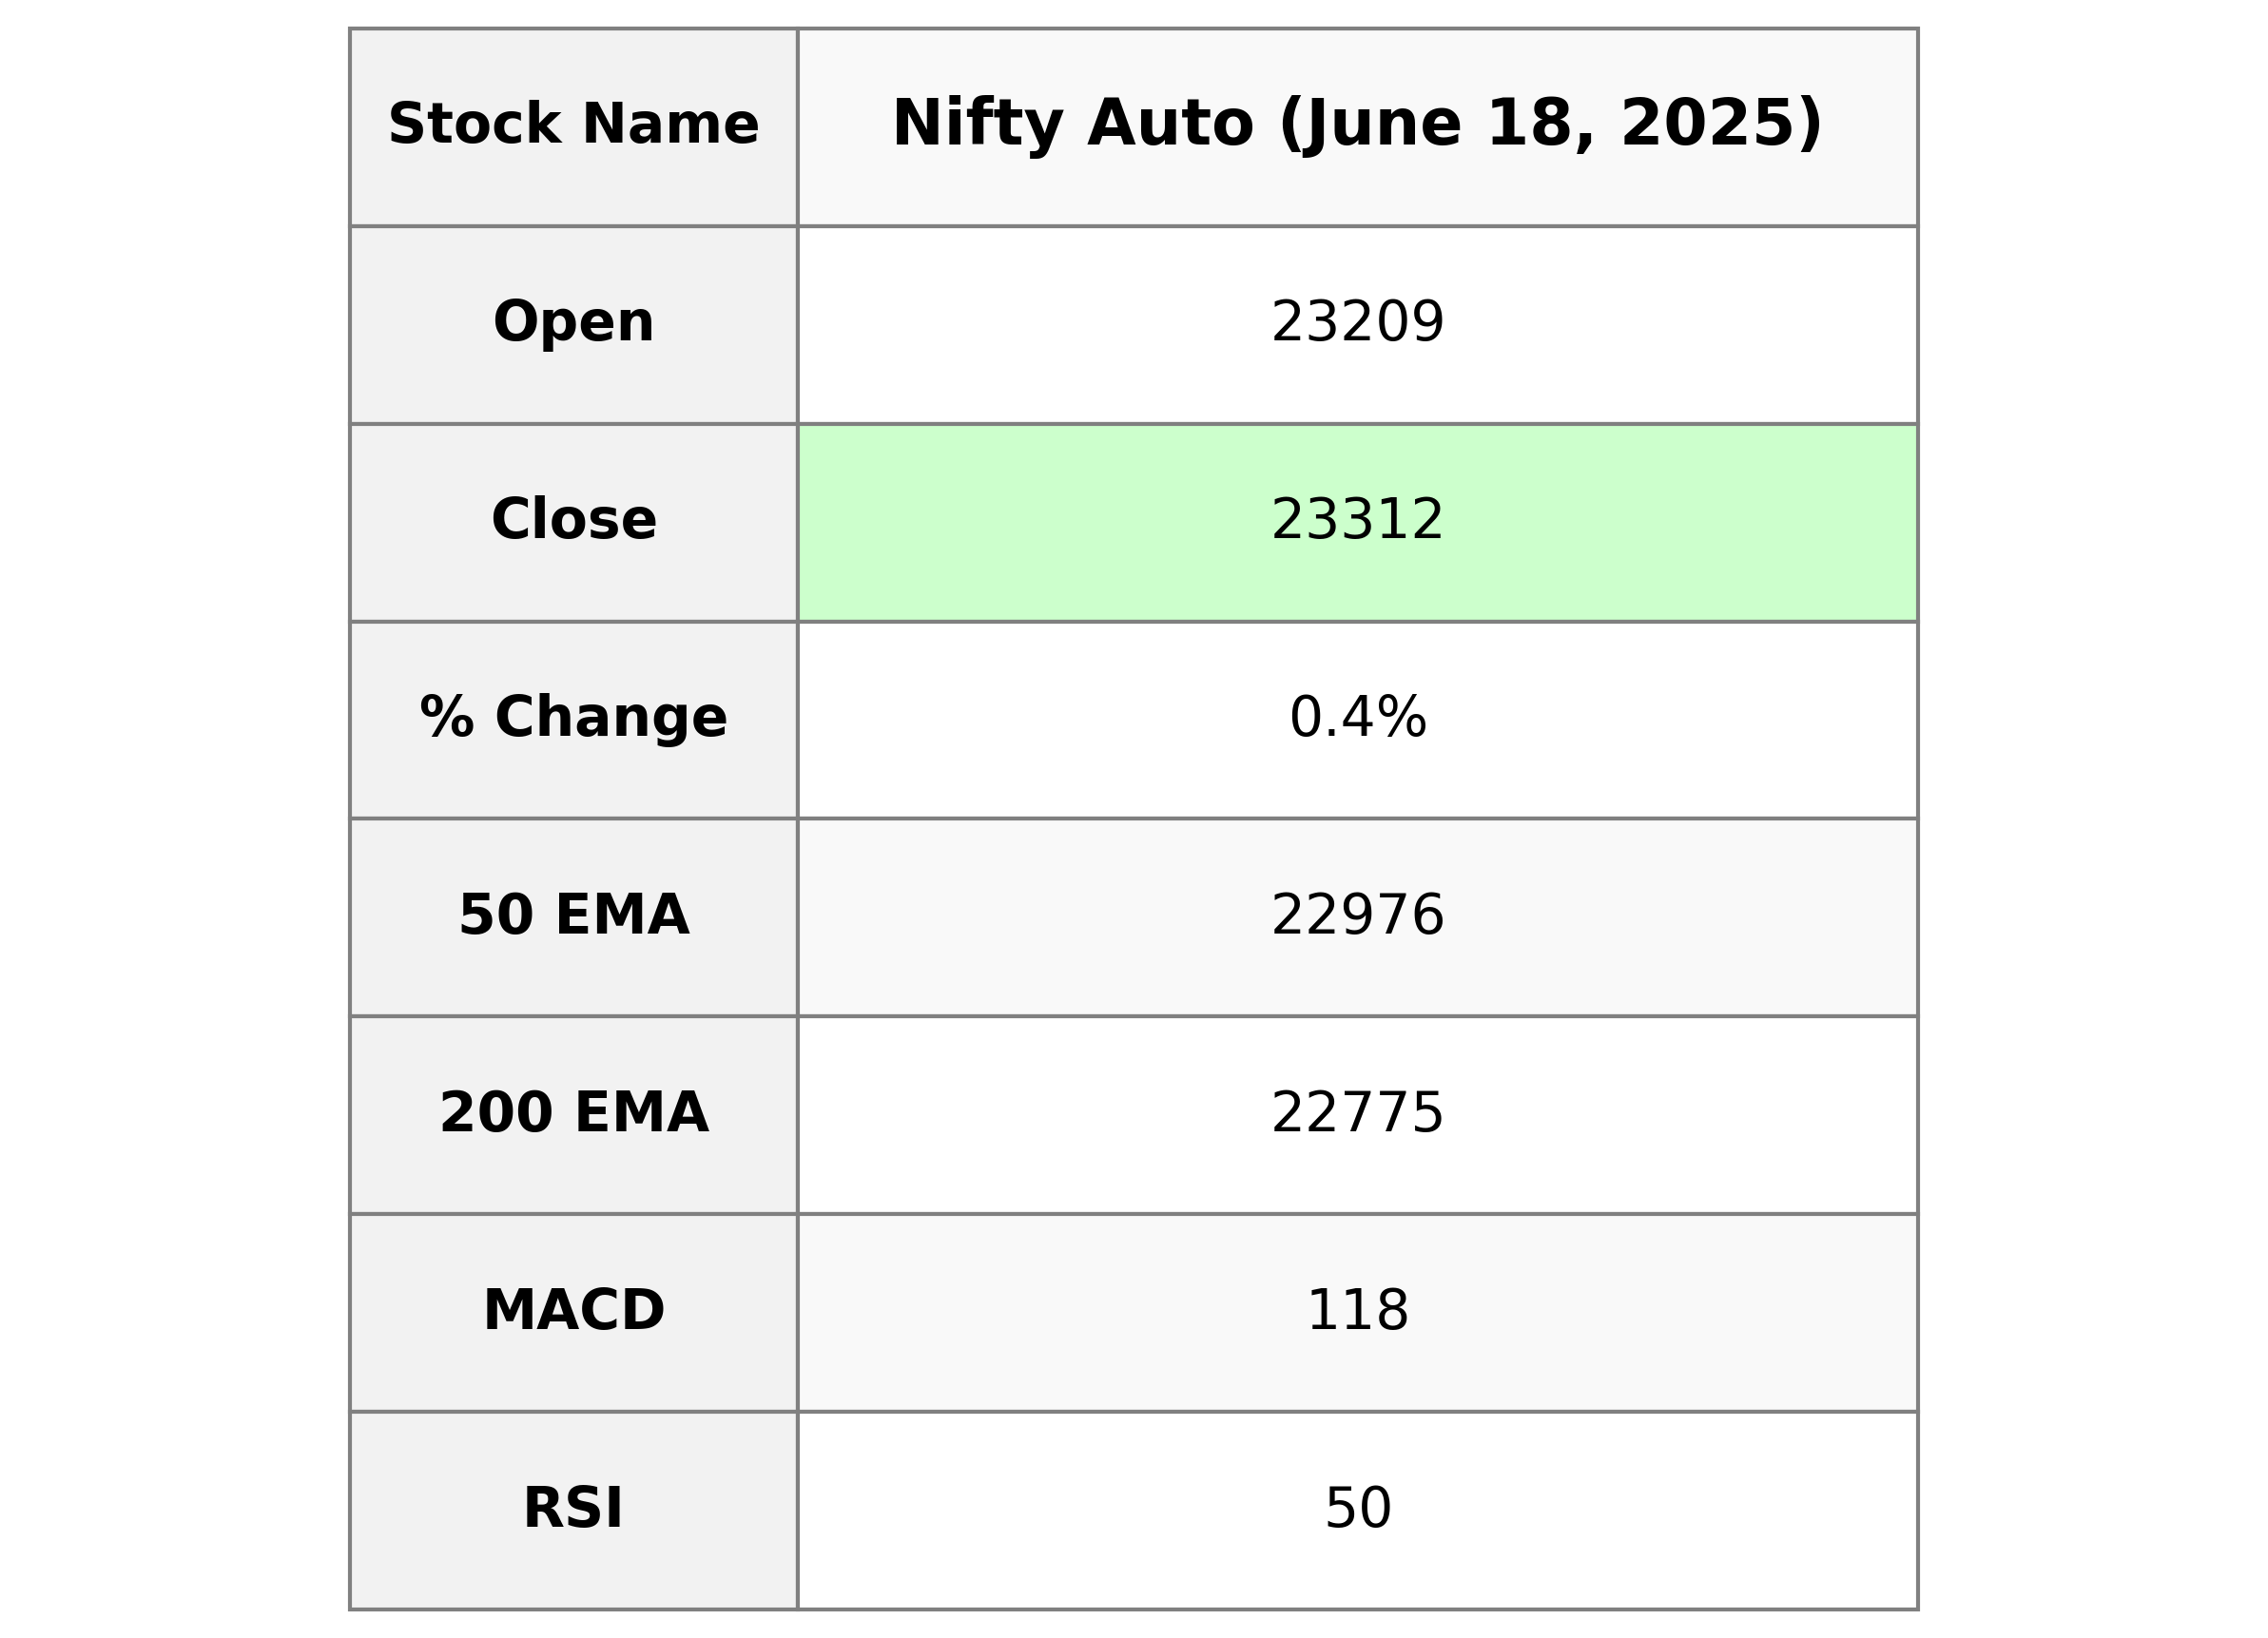
Nifty Auto opened at 23208.95 and closed at 23312.35, marking a positive change of 85.05 points or 0.37% from its previous close of 23227.30. The index's high for the day was 23564.95, with RSI sitting at 50.44, indicating a neutral momentum. The volume was reported as 0, suggesting no recorded transactions, and the MACD was below its signal line, hinting at a possible bearish trend.
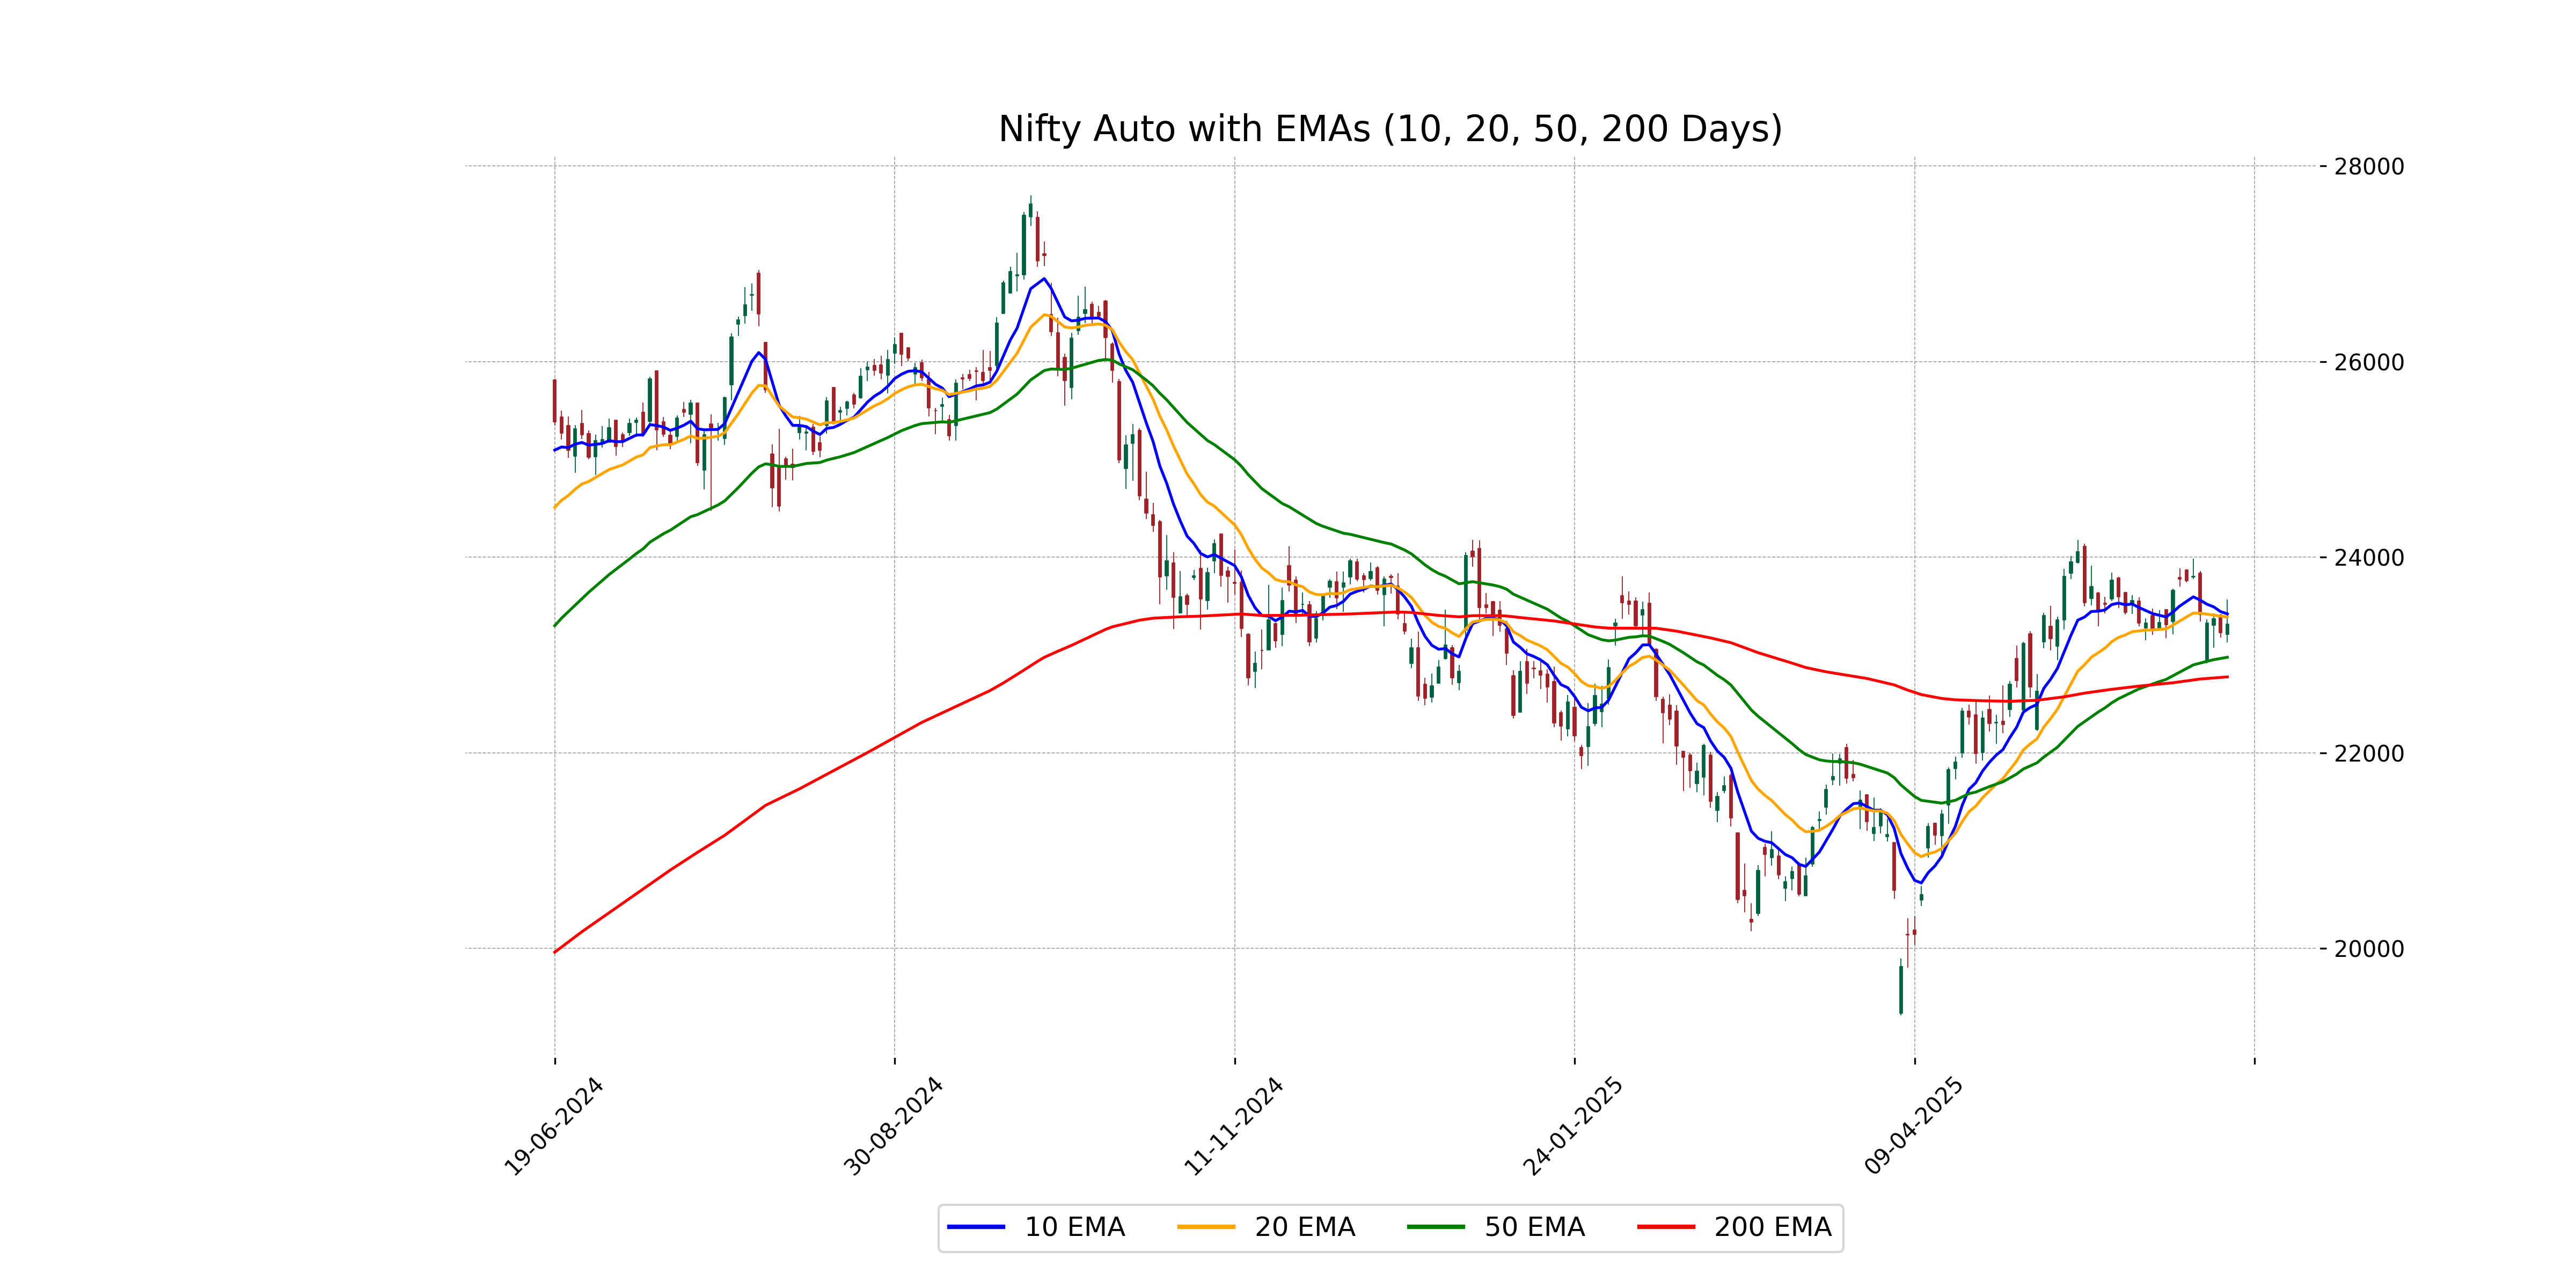
Relationship with Key Moving Averages
Nifty Auto closed at 23,312.35, which is above its 50-day EMA of 22,975.62 and its 200-day EMA of 22,774.95, indicating a bullish trend in the longer term. However, the close is below its 10-day EMA of 23,419.20 and 20-day EMA of 23,386.79, suggesting short-term weakness.
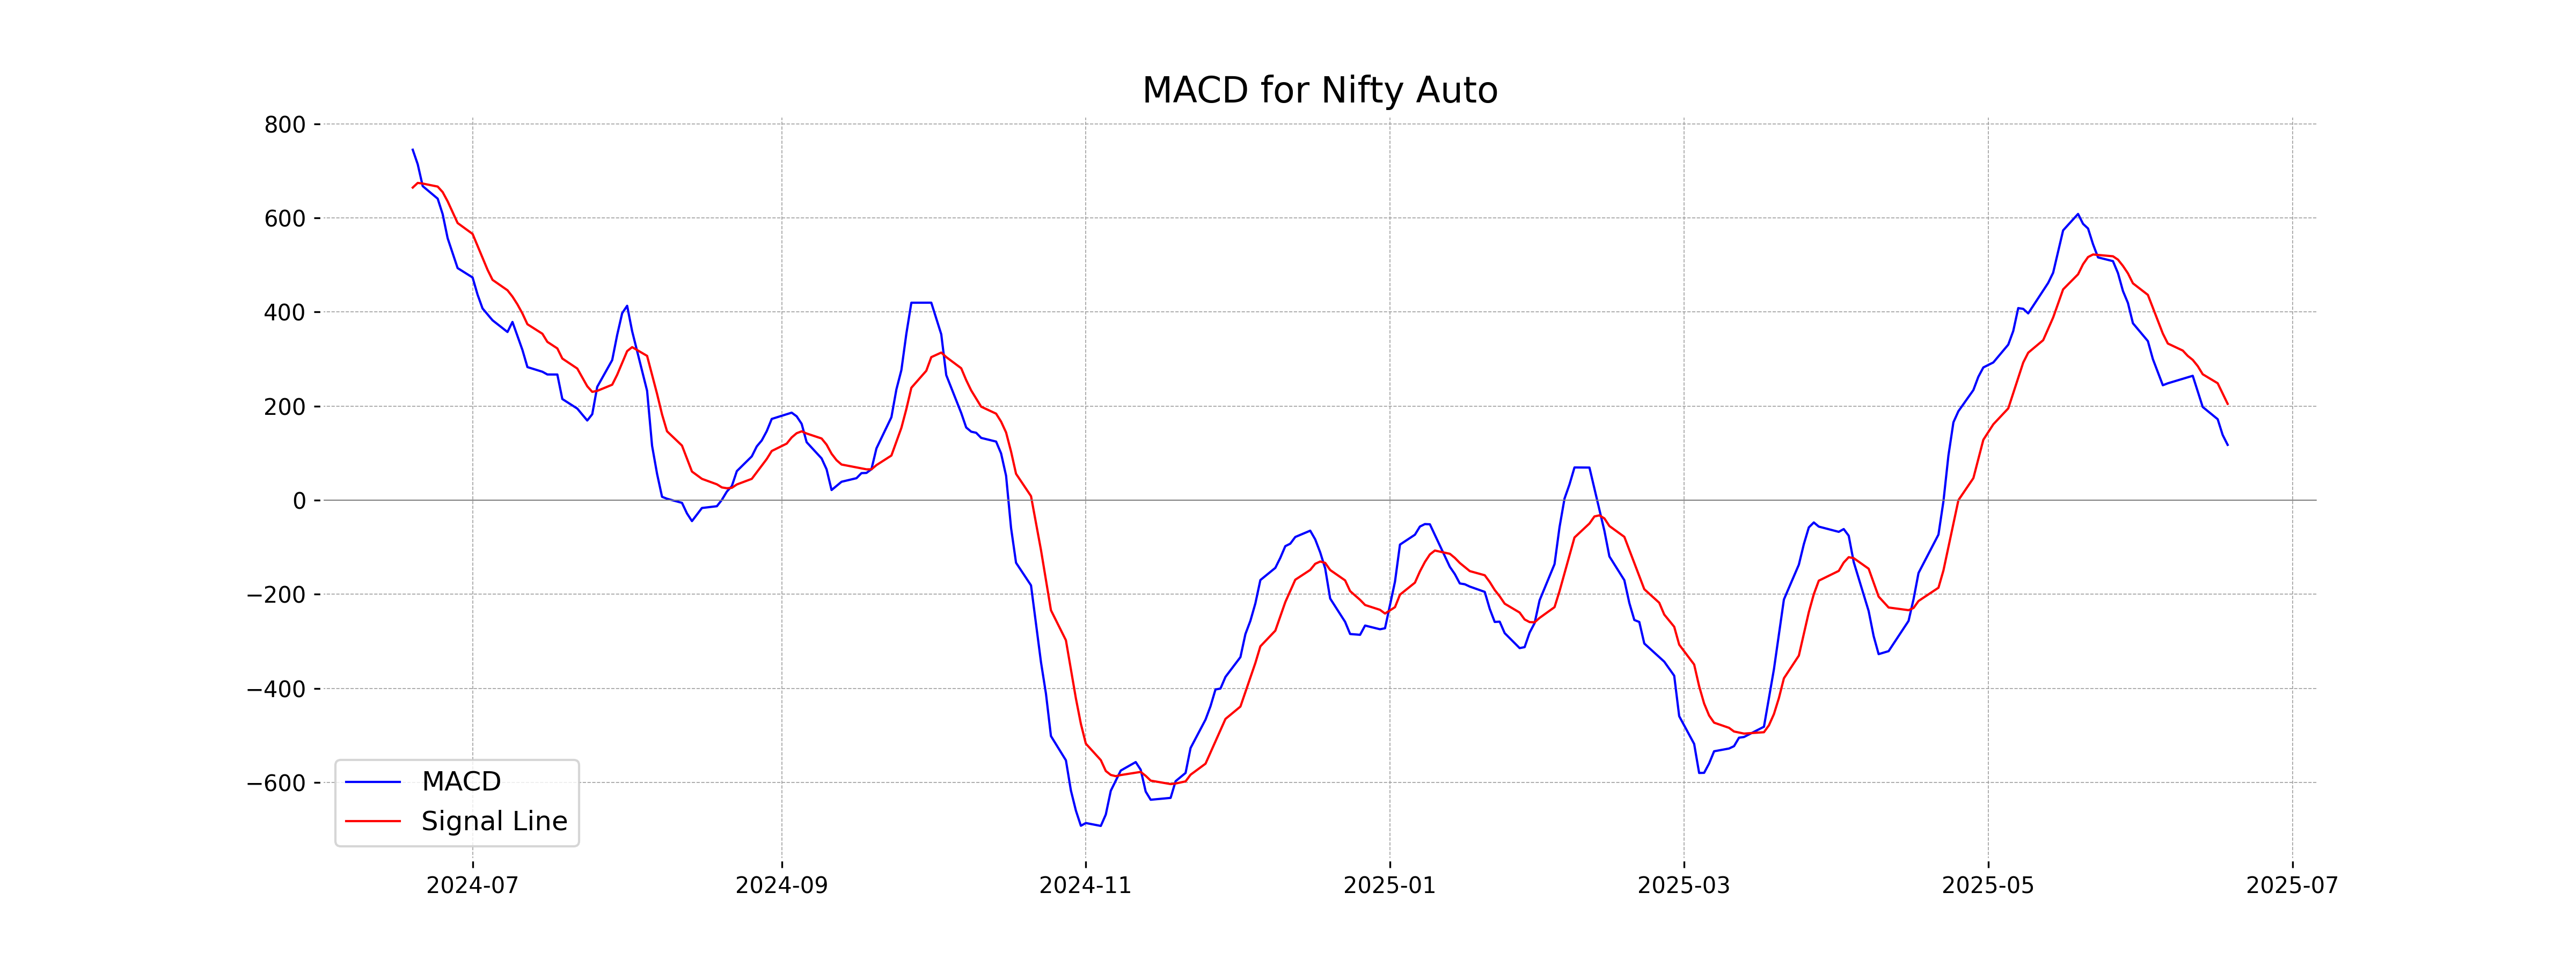
Moving Averages Trend (MACD)
The MACD for Nifty Auto is currently at 117.70, while the MACD Signal is higher at 204.91. This suggests potential weakness in upward momentum as the MACD line is below the signal line, indicating a possible bearish trend in the short term.
RSI Analysis
Nifty Auto's RSI (Relative Strength Index) is 50.44, indicating a neutral market sentiment. This suggests that the index is neither overbought nor oversold, reflecting a balanced level of buying and selling pressure.
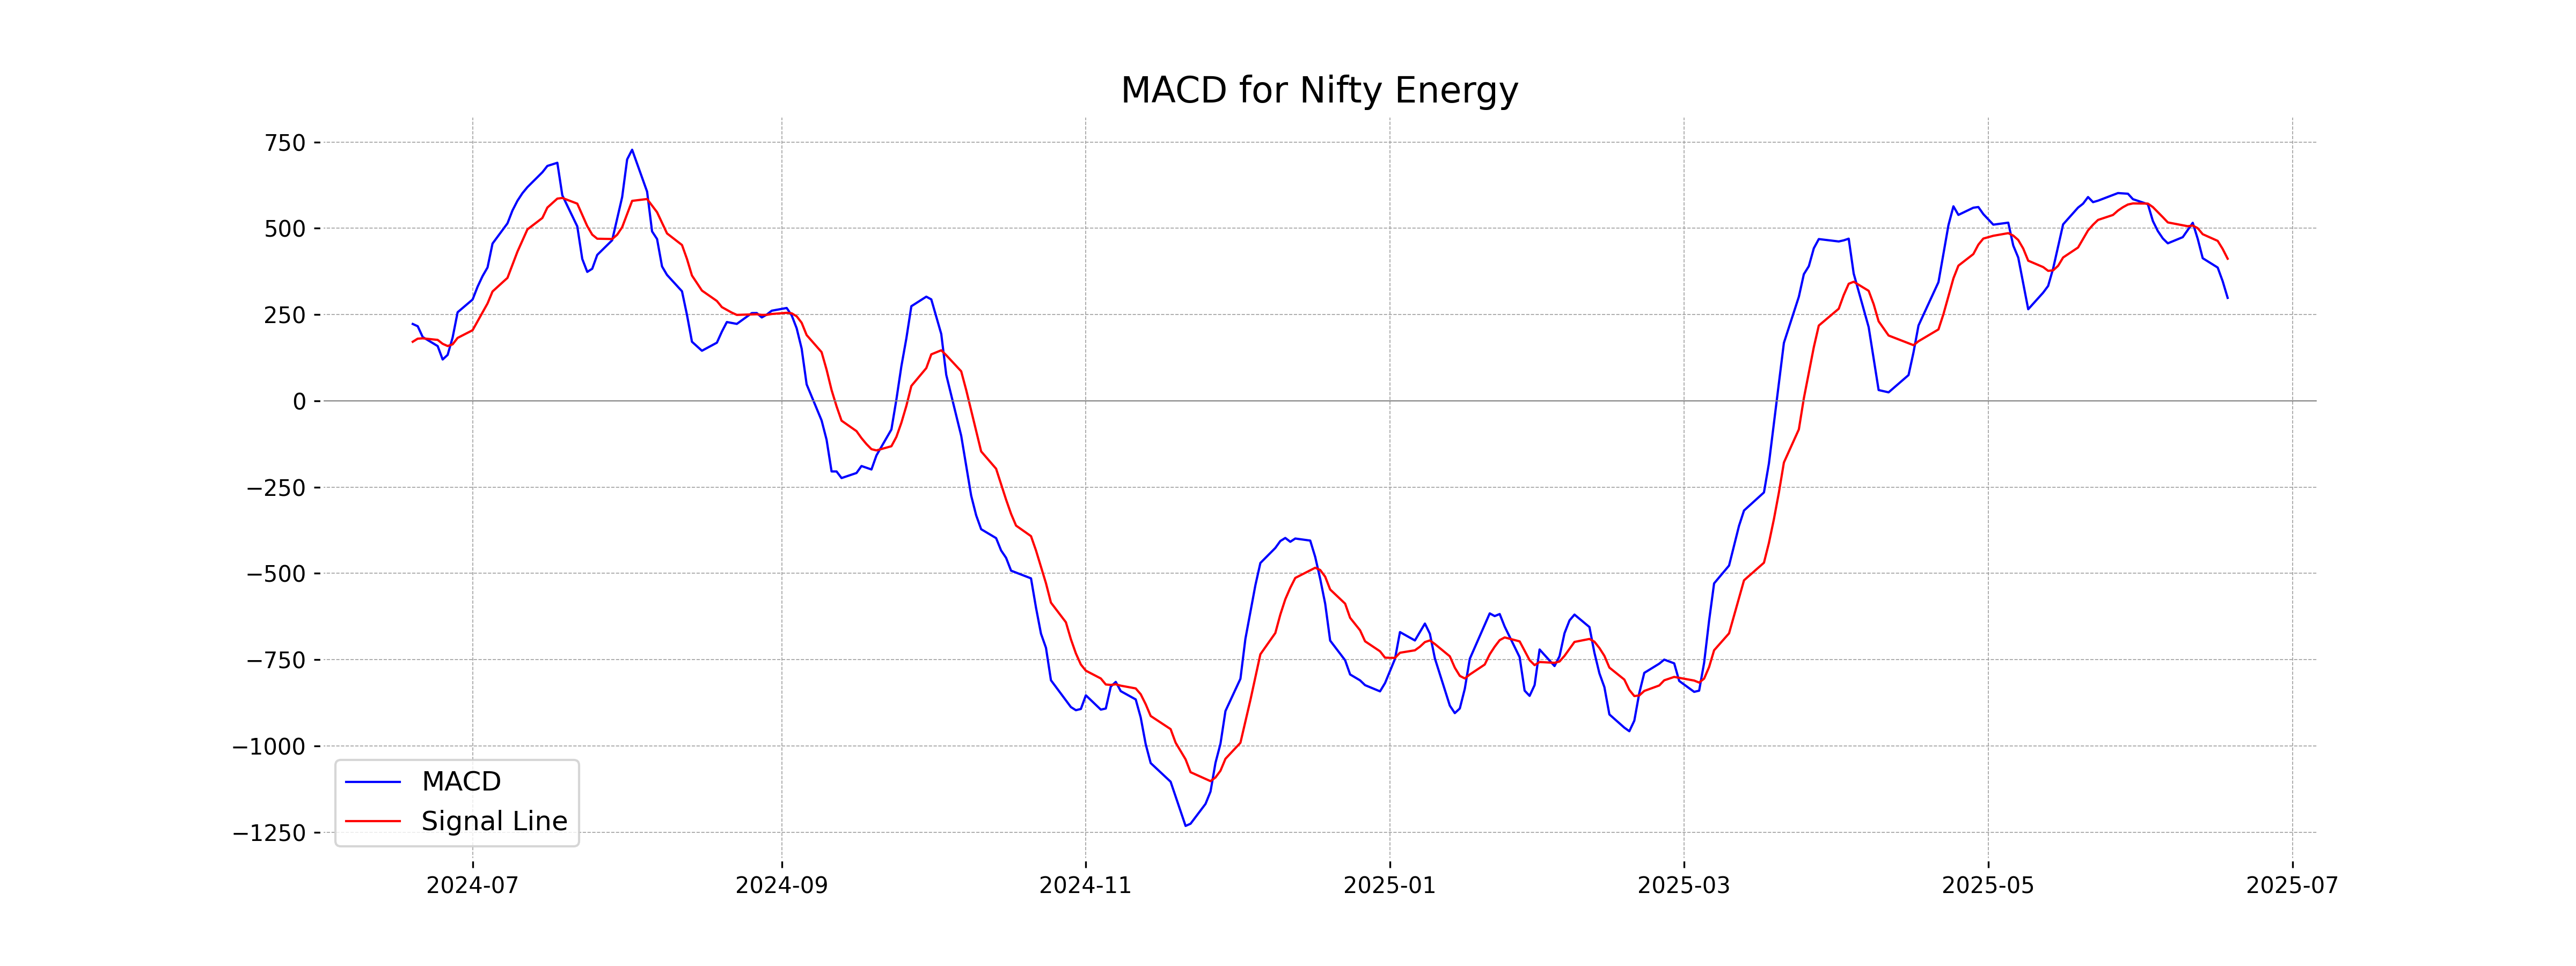
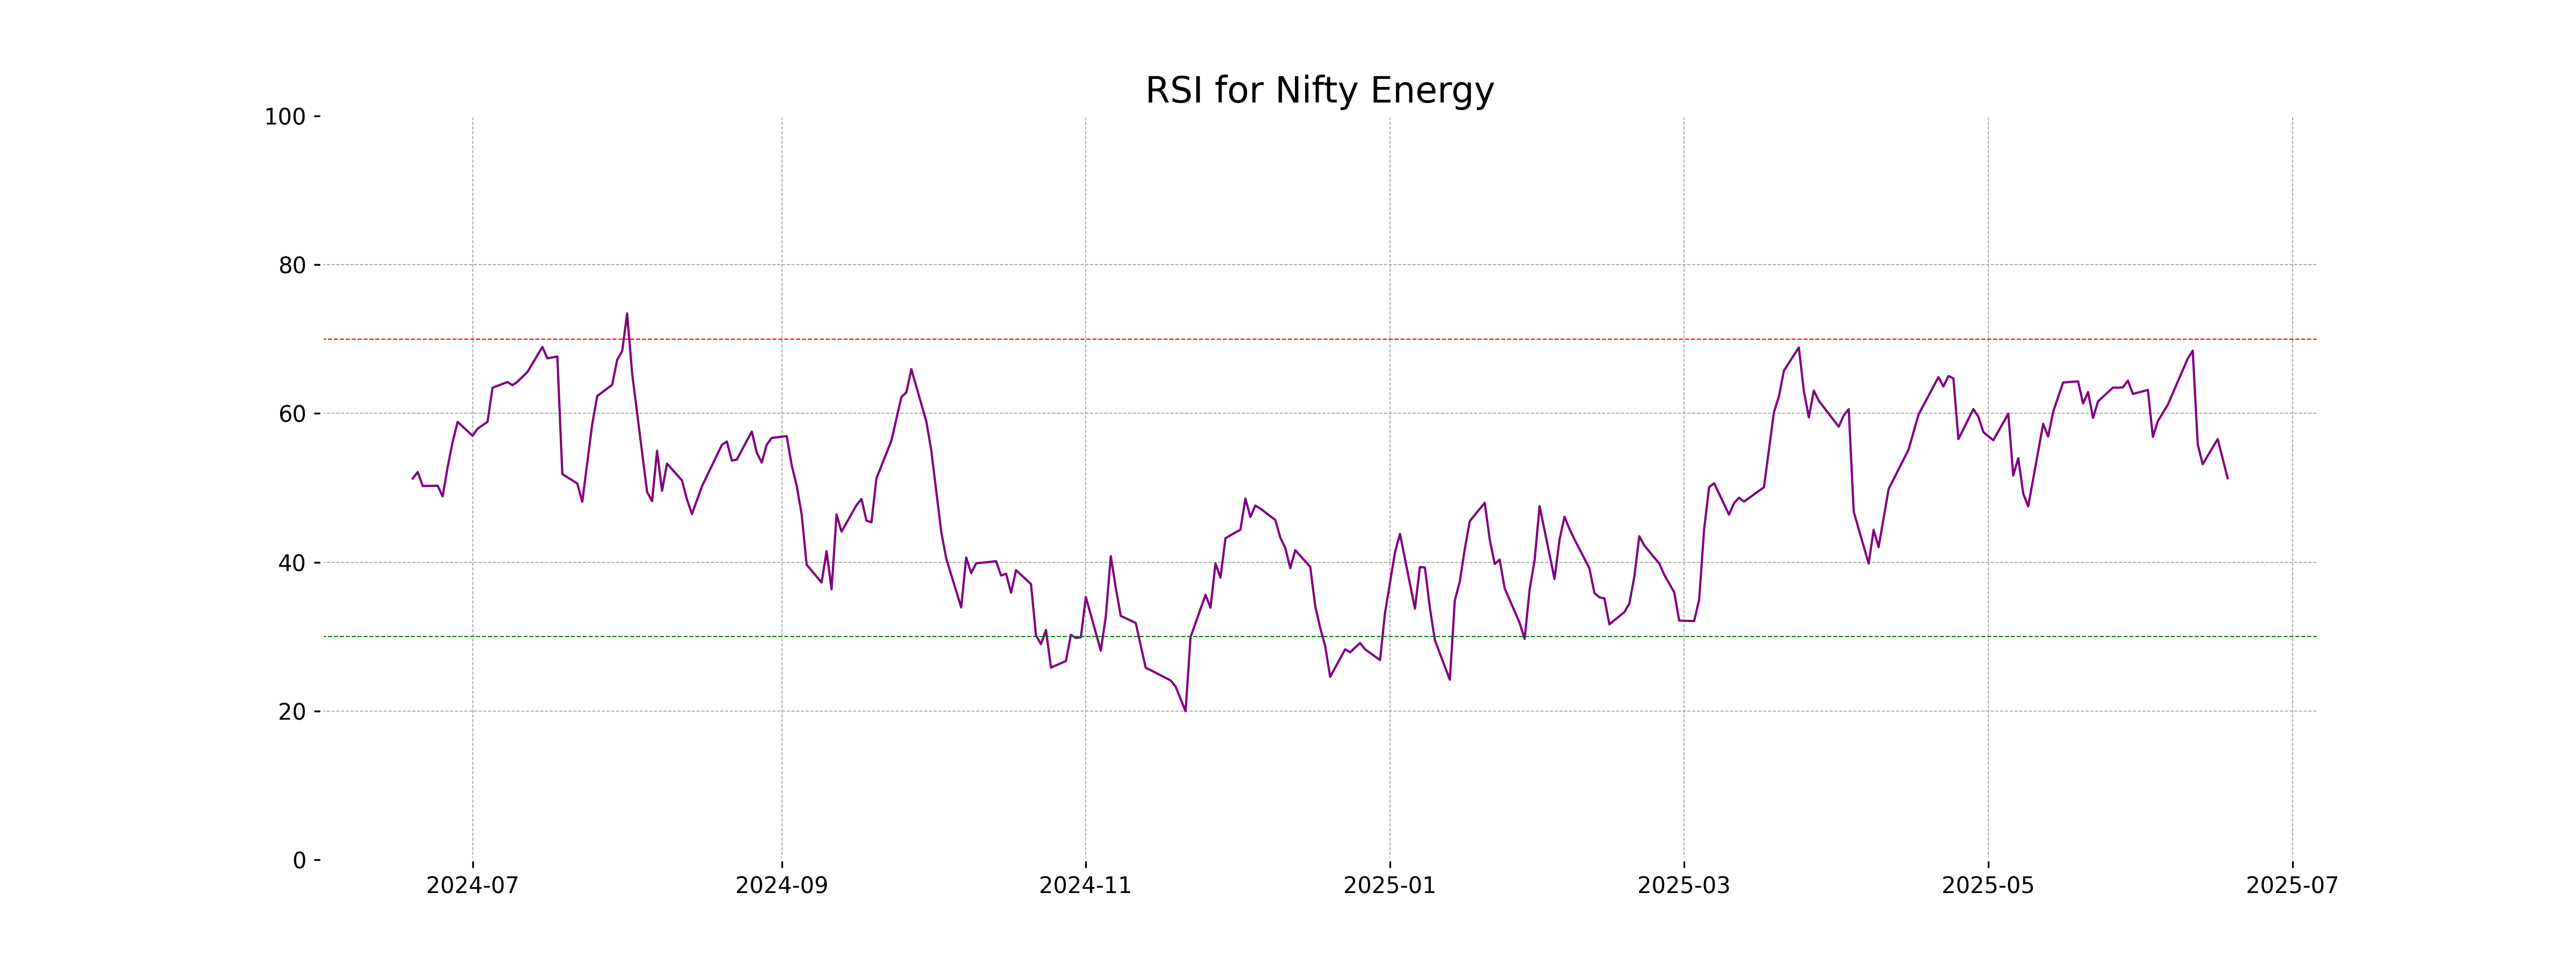
Analysis for Nifty Energy - June 18, 2025
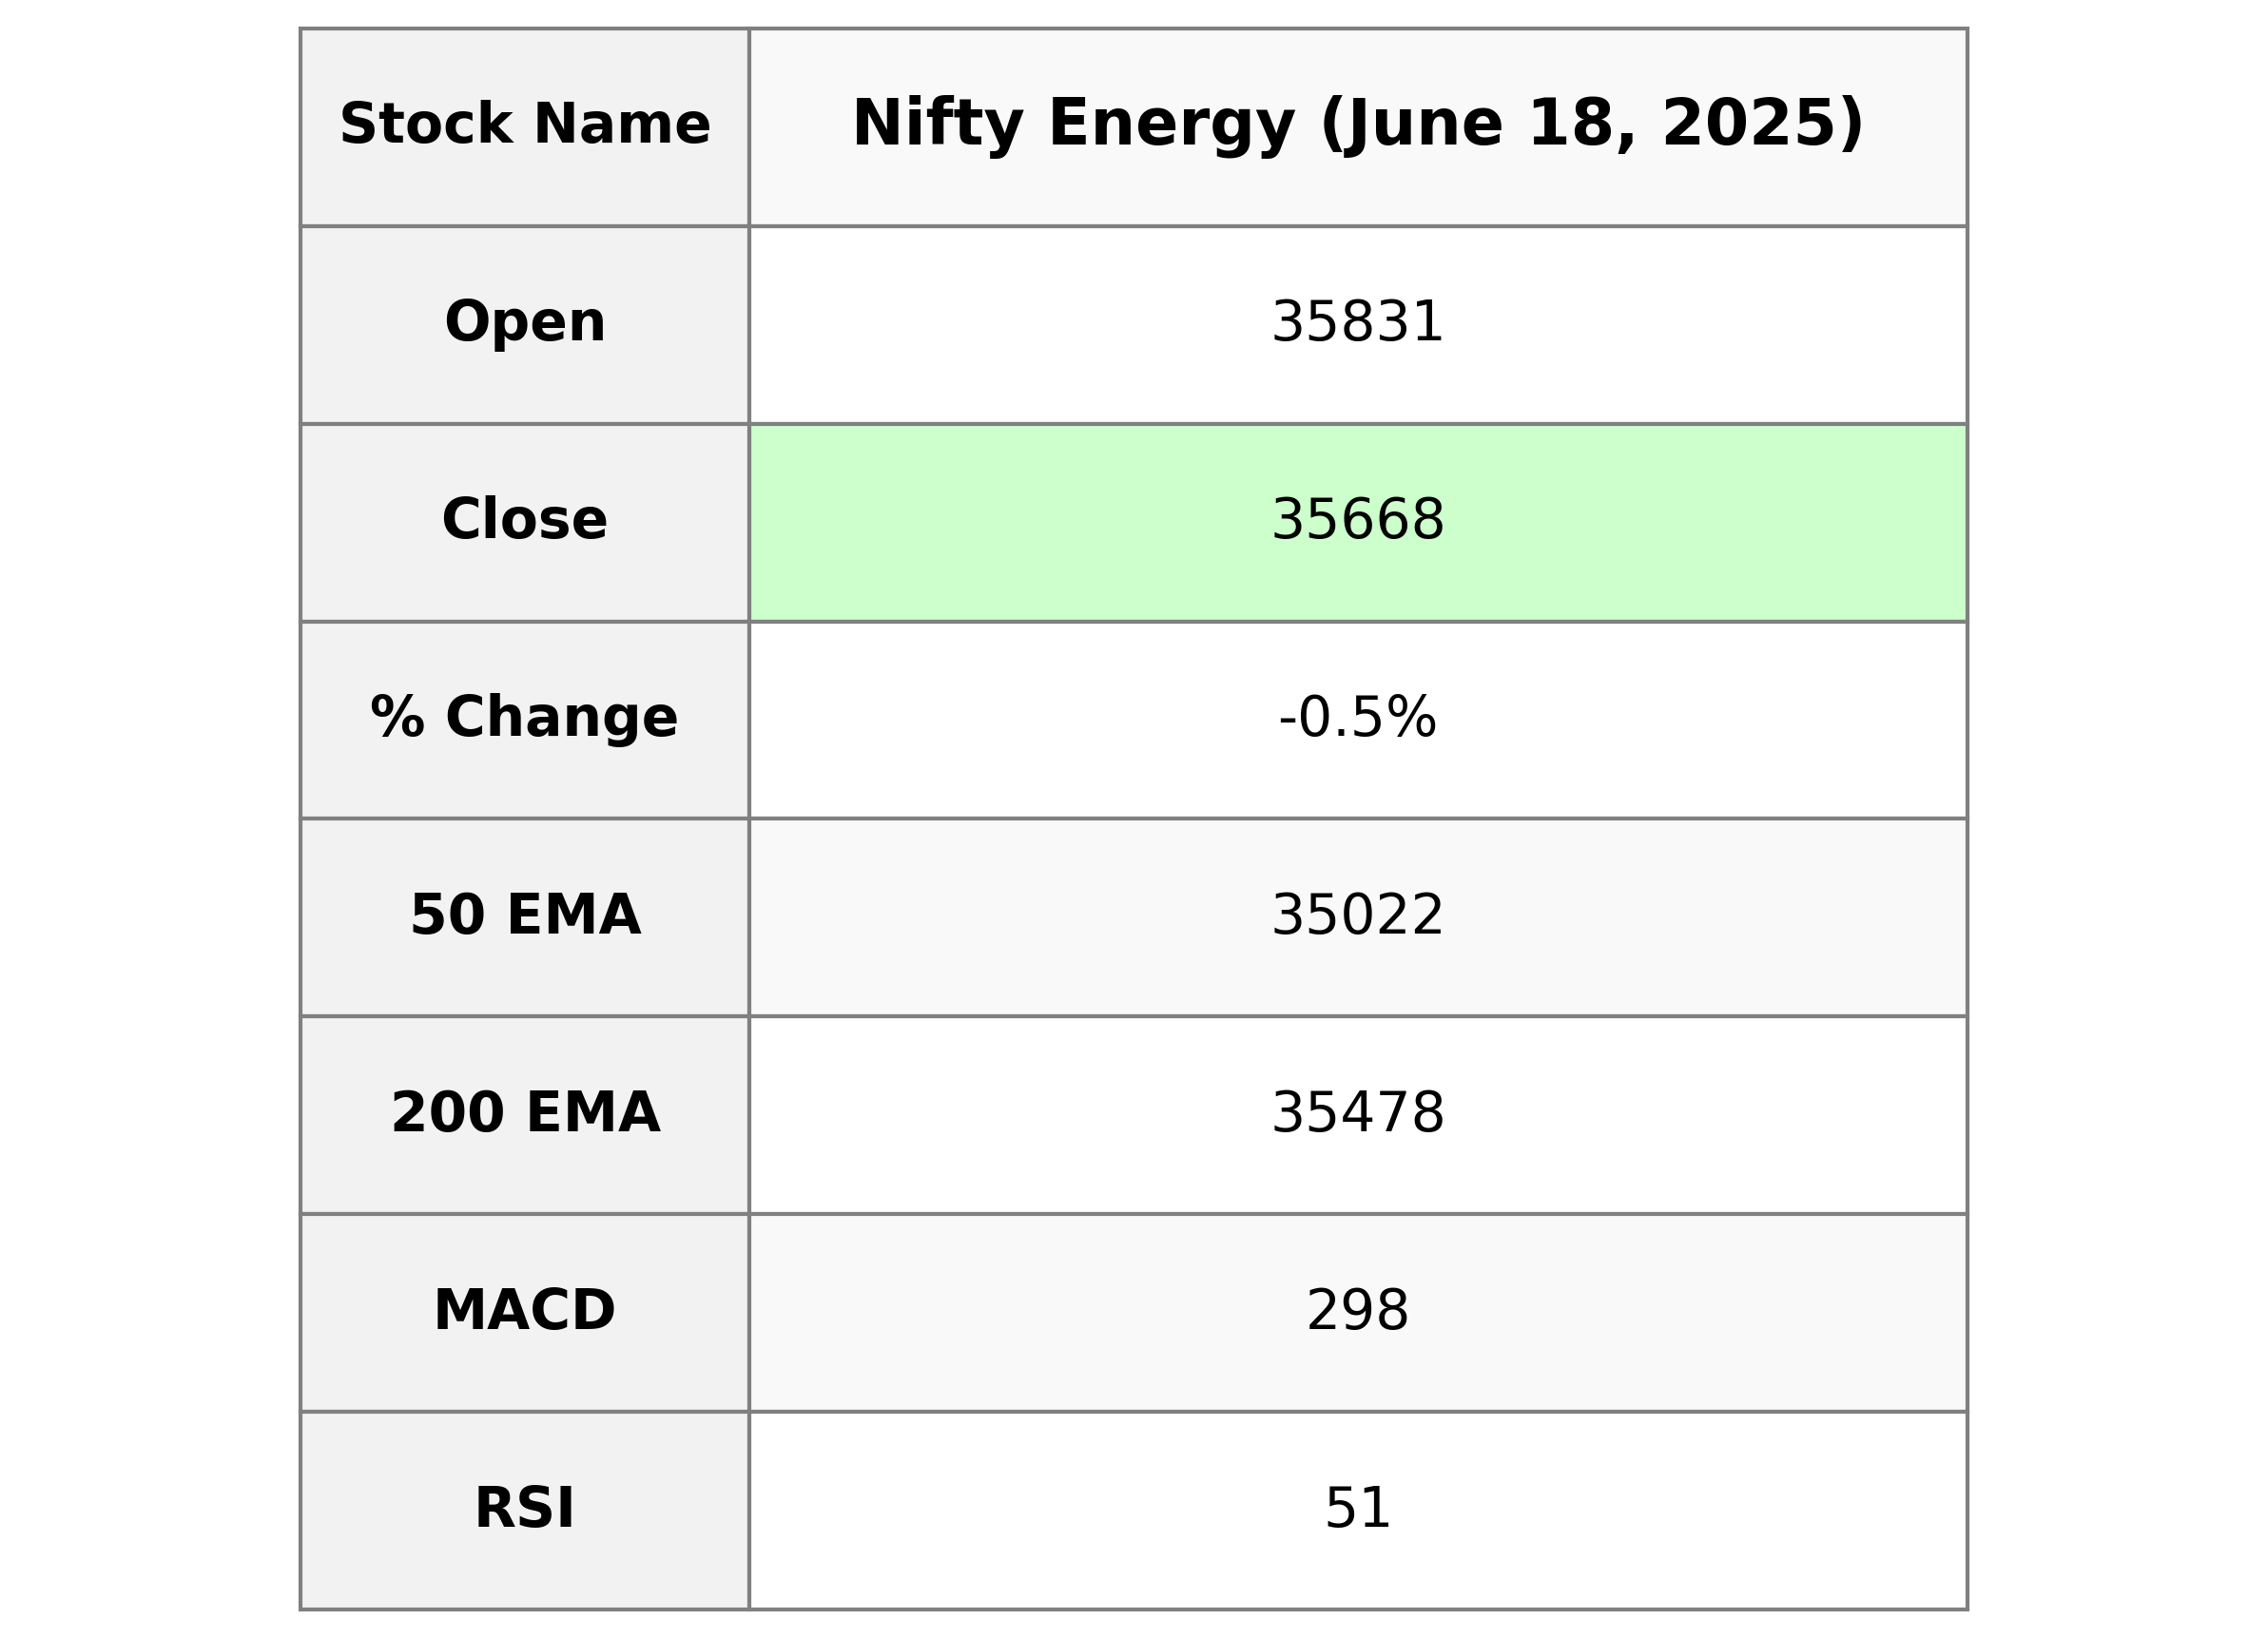
Nifty Energy Performance Description: On the trading day, Nifty Energy opened at 35831.25 and closed at 35667.55, marking a decrease of 0.47% or 168.45 points from the previous close of 35836.0. The day's high was 35941.95, while the low was 35544.15. The technical indicators show a MACD of 298.41 with a signal line at 411.85, and an RSI of 51.29, indicating a somewhat neutral market sentiment. With the 50-day EMA at 35021.62 and the 200-day EMA at 35478.24, the index is trading slightly above these averages, hinting at a recent bullish trend but with possible consolidation.
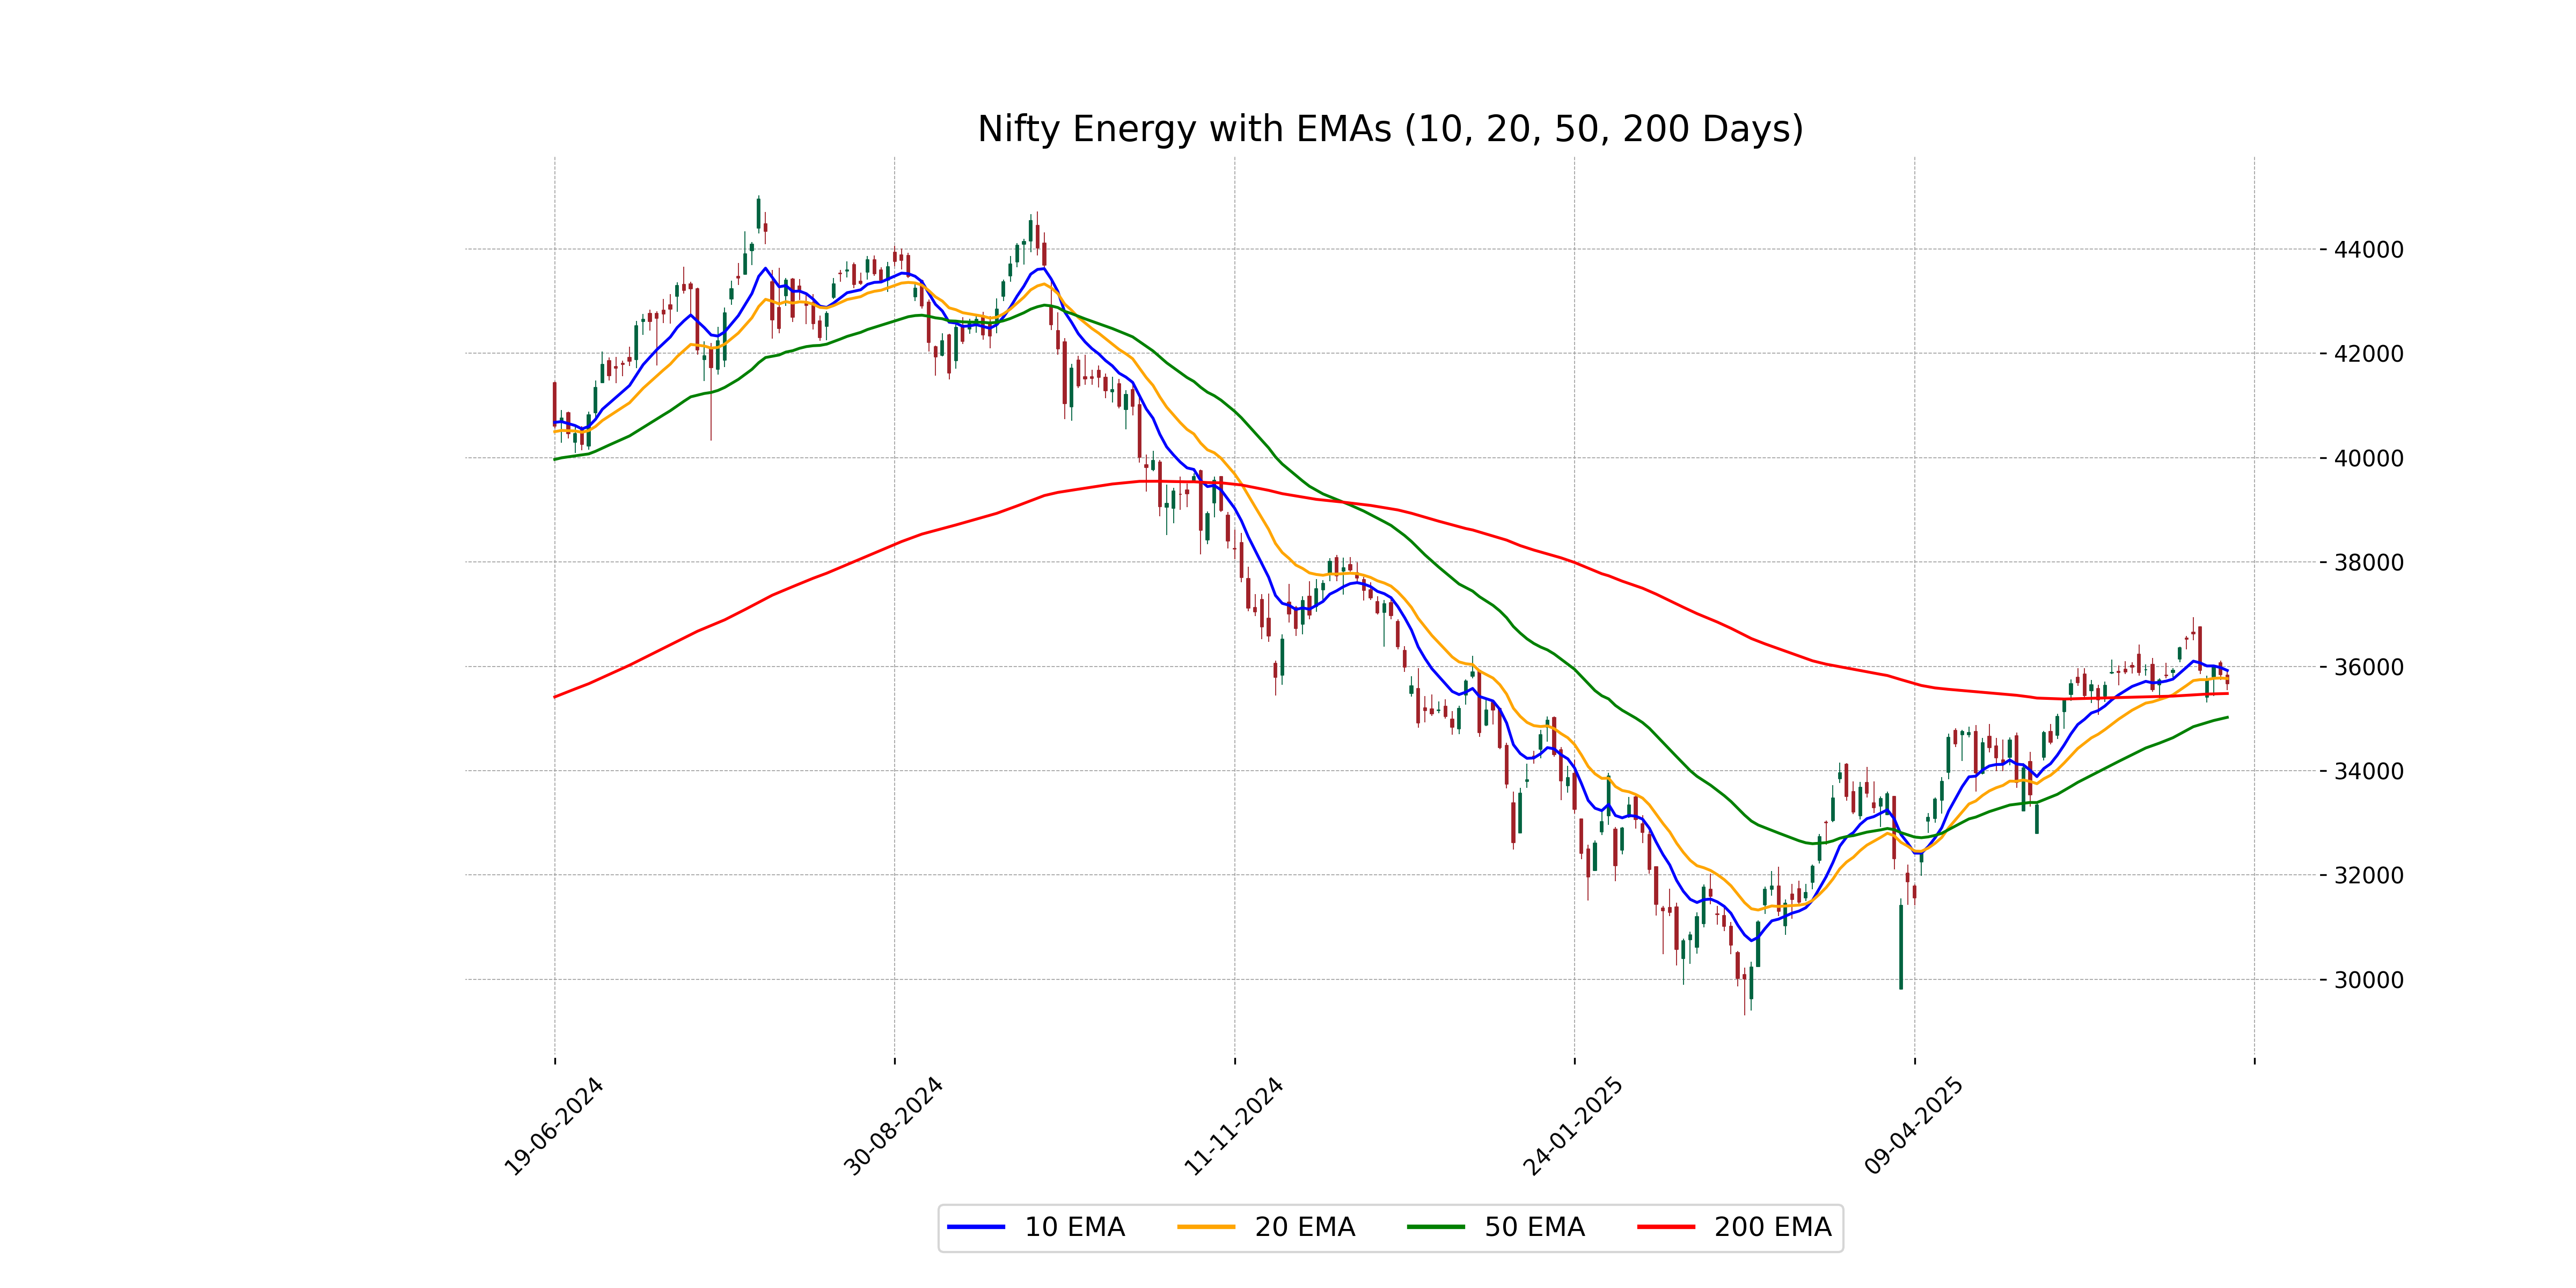
Relationship with Key Moving Averages
Nifty Energy closed below its 10 EMA, 20 EMA, and 50 EMA, indicating short-term and medium-term bearishness, as it has also closed above the 200 EMA, suggesting long-term support remains intact. The RSI value suggests a neutral momentum with potential for upcoming price movement.
Moving Averages Trend (MACD)
The MACD for Nifty Energy shows a negative histogram as the MACD is at 298.41 while the MACD Signal is higher at 411.85. This indicates a bearish phase as the MACD line is below the signal line. The decline in MACD values suggests weakening momentum in the stock.
RSI Analysis
Nifty Energy is showing a Relative Strength Index (RSI) of 51.29, which indicates a neutral market sentiment. This suggests that the index is neither overbought nor oversold, allowing room for potential movement in either direction.
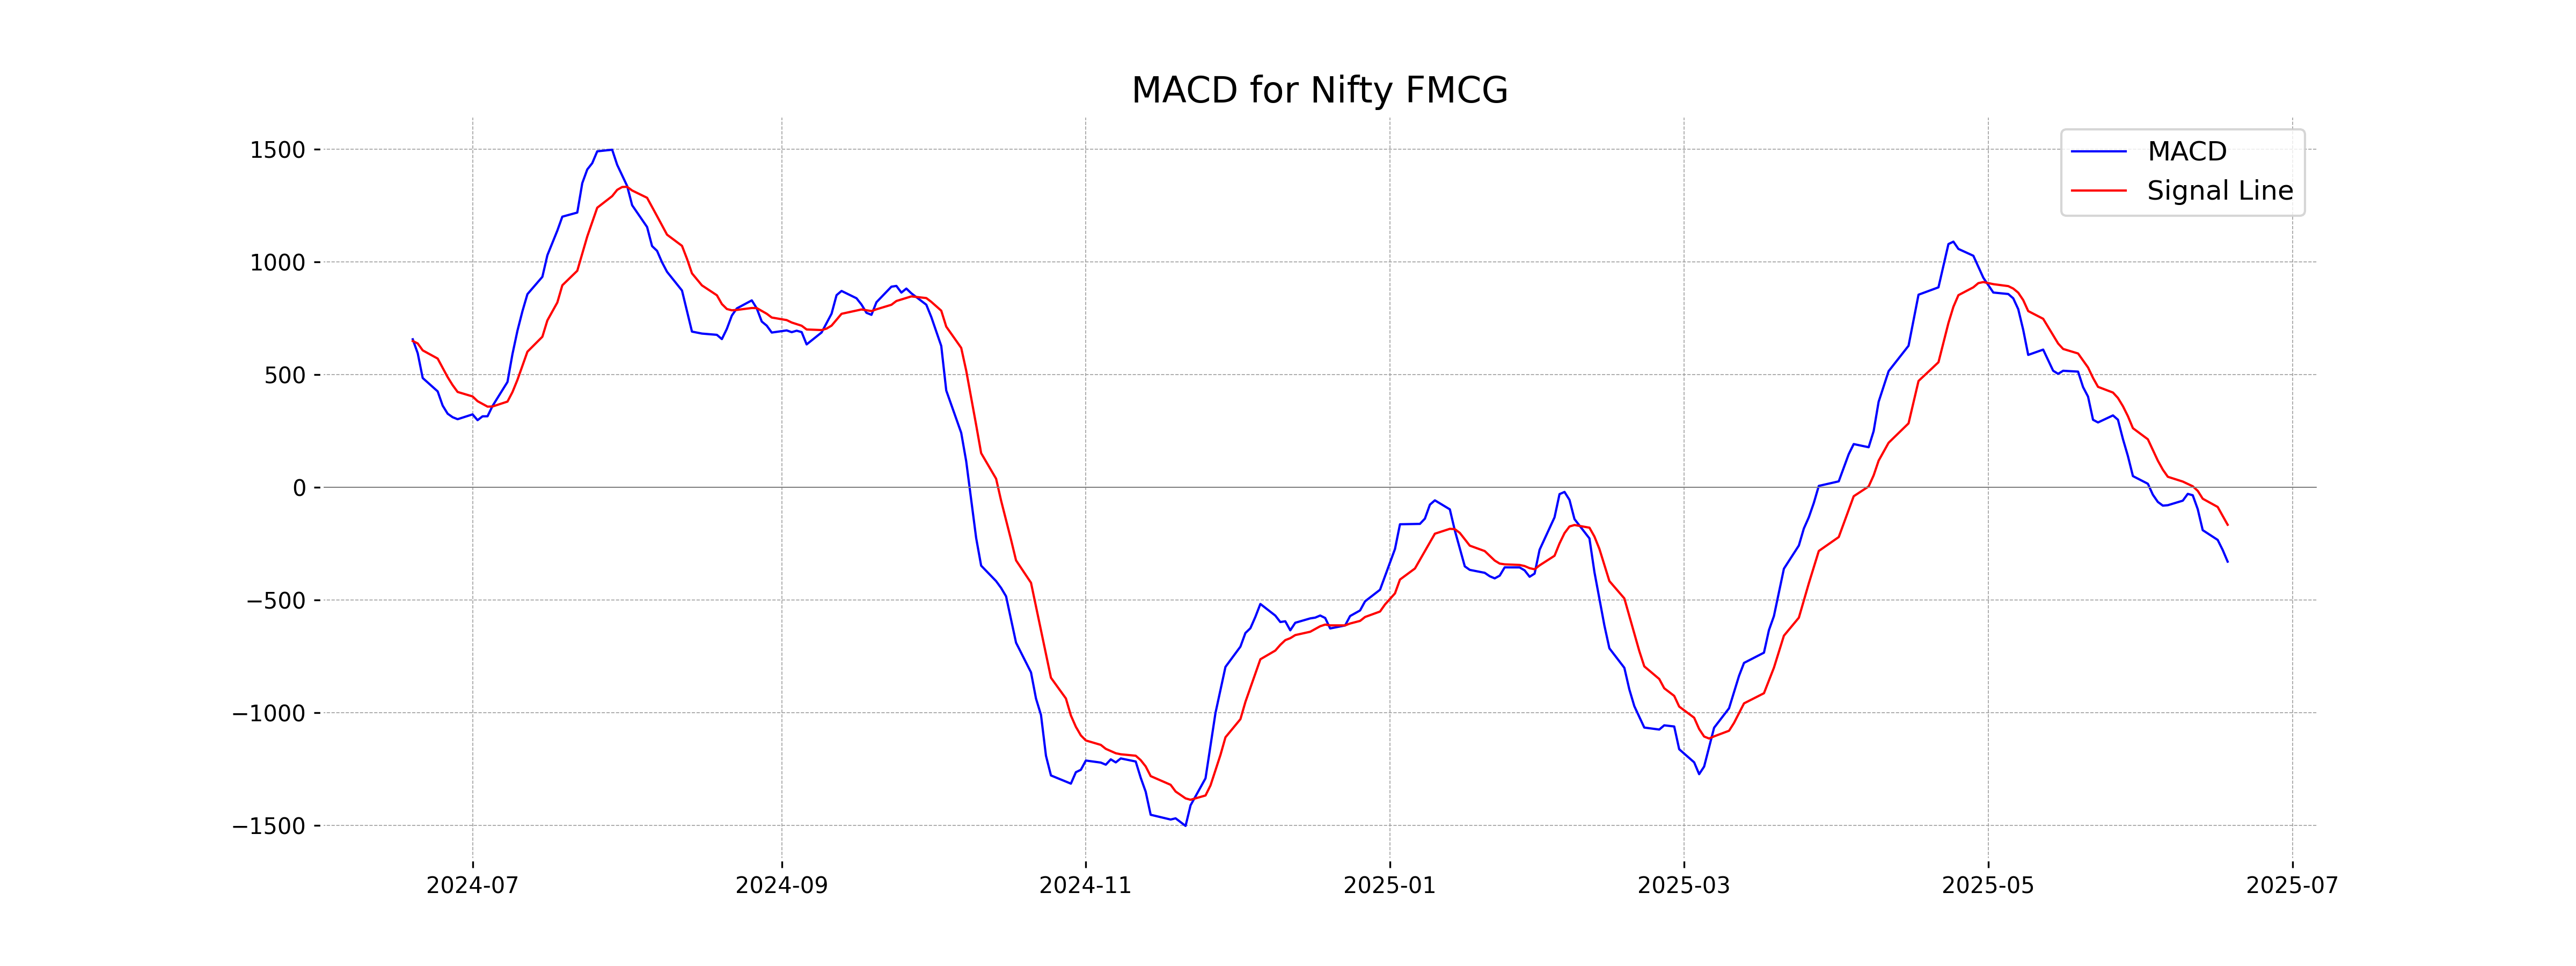
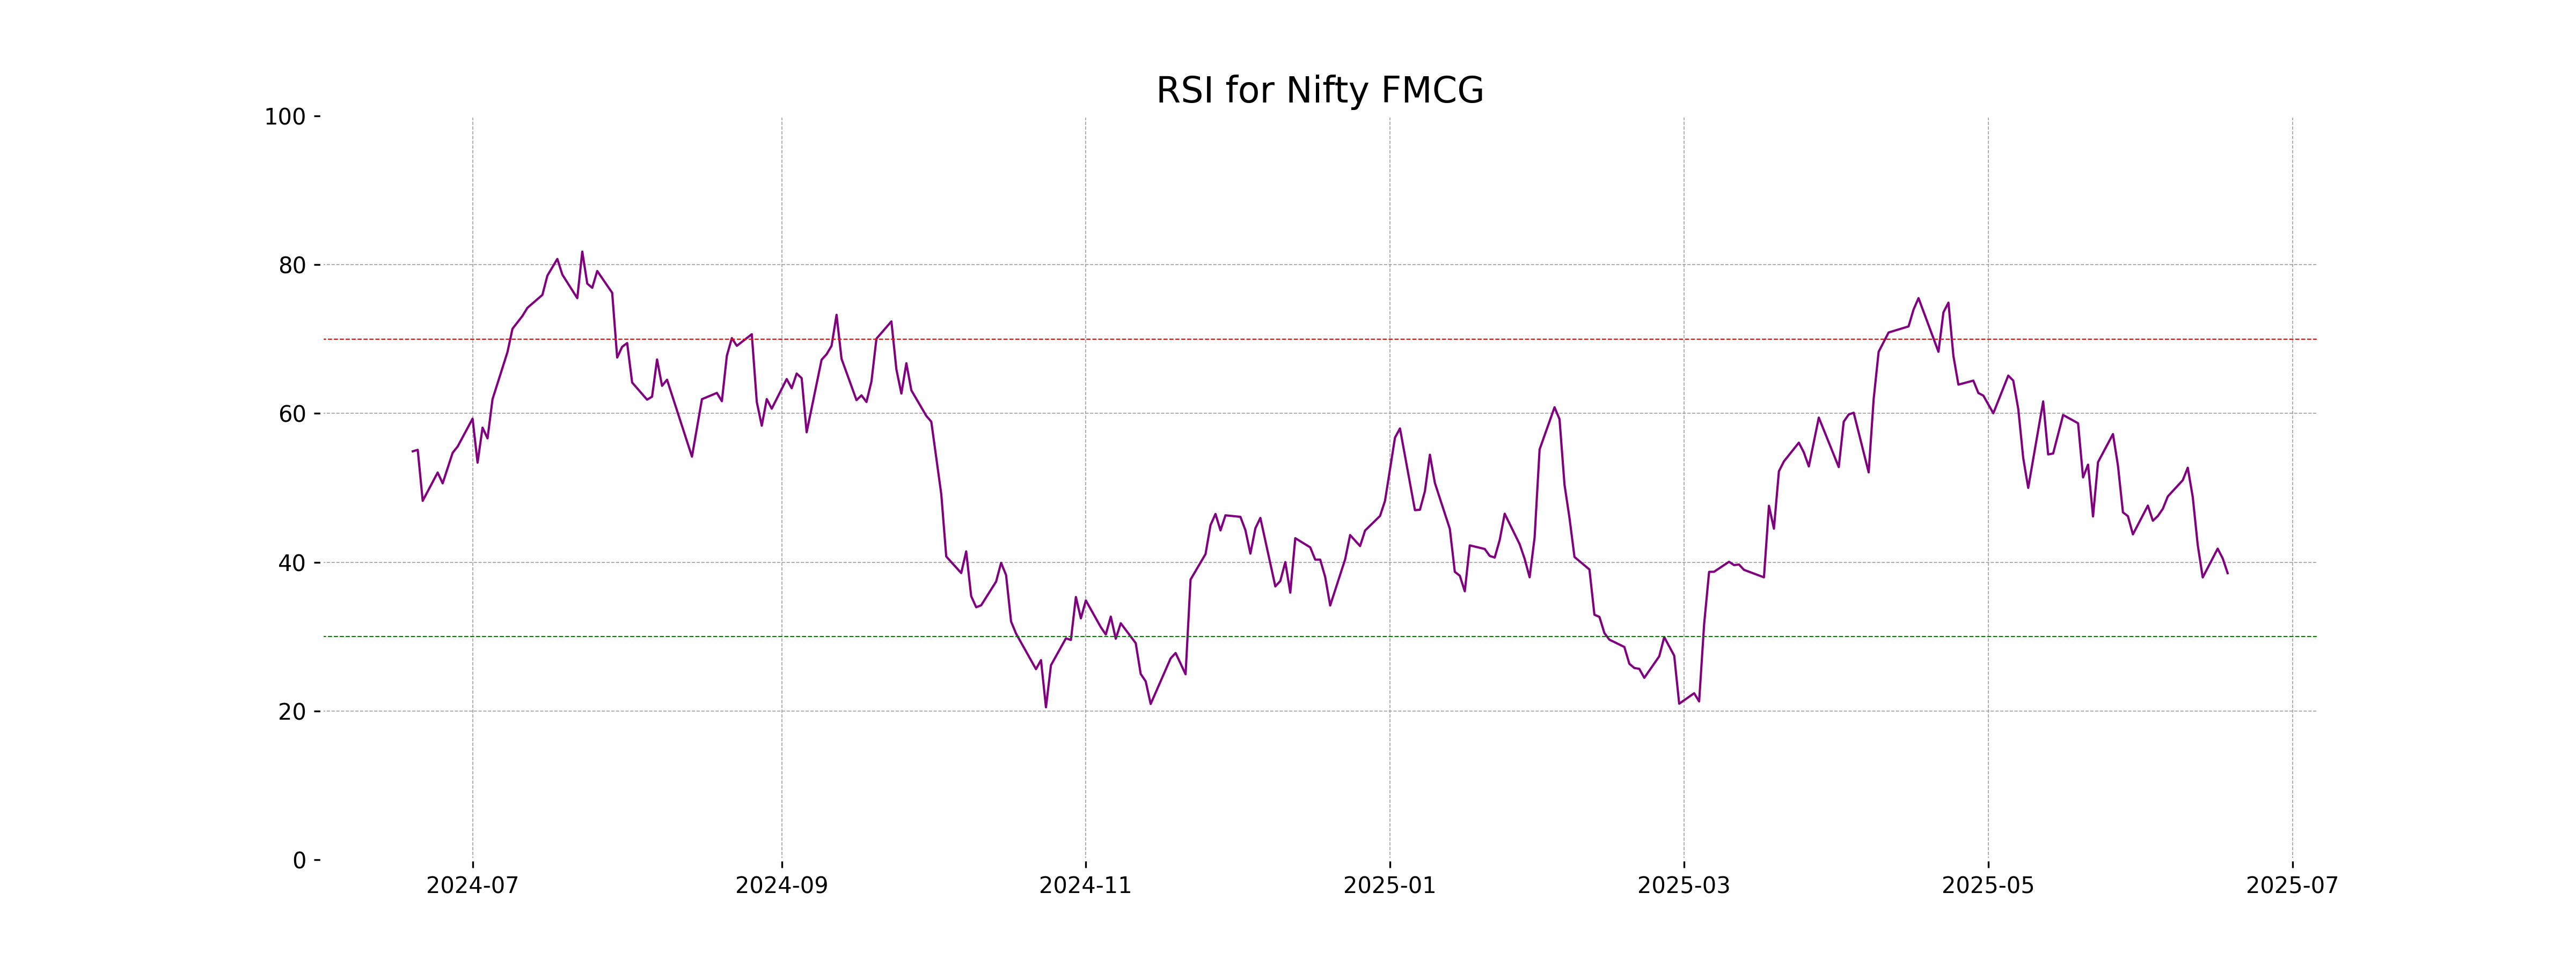
Analysis for Nifty FMCG - June 18, 2025
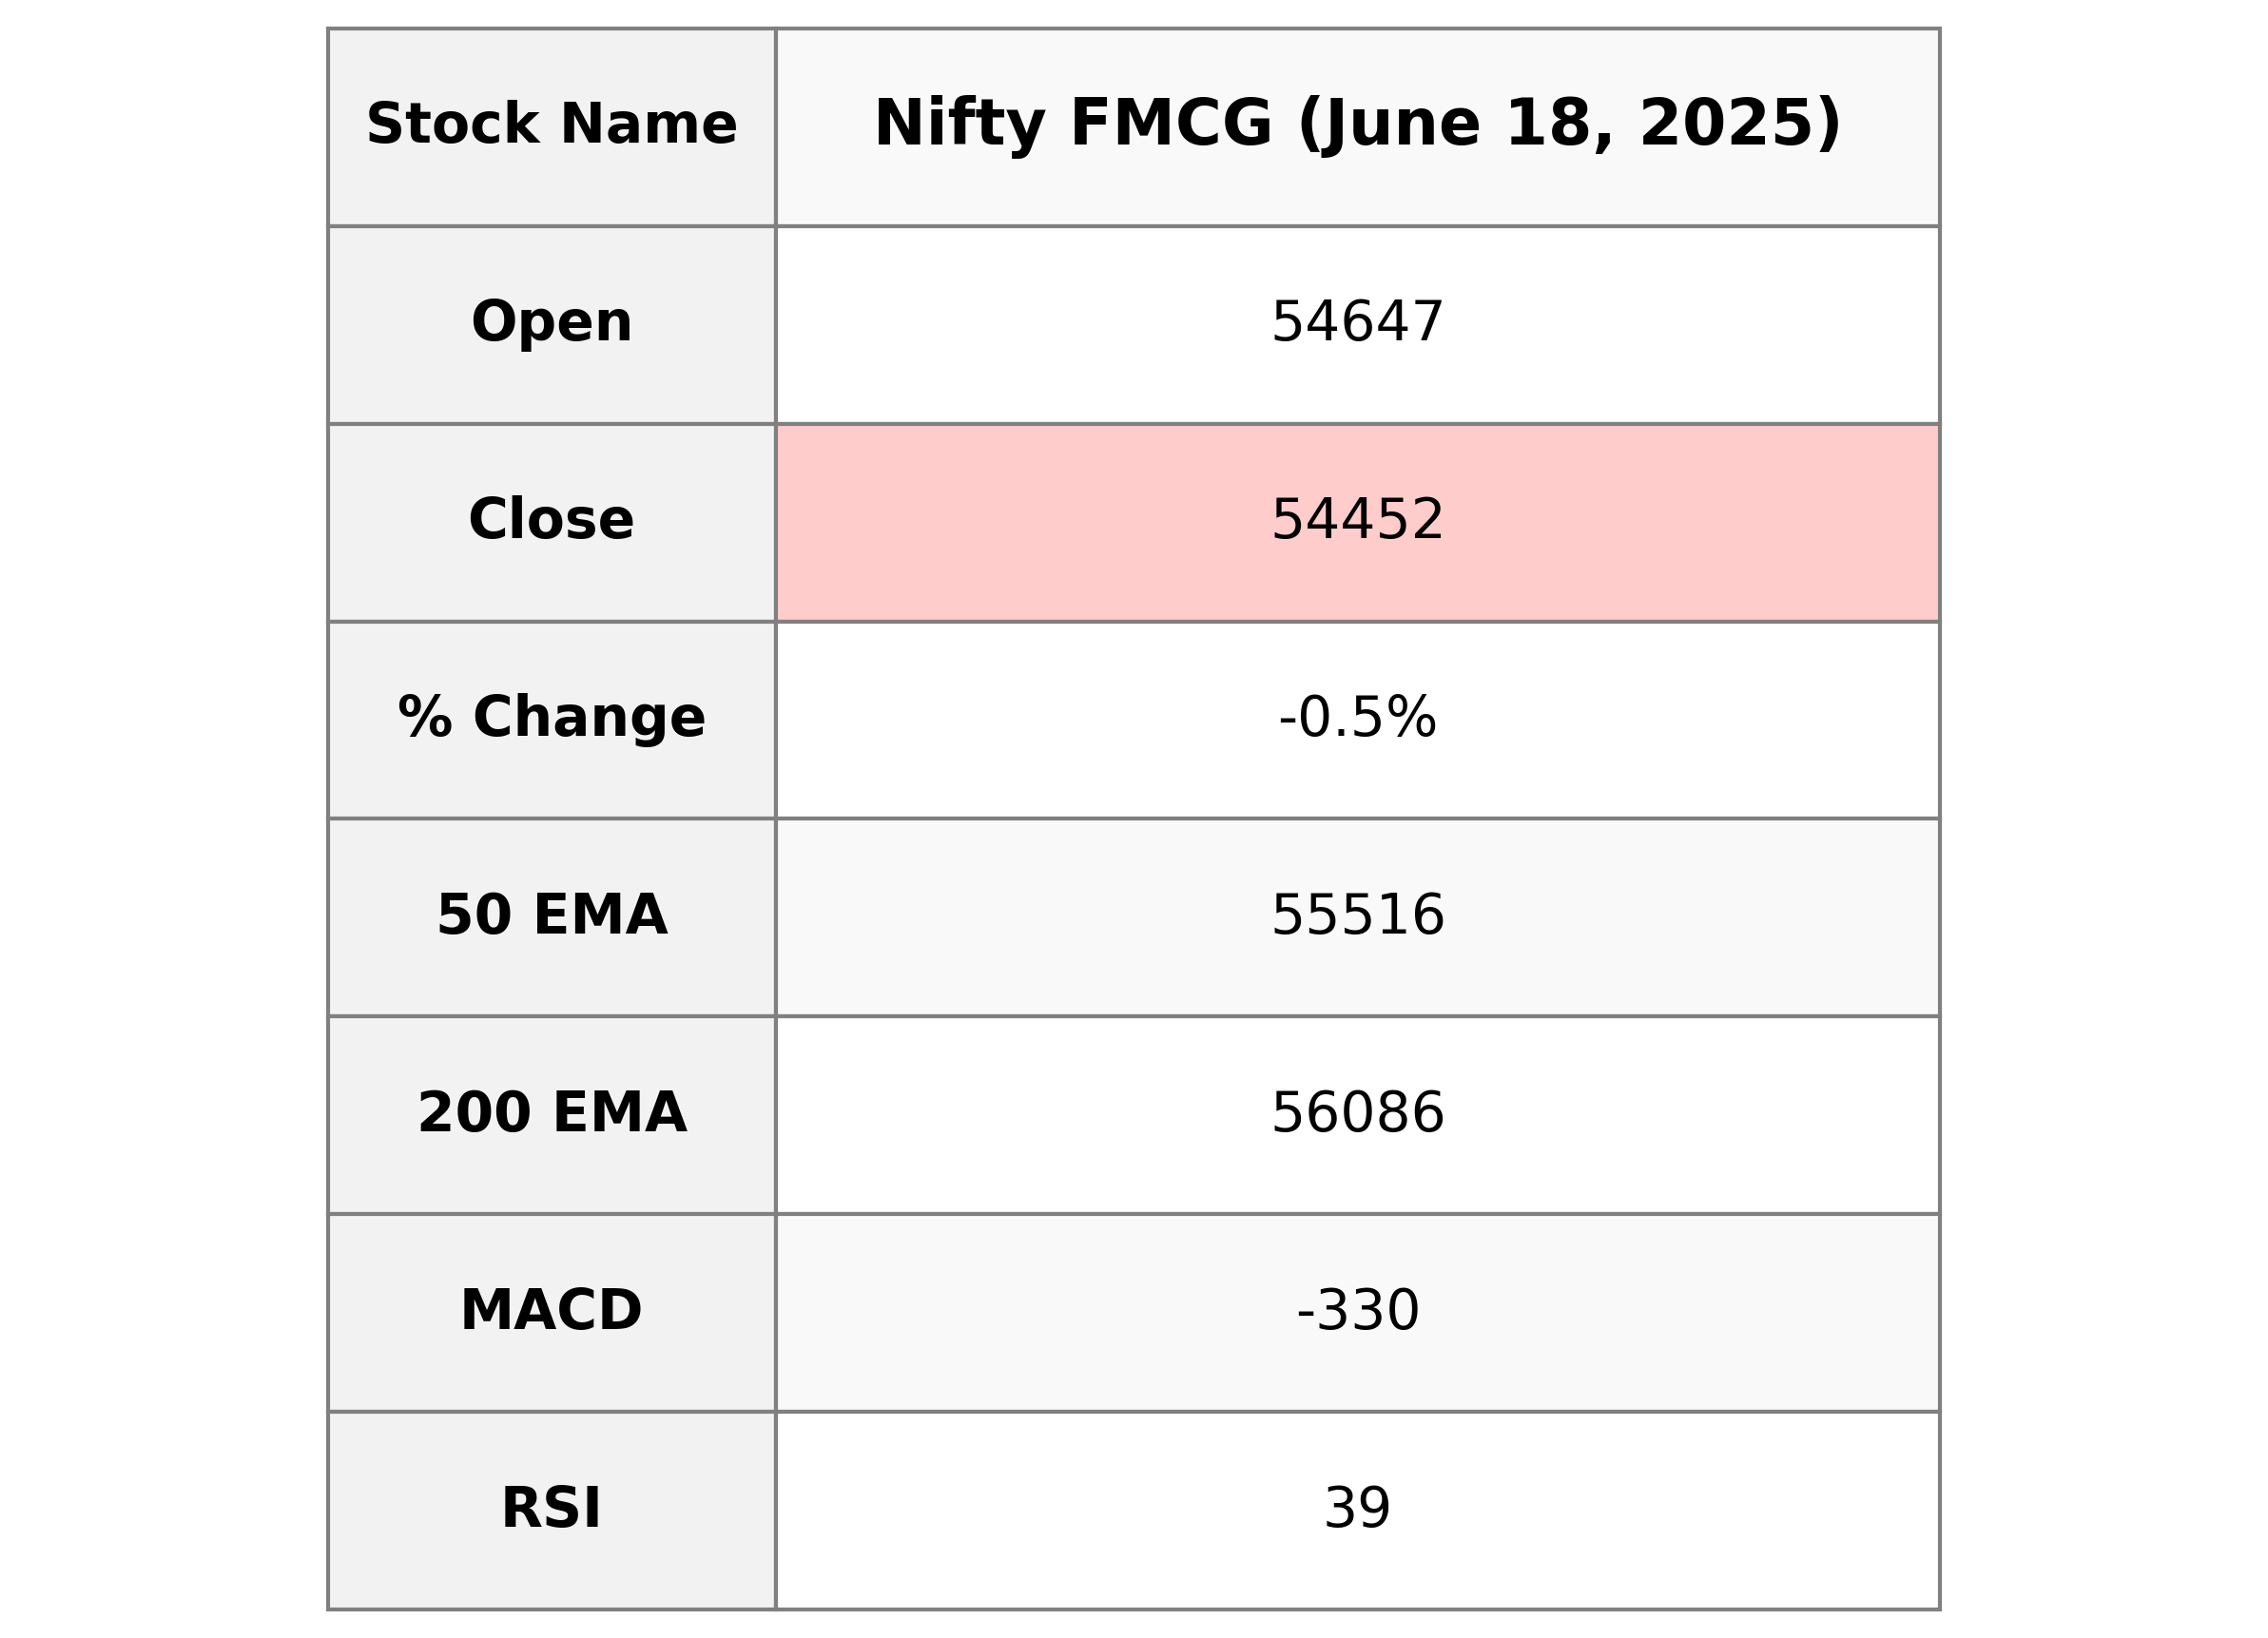
Nifty FMCG opened at 54,647.15 and closed at 54,452.40, experiencing a percentage change of -0.47% with a points change of -256.35. The 50-day and 200-day EMAs are 55,515.65 and 56,086.41 respectively, indicating that the current price is below these averages. The RSI is at 38.53, suggesting the index might be approaching oversold conditions, while the MACD shows bearish momentum with a value of -329.51.
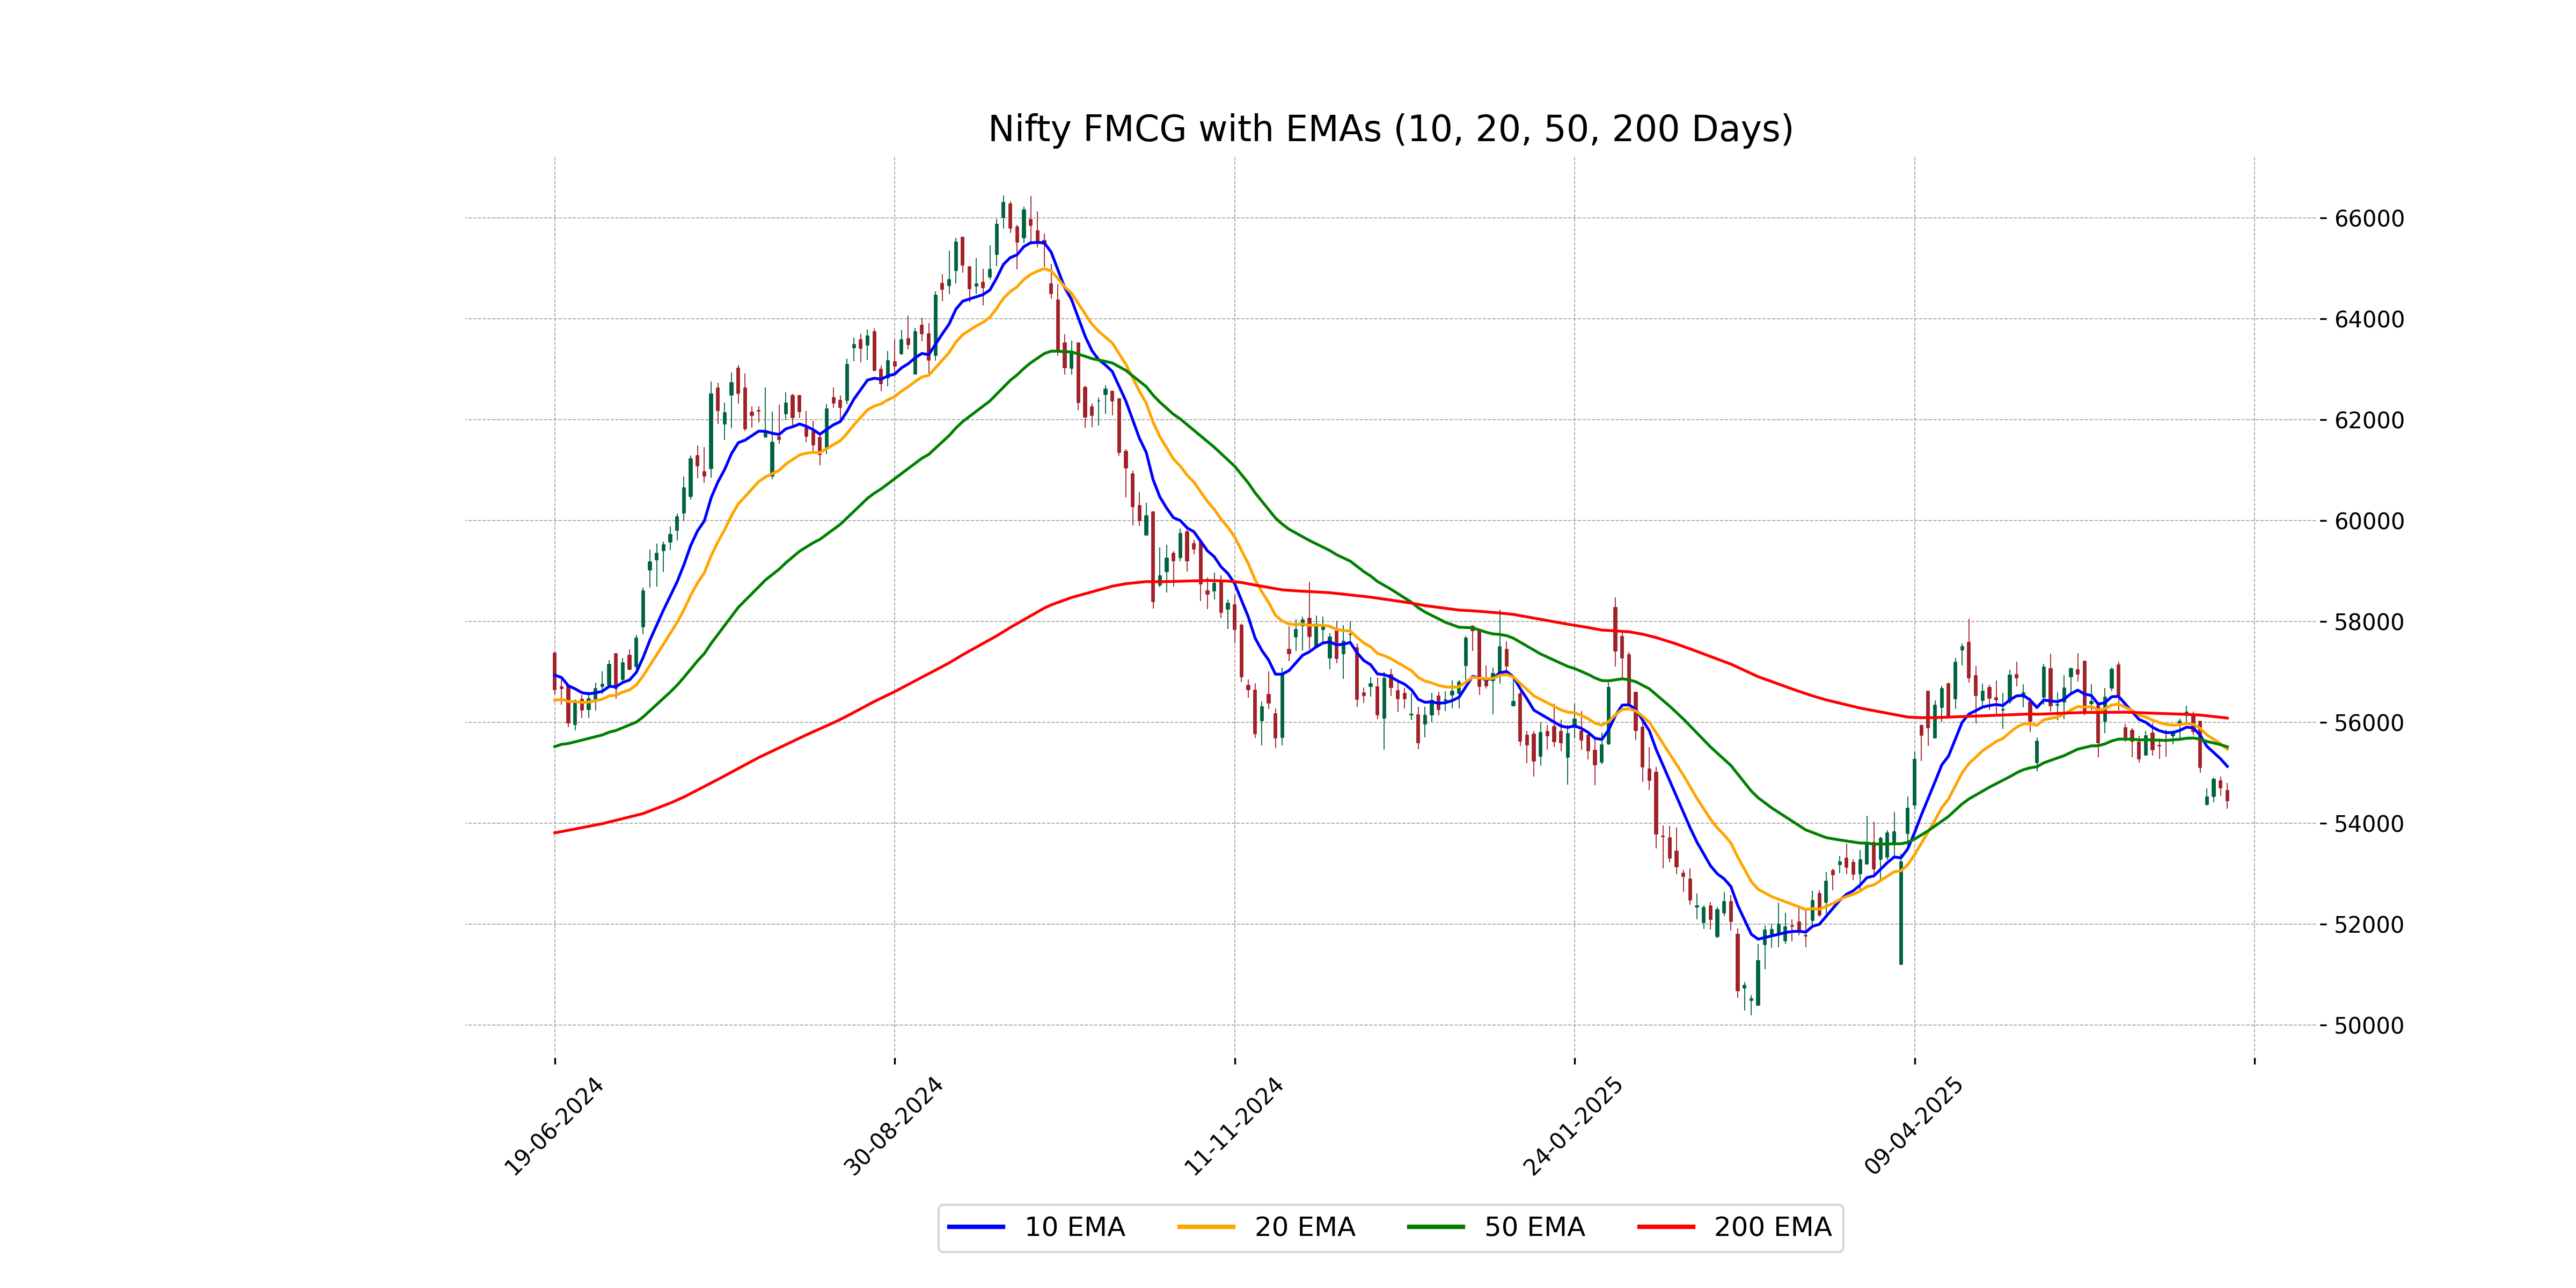
Relationship with Key Moving Averages
The Nifty FMCG closed below all its key moving averages, with the close at 54,452.40 beneath the 10 EMA (55,129.47), 20 EMA (55,469.69), and 50 EMA (55,515.65). This indicates a bearish trend as the price is trading below short, medium, and longer-term moving averages.
Moving Averages Trend (MACD)
The Nifty FMCG index is exhibiting a bearish signal as the MACD is negative at -329.51 and is below the MACD Signal line of -165.99. This indicates potential downward momentum in the index, as the MACD line is further below its signal line.
RSI Analysis
The RSI for Nifty FMCG is 38.53, which suggests that the index is approaching the oversold territory. An RSI below 30 typically indicates that an asset is oversold, and as it nears this level, it may signal a potential buying opportunity or a possible reversal in the trend.
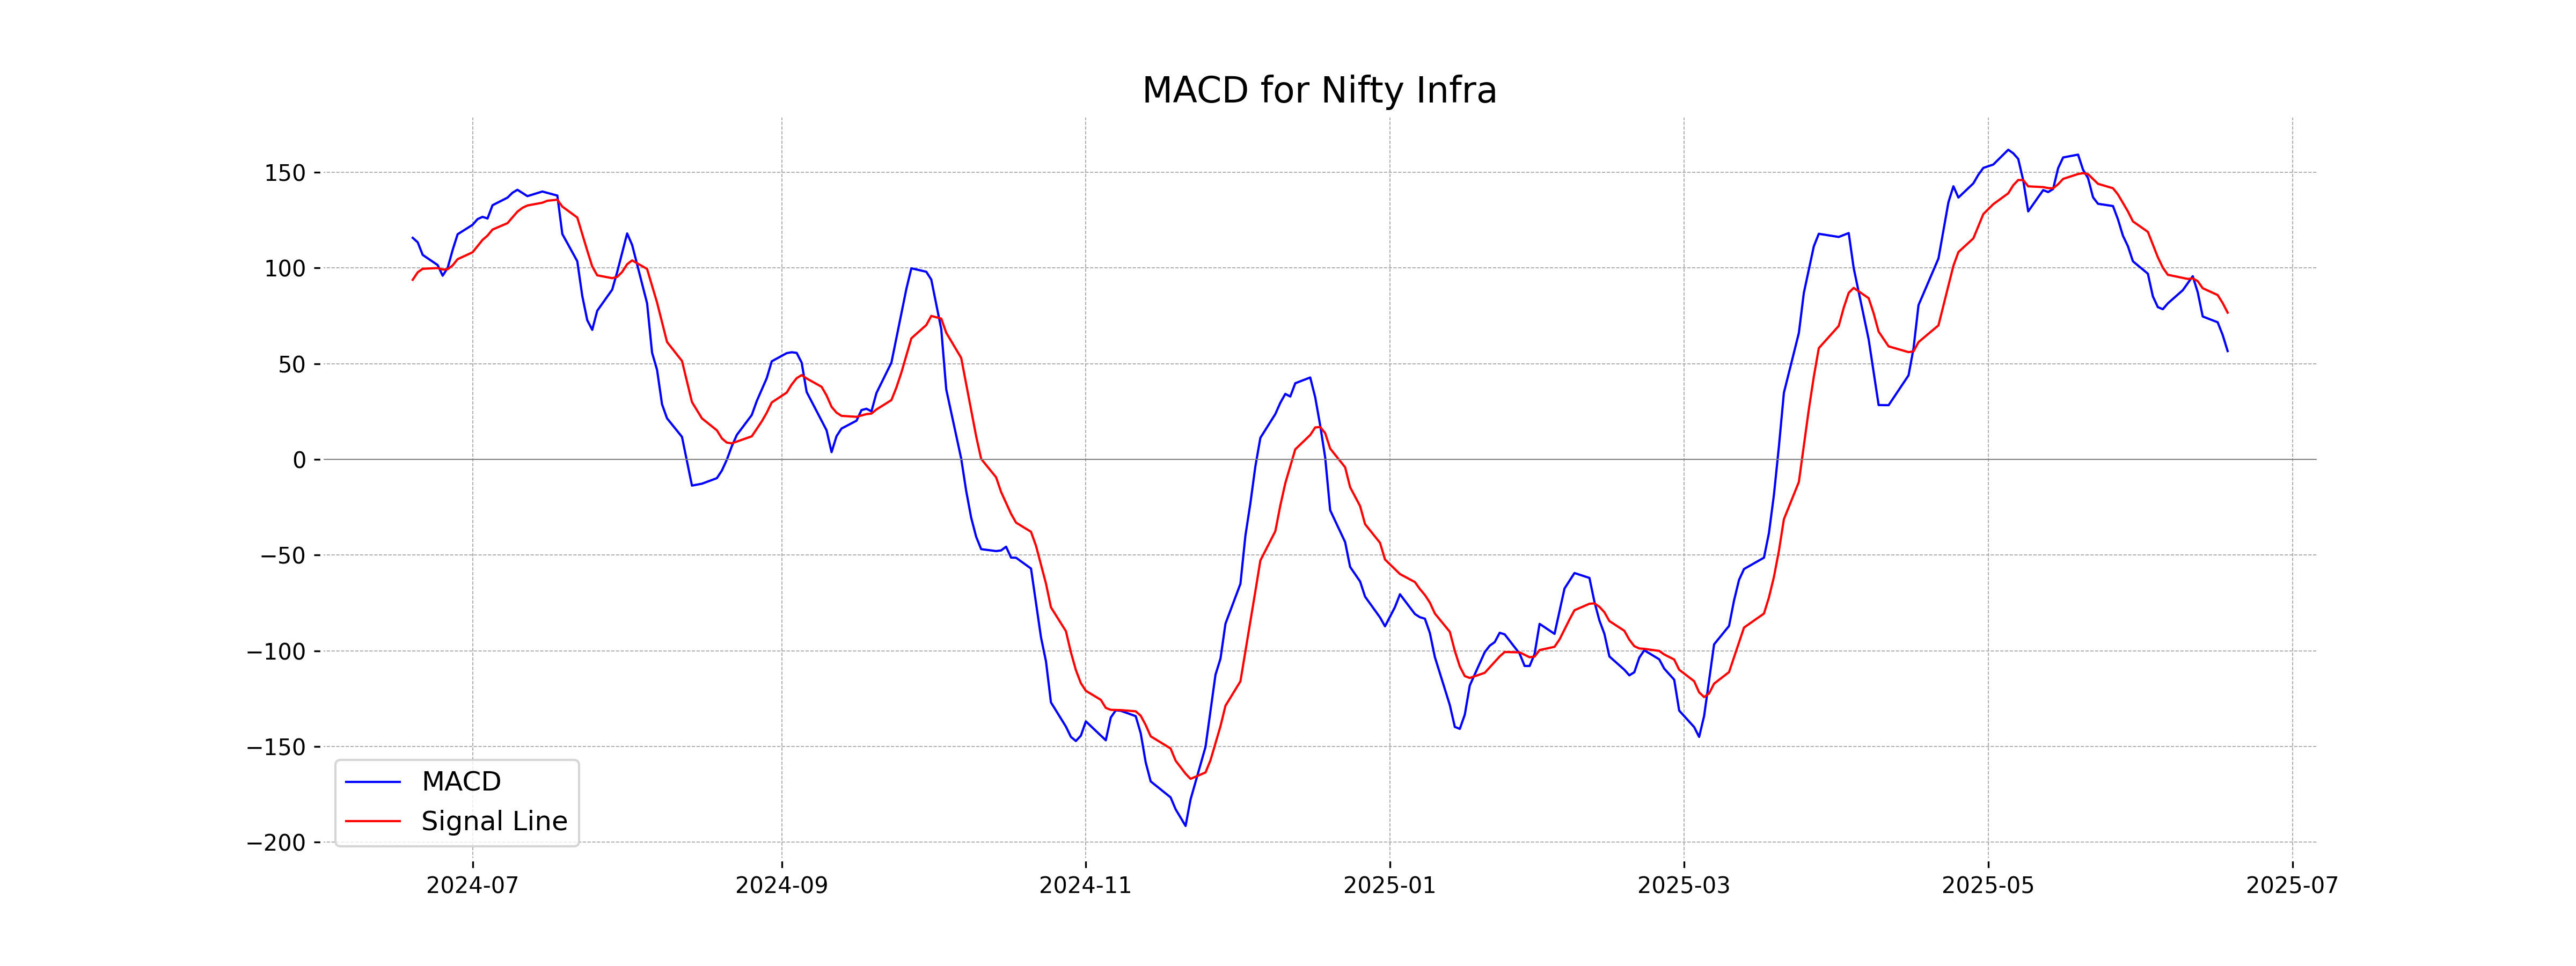
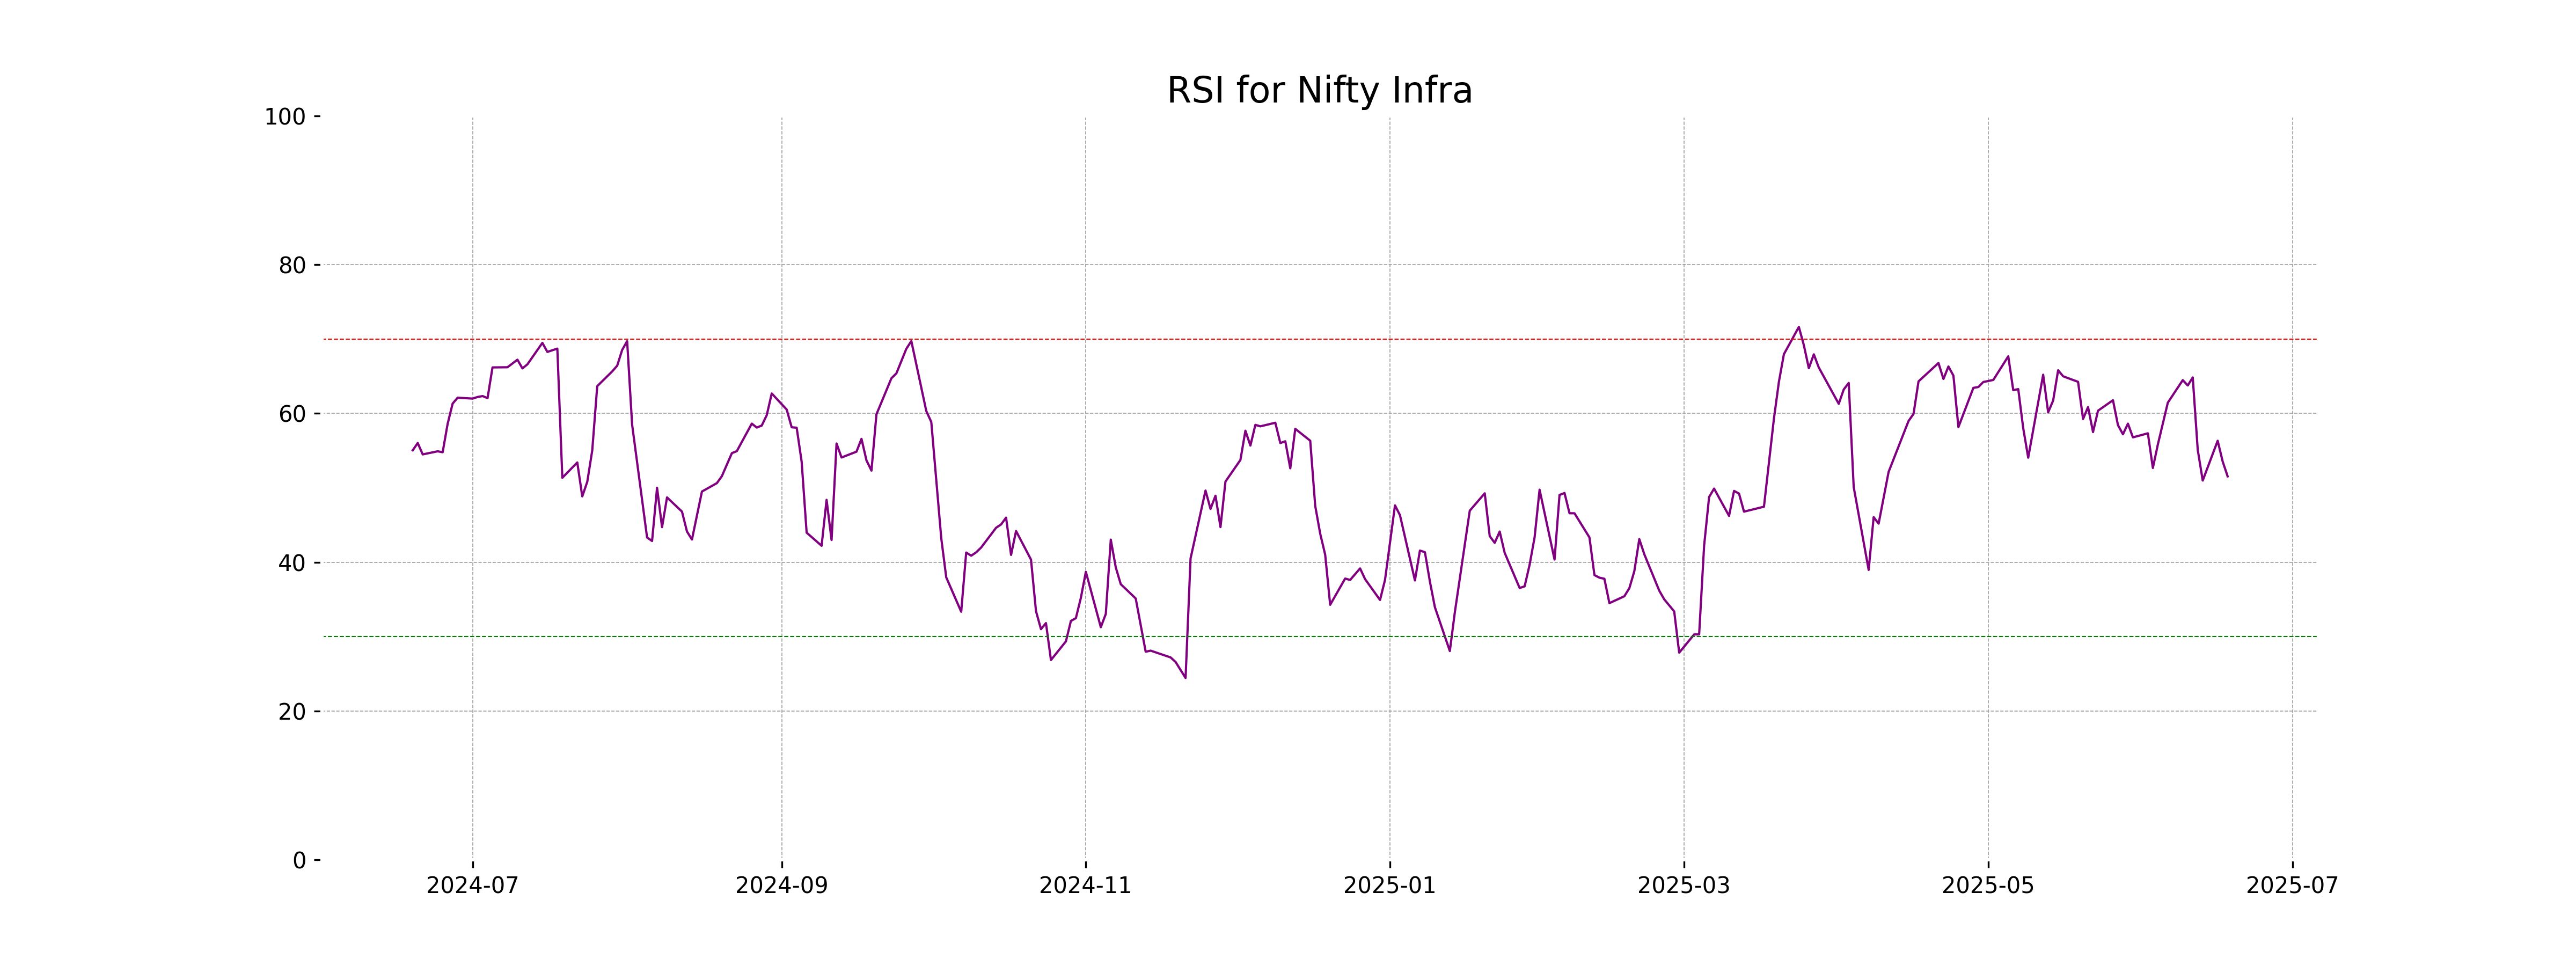
Analysis for Nifty Infra - June 18, 2025
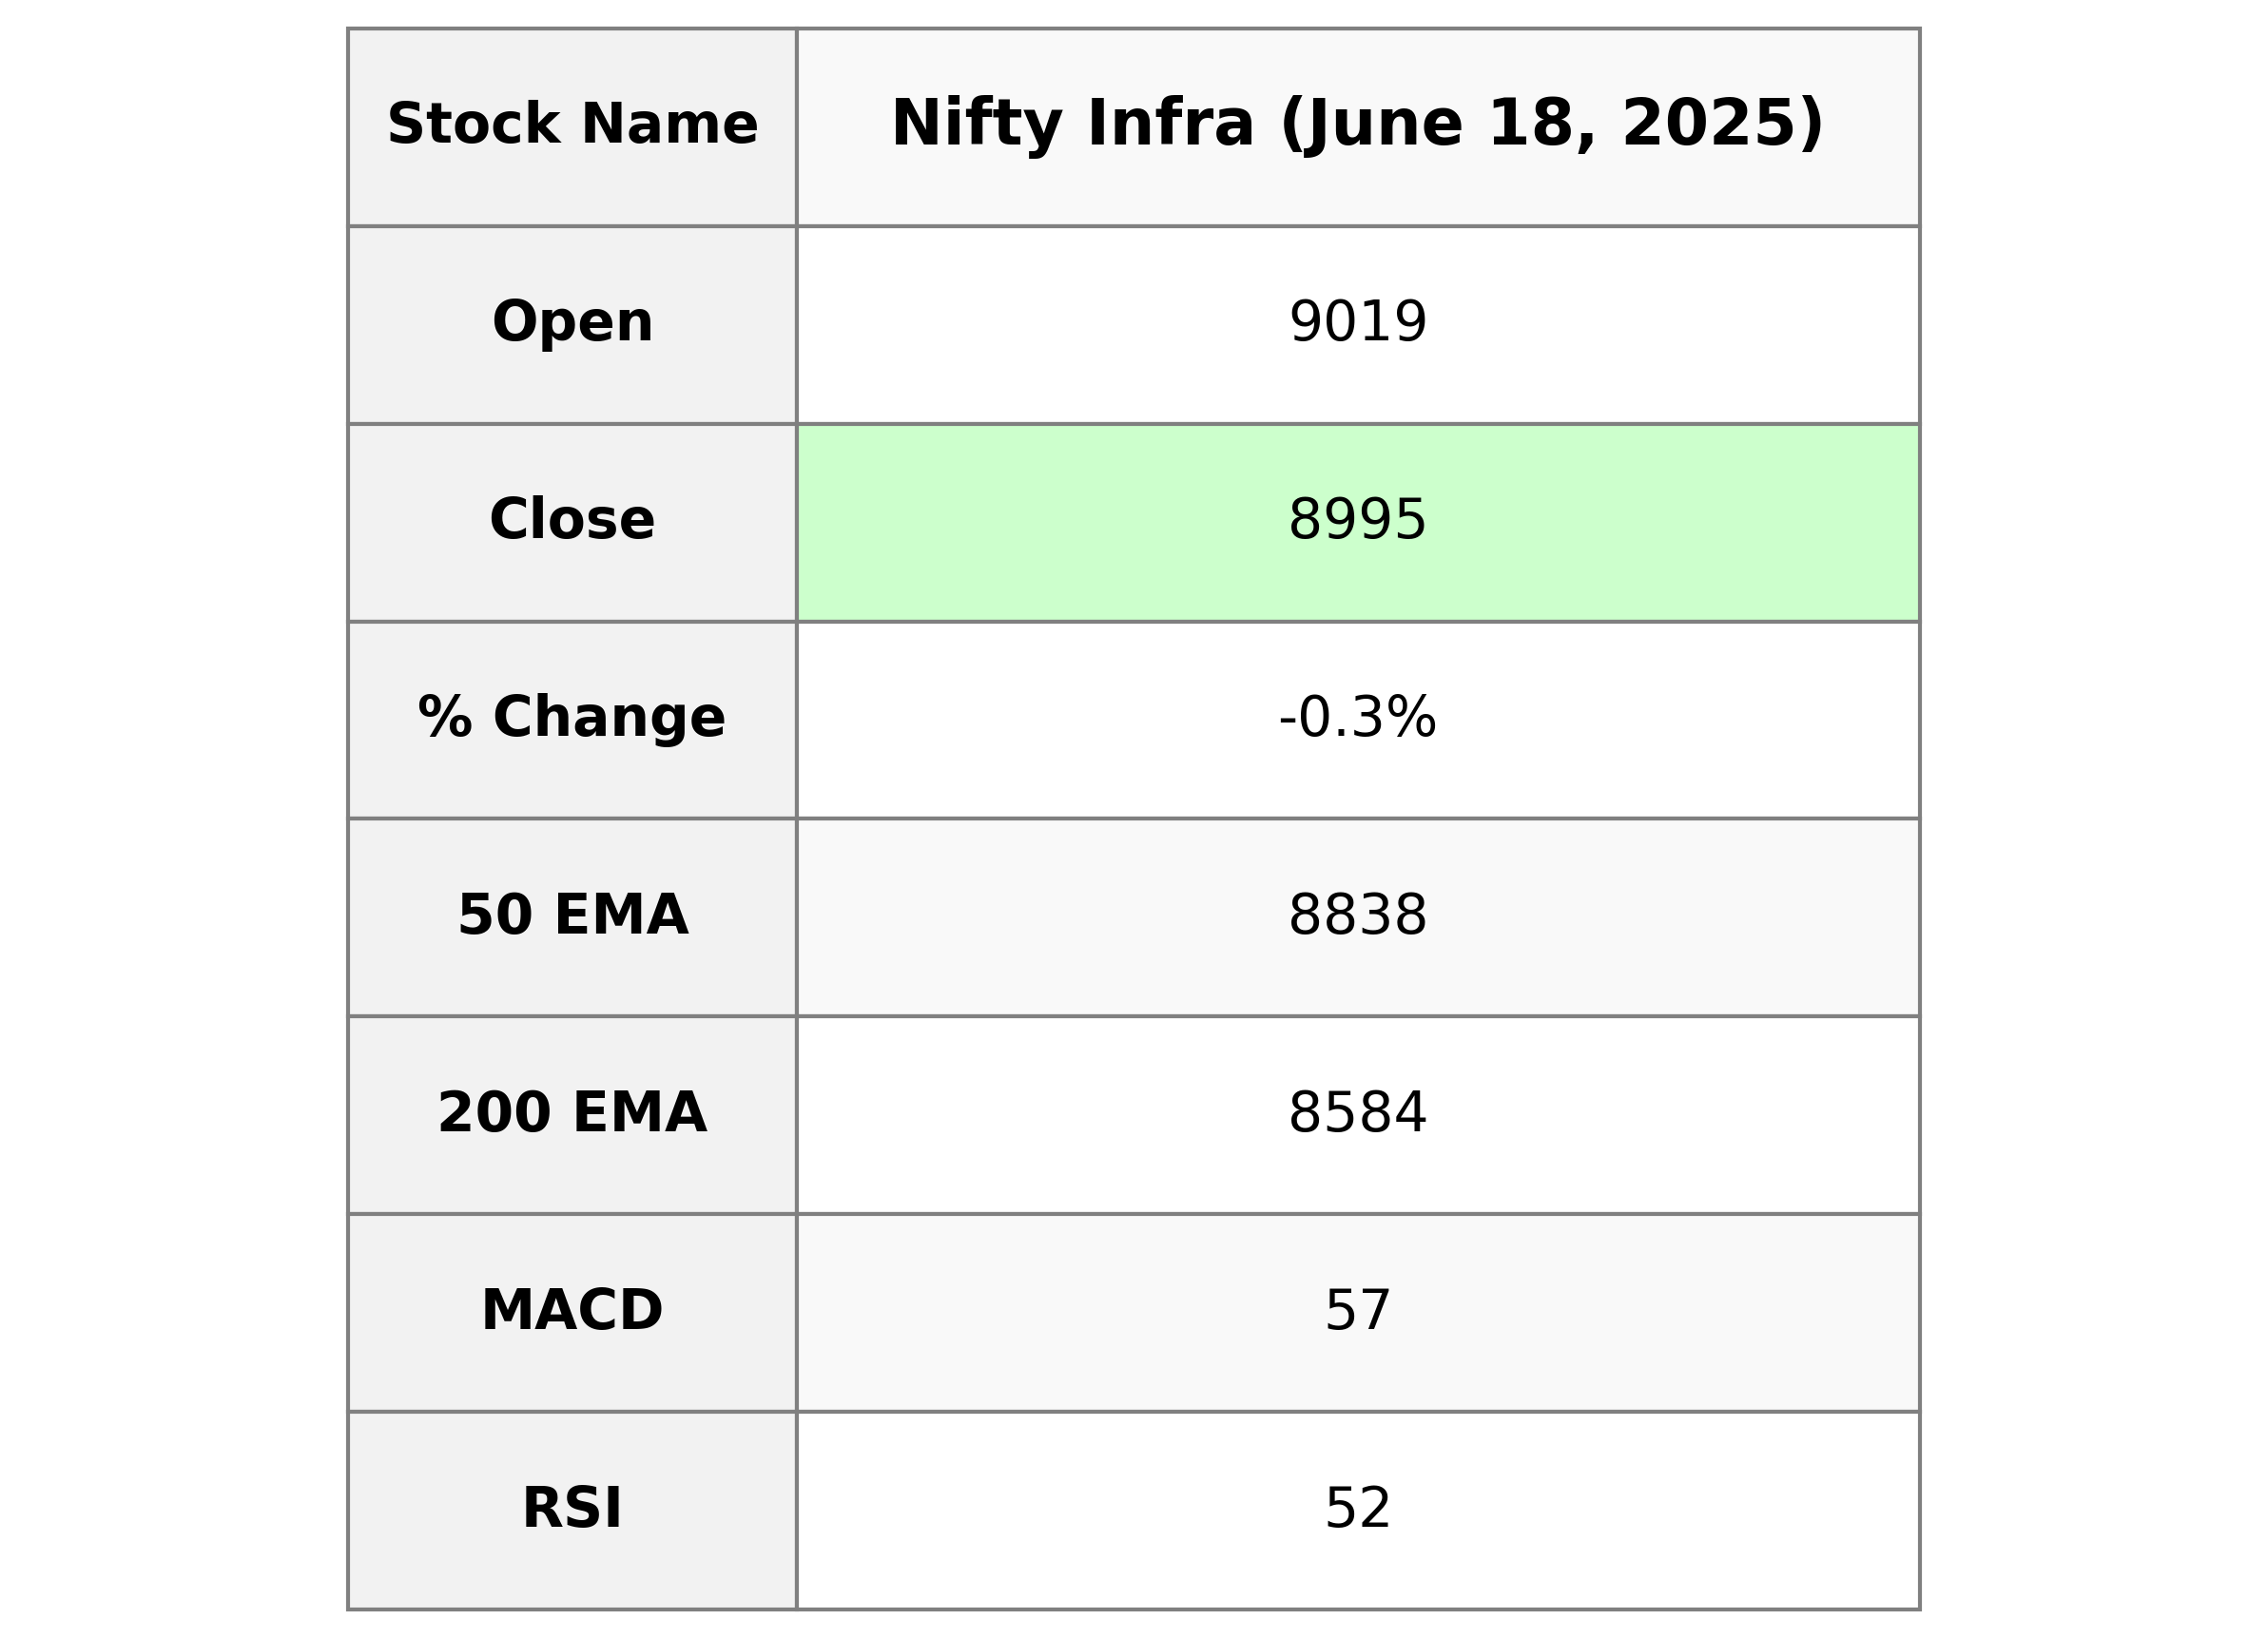
Nifty Infra opened at 9018.55, reached a high of 9059.0, a low of 8974.05, and closed at 8994.60, indicating a points change of -31.35 and a percentage change of -0.35% from the previous close of 9025.95. The relative strength index (RSI) is at 51.54, suggesting a neutral momentum, while the MACD is below the signal line, indicating a potential bearish trend. The 50-day EMA stands at 8838.06, above the 200-day EMA, which is at 8583.60, indicating a long-term uptrend.
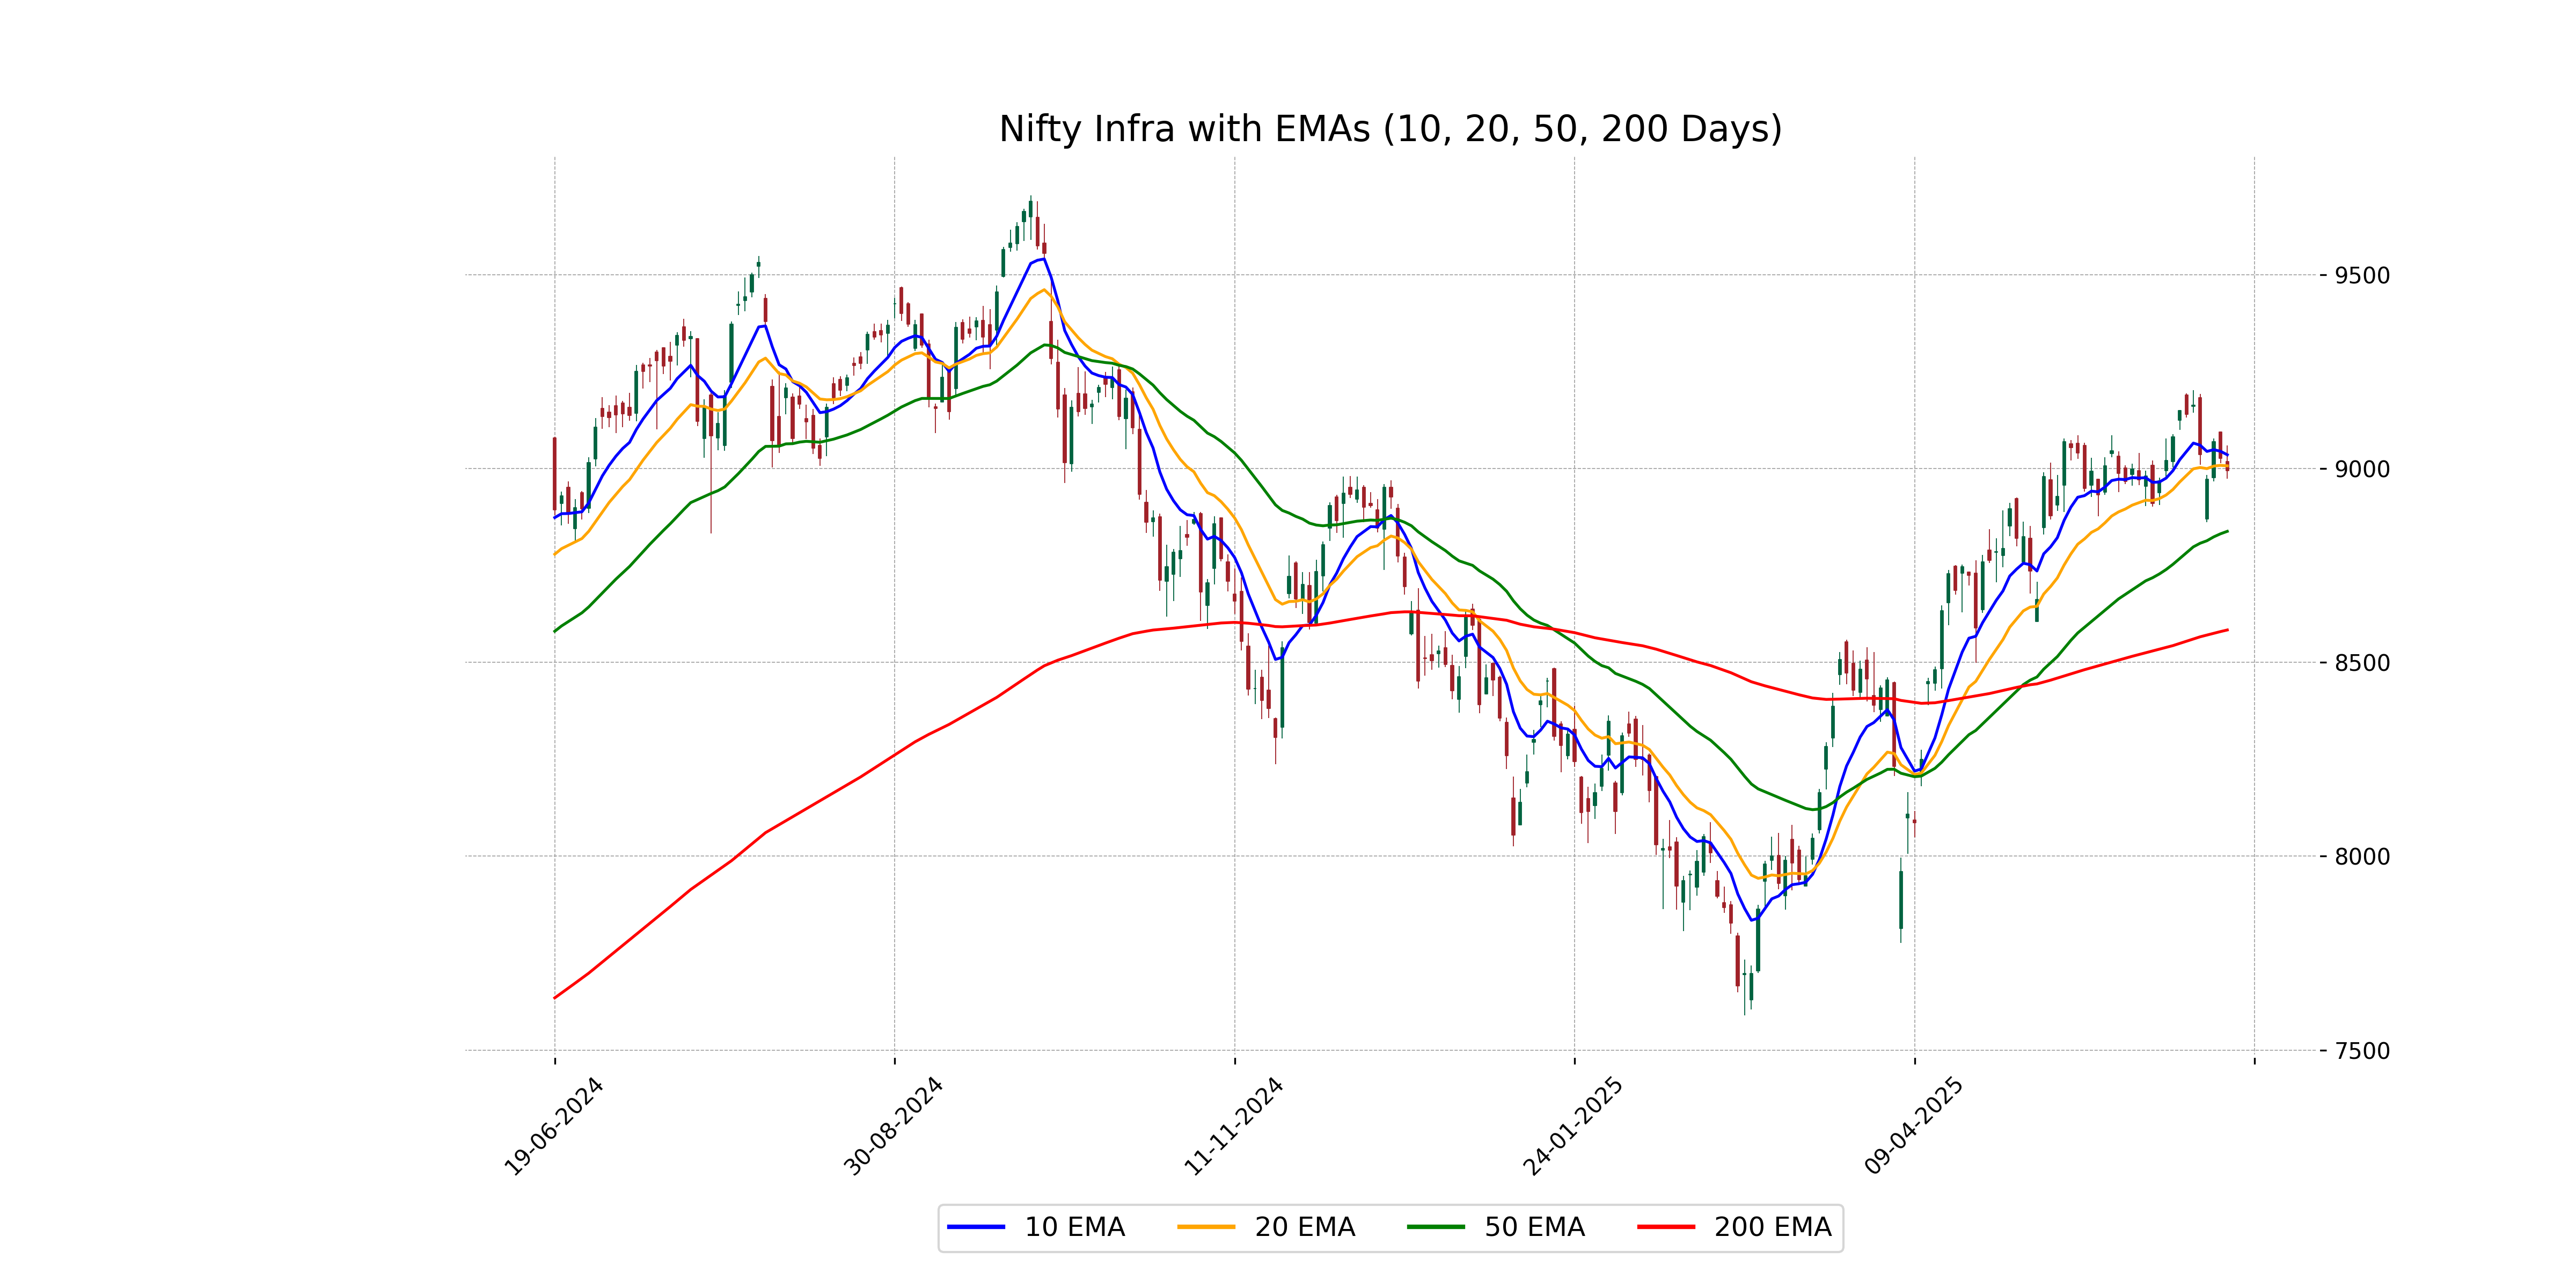
Relationship with Key Moving Averages
Nifty Infra closed at 8994.60, which is below its 10 EMA of 9035.47 and 20 EMA of 9006.94, but above its 50 EMA of 8838.06 and 200 EMA of 8583.60. This suggests a slight short-term bearish trend while maintaining a longer-term positive outlook.
Moving Averages Trend (MACD)
MACD Analysis for Nifty Infra: The MACD value for Nifty Infra is 56.56, which is below its signal line at 76.65. This suggests a bearish trend as the MACD line is crossing under the signal line. The RSI close to 51.54 indicates a neutral momentum without any overbought or oversold conditions.
RSI Analysis
The RSI for Nifty Infra is 51.54, indicating that the stock is in a neutral zone and not showing signs of being overbought or oversold. Generally, an RSI above 70 suggests overbought conditions, and below 30 indicates oversold conditions, so current levels suggest stability.
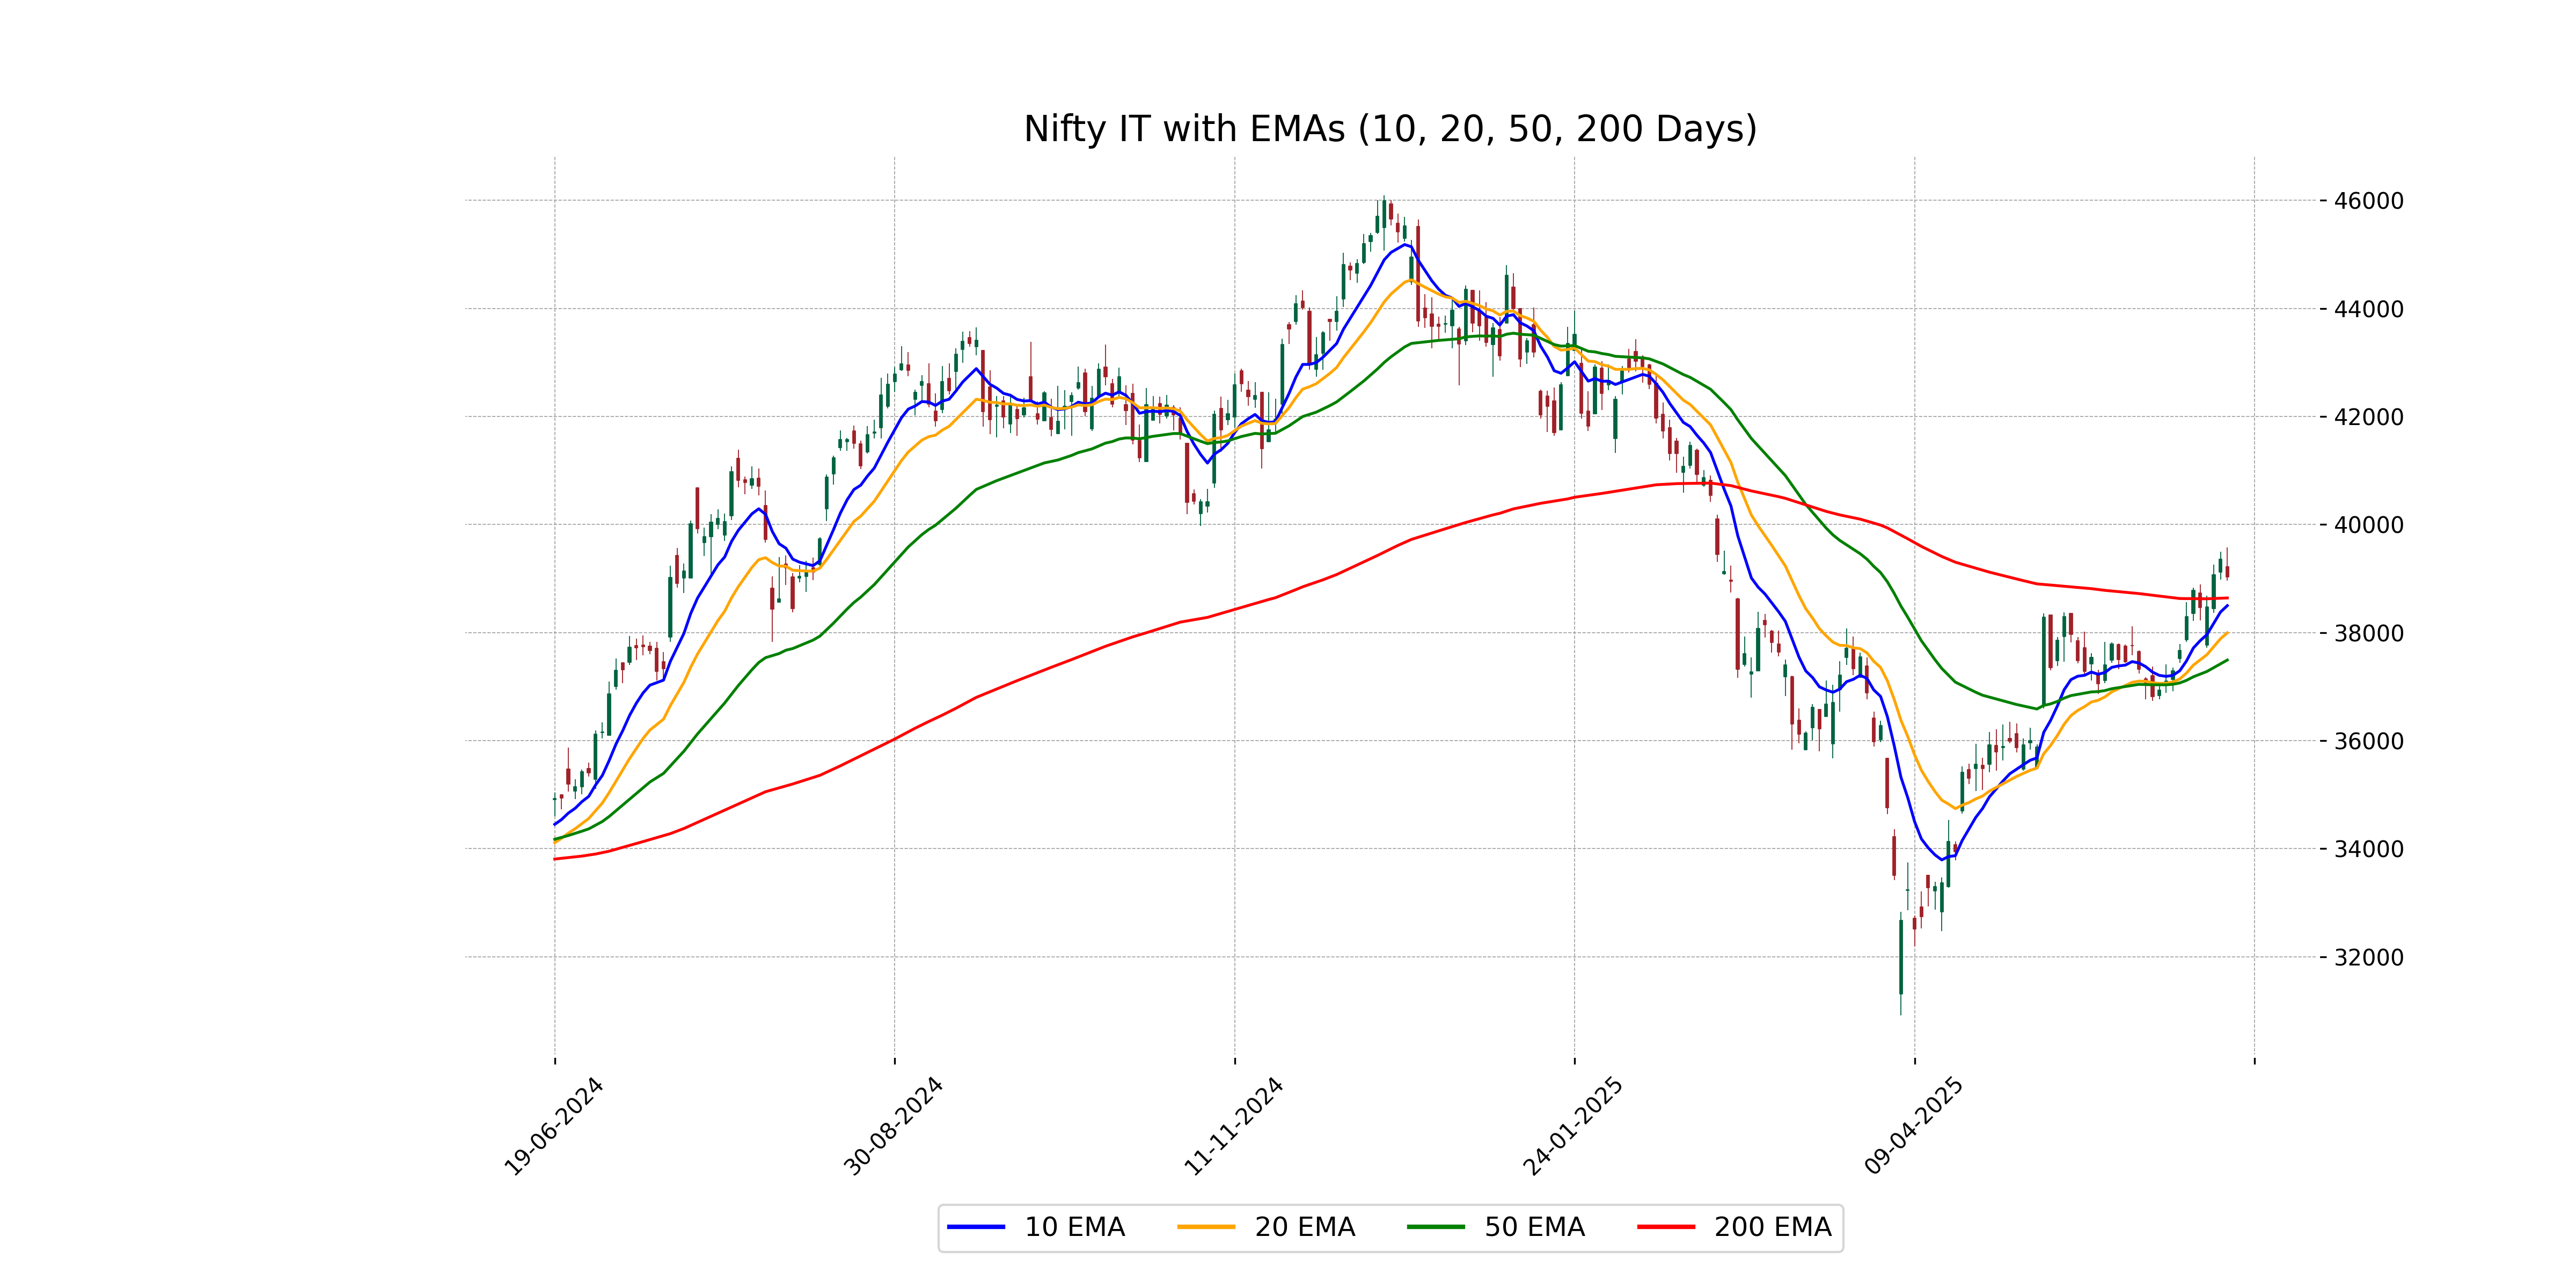
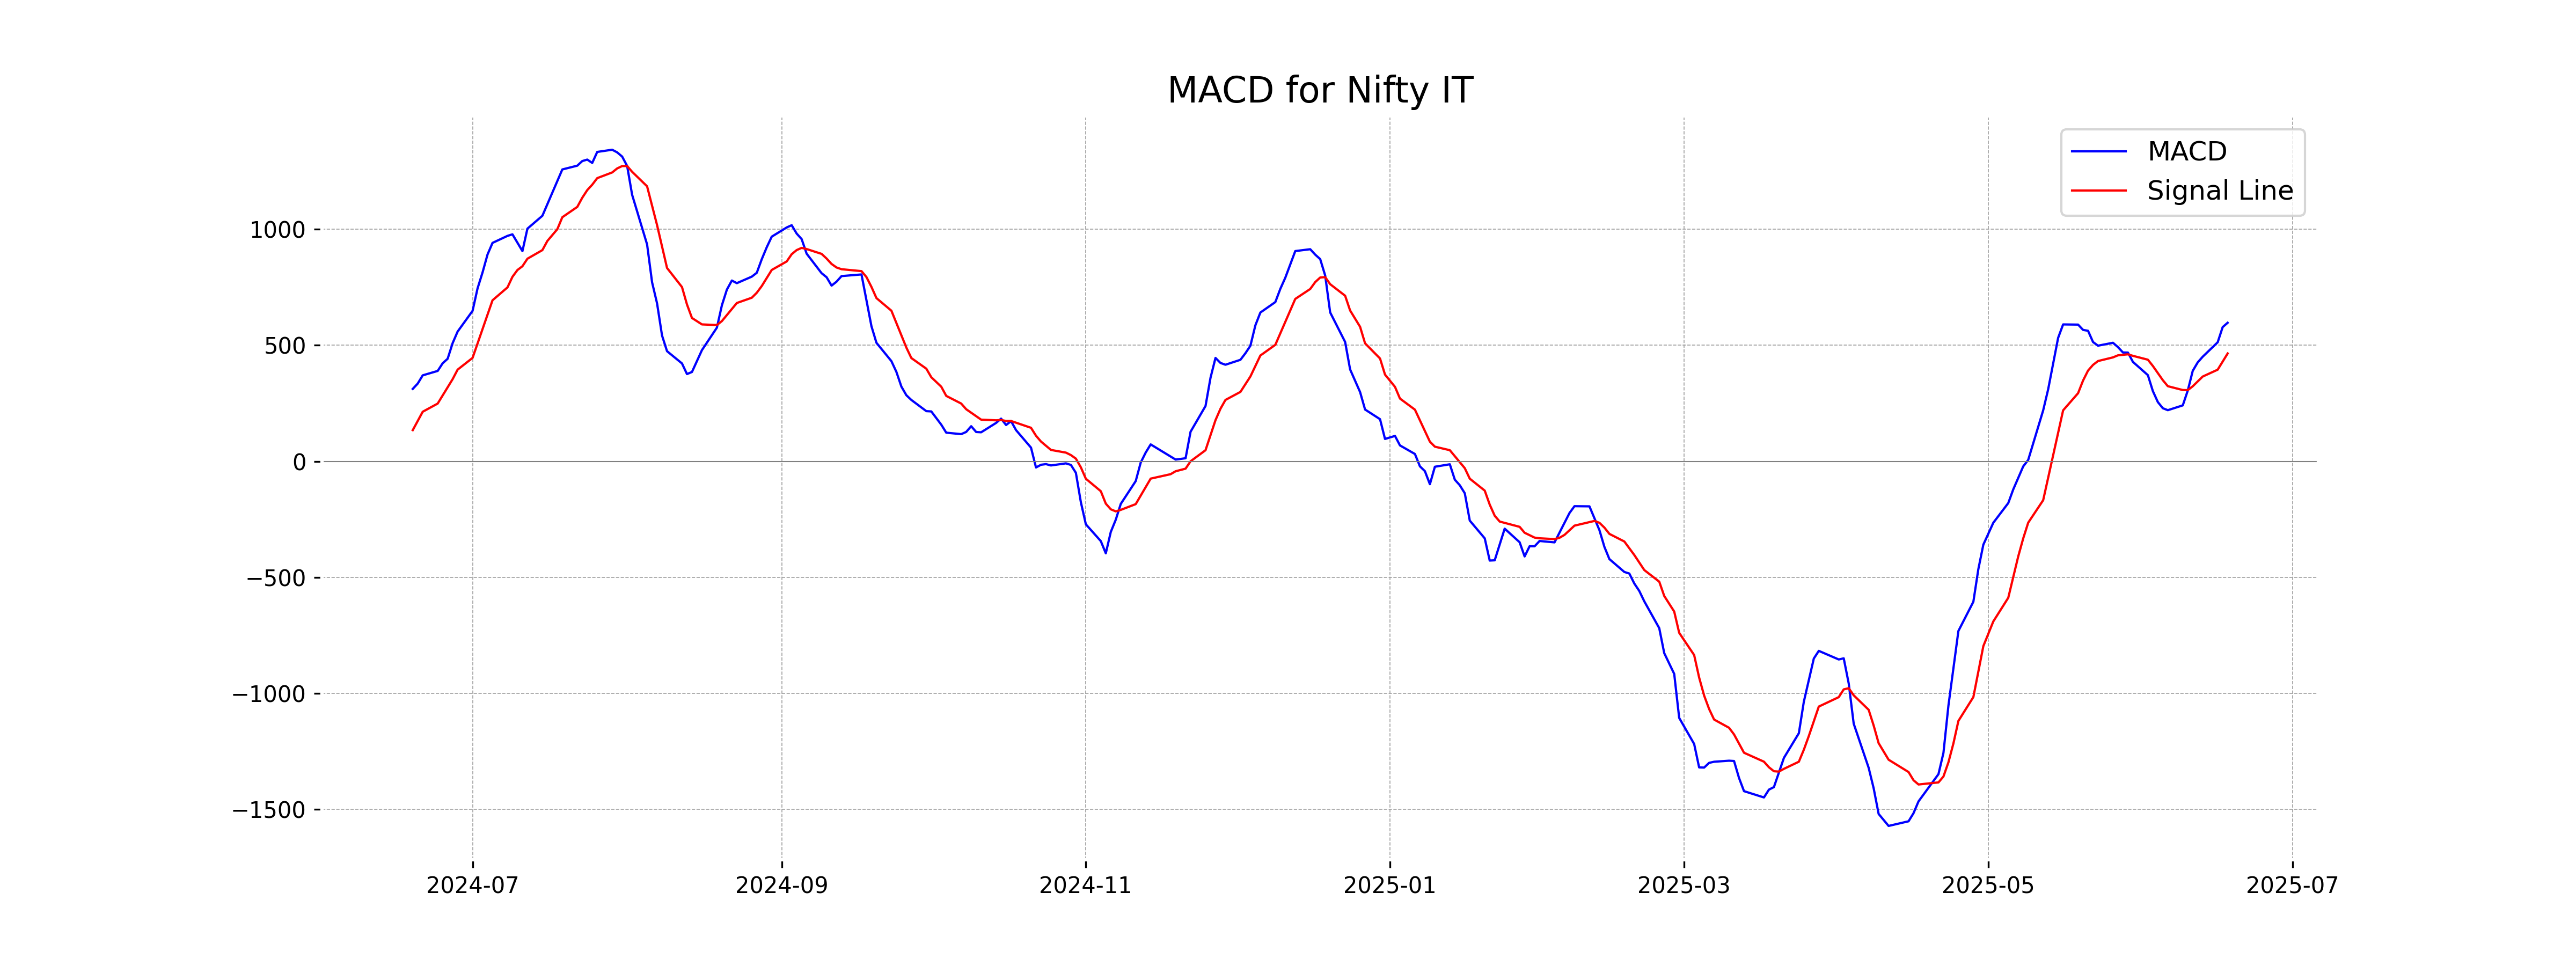
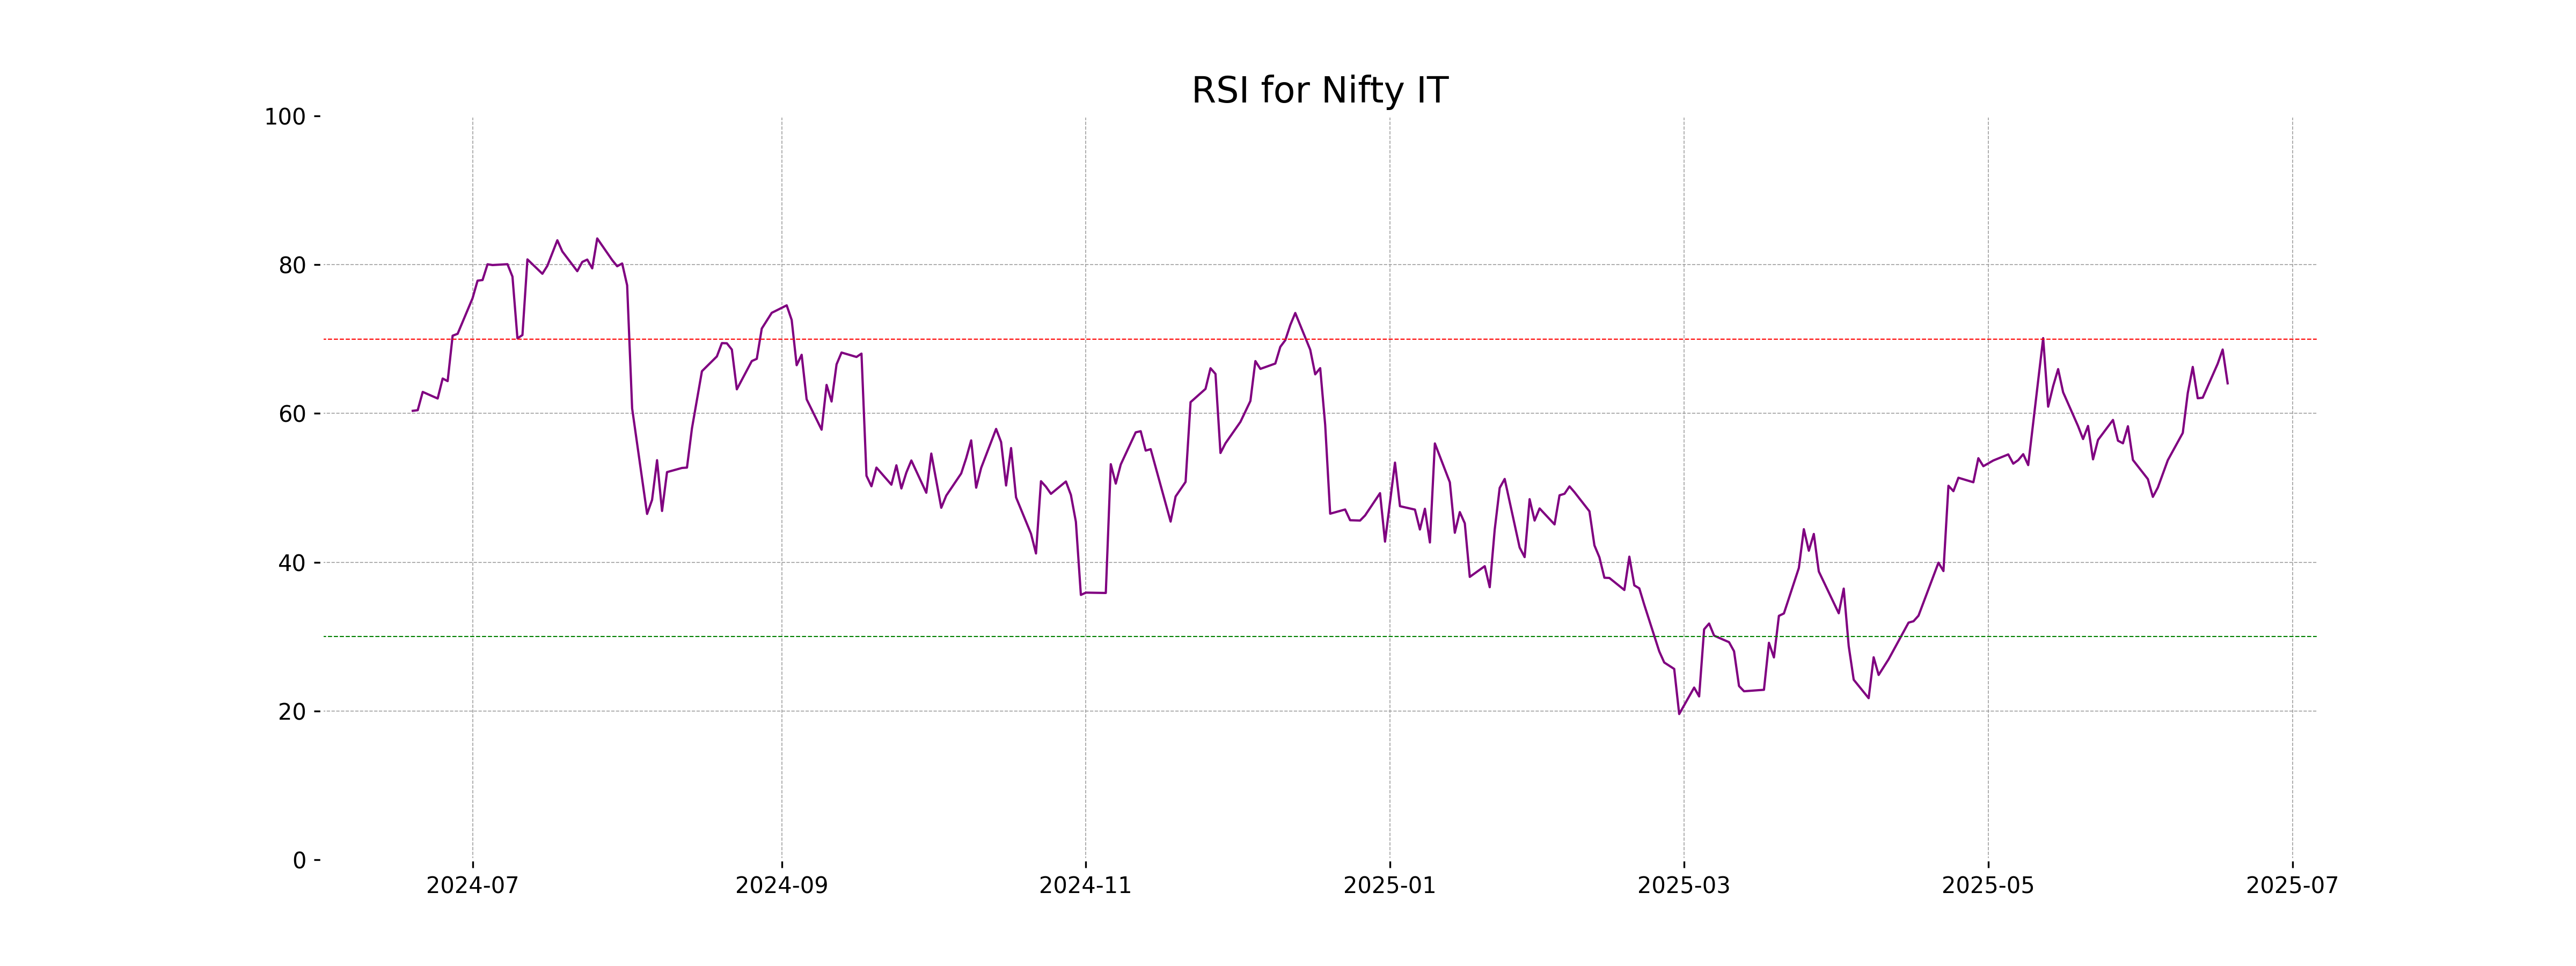
Analysis for Nifty IT - June 18, 2025

The Nifty IT opened at 39,220.35, reaching a high of 39,572.50 and a low of 38,963.80, before closing at 39,030.90. It experienced a percentage change of -0.83% and a points change of -325.20. The current RSI of 64.05 suggests a moderately strong trend, with the MACD indicating positive momentum above its signal line, but the stock closed lower than its previous close of 39,356.10.
Relationship with Key Moving Averages
The Nifty IT index closed at 39030.9, which is above its 50-day EMA of 37492.04 and 200-day EMA of 38641.13, but below the 10-day EMA of 38499.05 and 20-day EMA of 37995.80. This indicates a mixed momentum with respect to these key moving averages.
Moving Averages Trend (MACD)
The MACD for Nifty IT is 597.05, with a MACD signal of 464.63, indicating a positive crossover. This suggests bullish momentum as the MACD line is above the signal line. However, traders should monitor for potential changes in trend.
RSI Analysis
The RSI for Nifty IT is 64.05, indicating that the stock is approaching overbought territory but is still within a neutral range. Investors should monitor the RSI for potential reversal signals if it moves above 70, suggesting overbought conditions.
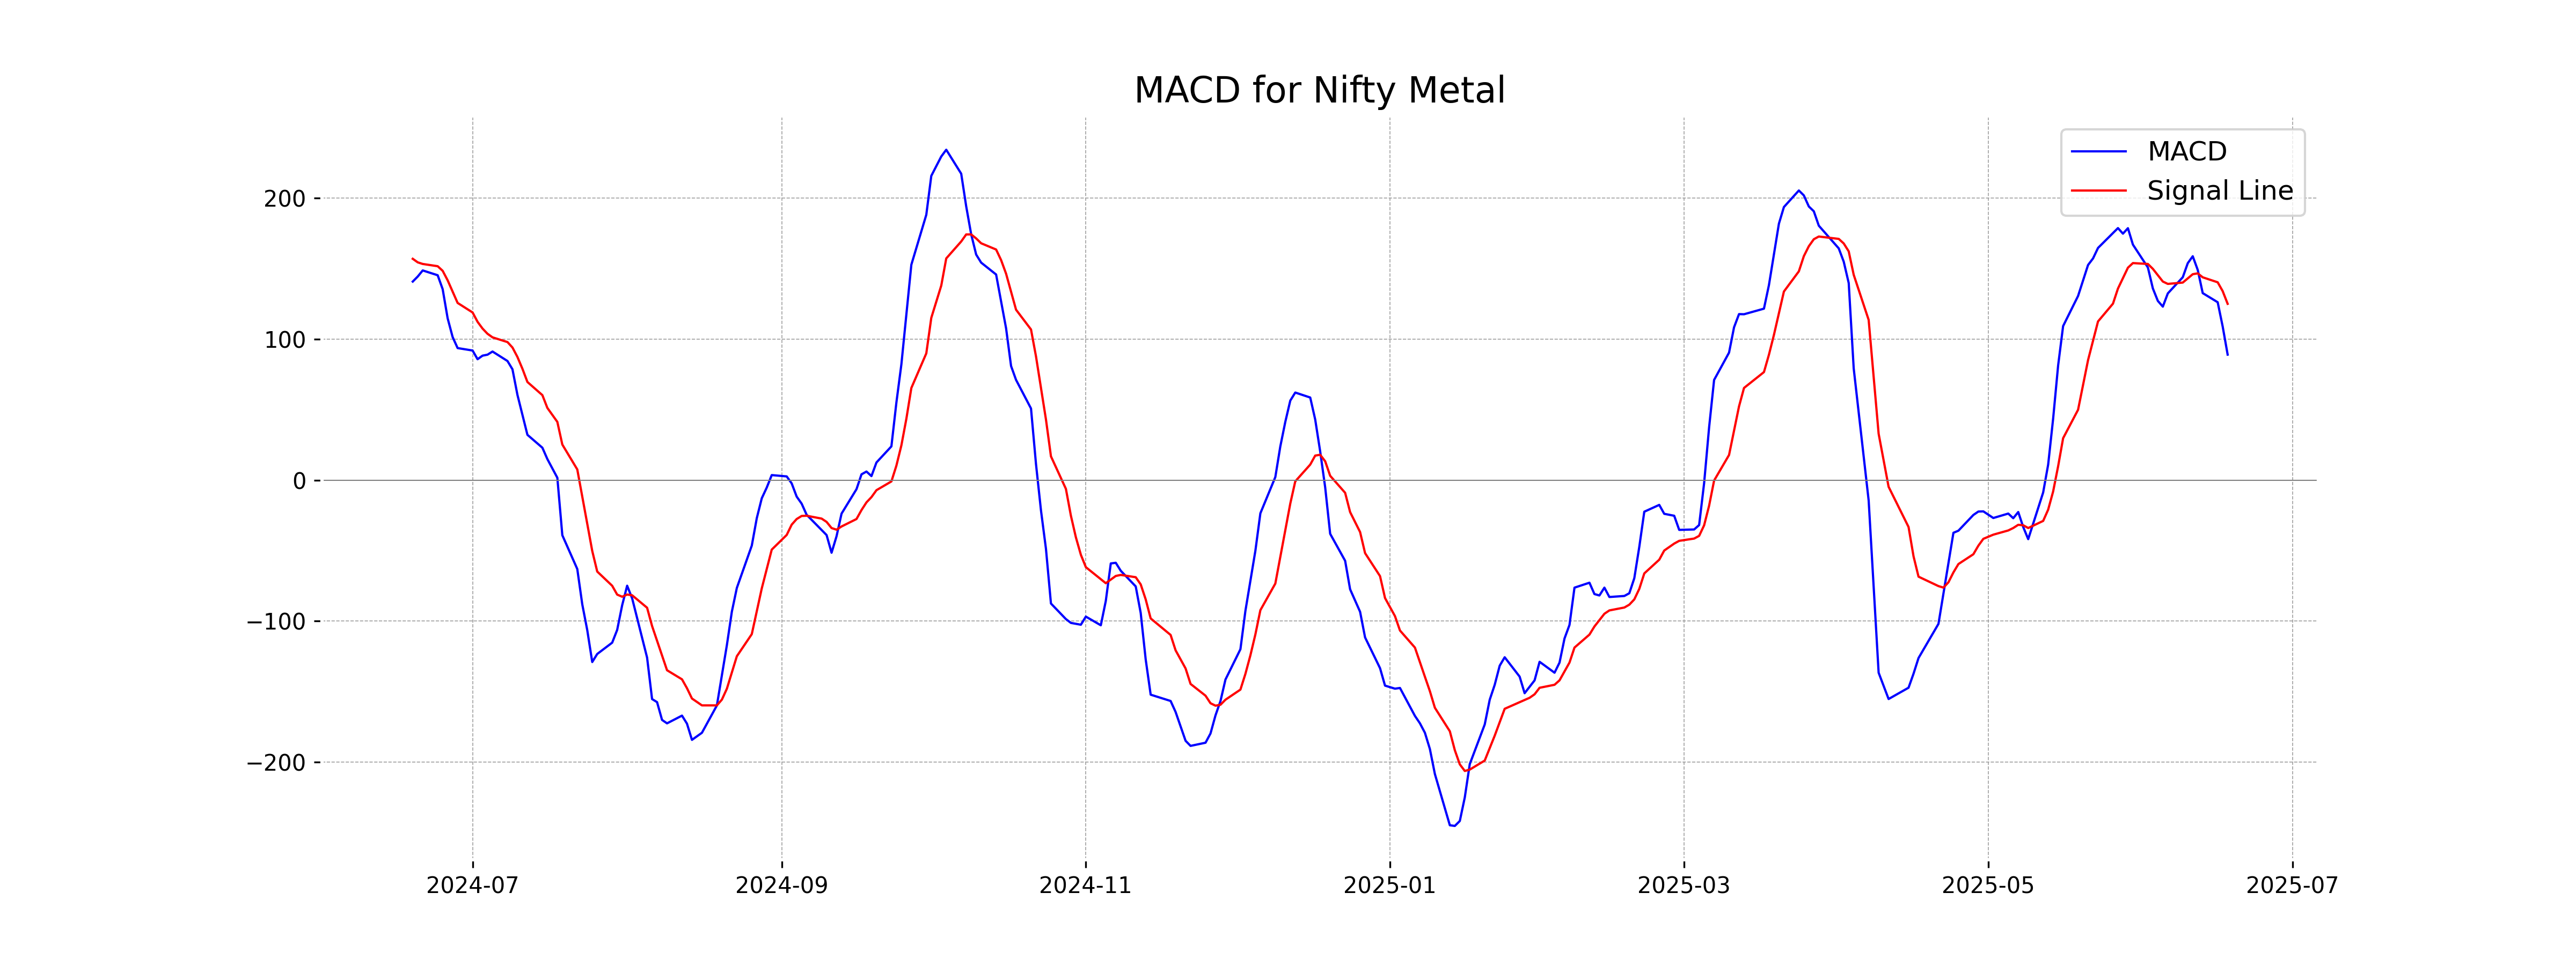
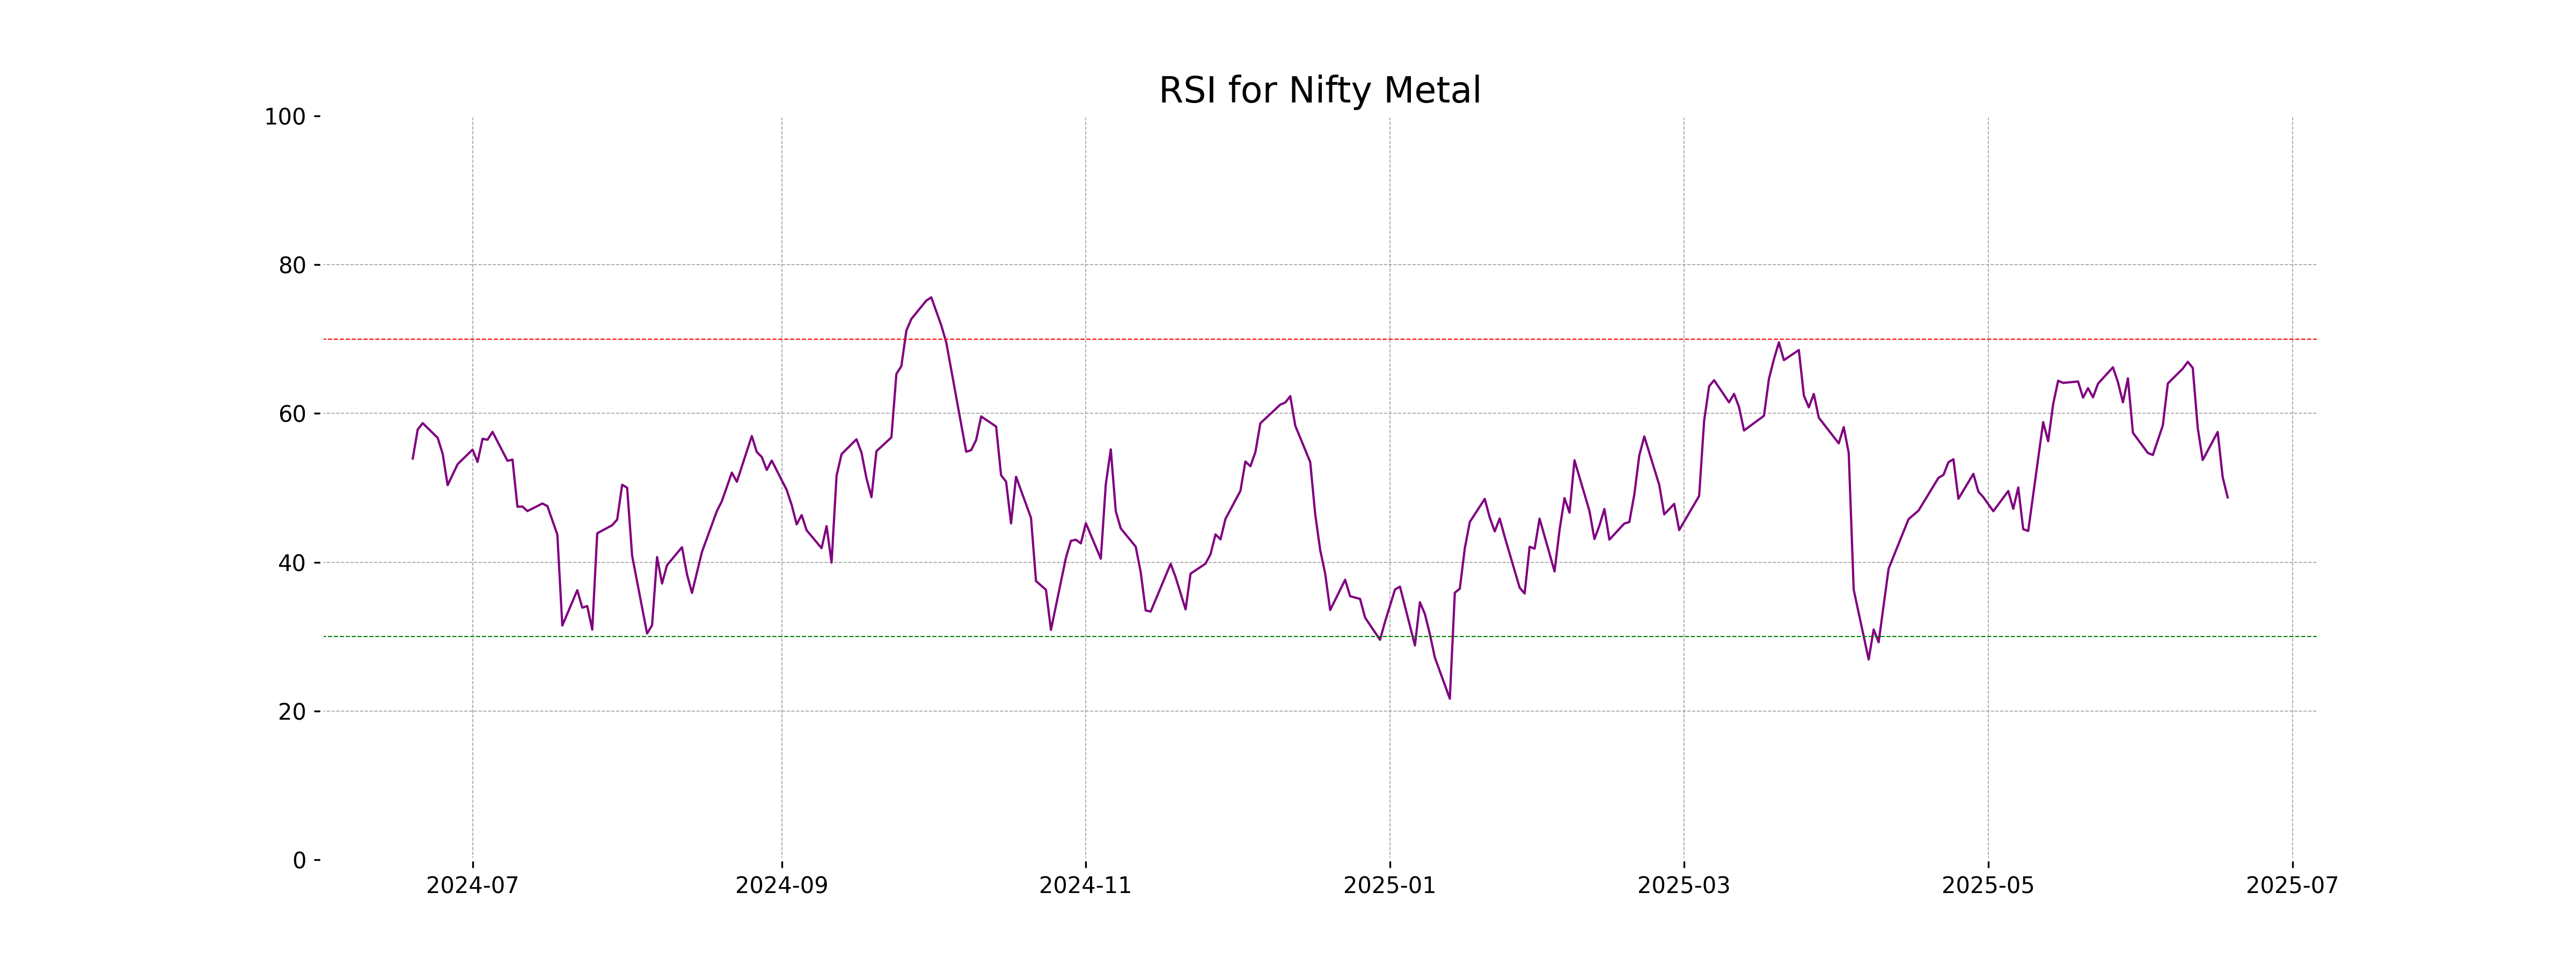
Analysis for Nifty Metal - June 18, 2025
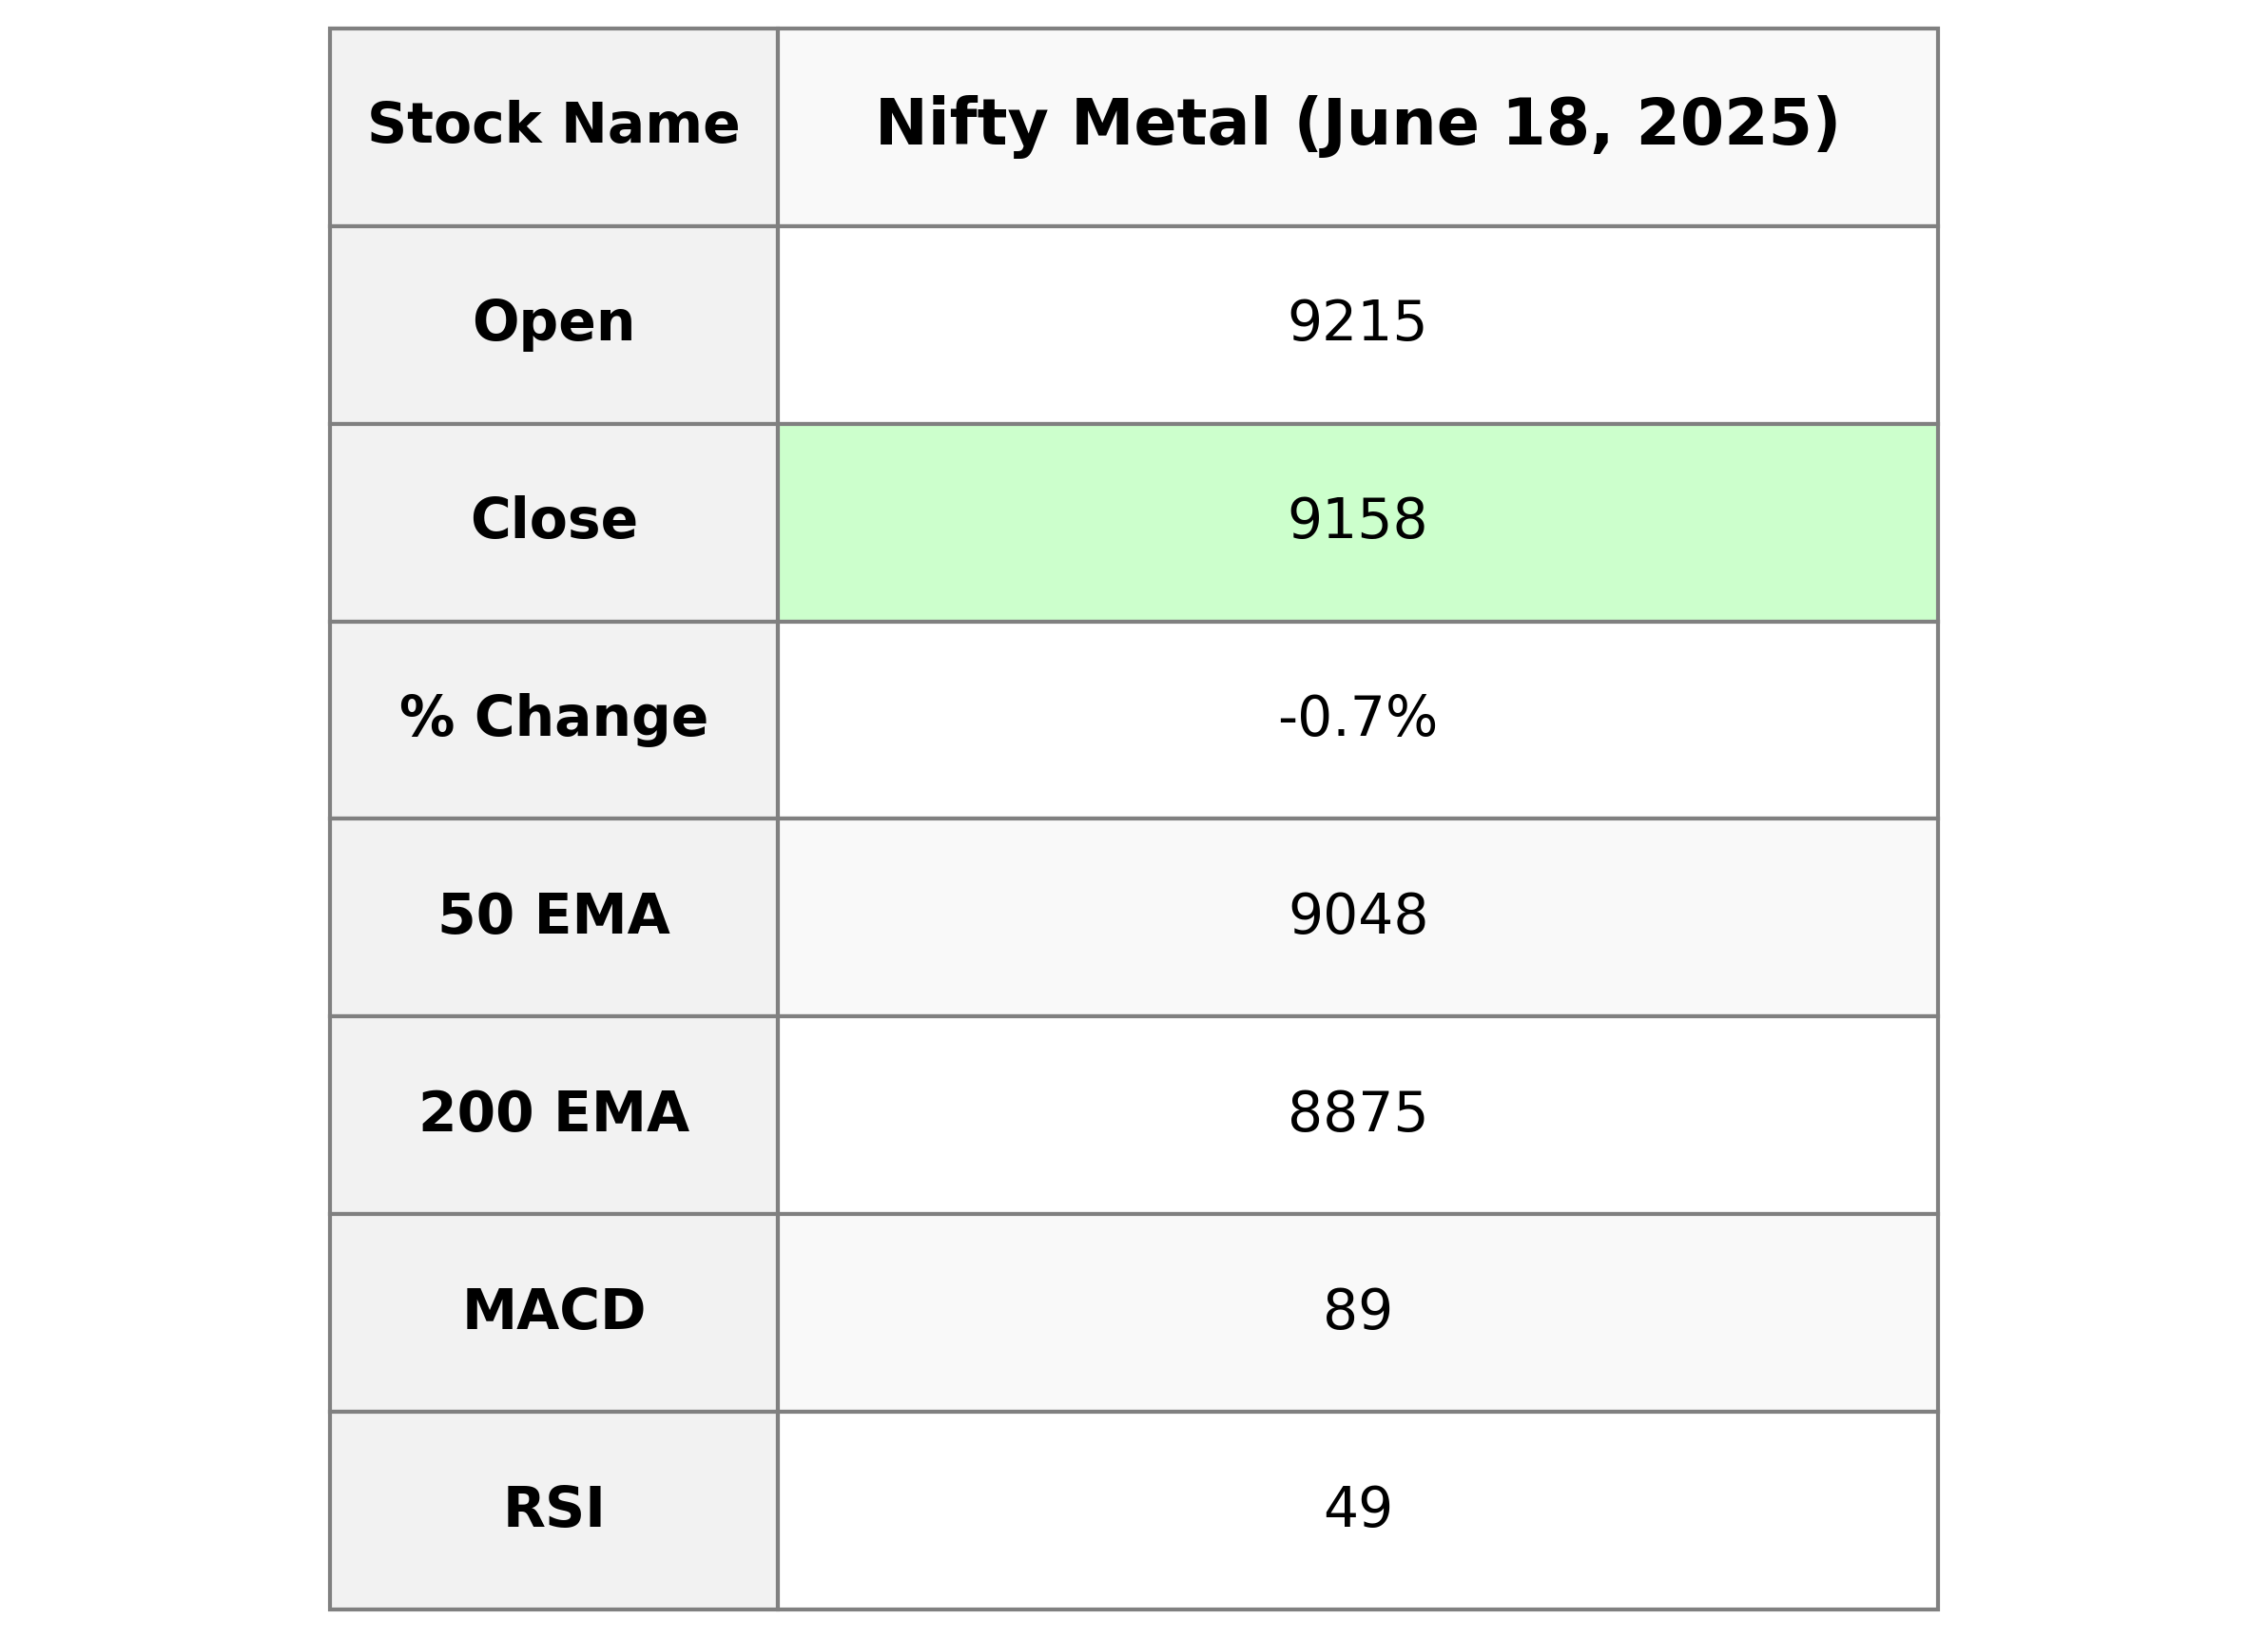
Nifty Metal Performance: On the specified day, Nifty Metal opened at 9215.45 and closed lower at 9158.25, experiencing a percentage decrease of approximately -0.72%. The trading range was between a high of 9238.80 and a low of 9120.55. With an RSI of 48.71, the index is in a neutral zone, indicating that it's neither overbought nor oversold. The MACD value of 89.07 compared to its signal line value of 125.11 suggests a bearish trend.
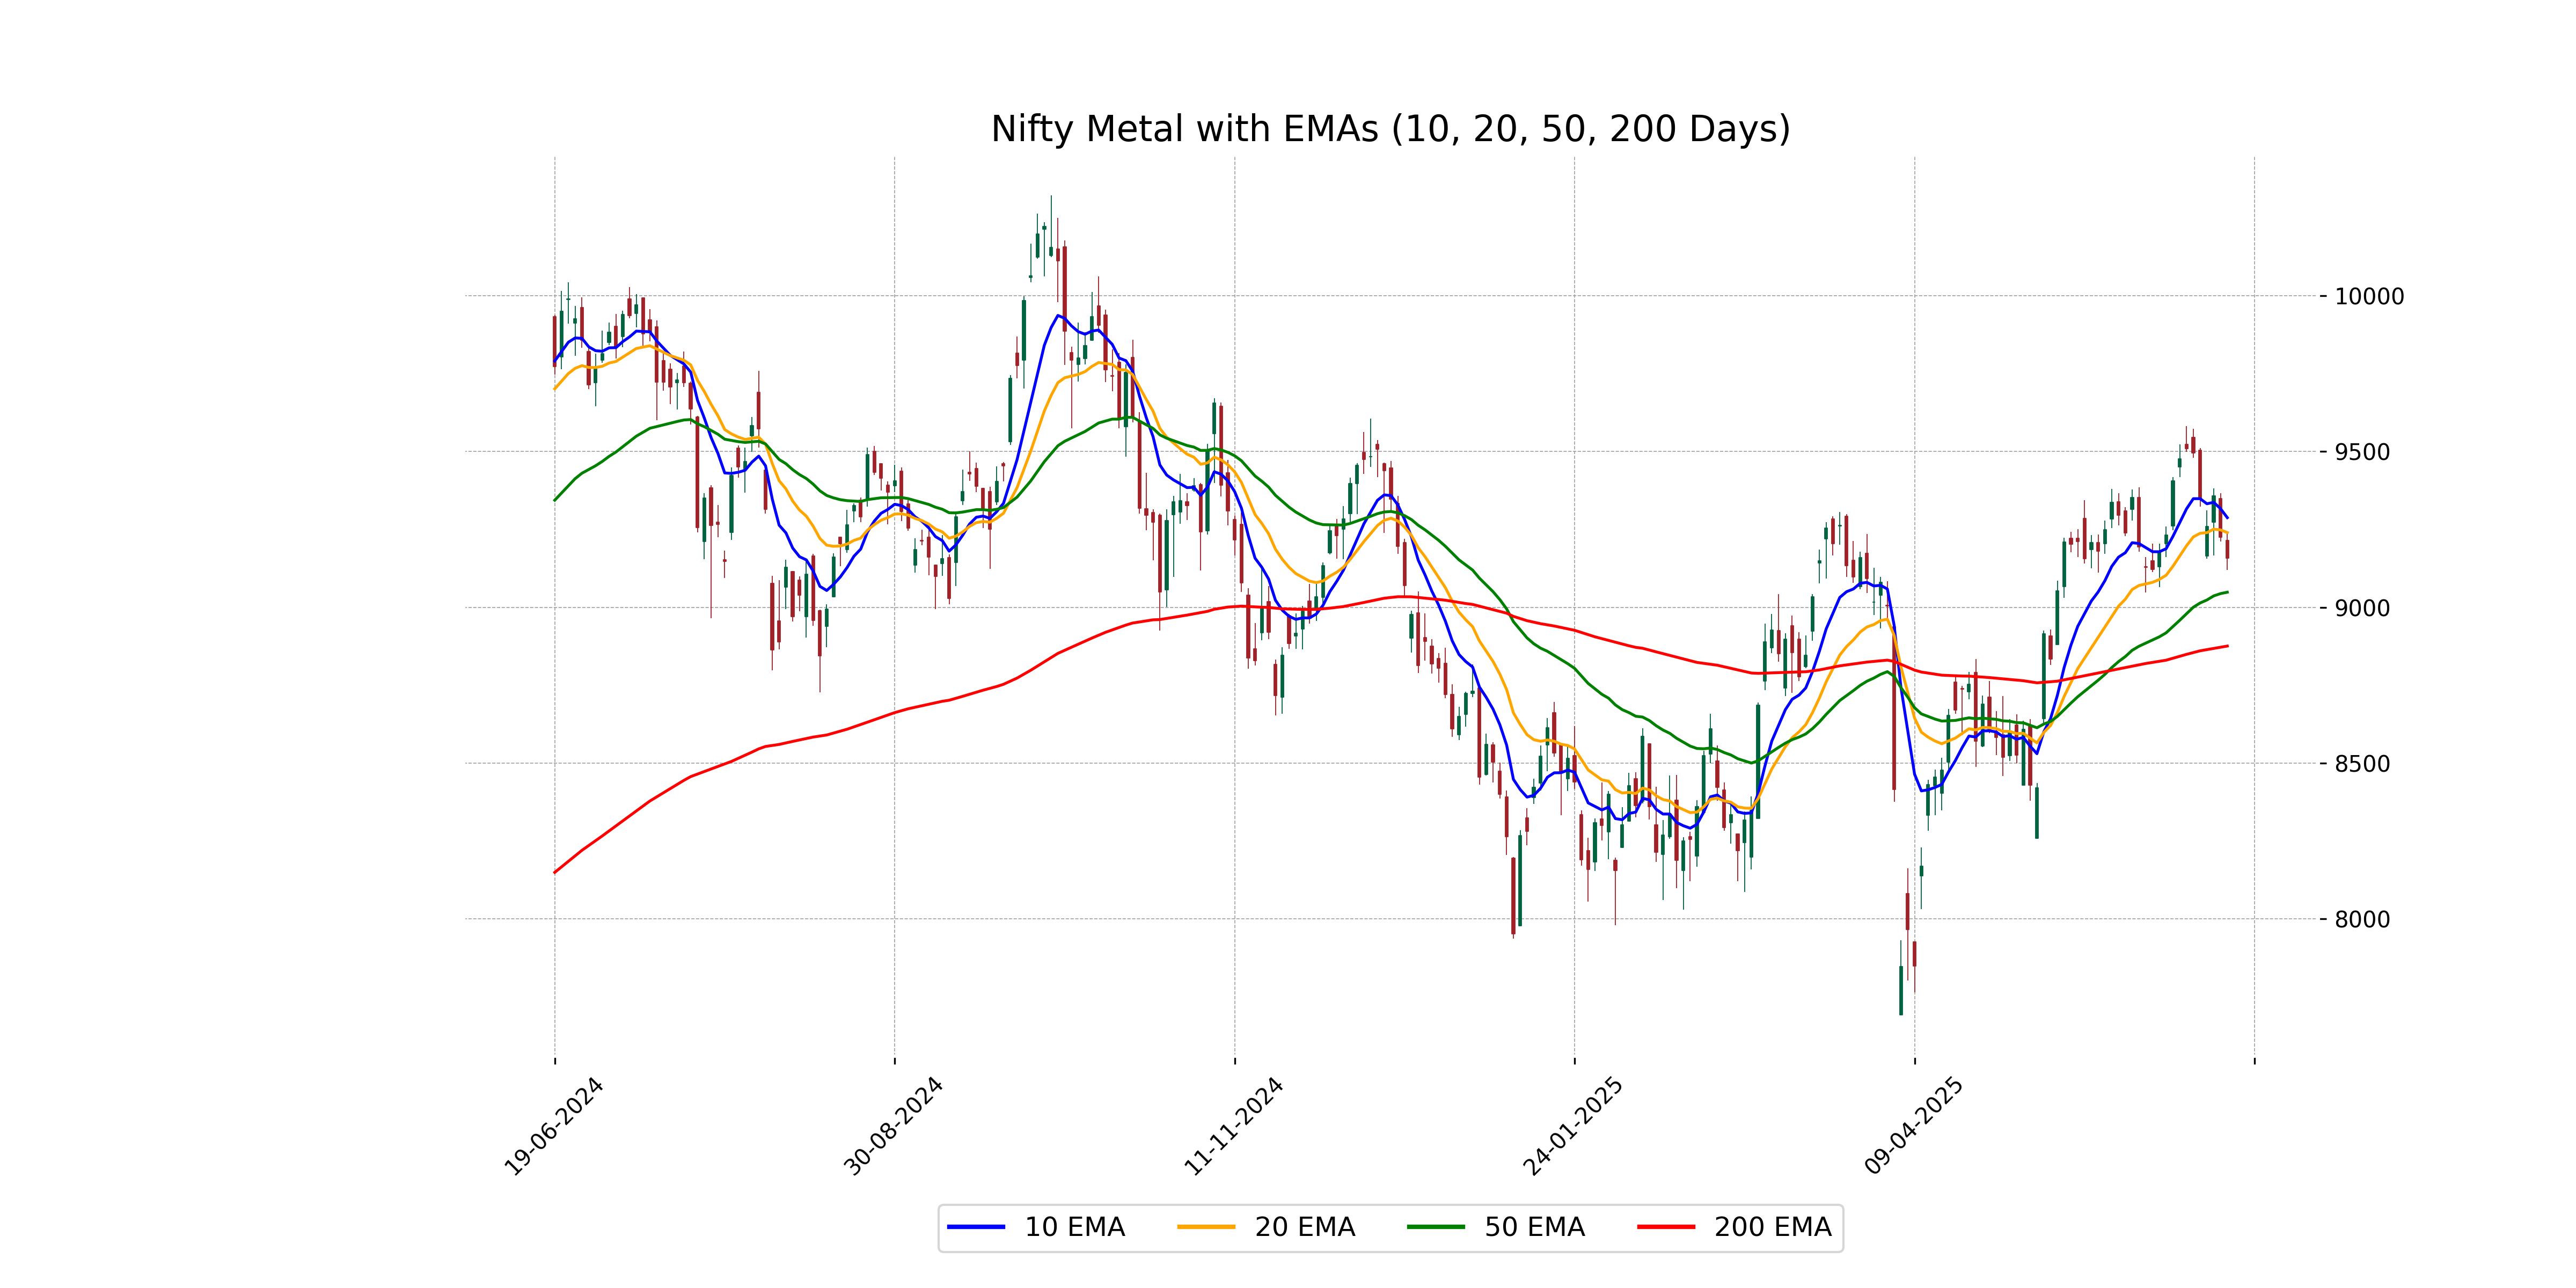
Relationship with Key Moving Averages
Nifty Metal closed at 9158.25, which is below its 10 EMA of 9287.78 and 20 EMA of 9239.79, indicating short-term bearish sentiment. However, it remains above the 50 EMA of 9048.36 and the 200 EMA of 8875.47, suggesting a longer-term bullish outlook.
Moving Averages Trend (MACD)
Nifty Metal MACD Analysis: The MACD value of 89.07 is below the MACD Signal line of 125.11, indicating a bearish signal. This situation suggests a potential downward momentum for the Nifty Metal index in the short term.
RSI Analysis
The RSI value for Nifty Metal is 48.71, which indicates a neutral market sentiment. It suggests that the stock is neither in the overbought nor the oversold territory, hinting at a potential lack of strong momentum in either direction.
Analysis for Nifty Bank - June 18, 2025

Nifty Bank opened at 55544.95 and closed slightly higher at 55828.75, with a percentage change of 0.21% and a points change of 114.60 from the previous close of 55714.15. Despite the increase, the RSI indicates a neutral stance at 53.79. The MACD line is below the signal line, suggesting potential caution in the momentum.
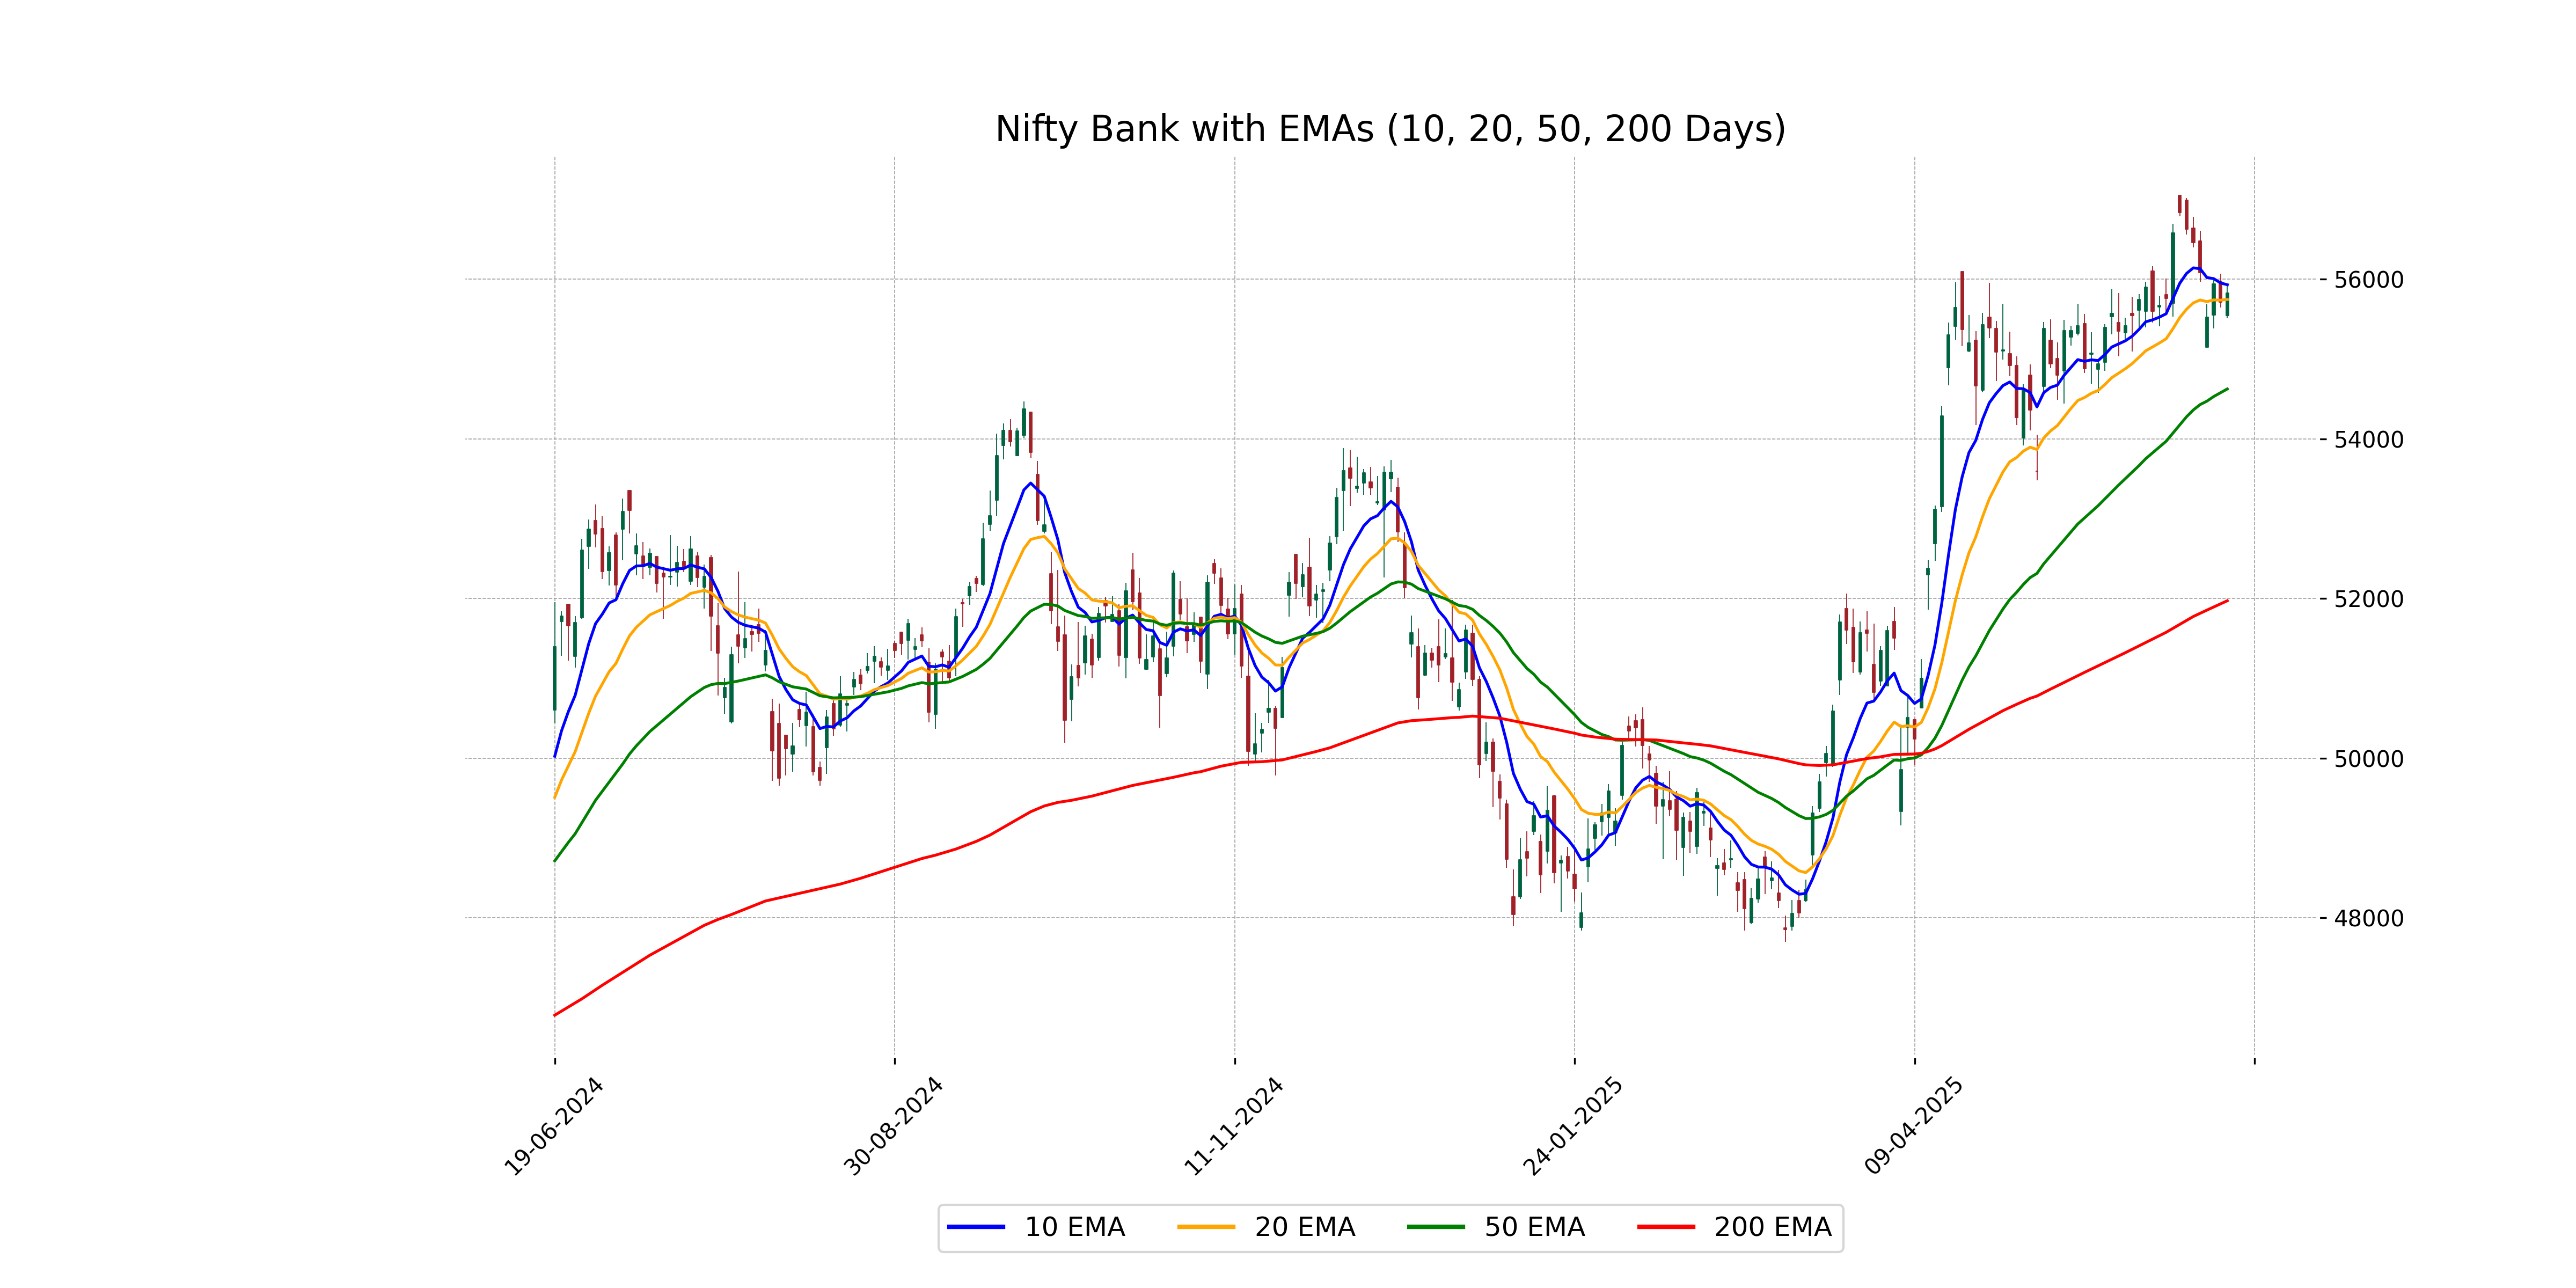
Relationship with Key Moving Averages
Nifty Bank closed at 55828.75, positioned above the 50-day EMA of 54627.03 and the 200-day EMA of 51973.69, indicating a bullish trend in the short to medium term. However, it closed slightly below the 10-day EMA of 55931.92, which may suggest short-term consolidation. The 20-day EMA at 55747.75 is close to the closing price, highlighting a potential area of support or resistance.
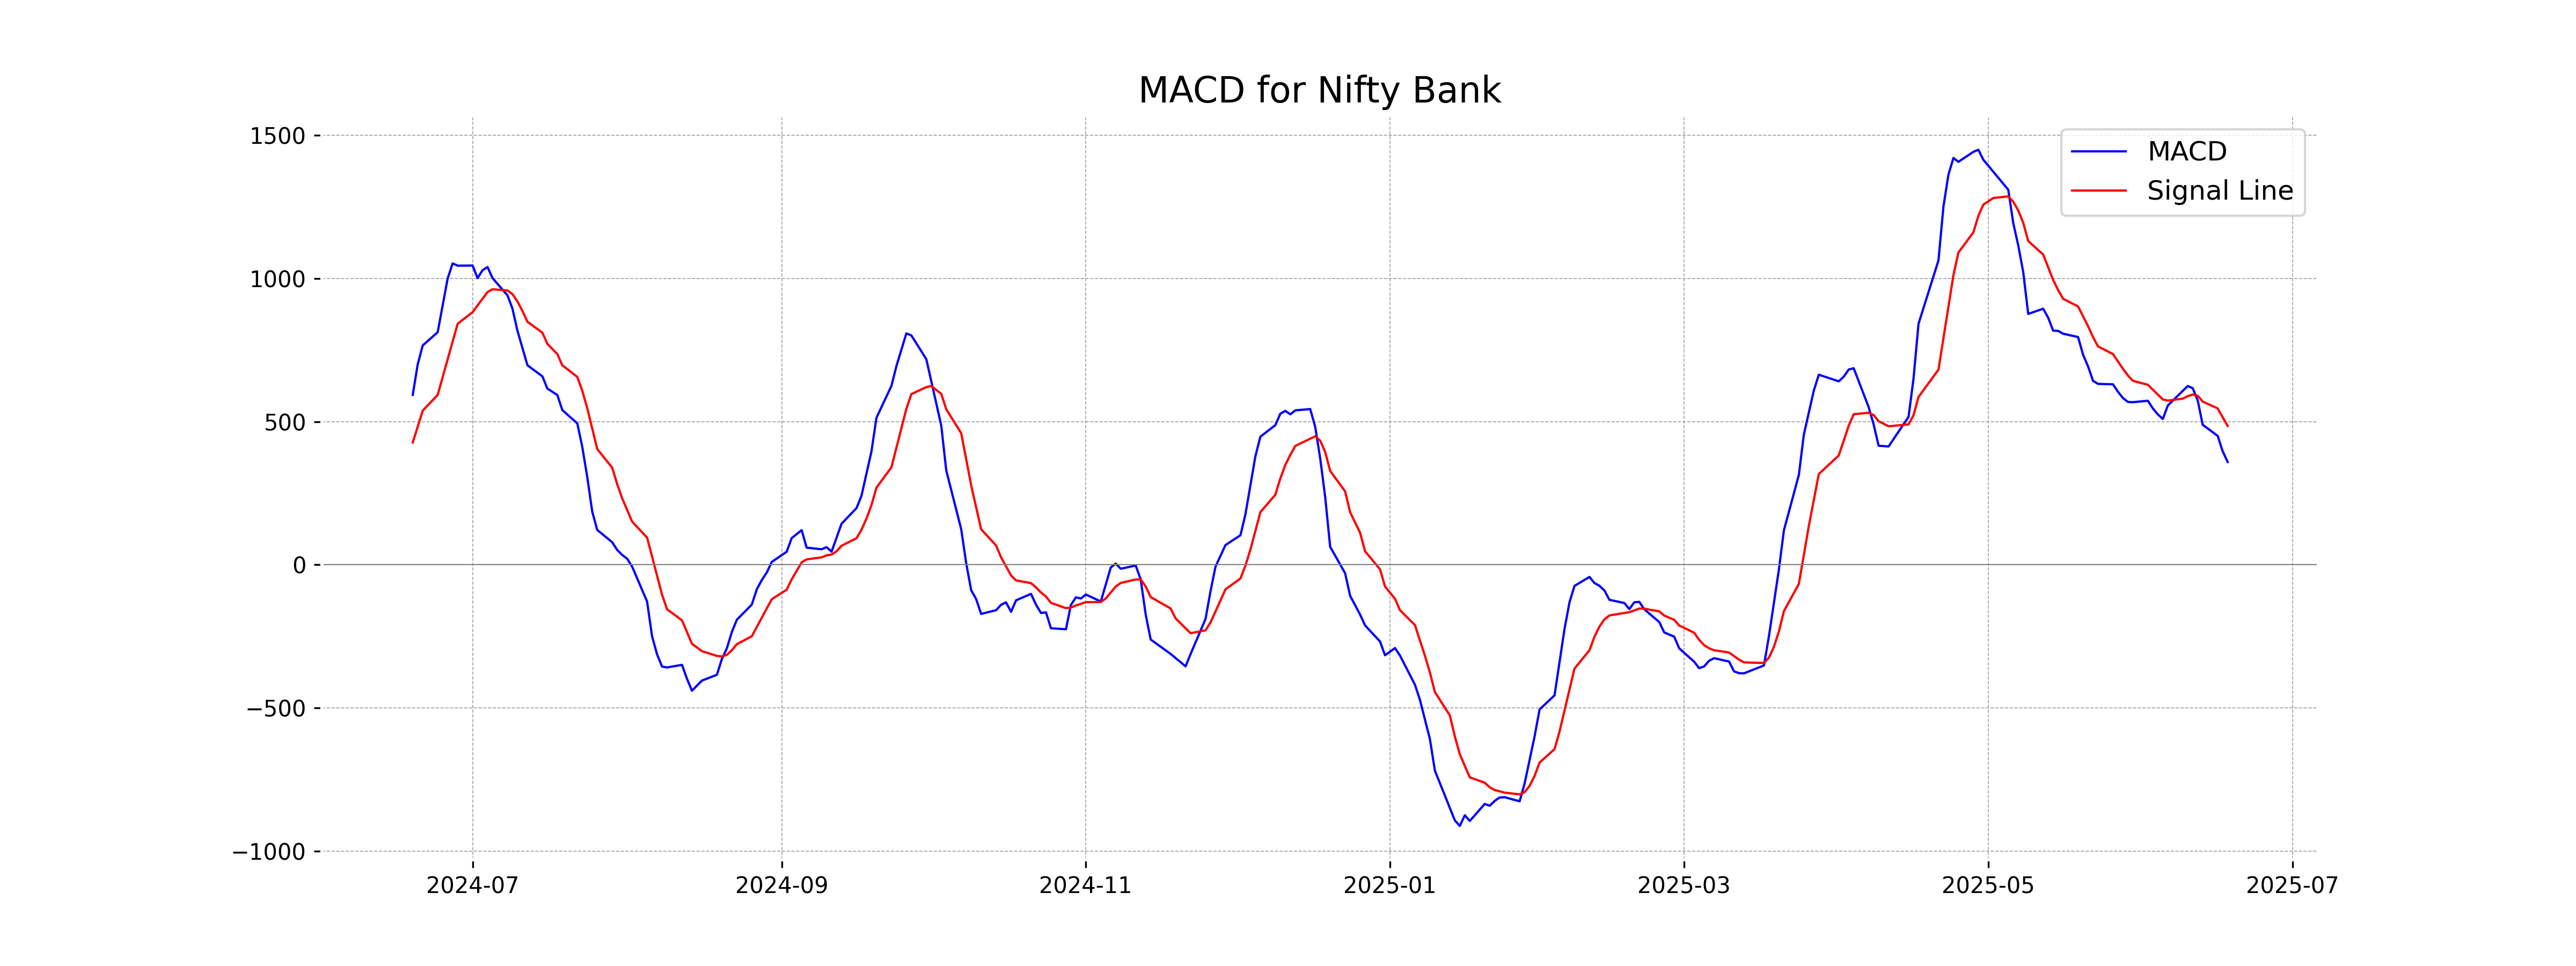
Moving Averages Trend (MACD)
Based on the provided data, the MACD value for Nifty Bank is 358.99, which is below the MACD Signal of 484.68. This indicates a potential bearish momentum as the MACD line is below the signal line.
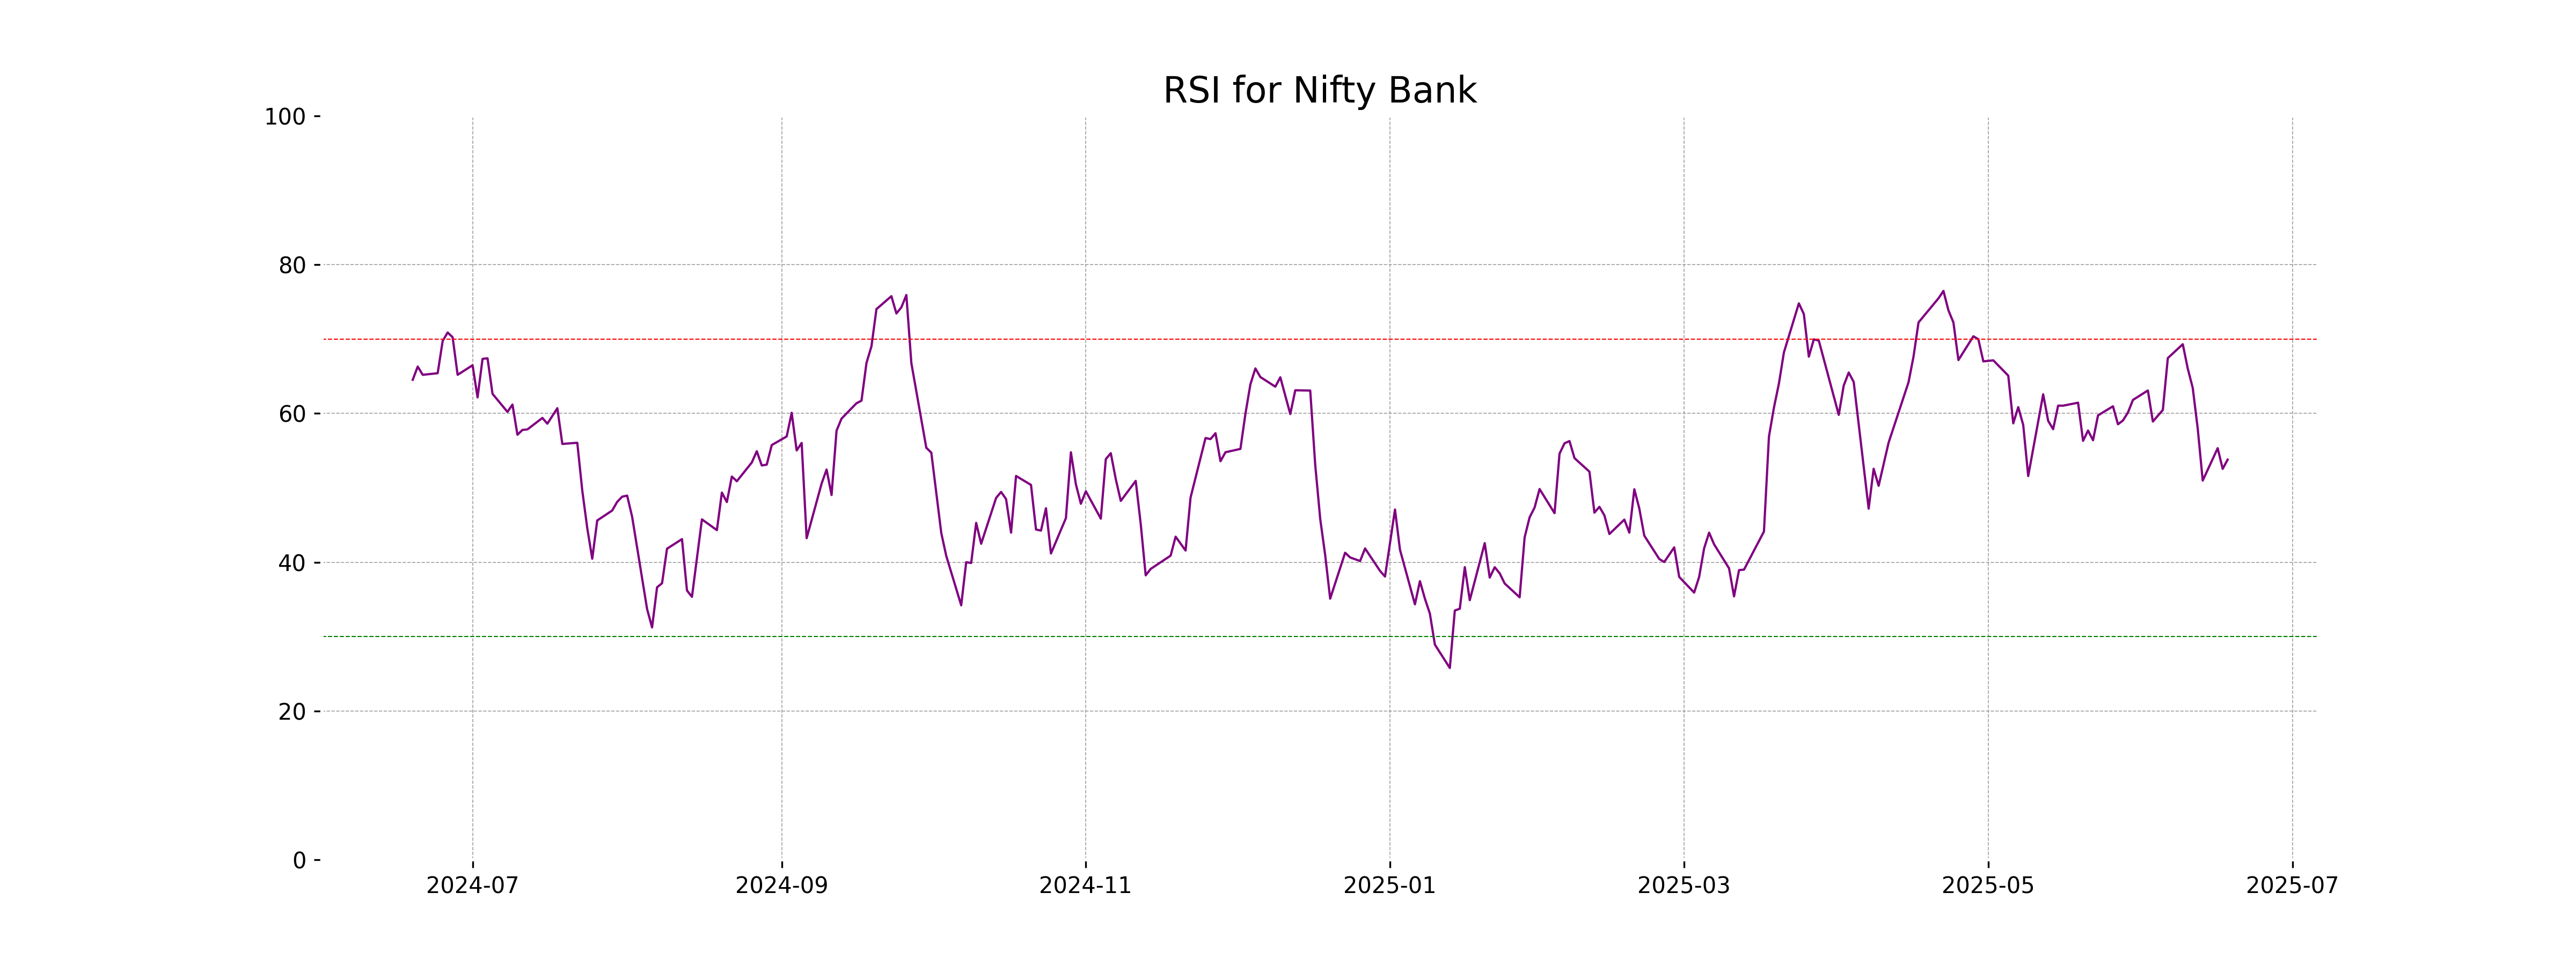
RSI Analysis
The RSI for Nifty Bank is presently at 53.79, suggesting a neutral stance in terms of market conditions. RSI values between 30 and 70 usually indicate that the stock is neither overbought nor oversold. Therefore, Nifty Bank appears to be in a stable position without strong upward or downward momentum.
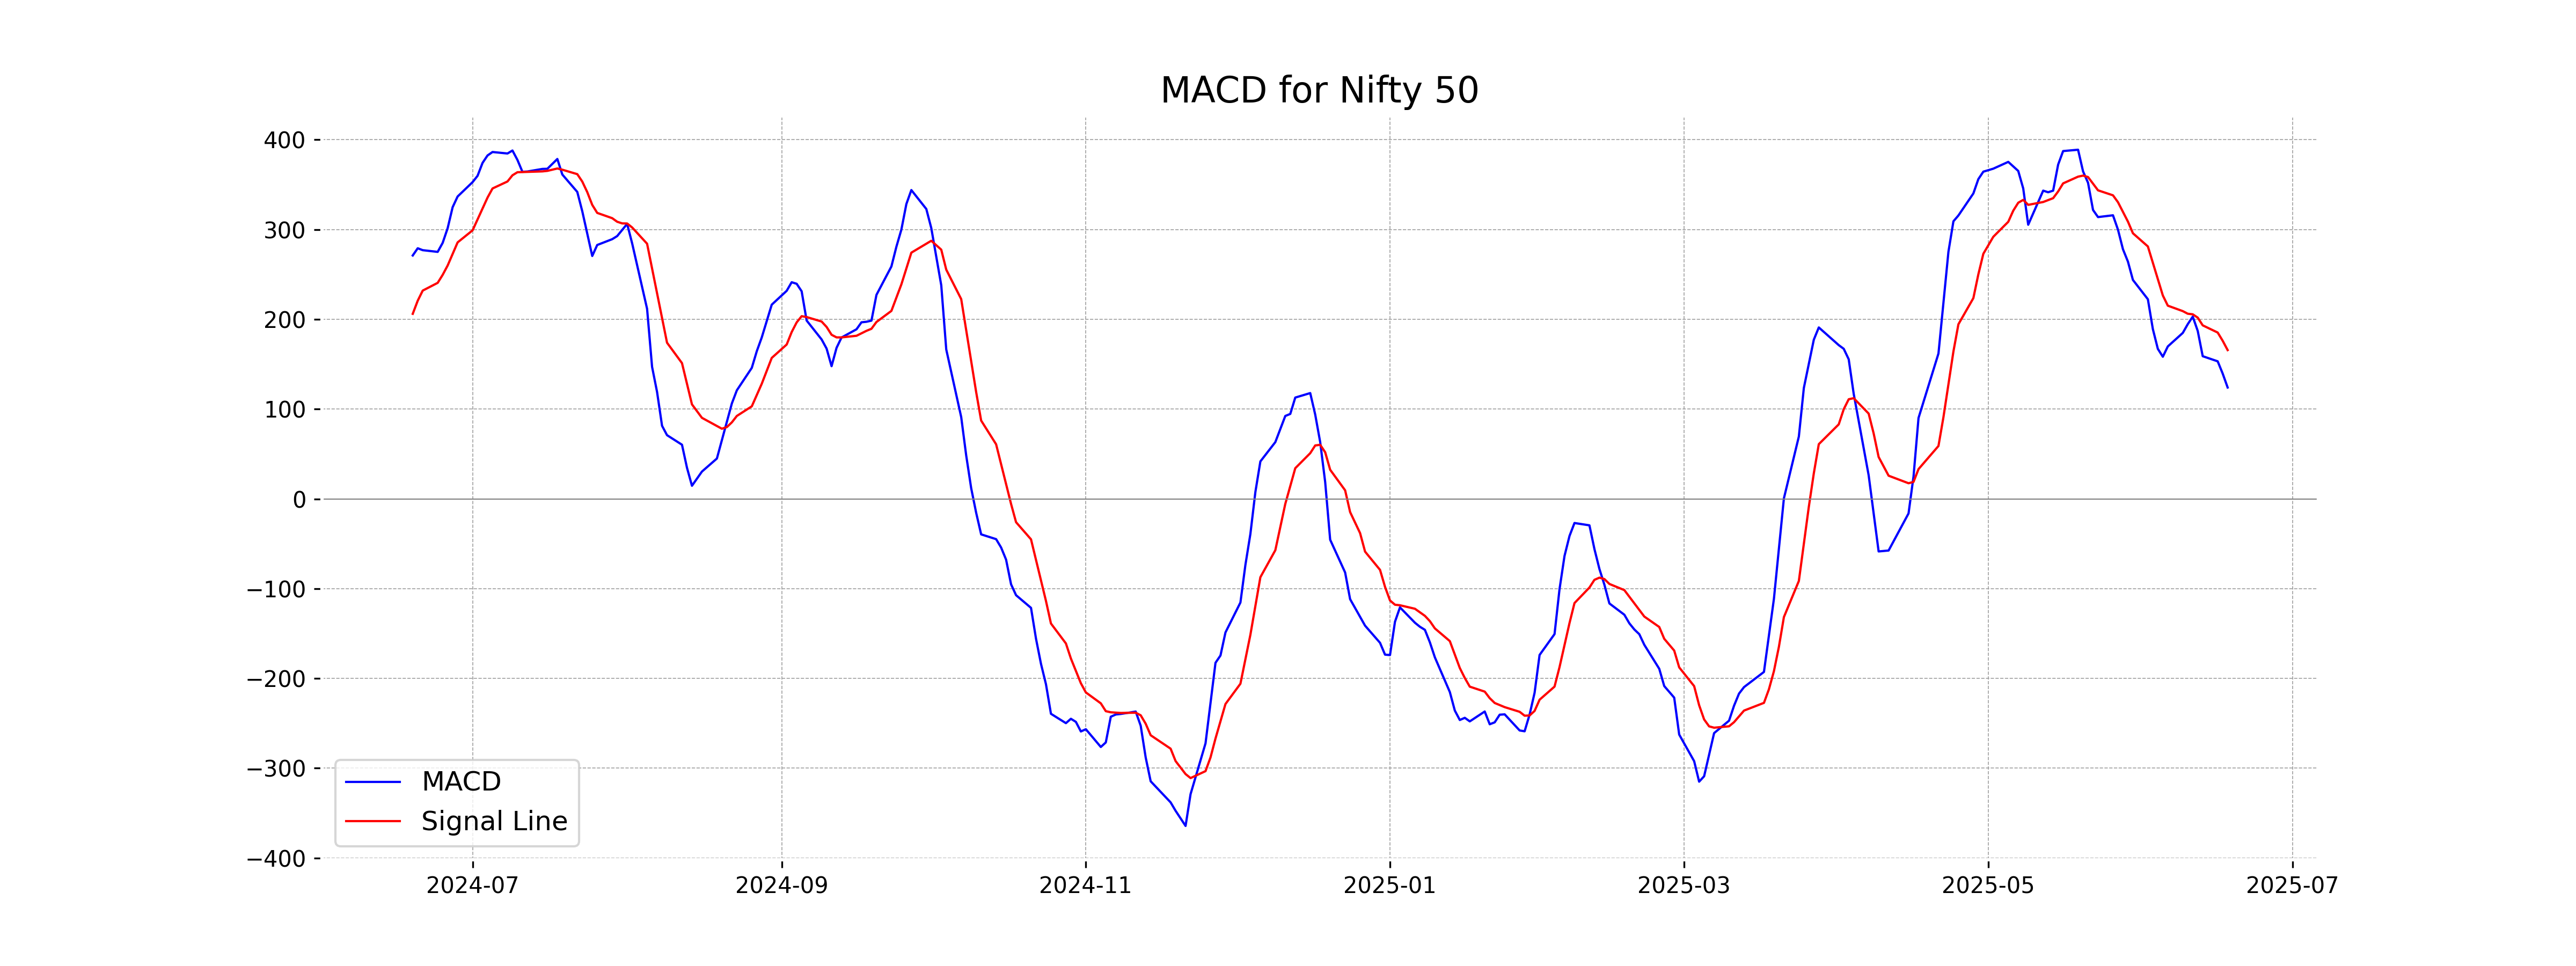
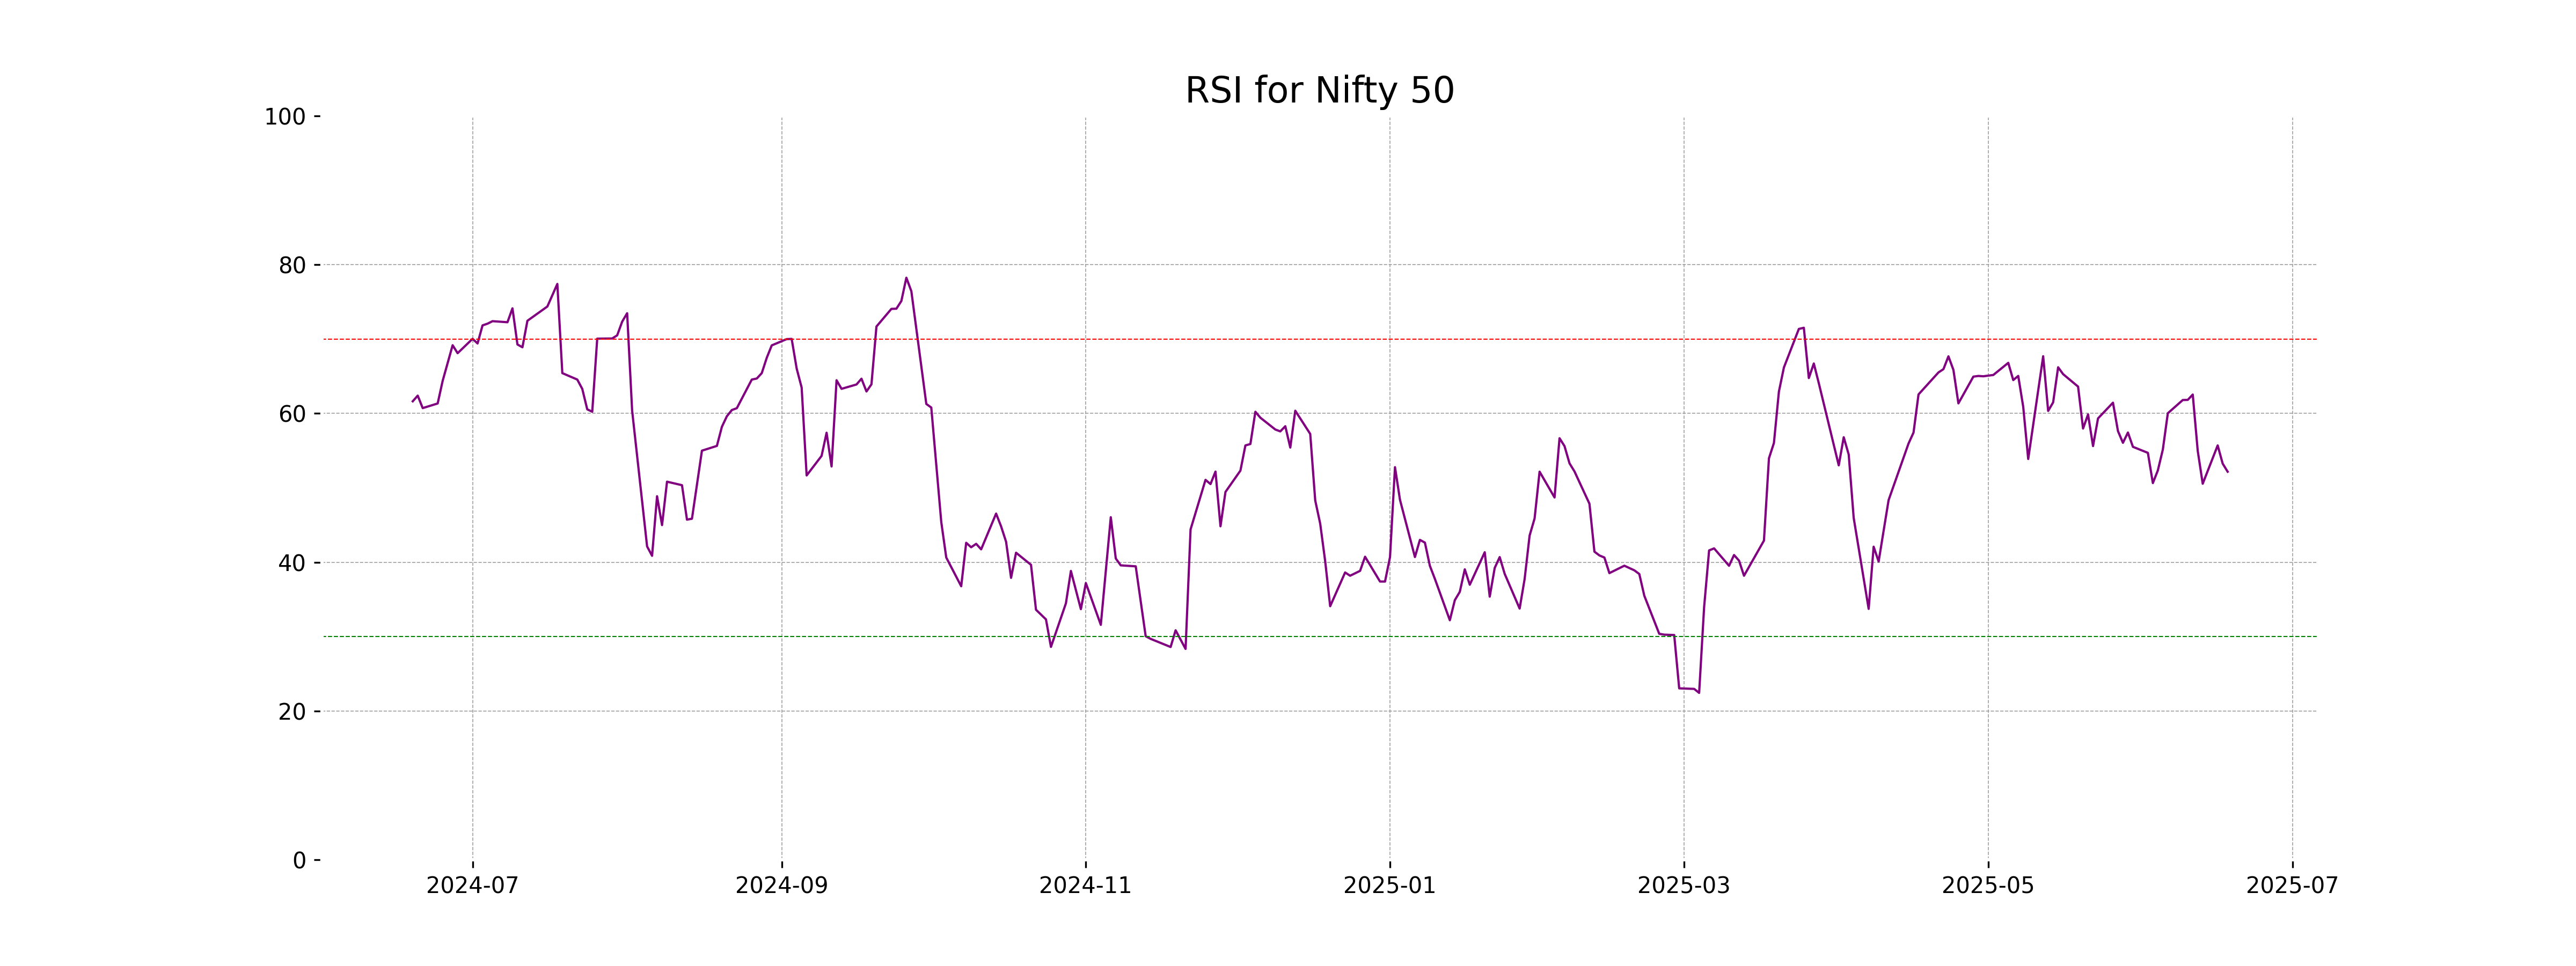
Analysis for Nifty 50 - June 18, 2025
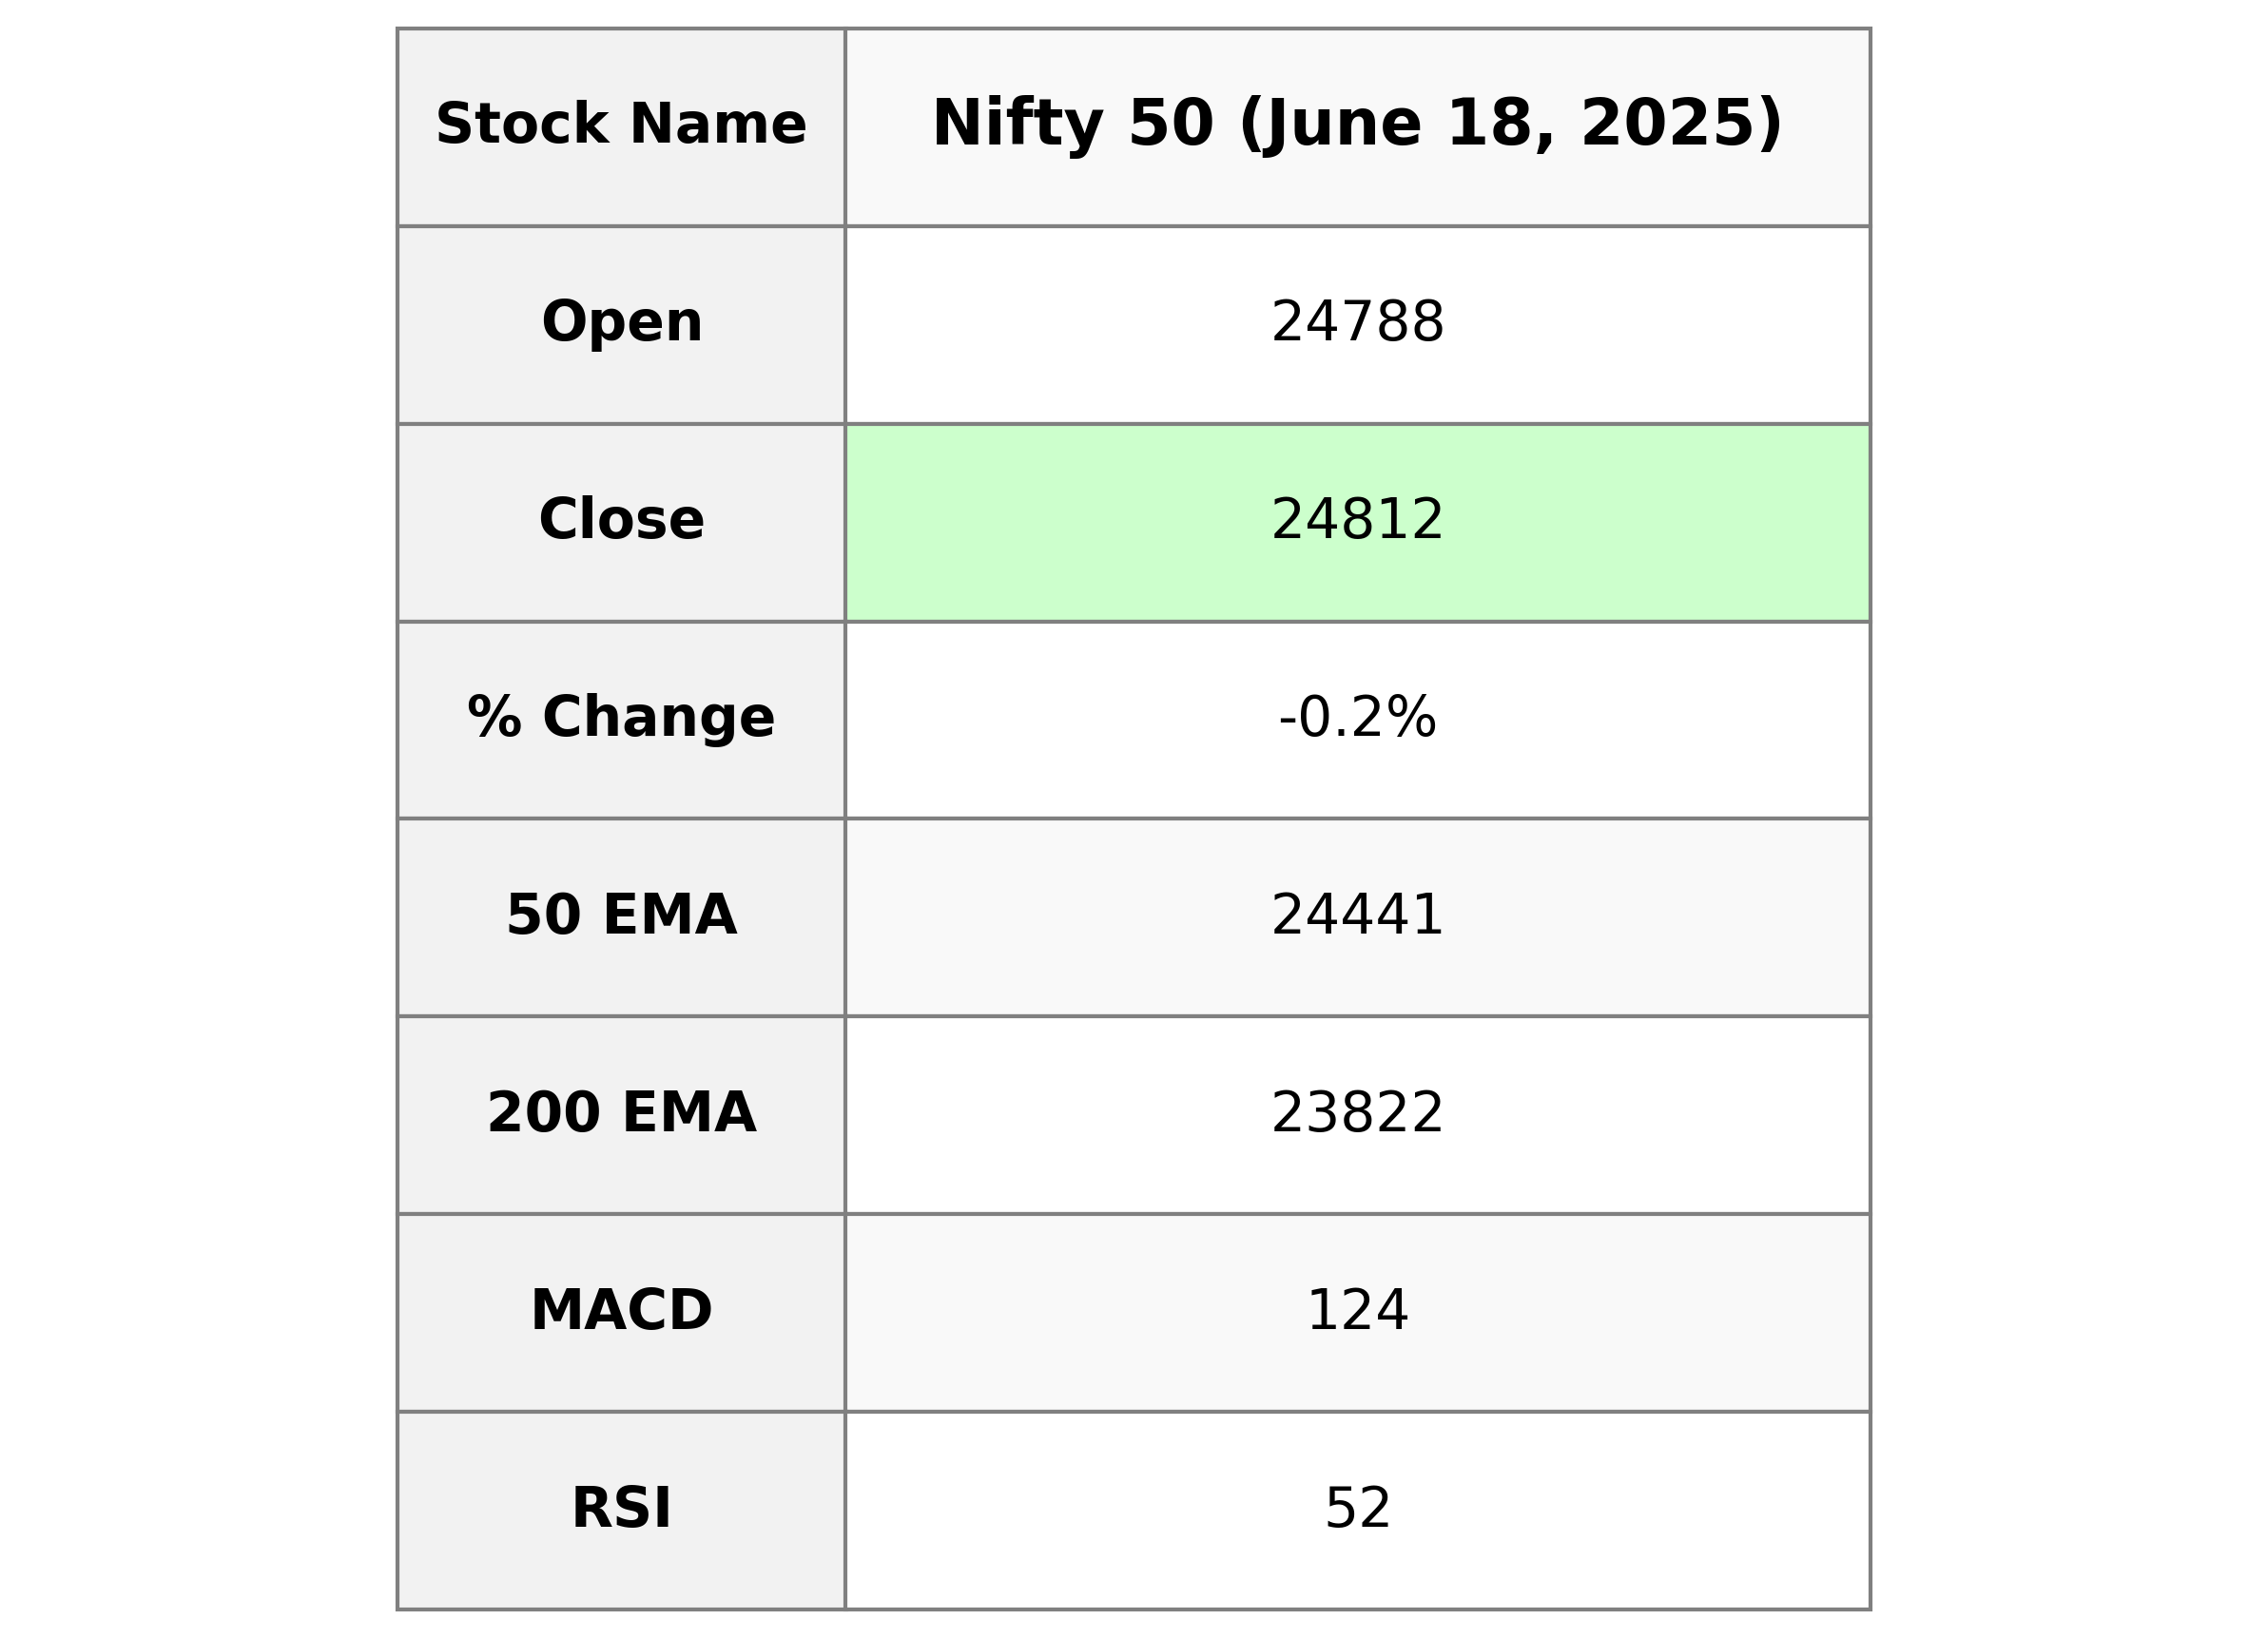
Nifty 50 opened at 24,788.35 and closed slightly lower at 24,812.05, with a minor decline of 0.17% indicated by a points change of -41.35. The relative strength index (RSI) is at a neutral level of 52.17, suggesting neither overbought nor oversold conditions. The moving average convergence divergence (MACD) is below the signal line, indicating a bearish trend.
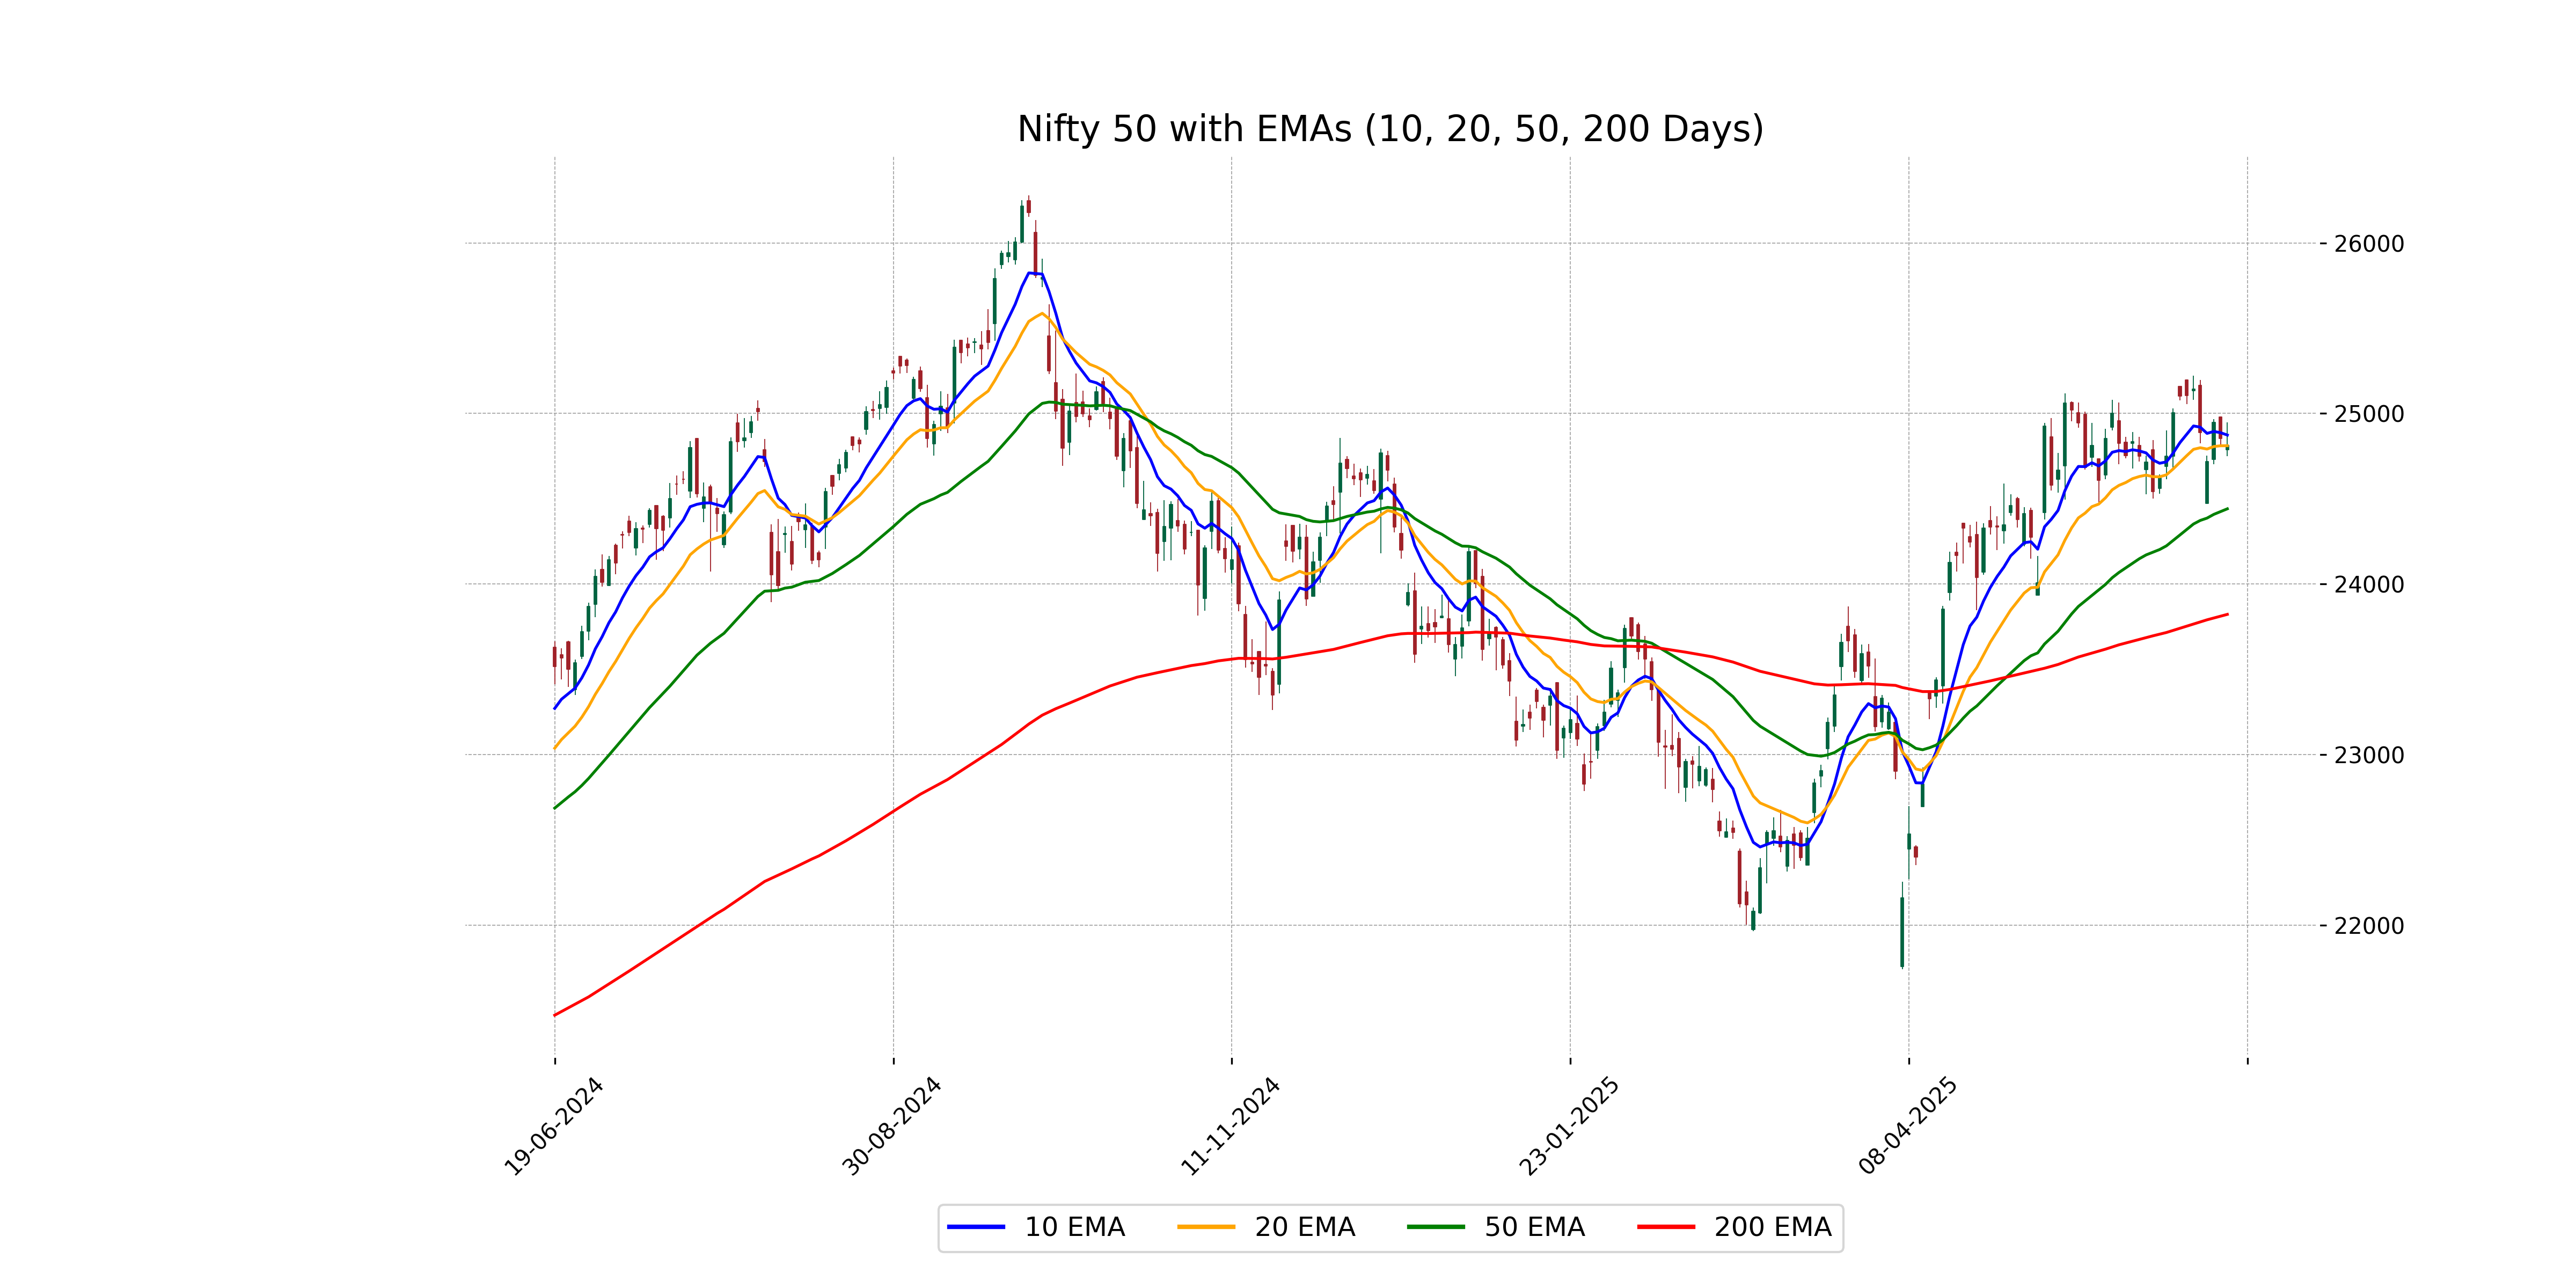
Relationship with Key Moving Averages
The closing price for Nifty 50 is slightly above the 20-day EMA but below the 10-day EMA, indicating some short-term bearish sentiment. The 50-day EMA is significantly lower than the current closing price, suggesting a longer-term bullish trend remains intact.
Moving Averages Trend (MACD)
Based on the data provided for Nifty 50, the MACD (124.04) is below the MACD Signal (165.72), indicating a potential bearish signal. This suggests that the momentum may be declining, and traders might interpret this as a sign to be cautious with long positions.
RSI Analysis
Nifty 50's RSI value is 52.17, which suggests that the stock index is in a neutral zone. It indicates neither overbought nor oversold conditions, implying little momentum in either direction based on RSI alone. Right now, it's important to watch for any emerging trends.
Up Next

Indian stock market sector-wise performance today - June 18, 2025

India's GDP expected to register over 8 pc growth in Sep-Dec: Report

Govt announces seven measures to help boost exports

RBI keeps interest rates on hold after US trade deal boosts outlook

RBI proposes to compensate customers up to Rs 25,000 loss due to fraud

RBI raises GDP growth projection of Q1, Q2 of FY27

More videos

RBI pauses rate cuts, retains interest rate at 5.25 pc

Rupee jumps 122 paise to close at 90.27 against US dollar on India-US trade deal

Stock markets cheer India-US trade deal: Sensex, Nifty surge 2.5 pc

UPI transactions hit record high of Rs 230 lakh crore in 2025-26 till Dec: Govt

Explained: India-US trade deal, tariffs and trade benefits

Trade deal with US adds momentum to India's growth ambition: Industry leaders

Rupee jumps 119 paise to 90.30 against the US dollar on India-US trade deal

President Trump announces US-India trade deal, lowers tariffs from 25 pc to 18 pc

Stock markets cheer India-US trade deal: Sensex jumps over 5 pc; Nifty nears all-time high

Sustaining 7–8% growth top priority to create jobs: FM Nirmala Sitharaman