


Highlights
- Overall market sentiment showed strong sectorial divergences
- Energy and FMCG sectors revealed powerful bullish indicators
- RSI readings mostly register near neutral, with MACD divergences igniting careful optimism
Latest news

Haier Launches HQLED P7 Pro Series TVs With Google Gemini, 50W Audio And AI Picture Enhancements

Nothing's Latest Pokémon Teasers Hint At New Hardware, RCB Collaboration May Also Be In The Works

OnePlus N6 Set To Debut With Massive 8,000mAh Battery And Long-Term Performance Focus

Roblox Introduces Age-Based Accounts for Younger Users, Expands Parental Controls Globally

IIFL Capital Launches Algo Marketplace with Over 100 Ready-Made Strategies

LUMIQ Raises INR 50 Crore Pre-Series B to Become the AI Decision Layer for Financial Services

Tay Keith, producer behind Travis Scott's 'Sicko Mode' dies at 29

GenAI could lift realty sales velocity by up to 50%, speed up launches by 30%: Report
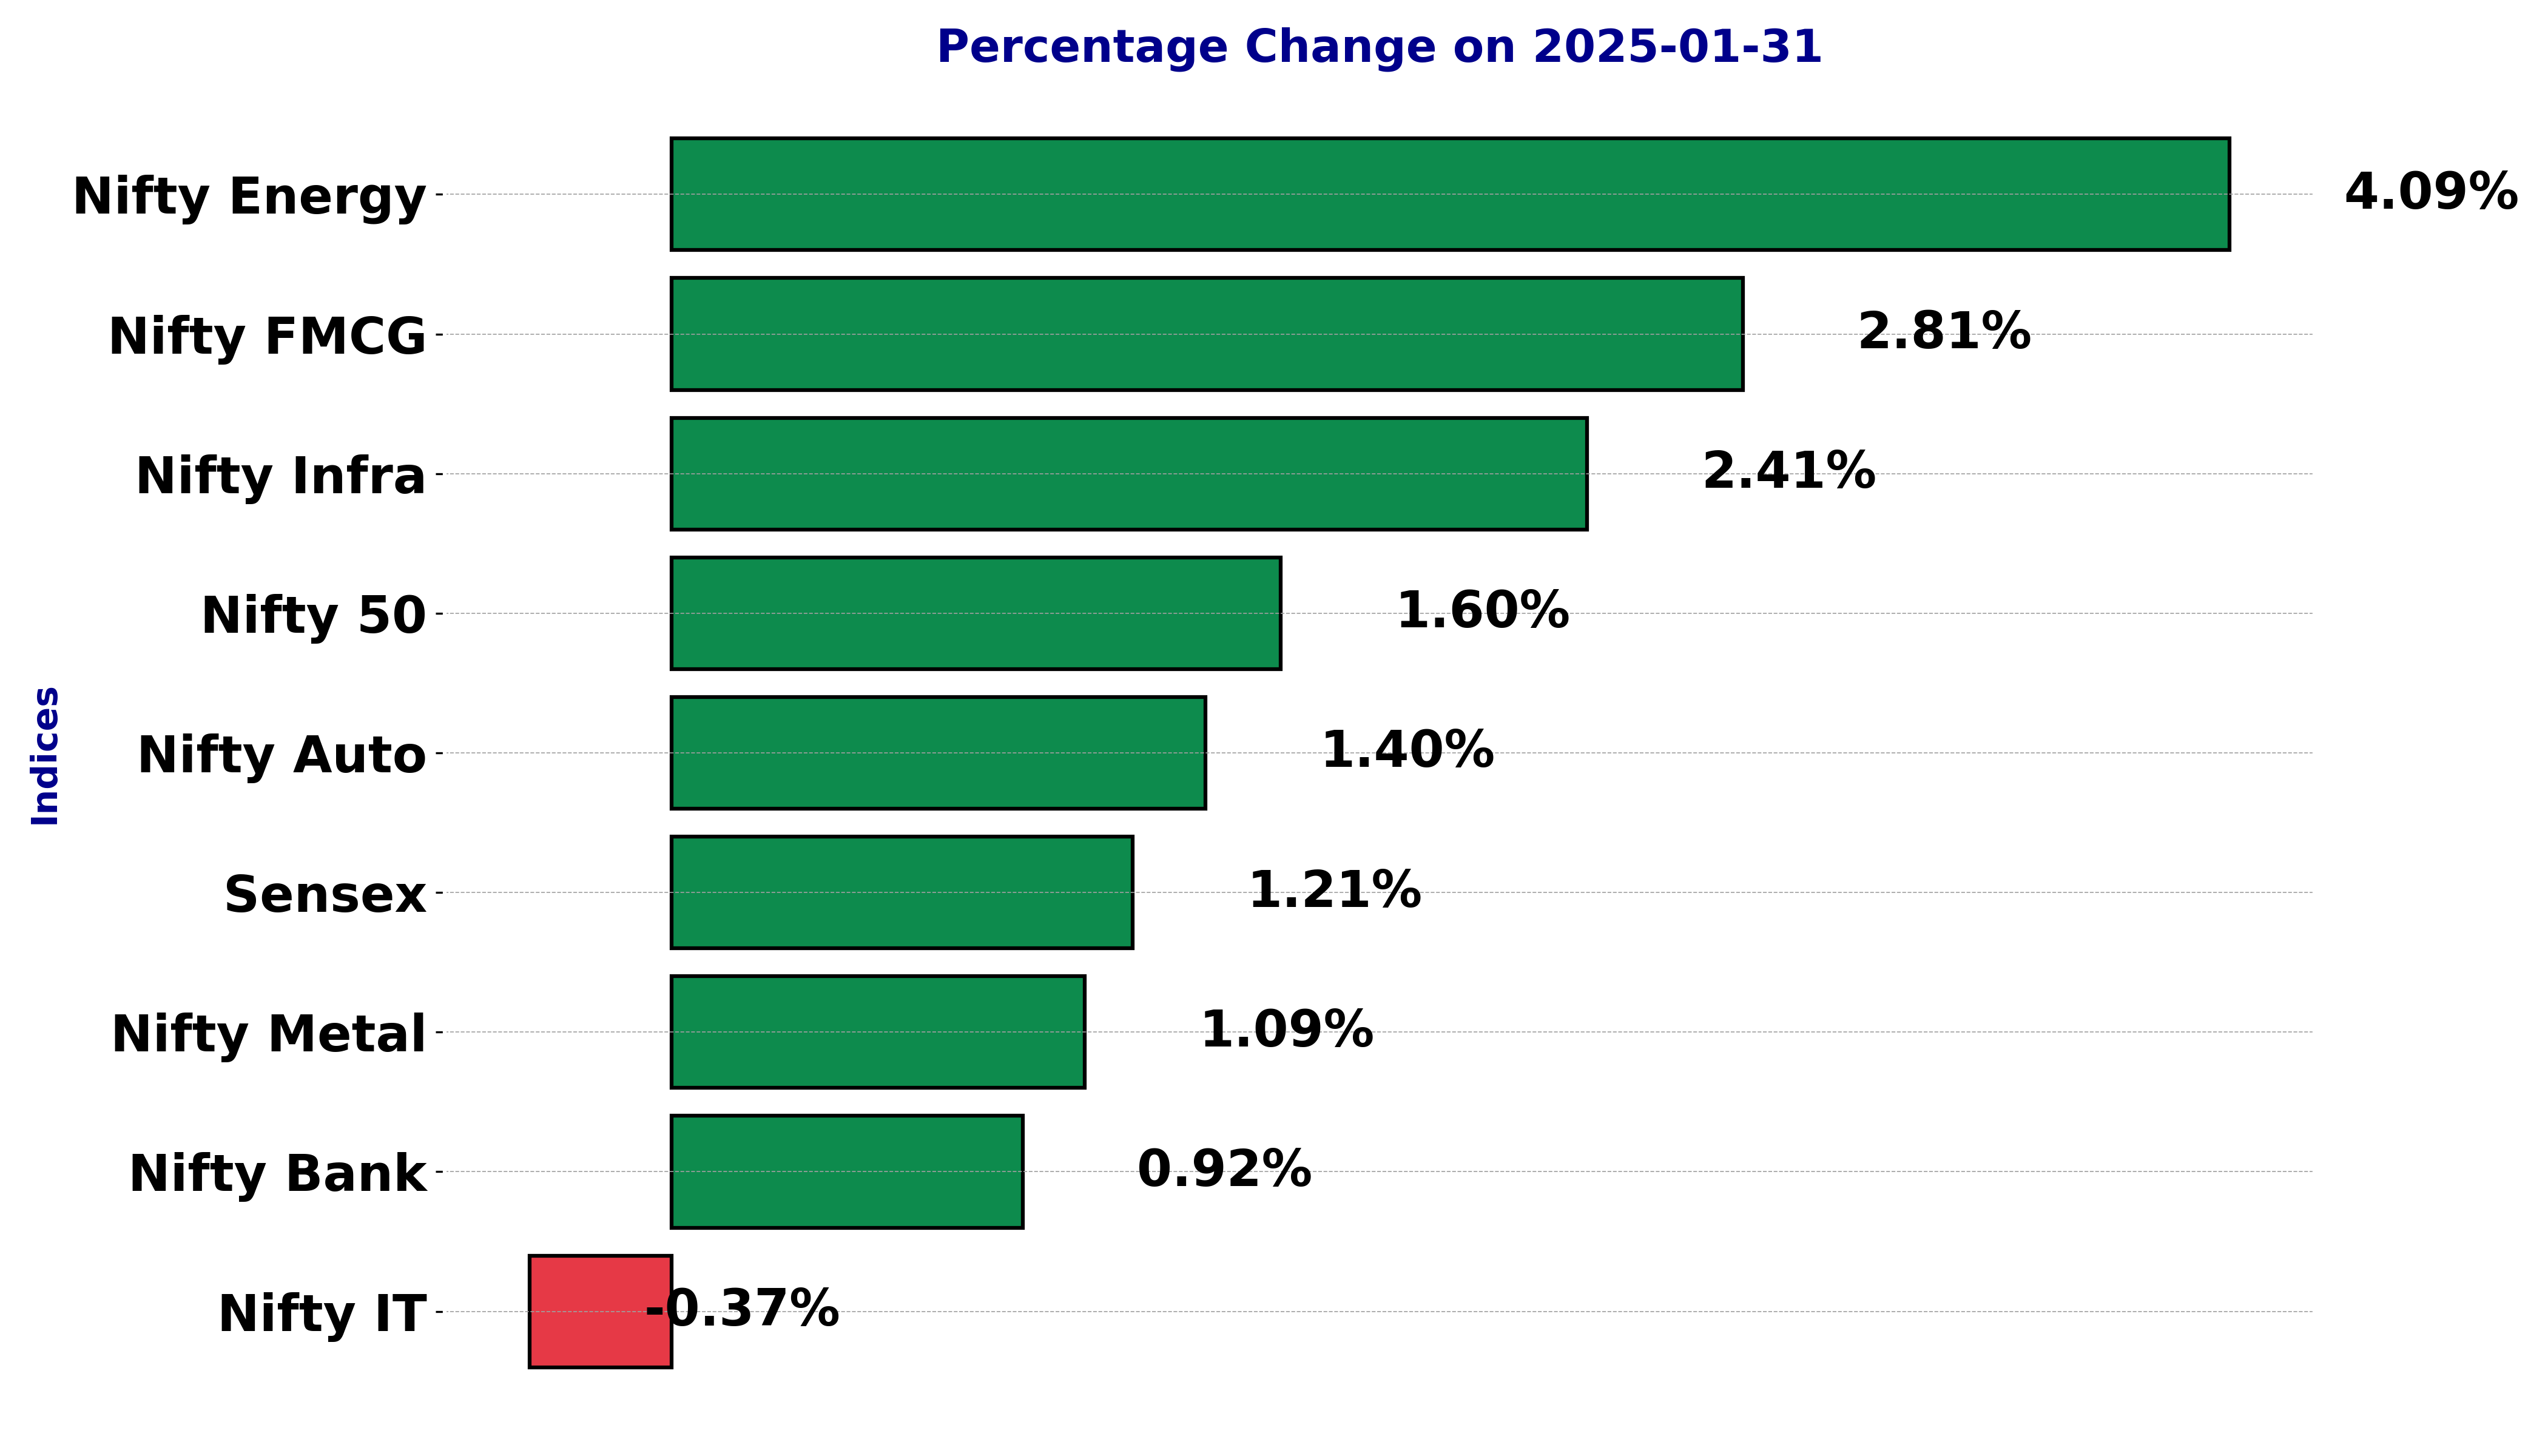
Indian stock market sector-wise performance today - January 31, 2025


The national stock market indices showed varied performances on January 31, 2025, reflecting the economic sentiment.
In this article, we analyze the performance of key national indices including the Nifty 50,Nifty Bank,Nifty IT,Nifty Auto,Nifty Pharma,Nifty FMCG,Nifty Infra,Nifty Energy and Nifty Metal.
Indices Performance for the Sensex on January 31, 2025:

The Sensex opened at 76,888.89 and closed at 77,460.09, showing a positive change of 1.21% from the previous close of 76,532.96. The highest point of the day was 77,549.92 and the lowest was 76,833.87, with a points change of 927.13.

Sensex Relationship with Key Moving Averages:
The current close of the Sensex at 77,460.09 is above its 10-EMA (76,581.31) and 20-EMA (77,026.28), indicating a short-term bullish trend. However, it is below the 50-EMA (78,208.70) and the 200-EMA (77,842.28), suggesting some longer-term resistance and slightly bearish pressure from a broader perspective.
Moving Averages Trend (MACD) and RSI:
The MACD line at -669.57 is above the MACD Signal line at -788.13, potentially suggesting the beginning of a bullish crossover, though it remains in the negative territory which indicates cautious optimism.

The RSI value is at 50.67, which is near the midpoint of the neutral range. This indicates that the stock market is neither overbought nor oversold, offering no strong directional bias.

Indices Performance for Nifty Auto - January 31, 2025:

Nifty Auto opened at 22,552.10, reached a high of 22,951.40, dropped to a low of 22,490.30, and finally closed at 22,903.10. The previous close was 22,586.35, resulting in a percentage change of 1.40% and a points change of 316.75.

Relationship with Key Moving Averages:
The Nifty Auto index is positioned below its 50-EMA (23,171.04) and 200-EMA (23,260.87), but above the 10-EMA (22,538.08) and 20-EMA (22,696.98). This setup suggests a short-term bullish trend, given the closing price above the shorter-term moving averages. However, being below the longer-term moving averages indicates potential resistance and an overall bearish outlook.
Moving Averages Trend (MACD):
The MACD value is -228.65, with a MACD Signal of -252.90. This negative MACD value reflects a bearish momentum, but since the MACD is above its signal line, it suggests a potential shift towards bullishness.

RSI Analysis:
The Relative Strength Index (RSI) is 51.43, indicating a neutral position slightly leaning towards bullishness, as it's above the midpoint of 50.

Indices Performance for Nifty Energy on January 31, 2025:

The opening price was 33,139.20, hitting a high of 33,950.90 and a low of 32,958.80, with the day closing at 33,942.35. The previous close was 32,607.85, leading to a percentage change of 4.09% with a points change of 1,334.50.

Relationship with Moving Averages:
The Nifty Energy is currently above its 10-EMA (33,400.14) but very close to its 20-EMA (33,939.18), indicating a slightly bullish trend. However, it is below the 50-EMA (35,471.24) and the 200-EMA (37,760.96), which reveals a long-term bearish trend. The proximity above the short-term EMAs suggests possible short-term bullish momentum, yet the overall lower position against longer-term EMAs hints at bearish undertones.
Moving Averages Trend (MACD):
The MACD is at -750.63 with the MACD Signal at -751.27. The minor difference between the MACD and its signal line suggests indecision, neither confirming strong bearish nor bullish momentum. It's crucial to observe if the MACD line can cross its signal upwards, potentially indicating a bullish shift.

RSI Analysis:
The RSI is at 47.41, indicating a neutral position. The index is neither overbought nor oversold, suggesting that the Nifty Energy might be in a consolidation phase. It is crucial to observe if the RSI moves above 50, supporting a bullish passage, or drops below 30 to confirm bearish sentiment.

Indices Performance for Nifty FMCG as of January 31, 2025:
The Nifty FMCG index opened at 55,572.45, reached a high of 56,790.75, and closed at 56,715.20. This signifies an impressive upward movement from the previous close of 55,163.05, showing a percentage change of 2.81% and a points change of 1,552.15.


Moving Averages Analysis:
The current close of Nifty FMCG is slightly below the 50-EMA but well above the 10-EMA and 20-EMA, indicating a short to medium-term bullish trend, though caution might be warranted due to its proximity below the 50-EMA. The index remains below the 200-EMA, suggesting the long-term trend might still be considered cautiously bearish despite the recent performance.
MACD:
The MACD value of -290.34 being greater than the MACD Signal of -344.86 suggests bullish momentum is developing. Crossovers like this indicate potential trend changes.

RSI:
The RSI is at 54.67, placing it in the neutral zone. This suggests that the Nifty FMCG doesn't appear overbought or oversold, thereby supporting the possibility of sustained bullish movement if other indicators align.

Nifty Infra Indices Performance on January 31, 2025:
The Nifty Infra index opened at 8261.05, reached a high of 8362.90, and closed at 8360.10. This represented a 2.41% change from the previous close of 8163.75, with a points change of 196.35.


Key Moving Averages:
Nifty Infra is currently positioned near its 10-EMA of 8255.29 and 20-EMA of 8317.06, suggesting consolidation in the short term. The index is below the 50-EMA of 8496.88 and the 200-EMA of 8554.47, indicating a broader bearish trend despite the recent positive movement.
MACD Analysis:
The MACD value of -91.07 is higher than its signal line at -100.93, showing signs of an attempting reversal in momentum. This may indicate a potential bullish crossover if the trend continues.

RSI Analysis:
The Relative Strength Index (RSI) is at 49.85, positioning itself in a neutral zone. This suggests neither overbought nor oversold conditions, thereby supporting a wait-and-watch approach for potential investors.

Indices Performance for Nifty IT on January 31, 2025:
The Nifty IT index opened at 42,586.10, reached a high of 42,967.75, and closed at 42,754.55. It recorded a minor decrease of 0.37% from the previous close, with a points change of -159.95.


Nifty IT Moving Averages Analysis:
The Nifty IT's current price is trading below the 50-EMA (43,178.17) and 20-EMA (42,989.97), indicating a potential bearish trend. However, it is closely aligned with the 10-EMA (42,711.60), suggesting that recent movements have slightly tempered the bearish momentum.
Technical Indicators Analysis:
1. MACD: The MACD value of -340.04 compared with its signal line at -323.65 suggests a bearish convergence pattern, indicating a potential downtrend.

2. RSI: With an RSI of 47.49, the index is near the neutral zone. This suggests neither overbought nor oversold conditions, thus providing indecisive signals on the continuation of the trend.

Stock Analysis for Nifty Metal on January 31, 2025
Indices Performance:


The Nifty Metal index opened at 8278.80, reached a high of 8409.20, and closed at 8398.85. The performance shows a 1.09% increase in value from the previous close.
Moving Averages Relationship:
The current closing price of the Nifty Metal index is 8398.85, which is above the 10 EMA of 8367.24 but below the 20 EMA of 8455.44, the 50 EMA of 8724.54, and the 200 EMA of 8893.54. This suggests a short-term bullish trend due to the price being above the 10 EMA, but the longer-term trend appears bearish as the price remains below the longer EMAs.
Moving Averages Trend (MACD):
The MACD value of -134.07 compared with its signal line value of -150.29 indicates a limited bullish momentum as MACD is rising and approaching the signal line. The negative MACD values, however, suggest an overall bearish trend.

RSI Analysis:
The RSI stands at 45.51, which is below the neutral level of 50, indicating that the asset is neither overbought nor oversold. This position signifies a lack of strong momentum either way, but the asset is closer to the oversold boundary, which might attract buyers.

Indices Performance for Nifty Bank on January 31, 2025
The Nifty Bank index opened at 49,259.65, reached a high of 49,674.80, and a low of 49,031.80 before closing at 49,619.55. This shows an increase of 0.92% from the previous close of 49,165.95, marking a change of 453.60 points.


Relationship with Key Moving Averages (EMA)
The stock is trading close to its 10-EMA (48,971.08) and 20-EMA (49,328.25), suggesting a short-term recovery. However, it is still below the 50-EMA (50,310.93) and the 200-EMA (50,234.44), indicating underlying bearish momentum in the long-term.
Moving Averages Trend (MACD)
The MACD is at -574.17 and the MACD Signal at -731.88; this crossover indicates a bullish trend may be forming, as the MACD is moving closer to the signal line.

RSI Analysis
The RSI stands at 49.93, signaling a neutral momentum in the stock without a significant overbought or oversold condition, suggesting that the stock might experience minor fluctuations.

Nifty 50 Indices Performance on January 31, 2025:
The stock opened at 23,296.75, with a high at 23,546.80, a low at 23,277.40, and closed at 23,533.75. The previous close was 23,163.10, showing a percentage change of 1.60% with a points change of 370.65.

Key Moving Averages Analysis:
The Nifty 50 is currently positioned above the 10 EMA of 23,206.60 and the 20 EMA of 23,332.49 but is slightly below the 50 EMA of 23,698.21 and the 200 EMA of 23,627.97. This suggests that while the short-term trend indicates a bullish move, the stock faces resistance from the medium to long-term moving averages, indicating a mixed trend with potential bearish pressure if the stock does not break above these levels.

RSI Analysis:
The Relative Strength Index (RSI) is at 52.28, which is a neutral level, suggesting neither overbought nor oversold conditions. This indicates potential stability, allowing room for the trend to be decided by other factors, such as price movements or breaking moving average thresholds.

MACD Trend Explanation:
The MACD is at -193.32, with its signal line at -231.70, indicating a bullish crossover as the MACD is above the signal line. This suggests potential upward momentum; however, the negative values also highlight prevailing bearish tendencies, signaling the need for vigilance as the trend may shift quickly.

Up Next
Indian stock market sector-wise performance today - January 31, 2025

Honda Activa 6G: Everything You Need to Know Before Buying

How much does a ULIP plan really cost? A break-down of all charges

Centre plans to borrow Rs 8.20 lakh cr from market in first half of FY27

Reliance denies buying Iranian oil amid US sanctions waiver

Premium petrol price up Rs 2, industrial diesel up Rs 22; no change in normal petrol, diesel rates

More videos

India's GDP expected to register over 8 pc growth in Sep-Dec: Report

Govt announces seven measures to help boost exports

RBI keeps interest rates on hold after US trade deal boosts outlook

RBI proposes to compensate customers up to Rs 25,000 loss due to fraud

RBI raises GDP growth projection of Q1, Q2 of FY27

RBI pauses rate cuts, retains interest rate at 5.25 pc

Rupee jumps 122 paise to close at 90.27 against US dollar on India-US trade deal

Stock markets cheer India-US trade deal: Sensex, Nifty surge 2.5 pc

UPI transactions hit record high of Rs 230 lakh crore in 2025-26 till Dec: Govt

Explained: India-US trade deal, tariffs and trade benefits