


Highlights
- Mixed emotions with certain indices like IT and Energy witnessing uptrends
- Weak RSI across most indices implies caution
- Negative MACD values across the board suggest a bearish sentiment still looms
Latest news

Oppo Enco Buds3 Pro+ Review: ANC That Actually Works Under ₹2,500

Permission denied for Vijay Hazare trophy match at Chinnaswamy Stadium on December 24

Protesters march to Bangladesh Deputy High Commission in Kolkata to protest violence on Hindus

BJP’s national working president Nitin Nabin leads roadshow in Patna

Bangladesh summons Indian envoy over security concerns for missions

Passenger beaten by off-duty Air India Express pilot suffers nasal fracture, seeks justice

Over 270 flights delayed, 10 cancelled at Delhi airport

Fresh snowfall, rain hit parts of Kashmir as temperatures stay above freezing point
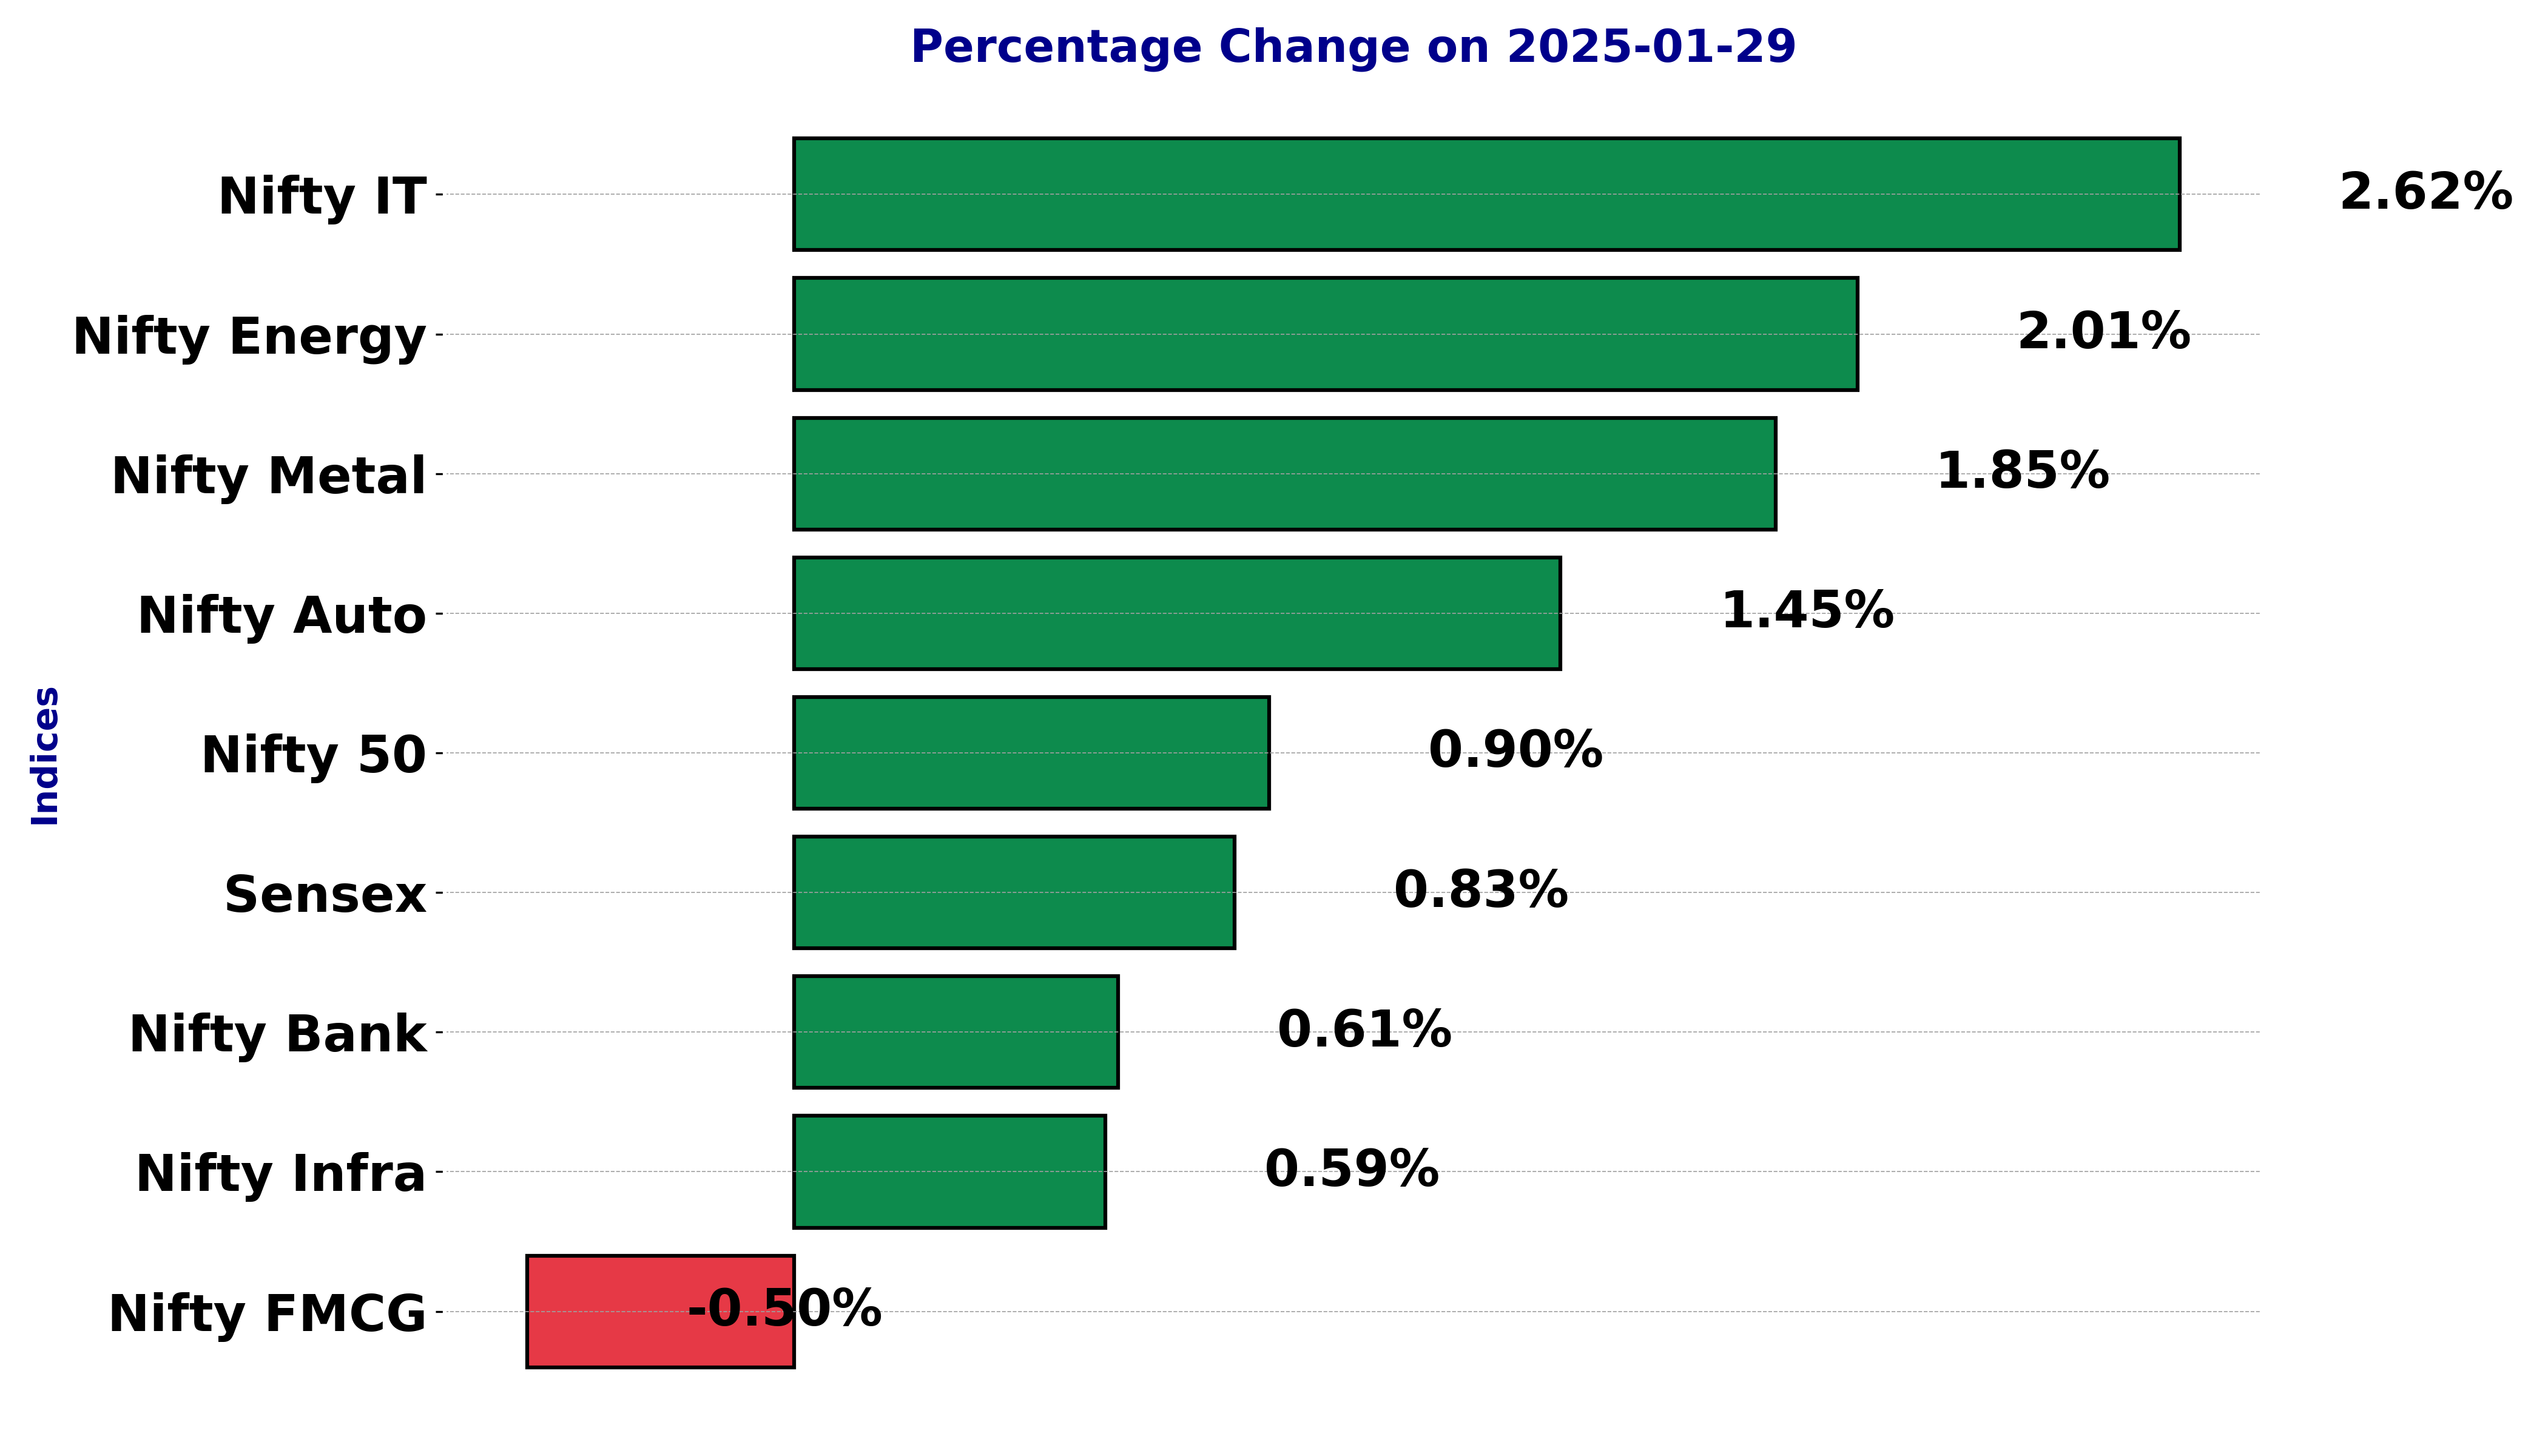
Indian stock market sector-wise performance today - January 29, 2025


The national stock market indices showed varied performances on January 29, 2025, reflecting the economic sentiment.
In this article, we analyze the performance of key national indices including the Nifty 50,Nifty Bank,Nifty IT,Nifty Auto,Nifty Pharma,Nifty FMCG,Nifty Infra,Nifty Energy and Nifty Metal.
Stock Performance for BSE Sensex on January 29, 2025:
The stock opened at 76,138.24, reached a high of 76,599.73, and a low of 75,975.80, before closing at 76,532.96. This represents a percentage change of 0.83% from the previous close of 75,901.41, with a points change of 631.55.


Relationship with Key Moving Averages:
The current price is below both the 50-EMA (78,239.25) and the 200-EMA (77,845.60), suggesting a bearish trend. However, it is above the 10-EMA (76,386.02) but below the 20-EMA (76,980.61), indicating a short-term recovery amid a longer-term downward trend.
Technical Indicators:
MACD Analysis: The MACD is at -805.82 with a signal line at -817.78, which indicates a bearish momentum in the market. The negative value confirms the ongoing bearish trend but the closeness to the signal line suggests a possible trend change.

RSI Analysis: The RSI is currently at 43.95, which suggests that the stock is neither overbought nor oversold. This neutral position suggests limited upside potential without a strong bullish catalyst.

Stock Performance for NIFTY AUTO on January 29, 2025:
The NIFTY AUTO opened at 22,299.0 and closed at 22,586.35. It had a high of 22,707.55 and a low of 22,269.95, with a percentage change of 1.45% and a points change of 322.20 from the previous close of 22,264.15.

The current 10 EMA is 22,456.96, the 20 EMA is 22,675.28, the 50 EMA is 23,181.98, and the 200 EMA is 23,264.17. The stock is trading slightly above its 10 and 20 EMA, which might indicate a short-term bullish trend. However, it is below the 50 and 200 EMA, suggesting a longer-term bearish trend. Therefore, the short-term momentum could be upward, but longer-term resistance is still significant, implying cautious optimism.

Technical Indicators: MACD and RSI
The MACD is at -281.30 with a signal line at -258.96, indicating a bearish divergence, which suggests that the downward momentum may continue unless we see a crossover. The RSI is currently at 46.59, which is below the neutral 50 mark, indicating that the stock is neither overbought nor oversold and might be seeing some consolidation around current levels.

The current MACD trend suggests a bearish sentiment continuing as the MACD line is below the signal line. RSI value being near the midpoint, suggests that the stock is lacking strong momentum in either direction but is closer to being oversold, which might attract buyers if it dips further.

Stock Performance for NIFTY ENERGY on January 29, 2025:
Opening at 32,086.35, NIFTY ENERGY reached a high of 32,663.00 and closed at 32,607.85. This represents a 2.01% increase from the previous close of 31,966.10, with a points change of 641.75. 

Relationship with Key Moving Averages:
The stock's current price is below its short-term 10-EMA (33,279.65) and 20-EMA (33,938.84), indicating a bearish trend in the short-term. It is also below the 50-EMA (35,533.64) and 200-EMA (37,799.16), reinforcing the overall downward trend.
RSI Analysis:
The RSI is at 36.31, suggesting that the stock is approaching oversold territory, which may indicate a potential reversal if buying pressure increases. 
MACD Analysis:
The MACD is at -854.92, with the MACD Signal at -751.44. This negative divergence between MACD and its Signal Line indicates bearish momentum in the market, pointing towards continued weak performance in the near term. 
Technical Analysis for NIFTY FMCG - January 29, 2025
Stock Performance:
On January 29, 2025, the NIFTY FMCG opened at 55,444.80, reached a high of 55,673.90, and fell to a low of 54,757.00 before closing at 55,163.05. The stock experienced a decline of 278.90 points from the previous close of 55,441.95, marking a percentage change of -0.50%.


Relationship with Key Moving Averages:
The stock's current price is below its 10-EMA (55,685.36), 20-EMA (55,985.99), 50-EMA (56,880.70), and 200-EMA (57,819.90). This positions the stock in a bearish trend as it trades below these key moving averages.
Moving Averages and MACD Analysis:
The Moving Average Convergence Divergence (MACD) value is -396.50, indicating a bearish trend as it is below the MACD Signal line of -358.49. This negative MACD reflects the downward momentum in the stock's price.

RSI Analysis:
The Relative Strength Index (RSI) is at 37.98, which is below the neutral level of 50, suggesting that the stock might be oversold. This indicates a potential for a price reversal if buying pressure emerges.

Technical Analysis for NIFTY INFRA on January 29, 2025:
Stock Performance:
The stock, NIFTY INFRA, opened at 8130.30, reached a high of 8187.65, and a low of 8095.95, and closed at 8163.75. The previous close was 8116.05, resulting in a % change of 0.59% and a points change of 47.70. The trading volume for the day was 0, indicating possible low liquidity for the day.


Relationship with Key Moving Averages:
The current close is below the 10-EMA (8232.00), 20-EMA (8312.53), 50-EMA (8502.47), and 200-EMA (8556.34). This indicates a bearish trend, as the stock is trading below its significant moving averages.
Relative Strength Index (RSI):
The RSI is at 39.66, which is below the neutral level of 50. This suggests that the stock might be in the oversold region, possibly indicating a buying opportunity. 
MACD Analysis:
The MACD is at -107.95 and the signal line is at -103.39, indicating a bearish momentum as the MACD is below the signal line. 
Stock Performance for NIFTY IT on January 29, 2025:
NIFTY IT opened at 42,052.0, reached a high of 42,968.4, and a low of 42,051.6, finally closing at 42,914.5. The previous close was 41,820.6, marking a percentage change of 2.62% with a points change of 1,093.85.


Moving Averages Relationship:
NIFTY IT is trading below its 50-EMA (43,195.46) but above the 10-EMA (42,702.05) and the 200-EMA (40,533.61), indicating a mixed trend. The stock's position relative to the EMAs suggests potential bullish momentum if it continues to rise above the shorter EMAs while breaking past its 50-EMA.
MACD Analysis:
The MACD value is -365.96 with a signal line at -319.56, indicating that the stock is under bearish momentum. The negative MACD suggests bearish sentiment; however, as it approaches the signal line, this could change if the trend reverses.

RSI Analysis:
The RSI stands at 48.48, which is generally considered neutral, indicating that the stock is neither overbought nor oversold. This neutral RSI suggests potential room for movement in either direction depending on further market influences.

Stock Performance for NIFTY METAL on January 29, 2025:
NIFTY METAL opened at 8183.05, reached a high of 8321.55, and closed at 8308.65. There was a notable increase from the previous close of 8157.45, marking a percentage change of 1.85% with a points change of 151.20. Volume traded was 0.0, indicating no transactions recorded for this period.


Relationship with Key Moving Averages:
The current price of NIFTY METAL stands at 8308.65, which is below the 10-EMA (8360.22), 20-EMA (8461.40), 50-EMA (8737.83), and 200-EMA (8898.45). This positioning indicates a bearish trend as the price is below all significant short to long-term EMAs.
Moving Averages Trend (MACD) and RSI:
The MACD is currently positioned at -146.52, and the signal line is at -154.34. With the MACD line being higher than the signal line, there is a potential impending bullish crossover. While this demonstrates some bullish momentum, overall sentiment remains bearish due to the price's position relative to moving averages.
The RSI is at 42.08, suggesting that the stock is neither overbought nor oversold, hovering around the mid-range. This neutral RSI level may not signify a strong trend direction but indicates the stock has some room before reaching critical RSI levels.
NIFTY BANK Stock Performance for January 29, 2025
On January 29, 2025, the NIFTY BANK opened at 48,997.20, achieved a high of 49,199.65, a low of 48,849.80, and closed at 49,165.95. The previous close was 48,866.85, resulting in a positive change of approximately 0.61%, which equates to a gain of 299.10 points. Notably, the trading volume was at 0.0, suggesting no new shares were traded on this particular day.


Relationship with Key Moving Averages
The NIFTY BANK's current closing price of 49,165.95 positions it below the 20-EMA of 49,297.58 but above the 10-EMA of 48,826.98, indicating mixed market sentiments. Furthermore, the stock is trading below both the 50-EMA of 50,339.15 and the 200-EMA of 50,240.26, which supports a bearish longer-term trend.
MACD and RSI Analysis
The MACD value of -681.84, when compared to its signal of -771.31, suggests a bearish momentum may be softening, as the indicator is moving towards converging with its signal line.

The RSI stands at 46.04, which is below the typical neutral level of 50, thereby underscoring a mildly bearish outlook in the recent past, though not in oversold territory yet.

Stock Performance for NIFTY 50 on January 29, 2025:
NIFTY 50 opened at 23,026.75 and had a high of 23,183.35, a low of 22,976.50, and closed at 23,163.10. The previous close was 22,957.25, indicating a percentage change of 0.897% with a points change of 205.85.


Moving Averages and Trend (Bullish or Bearish):
The stock is currently trading above its 10-EMA (23,133.91) but below the 20-EMA (23,311.31), 50-EMA (23,704.92), and 200-EMA (23,628.76). This indicates a short-term bullish trend; however, the mid to long-term indicators suggest a potential bearish trend due to the prices being below these moving averages.
RSI Analysis:
The RSI (Relative Strength Index) is at 43.59, which is slightly below the neutral level of 50. This suggests that the stock is neither overbought nor oversold, hinting at a possible consolidation phase or slight bearish momentum.

MACD Analysis:
The MACD is currently at -240.25 with the MACD Signal at -241.30. The MACD line being slightly above the signal line indicates a weak bullish cross, though both are in negative territory, suggesting the momentum may still be weak or bearish.

Up Next
Indian stock market sector-wise performance today - January 29, 2025

New Zealand commits USD 20 bn investment in India under FTA in 15 yrs; on lines of EFTA pact

India, New Zealand conclude FTA talks; pact to offer duty-free access, USD 20 bn FDI

FTA with New Zealand to significantly deepen bilateral economic engagement: Govt

Rupee breaches 91-mark against US dollar for first time in intra-day trade

Microsoft commits USD 17.5 billion investment in India: CEO Satya Nadella

More videos

CBI books Anil Ambani's son, Reliance Home Finance Ltd. in Rs 228 crore bank fraud case

RBI raises FY26 GDP growth projection to 7.3 pc

RBI trims policy interest rate by 25bps to 5.25pc, loans to get cheaper

Rupee slumps to all-time low of 90.25 against US dollar in intra-day trade

Reliance completes merger of Star Television Productions with Jiostar

India to lead emerging market growth with 7pc GDP rise in 2025: Moody’s

Nifty hits record high after 14 months; Sensex nears all-time peak

Reliance stops Russian oil use at its only-for-export refinery to comply with EU sanctions

ED attaches fresh assets worth over Rs 1,400 cr in case against Anil Ambani's Reliance Group

India signs one-year deal to import 2.2 million tonnes of LPG from US