Highlights
- Nifty IT saw the largest decline of -4.18%
- CNX Auto dropped by -3.92%, impacting sector
- Nifty FMCG decreased by -2.62%, notable dip
Latest news

CEO among three held for gangrape of woman IT firm manager in Udaipur

PM Modi says government reforms to continue with greater vigour, focusing on ‘Ease of Living’

Reflation, possible earnings revival to push Indian equities higher through 2026: Report

Declassified US documents reveal US, Russia 'nervous' over Pakistan's nuclear proliferation

Delhi Environment Minister warns pollution could spike again amid western disturbances

China hits out at Pentagon report alleging bid to weaken US-India ties

Four VHP, Bajrang Dal members arrested for Christmas vandalism in Assam school

'Papa, I cannot bear pain': Indian-origin man dies after 8-hour wait at Canada hospital
Indian stock market sector-wise performance today - February 28, 2025

The stock market faced a significant downturn today (February 28, 2025), with key indices across various sectors experiencing notable declines.
The Nifty IT index suffered the steepest drop, falling -4.18%, making the technology sector the hardest hit.
The Nifty Auto index followed closely, registering a sharp decline of -3.92%, indicating challenges in the automotive sector.
The Nifty FMCG index saw a decline of -2.62%, reflecting pressures in the fast-moving consumer goods sector, while the Nifty Energy index dropped -2.09%, highlighting weakness in energy-related stocks. The Nifty Infrastructure index was also impacted, falling -2.06%.
Among the broader market indices, the BSE Sensex declined by -1.90%, signaling a widespread bearish sentiment. Similarly, the Nifty 50 index fell -1.86%, mirroring the overall market downturn.
The Nifty Metal index showed a relatively smaller decline of -1.39%, while the Nifty Bank index exhibited some resilience, limiting its losses to -0.82%.
The steep decline in Nifty IT can be attributed to global economic uncertainties, potential regulatory changes, and investor sentiment shifting away from tech stocks.
Concerns over interest rate hikes and inflation continue to weigh on the growth outlook for IT companies, adding to the sector’s volatility.
Overall, today's session was marked by widespread declines, with technology stocks being the most affected, driving a broader negative sentiment across the market.

Analysis for Sensex - February 28, 2025

Sensex Performance: The Sensex opened at 74,202.77, reaching a high of 74,282.43 and a low of 73,141.27, closing at 73,198.10, which represents a decline of 1.90%. The price change indicates a drop of 1,414.33 points compared to the previous close of 74,612.43. The technical indicators suggest bearish momentum with an RSI of 24.40 and a negative MACD of -842.82.

Relationship with Key Moving Averages
The Sensex closed at 73198.10, which is below its 50-day EMA of 76957.47, 200-day EMA of 77540.26, 10-day EMA of 74999.87, and 20-day EMA of 75727.35. This indicates a bearish trend as it is trading below these key moving averages.
Moving Averages Trend (MACD)
MACD Analysis for Sensex: The MACD value of -842.82 indicates a bearish trend in the market as it is below the signal line value of -594.72. This divergence suggests that the market momentum is negative and may continue to see selling pressure.

RSI Analysis
RSI Analysis for Sensex: The Relative Strength Index (RSI) for Sensex is at 24.40, which is below the typical oversold threshold of 30. This suggests that the index might be experiencing bearish momentum and could potentially be undervalued in the short term. Investors may consider this as a signal for possible buying opportunities if they anticipate a market reversal.

Analysis for Nifty Auto - February 28, 2025

Nifty Auto Performance: Nifty Auto experienced a significant decline with a closing at 20,498.60, which is a decrease of 836.75 points or -3.92% from the previous close of 21,335.35. The RSI is at 25.96, indicating it is in the oversold territory. Key moving averages such as the 50 EMA and 200 EMA are above the current price, suggesting a bearish trend. The MACD and Signal Line also indicate negative momentum.

Relationship with Key Moving Averages
Nifty Auto closed below its key moving averages, with a closing value of 20498.60, which is beneath the 50 EMA of 22605.37, the 200 EMA of 23084.24, the 10 EMA of 21596.27, and the 20 EMA of 22006.75. This suggests a bearish trend as the index is not only below short-term averages but also significantly below long-term averages.
Moving Averages Trend (MACD)
The MACD for Nifty Auto is at -458.91, which indicates a bearish momentum as it is below the MACD Signal line of -306.93. This suggests that the selling pressure in the market is currently strong, and the trend may continue downward unless there's a significant reversal.

RSI Analysis
The RSI value for Nifty Auto is 25.96, indicating that it is currently in the oversold territory. An RSI below 30 typically suggests that the stock may be undervalued and due for a potential upward correction. Investors might consider this as a signal for a potential buying opportunity, but it's essential to evaluate other indicators and market conditions.

Analysis for Nifty Energy - February 28, 2025

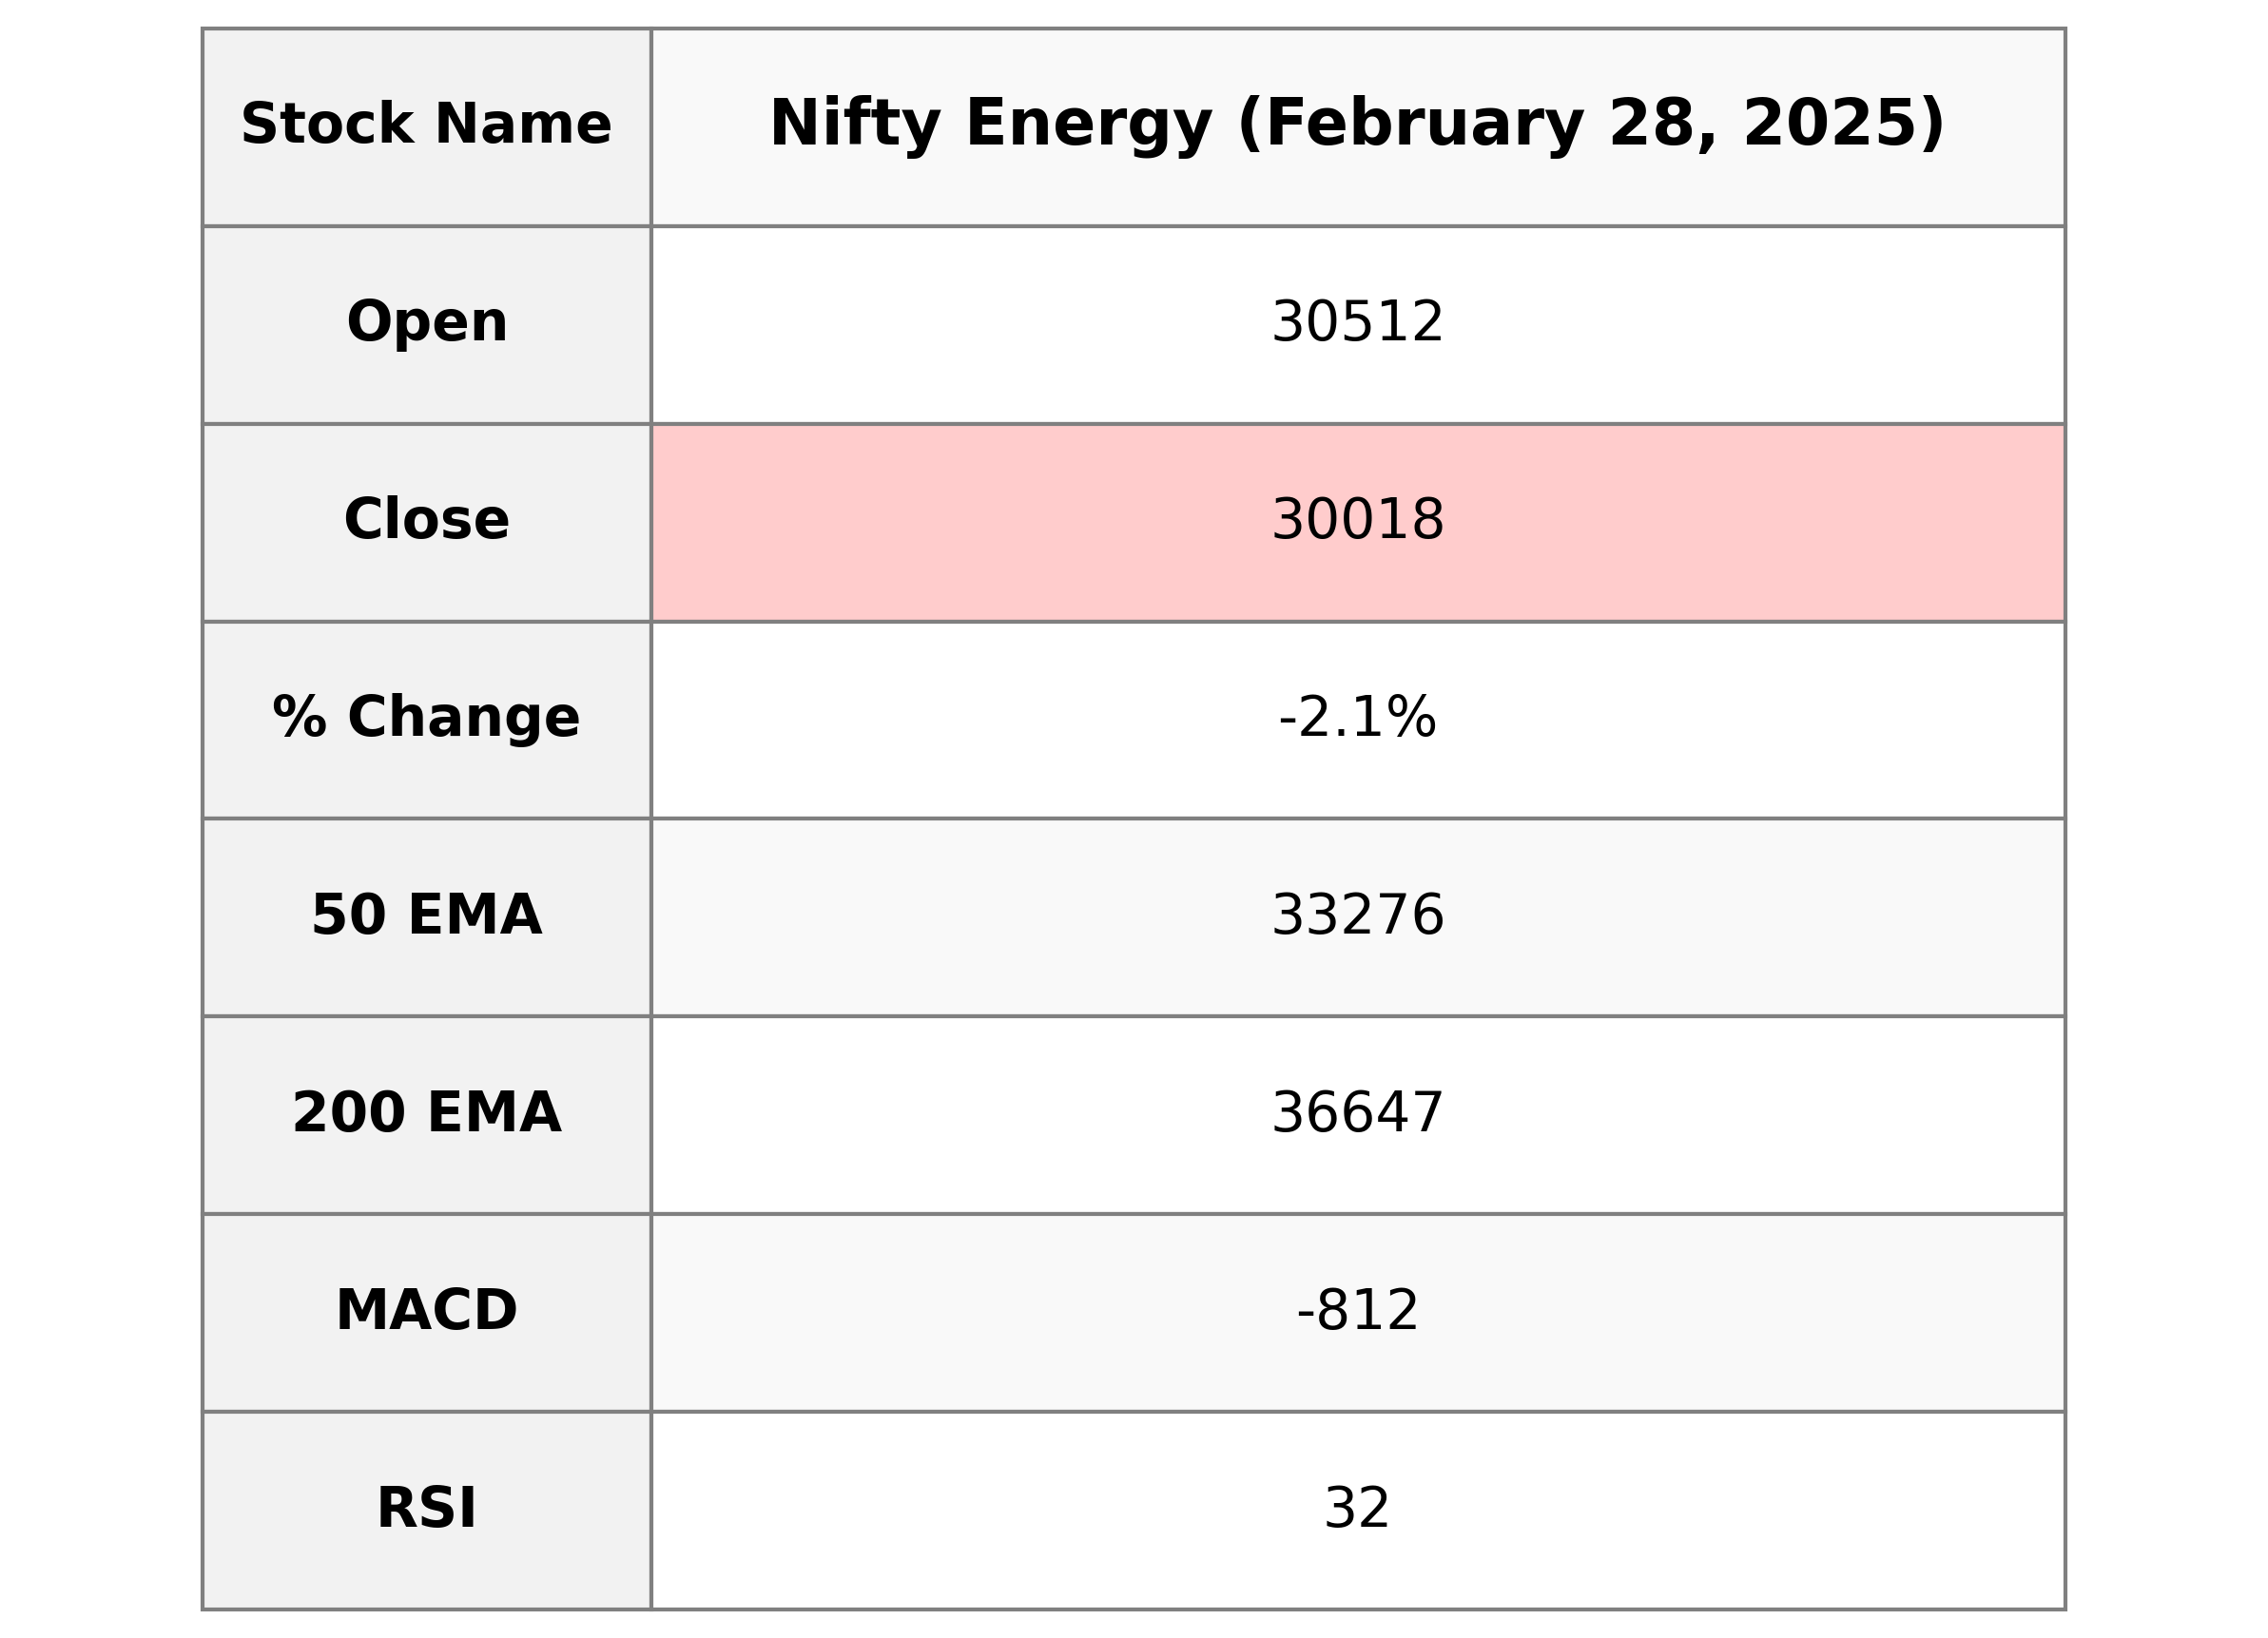
The Nifty Energy index opened at 30,511.5 and closed at 30,018.15, showing a decrease of 641.10 points, or -2.09%, from the previous close of 30,659.25. The index's RSI of 32.15 suggests it might be in the oversold territory, while the MACD value of -811.70 indicates a bearish trend. The trading volume was not specified.

Relationship with Key Moving Averages
Based on the provided data, Nifty Energy closed well below its key moving averages, with the 50 EMA at 33276.16, the 20 EMA at 31623.95, and the 10 EMA at 31038.34. This indicates a bearish trend as the current close of 30018.15 is lower than these moving averages.
Moving Averages Trend (MACD)
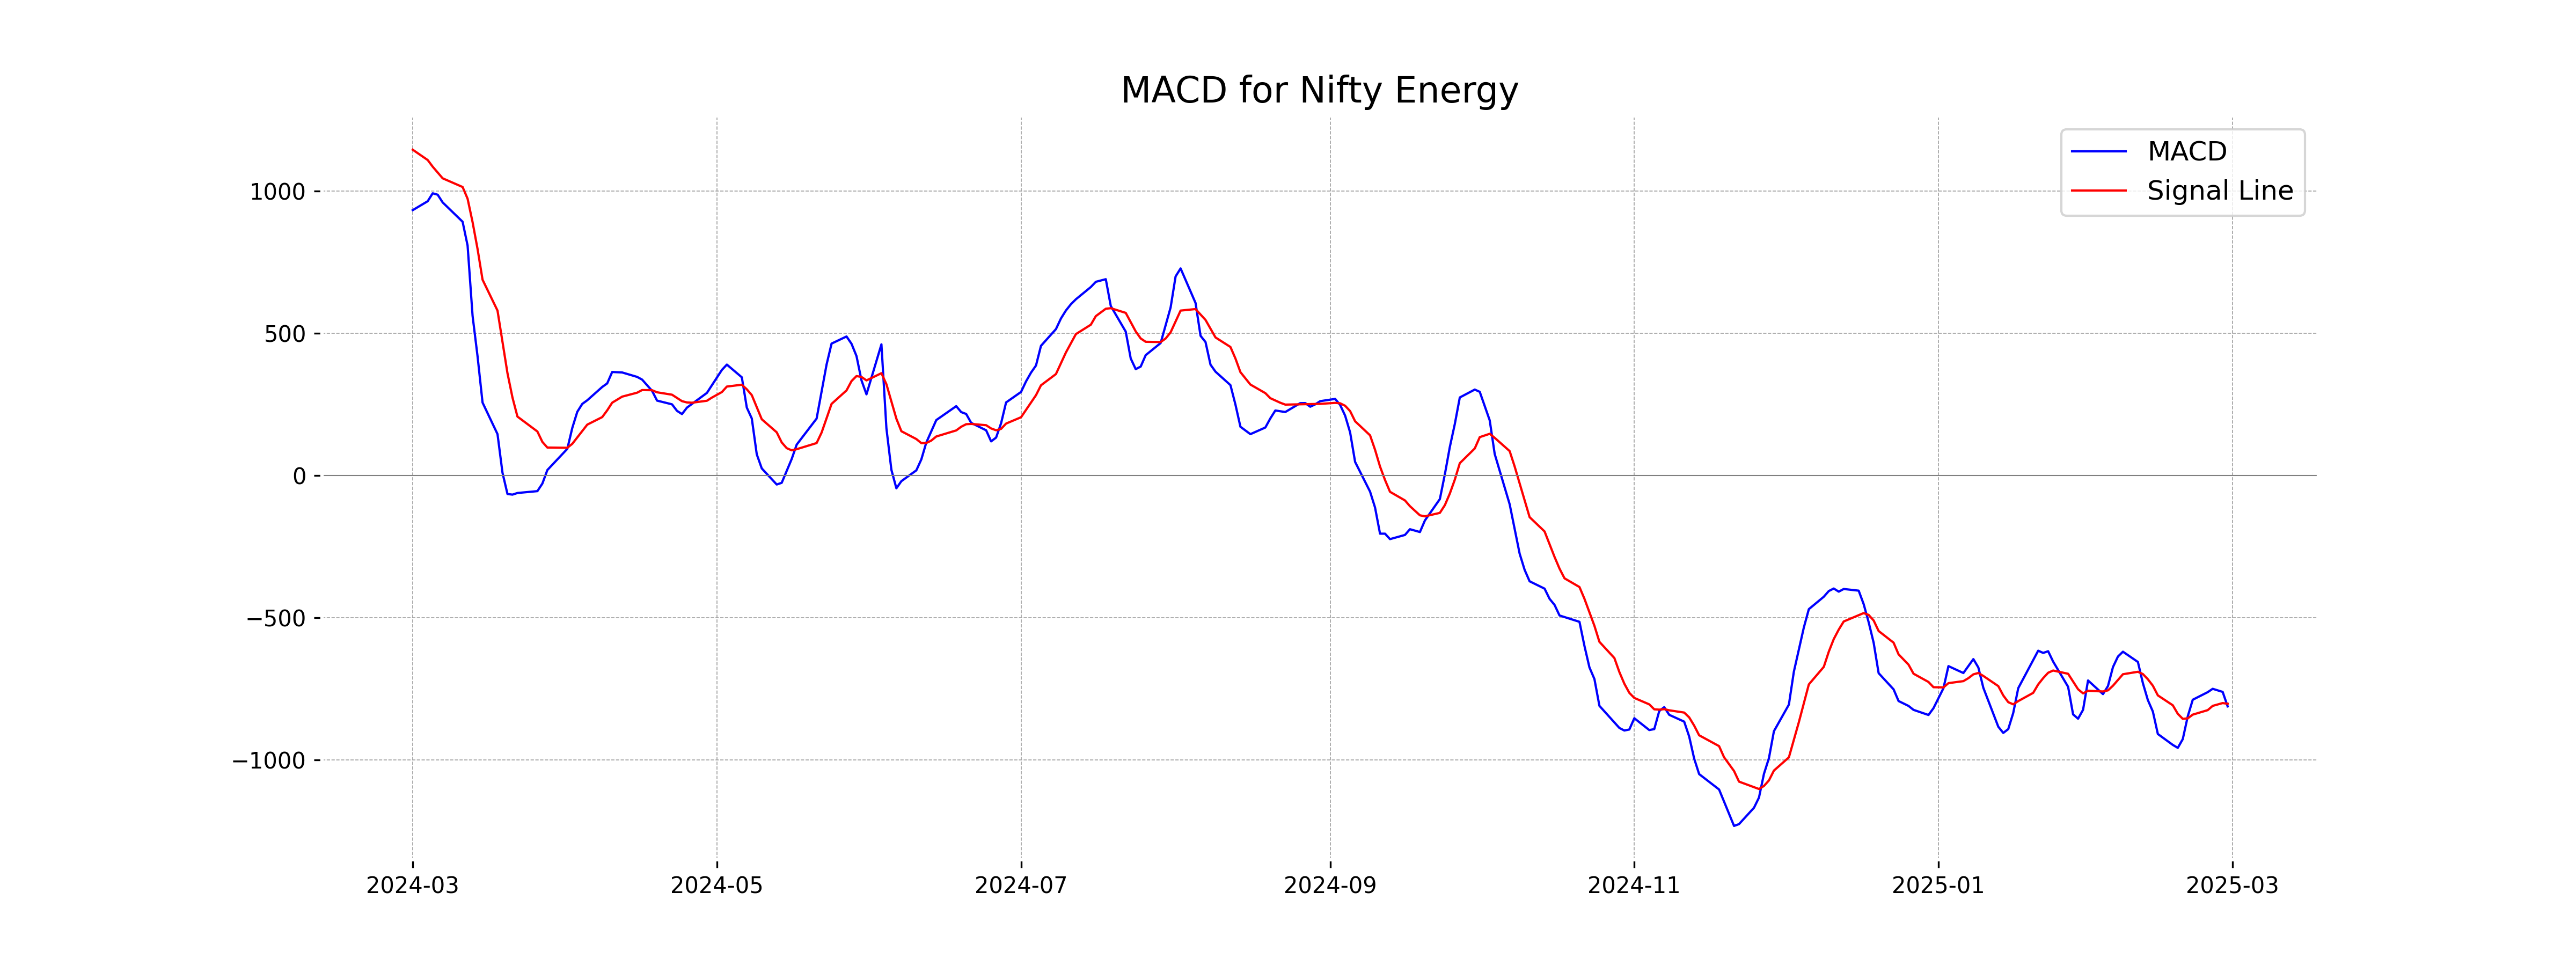
### Nifty Energy MACD Analysis The MACD for Nifty Energy is currently at -811.70, which is below its signal line of -802.35. This indicates a bearish trend, suggesting that the stock may continue to see downward momentum in the near future.

RSI Analysis
Nifty Energy RSI Analysis: The RSI (Relative Strength Index) of 32.15 indicates that Nifty Energy is approaching an oversold condition. An RSI below 30 typically signals that the asset might be undervalued and could be due for a price correction or rebound. Investors should watch for potential buying opportunities, although further confirmation from other indicators might be prudent.

Analysis for Nifty FMCG - February 28, 2025

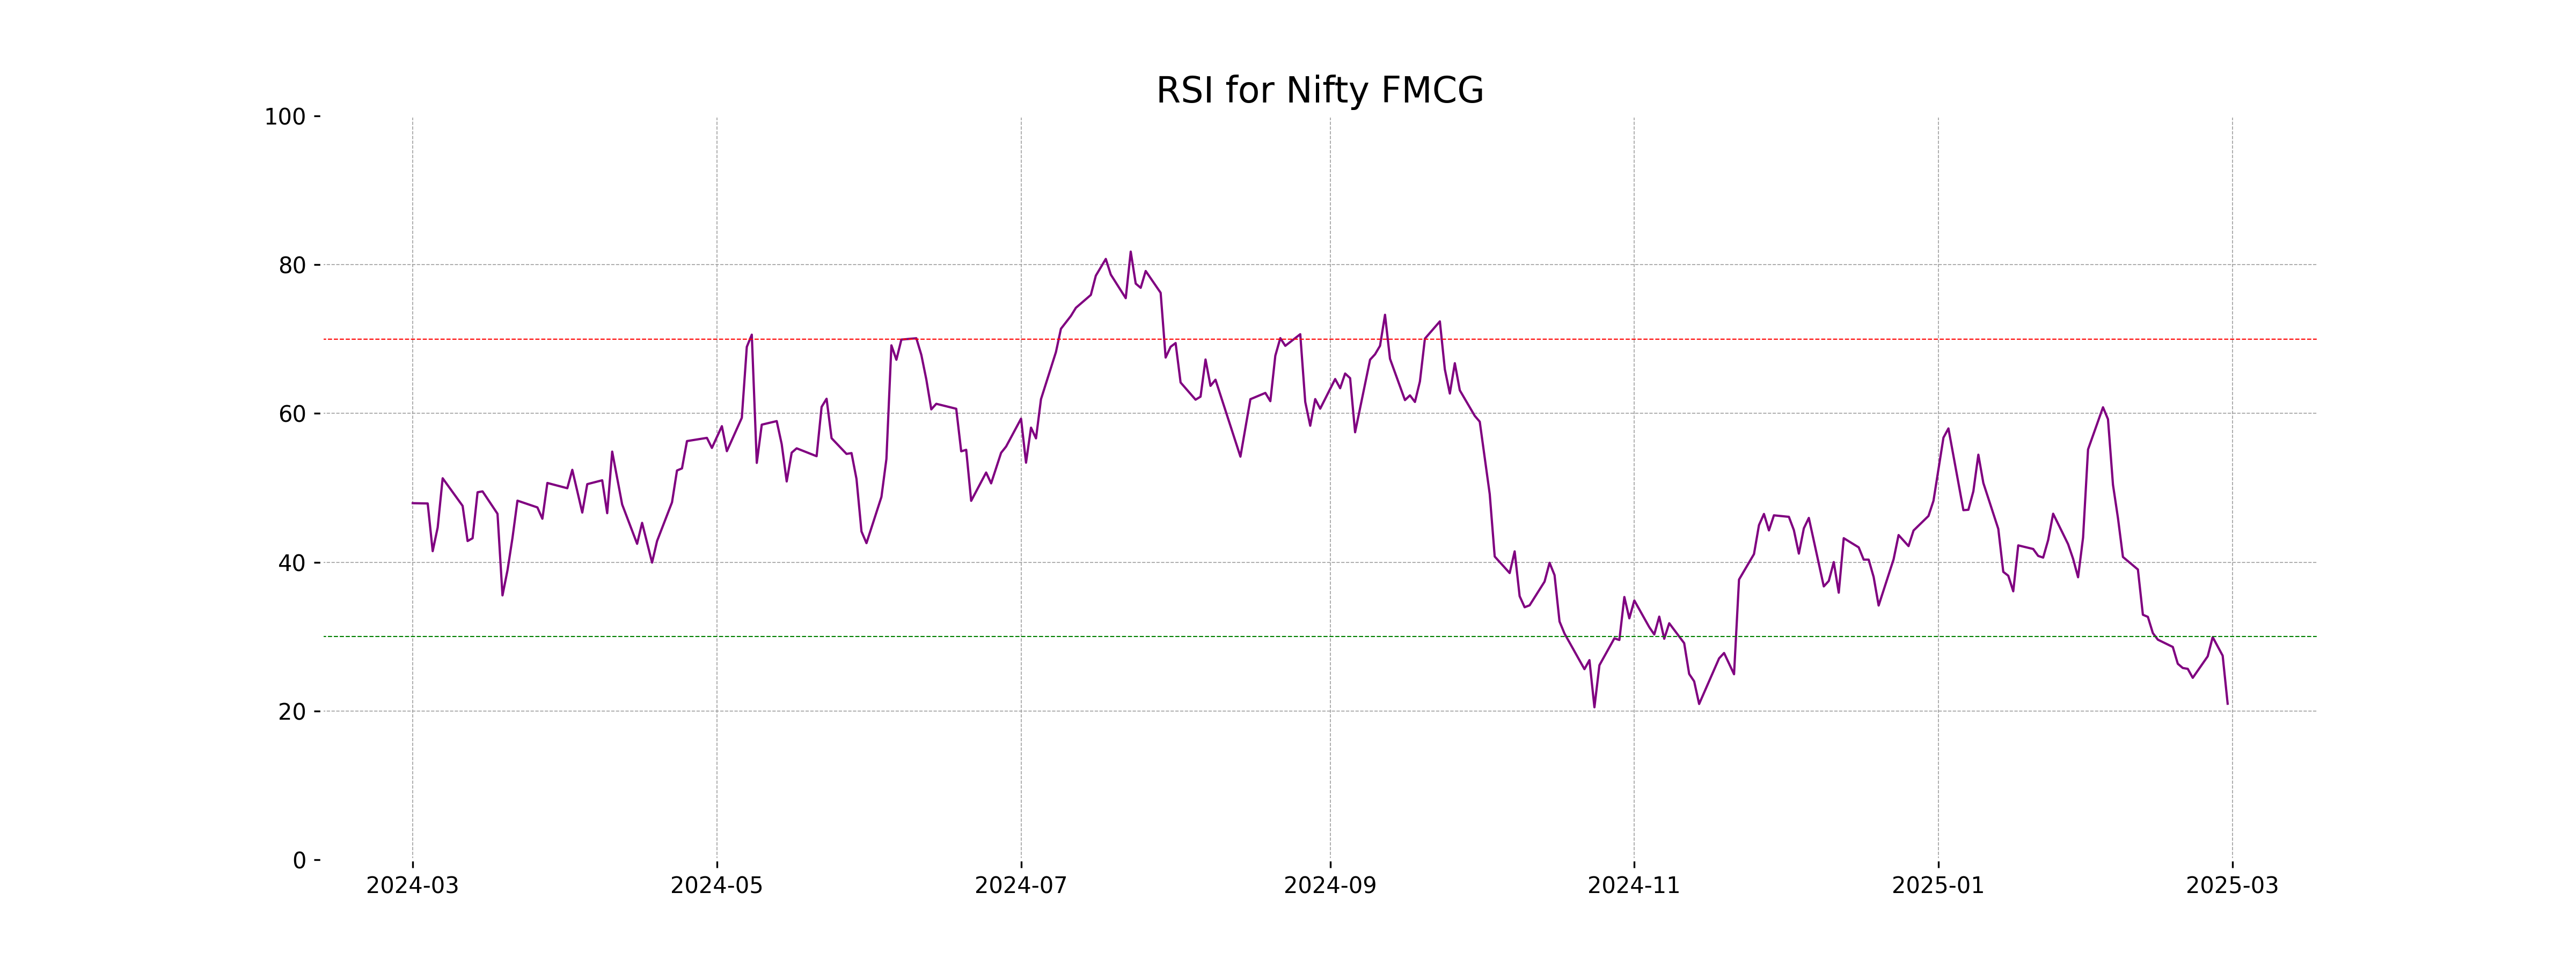
Nifty FMCG Performance: Nifty FMCG opened at 51,796.65 and closed at 50,689, reflecting a decrease of approximately 2.62% from its previous close of 52,055.15. The RSI of 20.98 suggests that the index may be oversold. Furthermore, the MACD of -1161.24 compared to the MACD Signal of -972.07 indicates a bearish momentum in the short term.

Relationship with Key Moving Averages
The Nifty FMCG index has closed at 50,689, which is significantly below its 50 EMA of 54,970 and 200 EMA of 57,069, indicating a bearish trend. With a 10 EMA of 52,372 and a 20 EMA of 53,329, the short-term moving averages demonstrate a downward crossover, reinforcing negative momentum.
Moving Averages Trend (MACD)
The MACD for Nifty FMCG indicates a bearish trend as it is negative at -1161.2365, and it is below the MACD Signal line at -972.0674. This suggests a potential continuation of the current downward momentum for the stock index.

RSI Analysis
The RSI for Nifty FMCG is currently at 20.98, indicating that the index is in the oversold territory. An RSI below 30 typically suggests that an asset or index is undervalued and may be a good opportunity for buyers to consider. However, further analysis is recommended.

Analysis for Nifty Infra - February 28, 2025

Nifty Infra opened at 7793.70 and closed at 7665.55, showing a decline of -2.07%. The index experienced a points change of -161.70, with a notable drop from the previous close of 7827.25. Technical indicators suggest bearish momentum, with an RSI of 27.84 and a negative MACD divergence.

Relationship with Key Moving Averages
The Nifty Infra closed at 7665.55, which is below the 10 EMA (7902.59), 20 EMA (8007.50), 50 EMA (8226.96), and 200 EMA (8460.46). This indicates a bearish position in relation to its key moving averages, suggesting potential downward momentum.
Moving Averages Trend (MACD)
Based on the data provided, Nifty Infra is showing bearish momentum as indicated by the negative MACD of -131.26, which is below the MACD Signal line of -109.91. This suggests that selling pressure may continue in the short term.

RSI Analysis
The RSI value for Nifty Infra is 27.84, which indicates that the stock is currently in the oversold territory. This suggests the potential for a price reversal or a buying opportunity, as RSI values below 30 generally suggest that the stock is oversold.

Analysis for Nifty IT - February 28, 2025

Nifty IT faced a significant decline, closing at 37,318.30, down from the previous close of 38,946.65, marking a 4.18% decrease. The RSI of 19.59 indicates that the index is in the oversold territory, while a negative MACD suggests bearish momentum. With no trading volume reported, there is additional uncertainty surrounding these movements.

Relationship with Key Moving Averages
The Nifty IT index closed significantly below all key moving averages, including the 10 EMA, 20 EMA, 50 EMA, and 200 EMA, indicating a bearish trend. The current close of 37,318.3 is particularly below the 50 EMA of 41,937.54 and the 200 EMA of 40,669.76, suggesting strong downward momentum.
Moving Averages Trend (MACD)
MACD Analysis for Nifty IT: The MACD value of -1105.86, which is lower than the MACD Signal of -739.19, indicates a bearish trend. This suggests that the stock has been experiencing downward momentum. The negative MACD value combined with a low RSI further supports the bearish outlook.

RSI Analysis
The current RSI for Nifty IT is 19.59, which indicates that the index is in oversold territory. This level suggests potential for a price reversal or a bounce-back since values below 30 typically signify the asset is undervalued or has been under heavy selling pressure.

Analysis for Nifty Metal - February 28, 2025

Nifty Metal opened at 8272.25 and closed at 8219.25, marking a decline of 1.39% from the previous close of 8334.80. The index's RSI is at 44.33, indicating mild bearish momentum, while the MACD shows a value of -35.25, suggesting potential downward pressure. The lack of volume data and a substantial difference between current value and 50-day EMA (8513.62) also reflect ongoing weakness in the sector.

Relationship with Key Moving Averages
Nifty Metal closed at 8219.25, which is below its 50 EMA of 8513.62, indicating a potential bearish trend. The closing price is also below the 10 EMA (8342.95) and 20 EMA (8359.33), suggesting short-term weakness in the index.
Moving Averages Trend (MACD)
The MACD for Nifty Metal is -35.25, while the MACD signal is -43.02. This indicates a potential reversal or consolidation phase as the MACD line is slightly above the signal line despite being in negative territory. Further confirmation is needed to ascertain any clear trend direction.

RSI Analysis
The Nifty Metal index has an RSI value of 44.33, indicating a relatively neutral trend but leaning slightly towards being oversold. Typically, an RSI below 30 suggests oversold conditions, while above 70 indicates overbought conditions. This current RSI suggests modest bearish momentum that traders might watch closely for potential reversal opportunities.

Analysis for Nifty Bank - February 28, 2025

Nifty Bank opened at 48,437.55 and closed lower at 48,344.70, indicating a decline of 0.82% with a points change of -399.10. The current RSI at 38.03 suggests it may be entering oversold territory. The MACD at -291.36, compared to the signal line at -211.76, indicates bearish momentum.

Relationship with Key Moving Averages
Nifty Bank's current close of 48344.70 is below the 10 EMA at 48910.45, the 20 EMA at 49146.63, the 50 EMA at 49737.79, and the 200 EMA at 50076.76, indicating a bearish trend relative to these key moving averages. The negative MACD further suggests downward momentum.
Moving Averages Trend (MACD)
The MACD for Nifty Bank is -291.36, while the MACD Signal is -211.76, indicating a bearish momentum as the MACD line is below the signal line. This suggests that the price trend could be downward in the short term. The RSI at 38.03 also supports the likelihood of further bearish sentiment.

RSI Analysis
The RSI (Relative Strength Index) for Nifty Bank is currently at 38.03, which suggests that the stock is nearing the oversold territory. An RSI below 30 is typically considered oversold, indicating potential for a price rebound. However, as current RSI is not below 30, it may indicate bearish sentiment is still prevailing without reaching an extreme oversold condition yet.

Analysis for Nifty 50 - February 28, 2025

Nifty 50 opened at 22,433.40, hit a high of 22,450.35, and closed at 22,124.70, showing a significant decline of 1.86% or a drop of 420.35 points from the previous close of 22,545.05. With a low volume and an RSI of 23.04, the index indicates a bearish trend, further evidenced by a negative MACD of -262.57 compared to the MACD Signal of -187.72.

Relationship with Key Moving Averages
The Nifty 50 index closed at 22,124.70, which is below all its key moving averages: the 50-day EMA at 23,292.34, the 200-day EMA at 23,520.35, and the 10-day EMA at 22,677.17. This suggests a bearish trend as the current price is below short-term and long-term averages.
Moving Averages Trend (MACD)
The MACD for Nifty 50 is -262.57, which is below the MACD Signal of -187.72. This indicates a bearish momentum in the current trend. The negative MACD suggests that the short-term moving average is lower than the long-term moving average, often seen as a signal of potential downward price action.

RSI Analysis
The RSI value for Nifty 50 is 23.04, which indicates that the market is in an oversold condition. This suggests a potential buying opportunity, as prices may be due for a bounce back. However, it's important to consider other factors and analyses before making trading decisions.

ADVERTISEMENT
Up Next

Indian stock market sector-wise performance today - February 28, 2025

New Zealand commits USD 20 bn investment in India under FTA in 15 yrs; on lines of EFTA pact

India, New Zealand conclude FTA talks; pact to offer duty-free access, USD 20 bn FDI

FTA with New Zealand to significantly deepen bilateral economic engagement: Govt

Rupee breaches 91-mark against US dollar for first time in intra-day trade

Microsoft commits USD 17.5 billion investment in India: CEO Satya Nadella
More videos
CBI books Anil Ambani's son, Reliance Home Finance Ltd. in Rs 228 crore bank fraud case
RBI raises FY26 GDP growth projection to 7.3 pc
RBI trims policy interest rate by 25bps to 5.25pc, loans to get cheaper
Rupee slumps to all-time low of 90.25 against US dollar in intra-day trade
Reliance completes merger of Star Television Productions with Jiostar
India to lead emerging market growth with 7pc GDP rise in 2025: Moody’s
Nifty hits record high after 14 months; Sensex nears all-time peak
Reliance stops Russian oil use at its only-for-export refinery to comply with EU sanctions
ED attaches fresh assets worth over Rs 1,400 cr in case against Anil Ambani's Reliance Group
India signs one-year deal to import 2.2 million tonnes of LPG from US