


Highlights
- Nifty Auto fell by 0.61%, signaling weakness
- Nifty IT gained 0.95%, showing strong performance
- Nifty FMCG declined by 0.88%, indicating pressure
Latest news

Samsung's Bespoke AI ACs Focus on Humidity, Hygiene and Smarter Cooling

Samsung CEO Says Next Galaxy Foldables Will Be Thinner, Lighter and Smarter

Dell Launches New Pro Precision AI Workstations In India, Introduces Deskside Agentic AI Platform

Oppo Enco Air5 Review: Incredible Value at ₹3,099

Samsung Galaxy A27 5G Goes On Sale In India With Cashback Offers, Zero Down Payment Schemes
 First Impressions: A Strong Debut For The New 'b' Series")
Nothing Phone (4b) First Impressions: A Strong Debut For The New 'b' Series

Samsung Galaxy A27 Review: A Dependable Mid-Ranger With Few Surprises

Union Finance Minister Nirmala Sitharaman Inaugurates Muzhiyan Kulam, Restored by Lumina Datamatics and Community Stakeholders in Puducherry
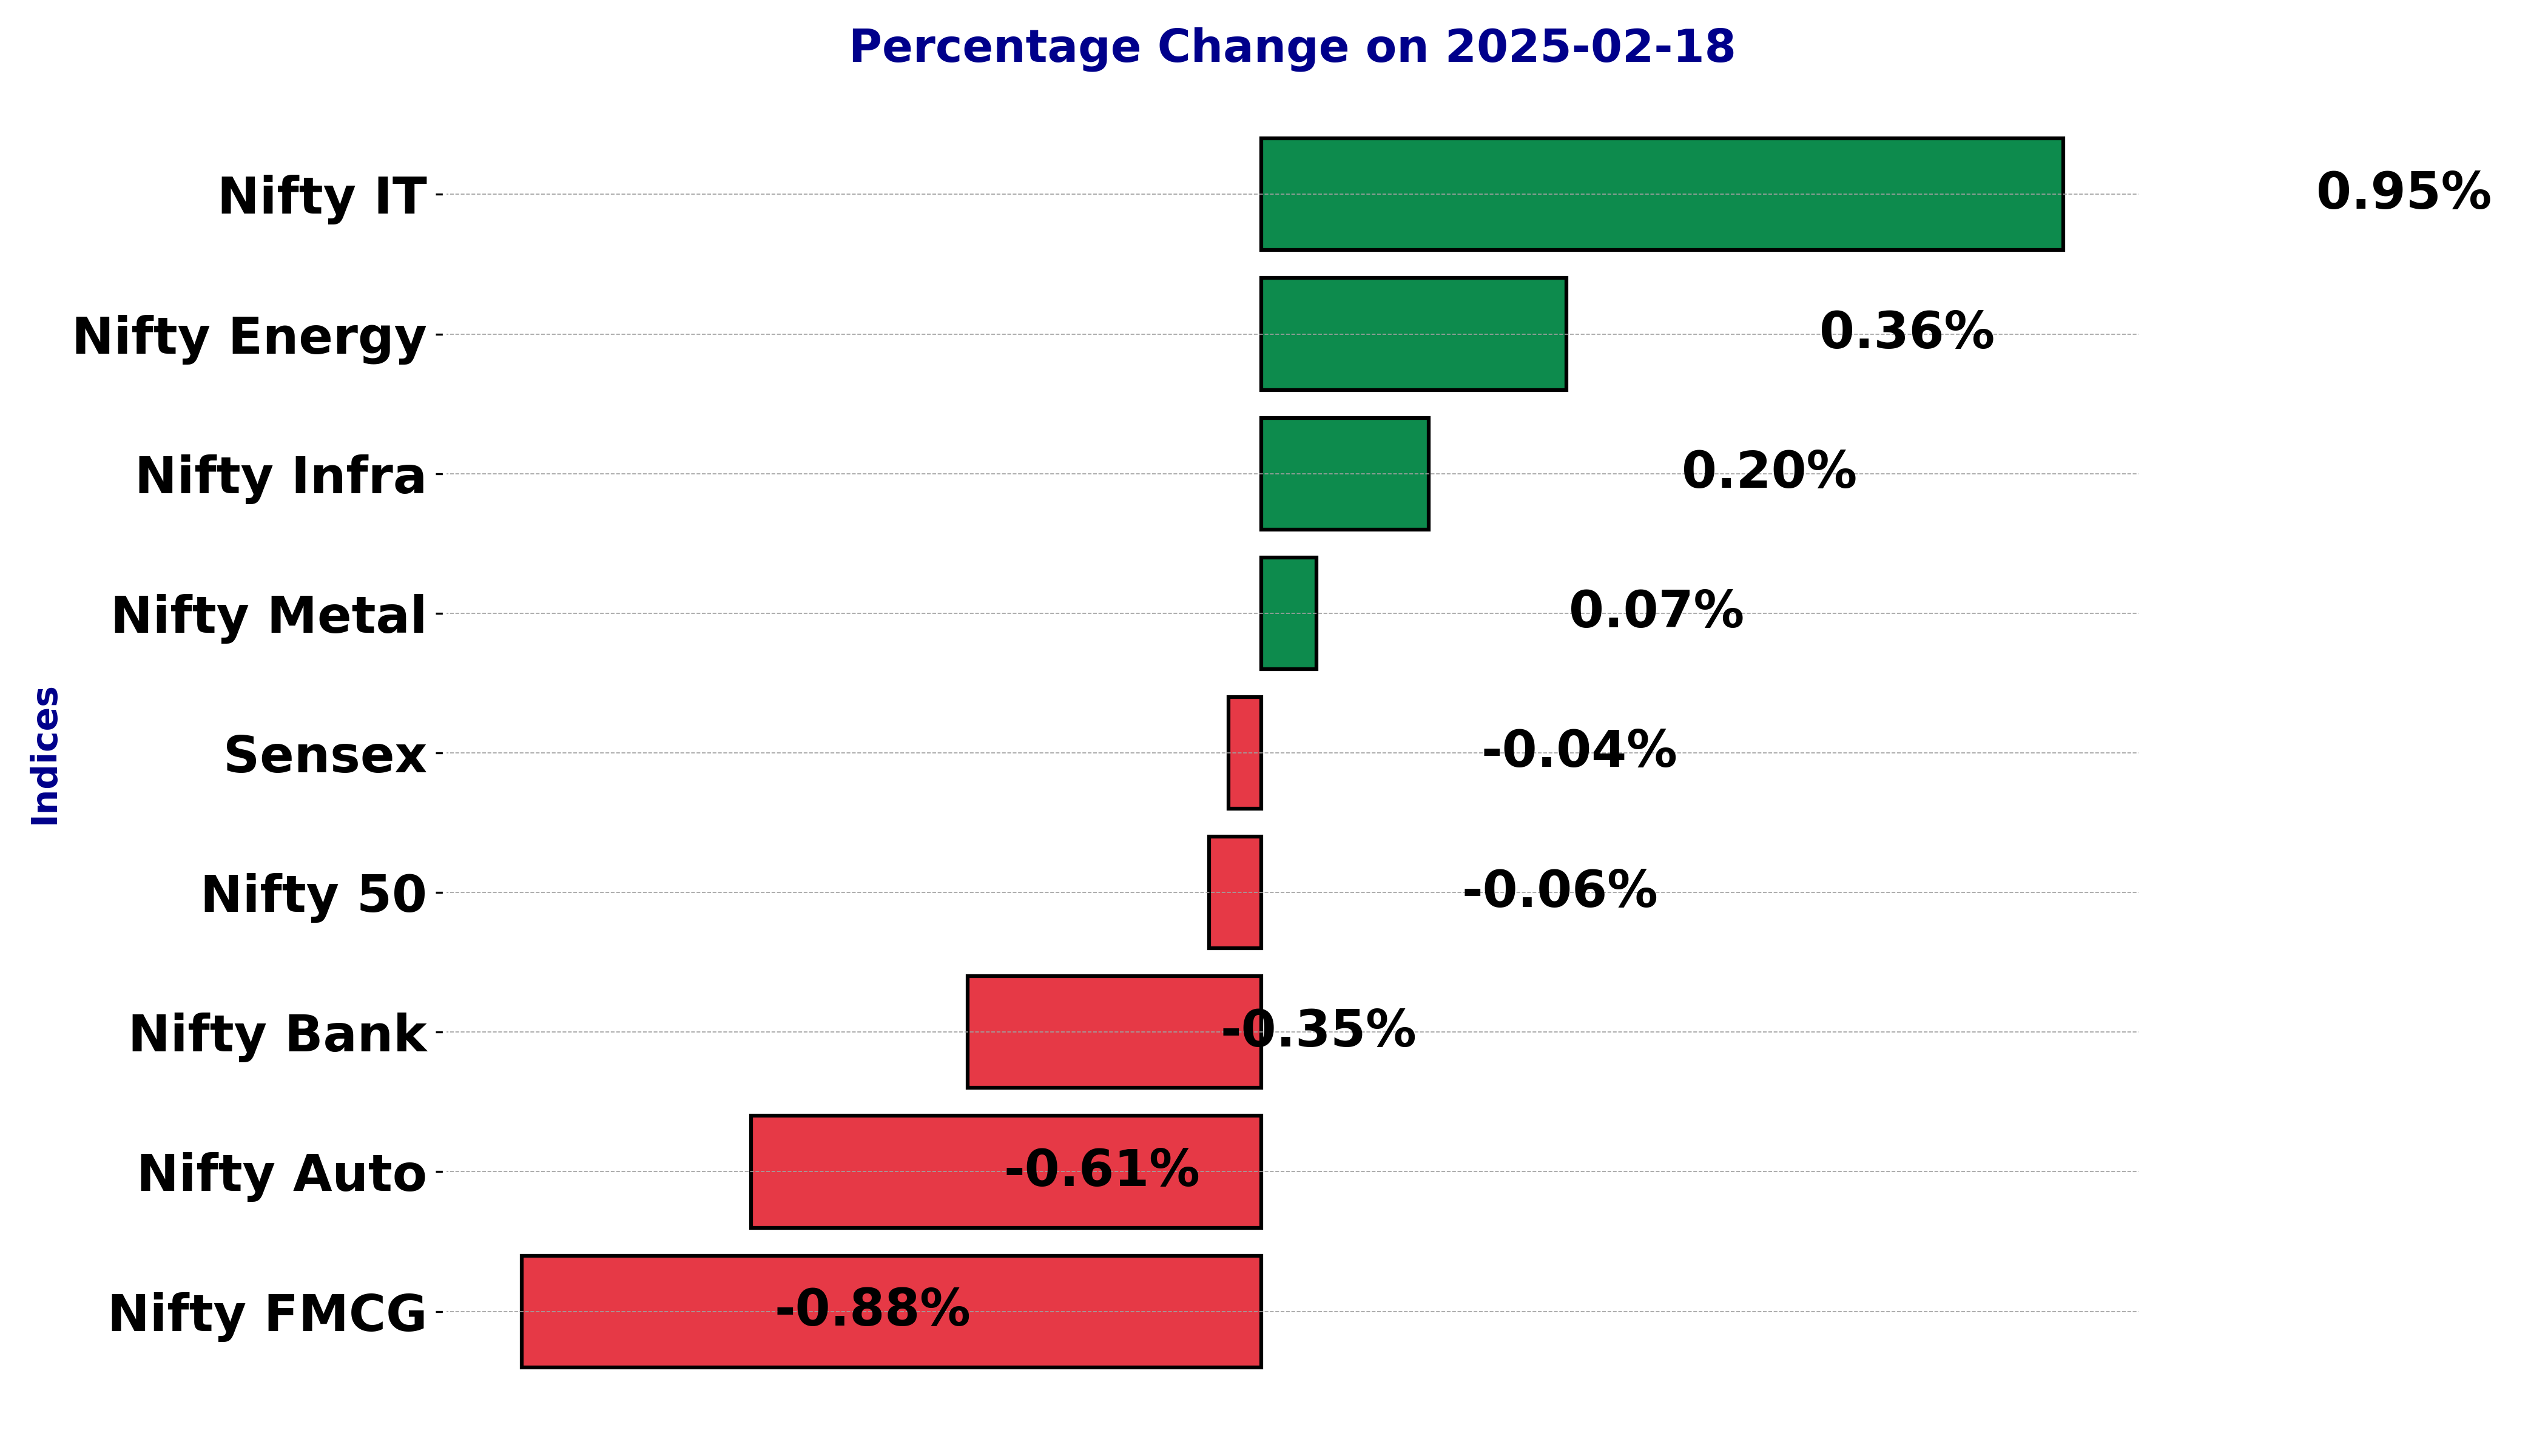
Indian stock market sector-wise performance today - February 18, 2025


The stock market witnessed a mixed performance across various sectors and indices. The Sensex showed a slight decline of 0.04% as it closed at 75,967.39, marking a nominal points change of -29.47 from the previous close.
This marginal downturn reflects investors' cautious sentiment. Within the sectors, the Auto sector index registered the most significant decline, falling by 0.61%.
It closed at 21,818.90 compared to its previous mark of 21,951.85. This sector's decline could be attributed to weakened demand expectations and possible supply chain concerns that have been persistent.
In contrast, the Energy sector exhibited relative strength with a growth of 0.36%, closing at 30,849.05.
This increase suggests some investor confidence in energy stocks, possibly due to stabilization in energy prices or positive corporate announcements within the sector.
The FMCG sector experienced the most notable downturn among sectors, declining by 0.88% to close at 52,480.5.
The decline in the Fast-Moving Consumer Goods segment indicates market concerns over consumption trends or profit pressures, possibly stemming from rising input costs and inflationary pressures affecting consumer spending patterns.
The Infra sector showed slight positive movement, with a 0.20% increase, closing at 7,953.20. This indicates some investor optimism towards infrastructure developments and government policy support that may benefit this sector.
On the technology front, Nifty IT stood out with a notable increase of 0.95%, finishing at 41,464.35. The positive momentum in the IT sector could be due to strong earnings reports or optimistic guidance from leading IT firms, indicating sustained demand for technology services.
Lastly, Nifty Metal saw minimal change, rising slightly by 0.07% to 8,255.60. The minor positive shift hints at a stabilization period after previous volatility within the metal stocks.
Overall, the day's movements were defined by a mix of cautious trading and selective buying, primarily influenced by economic data releases, global market cues, and specific sectoral news.
While some sectors faced downward pressure, Tech and Energy emerged relatively strong, reflecting investor confidence in these areas amidst ongoing uncertainties in the global economic landscape.
Analysis for Sensex - February 18, 2025
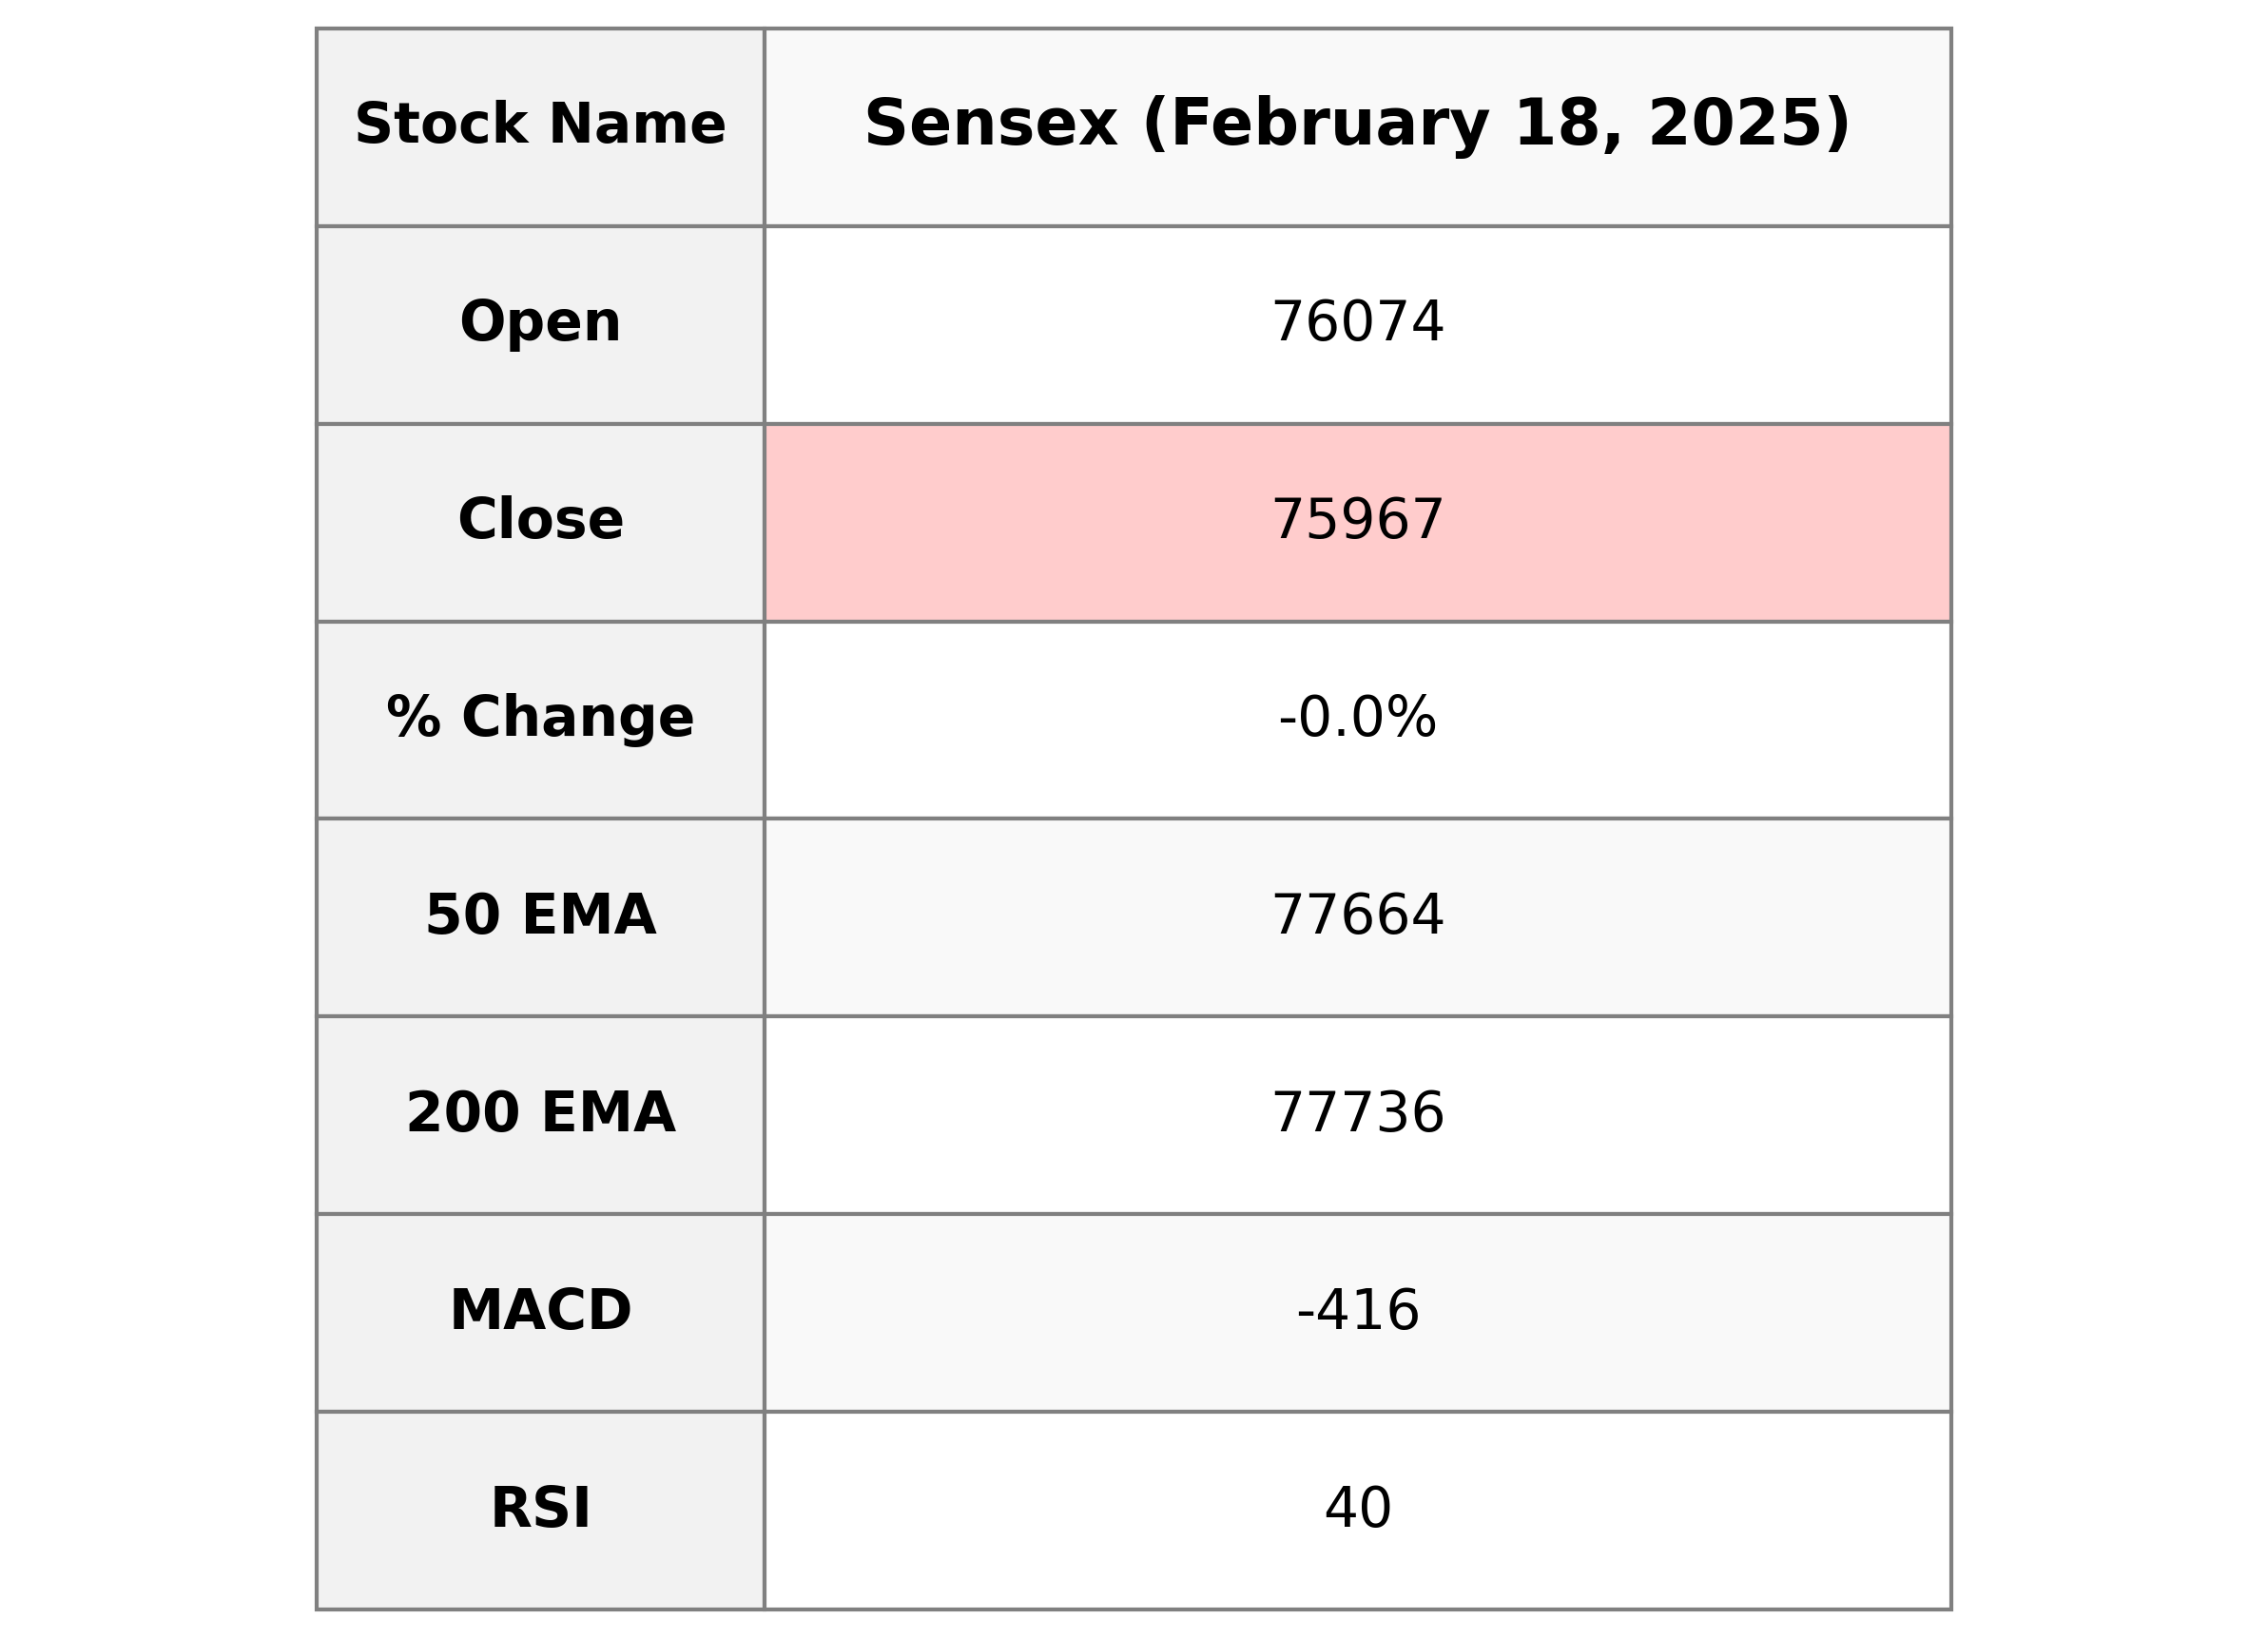
The Sensex opened at 76,073.71, with a high of 76,091.69 and a low of 75,531.01, closing at 75,967.39. It saw a slight decrease of 0.0388% from its previous close. The EMA values show the index is below both its 50 EMA and 200 EMA, indicative of a bearish trend. The RSI is 40.10, suggesting the index is nearing an oversold condition.
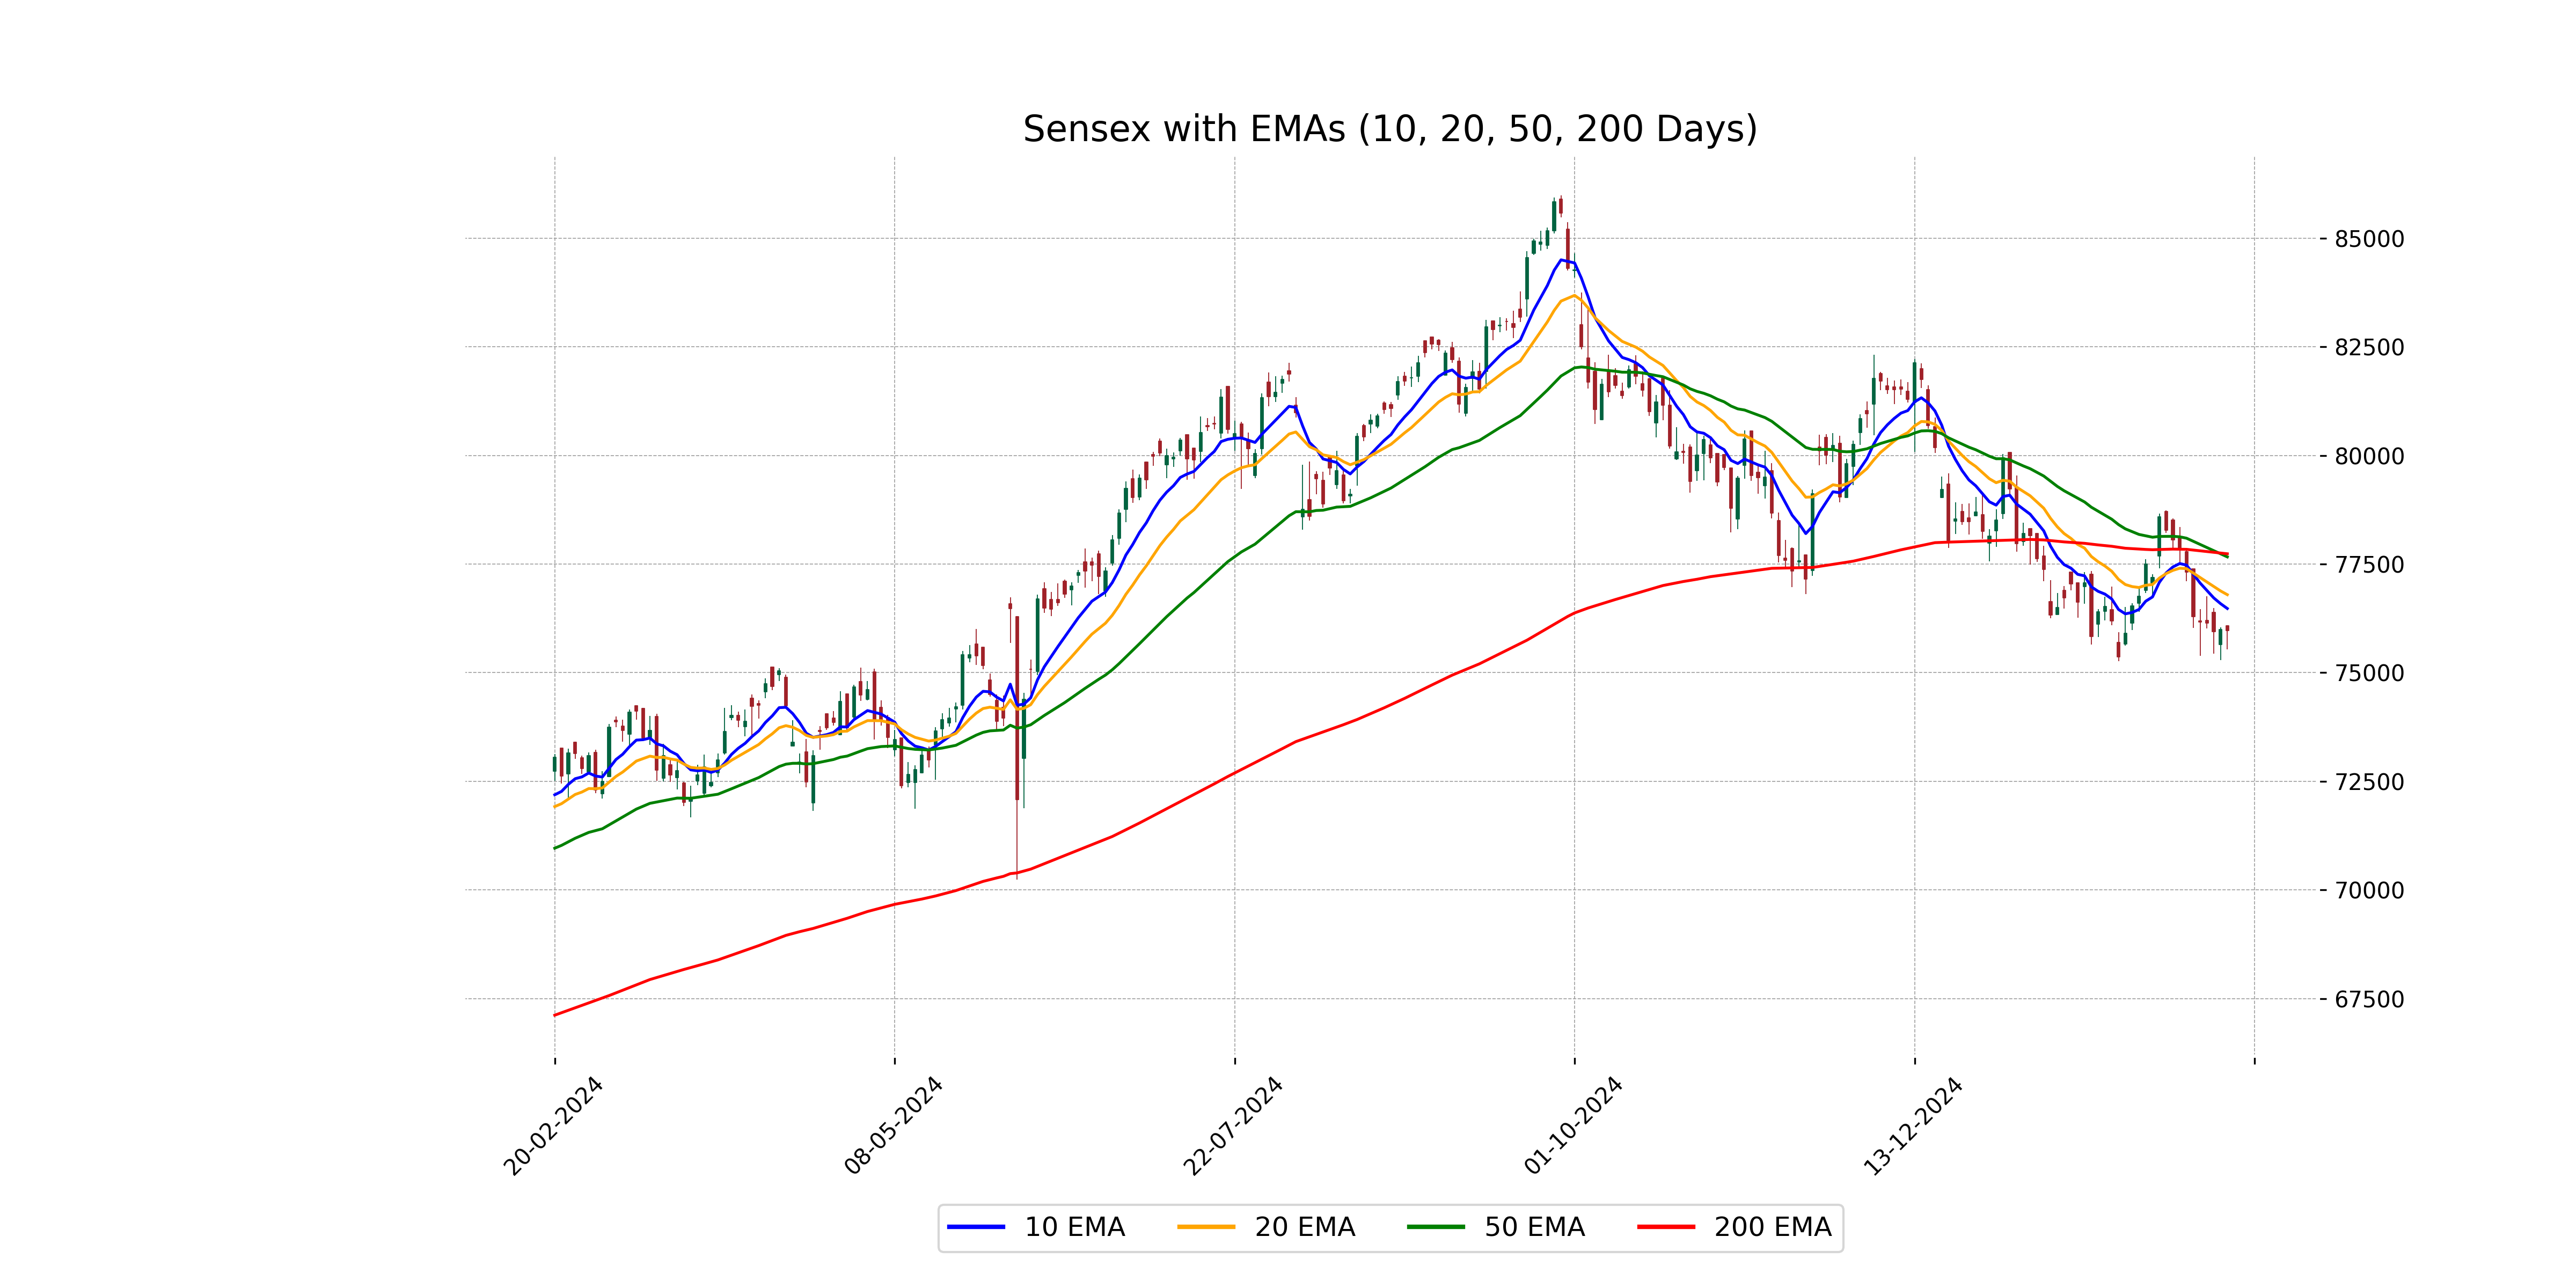
Relationship with Key Moving Averages
The Sensex closed at 75967.39, which is below the 10 EMA of 76475.98, the 50 EMA of 77663.72, and the 200 EMA of 77735.57. This indicates a bearish sentiment, as the current price is below these key moving averages.
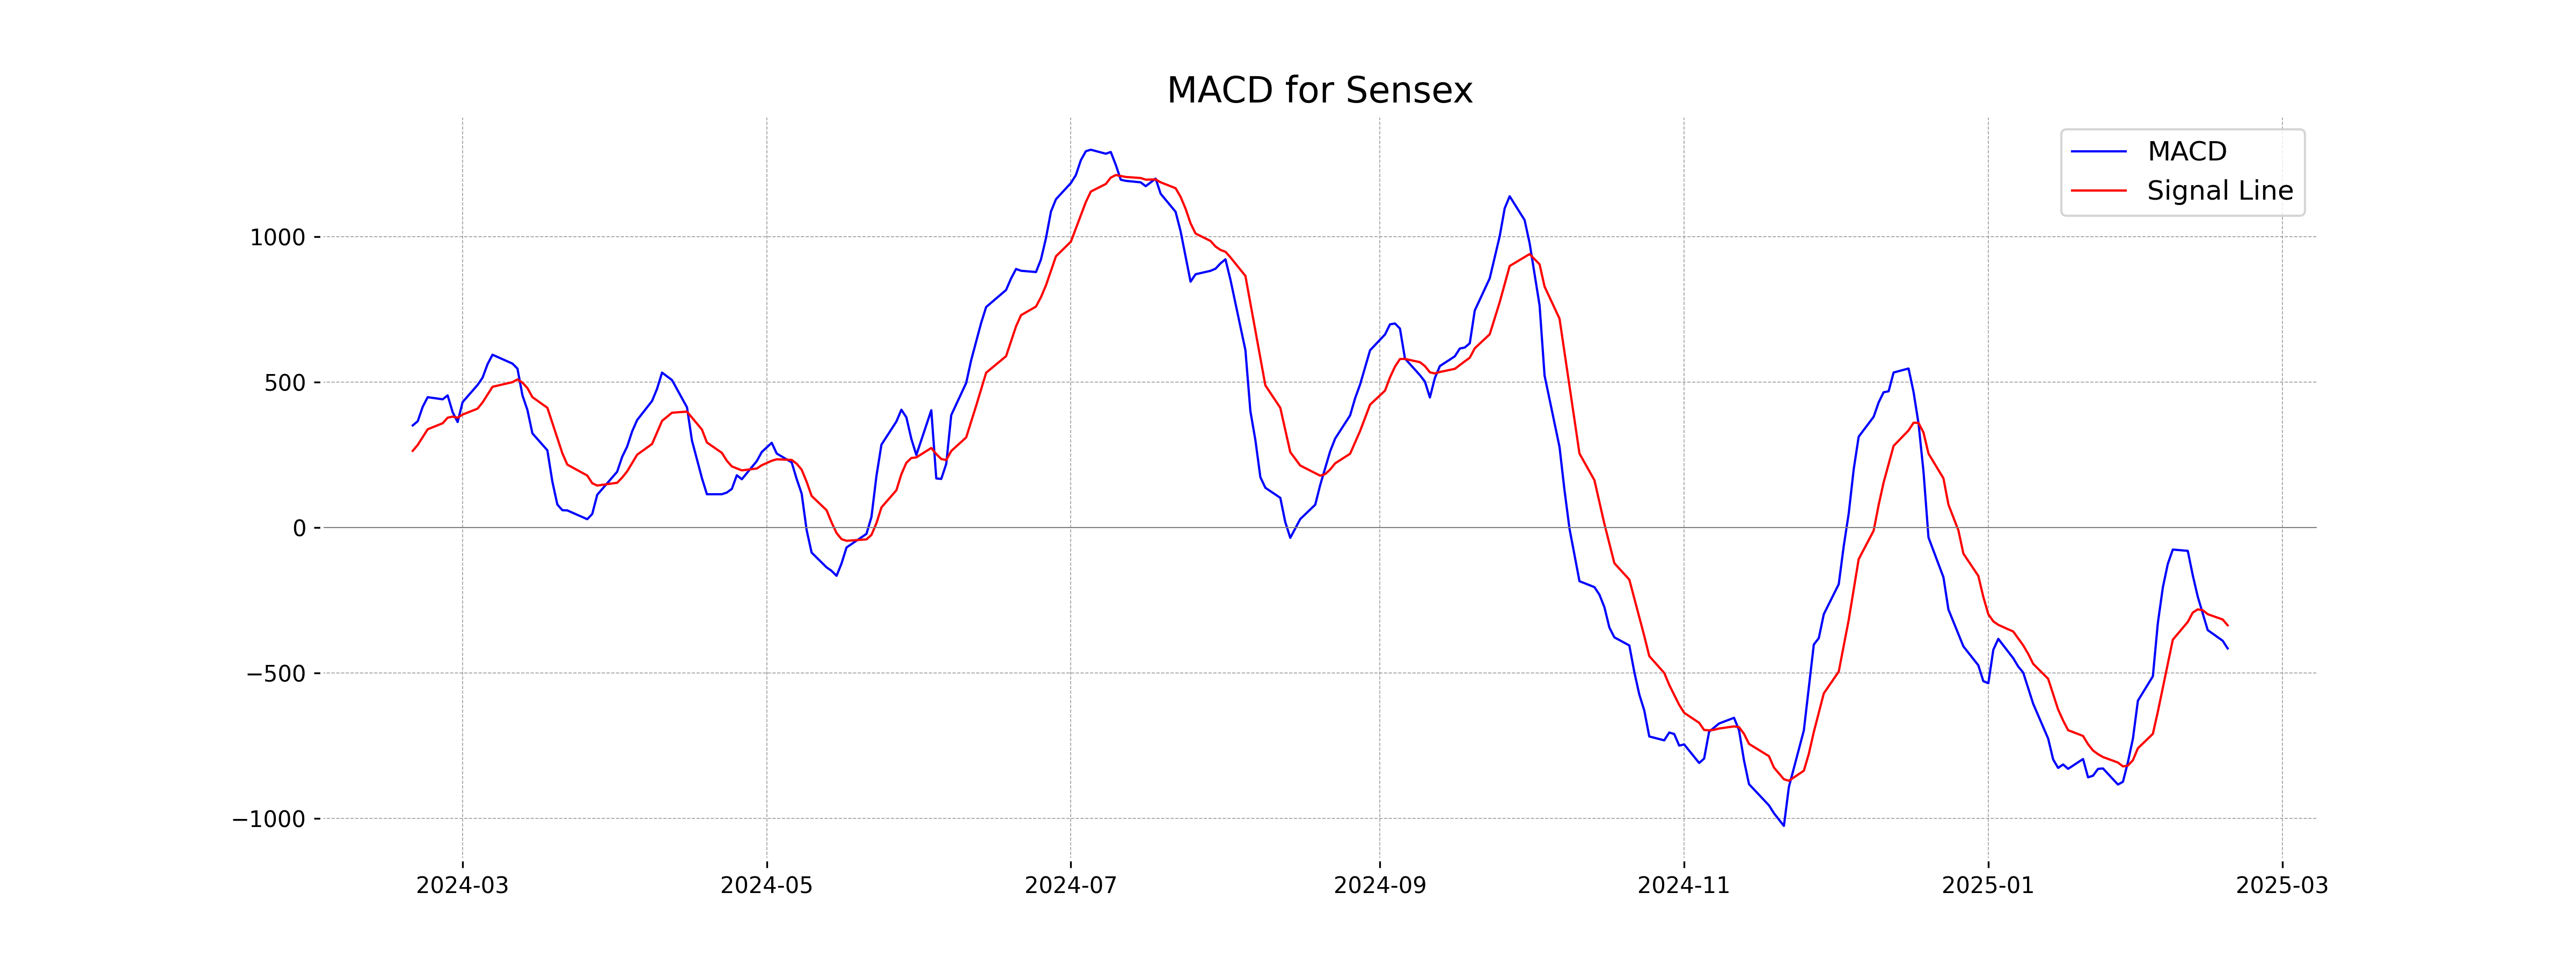
Moving Averages Trend (MACD)
The Sensex is showing a bearish trend, as indicated by the negative MACD value of -415.54, which is below its signal line at -335.95. This suggests that the selling pressure currently outweighs the buying pressure.
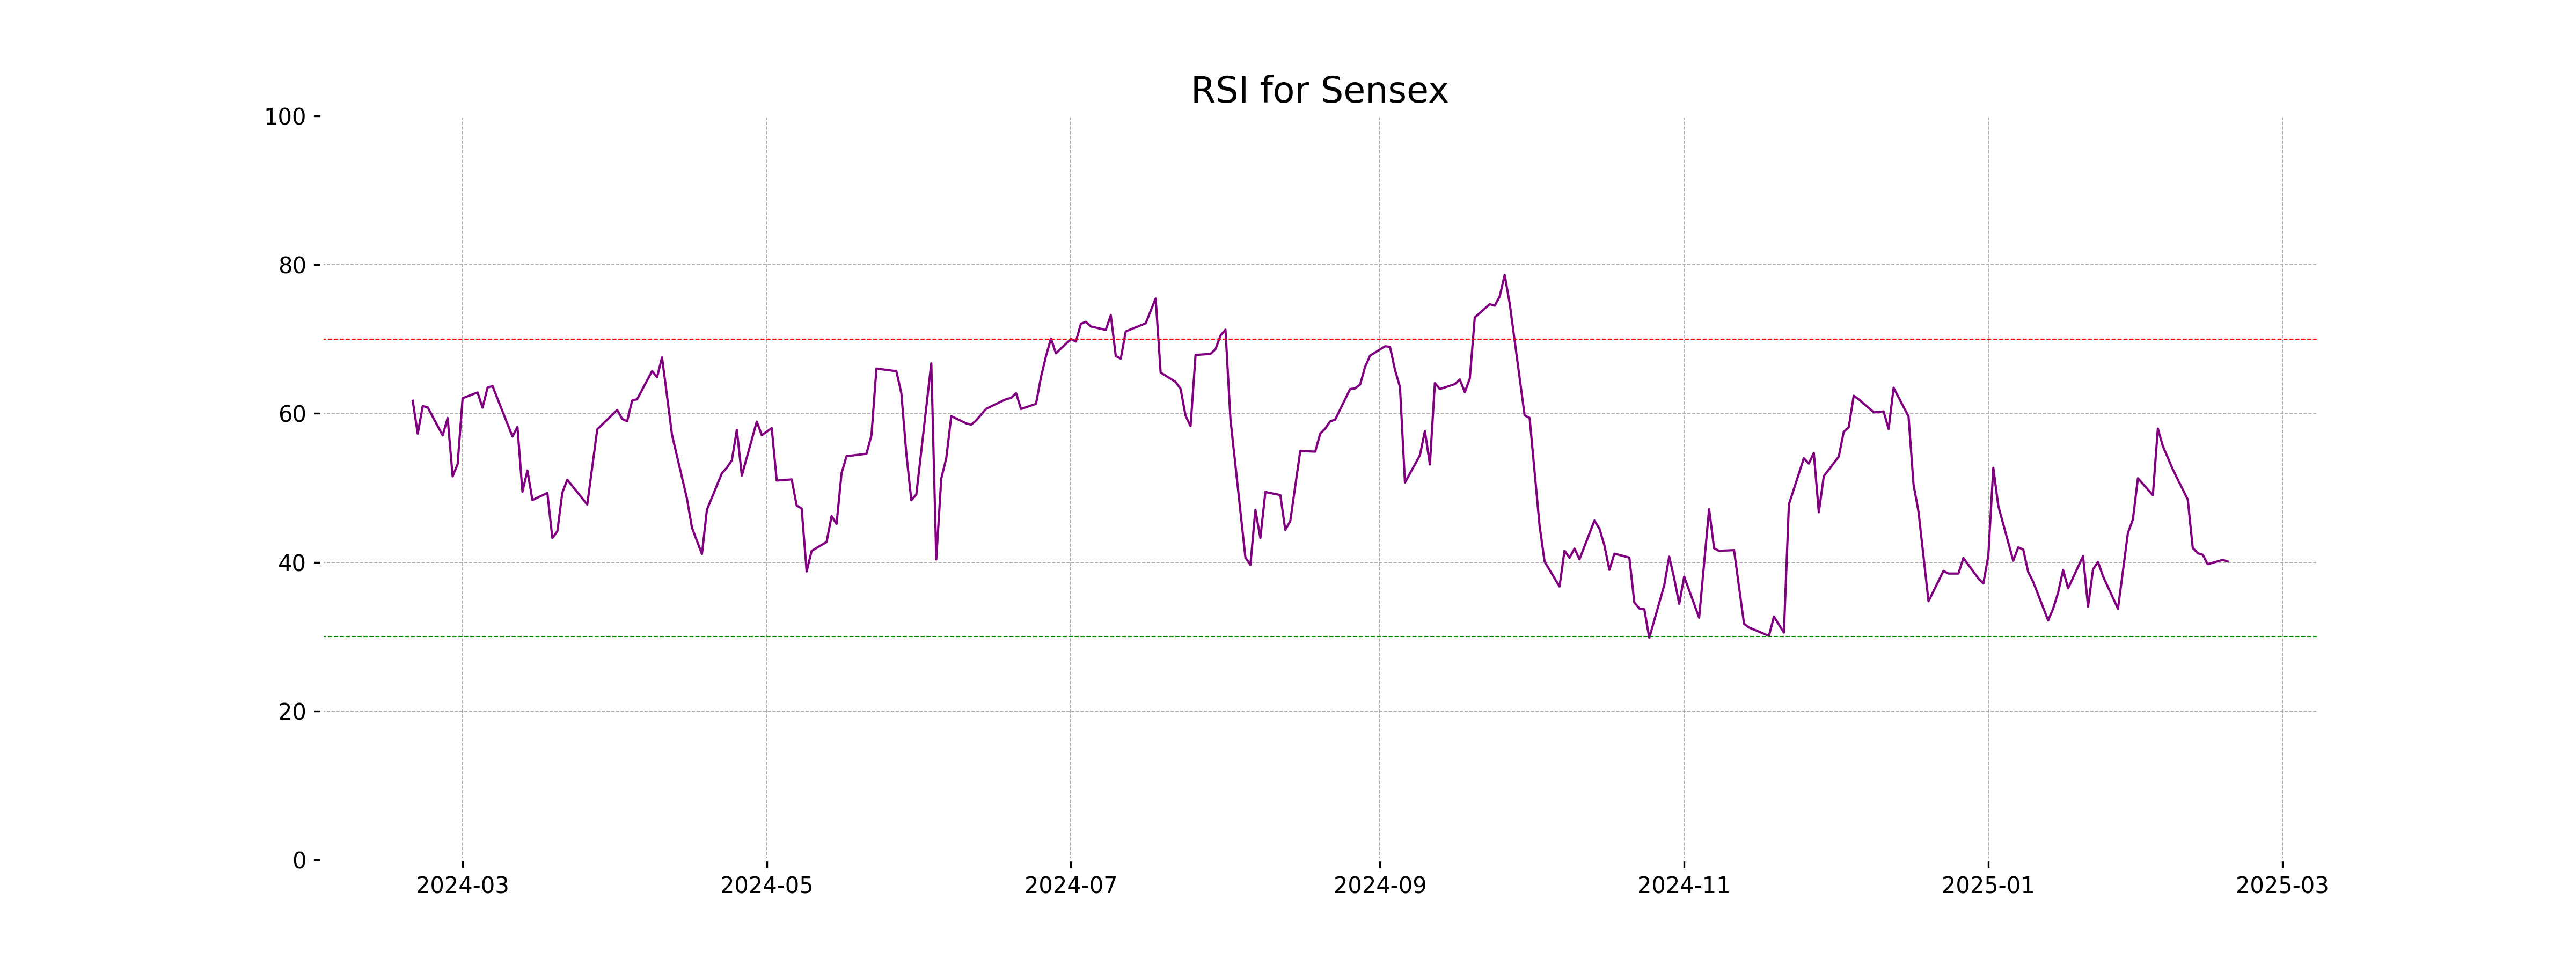
RSI Analysis
Based on the given data, the RSI for Sensex is 40.10, which indicates that the market is nearing oversold conditions, as it is below the neutral line of 50. This might suggest a potential buying opportunity if the market starts to recover or show strength.
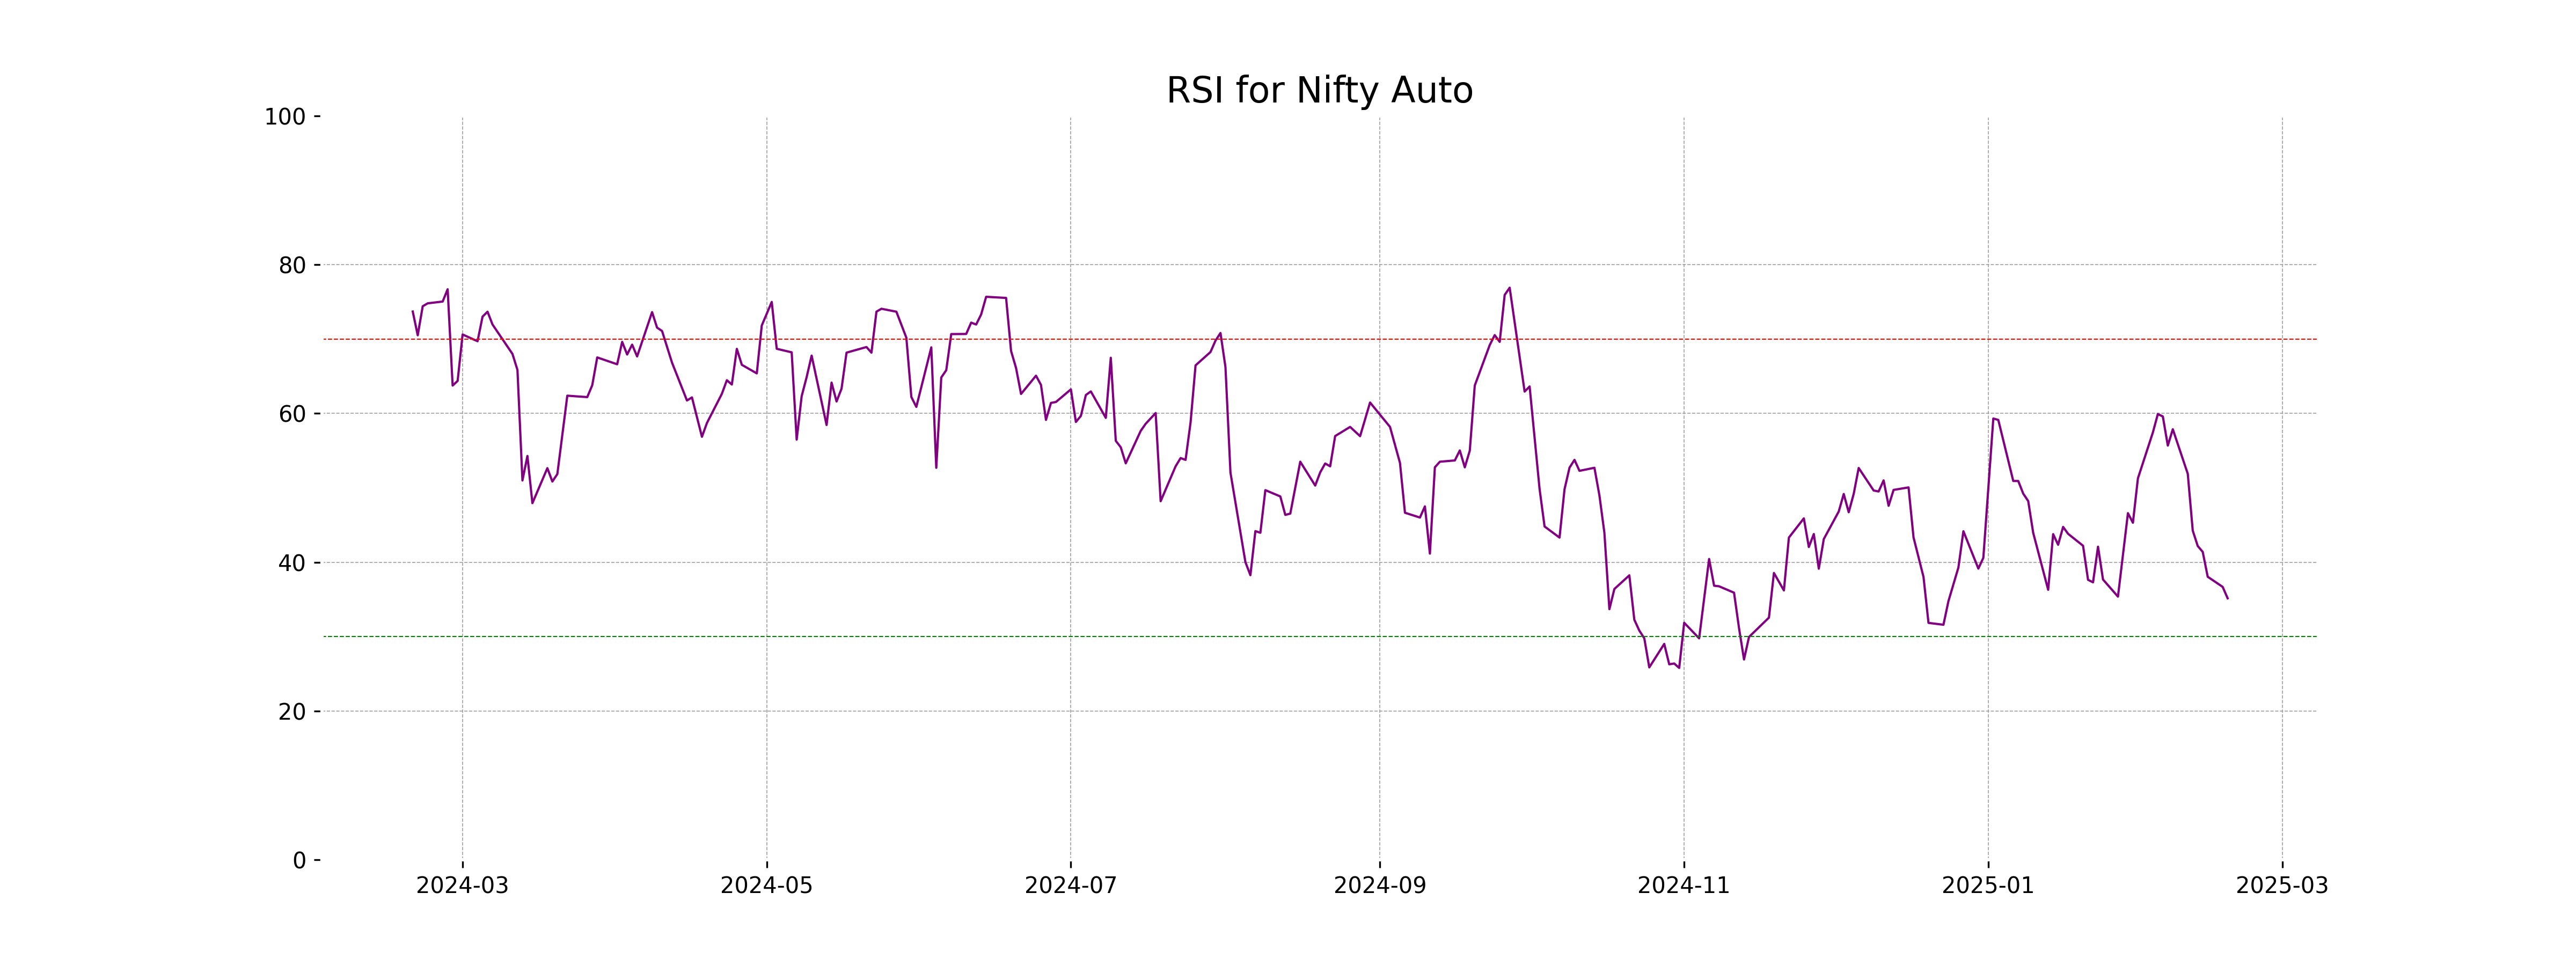
Analysis for Nifty Auto - February 18, 2025
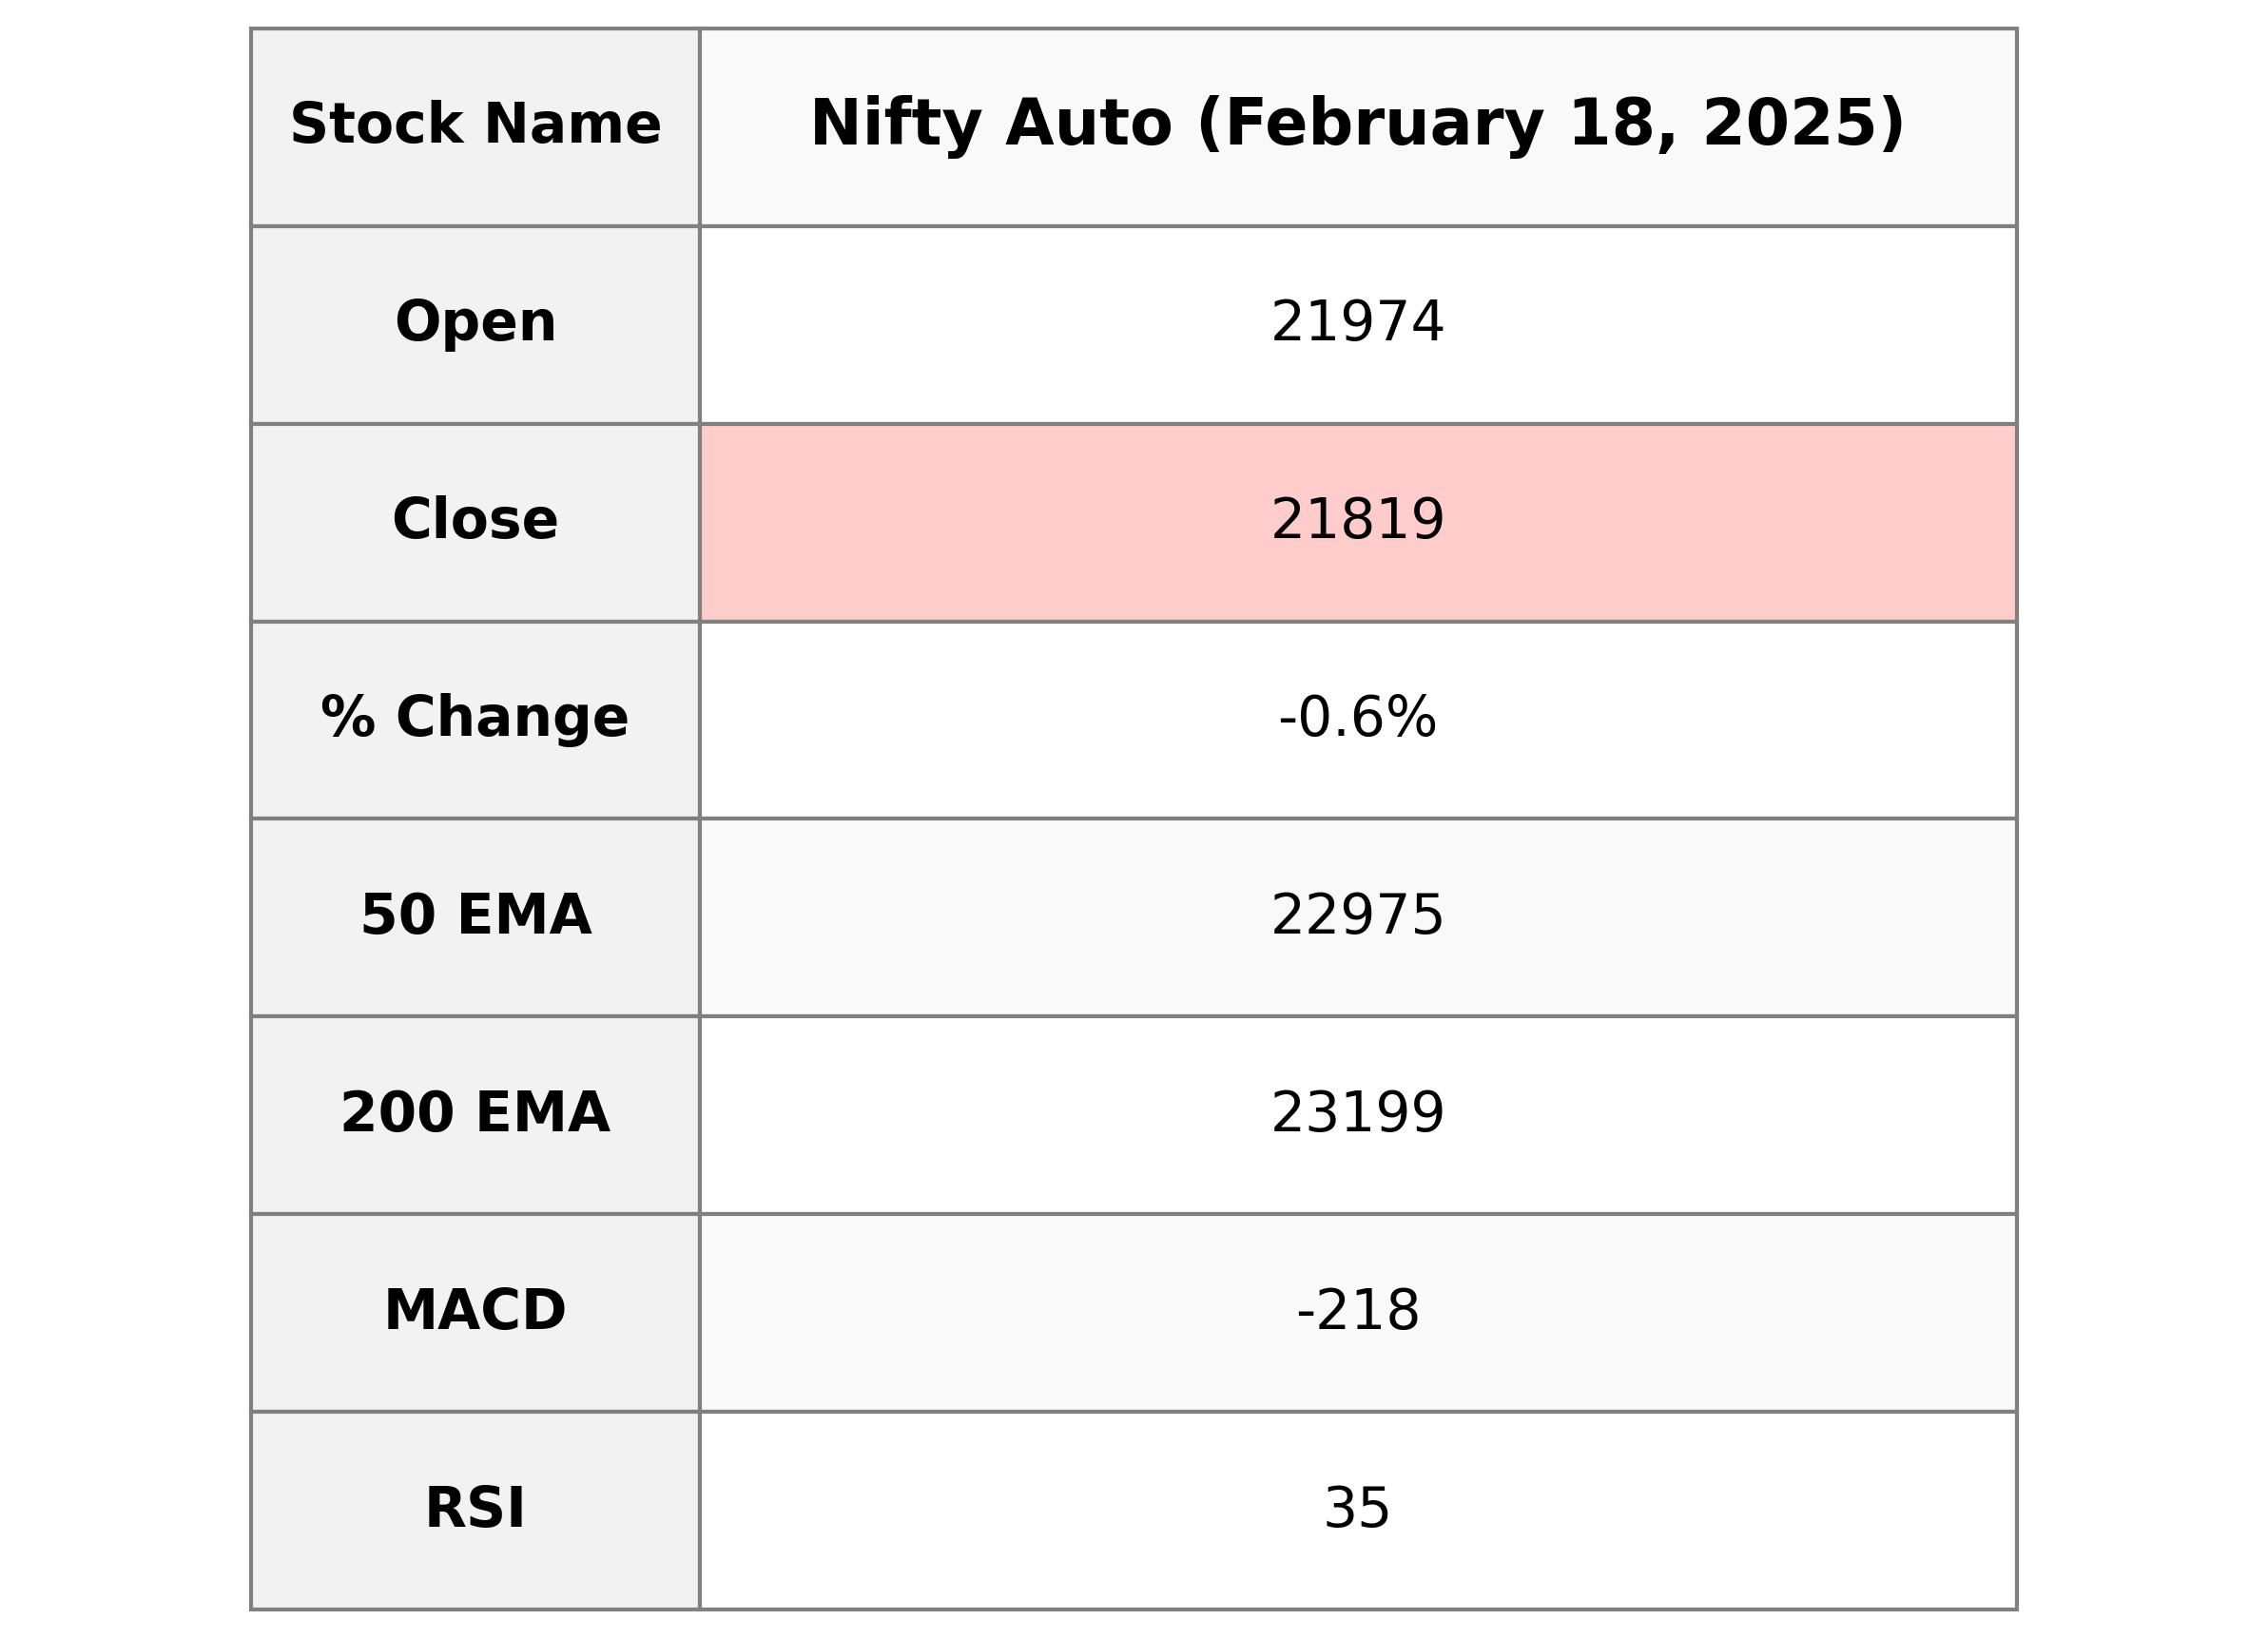
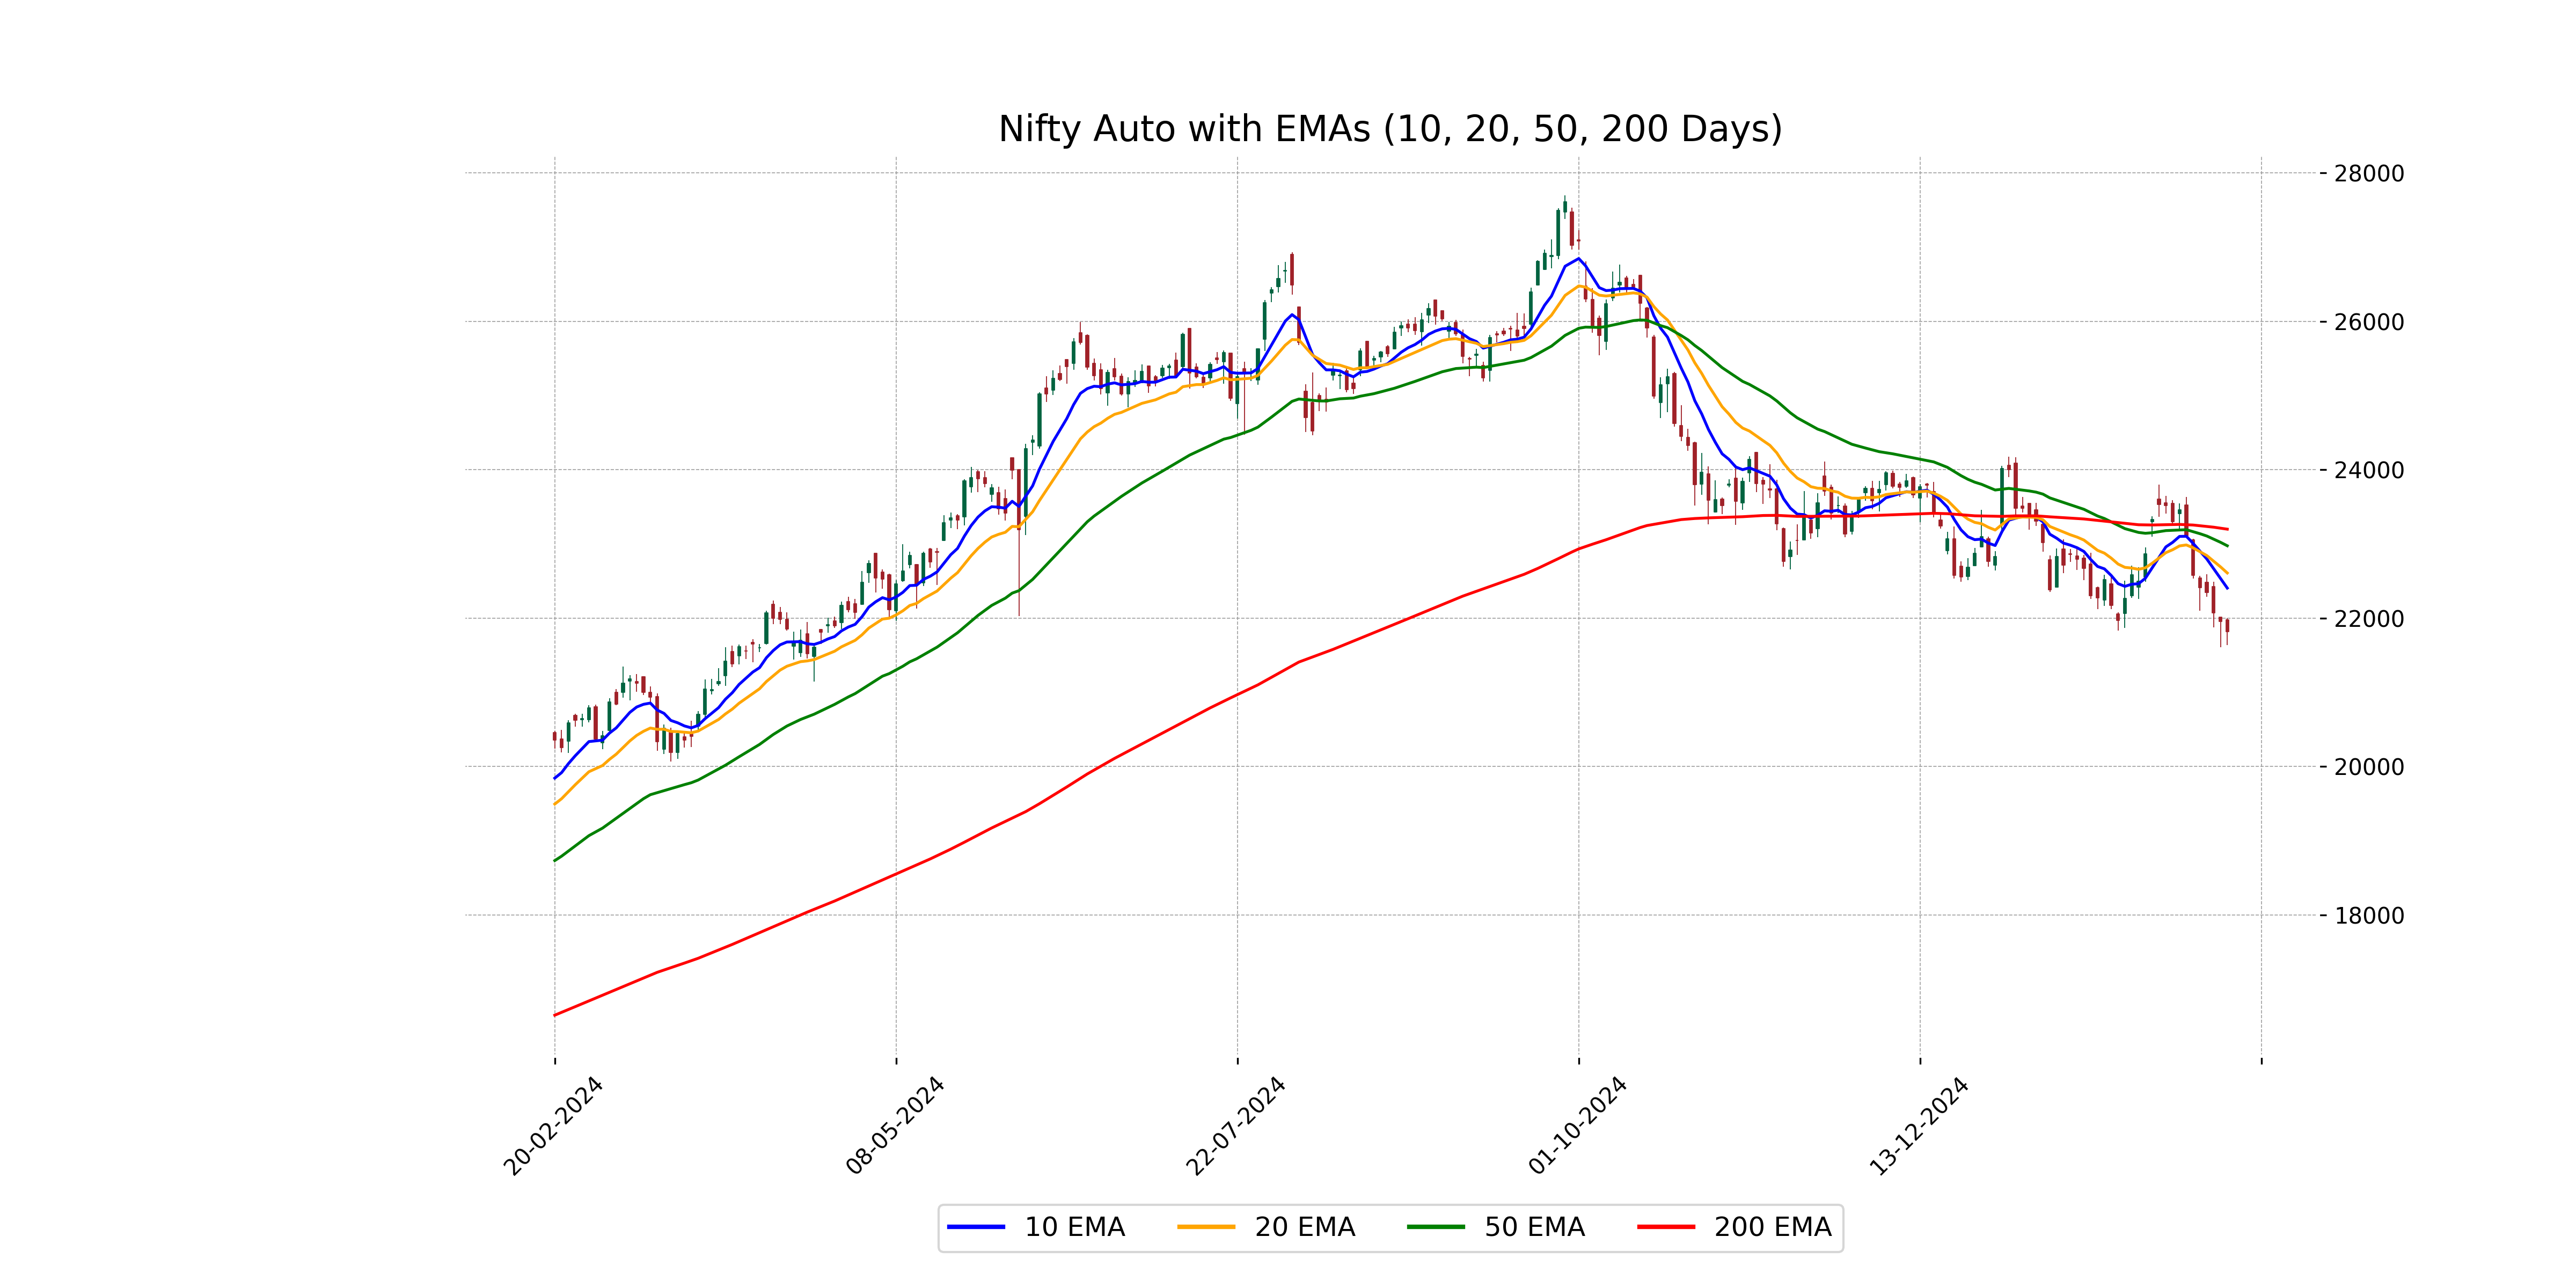
Nifty Auto opened at 21,973.70 and closed at 21,818.90, experiencing a decrease of 132.95 points or about -0.61%. The technical indicators suggest a bearish momentum with the RSI at 35.15 and the MACD being lower than the signal line, indicating potential downward pressure. The index is trading below its 10, 20, 50, and 200 EMAs, which may signify a continued bearish trend in the short to medium term.
Relationship with Key Moving Averages
The Nifty Auto index closed at 21,818.90, which is below its 10-day EMA of 22,405.09, 20-day EMA of 22,608.62, 50-day EMA of 22,975.27, and 200-day EMA of 23,199.27, indicating a bearish trend relative to these moving averages. The index's current position suggests it is experiencing downward momentum.
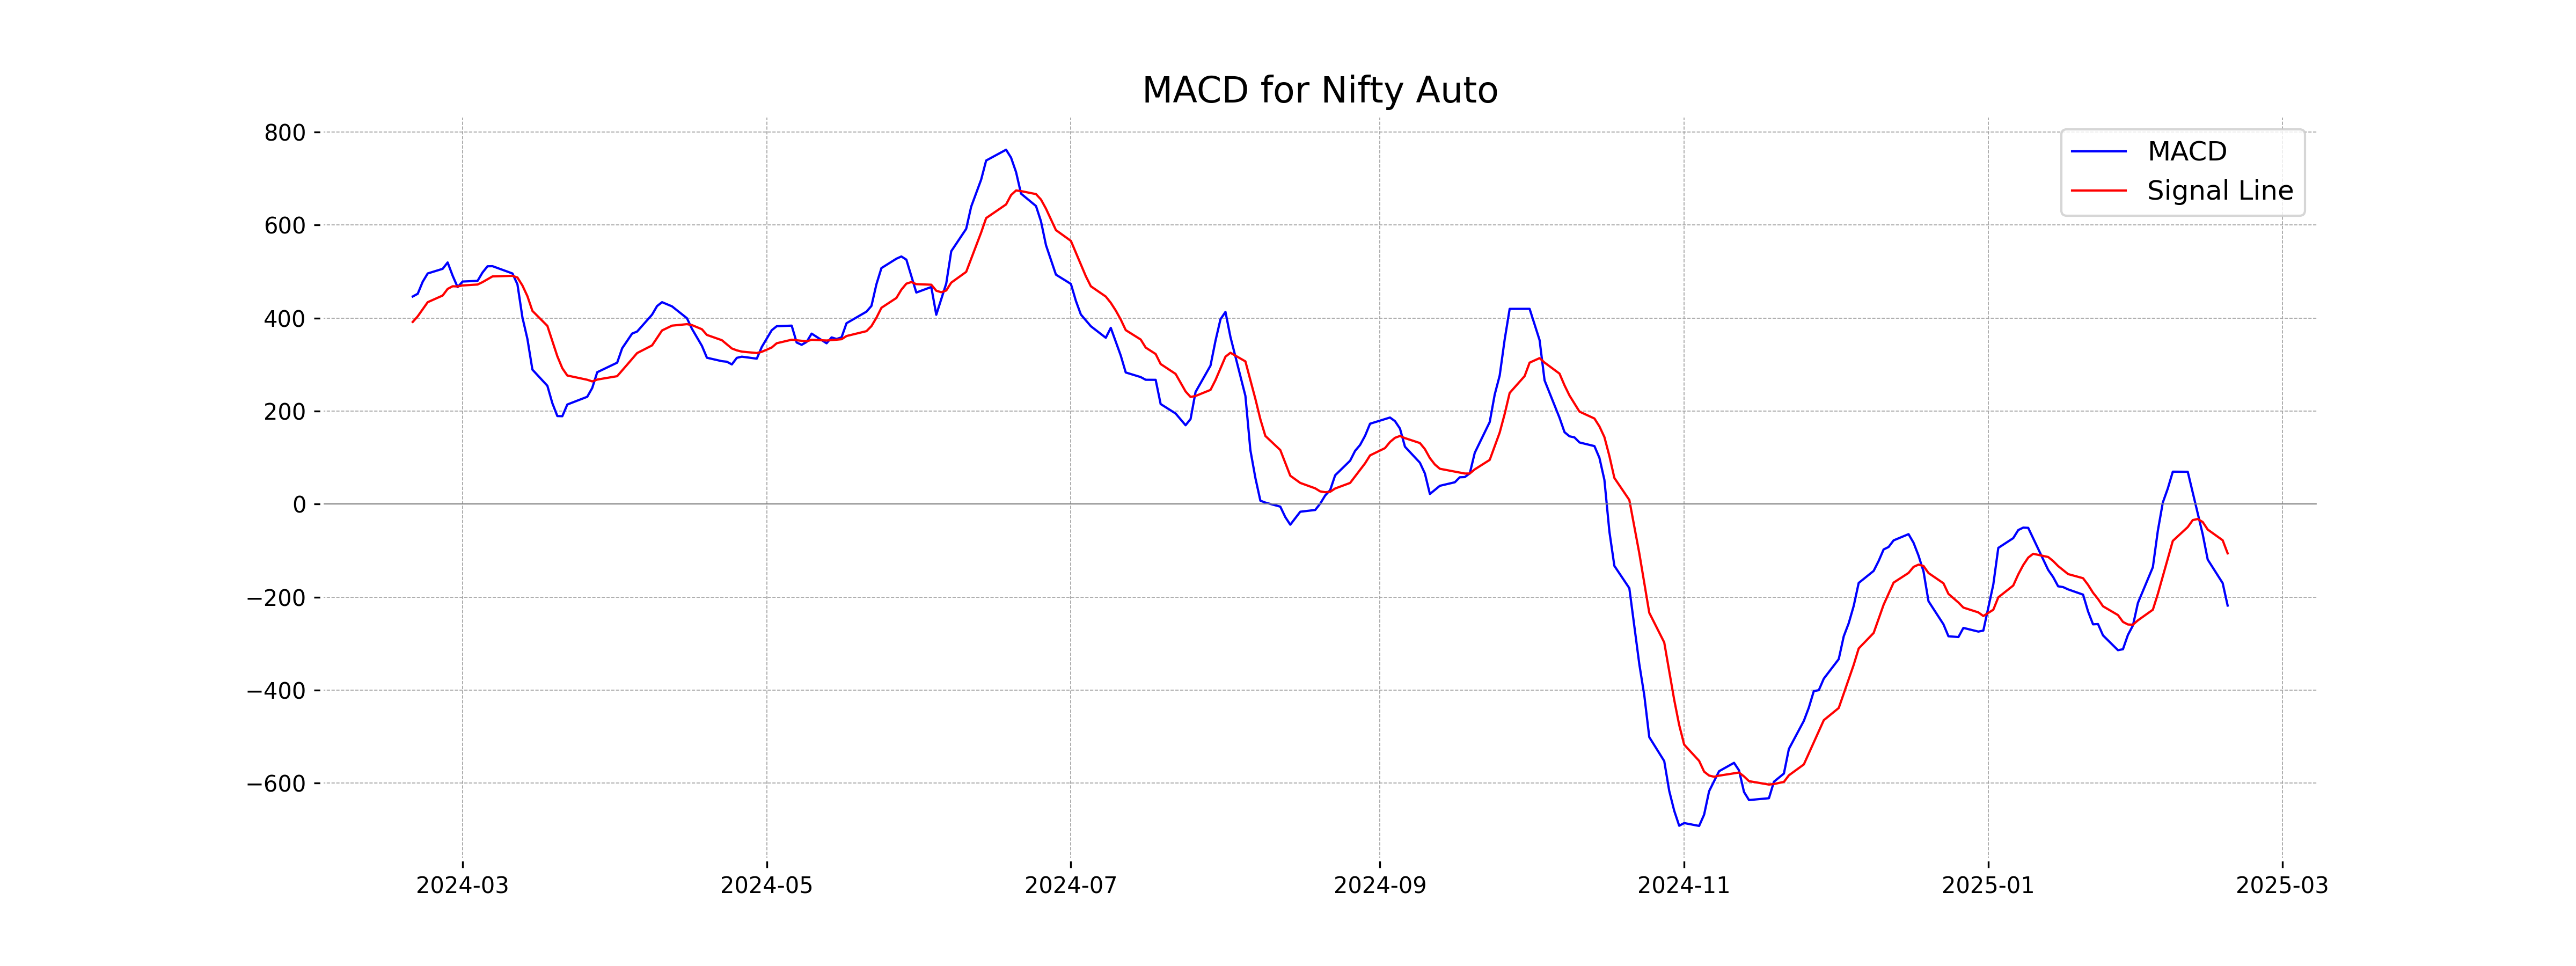
Moving Averages Trend (MACD)
The MACD for Nifty Auto is negative at -218.31, indicating a bearish momentum. Additionally, since the MACD is below its signal line (-105.91), the bearish trend may continue in the short term.
RSI Analysis
The Nifty Auto index has an RSI of 35.15, indicating that it is approaching the oversold territory. This suggests that the selling pressure might be high and there could be a potential buying opportunity if the trend reverses. An RSI below 30 typically signals that the asset is oversold.
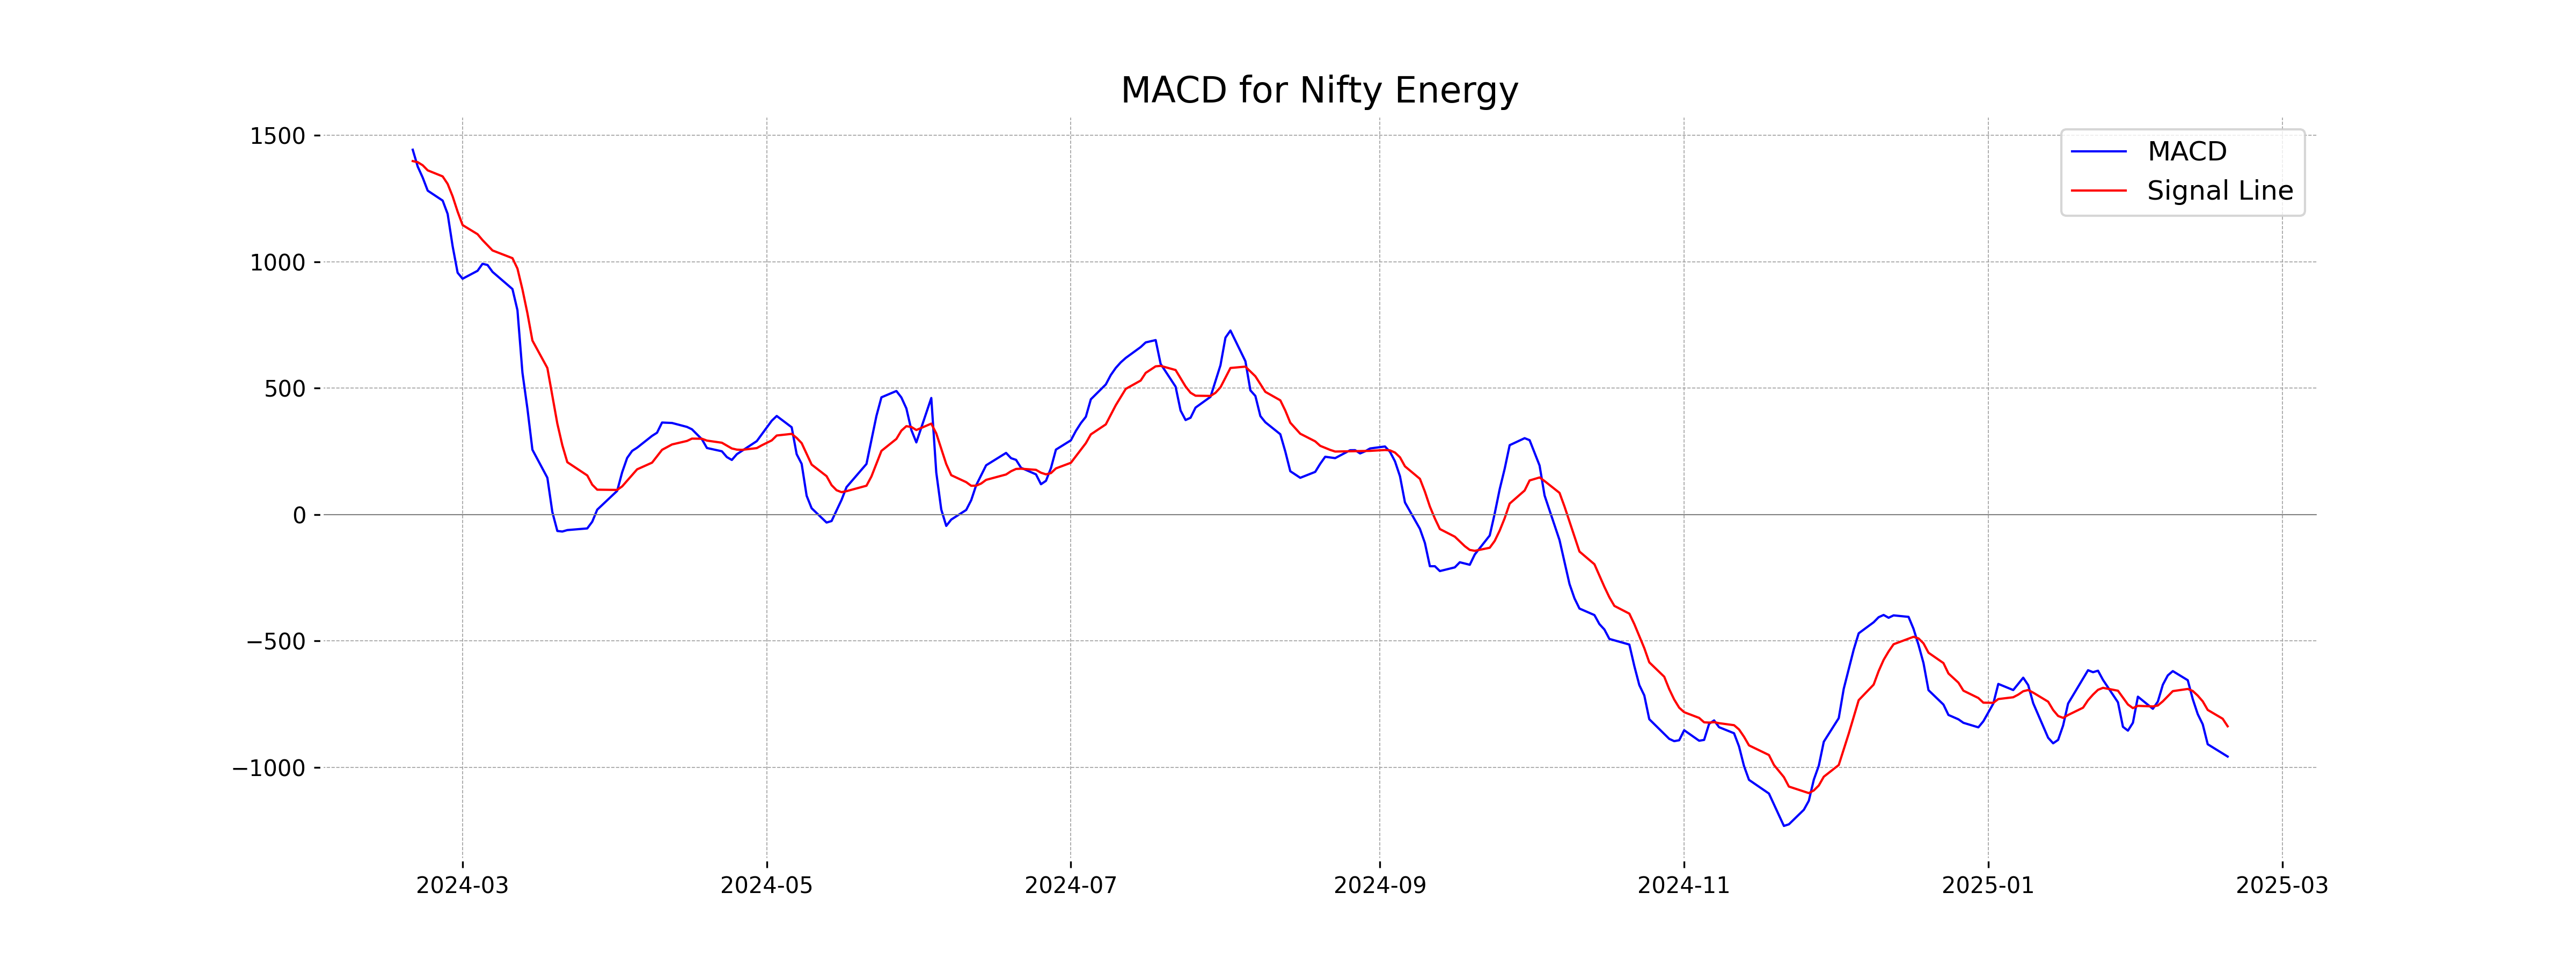
Analysis for Nifty Energy - February 18, 2025
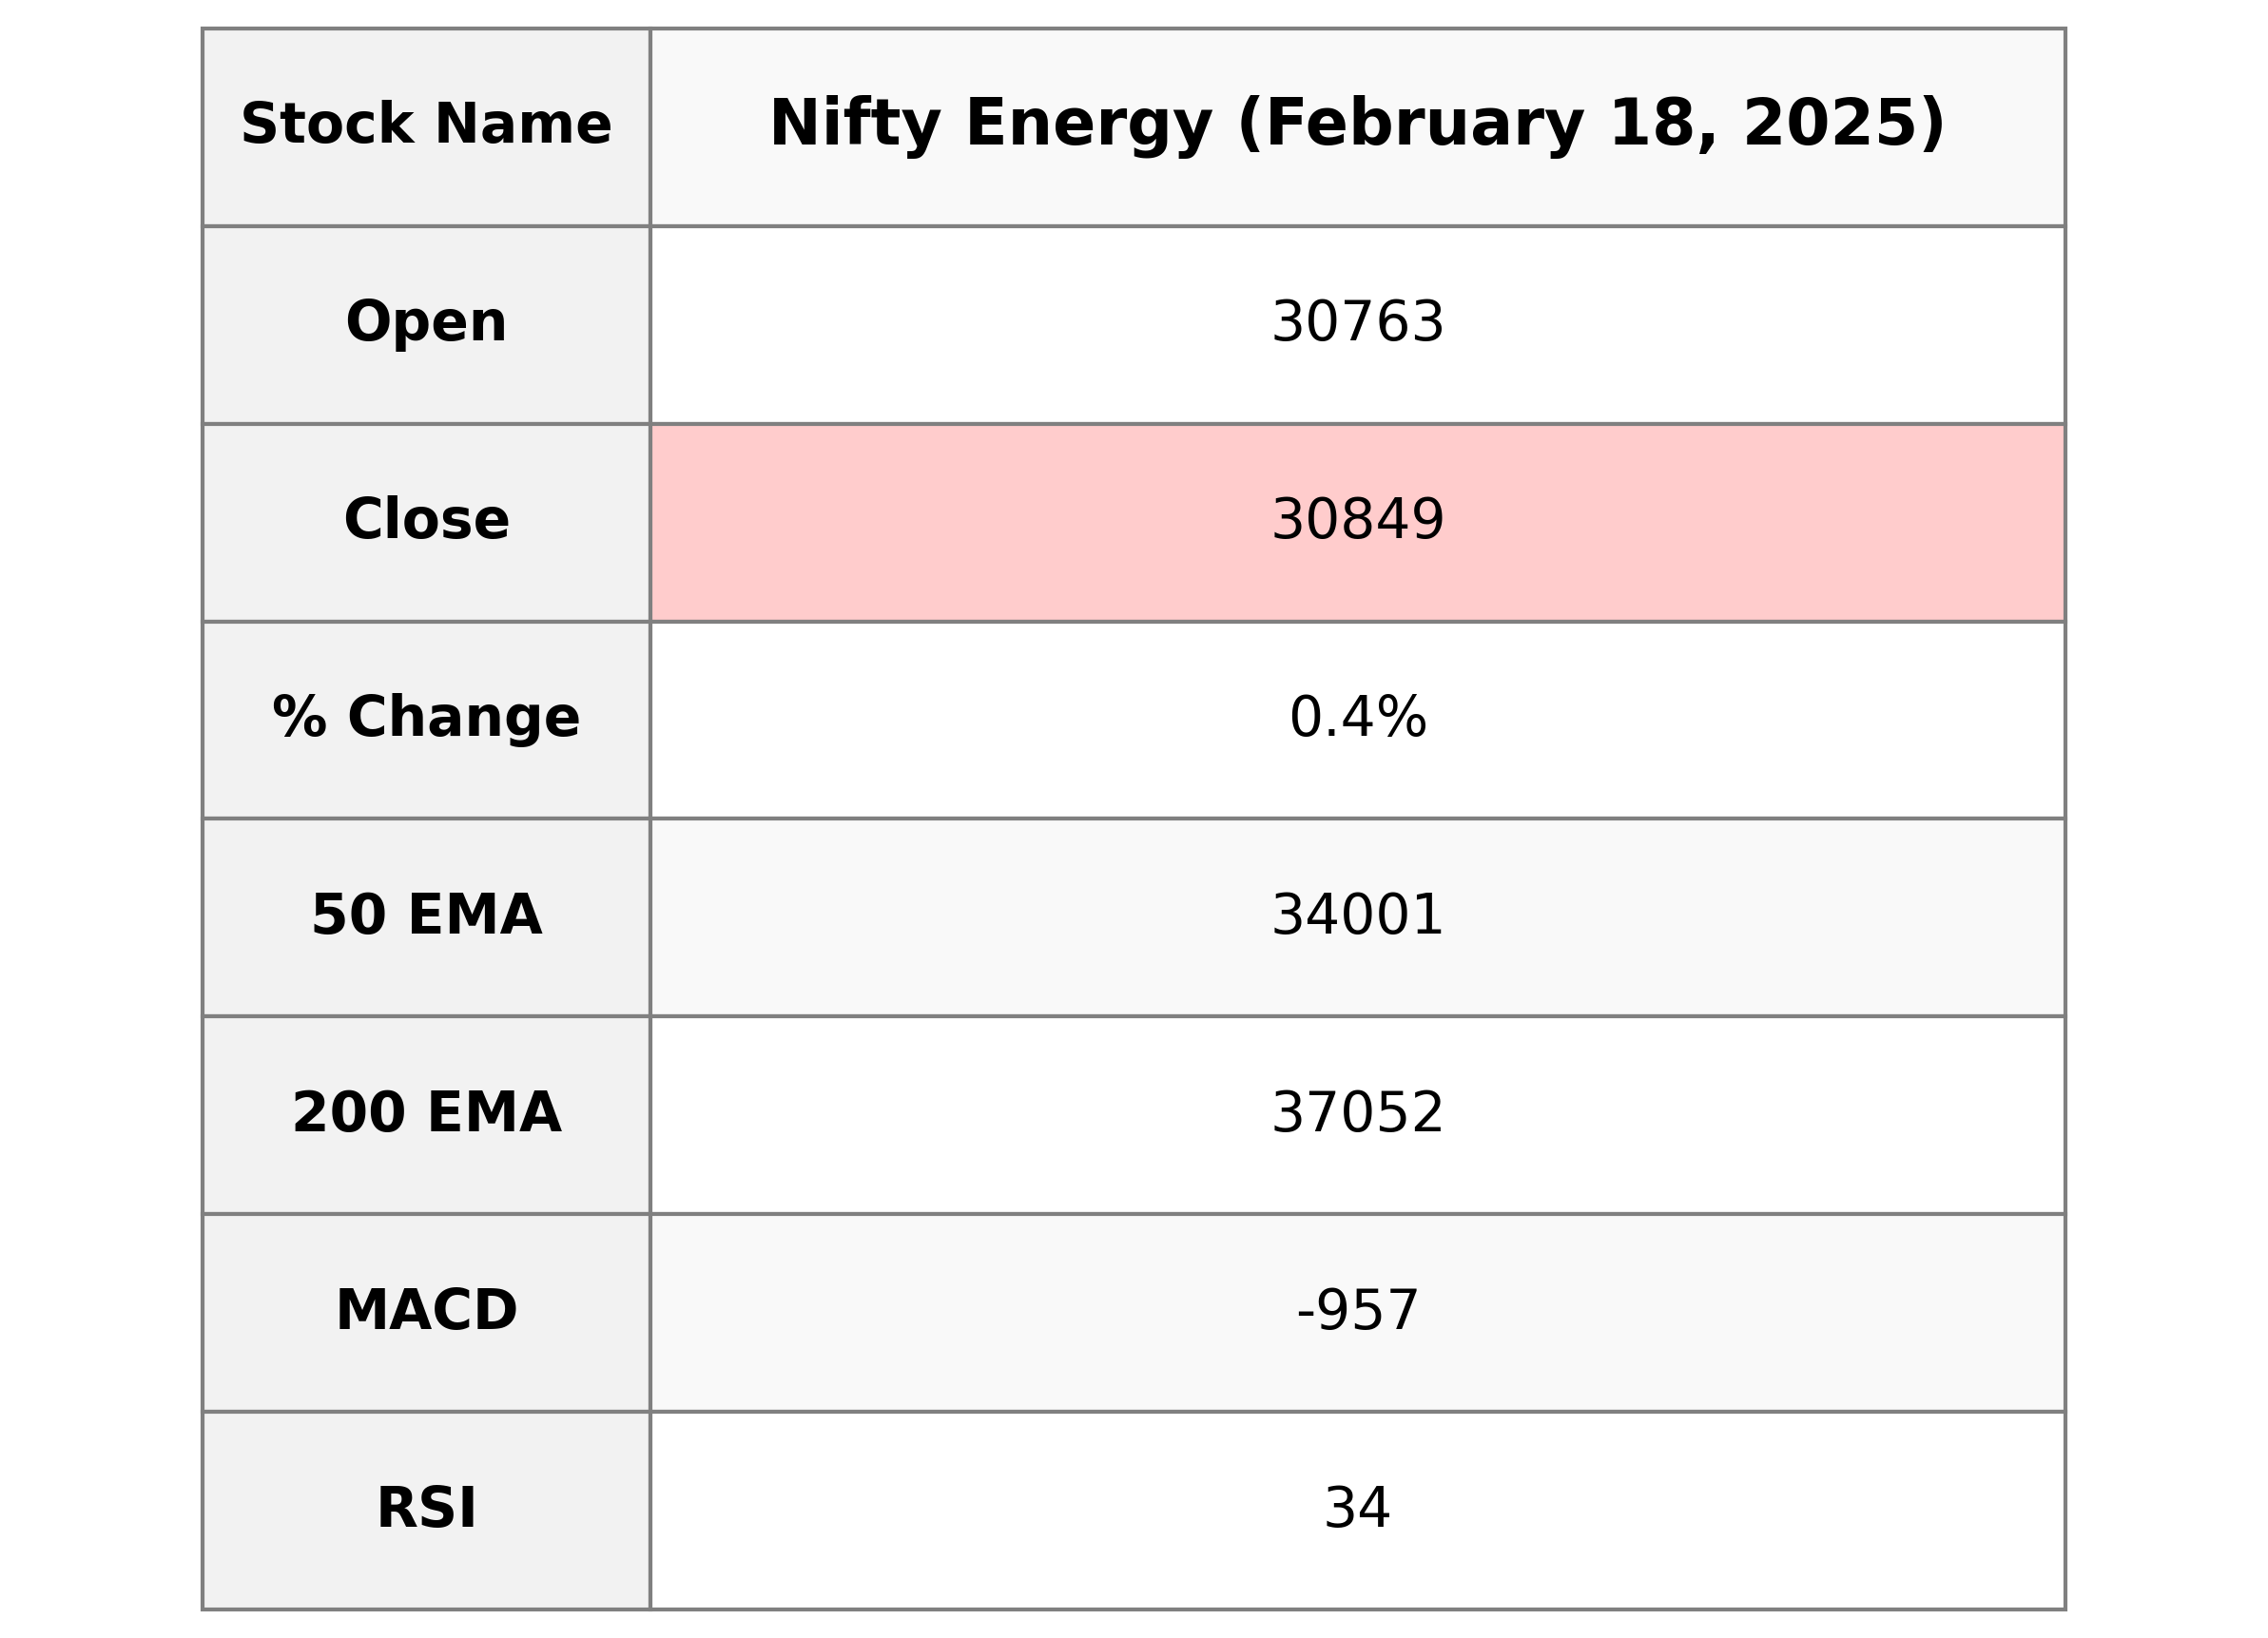
Nifty Energy opened at 30,763.25 and closed at 30,849.05, registering a modest increase of 0.36% with a points change of 111.5. The Relative Strength Index (RSI) is at 34.44, indicating potential oversold conditions, while the MACD is negative at -957.39, suggesting a bearish trend. The stock is trading below its 50-day and 200-day EMAs, reflecting a bearish sentiment in the market.
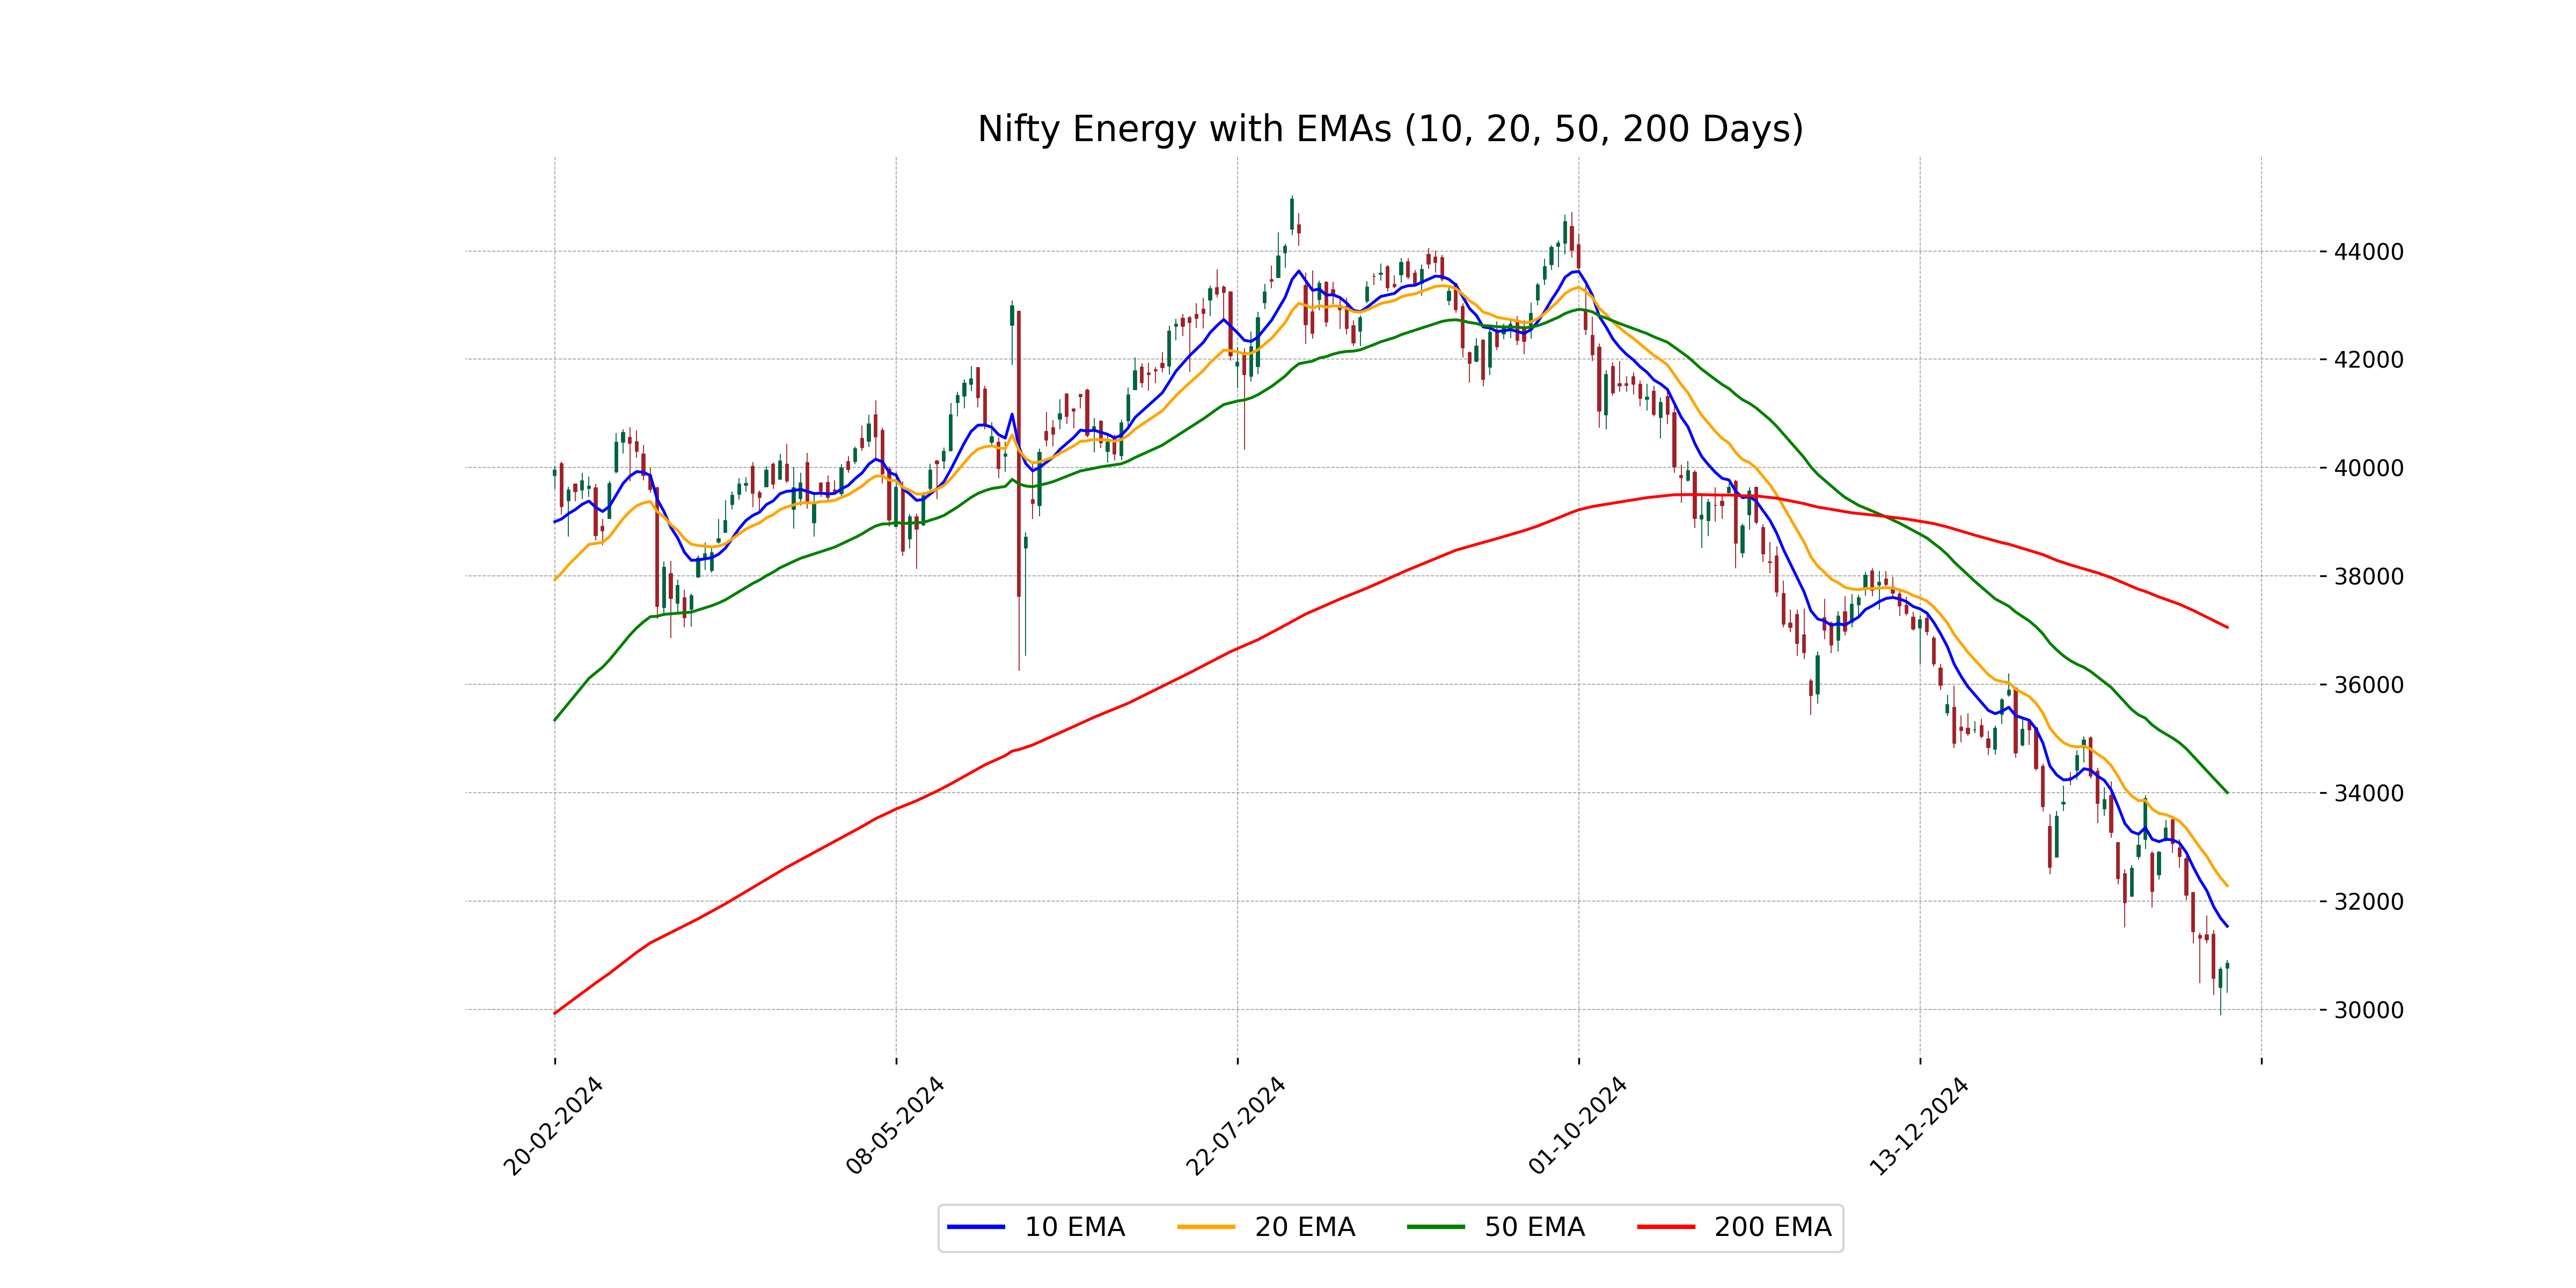
Relationship with Key Moving Averages
Nifty Energy closed at 30,849.05, which is below its 10-day, 20-day, 50-day, and 200-day EMAs, indicating a bearish trend. The stock's RSI of 34.44 also suggests it is approaching oversold territory. With a MACD of -957.39, Nifty Energy further confirms a downward momentum below its signal line.
Moving Averages Trend (MACD)
The MACD for Nifty Energy is -957.39, with a MACD Signal of -837.69, indicating a bearish trend as the MACD is below the signal line. This suggests potential continued downward momentum in the short term.
RSI Analysis
The RSI for Nifty Energy is 34.44, which suggests that the stock is approaching the oversold region, typically considered below 30. This could indicate potential undervaluation, but further analysis is recommended to confirm any buying opportunities.

Analysis for Nifty FMCG - February 18, 2025

The Nifty FMCG index opened at 52,897.55 and closed at 52,480.5, marking a decrease of 0.88% or 464.5 points from its previous close of 52,945. The technical indicators suggest a bearish trend, with the index trading below its 10, 20, 50, and 200-day EMAs and a low RSI of 26.35. Additionally, the MACD is negative, indicating further downside potential.
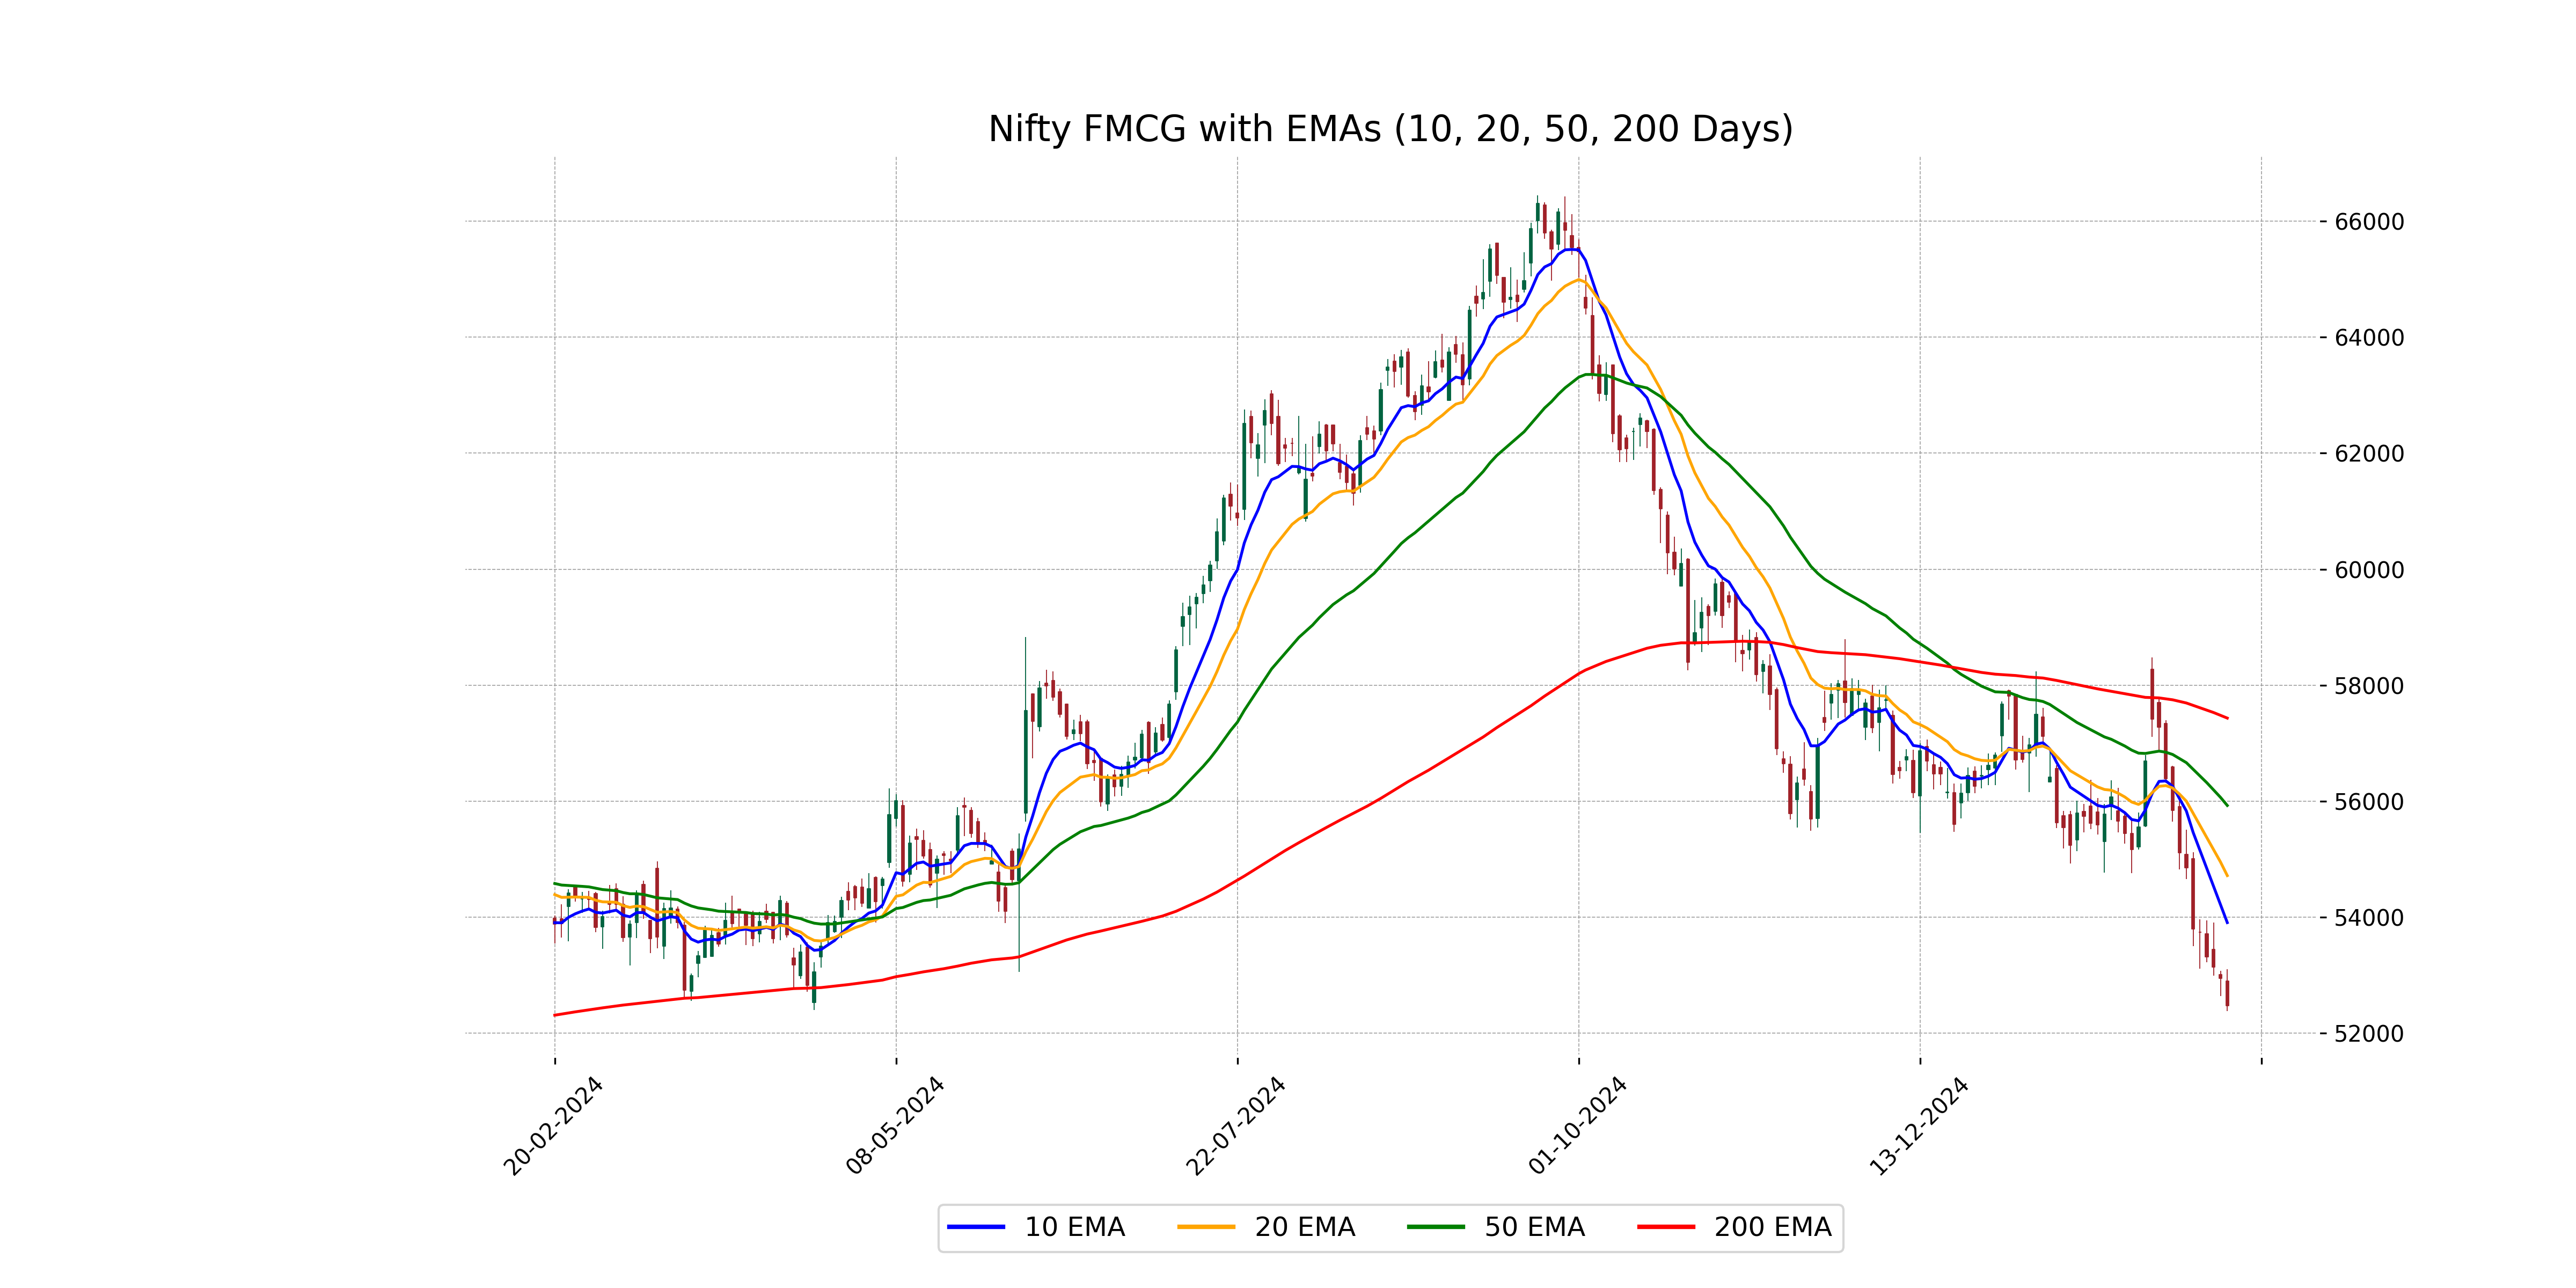
Relationship with Key Moving Averages
The current closing price of Nifty FMCG at 52,480.5 is below all its key moving averages: the 50-day EMA at 55,926.86, the 200-day EMA at 57,432.87, the 10-day EMA at 53,908.45, and the 20-day EMA at 54,718.39. This indicates a bearish trend as it is trading lower than these averages.
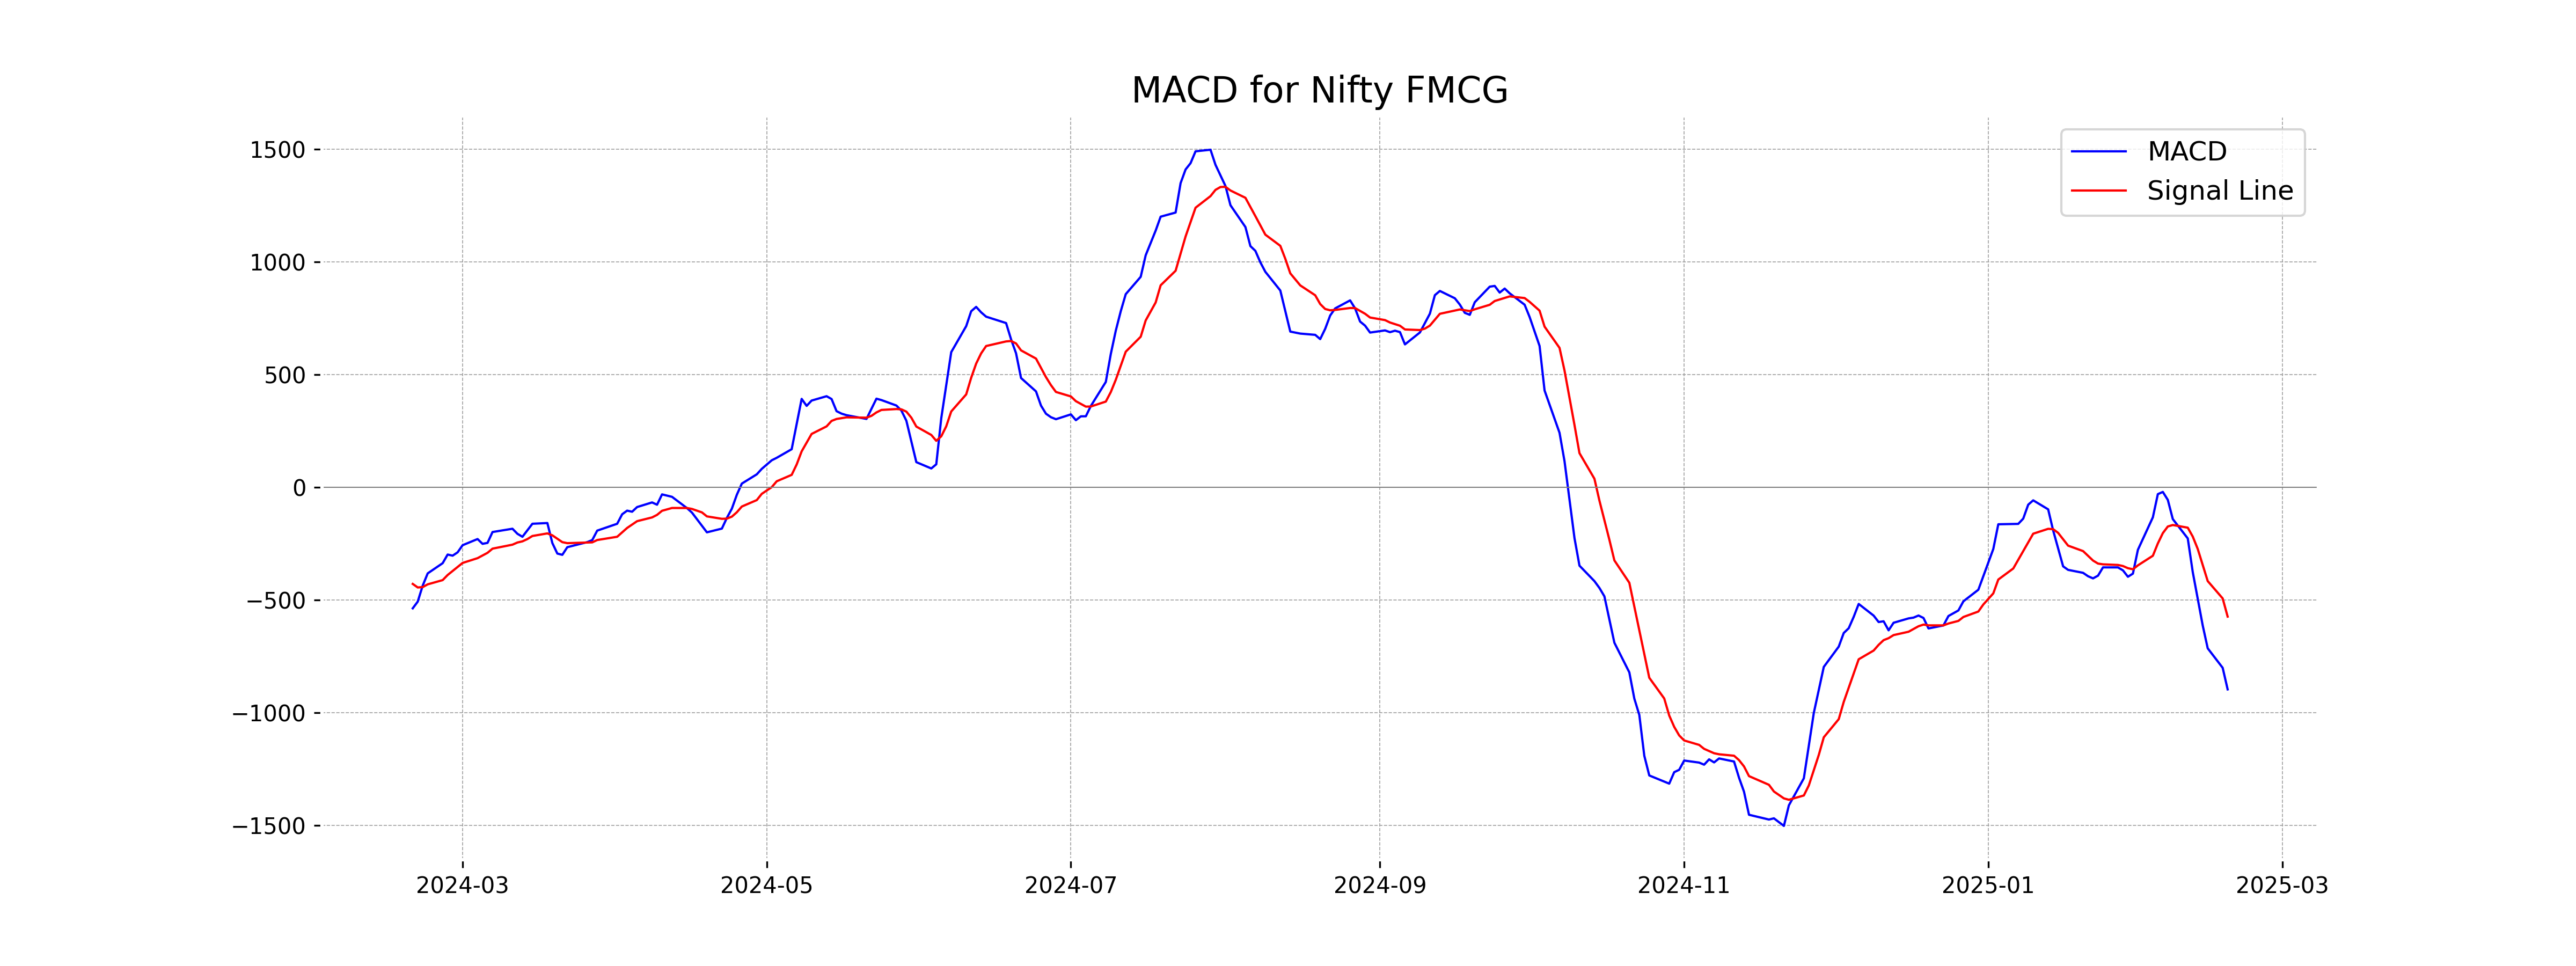
Moving Averages Trend (MACD)
The MACD analysis for Nifty FMCG indicates bearish momentum, as shown by the negative MACD value of -895.87, which is below the MACD Signal line at -573.21. This suggests that the stock may continue to decline unless there's a positive reversal in trends.
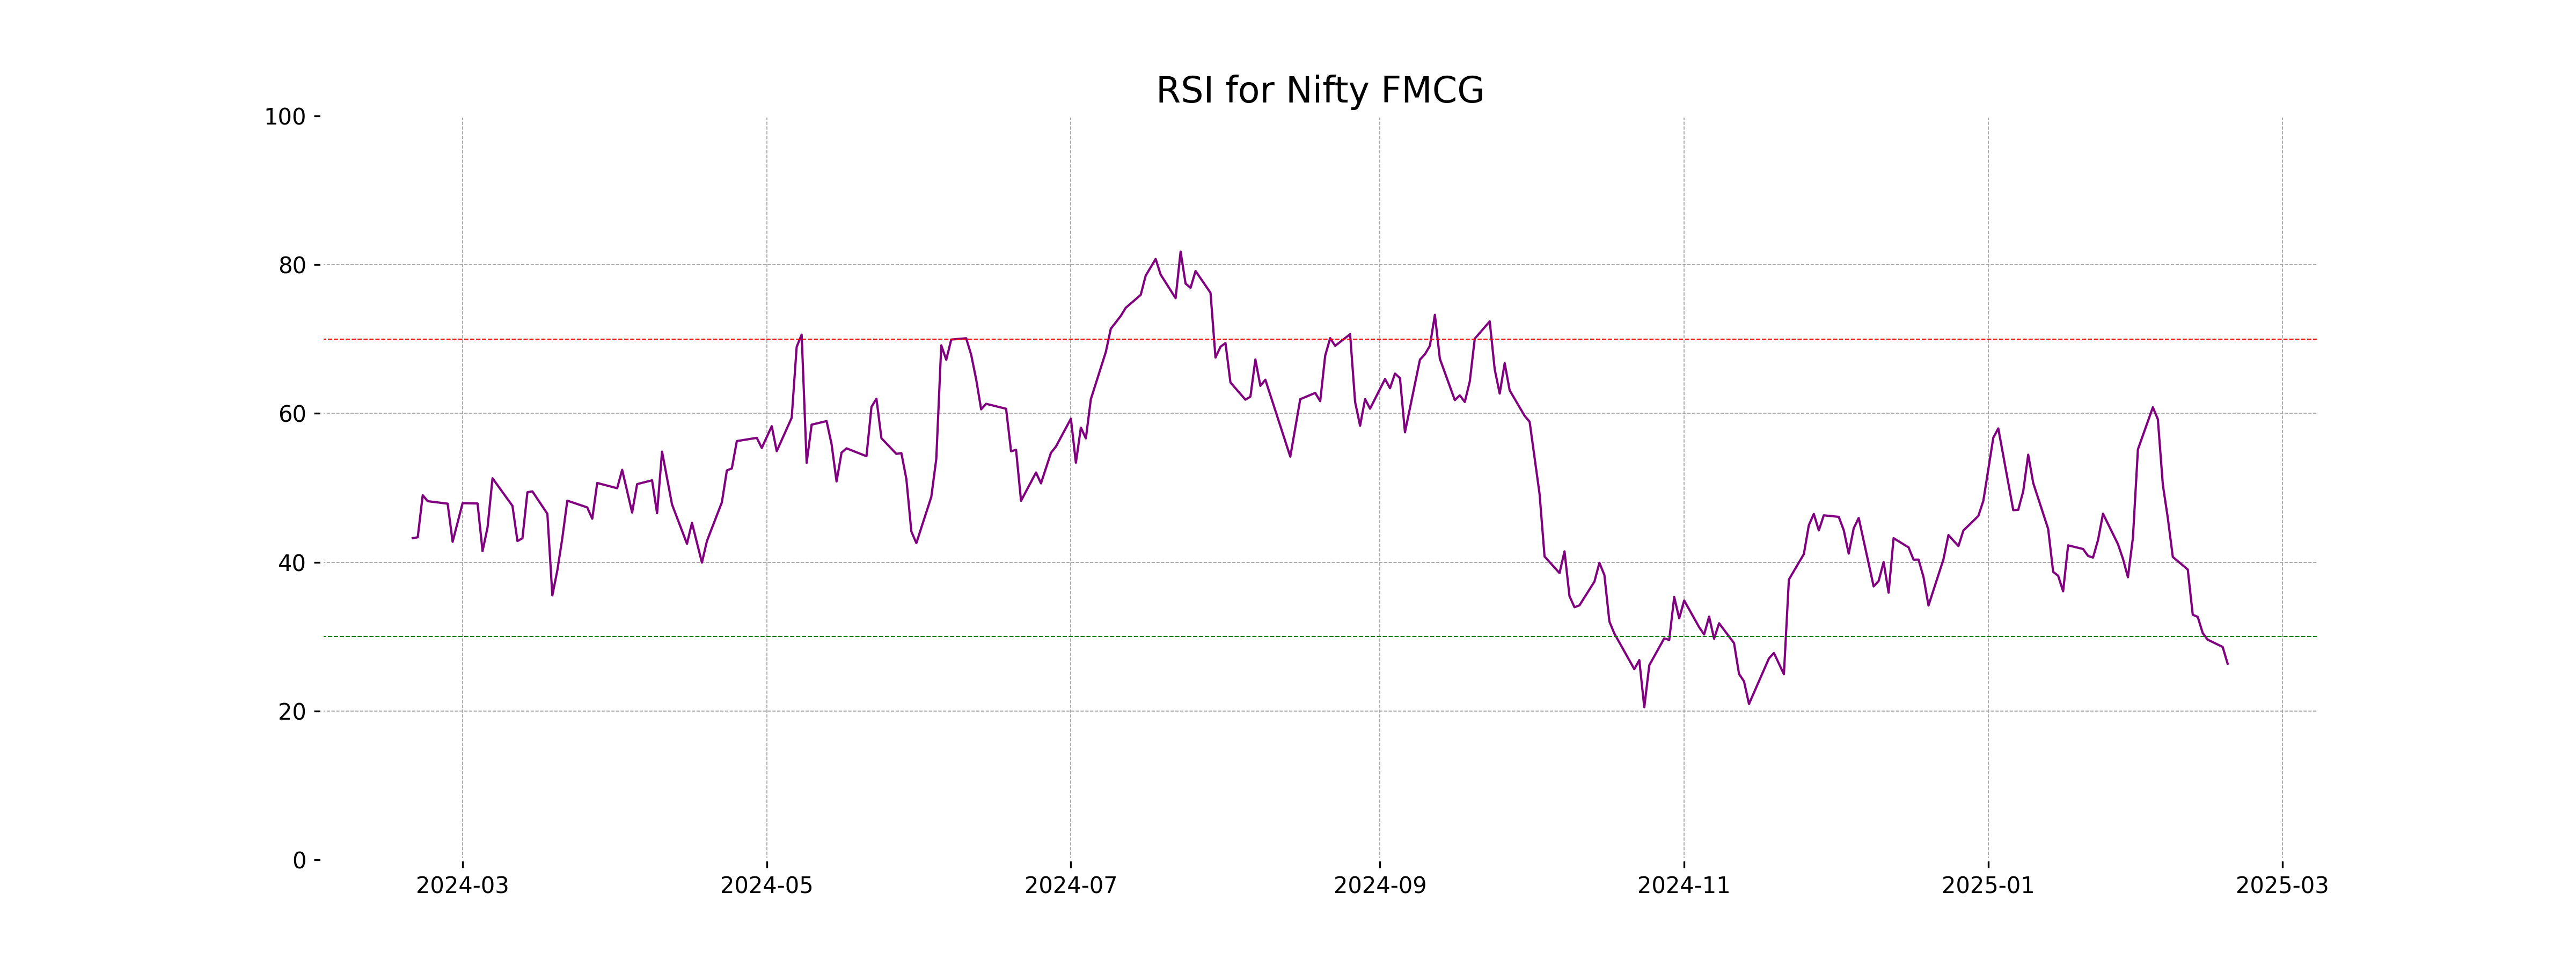
RSI Analysis
The Nifty FMCG index has an RSI of 26.35, which indicates it is in an oversold condition. This typically suggests that the index may be undervalued or that a potential rebound could occur in the near future.
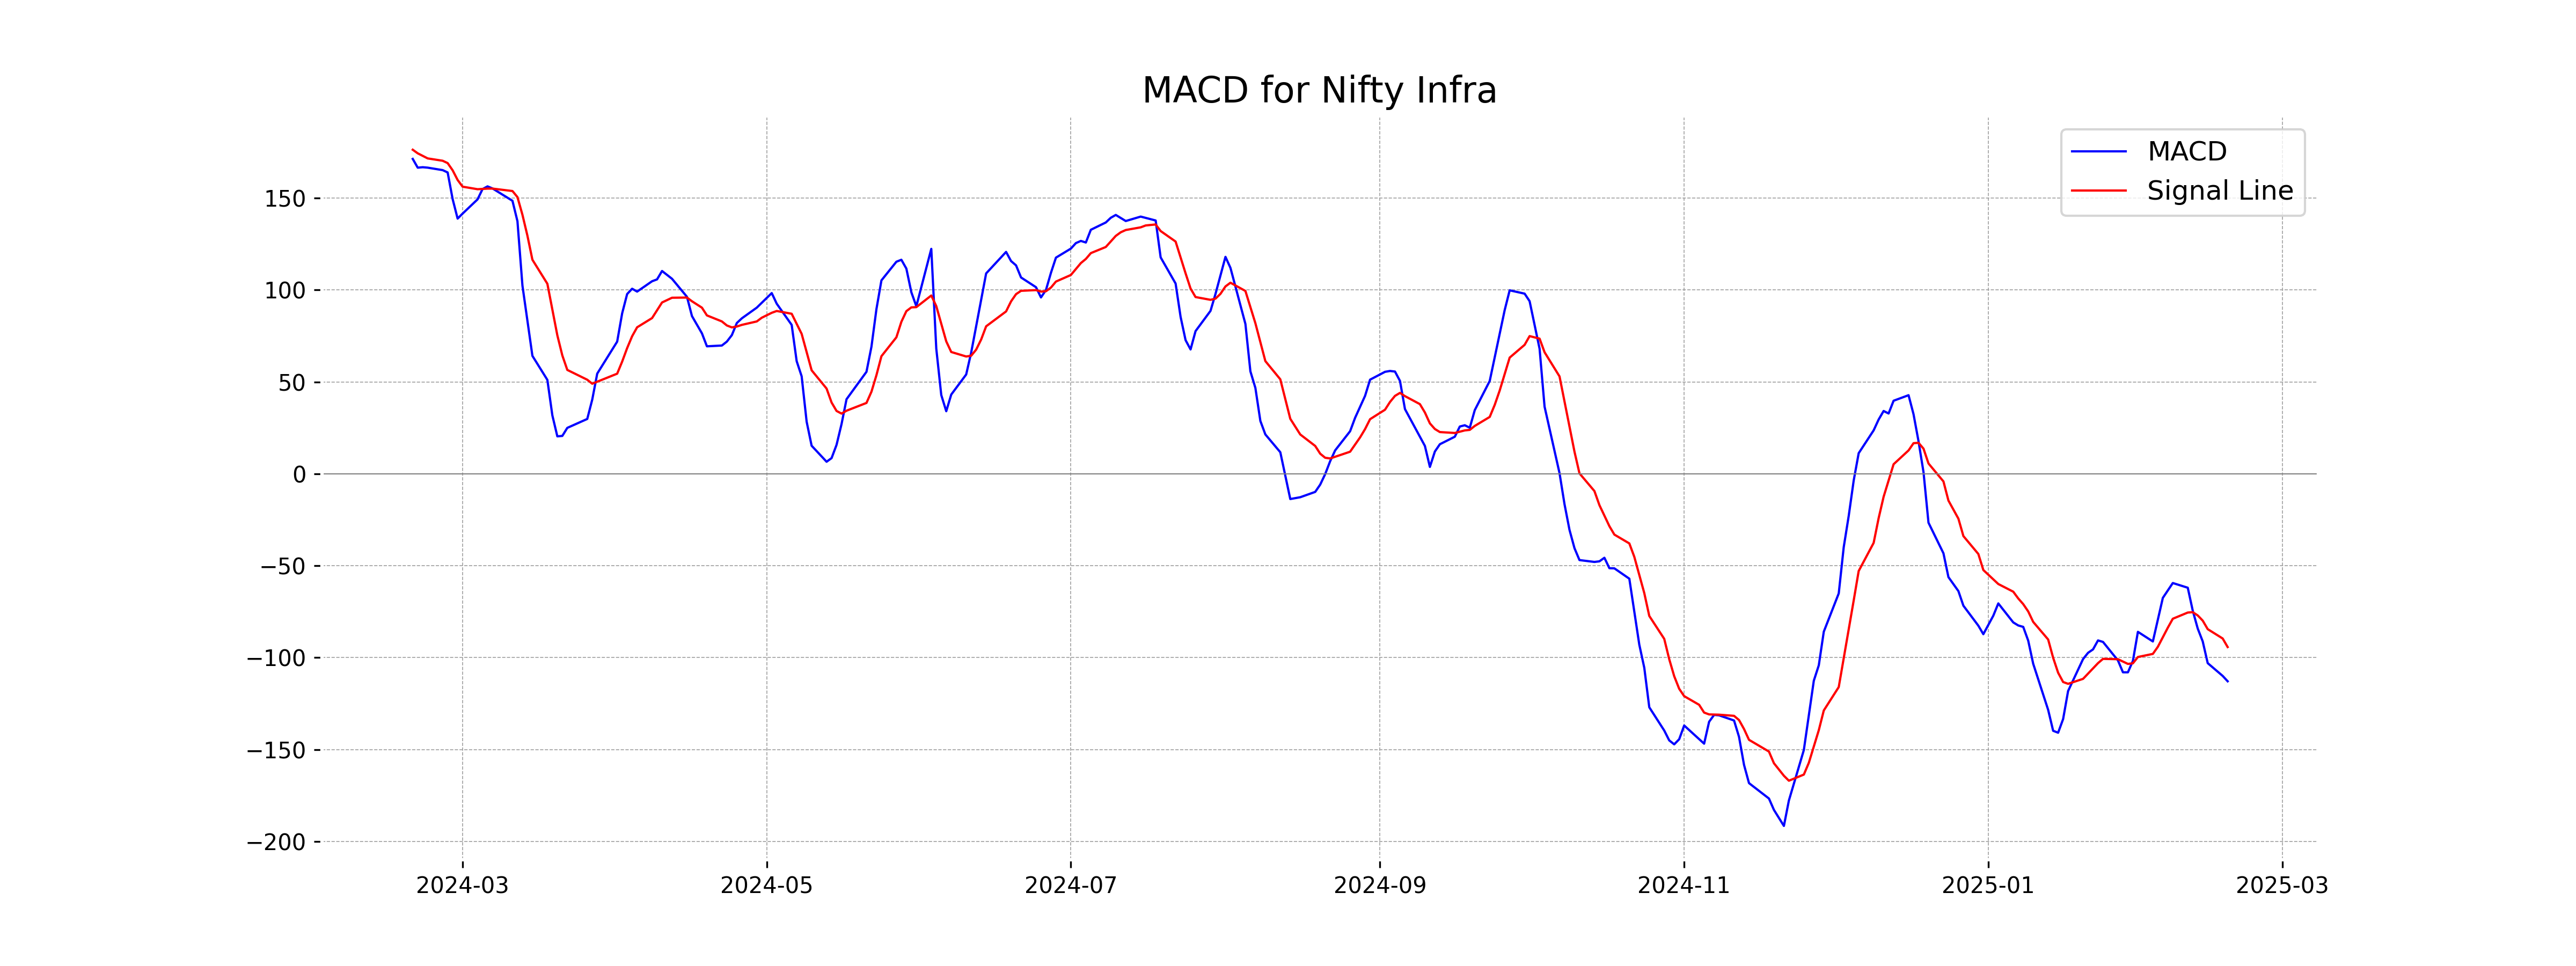
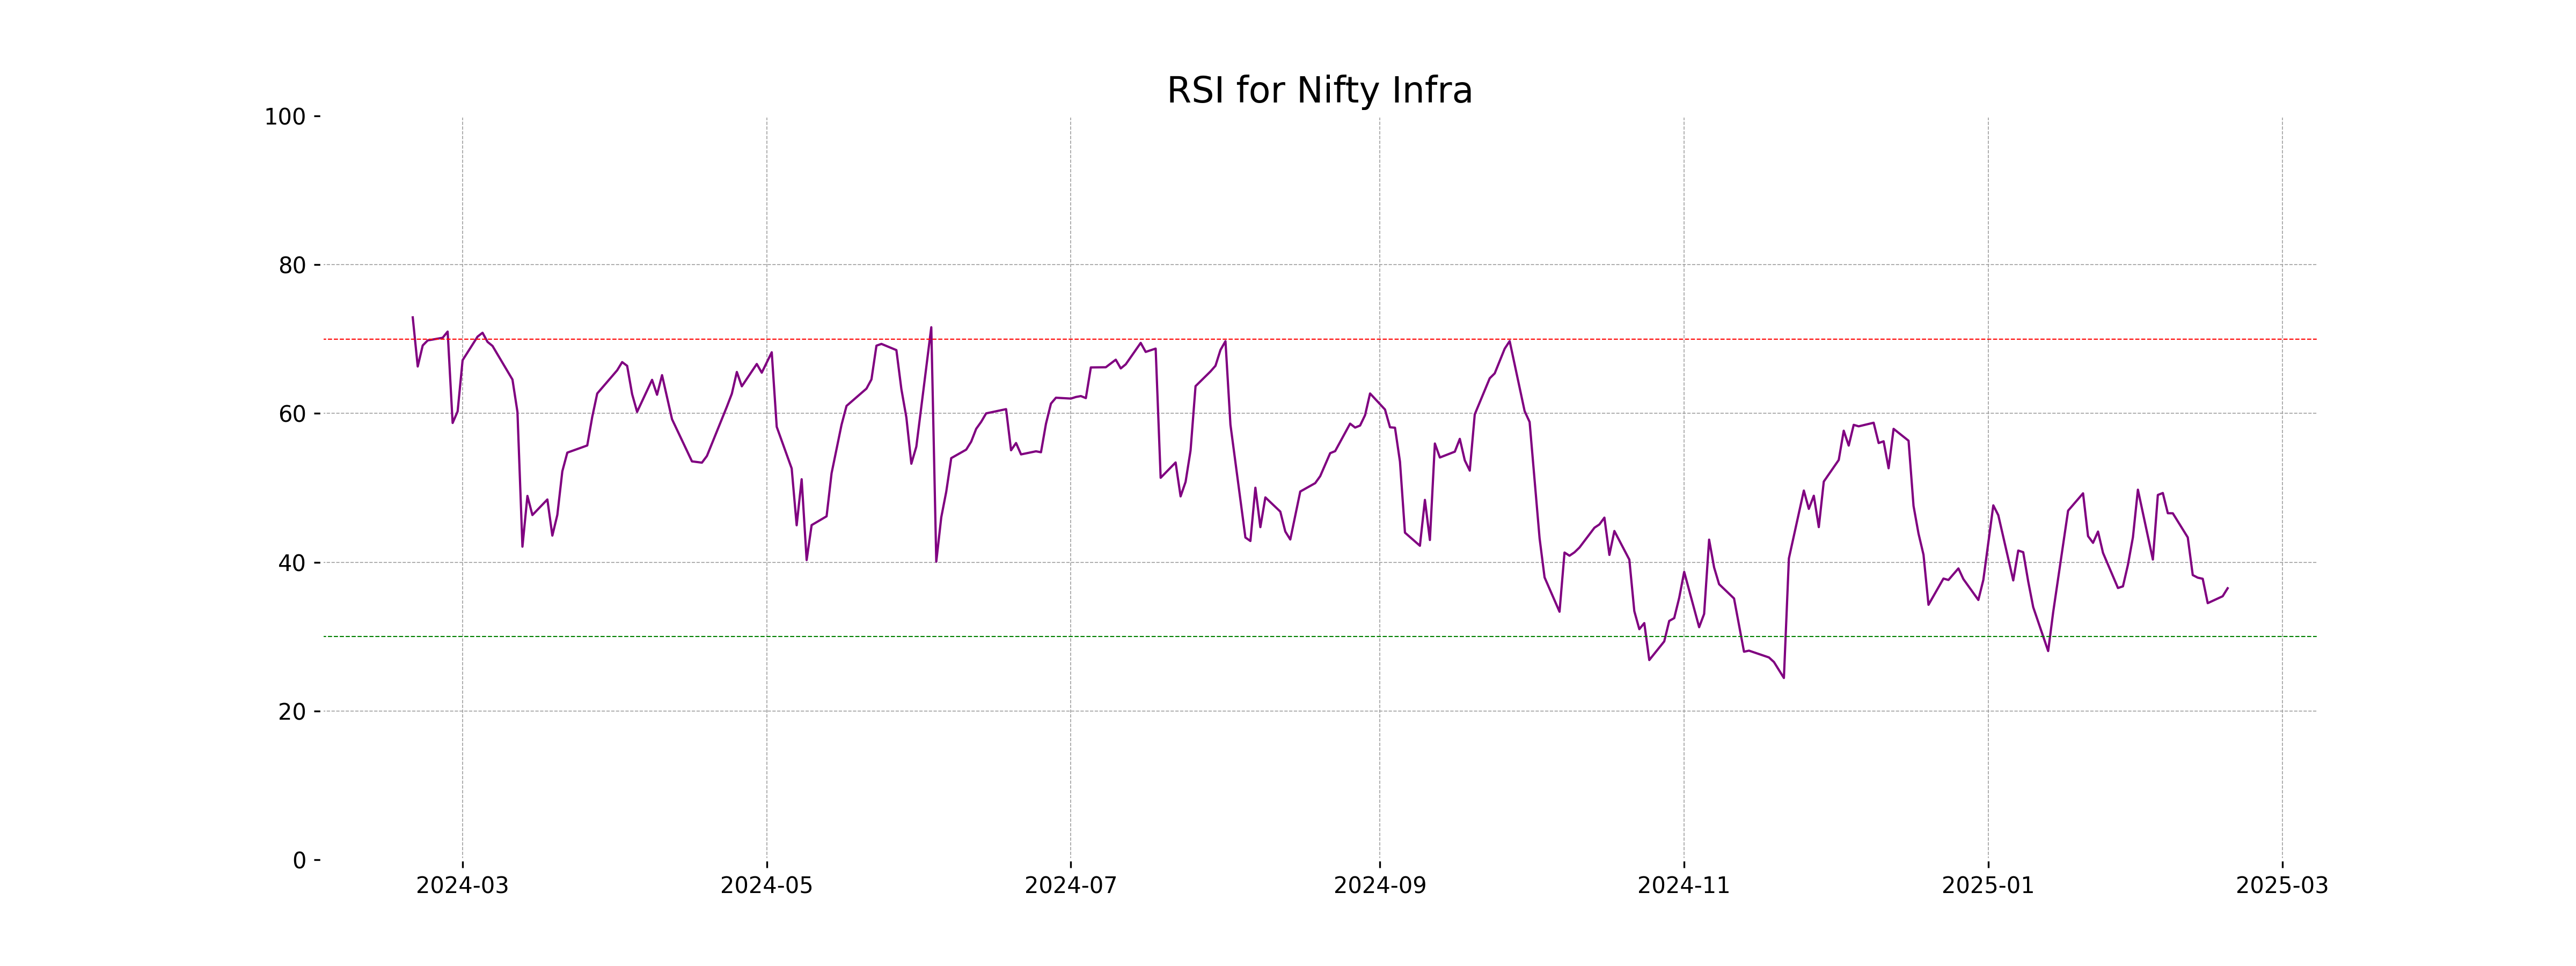
Analysis for Nifty Infra - February 18, 2025

Nifty Infra opened at 7951.90 and closed at 7953.20, marking a slight gain from the previous close with a percentage change of 0.20%. The volume was notably low at 0, and the index is trading below its 50, 200, 10, and 20 EMAs, indicating potential bearish momentum, while the RSI at 36.50 suggests it may be approaching oversold conditions. The MACD reading is negative, further supporting a bearish outlook.
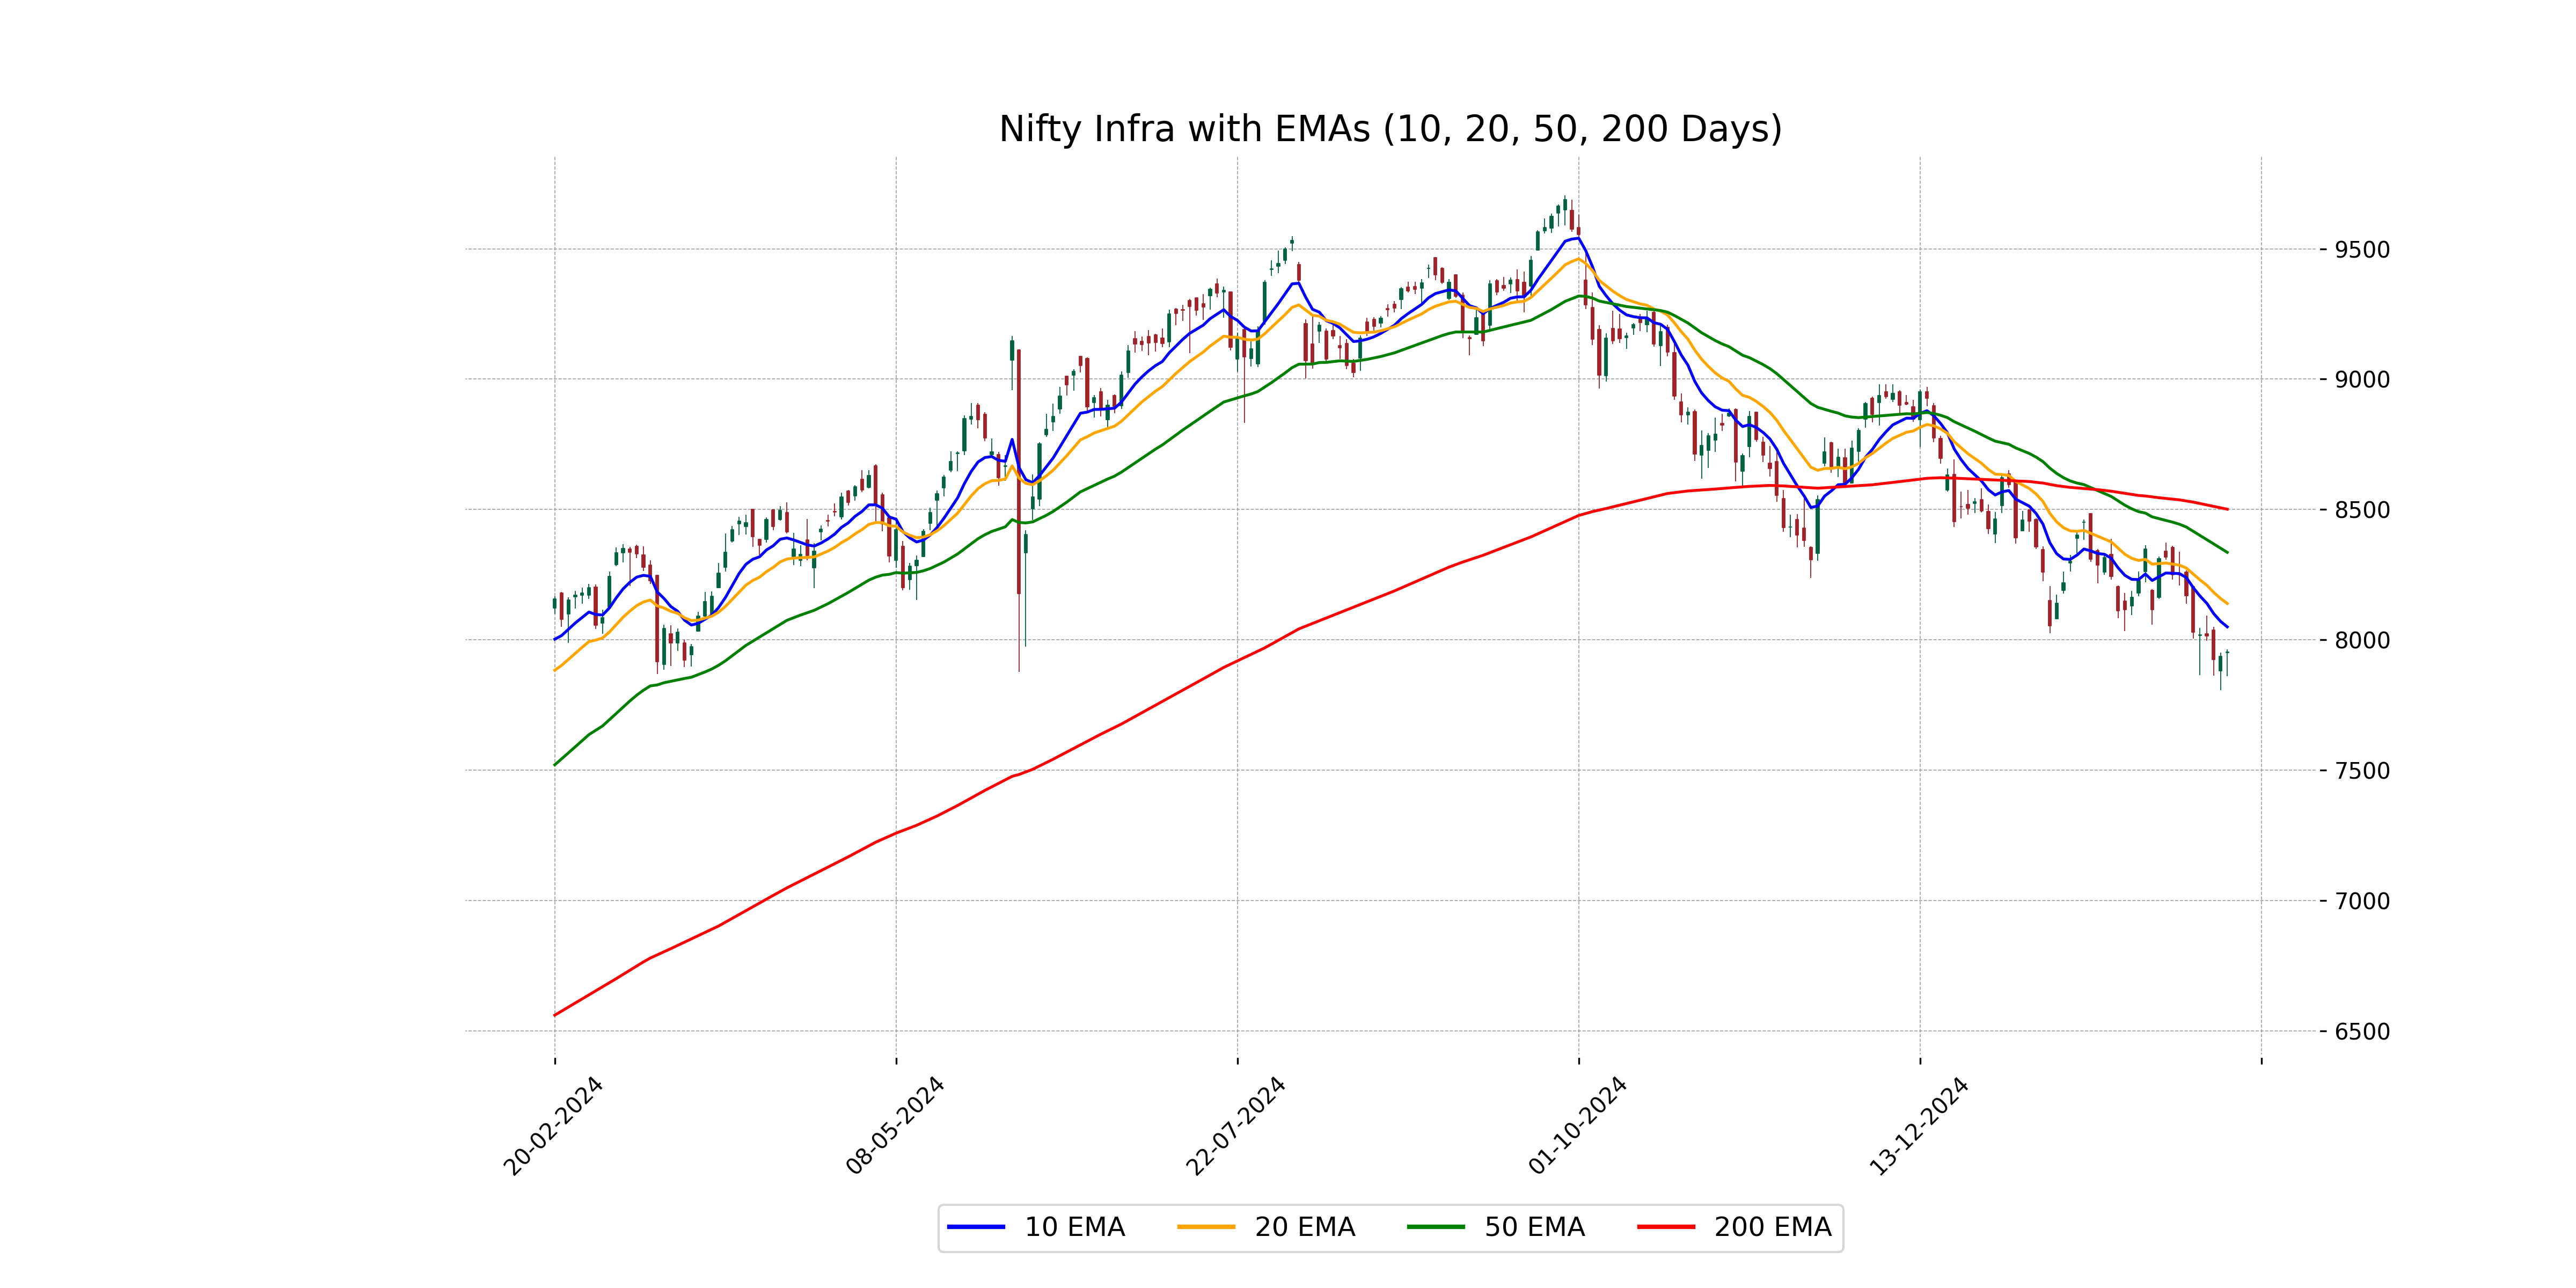
Relationship with Key Moving Averages
Nifty Infra closed at 7953.20, which is below its 50 EMA at 8335.41, 200 EMA at 8500.93, 10 EMA at 8049.56, and 20 EMA at 8139.22. This positioning indicates a bearish trend, as the closing price is below all major moving averages.
Moving Averages Trend (MACD)
The Nifty Infra shows a negative MACD value of -112.84, which is below the MACD signal line at -94.22. This suggests a bearish trend, indicating that recent momentum in the index has been downward, which may imply continued pressure unless there is a reversal.
RSI Analysis
Nifty Infra RSI Analysis: The Relative Strength Index (RSI) for Nifty Infra is at 36.50, indicating it is nearing oversold territory. Typically, an RSI below 30 suggests an asset may be undervalued or weakening, while levels closer to 70 indicate overbought conditions. Current RSI suggests limited selling pressure but not yet deeply oversold.
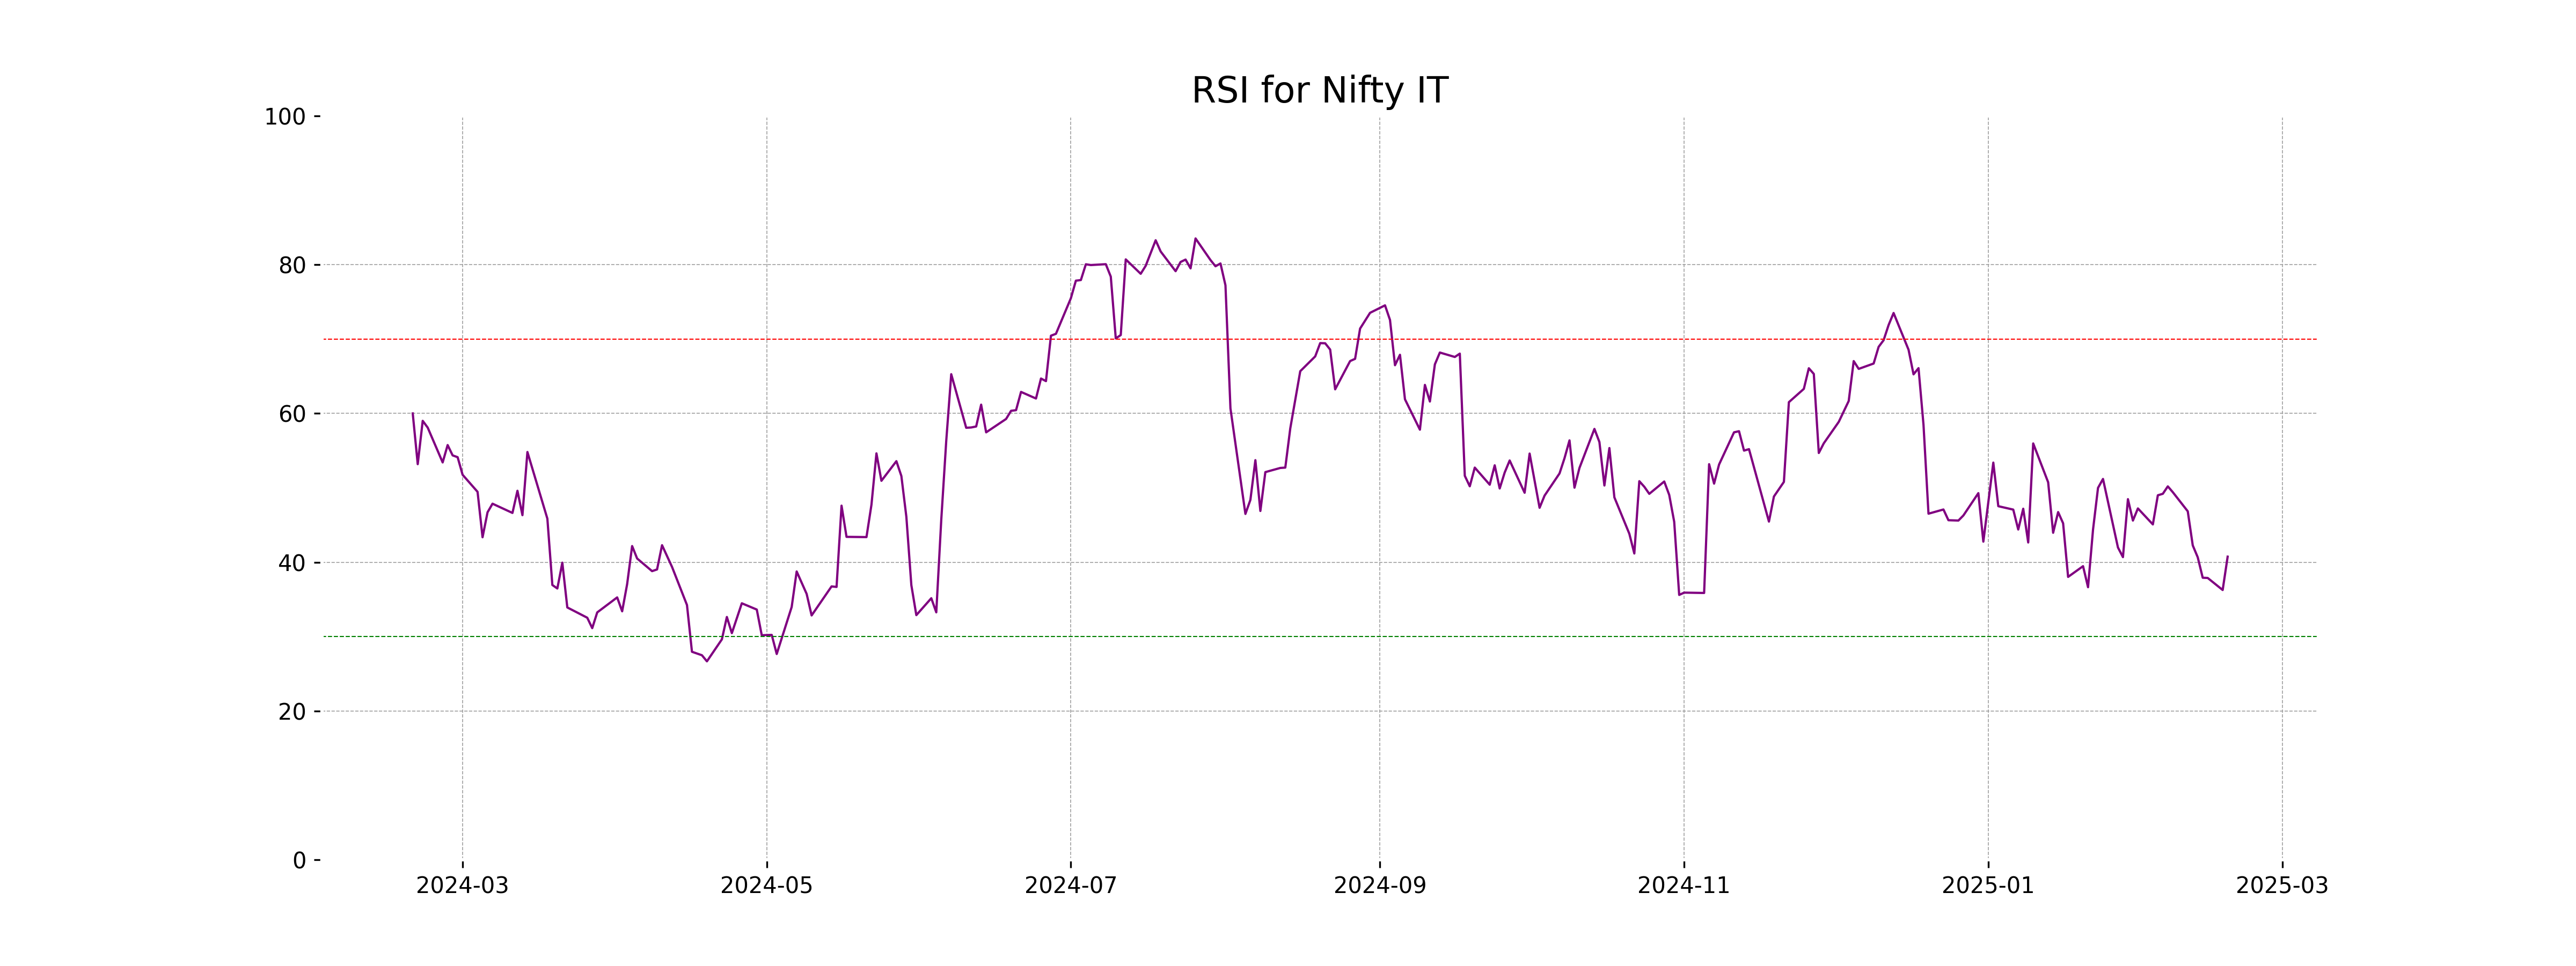
Analysis for Nifty IT - February 18, 2025
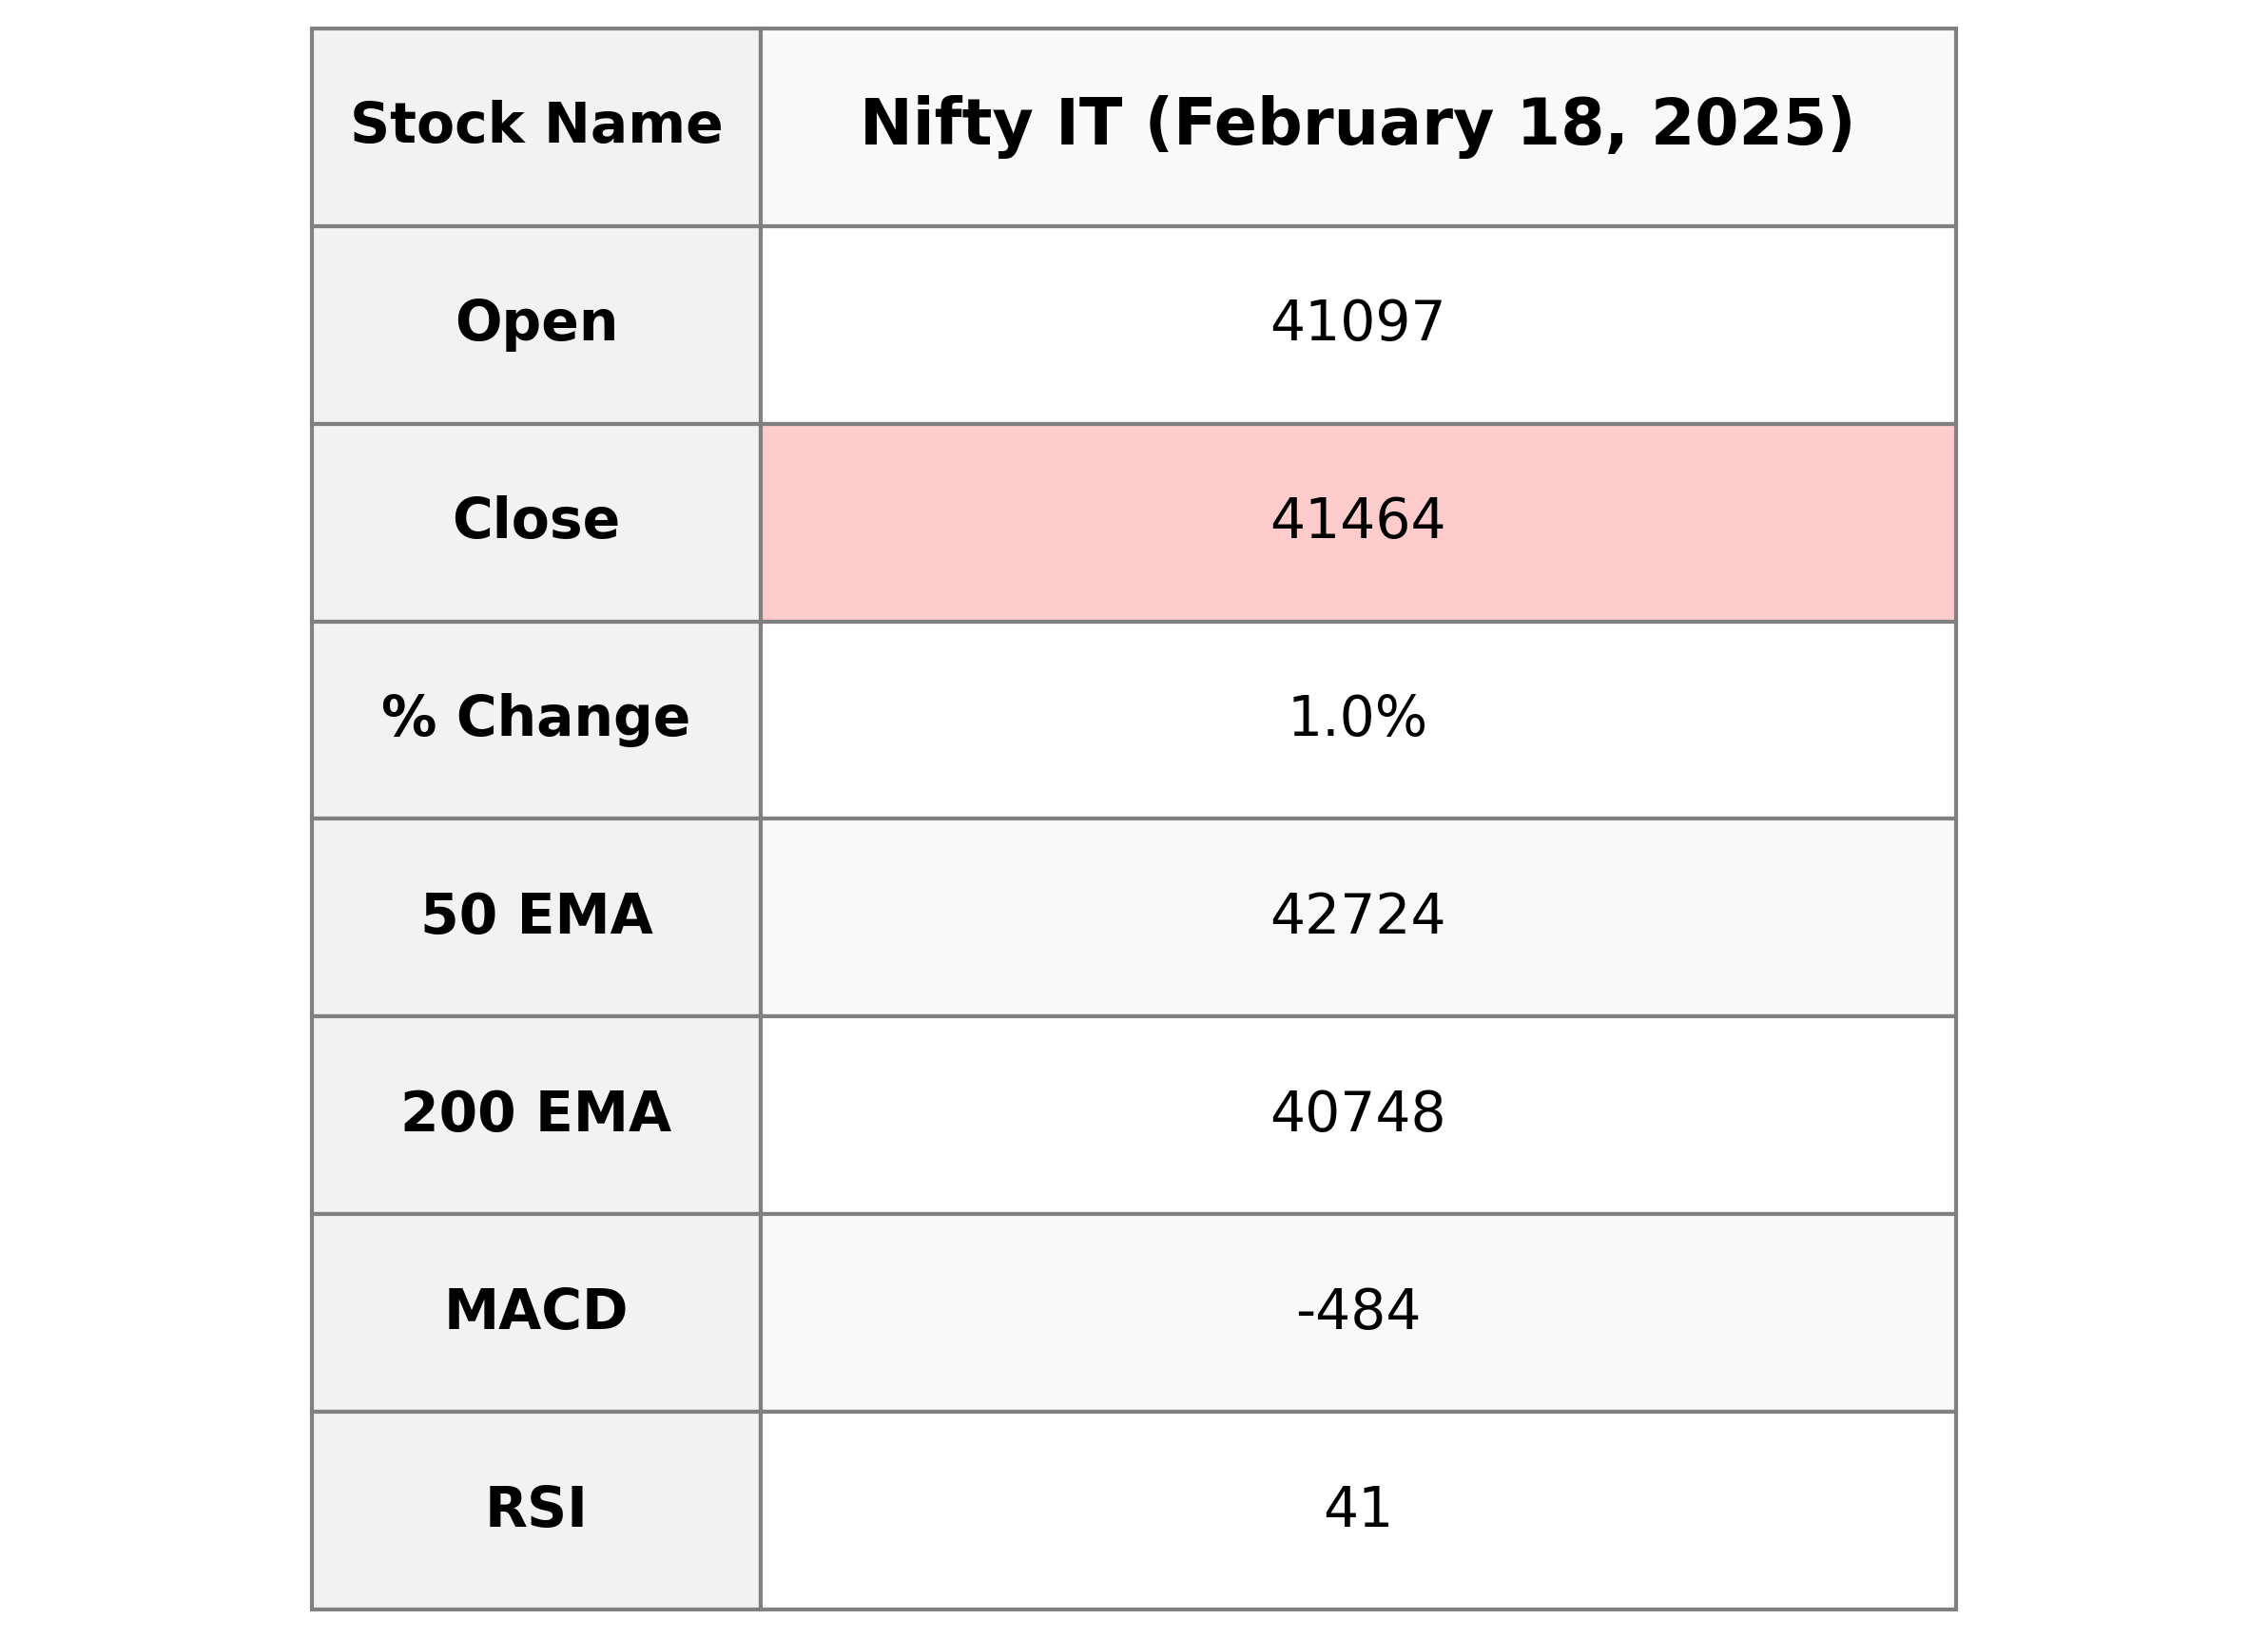
Nifty IT opened at 41,097.45 and closed at 41,464.35, showing a positive change of 0.95% with a points increase of 391.15. The RSI is 40.75, indicating a relatively neutral momentum, while the MACD suggests a bearish trend with a value of -483.75. Despite the gain, the current price is below the 50-day EMA of 42,723.86, hinting at a potential resistance level.
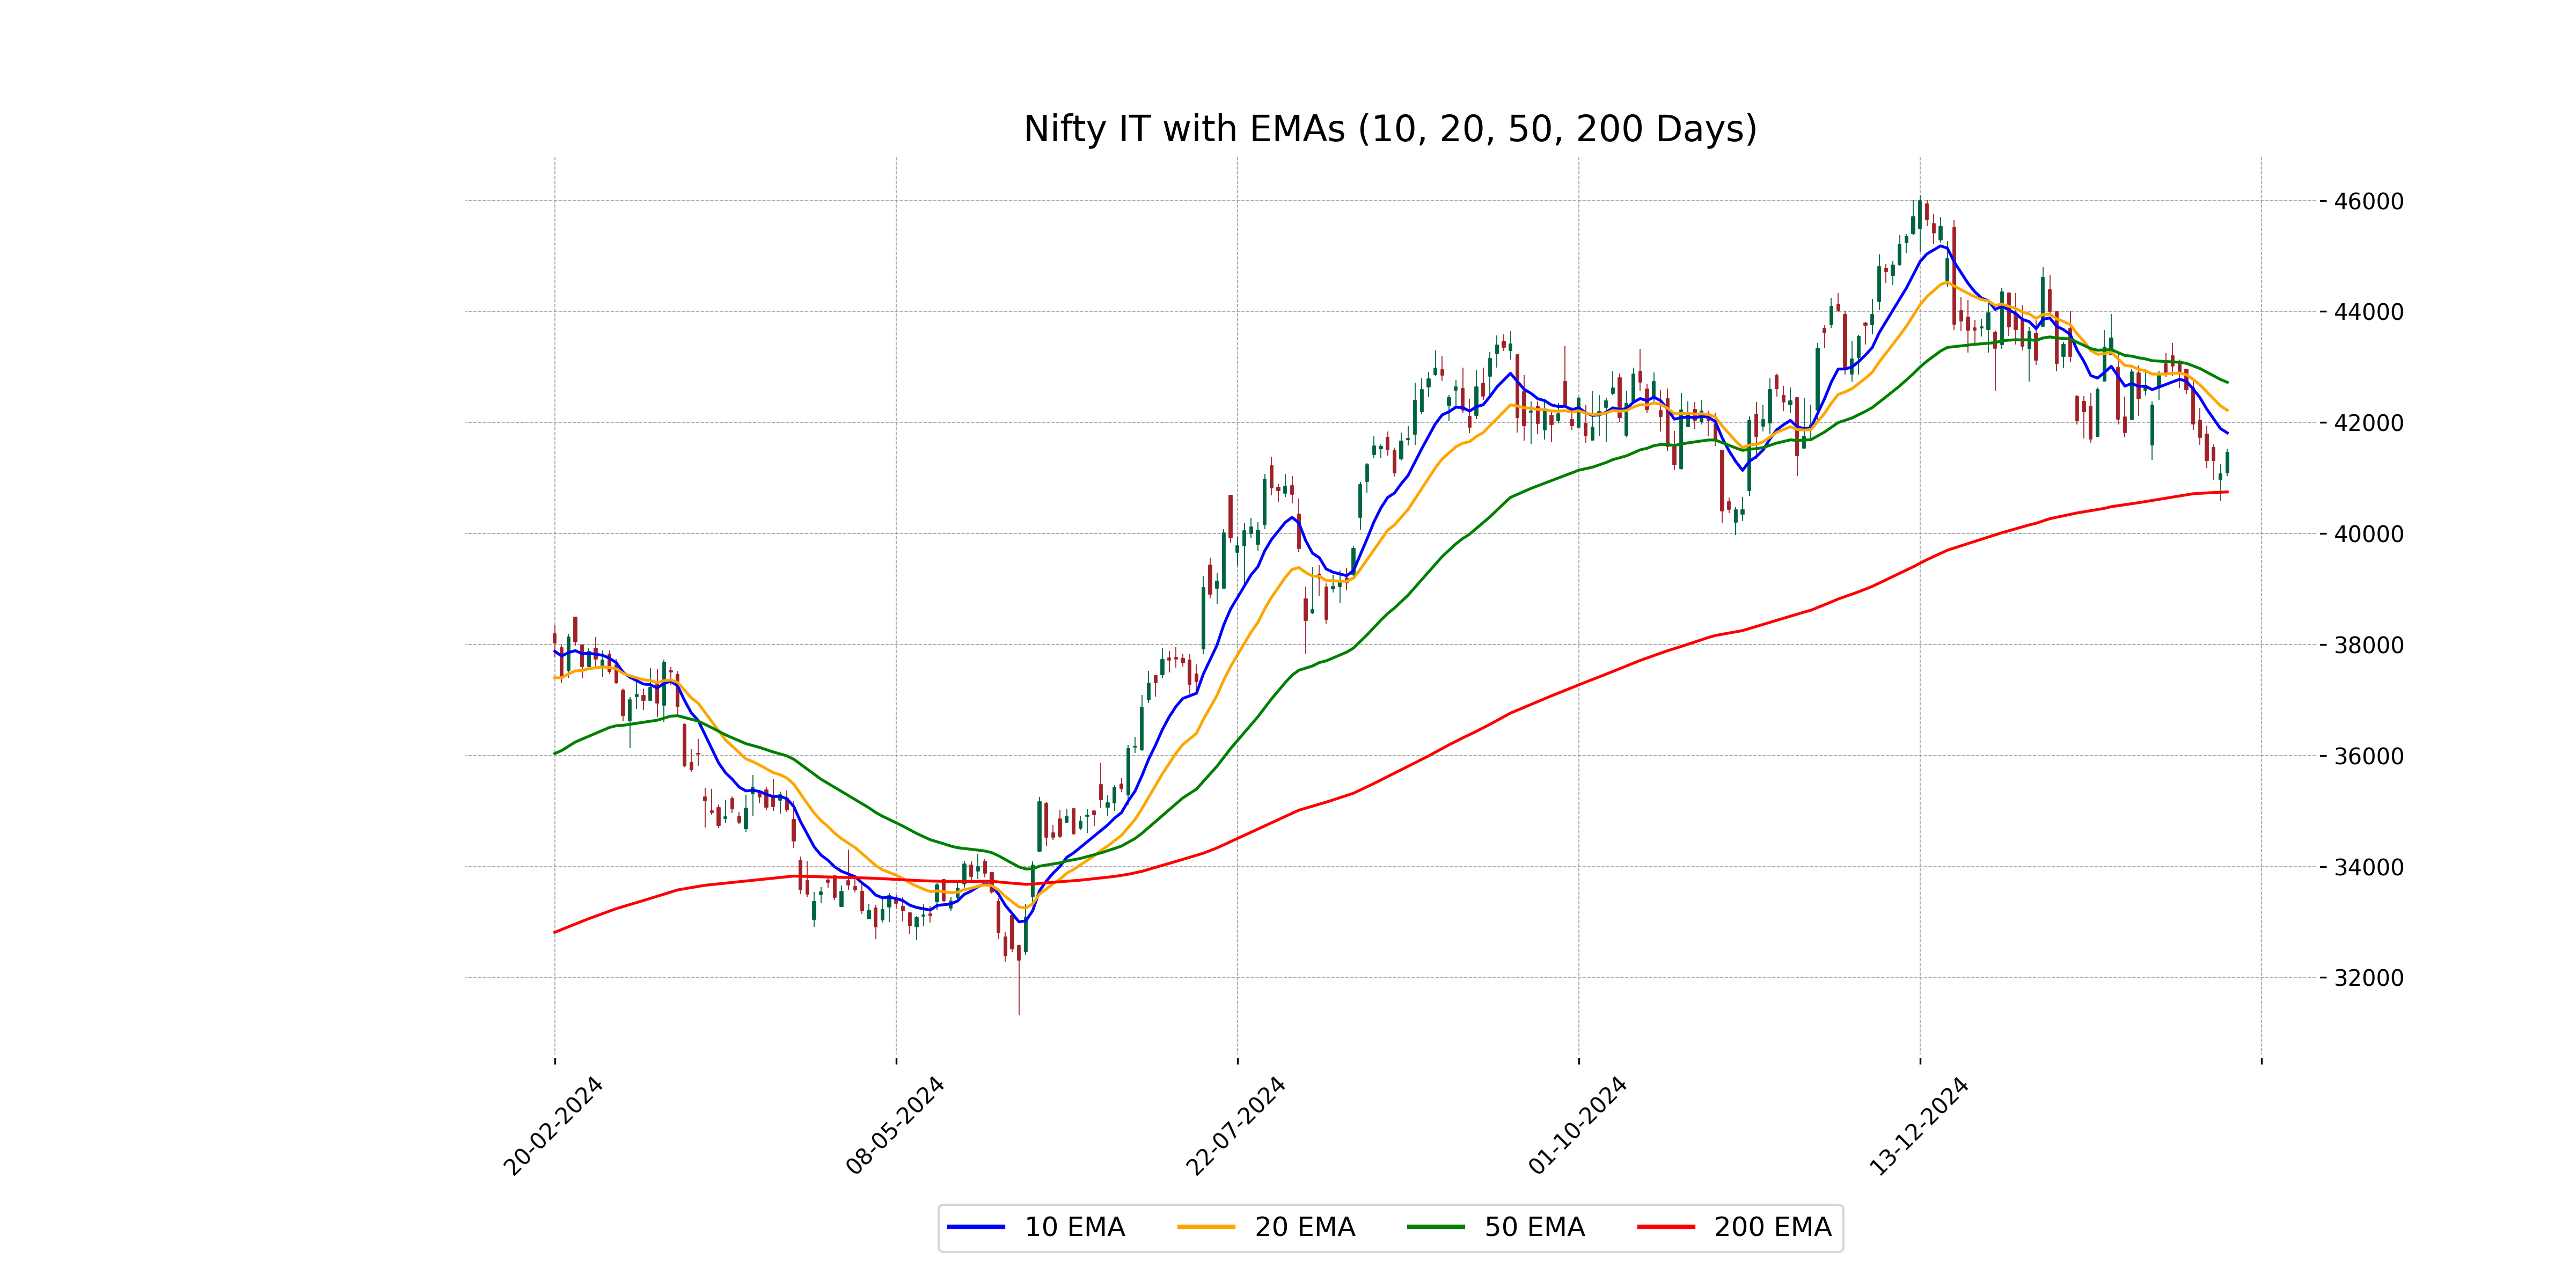
Relationship with Key Moving Averages
The Nifty IT index closed at 41464.35, which is below its 10 EMA of 41812.51, 20 EMA of 42221.09, and 50 EMA of 42723.86, indicating it is currently trading below these key short to mid-term averages. This positioning suggests a potential bearish sentiment in the short-term and mid-term outlook.
Moving Averages Trend (MACD)
The MACD for Nifty IT is negative at -483.75, while the MACD Signal is -373.28, indicating a bearish sentiment with the MACD line below the signal line. This suggests downward momentum, but traders should look for potential reversals if the MACD begins to converge towards the signal line.
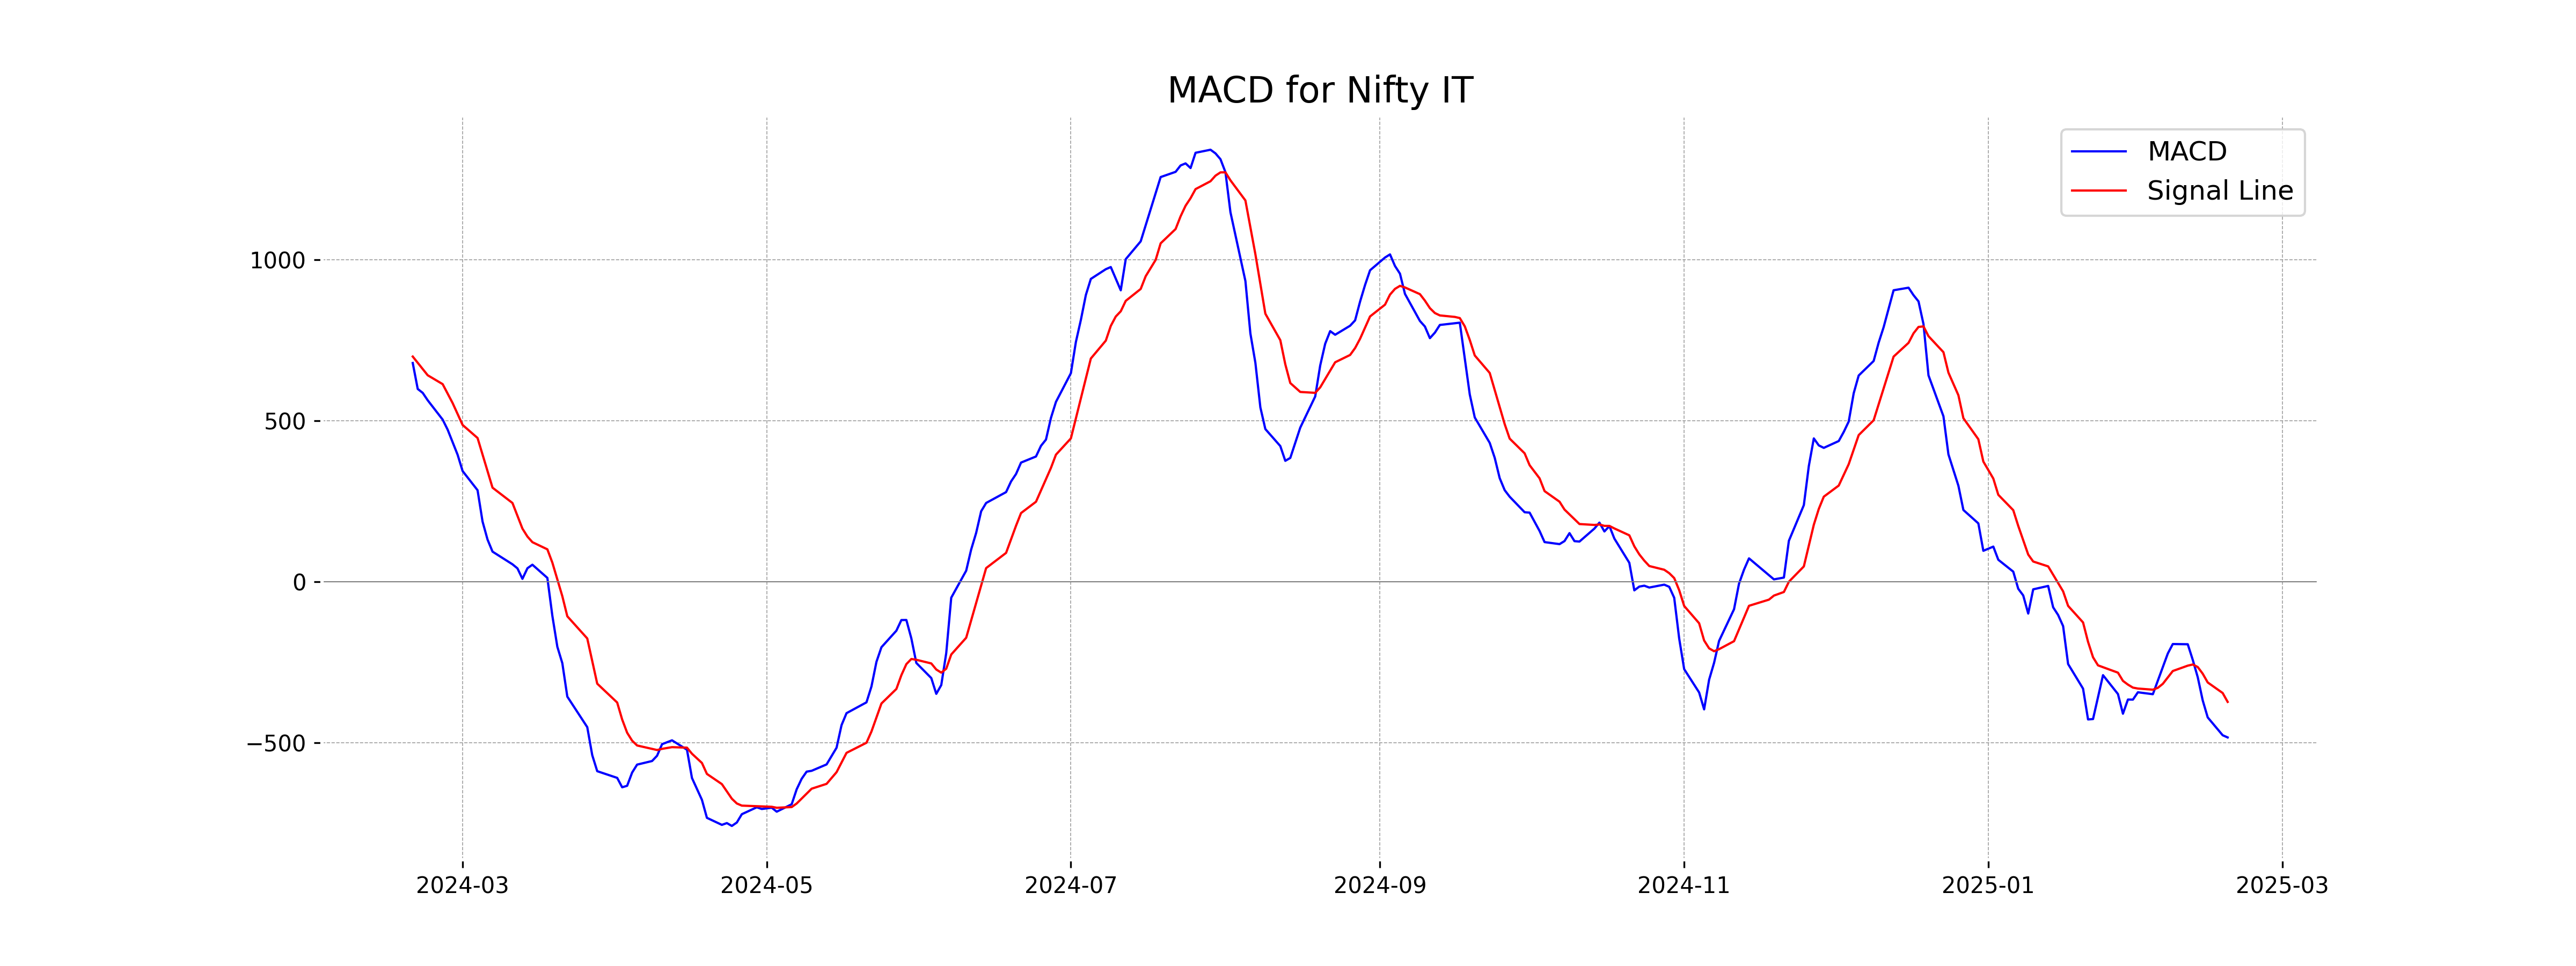
RSI Analysis
RSI Analysis for Nifty IT: The RSI value of 40.75 suggests that Nifty IT is approaching an oversold region, indicating a potential buying opportunity. However, given that it is below 50, the index currently shows weak momentum.
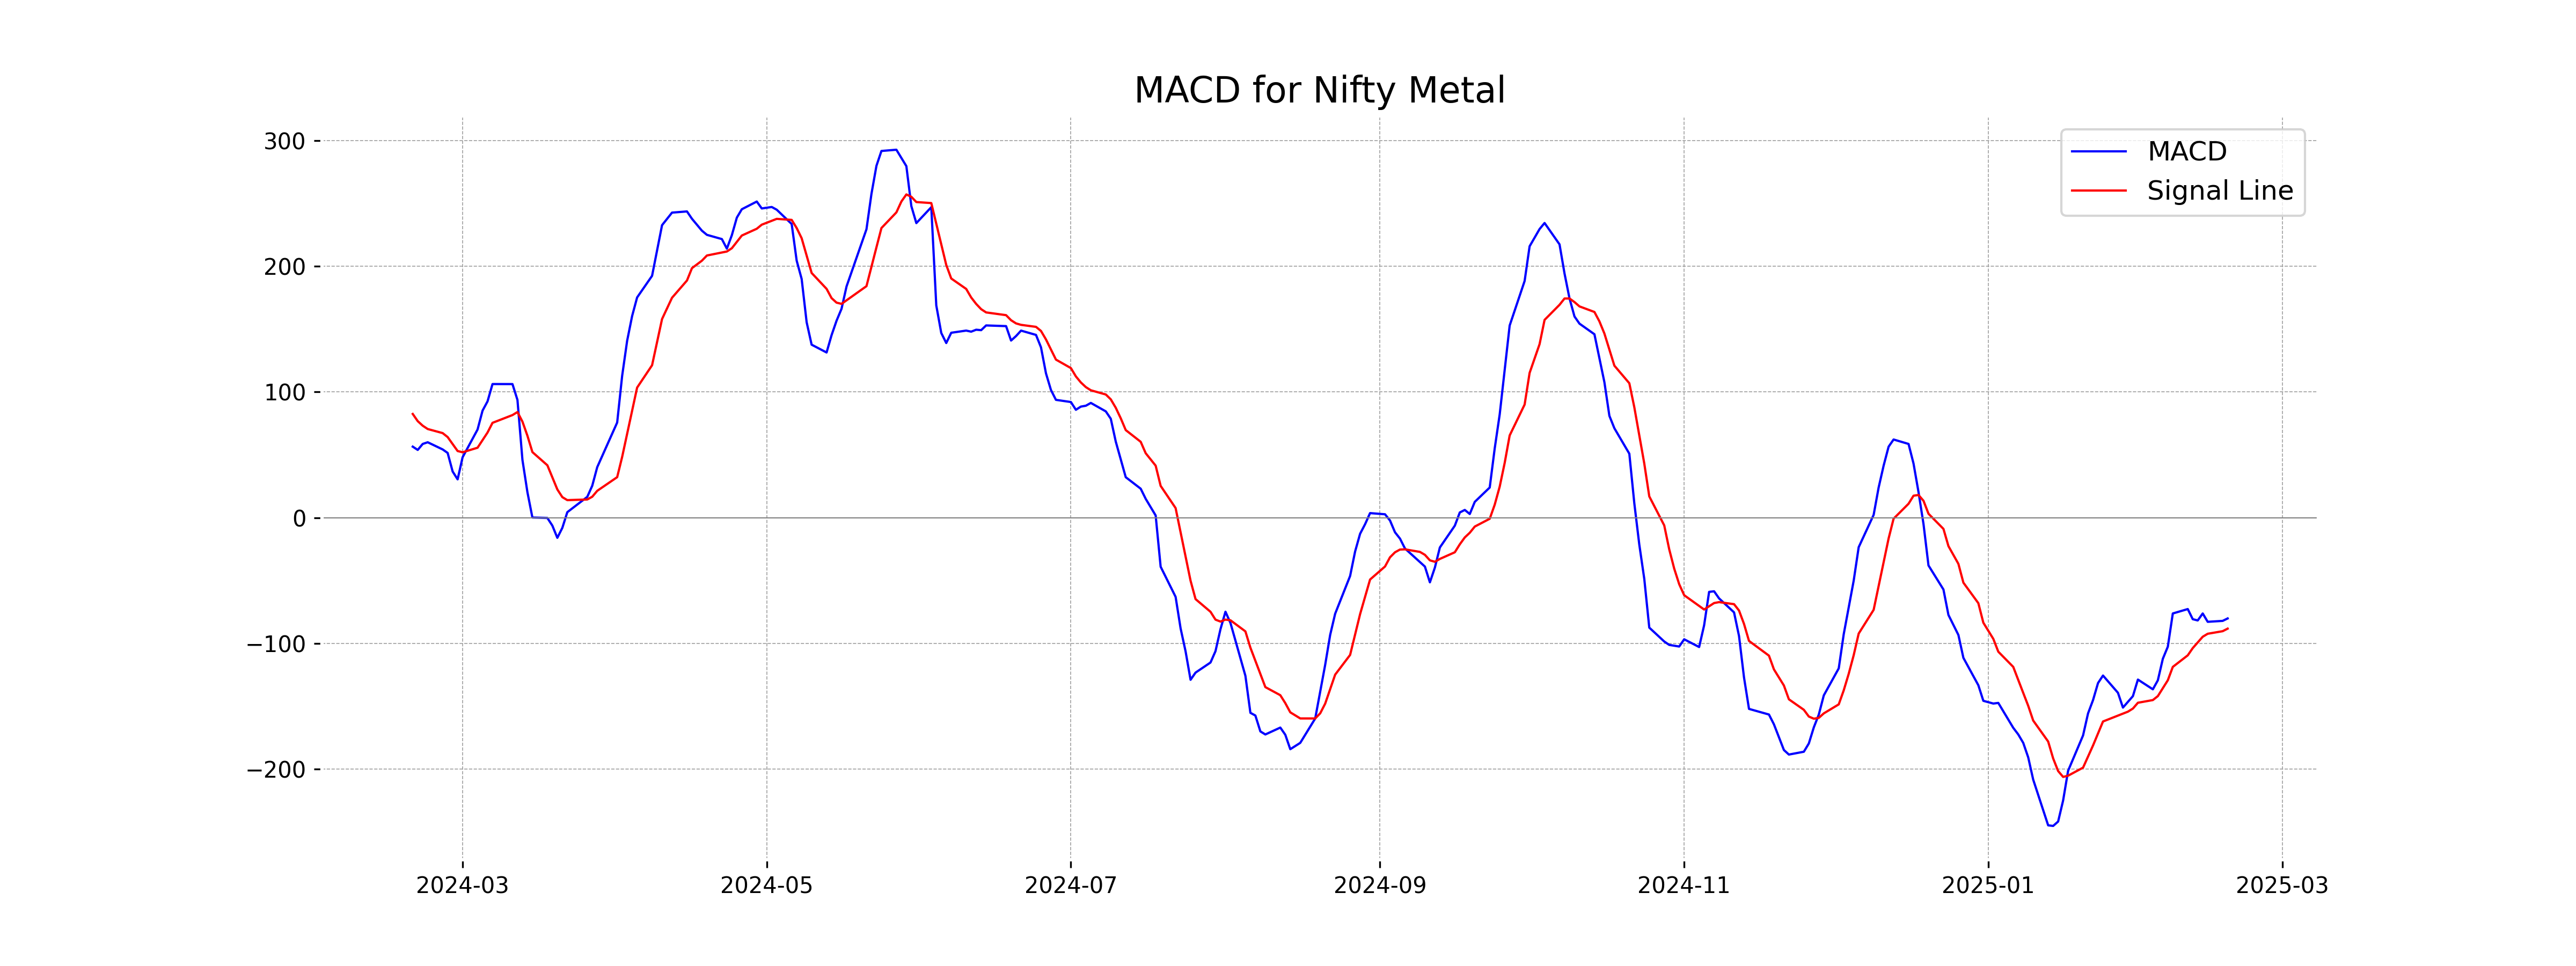
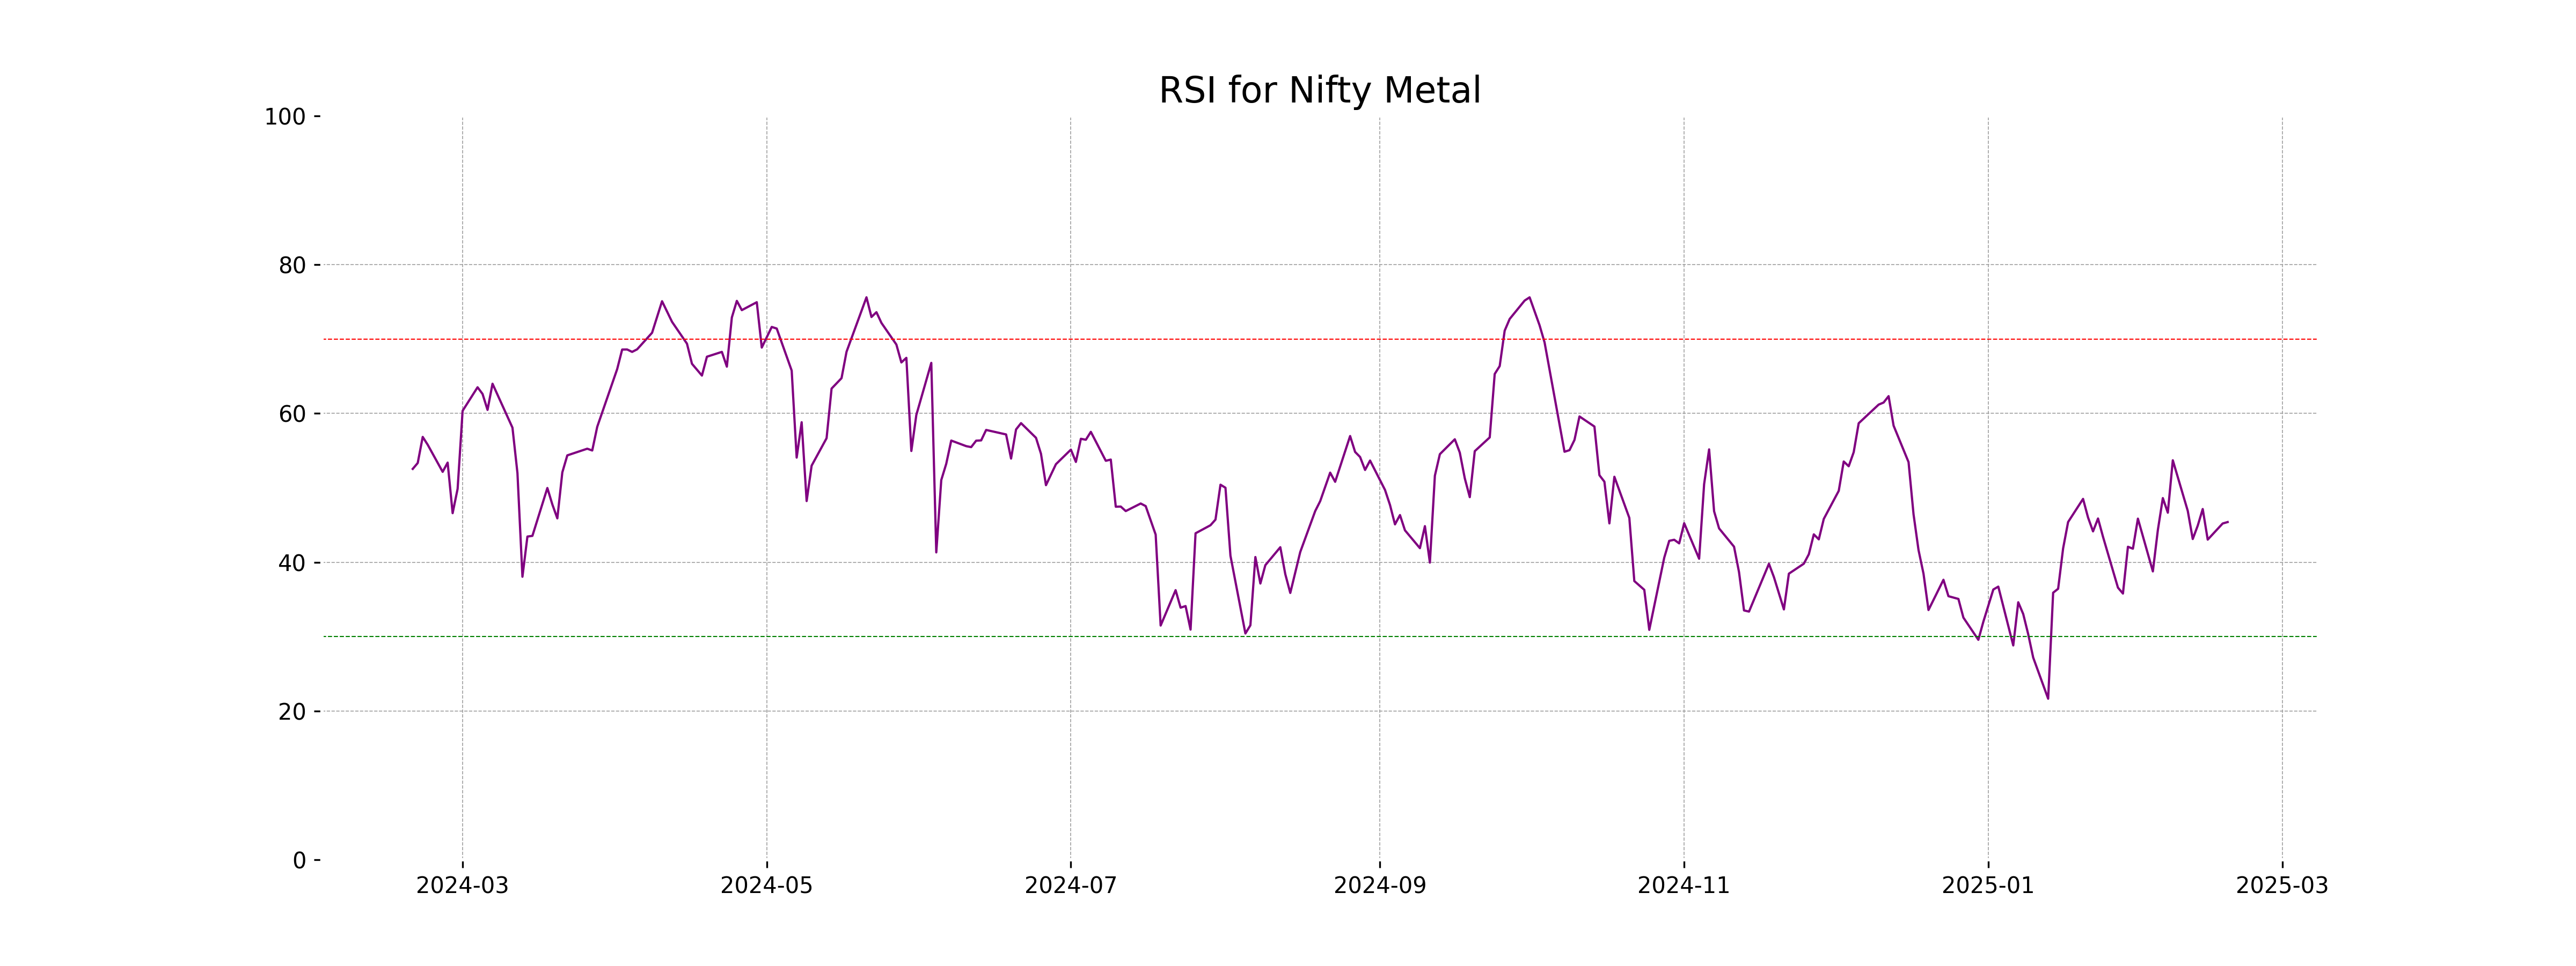
Analysis for Nifty Metal - February 18, 2025

Nifty Metal closed at 8255.60, showing a slight increase of 0.065% from its previous close of 8250.20. The index experienced a day of volatile trading with a high of 8278.20 and a low of 8119.80. The RSI stands at 45.40, indicating neither an overbought nor oversold condition, while the MACD suggests a bearish trend with a reading below the signal line.
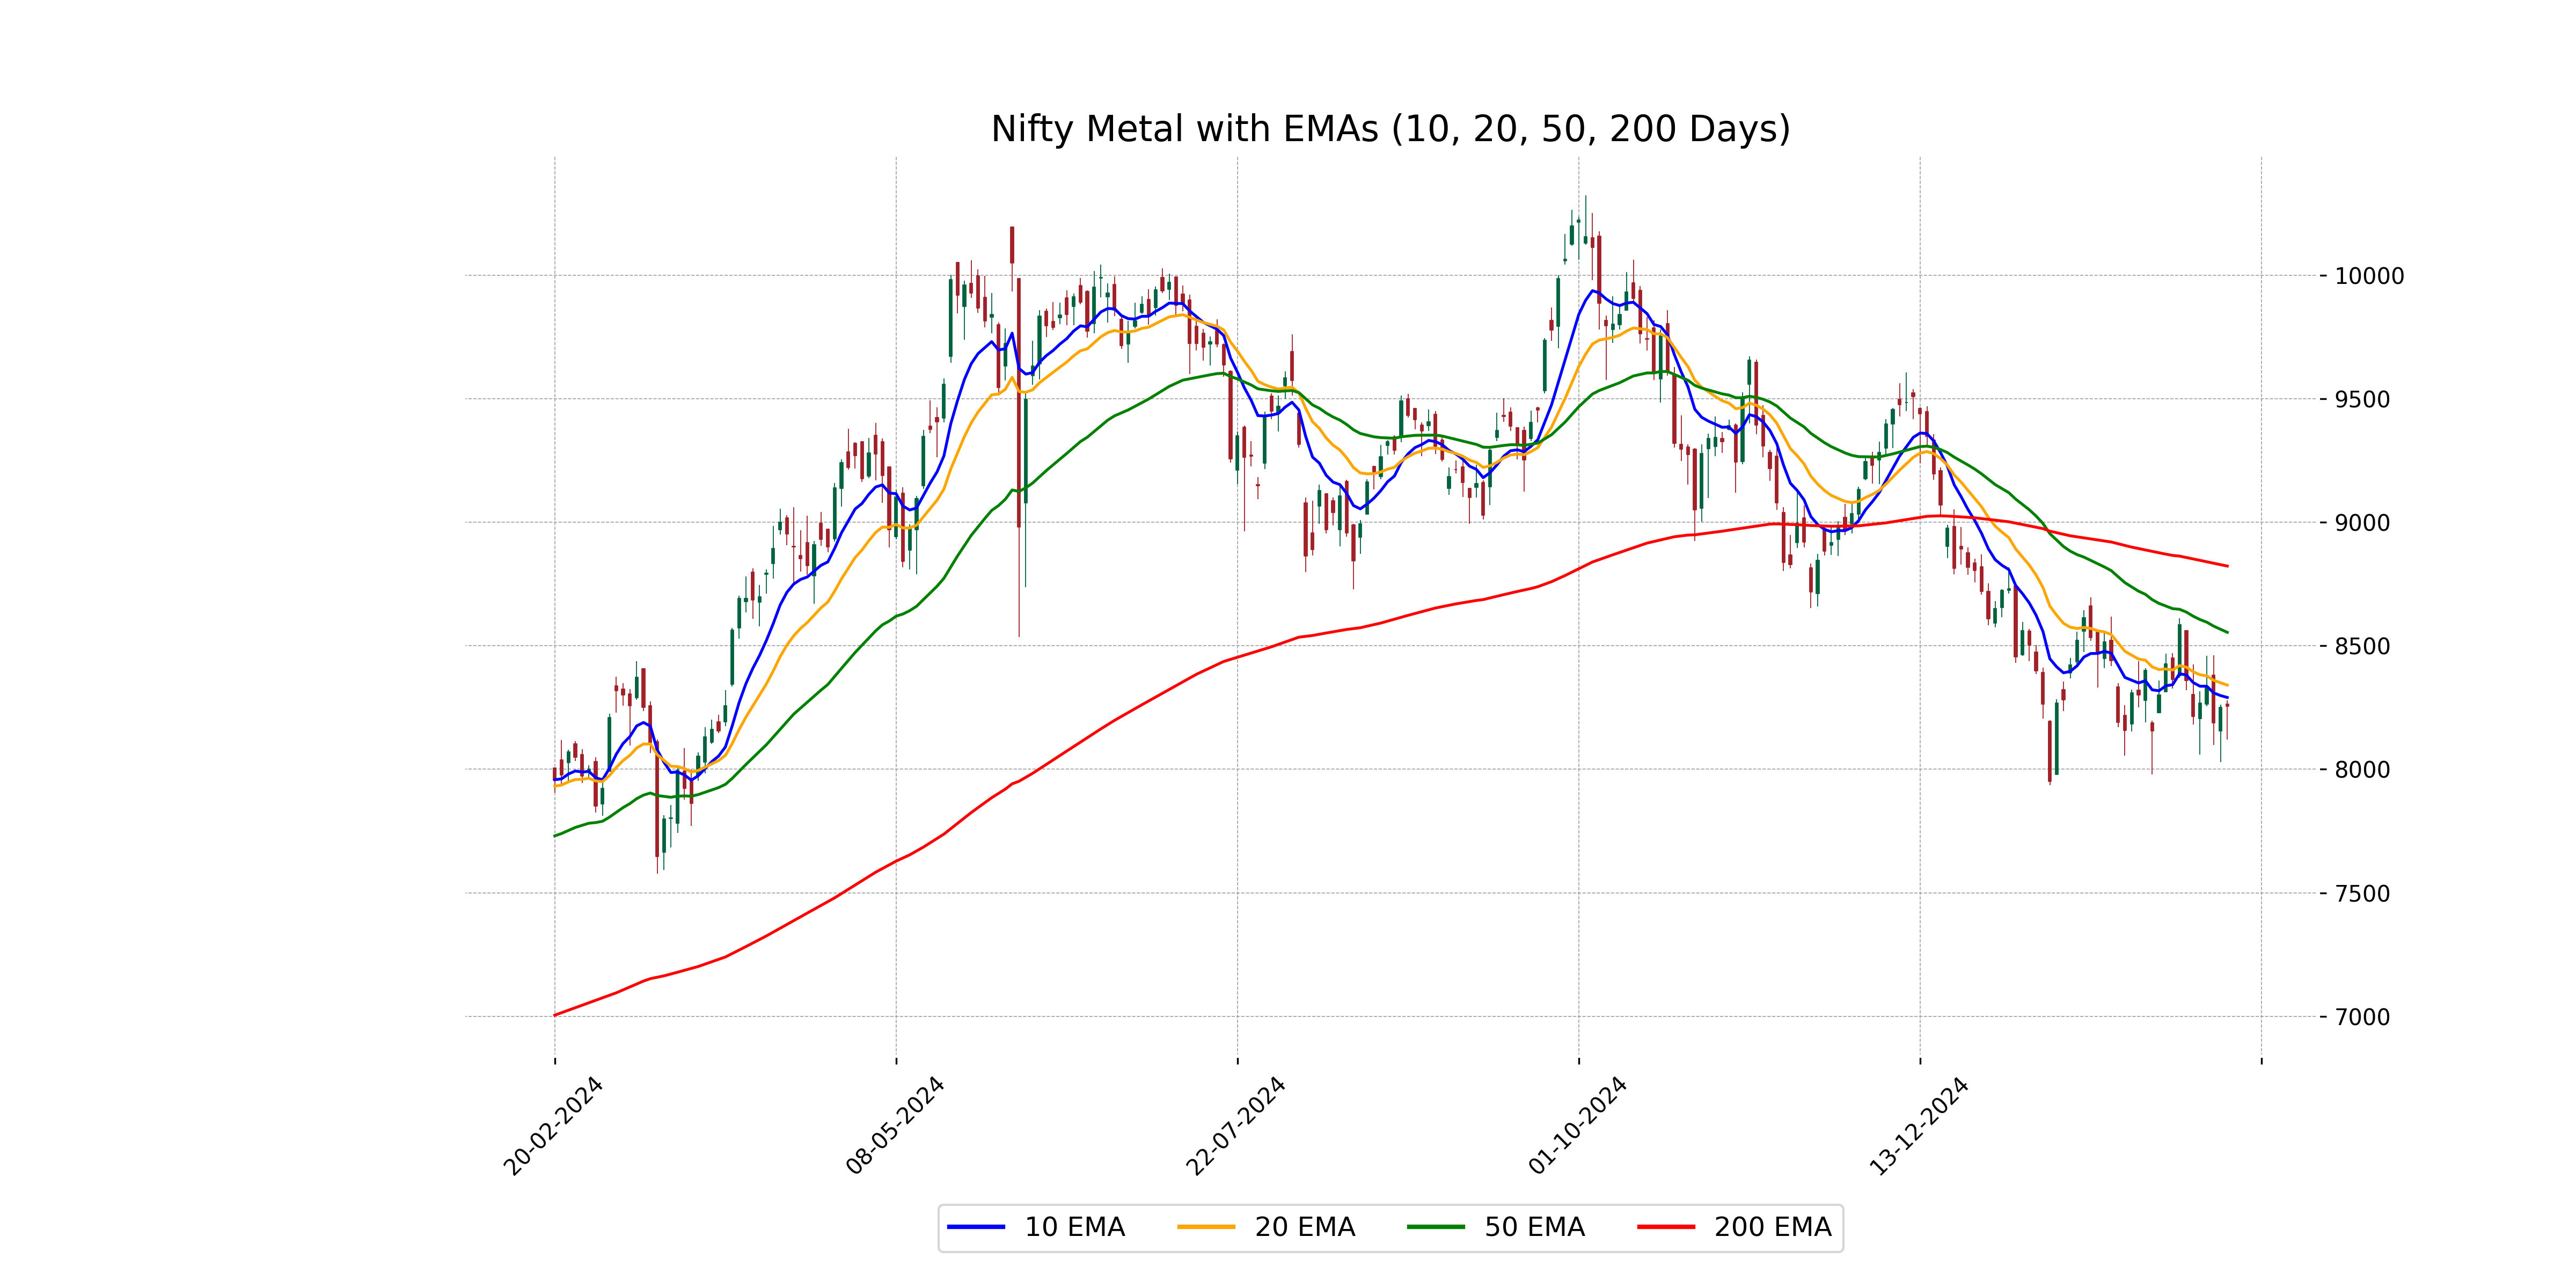
Relationship with Key Moving Averages
Nifty Metal closed at 8255.60, which is below its 50-day EMA of 8554.20 and 200-day EMA of 8822.44, indicating a bearish trend. However, it is slightly above its 10-day EMA of 8290.61 and below its 20-day EMA of 8340.58.
Moving Averages Trend (MACD)
The MACD for Nifty Metal is -80.182 while the MACD Signal is -88.293, indicating that the MACD line is above the signal line. This can typically suggest a potentially bullish crossover, but given that both values are negative, it might also reflect a bearish momentum that is weakening. Traders often look for confirmation from other indicators, such as RSI, which is currently at 45.40, suggesting a neutral to slightly bearish environment.
RSI Analysis
The RSI for Nifty Metal is currently at 45.40, indicating a neutral stance as it is near the midpoint of the typical RSI range between 30 and 70. This suggests that the index is neither overbought nor oversold, potentially implying stability with no imminent risk of a reversal or significant price change based solely on RSI.
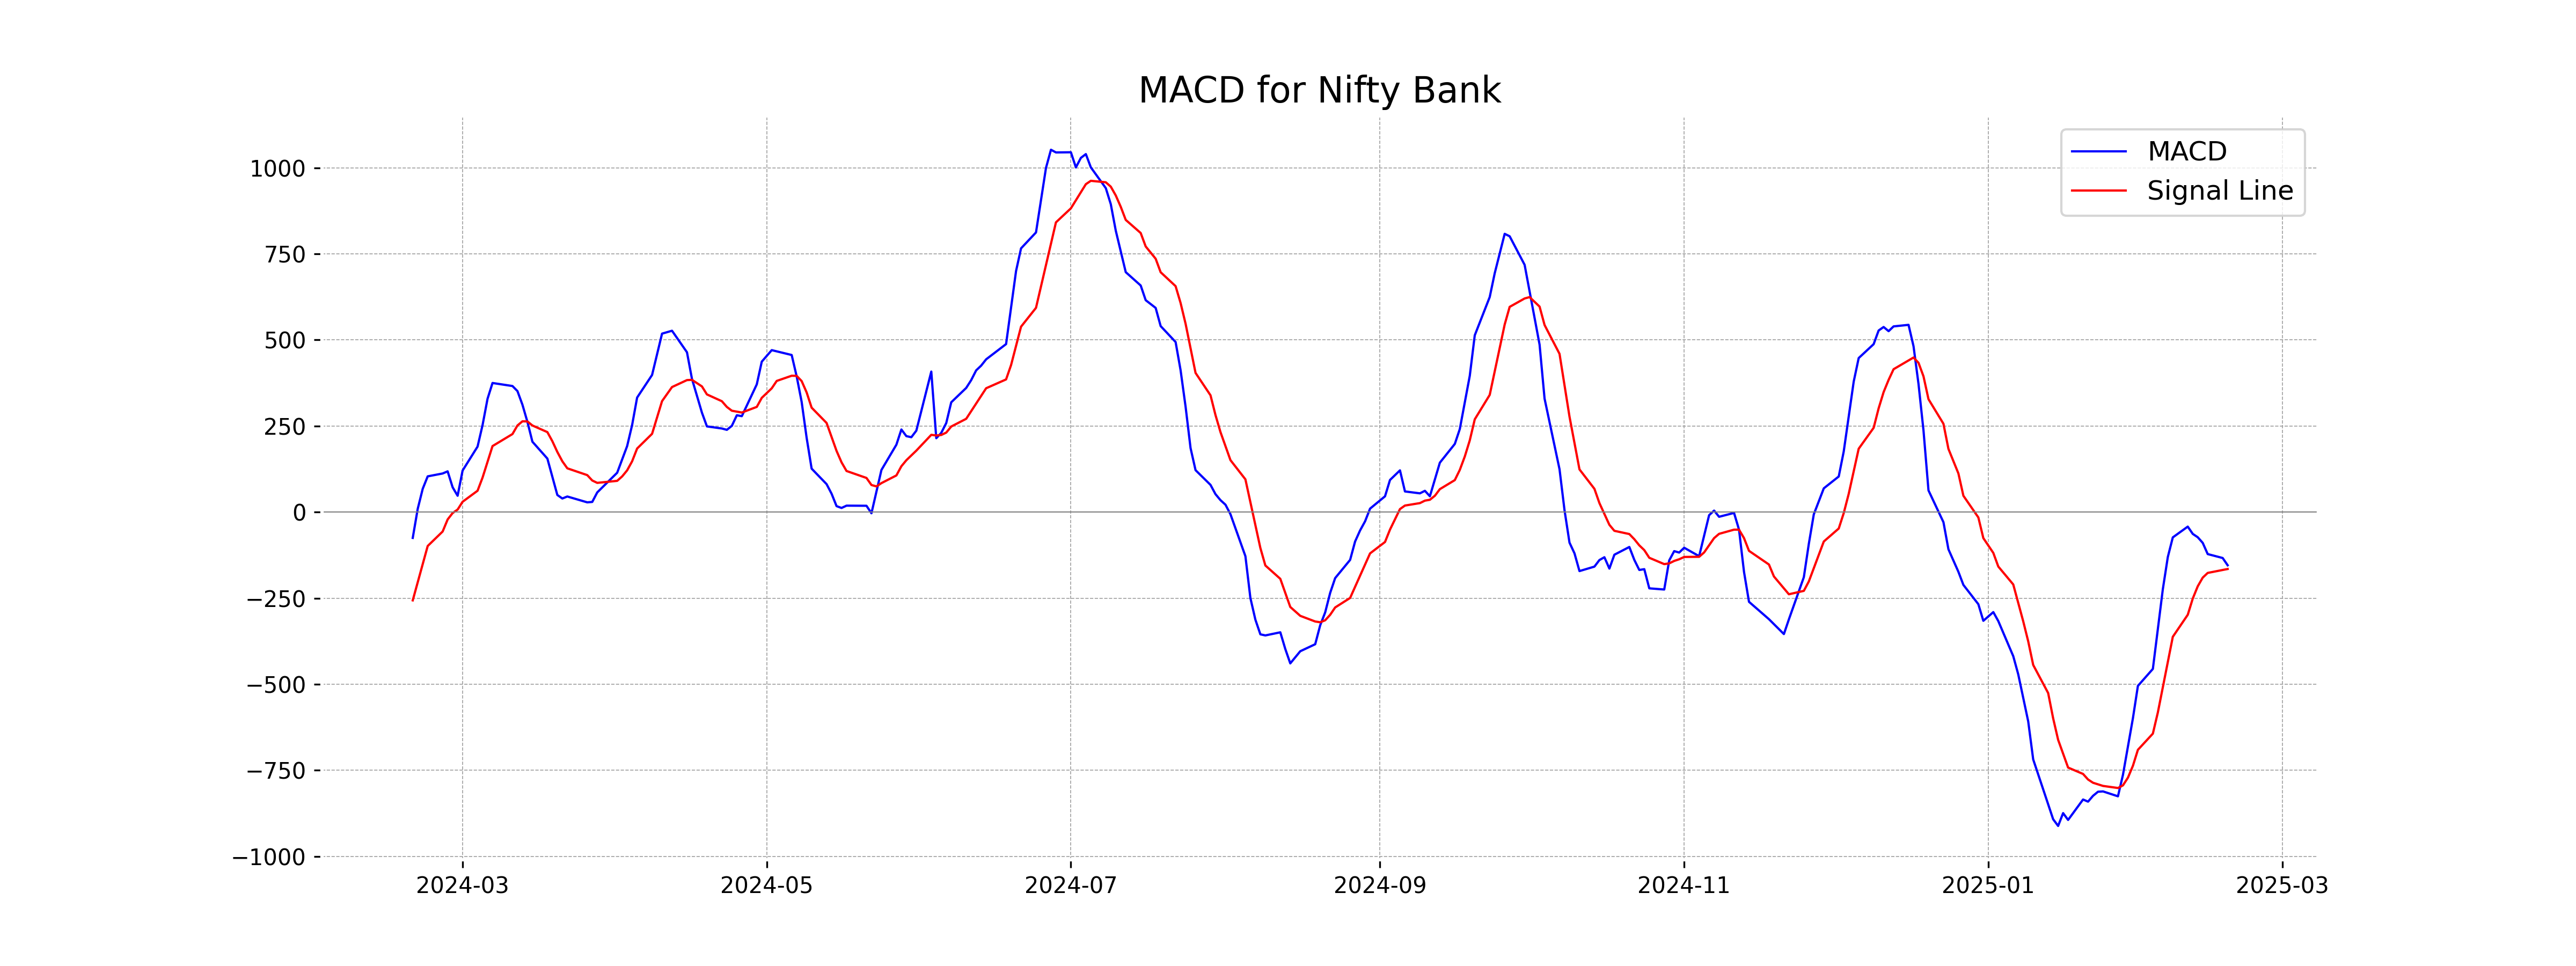
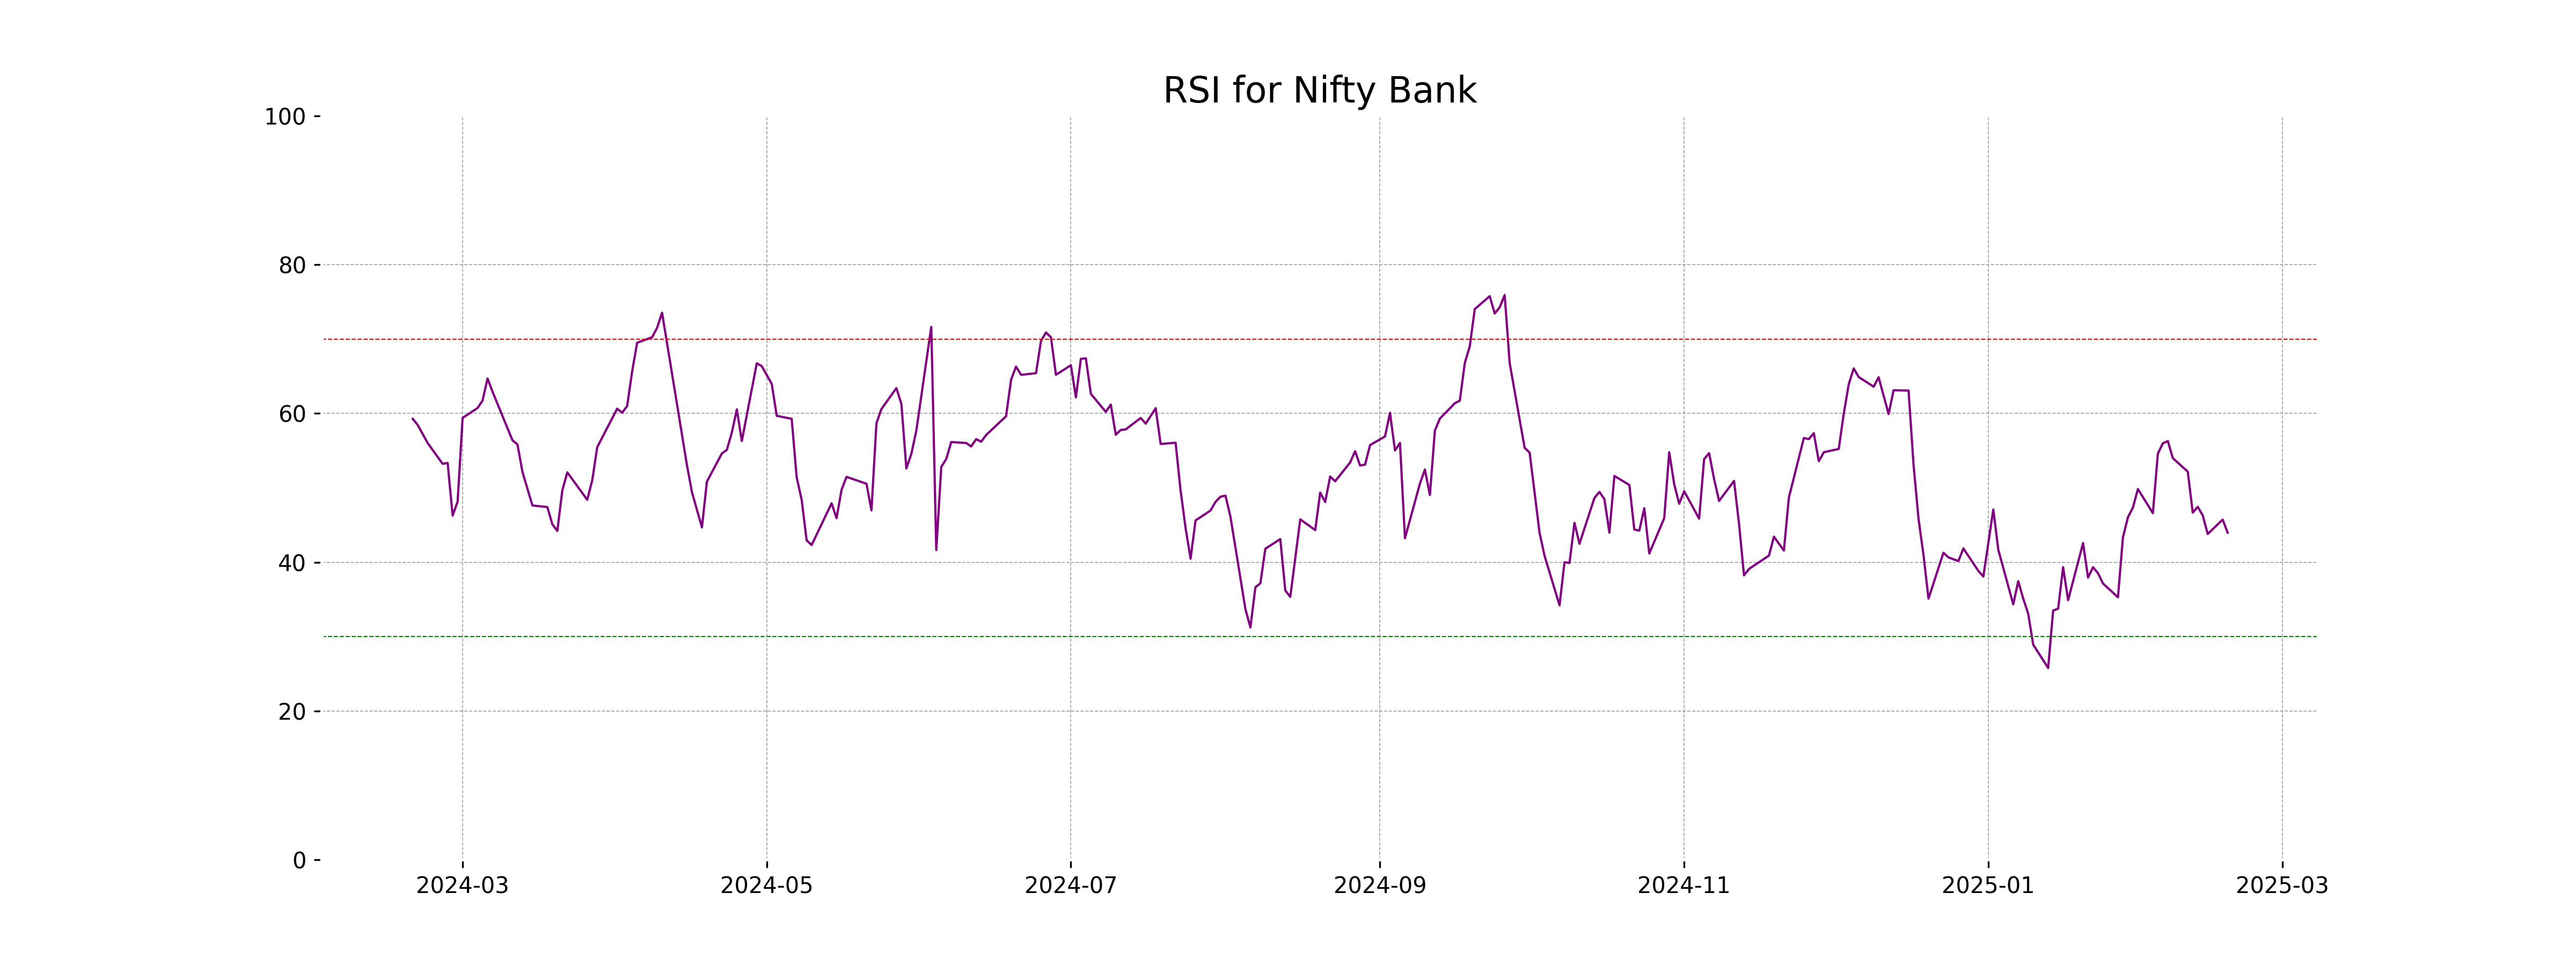
Analysis for Nifty Bank - February 18, 2025

Nifty Bank Performance: Nifty Bank opened at 49,211.85 and closed at 49,087.30, experiencing a decline of 0.35%, or a points change of -171.60. The current price is below its 50-day and 200-day EMAs, with an RSI of 44, indicating a potential continued bearish trend.

Relationship with Key Moving Averages
The closing price of Nifty Bank, 49087.30078125, is below its 50-day EMA of 50021.12638511244, 200-day EMA of 50161.95229936821, 10-day EMA of 49399.96202182796, and 20-day EMA of 49480.16016480125. This suggests a bearish trend as it is trading below key moving averages.
Moving Averages Trend (MACD)
The MACD for Nifty Bank, at -154.48 with a signal line of -165.32, indicates a current downtrend. This suggests a bearish momentum as the MACD line is above the signal line, but both are still in negative territory.
RSI Analysis
The RSI for Nifty Bank is 43.97, indicating that the stock is in a neutral to slightly oversold territory. Typically, an RSI below 30 suggests oversold conditions, while an RSI above 70 suggests overbought conditions. Since the RSI is between these two levels, it implies that there might be potential for a reversal or continuation depending on other market factors.
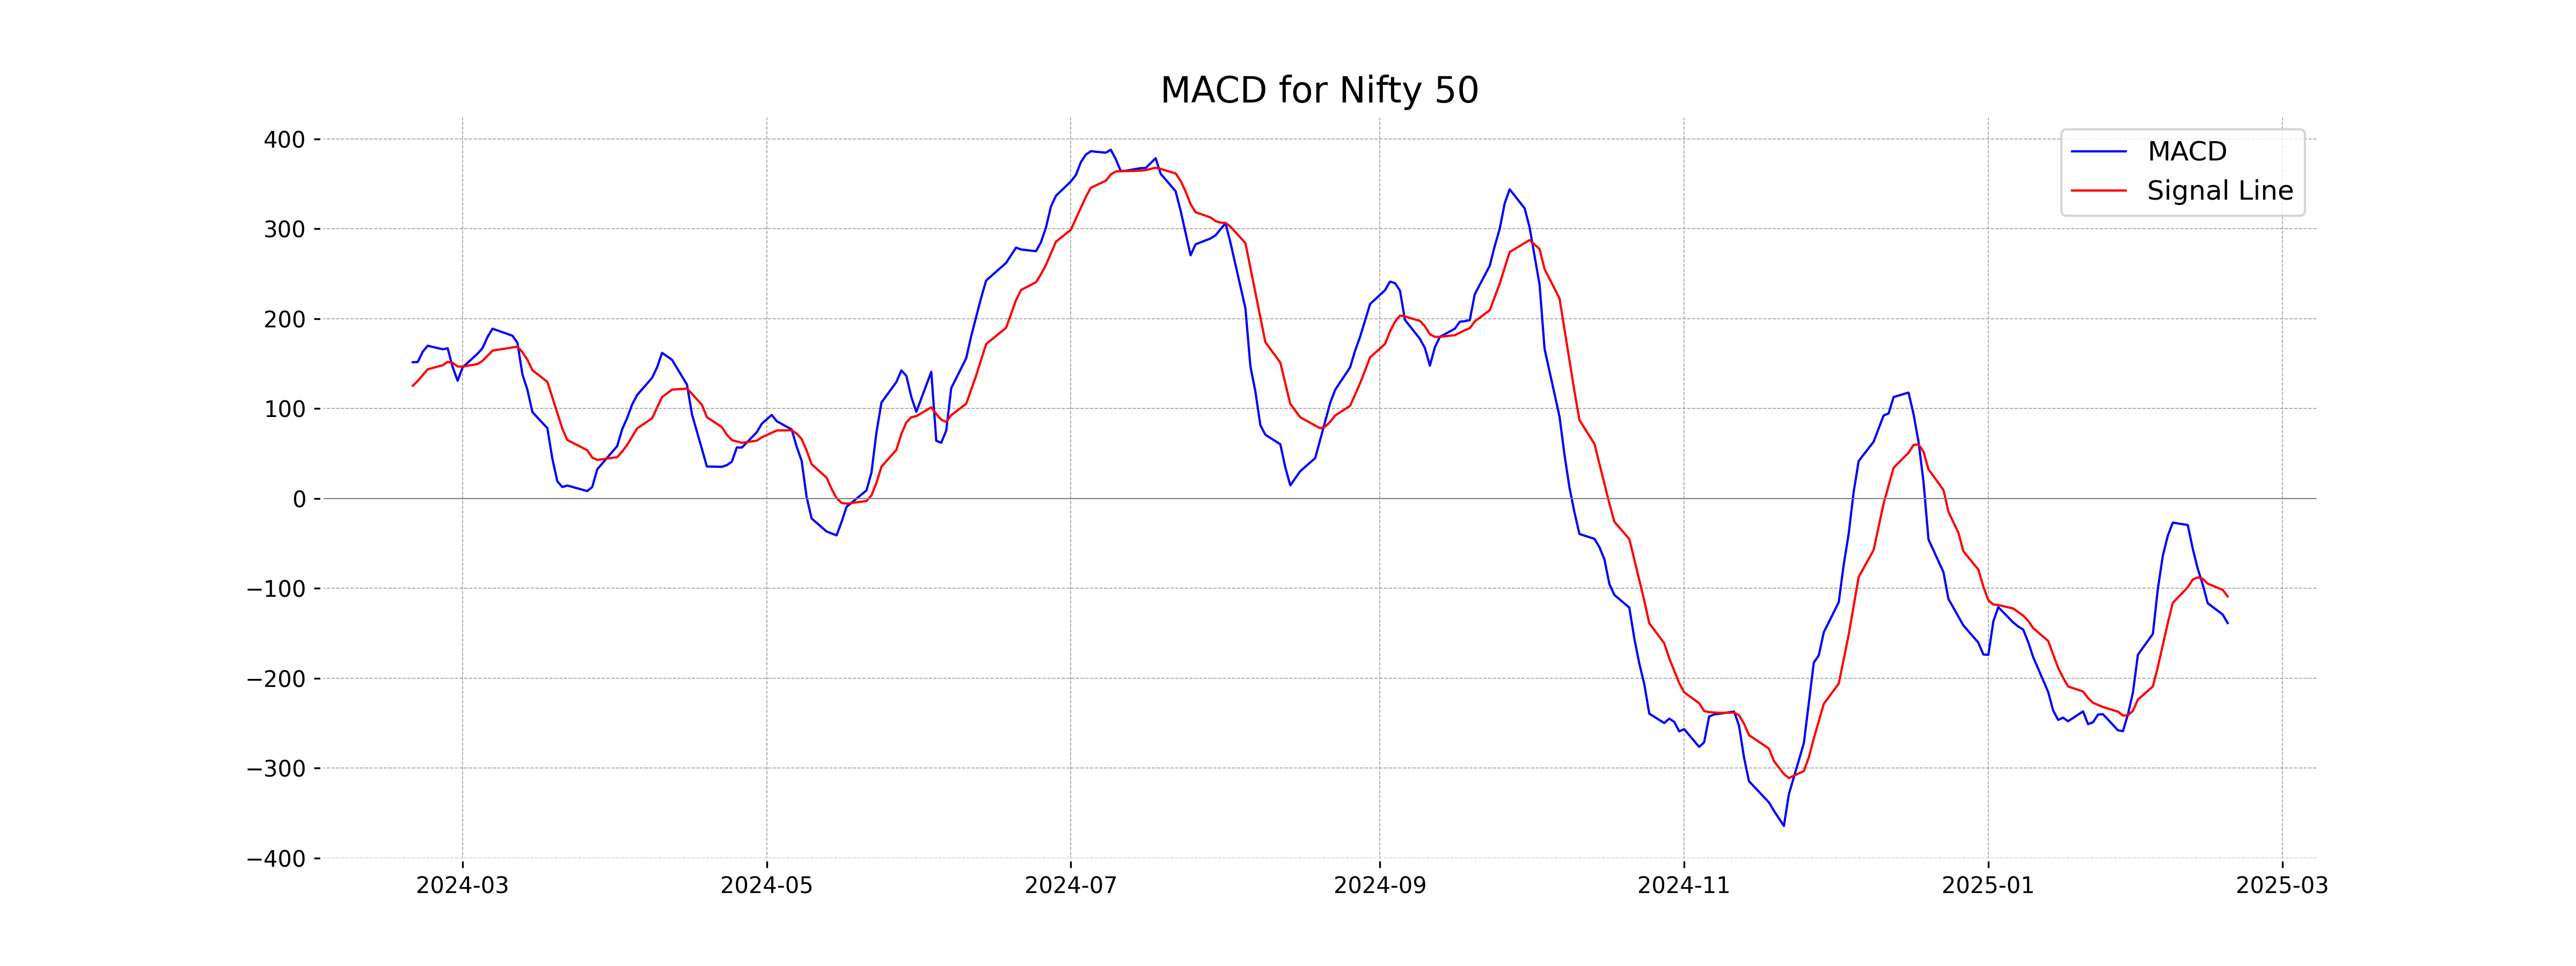
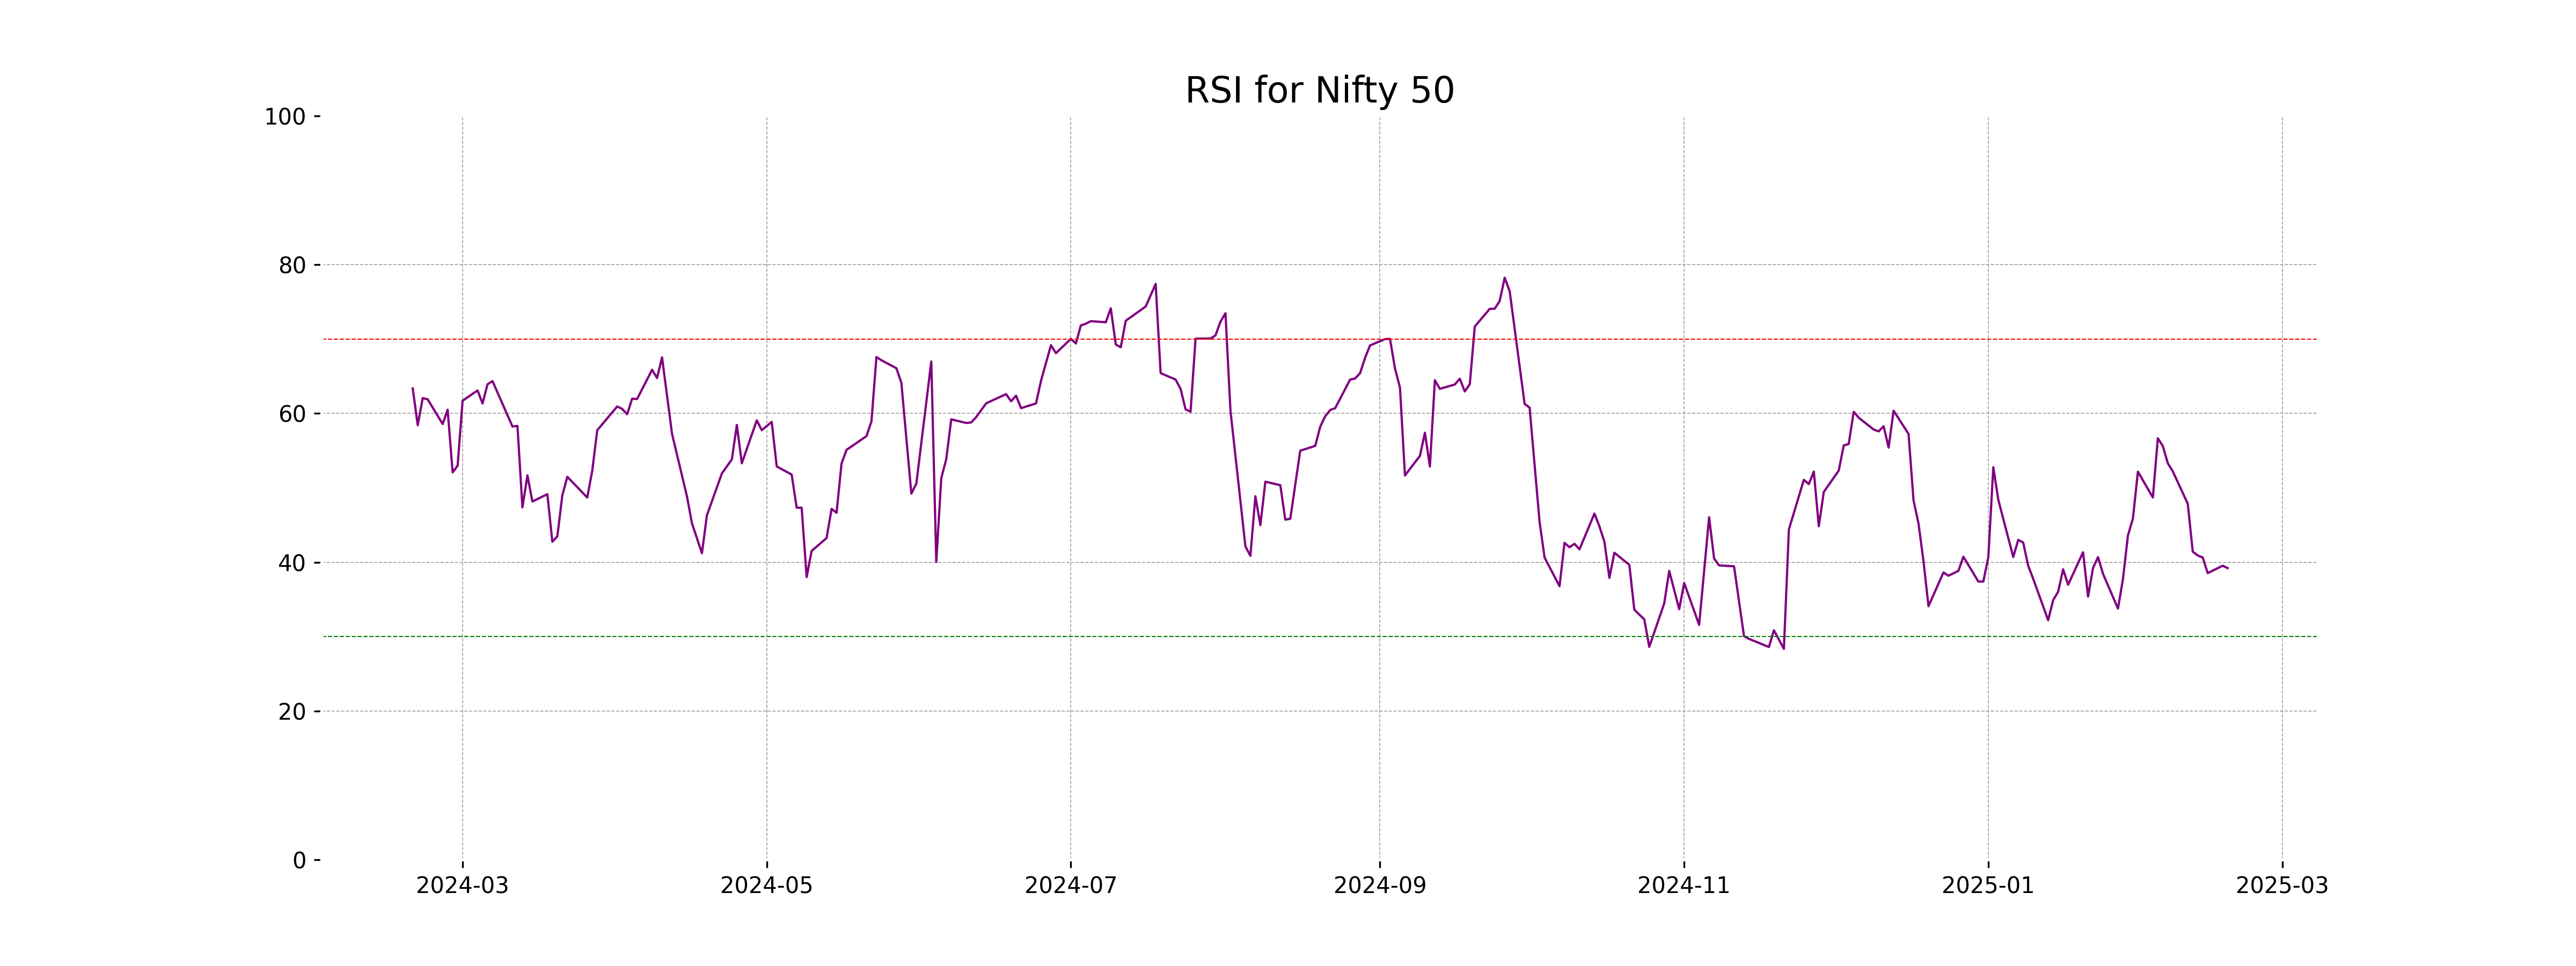
Analysis for Nifty 50 - February 18, 2025
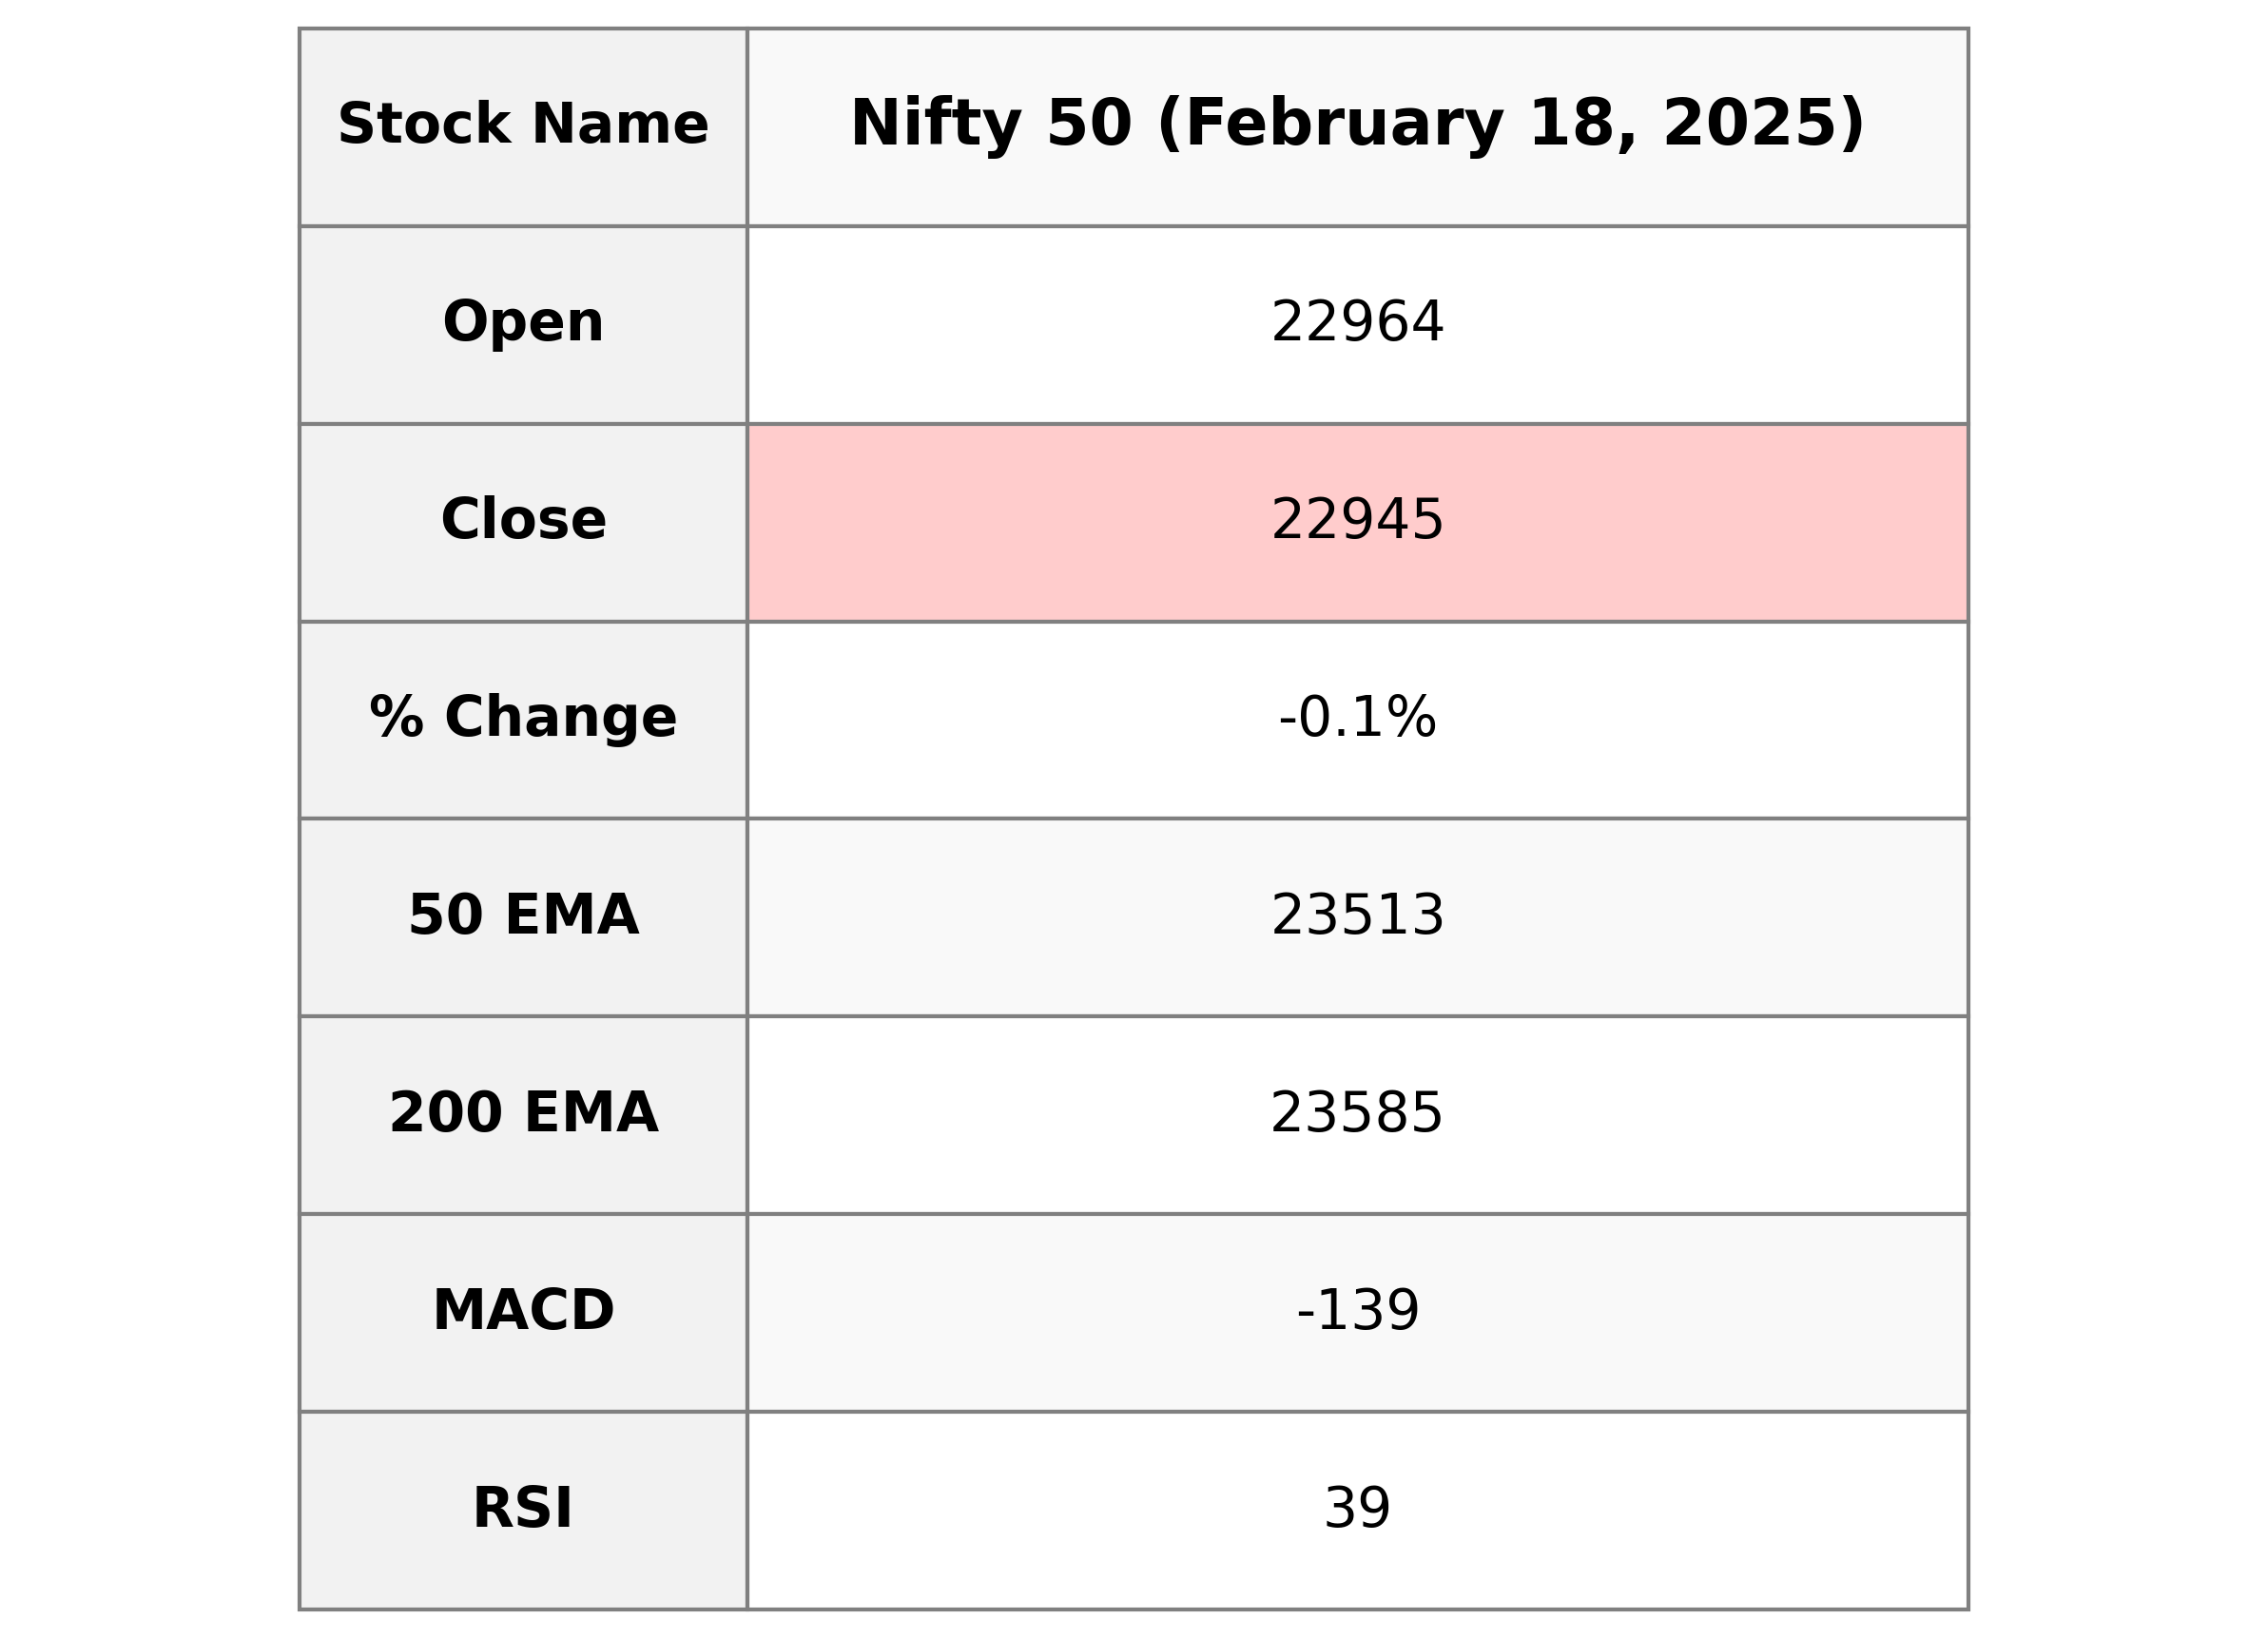
Nifty 50 opened at 22,963.65 and closed slightly lower at 22,945.30, with a marginal decrease of 0.06% from the previous close of 22,959.50, marking a points change of -14.20. The index recorded a high of 22,992.50 and a low of 22,801.50. Technical indicators show a bearish sentiment with RSI at 39.21 and MACD below the signal line, suggesting potential downward momentum.

Relationship with Key Moving Averages
The closing price of Nifty 50 is below all key moving averages, with a 50 EMA of 23512.60, a 200 EMA of 23584.64, a 10 EMA of 23120.67, and a 20 EMA of 23229.21, suggesting a bearish trend. The RSI is 39.21, indicating the market is approaching oversold conditions.
Moving Averages Trend (MACD)
The MACD for Nifty 50 is -138.61, which is below the MACD Signal of -109.04, indicating a bearish momentum. This suggests that the market might continue to experience downward pressure in the short term.
RSI Analysis
The Nifty 50 has an RSI of 39.21, indicating that the index is approaching oversold territory. An RSI below 30 typically signals oversold conditions, suggesting potential buying opportunities, however, caution is advised as other indicators should be considered.
Up Next
Indian stock market sector-wise performance today - February 18, 2025

Step-by-step guide to apply for a mortgage loan online with minimal documentation

Honda Activa 6G: Everything You Need to Know Before Buying

How much does a ULIP plan really cost? A break-down of all charges

Centre plans to borrow Rs 8.20 lakh cr from market in first half of FY27

Reliance denies buying Iranian oil amid US sanctions waiver

More videos

Premium petrol price up Rs 2, industrial diesel up Rs 22; no change in normal petrol, diesel rates

India's GDP expected to register over 8 pc growth in Sep-Dec: Report

Govt announces seven measures to help boost exports

RBI keeps interest rates on hold after US trade deal boosts outlook

RBI proposes to compensate customers up to Rs 25,000 loss due to fraud

RBI raises GDP growth projection of Q1, Q2 of FY27

RBI pauses rate cuts, retains interest rate at 5.25 pc

Rupee jumps 122 paise to close at 90.27 against US dollar on India-US trade deal

Stock markets cheer India-US trade deal: Sensex, Nifty surge 2.5 pc

UPI transactions hit record high of Rs 230 lakh crore in 2025-26 till Dec: Govt