


Highlights
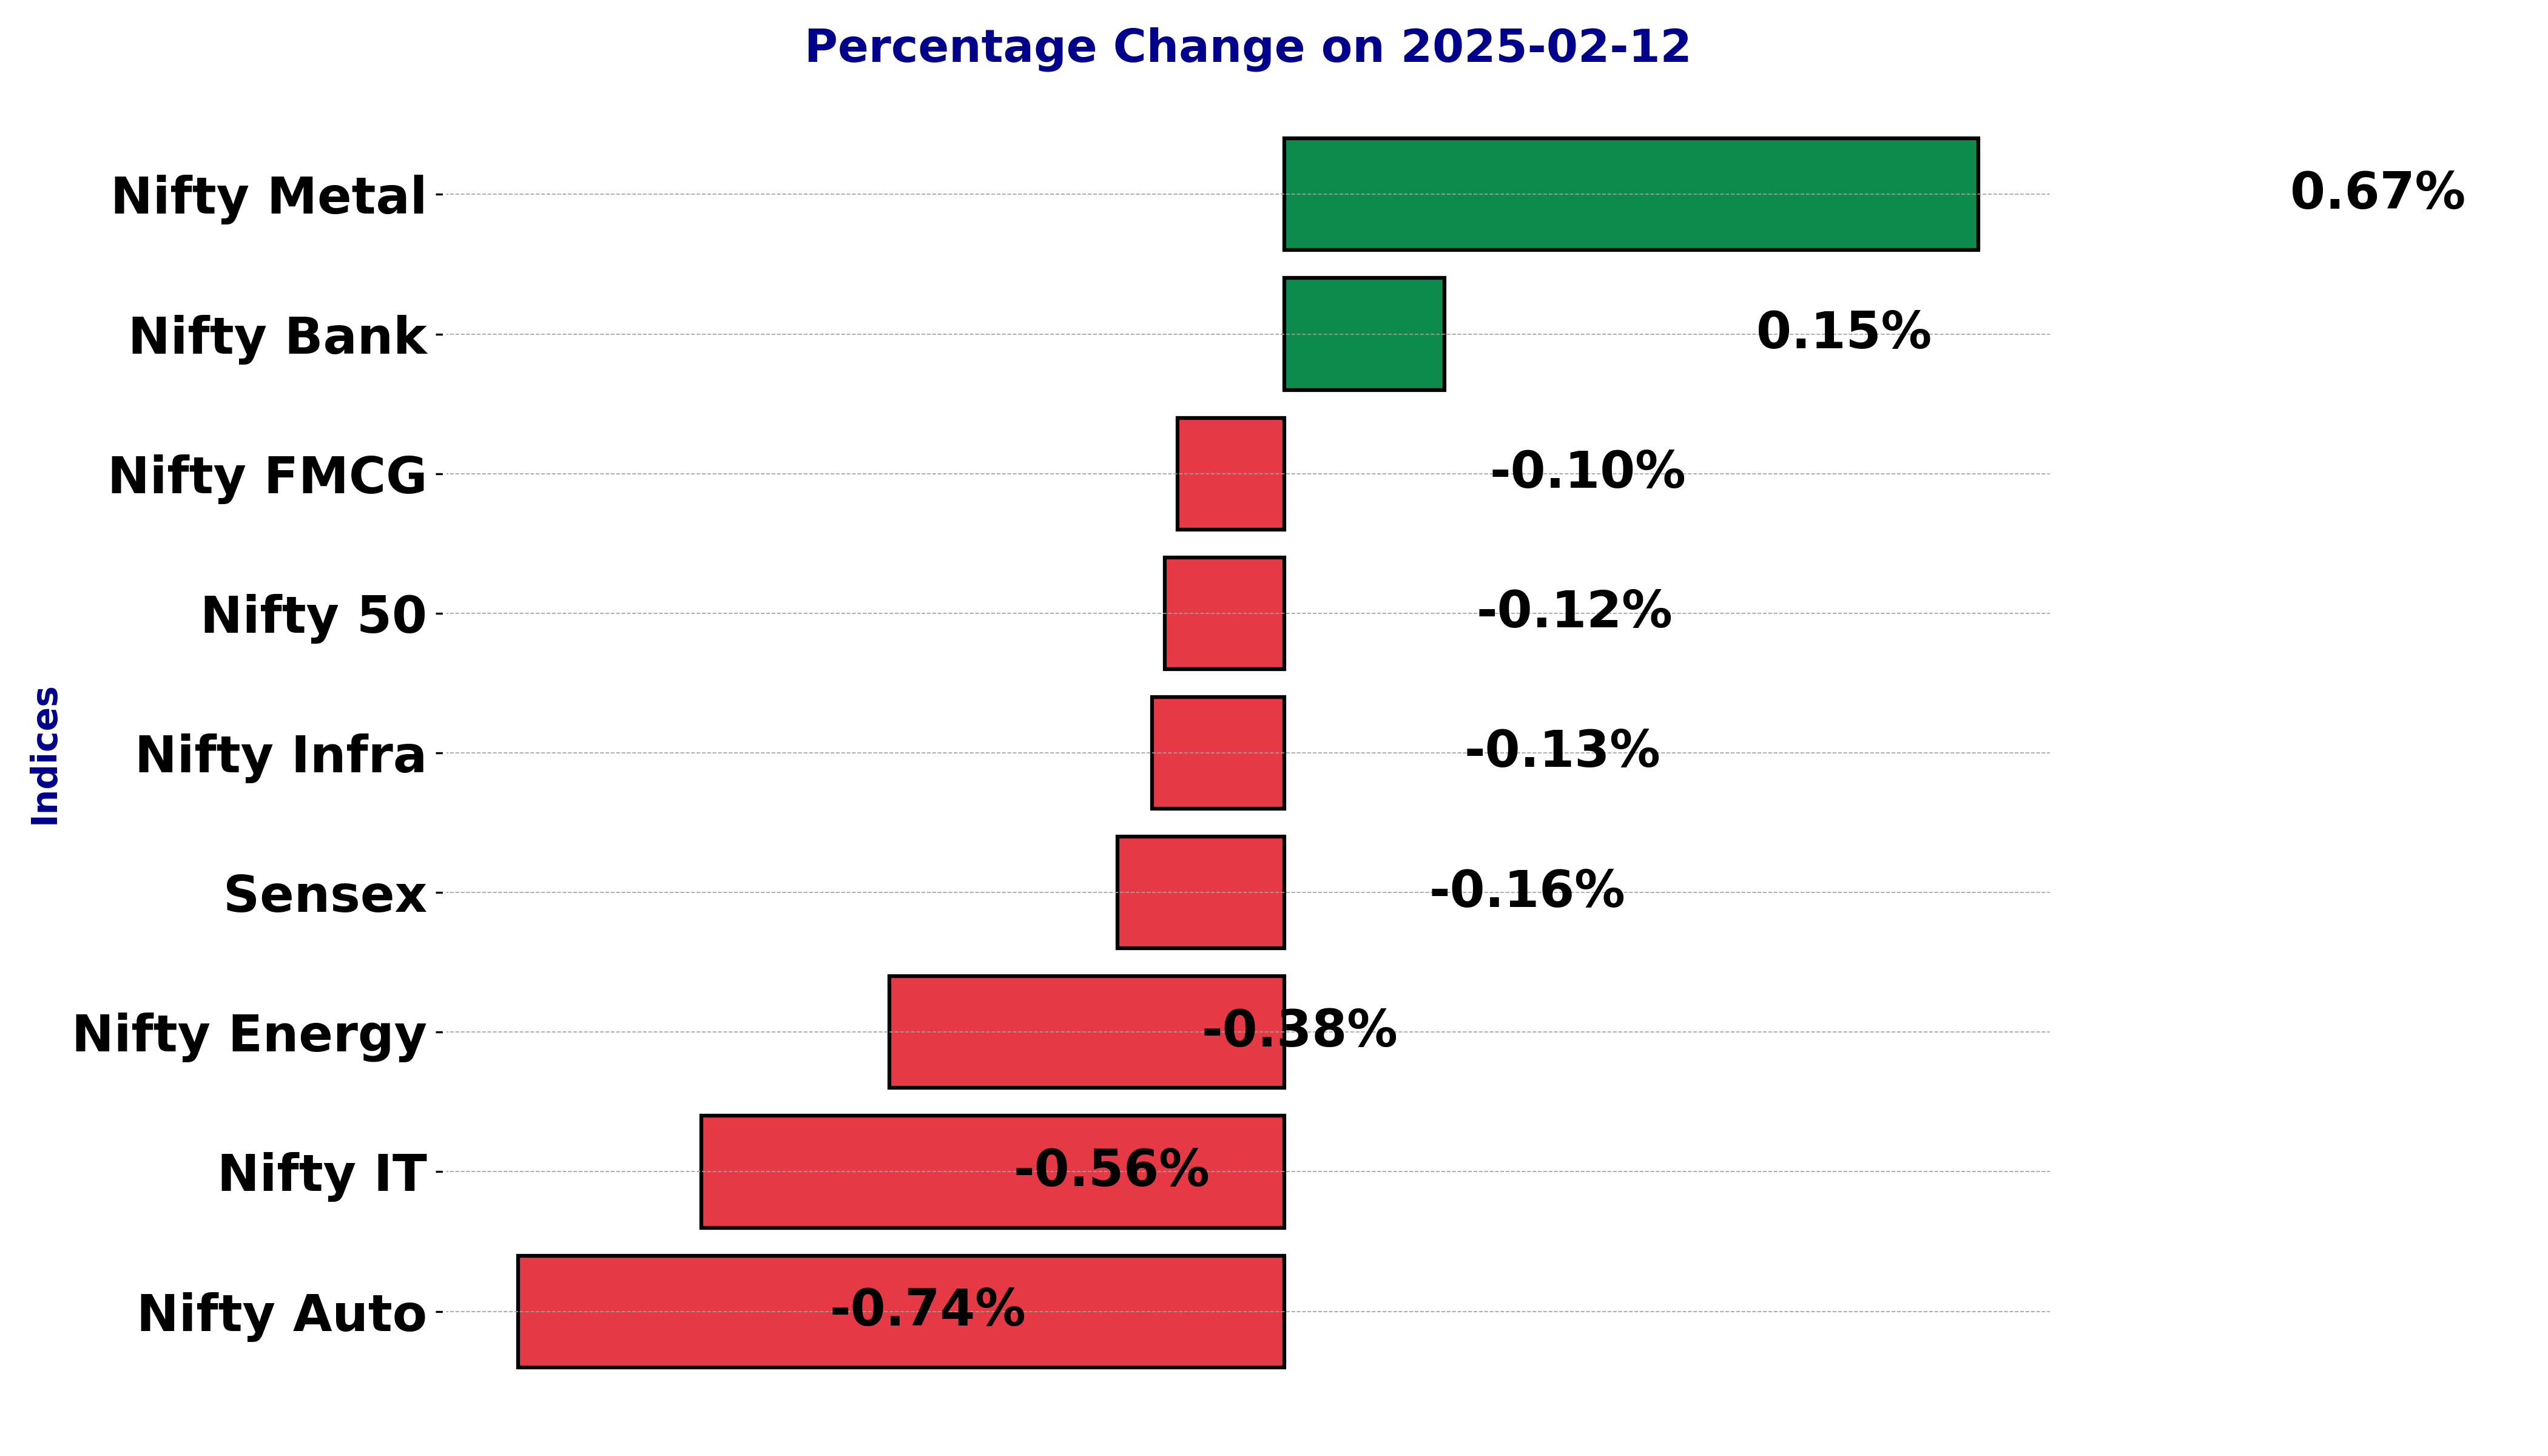
- Sensex closes slightly lower, down 0.16% today
- Nifty Auto, Energy, and FMCG show bearish trends
- Nifty Bank sees slight gains, up 0.15% overall
Latest news

Putin hails Ukraine gains, threatens more, in annual press conference

OnePlus Pad Go 2 Review: No drama, just a good tablet

Parliament Moment: Priyanka Gandhi shares tea with Rajnath Singh. PM Modi and Om Birla

Cold wave deepens in Kashmir as Chillai-Kalan nears, temperatures dip below freezing

Pakistan accuses India of attempting to undermine Indus treaty

Vande Mataram discussion in UP legislature to mark 150th anniversary: Yogi Adityanath

Ashes 2025: Travis Head slams unbeaten 142 to crush England's Ashes hopes

Tipra Motha youth wing protests Bangladesh leader's anti-India remarks in Agartala
Indian stock market sector-wise performance today - February 12, 2025


The national stock market indices showed varied performances on February 12, 2025, reflecting the economic sentiment.
In this article, we analyze the performance of key national indices including the Nifty 50,Nifty Bank,Nifty IT,Nifty Auto,Nifty Pharma,Nifty FMCG,Nifty Infra,Nifty Energy and Nifty Metal.
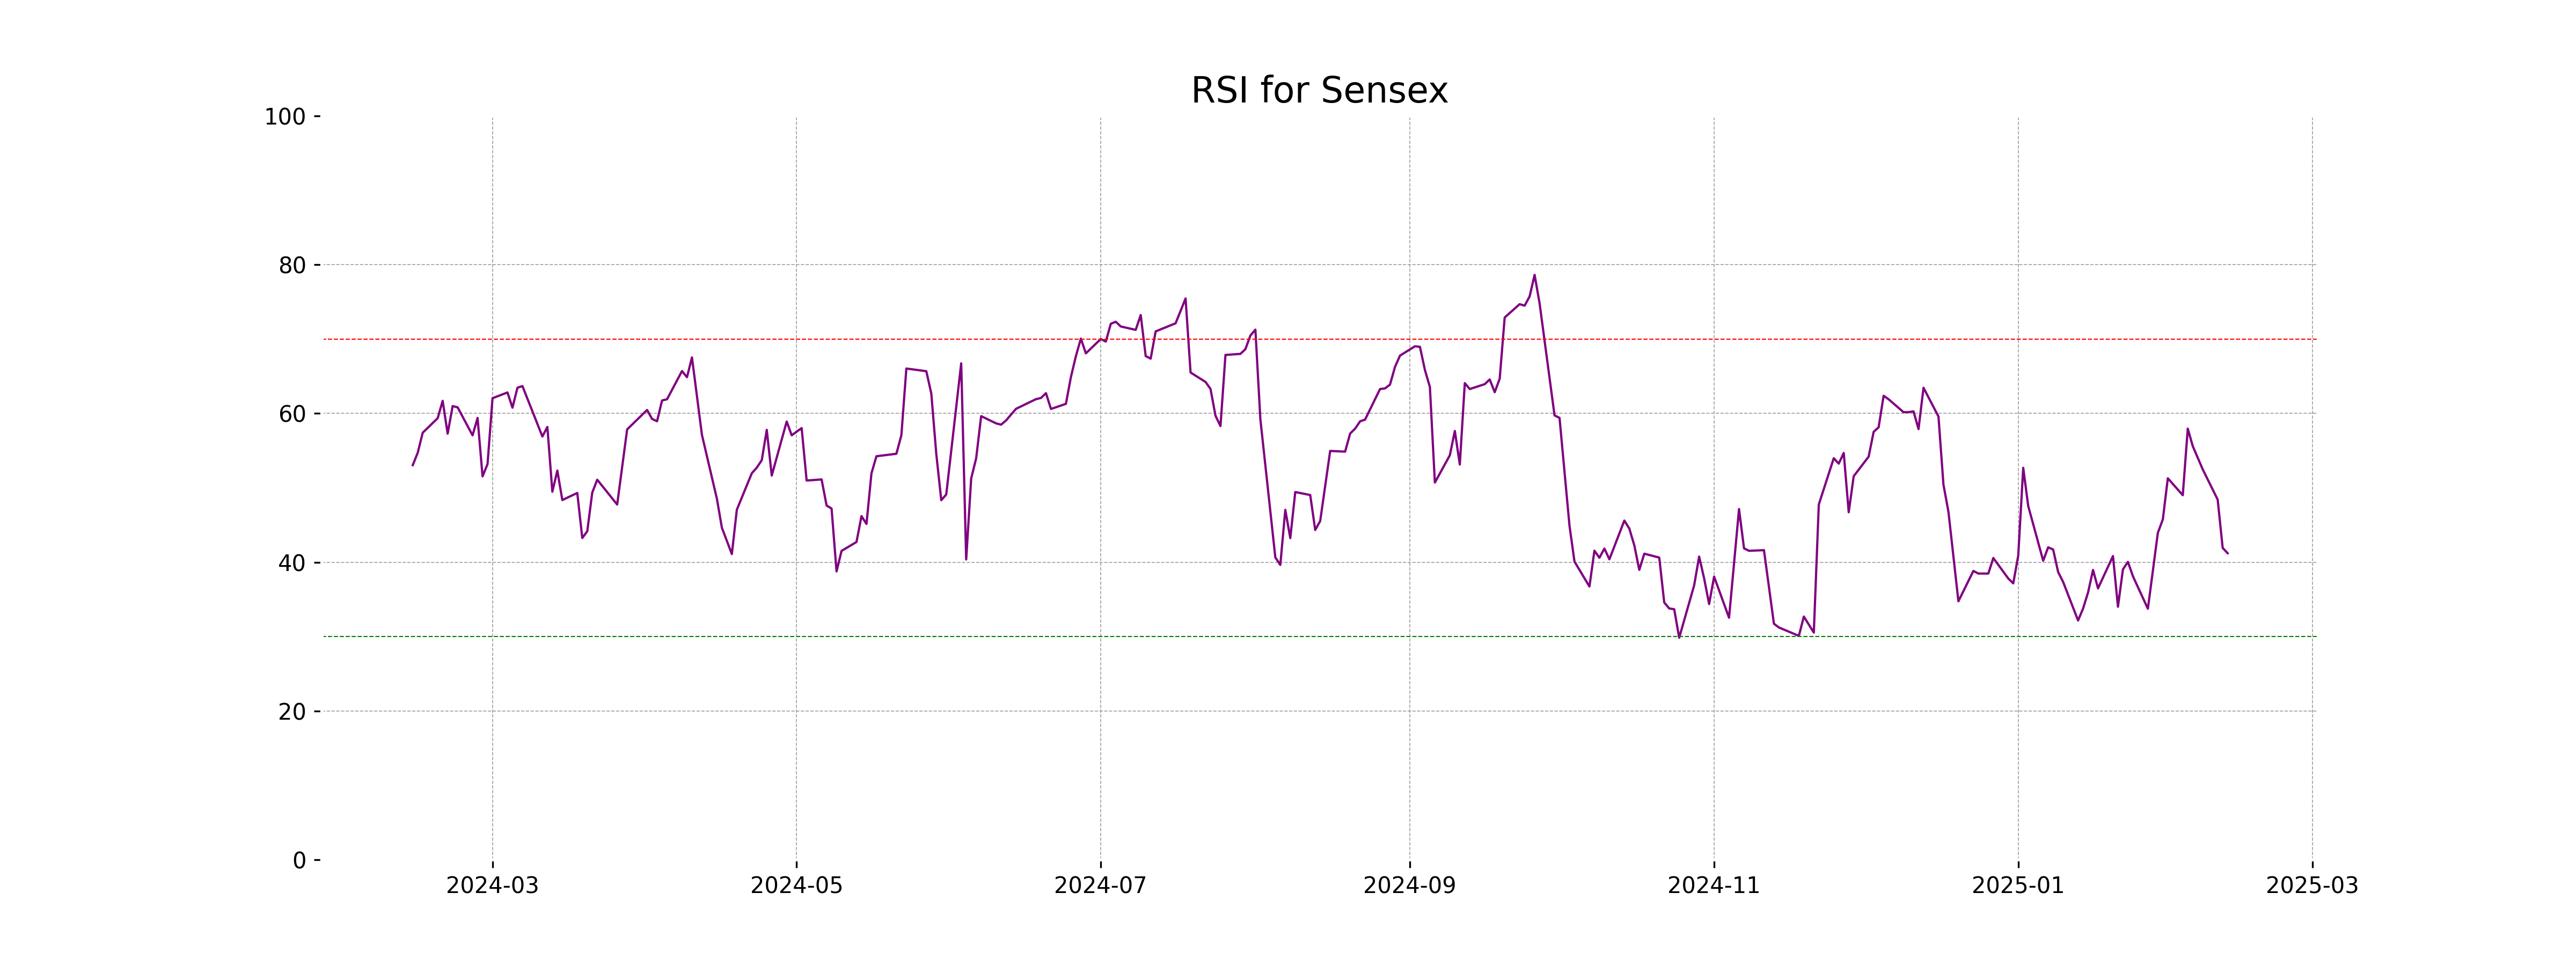
Analysis for Sensex - February 12, 2025
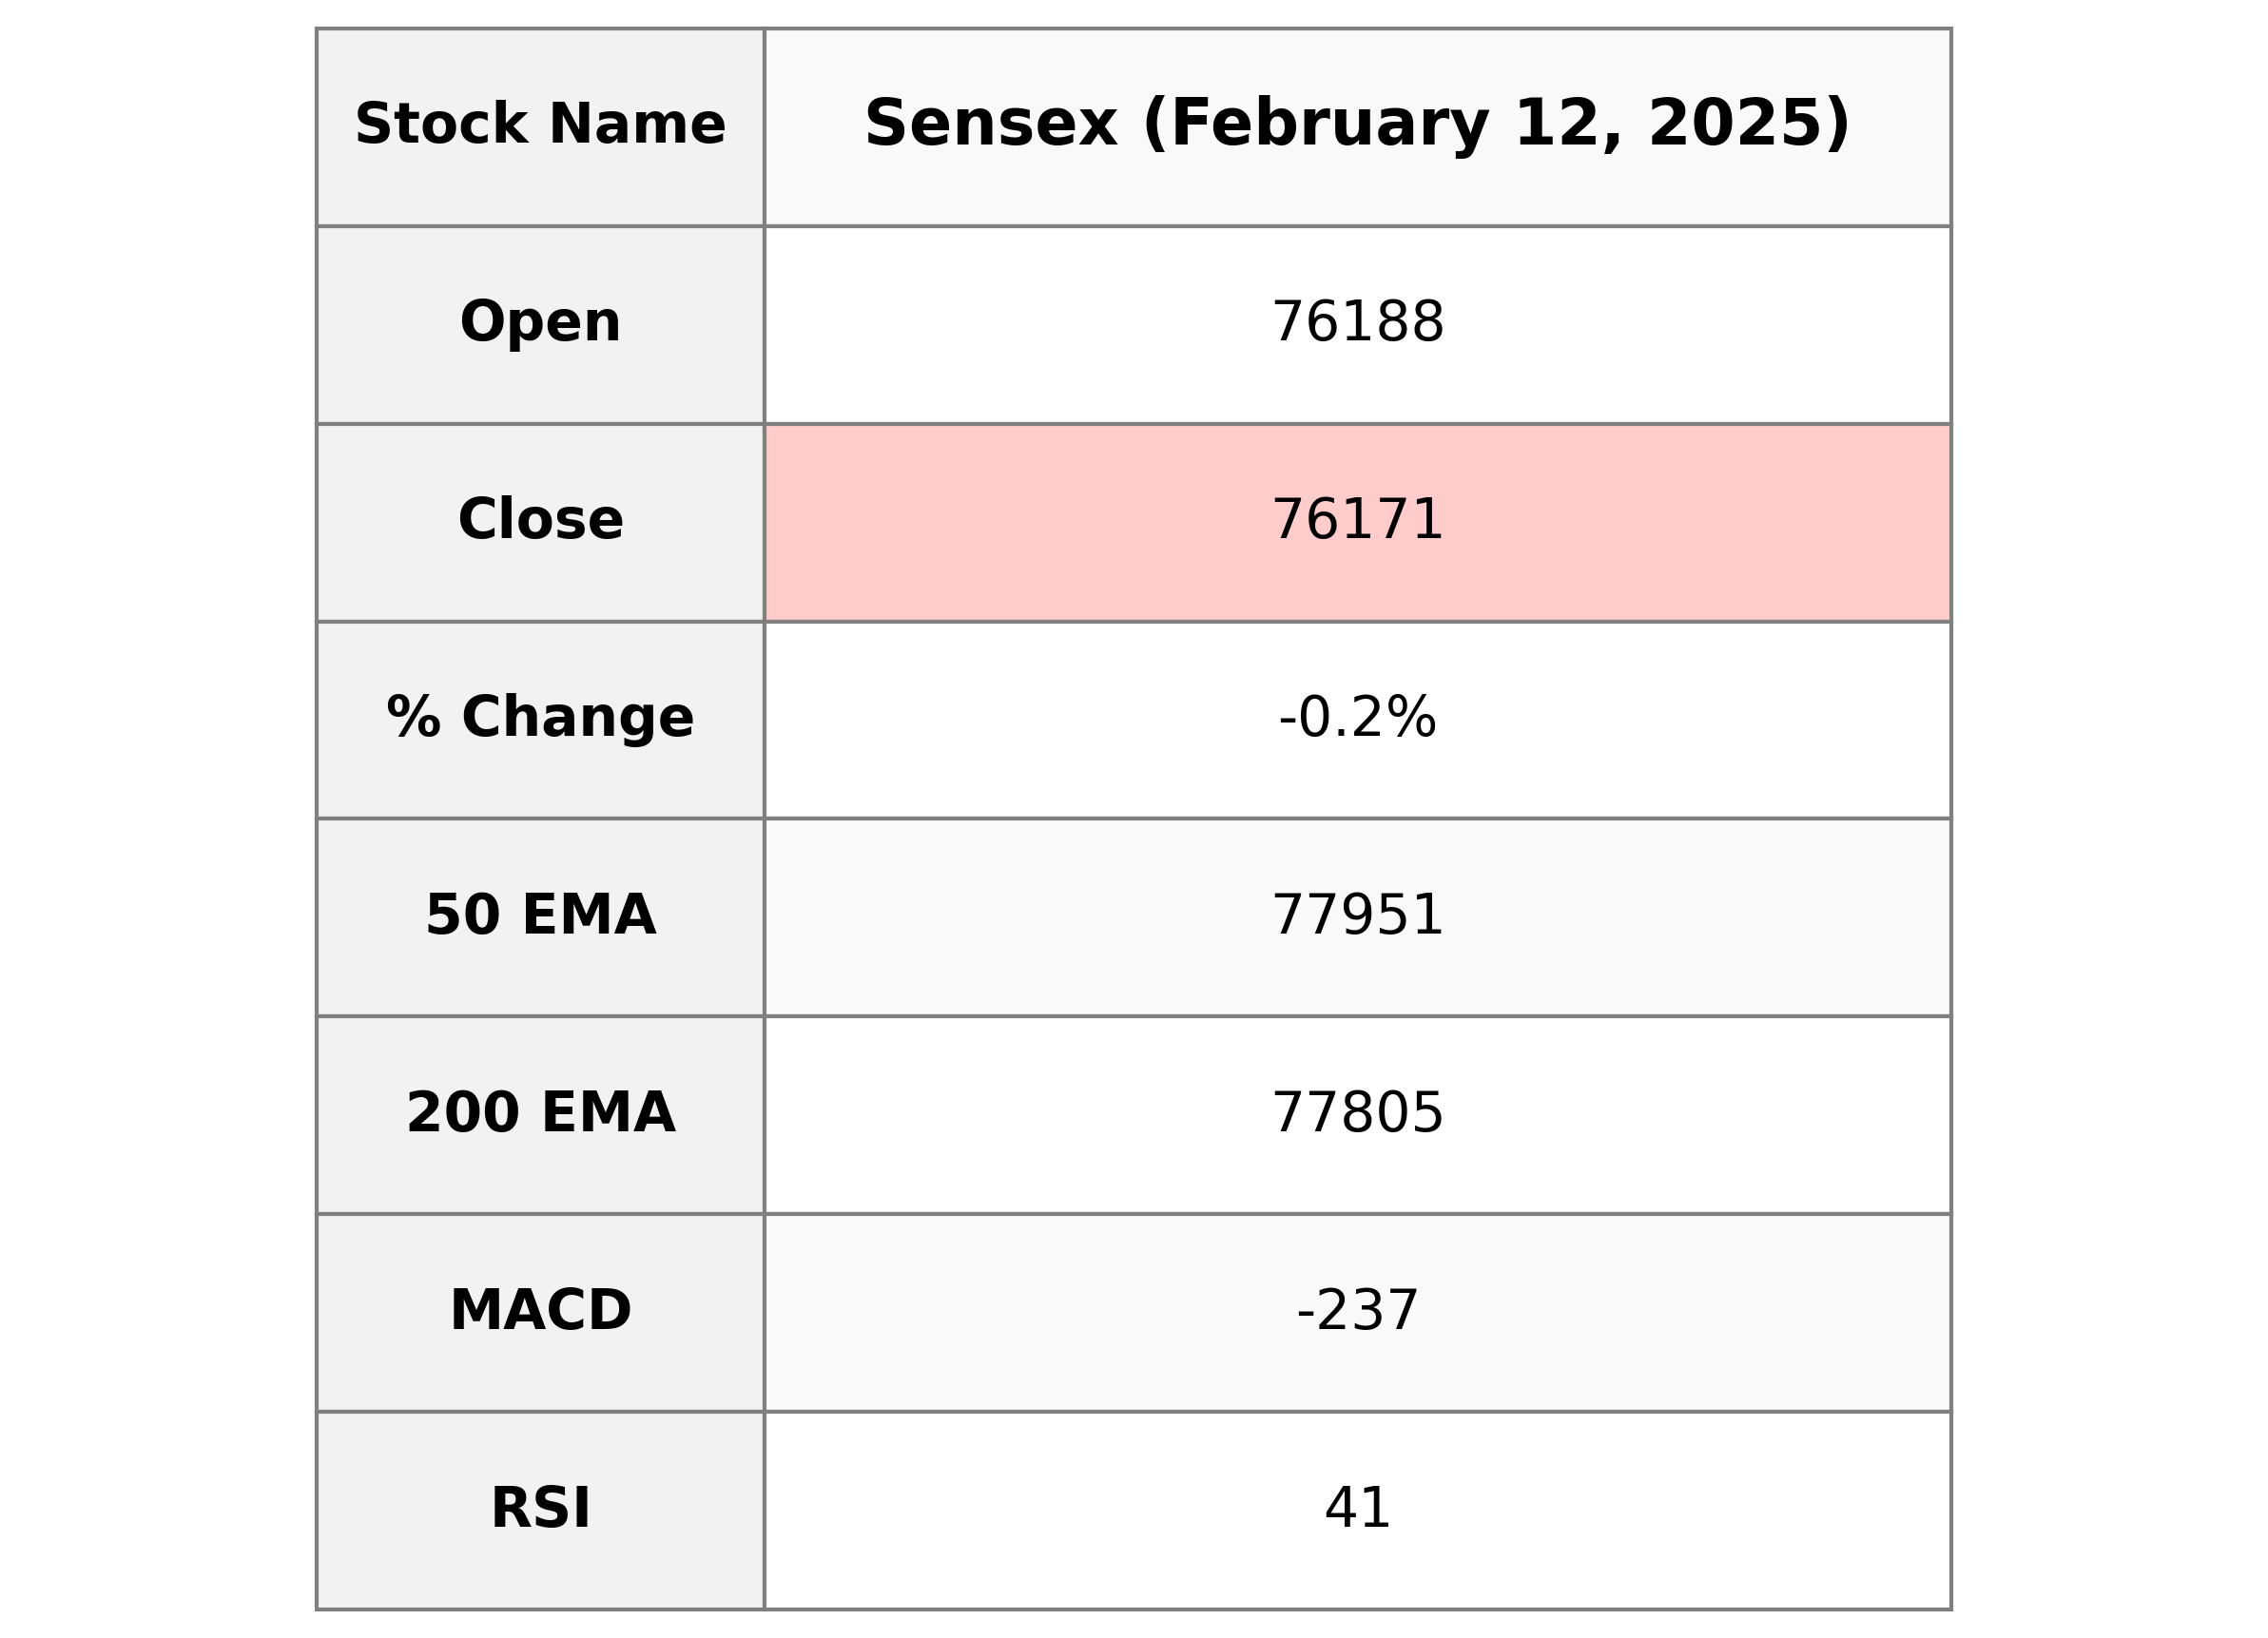
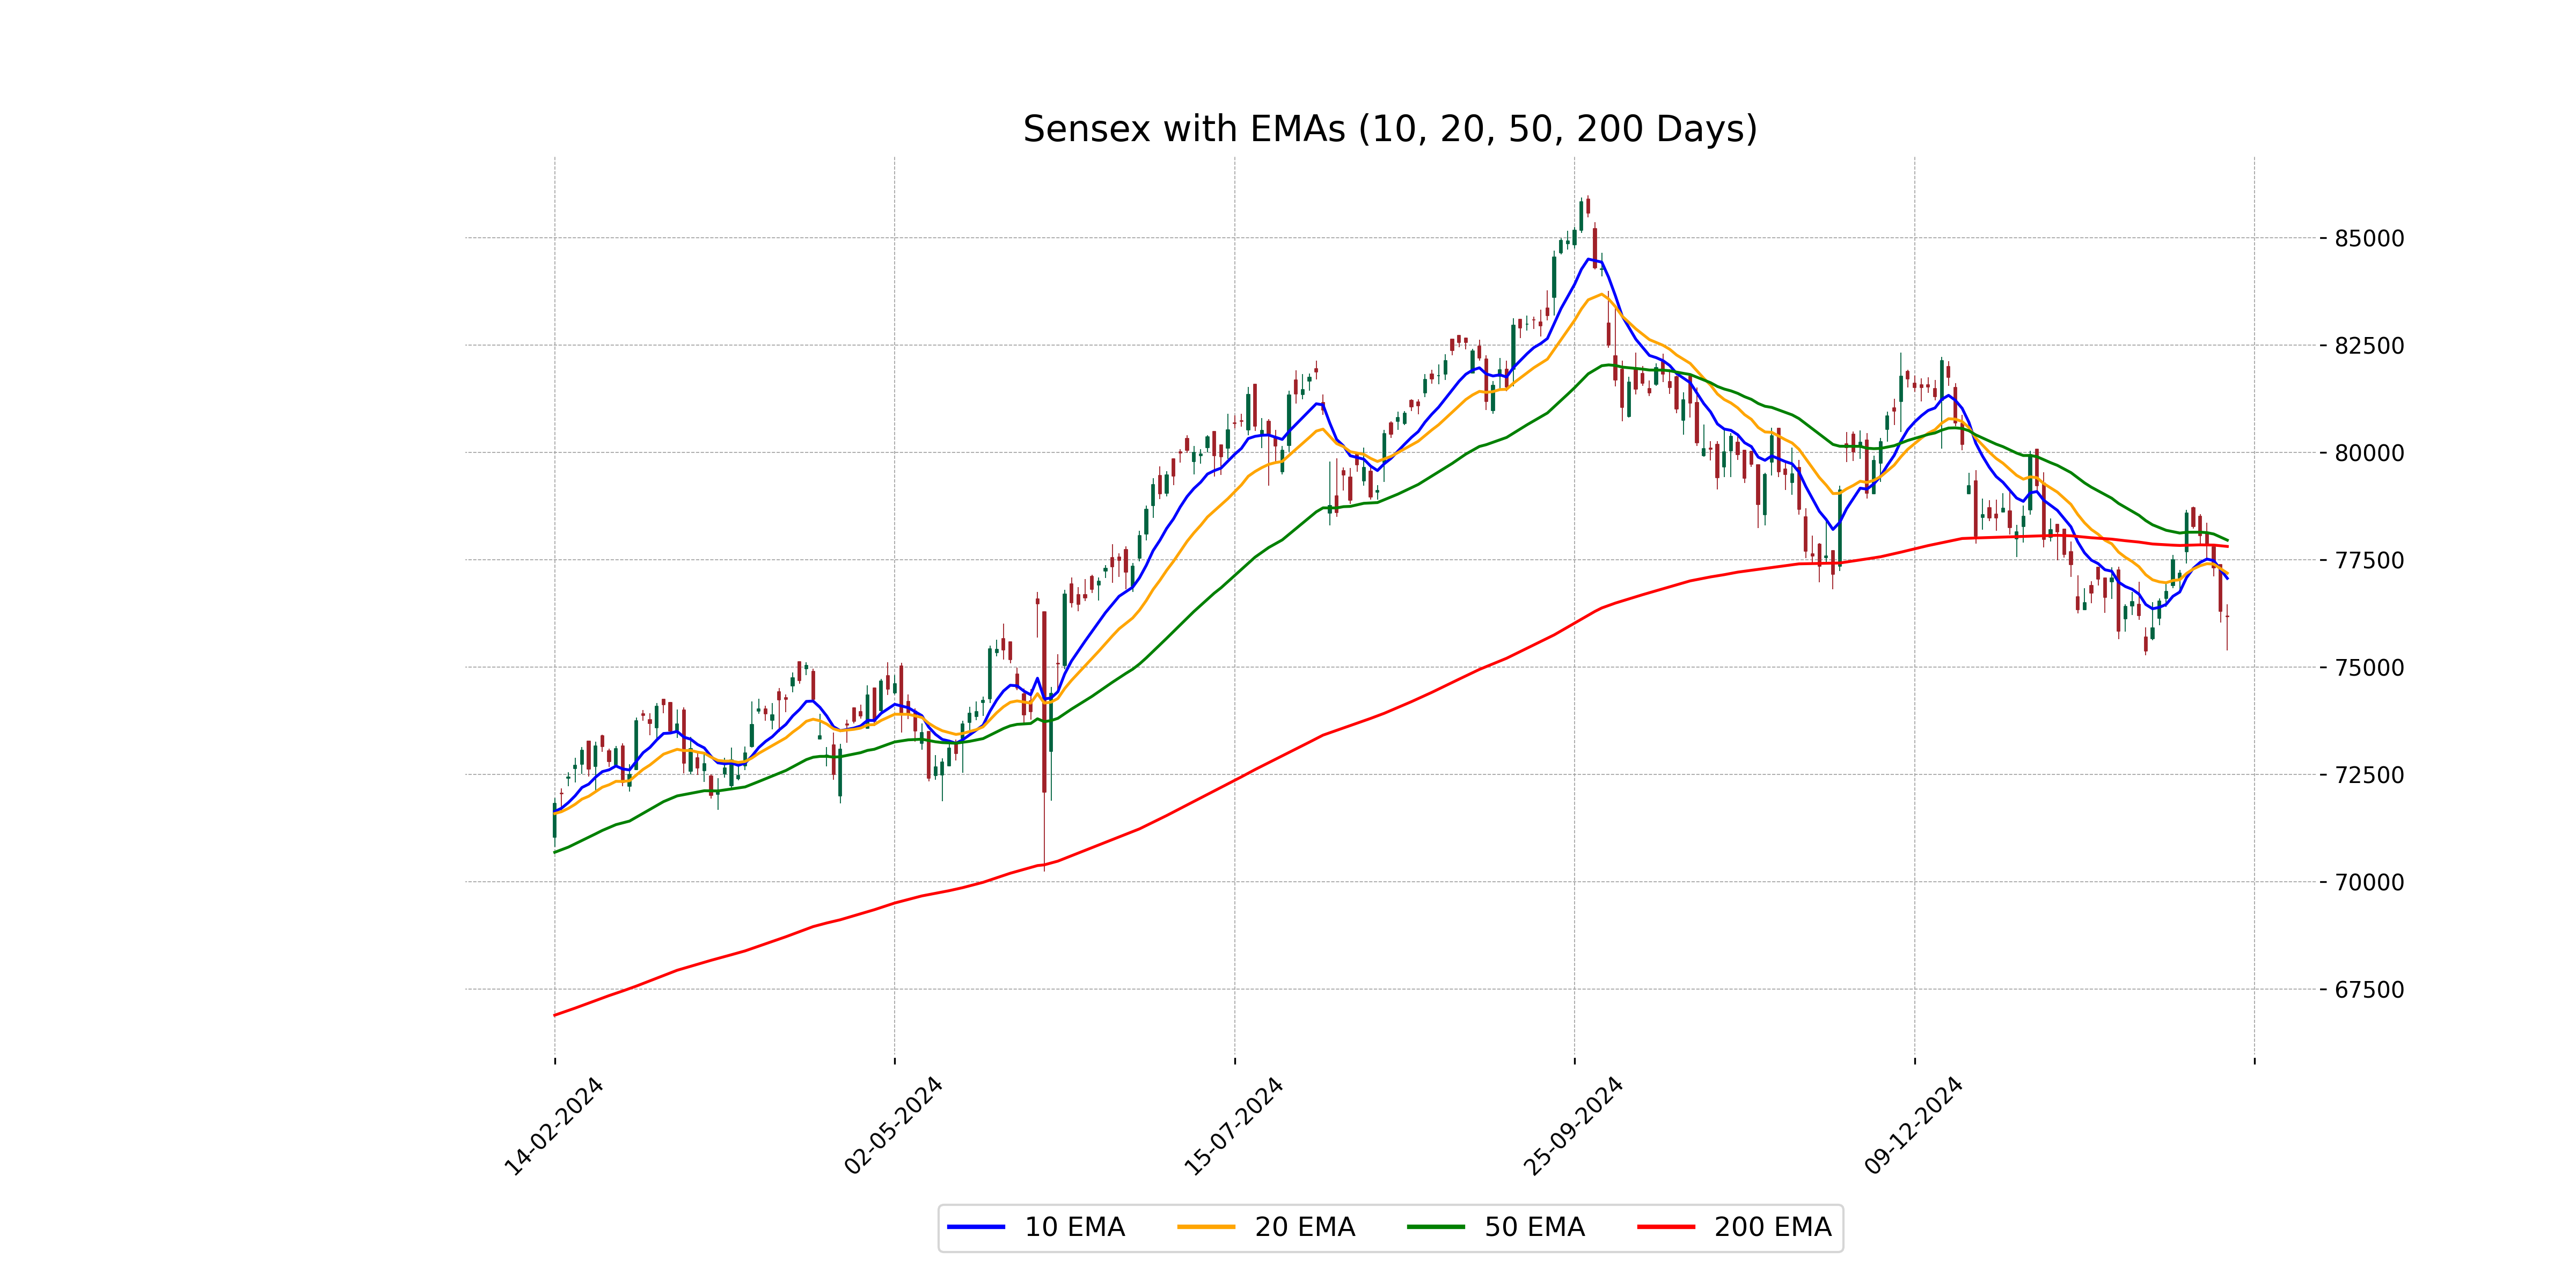
The Sensex opened at 76,188.24 and closed slightly lower at 76,171.08, indicating a decrease of 0.16% from the previous close. It experienced a daily high of 76,459.72 and a low of 75,388.39. Key indicators suggest a bearish sentiment with an RSI of 41.21 and the MACD below the signal line at -237.49.
Relationship with Key Moving Averages
The open and close prices of Sensex are currently below the 50 EMA, 200 EMA, 10 EMA, and 20 EMA, indicating a bearish trend compared to these moving averages. This suggests that the current market price is trading below its short- and long-term average prices, which might indicate downward momentum. Additionally, the negative MACD value and RSI below 50 further support the bearish sentiment.
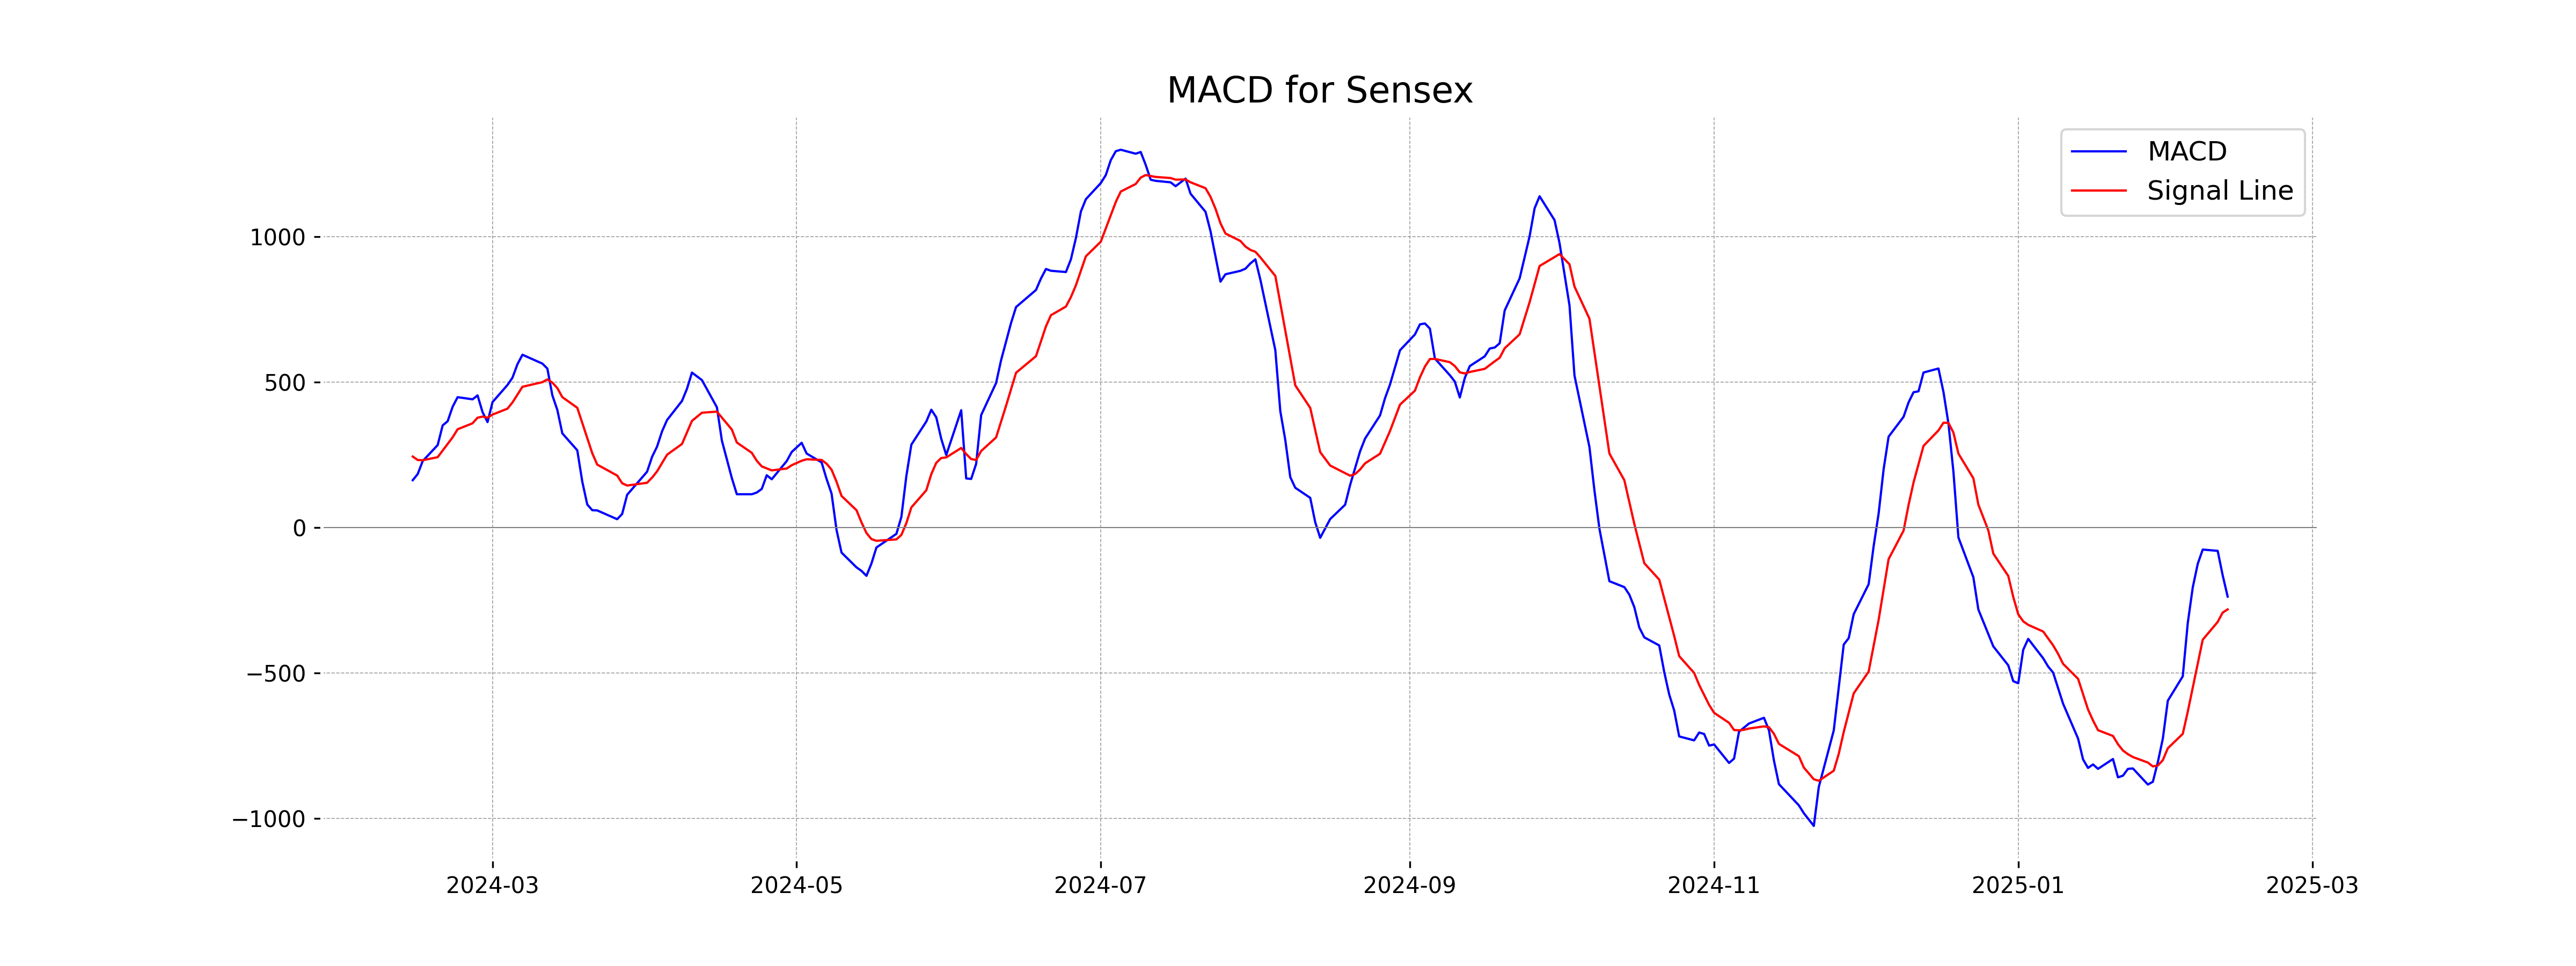
Moving Averages Trend (MACD)
**Sensex MACD Analysis**: The MACD value for Sensex is -237.49, indicating a bearish momentum as it is below the MACD Signal line of -281.42. This negative divergence suggests a potential for continued downward movement in the near term.
RSI Analysis
The RSI (Relative Strength Index) for Sensex is at 41.21, indicating that the index is in a neutral zone, but closer to being oversold. A reading below 30 typically suggests oversold conditions, while above 70 denotes overbought conditions. This suggests a potential for price movement stabilization or a change in trend if the RSI continues to move lower.
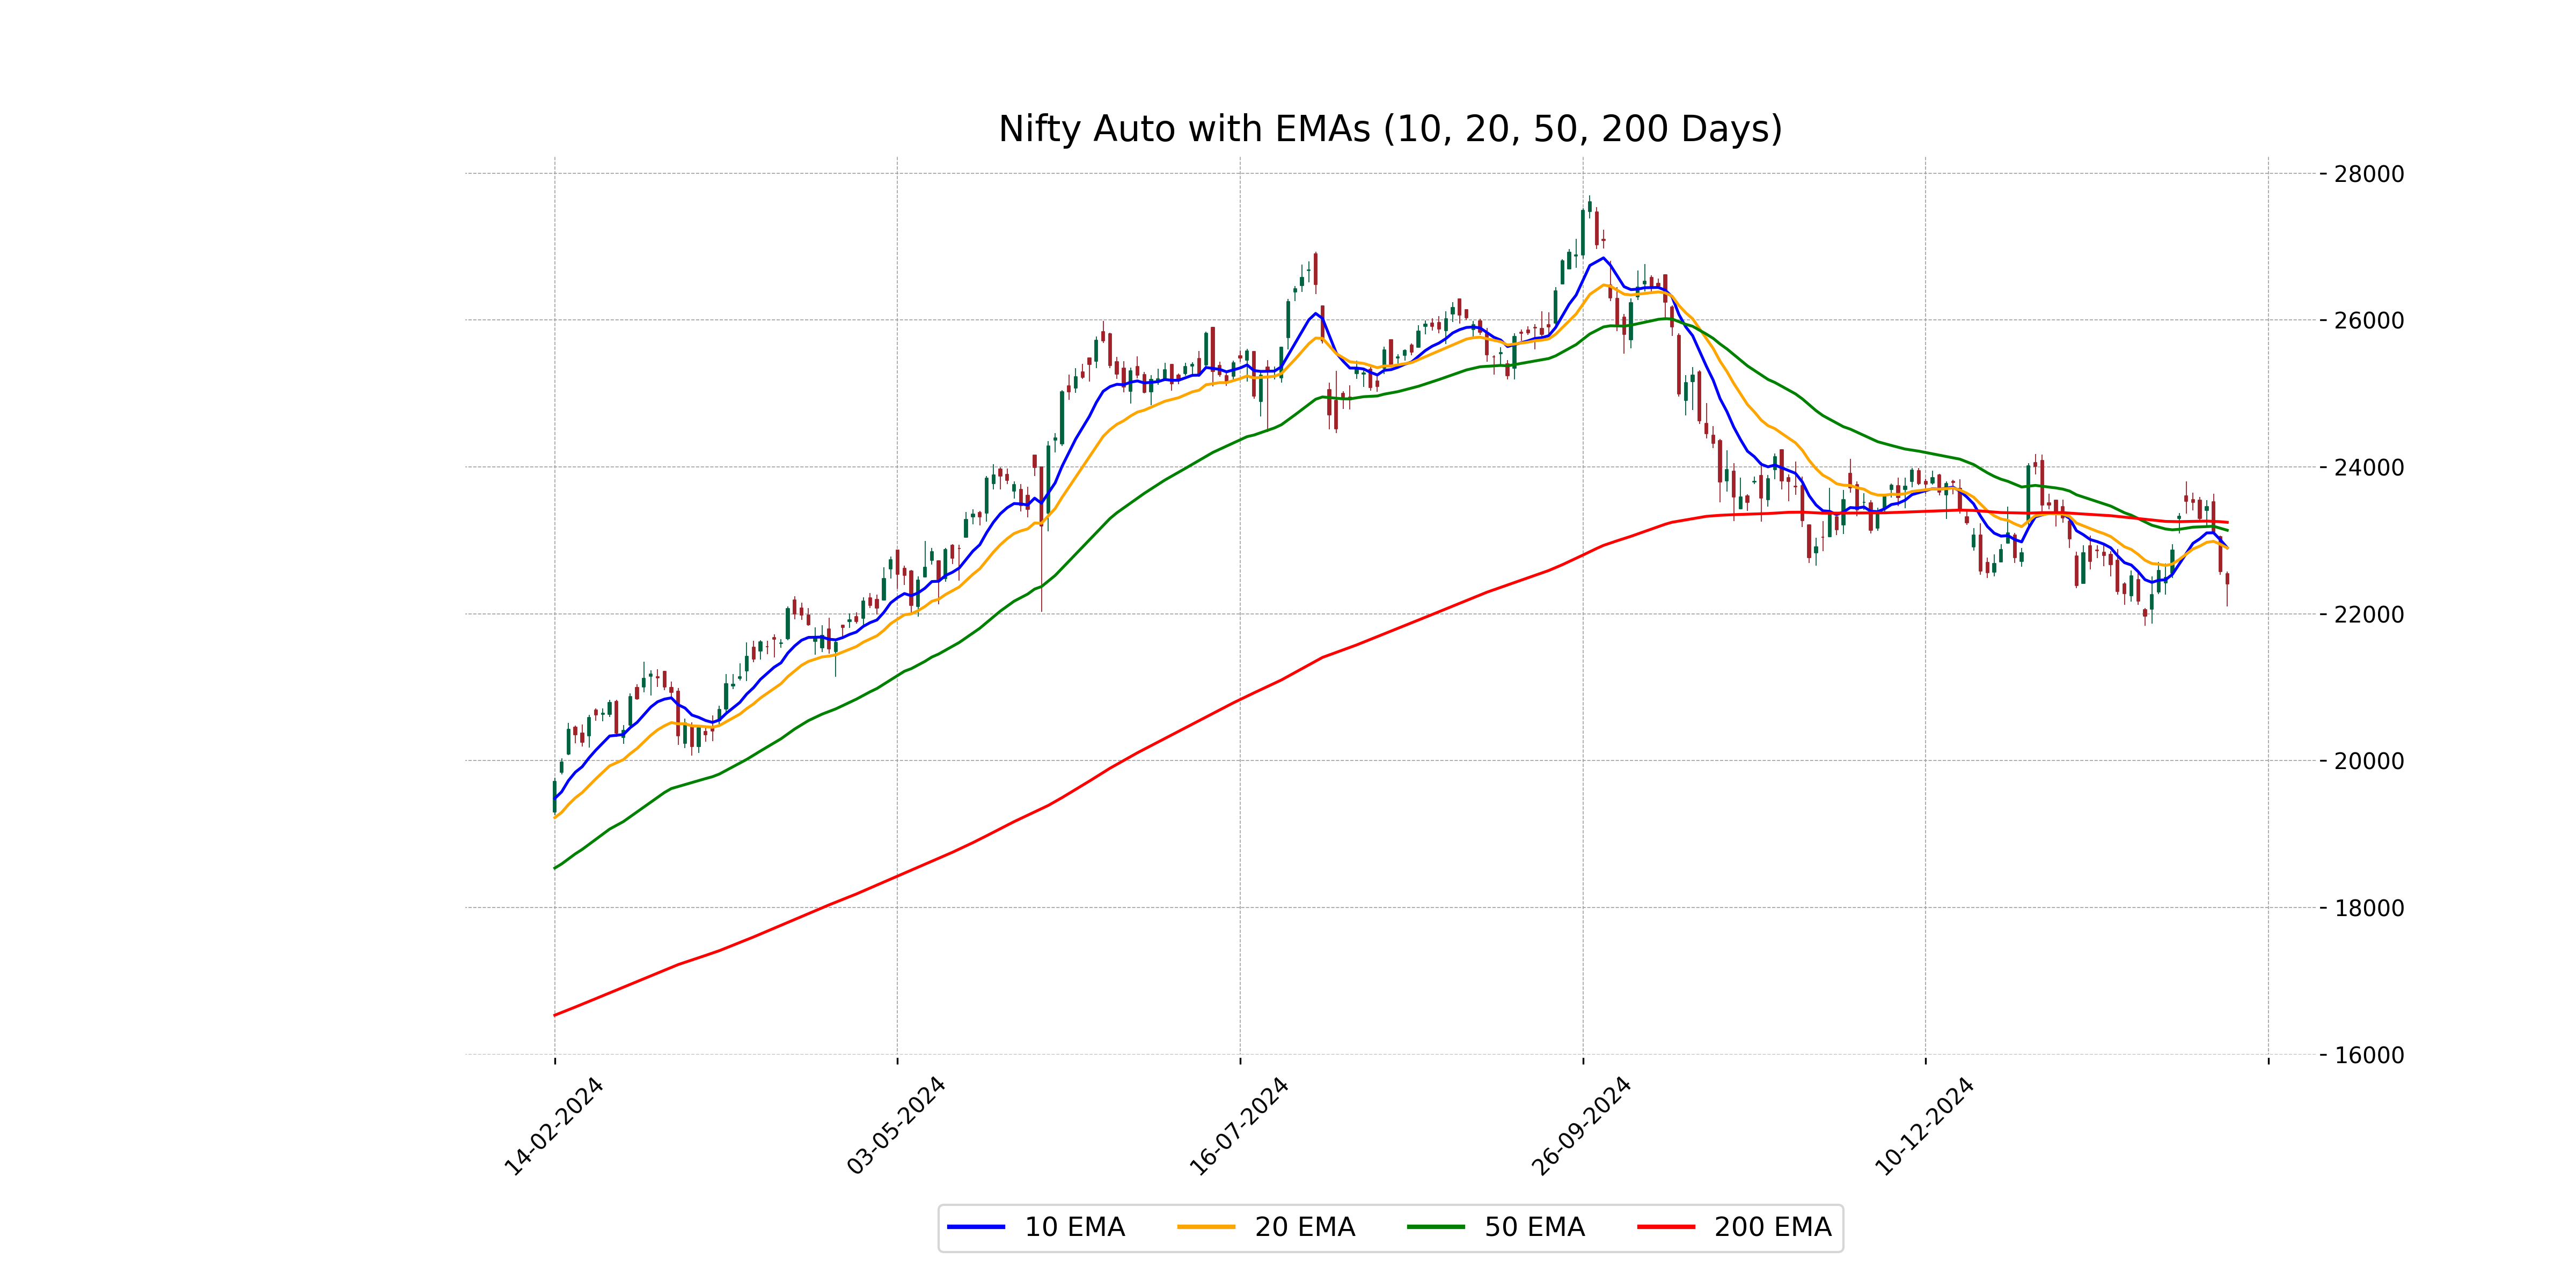
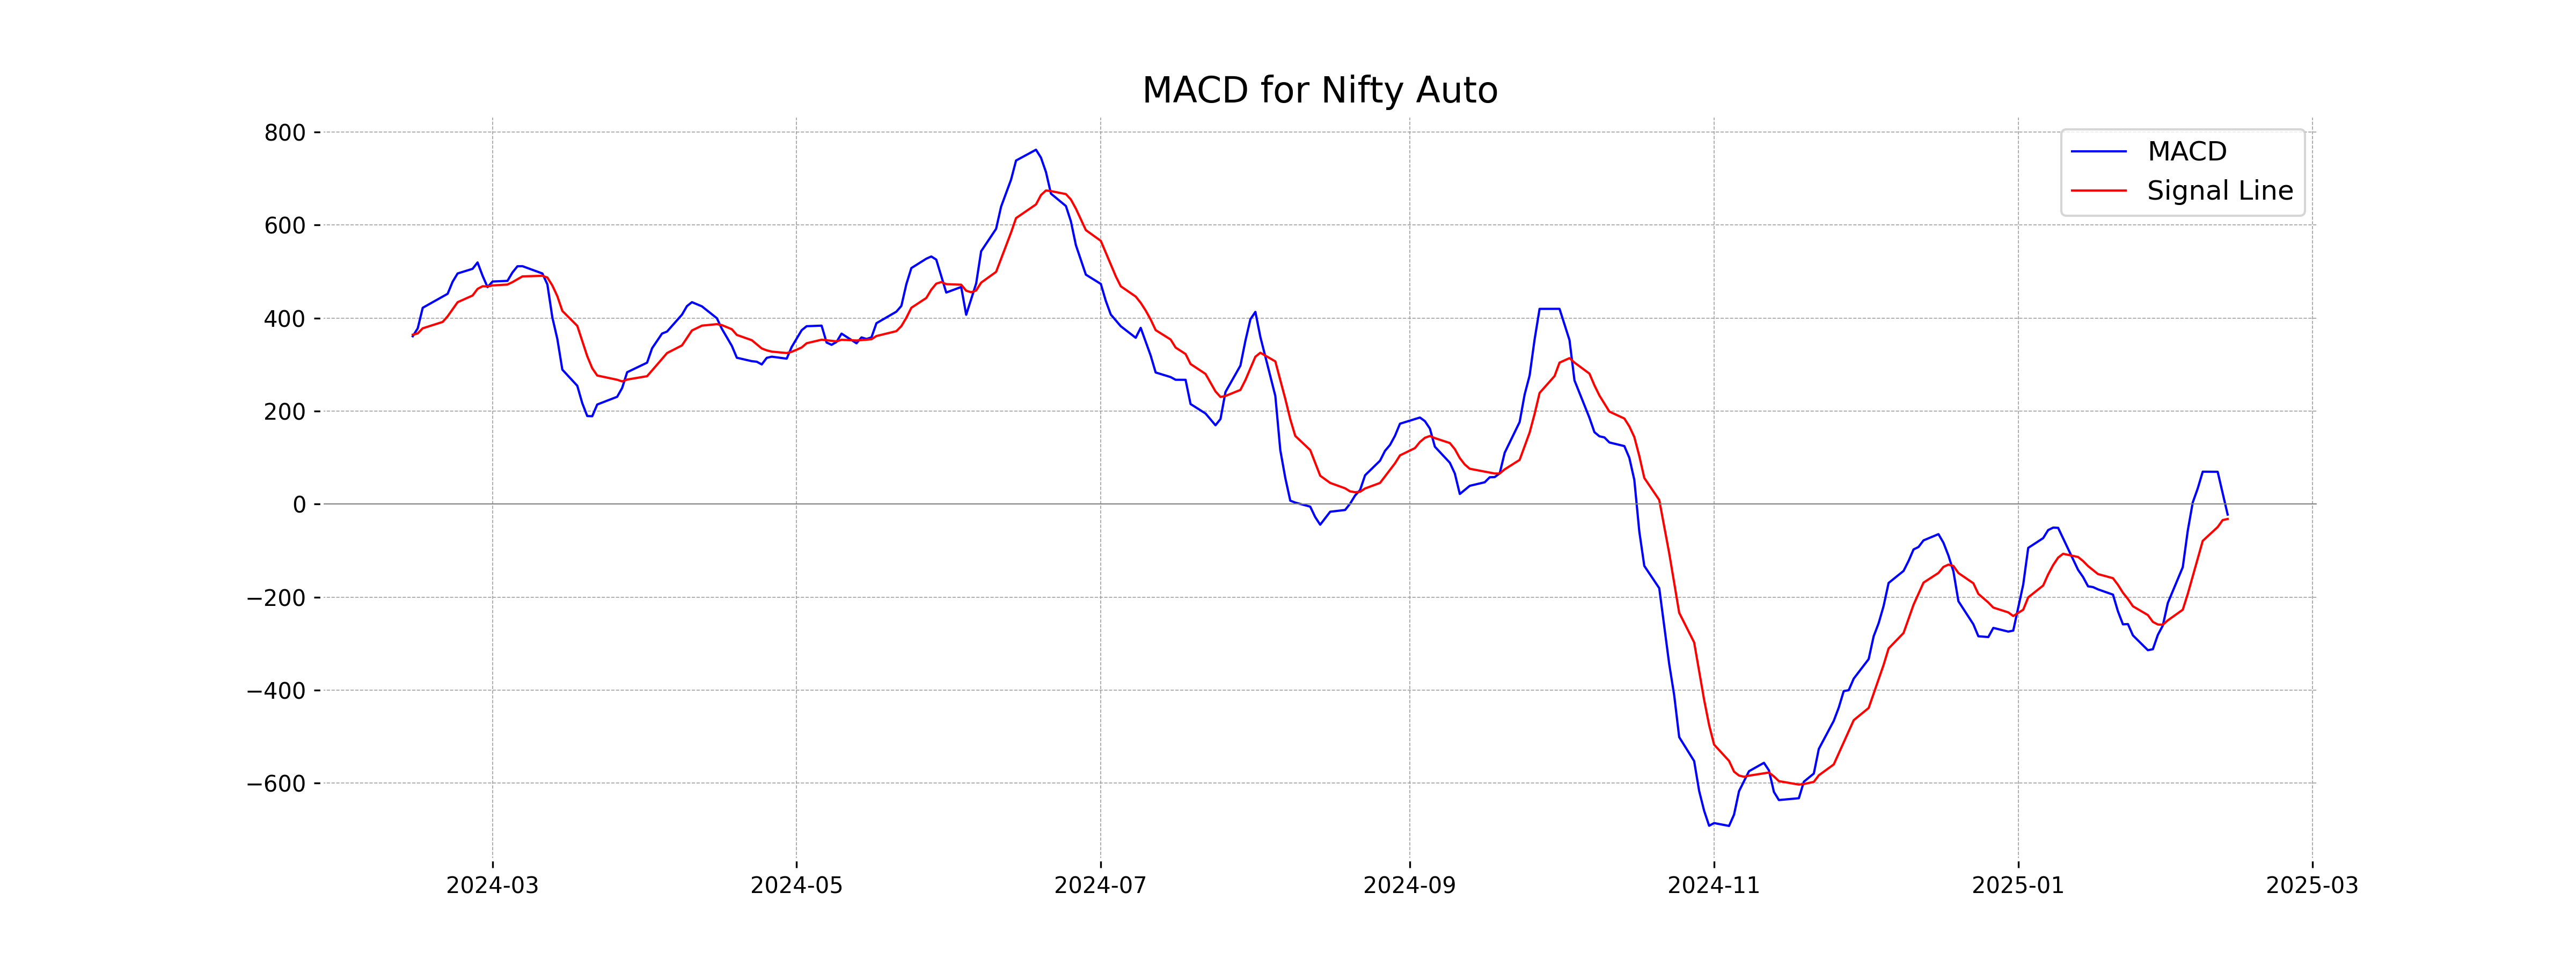
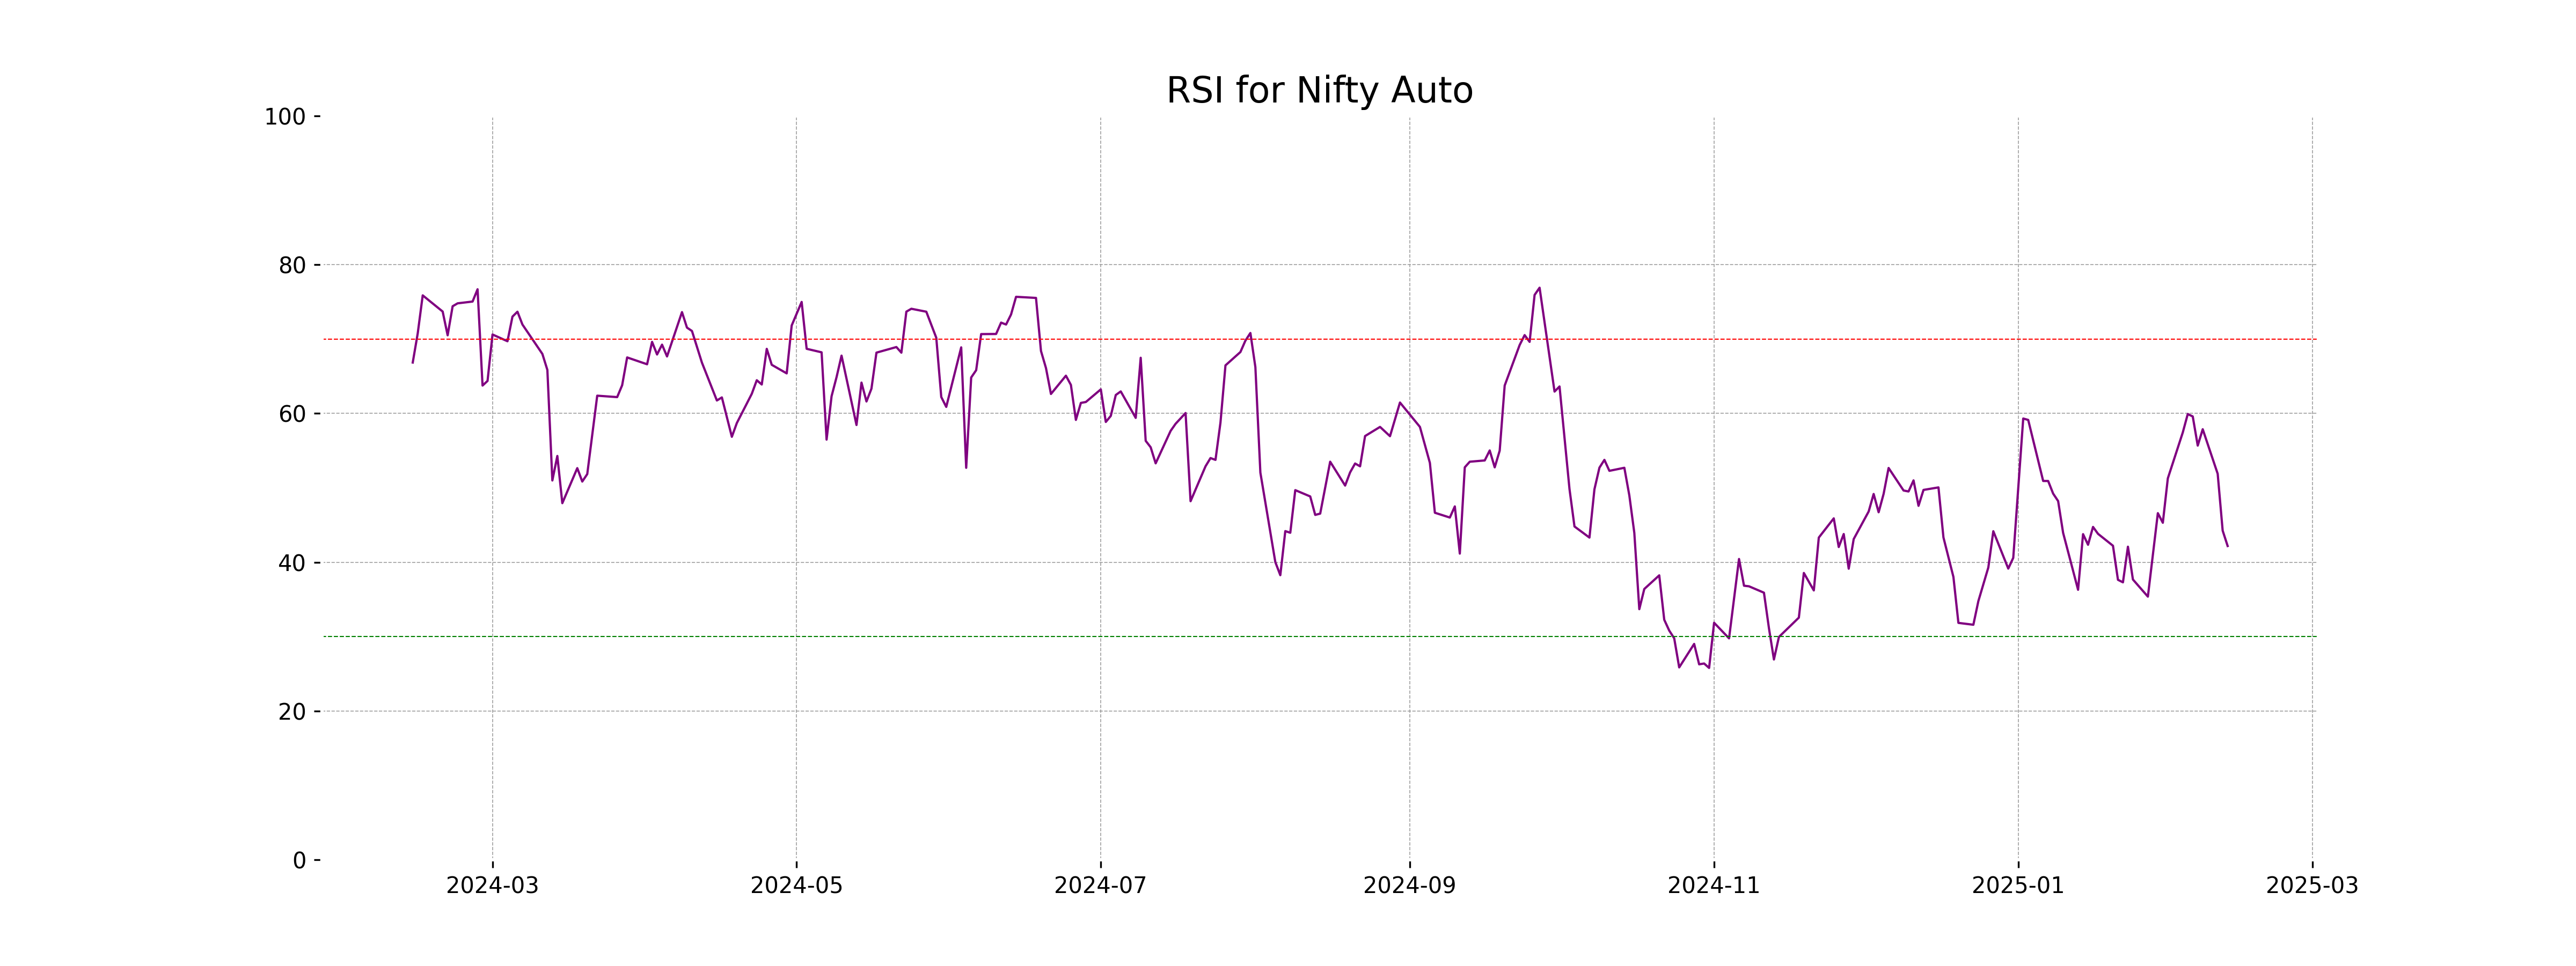
Analysis for Nifty Auto - February 12, 2025

Nifty Auto opened at 22,544.20, reached a high of 22,573.15, and closed at 22,407.45, showing a decrease of 0.74% from its previous close of 22,573.90. The index experienced a points change of -166.45 and has a current RSI of 42.18, indicating a moderately weak momentum. The MACD is at -22.52 with a signal of -32.06, suggesting a bearish trend.
Relationship with Key Moving Averages
The closing price of Nifty Auto at 22407.45 is below its 10-day EMA of 22898.09, 20-day EMA of 22895.88, 50-day EMA of 23137.98, and 200-day EMA of 23245.88. This suggests a bearish trend in the short-term and long-term perspectives, as the index is trading below these key moving averages.
Moving Averages Trend (MACD)
The MACD for Nifty Auto is -22.52, with the MACD Signal at -32.06. This indicates a bullish crossover as the MACD line is moving towards the signal line, suggesting potential upward momentum. However, with the RSI at 42.18, it is in the neutral zone.
RSI Analysis
The RSI for Nifty Auto is 42.18, which typically indicates that the stock is neither overbought nor oversold. An RSI below 30 usually suggests an undervalued condition, while above 70 indicates overvaluation. Therefore, Nifty Auto appears to be in a neutral zone, pointing towards a balanced momentum.
Analysis for Nifty Energy - February 12, 2025
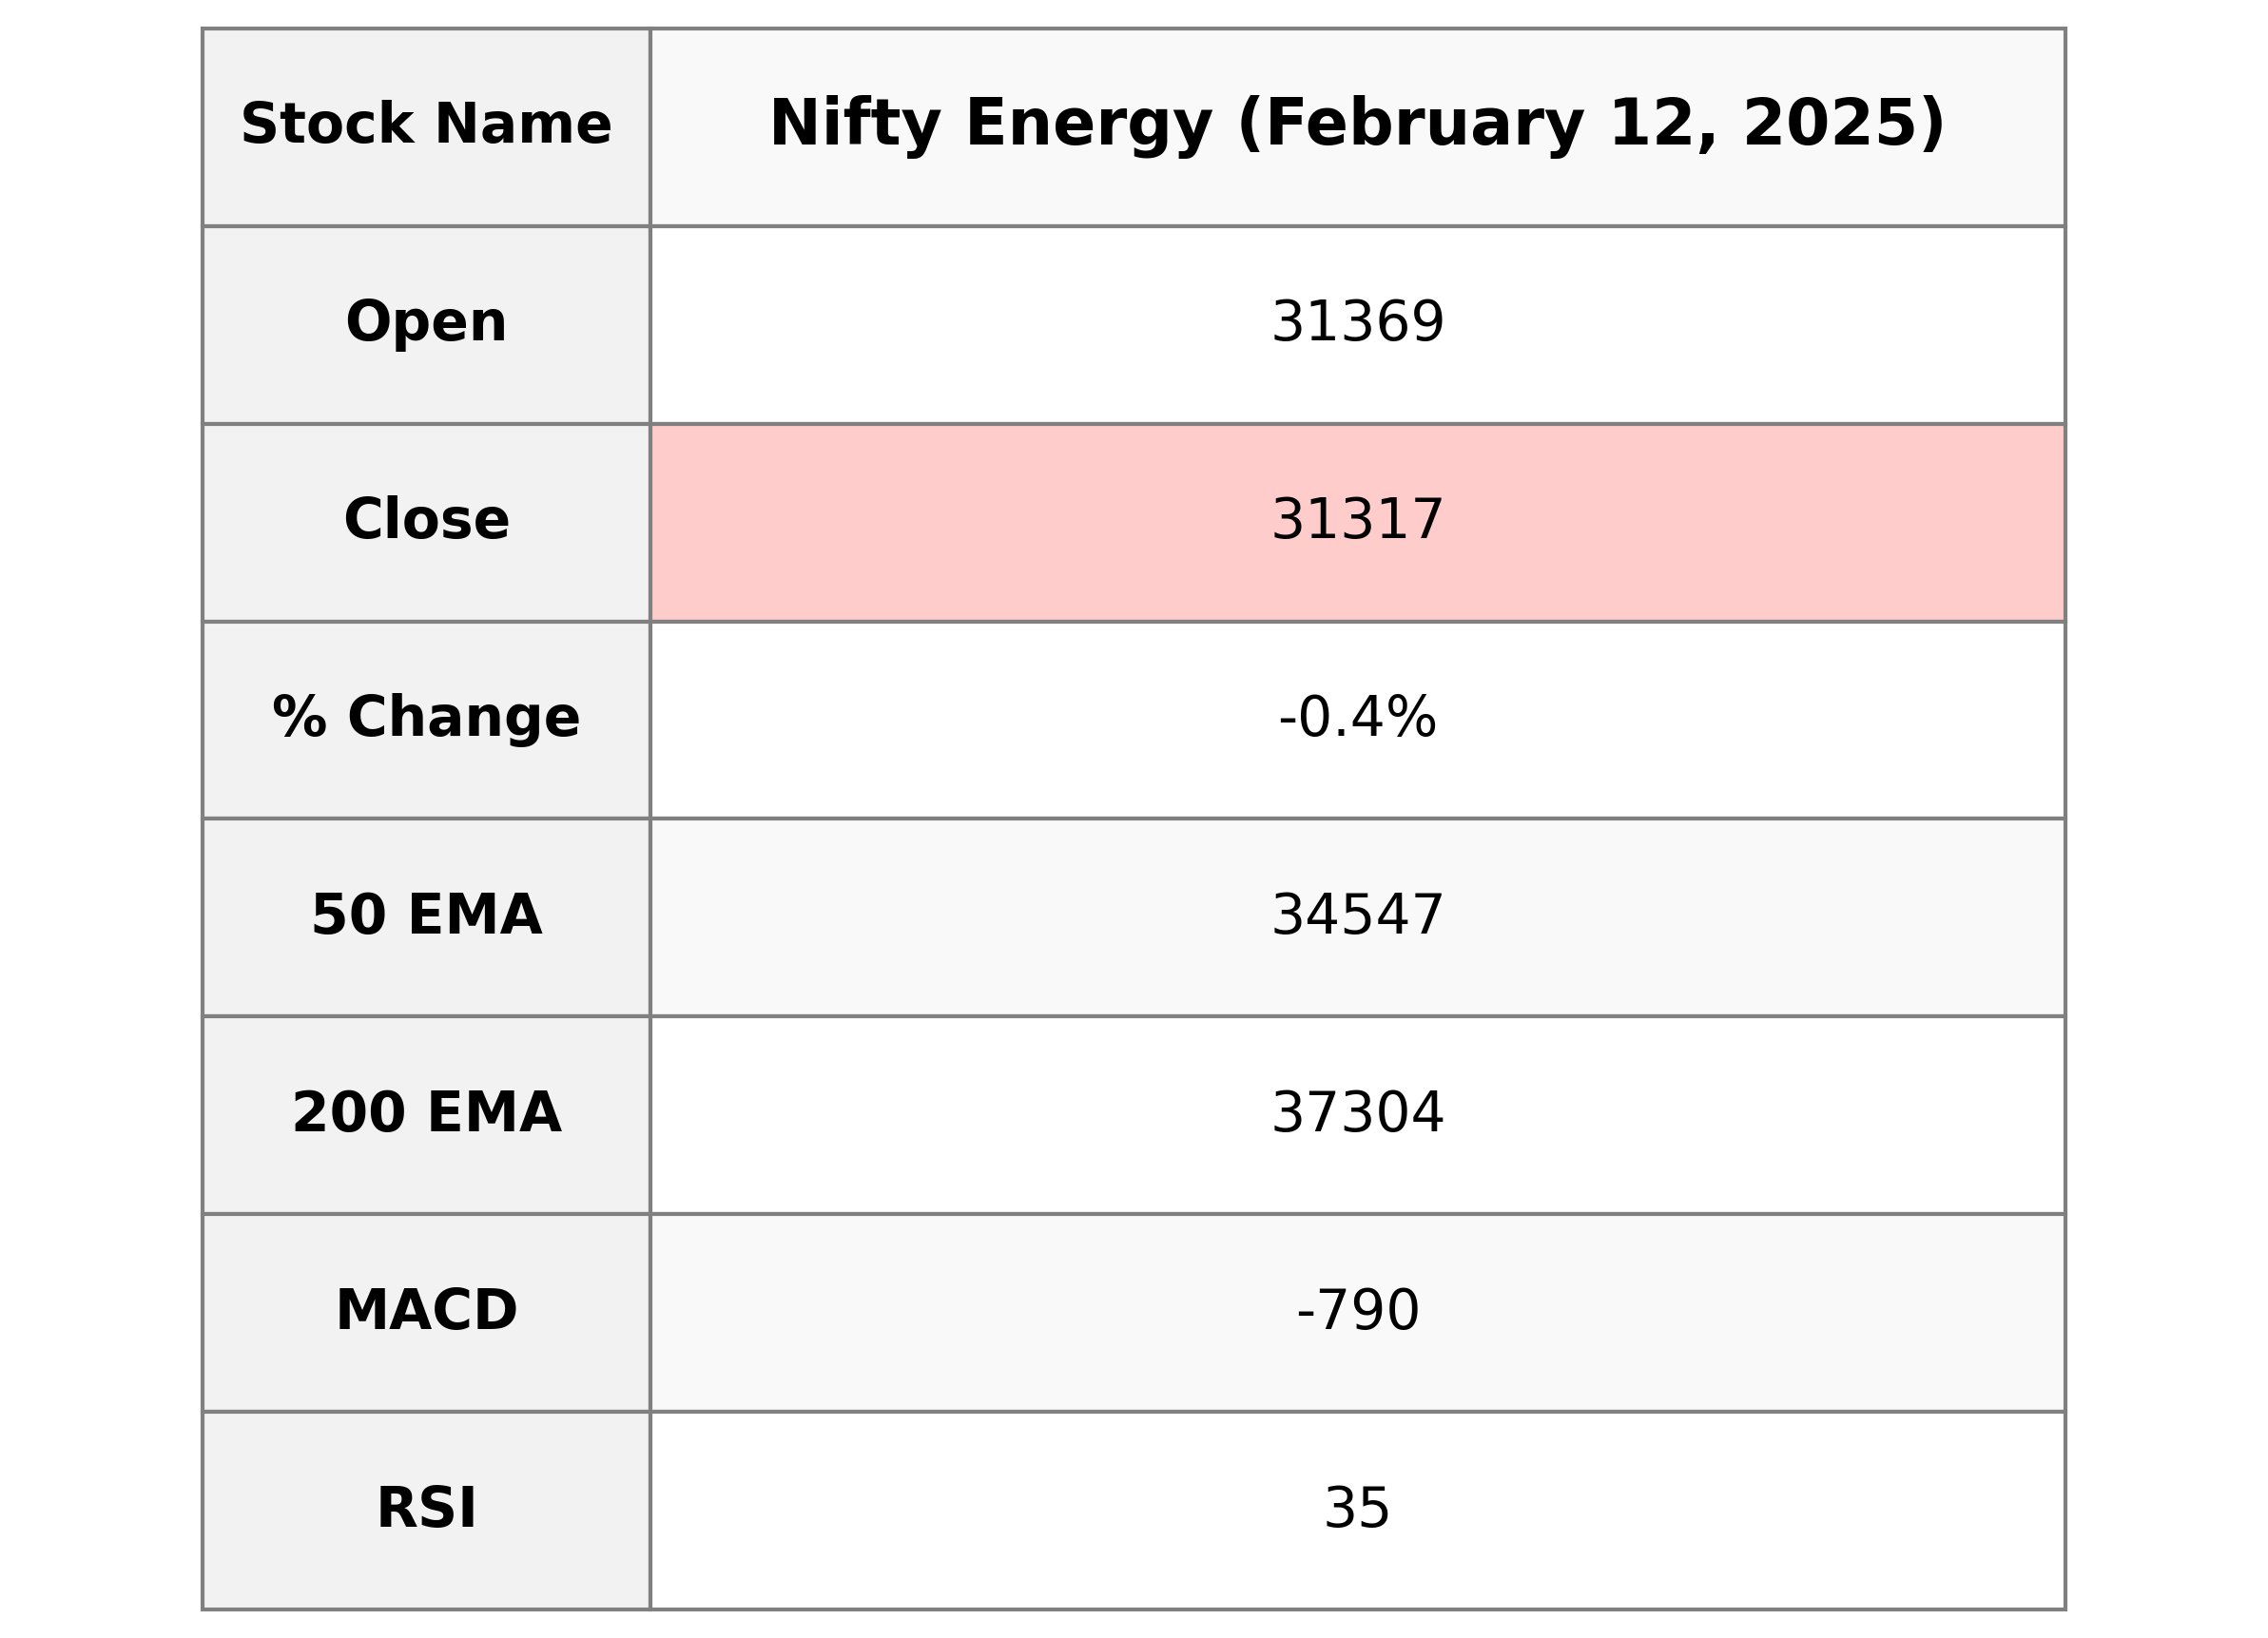
Nifty Energy opened at 31,369.45 and closed at 31,317.30, with a change of -0.38% in value from the previous close of 31,436.75. The stock experienced a drop of 119.45 points. The RSI is at 35.28, indicating a potential oversold condition, while the MACD is below the signal line, suggesting bearish momentum.
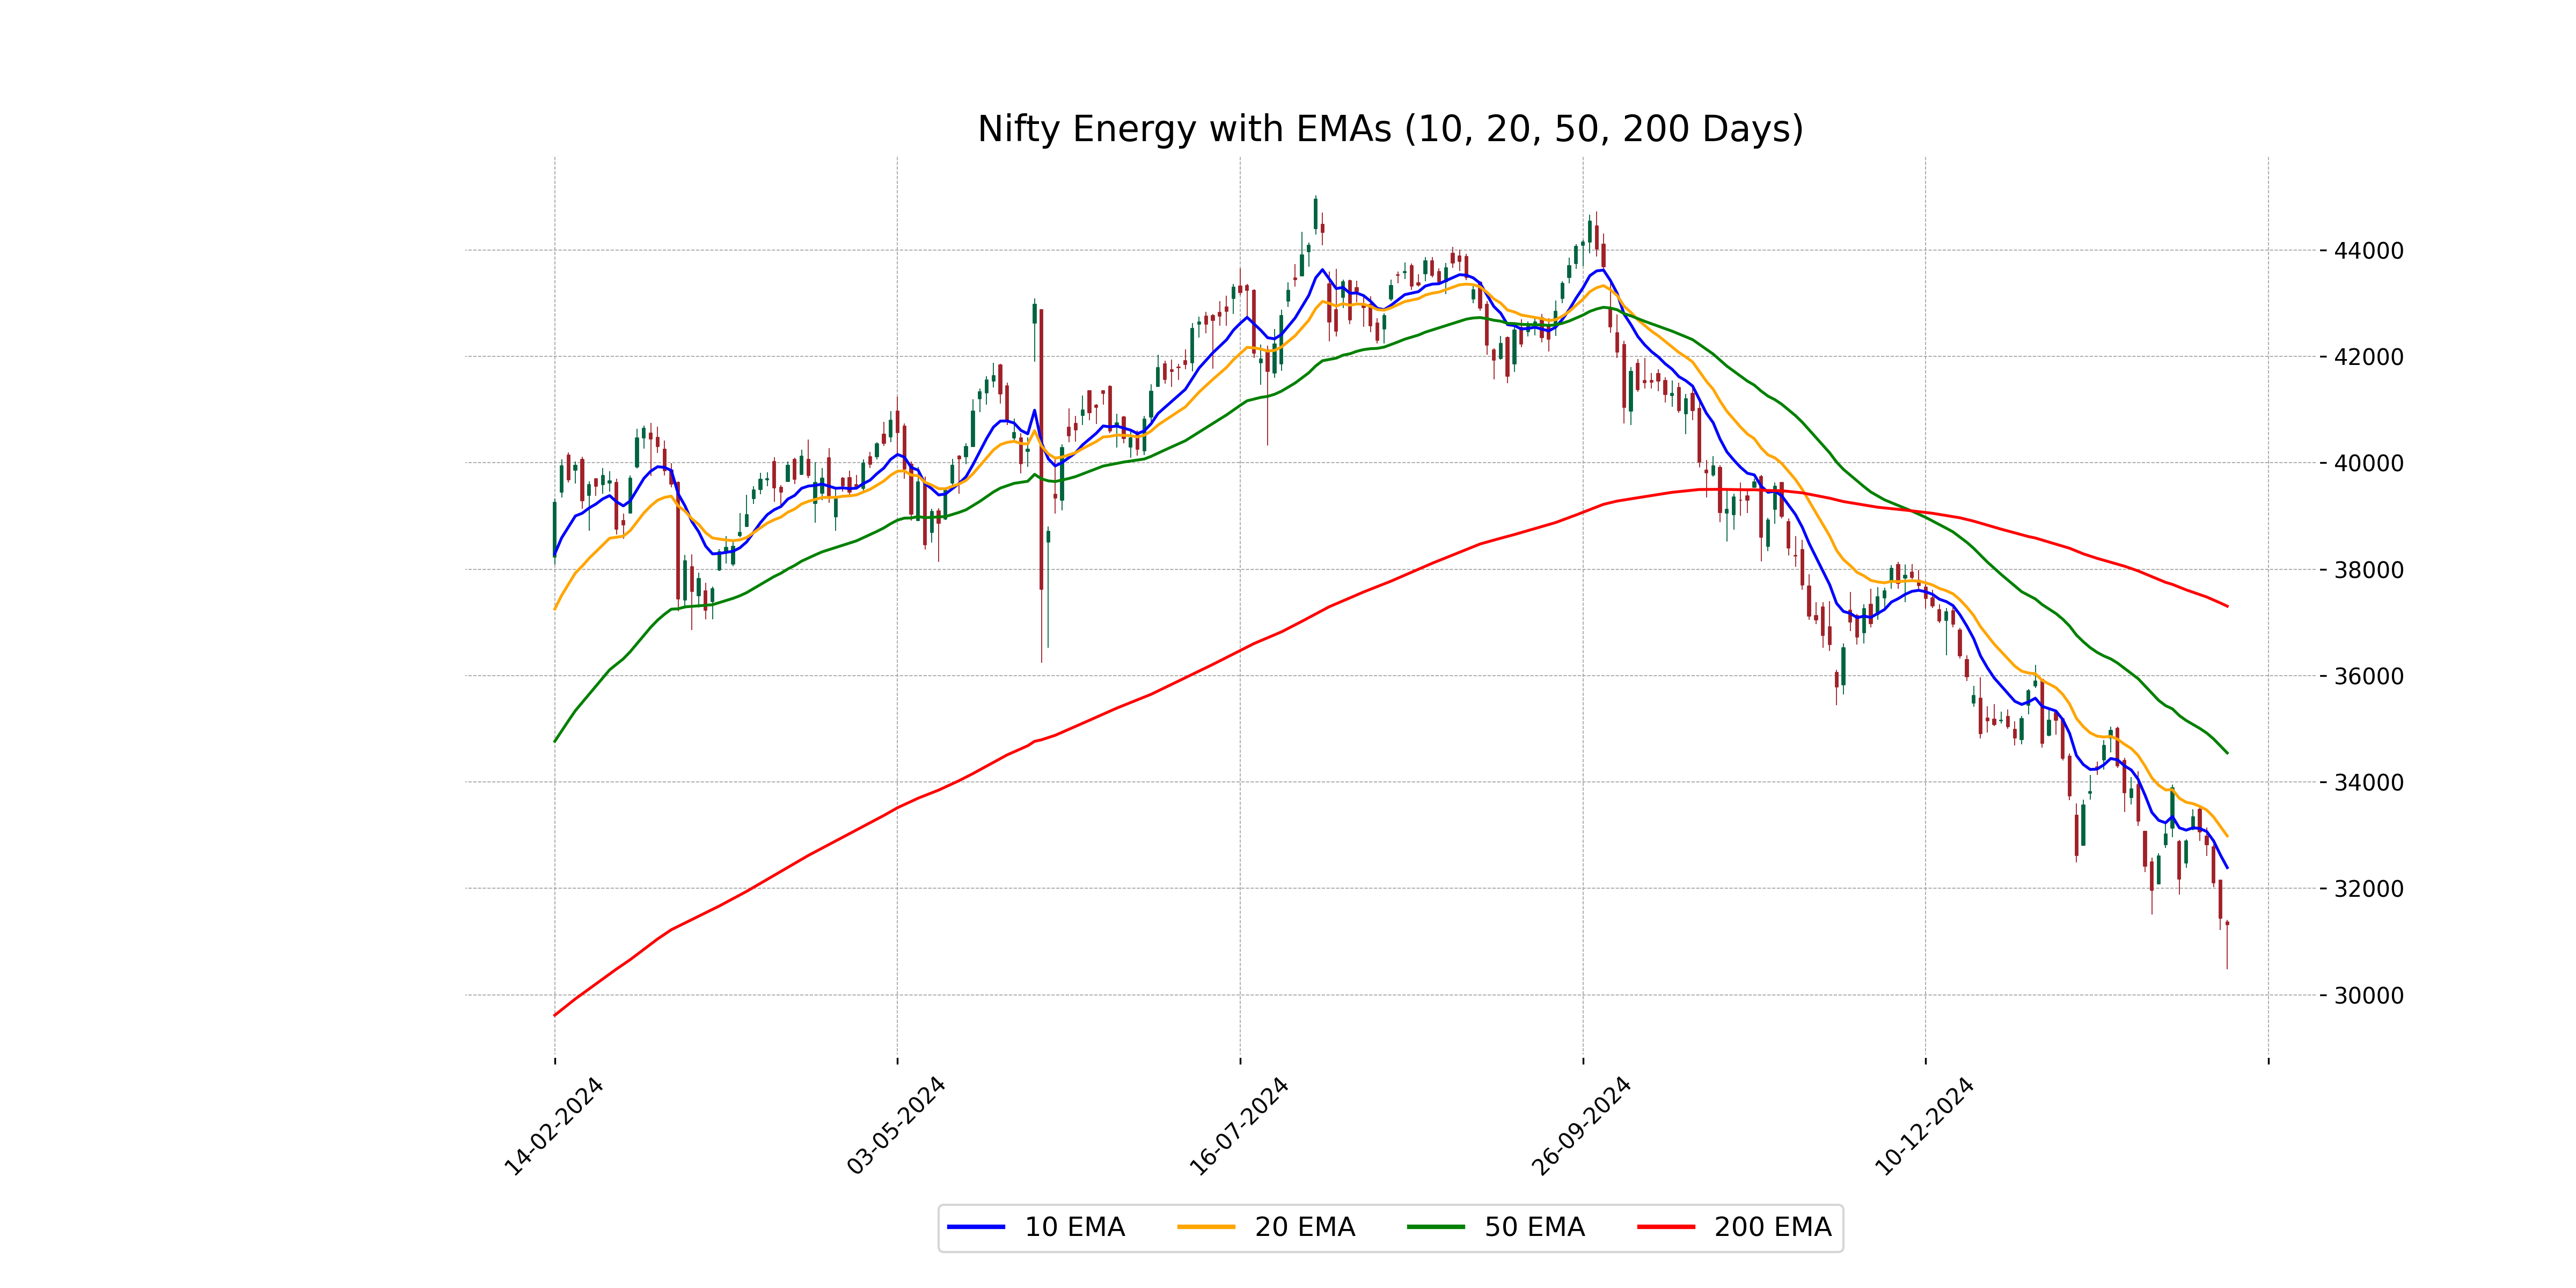
Relationship with Key Moving Averages
The Nifty Energy index closed below its 10-day, 20-day, 50-day, and 200-day EMAs, indicating a bearish trend in the short to long-term perspectives. With the closing price at 31317.30, the index is showing weakness as it remains below these key moving averages, further supported by a high RSI indicating potential continuation of downward momentum.
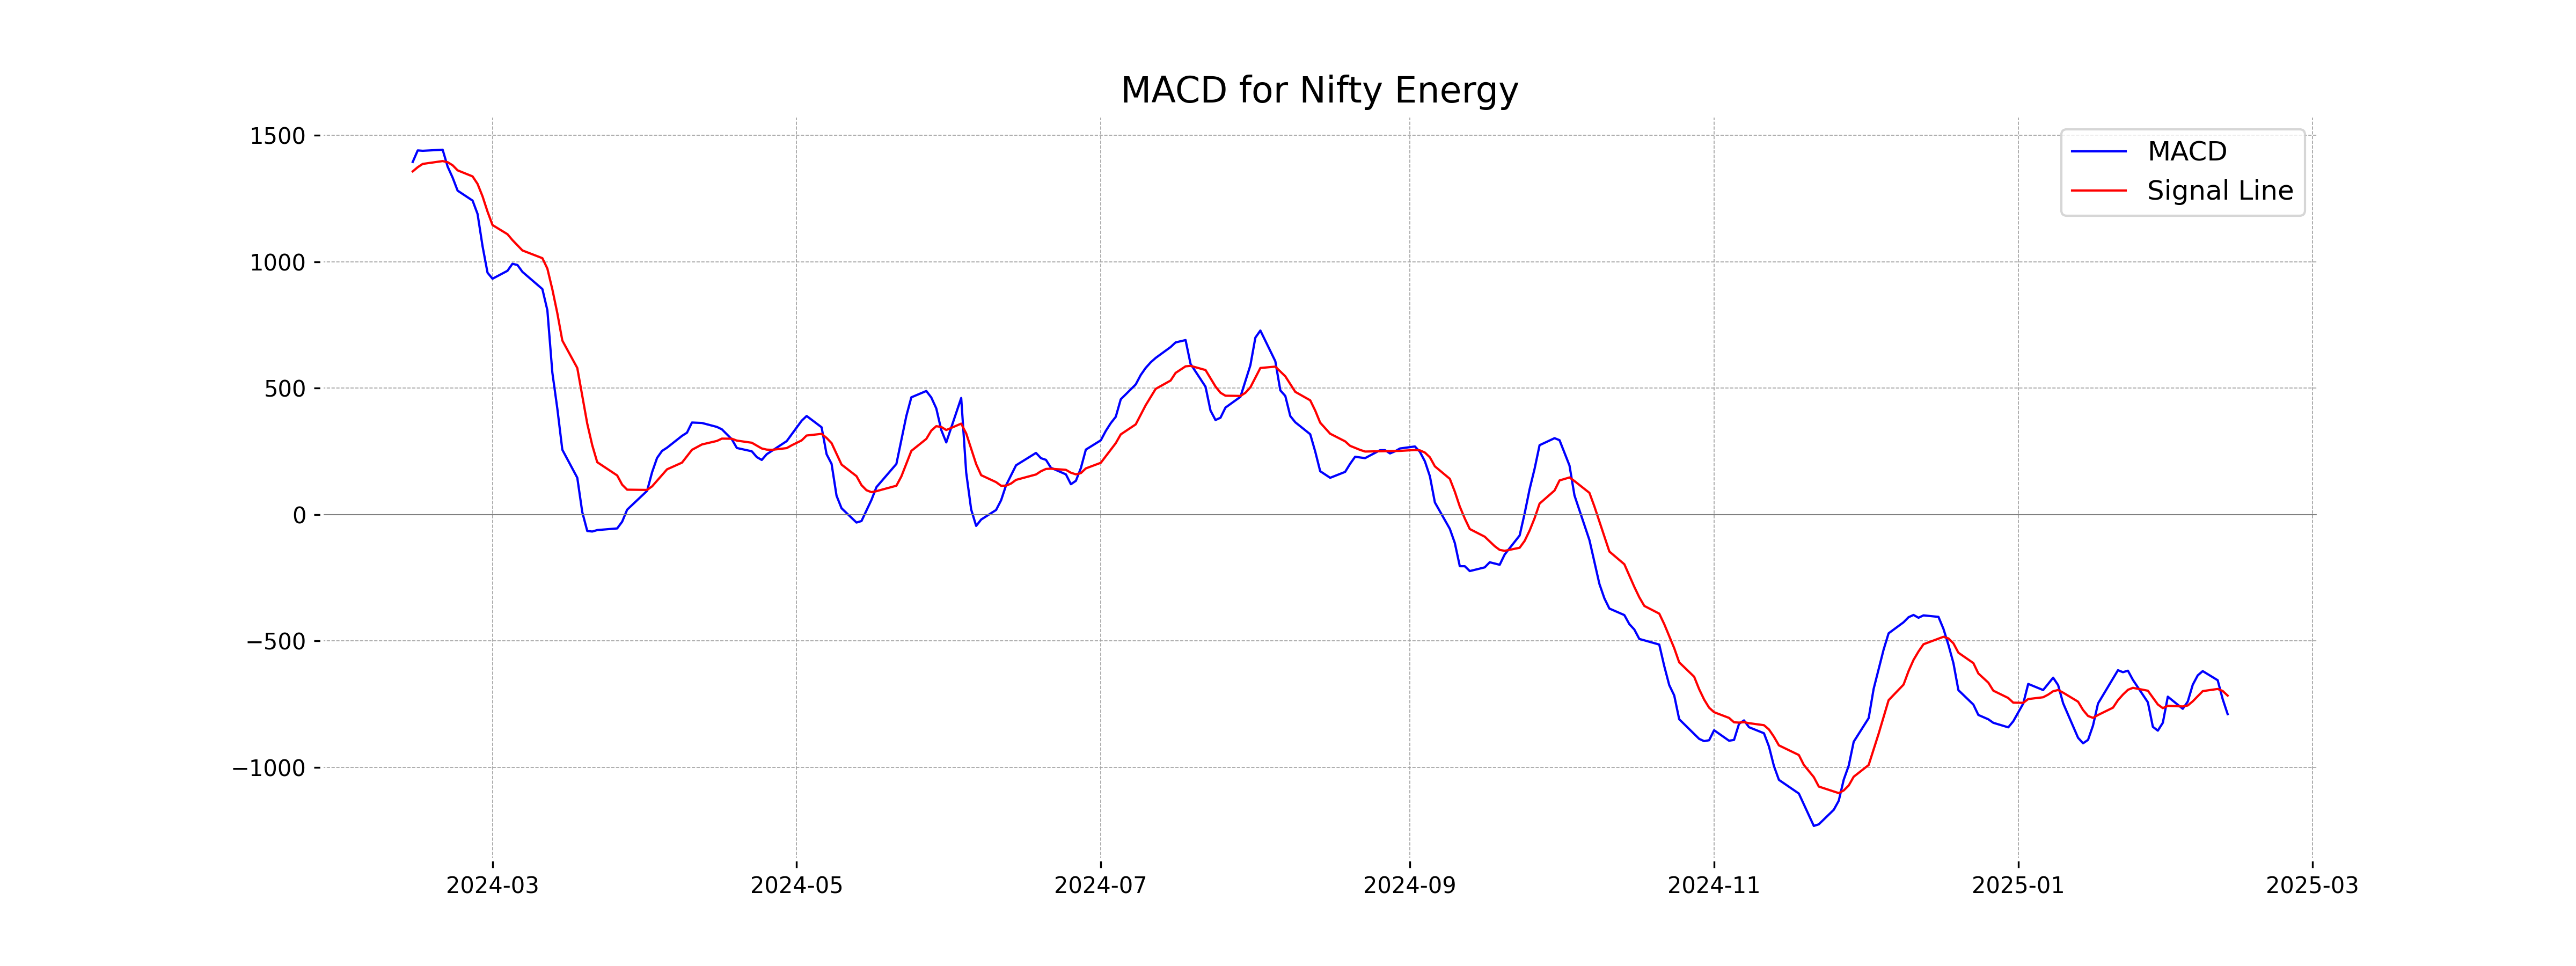
Moving Averages Trend (MACD)
**MACD Analysis for Nifty Energy:** The MACD value is -789.61, which is below the MACD Signal value of -716.32. This indicates a bearish trend as the indicator suggests that downward momentum is increasing. With the Relative Strength Index (RSI) at 35.28, the index is also approaching oversold territory.
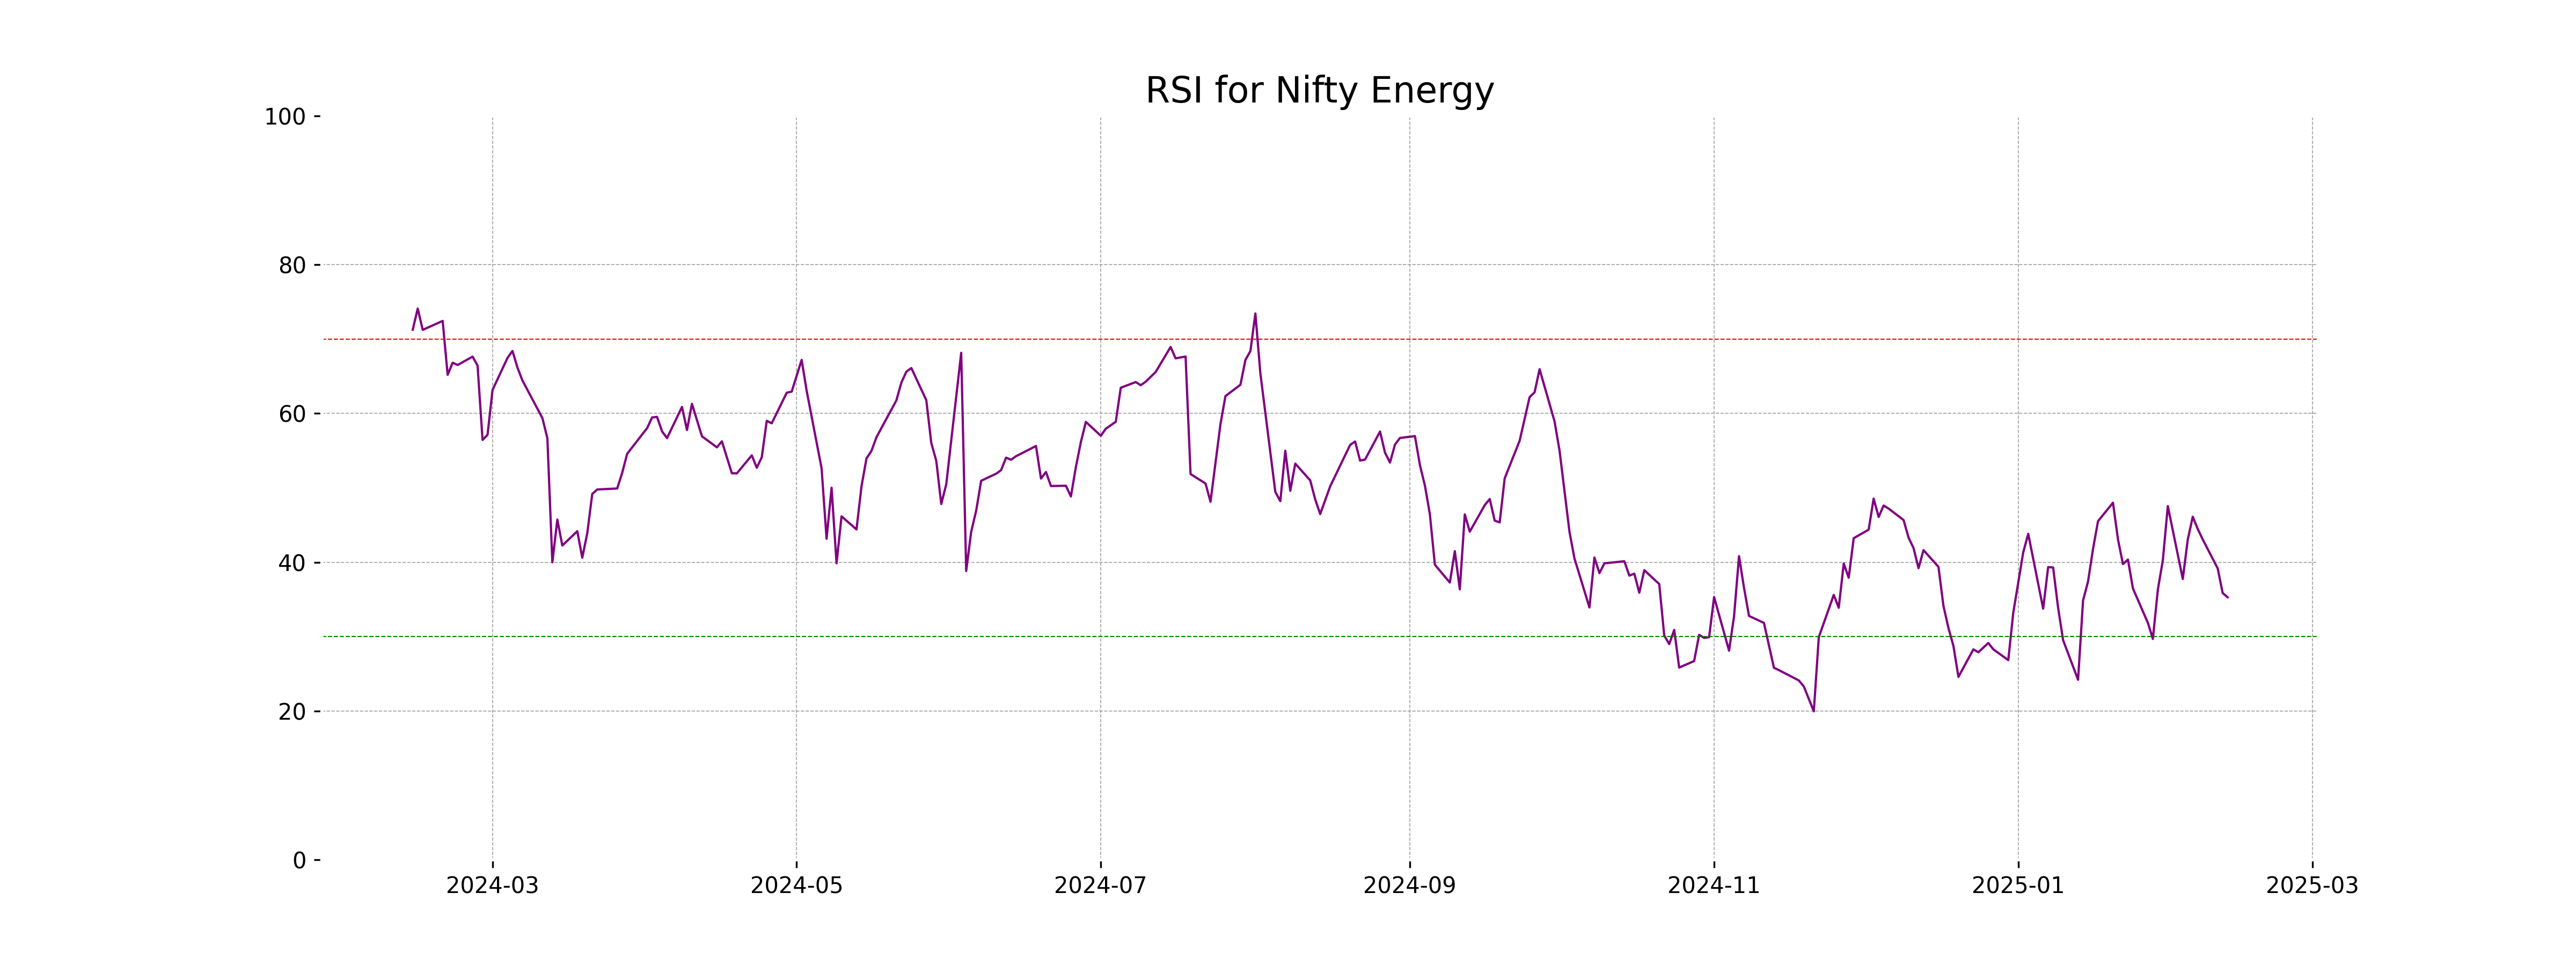
RSI Analysis
Nifty Energy's RSI is 35.28, indicating it is nearing the oversold territory. This suggests that the stock may be experiencing downward pressure, and investors could anticipate a potential bounce-back or trend reversal if this continues.
Analysis for Nifty FMCG - February 12, 2025

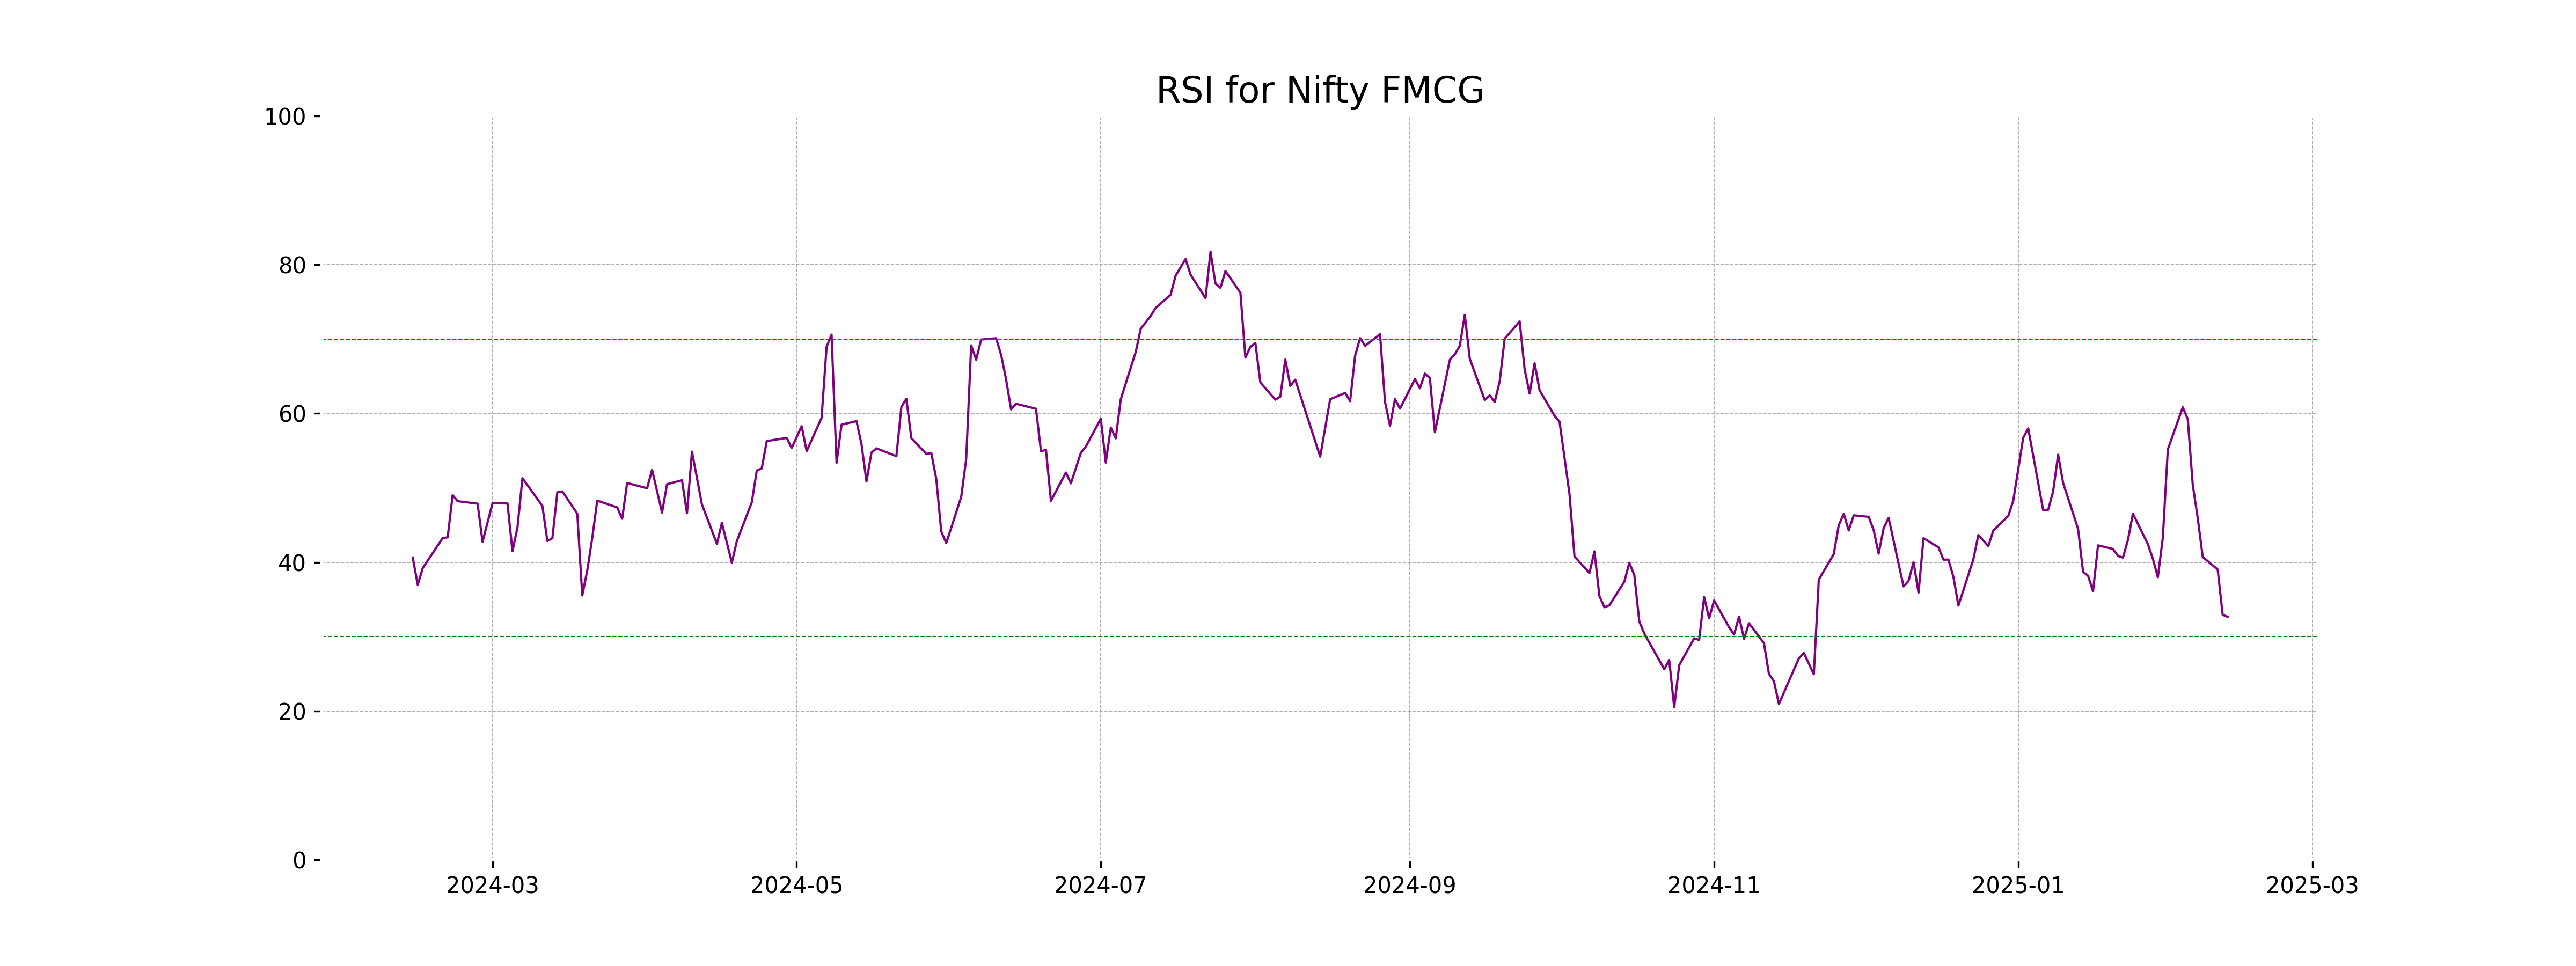
**Nifty FMCG Performance:** The Nifty FMCG index showed a slight decline with a close of 53,739, down 55.25 points from its previous close, marking a percentage change of -0.10%. Key indicators such as the RSI at 32.65 suggest oversold conditions, while the MACD indicates a downward trend, being below its signal line by a significant margin. The index is trading below its moving averages, pointing to a bearish momentum in the short term.
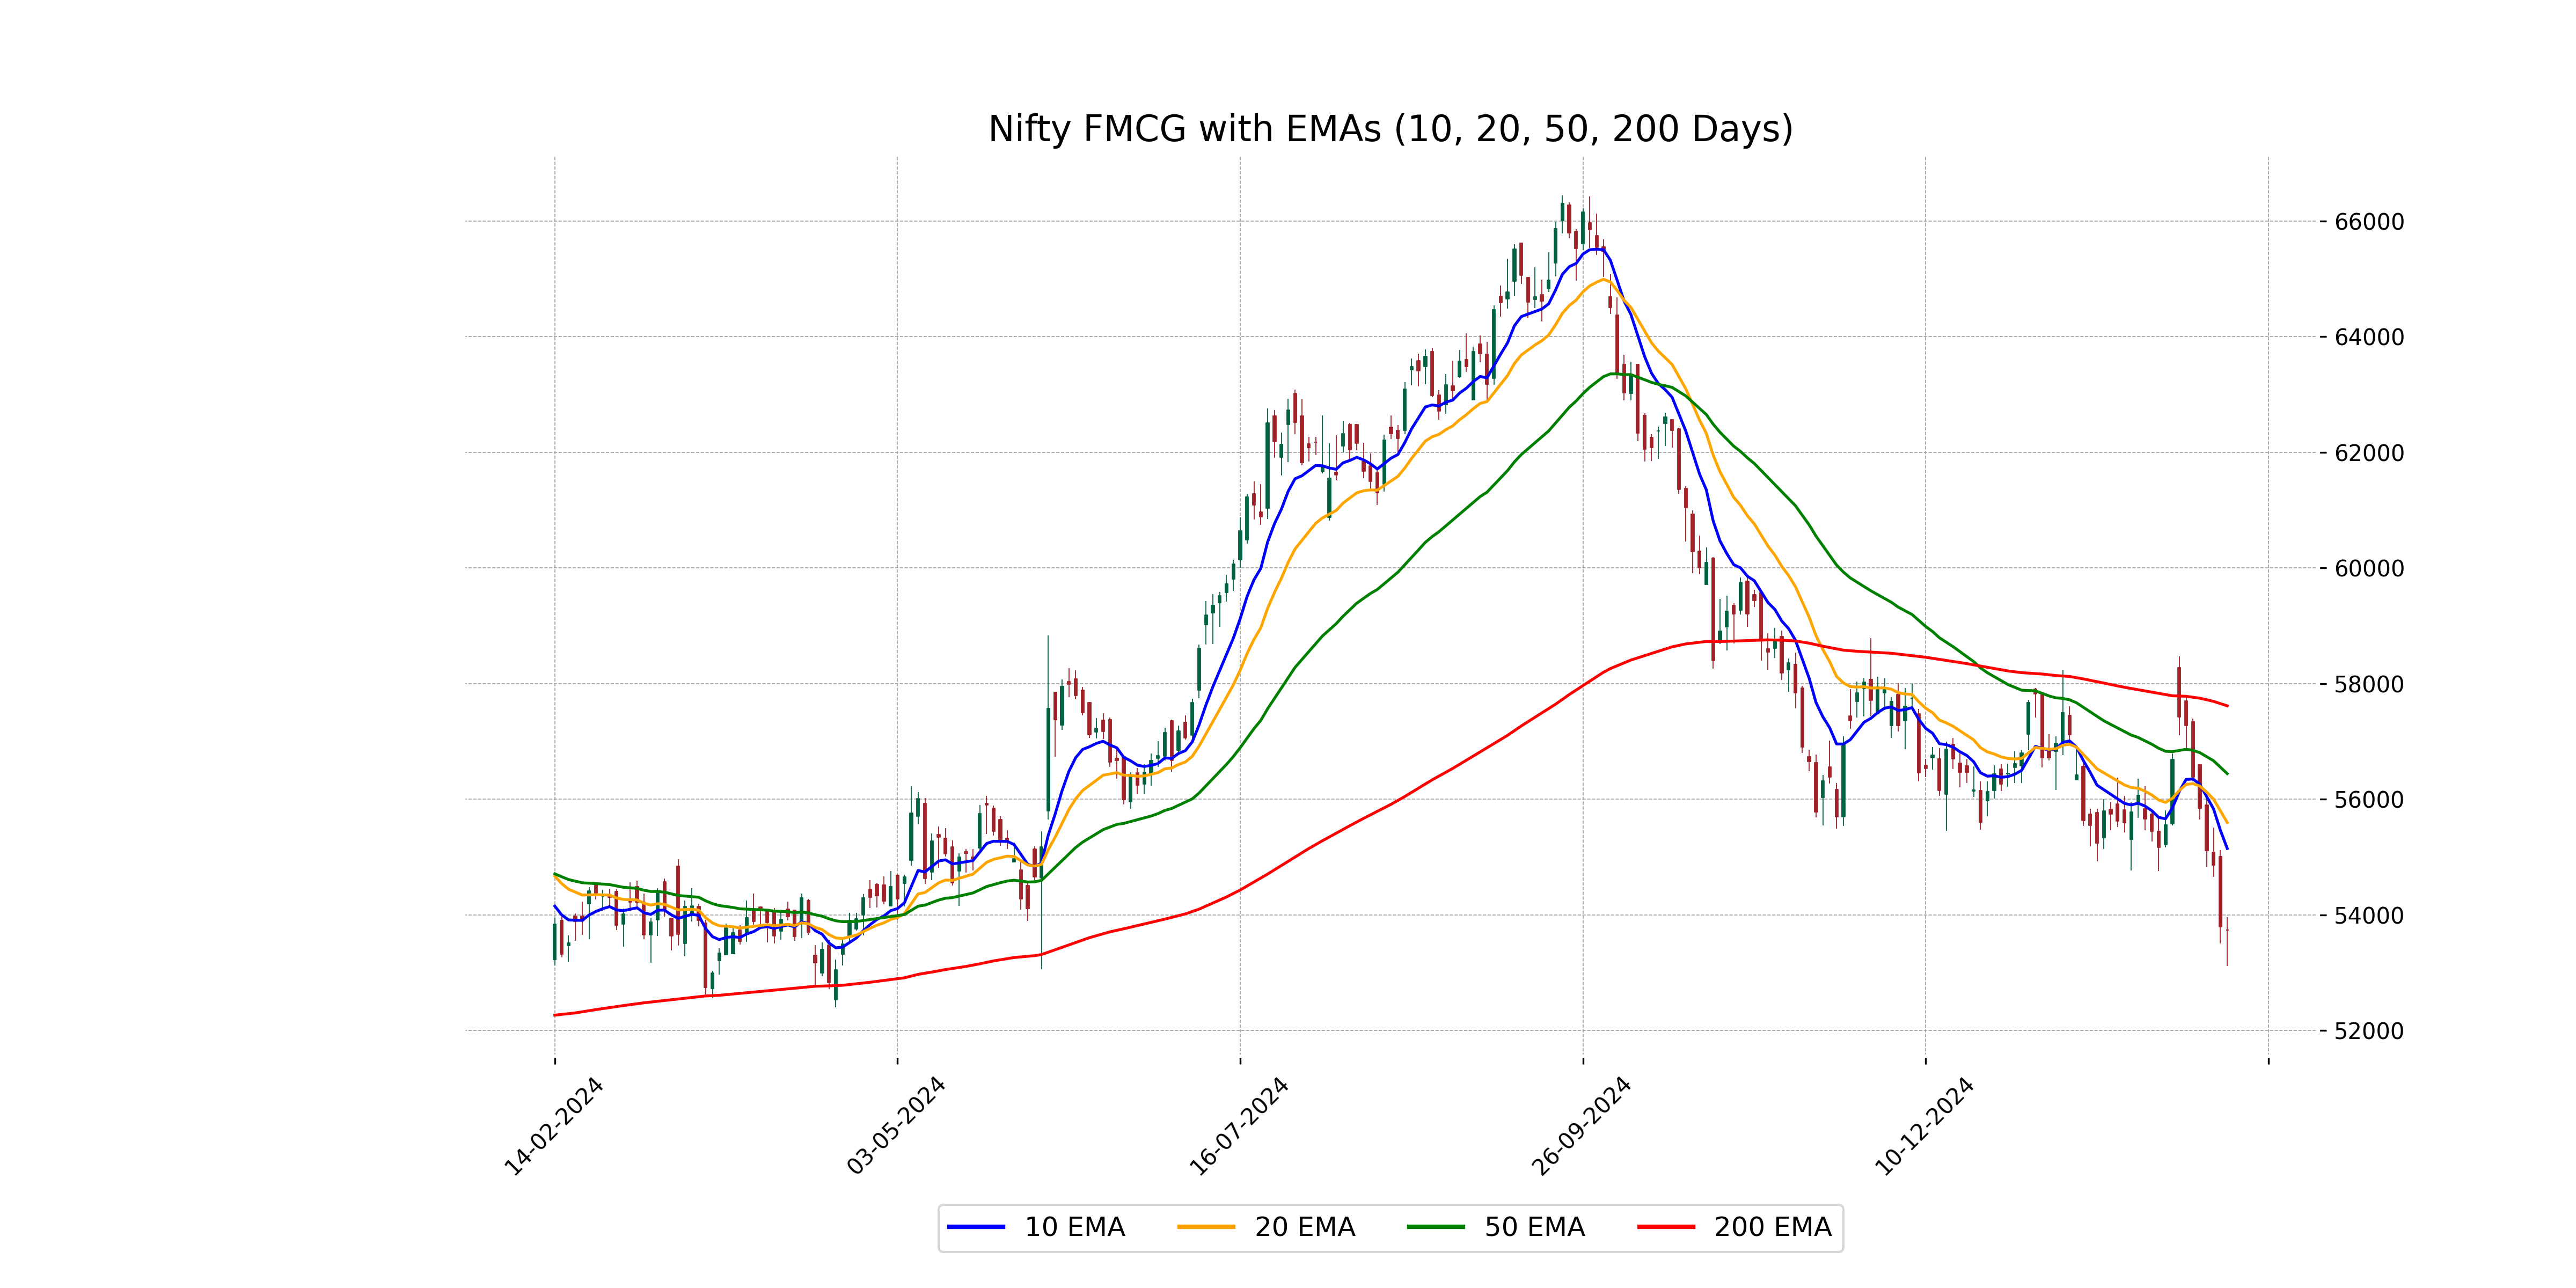
Relationship with Key Moving Averages
The Nifty FMCG closed at 53739.0, below its 10 EMA of 55148.68, 20 EMA of 55596.05, 50 EMA of 56442.38, and 200 EMA of 57614.44, indicating a potential bearish trend as the price is below these key moving averages. The RSI of 32.65 suggests that the index might be approaching oversold conditions.
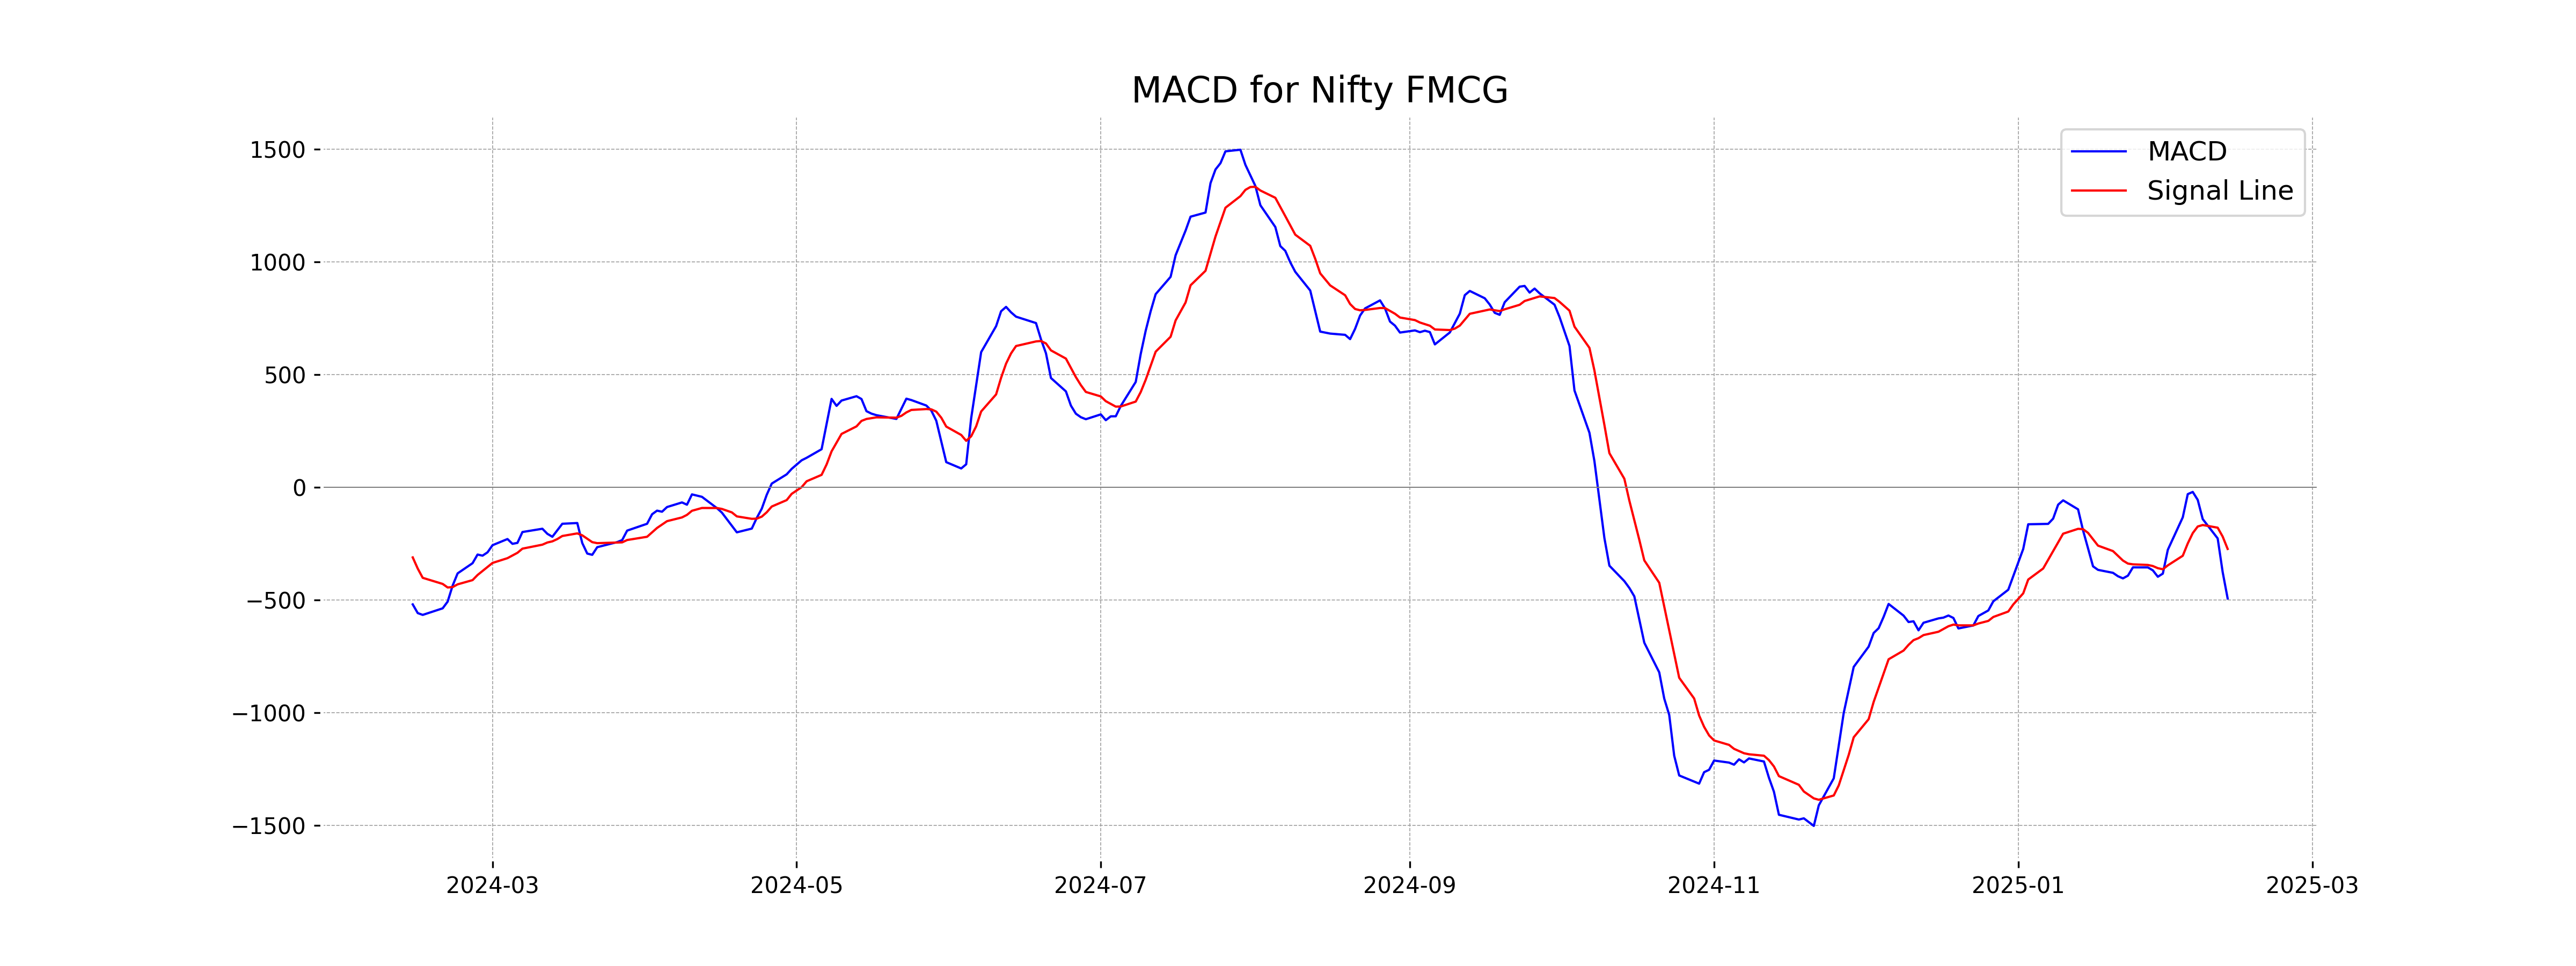
Moving Averages Trend (MACD)
The MACD for Nifty FMCG is -492.77, while the MACD Signal is -273.21. This indicates a bearish trend as the MACD line is below the MACD Signal line, suggesting potential downward momentum in the stock price.
RSI Analysis
The RSI value for Nifty FMCG is 32.65, indicating it is approaching oversold levels. Typically, an RSI below 30 is considered oversold, suggesting potential for a price reversal or a buying opportunity if the trend changes.
Analysis for Nifty Infra - February 12, 2025
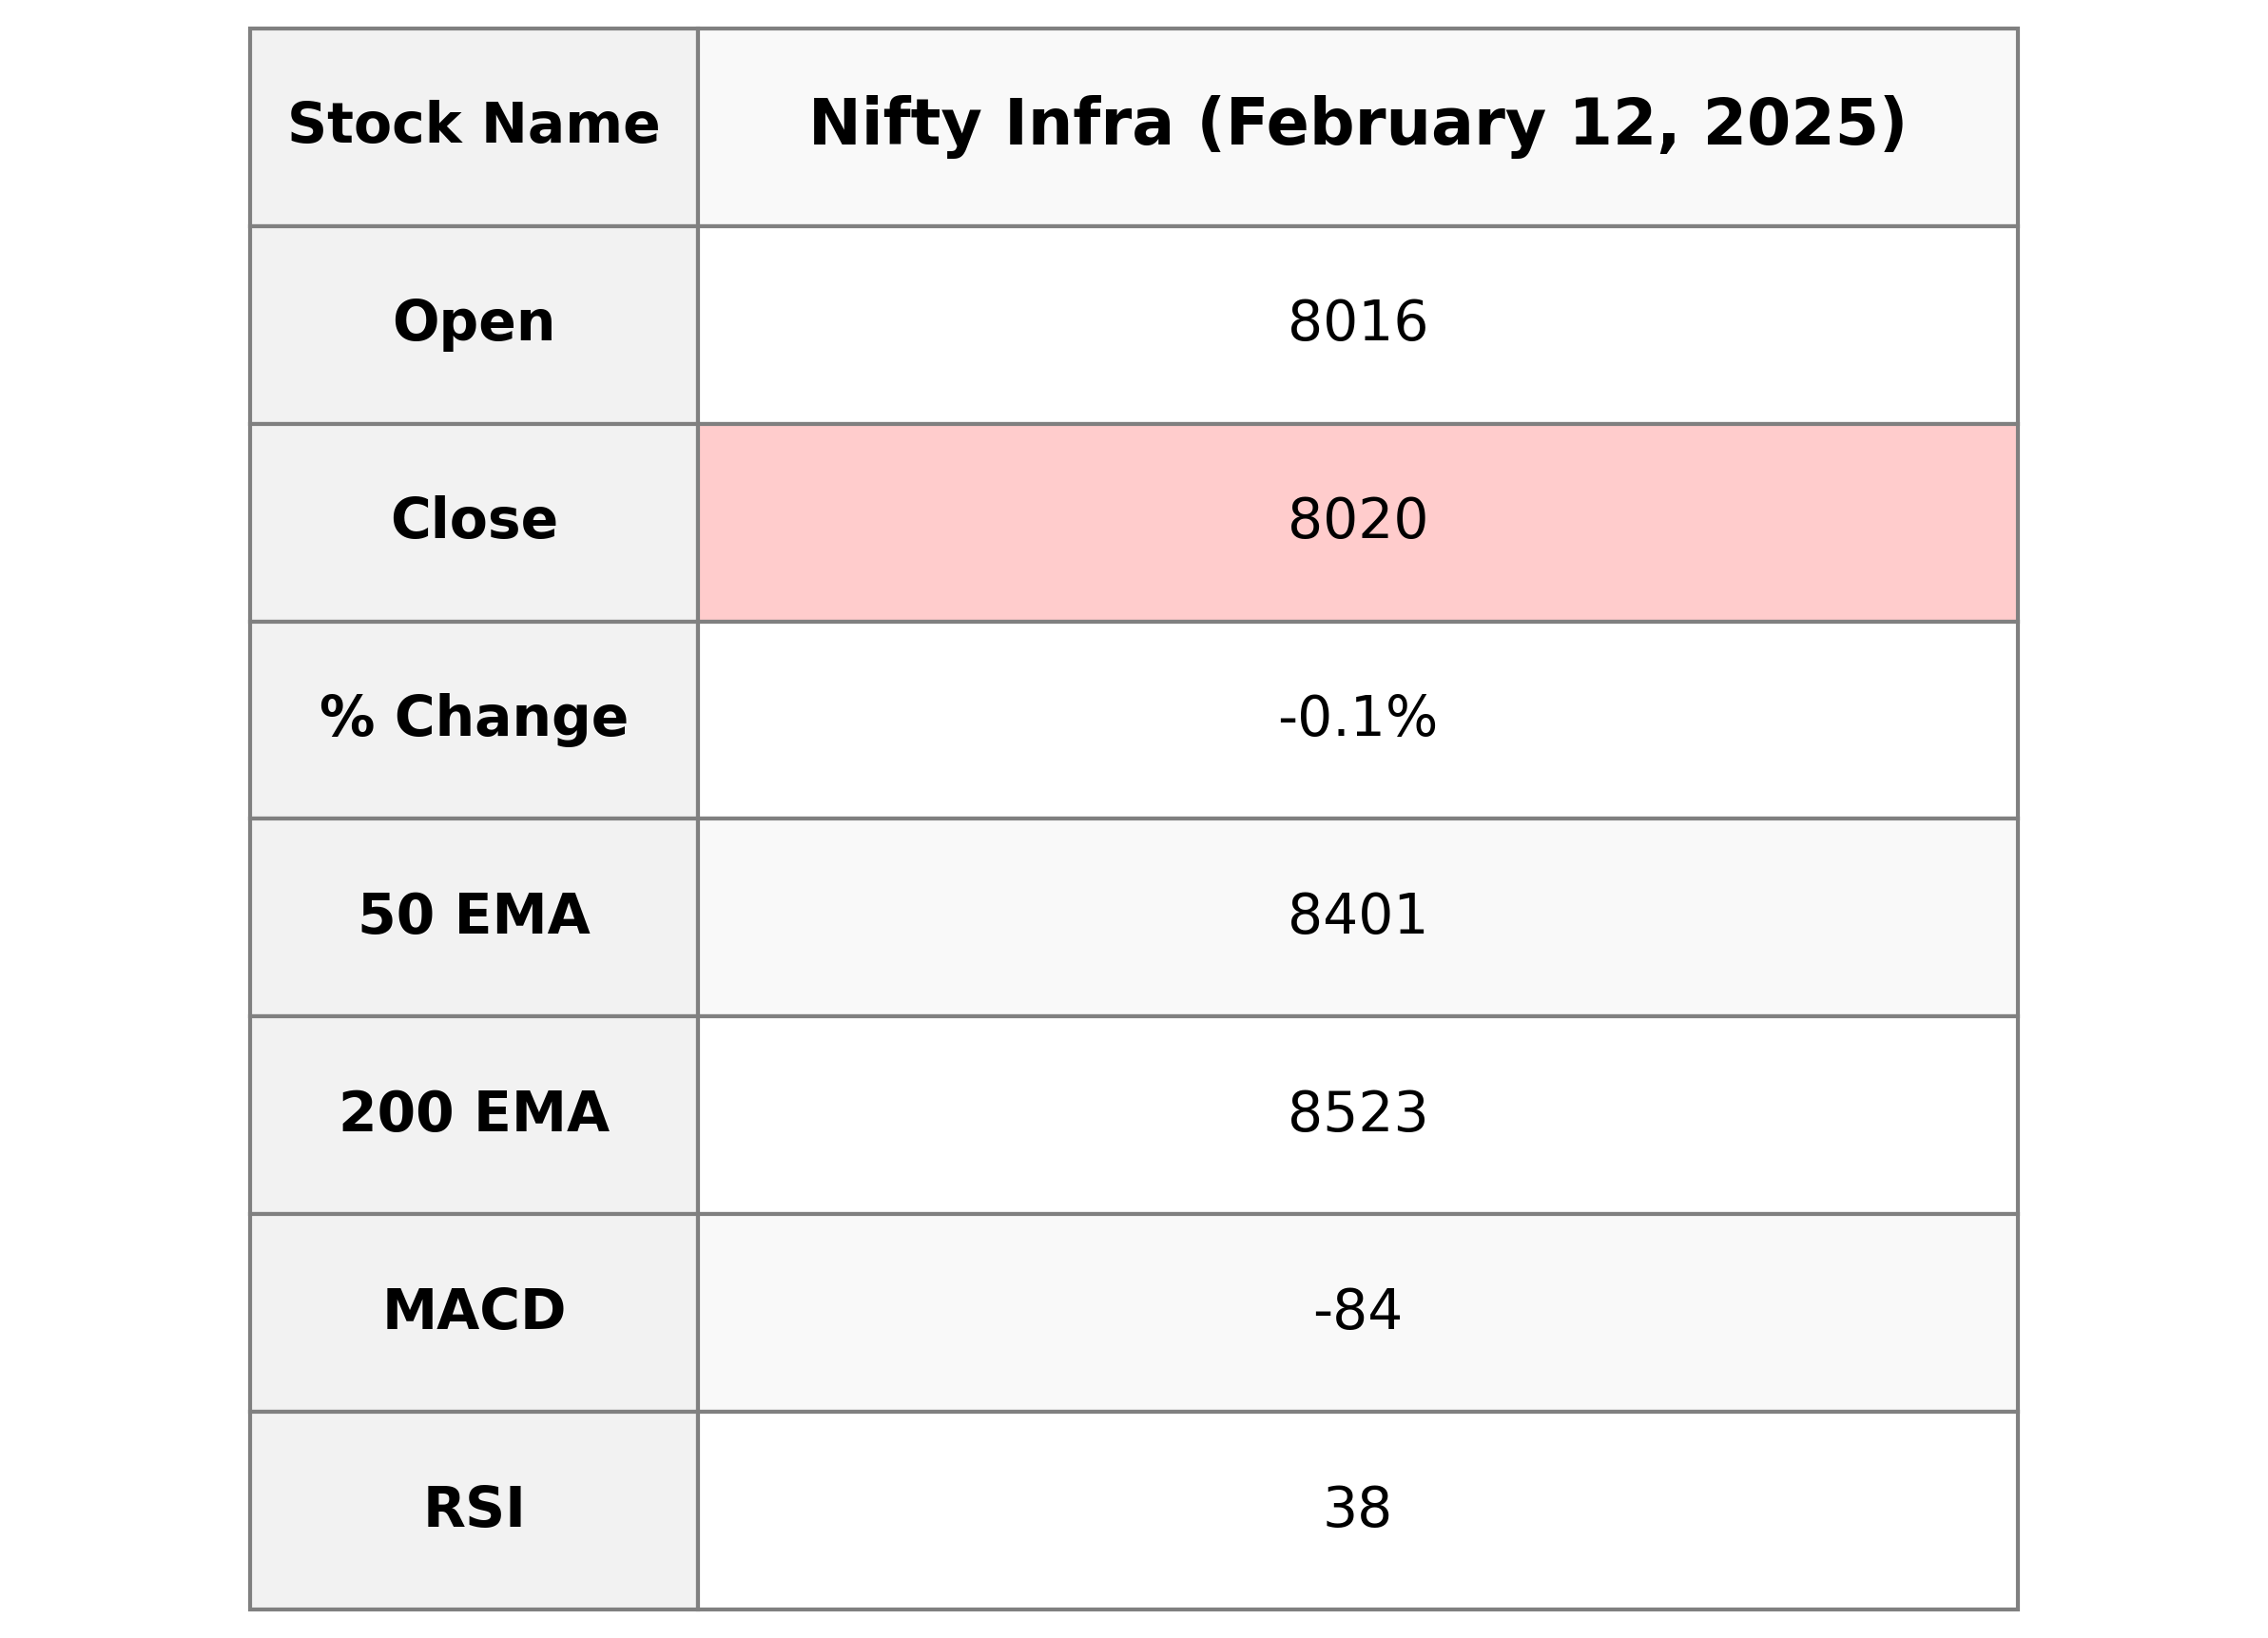
Nifty Infra opened at 8016.30 and closed slightly lower at 8019.65, indicating a marginal decline of 0.13% from the previous close. The index faced a downward momentum, with both its 50-day and 200-day EMAs above the current price, suggesting potential bearish trends. Additionally, a RSI below 40 and a negative MACD further reflect the prevailing negative sentiment.
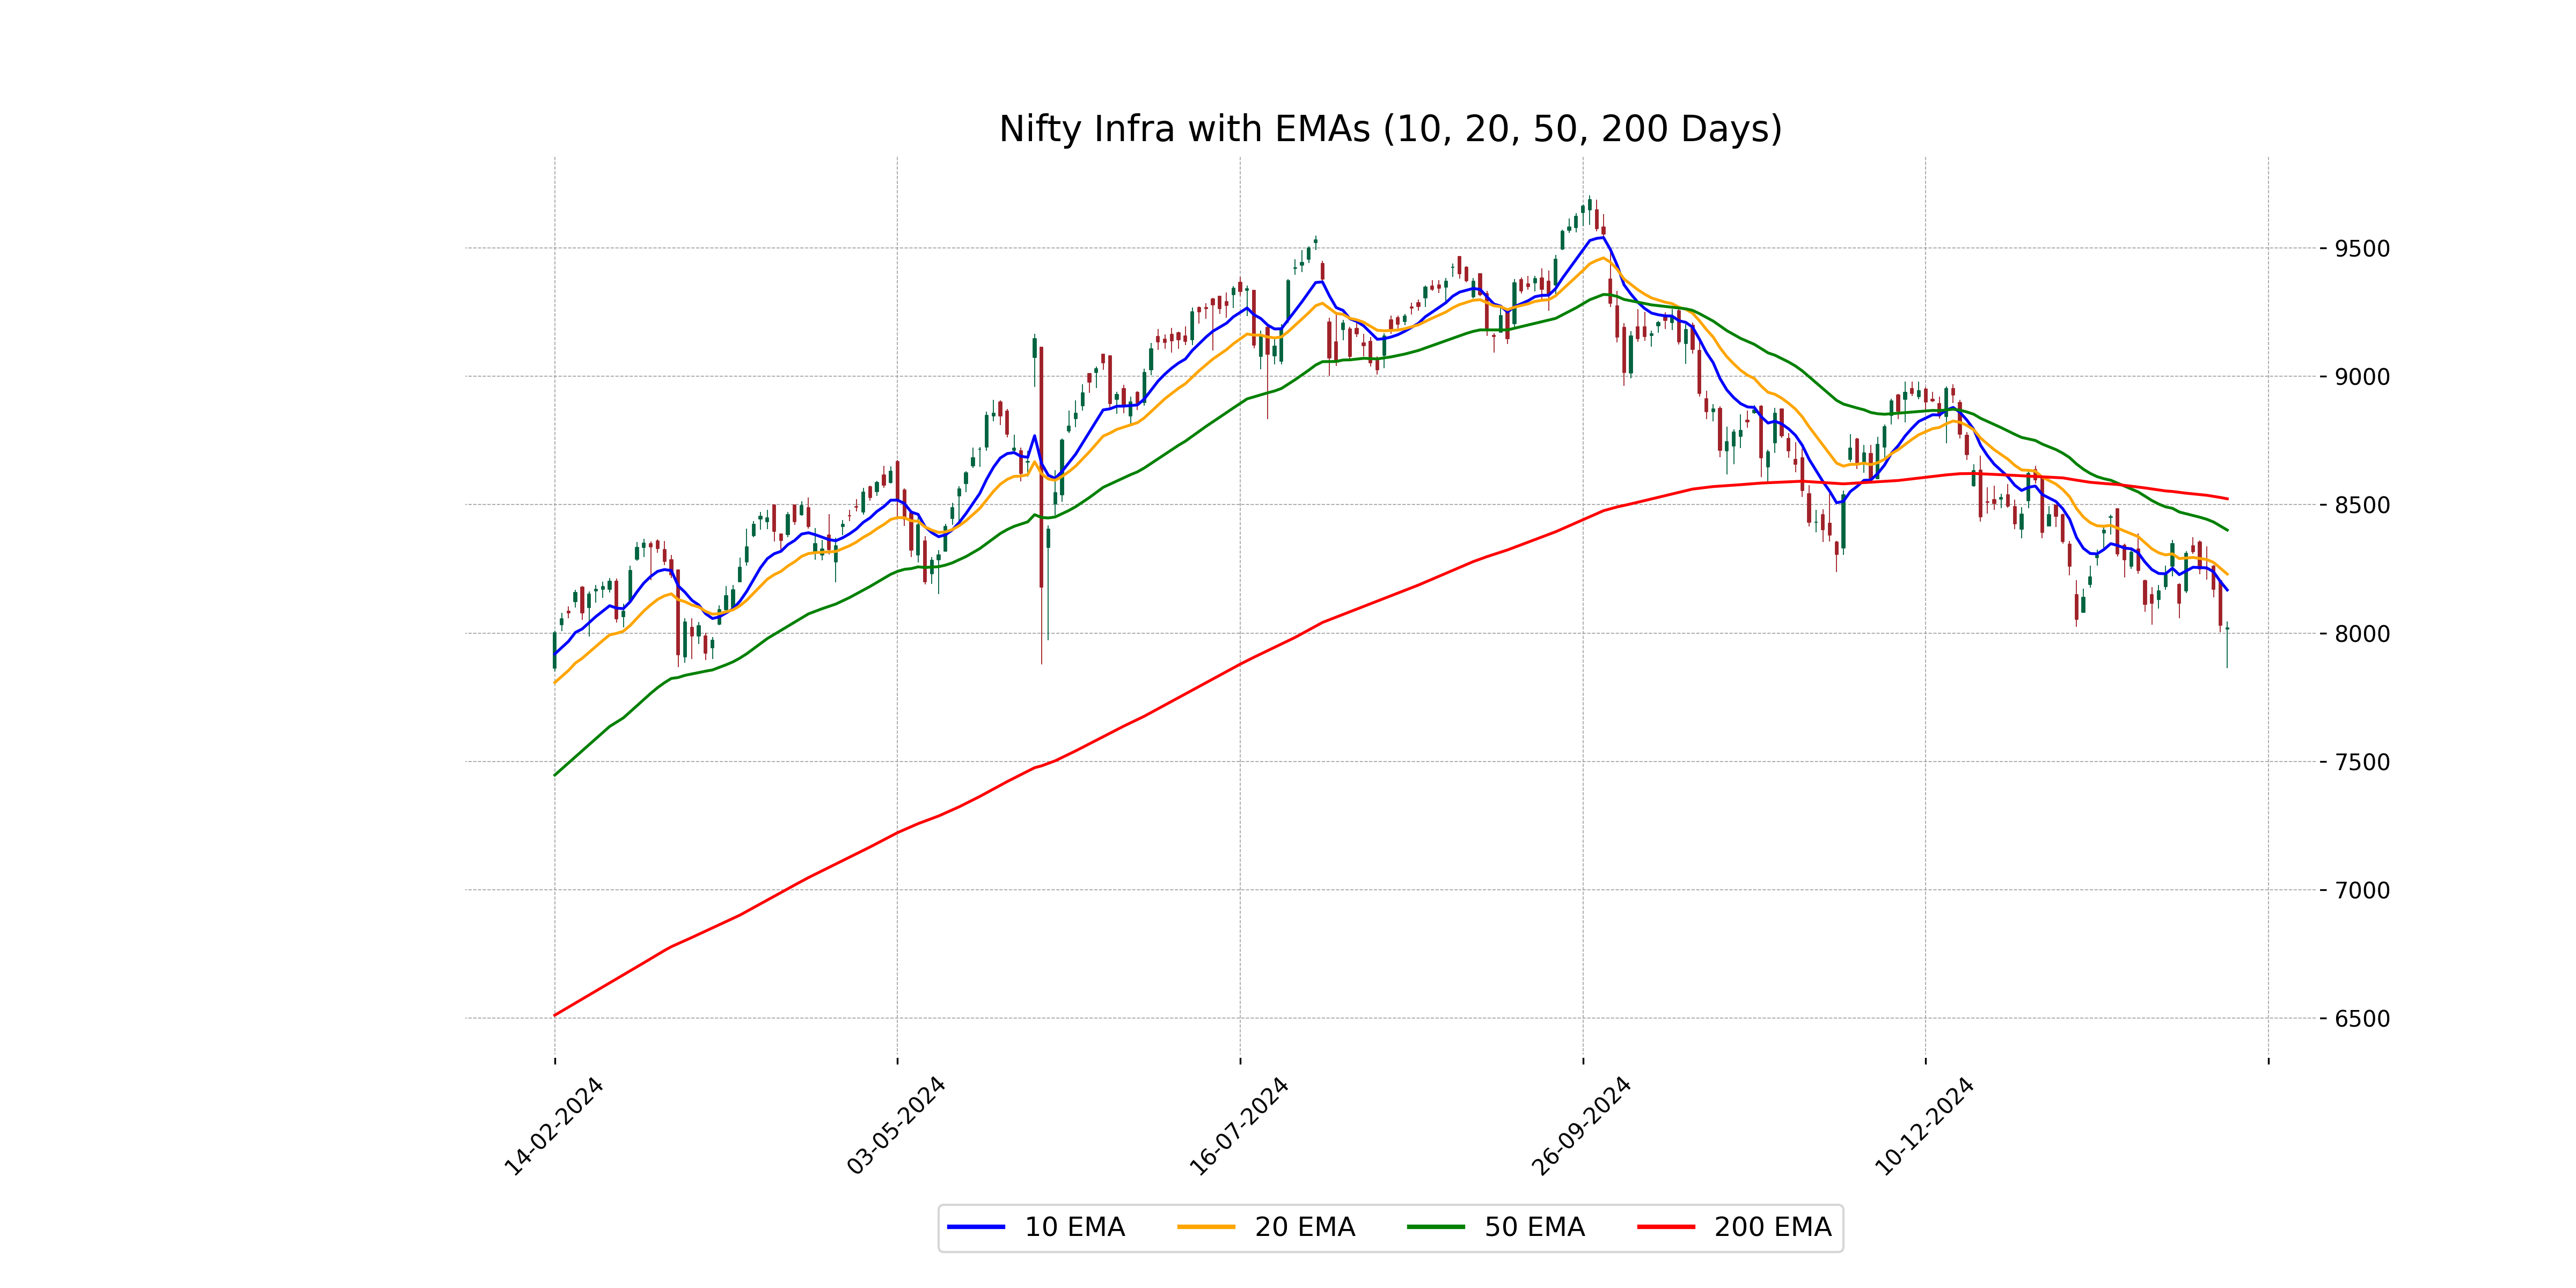
Relationship with Key Moving Averages
The current close of Nifty Infra is 8019.65, which is below its 50-day EMA of 8401.17 and 200-day EMA of 8522.97, indicating a bearish trend. The 10-day EMA of 8167.78 and 20-day EMA of 8229.76 are also above the current close, suggesting short-term bearish momentum.
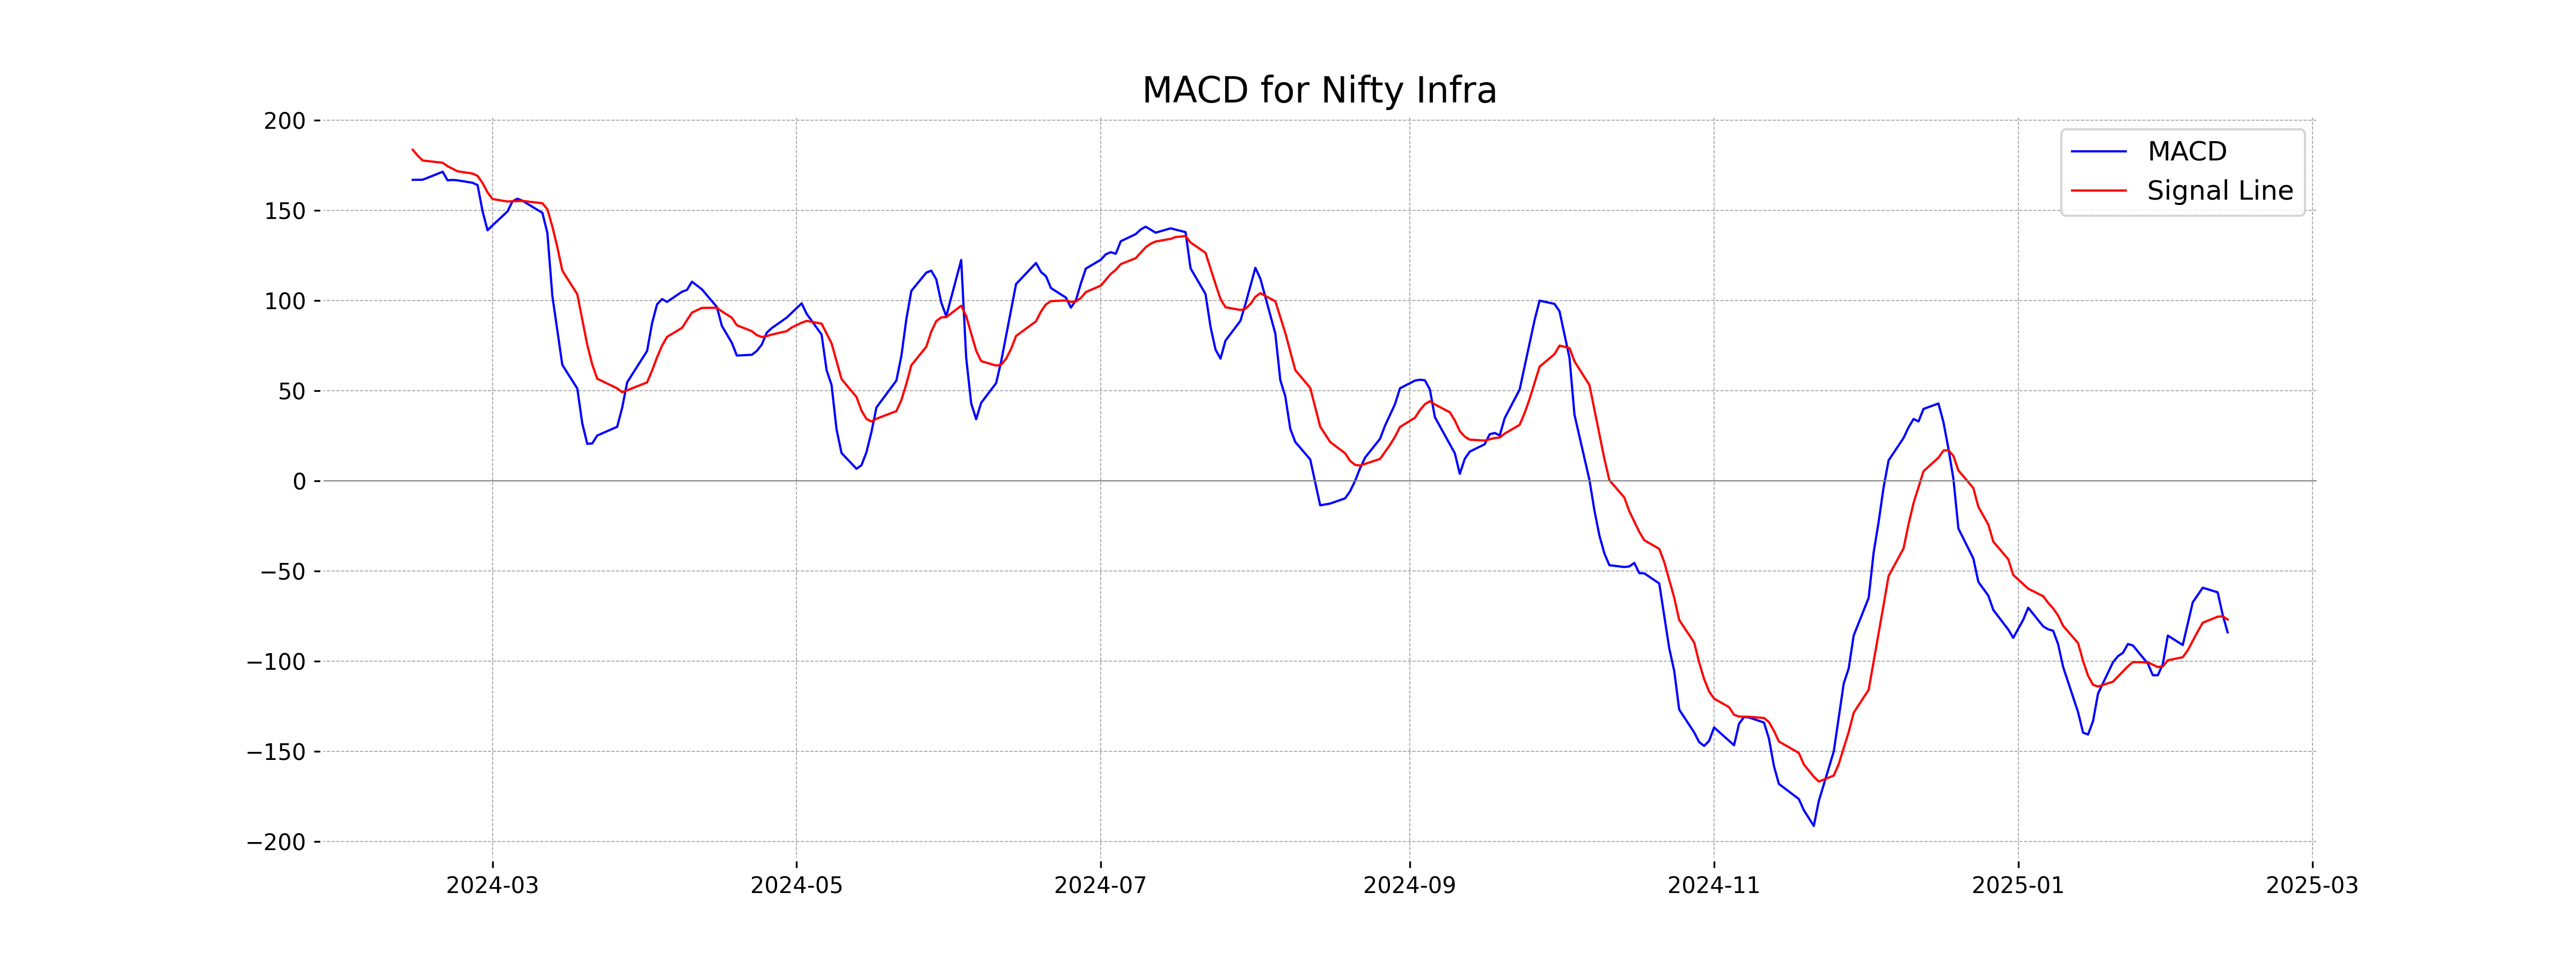
Moving Averages Trend (MACD)
The MACD for Nifty Infra is at -84.16, which is below the MACD Signal of -77.03. This indicates a bearish momentum, as the MACD line is below the Signal line, suggesting potential continued downward pressure.
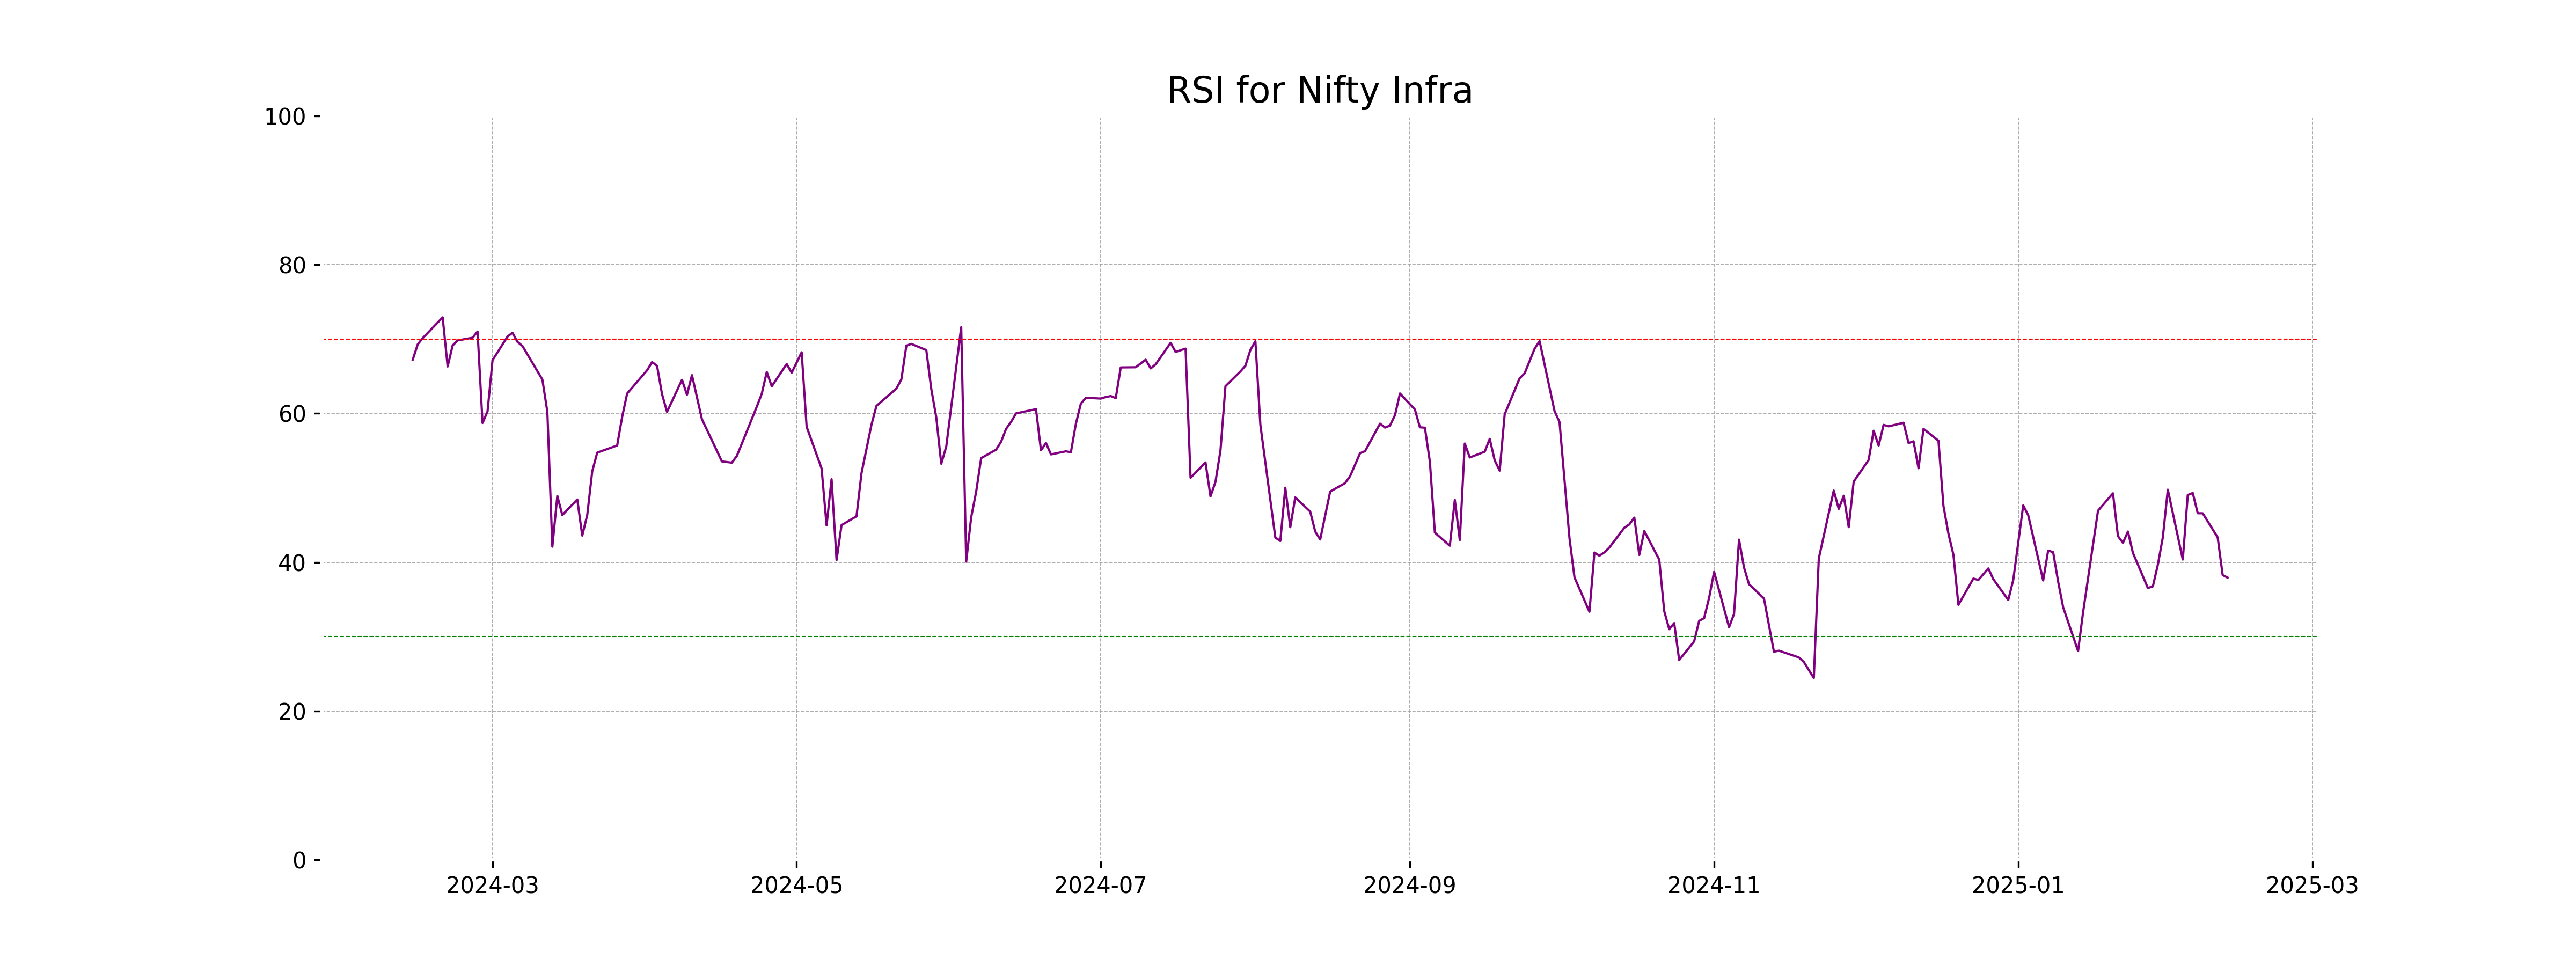
RSI Analysis
The RSI (Relative Strength Index) for Nifty Infra is 37.92, indicating that it is approaching the oversold territory. Values below 30 typically suggest that a security might be oversold, so investors may consider this level as a potential area for a price reversal or consolidation.
Analysis for Nifty IT - February 12, 2025
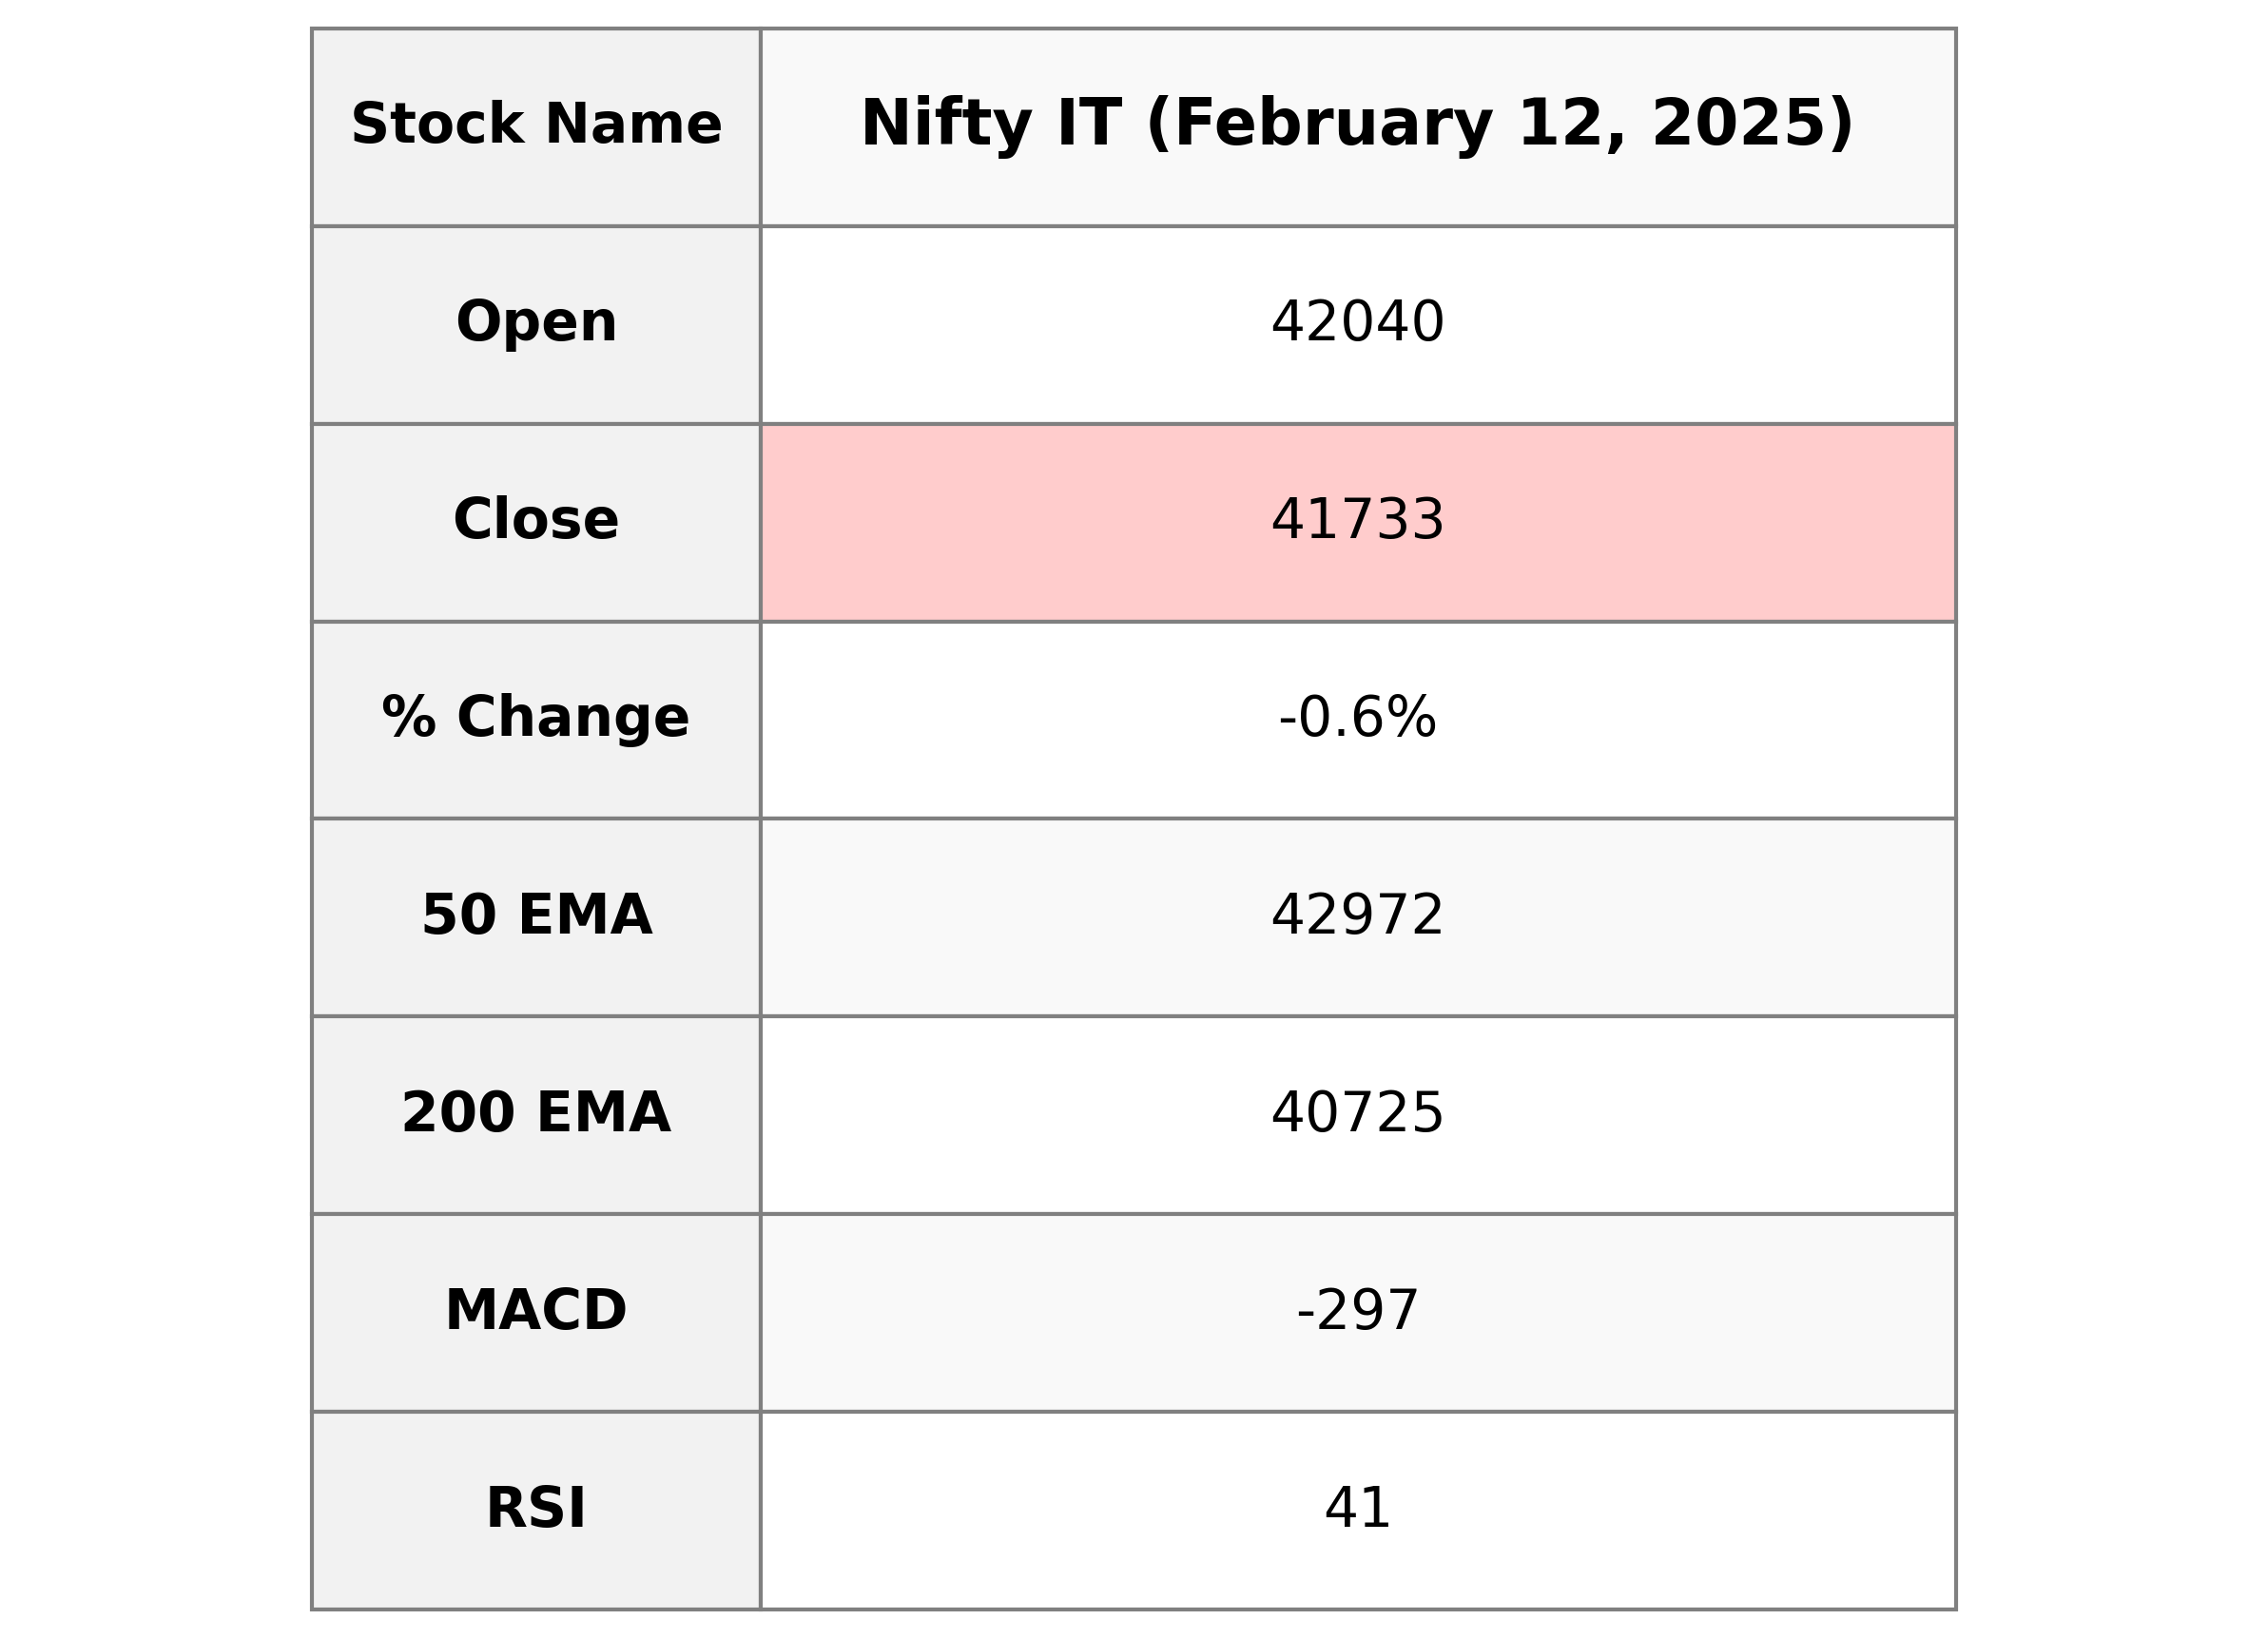
Nifty IT opened at 42039.5 with a high of 42263.05 and closed at 41733.0, showing a decrease of 0.56% from the previous close. Key indicators highlight a bearish trend, with the MACD below the signal line and an RSI at 40.66, indicating weak momentum.
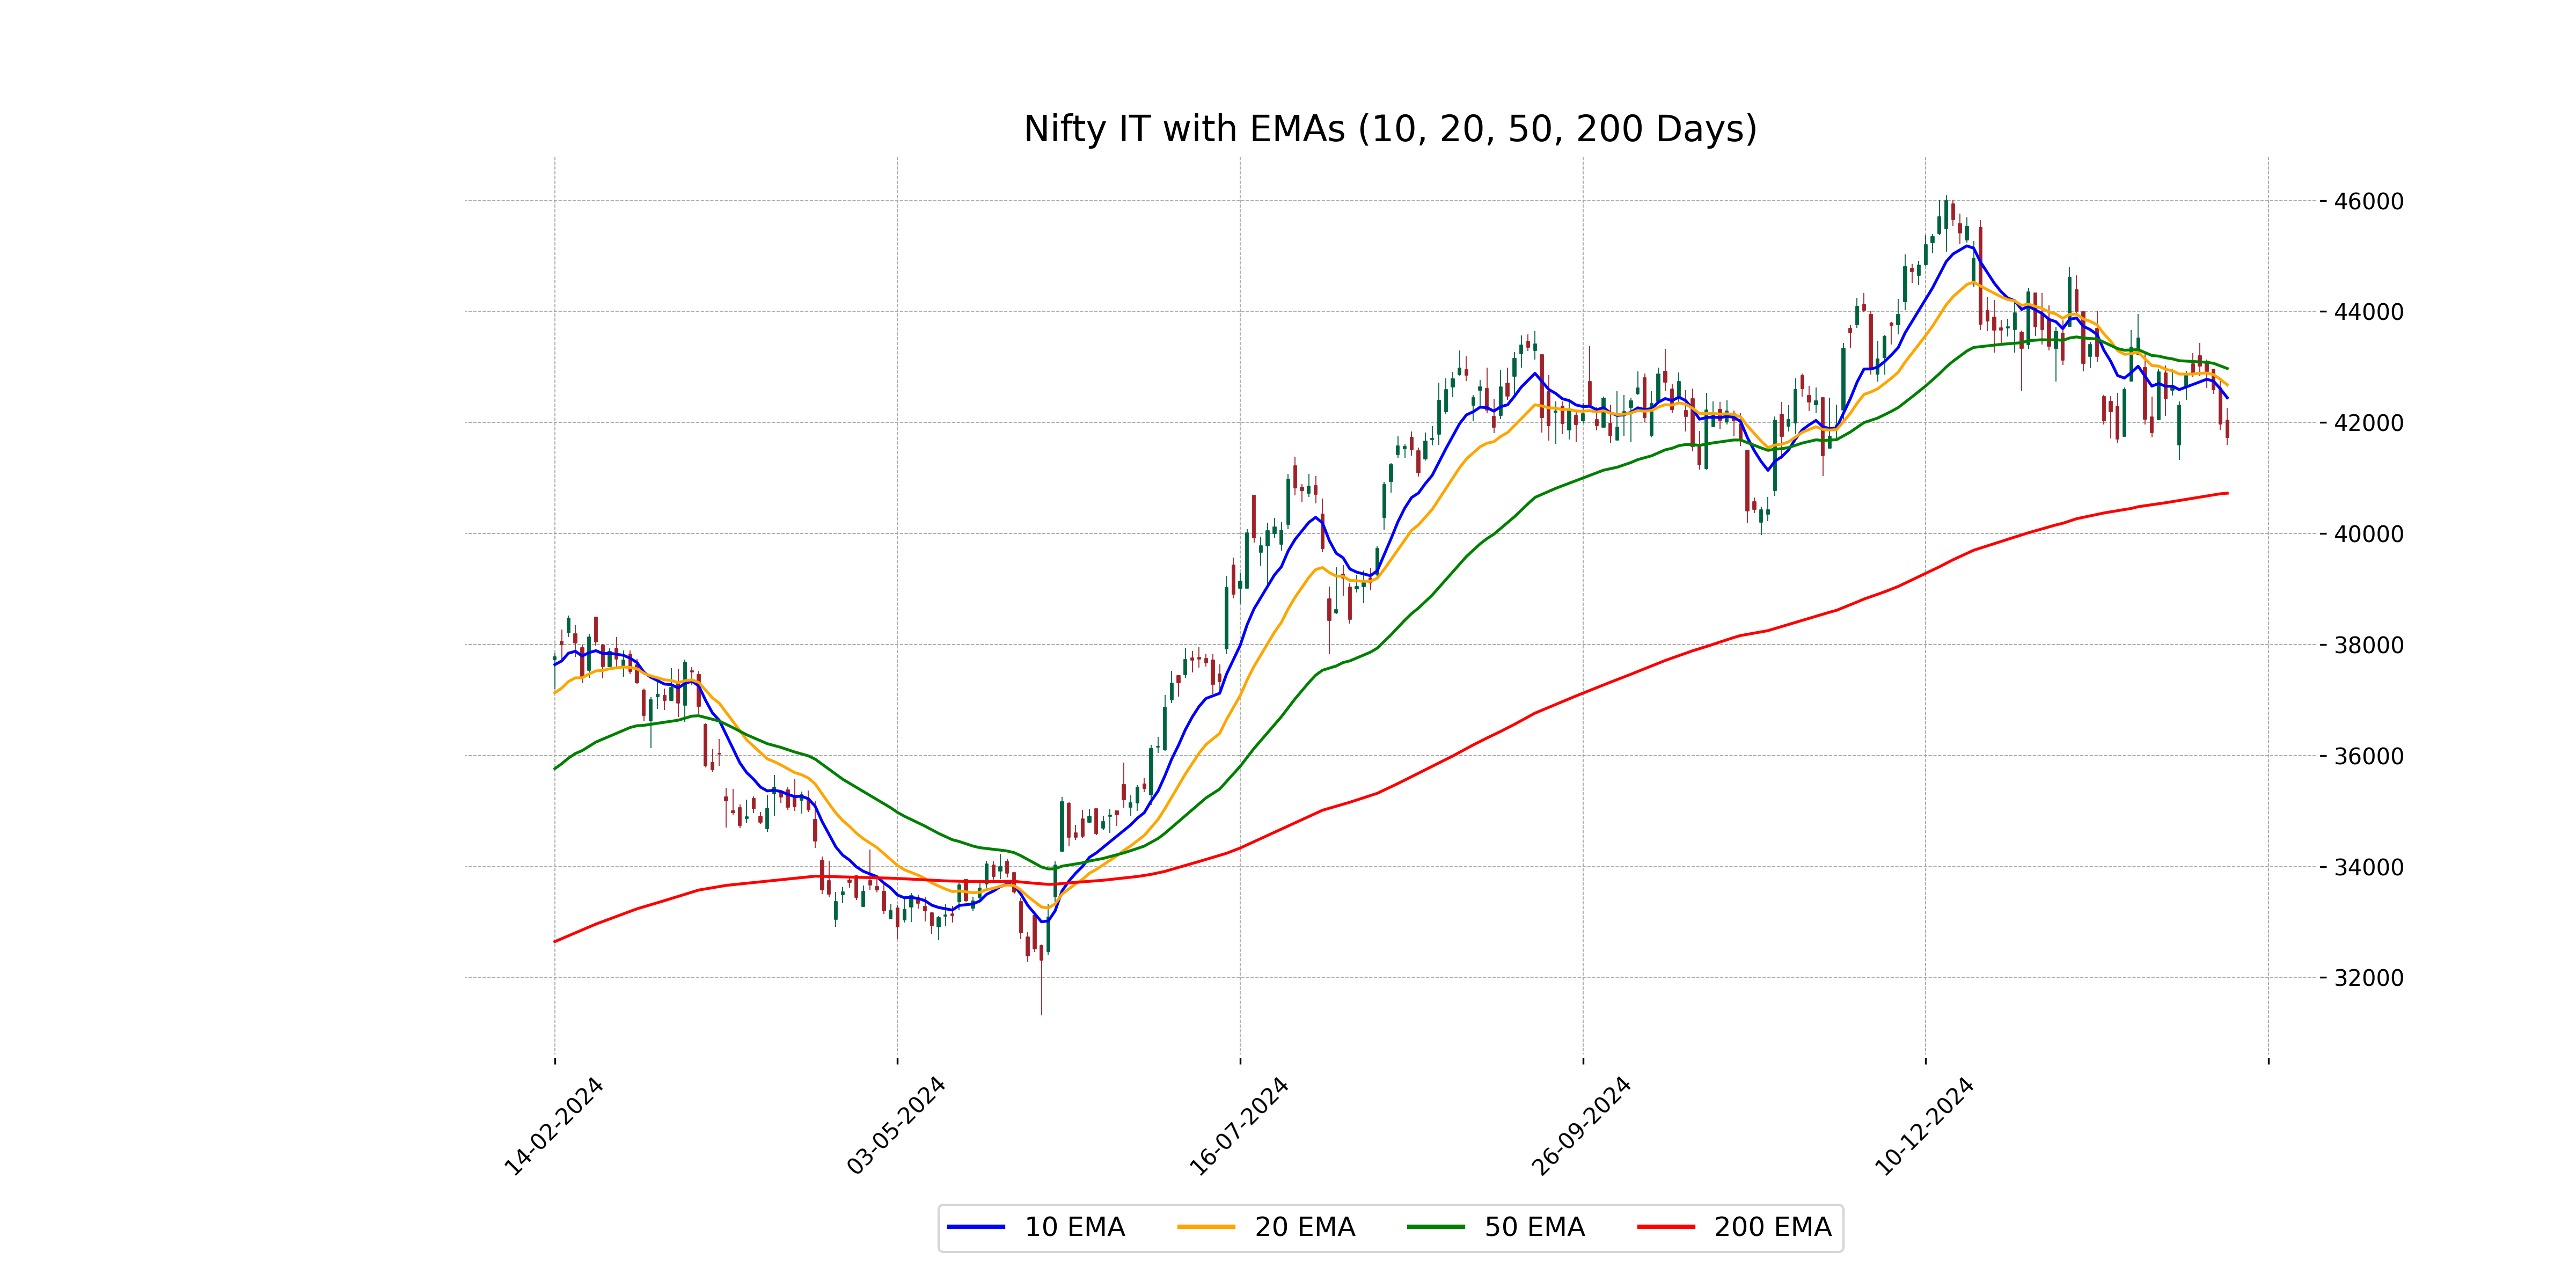
Relationship with Key Moving Averages
The closing price of Nifty IT at 41733.0 is below its 50-day EMA of 42972.31, indicating a bearish trend as it is also below the 10-day EMA of 42445.79 and the 20-day EMA of 42677.44. This suggests a negative momentum in the short to medium term.
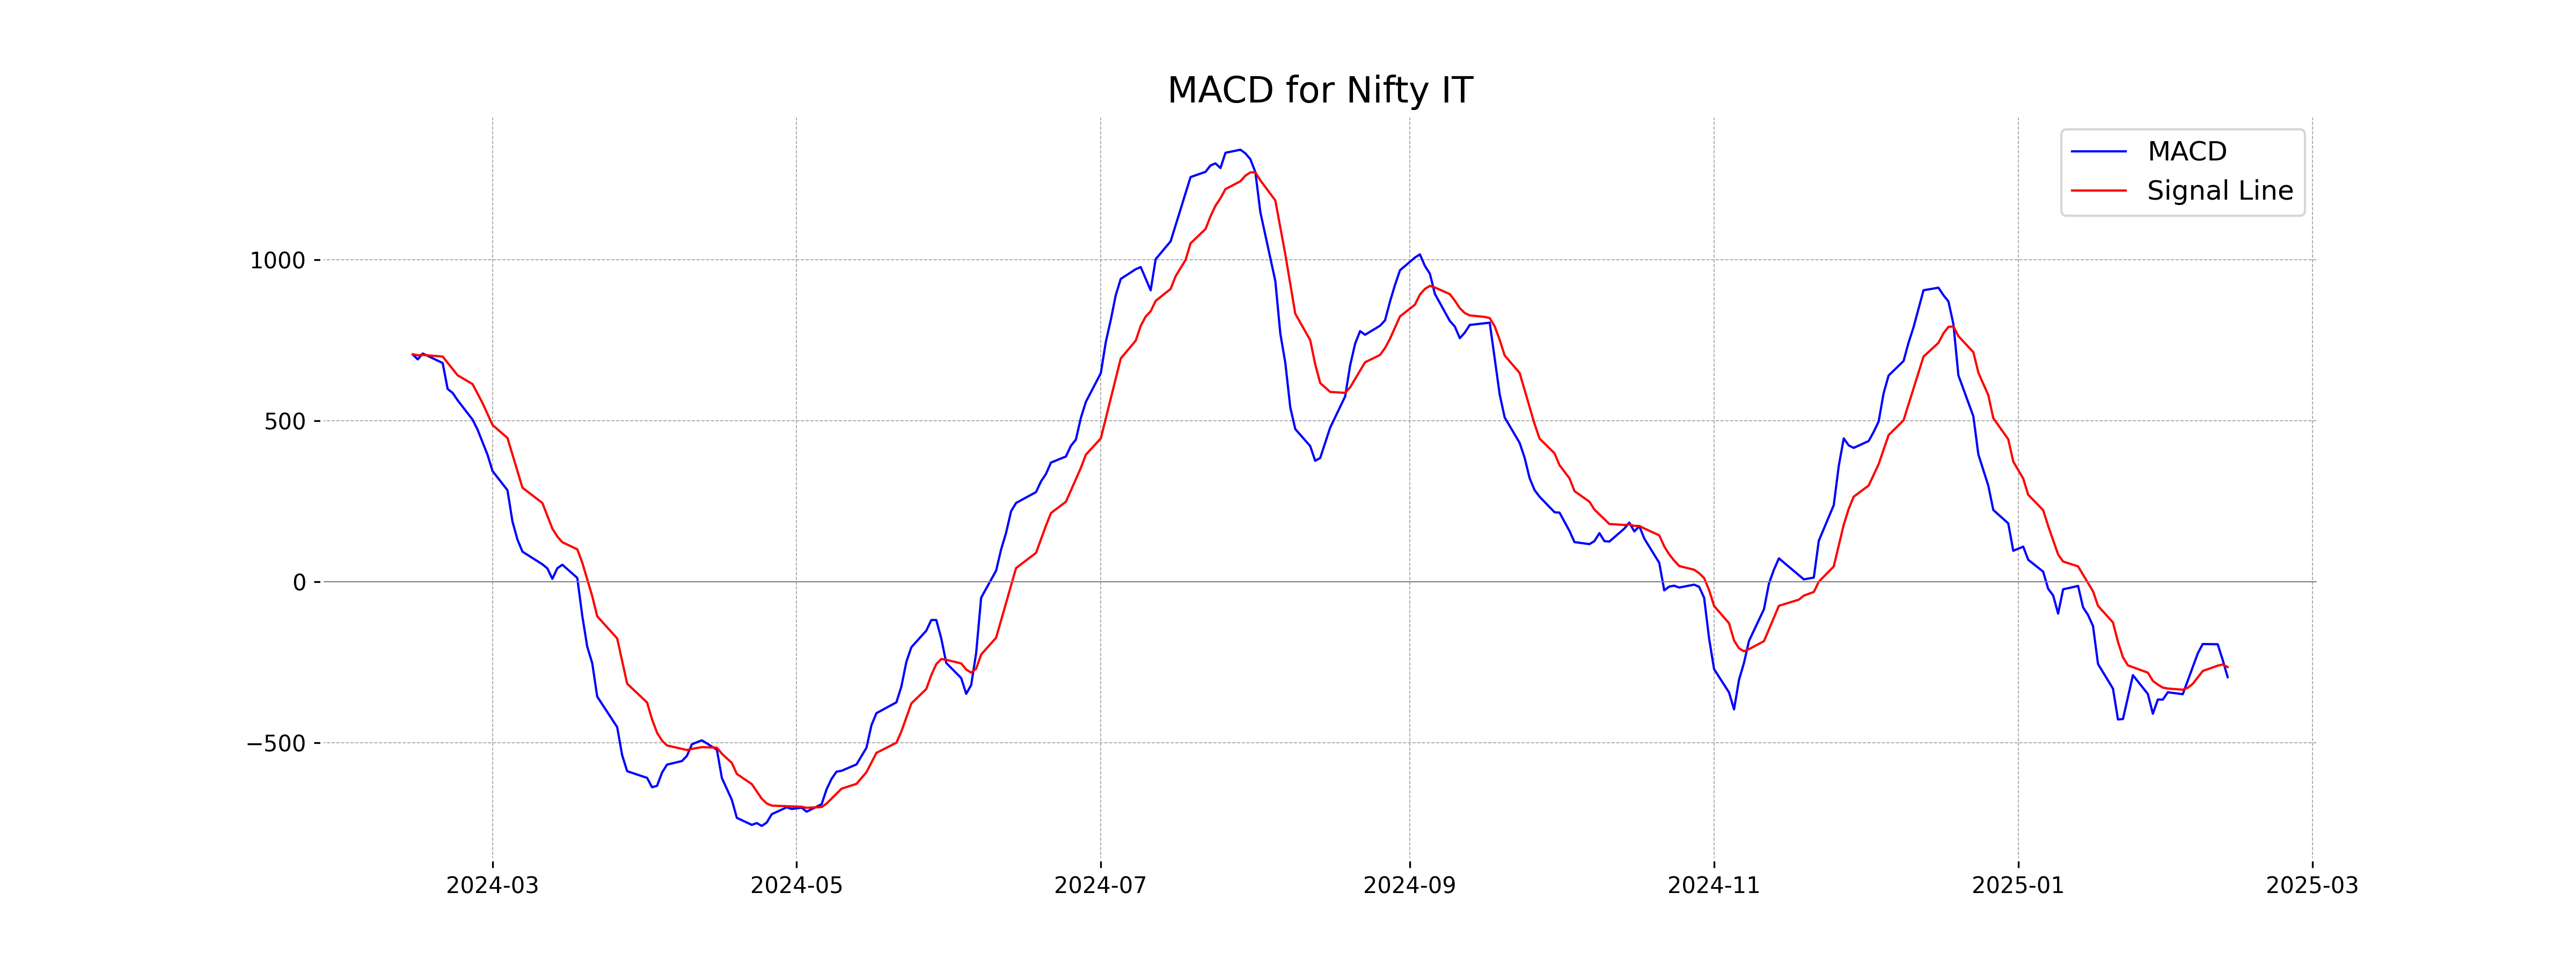
Moving Averages Trend (MACD)
Based on the given data for Nifty IT, the MACD is -296.53 and the MACD Signal is -264.94, indicating a bearish trend as the MACD is below the Signal line. This suggests potential downward momentum in the current market conditions.
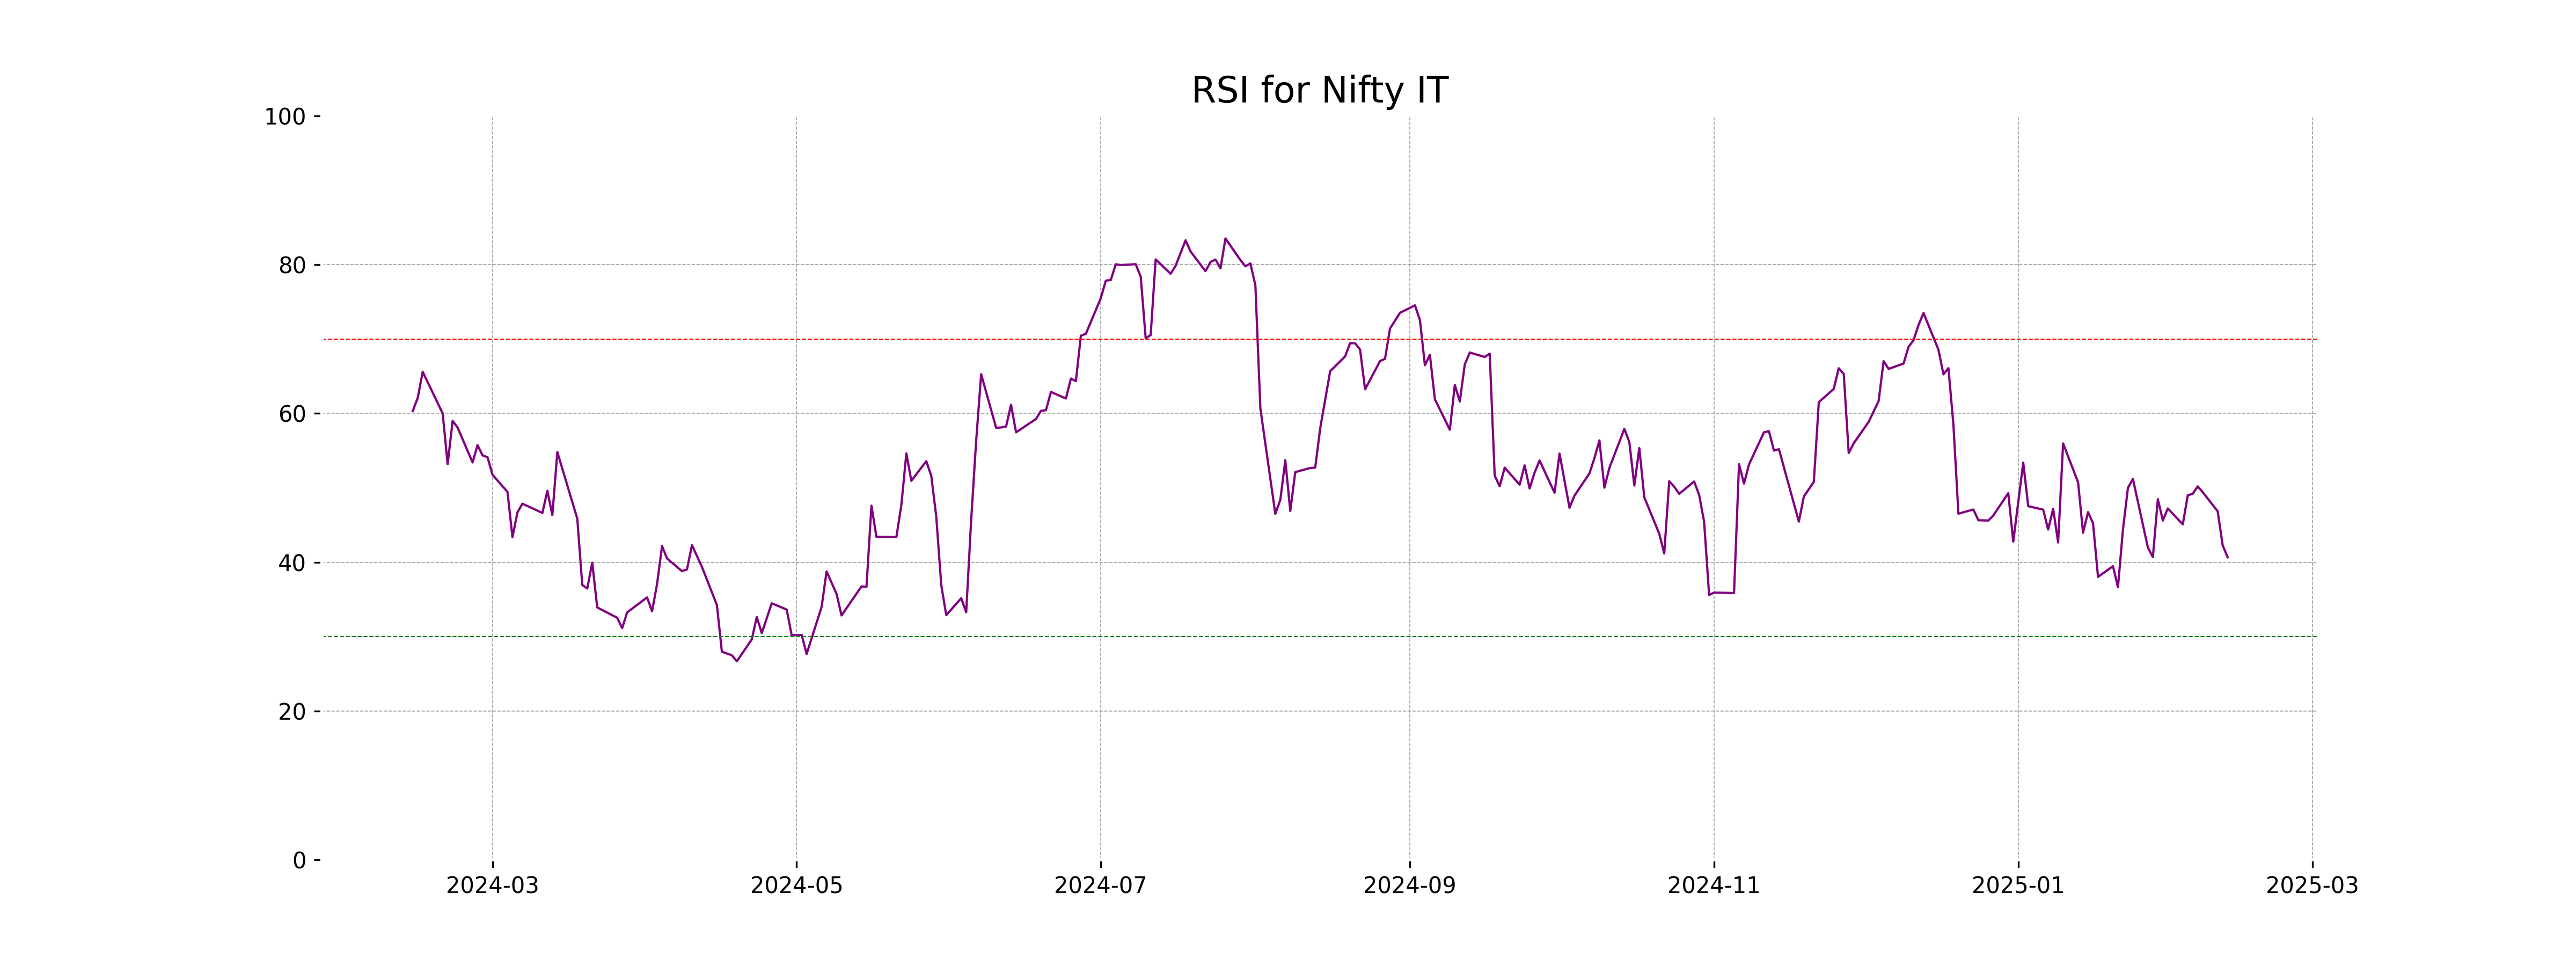
RSI Analysis
The RSI for Nifty IT is at 40.66, suggesting that the index is approaching oversold territory as RSI values below 30 typically indicate that condition. This could imply potential buying opportunities if the index continues to decline. However, investors should consider other technical indicators before making decisions.
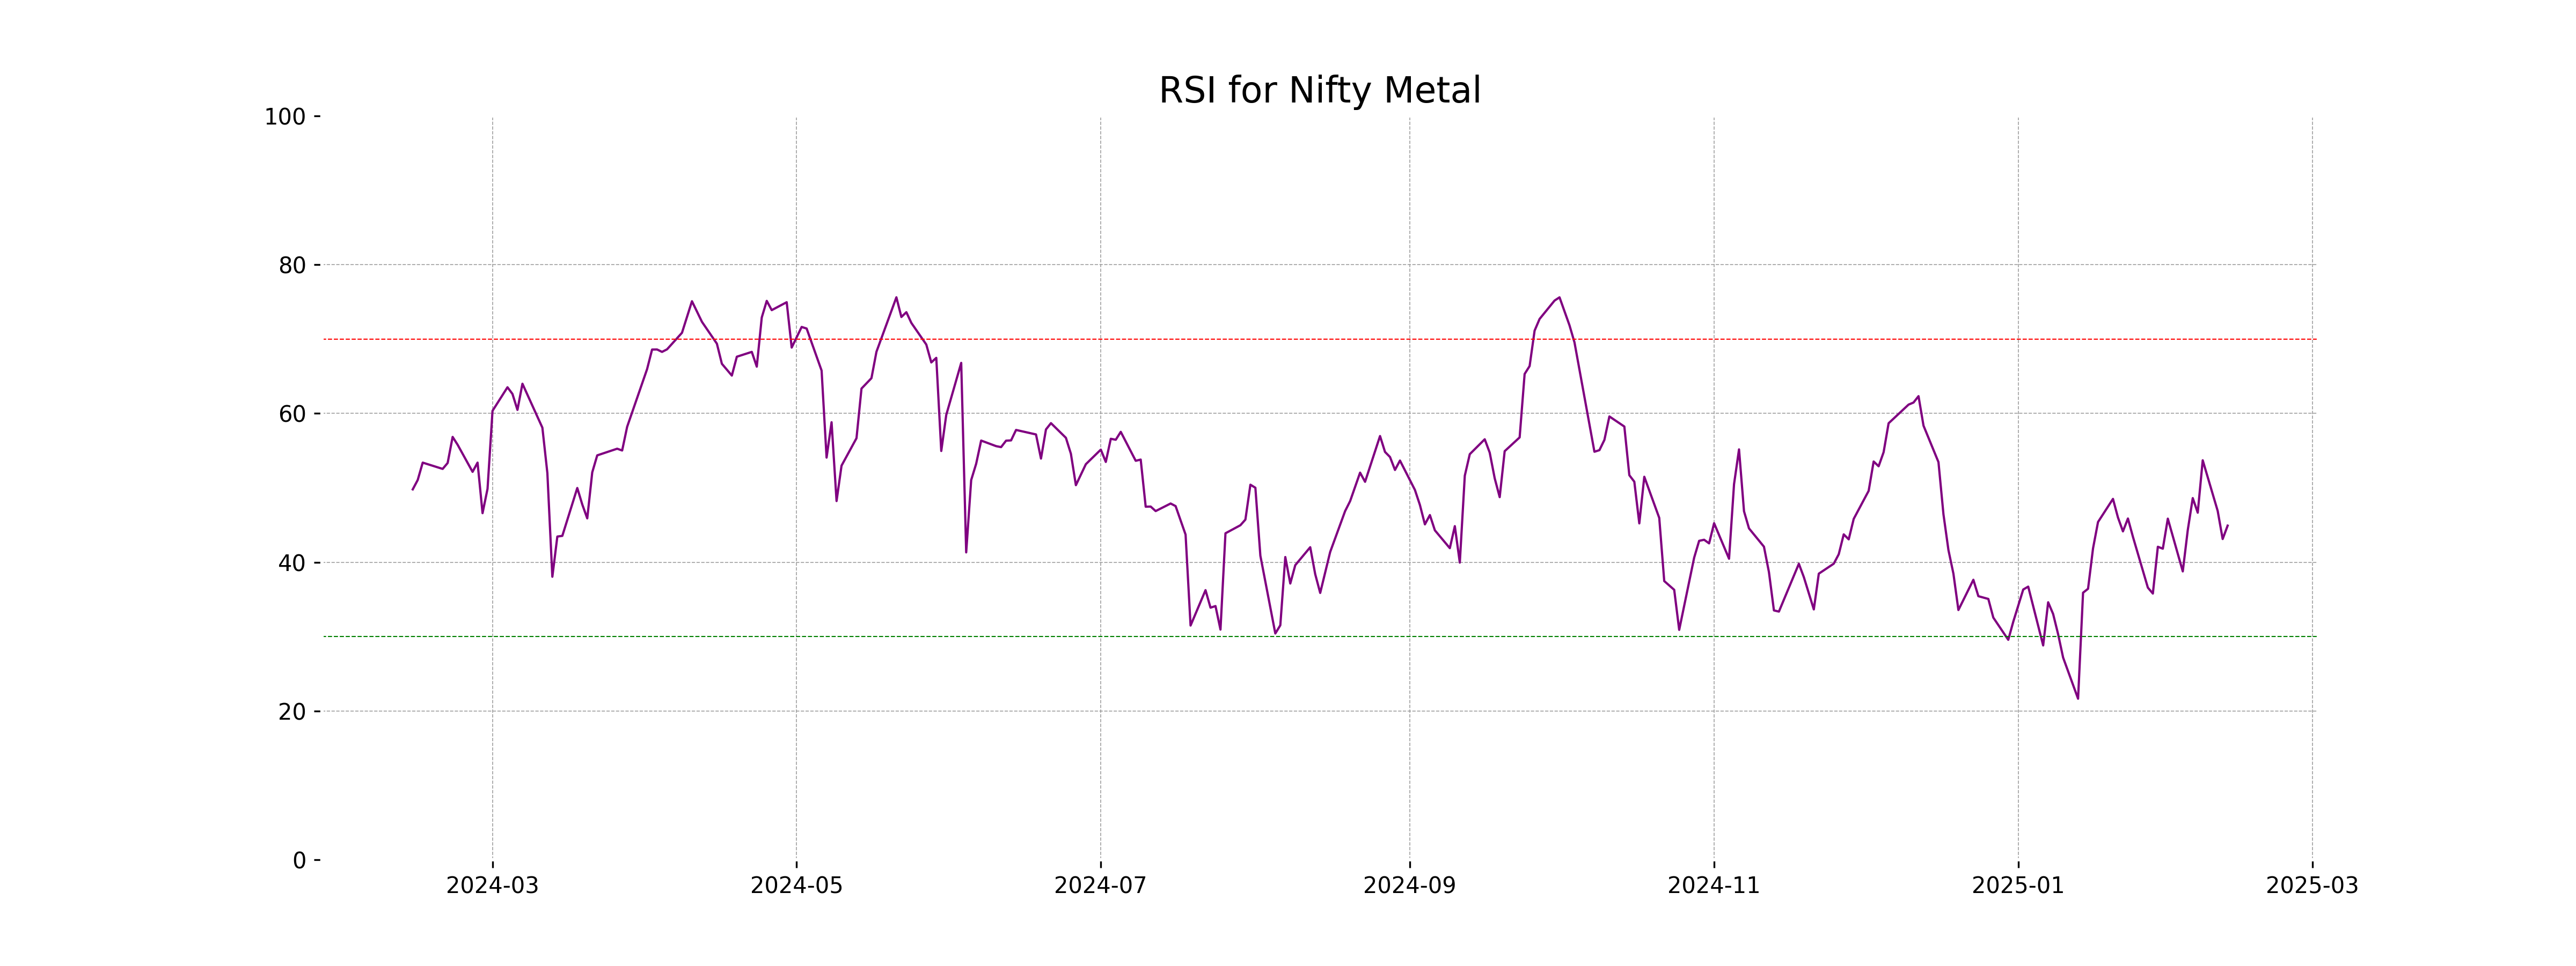
Analysis for Nifty Metal - February 12, 2025

The Nifty Metal index opened at 8205.70 and closed at 8268.40, registering a percentage change of 0.67% with a points change of 54.85. The RSI is at 44.92, indicating that the index is nearing oversold territory. The price is currently below several important EMAs, namely the 10, 50, and 200-day EMAs, which could imply a bearish sentiment in the market.
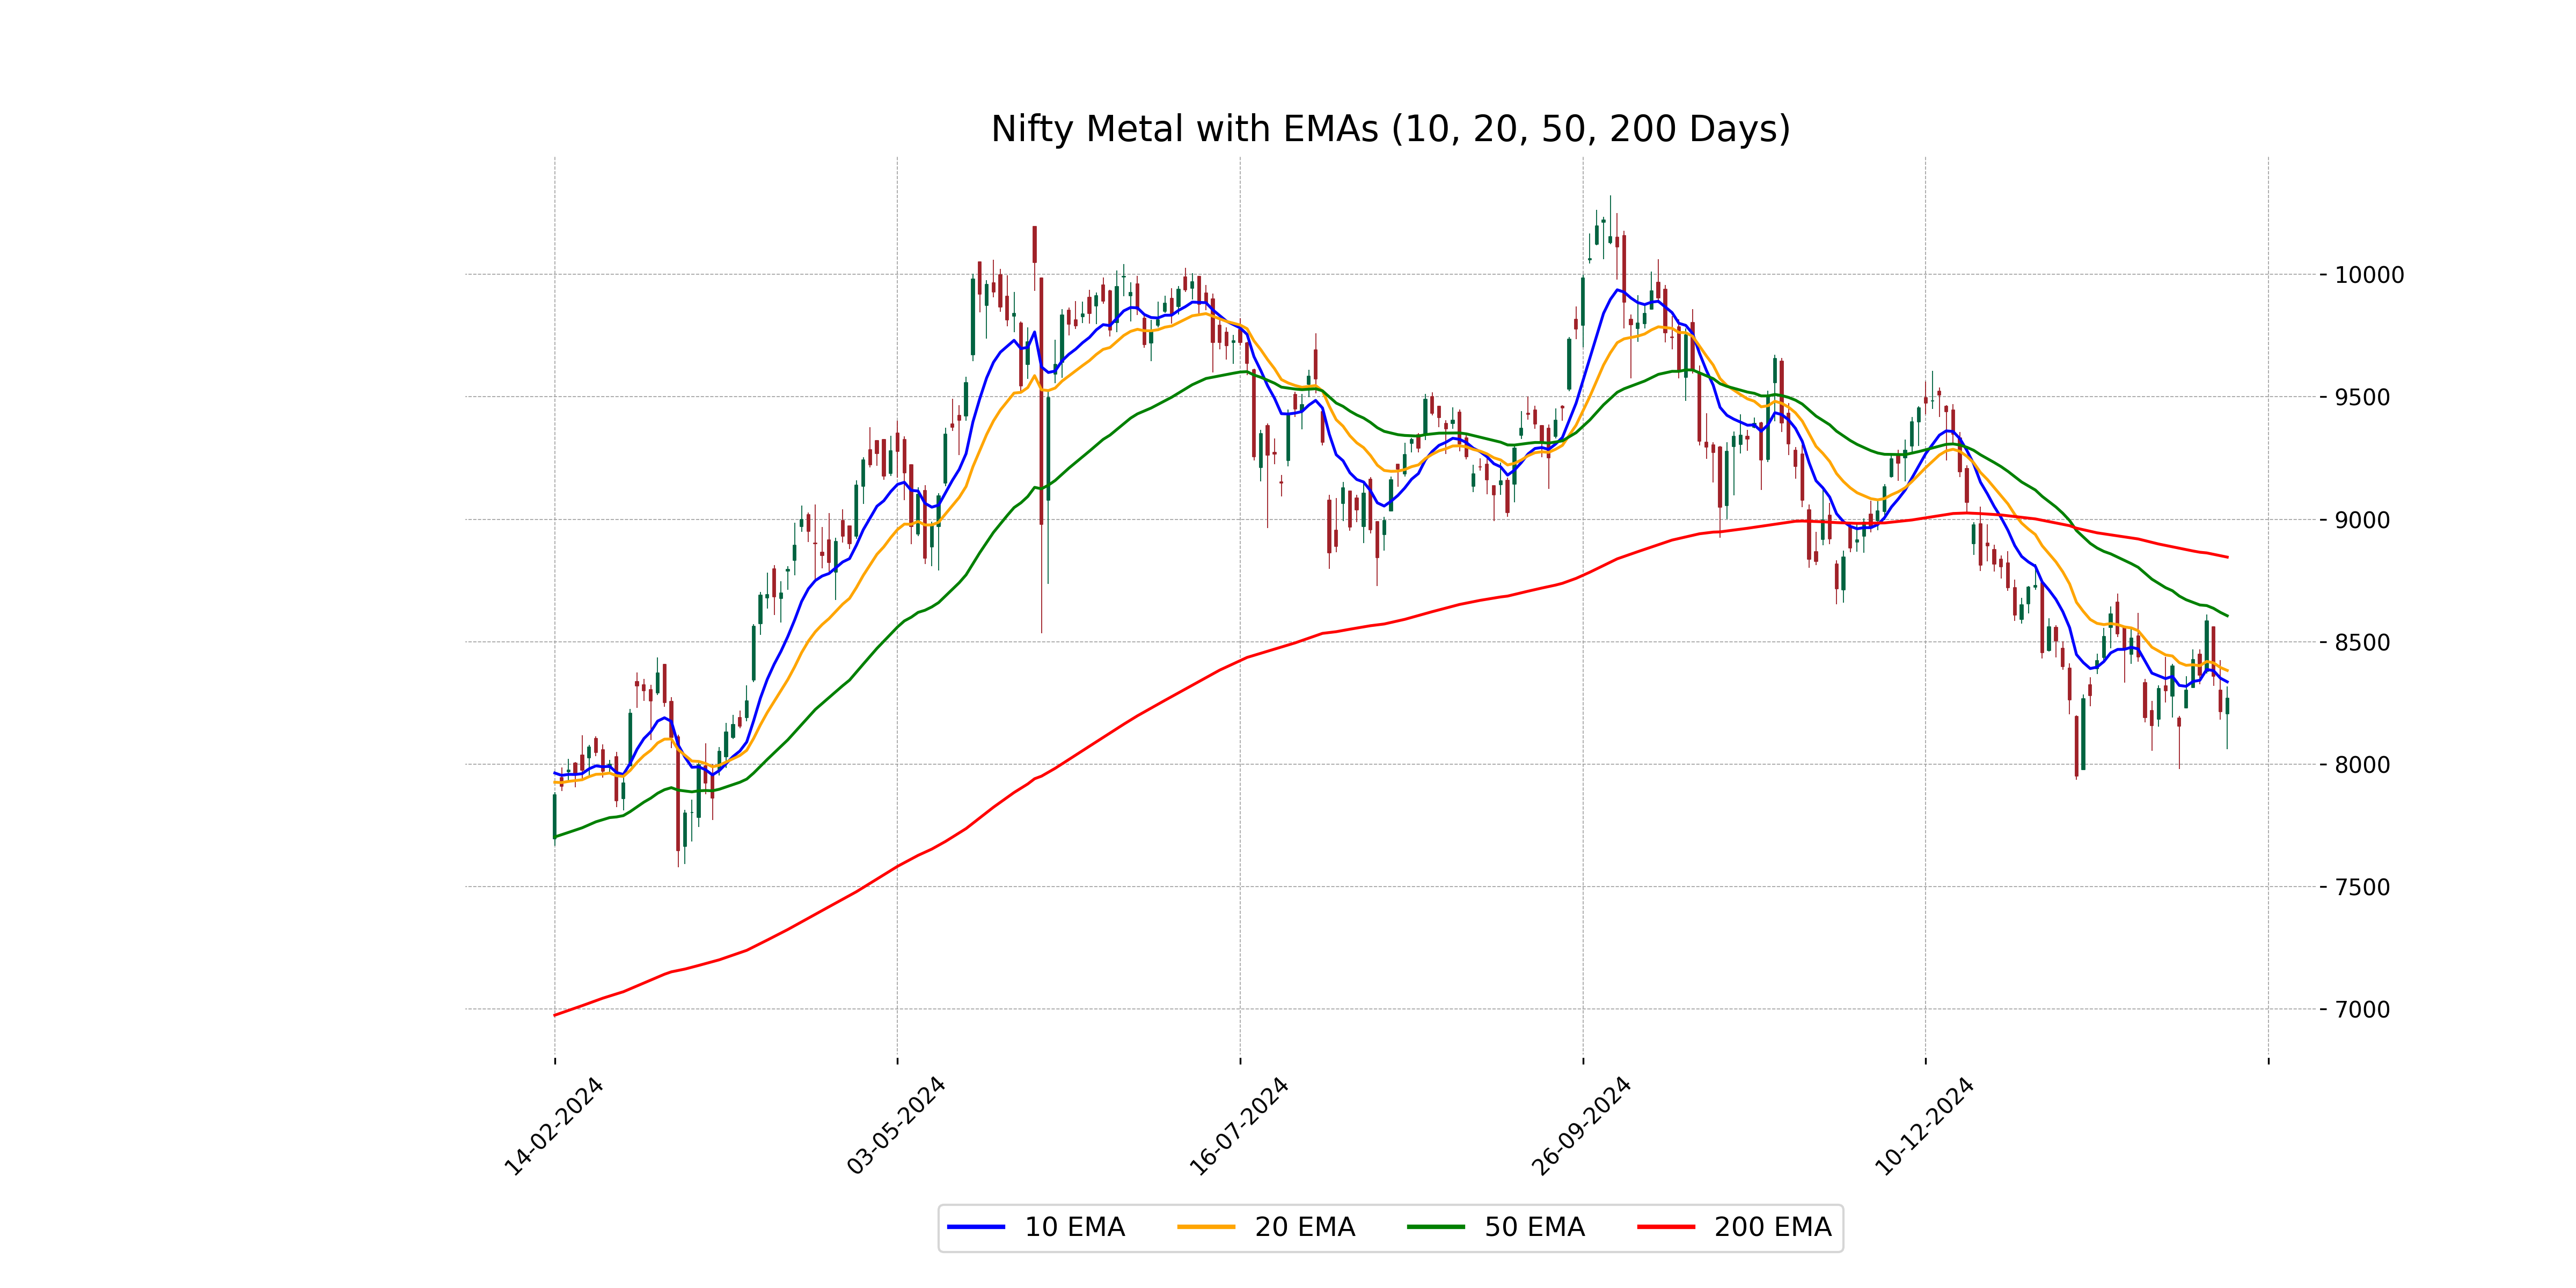
Relationship with Key Moving Averages
The Nifty Metal index closed at 8268.40, positioned below its 50-day EMA of 8605.85 and 200-day EMA of 8845.37, indicating a bearish trend. Additionally, it is also below its 10-day EMA of 8336.07 and 20-day EMA of 8382.53, suggesting recent weakness.
Moving Averages Trend (MACD)
The MACD value for Nifty Metal is -81.78, which is higher than the MACD Signal of -99.38. This suggests a potential bullish crossover is forming, indicating that the stock could be shifting towards a positive momentum. The current RSI of 44.92 implies that it is not in the overbought or oversold territory.
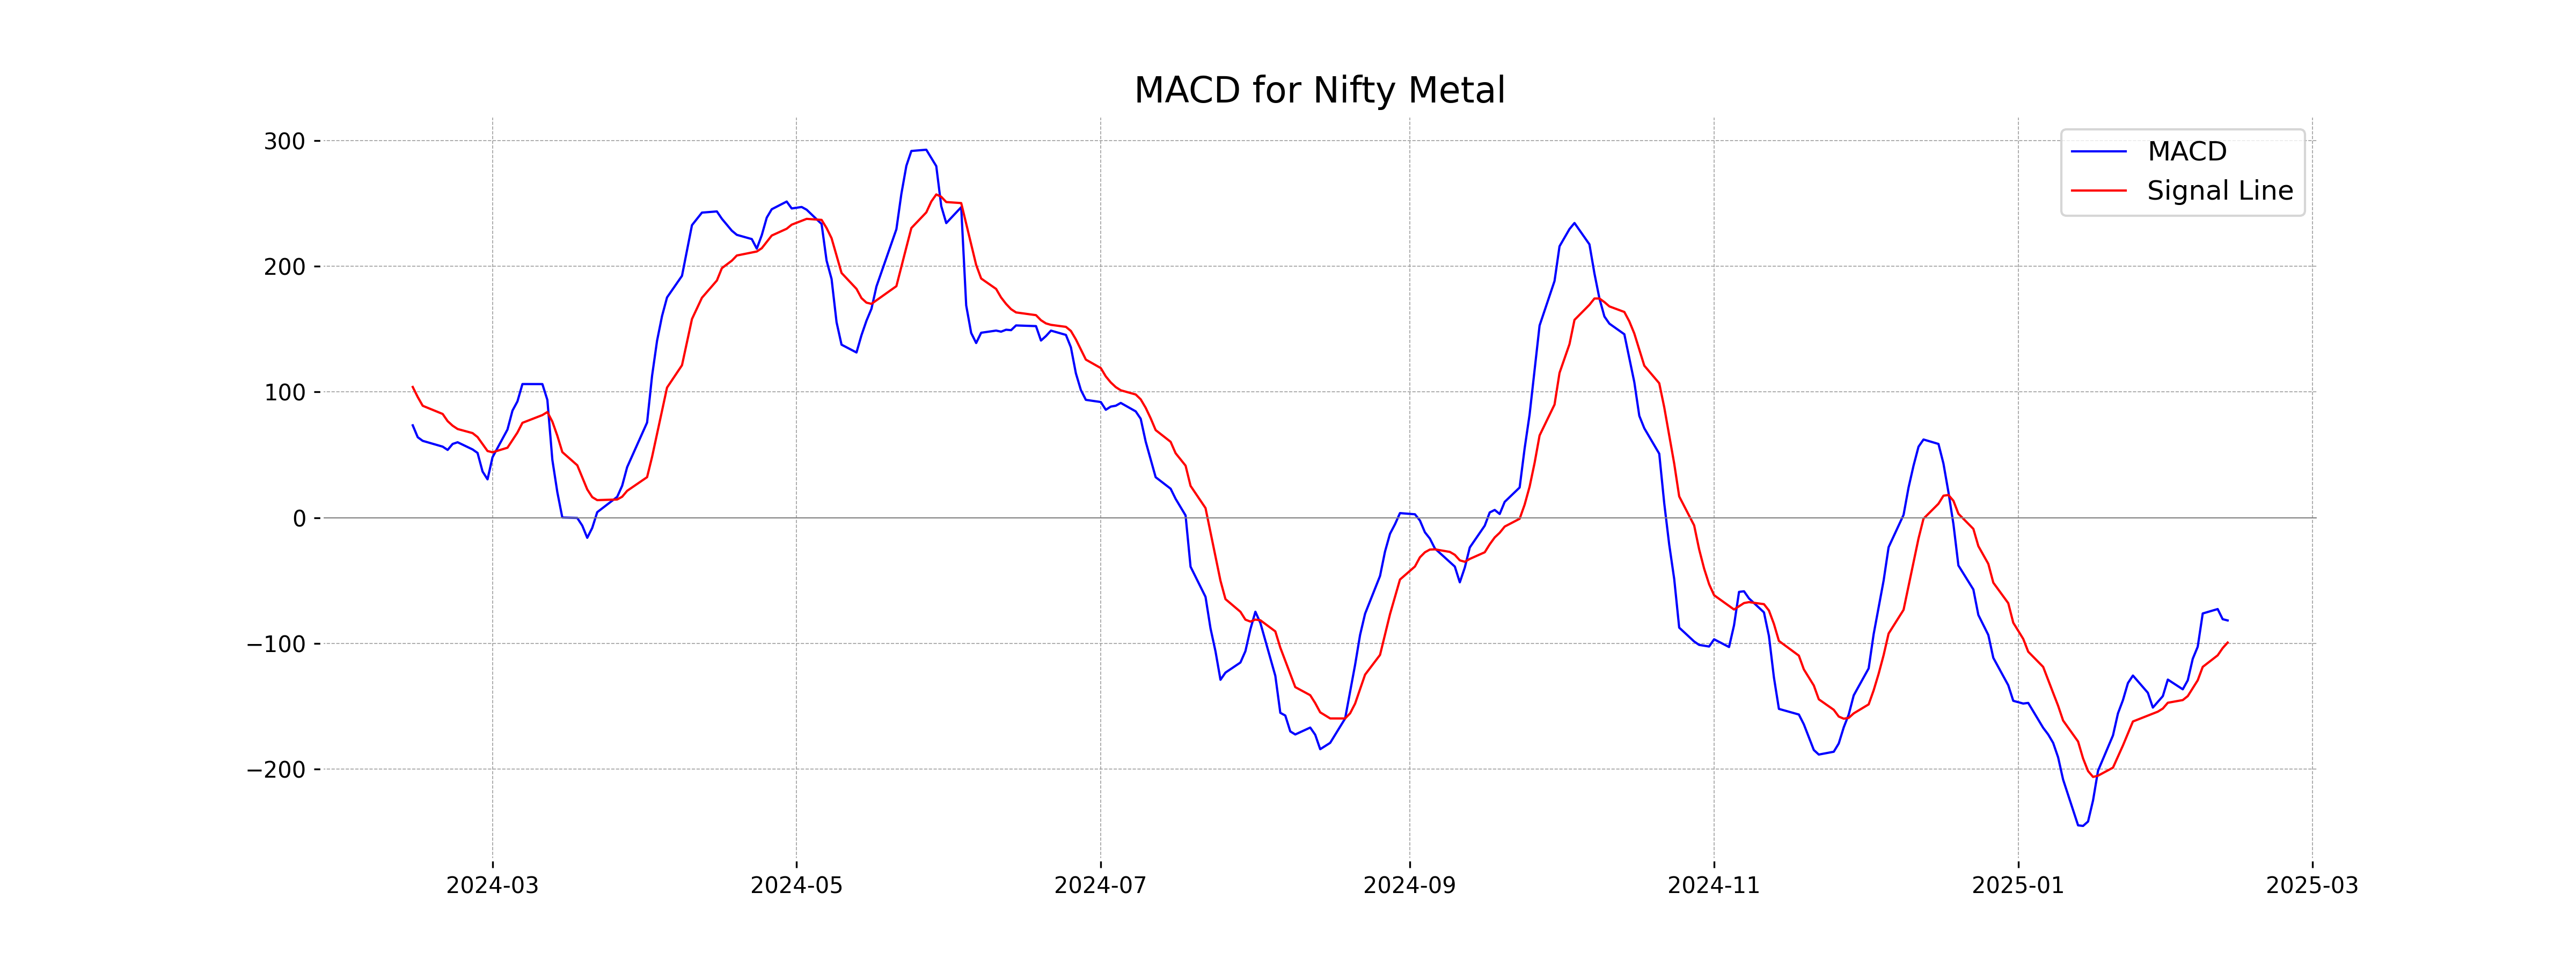
RSI Analysis
The RSI value for Nifty Metal is 44.92, which indicates that the stock is in a neutral position, neither overbought nor oversold. It suggests a lack of strong momentum in either direction, and investors might look for other indicators or wait for more movement.
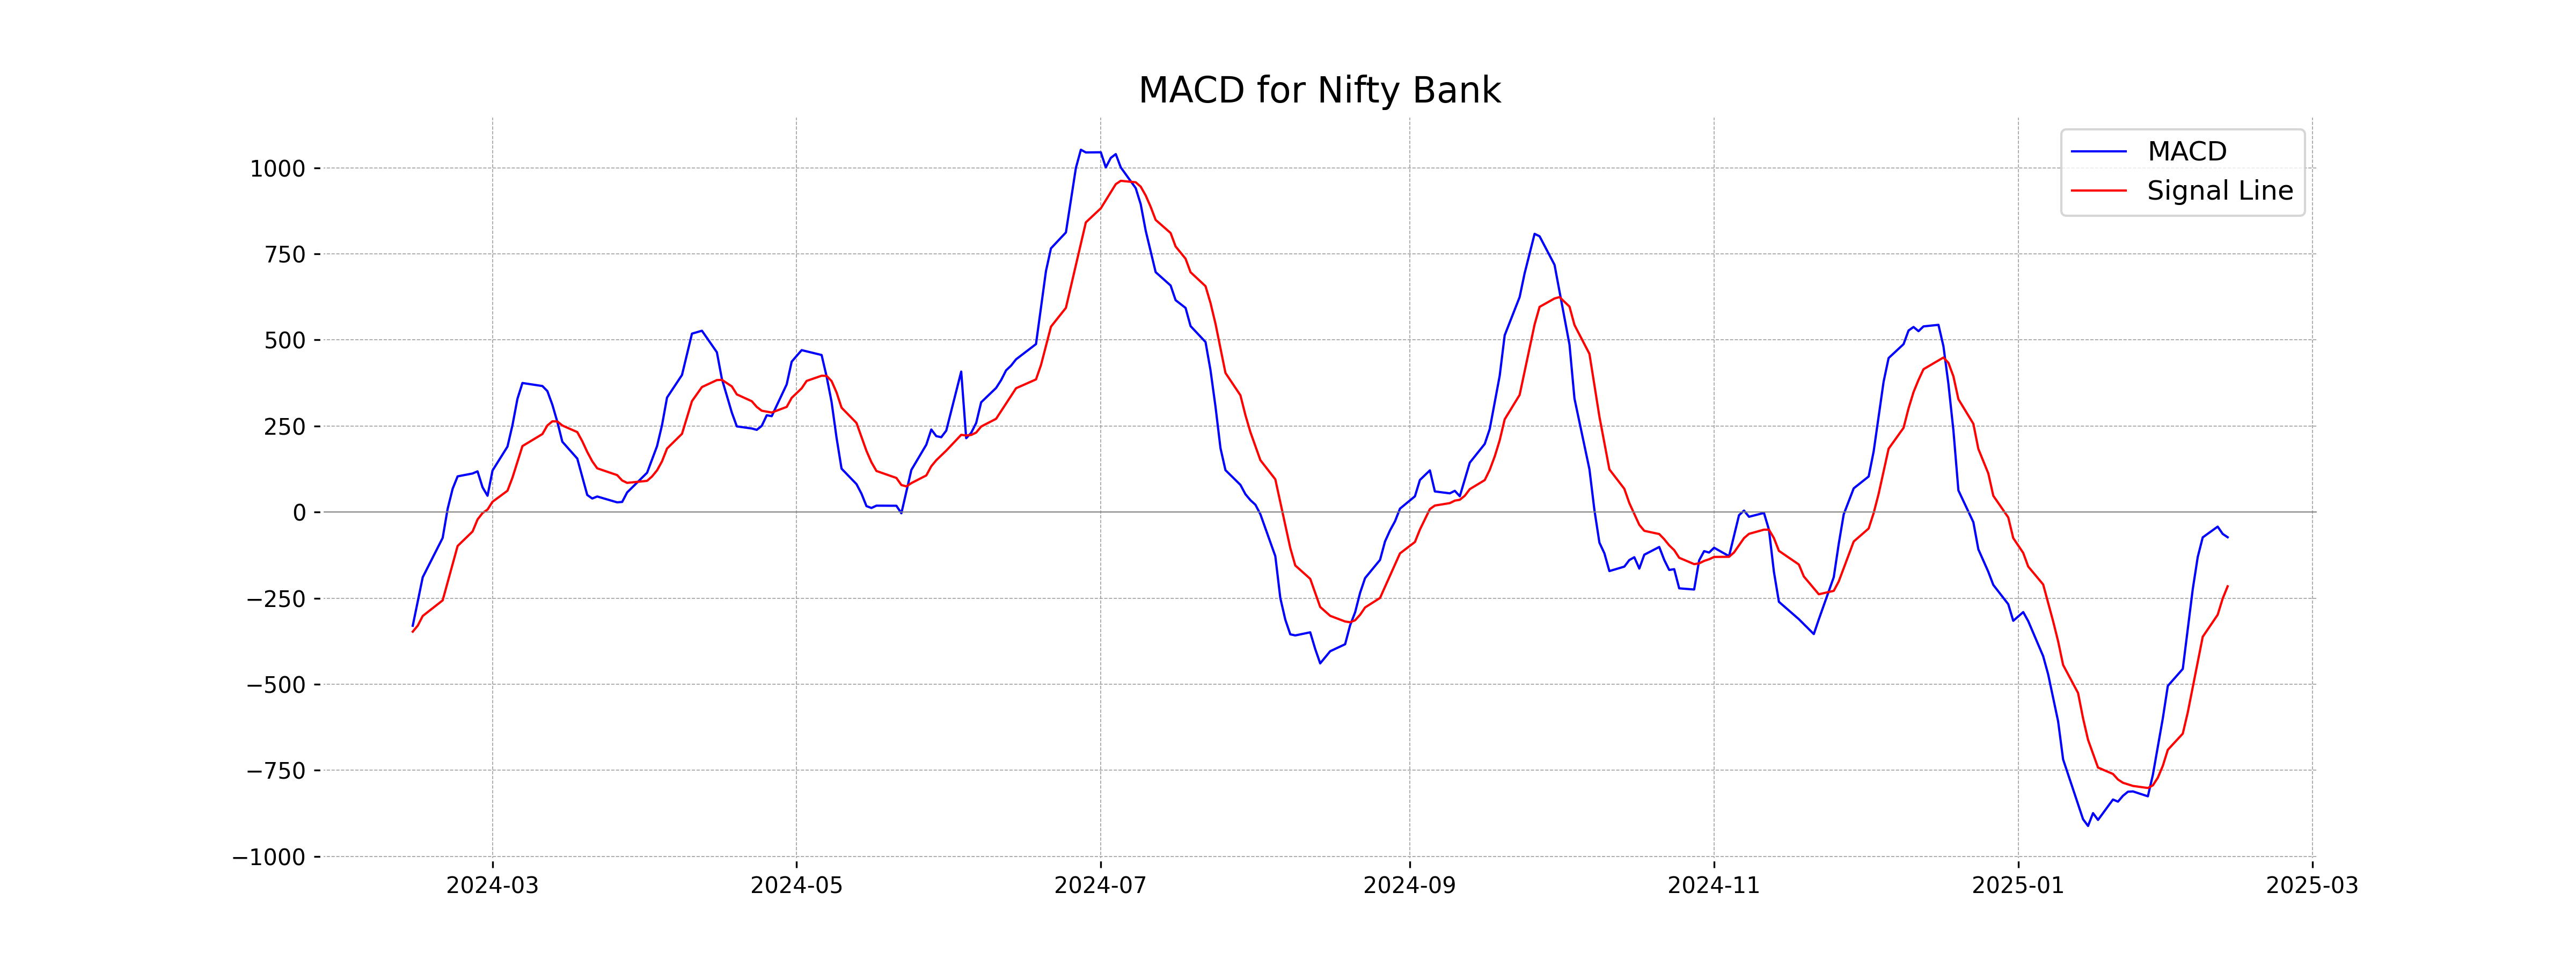
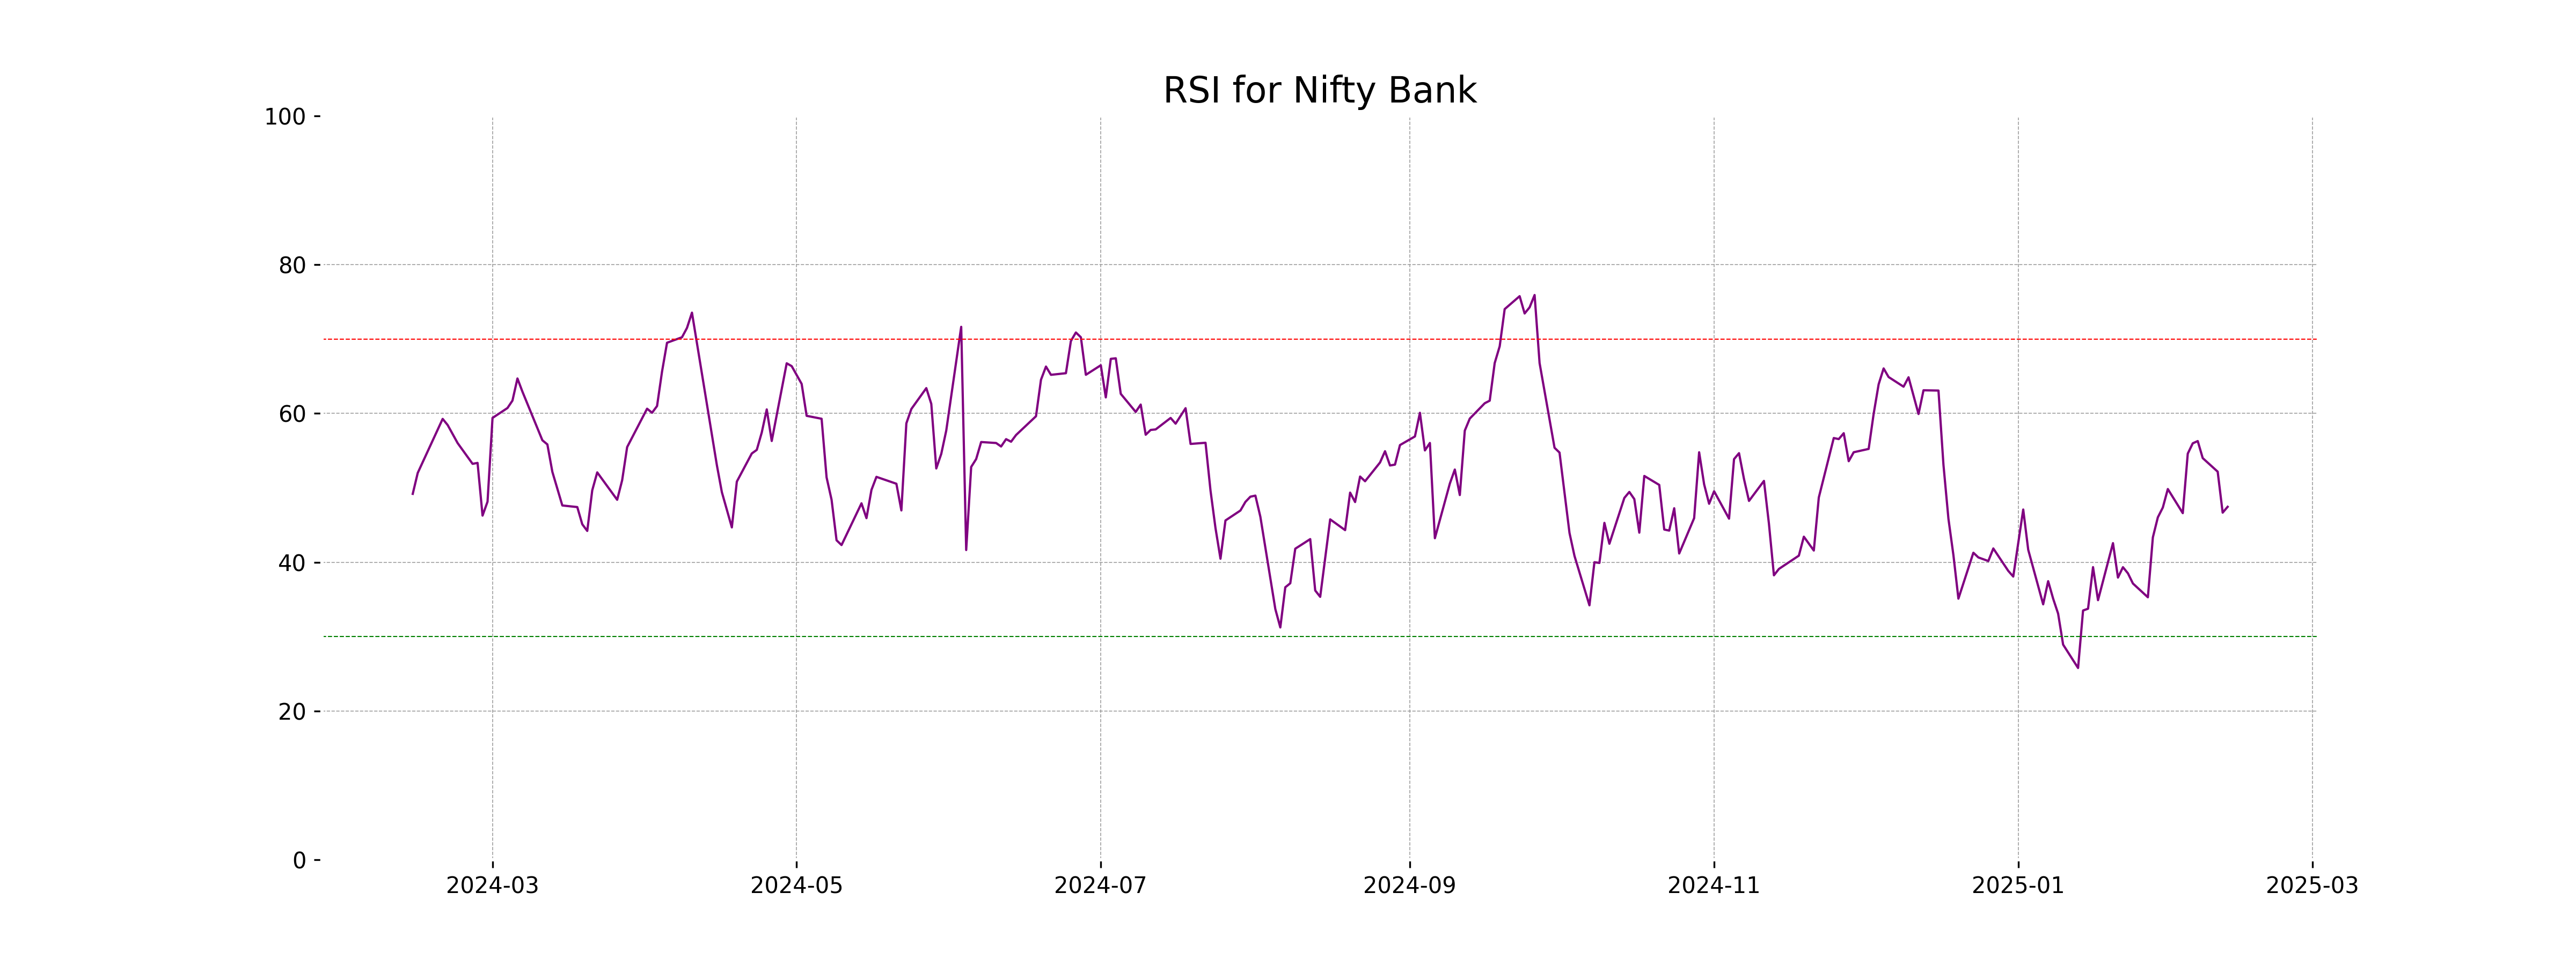
Analysis for Nifty Bank - February 12, 2025

The Nifty Bank index experienced a slight increase, closing at 49,479.45, up by 0.15% or 76.05 points from its previous close of 49,403.40. Although the index is trading below its 50-day and 200-day EMAs, indicating potential bearish sentiment, its RSI is relatively neutral at 47.45. The MACD indicates a bearish momentum as it remains negative, but the gap between MACD and its signal suggests that the bearish trend might be weakening.
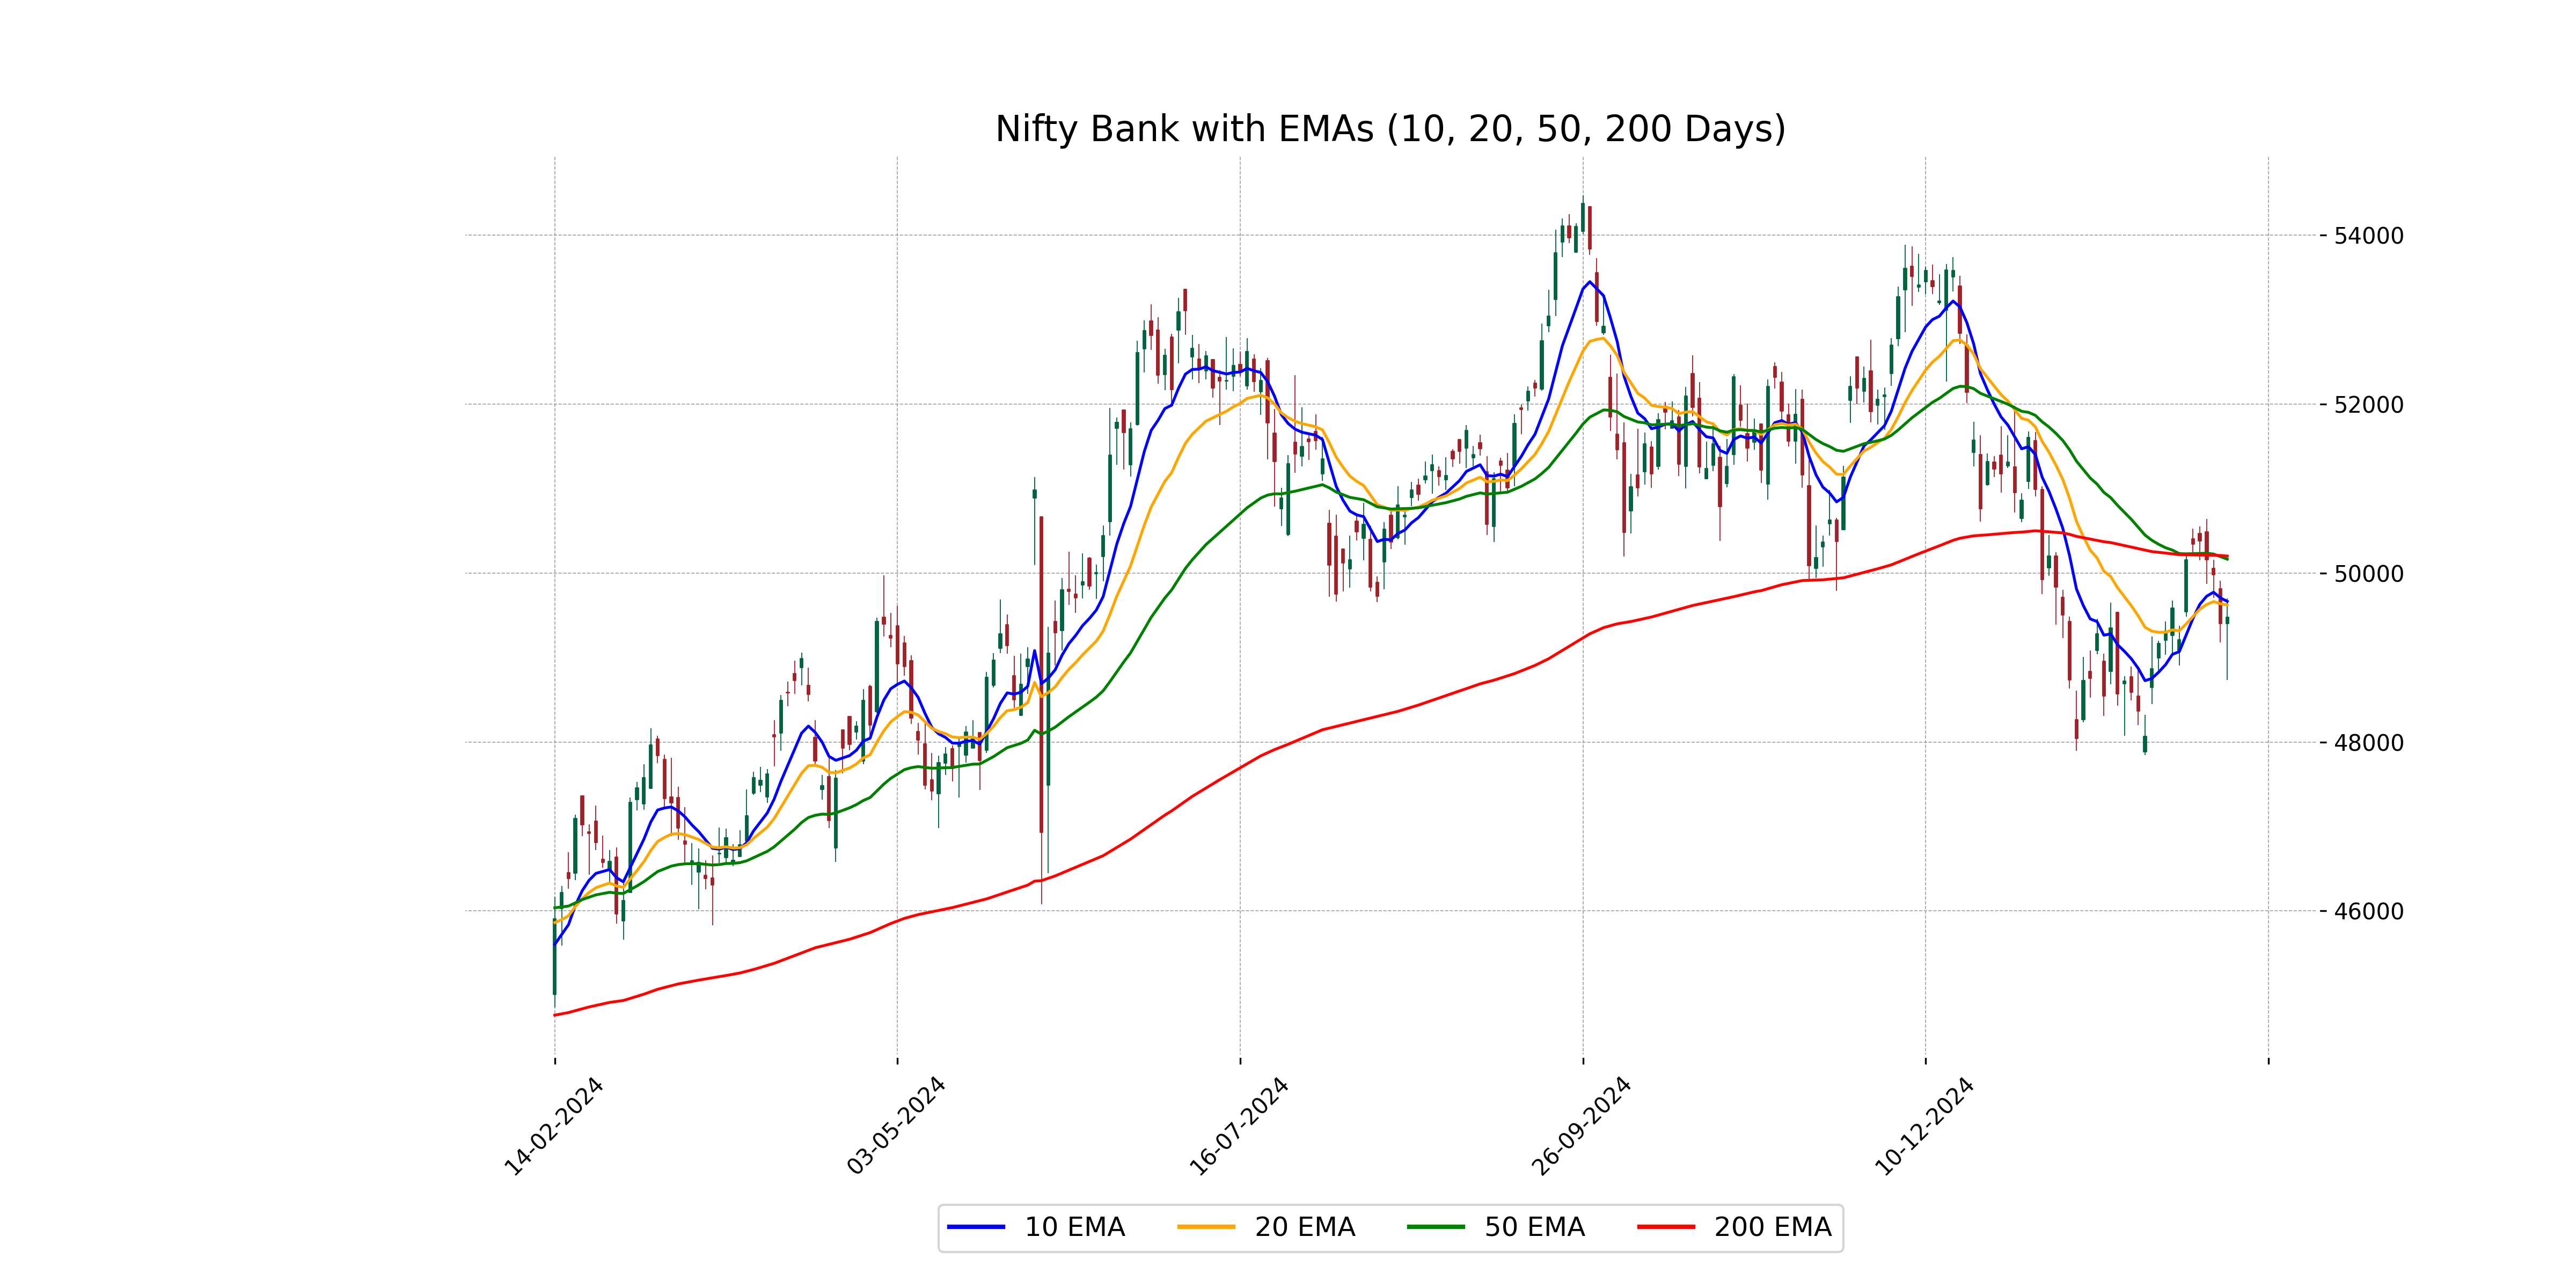
Relationship with Key Moving Averages
The Nifty Bank index closed at 49,479.45, which is below its 50-day EMA of 50,163.95 and 200-day EMA of 50,200.46, indicating a potential bearish trend. However, it remains slightly above the 10-day and 20-day EMAs of 49,664.18 and 49,621.41, respectively, suggesting some short-term strength.
Moving Averages Trend (MACD)
The MACD for Nifty Bank is currently at -73.09, which is higher than the MACD Signal of -215.61. This indicates a potential bullish crossover, suggesting that momentum may be shifting towards the upside. However, the MACD value is still negative, indicating that the stock is currently in a bearish phase.
RSI Analysis
The RSI for Nifty Bank is 47.45, indicating a neutral position for the stock. An RSI value below 50 typically suggests that the stock is neither overbought nor oversold, signaling a potential balance in buying and selling pressures.
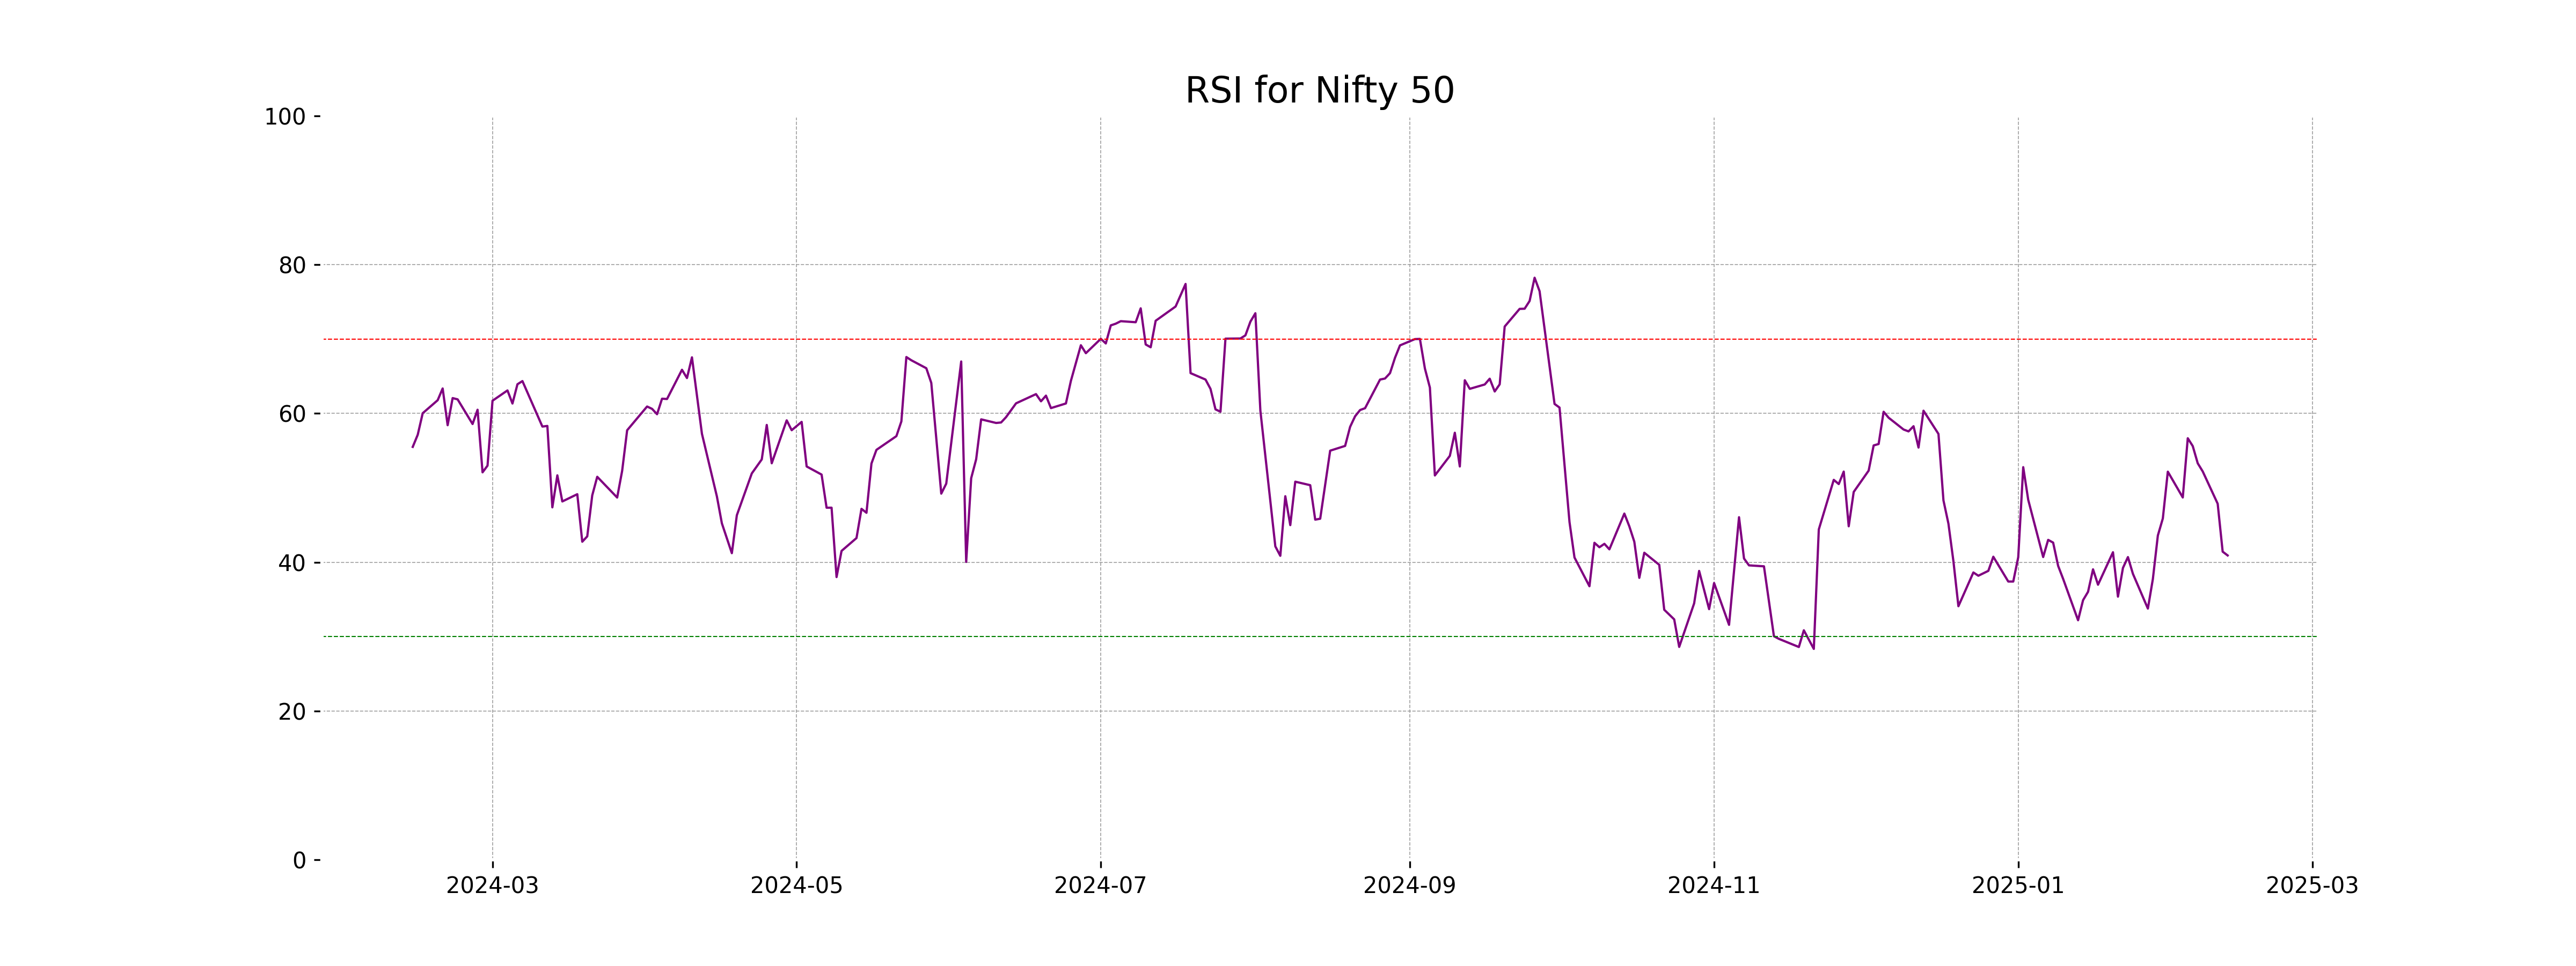
Analysis for Nifty 50 - February 12, 2025
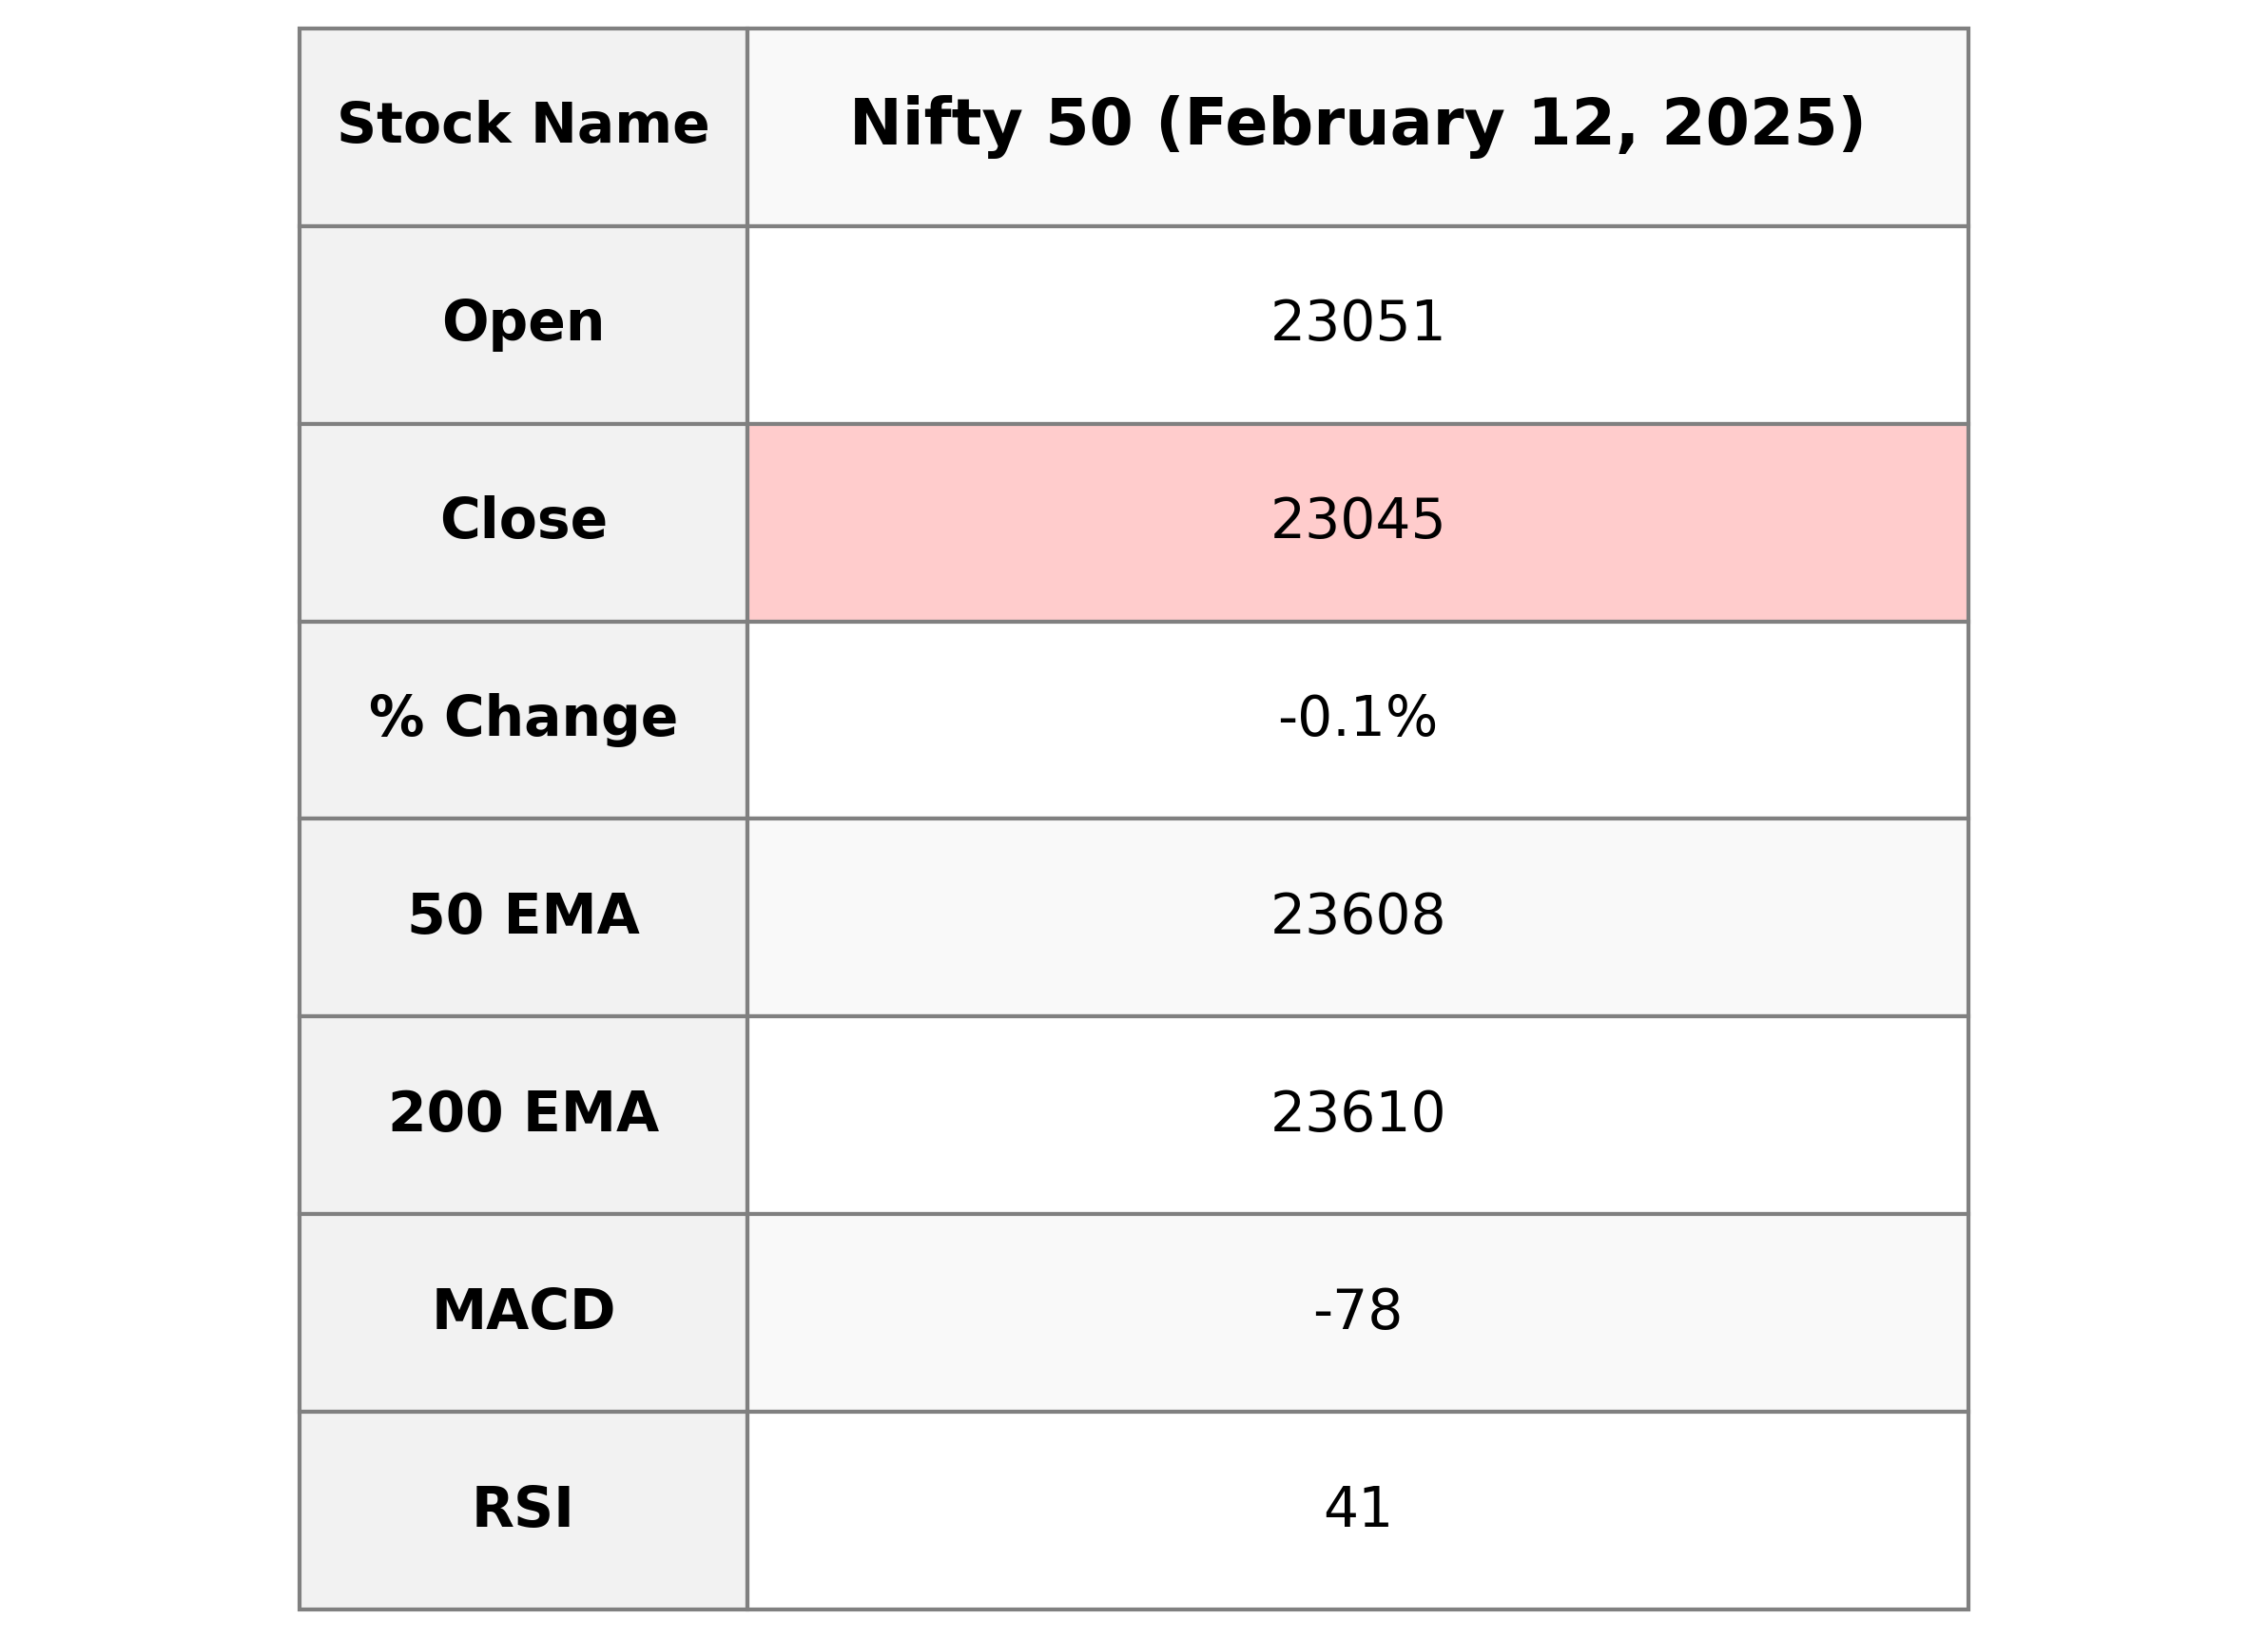
Nifty 50 opened at 23050.80 and closed slightly lower at 23045.25, marking a small decrease of 0.12% compared to the previous close. The index experienced a day low of 22798.35 and a high of 23144.70, with an RSI of 40.91, indicating that it is approaching the oversold territory. The MACD value stands at -78.08, hinting at a bearish trend continuation.
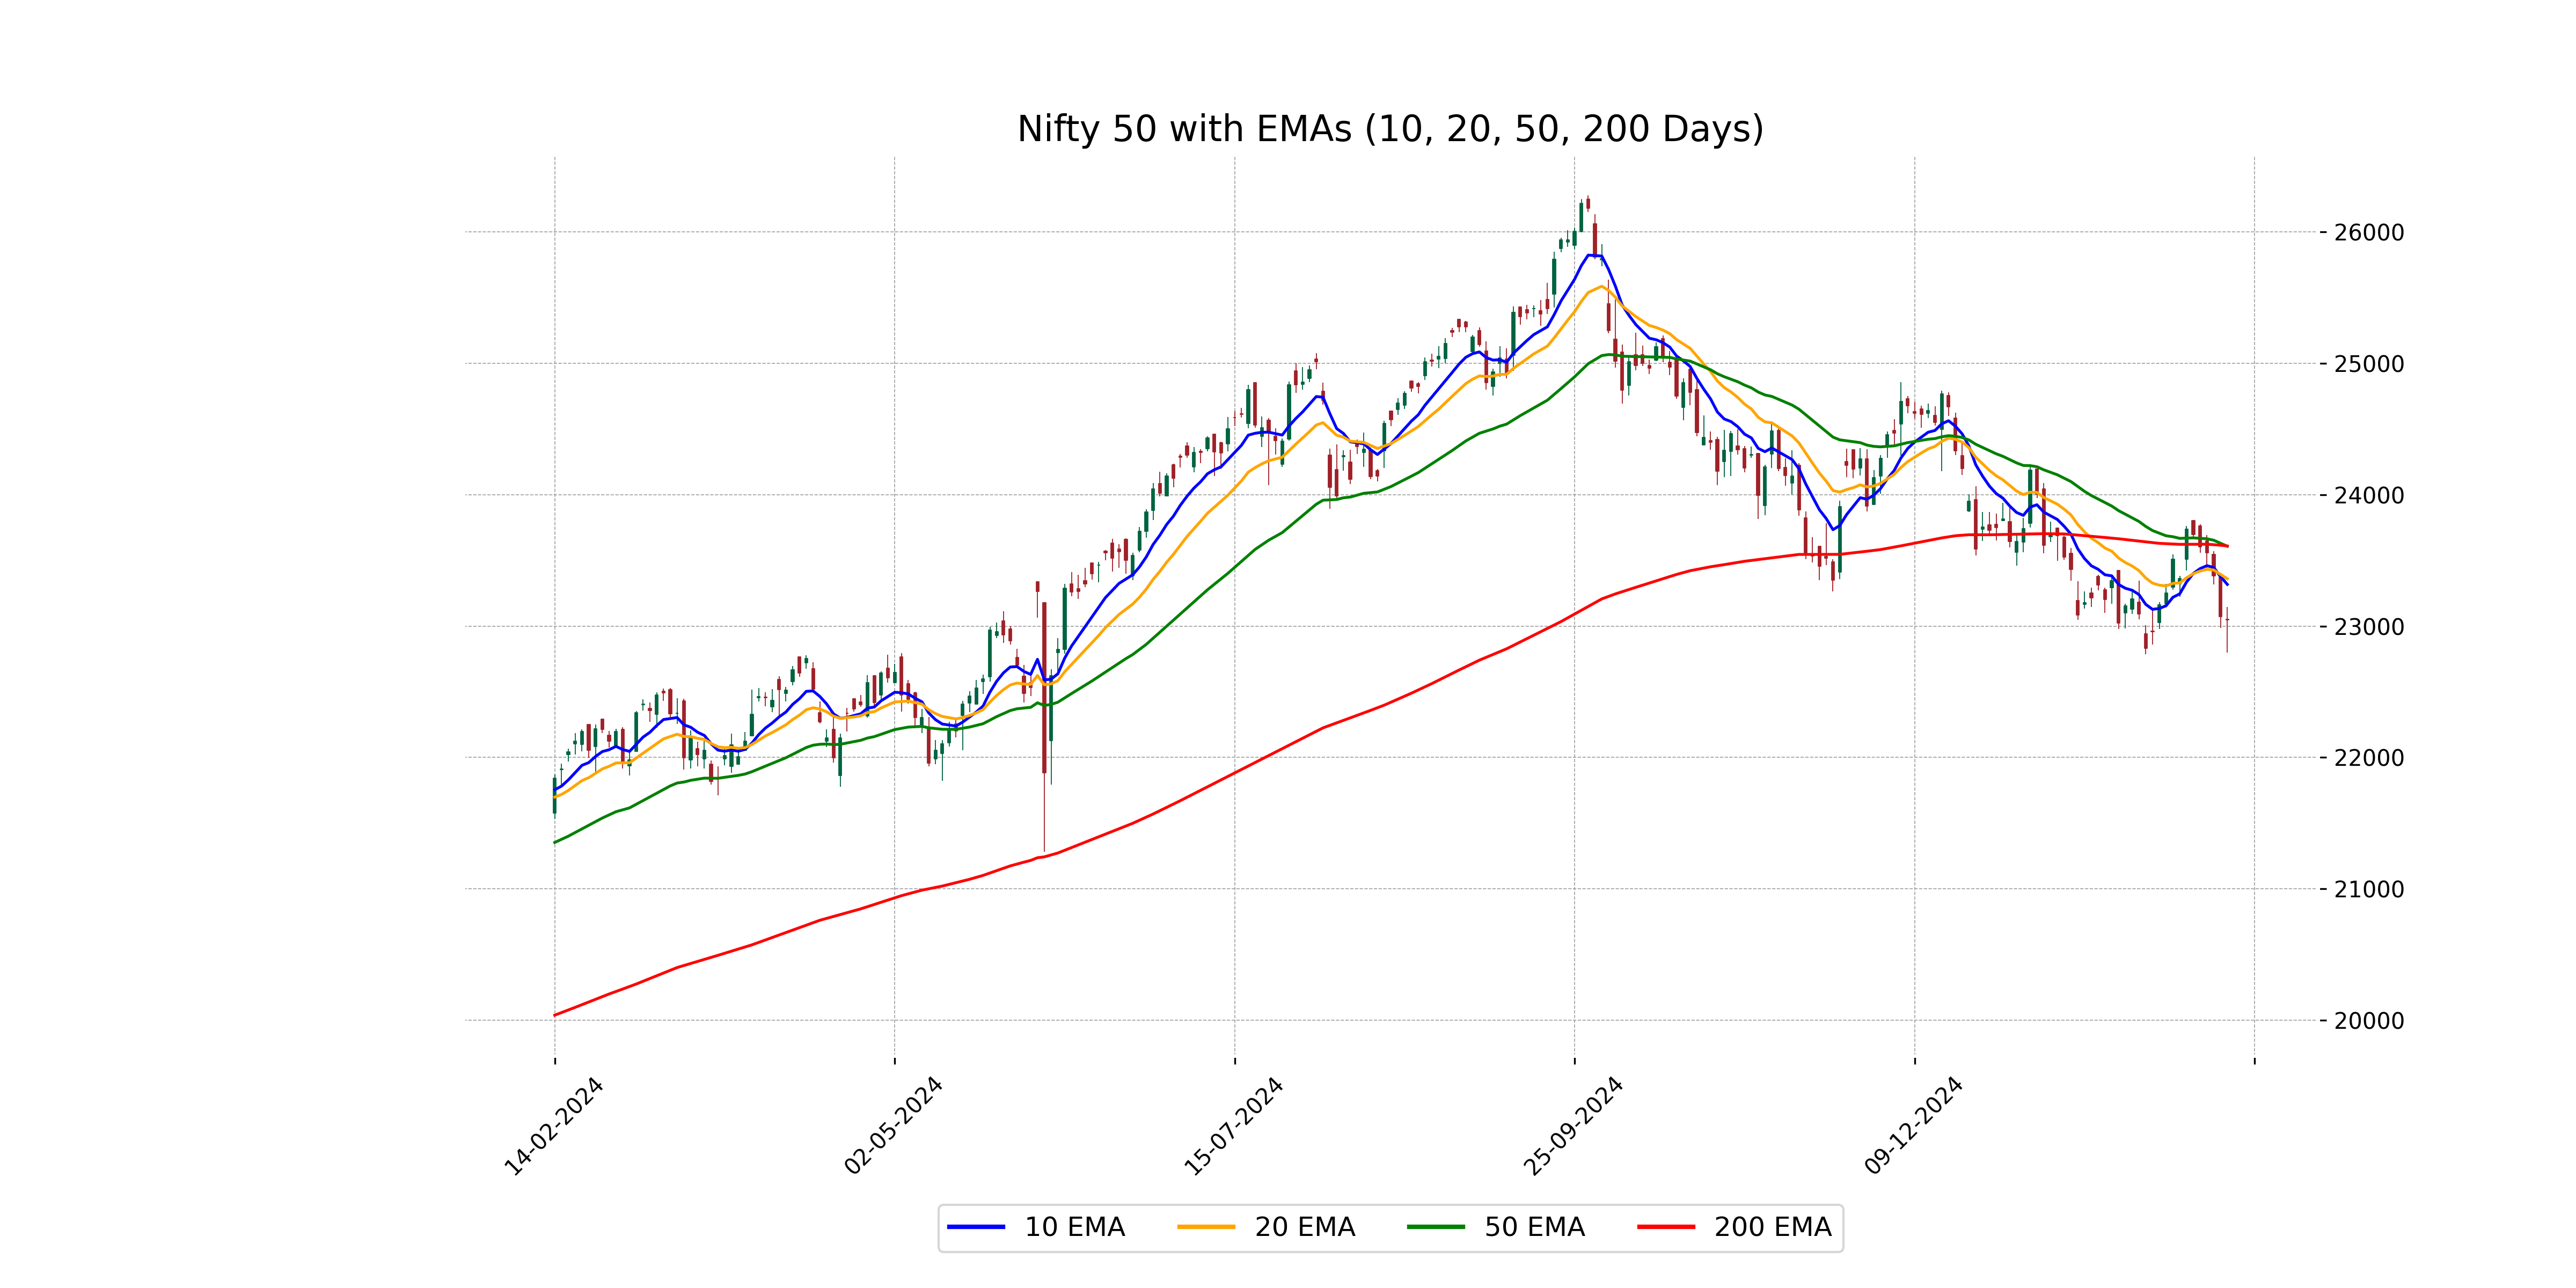
Relationship with Key Moving Averages
The Nifty 50 closed at 23045.25, which is below the 50-day EMA of 23607.59 and the 200-day EMA of 23609.57, indicating a bearish trend. Additionally, the index is also below the 10-day EMA of 23317.14 and the 20-day EMA of 23359.96, suggesting short-term weakness.
Moving Averages Trend (MACD)
The MACD value for Nifty 50 is -78.08 with a signal of -87.78, indicating a bearish trend as the MACD line is above the signal line. This suggests downward momentum in the market, and the RSI at 40.91 further confirms weak relative strength.
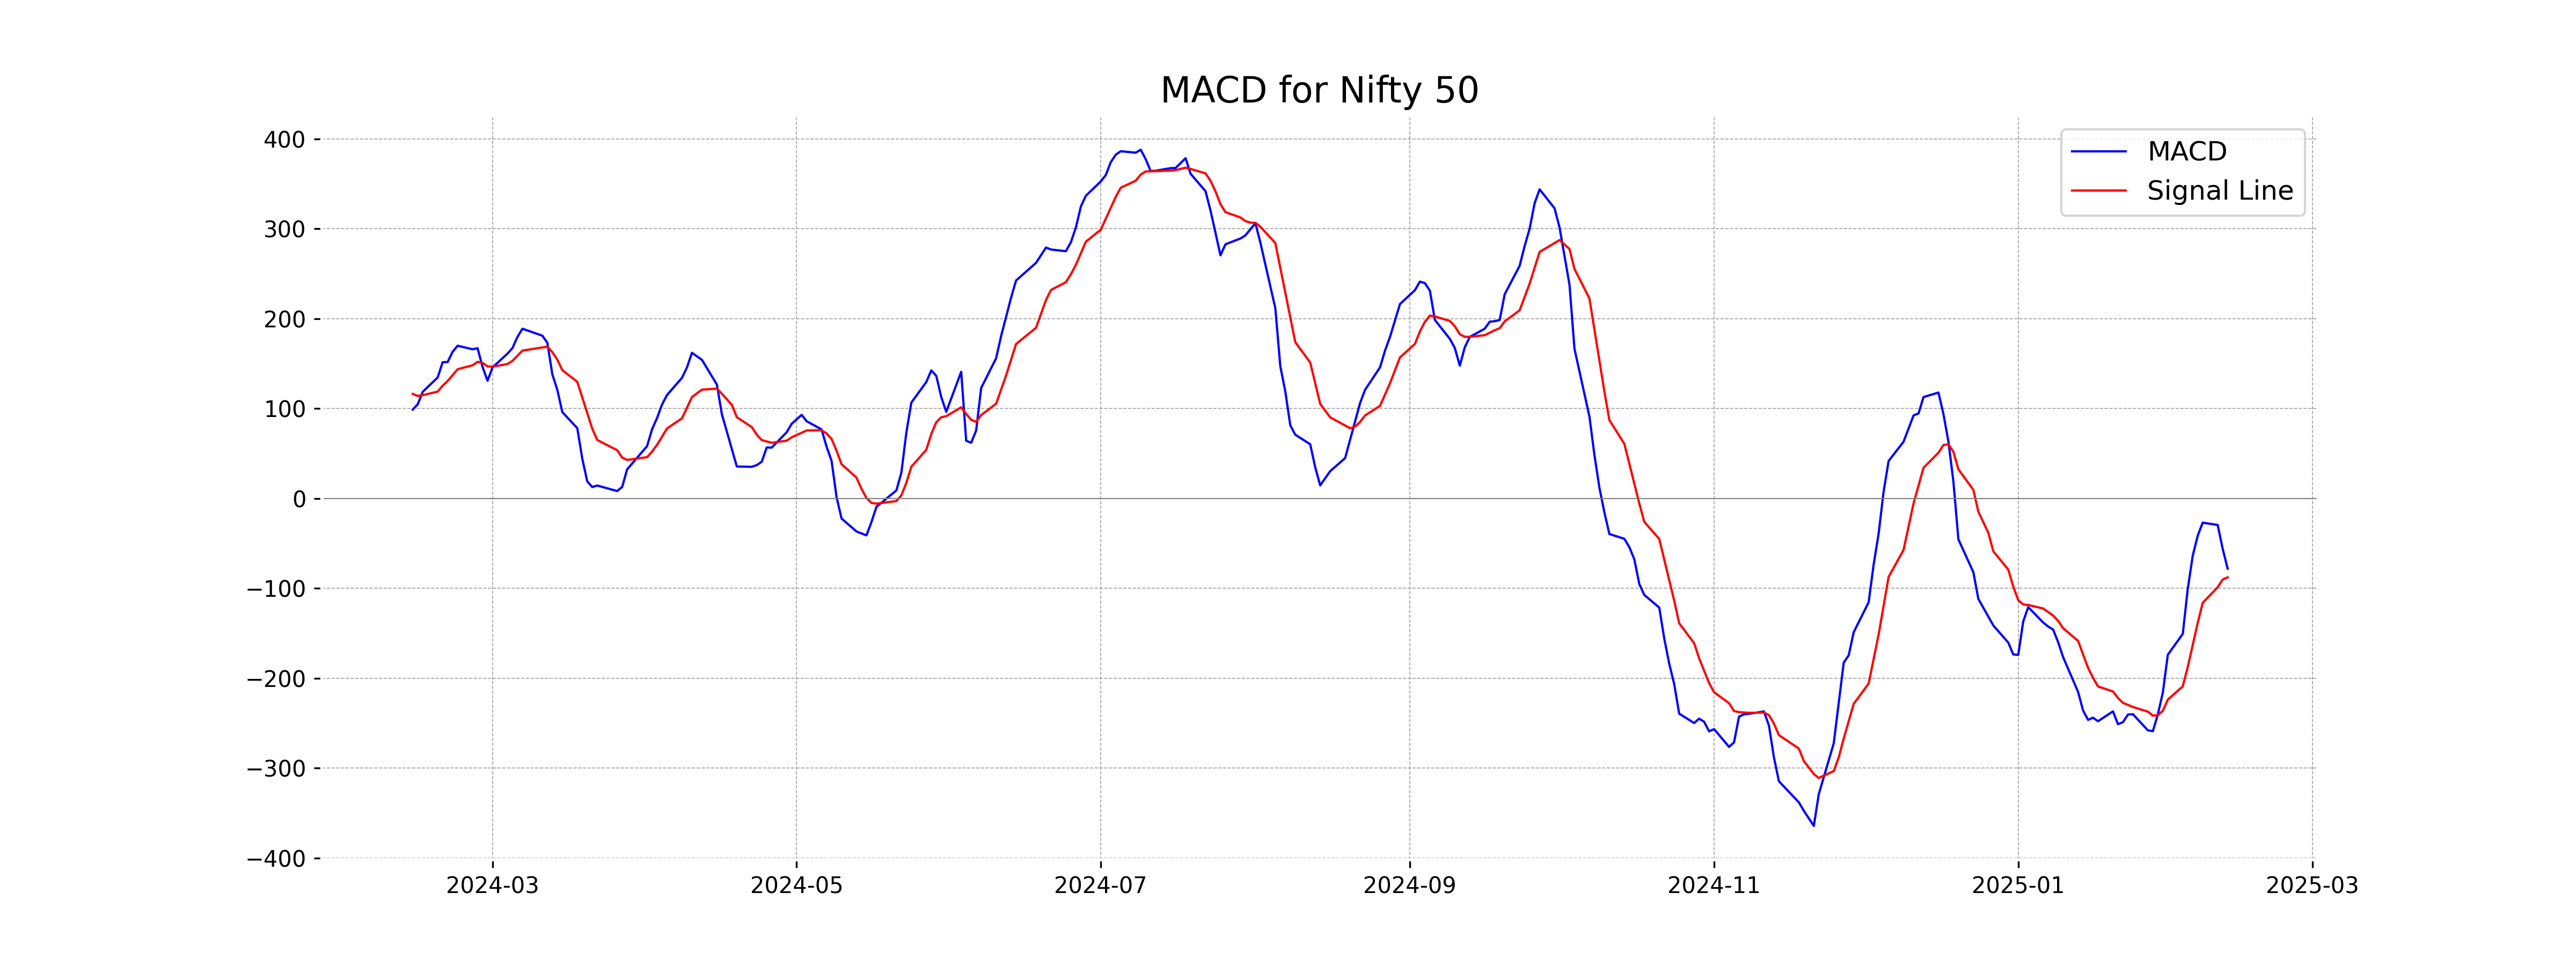
RSI Analysis
The Relative Strength Index (RSI) for Nifty 50 is currently at 40.91, which suggests that the index is approaching the oversold territory, typically below 30. This indicates potential underperformance relative to its recent price movements, and traders might watch for a reversal signal if the RSI continues to decline.
Up Next
Indian stock market sector-wise performance today - February 12, 2025

Rupee breaches 91-mark against US dollar for first time in intra-day trade

Microsoft commits USD 17.5 billion investment in India: CEO Satya Nadella

CBI books Anil Ambani's son, Reliance Home Finance Ltd. in Rs 228 crore bank fraud case

RBI raises FY26 GDP growth projection to 7.3 pc

RBI trims policy interest rate by 25bps to 5.25pc, loans to get cheaper

More videos

Rupee slumps to all-time low of 90.25 against US dollar in intra-day trade

Reliance completes merger of Star Television Productions with Jiostar

India to lead emerging market growth with 7pc GDP rise in 2025: Moody’s

Nifty hits record high after 14 months; Sensex nears all-time peak

Reliance stops Russian oil use at its only-for-export refinery to comply with EU sanctions

ED attaches fresh assets worth over Rs 1,400 cr in case against Anil Ambani's Reliance Group

India signs one-year deal to import 2.2 million tonnes of LPG from US

India International Trade Fair begins at Pragati Maidan amid tight security

Stock markets decline in initial trade on foreign fund outflows, weak Asian peers

Amazon to lay off 30,000 office workers amid AI-driven cost cuts