


Highlights
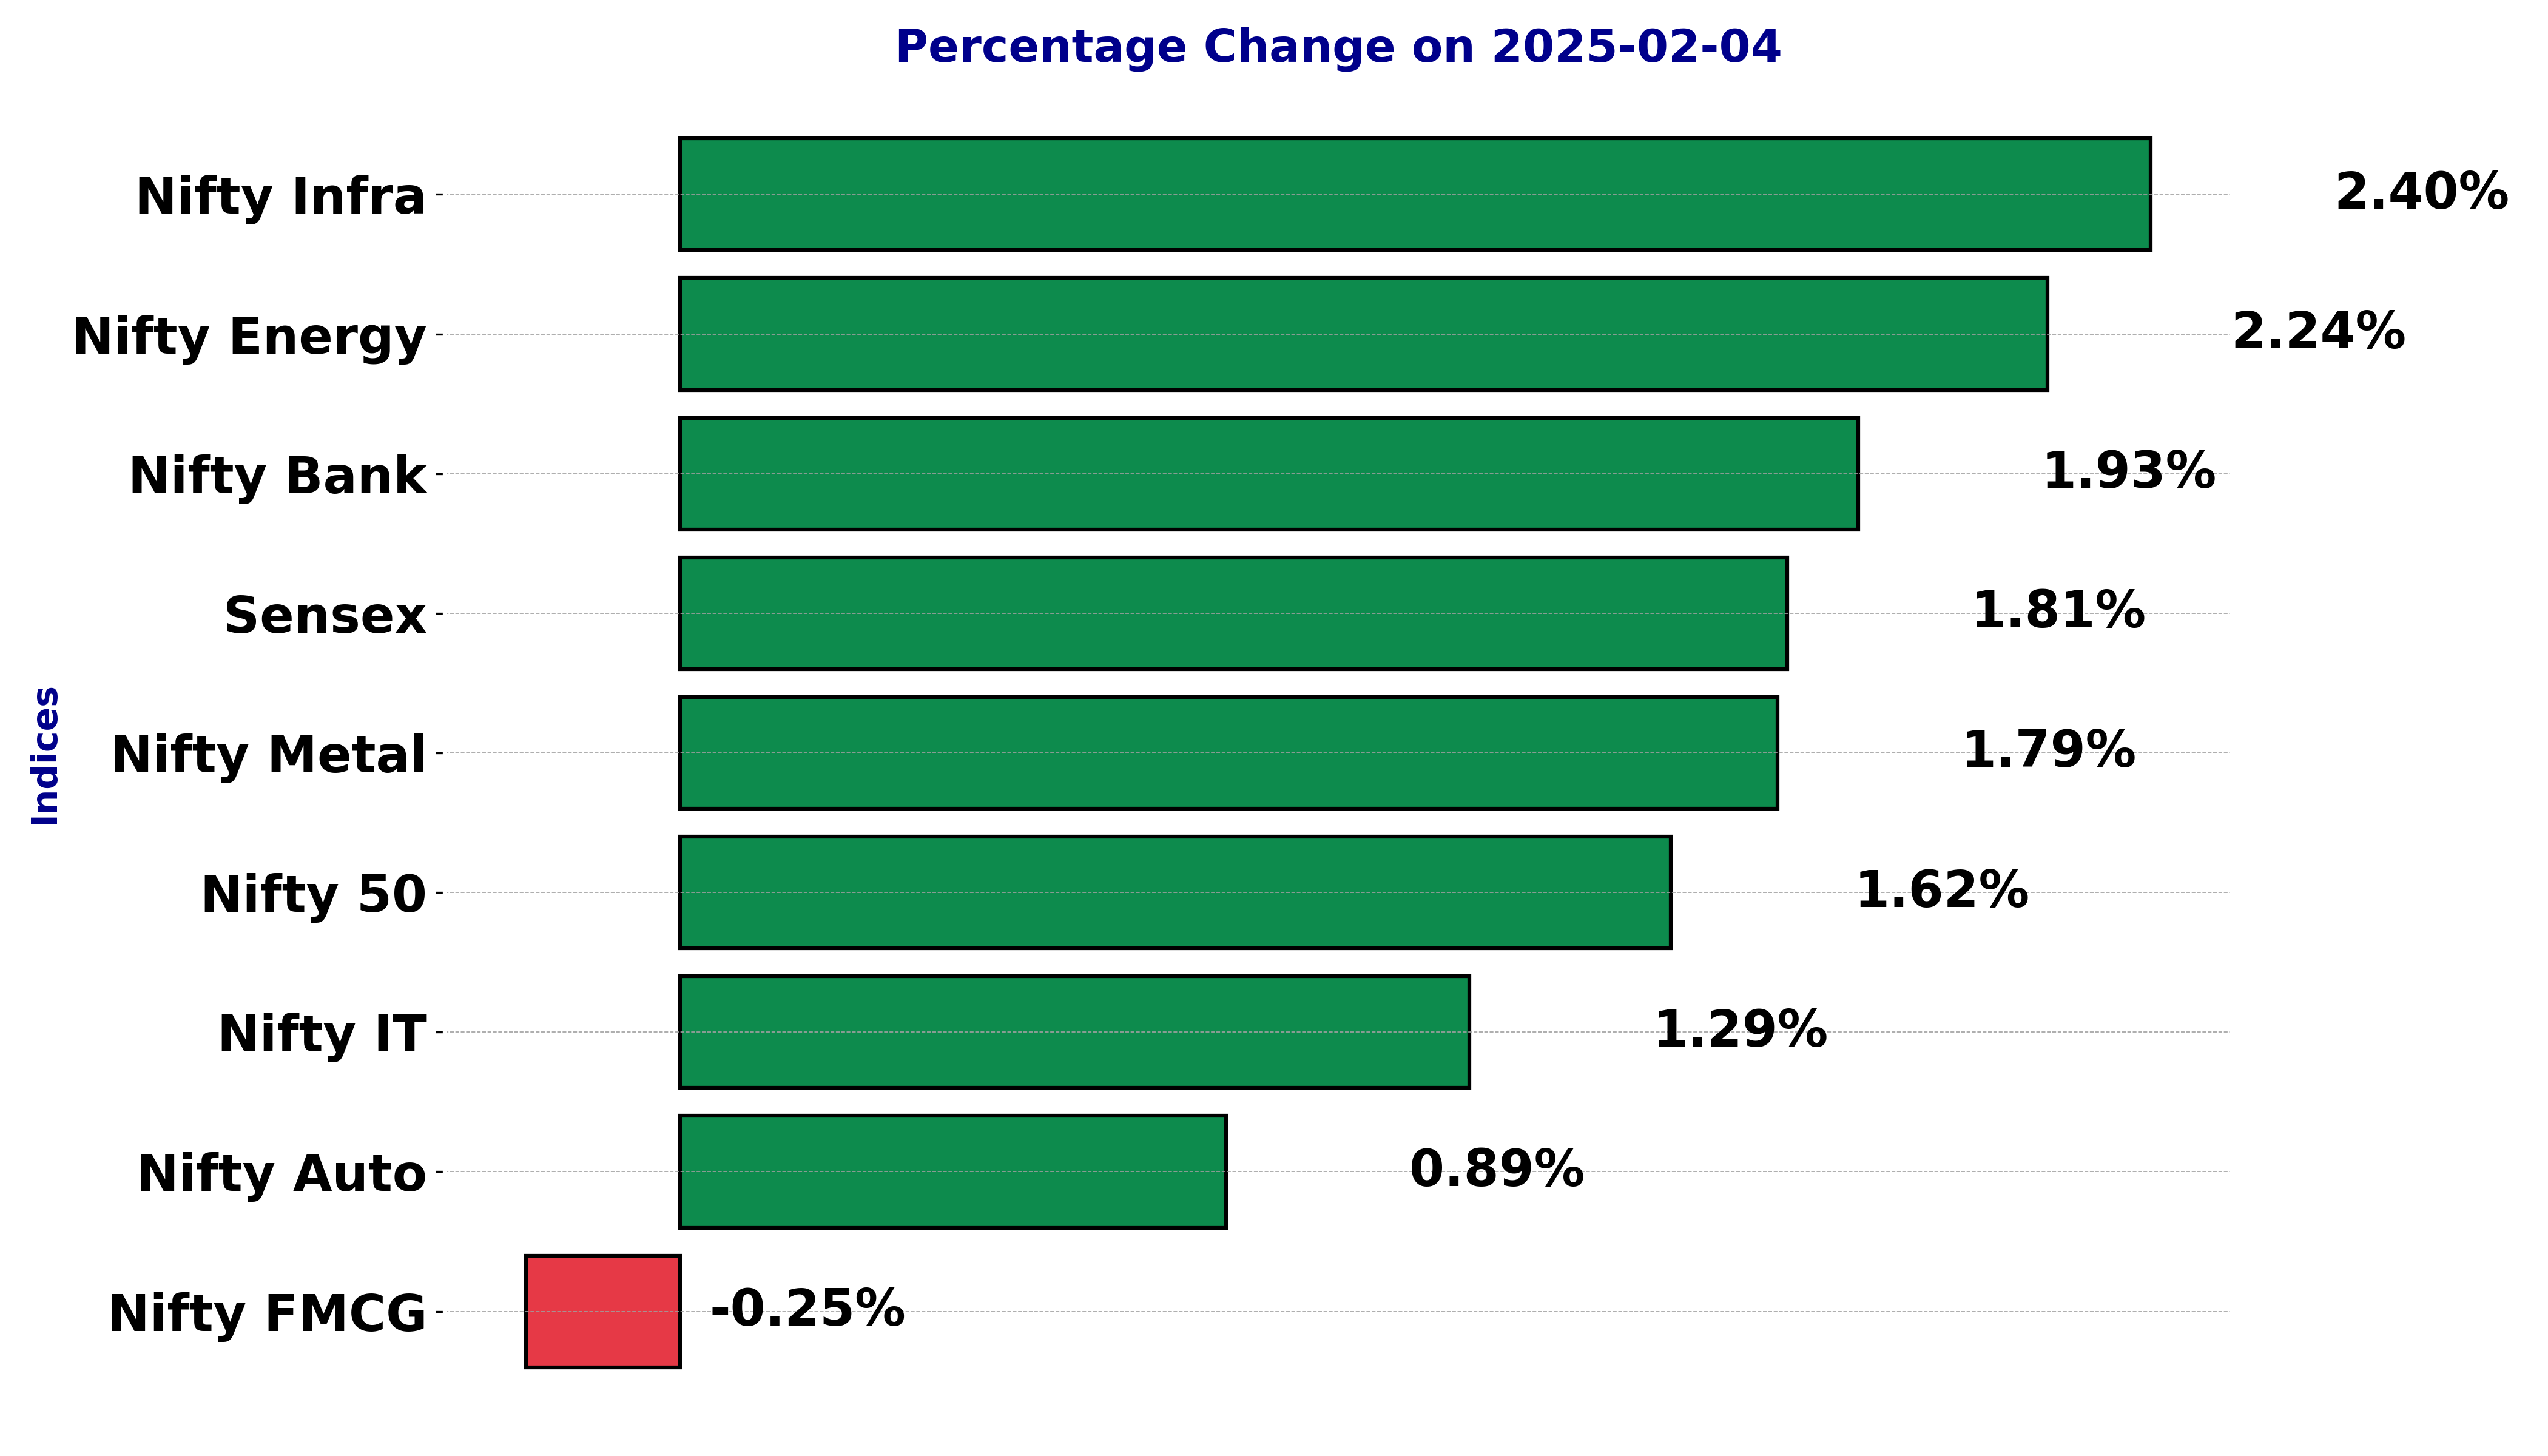
- Sensex soared by 1.81%.
- Nifty 50 stable at 1.62% gain.
- Mixed signals across indices.
Latest news

Putin hails Ukraine gains, threatens more, in annual press conference

OnePlus Pad Go 2 Review: No drama, just a good tablet

Parliament Moment: Priyanka Gandhi shares tea with Rajnath Singh. PM Modi and Om Birla

Cold wave deepens in Kashmir as Chillai-Kalan nears, temperatures dip below freezing

Pakistan accuses India of attempting to undermine Indus treaty

Vande Mataram discussion in UP legislature to mark 150th anniversary: Yogi Adityanath

Ashes 2025: Travis Head slams unbeaten 142 to crush England's Ashes hopes

Tipra Motha youth wing protests Bangladesh leader's anti-India remarks in Agartala
Indian Stock Market Sector-wise Performance: Which Sector is performed Well Today - February 04, 2025


The national stock market indices showed varied performances on February 04, 2025, reflecting the economic sentiment.
In this article, we analyze the performance of key national indices including the Nifty 50,Nifty Bank,Nifty IT,Nifty Auto,Nifty Pharma,Nifty FMCG,Nifty Infra,Nifty Energy and Nifty Metal.
Analysis for Sensex - February 04, 2025

**Sensex Performance:** The Sensex had a significant upward movement, closing at 78,583.81, which represents an increase of 1.81% from the previous close of 77,186.74. The index reached a high of 78,658.59 during the trading session, reflecting strong momentum. The 50-day EMA is above both the 10-day and 20-day EMAs, indicating a recent positive trend, while the RSI suggests the market is in a relative neutral to slightly bullish phase.

Relationship with Key Moving Averages
The closing value of the Sensex is above its 50-day EMA (78,134.91) and 200-day EMA (77,833.62), indicating a bullish trend. However, it is significantly higher than the 10-day EMA (77,077.61) and 20-day EMA (77,176.02), which could suggest a short-term overbought condition.
Moving Averages Trend (MACD)
The MACD value for Sensex is -328.24, which is higher than the MACD Signal of -632.86, indicating a potential bullish crossover. This suggests that the trend might be reversing to the upside.

RSI Analysis
Based on the given data, the RSI for Sensex is 57.96, indicating a neutral market sentiment. It suggests that the market is neither overbought nor oversold, potentially pointing to balanced trading conditions.

Analysis for Nifty Auto - February 04, 2025

**Nifty Auto Performance** Nifty Auto opened at 23,607.5 and closed at 23,535.05, reflecting a percentage change of 0.89% with a points increase of 208.05 from the previous close of 23,327. The index showed an upward trend with a high of 23,800.90 and a low of 23,366.90. The RSI indicates moderate strength at 59.92, and the MACD suggests a recovery trend, as it is moving towards the signal line.

Relationship with Key Moving Averages
The close price of Nifty Auto is above the 50 EMA and 200 EMA, indicating a bullish sentiment. However, it remains significantly above the 10 EMA and 20 EMA, which may suggest short-term upward momentum.
Moving Averages Trend (MACD)
The Nifty Auto index shows a MACD value of -57.20, which is less negative than the MACD Signal of -193.19. This indicates a potential upward momentum, as the MACD line is above the signal line. However, it is still in the negative zone, suggesting the upward movement may just be gaining strength.

RSI Analysis
The RSI value for Nifty Auto is 59.92, indicating that the index is in a neutral zone, neither overbought nor oversold. This suggests a balanced momentum and potentially stable trading activity. If the RSI moves above 70, it may signal overbought conditions, while a drop below 30 could indicate oversold conditions.

Analysis for Nifty Energy - February 04, 2025

Nifty Energy opened at 32,479.85 and closed at 32,896.70, showing a positive movement with a % change of approximately 2.24% and a points change of 719.30. The RSI is at 43.04, suggesting it is near the lower range, and the MACD is below the signal line, indicating bearish momentum. Despite closing higher, it remains below its 50 and 200 EMA, reflecting an overall bearish trend.

Relationship with Key Moving Averages
The Nifty Energy index closed at 32,896.70, which is below its 50 EMA and 200 EMA, indicating a potential bearish trend, but it's close to its 10 EMA, suggesting some recent upward momentum. The RSI is at 43.04, showing that the index is not in oversold territory but is leaning towards bearishness.
Moving Averages Trend (MACD)
The MACD for Nifty Energy is currently at -739.99, which is below the MACD Signal at -755.32, indicating a bearish momentum. The negative MACD value suggests that the stock is experiencing downward pressure and may continue in a bearish trend unless there's a reversal.

RSI Analysis
The RSI value for Nifty Energy is 43.04, indicating that the stock is in a neutral zone and not currently in an overbought or oversold condition. This level suggests relatively balanced momentum, with potential for either upward or downward movement.

Analysis for Nifty FMCG - February 04, 2025

Nifty FMCG opened at 57,701.85 and closed slightly lower at 57,274.70, showing a percentage change of -0.252%. The index experienced a decrease of 144.85 points. The 50-day EMA of 56,863.65 indicates a short-term average, while the 200-day EMA of 57,778.61 provides a long-term outlook. The RSI is at 59.22, suggesting mild buying pressure, and the MACD is -30.18, indicating a weak bearish momentum.

Relationship with Key Moving Averages
The Nifty FMCG closed at 57274.70, which is below its 200 EMA of 57778.61, indicating a potential bearish trend in a longer time frame. However, it remains above its 50 EMA of 56863.65 and significantly above the 10 and 20 EMA values, suggesting short-term bullishness.
Moving Averages Trend (MACD)
**MACD Analysis for Nifty FMCG:** The MACD is currently at -30.18, which is above the MACD Signal line at -248.77, suggesting a potential bullish reversal. This indicates that the recent momentum may be shifting towards the positive side, although the current MACD value is still negative, showing caution is advised.

RSI Analysis
The Relative Strength Index (RSI) for Nifty FMCG is currently at 59.22, suggesting that the stock is in a neutral zone, neither overbought nor oversold. Typically, an RSI above 70 indicates overbought conditions, while below 30 indicates oversold conditions, so Nifty FMCG is around its midpoint.

Analysis for Nifty Infra - February 04, 2025
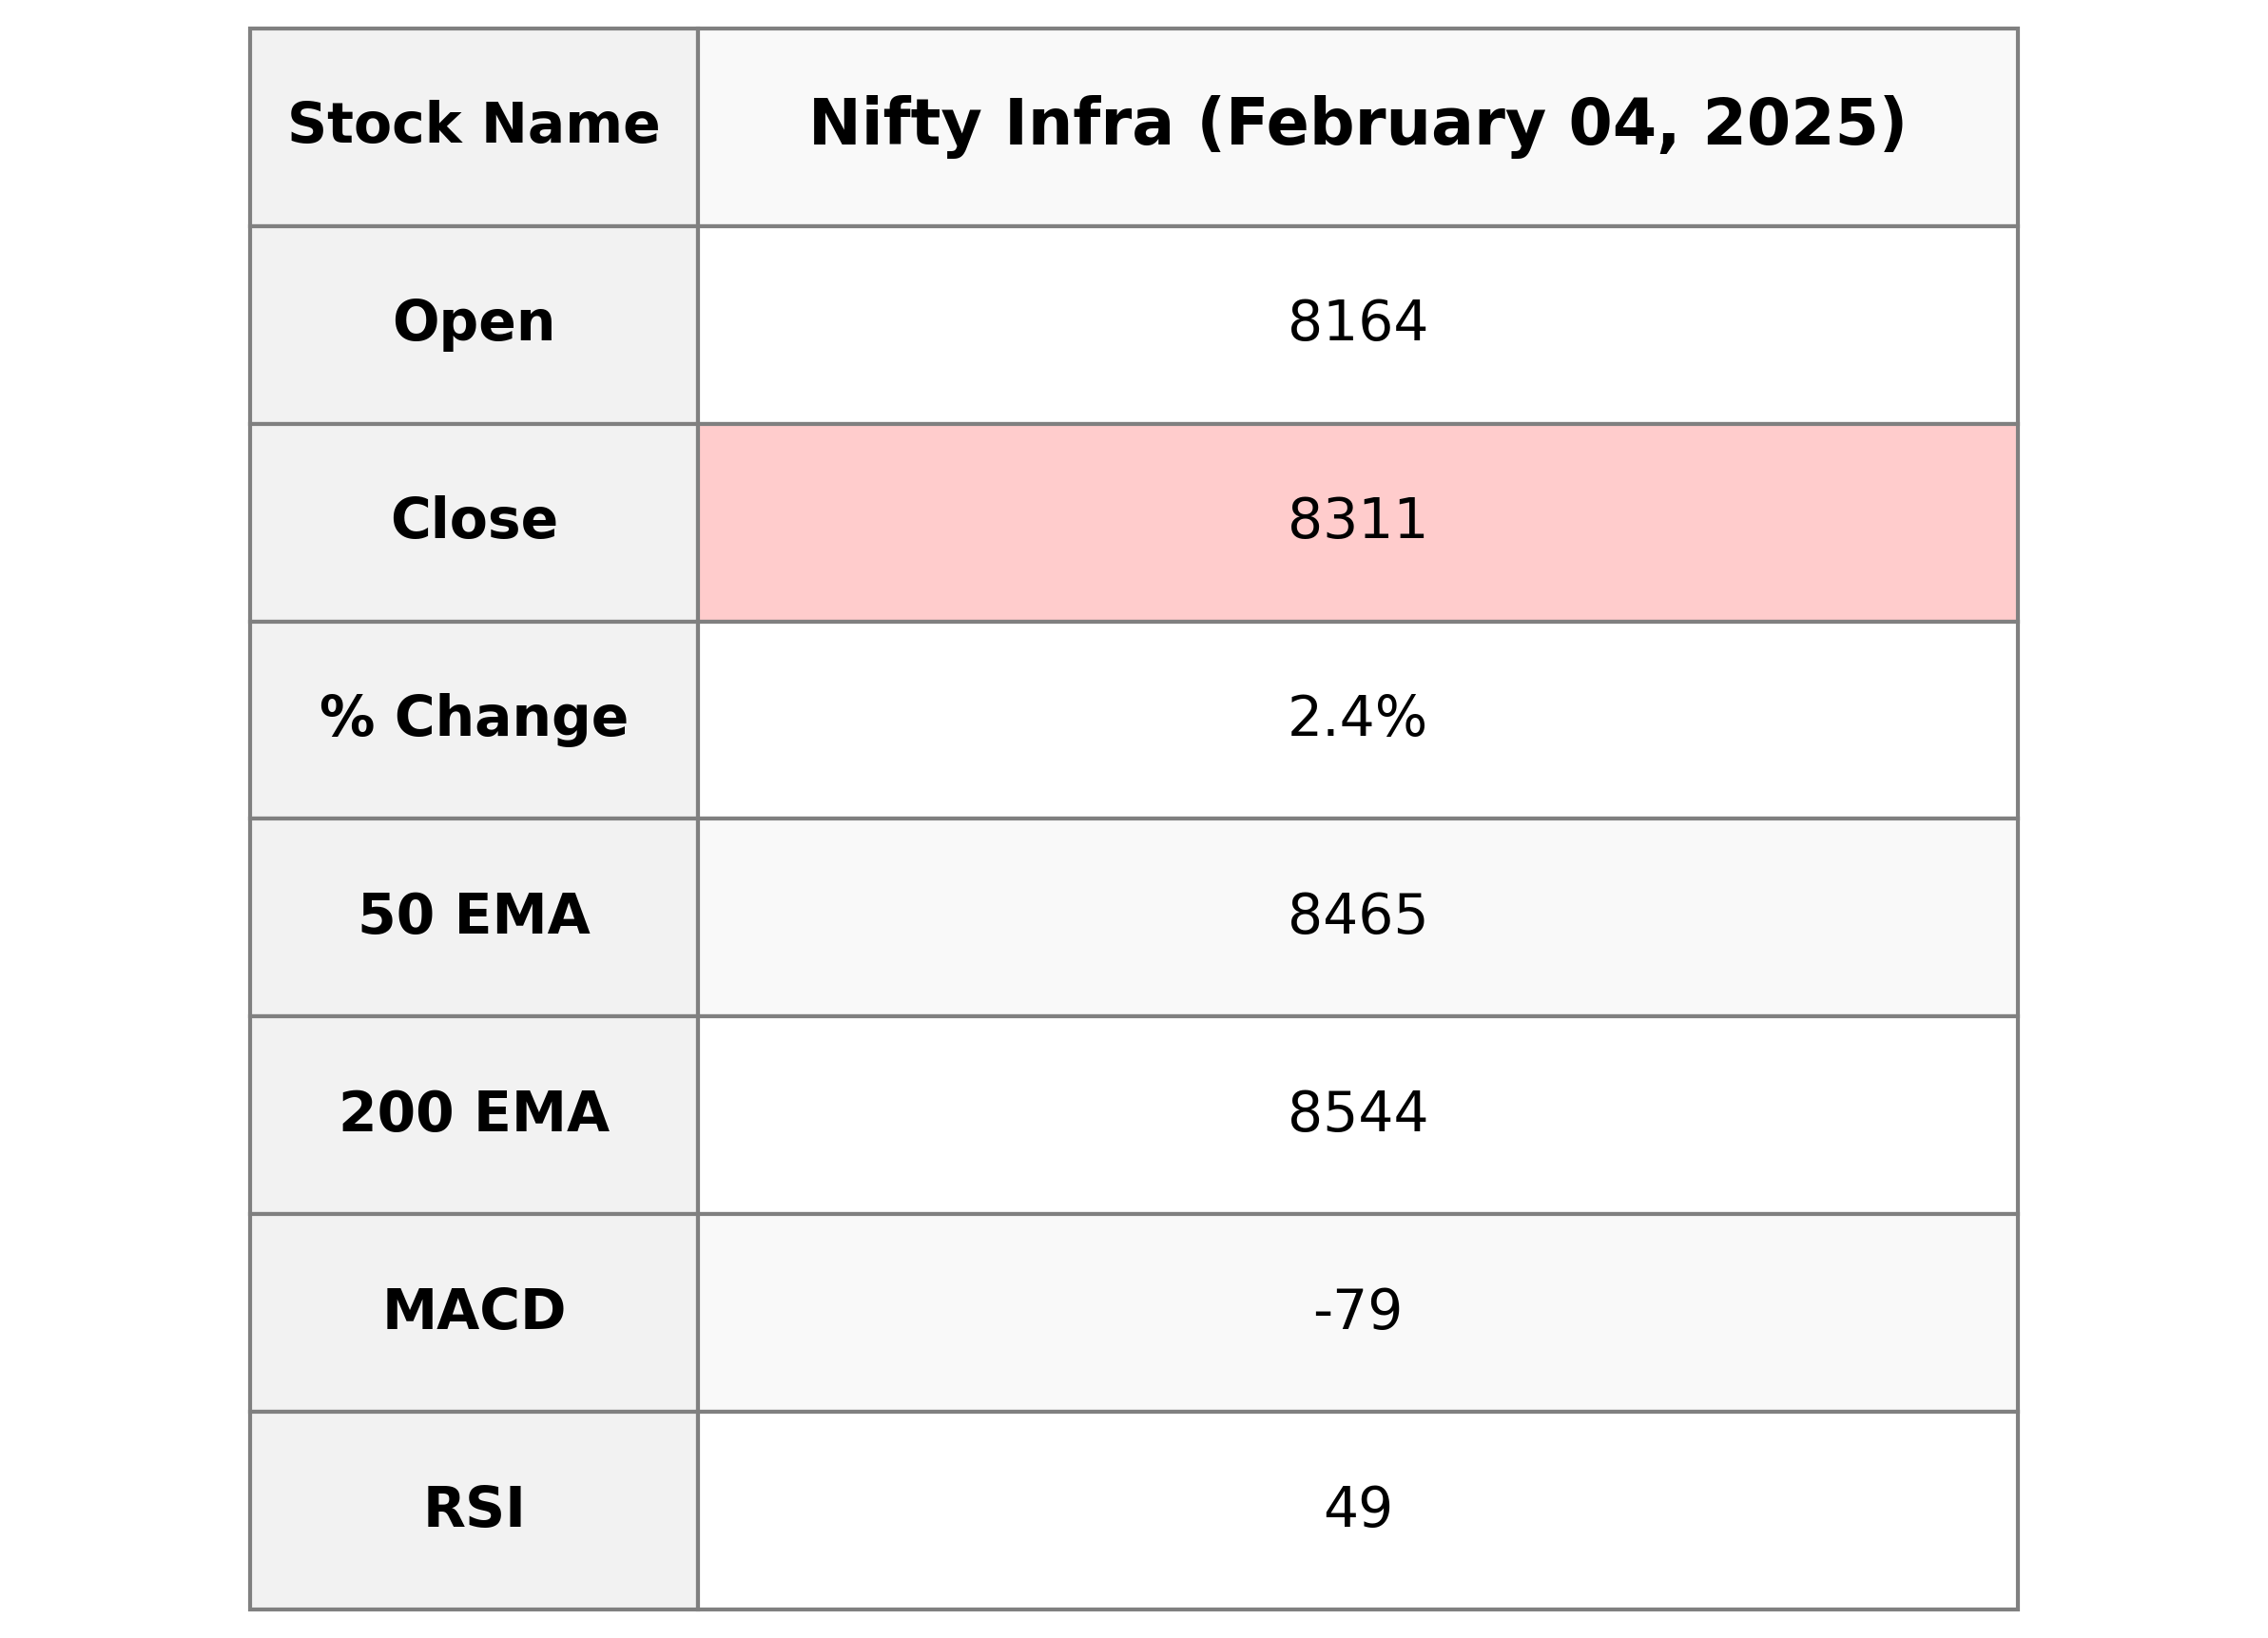
The Nifty Infra index showed a positive performance, closing at 8310.75 points, marking a 2.40% increase from its previous close of 8115.65. Despite the absence of market cap and PE ratio data, the index maintained a RSI of 49.04, indicating a neutral momentum, and the MACD suggests slightly bearish conditions, being below the signal line.

Relationship with Key Moving Averages
The Nifty Infra opened below its 10 EMA, 20 EMA, and 50 EMA but managed to close slightly above the 10 EMA, indicating a short-term bullish move. However, it remains significantly below both the 50 EMA and the 200 EMA, suggesting a continued longer-term bearish trend.
Moving Averages Trend (MACD)
Nifty Infra's MACD value is -78.69, indicating a bearish trend, as it is below the signal line of -94.09. This suggests a potential downtrend, but with the MACD moving closer to the signal line, a convergence or reversal might be possible.

RSI Analysis
The Relative Strength Index (RSI) for Nifty Infra is 49.04, which suggests a neutral stance as it is close to the midpoint of 50. This indicates that the index is neither overbought nor oversold, implying a balanced sentiment in its recent price movements.

Analysis for Nifty IT - February 04, 2025

Nifty IT opened at 42,642.75 and closed higher at 42,860.20, marking a percentage change of 1.29% with a points gain of 545.95. The RSI value indicates a neutral stance, while the MACD is negative showing a potential bearish trend. The volume for the day was zero, suggesting no significant trading activity.

Relationship with Key Moving Averages
The closing price of Nifty IT is 42860.20, which is below its 50-day EMA of 43103.08, indicating potential resistance or bearish trend pressure. However, it is above the 10-day EMA of 42640.91 and close to the 20-day EMA of 42870.75, suggesting near-term support and a relatively stable market sentiment.
Moving Averages Trend (MACD)
Based on the given data, Nifty IT has a MACD value of -306.55, which is above the MACD Signal of -329.55, indicating a potential bullish momentum. Although the MACD is negative, the recent positive % change suggests the momentum may be shifting upwards.

RSI Analysis
The RSI value for Nifty IT is approximately 49.00, indicating a neutral trend in the market. This suggests that the index is neither overbought nor oversold, and there may not be a strong momentum in either direction at present. It is important to watch for any changes in RSI that could signal a shift in market conditions.

Analysis for Nifty Metal - February 04, 2025
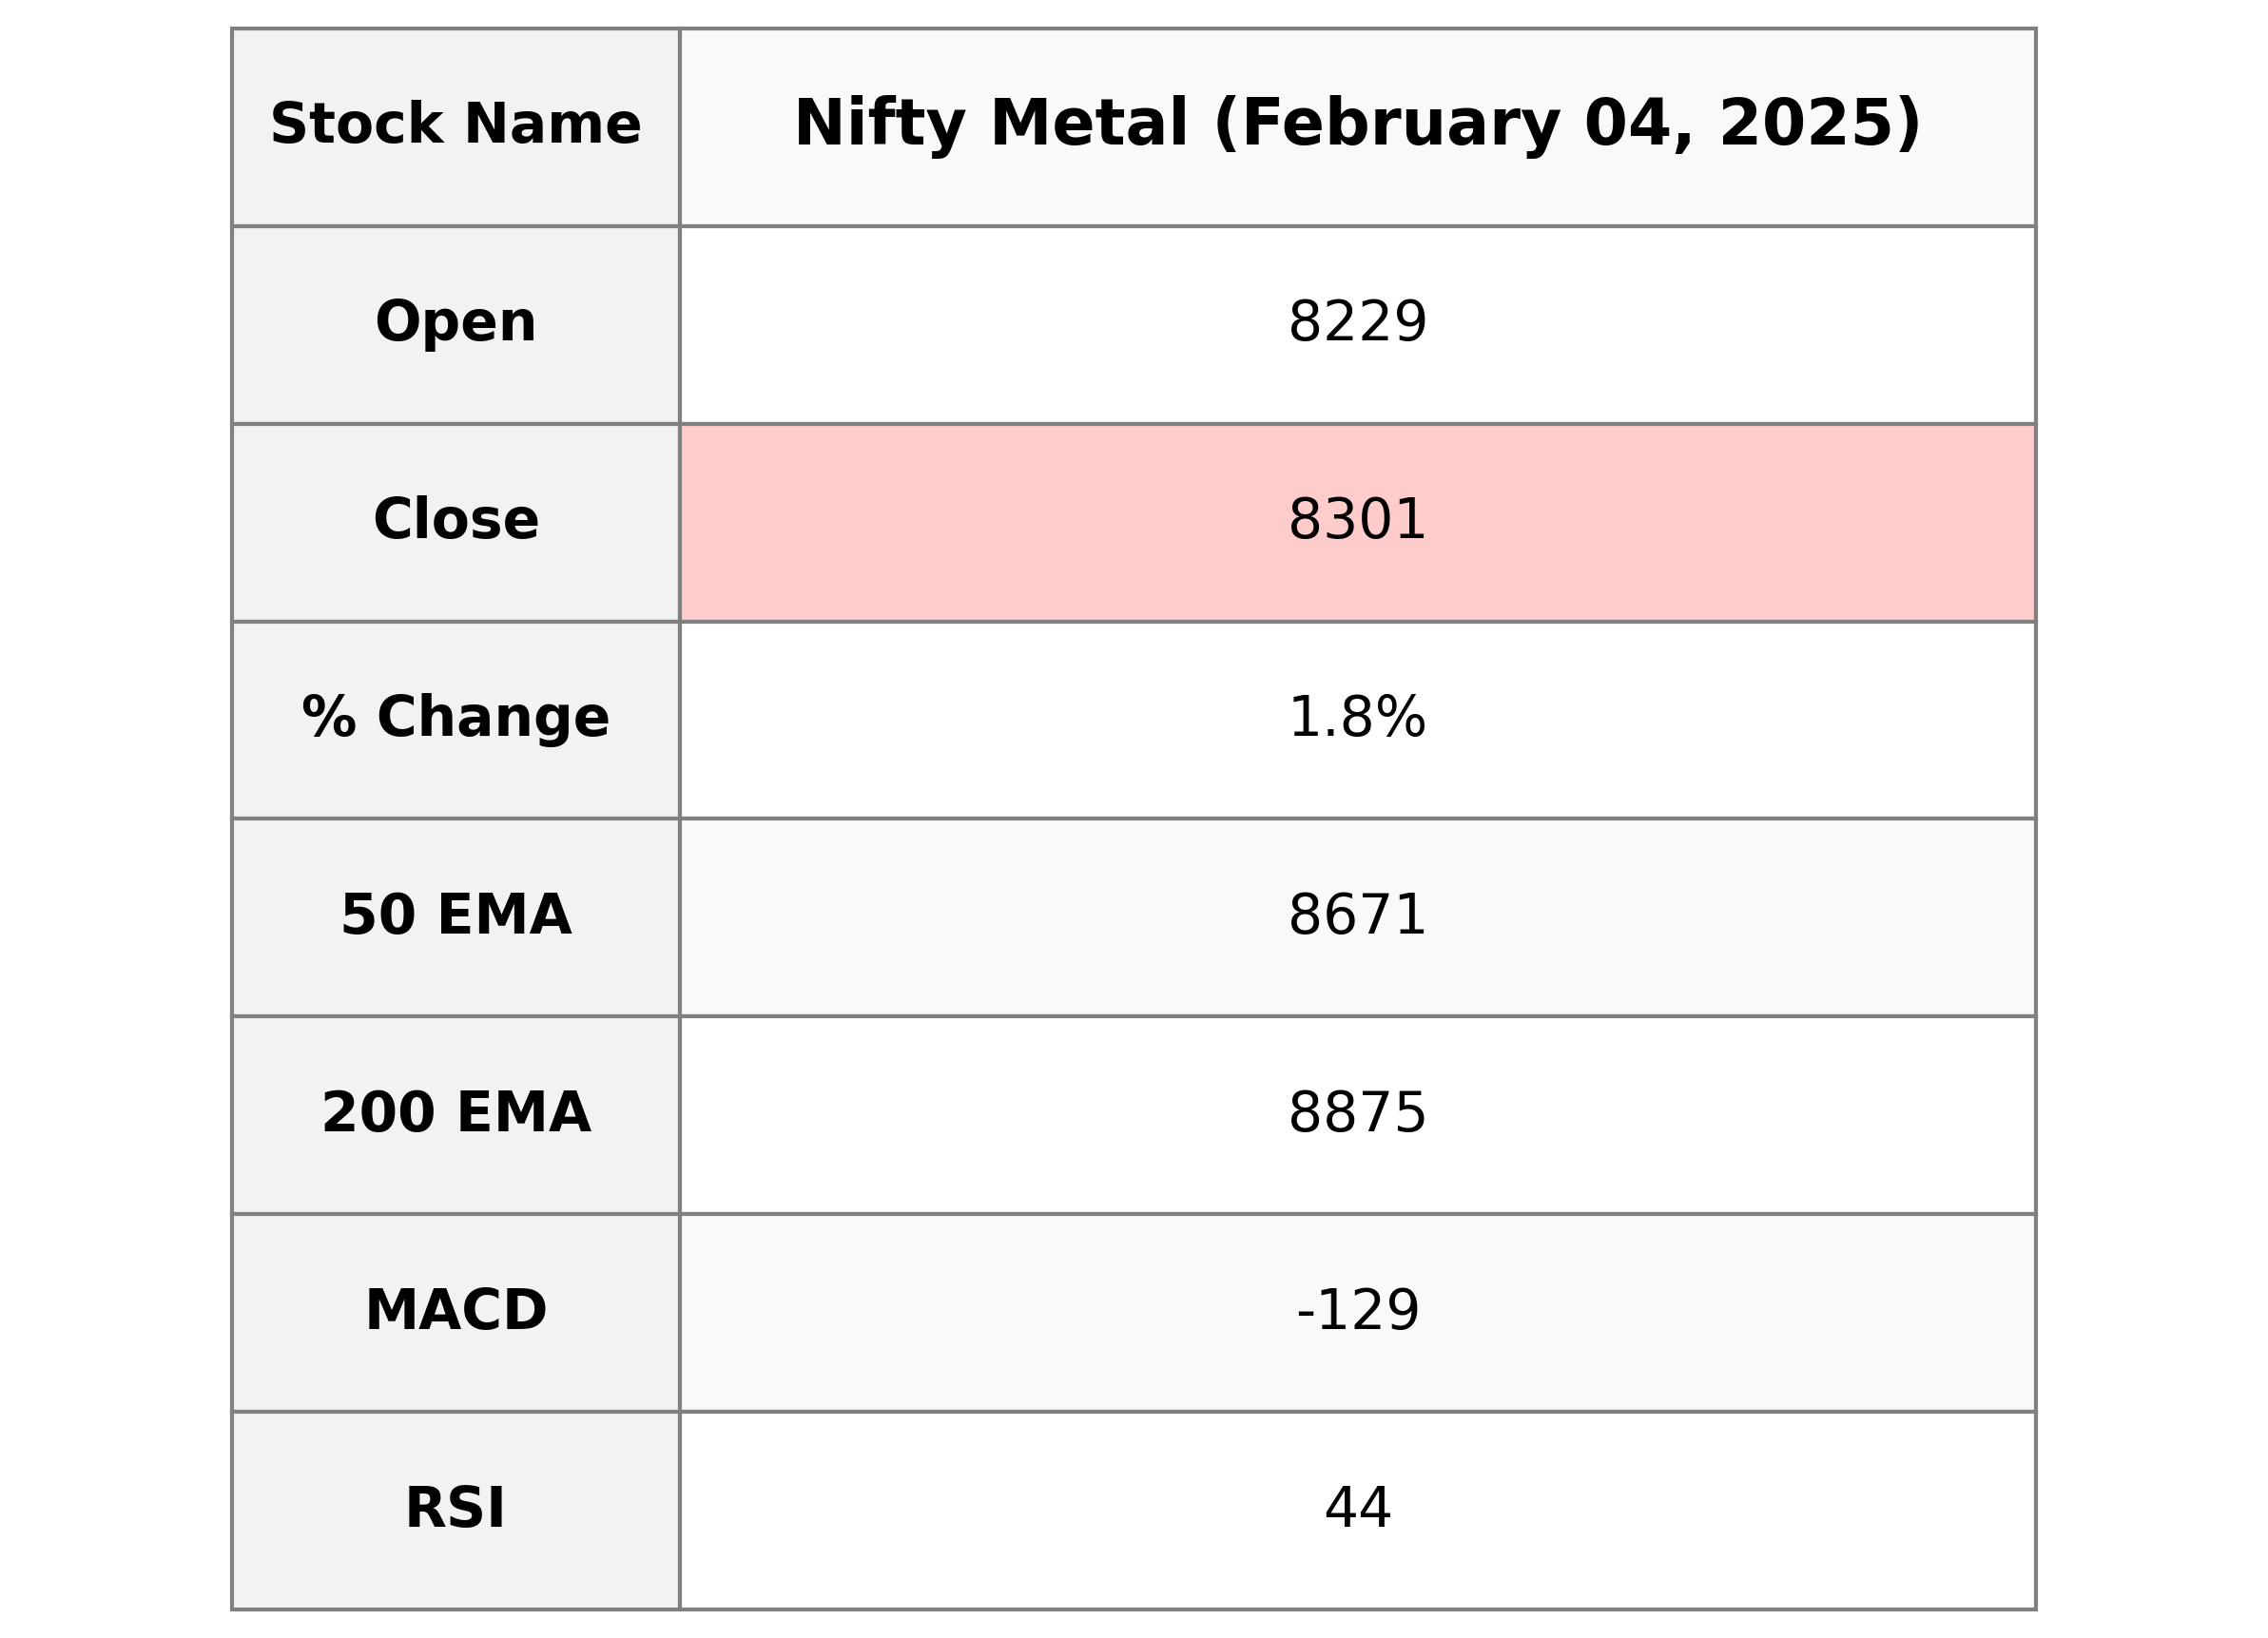
**Nifty Metal Performance Description:** On the given day, Nifty Metal opened at 8229.15, reached a high of 8358.65, and closed at 8301.45, marking a 1.79% increase from the previous close of 8155.15. The technical indicators show a 10 EMA of 8317.81, suggesting it's slightly above the current closing price, while the RSI stands at 44.31, indicating relatively weak momentum.

Relationship with Key Moving Averages
The Nifty Metal index closed at 8301.45, which is below its 50 EMA of 8671.28 and 200 EMA of 8874.65, indicating a bearish trend. However, it is slightly below its 10 EMA of 8317.81, suggesting short-term consolidation or potential support around the current level.
Moving Averages Trend (MACD)
Based on the provided data, Nifty Metal's MACD is -129.39 and the MACD Signal is -141.97, indicating a possible bearish trend as the MACD is below the signal line. This suggests that the momentum might be negative, but the convergence towards the signal line could hint at a potential reversal if the trend continues.

RSI Analysis
The RSI for Nifty Metal is 44.31, indicating it is in the neutral zone and not currently overbought or oversold. This suggests that the index may not be experiencing strong upward or downward momentum at the moment.

Analysis for Nifty Bank - February 04, 2025

The Nifty Bank index opened at 49,538.80 and closed at 50,157.95, marking a percentage change of approximately 1.93% with a points increase of 947.40 from its previous close. The RSI is at 54.60, indicating a neutral momentum, while the MACD is -336.12, suggesting a possible bearish trend. The volume recorded is zero, and the 50-day EMA is slightly above the closing price, demonstrating recent market activity around these levels.

Relationship with Key Moving Averages
Nifty Bank closed at 50157.95, slightly below the 50-day EMA of 50226.57 and the 200-day EMA of 50214.66, indicating potential near-term resistance around these levels. However, it is significantly above the 10-day EMA of 49266.86 and the 20-day EMA of 49395.61, suggesting a recent uptrend.
Moving Averages Trend (MACD)
The MACD for Nifty Bank is -336.12, with a MACD Signal of -581.95, indicating a potential bullish crossover or trend reversal. This suggests the possibility of upward momentum as the MACD is above the signal line.

RSI Analysis
The current RSI for Nifty Bank is 54.60, indicating a neutral position. Typically, an RSI above 70 suggests overbought conditions, while below 30 suggests oversold conditions; therefore, at 54.60, there might not be any significant momentum in either direction. Further analysis with other indicators could provide more insight.

Analysis for Nifty 50 - February 04, 2025

The Nifty 50 index opened at 23,509.90, reached a high of 23,762.75, and closed at 23,739.25, showing a percentage change of 1.62% and a points change of 378.20. The Relative Strength Index (RSI) is at 56.67, indicating a moderately strong market. The Moving Average Convergence Divergence (MACD) is -100.58 compared to the MACD Signal of -187.43, suggesting a bullish trend.

Relationship with Key Moving Averages
The Nifty 50 closed above its 50 EMA and 200 EMA, indicating a bullish sentiment as it surpasses these key moving averages, suggesting potential upward momentum. However, it remains higher than the 10 EMA and 20 EMA as well, reflecting shorter-term bullish trends.
Moving Averages Trend (MACD)
The MACD value for Nifty 50 is -100.58, which is above the MACD Signal of -187.43. This indicates a potential bullish signal, suggesting that the price momentum might be improving from the previous trend. However, given that both values are negative, the overall trend may still be bearish.

RSI Analysis
The RSI value for Nifty 50 is 56.67, indicating a neutral position, as it is neither in overbought territory (above 70) nor in oversold territory (below 30). This suggests that the index is currently stable without strong momentum in either direction.

Up Next
Indian Stock Market Sector-wise Performance: Which Sector is performed Well Today - February 04, 2025

Rupee breaches 91-mark against US dollar for first time in intra-day trade

Microsoft commits USD 17.5 billion investment in India: CEO Satya Nadella

CBI books Anil Ambani's son, Reliance Home Finance Ltd. in Rs 228 crore bank fraud case

RBI raises FY26 GDP growth projection to 7.3 pc

RBI trims policy interest rate by 25bps to 5.25pc, loans to get cheaper

More videos

Rupee slumps to all-time low of 90.25 against US dollar in intra-day trade

Reliance completes merger of Star Television Productions with Jiostar

India to lead emerging market growth with 7pc GDP rise in 2025: Moody’s

Nifty hits record high after 14 months; Sensex nears all-time peak

Reliance stops Russian oil use at its only-for-export refinery to comply with EU sanctions

ED attaches fresh assets worth over Rs 1,400 cr in case against Anil Ambani's Reliance Group

India signs one-year deal to import 2.2 million tonnes of LPG from US

India International Trade Fair begins at Pragati Maidan amid tight security

Stock markets decline in initial trade on foreign fund outflows, weak Asian peers

Amazon to lay off 30,000 office workers amid AI-driven cost cuts