


Highlights
- Nifty Bank sees the highest surge with a 2.50% rise
- Nifty Auto and Nifty Metal follow at 2.48% and 2.28%, respectively
- Nifty IT experiences a moderate gain of 1.70%
Latest news

Samsung Galaxy Z Fold 8, Fold 8 Ultra & Z Flip 8: A More Mature Foldable Family

Dell Launches New Alienware 16X Aurora, 16 Area-51 and 18 Area-51 Gaming Laptops in India

Samsung Takes on Premium Home Audio With New Music Studio Series

The End of OxygenOS: OnePlus Confirms Shift to Oppo's ColorOS

Fujifilm Instax Mini Evo Cinema Review: A Hybrid Camera That Prints Memories Differently

iQOO Teases Z11 Lite With AI Tools, Military-Grade Durability and a 6500mAh Battery

Editorji Launches Hook Global, Its International Digital News Brand

Samsung's Bespoke AI ACs Focus on Humidity, Hygiene and Smarter Cooling
Indian stock market sector-wise performance today - April 22, 2025


The stock market on Tuesday (22 April, 2025) exhibited a blend of subtle shifts and notable movements across various sectors, with some sectors witnessing remarkable changes.
The Sensex, one of the prominent indices, saw a slight increase of 0.24% as it closed at 79,595.59, up by 187.09 points from its previous close of 79,408.5.
Despite being a modest rise, it underscored a relatively stable day for the market overall.
In stark contrast, the Auto sector represented by the Nifty Auto index experienced a significant surge, escalating by 2.48% with a closure at 21,903.70. This marked a substantial gain of 530.60 points from the previous close.
Factors such as robust domestic demand and potential incentives for electric vehicle manufacturers might have contributed to the optimism in this sector.
The Energy sector, tracked by the Nifty Energy index, also recorded a notable increase of 2.13%, closing at 34,516.35. The upward movement might be influenced by rising oil prices and positive revisions in crude demand projections, indicating a favorable environment for energy stocks.
Meanwhile, the Nifty FMCG index climbed by 0.92%, closing at 57,193.80, reflecting a continuous consumer demand momentum. Similarly, the Nifty Infra index rose by 0.62%, indicating resilience as it ended the day at 8,686.00.
The IT sector, monitored by the Nifty IT index, rose by 1.70%, closing at 33,941.05. Despite a challenging global tech environment, this uptick might be attributed to a favorable sentiment around upcoming tech earnings.
In the Metal sector, represented by the Nifty Metal index, a considerable increase of 2.28% was observed, closing the session at 8,669.50. This improvement can be attributed to enhanced global metal prices and increasing domestic infrastructure spending.
The Banking sector, depicted by the Nifty Bank index, demonstrated robust growth as well, with a surge of 2.50%, closing at 55,647.20. This prosperity in the banking index signifies increased market confidence, potentially driven by optimistic economic outlooks and positive banking reforms.
Lastly, the Nifty 50 index experienced a minimal growth of 0.17%, closing at 24,167.25, reflecting a steady investor sentiment across the broad market. Among these, the Auto sector stood out with the most pronounced gain of 2.48%, driven primarily by an uptick in consumer sentiment and potential policy incentives supporting manufacturing and innovation within the automotive industry.
Overall, the market portrayed a blend of resilience and strategic sector advancements, with the Auto sector paving the way for an optimistic trajectory.

Analysis for Sensex - April 22, 2025

Sensex Performance The Sensex opened at 79,728.39 and closed at 79,595.59, showing a positive change of 0.24% with a points increase of 187.09. The current RSI is 66.38, indicating a relatively strong performance, while the MACD at 688.47 suggests bullish momentum above its signal line.

Relationship with Key Moving Averages
The Sensex closed at 79,595.59, which is significantly above its 50 EMA of 76,361.20 and its 200 EMA of 77,079.38. This suggests a strong upward trend as the current price is well above both short-term and long-term moving averages.
Moving Averages Trend (MACD)
Based on the given data for the Sensex, the MACD value is considerably higher than the MACD Signal, indicating a bullish momentum in the stock. This suggests that the Sensex may continue an upward trend in the near term if other conditions remain stable.

RSI Analysis
The current Relative Strength Index (RSI) of Sensex is 66.38, indicating that the index is approaching overbought territory, as RSI levels above 70 generally suggest overbought conditions. Investors might consider this as a sign of potential caution, anticipating possible market consolidation or correction if the RSI continues to rise.

Analysis for Nifty Auto - April 22, 2025

Nifty Auto opened at 21,837.05, reaching a high of 21,957.70 and a low of 21,729.80, before closing at 21,903.70. This represents a significant gain from the previous close of 21,373.10, with a 2.48% change and an increase of 530.60 points. The 50-day EMA is at 21,500.67, and the RSI at 59.59 suggests moderate strength.

Relationship with Key Moving Averages
The Nifty Auto index closed at 21,903.70, which is above its 50-day EMA of 21,500.67 and significantly higher than both its 10-day EMA of 21,114.72 and 20-day EMA of 21,105.89. This suggests current bullish momentum. However, it remains below the 200-day EMA at 22,542.53, indicating longer-term resistance.
Moving Averages Trend (MACD)
The MACD value for Nifty Auto is -66.79, while the MACD Signal is -184.66. This indicates a bullish crossover, as the MACD is higher than the signal line, suggesting potential upward momentum in the near term.

RSI Analysis
The RSI for Nifty Auto is 59.59, which indicates a neutral to slightly bullish momentum as it is approaching the overbought threshold of 70. This suggests that the stock is gaining strength, but it is still within a balanced range, offering potential for further gains or a consolidation before deciding the next trend.

Analysis for Nifty Energy - April 22, 2025

Nifty Energy Performance: Nifty Energy opened at 34,770.05, reached a high of 34,812.90, and closed at 34,516.35. It showed a positive change of 2.13% from the previous close of 33,797.50, with a gain of 718.85 points. The RSI at 64.22 indicates relatively strong momentum, and the MACD suggests a bullish trend with a MACD value of 334.05 against a signal of 204.99.

Relationship with Key Moving Averages
The Nifty Energy index closed at 34,516.35, which is above its 50-day EMA of 32,866.63 and 10-day EMA of 33,199.78, suggesting short-term bullish momentum. However, it remains below the 200-day EMA of 35,552.37, indicating longer-term bearish pressure still persists.
Moving Averages Trend (MACD)
The Nifty Energy index shows strong bullish momentum, as indicated by the MACD (334.05) being significantly above the MACD Signal (205.00). The positive MACD value, coupled with the relatively high RSI of 64.22, suggests continued upward momentum in the near term.

RSI Analysis
RSI (Relative Strength Index) for Nifty Energy is at 64.22, indicating a moderately strong momentum in the current trend. As it's below the typical overbought threshold of 70, this suggests the index is neither overbought nor oversold, signaling potential for continued movement in the current trend direction.

Analysis for Nifty FMCG - April 22, 2025

Nifty FMCG opened at 56,471.0 and closed at 57,193.8, showing a positive change of 0.92% or 519.60 points. The index experienced a high of 57,282.2 and a low of 56,263.6. Notably, the RSI of 77.75 indicates that the index might be in overbought territory.
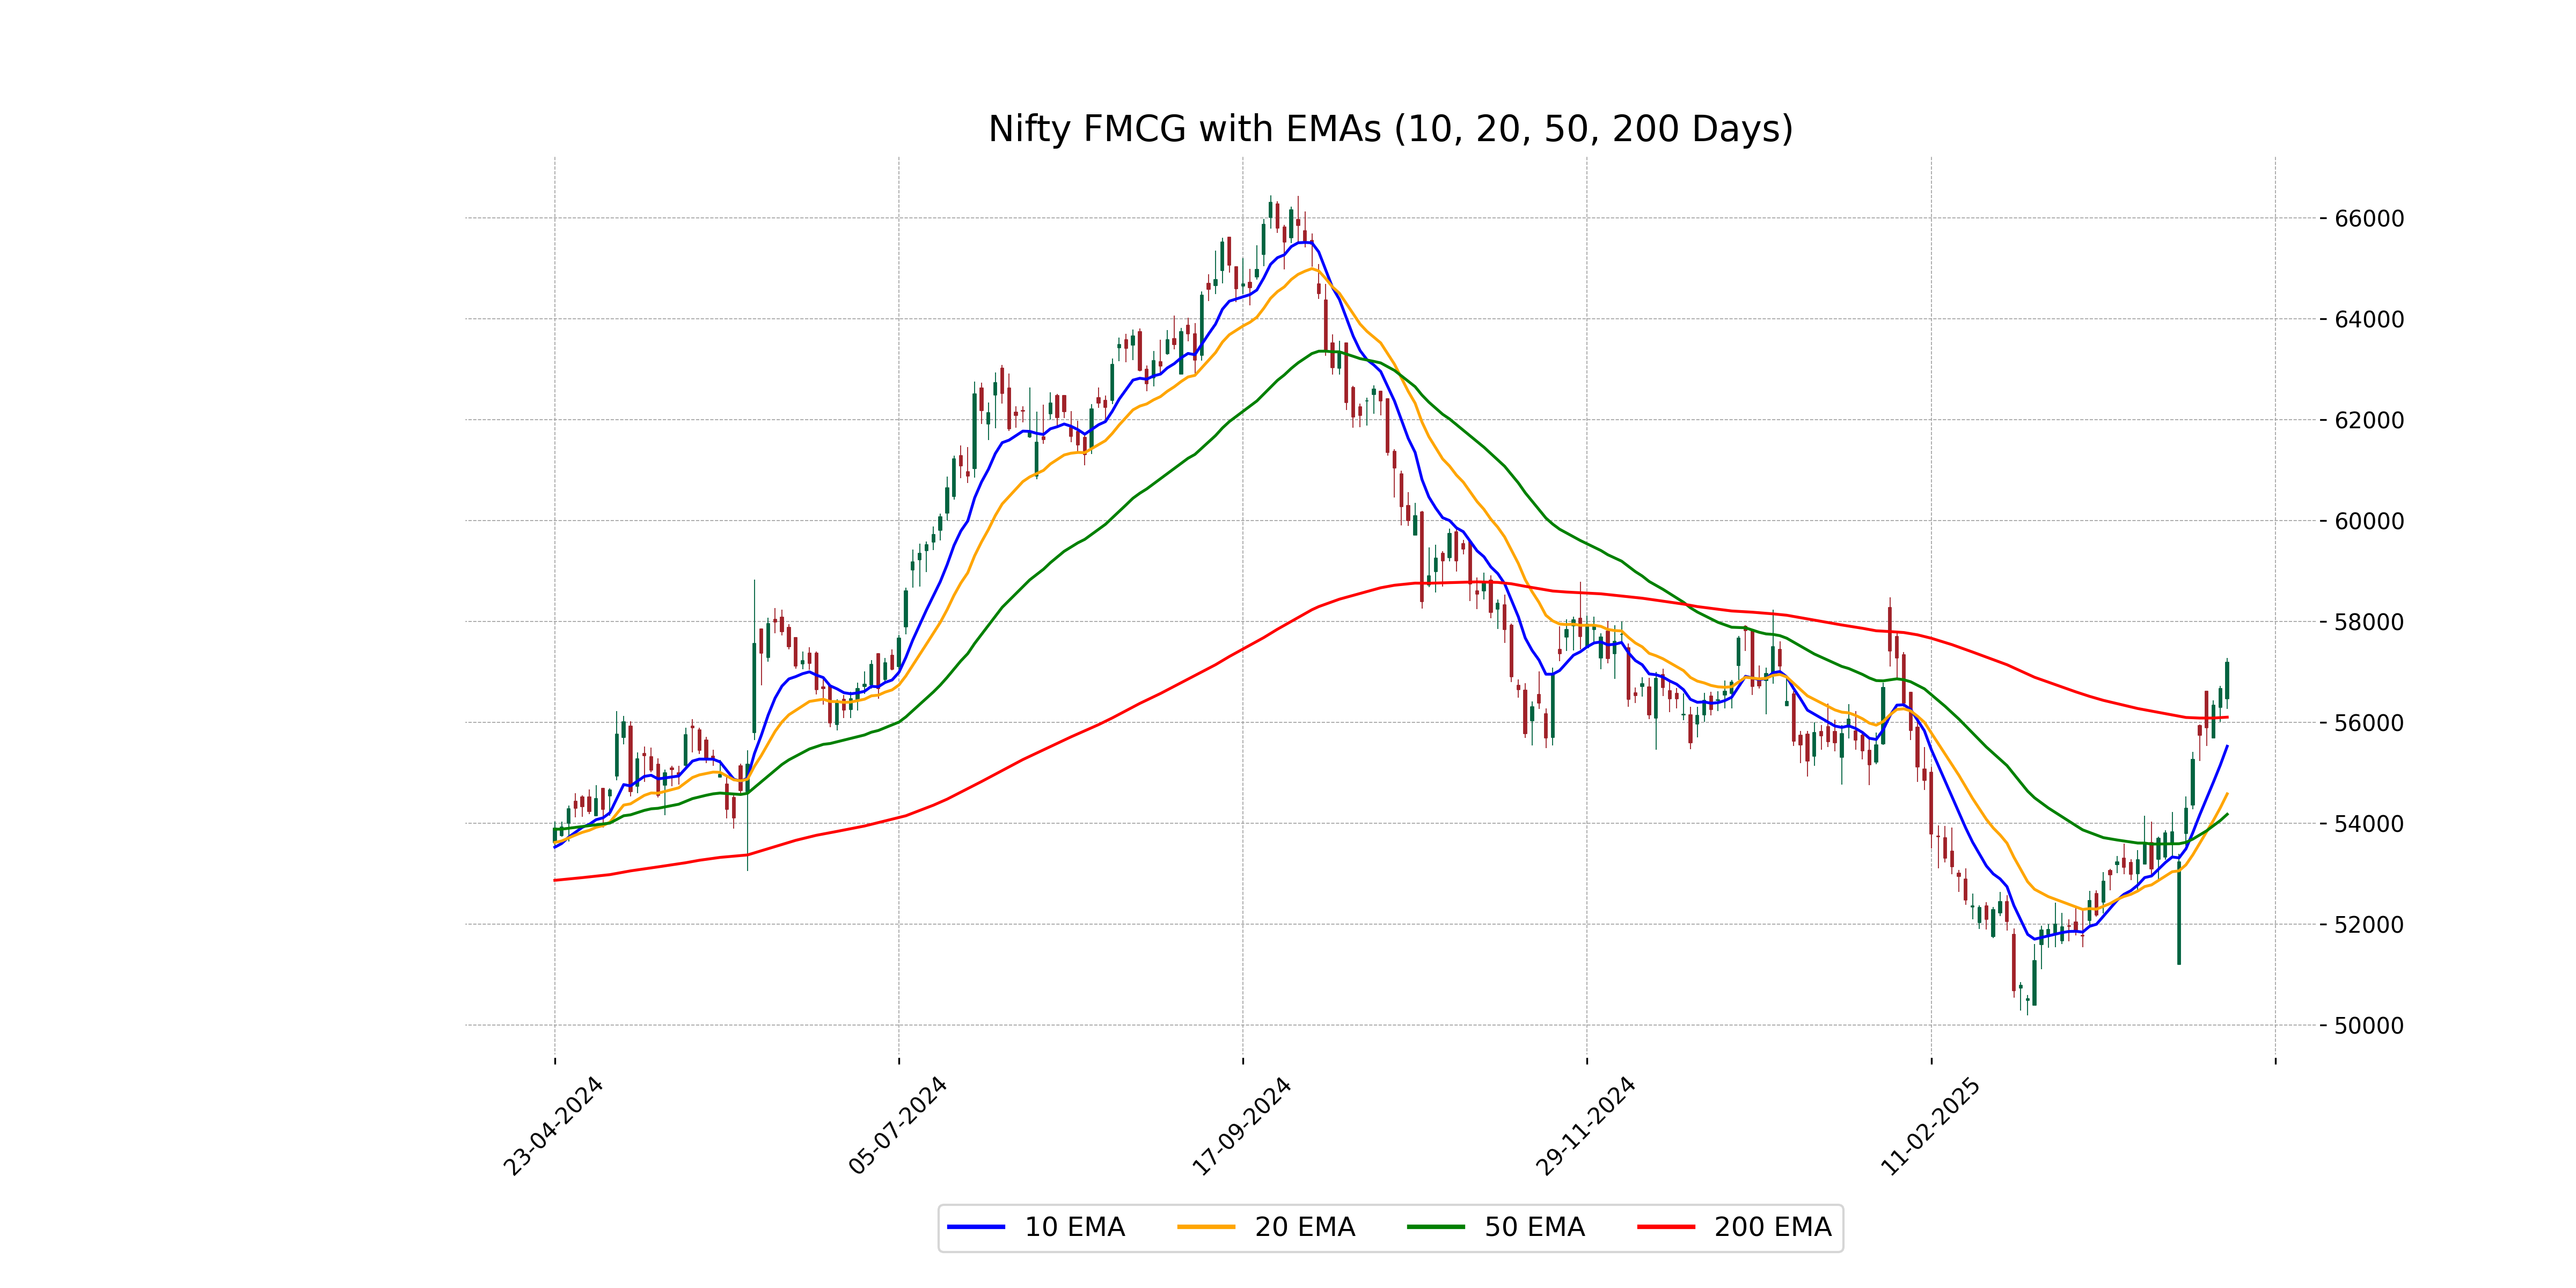
Relationship with Key Moving Averages
Nifty FMCG closed at 57193.80, which is above both its 50 EMA of 54179.94 and 200 EMA of 56103.68, indicating a bullish trend. Additionally, the current price is significantly higher than the 10 EMA of 55527.67 and 20 EMA of 54584.69, reinforcing short-term bullish sentiment.
Moving Averages Trend (MACD)
- MACD Value: The MACD is at 971.50, which is significantly above the MACD Signal line at 571.46, indicating a strong bullish momentum for Nifty FMCG. - Trend Indication: The rising MACD suggests an uptrend in the stock's price movement, supported by a positive crossover from the signal line.

RSI Analysis
The RSI for Nifty FMCG is 77.75, indicating that the stock is in the overbought zone. Values above 70 typically suggest that a security is overbought and could potentially see a price decline or correction in the near future. However, it's essential to consider other factors and indicators before making any trading decisions.

Analysis for Nifty Infra - April 22, 2025

Nifty Infra opened at 8747.55 and closed at 8686.0, showing a percentage change of 0.62% with a points change of 53.20. The Relative Strength Index (RSI) stands at 65.73, indicating a bullish sentiment, as it is higher than 50. The Moving Average Convergence Divergence (MACD) is also positive at 101.54 compared to the MACD Signal of 69.31, suggesting potential upward momentum.

Relationship with Key Moving Averages
The closing price of Nifty Infra at 8686.0 is above its 50-day EMA of 8260.06, 200-day EMA of 8399.08, 10-day EMA of 8423.20, and 20-day EMA of 8332.91. This suggests a bullish trend with the price currently trending above all the key moving averages.
Moving Averages Trend (MACD)
MACD Analysis for Nifty Infra: The MACD value of 101.54, being above the MACD Signal line at 69.31, indicates a bullish momentum for Nifty Infra. This suggests stronger buying pressure currently in the market.

RSI Analysis
Based on the data provided, the Relative Strength Index (RSI) for Nifty Infra is 65.73. An RSI value of 65.73 indicates that the stock is approaching the overbought territory, suggesting that there might be some buying pressure, but it is not yet at an extreme level typically associated with overbought conditions (usually above 70). Investors may want to monitor the stock closely for any changes in momentum.

Analysis for Nifty IT - April 22, 2025

The Nifty IT index opened at 34075.60 and closed at 33941.05, marking a percentage change of 1.70% from the previous close of 33372.35. The index is currently showing a negative MACD of -1363.71, with an RSI of 38.27, suggesting bearish momentum. The 10 EMA is slightly below the current closing price, indicating a short-term resistance.

Relationship with Key Moving Averages
The Nifty IT index closed at 33,941.05, which is below its 50 EMA of 37,203.47 and 200 EMA of 39,348.42, but slightly above its 10 EMA of 33,819.77. This indicates short-term bullish momentum compared to the 10 EMA, but it remains in a longer-term downtrend as it is trading below the 50 and 200 EMAs.
Moving Averages Trend (MACD)
The MACD for Nifty IT is at -1363.72, with the MACD signal at -1386.98, indicating a bullish crossover as the MACD is moving above the signal line. This suggests a potential upward momentum, though caution is advised due to the still negative MACD value.

RSI Analysis
The RSI for Nifty IT is 38.27, indicating that the index is nearing the oversold territory. This suggests potential for a bullish reversal if the RSI approaches or breaks below 30.

Analysis for Nifty Metal - April 22, 2025

Nifty Metal Performance: Nifty Metal opened at 8759.15, reaching a high of 8783.4 before closing at 8669.5, with a % change of 2.28% and a point change of 193. Despite a positive gain from its previous close of 8476.5, the RSI is at 51.71, indicating a neutral momentum. The MACD of -100.63 suggests it is still in a bearish phase, although signs of recovery are observed.

Relationship with Key Moving Averages
The Nifty Metal index closed slightly below the 50 EMA and well below the 200 EMA, indicating a potential bearish trend on a longer timeframe. However, the close is above the 10 EMA and approaching the 20 EMA, suggesting short-term bullish momentum.
Moving Averages Trend (MACD)
The MACD line for Nifty Metal is at -100.63, which is below the MACD Signal line at -74.87, indicating a bearish momentum. This suggests that the stock might be experiencing downward pressure, as the MACD is in negative territory and below its signal line.

RSI Analysis
The RSI for Nifty Metal is 51.71, which indicates a neutral stance in terms of market momentum. This value suggests that the index is neither overbought nor oversold, positioning it close to the middle of the RSI scale.

Analysis for Nifty Bank - April 22, 2025
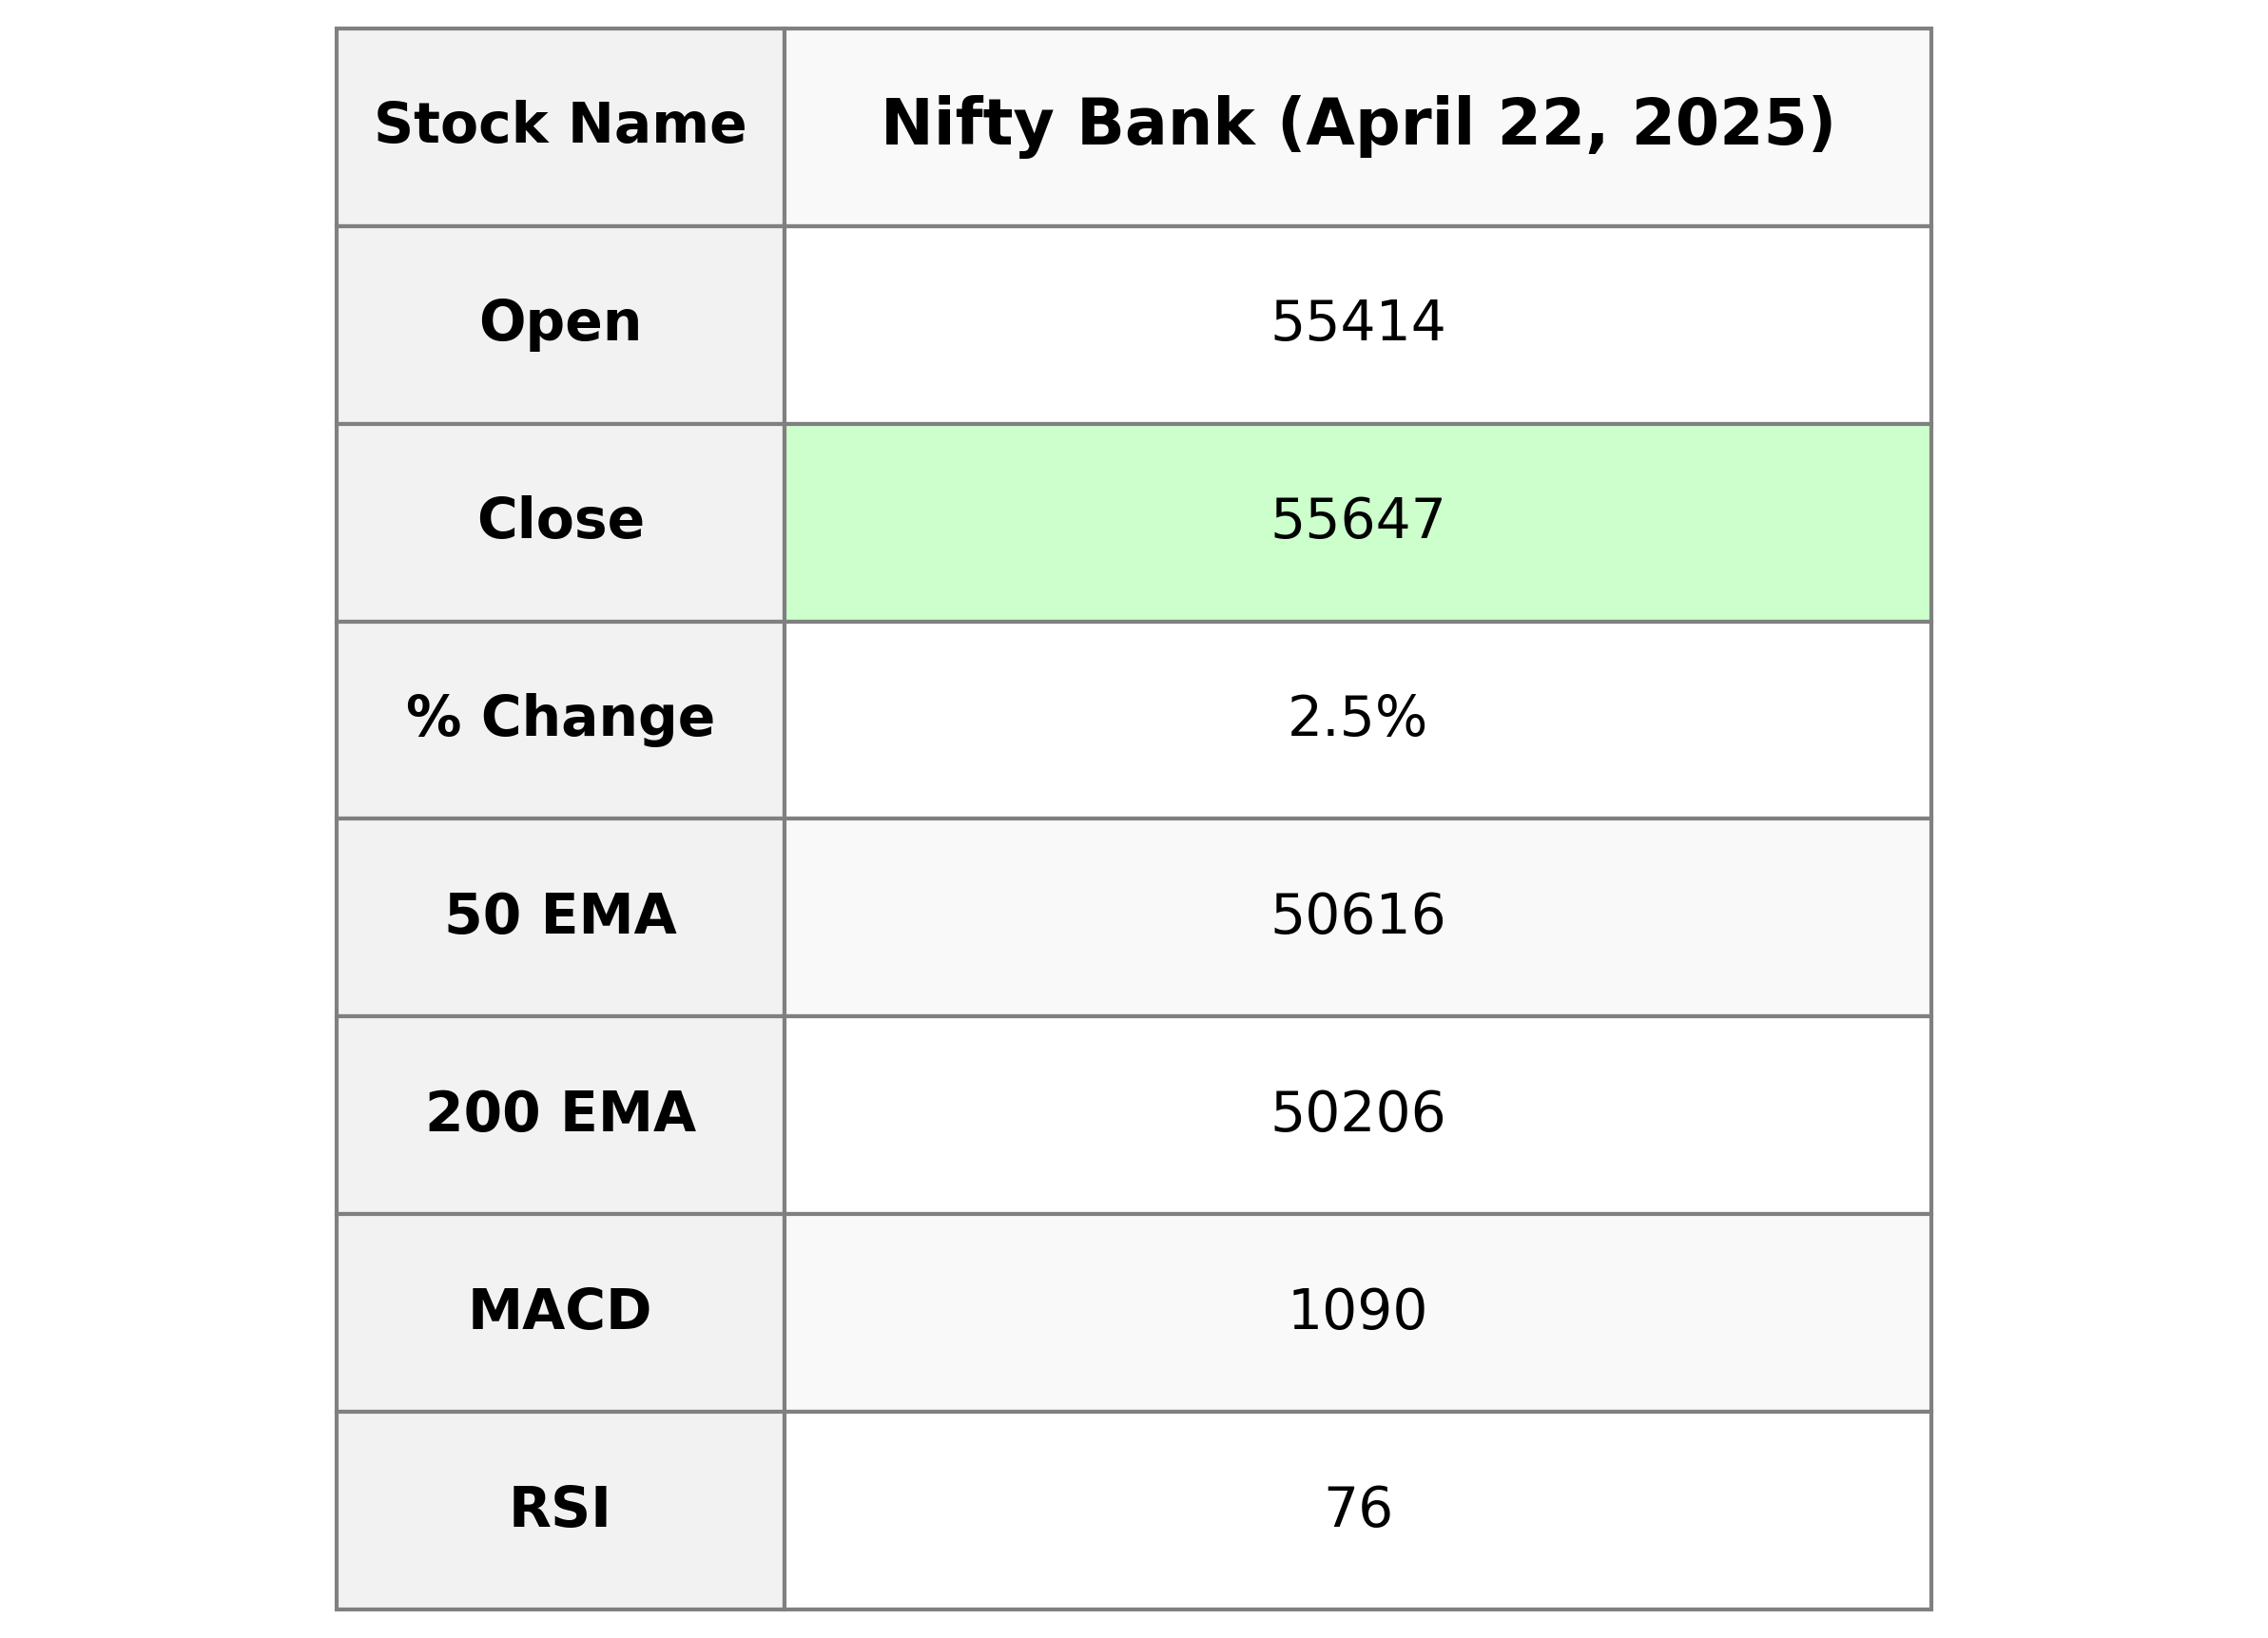
The Nifty Bank index opened at 55,414.30 and closed at 55,647.20, marking a 2.50% increase from the previous close of 54,290.20, with a points change of 1,357. The index is showing strong momentum with an RSI of 76.40, indicating it is in the overbought territory, while the MACD of 1,089.88 suggests bullish momentum over the signal line.

Relationship with Key Moving Averages
Based on the data provided, Nifty Bank's current closing price of 55,647.20 is significantly above its 50-day EMA of 50,615.64 and 200-day EMA of 50,206.32, indicating a strong upward trend. The 10-day EMA at 52,615.04 and 20-day EMA at 51,619.92 also confirm this bullish momentum with the price trading well above these shorter-term averages.
Moving Averages Trend (MACD)
Nifty Bank MACD Analysis: The MACD for Nifty Bank is significantly above the signal line (1089.88 vs. 686.89), indicating strong bullish momentum. This divergence suggests continued upward price movement, supported by the positive % change and closing price above previous levels.

RSI Analysis
Based on the provided data, the RSI for Nifty Bank is at 76.40, indicating that the stock is in an overbought condition. This level suggests potential caution for investors, as it might be due for a price correction or consolidation.

Analysis for Nifty 50 - April 22, 2025

Nifty 50 opened at 24185.40 and closed at 24167.25, marking an increase of approximately 0.17% compared to the previous close, adding 41.70 points. The technical indicators show a robust Relative Strength Index (RSI) of 65.96 and a strong MACD of 219.67, hinting at a bullish sentiment.

Relationship with Key Moving Averages
Nifty 50 closed at 24,167.25, which is above its 50 EMA of 23,168.83 and 200 EMA of 23,387.01, indicating a bullish trend as the current price surpasses major moving averages. Additionally, Nifty 50 is trading above its 10 EMA of 23,492.76 and 20 EMA of 23,270.45, suggesting short-term positive momentum.
Moving Averages Trend (MACD)
The MACD value for Nifty 50 is 219.67, which is higher than the MACD Signal line at 91.06. This indicates a bullish trend as the MACD line is above the signal line.

RSI Analysis
The RSI value for Nifty 50 is 65.96, which suggests that the index is nearing the overbought territory, typically marked above 70. This indicates potential caution for traders as the index price might be relatively high compared to its historical value.

Up Next
Indian stock market sector-wise performance today - April 22, 2025

Step-by-step guide to apply for a mortgage loan online with minimal documentation

Honda Activa 6G: Everything You Need to Know Before Buying

How much does a ULIP plan really cost? A break-down of all charges

Centre plans to borrow Rs 8.20 lakh cr from market in first half of FY27

Reliance denies buying Iranian oil amid US sanctions waiver

More videos

Premium petrol price up Rs 2, industrial diesel up Rs 22; no change in normal petrol, diesel rates

India's GDP expected to register over 8 pc growth in Sep-Dec: Report

Govt announces seven measures to help boost exports

RBI keeps interest rates on hold after US trade deal boosts outlook

RBI proposes to compensate customers up to Rs 25,000 loss due to fraud

RBI raises GDP growth projection of Q1, Q2 of FY27

RBI pauses rate cuts, retains interest rate at 5.25 pc

Rupee jumps 122 paise to close at 90.27 against US dollar on India-US trade deal

Stock markets cheer India-US trade deal: Sensex, Nifty surge 2.5 pc

UPI transactions hit record high of Rs 230 lakh crore in 2025-26 till Dec: Govt