


Highlights
- Nifty Metal leads with the highest change at 4.09% up
- Nifty Energy follows, showing a 2.70% increase in value
- Nifty Auto sees a 2.03% rise, continuing upward trend
Latest news

Samsung Galaxy Z Fold 8, Fold 8 Ultra & Z Flip 8: A More Mature Foldable Family

Dell Launches New Alienware 16X Aurora, 16 Area-51 and 18 Area-51 Gaming Laptops in India

Samsung Takes on Premium Home Audio With New Music Studio Series

The End of OxygenOS: OnePlus Confirms Shift to Oppo's ColorOS

Fujifilm Instax Mini Evo Cinema Review: A Hybrid Camera That Prints Memories Differently

iQOO Teases Z11 Lite With AI Tools, Military-Grade Durability and a 6500mAh Battery

Editorji Launches Hook Global, Its International Digital News Brand

Samsung's Bespoke AI ACs Focus on Humidity, Hygiene and Smarter Cooling
Indian stock market sector-wise performance today - April 11, 2025


The stock market on Friday (April 11, 2025) experienced a dynamic day of trading with varied performances across key indices.
The BSE Sensex posted a positive movement, gaining 1.77%. This upward trend was echoed across several sectors, driving overall market optimism.
Among the notable performers, the Nifty Metal index exhibited the most significant increase, climbing impressively by 4.09%. This sector's substantial growth may be attributed to favorable market conditions and a potential increase in demand for metal commodities, signaling investor confidence in metal stocks.
The Nifty Energy index also saw a robust upturn, with a gain of 2.70%. This rise could be linked to strengthening global oil prices and increased activity in energy markets, boosting investor sentiment and stock value within the sector.
On the infrastructure front, the Nifty Infra index advanced by 2.03%, reflecting renewed investor interest in infrastructure projects and developments.
Similarly, the Nifty Auto index marked a notable increase of 2.03%, possibly due to positive consumer sentiment and advances in the automotive industry.
The Nifty Bank index progressed with a 1.52% rise, while the NSE index followed suit with an upward movement of 1.92%. The financial sector's performance might have been influenced by stable banking operations and optimistic economic forecasts.
Despite these positive trends, the Nifty IT index experienced a modest increase of 0.69%. The smallest gain among the indices, it still indicated resilience in the tech sector amid varying market conditions.
In contrast, the Nifty FMCG index showed a more moderate growth of 0.86%, reflecting steady consumer demand for fast-moving consumer goods. This growth showcases the sector's foundational strength despite the broader market volatility.
Overall, the day's trading highlighted a fertile environment for key sectors like metals and energy, contributing to the collective push of the market indices.
The investors' optimistic outlook, coupled with sector-specific developments, played a vital role in driving these gains across the board.

Analysis for Sensex - April 11, 2025

The Sensex opened at 74,835.49 and closed at 75,157.26, showing a positive movement with a 1.77% change and a gain of 1,310.11 points from the previous close of 73,847.15. The RSI is near the neutral mark at 47.99, and the MACD indicates a bearish sentiment with a value of -235.20 compared to the MACD Signal of 17.12.

Relationship with Key Moving Averages
The close of Sensex at 75157.26 is below the 50 EMA of 75924.84, indicating a potential bearish sentiment in the short term. It is also below the 200 EMA of 77015.69, suggesting a long-term bearish trend. However, it is slightly above the 10 EMA of 75176.45, showing some recent upward momentum.
Moving Averages Trend (MACD)
MACD Analysis for Sensex: The MACD value of -235.20, together with the MACD Signal of 17.12, indicates a bearish trend for the index. The negative MACD suggests that the Sensex may continue to experience downward momentum unless there is a bullish crossover or change in the trend.

RSI Analysis
Based on the data, the Relative Strength Index (RSI) for Sensex is at 47.99. This indicates that the stock is in a neutral zone, neither overbought nor oversold. It suggests that the recent price movements are balanced, and there might be no imminent trend reversal.

Analysis for Nifty Auto - April 11, 2025

Nifty Auto Index opened at 20,493.05, reached a high of 20,637.95 and closed at 20,548.65. It saw a percent change of 2.03% with a points change of 408.25 from the previous close of 20,140.40. The RSI is at 42.26, indicating a relatively weaker momentum, while the MACD is -320.71, suggesting a bearish trend.

Relationship with Key Moving Averages
Nifty Auto's closing price at 20548.65 is below its 50-day EMA of 21512.80 and its 200-day EMA of 22587.39, indicating a bearish trend in the medium to long term. However, it is near its 10-day EMA of 20668.46, suggesting potential short-term consolidation.
Moving Averages Trend (MACD)
Based on the MACD analysis for Nifty Auto, the MACD value is -320.71, which is below the MACD Signal line at -227.94, indicating a bearish trend. The divergence suggests potential continued downward momentum unless there's a reversal.

RSI Analysis
The RSI value of 42.26 for Nifty Auto suggests that the index is currently neither in the overbought nor in the oversold territory, indicating a neutral momentum. This suggests that the market is relatively balanced, and there might not be a strong directional trend at the moment.

Analysis for Nifty Energy - April 11, 2025

Nifty Energy experienced a positive trading session, closing at 32,411.10, which represents a 2.70% increase with a points gain of 852.15 from the previous close of 31,558.95. The index had a volatile session with a high of 32,454.60 and a low of 31,981.20, showing strong upward momentum but slightly lagging behind its 50-EMA of 32,714.68. The RSI is close to the neutral zone at 49.83, indicating balanced momentum, while the MACD value suggests slightly diminished bullish momentum compared to the MACD Signal.

Relationship with Key Moving Averages
Nifty Energy closed at 32411.10, just below its 10-EMA of 32418.08 and significantly below its 50-EMA of 32714.68 and 200-EMA of 35626.14, suggesting it is trading closer to short-term support levels but remains well below longer-term averages.
Moving Averages Trend (MACD)
The MACD for Nifty Energy, at 24.66, is well below its MACD Signal of 189.30, indicating a bearish divergence. Despite a positive % change in the stock price, the MACD suggests that the momentum may not be strong enough to sustain an uptrend.

RSI Analysis
Nifty Energy's RSI is at 49.83, which indicates a neutral zone and suggests that the index is neither overbought nor oversold at the moment. This level of RSI suggests a balanced market sentiment, with potential for movement in either direction dependent on upcoming market trends and news.

Analysis for Nifty FMCG - April 11, 2025
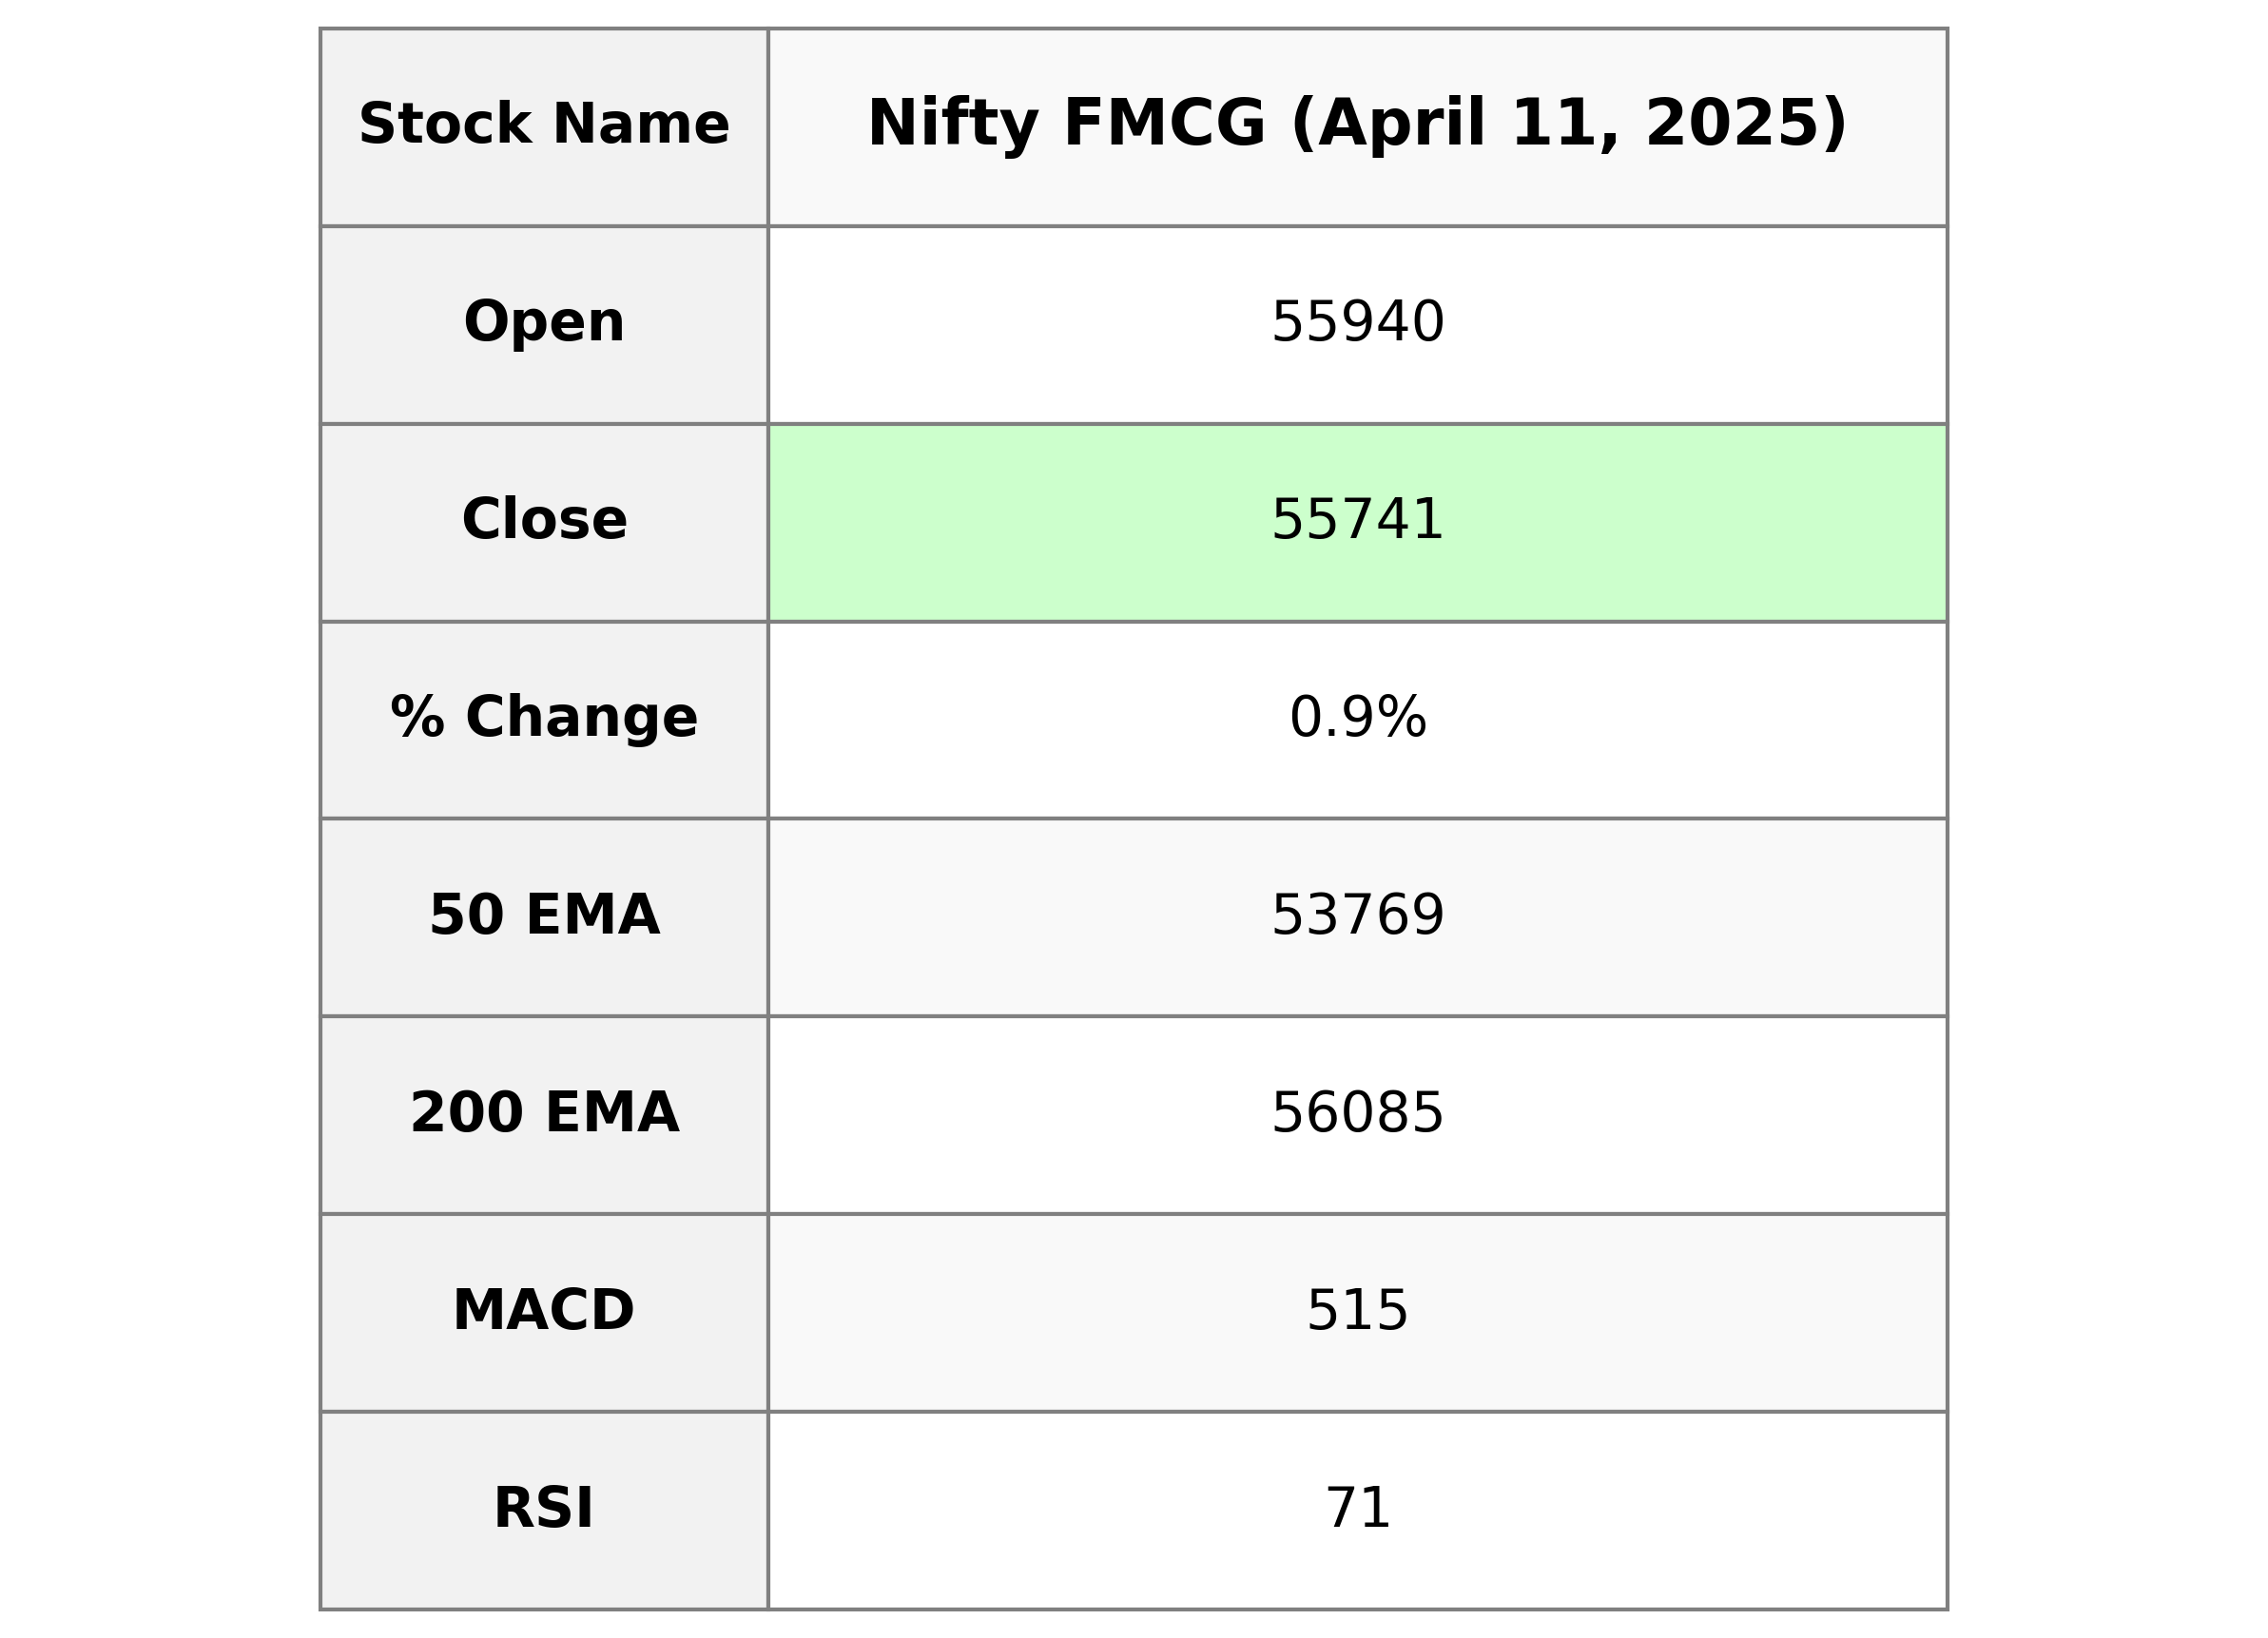
Nifty FMCG opened at 55,939.55 and closed at 55,741.10, experiencing a positive change of 0.86% or 476.35 points from the previous close of 55,264.75. The RSI is at 70.88, indicating overbought conditions. The MACD stands at 514.85 against a signal line of 197.55, suggesting strong upward momentum.

Relationship with Key Moving Averages
The Nifty FMCG index closed at 55,741.10, which is above its 50-day EMA of 53,768.87 and below its 200-day EMA of 56,084.87, indicating a medium-term uptrend but a slight lag in long-term momentum. The current position also shows it is comfortably above the 10-day and 20-day EMAs, supporting short-term bullish momentum.
Moving Averages Trend (MACD)
The MACD for Nifty FMCG is 514.85 with a signal line at 197.55, indicating a bullish signal as the MACD line is above the signal line, often considered a sign of positive momentum in the stock's price.

RSI Analysis
The RSI value for Nifty FMCG is 70.88, indicating that the stock is in the overbought zone. This typically suggests that the stock might be overvalued and could be due for a pullback or correction, as it is nearing the upper limit of the RSI range.

Analysis for Nifty Infra - April 11, 2025

Nifty Infra Performance The Nifty Infra index opened at 8218.15, reached a high of 8274.75, and closed at 8250.15, marking a 2.03% increase from the previous close of 8086.25. The index shows positive momentum with an RSI of 52.14 and a MACD of 28.29, though the MACD signal line is higher at 59.04, indicating a potential change in trend. The 50-day EMA is at 8206.81, suggesting a strong performance above short-term averages.

Relationship with Key Moving Averages
The Nifty Infra closed at 8250.15, which is above its 10-day EMA of 8225.11, indicating short-term bullish momentum. It also surpassed the 50-day EMA of 8206.81, but it remains below the 200-day EMA of 8392.03, suggesting long-term bearishness. The % change of 2.03% indicates significant upward movement from the previous close of 8086.25.
Moving Averages Trend (MACD)
For Nifty Infra, the current MACD value is 28.29, which is below the MACD Signal line at 59.04. This suggests a bearish momentum as the gap between the MACD and signal line indicates a potential downward trend. However, since the decline isn't extreme, it could also signal consolidation or sideways movement.

RSI Analysis
The Relative Strength Index (RSI) for Nifty Infra is 52.14, indicating a neutral market sentiment. This RSI value suggests that the sector is neither overbought nor oversold at the current level, implying potential stability.

Analysis for Nifty IT - April 11, 2025

Nifty IT opened at 32,926.65 and closed at 32,740.85, showing a percentage change of 0.69% and a points change of 223.5. The RSI indicates an oversold level at 26.95, while the MACD suggests a bearish trend with a reading of -1571.42.
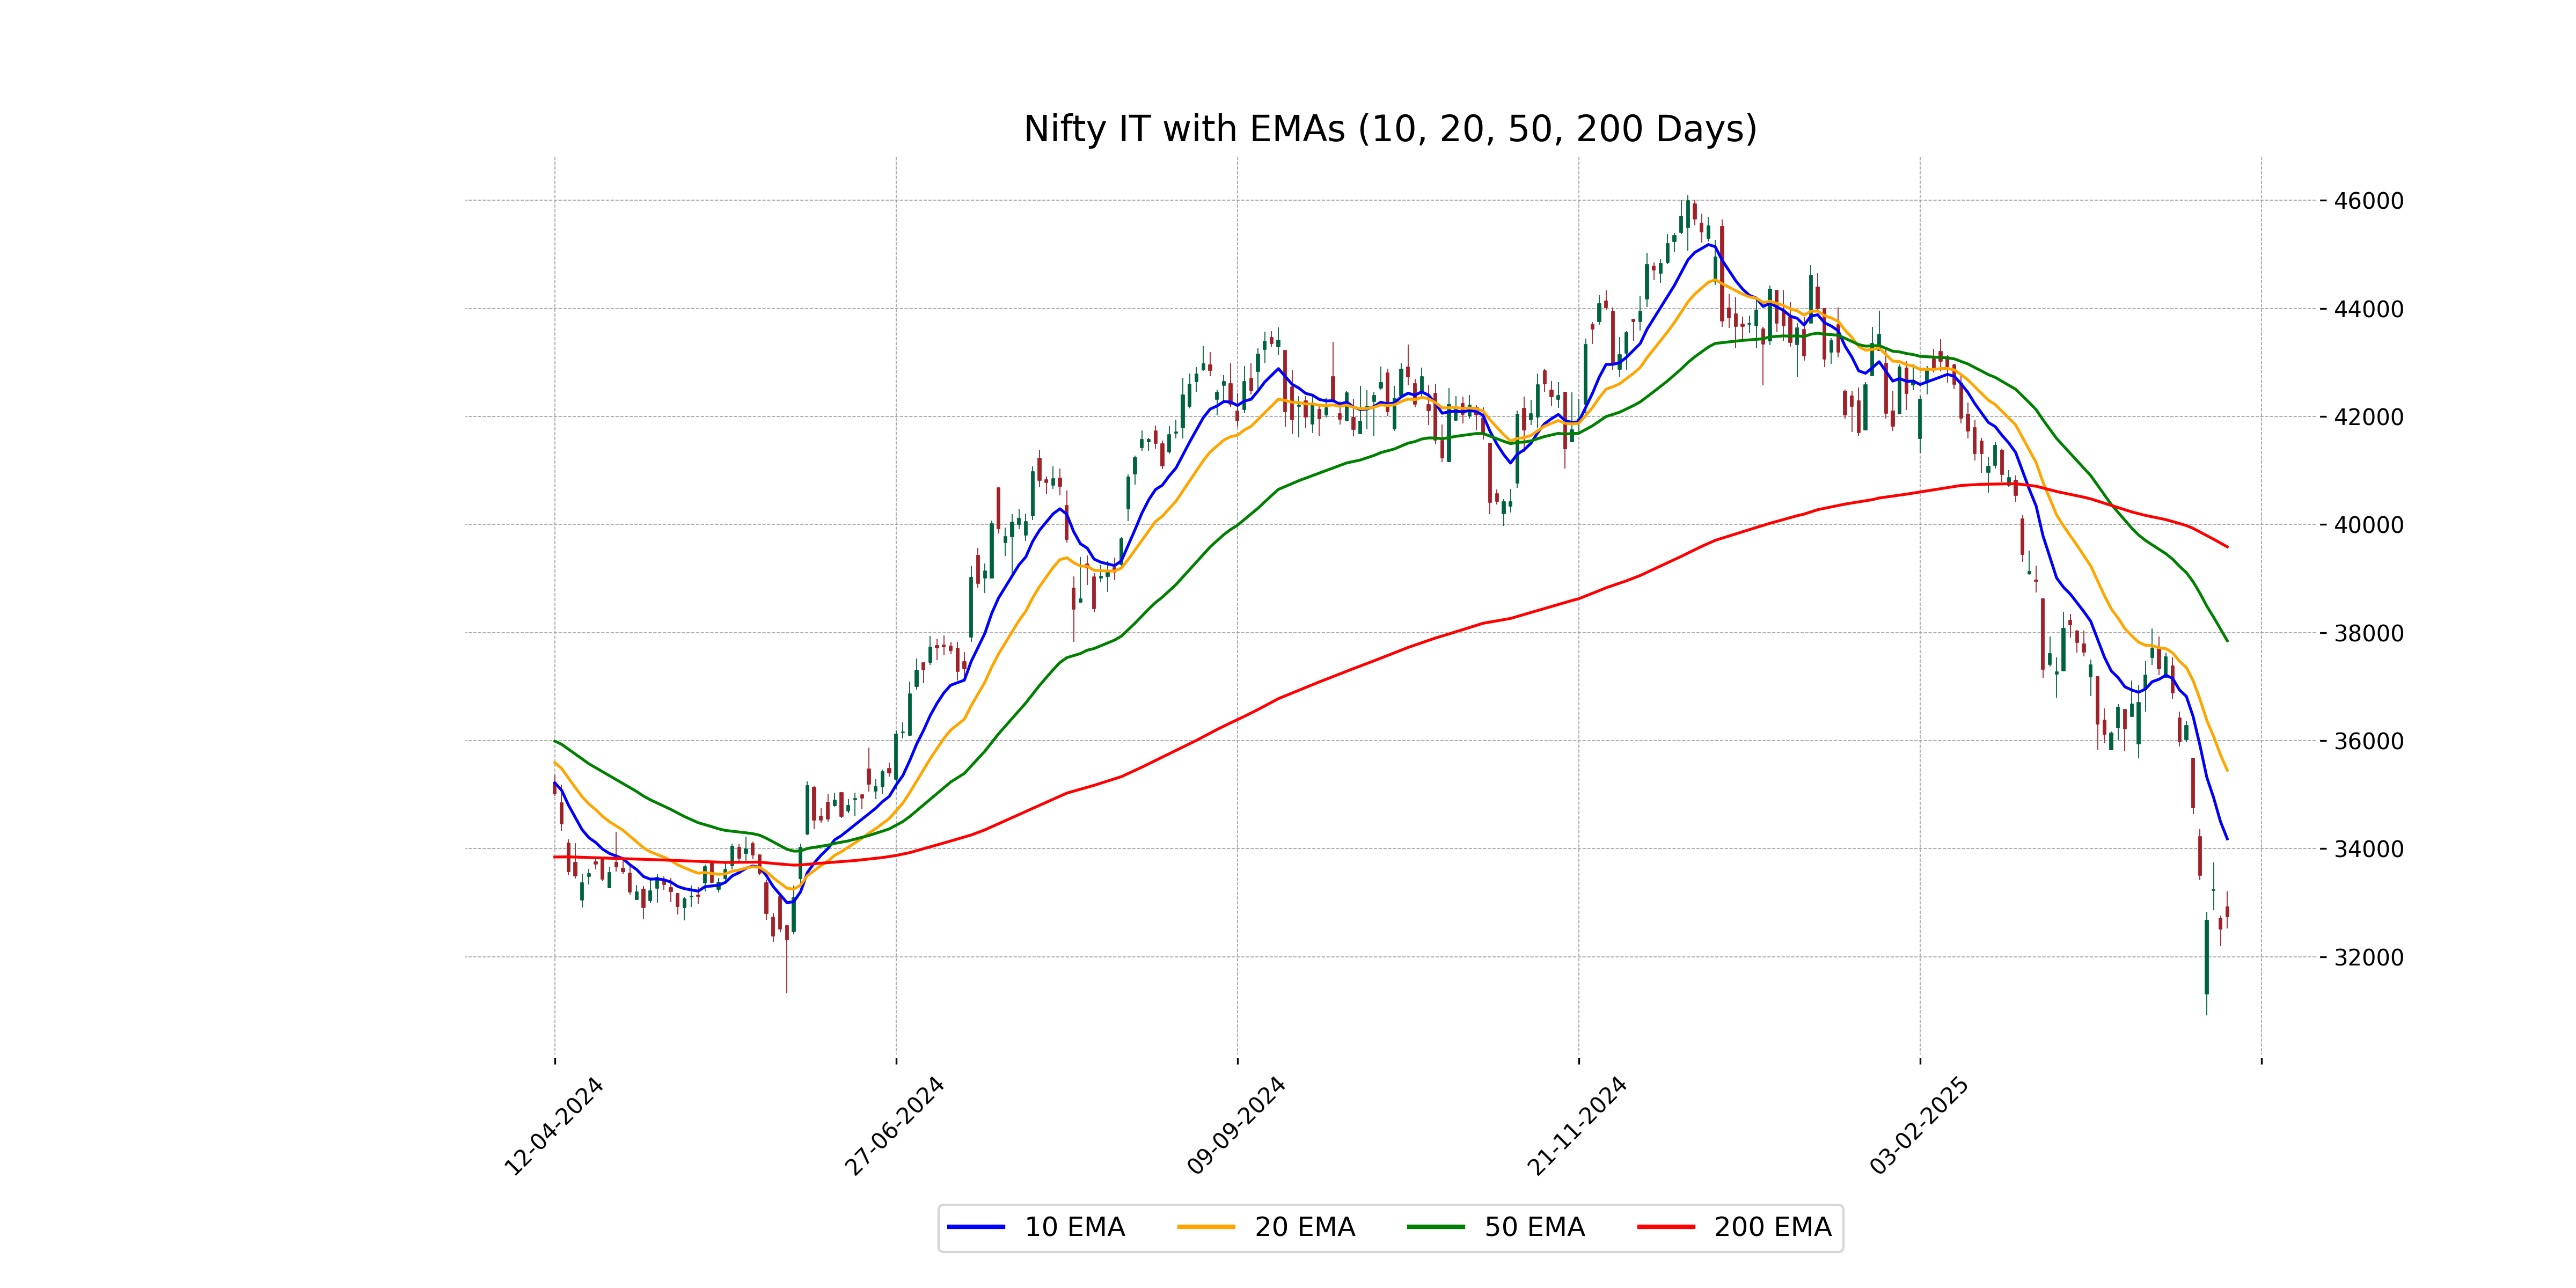
Relationship with Key Moving Averages
The current close of Nifty IT at 32740.85 is below the short-term 10 EMA of 34182.47, as well as significantly below both the 50 EMA of 37849.37 and the 200 EMA of 39587.44, indicating a bearish trend. The RSI at 26.95 suggests that Nifty IT is in oversold territory.
Moving Averages Trend (MACD)
Based on the provided data, the Nifty IT index shows a MACD value of -1571.42, which is below the MACD Signal value of -1286.08, indicating a bearish trend. This suggests that the downward momentum might continue unless there is a positive reversal.

RSI Analysis
The RSI (Relative Strength Index) for Nifty IT is 26.95, which indicates that the index is currently in an oversold condition. This suggests that the selling pressure might be overdone, and there could be potential for a price reversal or a rebound.

Analysis for Nifty Metal - April 11, 2025

Nifty Metal opened at 8136.8 and closed at 8168.3, showing a positive points change of 320.8 from the previous close of 7847.5, which translates to a percentage change of 4.09%. Despite this increase, the 50 EMA at 8657.57 and 200 EMA at 8789.87 indicate the index is trading below its medium to long-term averages, accompanied by a bearish MACD value. The RSI at 39.13 suggests a potential oversold condition, indicating underlying market weakness.

Relationship with Key Moving Averages
The closing price of Nifty Metal at 8168.30 is below its 10-day EMA of 8410.34, 20-day EMA of 8598.97, 50-day EMA of 8657.57, and 200-day EMA of 8789.87, indicating a bearish sentiment. The current RSI of 39.13 is closer to the oversold region, further suggesting potential downward pressure.
Moving Averages Trend (MACD)
The MACD for Nifty Metal is -155.22, while the MACD Signal is -4.68, indicating a weak bearish momentum. The significant gap between the MACD and its signal line suggests that the stock could still be under selling pressure, despite the recent positive price movement.

RSI Analysis
The RSI value for Nifty Metal is 39.13, indicating that the index is in the lower range and could be nearing an oversold condition. This suggests that the current trend might reverse or stabilize soon if the RSI continues to rise.

Analysis for Nifty Bank - April 11, 2025

Nifty Bank opened at 50,634.10 and closed at 51,002.35, marking an increase of 1.52% from its previous close of 50,240.15, with a points change of 762.20. The current RSI is 56.08, indicating a moderately strong performance, while the MACD stands at 413.26, with a signal line at 483.66, suggesting a slight bearish divergence.

Relationship with Key Moving Averages
Nifty Bank's close price of 51002.35 is above its 50 EMA of 50043.32, 200 EMA of 50055.27, and 20 EMA of 50449.94, indicating a bullish sentiment. However, it is only slightly above the 10 EMA of 50744.52, suggesting potential caution in the short term. The positive distance of the closing price from these EMAs reflects an overall upward trend.
Moving Averages Trend (MACD)
Nifty Bank: The MACD for Nifty Bank is currently at 413.26, which is below its signal line of 483.66. This can be interpreted as a bearish movement and may suggest the potential for further downward momentum. However, considering other factors like the upward movement from the previous close, monitoring additional indicators might provide a clearer picture.

RSI Analysis
Based on the provided data, the Relative Strength Index (RSI) for Nifty Bank is 56.08, which suggests a neutral market condition. The RSI value is above 50, indicating a potential bullish momentum, but it is not yet in the overbought territory (above 70).

Analysis for Nifty 50 - April 11, 2025

The Nifty 50 index opened at 22,695.40 and closed at 22,828.55, marking a percentage change of approximately 1.92%, with a points increase of 429.40. Despite the price increase, the index is trading below key moving averages such as the 50-day EMA and the 200-day EMA, indicating a potential bearish trend. The current RSI is 48.35, suggesting neutral momentum, while the MACD indicator shows a negative value, hinting at potential bearish sentiment in the market.

Relationship with Key Moving Averages
The Nifty 50 closed at 22828.55, which is below its 50-day EMA of 23028.87 and 200-day EMA of 23365.90, indicating a potential bearish trend. However, it is slightly above the 10-day EMA of 22833.98, suggesting short-term strength.
Moving Averages Trend (MACD)
The MACD value for Nifty 50 is negative at -57.55, indicating a potential bearish trend. Additionally, since the MACD is below the signal line (+25.79), it suggests downward momentum in the market.

RSI Analysis
The Nifty 50 RSI is currently at 48.35, which suggests the index is near the middle of the RSI range, indicating neither overbought nor oversold conditions. This neutral RSI implies a balanced momentum where neither bullish nor bearish forces are dominant. Traders might wait for further signals to gauge future price direction.

Up Next
Indian stock market sector-wise performance today - April 11, 2025

Step-by-step guide to apply for a mortgage loan online with minimal documentation

Honda Activa 6G: Everything You Need to Know Before Buying

How much does a ULIP plan really cost? A break-down of all charges

Centre plans to borrow Rs 8.20 lakh cr from market in first half of FY27

Reliance denies buying Iranian oil amid US sanctions waiver

More videos

Premium petrol price up Rs 2, industrial diesel up Rs 22; no change in normal petrol, diesel rates

India's GDP expected to register over 8 pc growth in Sep-Dec: Report

Govt announces seven measures to help boost exports

RBI keeps interest rates on hold after US trade deal boosts outlook

RBI proposes to compensate customers up to Rs 25,000 loss due to fraud

RBI raises GDP growth projection of Q1, Q2 of FY27

RBI pauses rate cuts, retains interest rate at 5.25 pc

Rupee jumps 122 paise to close at 90.27 against US dollar on India-US trade deal

Stock markets cheer India-US trade deal: Sensex, Nifty surge 2.5 pc

UPI transactions hit record high of Rs 230 lakh crore in 2025-26 till Dec: Govt