


Highlights
- Sensex & Nifty slip below key EMAs, bearish signals
- Dow Jones, Nasdaq, S&P stay above EMAs, bullish bias
- FTSE 100, CAC 40, DAX show steady upward momentum
Latest news

Haier Launches HQLED P7 Pro Series TVs With Google Gemini, 50W Audio And AI Picture Enhancements

Nothing's Latest Pokémon Teasers Hint At New Hardware, RCB Collaboration May Also Be In The Works

OnePlus N6 Set To Debut With Massive 8,000mAh Battery And Long-Term Performance Focus

Roblox Introduces Age-Based Accounts for Younger Users, Expands Parental Controls Globally

IIFL Capital Launches Algo Marketplace with Over 100 Ready-Made Strategies

LUMIQ Raises INR 50 Crore Pre-Series B to Become the AI Decision Layer for Financial Services

Tay Keith, producer behind Travis Scott's 'Sicko Mode' dies at 29

GenAI could lift realty sales velocity by up to 50%, speed up launches by 30%: Report
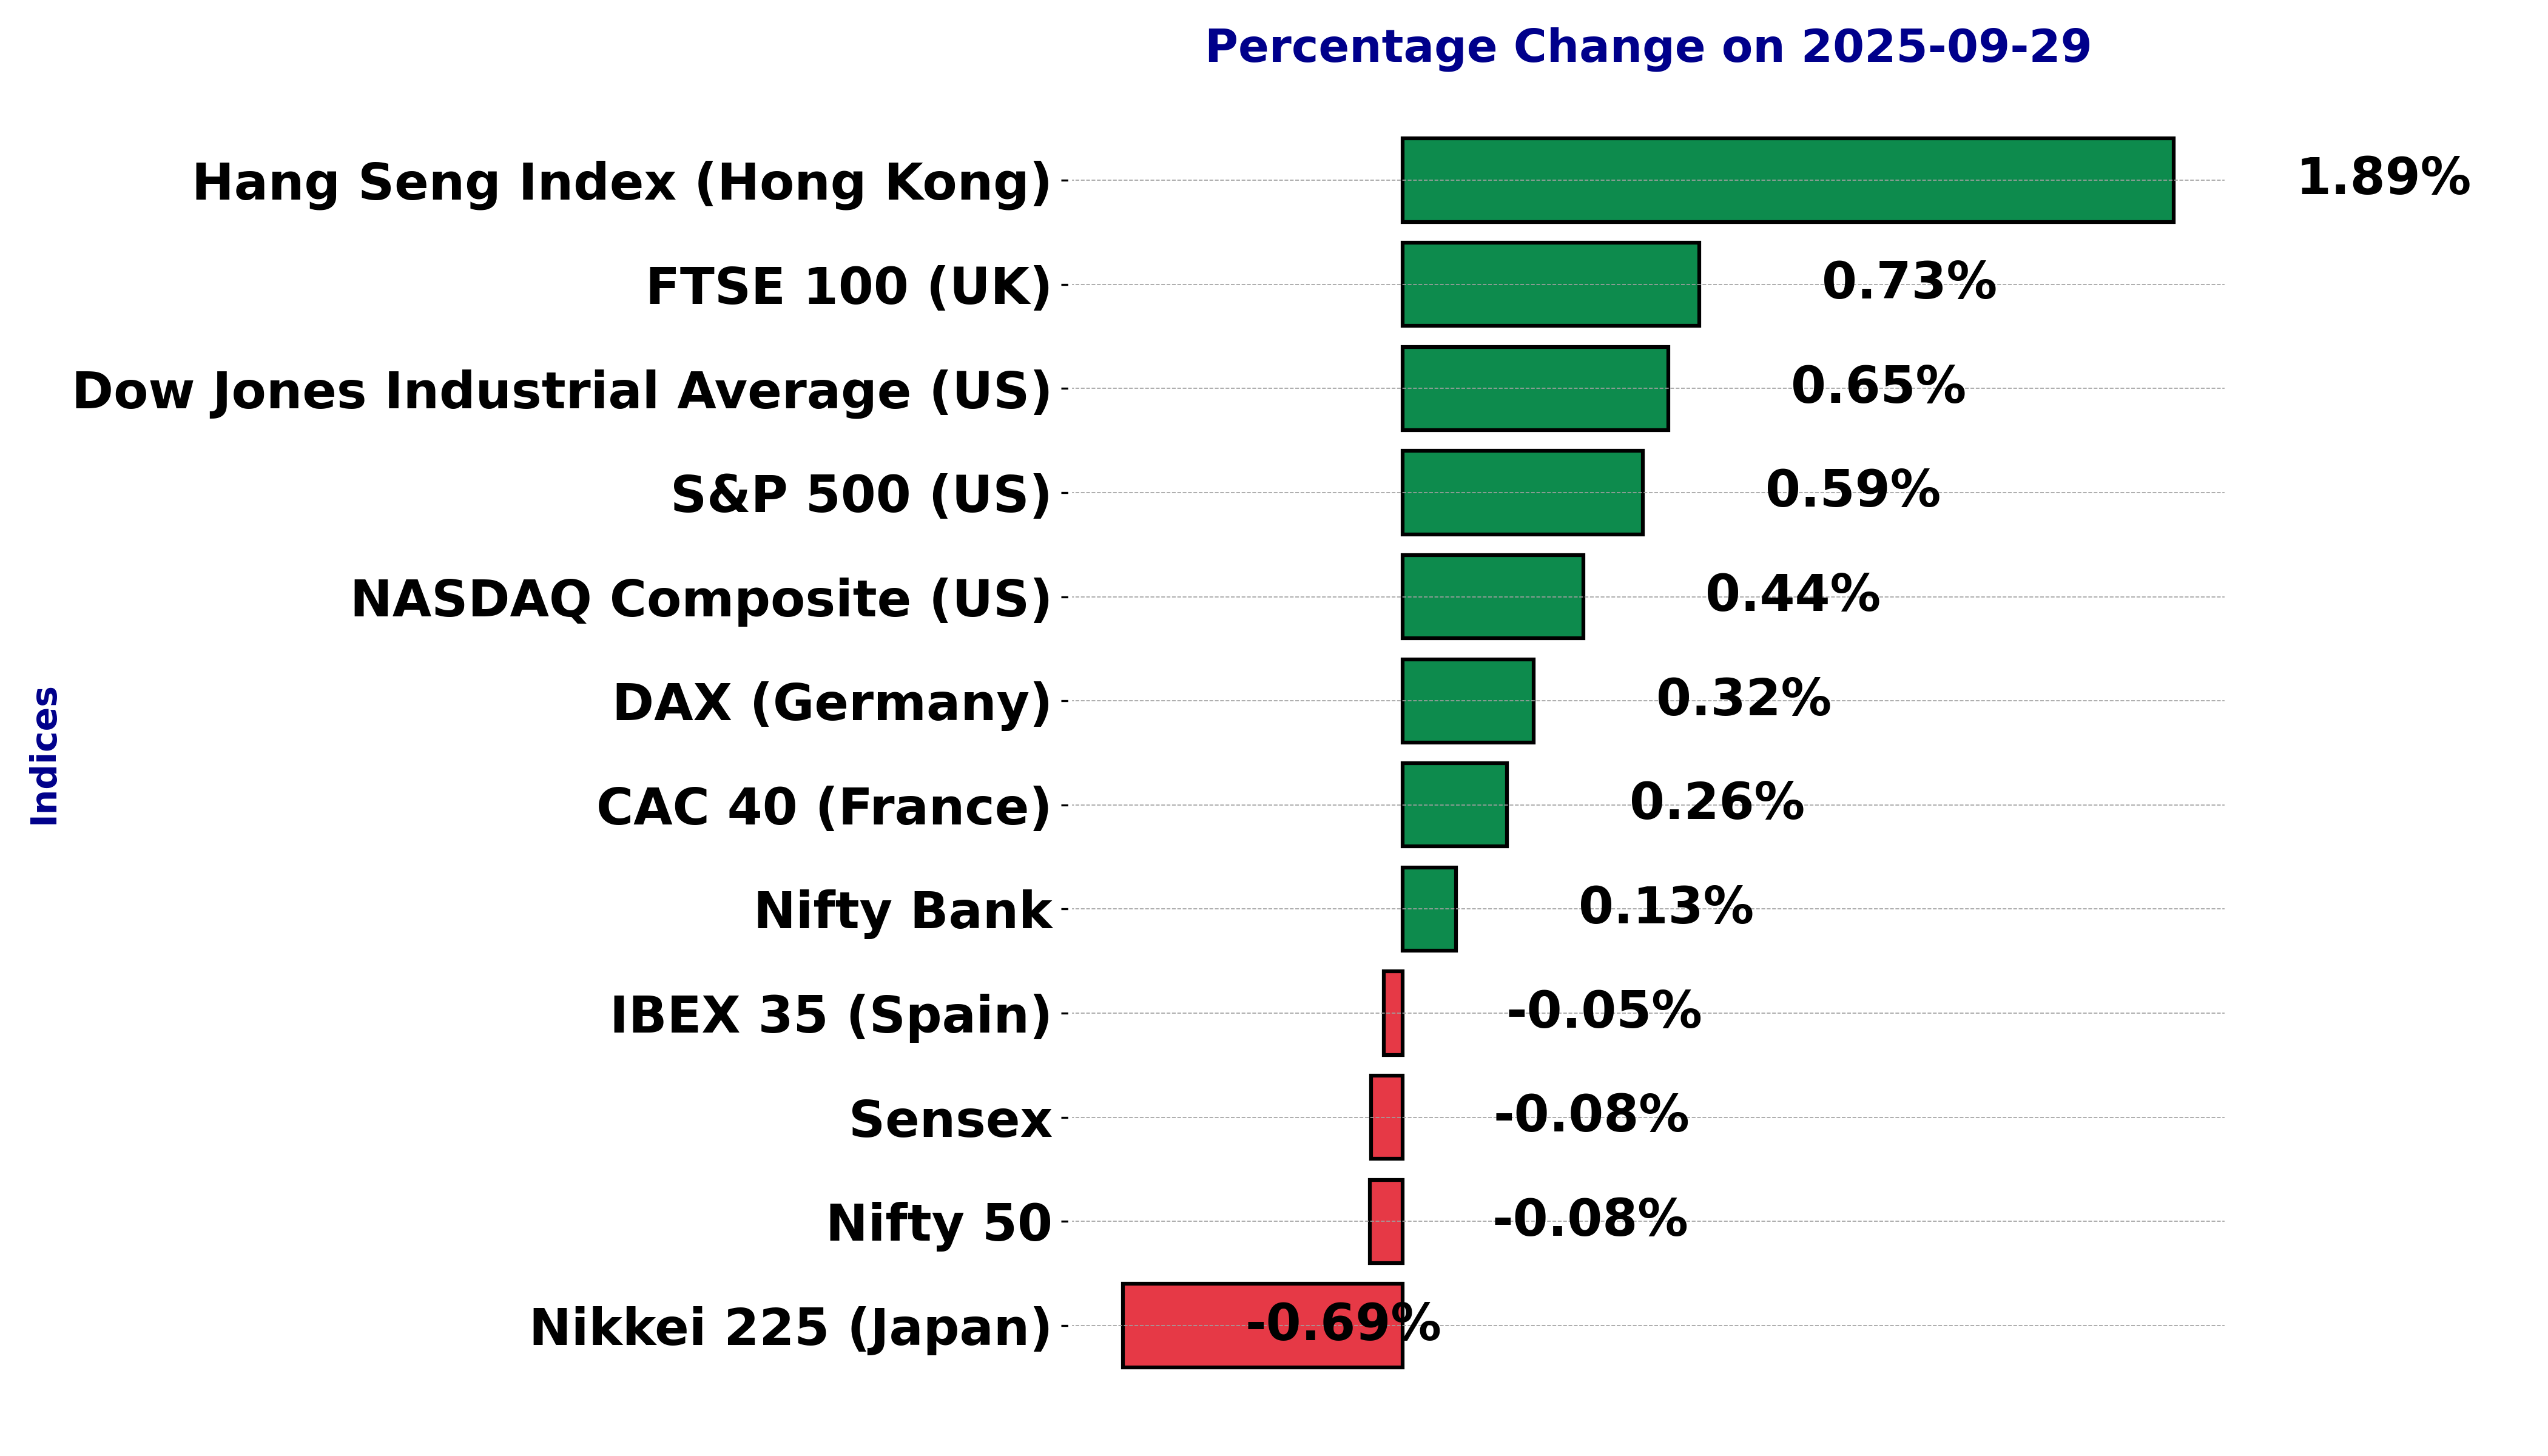
Global stock market indices: How the world markets performed today - 29 September 2025


The international stock market indices showed varied performances on September 29, 2025, reflecting the economic sentiment across different regions.
In this article, we analyze the performance of key global indices including the S&P 500, Dow Jones Industrial Average, NASDAQ Composite, FTSE 100, DAX, CAC 40, IBEX 35, Nikkei 225, Hang Seng, Nifty 50, and BSE Sensex.
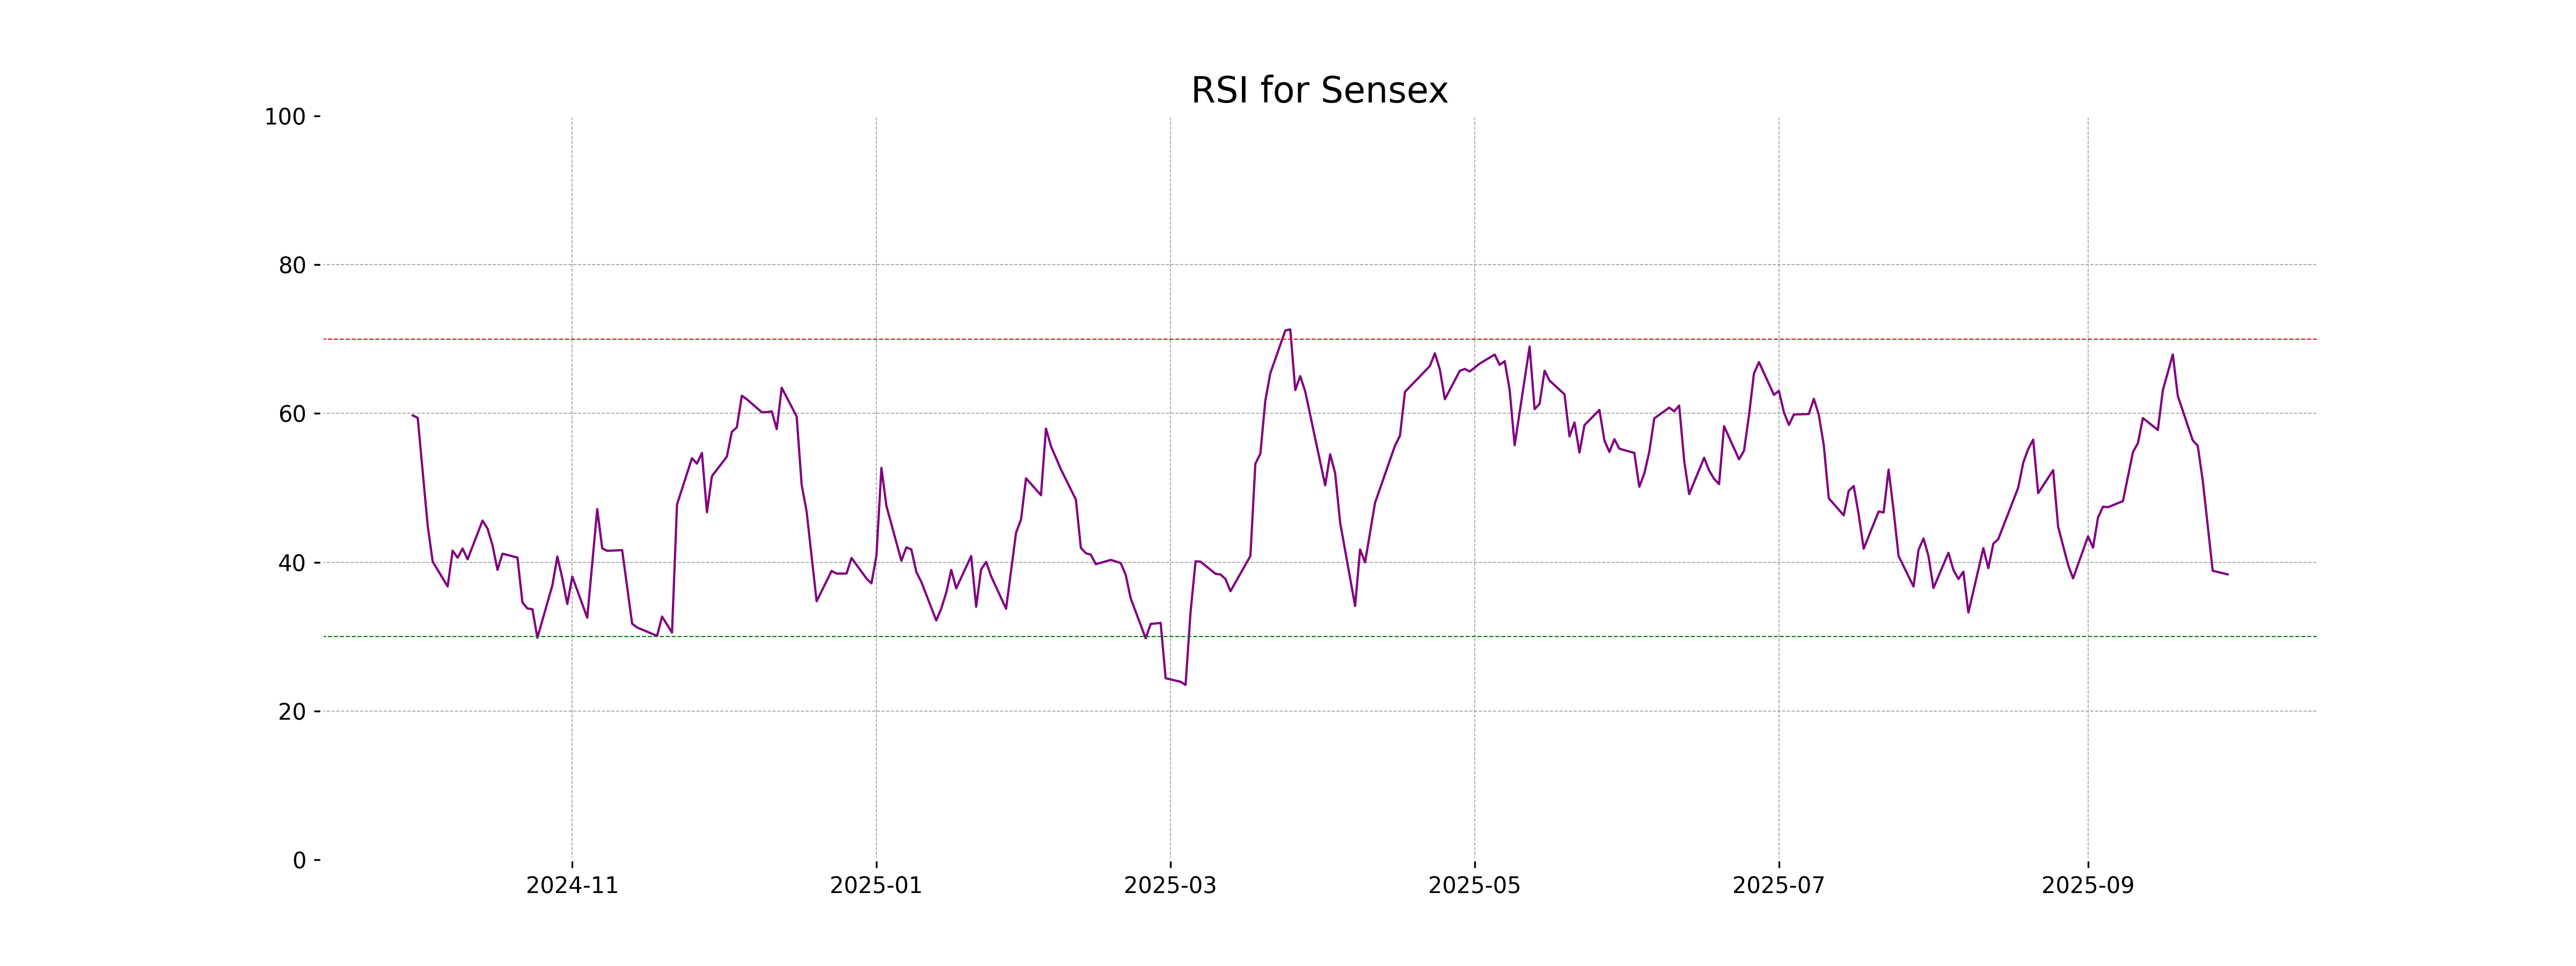
Analysis for Sensex - September 29, 2025
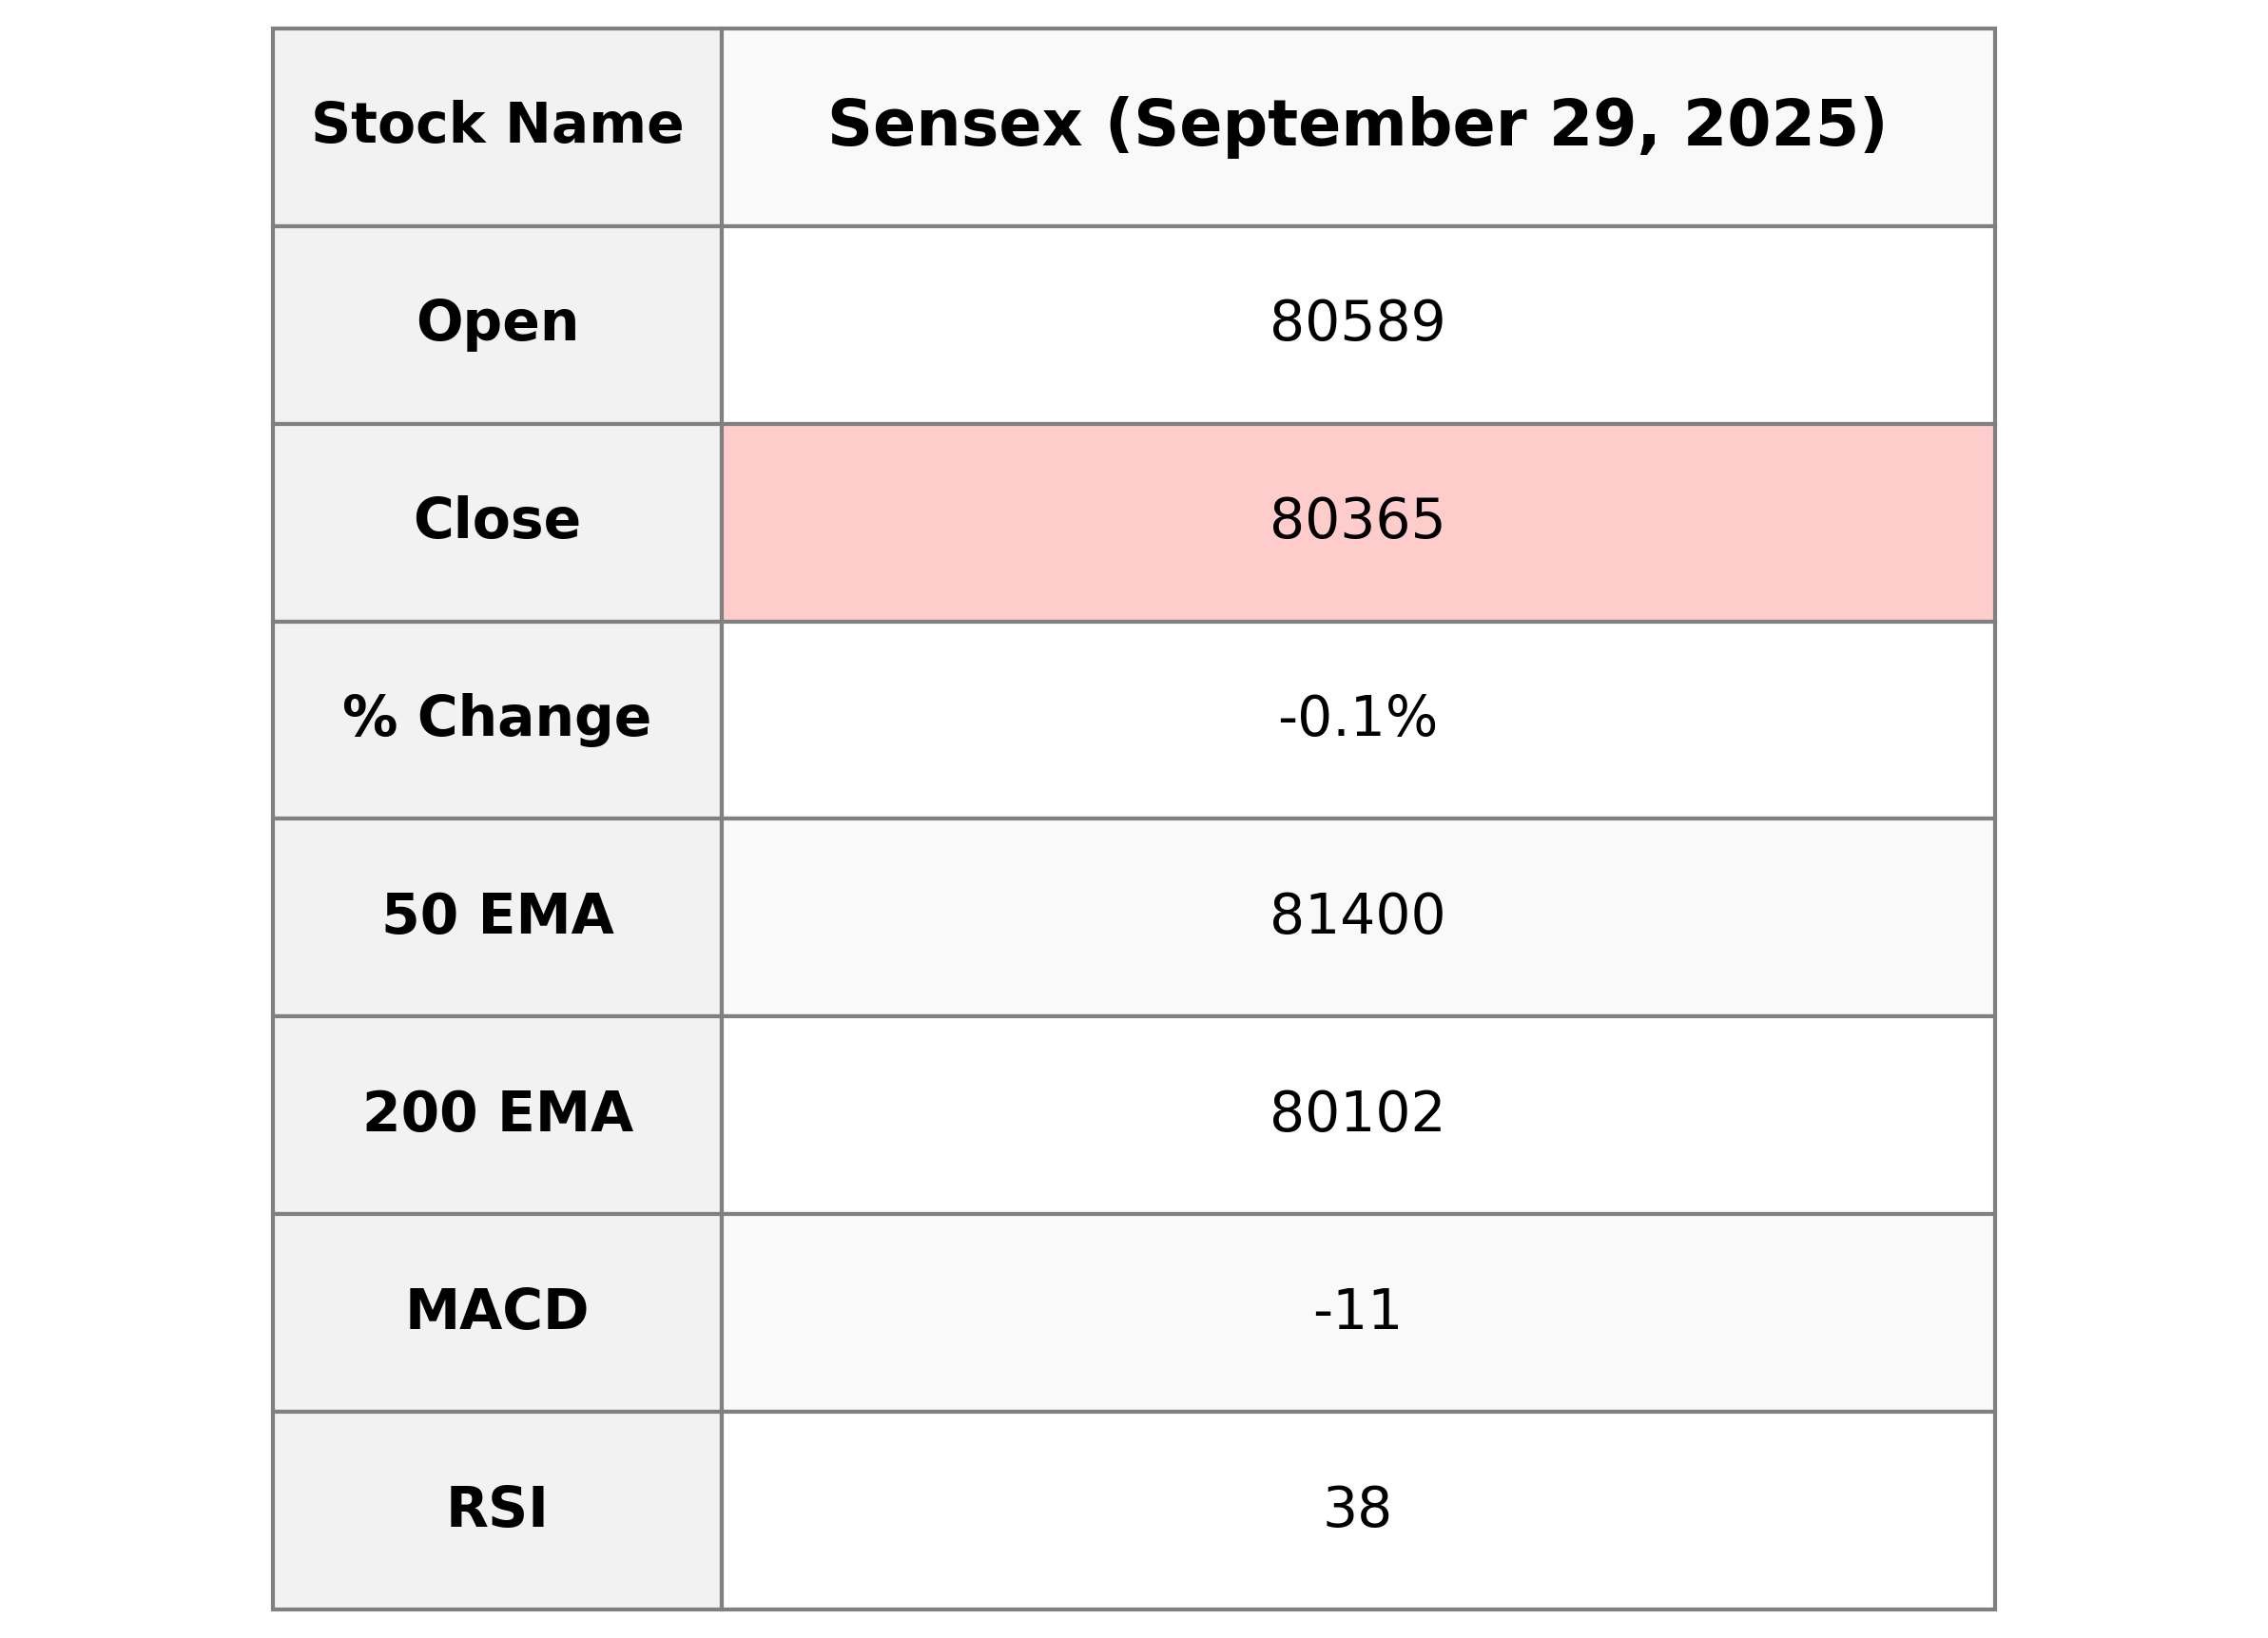
The Sensex opened at 80,588.77 and closed slightly lower at 80,364.94, marking a decrease of 0.08% or 61.52 points from the previous close of 80,426.46. The RSI indicates bearish momentum at 38.36 with a negative MACD of -10.63, suggesting potential further weakness.
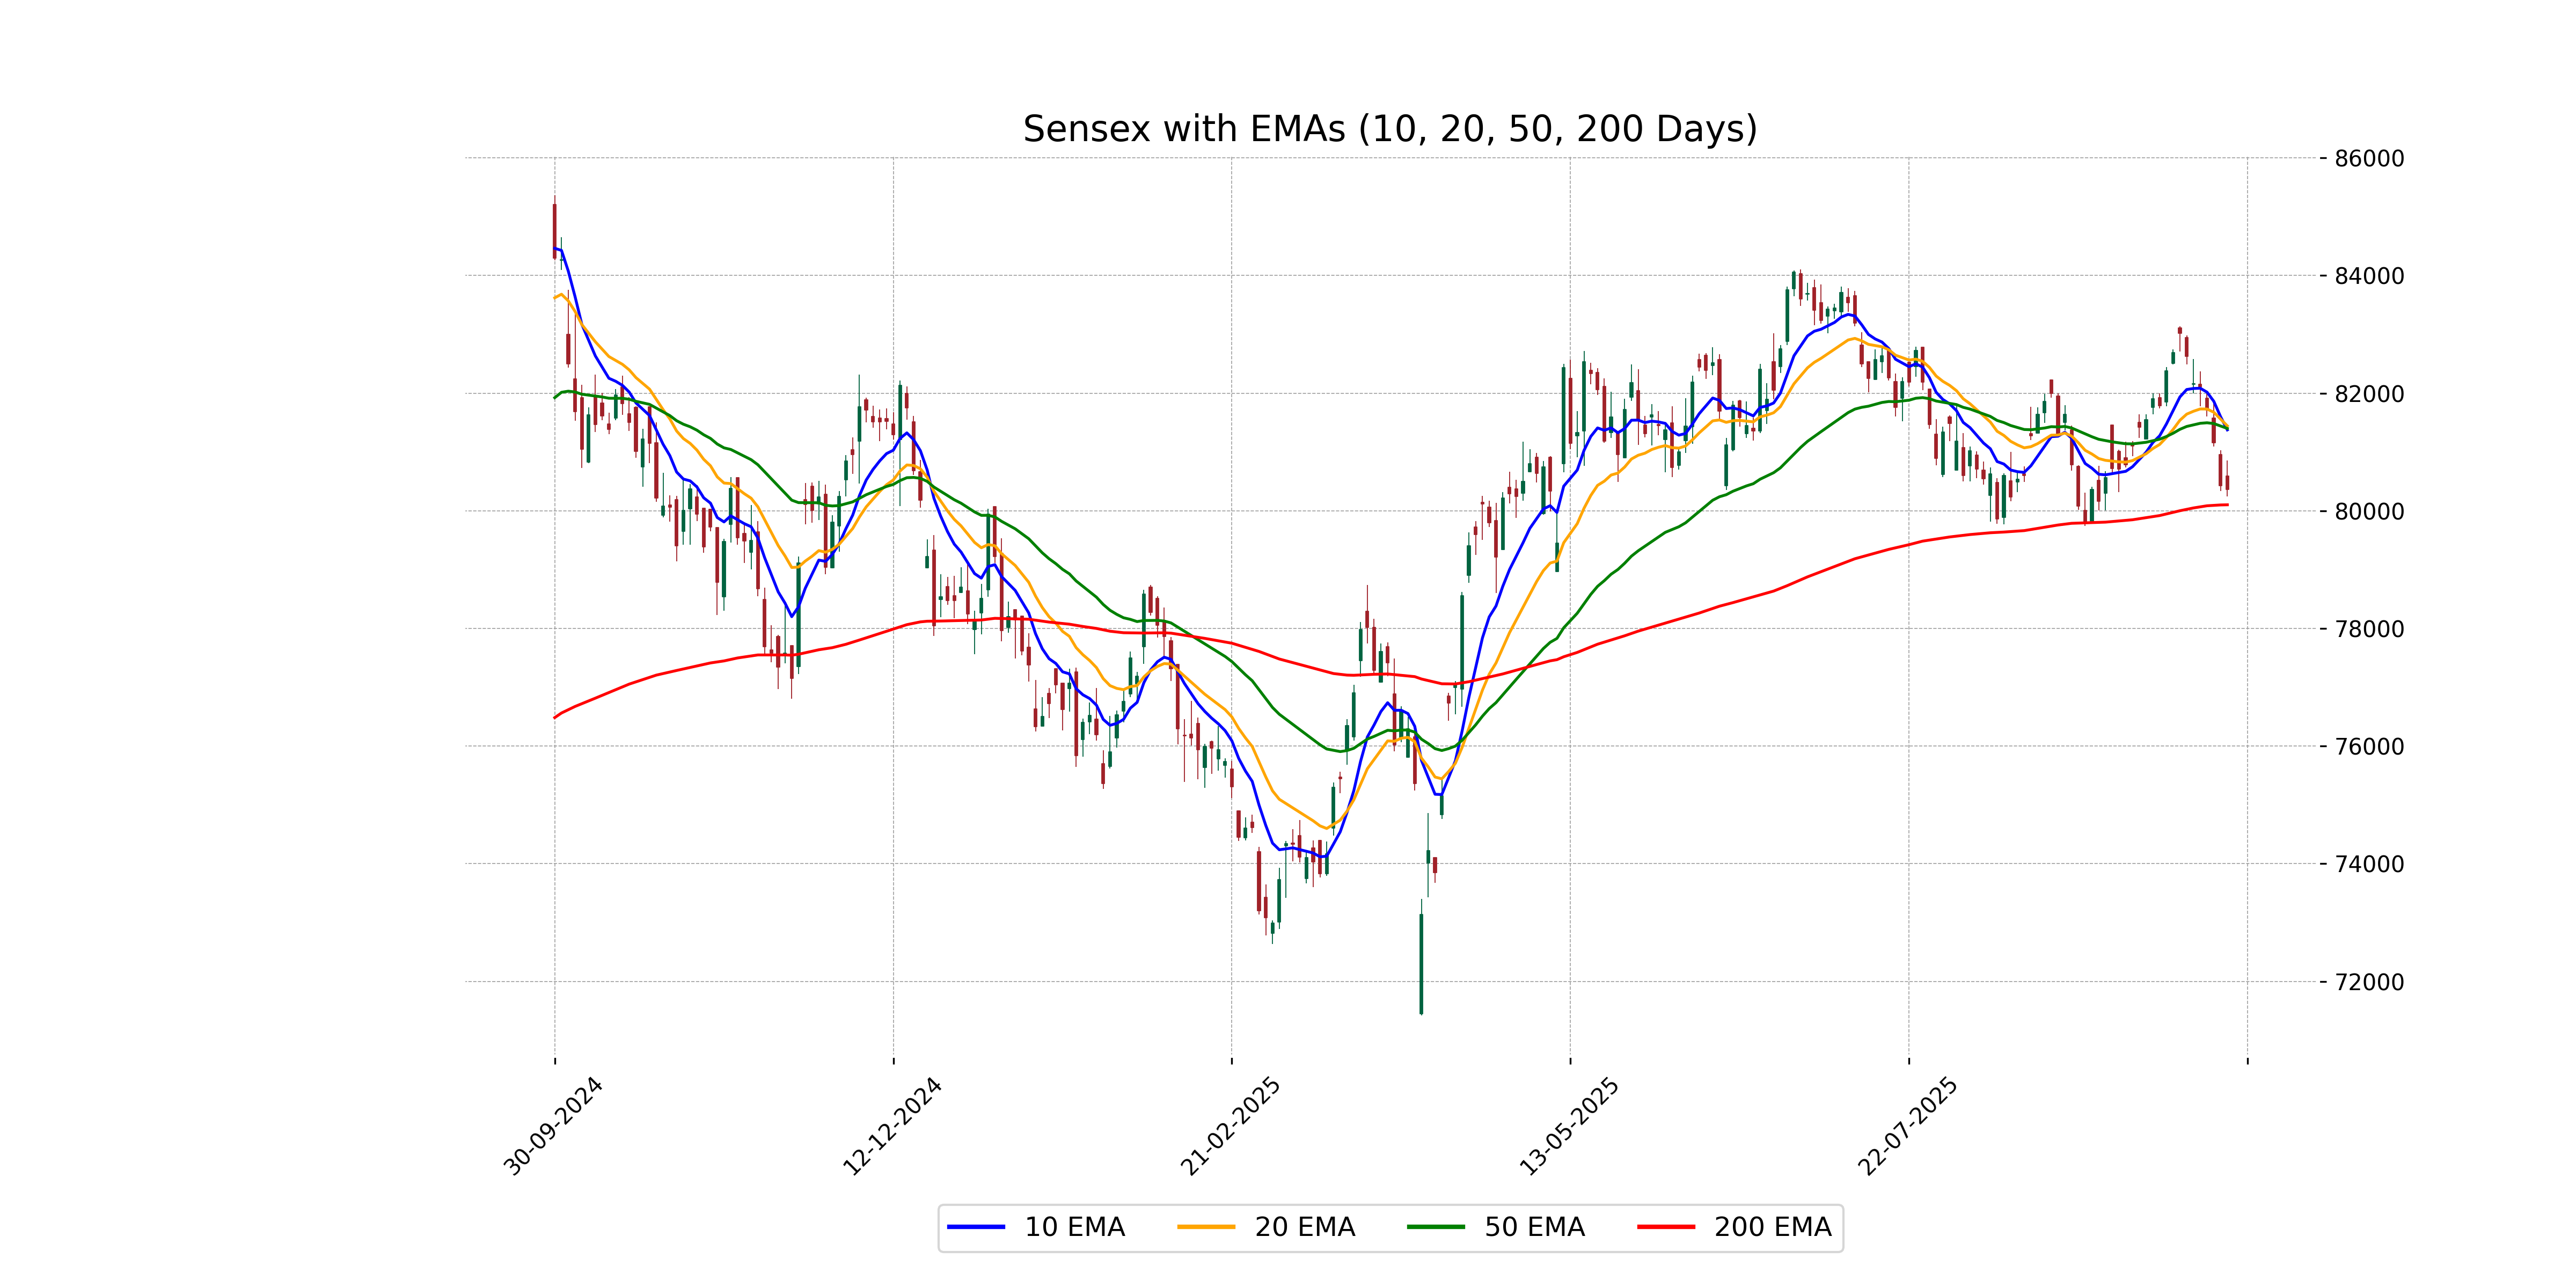
Relationship with Key Moving Averages
The Sensex closed below its 50-day EMA (81,399.60) and 10-day EMA (81,375.57), indicating a bearish sentiment in the short to mid-term. However, it closed above its 200-day EMA (80,102.07), suggesting a potential support level on a longer-term basis.
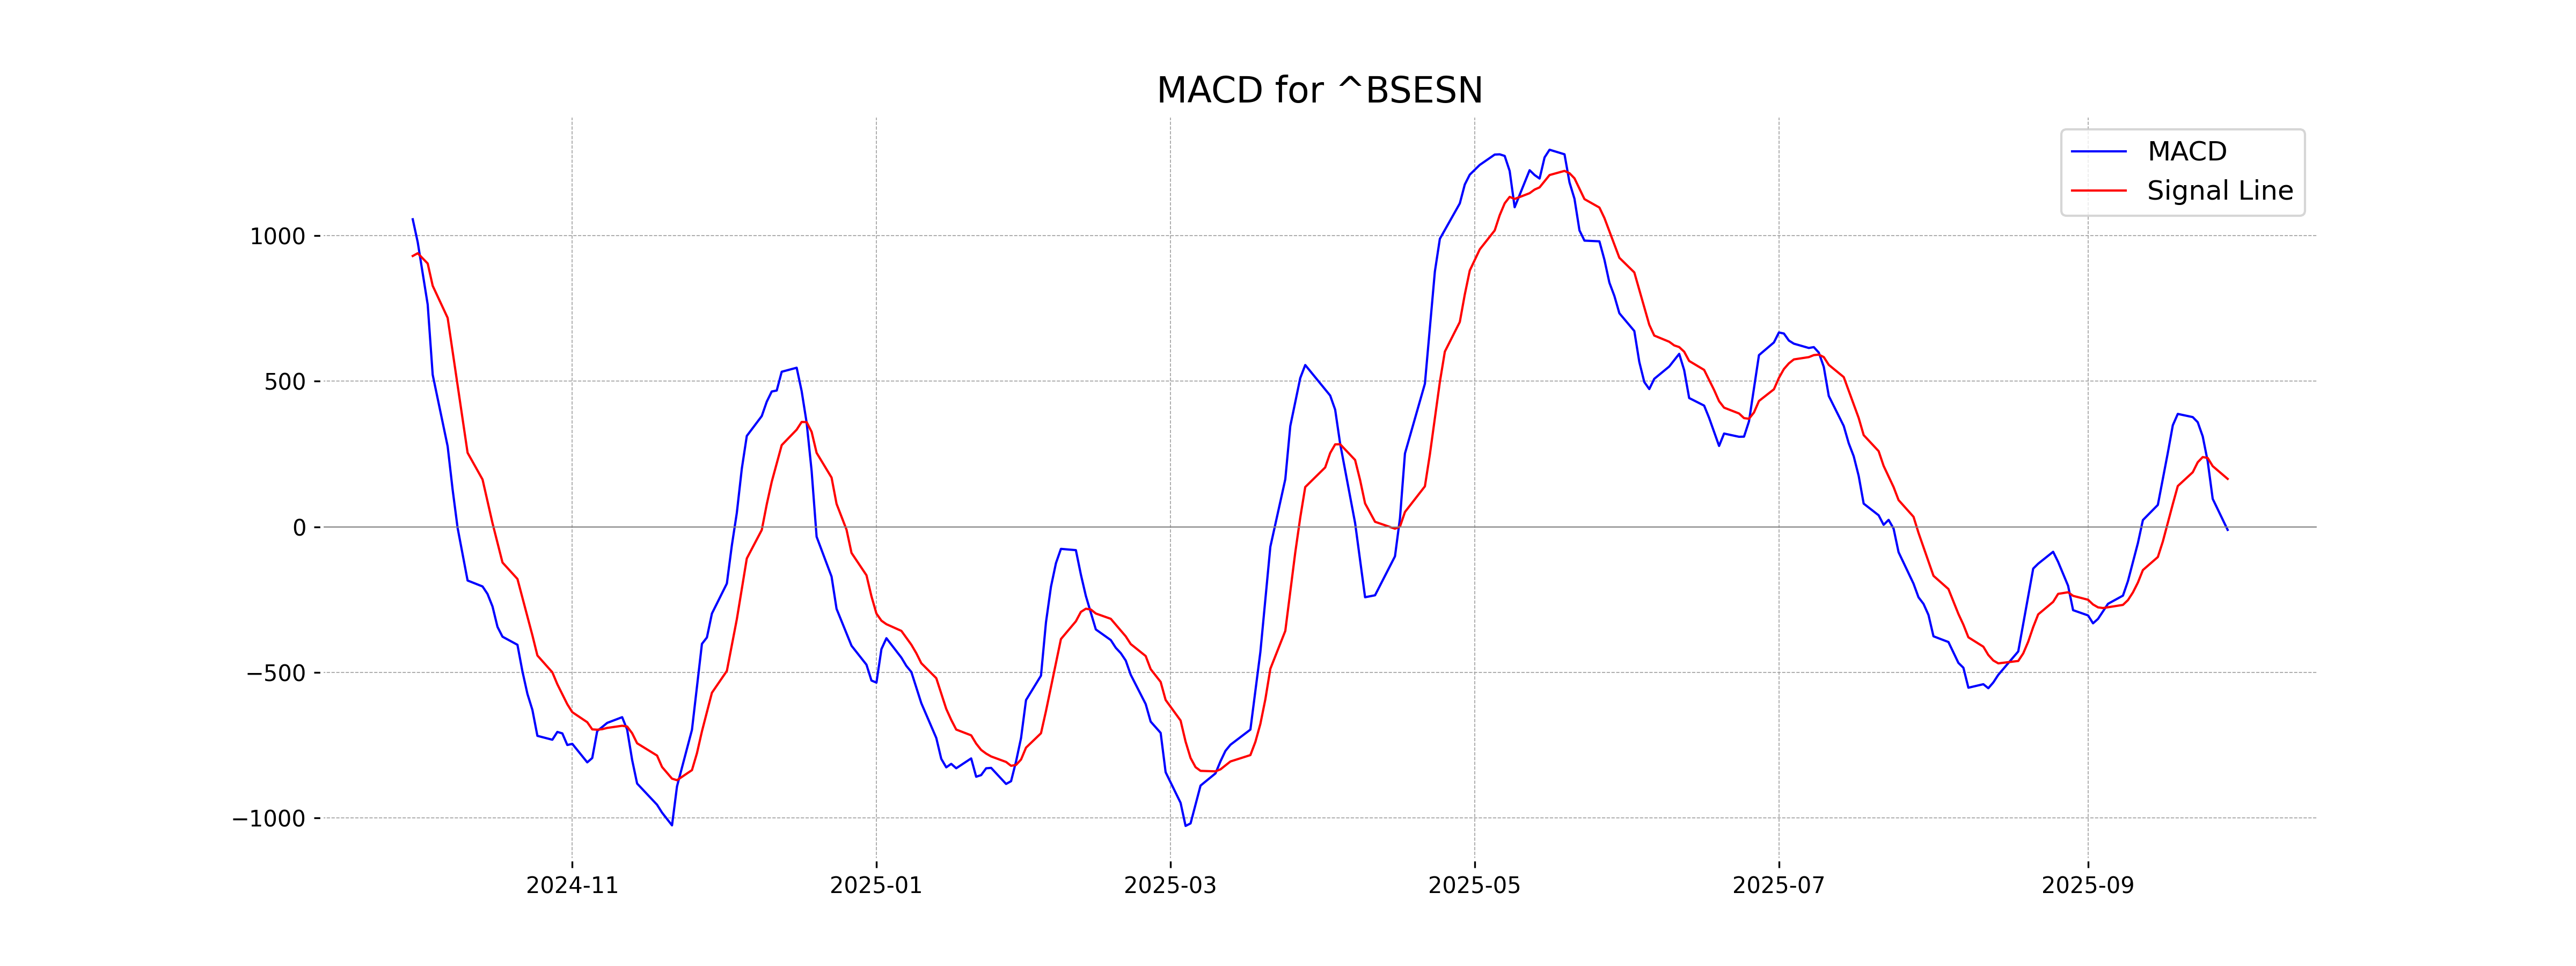
Moving Averages Trend (MACD)
The current MACD for Sensex is negative at -10.63, below the MACD Signal of 164.51, indicating a bearish trend. This suggests potential downward momentum in Sensex in the near term.
RSI Analysis
The Sensex has an RSI of 38.36, which is below the neutral 50 mark, indicating that the index is entering or already in a bearish trend. This suggests that the market might be experiencing some selling pressure, and the current sentiment is more negative than positive.
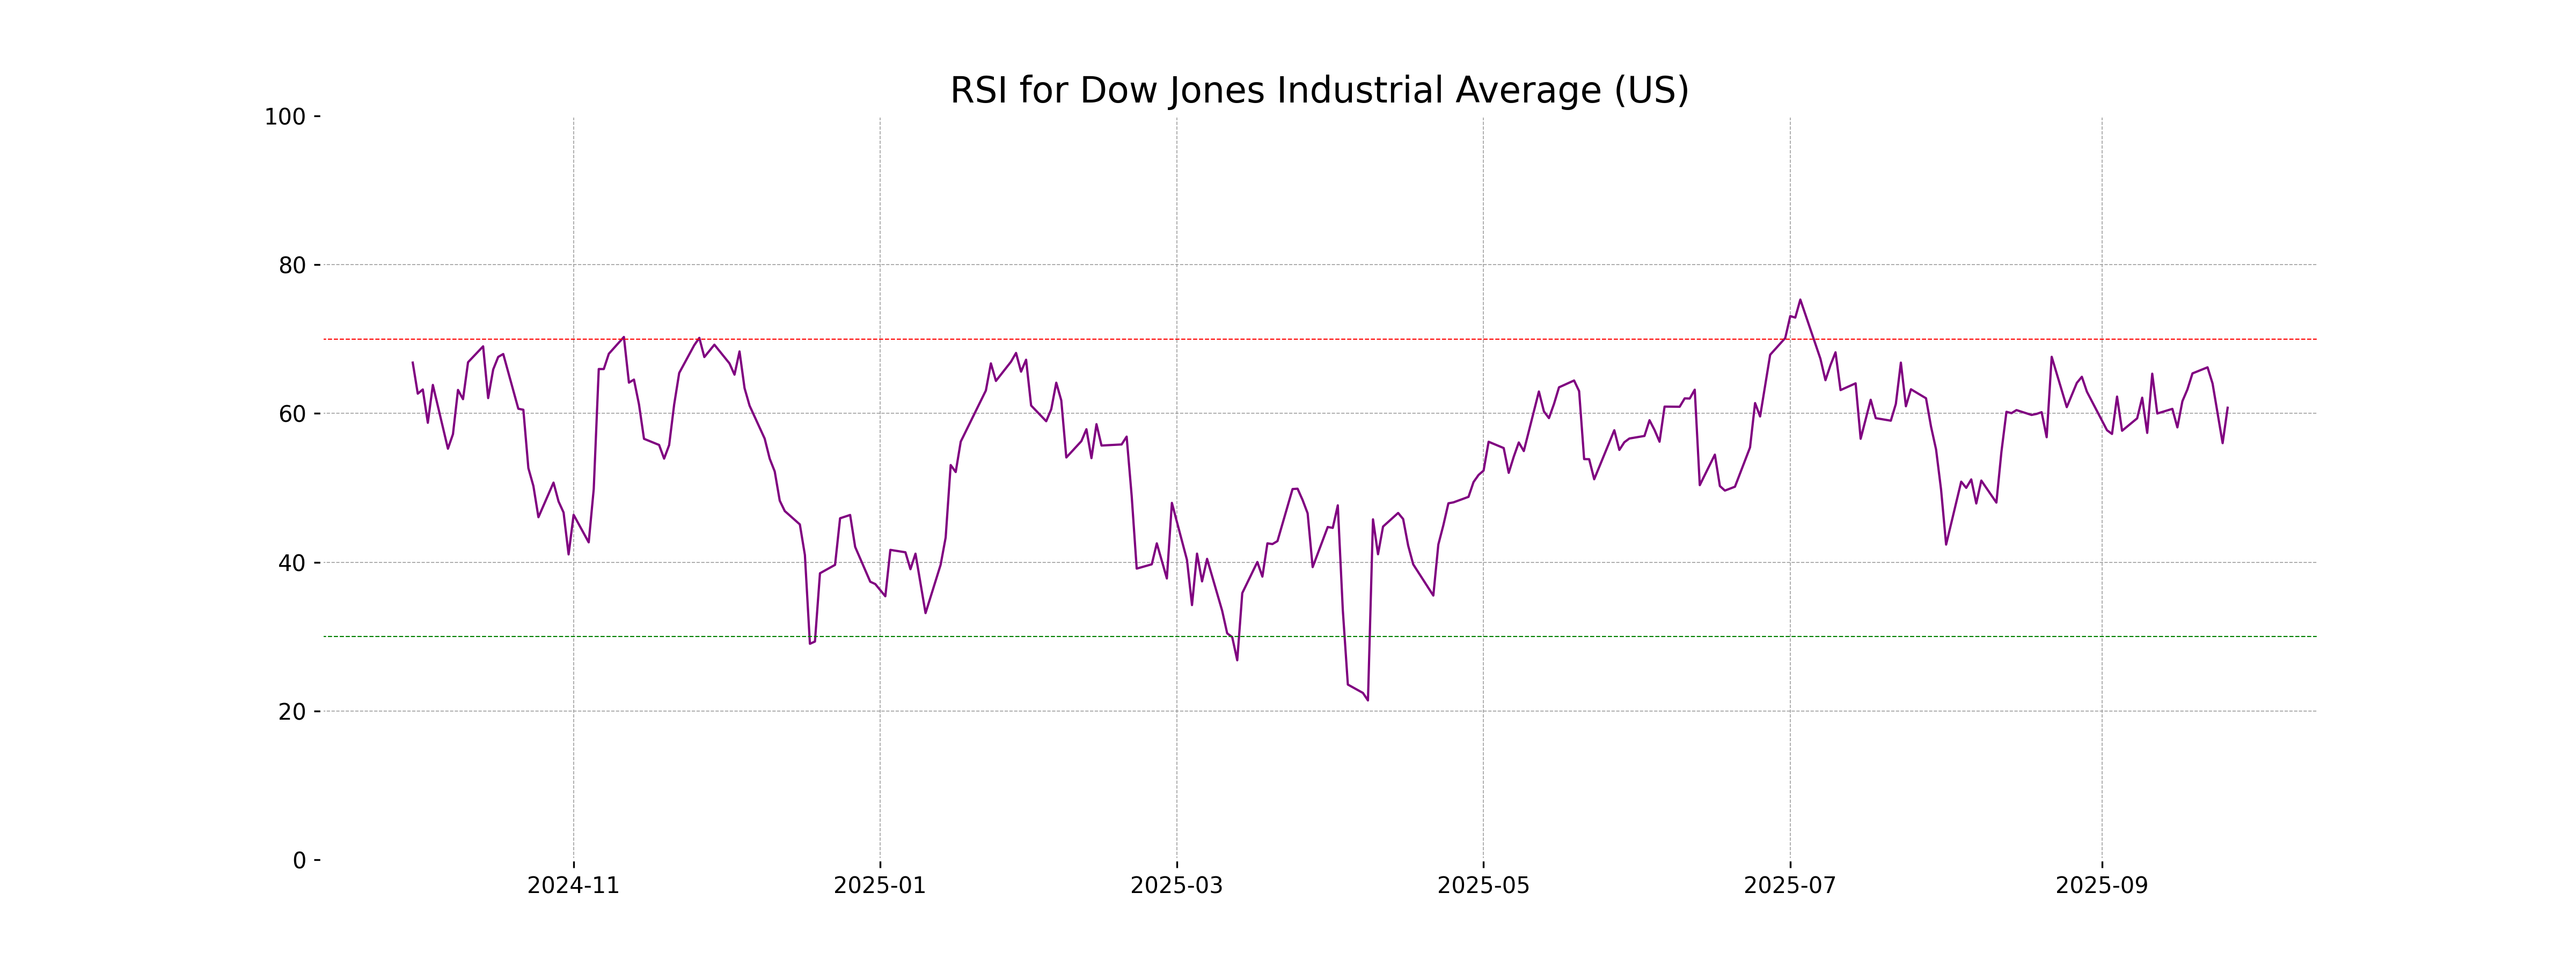
Analysis for Dow Jones Industrial Average (US) - September 29, 2025
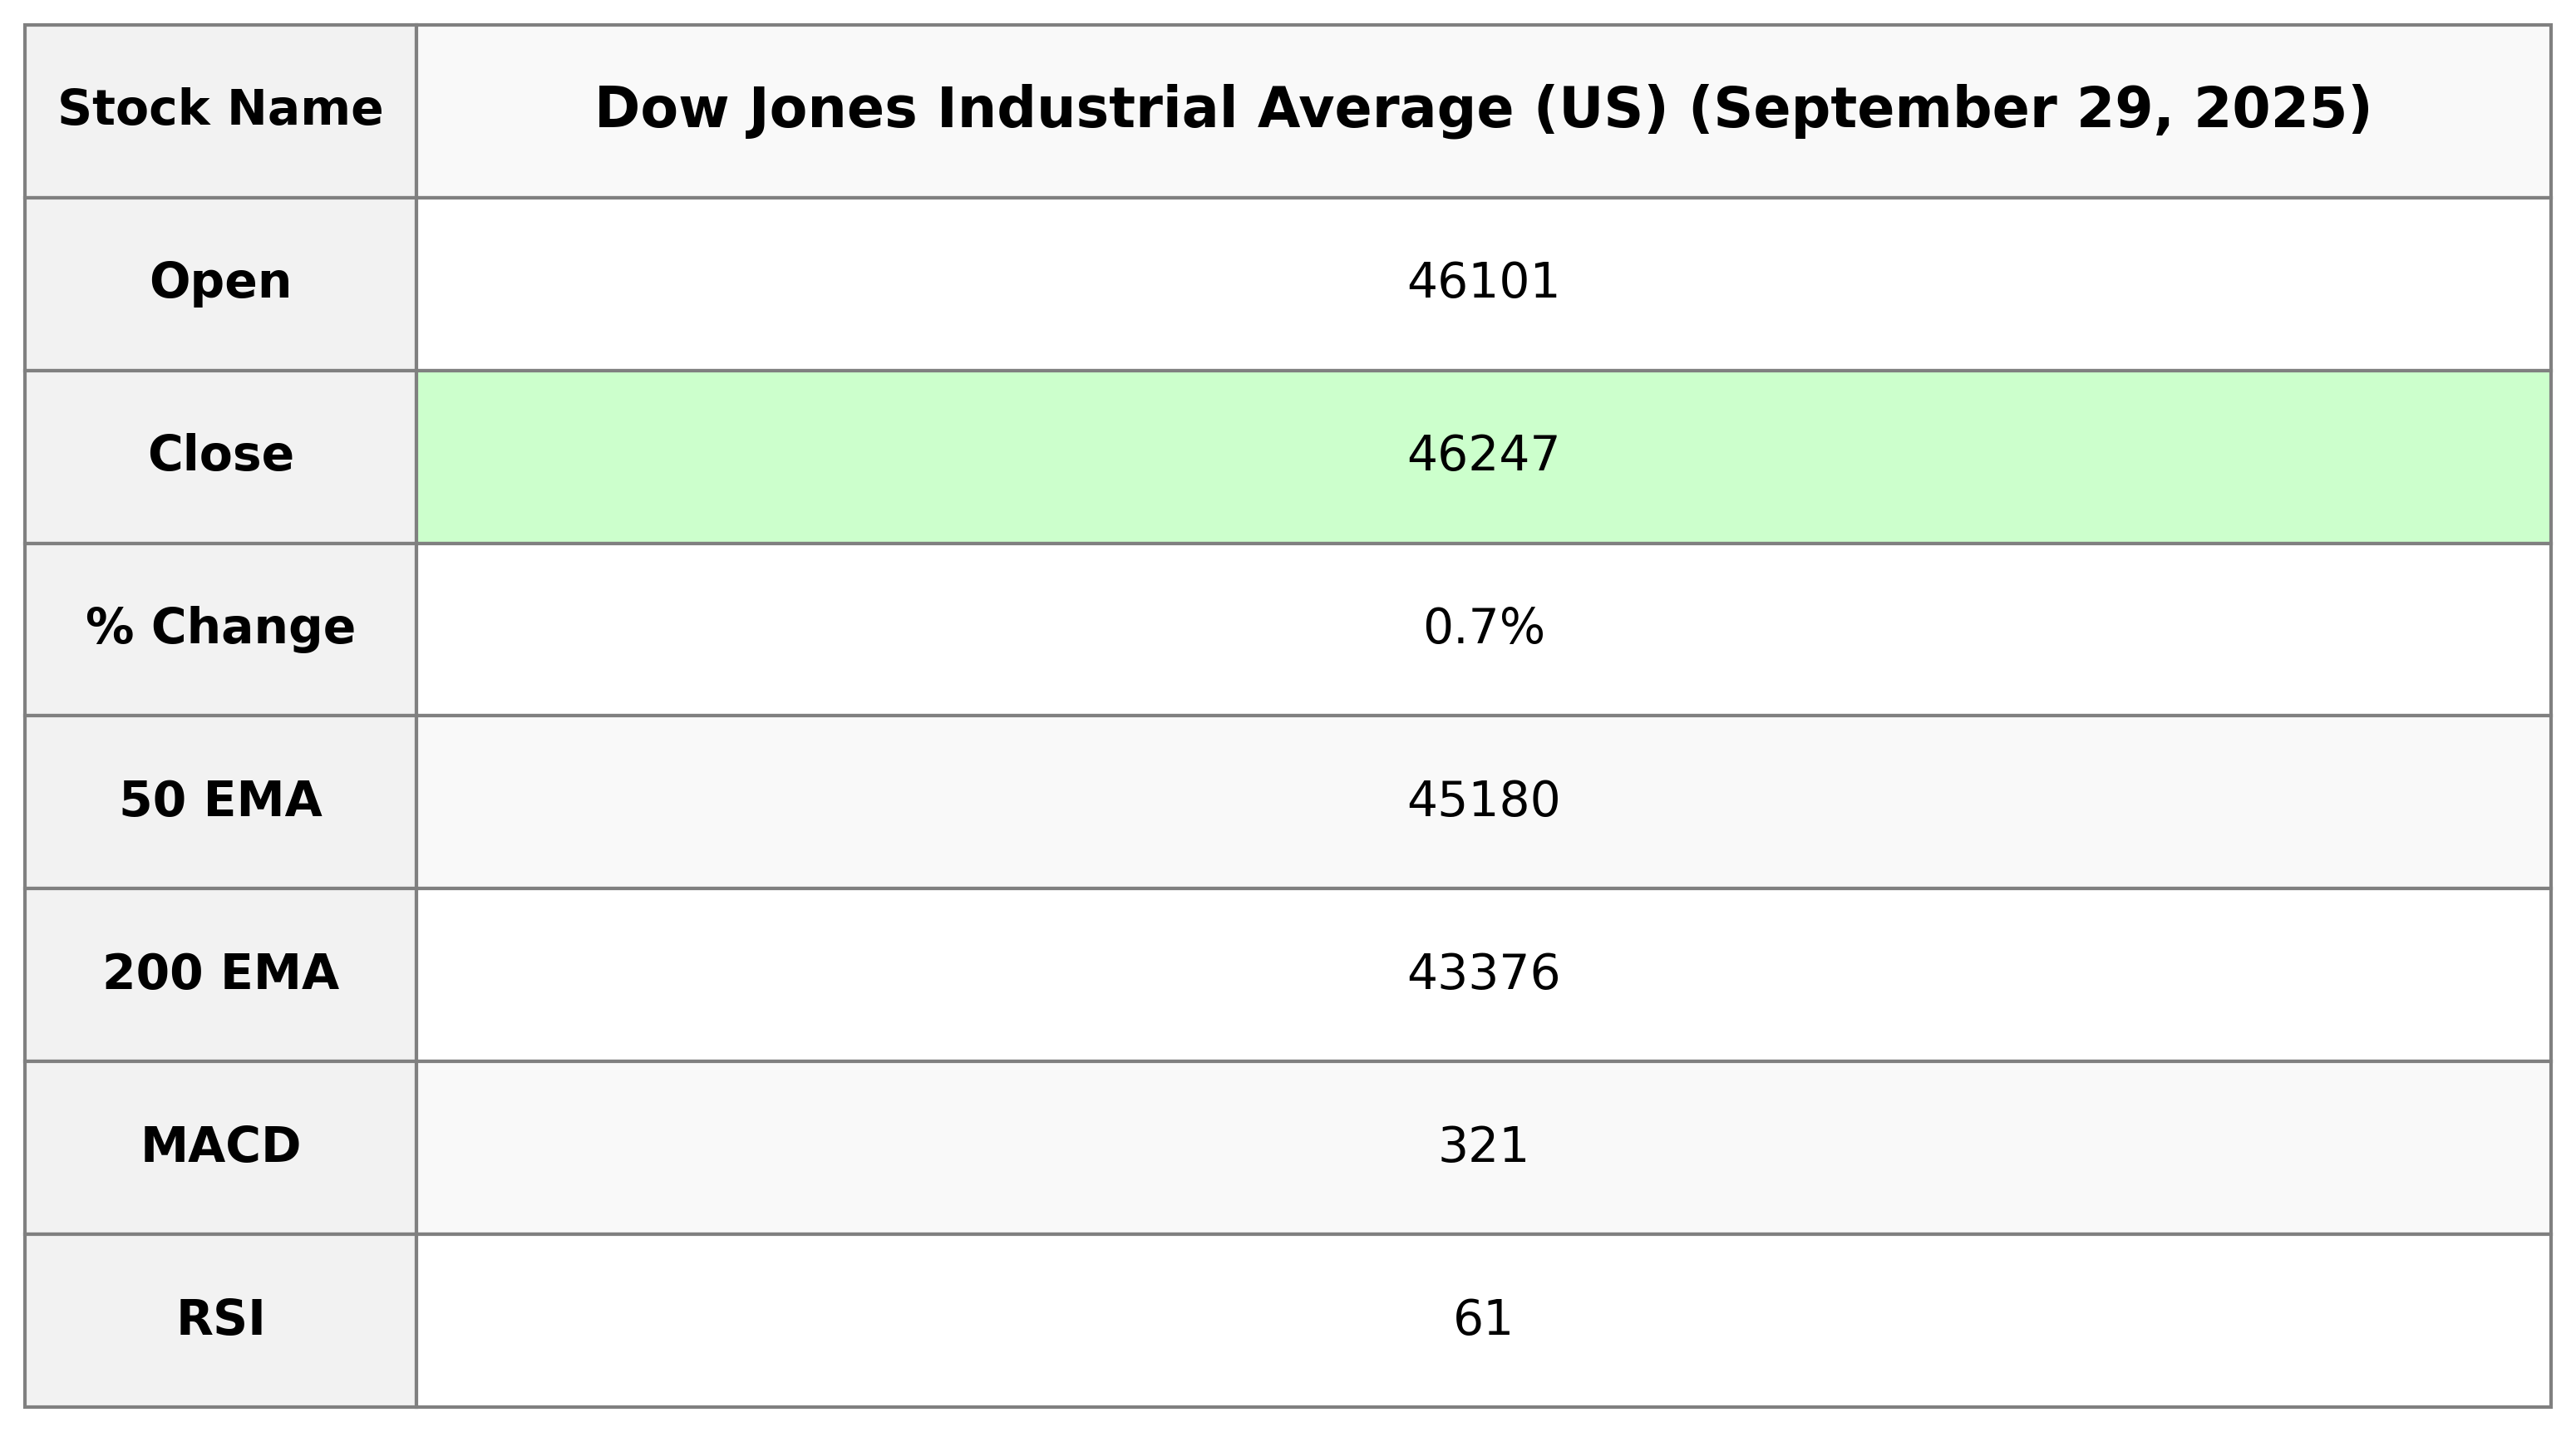
Dow Jones Industrial Average (US) opened at 46101.45 and closed at 46247.29, with a high of 46353.03 and a low of 46051.92. The index saw a significant points increase of 299.97, reflecting a percentage change of 0.65%. Technical indicators show a 50-day EMA of 45180.35, a 200-day EMA of 43375.64, and an RSI of 60.77, suggesting a bullish trend.
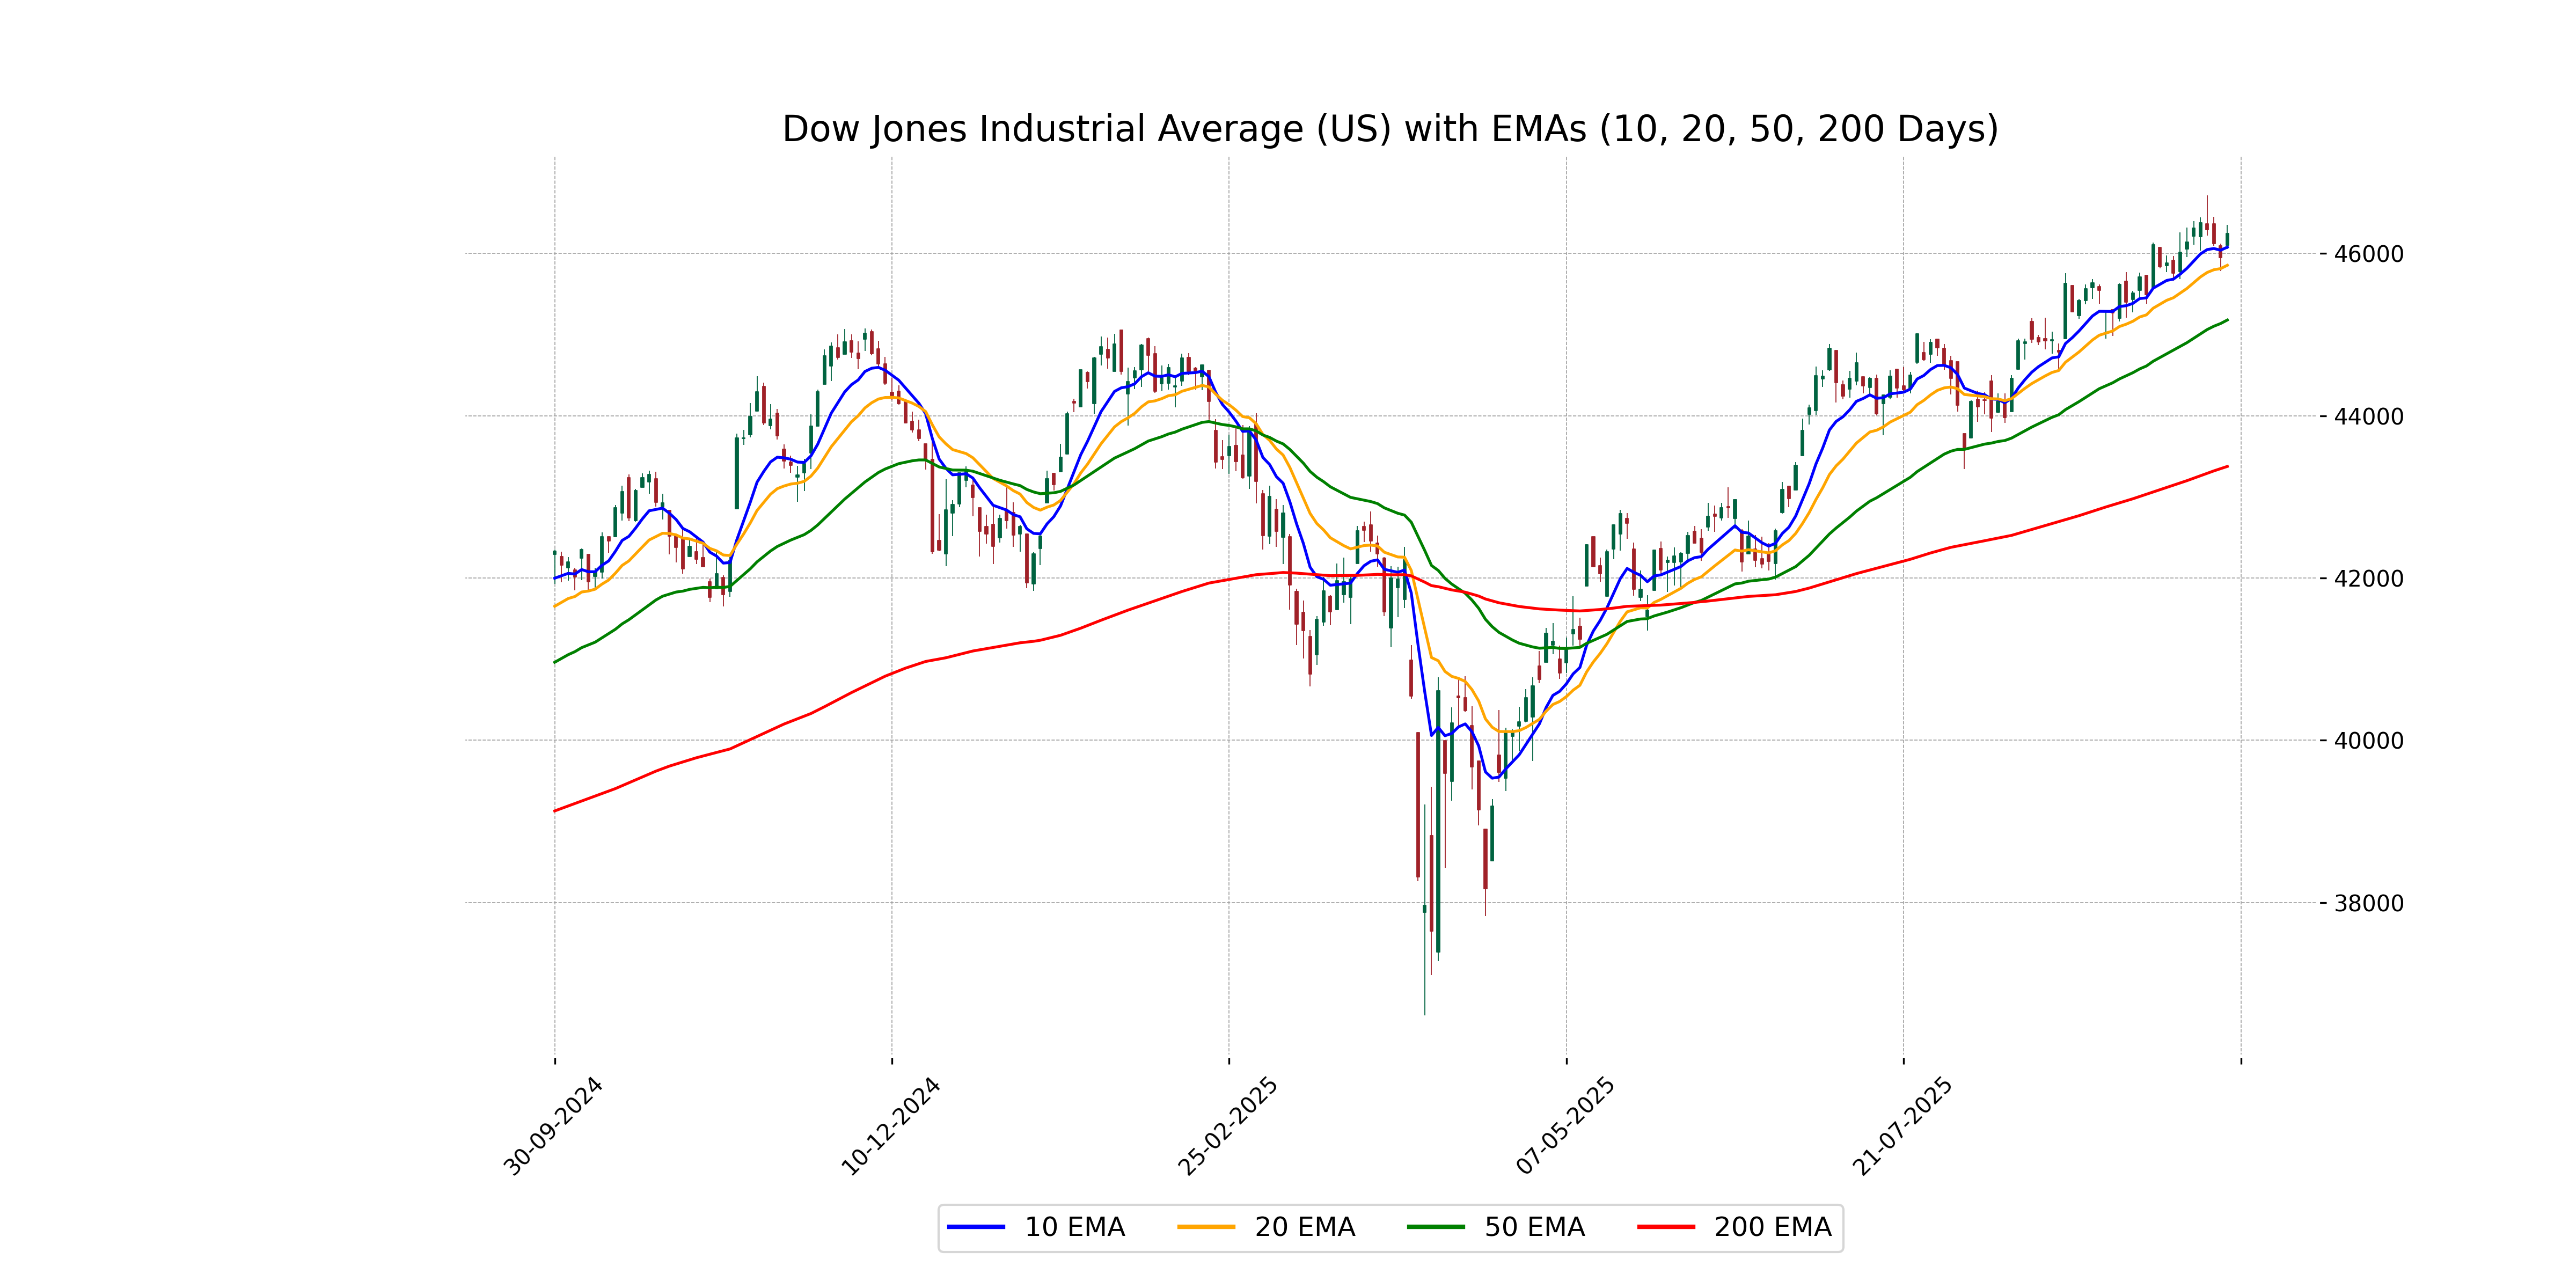
Relationship with Key Moving Averages
The Dow Jones Industrial Average opened at 46,101.45 and closed at 46,247.29, showing a positive movement above its key moving averages. It is trading higher than the 10-day EMA (46,078.29), 20-day EMA (45,855.08), 50-day EMA (45,180.35), and 200-day EMA (43,375.64), indicating a strong upward trend with a positive short to long-term momentum.
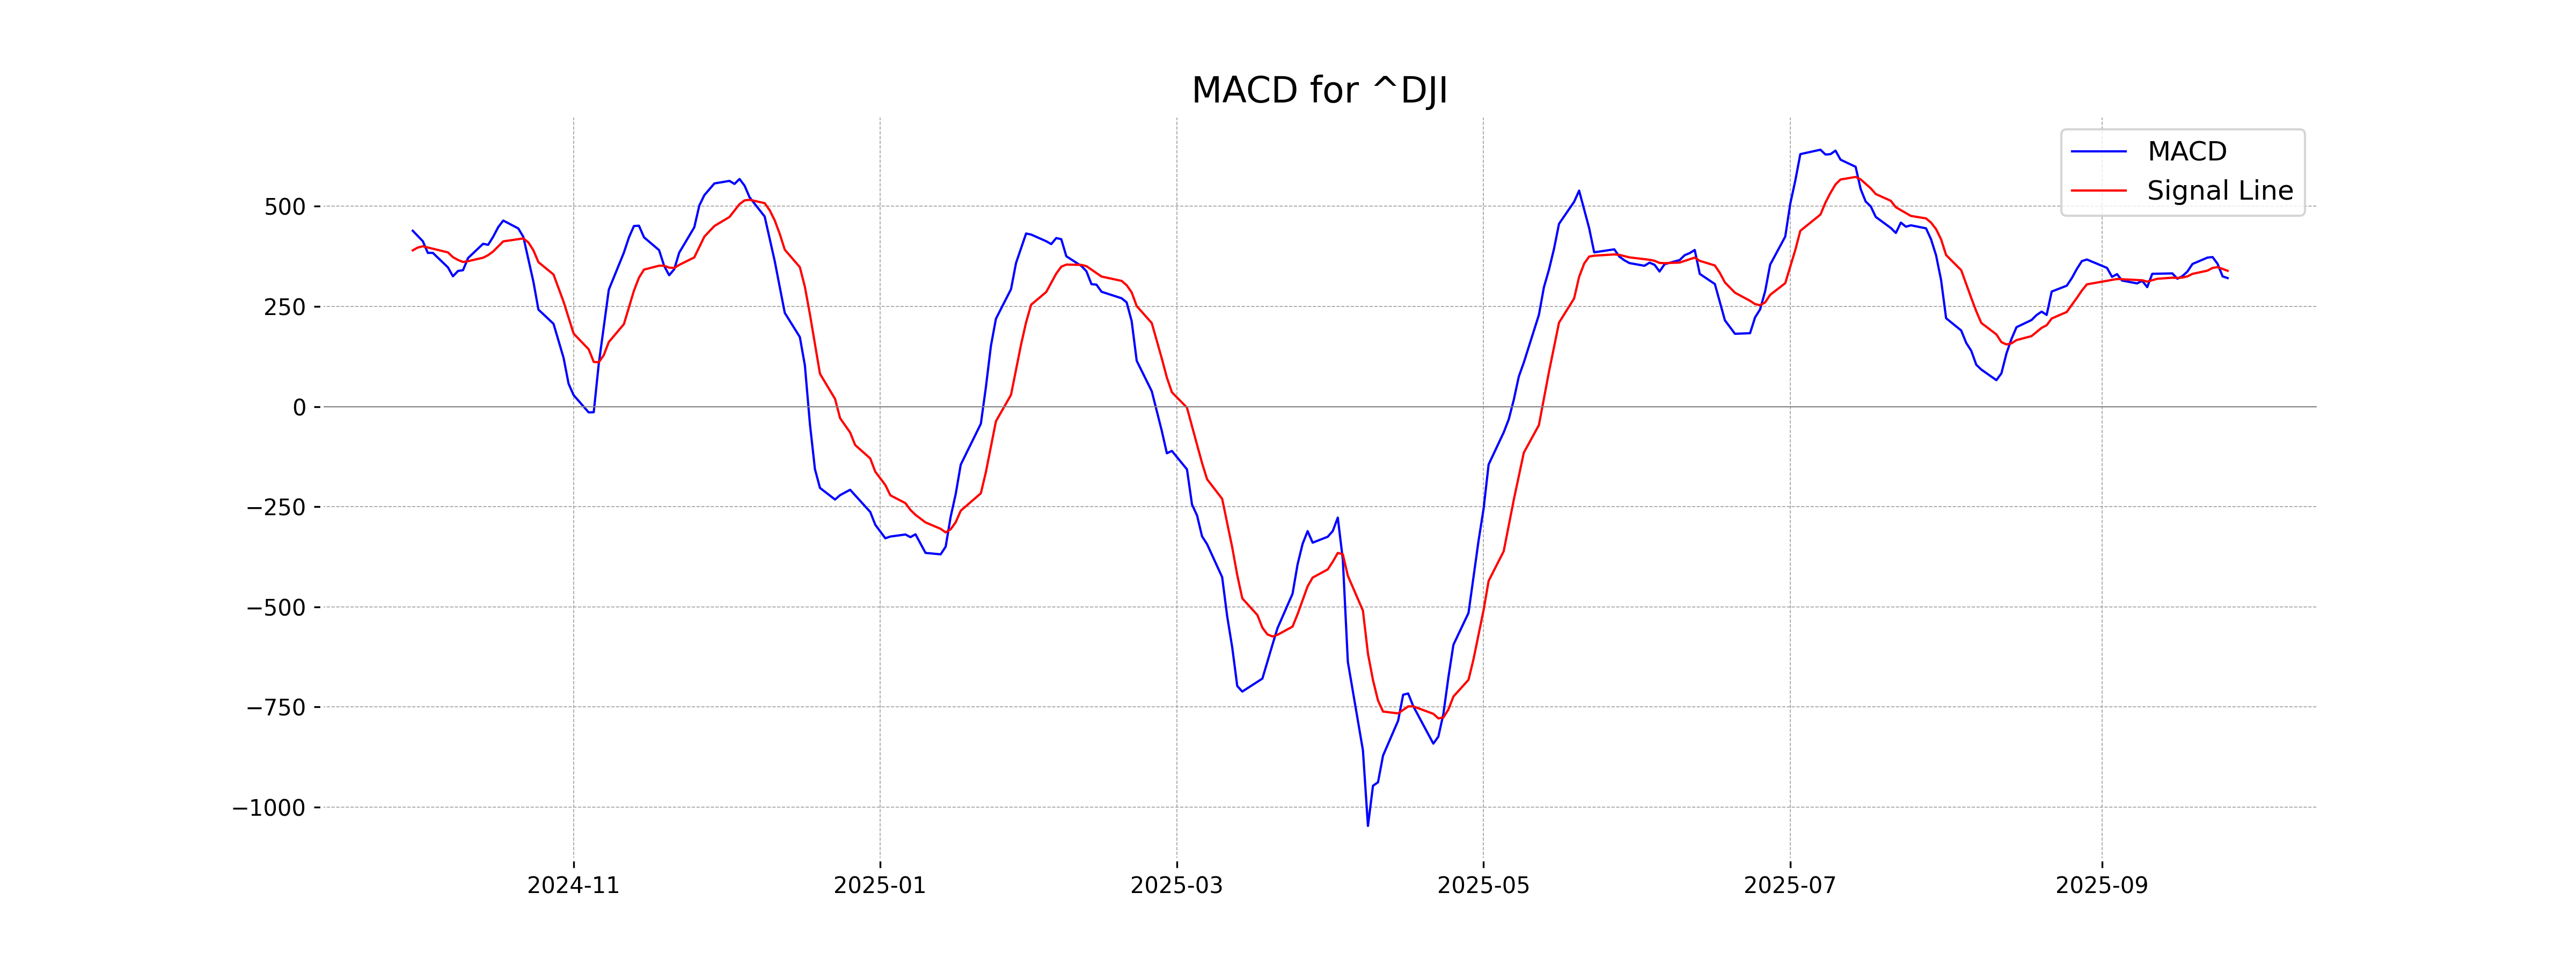
Moving Averages Trend (MACD)
The MACD value for the Dow Jones Industrial Average is 320.75, indicating a potential change in trend. Since the MACD is below the MACD Signal value of 338.98, it suggests a bearish phase as the trend strength might be decreasing. This implies that traders might be cautious about the current momentum.
RSI Analysis
RSI Analysis for Dow Jones Industrial Average (US): The RSI of 60.77 indicates a moderate strength in the upward momentum; while not yet overbought, it suggests investors could remain cautiously optimistic. It's important to monitor if the RSI approaches the overbought threshold of 70, which might signal a potential pullback in the near term.
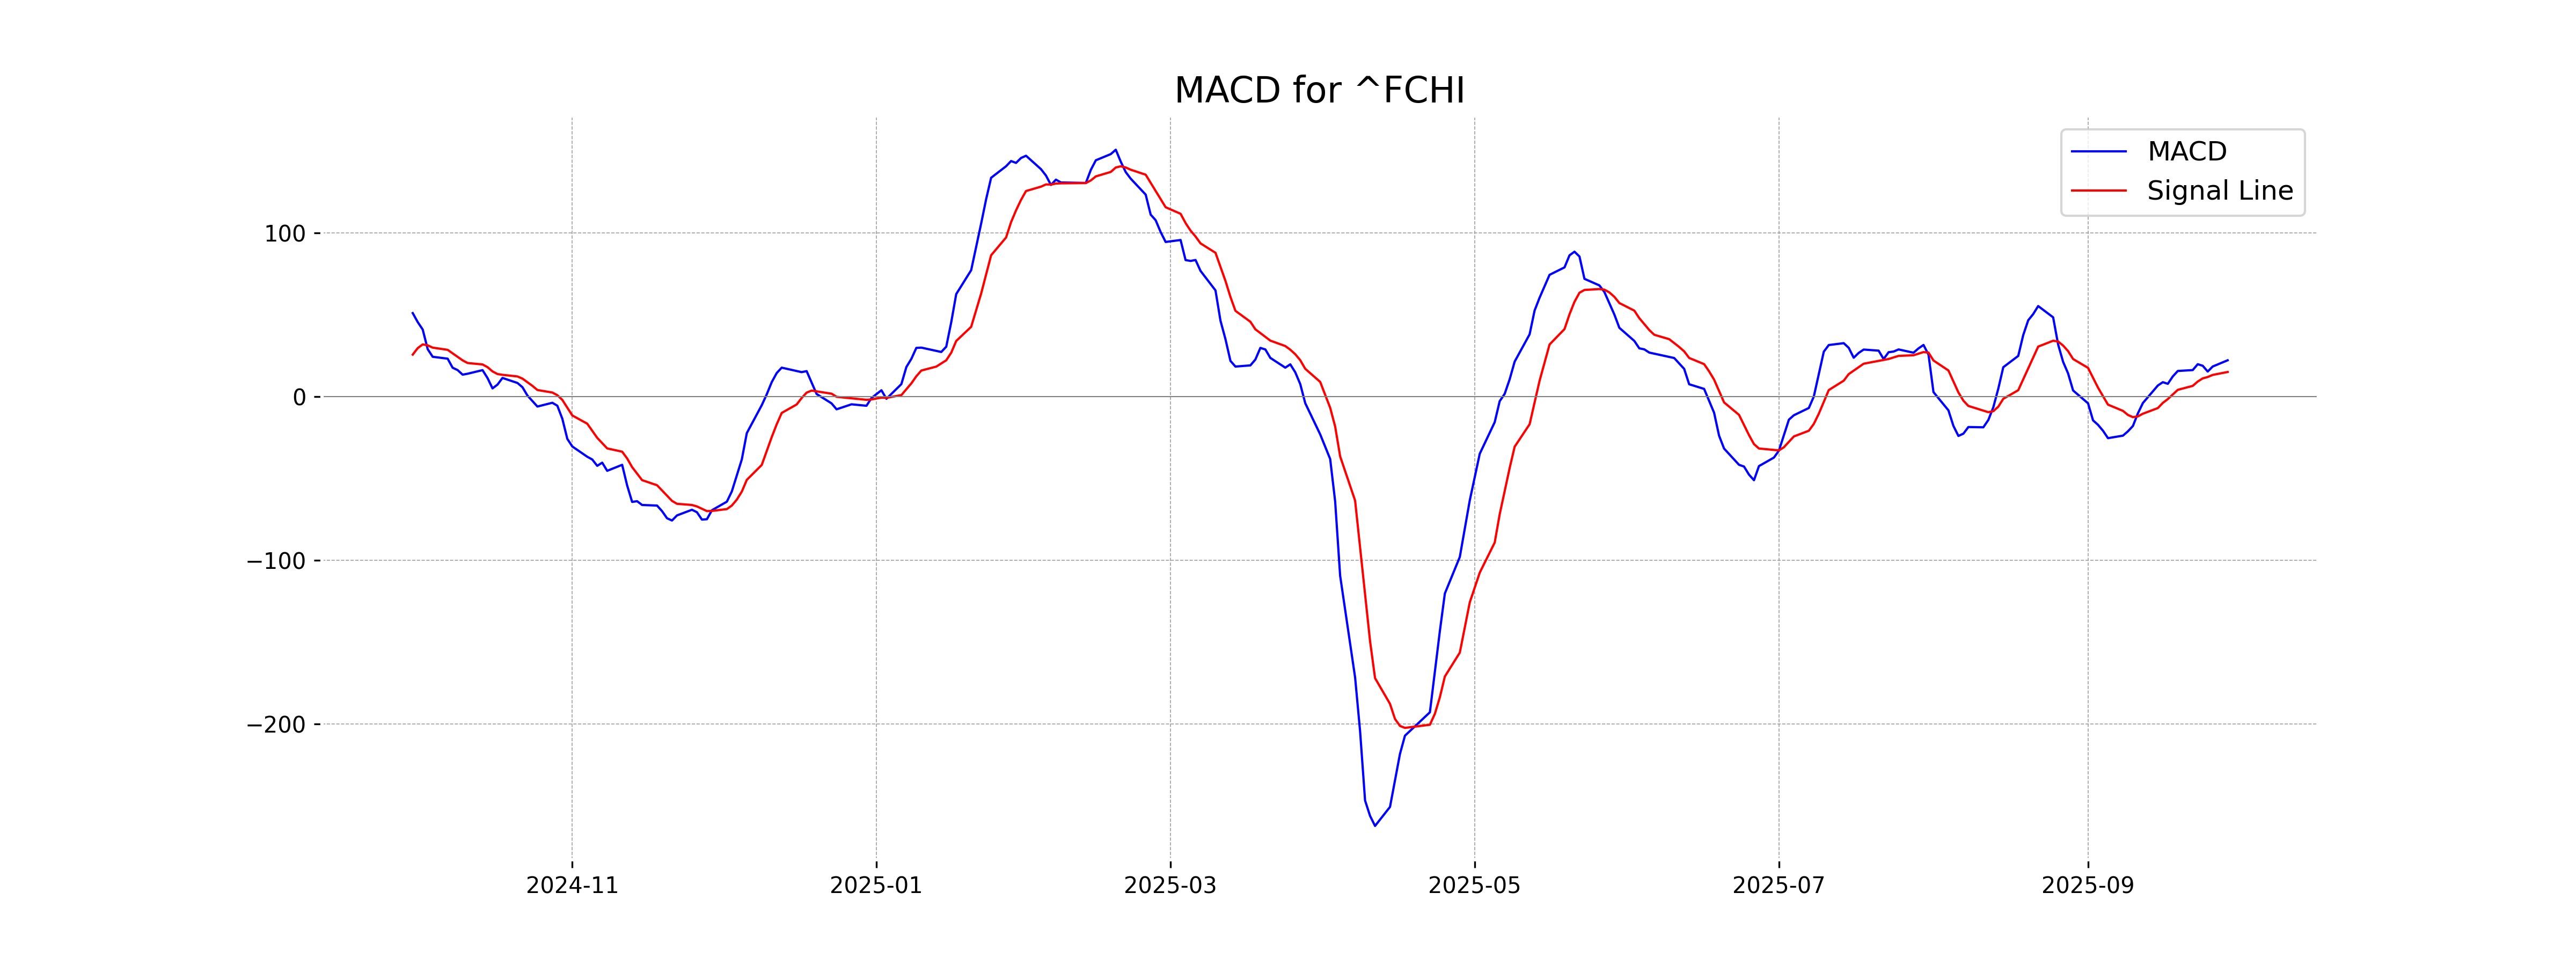
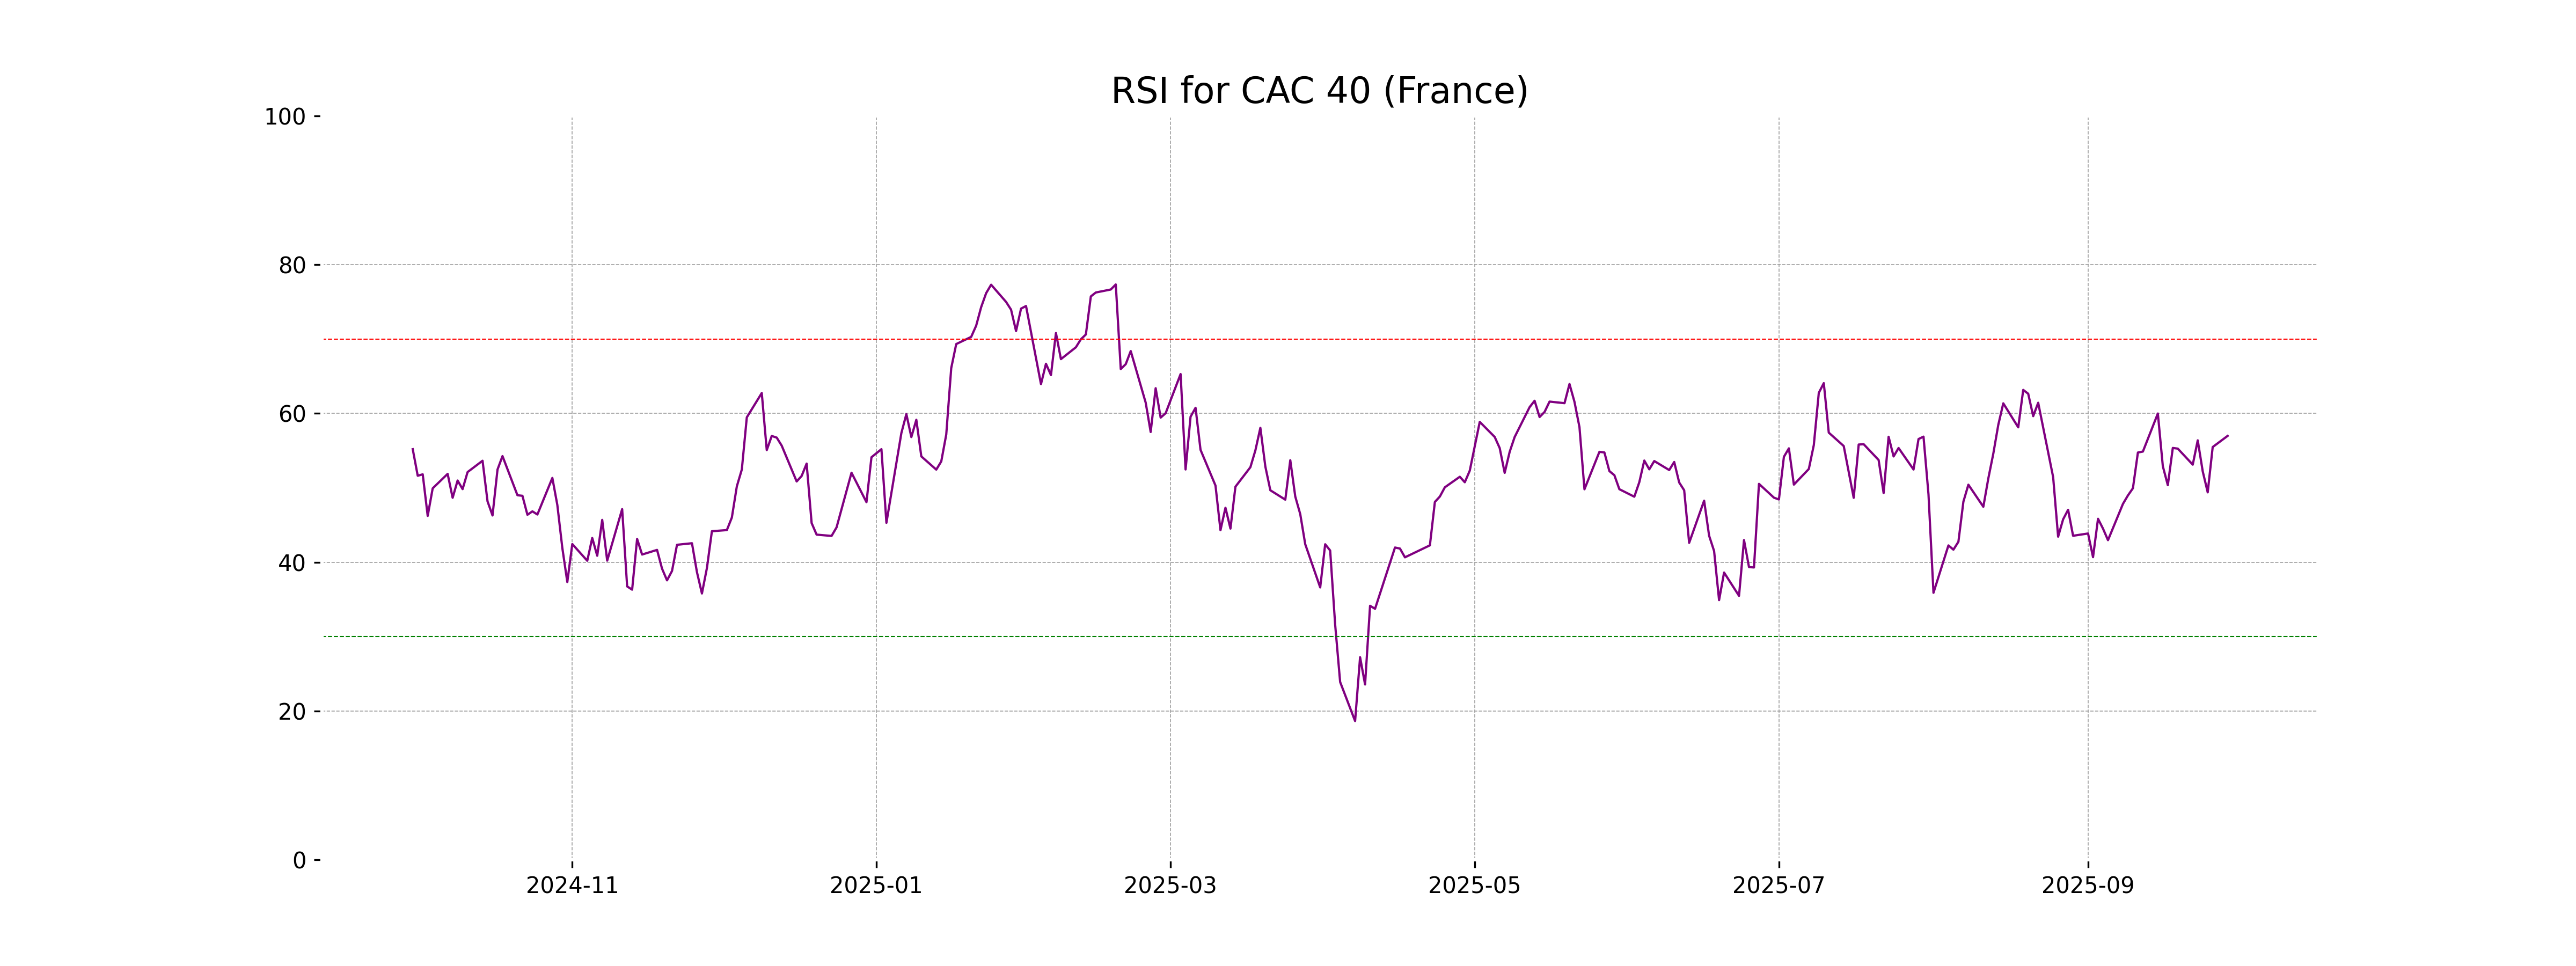
Analysis for CAC 40 (France) - September 29, 2025
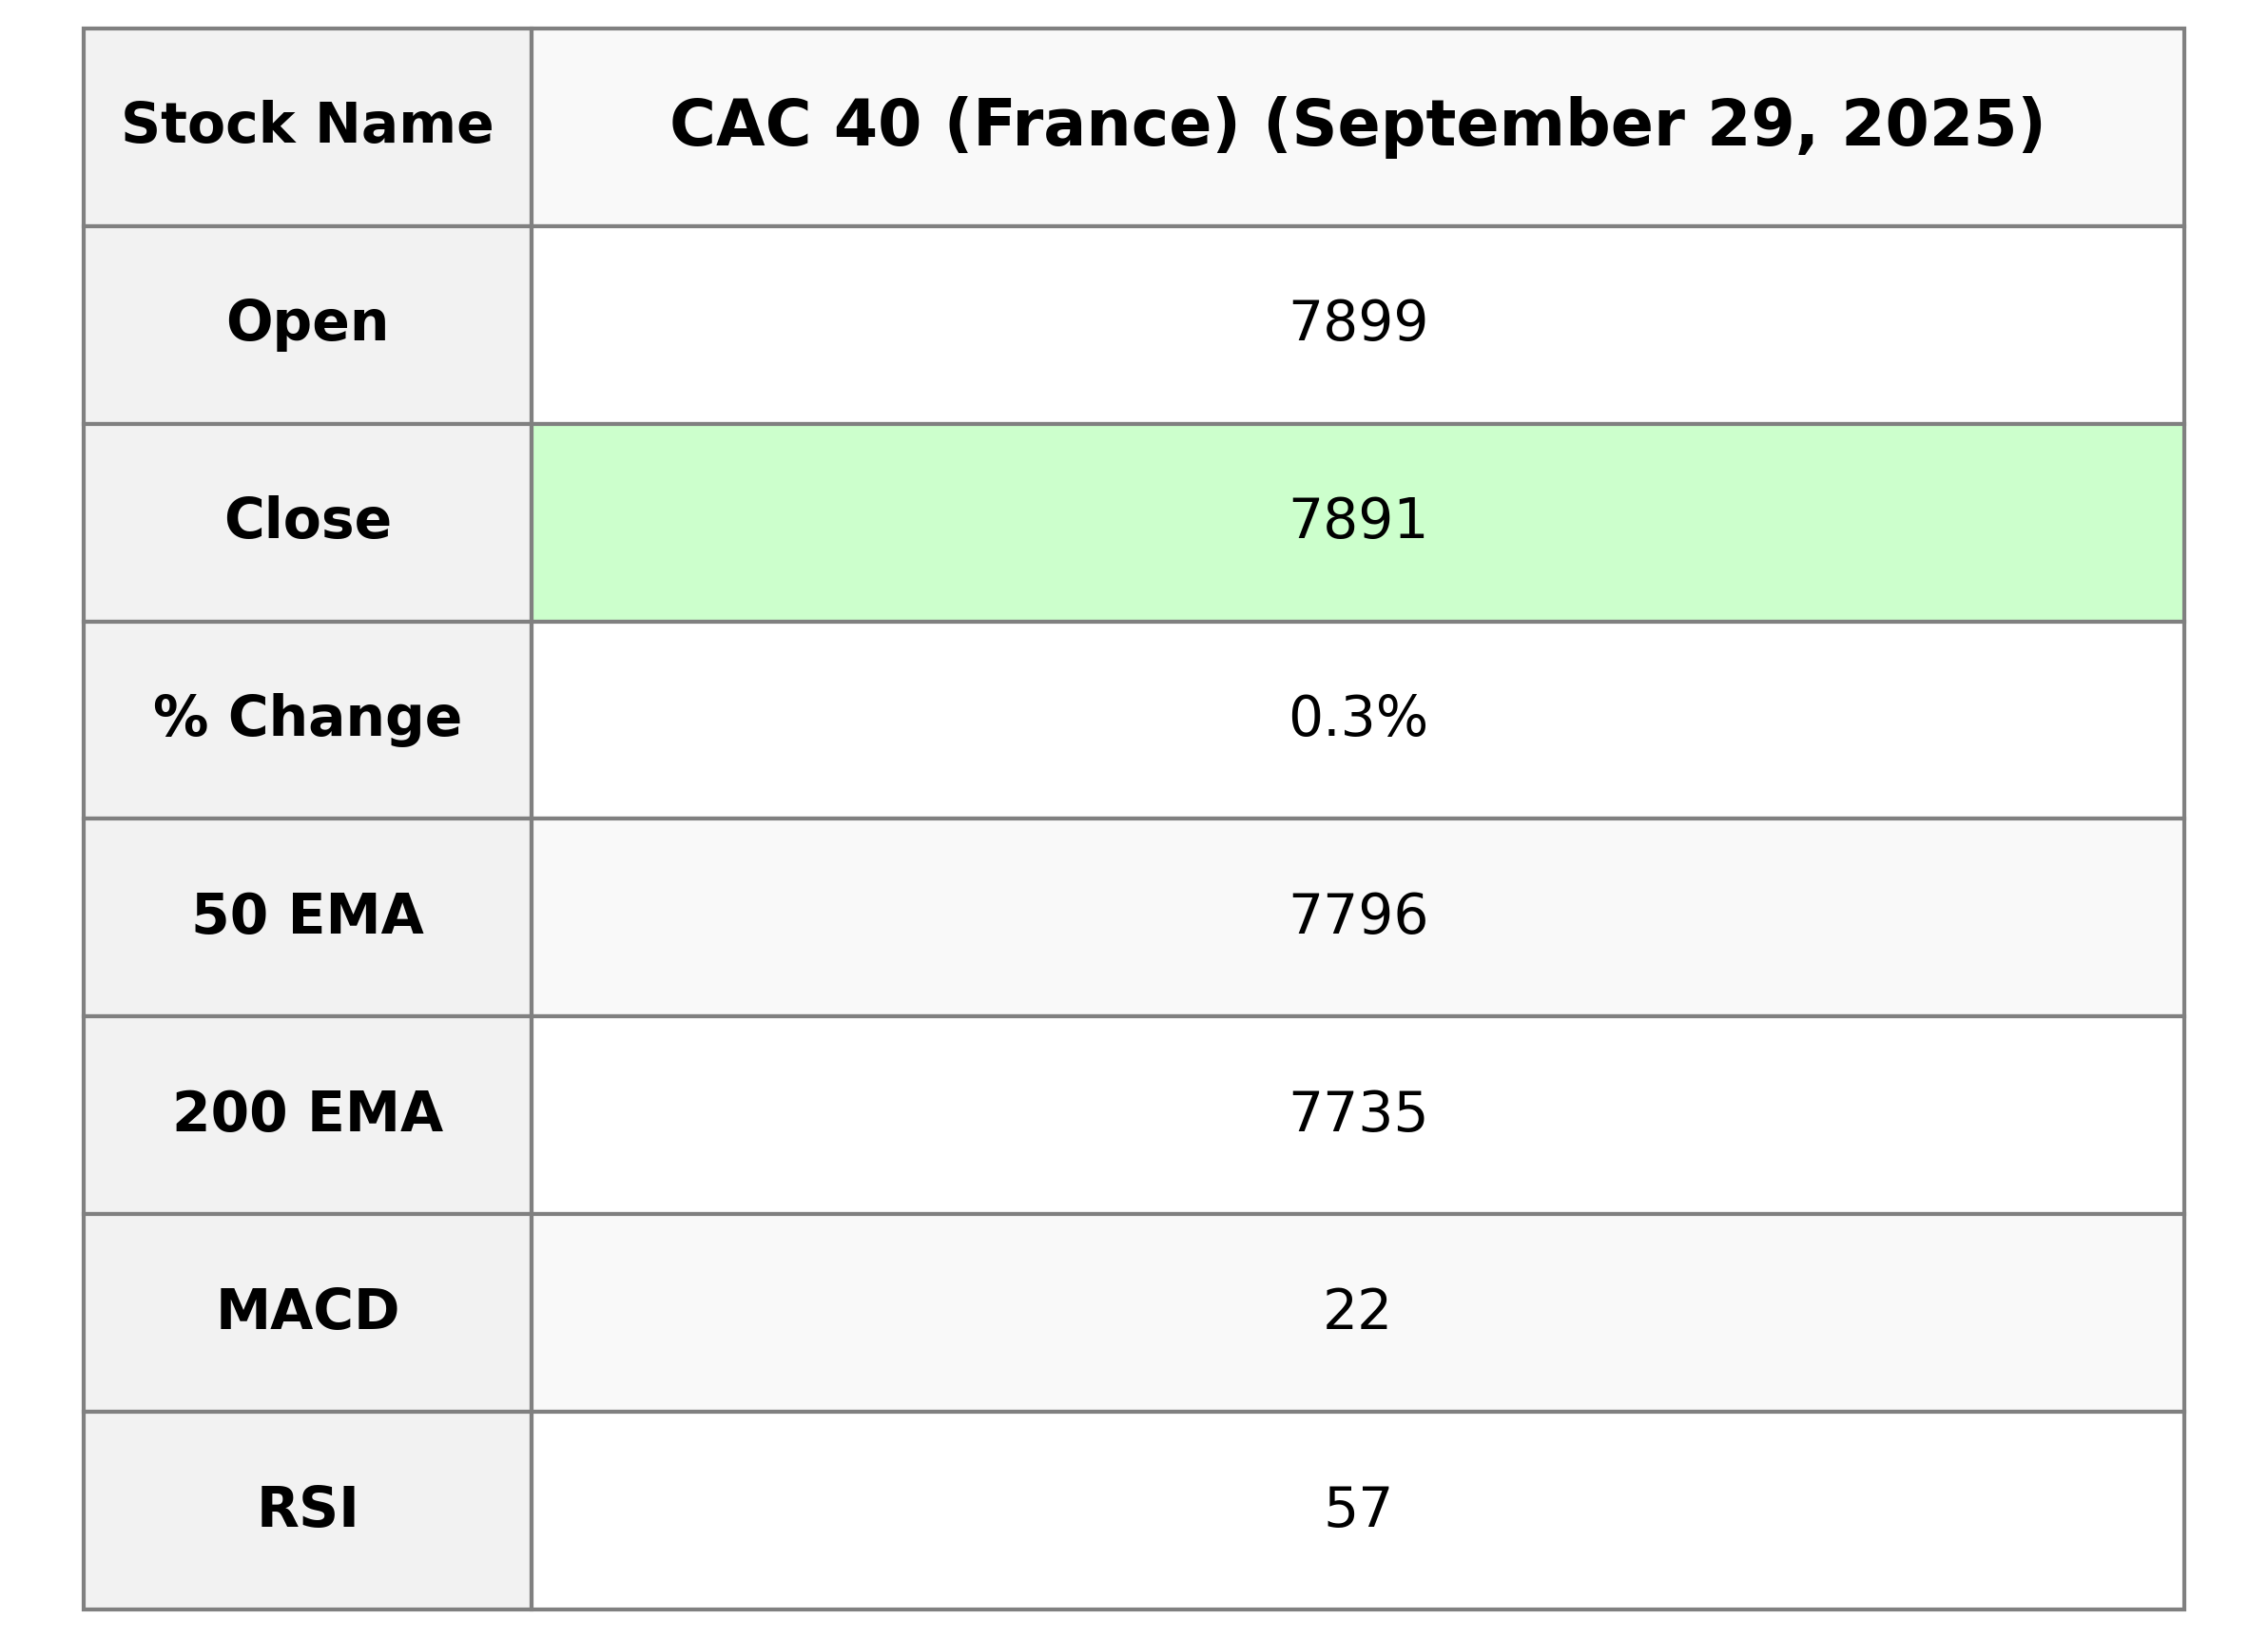
CAC 40 (France) Performance: The CAC 40 index opened at 7899.02 and closed slightly lower at 7890.92. The index experienced a small percentage gain of 0.26% from the previous close, with a points change of 20.24. The current RSI of 56.99 suggests moderate momentum, while the MACD is above its signal line, indicating potential bullishness.
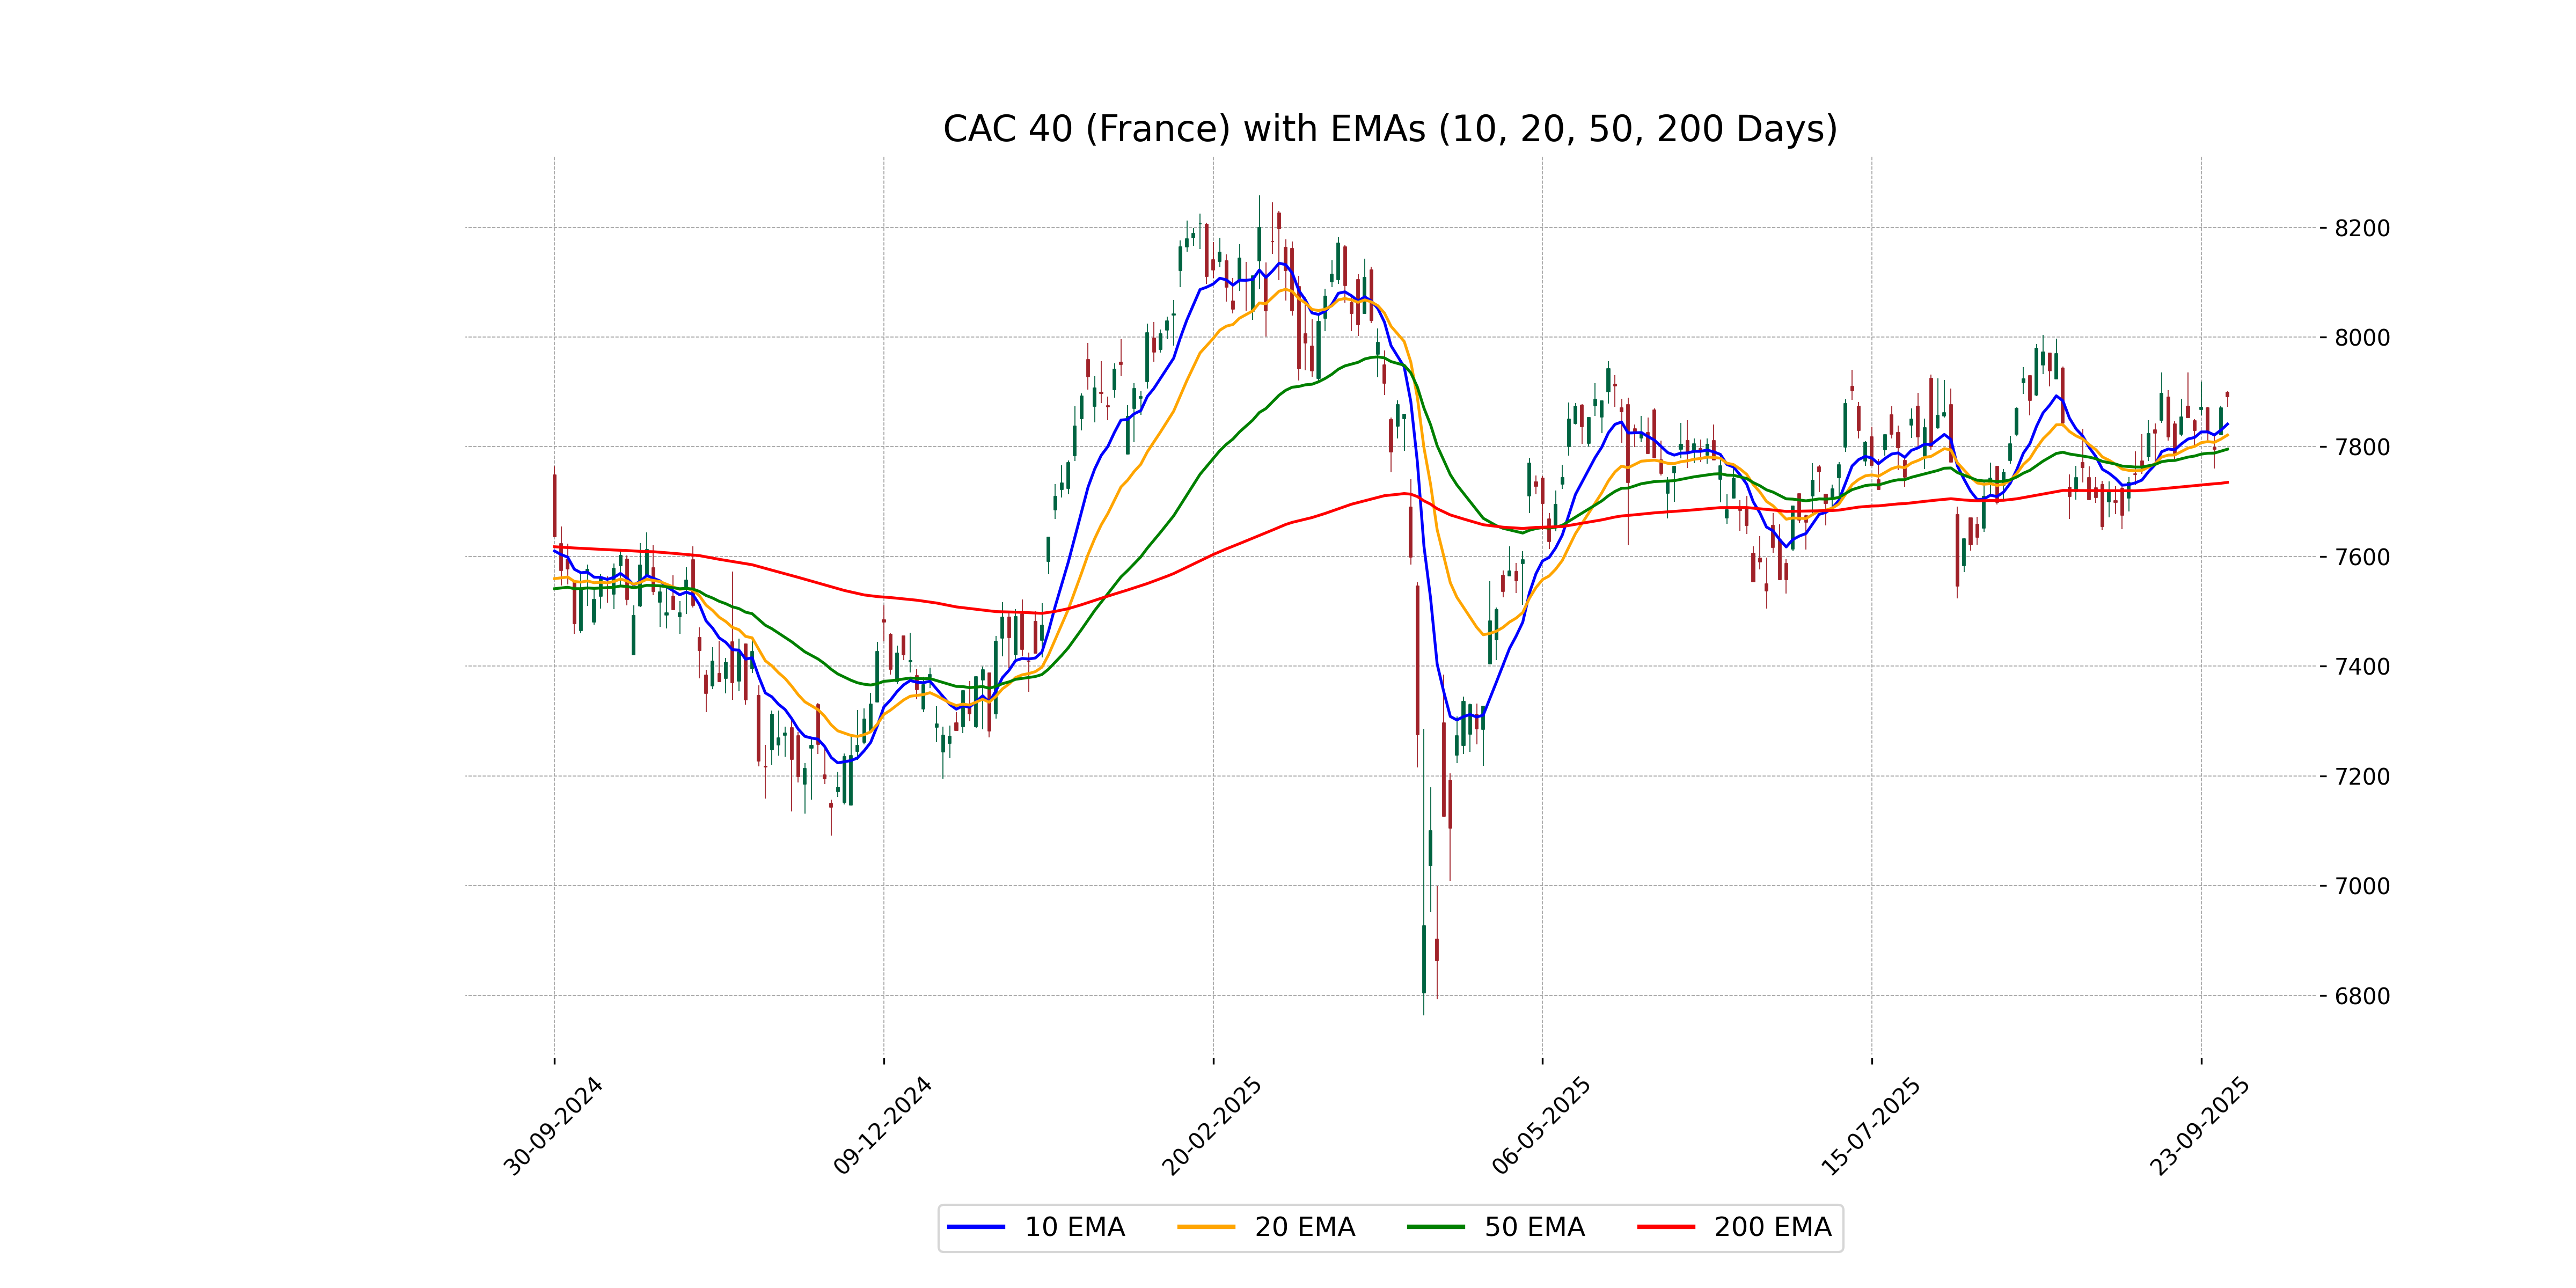
Relationship with Key Moving Averages
The CAC 40 (France) is currently trading above its 50-day and 200-day EMAs, suggesting a short to medium-term upward trend. It is also above its 10-day and 20-day EMAs, indicating recent price strength. The relative position of the current price compared to these key moving averages suggests a bullish sentiment.
Moving Averages Trend (MACD)
The MACD for CAC 40 is at 22.11, with a signal line at 14.95, indicating a bullish momentum as the MACD is above the signal line. This suggests that the recent upward trend may continue, but it is essential to consider other indicators for comprehensive analysis.
RSI Analysis
The relative strength index (RSI) for CAC 40 (France) is currently at 56.99, indicating a neutral position as it is neither in the overbought nor oversold territories. Generally, an RSI above 70 suggests an overbought condition, while below 30 indicates oversold conditions.
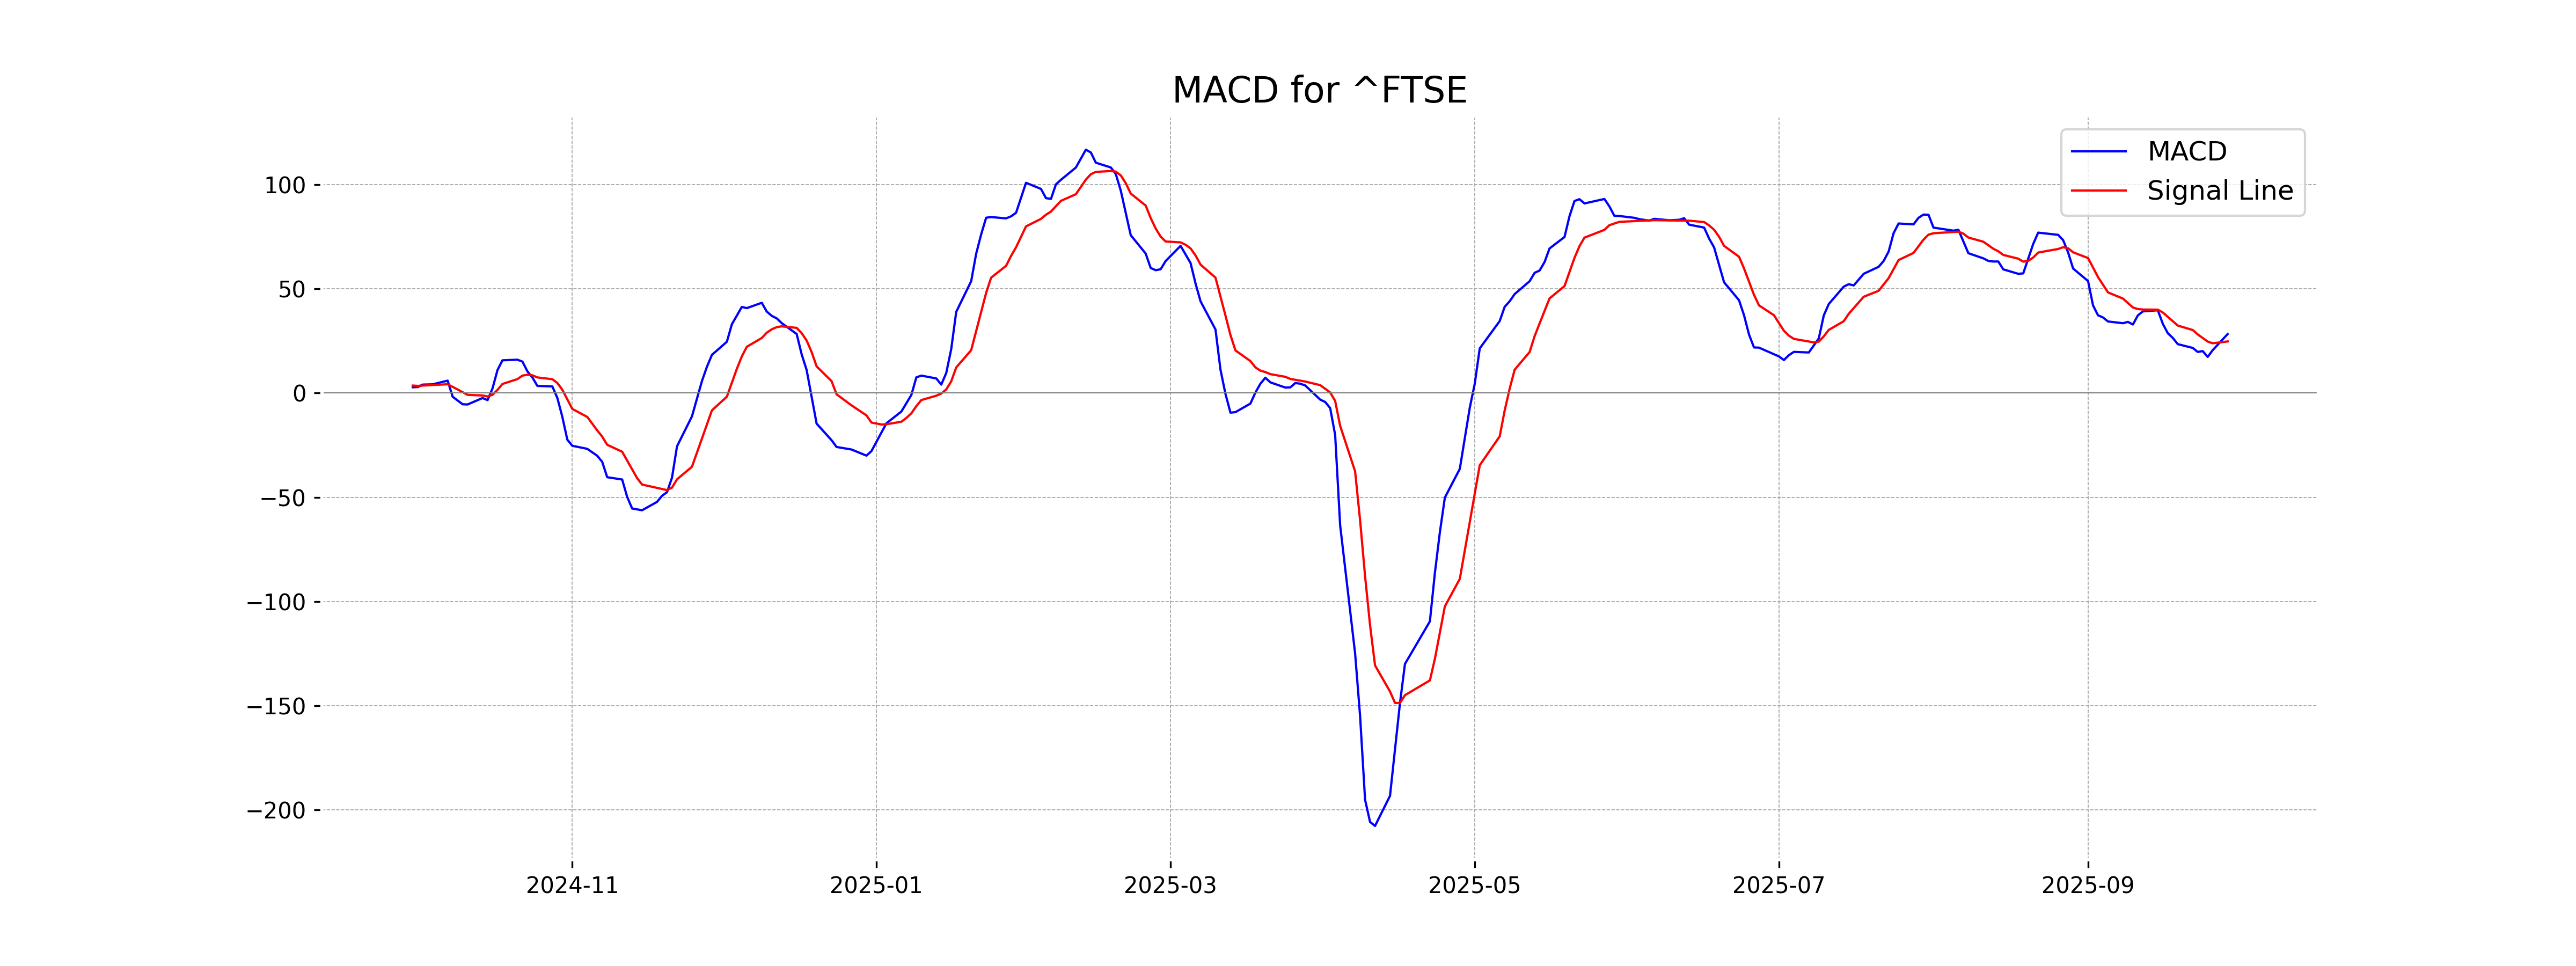
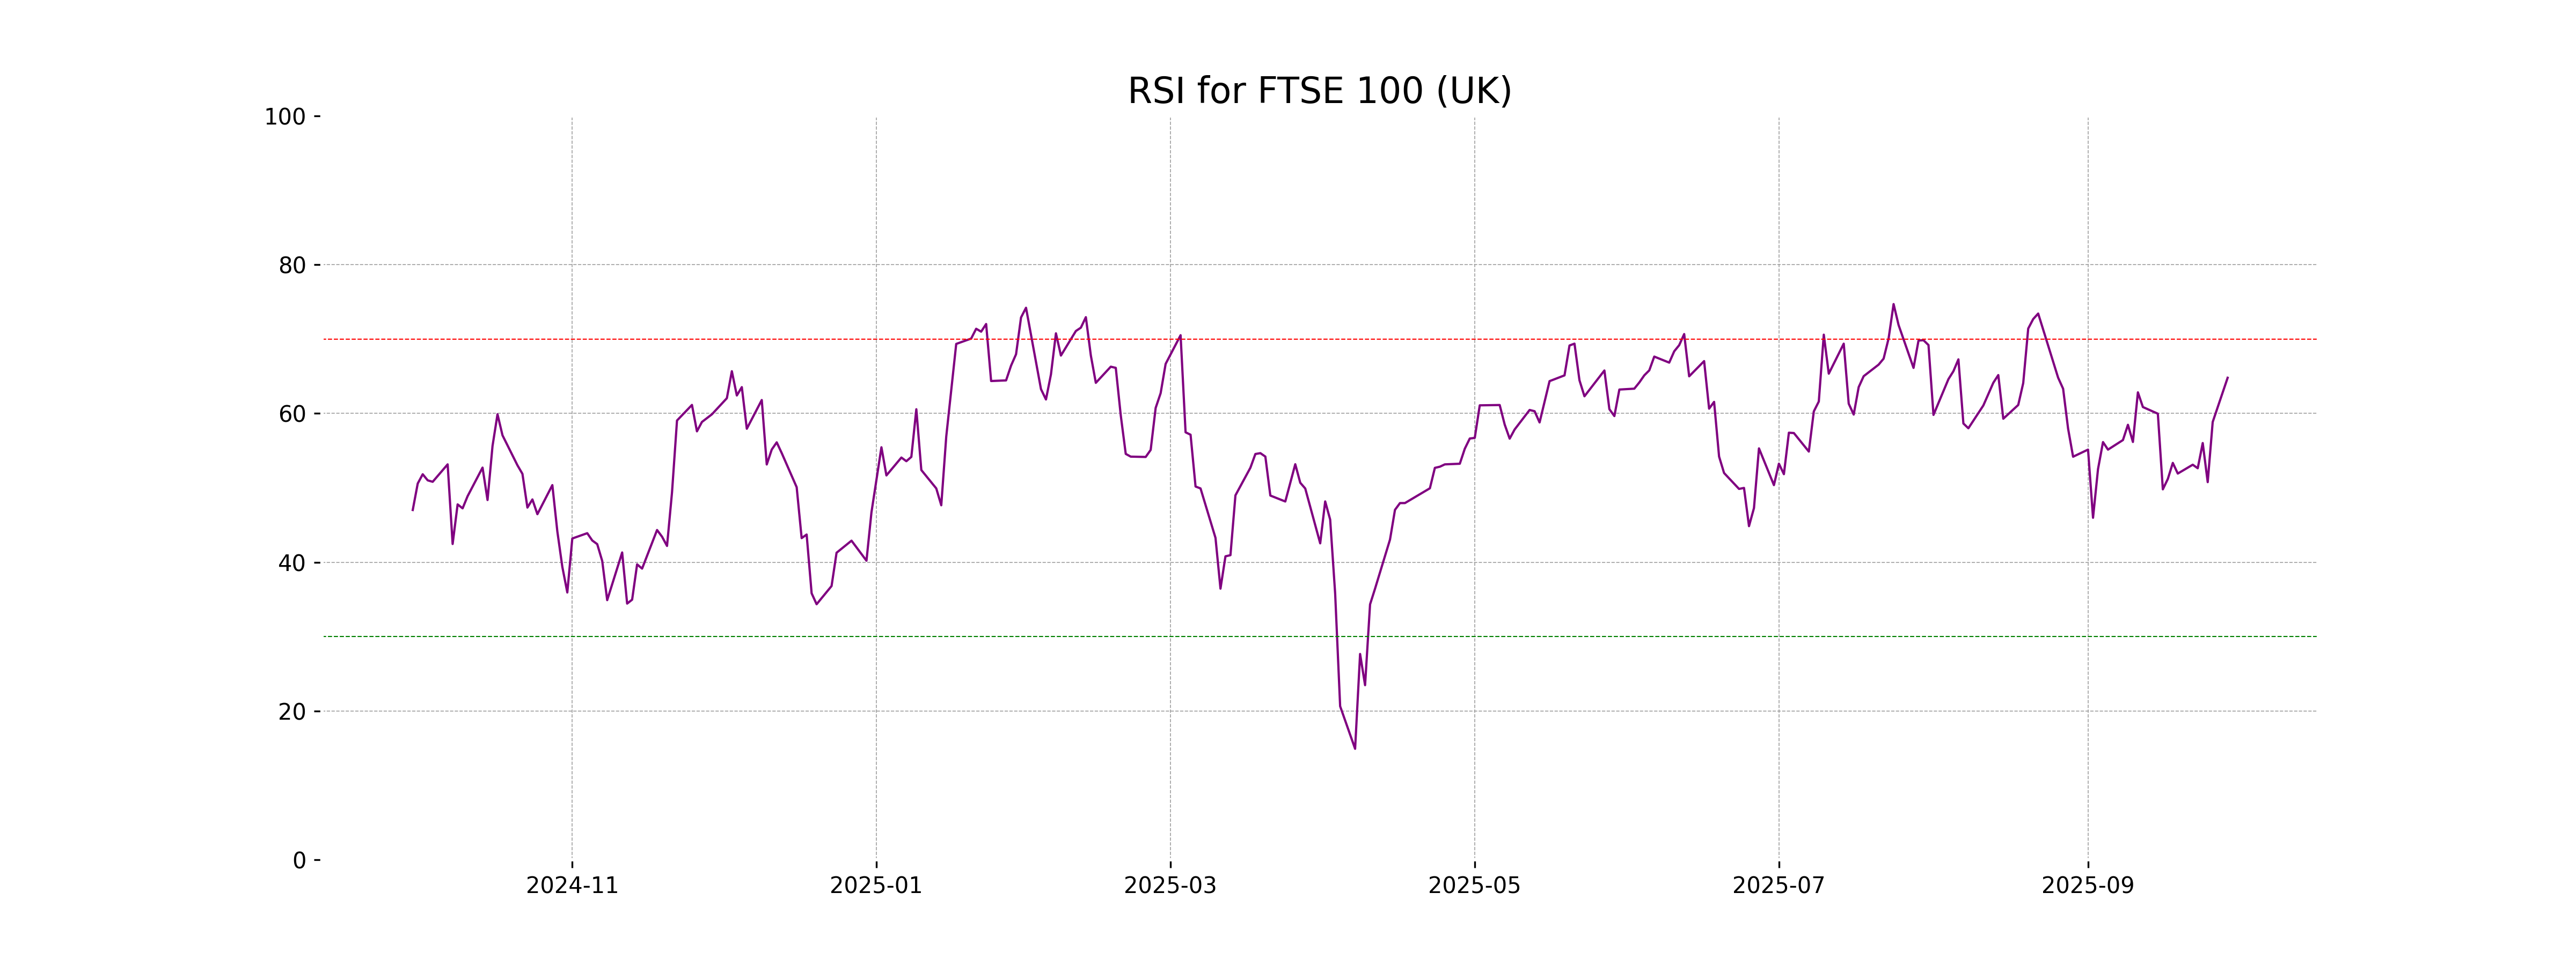
Analysis for FTSE 100 (UK) - September 29, 2025
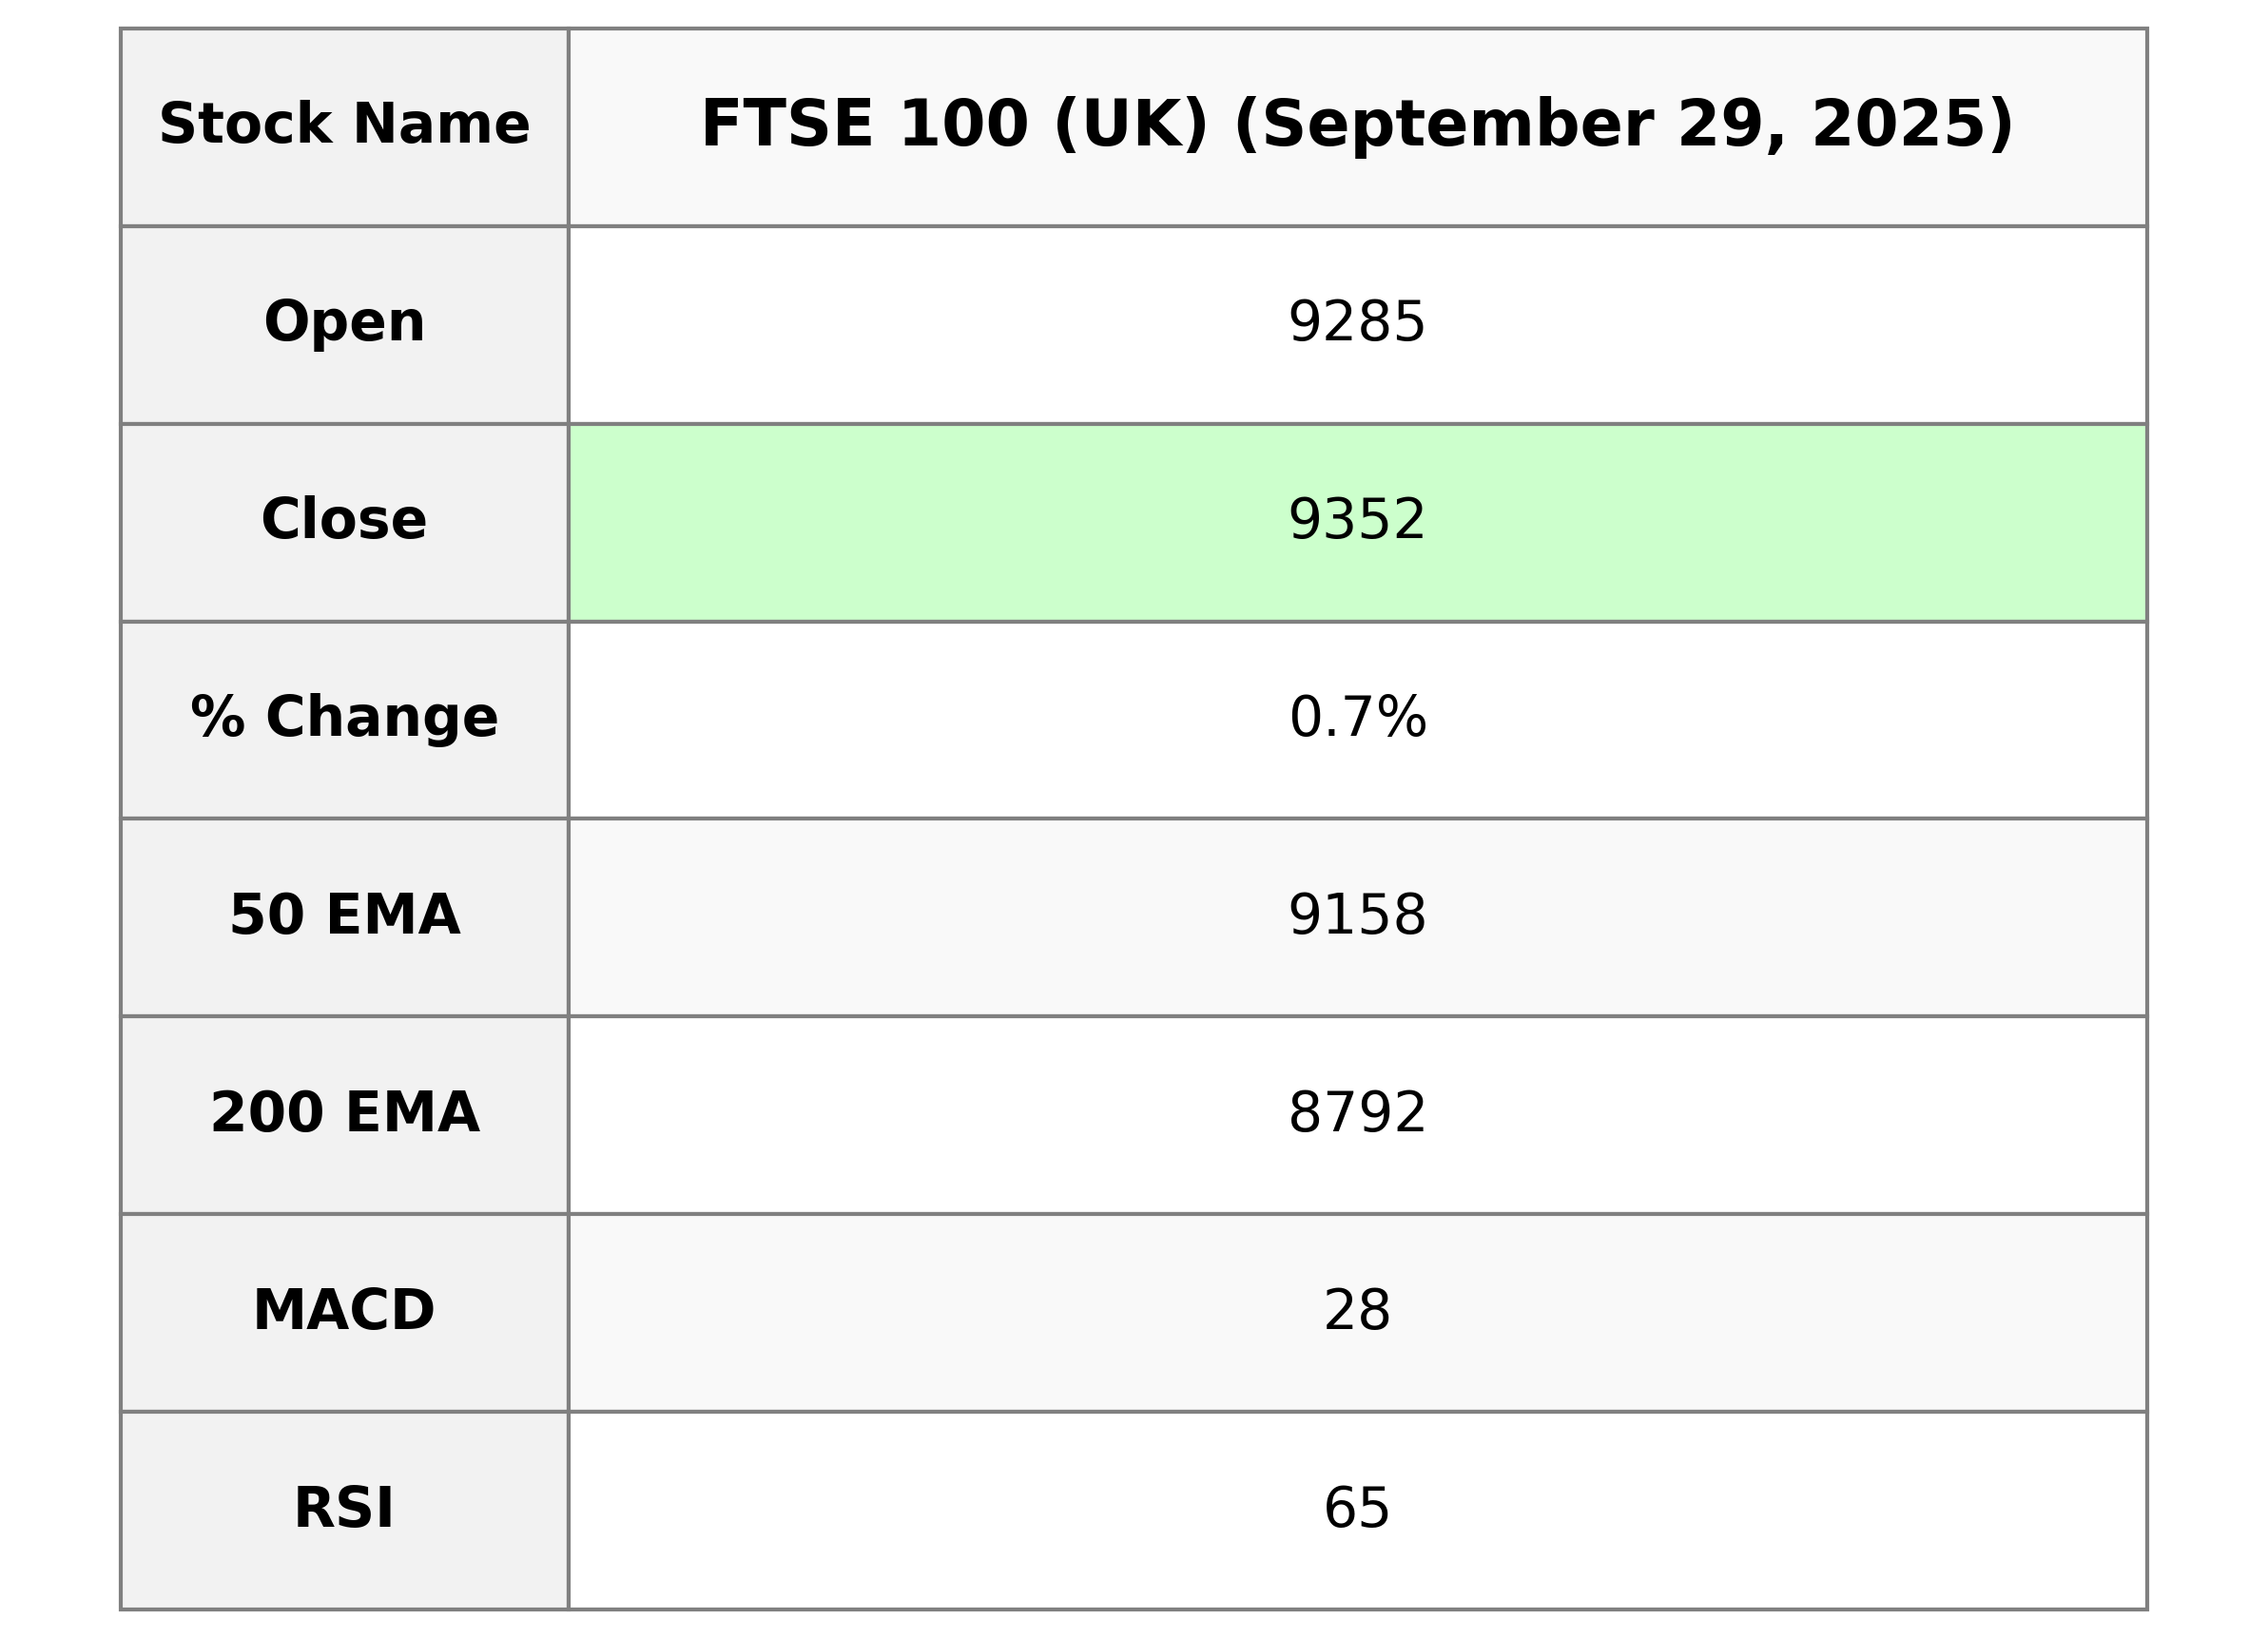
FTSE 100 (UK) Performance Overview: The FTSE 100 opened at 9284.82 and rose to a high of 9352.78 before closing at 9352.44, indicating a % change of 0.73% with a points increase of 67.64. The index shows an RSI of 64.80, suggesting near-overbought conditions, while the MACD of 28.30 reflects a bullish sentiment against the signal at 24.76.
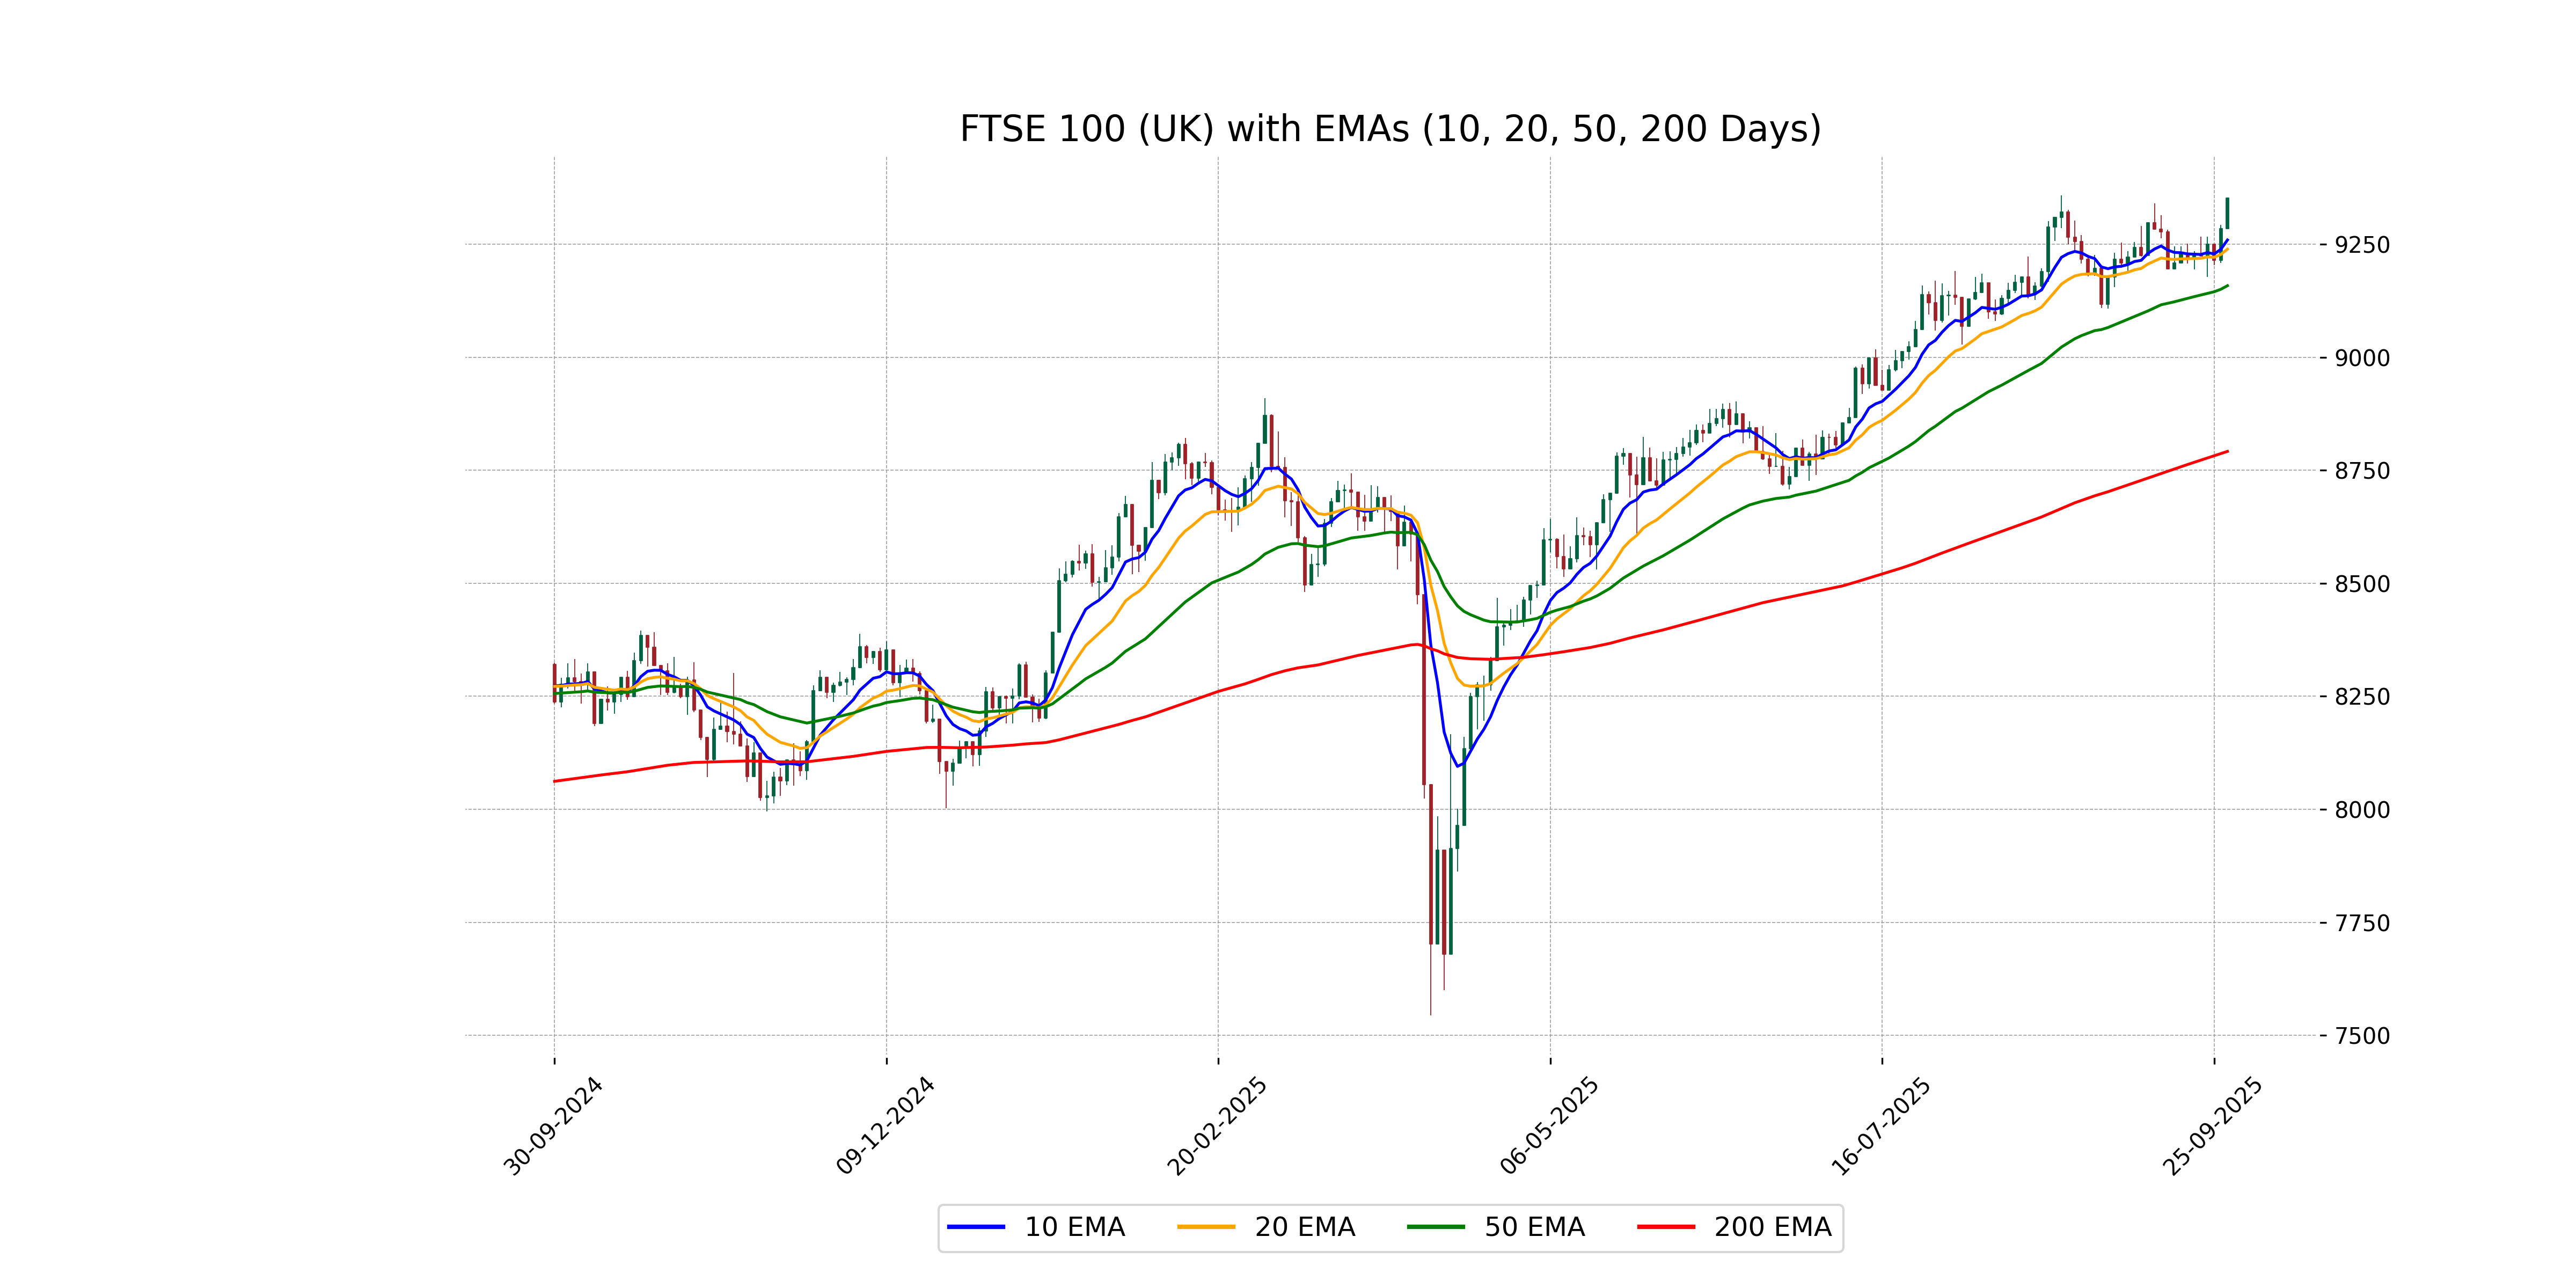
Relationship with Key Moving Averages
The FTSE 100 index is trading above its 50 EMA of 9158.15 and 200 EMA of 8791.68, indicating a bullish trend. It is also above the 10 EMA of 9259.26 and 20 EMA of 9238.99, suggesting short-term bullish momentum.
Moving Averages Trend (MACD)
The MACD for the FTSE 100 is 28.30, which is above the MACD Signal of 24.76, indicating a bullish signal. This suggests potential upward momentum. The RSI of 64.80 suggests the index is not yet overbought.
RSI Analysis
The relative strength index (RSI) for FTSE 100 is 64.80, suggesting a moderately bullish trend as it approaches the overbought threshold of 70. Further monitoring is advised to determine if it will enter overbought territory, indicating potential for a price correction.
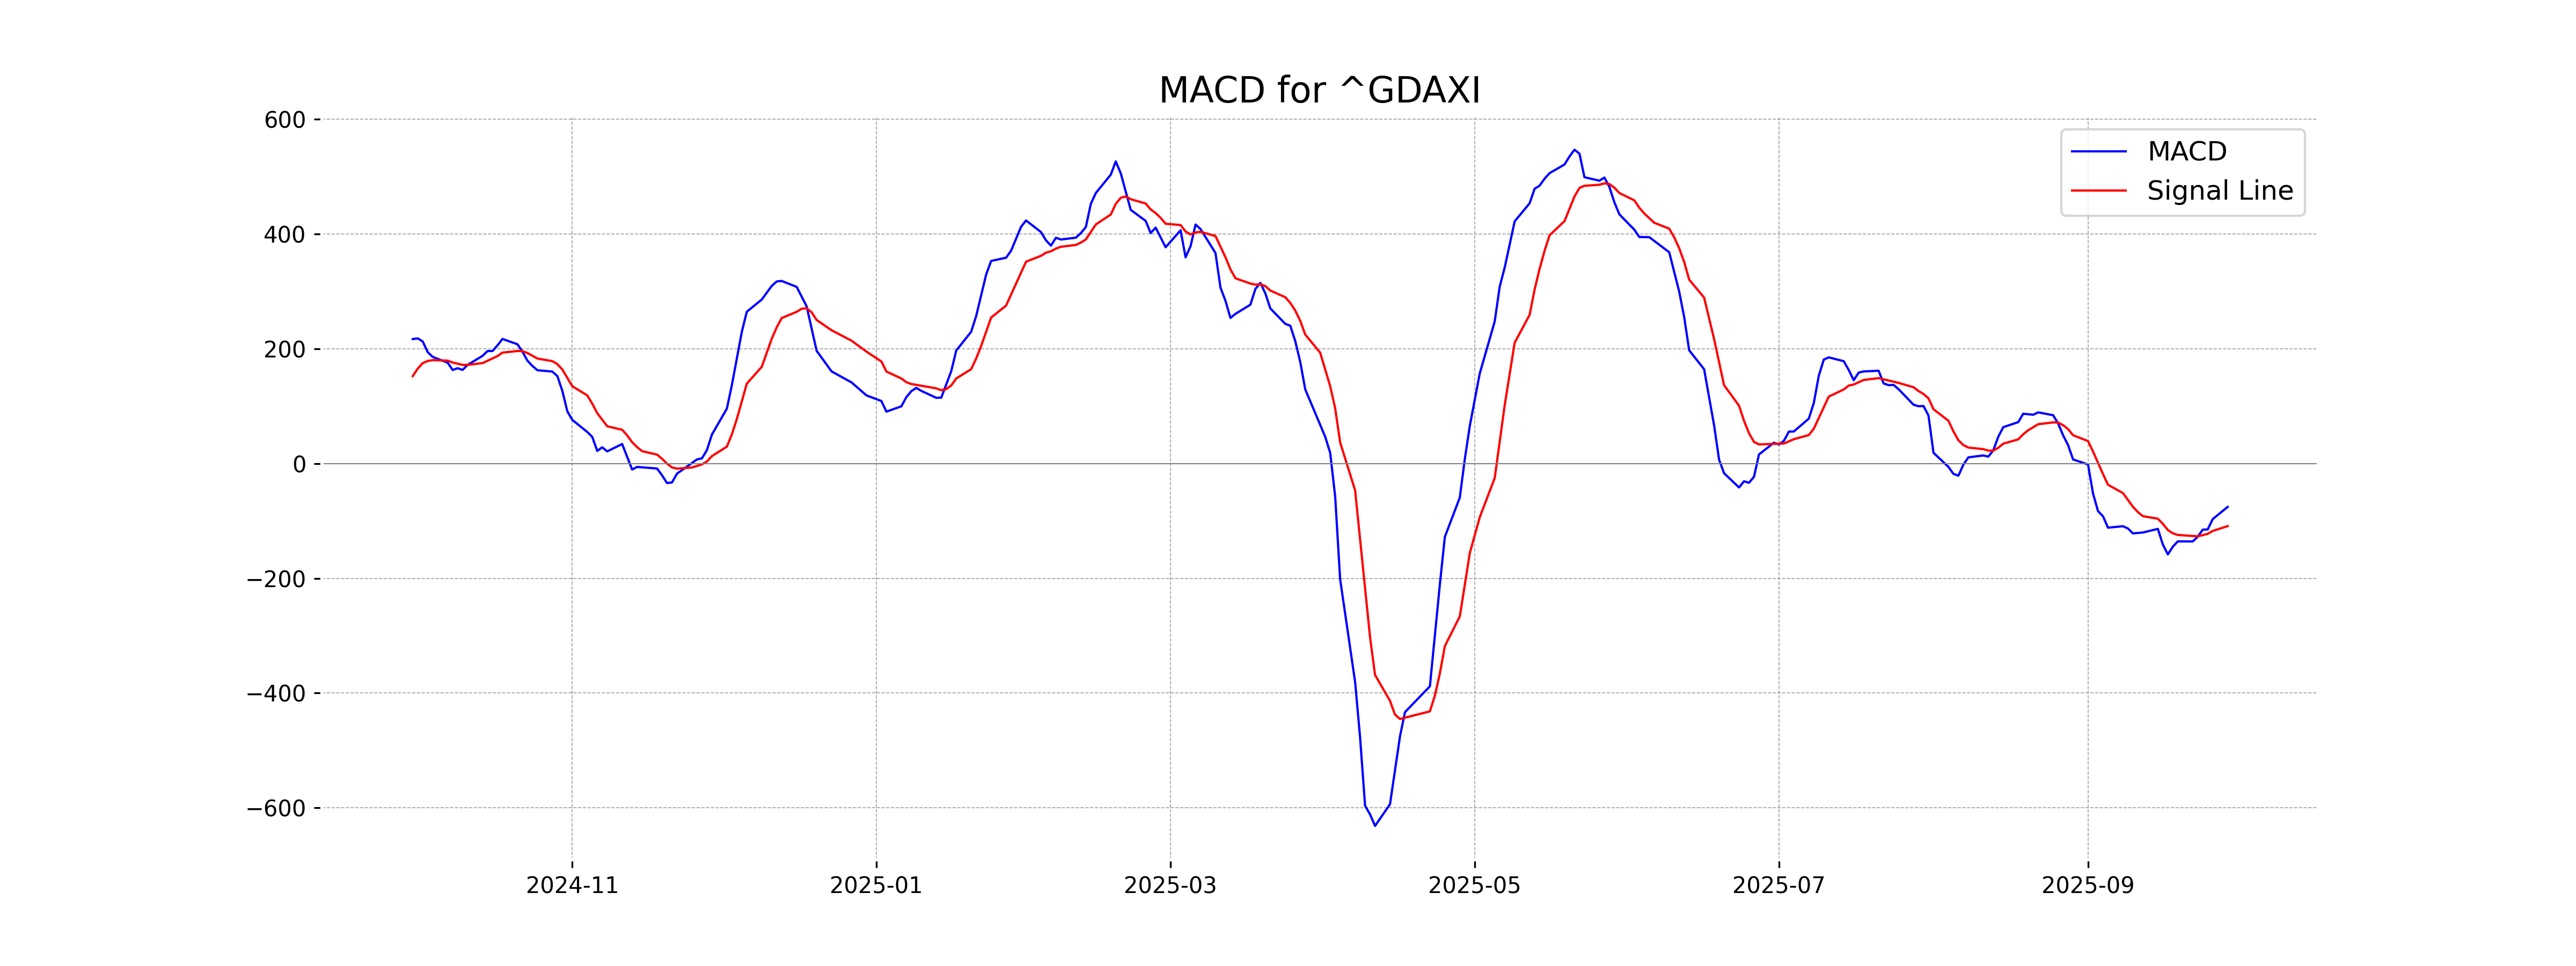
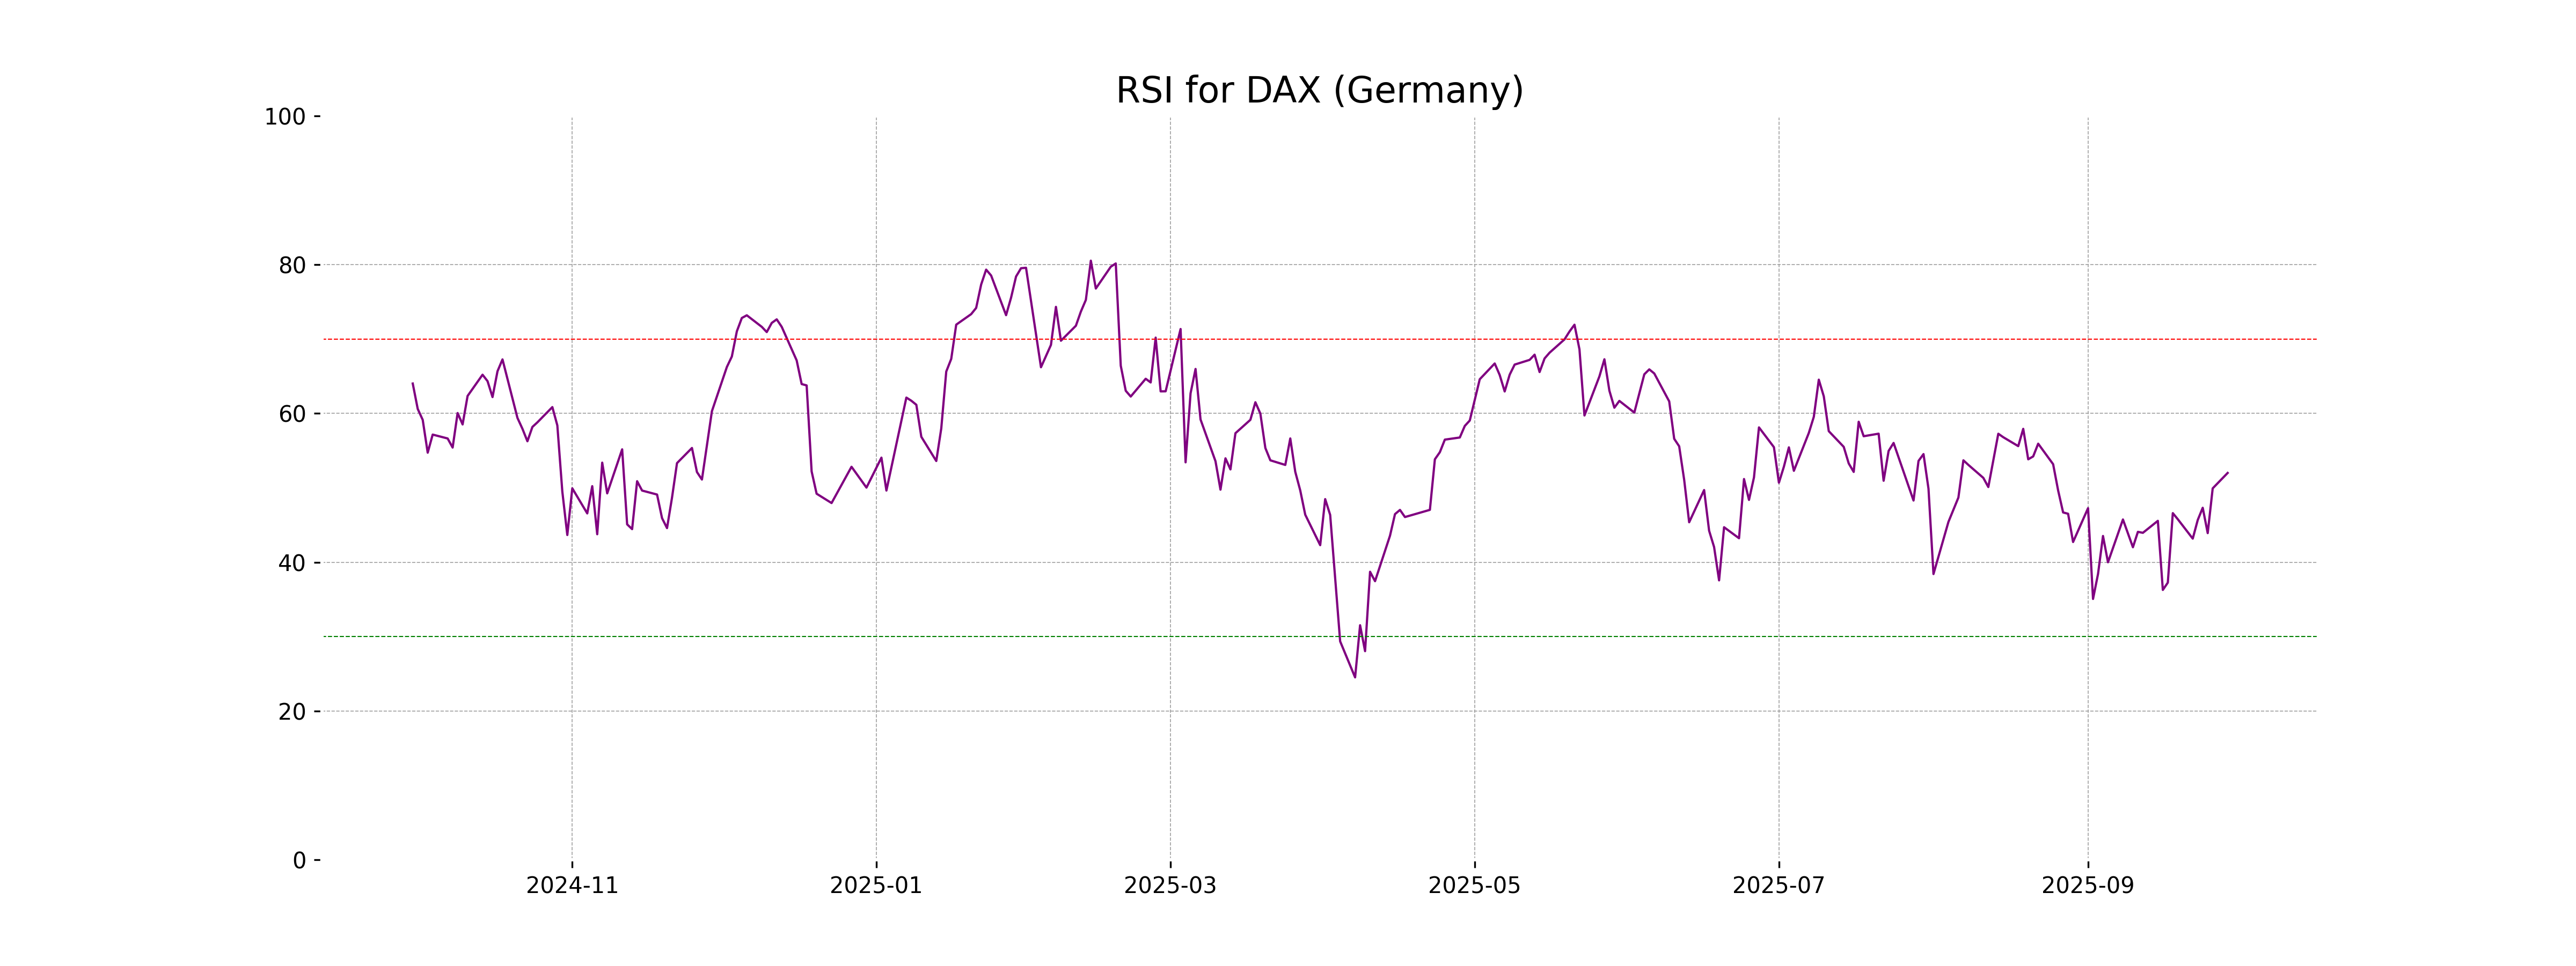
Analysis for DAX (Germany) - September 29, 2025
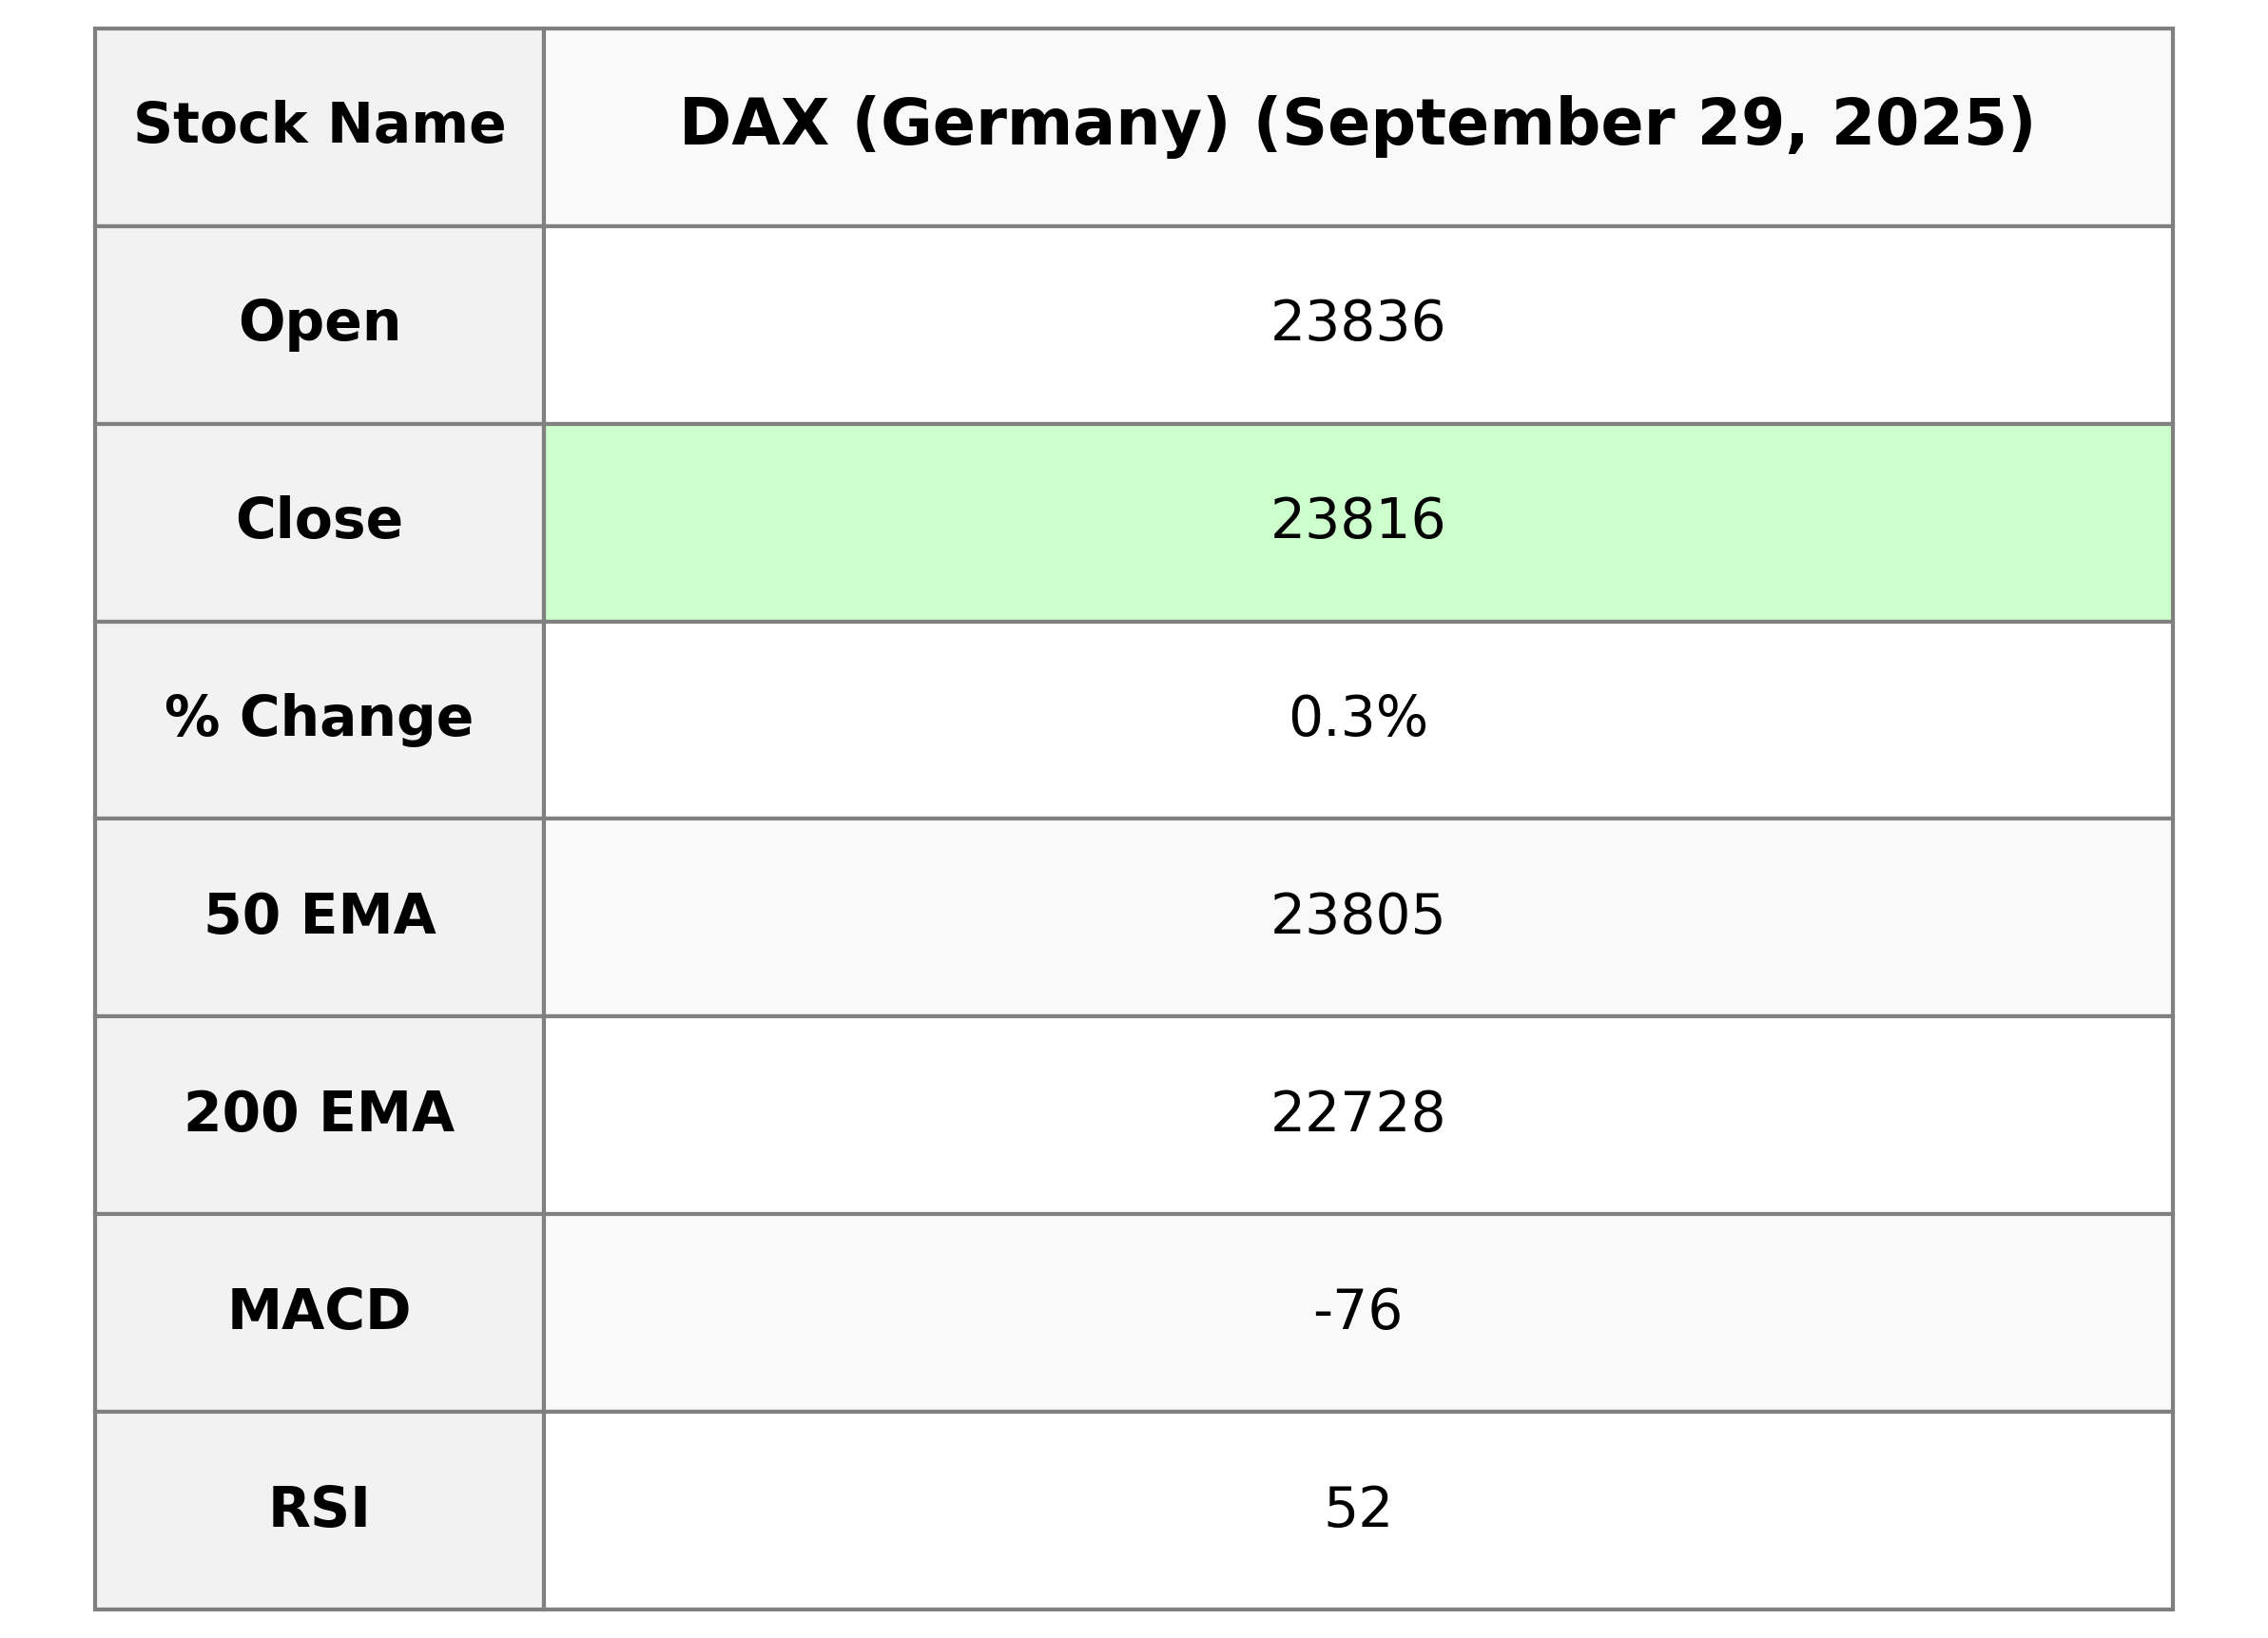
The DAX index opened at 23,835.61 and closed slightly lower at 23,816.01, showing a 0.32% increase over the previous close, with a points change of 76.54. Key indicators include a 50-day EMA of 23,804.60, a 200-day EMA of 22,727.83, and an RSI of 52.00, suggesting a moderately bullish outlook.
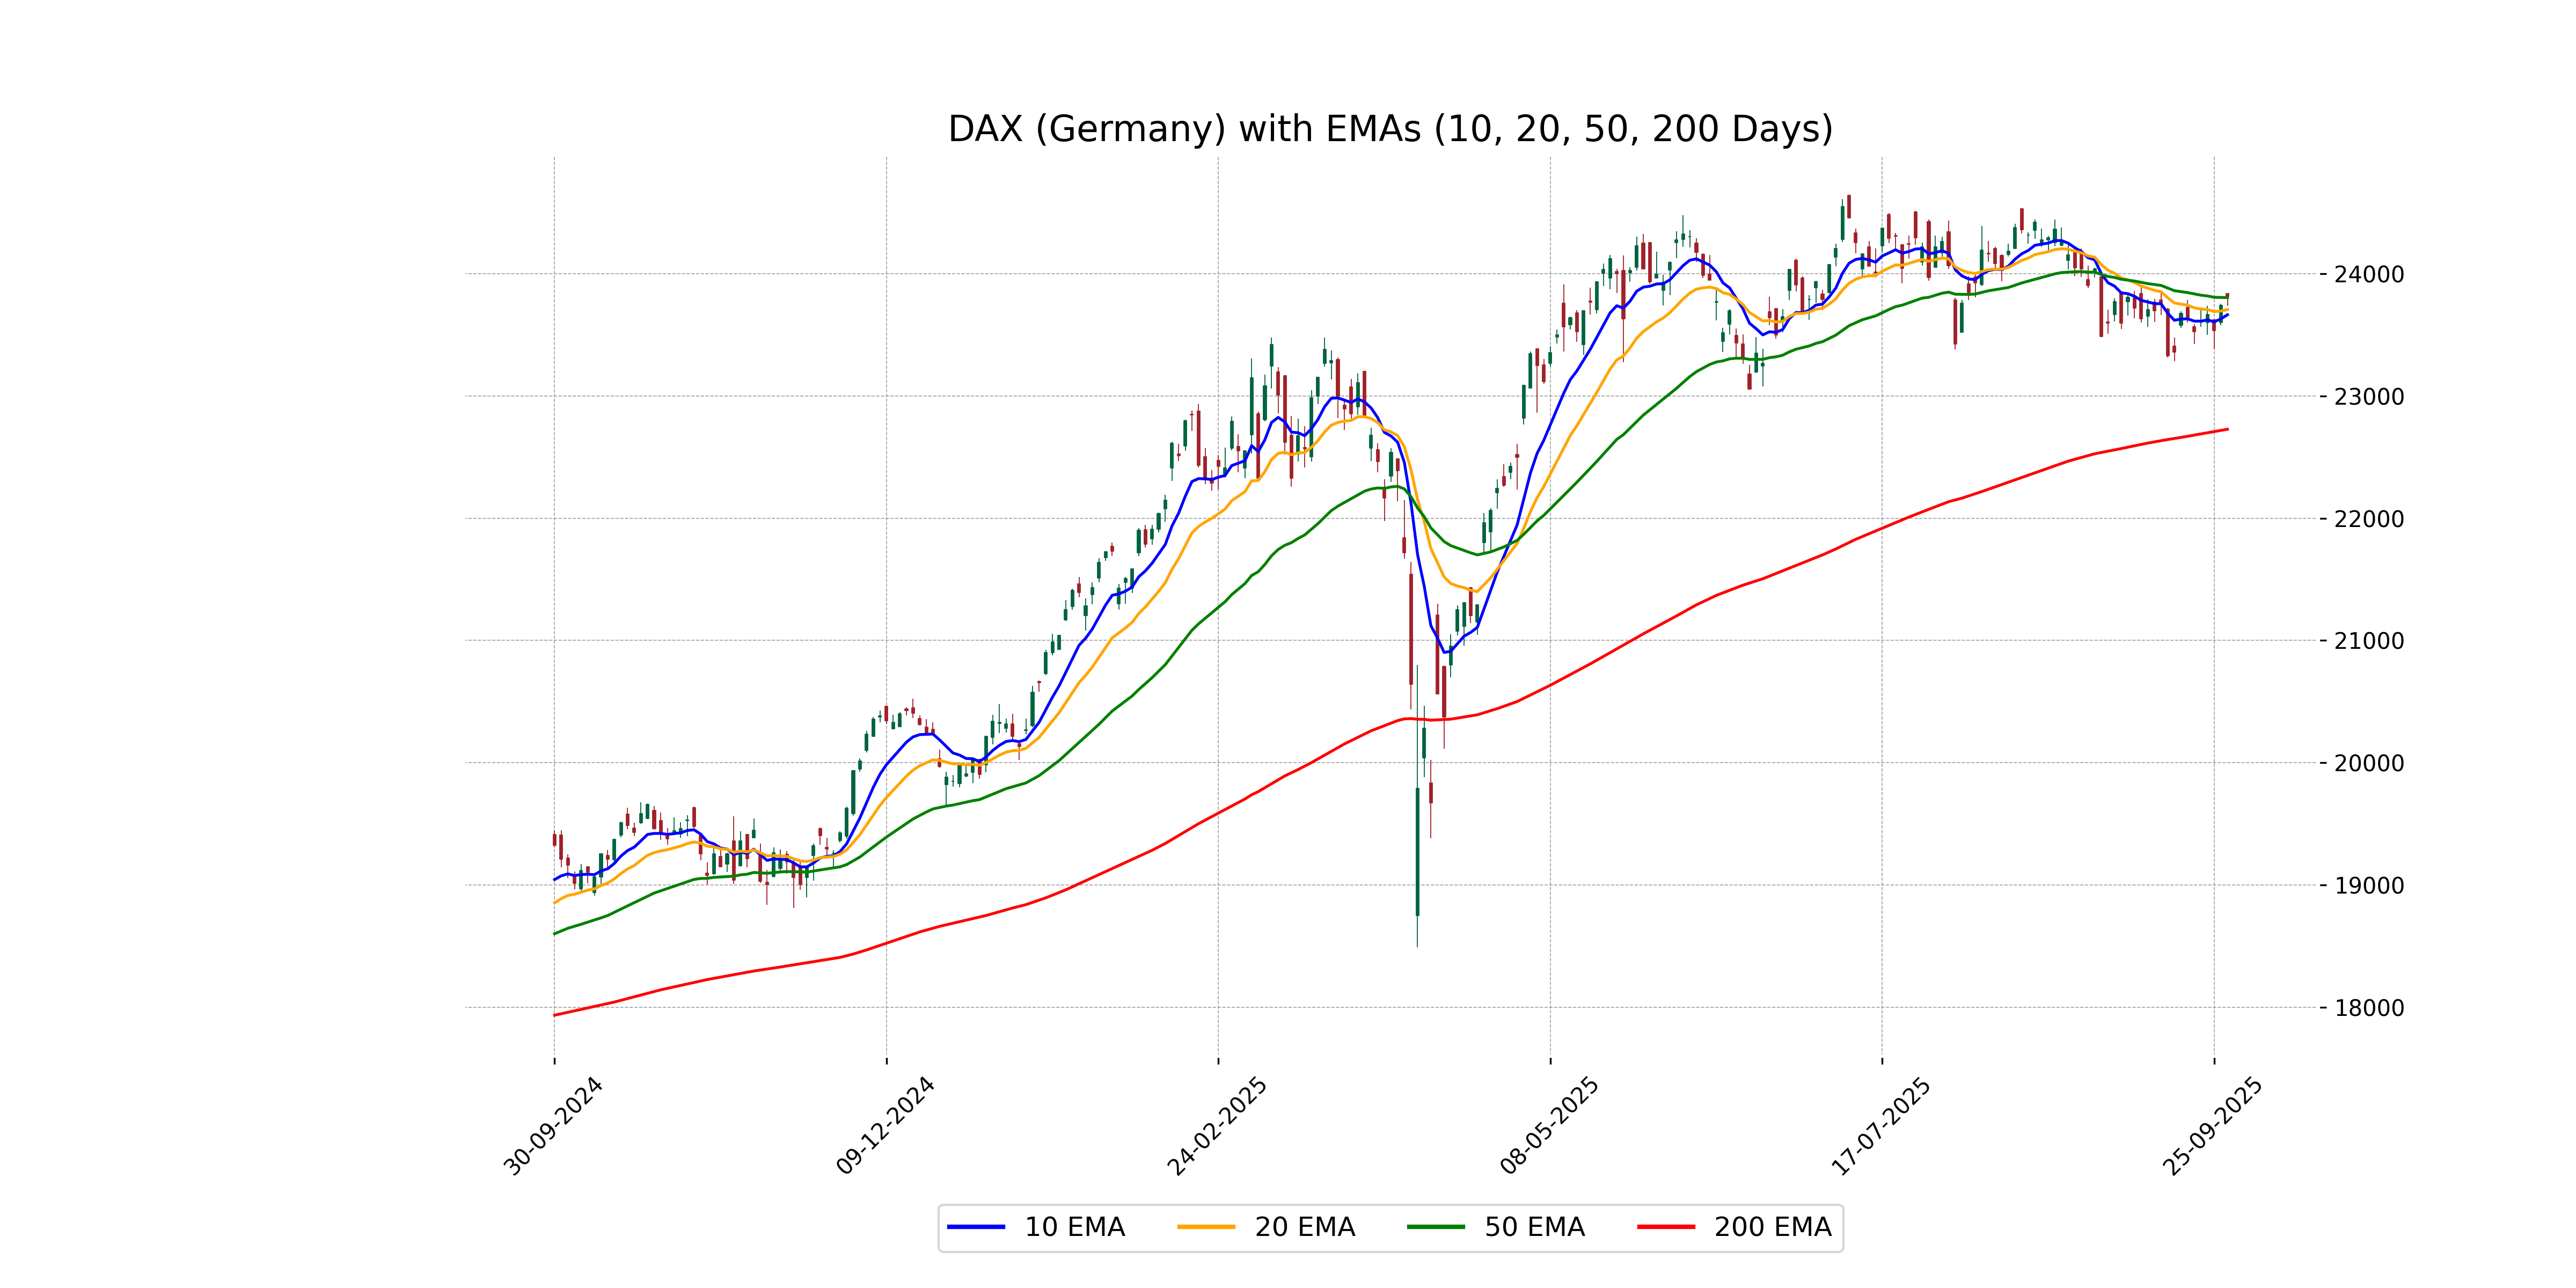
Relationship with Key Moving Averages
The DAX (Germany) closed higher than its 10-day EMA (23664.09), 20-day EMA (23706.38), and 50-day EMA (23804.60), indicating a short-term bullish trend. However, it remains significantly above the 200-day EMA (22727.83), suggesting longer-term strength despite the MACD being negative, which might show consolidation or potential correction.
Moving Averages Trend (MACD)
The MACD for DAX (Germany) is at -75.53, which is above its MACD Signal line at -109.01. This indicates a potential bullish signal as the MACD line is moving upward, suggesting a possible reversal or continued upward momentum in the market.
RSI Analysis
The RSI for DAX (Germany) is 52.00, which suggests a neutral market sentiment. This indicates that the index is neither overbought nor oversold, suggesting there is a balanced buying and selling pressure. Traders might look for further cues from other indicators or market conditions for potential direction.
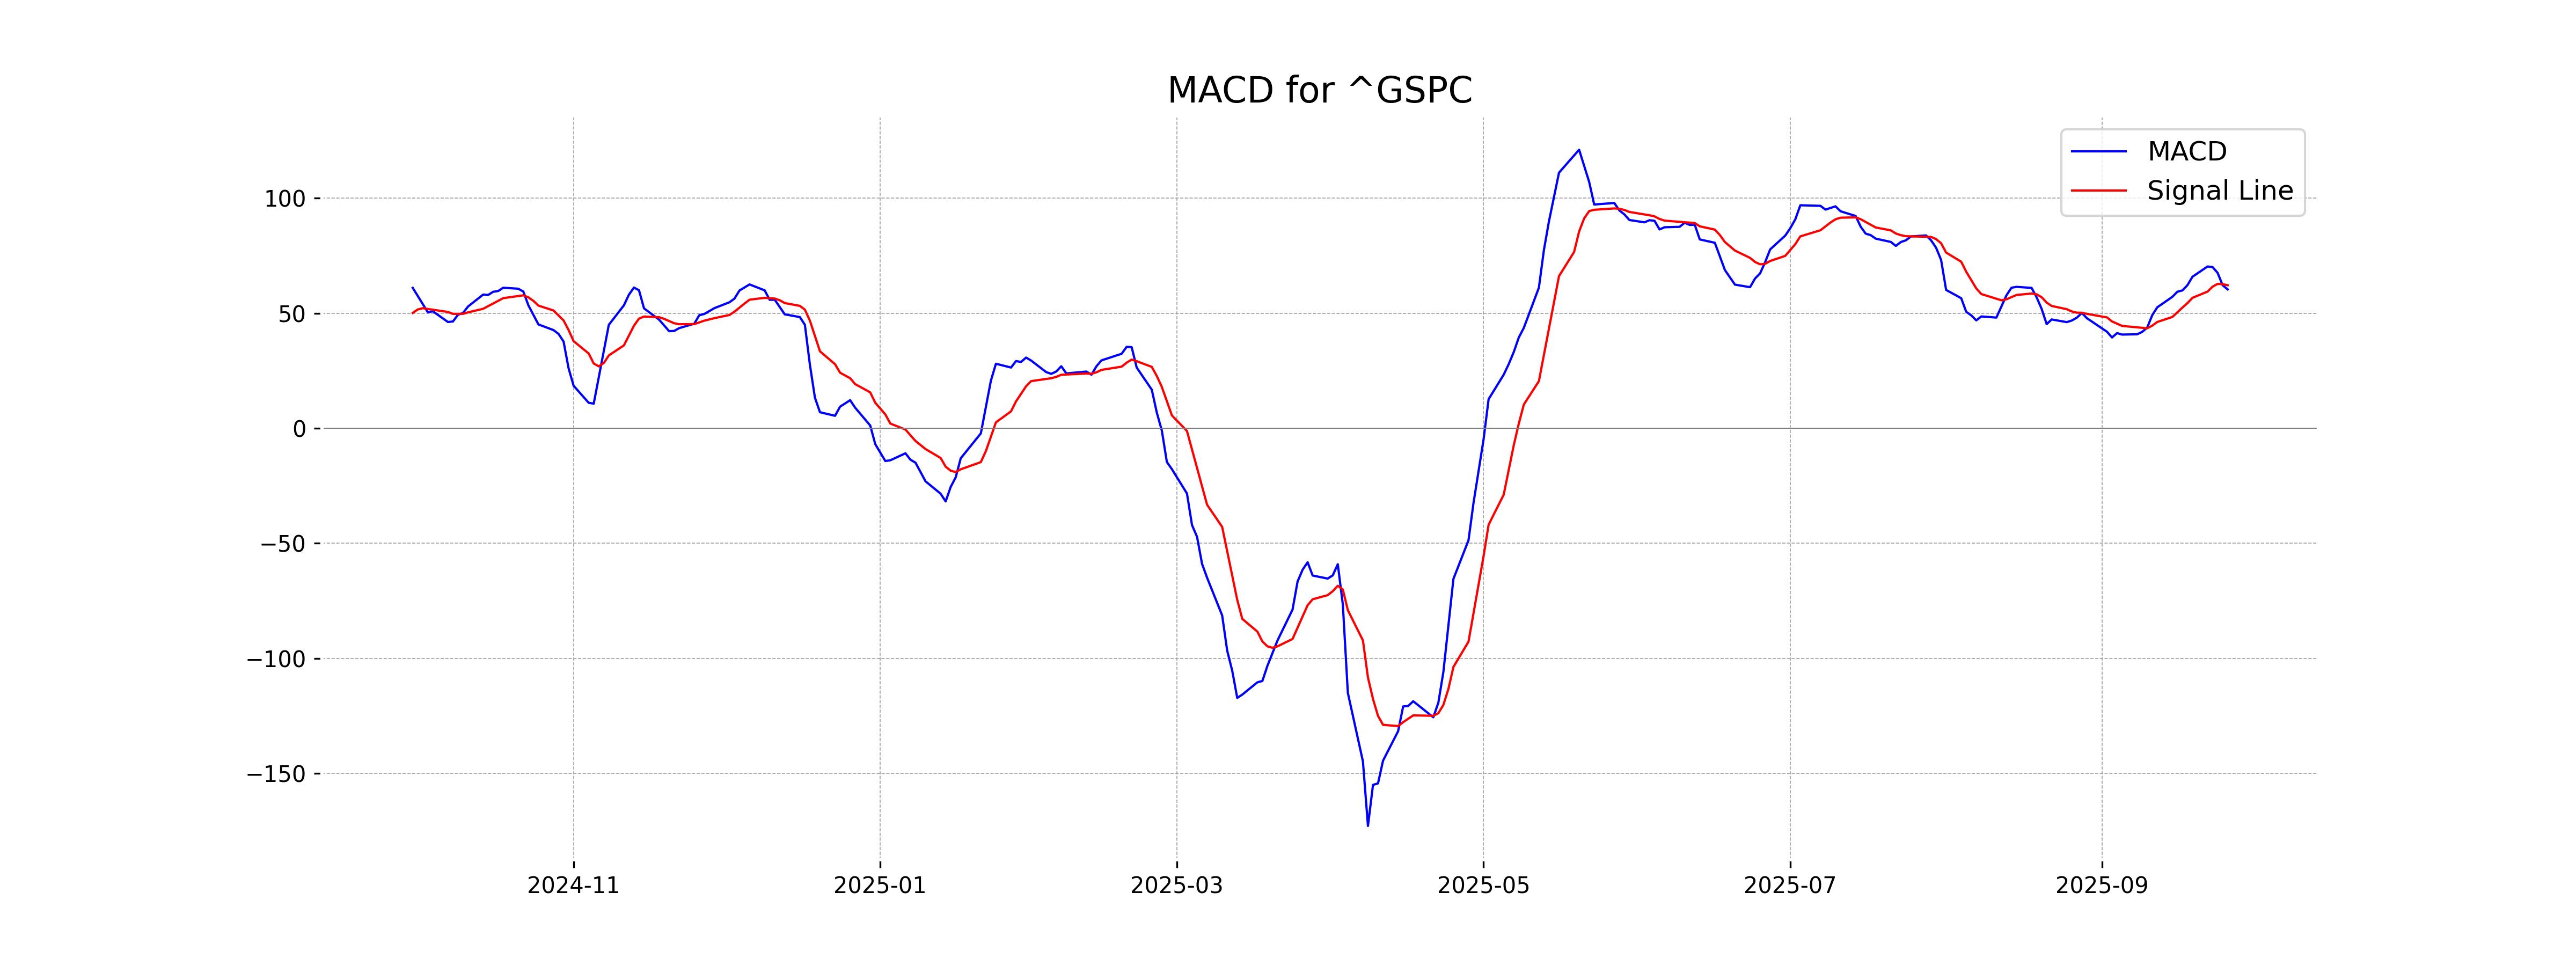
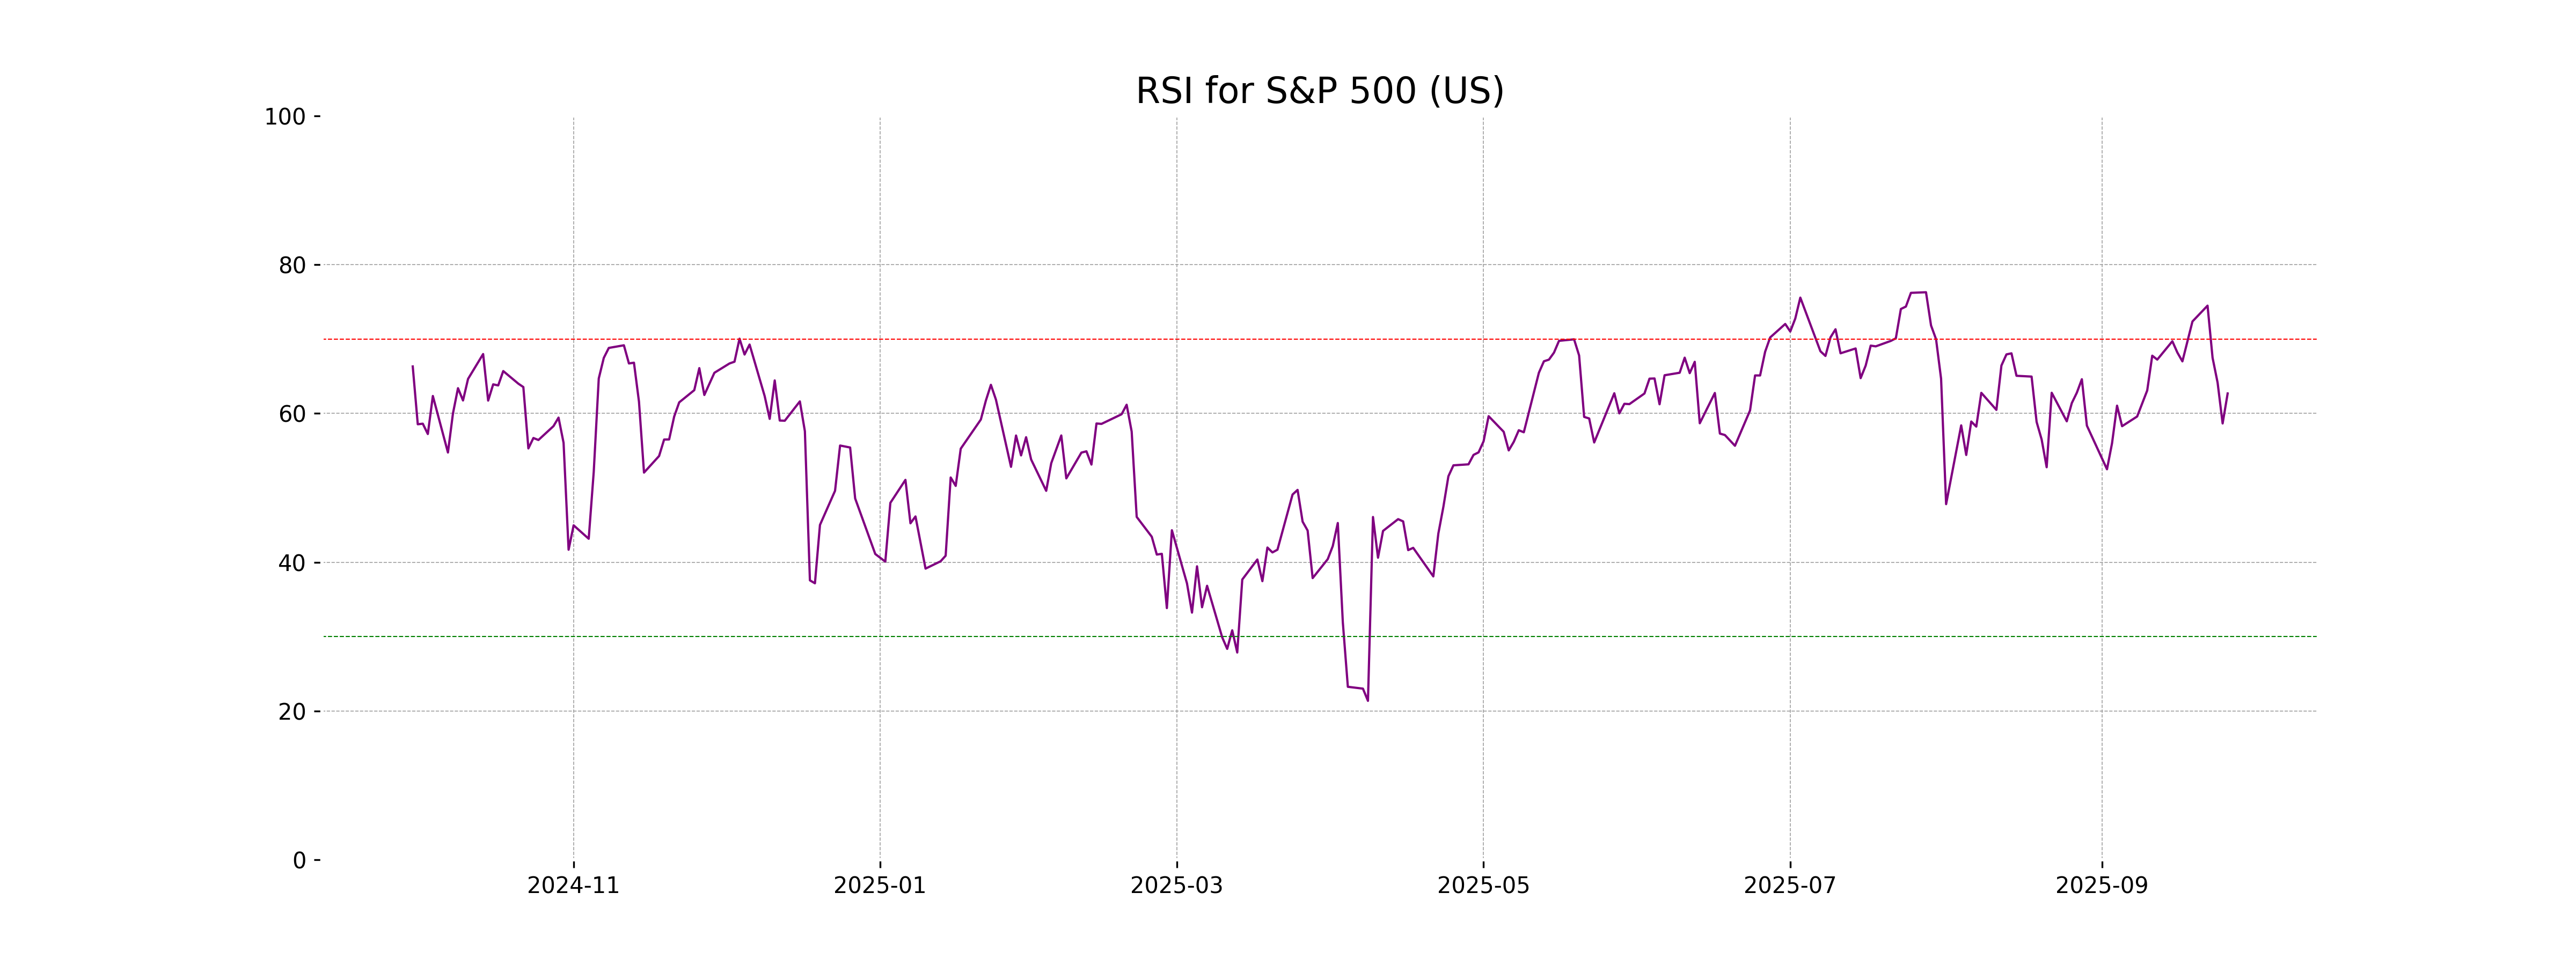
Analysis for S&P 500 (US) - September 29, 2025
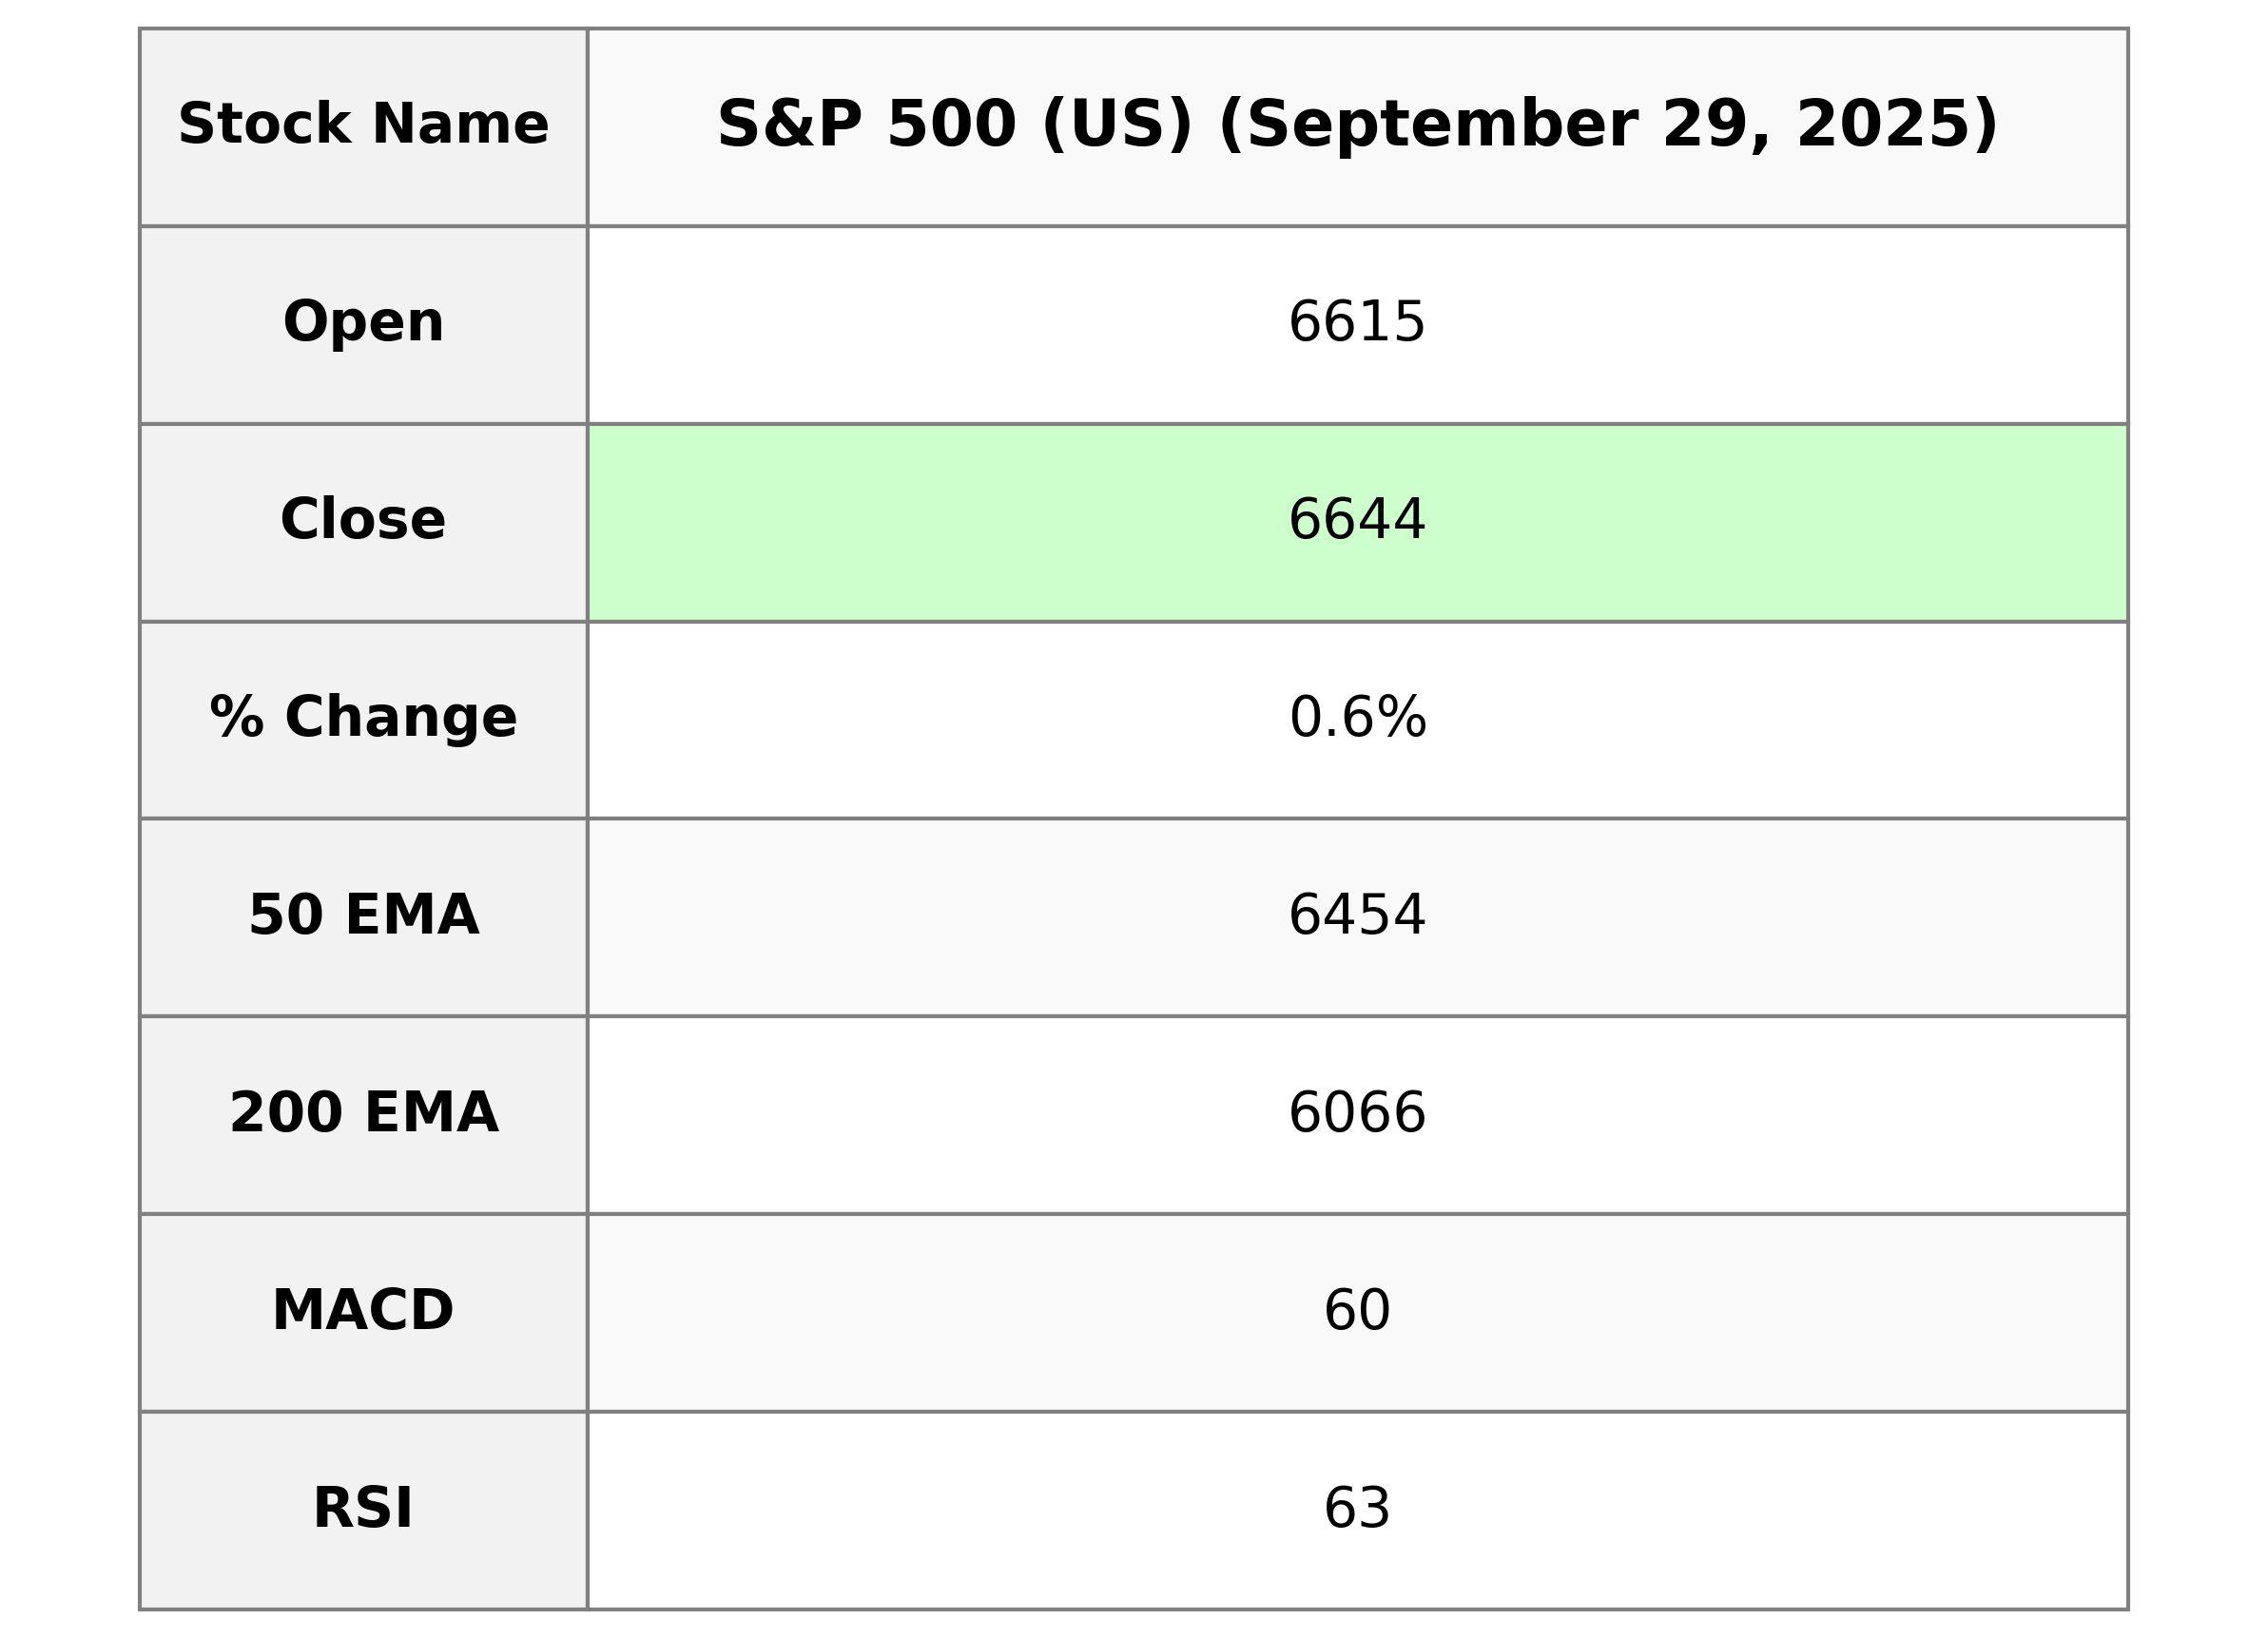
The S&P 500 (US) opened at 6615.38 and closed higher at 6643.70, marking a positive change of 0.59% with a gain of 38.98 points. The index's RSI stands at 62.69, indicating potential bullish momentum, while the MACD value of 60.38 is slightly below its signal line, suggesting a mixed trend outlook. Despite this, the index is trading above key EMA levels, showing an overall upward trend.
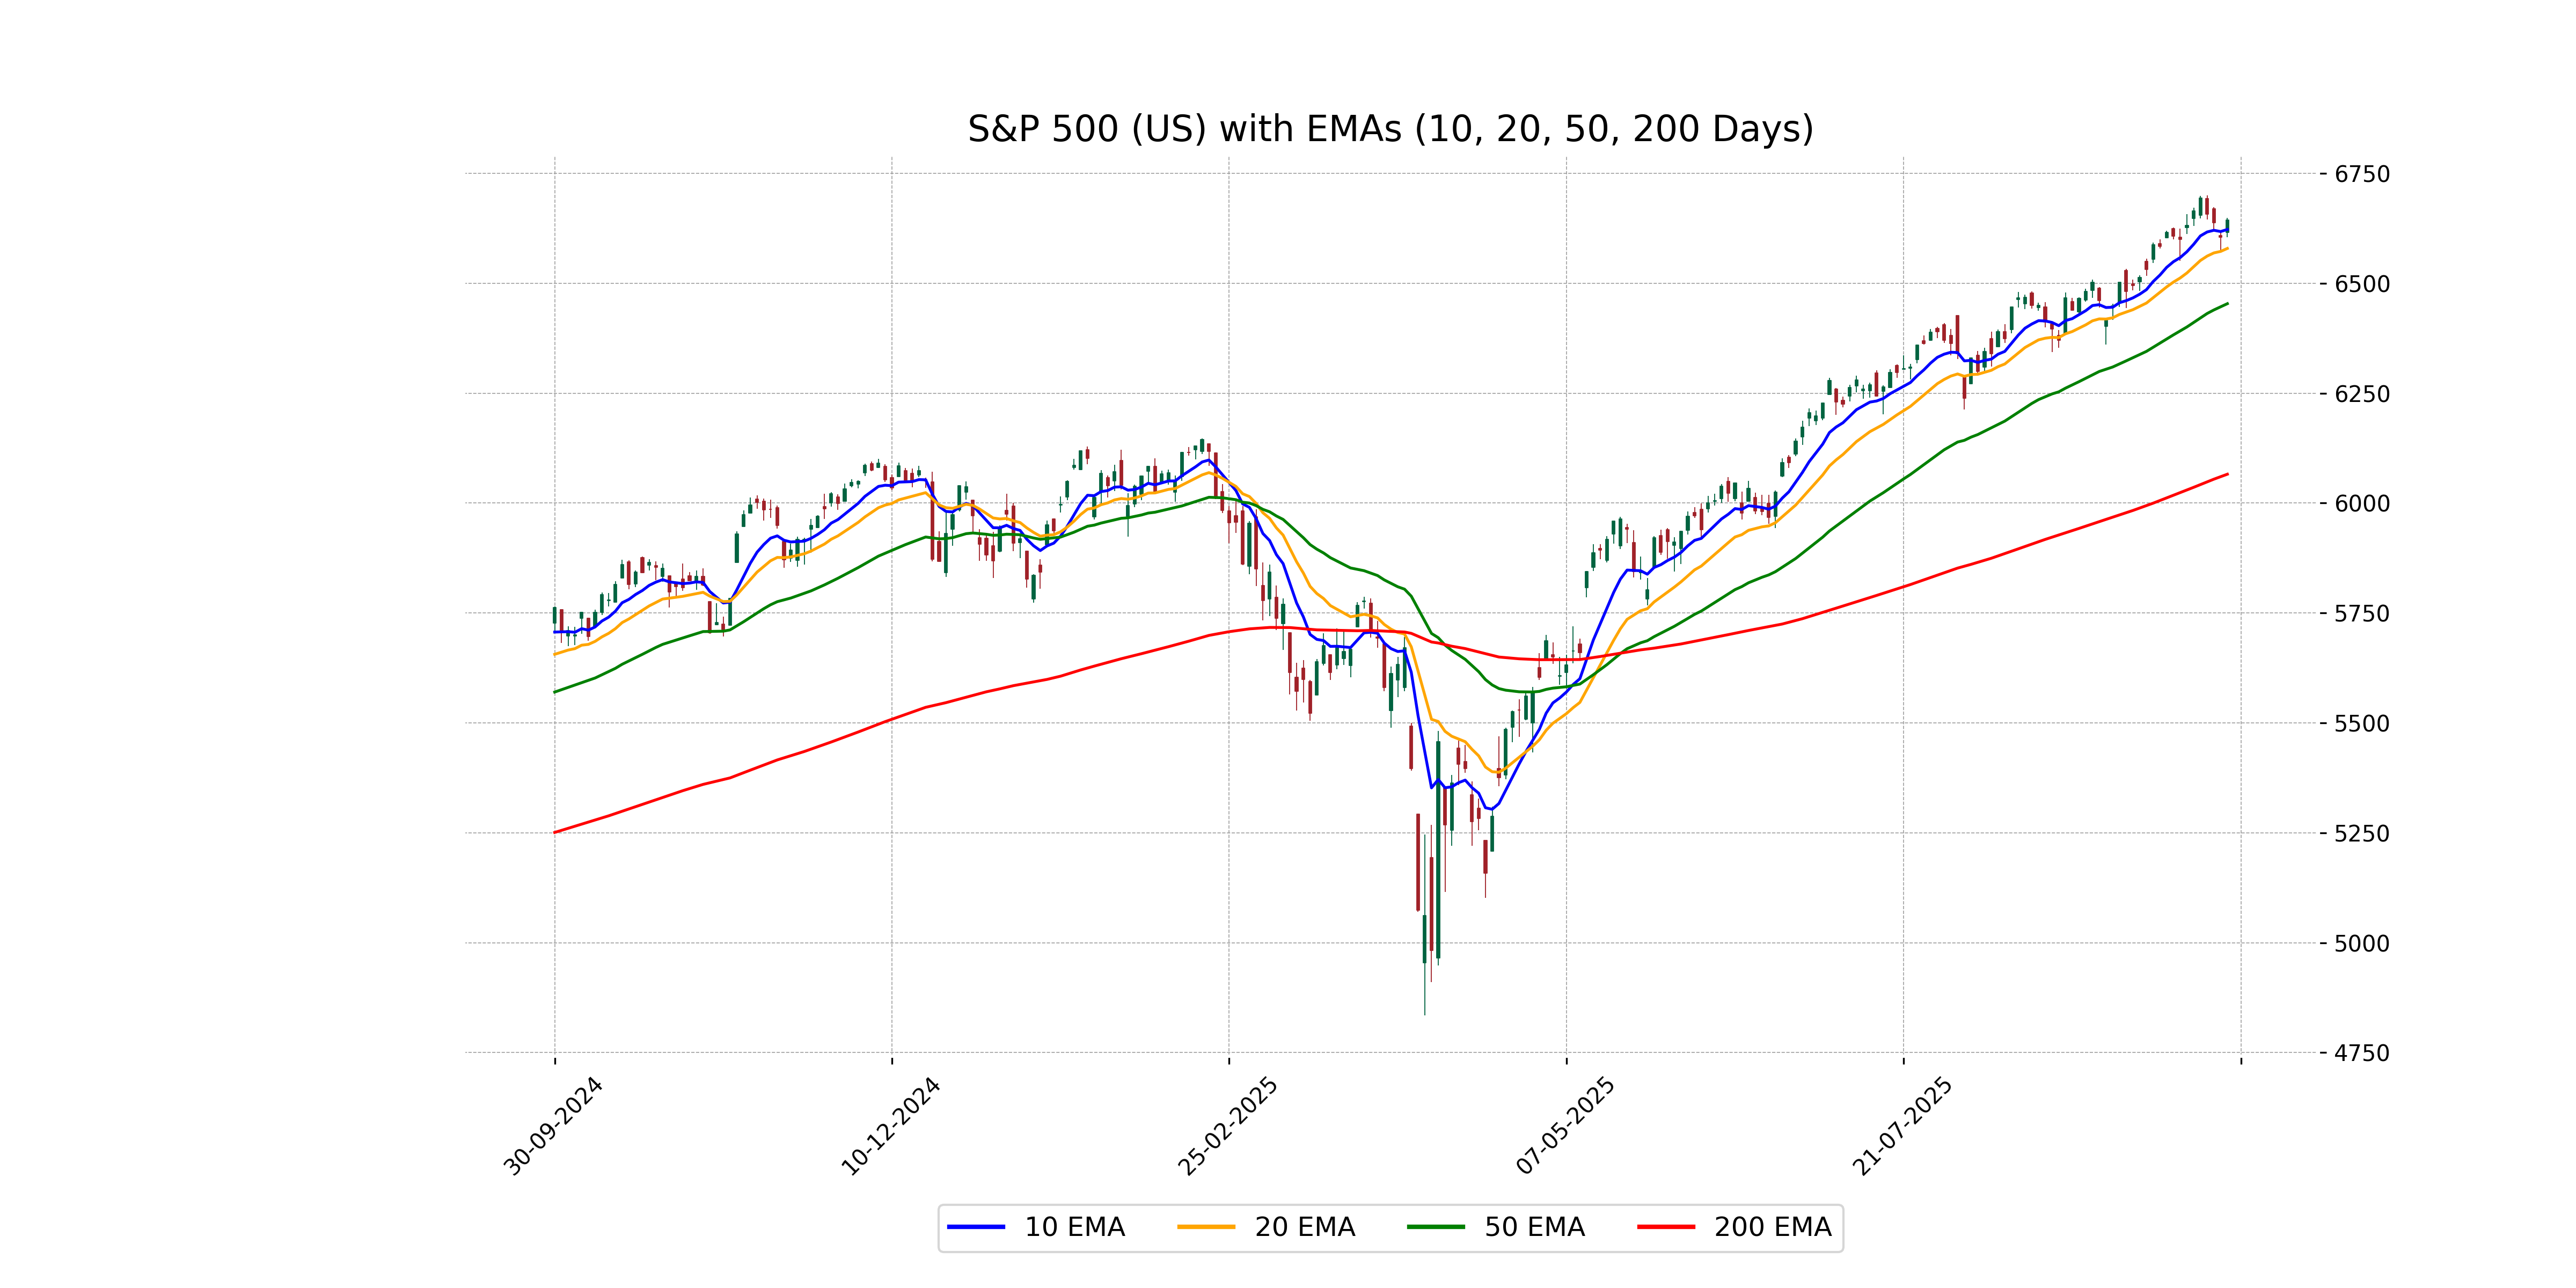
Relationship with Key Moving Averages
The current closing price of the S&P 500 is 6643.7002, which is above its 50-day EMA of 6453.5479 and 200-day EMA of 6065.6381, indicating a strong upward trend. The price is also above the 10-day EMA of 6622.3833 and 20-day EMA of 6579.2158, suggesting recent bullish momentum.
Moving Averages Trend (MACD)
The S&P 500 shows a MACD value of 60.38, which is below the MACD Signal of 62.20. This indicates a potential bearish trend as the MACD line is trailing the signal line. Traders often interpret this as a possible signal to sell or anticipate downward momentum.
RSI Analysis
The relative strength index (RSI) for the S&P 500 is currently at 62.69, indicating a moderately strong upward momentum. This suggests that the index is approaching the overbought territory, but it is not necessarily overstretched yet. Traders may interpret this as a continuation of a positive trend with some caution.
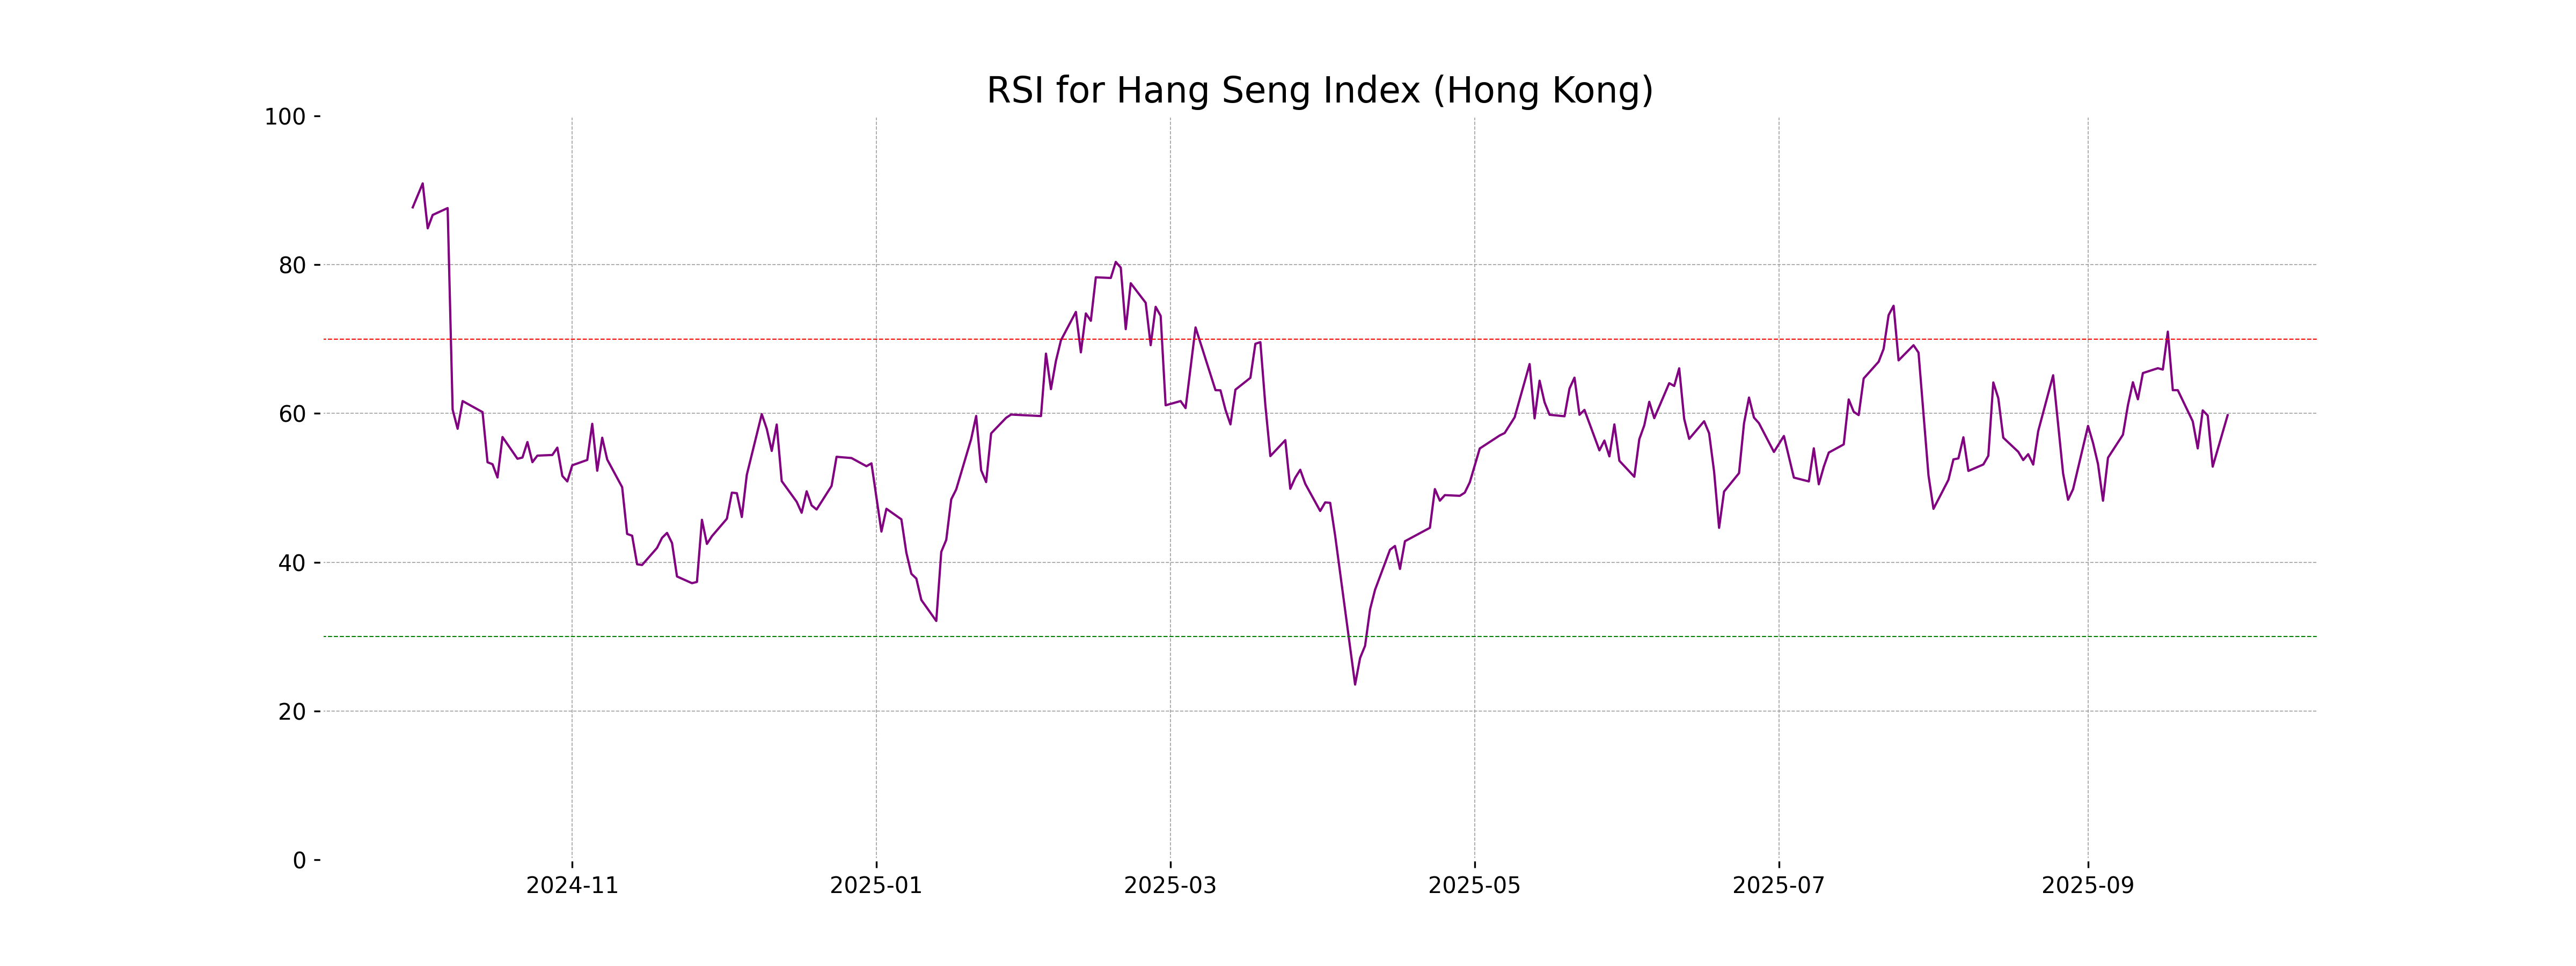
Analysis for Hang Seng Index (Hong Kong) - September 29, 2025
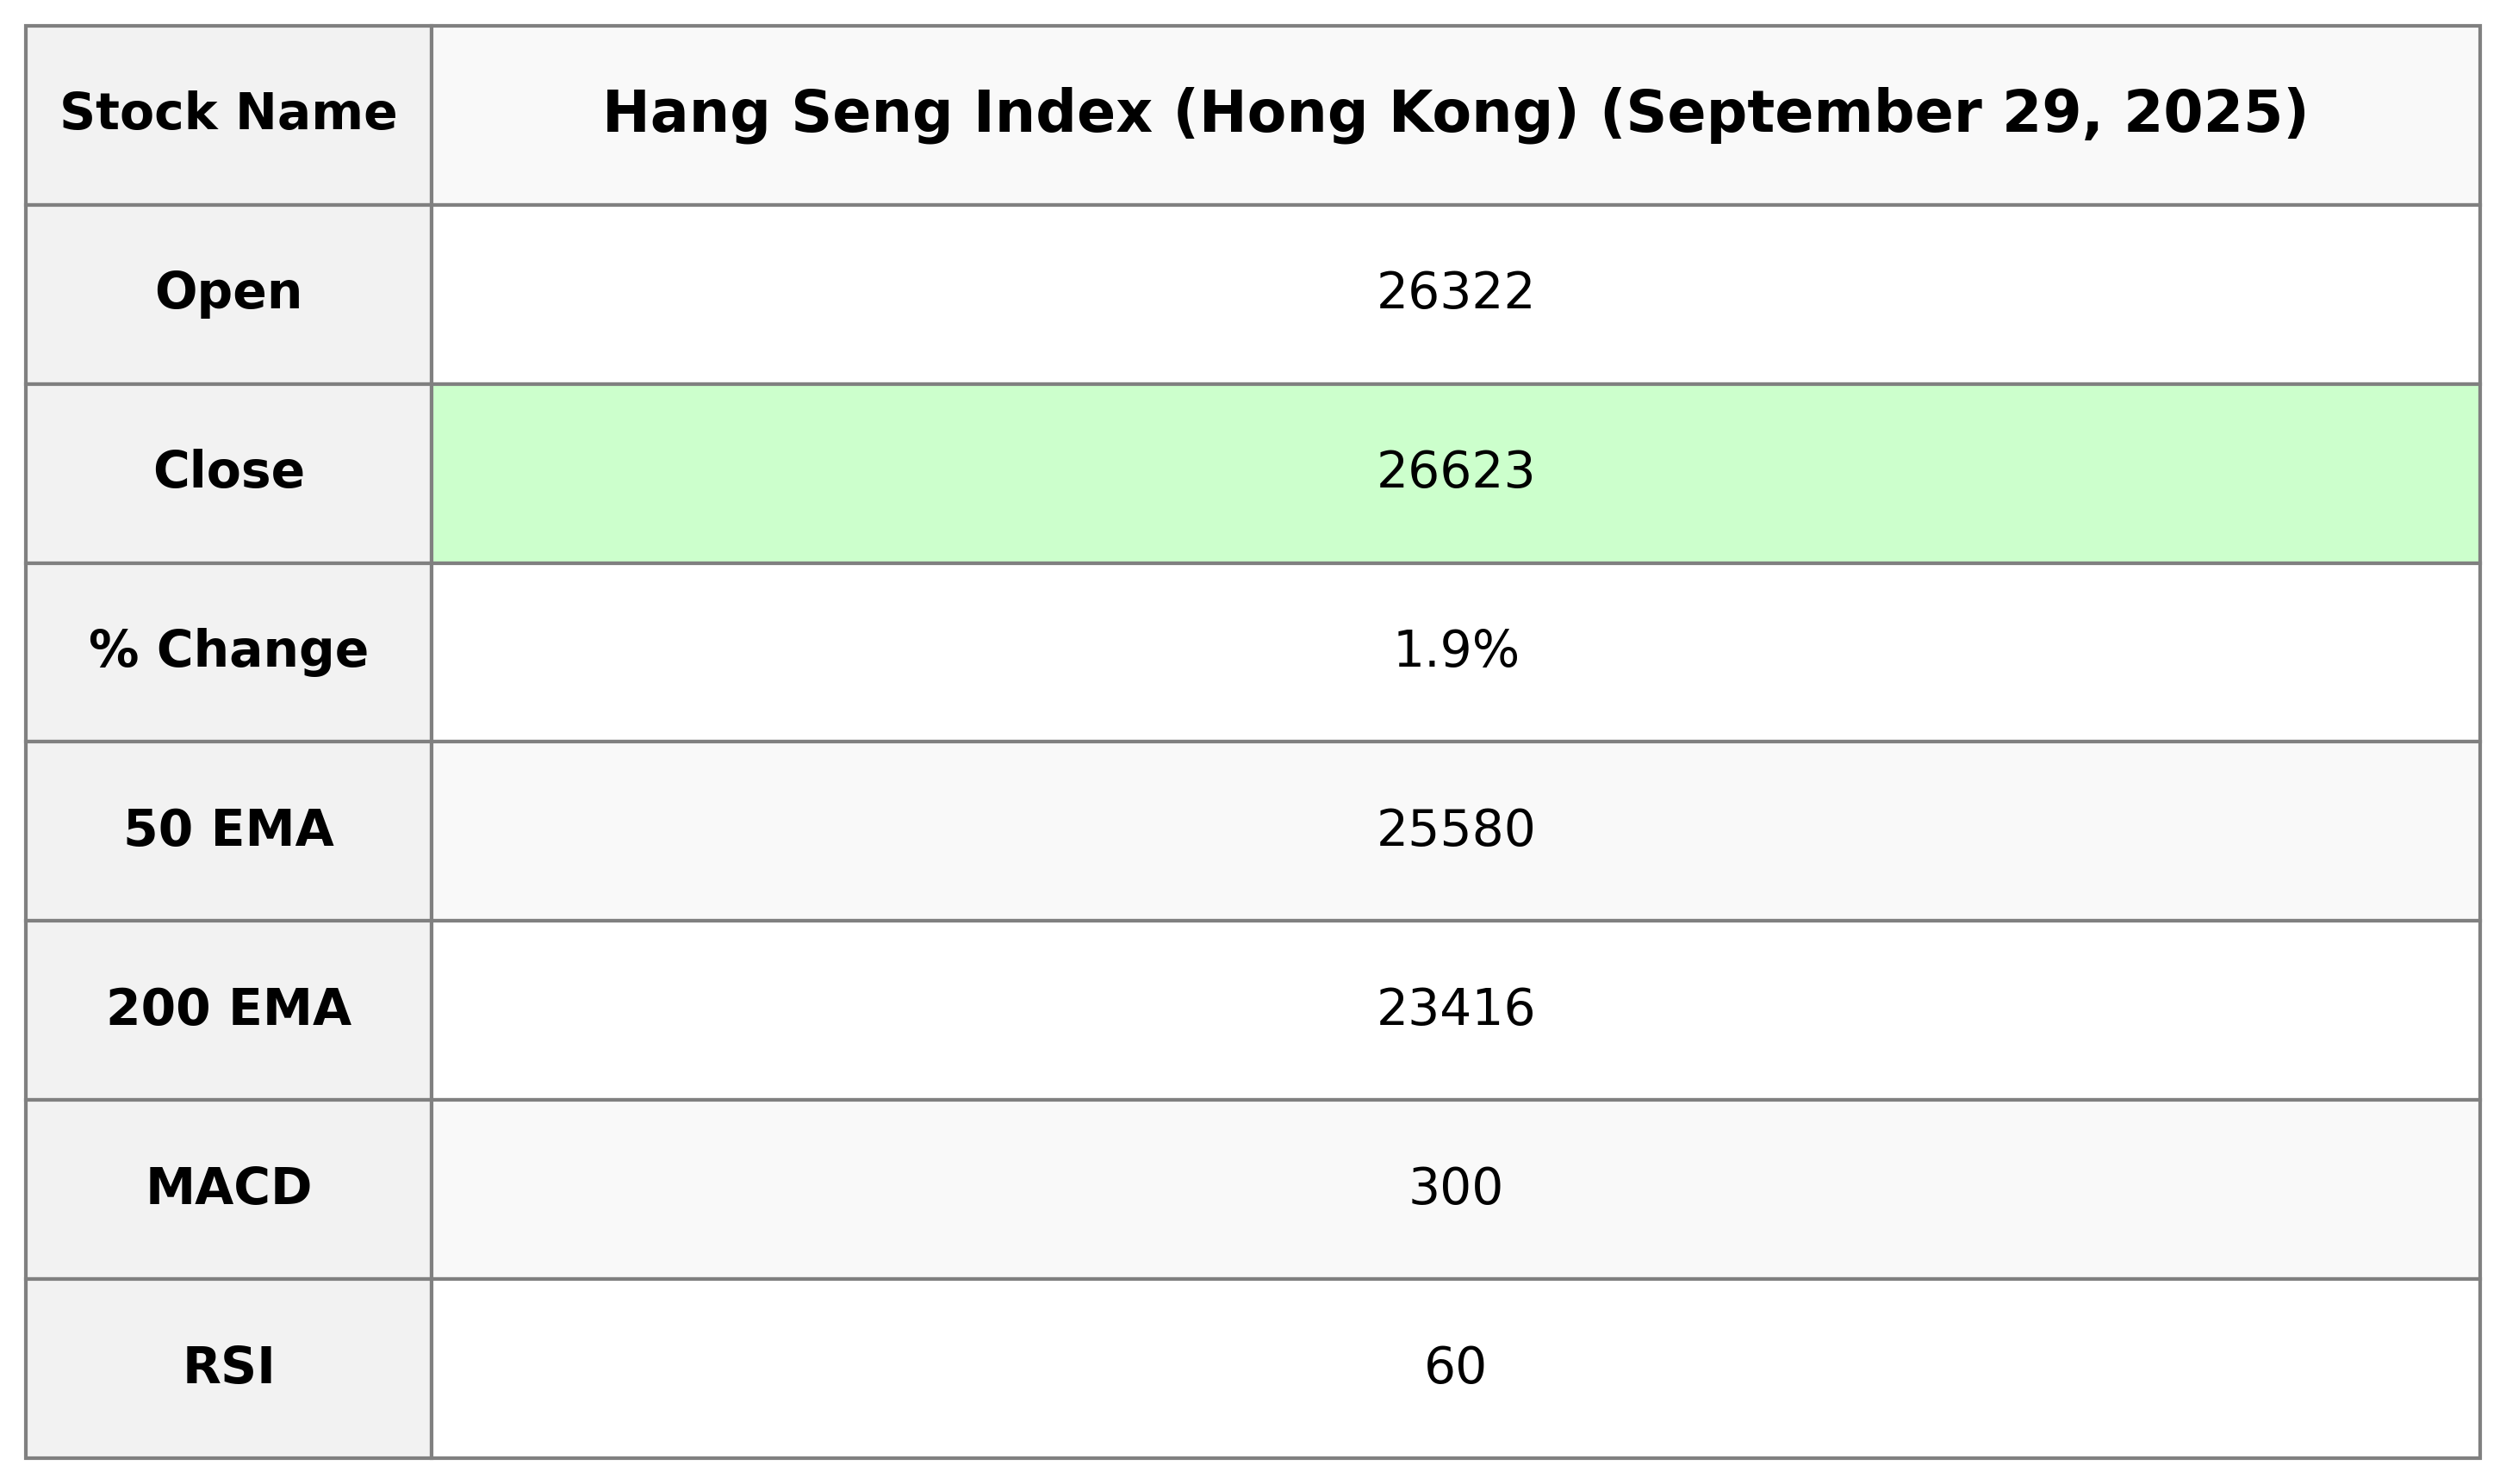
The Hang Seng Index (Hong Kong) opened at 26,321.57 and closed at 26,622.88, marking a 1.89% increase from the previous close of 26,128.20, with a points change of 494.68. The RSI value of 59.77 suggests moderate strength in the index's recent performance, and the index remains above both its 50-day EMA of 25,579.74 and 200-day EMA of 23,416.20, indicating a bullish trend.
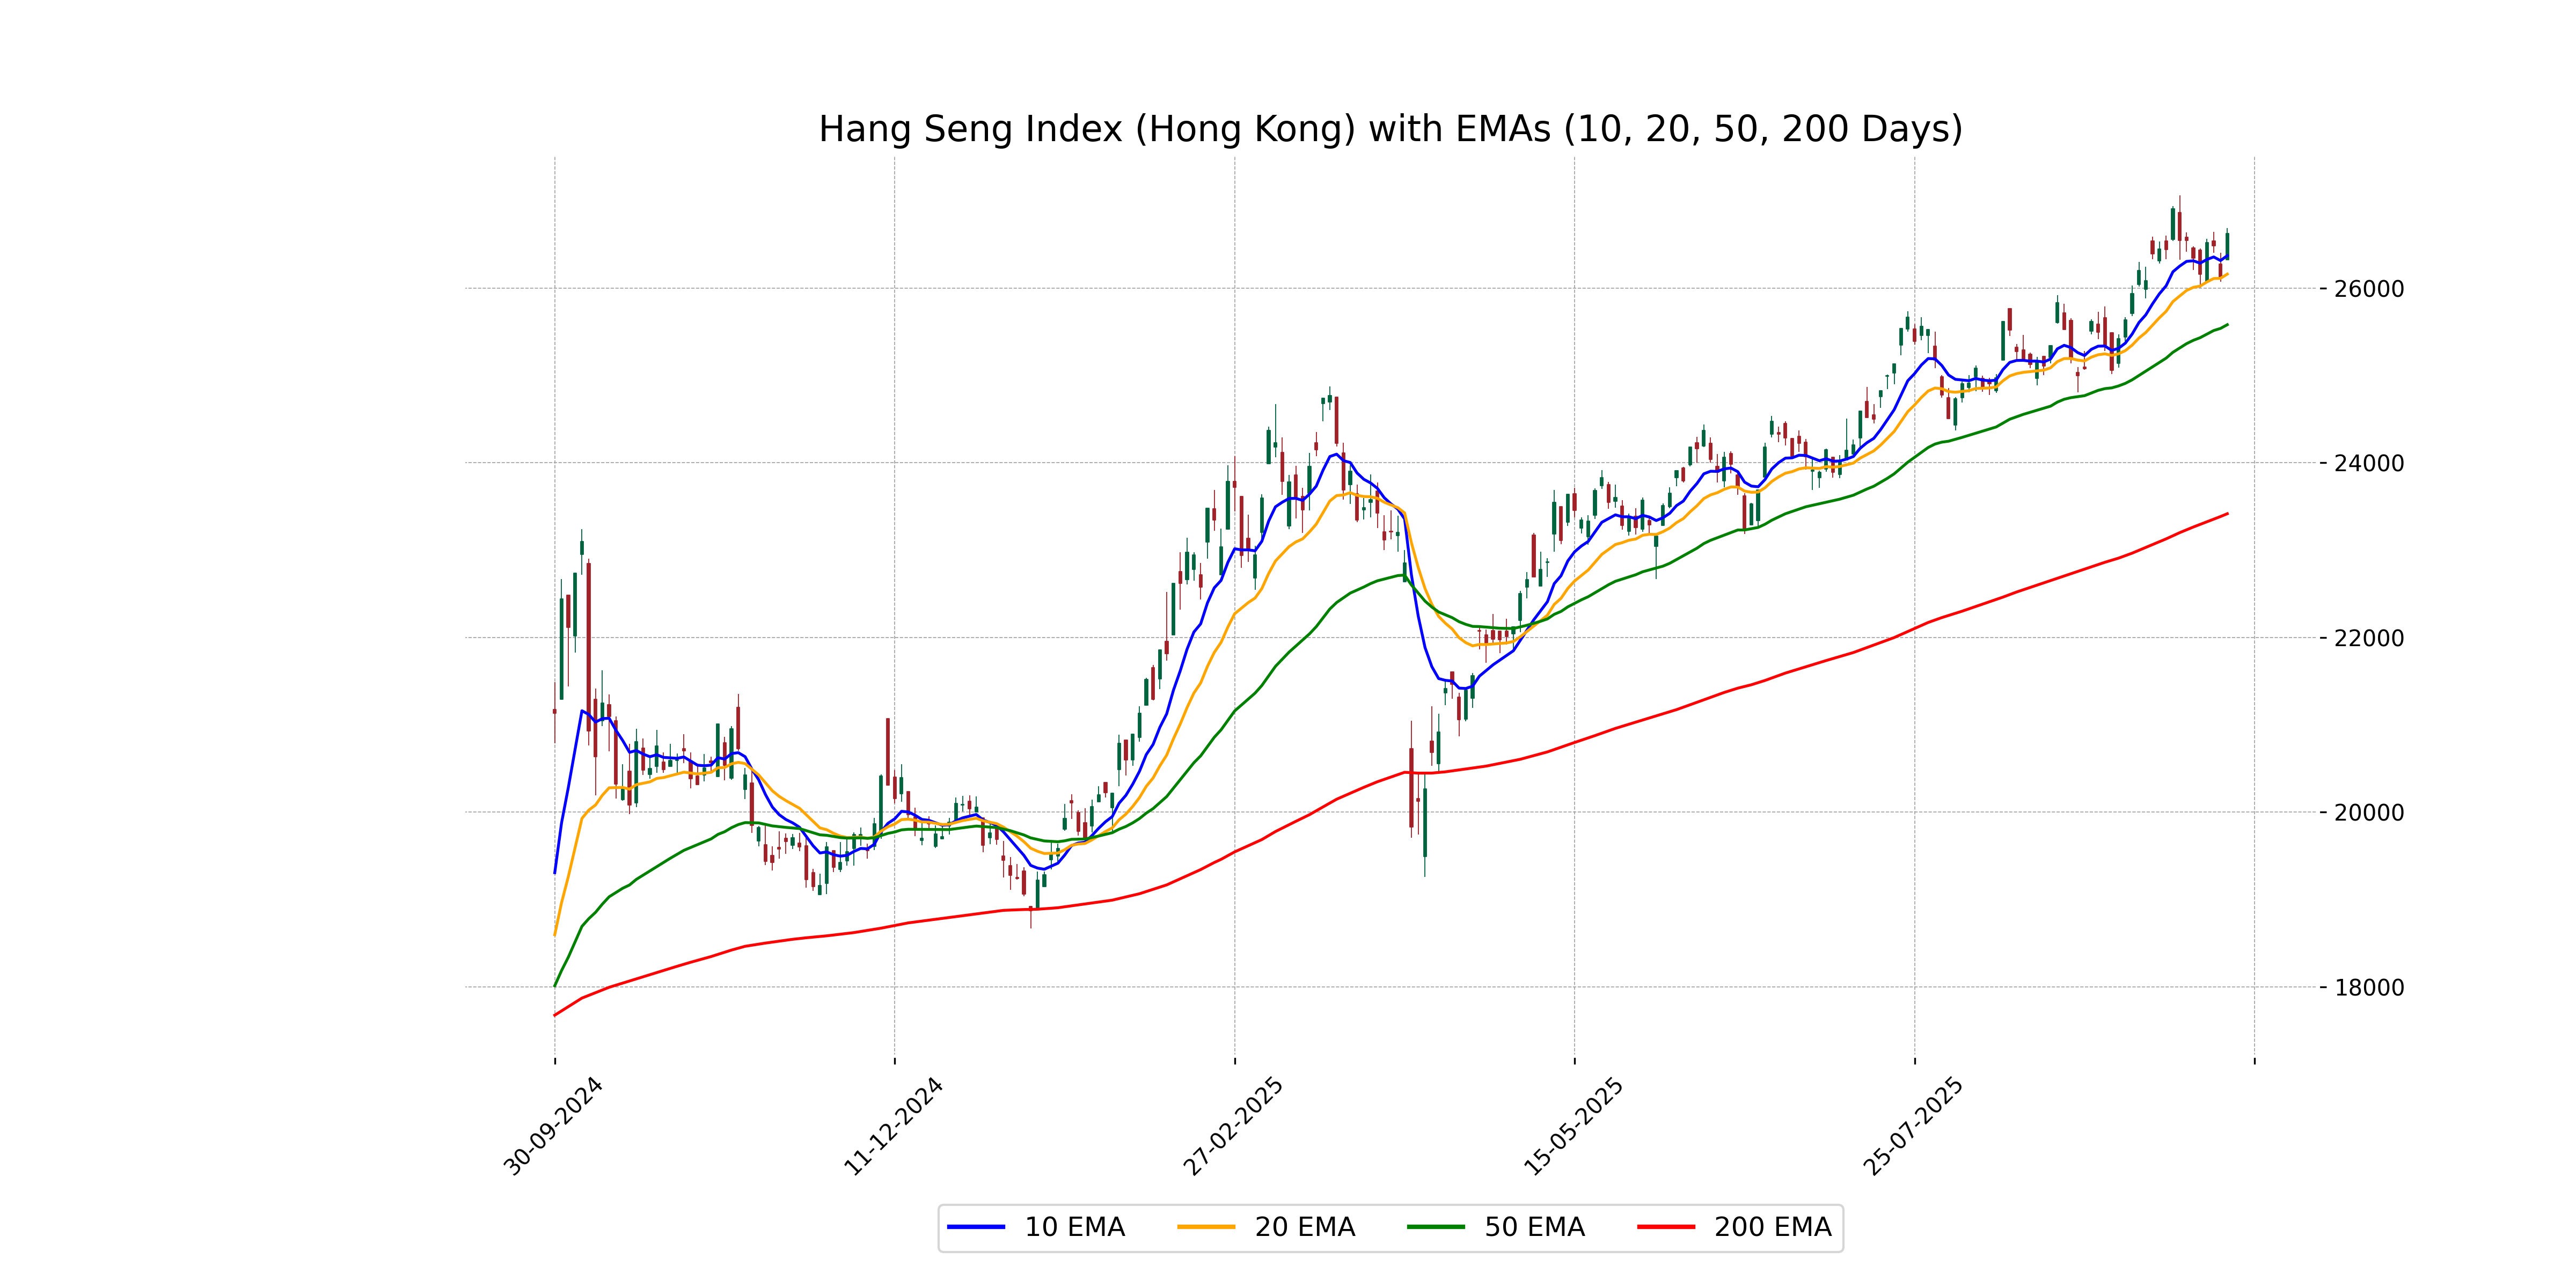
Relationship with Key Moving Averages
Hang Seng Index (Hong Kong) is trading above its key moving averages with the close price of 26622.88 above the 50 EMA at 25579.74, 200 EMA at 23416.20, and 10 EMA at 26370.14, indicating a positive trend. The index's RSI is 59.77, suggesting neither overbought nor oversold conditions.
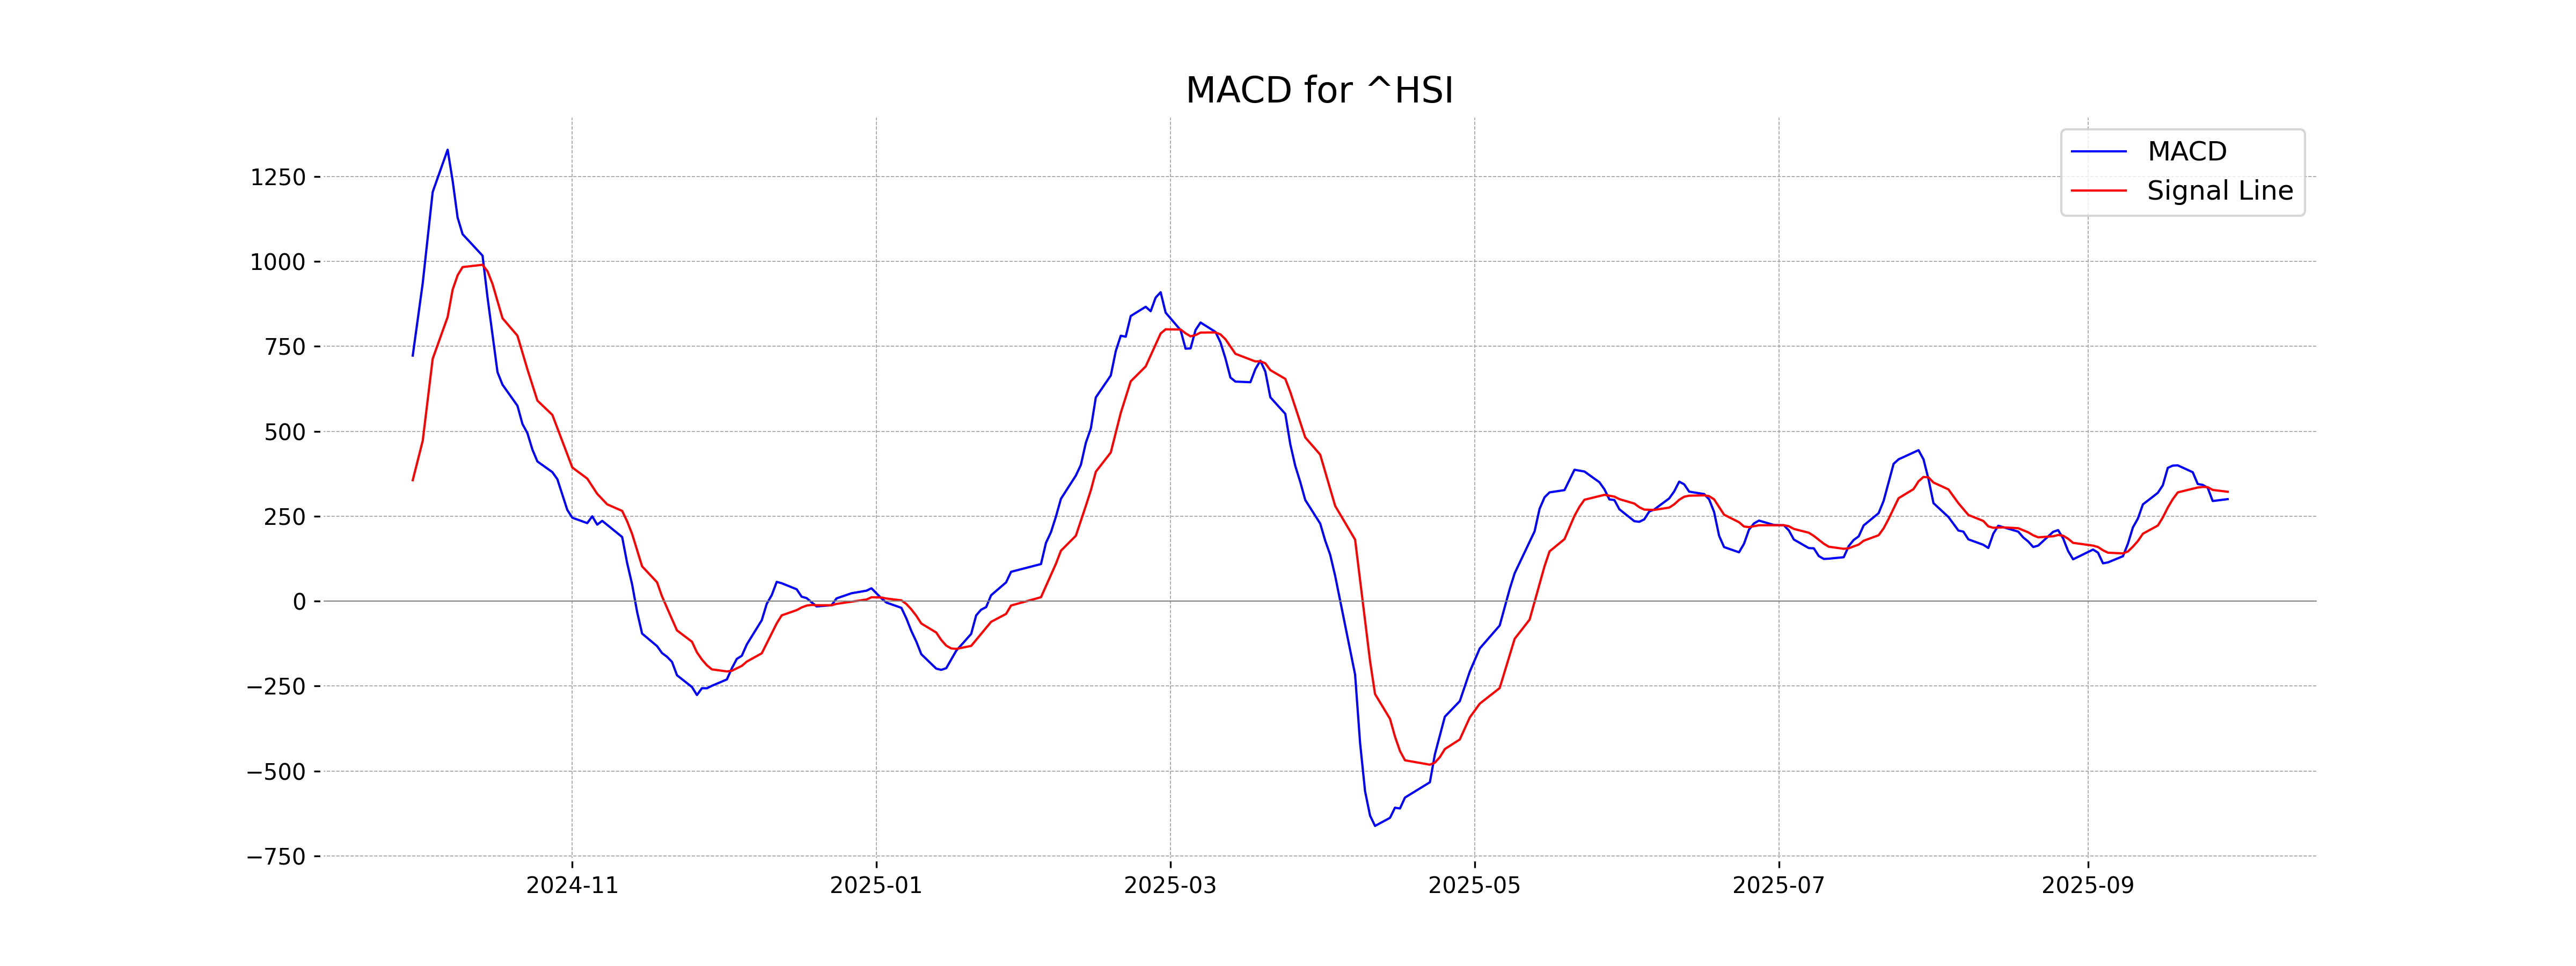
Moving Averages Trend (MACD)
The MACD for Hang Seng Index is 300.17, which is below the MACD Signal of 321.88, suggesting a bearish trend may be present. This indicates that momentum is currently negative.
RSI Analysis
RSI Analysis for Hang Seng Index (Hong Kong): The RSI value for the Hang Seng Index is 59.77, indicating a neutral to slightly bullish momentum. While not overbought or oversold, the RSI suggests there is room for further price movement in either direction.
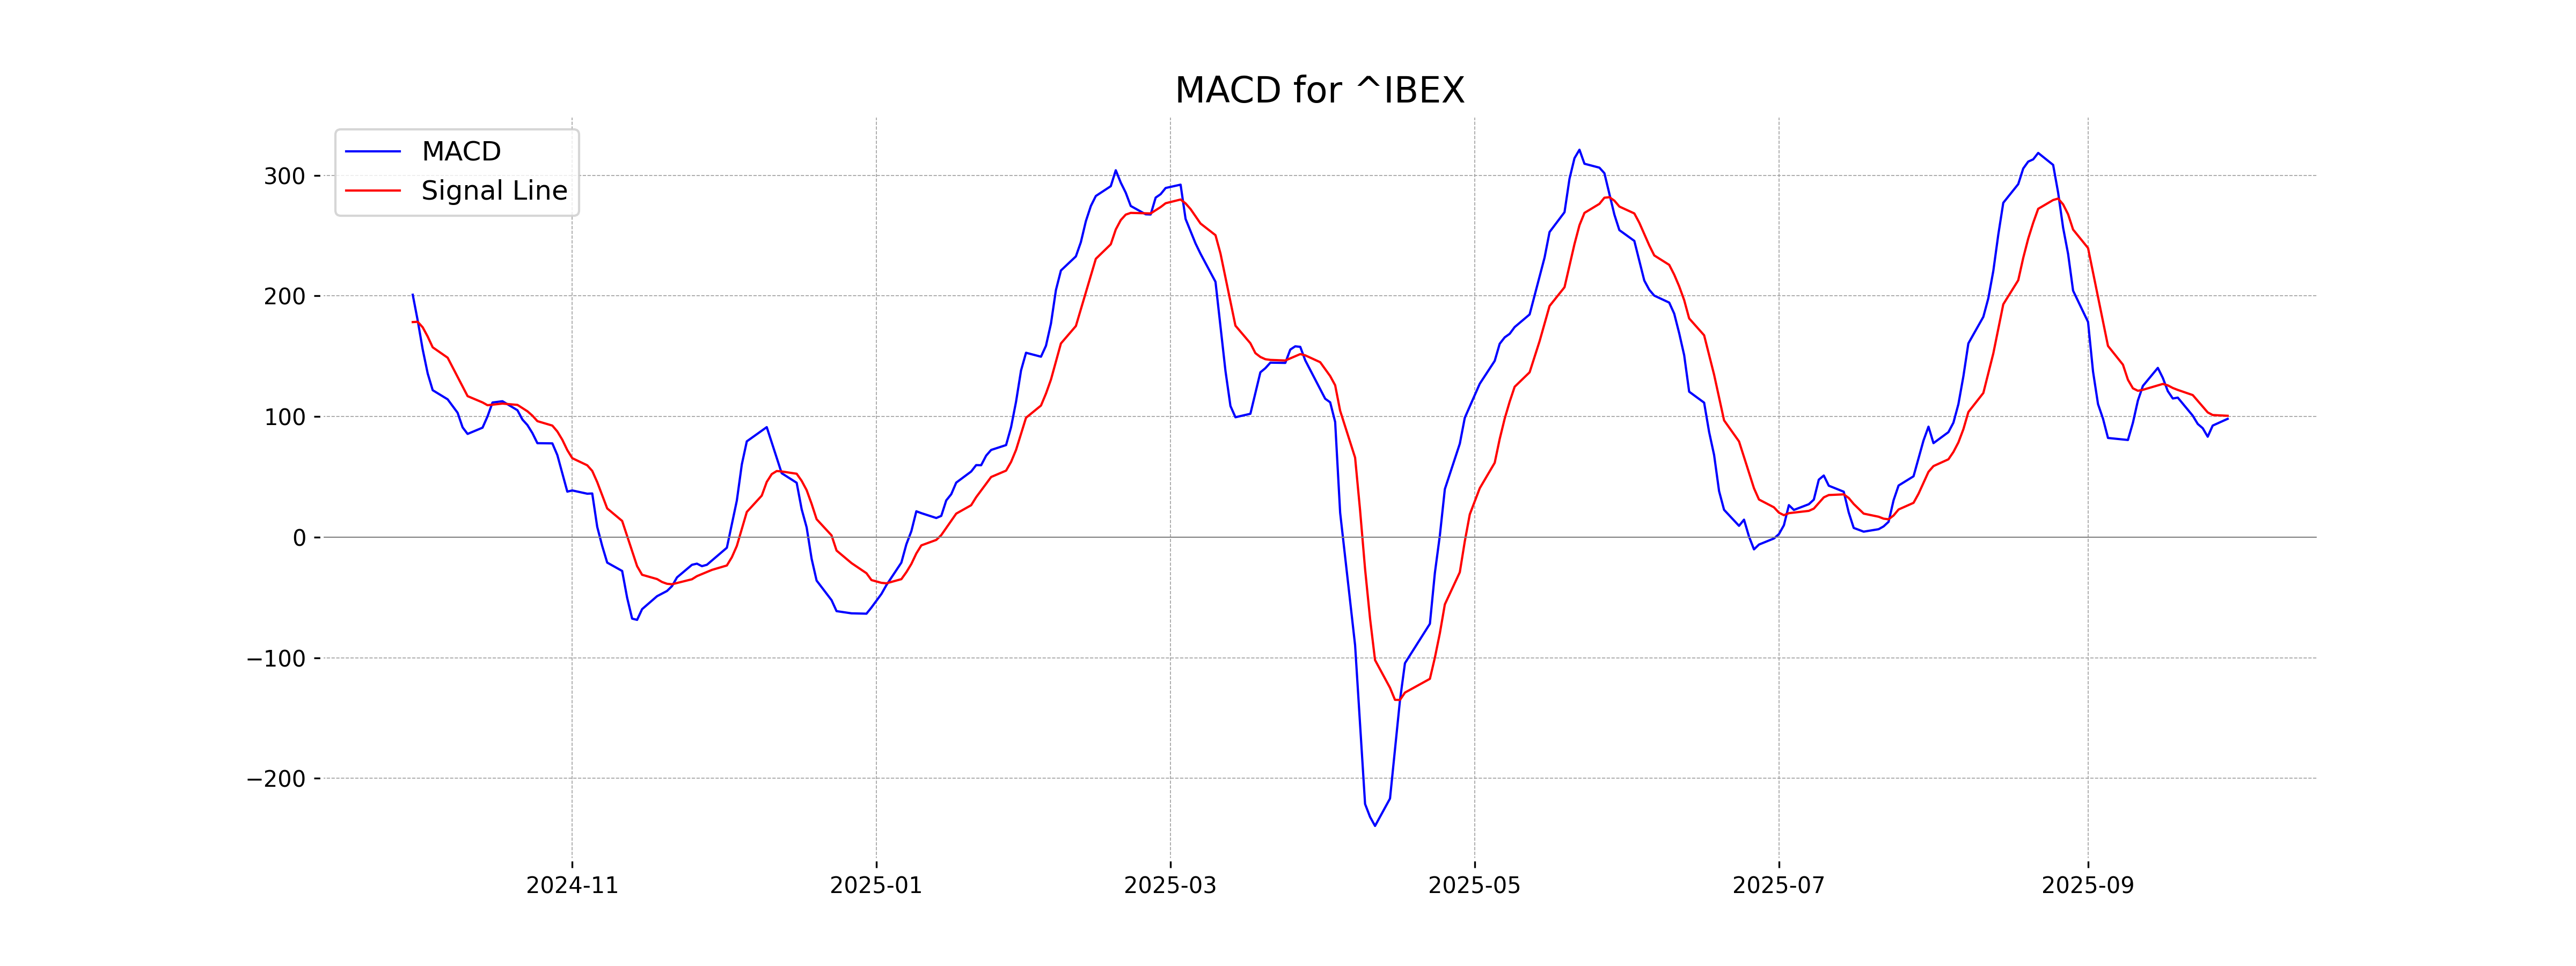
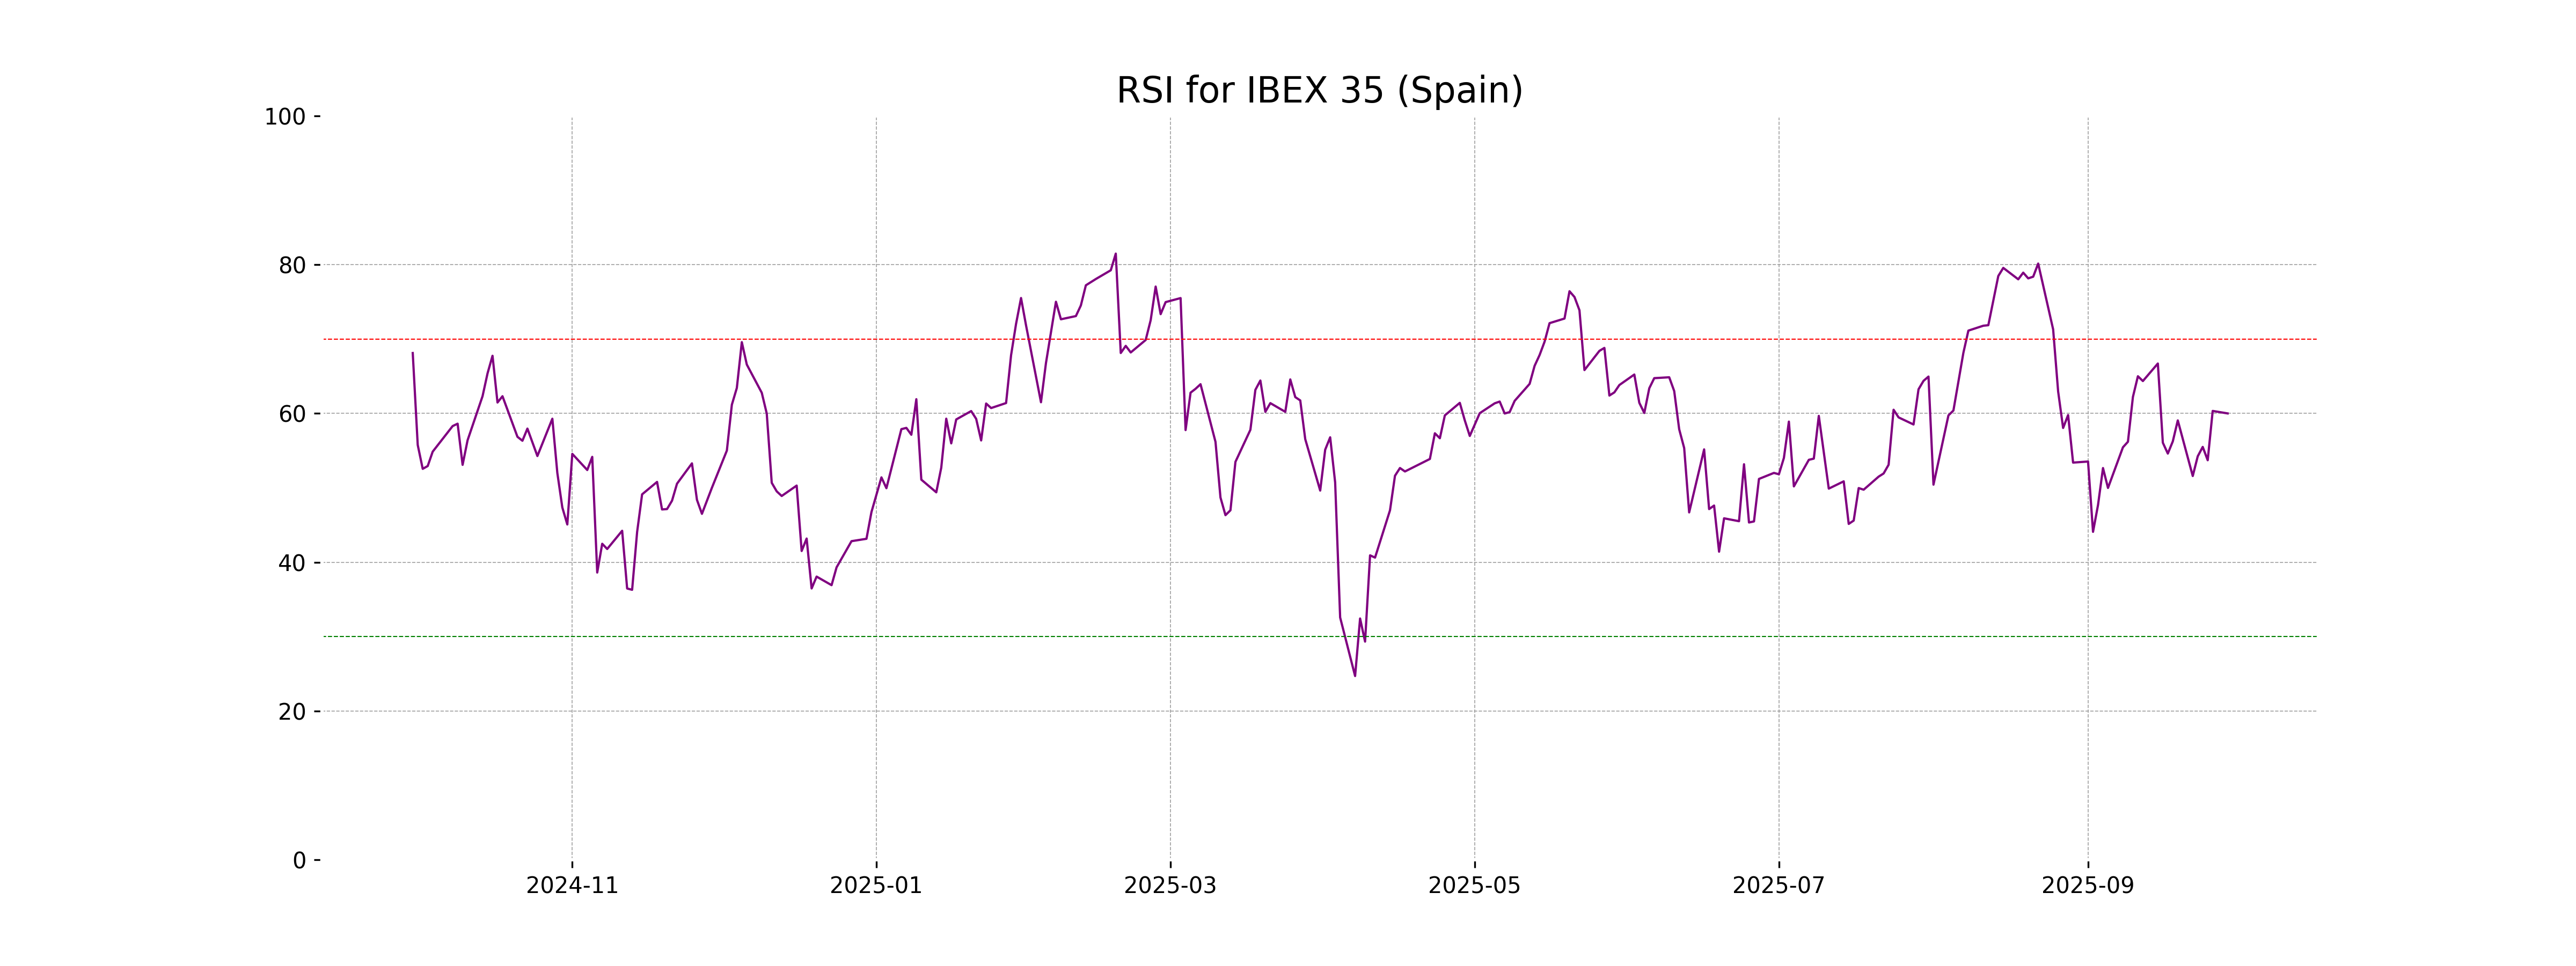
Analysis for IBEX 35 (Spain) - September 29, 2025
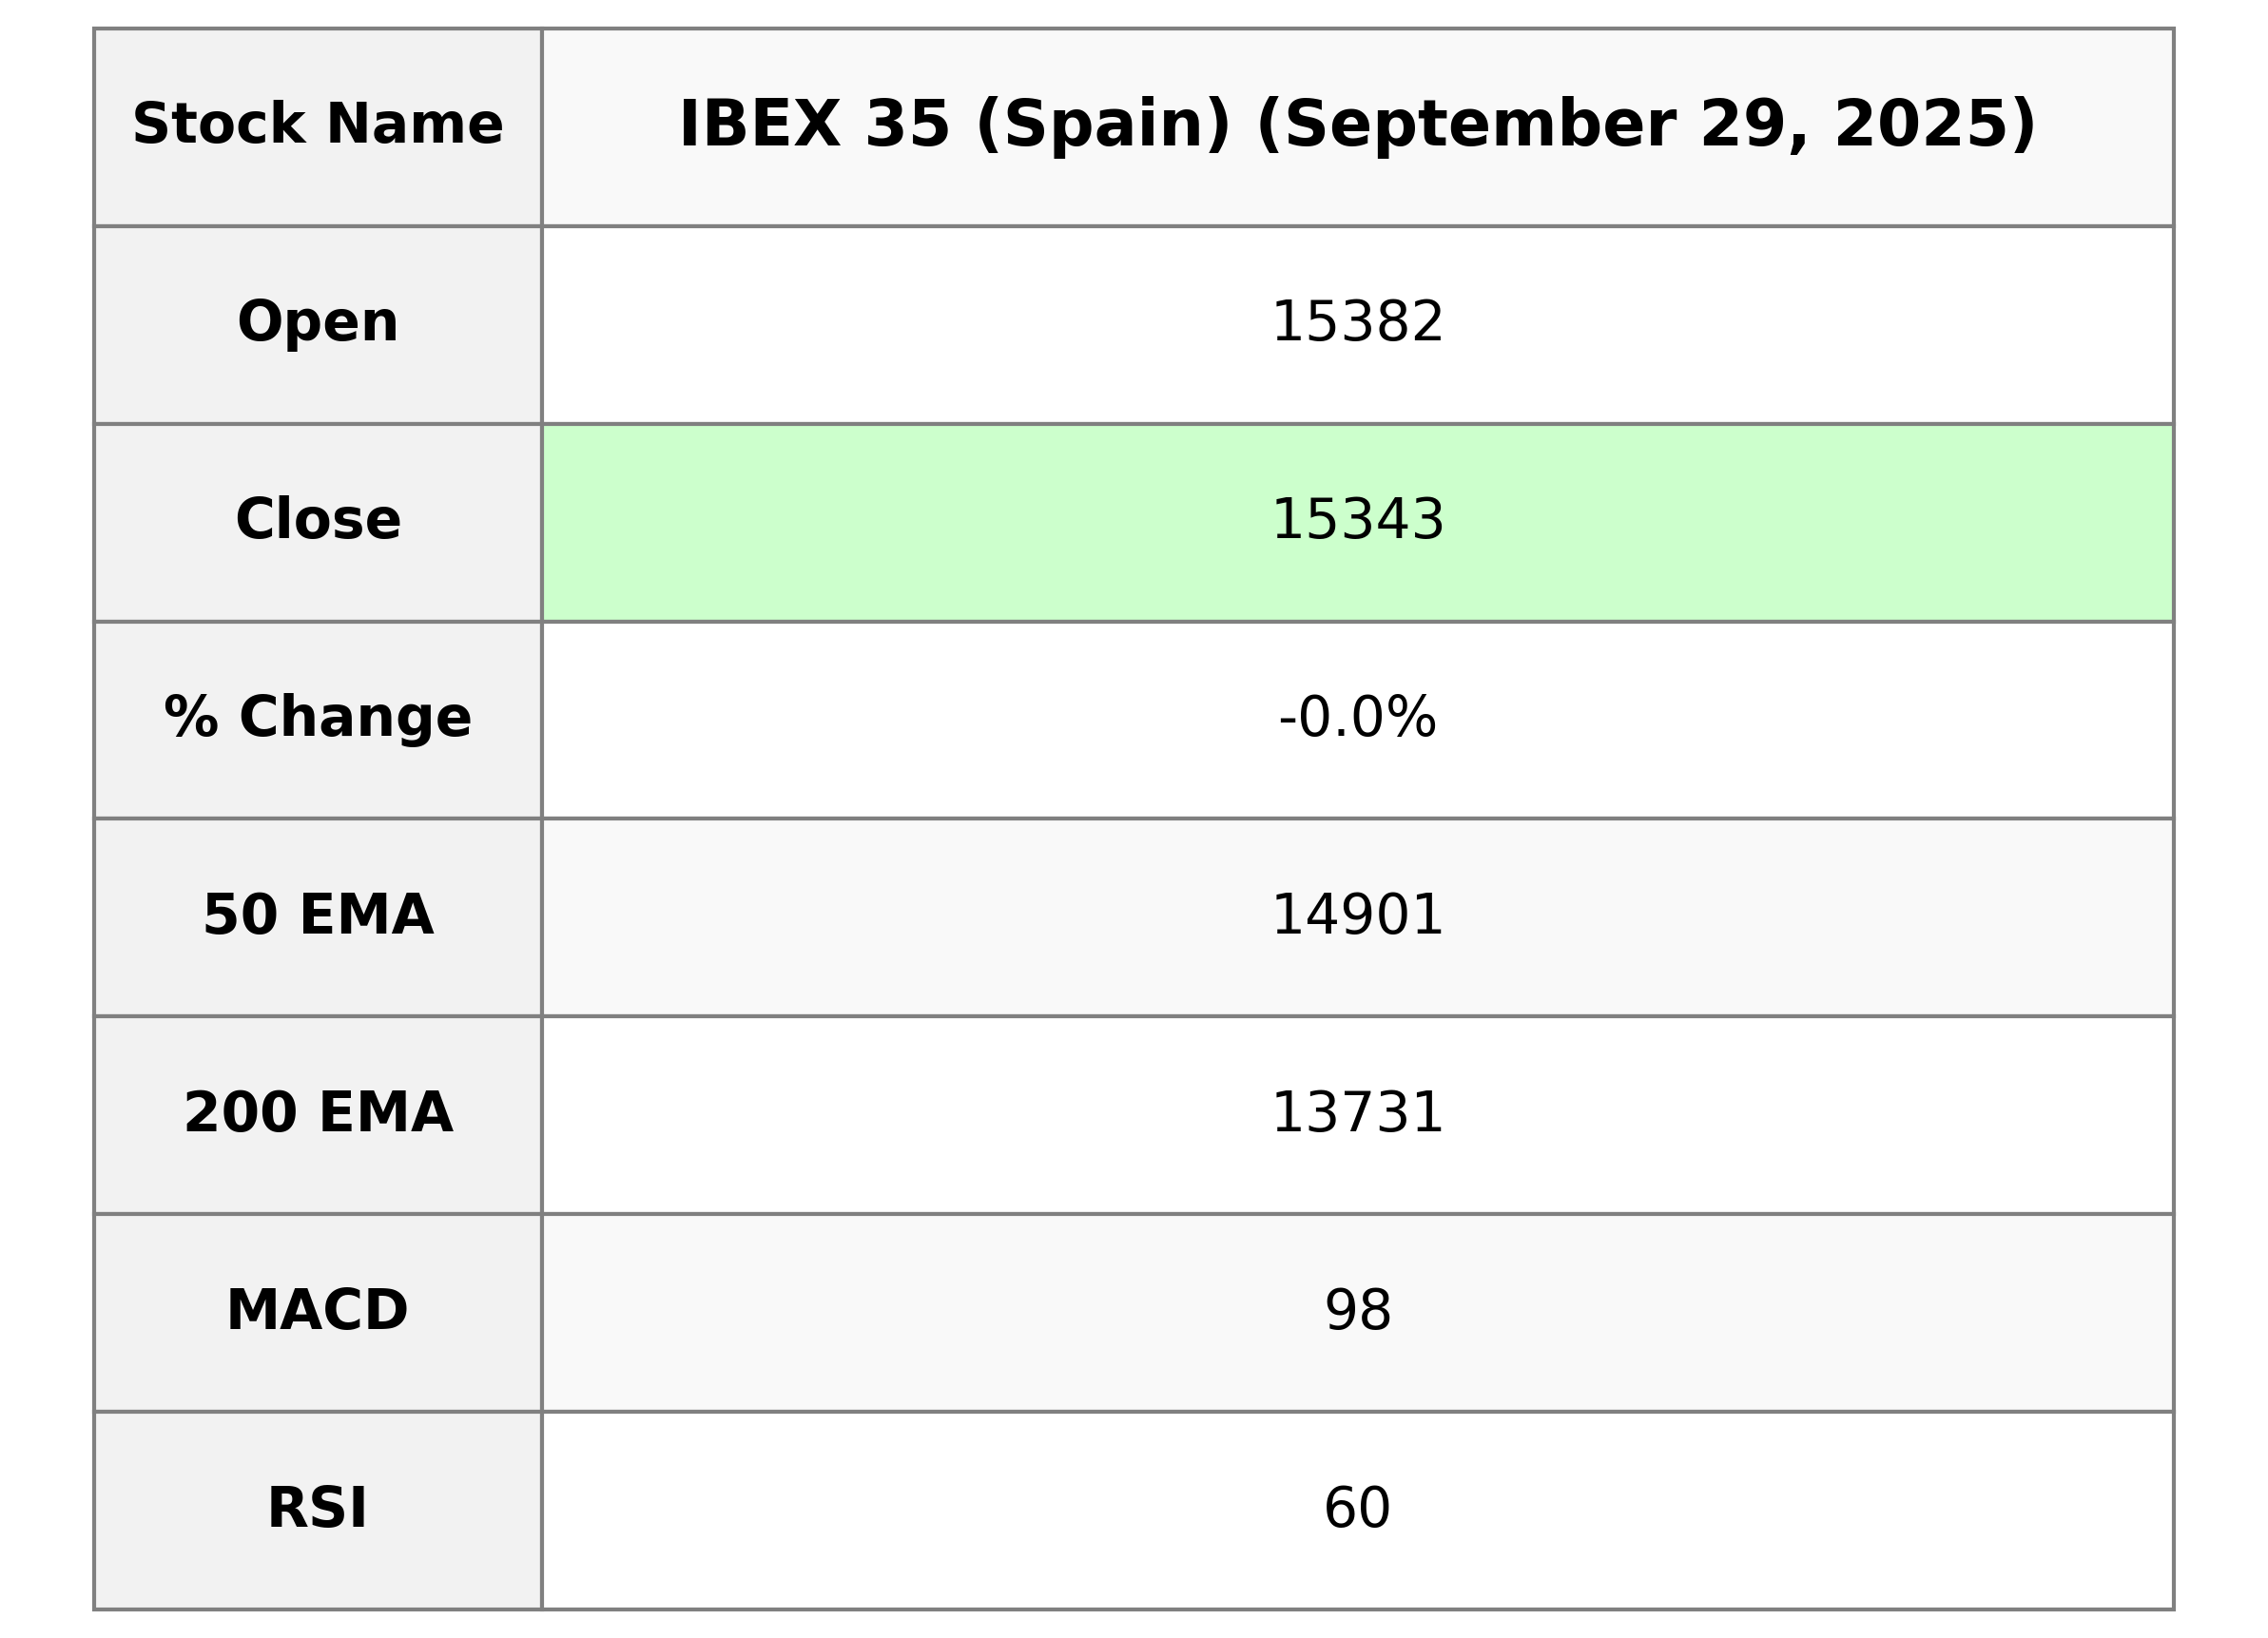
The IBEX 35 opened at 15,382.5 and closed slightly down at 15,343.3, marking a points change of -7.1 from the previous close of 15,350.4. The index saw a percentage change of approximately -0.05%, with a trading volume of 21,679,107. Key technical indicators show a 50-day EMA of 14,901.43 and a 200-day EMA of 13,731.31, with the RSI at 60 indicating near-neutral momentum.
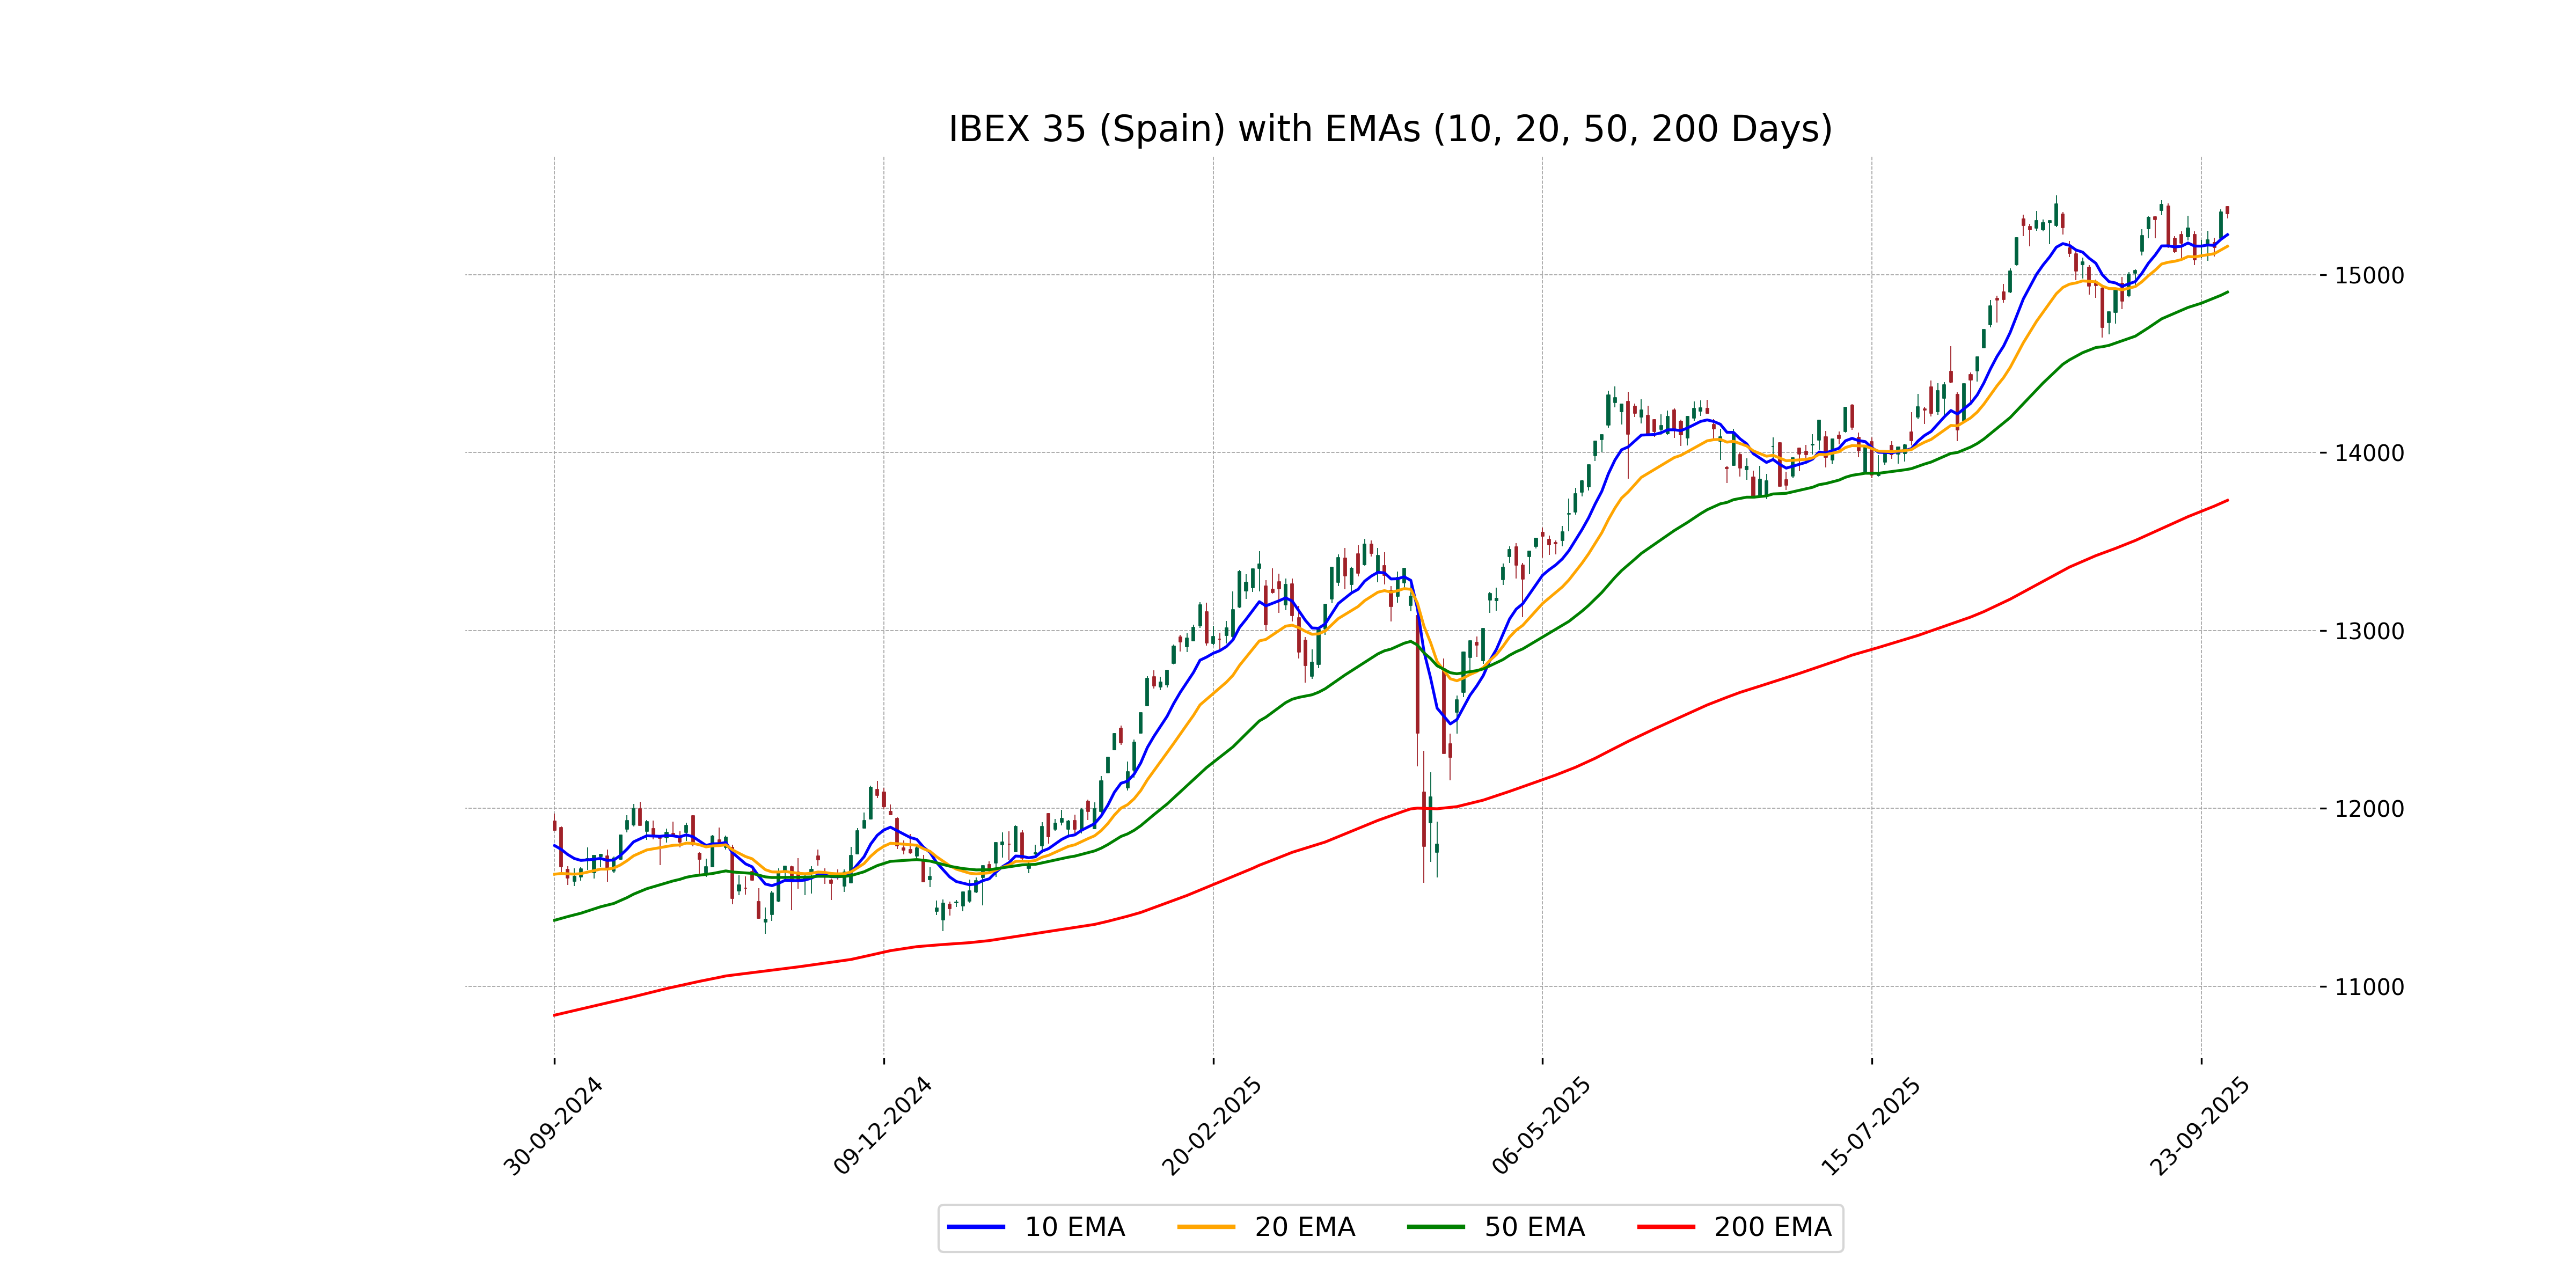
Relationship with Key Moving Averages
The closing price of IBEX 35 is 15,343.30, which is above the 50-day EMA of 14,901.43, indicating a short-term bullish trend, and significantly above the 200-day EMA of 13,731.31, suggesting a strong long-term upward trend. However, it's slightly below the 10-day EMA of 15,224.21 and the 20-day EMA of 15,158.88, indicating possible short-term resistance or a minor pullback.
Moving Averages Trend (MACD)
The MACD for IBEX 35 is slightly below the MACD Signal, indicating a potential bearish trend or a slowdown in bullish momentum. With the MACD at 98.08 and the Signal line at 100.59, traders might watch for further crossover signals to confirm future market direction.
RSI Analysis
RSI for IBEX 35 is 60.00, indicating a neutral position as it is close to the midpoint of the scale. This suggests that the market is relatively balanced between overbought and oversold conditions.
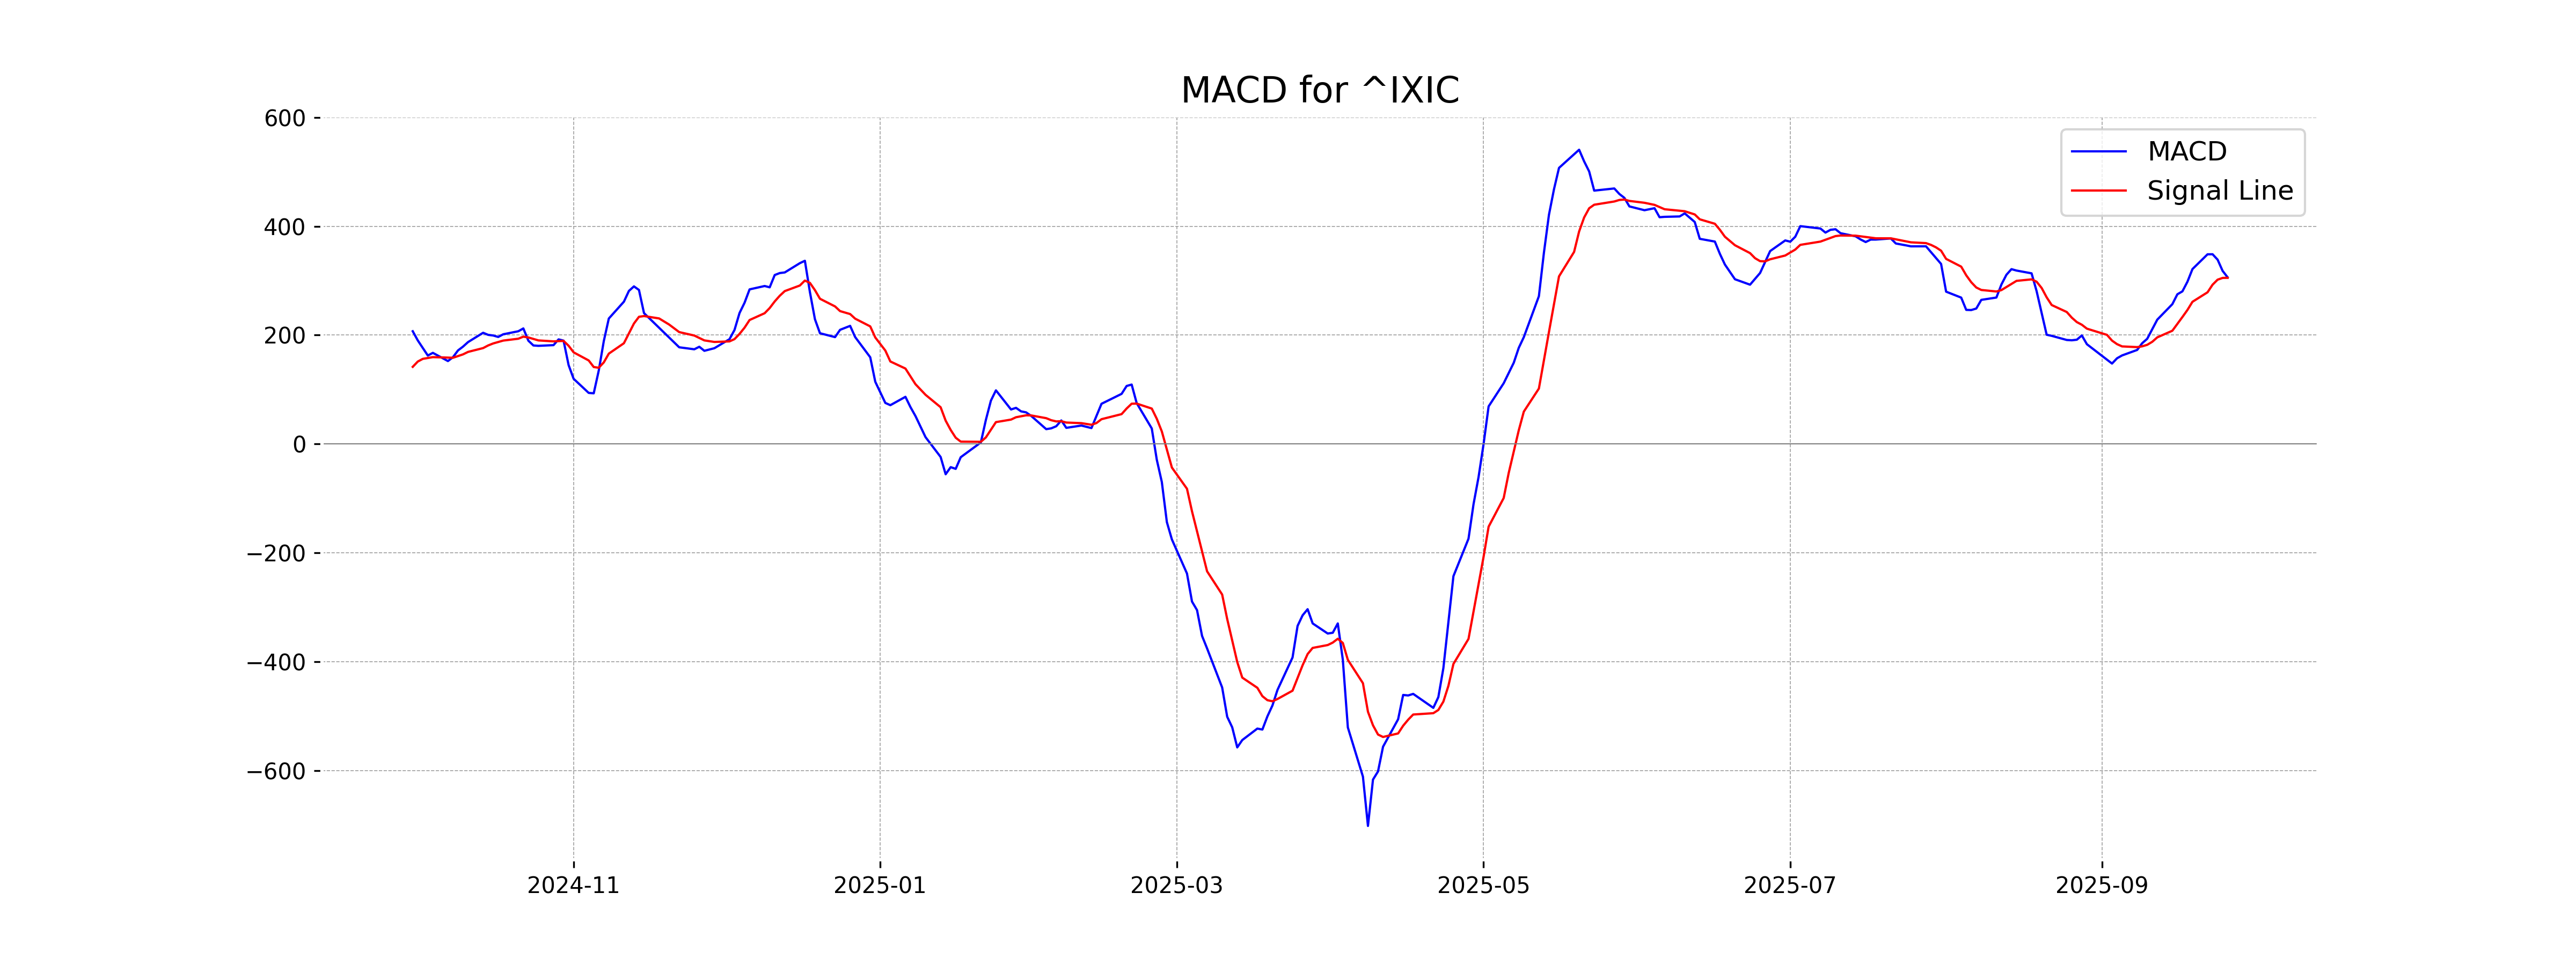
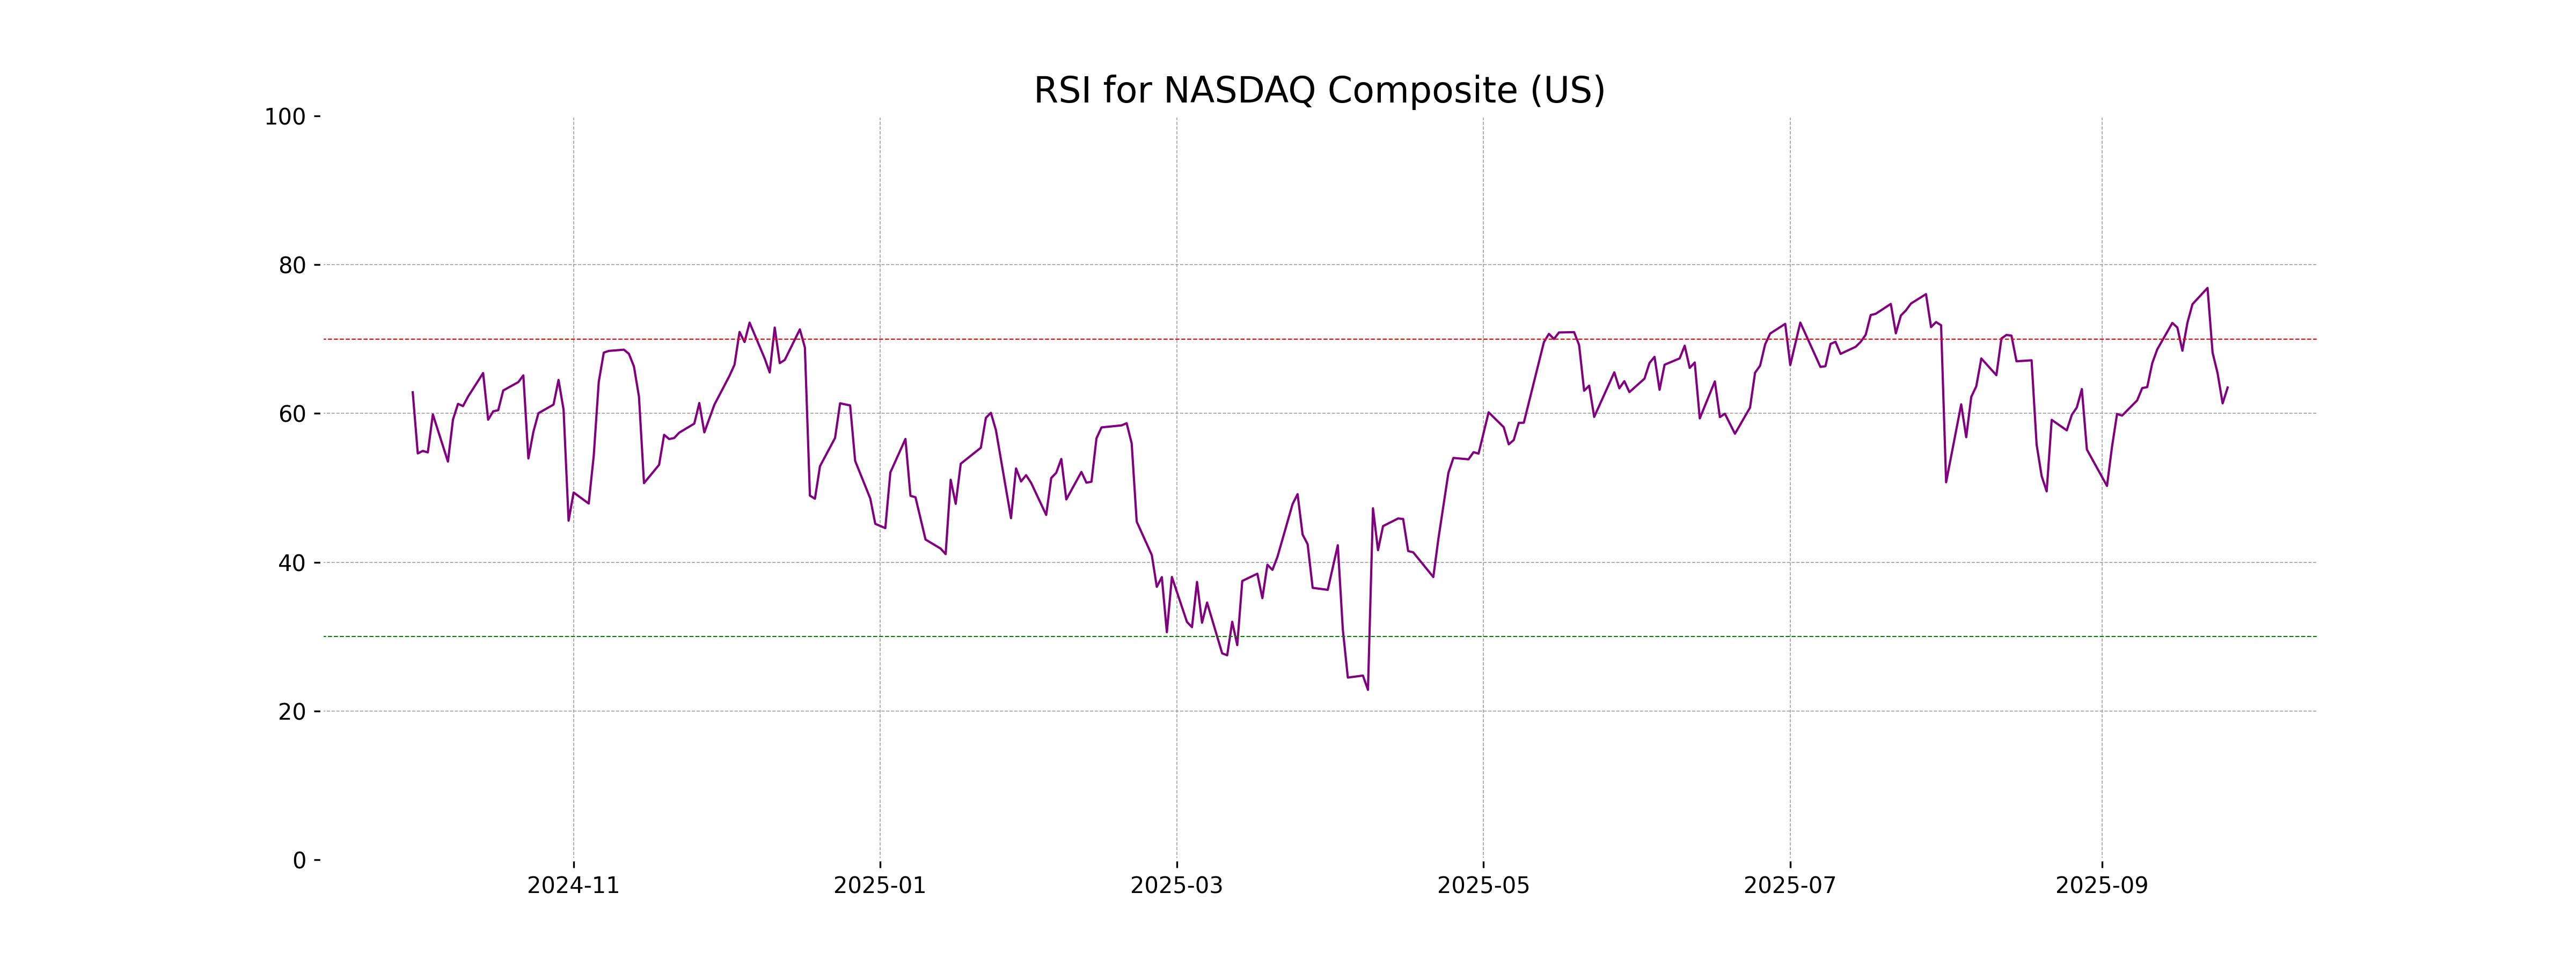
Analysis for NASDAQ Composite (US) - September 29, 2025
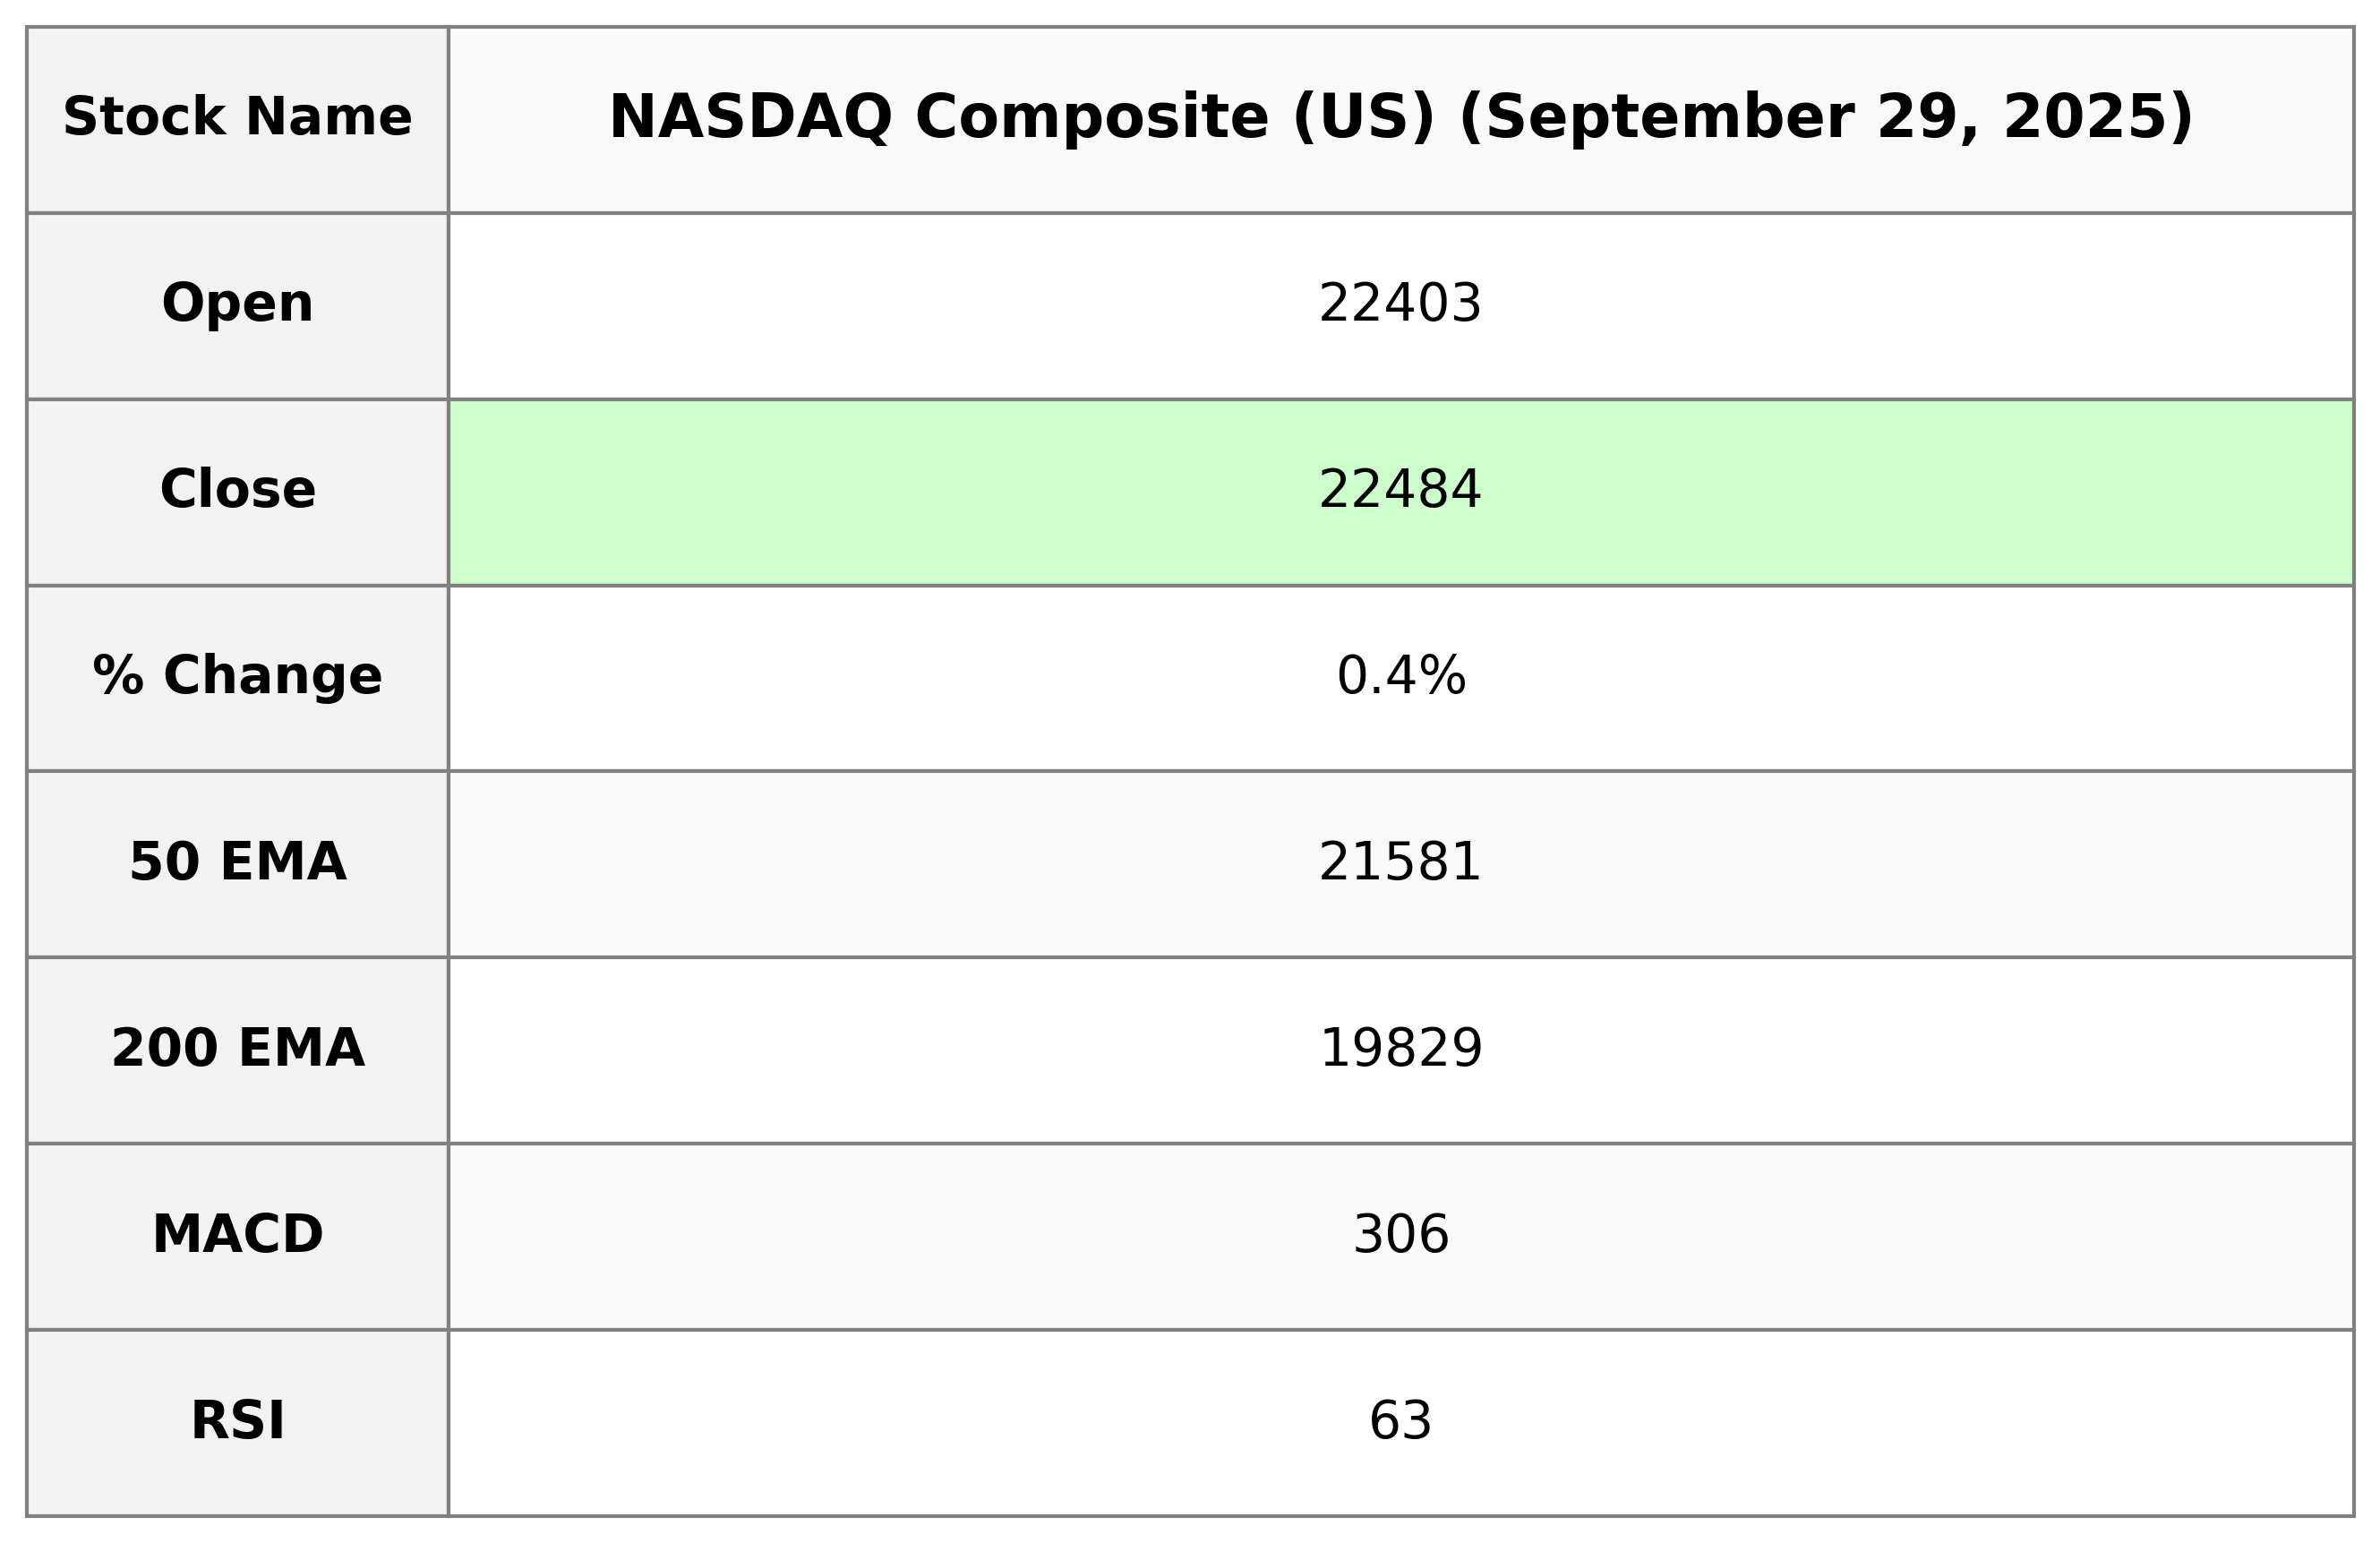
The NASDAQ Composite (US) showed a positive performance with a closing value of 22,484.07, reflecting a percentage change of 0.44% from the previous close of 22,384.70. The index had an intraday high of 22,488.18 and a low of 22,285.44, while trading volume reached 8.49 billion. Notably, the Relative Strength Index (RSI) stands at 63.49, suggesting a strong momentum in the current uptrend.
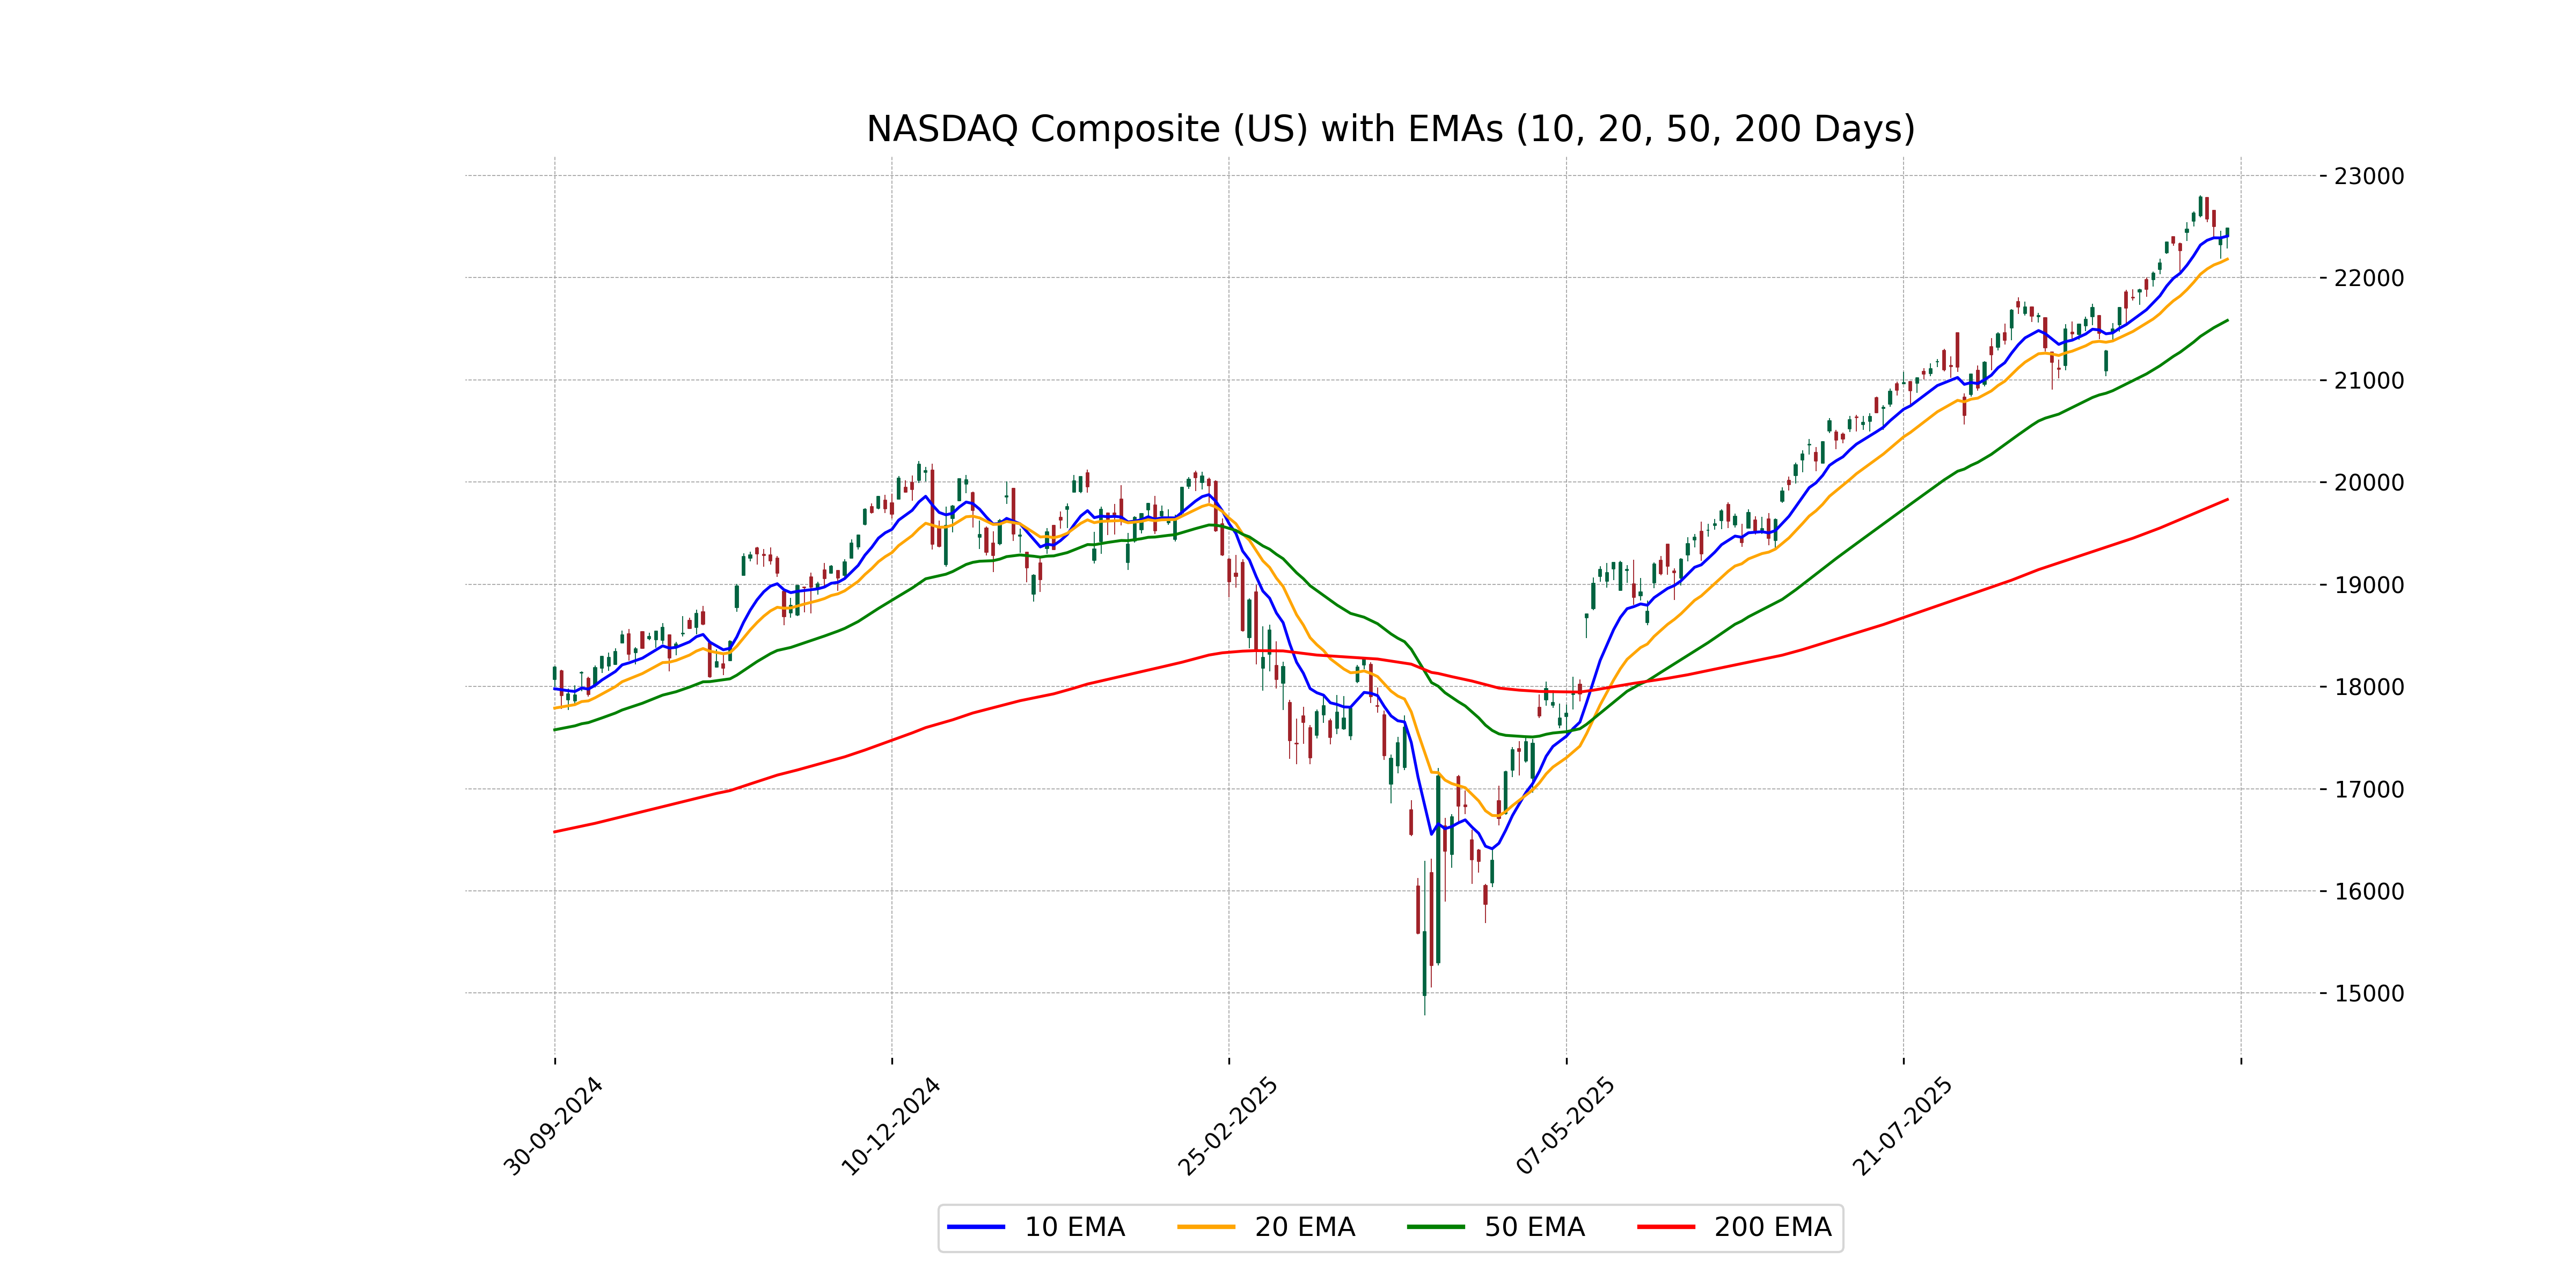
Relationship with Key Moving Averages
The NASDAQ Composite closed at 22,484.07, positioned above its 50-day EMA of 21,580.69, and significantly higher than the 200-day EMA of 19,828.69, indicating a bullish trend. Additionally, it is slightly above the 10-day EMA of 22,405.20 and the 20-day EMA of 22,180.05, suggesting short-term strength.
Moving Averages Trend (MACD)
The NASDAQ Composite (US) shows a positive MACD of 306.05 compared to its signal line of 305.23, indicating a bullish momentum in the stock. This suggests a potential upward trend as the MACD line is above the signal line.
RSI Analysis
The RSI for the NASDAQ Composite stands at approximately 63.49, suggesting that the index is nearing overbought territory but is not excessively high. This implies that while there is some buying pressure, it is not yet at extreme levels where a reversal might be imminent.
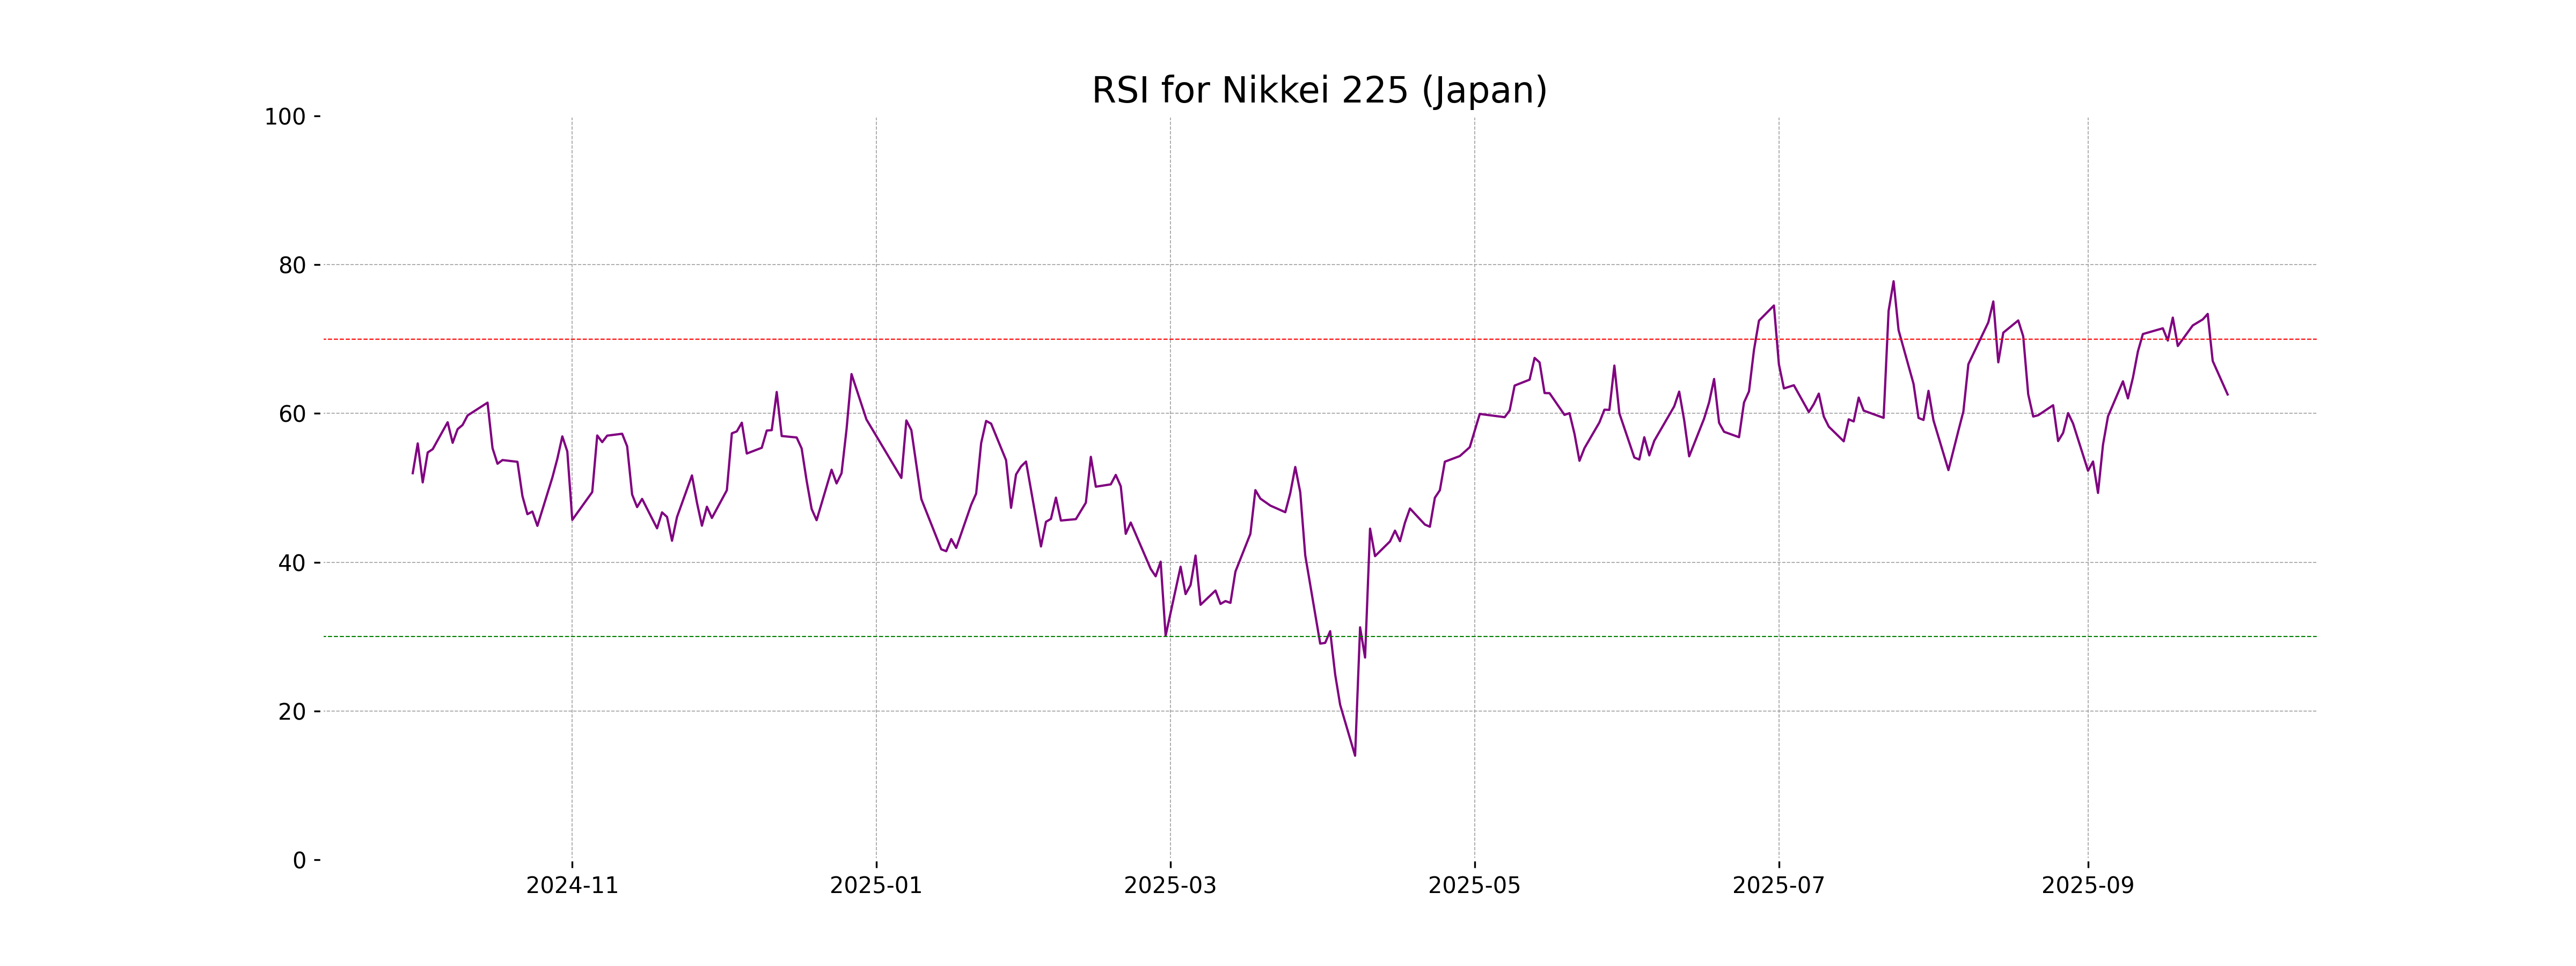
Analysis for Nikkei 225 (Japan) - September 29, 2025
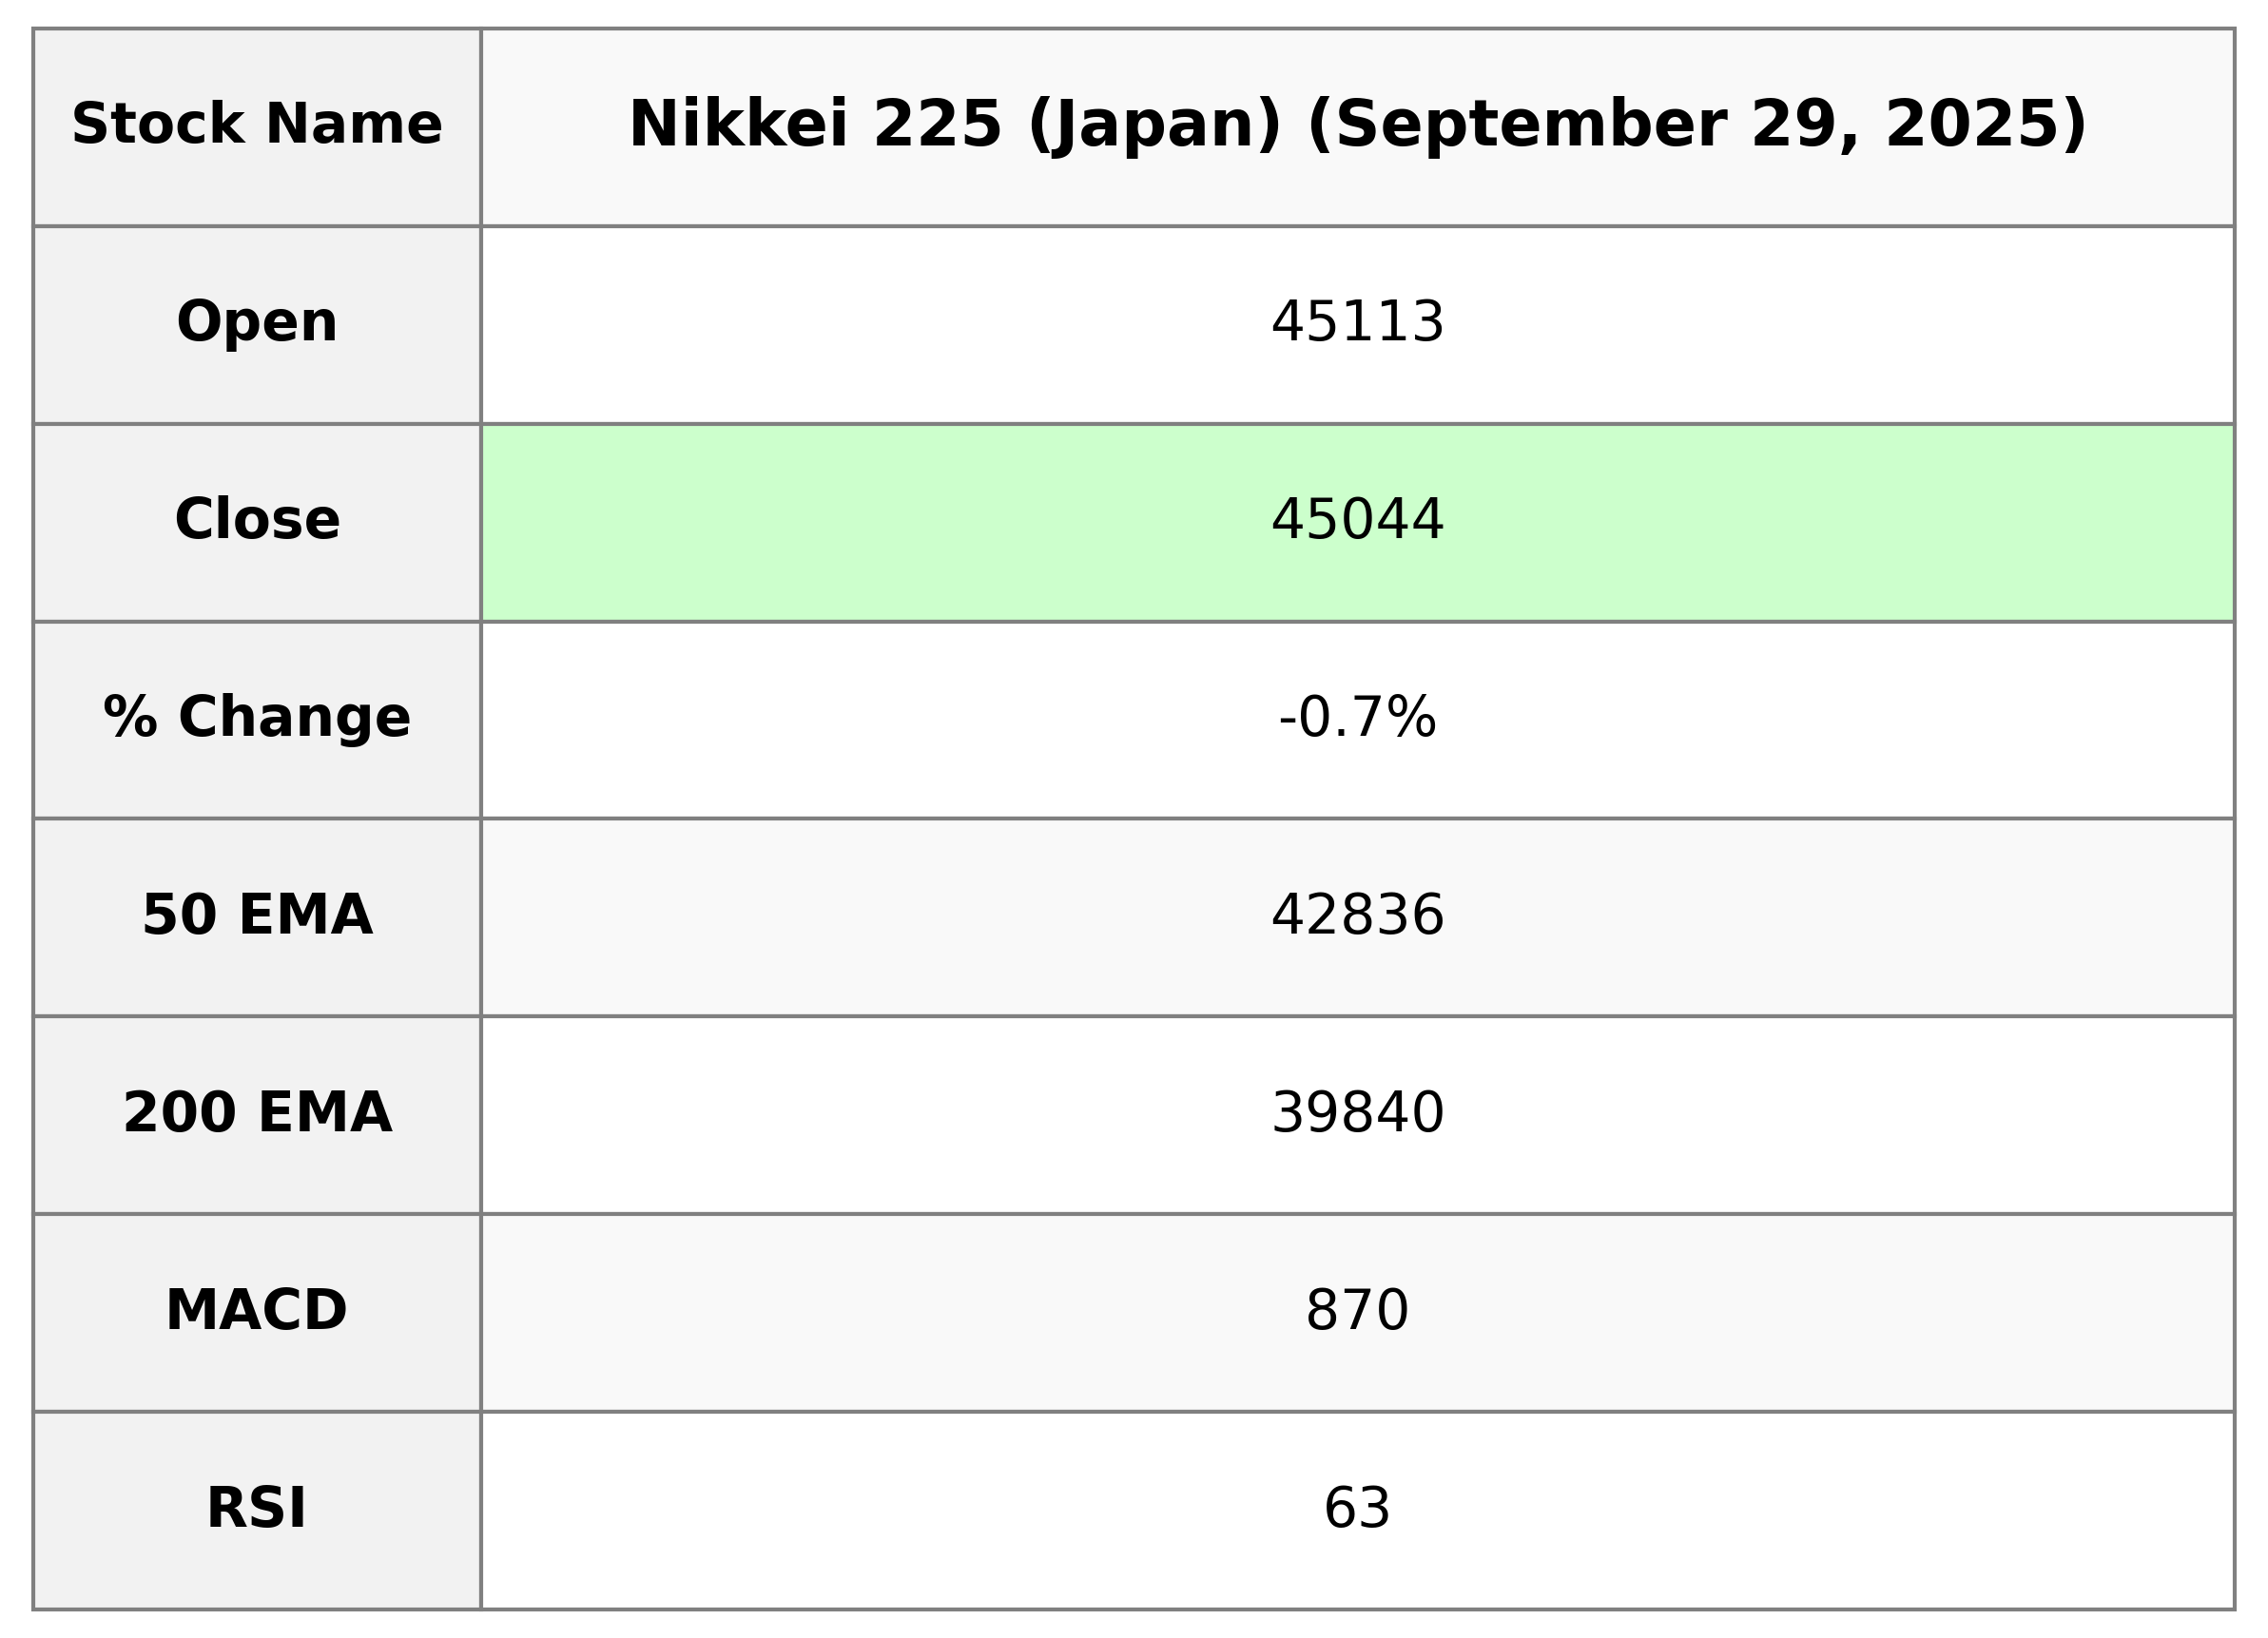
Nikkei 225 (Japan) opened at 45113.29, reached a high of 45152.70, and closed at 45043.75, reflecting a slight decline of 0.69% from the previous close of 45354.99. The 10-day EMA stands close to the current close, while the RSI of 62.55 indicates a relatively strong trend. Additionally, the MACD suggests a positive momentum with a value exceeding its signal line.
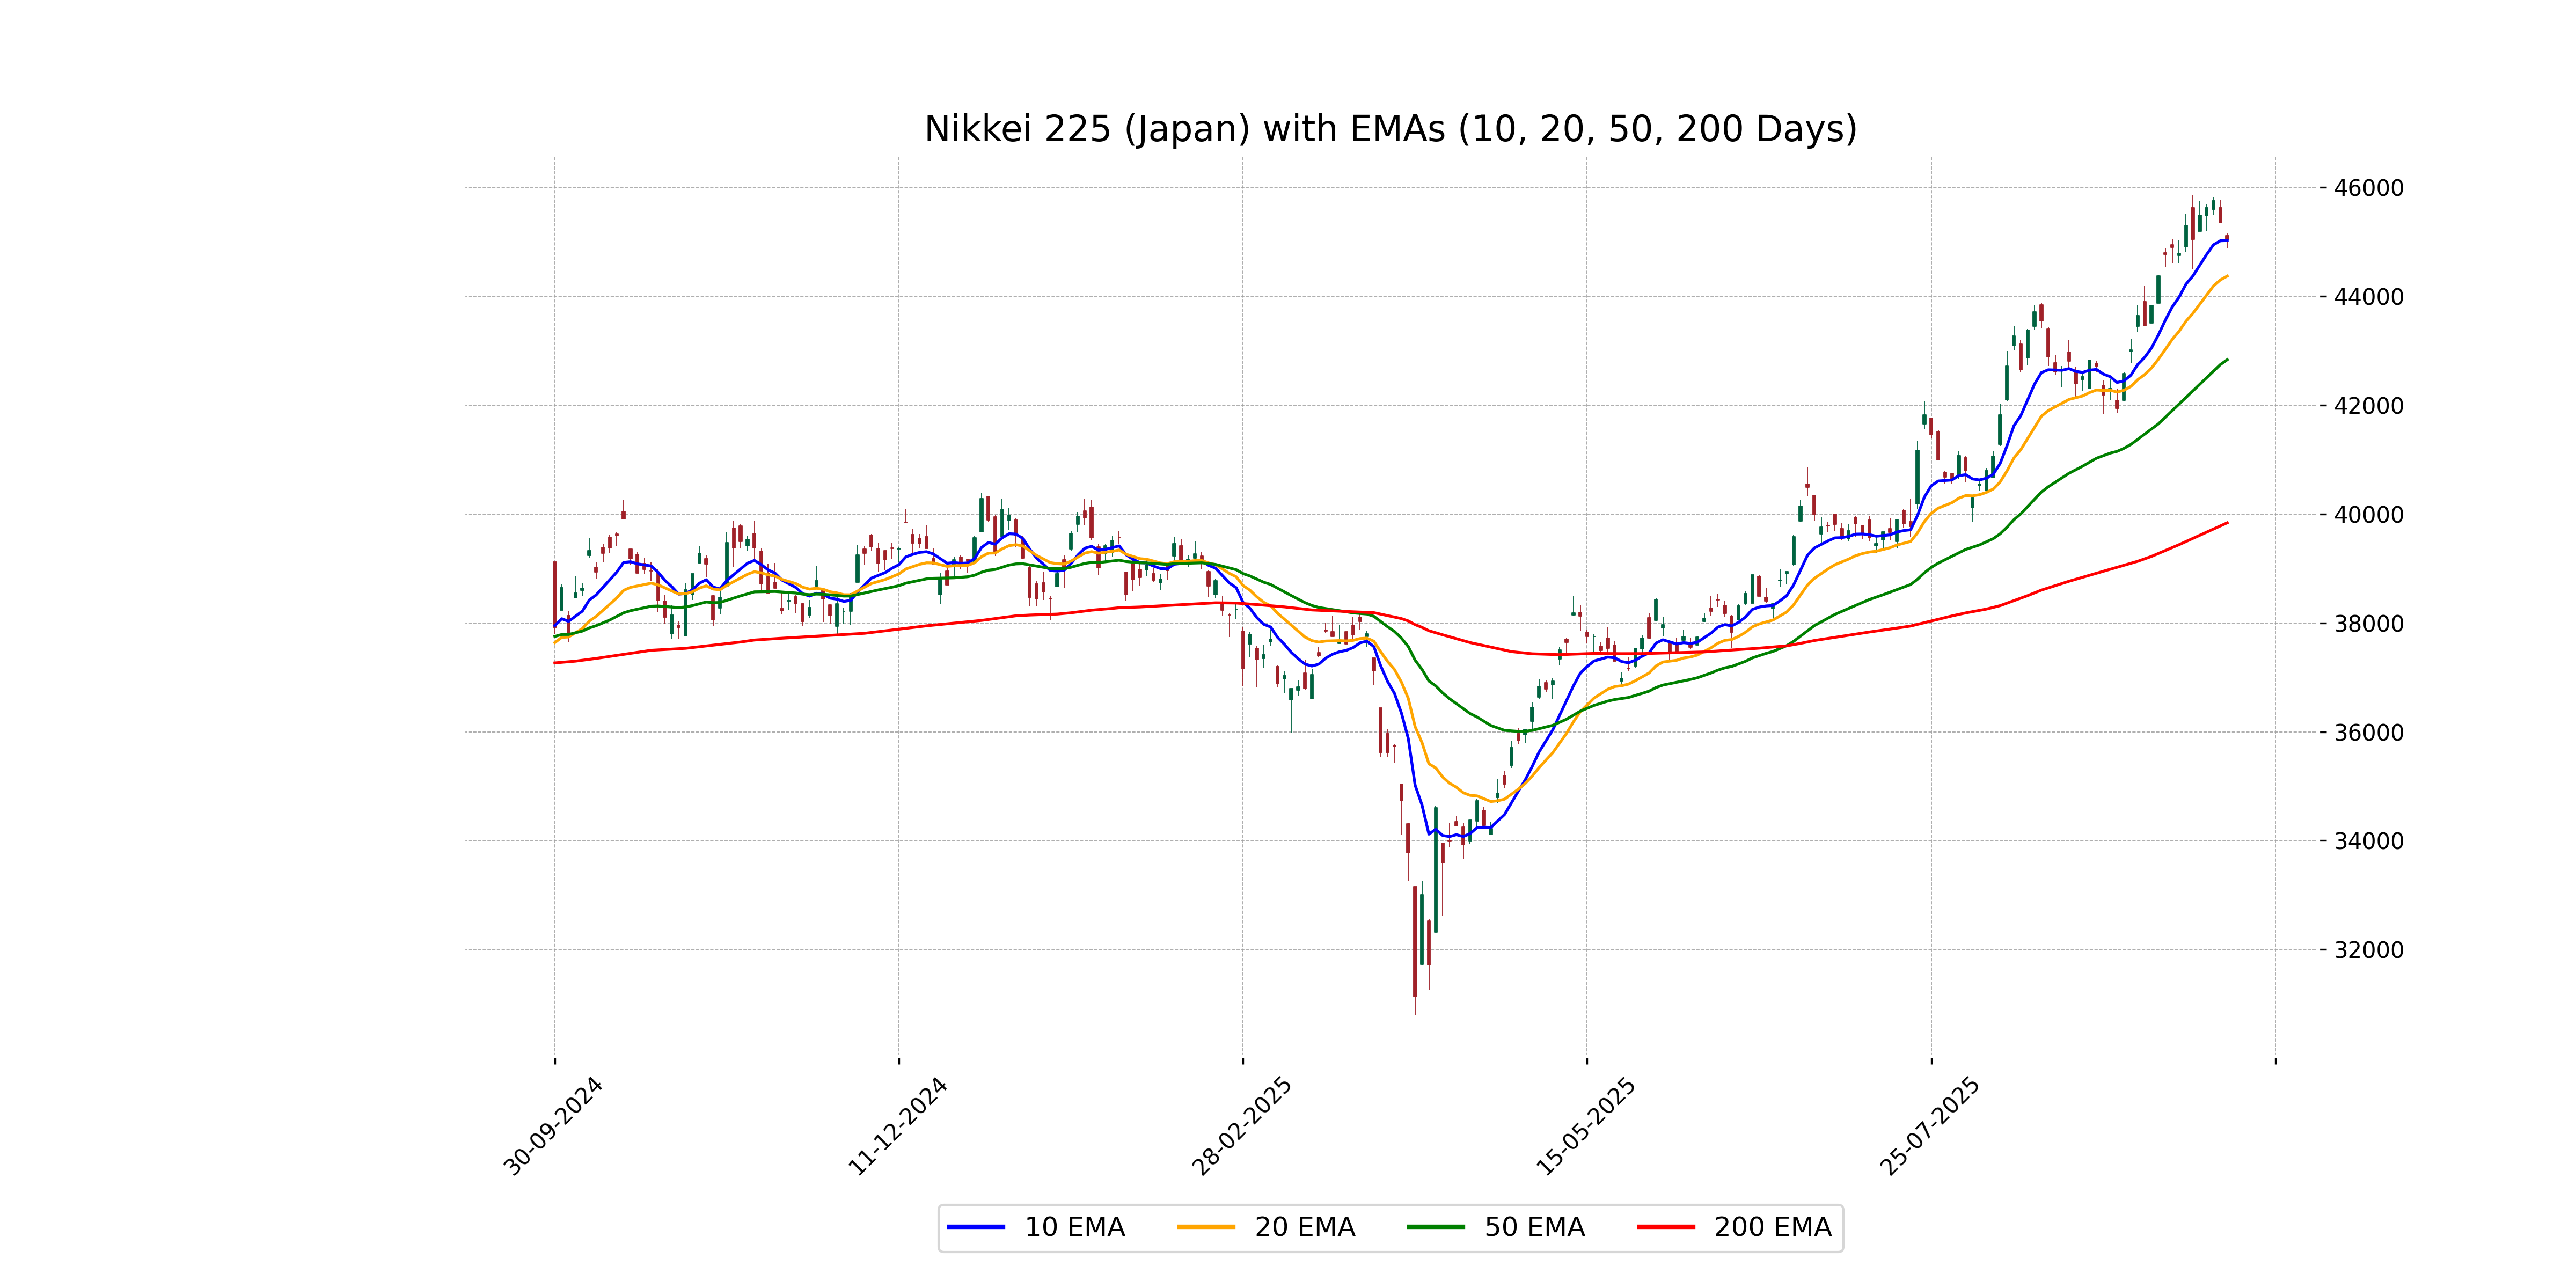
Relationship with Key Moving Averages
The Nikkei 225 closed at 45043.75, which is above the 50 EMA of 42836.37 and the 200 EMA of 39839.76, suggesting a bullish trend over both the medium and long term. However, it remains closely aligned with the 10 EMA of 45025.95, indicating a short-term consolidation.
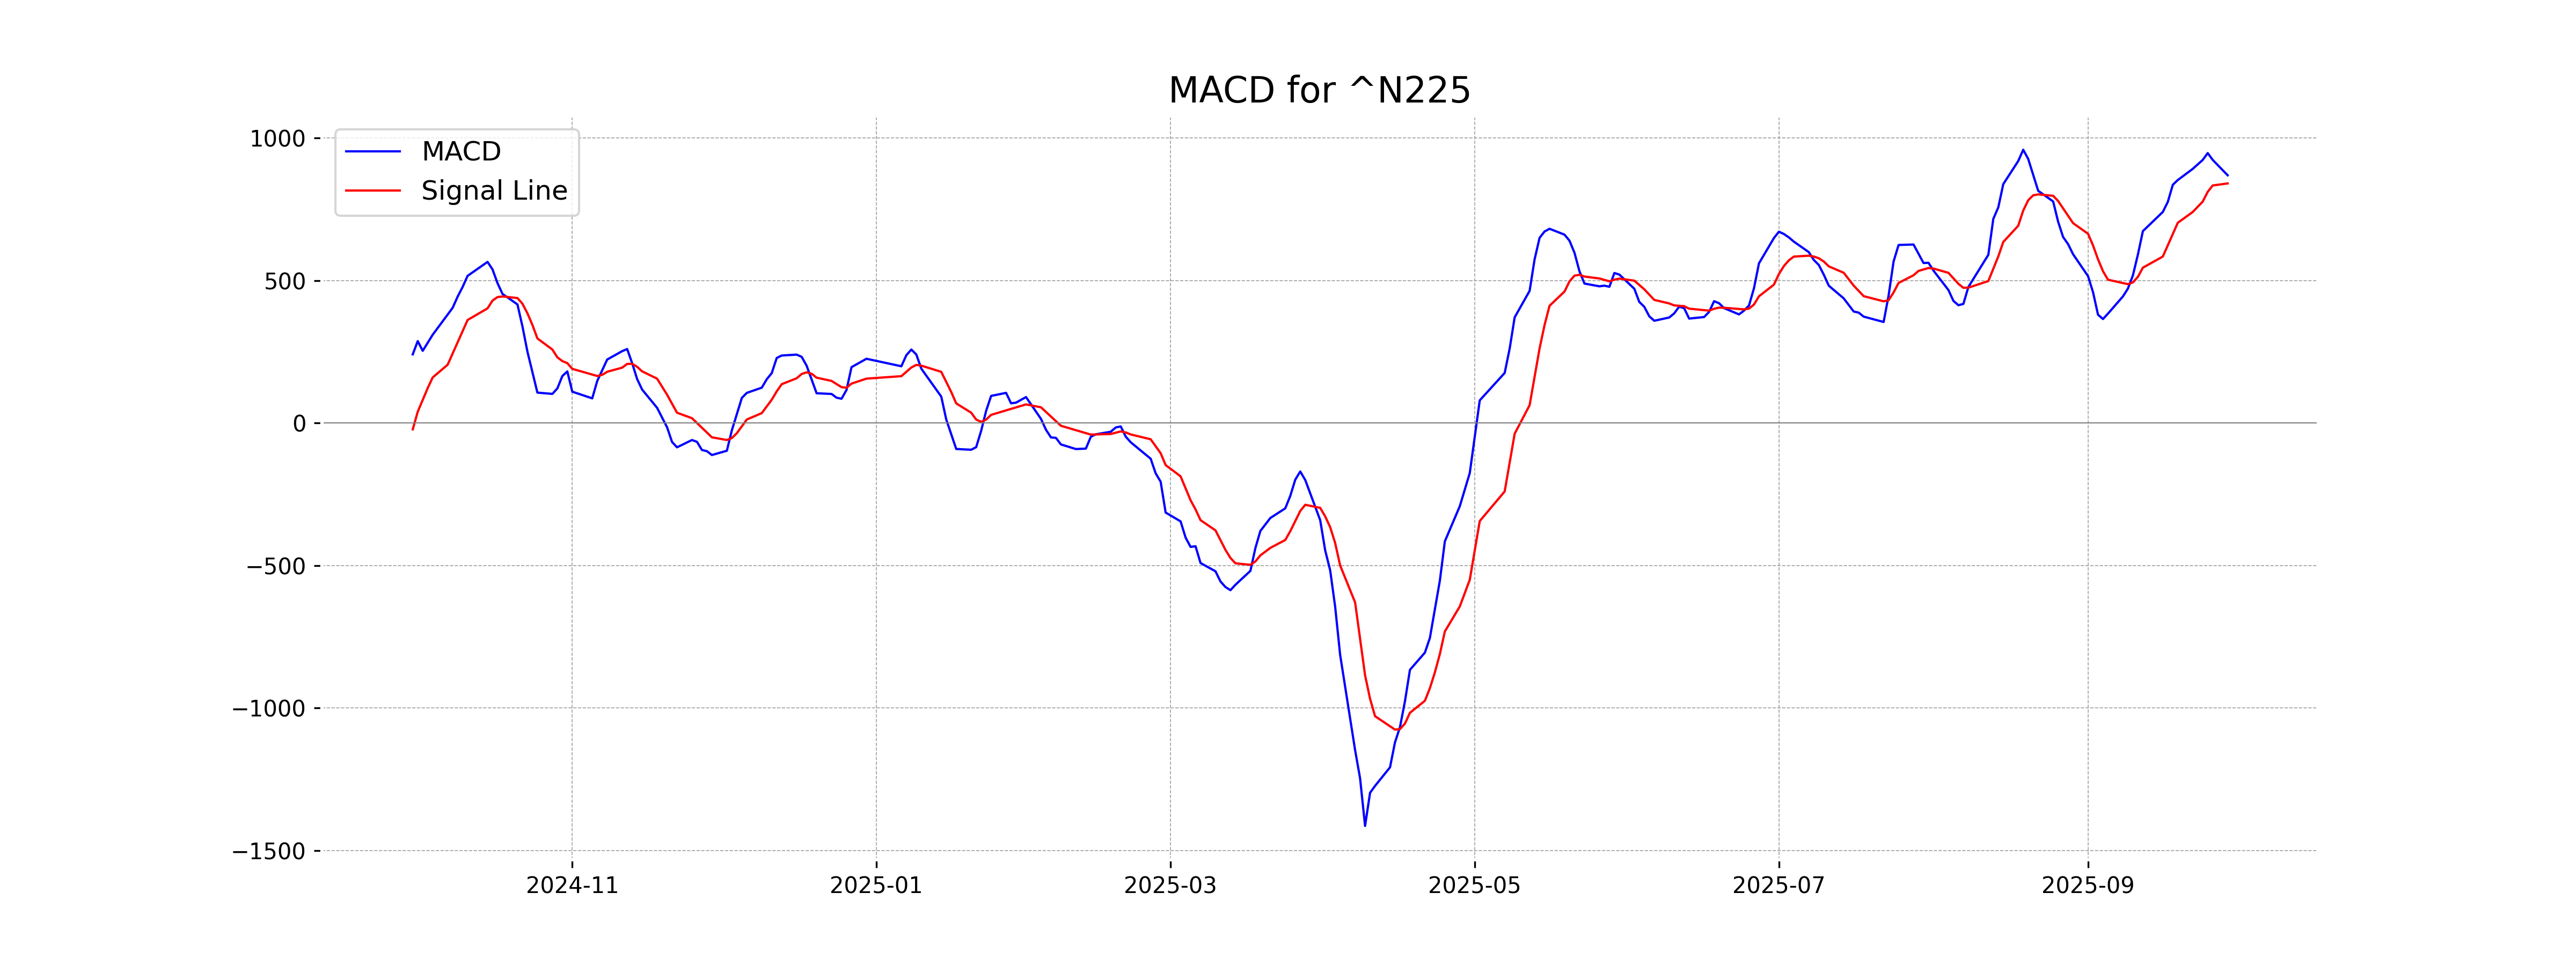
Moving Averages Trend (MACD)
MACD Analysis for Nikkei 225 (Japan): The MACD value of 869.52 is above the MACD Signal value of 840.93, indicating a potential bullish trend. Since the MACD line is higher than the Signal line, it suggests positive momentum might continue if the trend holds.
RSI Analysis
The Relative Strength Index (RSI) for Nikkei 225 is 62.55, indicating a relatively strong momentum but not yet overbought, as it remains below the 70 threshold. This suggests that the index might continue its upward trend unless other indicators suggest otherwise.
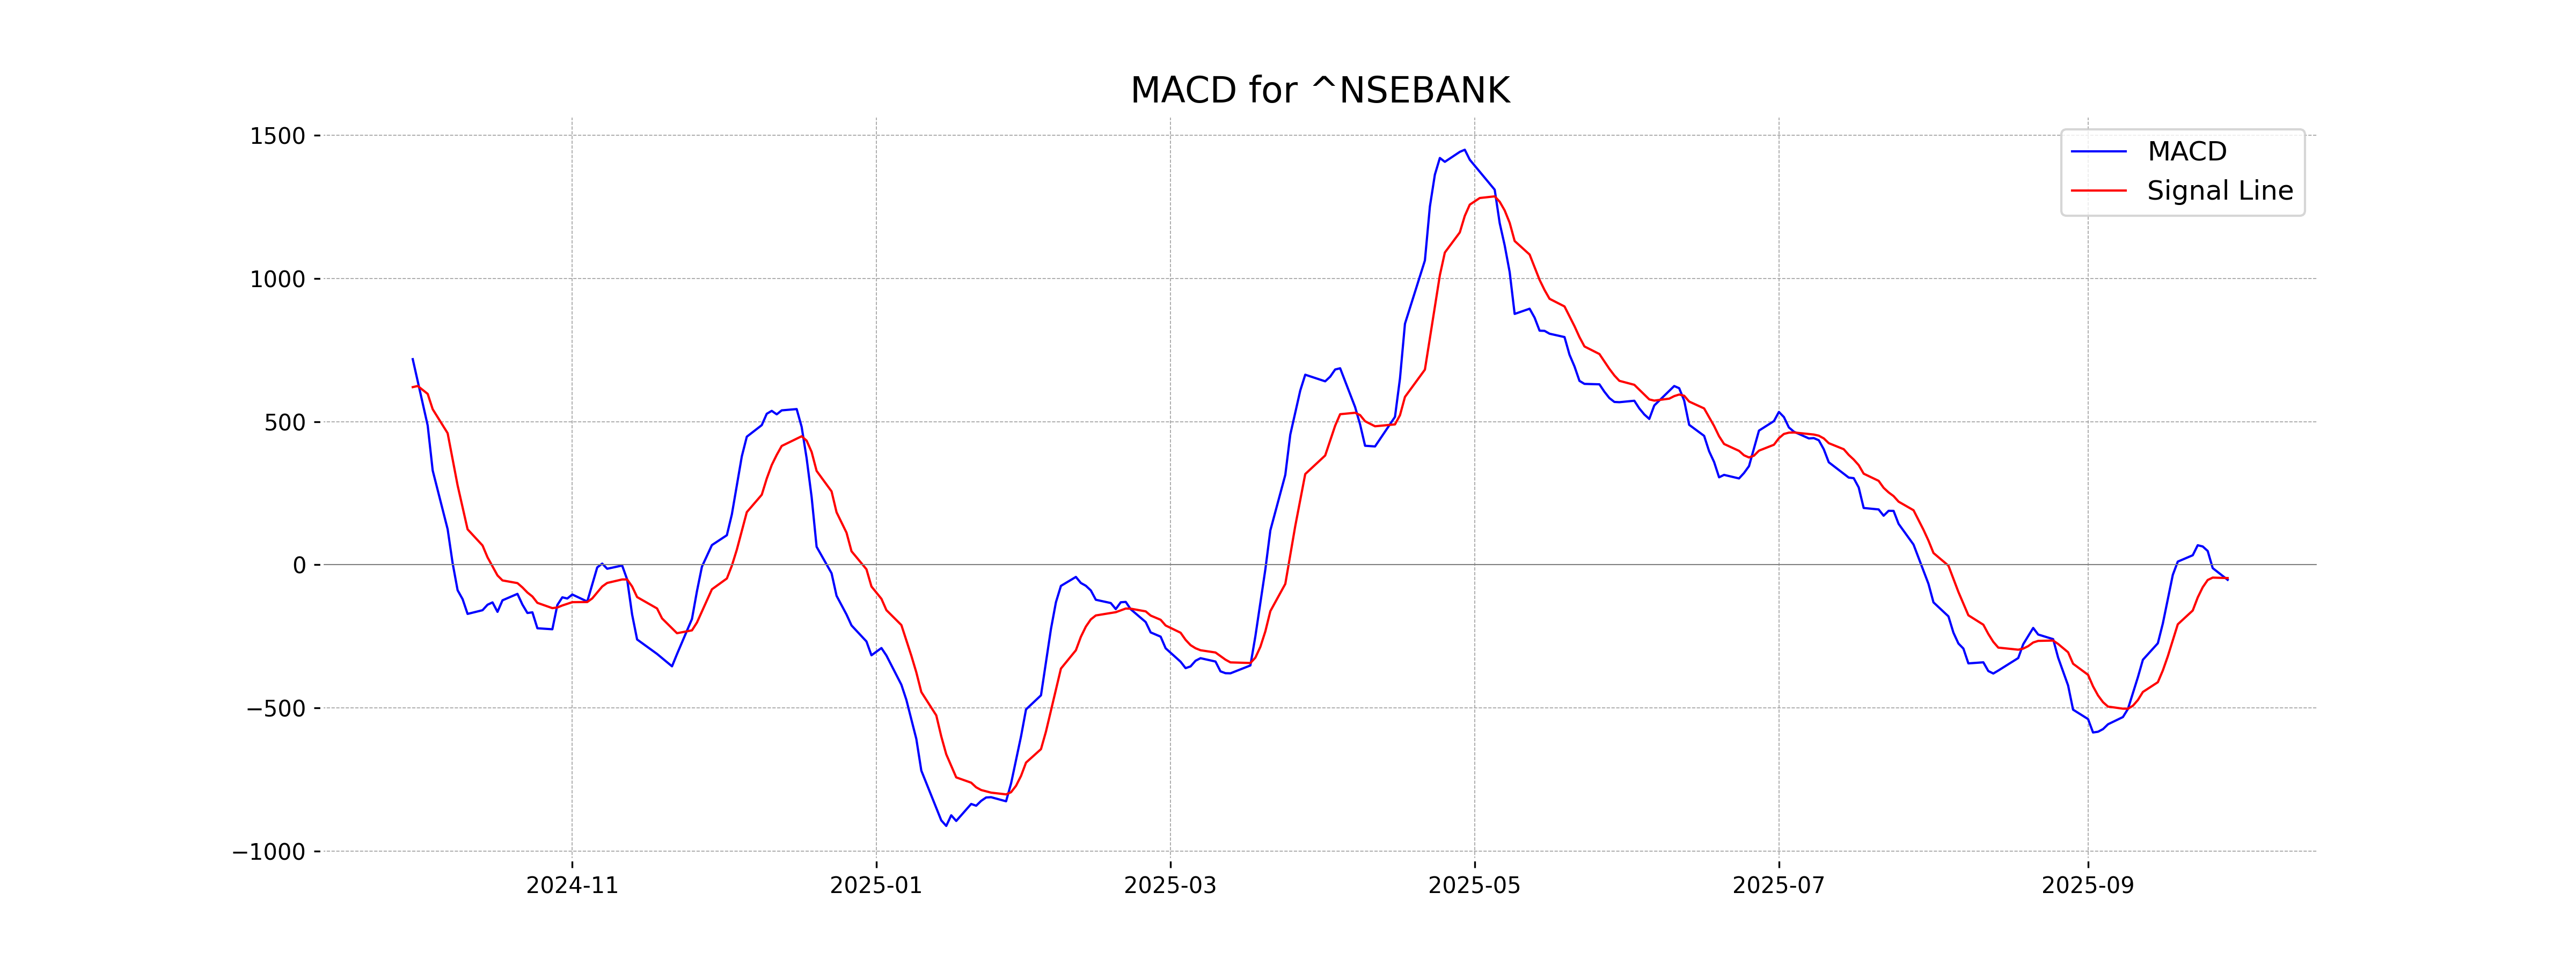
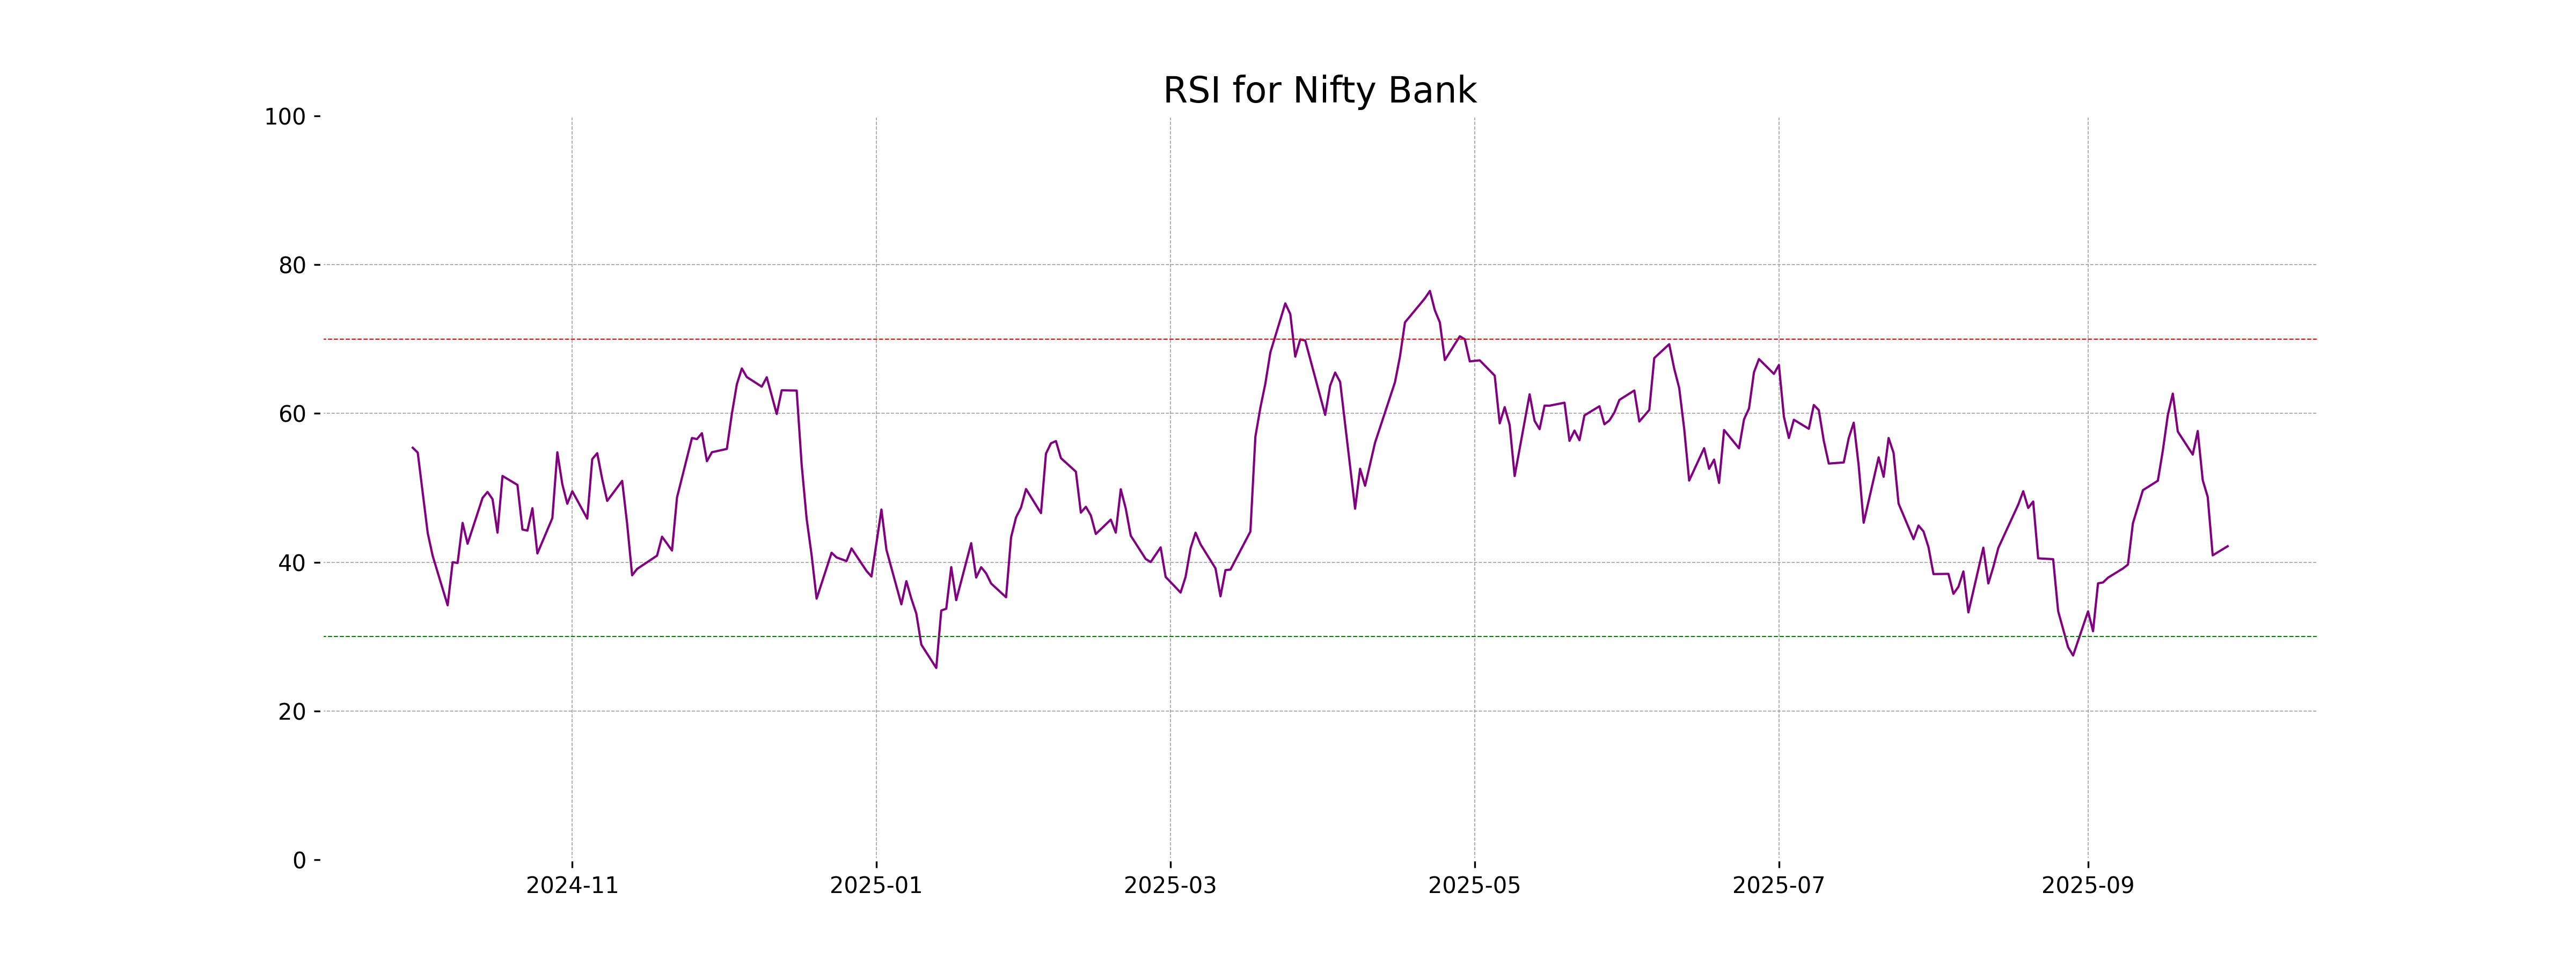
Analysis for Nifty Bank - September 29, 2025
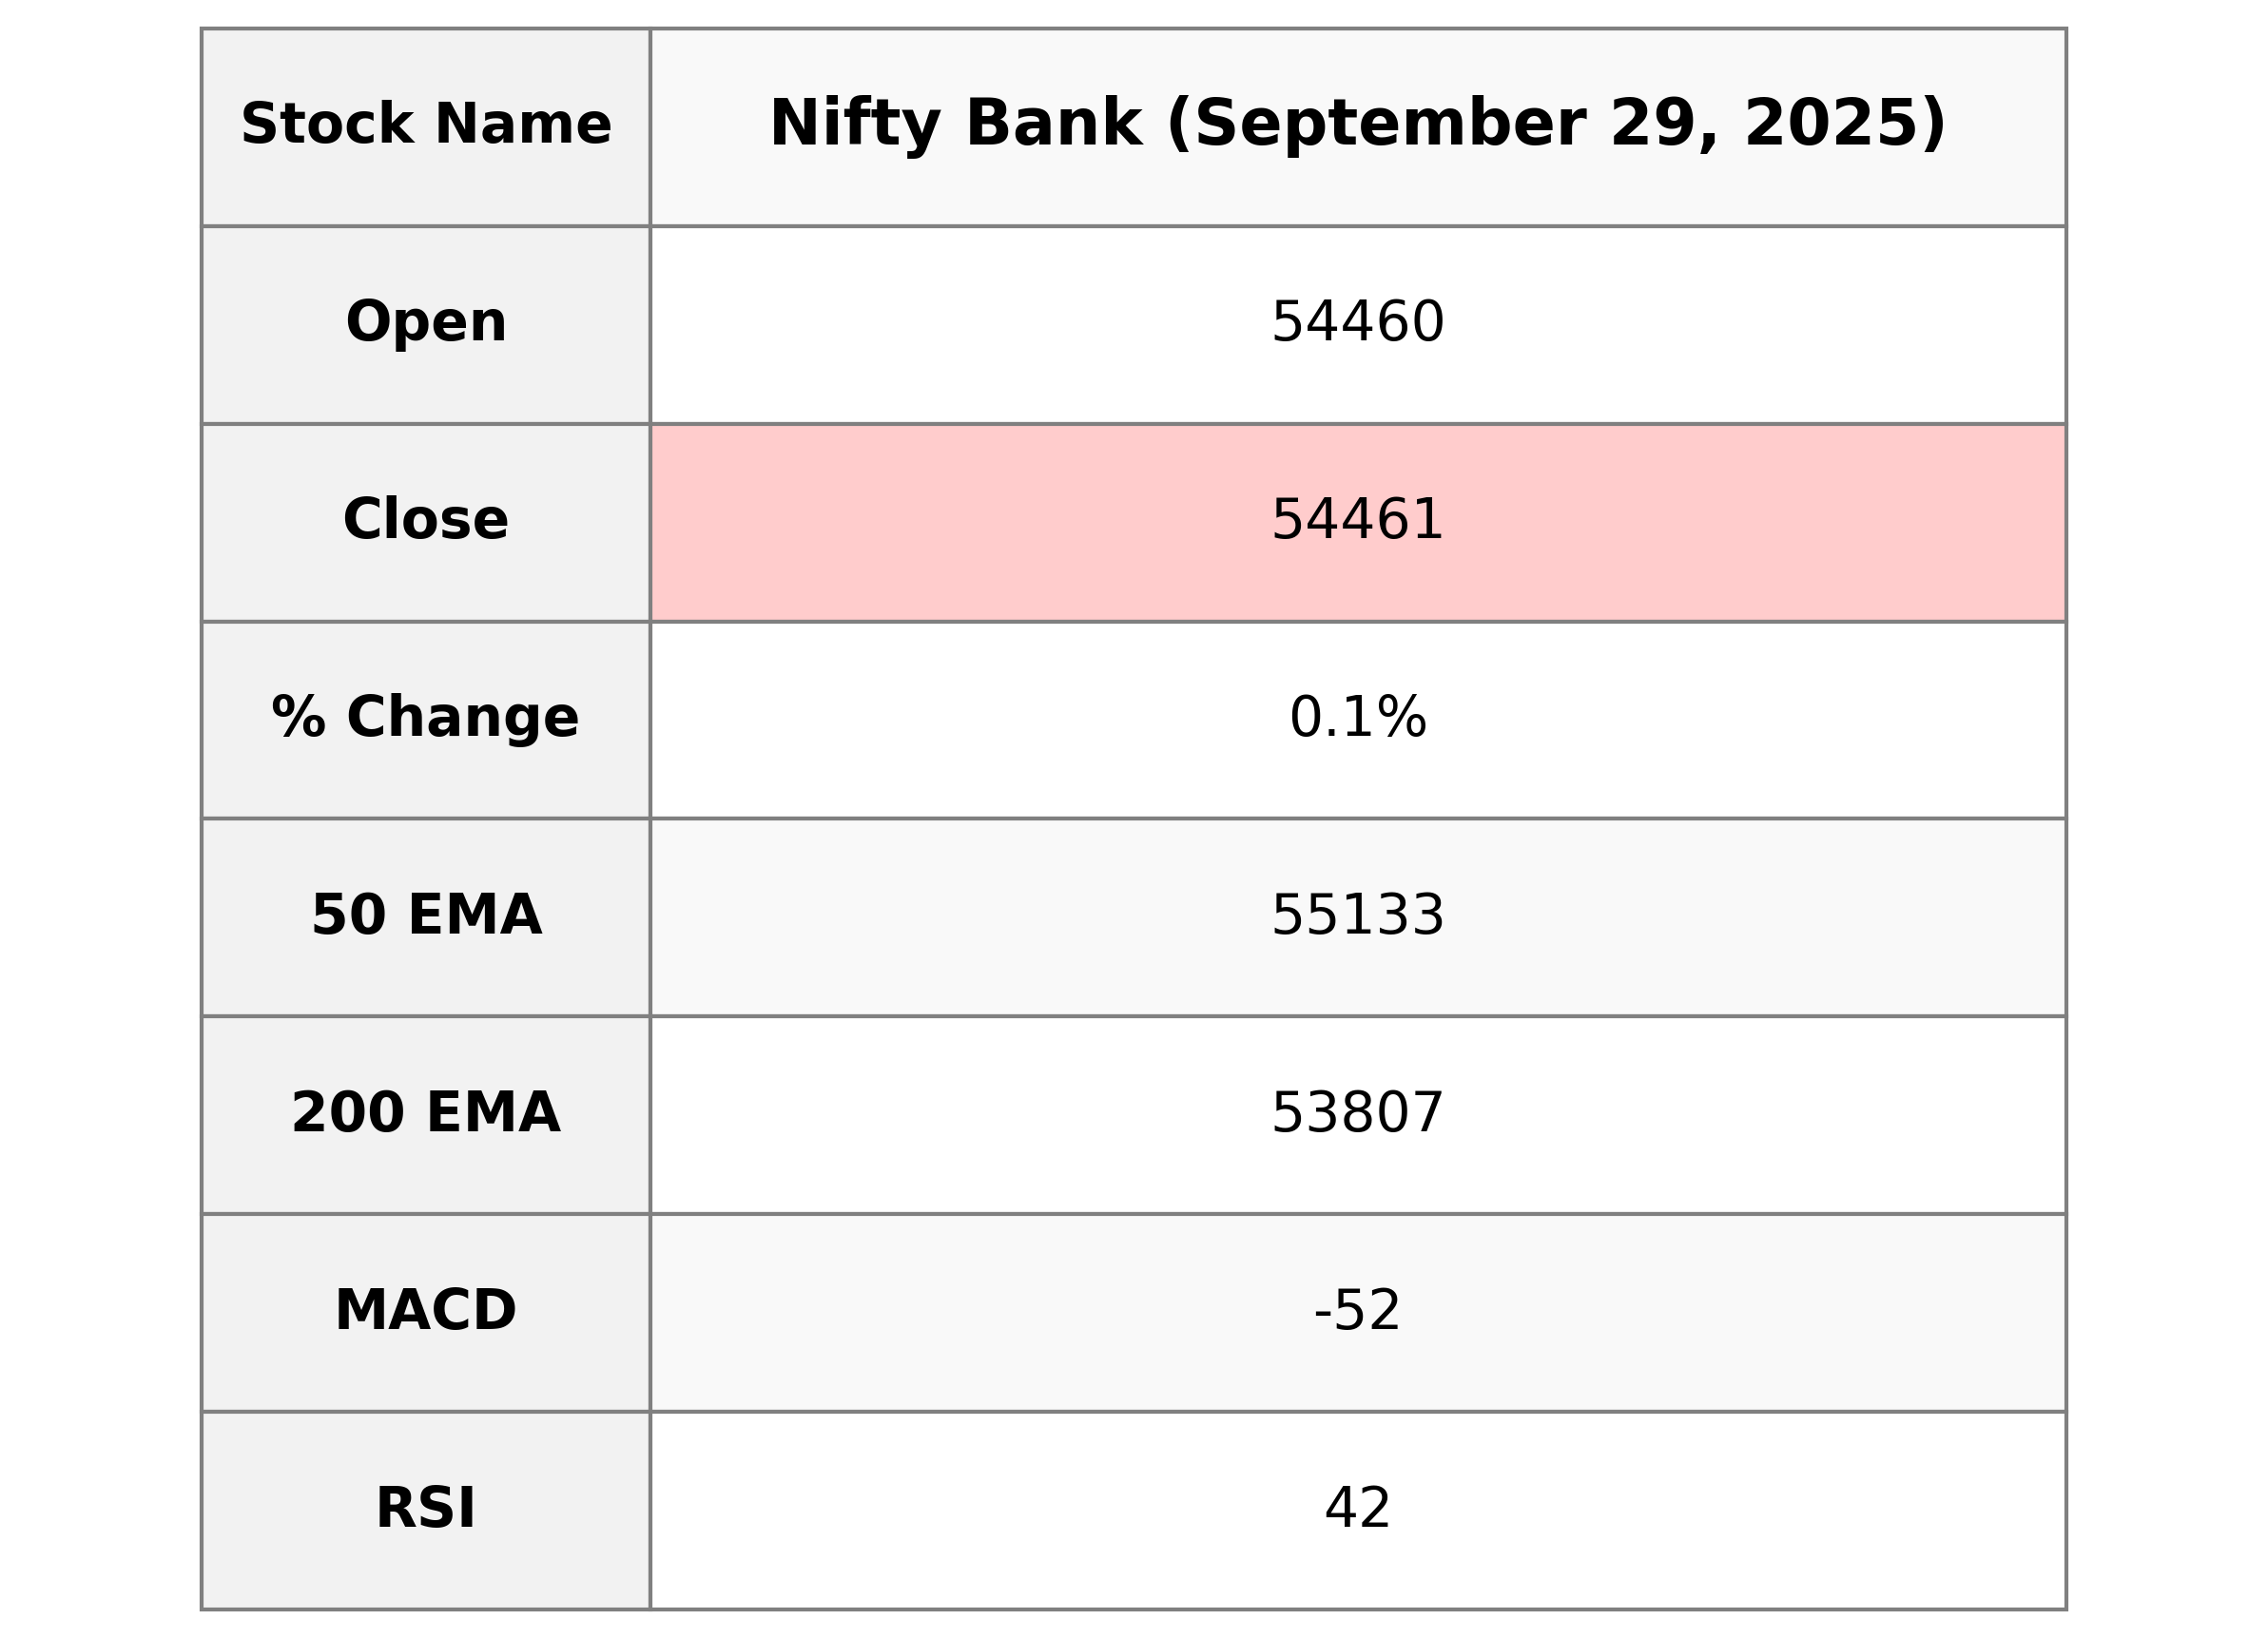
Nifty Bank opened at 54460.40 and closed slightly higher at 54461.0, resulting in a percentage change of 0.13% and a points change of 71.65. The RSI of 42.15 suggests that the index is nearing oversold conditions. The MACD is below its signal line, indicating potential bearish momentum.
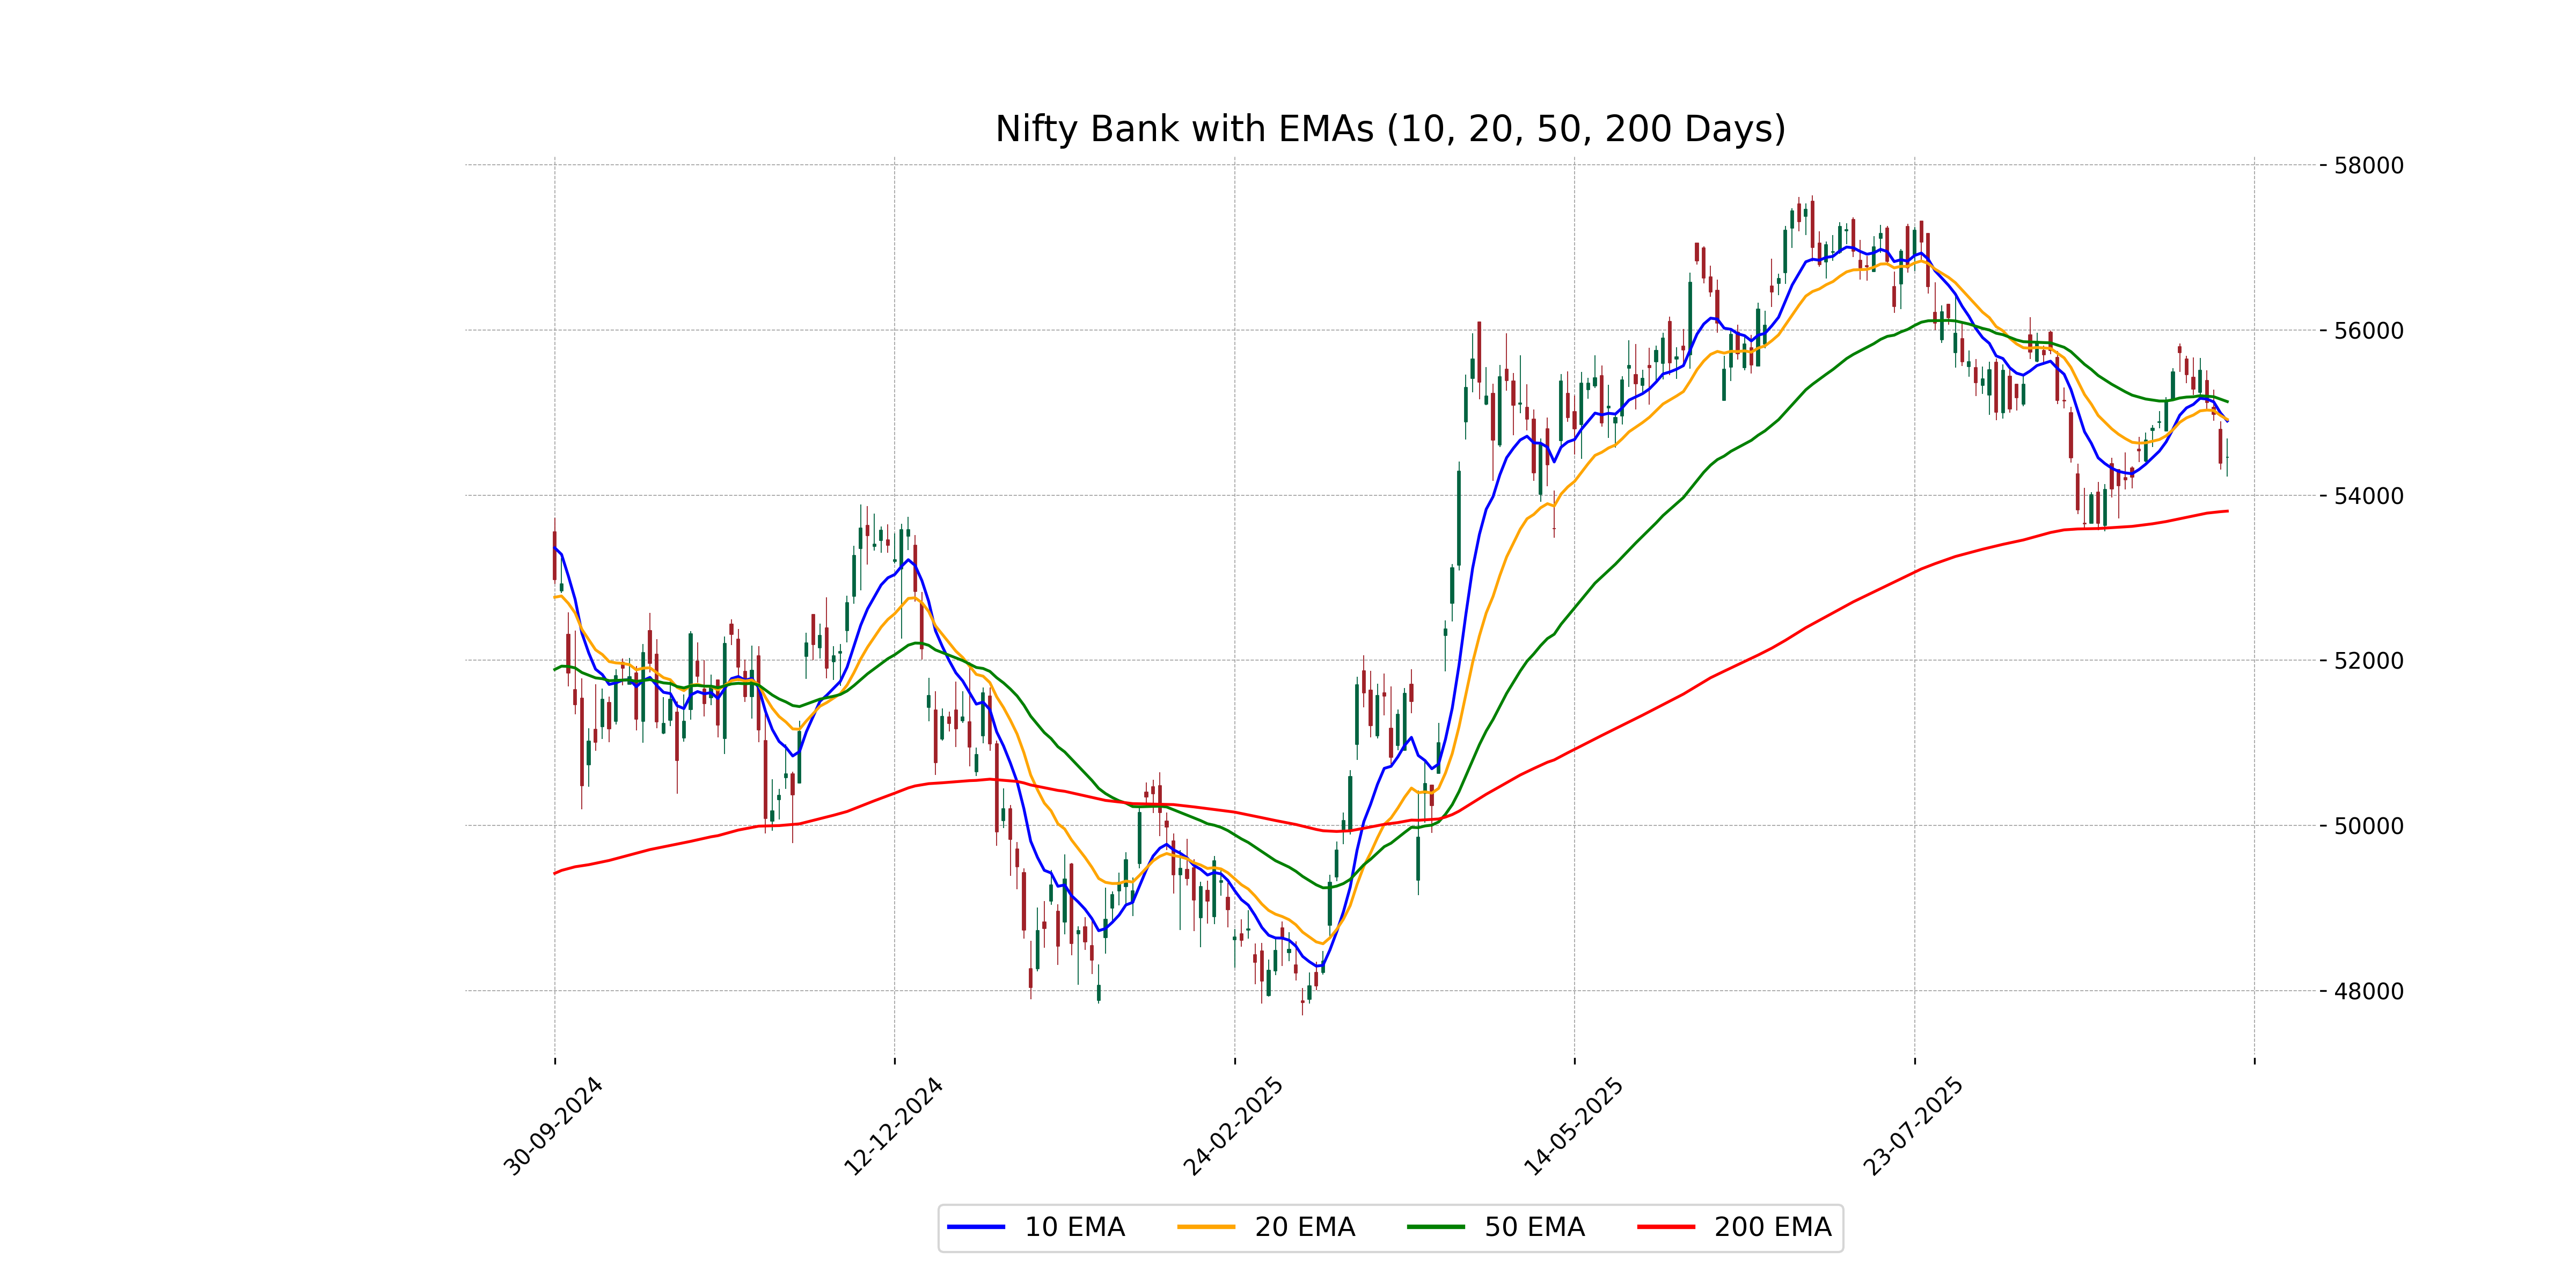
Relationship with Key Moving Averages
The Nifty Bank closed slightly above its previous close, with a % change of 0.13%. Its current closing price of 54,461 is below the 50-day EMA of 55,133 and the 10-day EMA of 54,898, suggesting short-term bearish momentum. However, it is above the 200-day EMA of 53,806, indicating a longer-term bullish trend. The RSI of 42.15 falls within the neutral range, leaning towards being oversold.
Moving Averages Trend (MACD)
The Nifty Bank exhibited a MACD of -52.31, which is below the MACD Signal of -46.18, indicating a bearish momentum. This suggests that the current trend might continue to be downward unless a shift occurs. Investors may want to monitor for potential bullish or reversal signals before considering entry.
RSI Analysis
The RSI (Relative Strength Index) for Nifty Bank is at 42.15, which suggests that the stock is nearing oversold territory but is not quite there yet. This might indicate potential for a price reversal if the RSI continues to decline, attracting buyer interest at lower price levels.
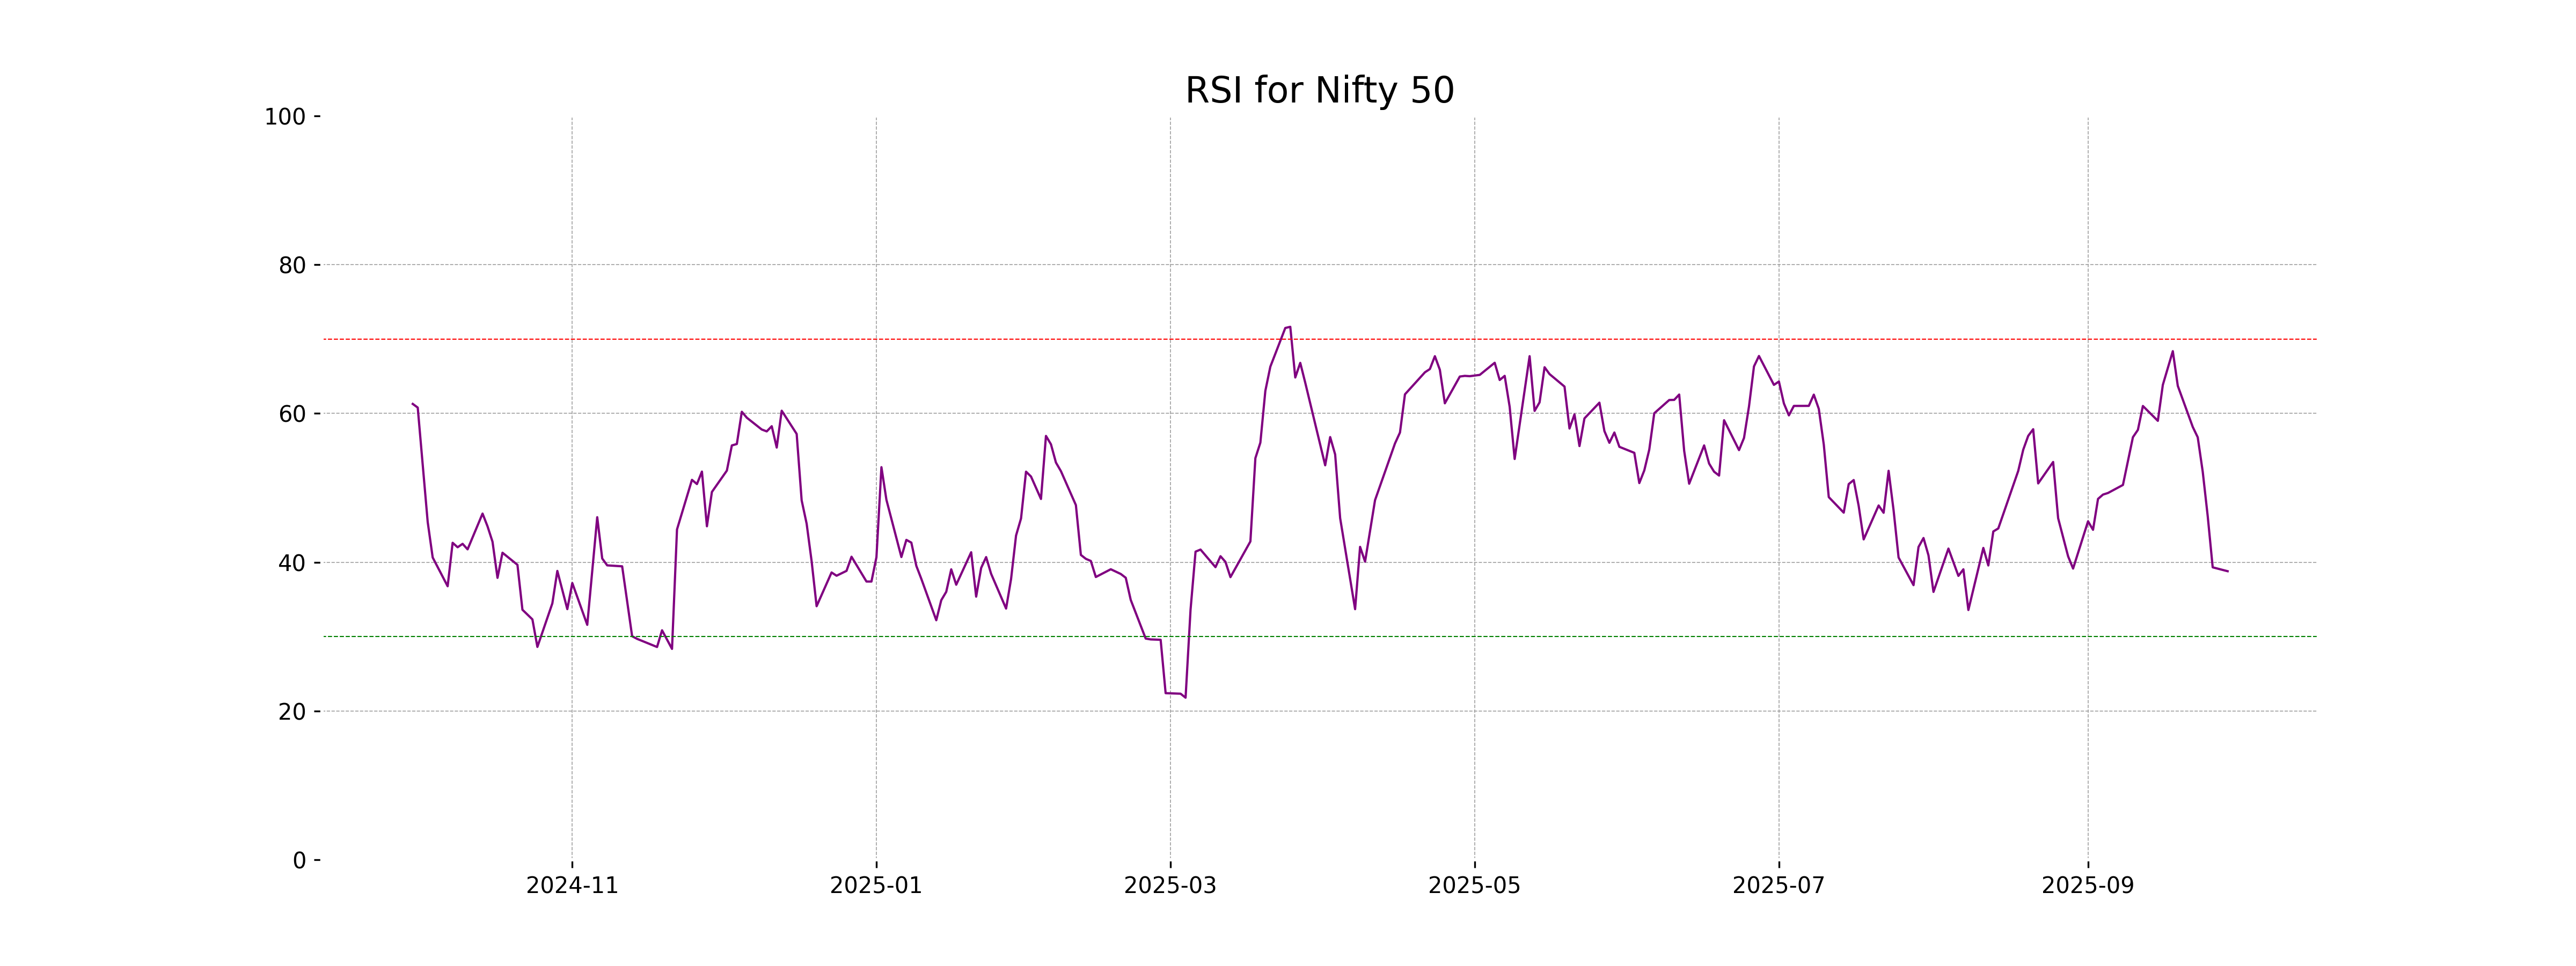
Analysis for Nifty 50 - September 29, 2025
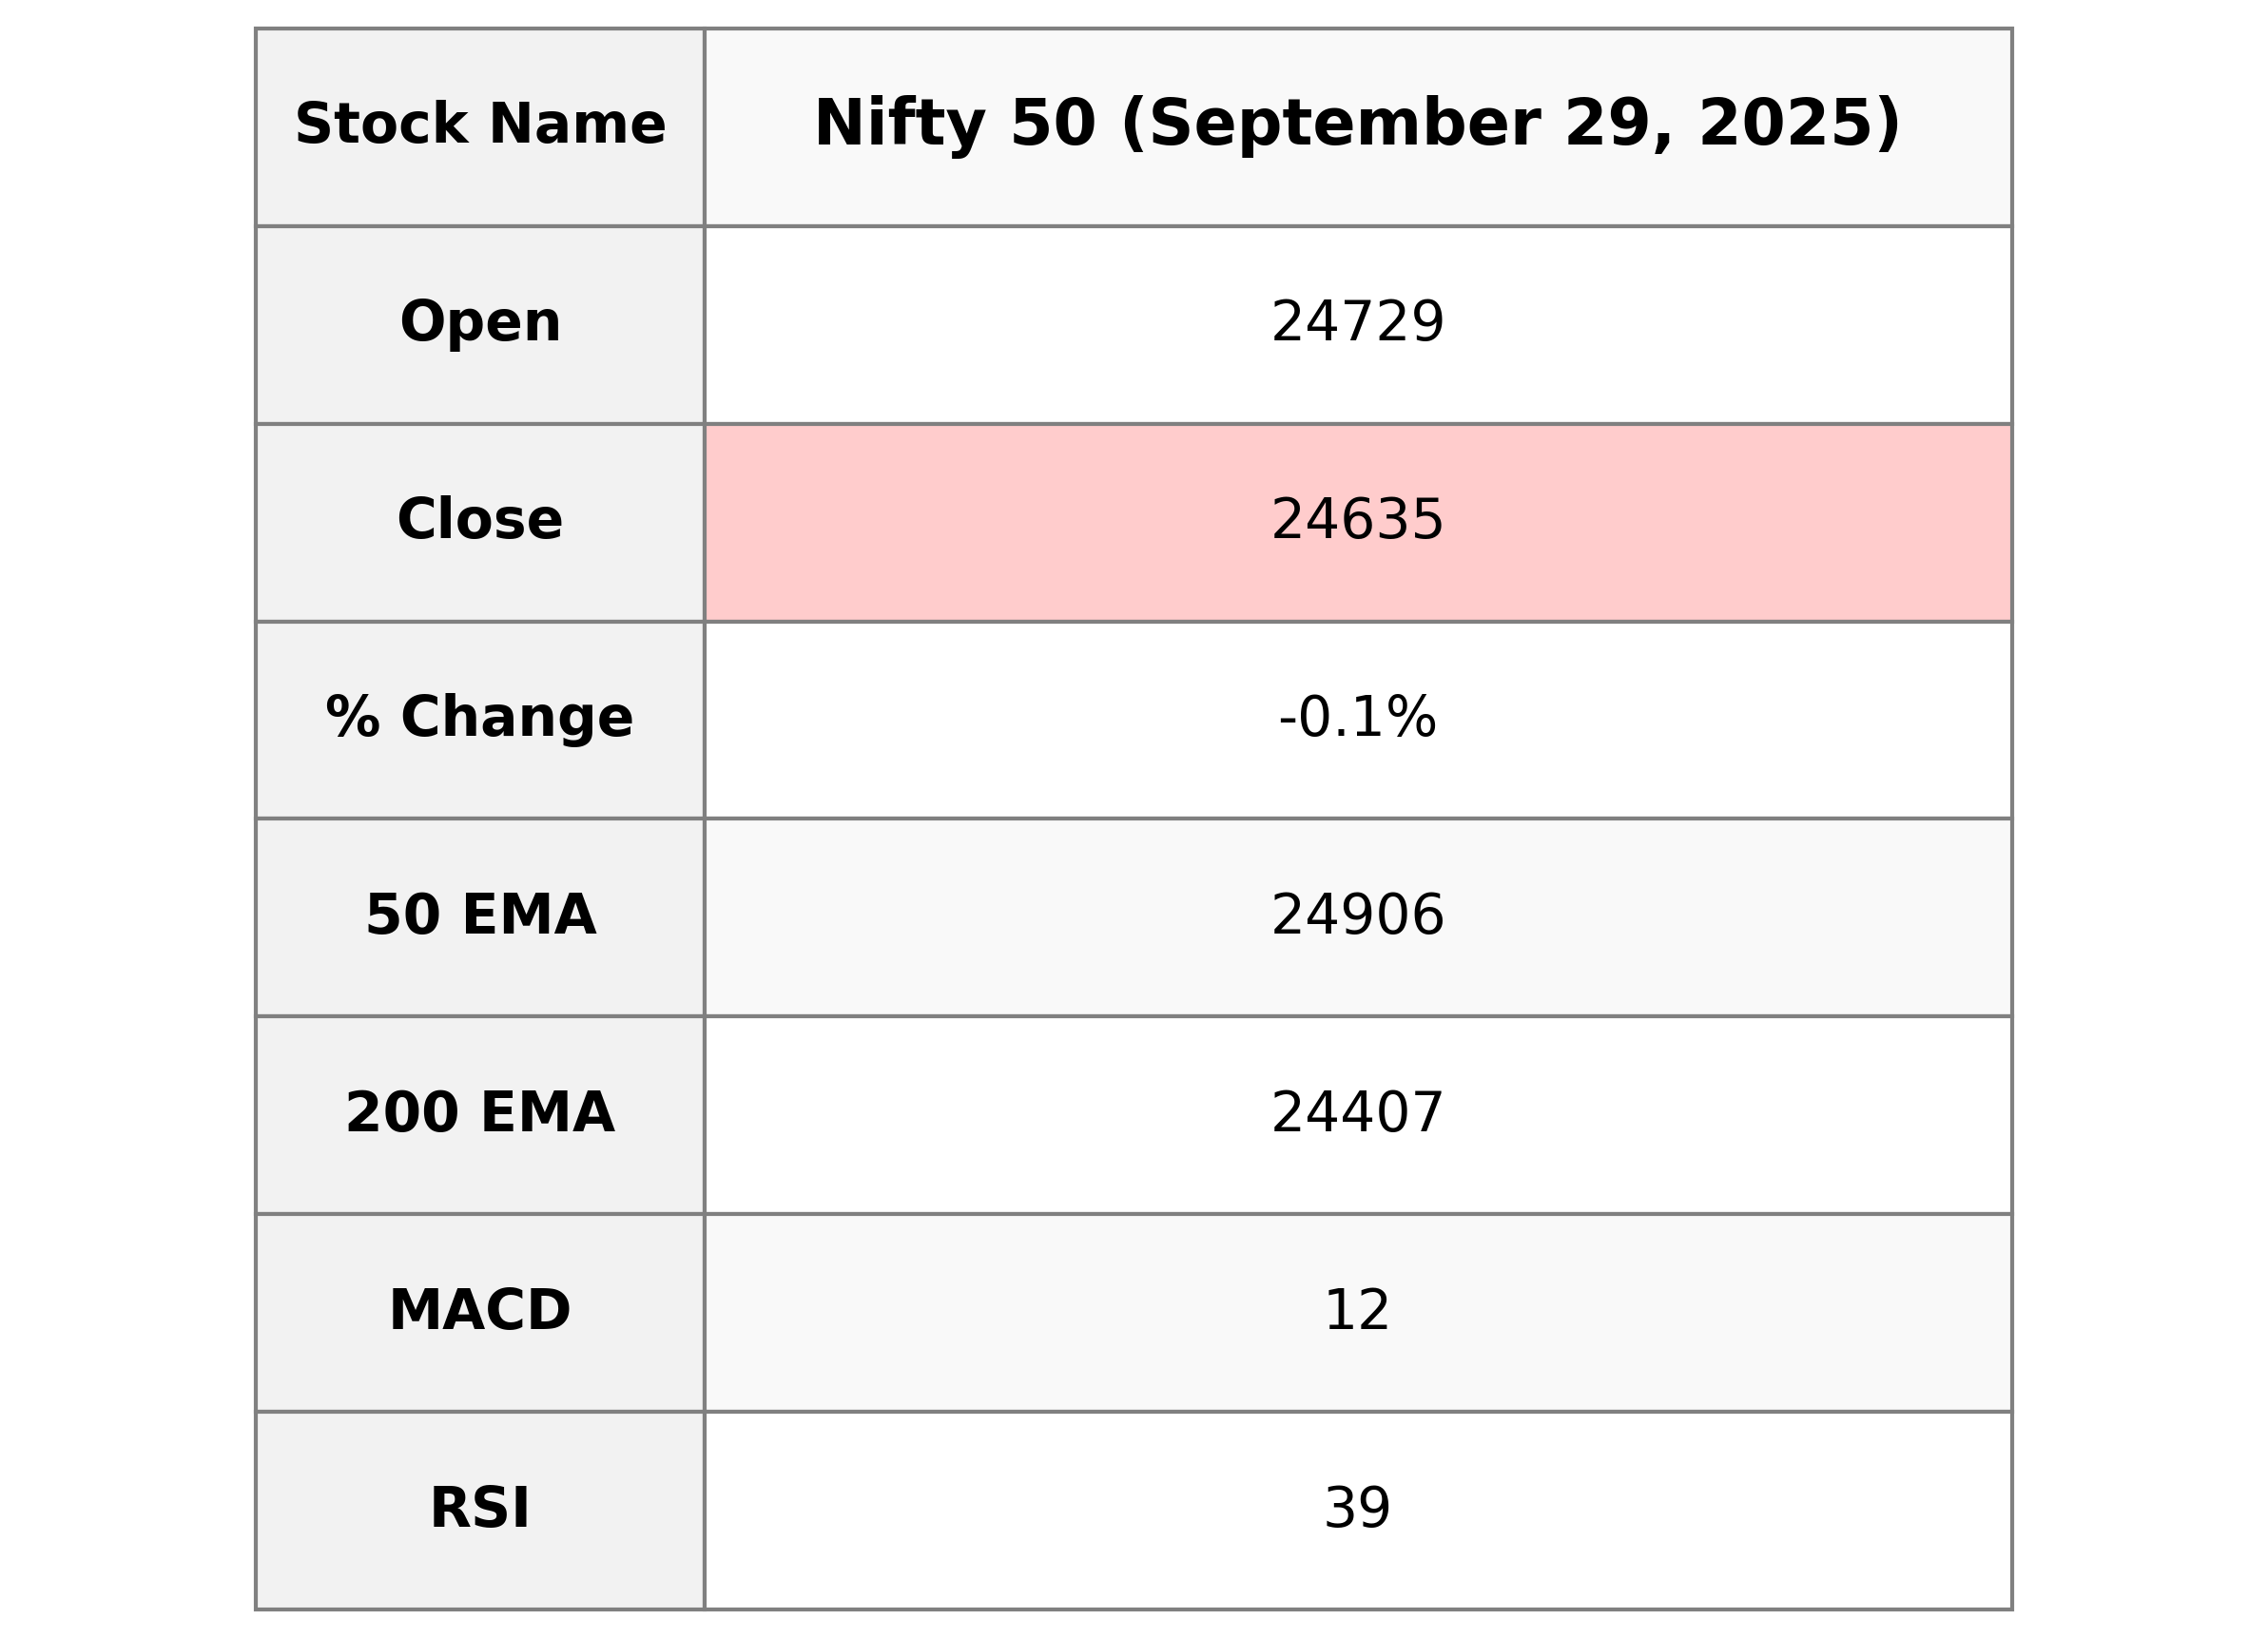
The Nifty 50 opened at 24,728.55 and closed slightly lower at 24,634.90, marking a points change of -19.80 and a percentage change of -0.08%. The index's RSI is at 38.79, indicating it might be nearing oversold territory. The MACD is below the signal line, suggesting a bearish trend.
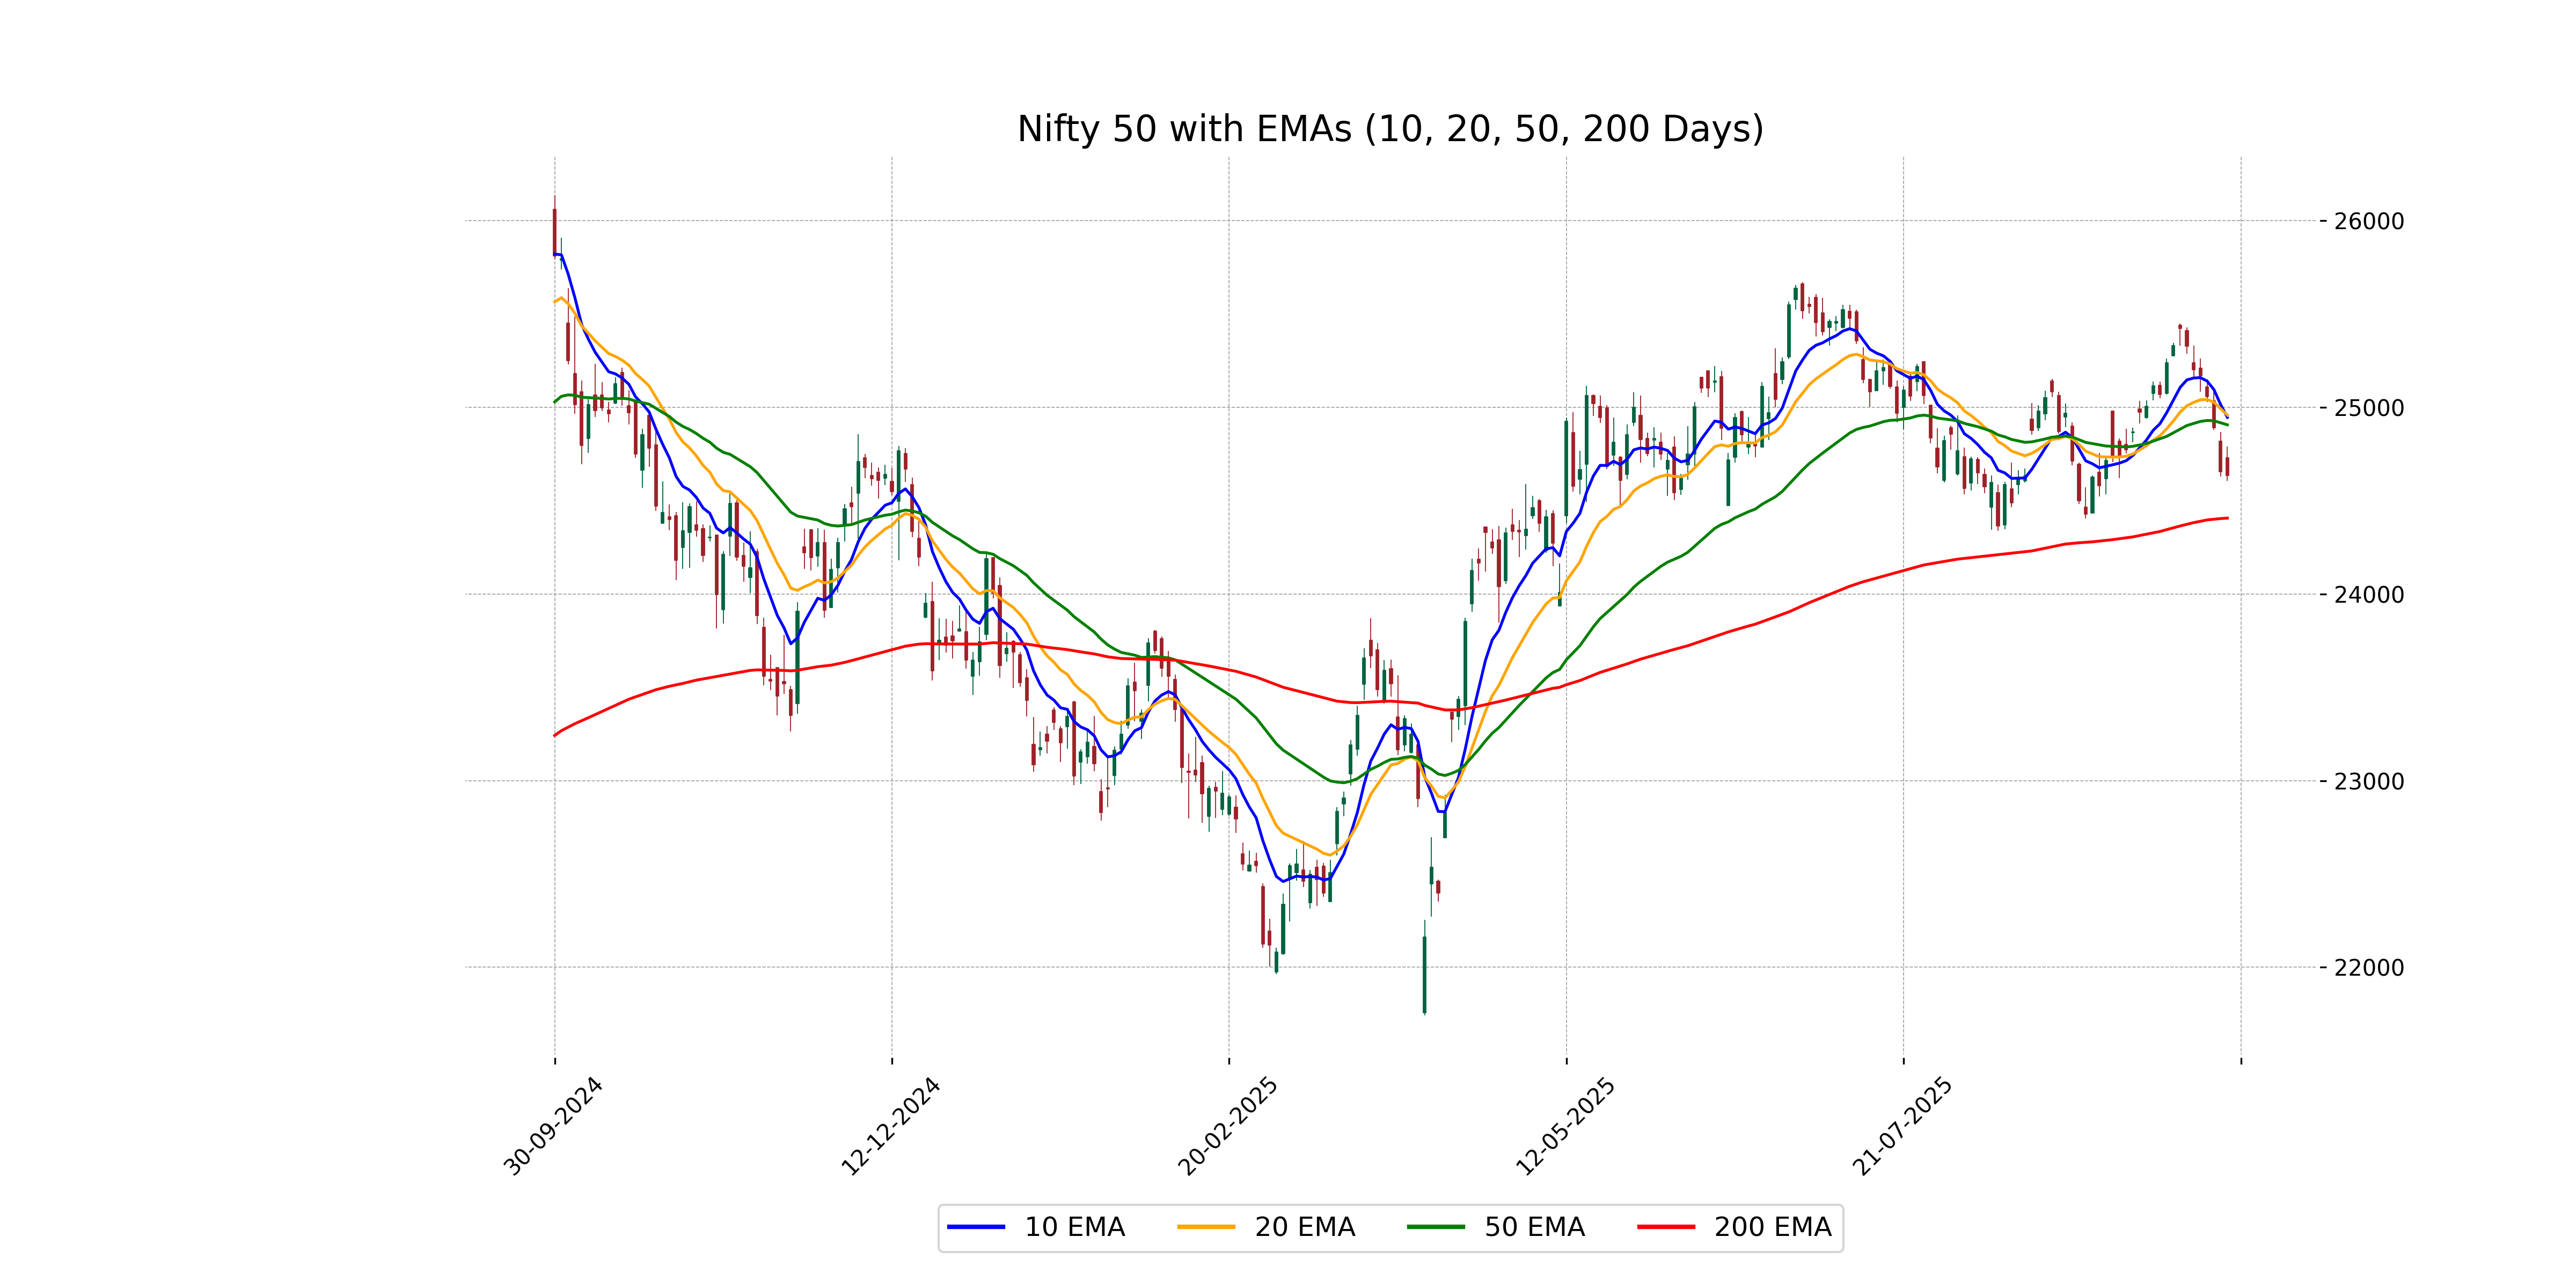
Relationship with Key Moving Averages
The Nifty 50 index is trading below its key moving averages, as indicated by the current close of 24,634.90 being below the 50 EMA of 24,906.38, 10 EMA of 24,946.06, and 20 EMA of 24,957.99, suggesting a bearish trend.
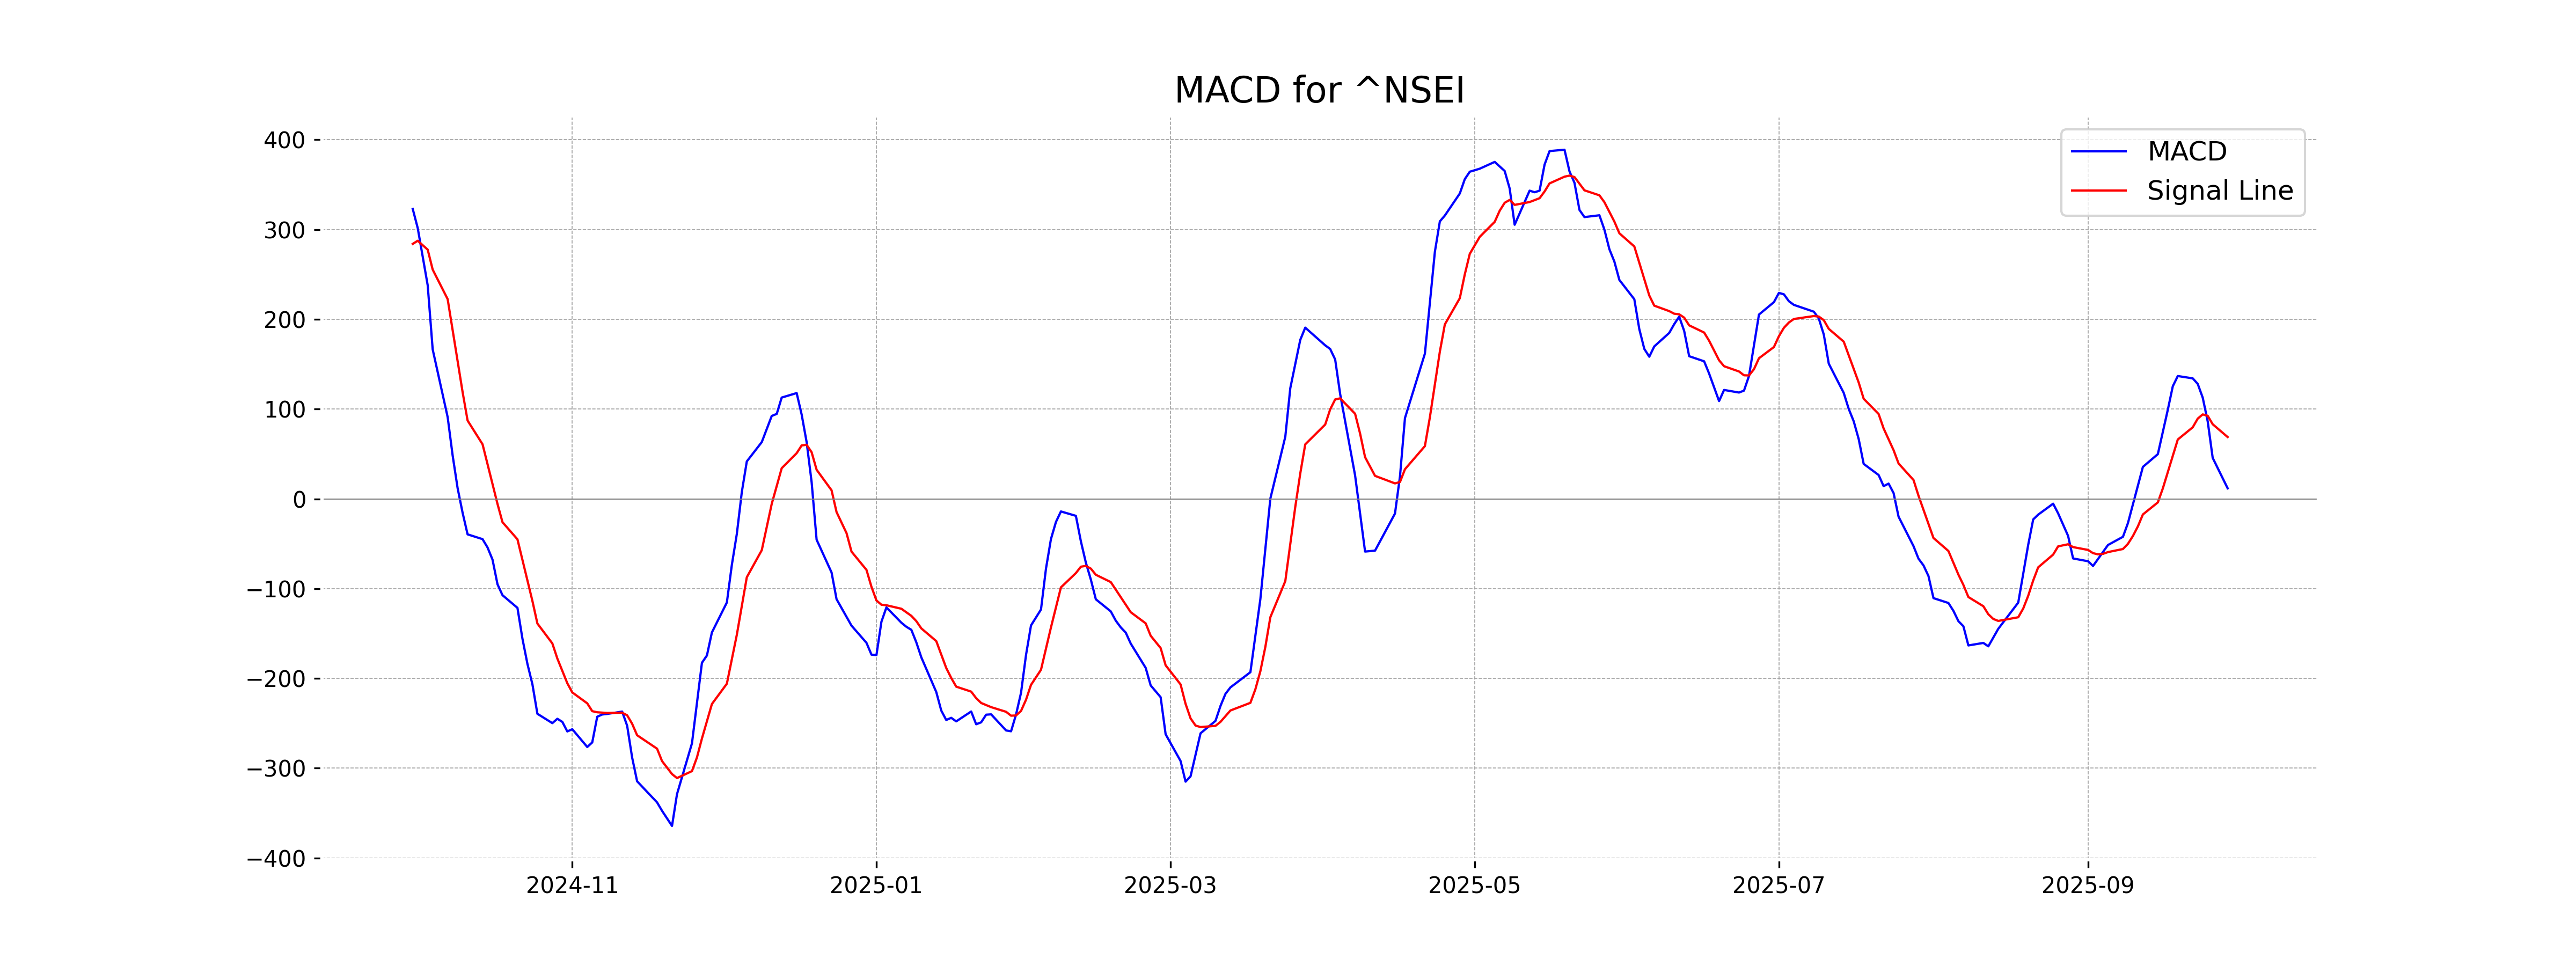
Moving Averages Trend (MACD)
The MACD for Nifty 50 is at 11.74, which is significantly lower than the MACD Signal of 68.84. This negative MACD divergence suggests a potential bearish momentum. It's important to monitor this trend closely for any trading decisions.
RSI Analysis
Nifty 50 RSI Analysis: The Relative Strength Index (RSI) for Nifty 50 is 38.79, indicating that the index is in the lower range of the RSI scale. Typically, an RSI below 30 is considered oversold, so while Nifty 50 is not yet oversold, it is approaching that territory, suggesting potential weakening momentum.
Up Next

Global stock market indices: How the world markets performed today - 29 September 2025

Honda Activa 6G: Everything You Need to Know Before Buying

How much does a ULIP plan really cost? A break-down of all charges

Centre plans to borrow Rs 8.20 lakh cr from market in first half of FY27

Reliance denies buying Iranian oil amid US sanctions waiver

Premium petrol price up Rs 2, industrial diesel up Rs 22; no change in normal petrol, diesel rates

More videos

India's GDP expected to register over 8 pc growth in Sep-Dec: Report

Govt announces seven measures to help boost exports

RBI keeps interest rates on hold after US trade deal boosts outlook

RBI proposes to compensate customers up to Rs 25,000 loss due to fraud

RBI raises GDP growth projection of Q1, Q2 of FY27

RBI pauses rate cuts, retains interest rate at 5.25 pc

Rupee jumps 122 paise to close at 90.27 against US dollar on India-US trade deal

Stock markets cheer India-US trade deal: Sensex, Nifty surge 2.5 pc

UPI transactions hit record high of Rs 230 lakh crore in 2025-26 till Dec: Govt

Explained: India-US trade deal, tariffs and trade benefits