


Highlights
- S&P 500 rises 0.72%, strong bullish momentum
- Dow Jones declines 0.64%, RSI signals moderate strength
- Hang Seng surges 2.3%, RSI indicates strong momentum
Latest news

Hansika Motwanni seeks blessings at Tirumala temple, shares morning glimpse

Former New York IT Professional Builds Wellness Brand in Telangana, Creating Employment Through Small-Town Manufacturing

Sand2Sky Launches as Bhubaneswar's Premier Luxury Real Estate Consultancy, Redefining High-End Property Advisory in Odisha

Eros Music Worlds announces AI-powered music platform, partnership with Mohammed Rafi family

LTM Joins Athena, a Chainguard-led Industry Coalition to Help Secure Open Source Software in the AI Era

DOT School of Design Hosts Tamil Nadu's Biggest Design Graduation Show in Chennai

Bell Techlogix India Earns 2026 Great Place To Work Certification™ for Second Consecutive Year

Real estate sector faces stark leadership gap, only 1-2% of top roles occupied by women: Report
Global stock market indices: How the world markets performed today - 14 May 2025


The international stock market indices showed varied performances on May 14, 2025, reflecting the economic sentiment across different regions.
In this article, we analyze the performance of key global indices including the S&P 500, Dow Jones Industrial Average, NASDAQ Composite, FTSE 100, DAX, CAC 40, IBEX 35, Nikkei 225, Hang Seng, Nifty 50, and BSE Sensex.

Analysis for Sensex - May 14, 2025

Sensex Performance Summary: The Sensex index showed a slight positive performance, closing at 81,330.56, which is an increase of 182.34 points or 0.22% from the previous close of 81,148.22. The market's momentum appears favorable with the RSI at 61.30 and a positive MACD above the signal line, suggesting continued upward movement.

Relationship with Key Moving Averages
The Sensex is currently trading above its 50-day EMA of 78,259.02 and its 200-day EMA of 77,560.05, indicating a bullish trend. It is also above its 10-day and 20-day EMAs, suggesting upward momentum in the short term.
Moving Averages Trend (MACD)
Based on the provided data, the Sensex MACD value is 1195.73, which is above the MACD Signal line value of 1165.52. This suggests a bullish trend as the MACD line is above the Signal line, indicating potential upward movement in the market.

RSI Analysis
The RSI for Sensex stands at 61.30, indicating a neutral to moderately bullish sentiment. Typically, an RSI above 70 suggests an overbought condition, while below 30 indicates oversold. As it's above 50 but below 70, it suggests a continuation of the current trend with a potential for upward momentum.

Analysis for Dow Jones Industrial Average (US) - May 14, 2025

The Dow Jones Industrial Average opened at 42,507.33 and closed at 42,140.43, indicating a decline of 0.64% with a points change of -269.67. Despite a lower closing, the RSI indicator stands at 60.27, suggesting moderate strength, and the MACD indicator of 297.97 compared to the MACD Signal of 22.57 points towards potential bullish momentum.

Relationship with Key Moving Averages
The Dow Jones Industrial Average is currently trading below its 50 EMA (41,232.11) and 200 EMA (41,592.36), suggesting a potential bearish trend. However, it remains above the 10 EMA (41,348.05) and 20 EMA (40,966.40), indicating a mixed short-term outlook.
Moving Averages Trend (MACD)
The Dow Jones Industrial Average is currently experiencing a positive momentum trend as observed with the MACD of 297.97, which is significantly higher than the MACD Signal of 22.57, indicating potential bullish momentum. This suggests that the index could be in a phase of upward movement.

RSI Analysis
RSI Analysis for Dow Jones Industrial Average (US): The RSI value is 60.27, which indicates a moderately bullish signal as it is above the neutral level of 50. This suggests that the index is experiencing upward momentum, but it's not yet in overbought territory, which typically is above 70.

Analysis for CAC 40 (France) - May 14, 2025

CAC 40 (France) opened at 7875.39 and closed lower at 7825.09, a decrease of 0.62% from the previous close of 7873.83. The index experienced a volume of zero and showed some volatility within the day, with a high of 7877.74 and a low of 7805.70. The RSI is 58.86, indicating a moderately strong momentum, while the MACD value is above its signal line, suggesting a positive trend in the market momentum.

Relationship with Key Moving Averages
The CAC 40 index is currently trading below two of its key moving averages, the 10-day EMA (7733.44) and the 50-day EMA (7678.59), but above the 200-day EMA (7658.26). This suggests short-term weakness compared to its recent past but still maintains a positive trend in relation to the longer-term average.
Moving Averages Trend (MACD)
The MACD for CAC 40 (France) is 59.41, which is above the MACD Signal of 9.42, indicating a potential bullish momentum. This could suggest that the current trend might continue if supported by other factors. Nonetheless, investors should also consider other indicators and market conditions for a comprehensive analysis.

RSI Analysis
The RSI value for CAC 40 (France) stands at approximately 58.86, which suggests a relatively neutral position in terms of overbought or oversold conditions. This indicates that the index is neither strongly bullish nor bearish, reflecting a balanced market sentiment.

Analysis for FTSE 100 (UK) - May 14, 2025

FTSE 100 (UK) opened at 8602.92 and closed slightly lower at 8600.90, reflecting a marginal percentage change of -0.02% with a points decrease of 2. The Relative Strength Index (RSI) stands at 60.13, indicating moderately strong momentum.

Relationship with Key Moving Averages
The FTSE 100's close value of 8600.90 is above both its 50-day EMA (8466.01) and 200-day EMA (8356.43), indicating a potential bullish trend. Additionally, the close is above the 10-day EMA (8546.99) and 20-day EMA (8484.88), suggesting short-term upward momentum.
Moving Averages Trend (MACD)
The MACD for the FTSE 100 (UK) is 60.03, which is above its MACD Signal line of 33.83, indicating a bullish signal. This suggests that the recent momentum is positive, as the MACD line has crossed over the Signal line.

RSI Analysis
The FTSE 100 currently has an RSI of 60.13, which suggests that the index is experiencing moderate bullish momentum and is in neither overbought nor oversold territory. An RSI value above 70 typically indicates an overbought condition, while below 30 indicates an oversold condition.

Analysis for DAX (Germany) - May 14, 2025

The DAX index (Germany) opened at 23,679.03, reached a high of 23,702.20 and a low of 23,444.41, closing at 23,512.65. The closing price represents a -0.53% change from the previous close, with a points change of -125.91. Technical indicators suggest an upward pressure with the 50-day EMA above the 200-day EMA, and a RSI of 65.28, indicating a bullish momentum.

Relationship with Key Moving Averages
The DAX's current close at 23512.65 is above the 50-day EMA of 22294.03 and the 200-day EMA of 20737.96, indicating a generally bullish trend. It is also above the 10-day EMA of 23202.32 and the 20-day EMA of 22755.95, suggesting short-term strength.
Moving Averages Trend (MACD)
Based on the given data for DAX (Germany), the MACD value is 483.23, which is above the MACD Signal line at 339.18. This indicates a bullish trend, suggesting that the market momentum is currently positive.

RSI Analysis
The Relative Strength Index (RSI) for DAX (Germany) stands at 65.28. This value suggests that the index is approaching overbought conditions but is still within neutral territory, indicating moderate upward momentum.

Analysis for S&P 500 (US) - May 14, 2025

The S&P 500 opened at 5854.15 and closed at 5886.55, marking a positive change of approximately 0.72% from the previous close of 5844.19, with a points increase of 42.36. The trading volume was notable at 5,516,290,000 shares, and technical indicators show an RSI of 67.01, suggesting relatively strong market momentum.
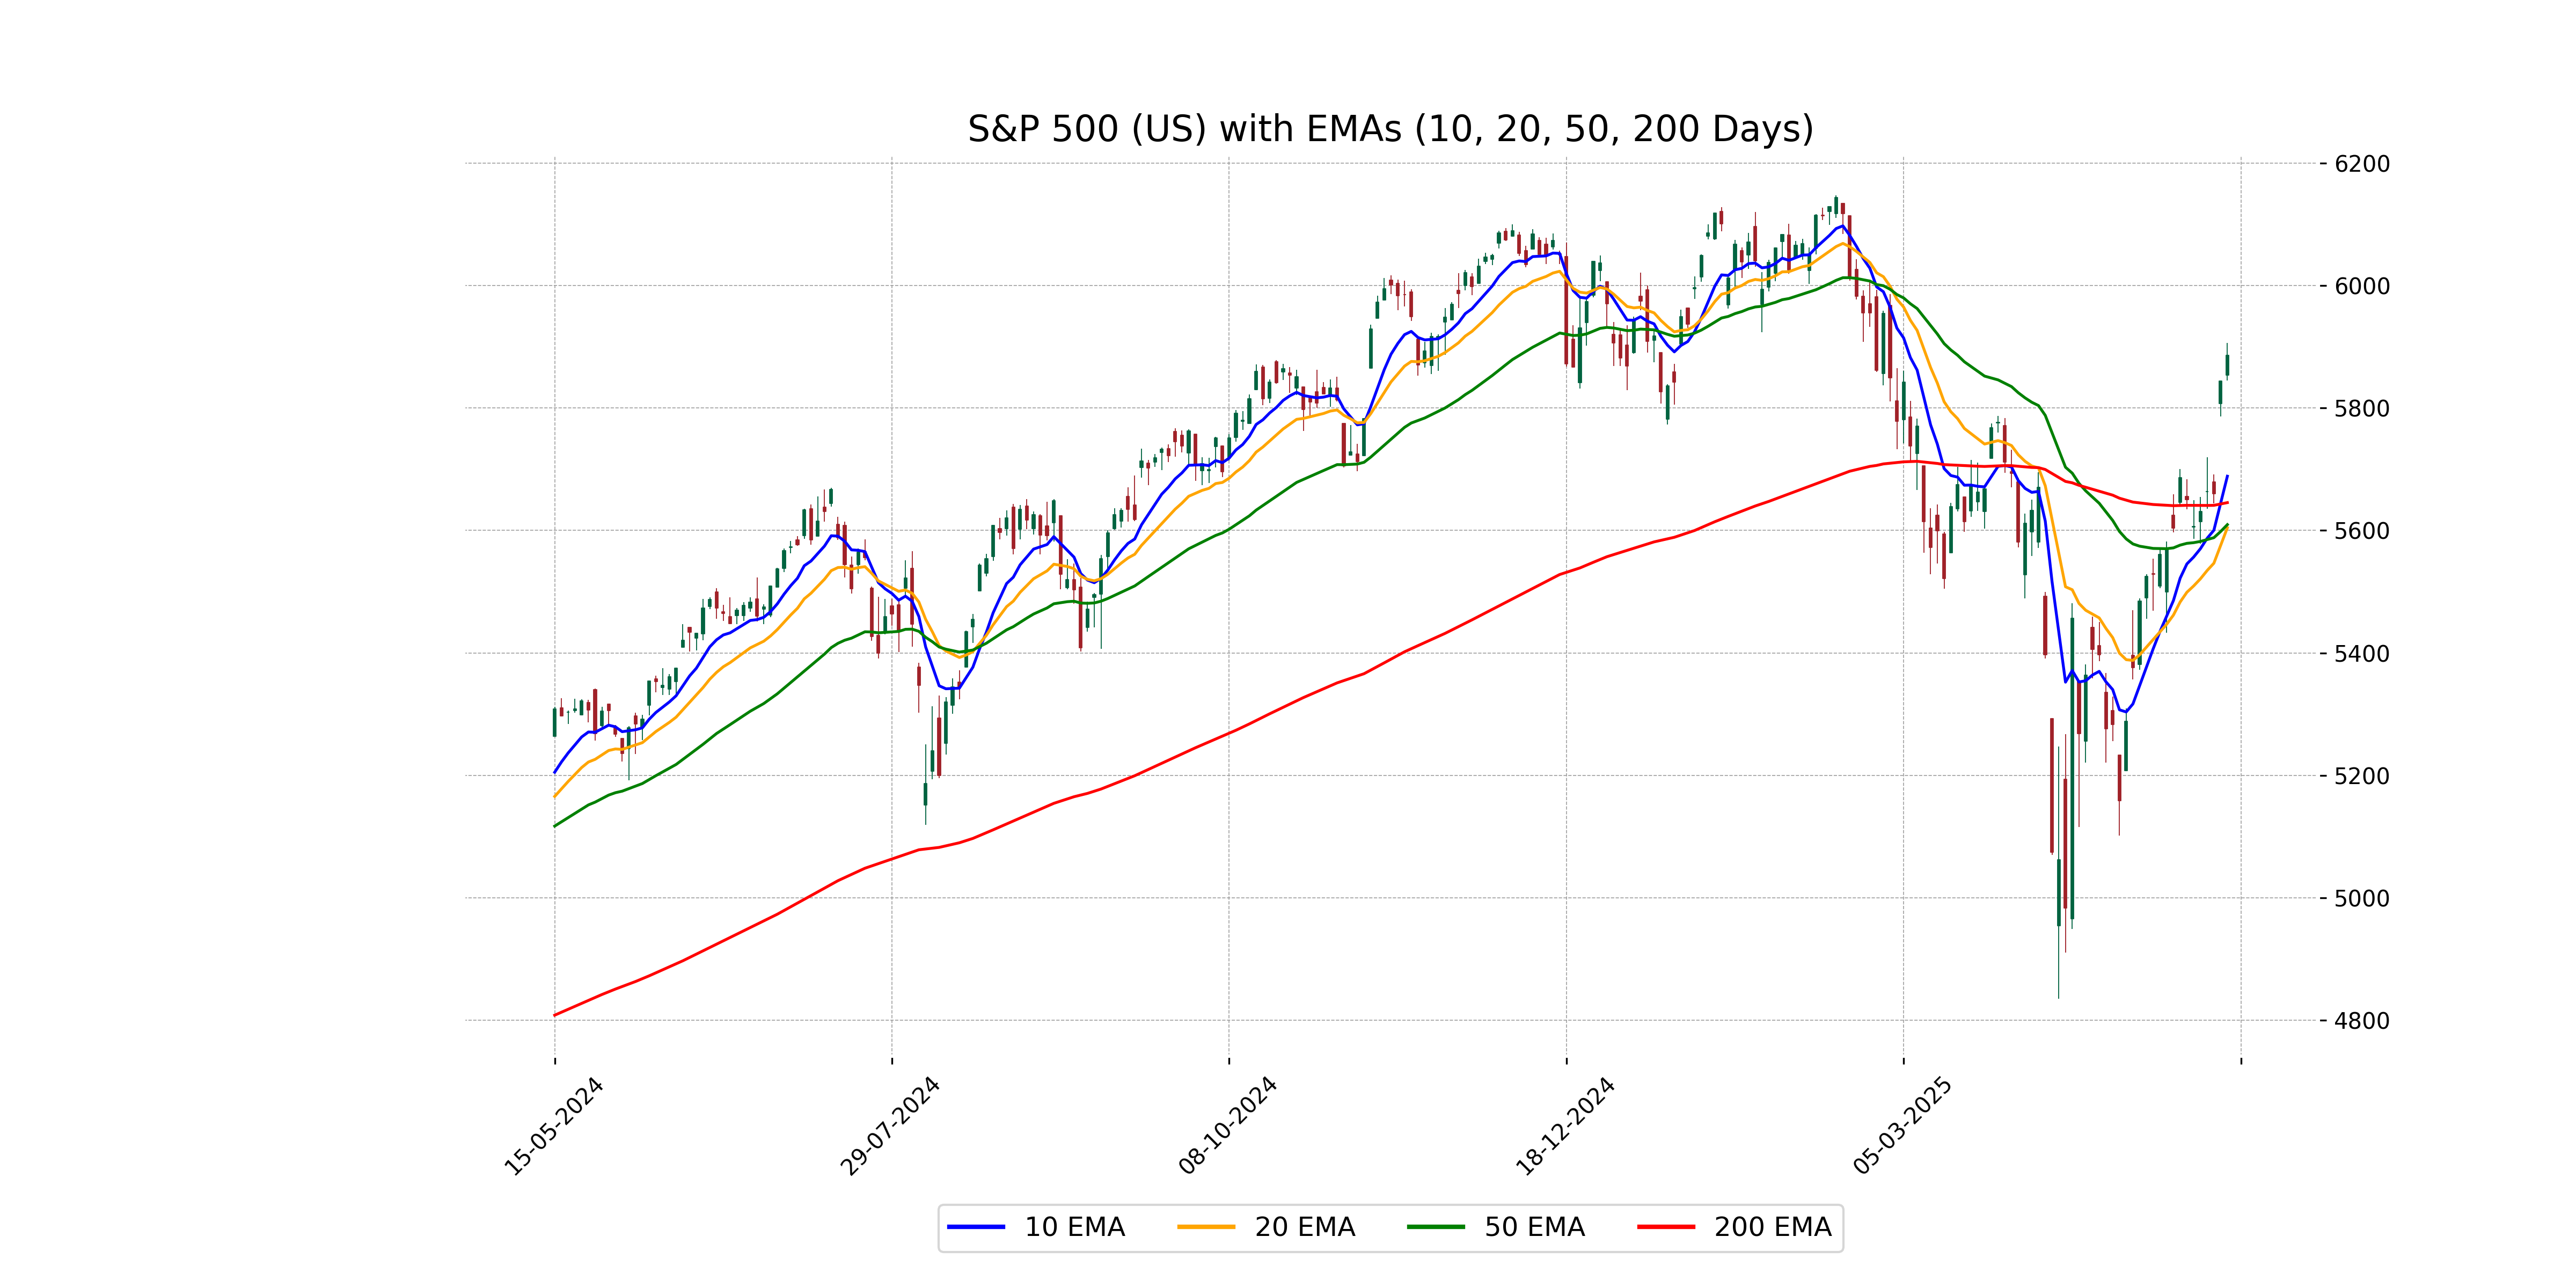
Relationship with Key Moving Averages
The S&P 500 closed at 5886.55, which is above its 50-day EMA of 5609.58 and its 20-day EMA of 5604.54, but below its 10-day EMA of 5688.71. The current close is also above the 200-day EMA of 5645.55, indicating a generally bullish trend over these time frames.
Moving Averages Trend (MACD)
The MACD for the S&P 500 is 77.51, which is significantly above the MACD Signal line of 31.89, indicating a strong bullish momentum. This suggests potential continued upward movement in the index based on current momentum indicators.

RSI Analysis
The Relative Strength Index (RSI) for the S&P 500 is currently at 67.01, which indicates that the index is approaching overbought levels. This suggests that the index has experienced a strong upward momentum recently, and investors should be cautious of potential short-term pullbacks.

Analysis for Hang Seng Index (Hong Kong) - May 14, 2025

The Hang Seng Index (Hong Kong) opened at 23,316.45, reaching a high of 23,640.65 and closing at the same high. It experienced a substantial increase of 2.3% from the previous close, amounting to a points change of 532.38. The index shows a positive trend supported by technical indicators such as the RSI at 64.41 and the MACD at 271.69, which is above the MACD Signal of 52.34.

Relationship with Key Moving Averages
The Hang Seng Index is trading above key moving averages with its recent close at 23,640.65, surpassing the 50 EMA of 22,350.13, 200 EMA of 20,765.85, 10 EMA of 22,875.62, and 20 EMA of 22,561.15. This indicates a bullish trend in the short to medium term.
Moving Averages Trend (MACD)
The MACD for Hang Seng Index is significantly above the MACD Signal line, indicating a bullish momentum. With a MACD of 271.69 and a signal line at 52.34, the index is showing strong upward momentum.

RSI Analysis
Based on the provided stock data for Hang Seng Index (Hong Kong), the RSI is 64.41, indicating a moderately strong buying momentum. As RSI values between 50 and 70 generally suggest a potential uptrend, the index appears to be moving towards being overbought, which might lead to further gains if the trend continues.

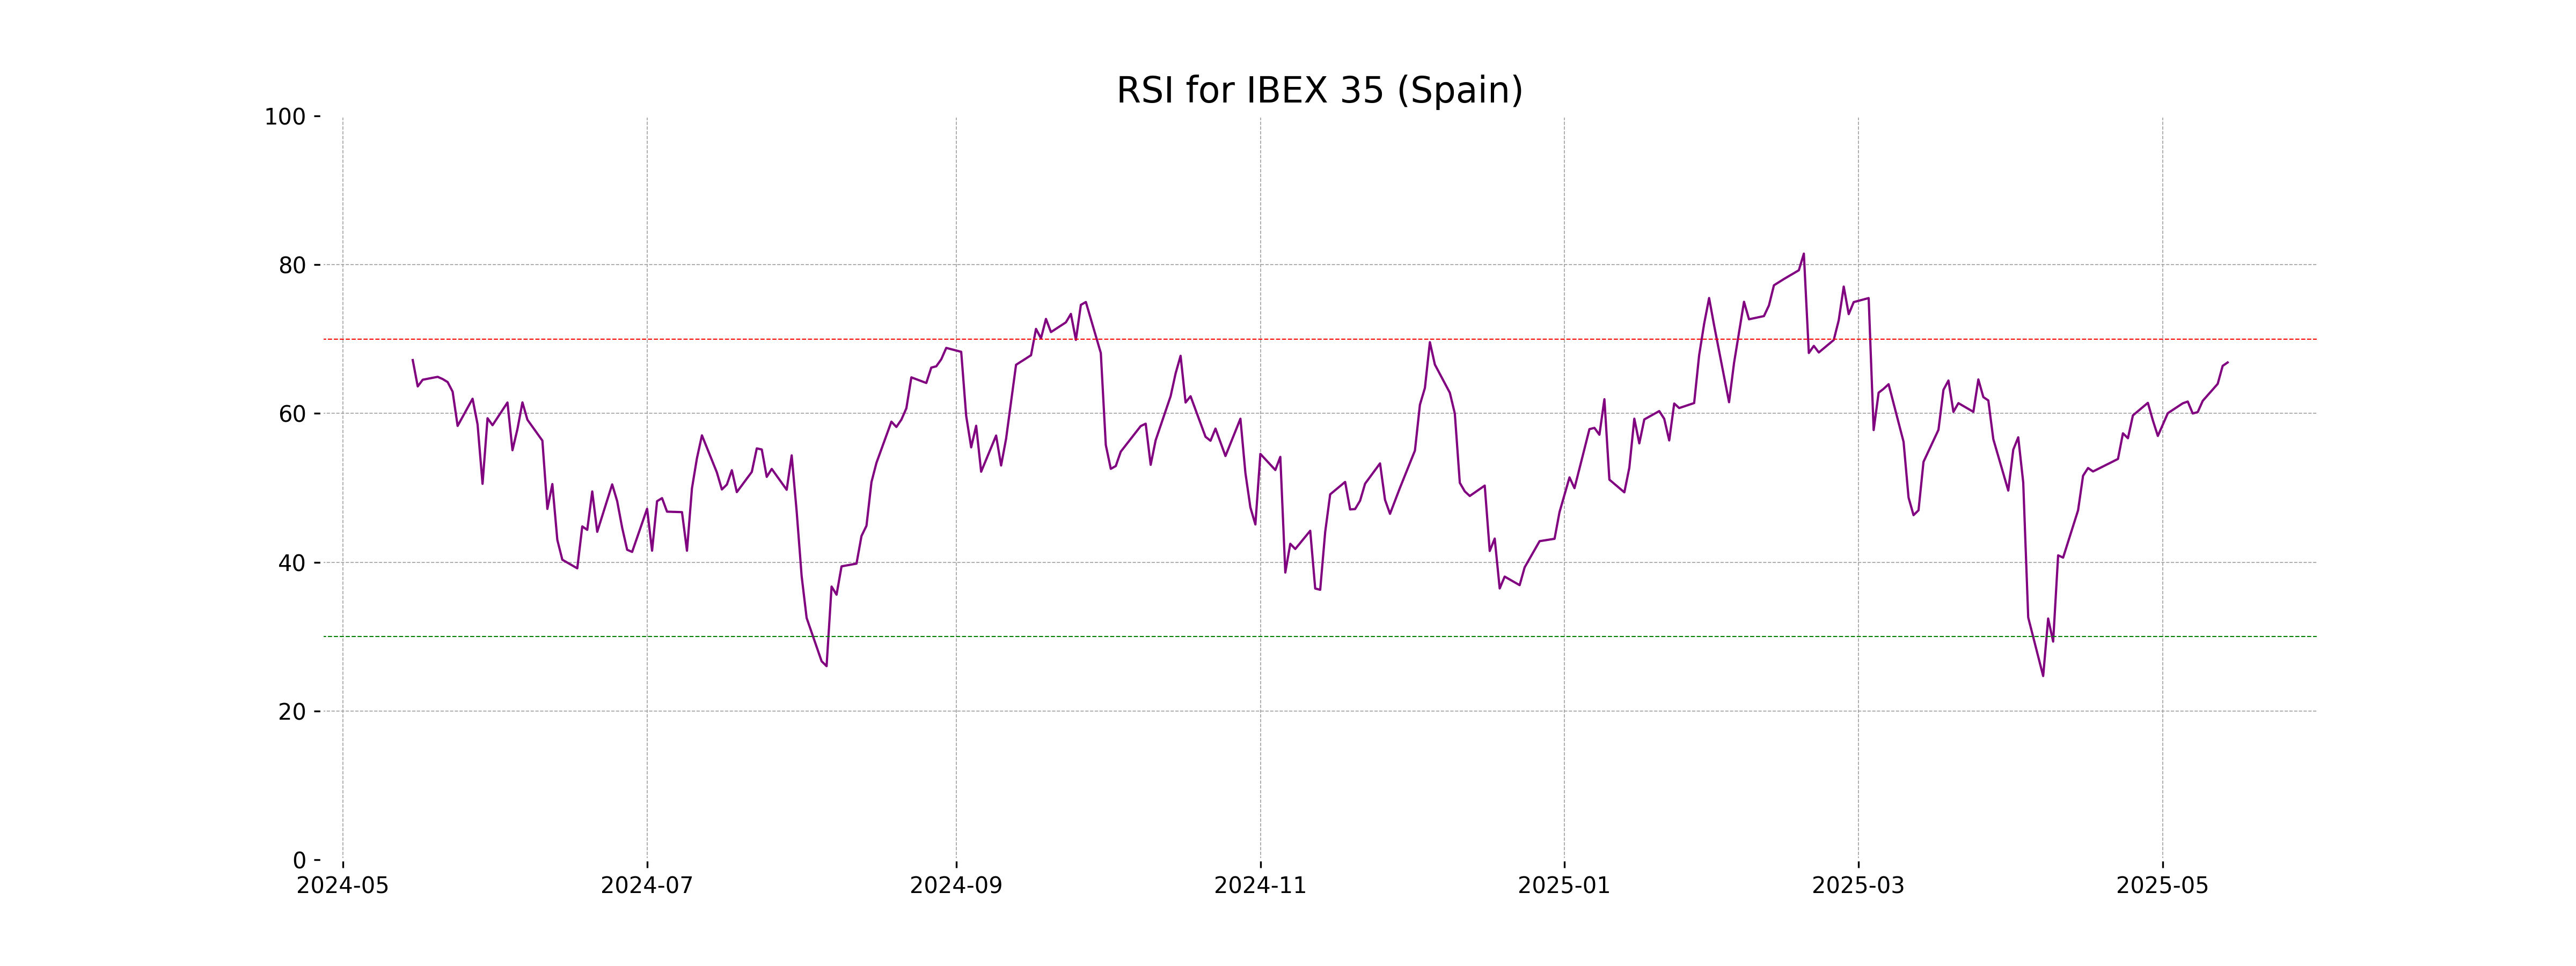
Analysis for IBEX 35 (Spain) - May 14, 2025

IBEX 35 (Spain) opened at 13776.0 and closed at 13790.7998, reflecting a small percentage change of 0.1576% with an increase of 21.7002 points. The index traded within a range of 13756.4 to 13846.0. The relative strength index (RSI) is moderately high at 66.85, indicating some buying pressure.

Relationship with Key Moving Averages
IBEX 35 (Spain) is currently trading above its key moving averages, including the 50-day EMA (13106.90), 20-day EMA (13373.66), and 10-day EMA (13558.02), indicating a strong upward momentum. The price is significantly higher than the 200-day EMA (12240.16), suggesting a long-term bullish trend.
Moving Averages Trend (MACD)
IBEX 35 (Spain) MACD Analysis: The MACD line for IBEX 35 is 211.12, which is above the MACD Signal line of 161.64, indicating a bullish trend. This suggests positive momentum and potential for continued upward movement in the stock index.

RSI Analysis
The RSI for IBEX 35, Spain, is 66.85, positioning it in the neutral to slightly overbought range. Generally, an RSI above 70 is considered overbought, suggesting potential for a price pullback, while below 30 is oversold, indicating potential for a price rise. This current RSI suggests a mostly stable momentum with a mild inclination towards overbuying.
Analysis for NASDAQ Composite (US) - May 14, 2025

The NASDAQ Composite (US) performance for the day shows a closing value of 19,010.09, which is an increase of 301.75 points (1.61%) from the previous close of 18,708.34. The index reached a high of 19,065.96 during the day, with a relatively strong RSI of 69.60 indicating approaching overbought conditions. The MACD is at 351.39, suggesting a strong upward momentum compared to the signal line at 151.71.

Relationship with Key Moving Averages
The NASDAQ Composite closed above all its key moving averages, with the closing price of 19,010.09 higher than the 50 EMA (17,683.96), 200 EMA (17,952.02), 10 EMA (18,055.09), and 20 EMA (17,679.18). This suggests a strong bullish momentum in the market.
Moving Averages Trend (MACD)
Based on the stock data for NASDAQ Composite (US), the MACD is at 351.39 and the MACD Signal is at 151.71. The positive value of the MACD and its greater value compared to the MACD Signal suggests a possible bullish trend in the market.

RSI Analysis
The RSI value for the NASDAQ Composite is 69.60, indicating that the index is approaching overbought levels. Typically, an RSI above 70 suggests that the stock or index may be overvalued, potentially signaling a reversal or pullback. However, it's important to consider the broader market context and other indicators for a comprehensive analysis.

Analysis for Nikkei 225 (Japan) - May 14, 2025

The Nikkei 225 of Japan opened at 38,199.03, reached a high of 38,325.88, and closed at 38,128.13. It experienced a slight decrease in performance, with a drop of 0.14% or 55.13 points from the previous close of 38,183.26. The RSI is at 66.86, indicating a relatively strong momentum, while the MACD is 650.18, suggesting a bullish trend.

Relationship with Key Moving Averages
Nikkei 225 is currently trading above all key moving averages, with its close at 38128.13 being higher than the 50-day EMA (36378.72), 200-day EMA (37414.72), 10-day EMA (37077.19), and 20-day EMA (36367.70). This suggests a bullish trend, as the price surpasses these averages, indicating potential momentum in the market.
Moving Averages Trend (MACD)
The Nikkei 225 is currently showing bullish momentum as indicated by the MACD analysis, with the MACD line at 650.18 significantly above the signal line at 262.21. This suggests strong upward momentum in the index's trend.

RSI Analysis
The RSI for the Nikkei 225 is 66.86, indicating that it is nearing the overbought territory, which typically starts at 70. This suggests that the index may be experiencing strong momentum, but caution is advised as it approaches overbought conditions.

Analysis for Nifty Bank - May 14, 2025

Nifty Bank opened at 55008.55, reaching a high of 55208.60 and a low of 54491.00, before closing at 54801.30. The index saw a decrease of 0.25% from its previous close, with a points change of -139.55. The Relative Strength Index (RSI) is at 57.89, suggesting moderate buying strength. The Moving Average Convergence Divergence (MACD) shows a negative divergence with its signal line, indicating potential bearish momentum.

Relationship with Key Moving Averages
Nifty Bank is currently trading above its 50 EMA and 200 EMA, indicating a strong upward trend over the mid and long term. However, it is near its 10 EMA, suggesting potential short-term stability or slight volatility. The moving averages show that overall momentum remains positive.
Moving Averages Trend (MACD)
The MACD for Nifty Bank is 817.40, while the MACD Signal is 994.76. Since the MACD is below the MACD Signal, this indicates a bearish momentum in the current trend.

RSI Analysis
The RSI value for Nifty Bank is 57.89, indicating a moderately strong trend. An RSI near 50 suggests a neutral momentum, neither overbought nor oversold, which may imply potential stability or a continuation of the current trend.

Analysis for Nifty 50 - May 14, 2025

Nifty 50 showed a positive performance with a closing at 24,666.90, marking a rise of 0.36% or 88.55 points from the previous close. The session's high was 24,767.55, while the low was 24,535.55. The relative strength index (RSI) stood at 61.49, indicating healthier sentiment as it remains above the neutral 50 mark.

Relationship with Key Moving Averages
The Nifty 50 is trading above its 10 EMA (24,431.82), 20 EMA (24,171.62), 50 EMA (23,723.63), and 200 EMA (23,526.82), indicating a strong upward momentum. The current close of 24,666.90 suggests bullish sentiment as it exceeds these key moving averages.
Moving Averages Trend (MACD)
Based on the stock data for Nifty 50, the MACD value is 343.34, which is above the MACD signal line of 334.96. This indicates a bullish trend, suggesting potential upward momentum in the market. Investors might consider this as a positive signal.

RSI Analysis
The Nifty 50 index has an RSI (Relative Strength Index) of 61.49, which suggests a neutral to slightly bullish momentum as it is above the midpoint of 50. Generally, an RSI between 50 and 70 indicates that the asset is strengthening but not yet in overbought territory.

Up Next

Global stock market indices: How the world markets performed today - 14 May 2025

Honda Activa 6G: Everything You Need to Know Before Buying

How much does a ULIP plan really cost? A break-down of all charges

Centre plans to borrow Rs 8.20 lakh cr from market in first half of FY27

Reliance denies buying Iranian oil amid US sanctions waiver

Premium petrol price up Rs 2, industrial diesel up Rs 22; no change in normal petrol, diesel rates

More videos

India's GDP expected to register over 8 pc growth in Sep-Dec: Report

Govt announces seven measures to help boost exports

RBI keeps interest rates on hold after US trade deal boosts outlook

RBI proposes to compensate customers up to Rs 25,000 loss due to fraud

RBI raises GDP growth projection of Q1, Q2 of FY27

RBI pauses rate cuts, retains interest rate at 5.25 pc

Rupee jumps 122 paise to close at 90.27 against US dollar on India-US trade deal

Stock markets cheer India-US trade deal: Sensex, Nifty surge 2.5 pc

UPI transactions hit record high of Rs 230 lakh crore in 2025-26 till Dec: Govt

Explained: India-US trade deal, tariffs and trade benefits