


Highlights
- Sensex, DAX, and CAC 40 closed higher today
- Dow Jones, NASDAQ showed mixed short-term momentum
- FTSE 100, Hang Seng, Nikkei signaled bullish trends
Latest news

West Asia crisis poses supply shock risk, if recovery delayed inflation may spread across economy: Finance Ministry

Sunil Munshi Appointed CEO of Denave

6 Instant Personal Loan Options to Manage Bills, EMIs, and Monthly Expenses

FundedFirm: Building Global Trust While Delivering Over 20 Million in Trader Payouts

JISA Softech and Seqrite Partner to Deliver Integrated Data Protection and Data Privacy Solutions for Global Enterprises

Monitra Health Raises Capital as upBeat® Emerges as Scalable Global Cardiac Monitoring Platform

Star Health reports a 16% increase in PAT of INR 911 Crores in FY26 vs FY25; Growth and Operating Metrics improve sharply

Neutrinos Named a Leader in Everest Group's 2026 Insurance-specific IDP PEAK Matrix® Assessment
Global stock market indices: How the world markets performed today - 02 May 2025


The international stock market indices showed varied performances on May 02, 2025, reflecting the economic sentiment across different regions.
In this article, we analyze the performance of key global indices including the S&P 500, Dow Jones Industrial Average, NASDAQ Composite, FTSE 100, DAX, CAC 40, IBEX 35, Nikkei 225, Hang Seng, Nifty 50, and BSE Sensex.

Analysis for Sensex - May 02, 2025

The Sensex opened at 80,300.19 and closed at 80,501.99, reflecting a rise of 0.32% from the previous close of 80,242.24, with an increase of 259.75 points. The relative strength index (RSI) is at 66.70, indicating a relatively strong market momentum. Important moving averages, such as the 10 EMA and 20 EMA, are well below the closing price, suggesting an upward trend.

Relationship with Key Moving Averages
The closing value of Sensex at 80,501.99 is currently above its 50 EMA (77,267.71), 200 EMA (77,282.90), 10 EMA (79,458.63), and 20 EMA (78,372.65), indicating a bullish trend as it trades higher than these key moving averages. Additionally, the RSI is at 66.70, which suggests relatively strong momentum in the current market conditions.
Moving Averages Trend (MACD)
The MACD value for Sensex is 1242.58, which is higher than the MACD Signal of 952.53. This indicates a bullish trend, suggesting a potential upward momentum in the stock market.

RSI Analysis
The current RSI for Sensex is 66.70, suggesting that the index is nearing overbought territory as RSI above 70 is generally considered overbought. This indicates potential for a price pullback or consolidation if upward momentum does not persist.

Analysis for Dow Jones Industrial Average (US) - May 02, 2025

The Dow Jones Industrial Average (US) opened at 40,918 and closed at 40,752, marking a slight increase of approximately 0.21% from the previous close, with a points change of 83.60. The RSI stands at 52.32, indicating a moderately strong trend, and the MACD reflects a negative trend with a value of -255.00. Overall, despite a high trading volume of 597.27 million, the market remains below its 50-day and 200-day EMAs, suggesting bearish momentum.
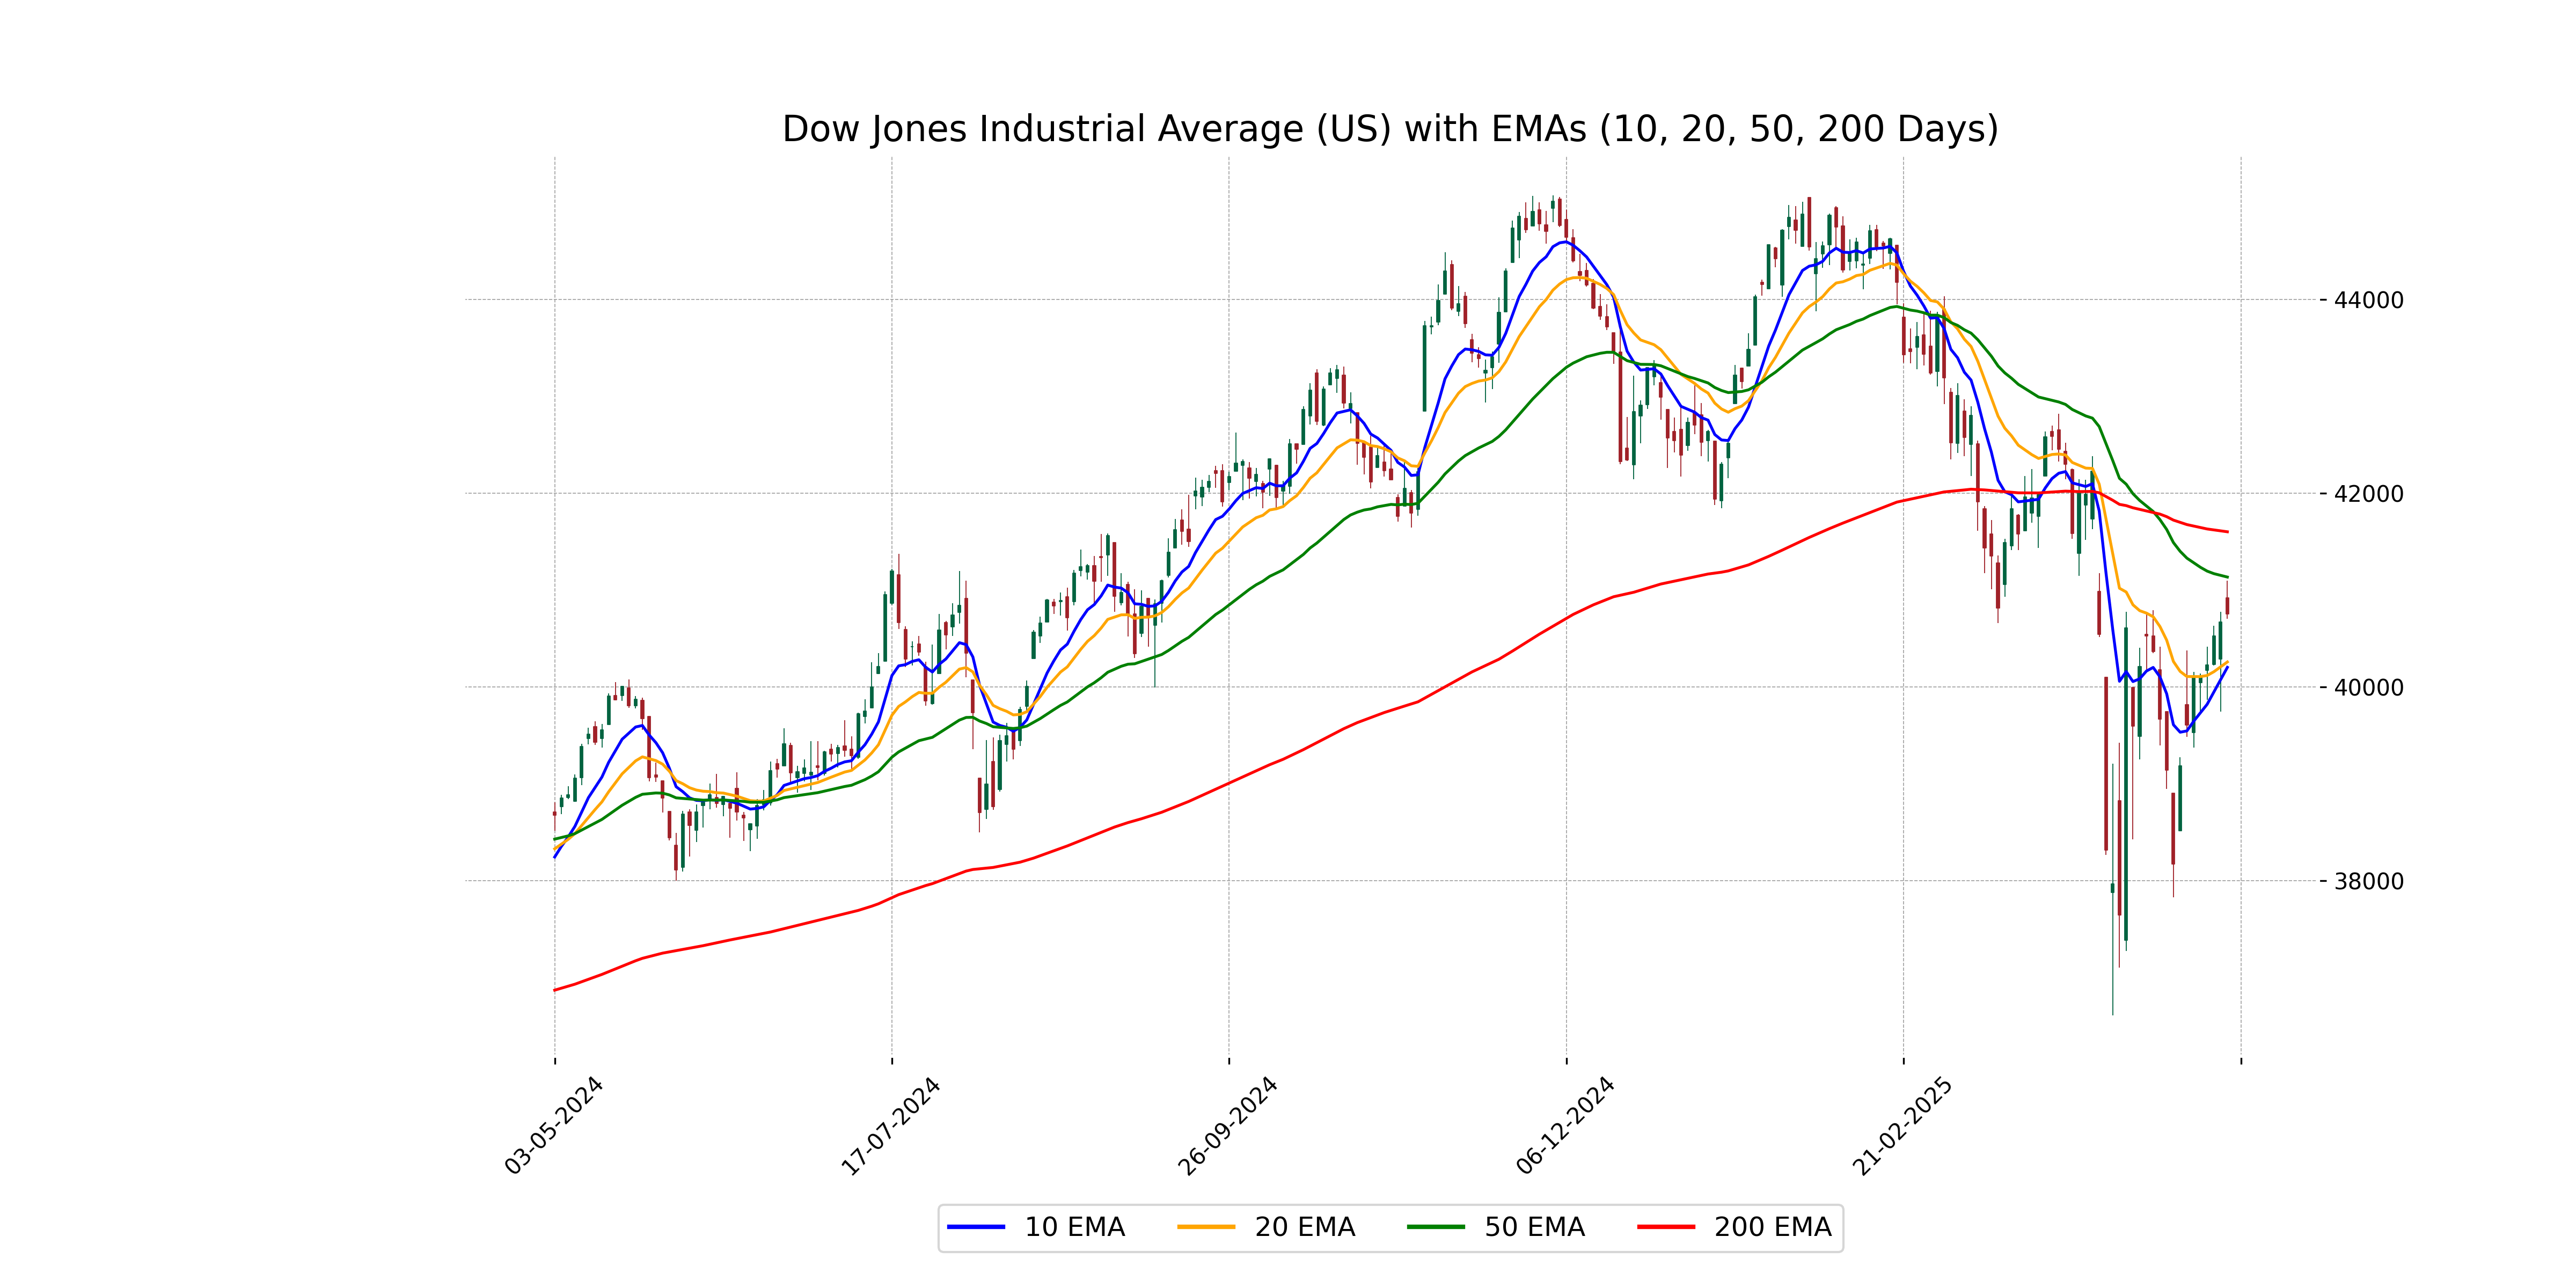
Relationship with Key Moving Averages
The Dow Jones Industrial Average opened at 40,918.04 and closed at 40,752.96, remaining below its 50-EMA (41,134.88) and 200-EMA (41,602.33), indicating a potential downtrend. Additionally, the current close is above the 10-EMA (40,202.78) and 20-EMA (40,258.43), suggesting some short-term upward momentum.
Moving Averages Trend (MACD)
Dow Jones Industrial Average (US) MACD Analysis: The MACD value of -255.00 shows a bearish trend compared to its signal line at -507.89. Moving closer to the signal line, it suggests a potential weakening of the current downward momentum.

RSI Analysis
The RSI for the Dow Jones Industrial Average (US) is 52.32, indicating a neutral stance as it lies close to the midpoint of the RSI scale (0-100). Typically, an RSI above 70 suggests overbought conditions, while below 30 suggests oversold conditions; therefore, the current RSI suggests no strong momentum in either direction.

Analysis for CAC 40 (France) - May 02, 2025

The CAC 40 (France) opened at 7710.08 and closed at 7710.55, reflecting a positive change of 1.54% from the previous close of 7593.87, with a points change of 116.68. The RSI stood at 56.85, indicating slightly bullish conditions, while the MACD at -39.79 suggests potential upward momentum as it contrasts with the MACD Signal of -108.60.

Relationship with Key Moving Averages
The CAC 40 index closed at 7710.55, slightly above its 50-day EMA of 7645.29 and 200-day EMA of 7649.40, indicating a potential short-term bullish trend. The index is also significantly above its 10-day EMA of 7522.11 and 20-day EMA of 7518.02, reflecting recent upward momentum.
Moving Averages Trend (MACD)
The MACD for CAC 40 (France) is -39.79, while the MACD Signal is -108.60. Since the MACD is higher than the MACD Signal, it indicates a bullish crossover, suggesting potential upward momentum.

RSI Analysis
The RSI for CAC 40 (France) is 56.85, indicating a neutral stance, as it is neither in the overbought (above 70) nor oversold (below 30) region. This suggests that the index is experiencing moderate momentum and is not currently exhibiting signs of turning points.

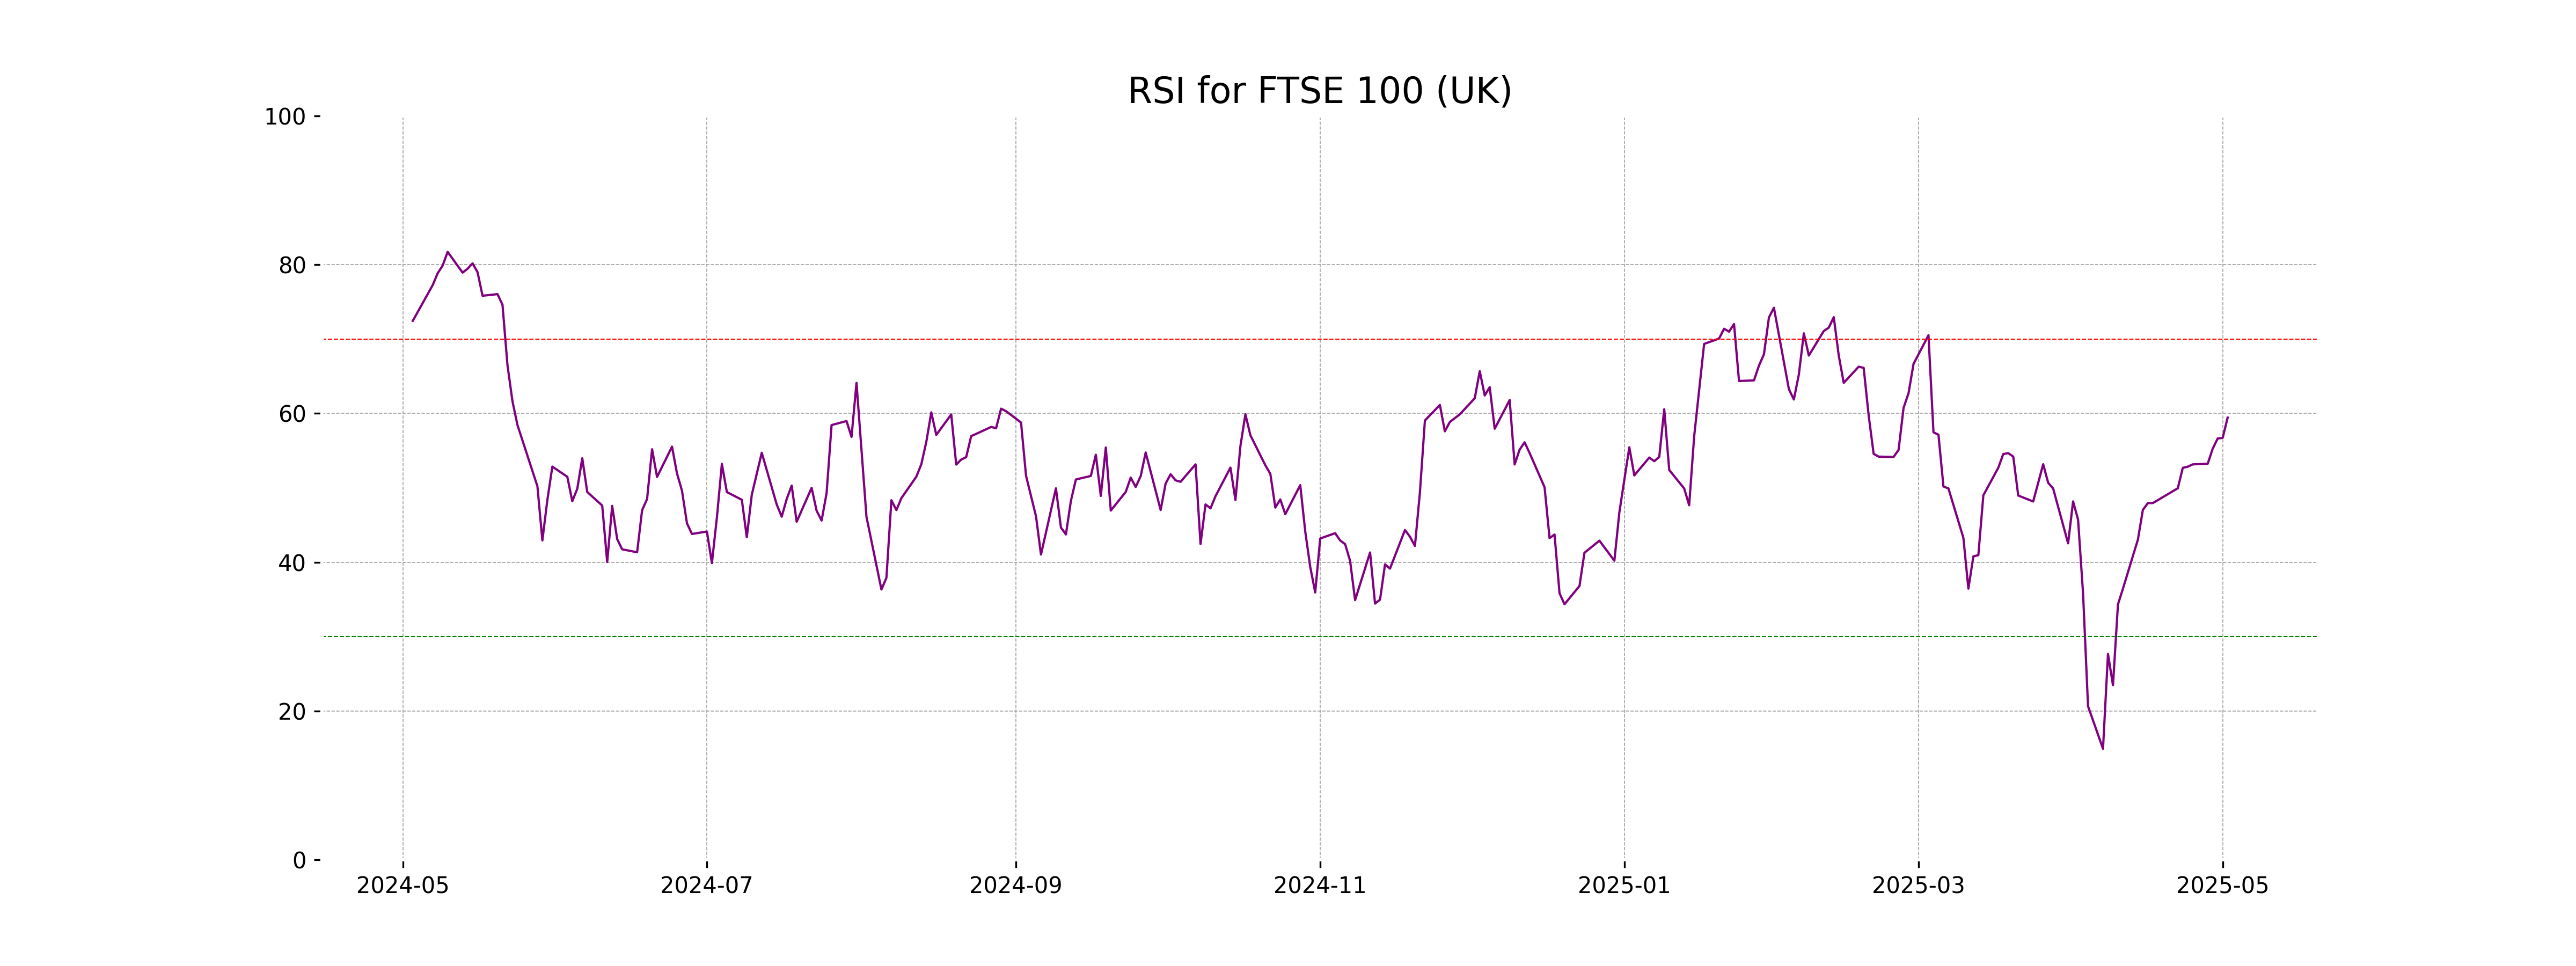
Analysis for FTSE 100 (UK) - May 02, 2025

FTSE 100 (UK) opened at 8496.80 and closed higher at 8556.40, showing a positive change of 0.70%. This increase resulted in a points change of 59.60, with a high of 8587.71 recorded during the day. The index's RSI of 59.44 indicates moderate momentum, while its MACD value signifies a bullish trend.

Relationship with Key Moving Averages
The FTSE 100 closed at 8556.40, which is above its 50-day EMA of 8427.64 and 200-day EMA of 8339.80, indicating a bullish trend. Additionally, the 10-day and 20-day EMAs are also below the closing price, further supporting positive momentum.
Moving Averages Trend (MACD)
The current MACD of the FTSE 100 is 18.24, which is above the MACD Signal line at -35.25. This suggests a bullish signal, indicating that the recent price momentum is upwards and could potentially continue if the trend holds.

RSI Analysis
The Relative Strength Index (RSI) for FTSE 100 (UK) is 59.44, which suggests that the index is currently in a neutral to slightly bullish range. An RSI value between 50 and 70 typically indicates that there is buying momentum, but it has not yet reached overbought levels, which occur above 70.
Analysis for DAX (Germany) - May 02, 2025

DAX (Germany) Performance: The DAX index opened at 22,818.18 and closed at 22,867.79, marking a 1.65% increase from the previous close. The index saw a points change of 370.81, with a high of 22,897.37 and a low of 22,764.51. The RSI stands at 62.72, indicating a moderately overbought condition, while the MACD reflects a strong bullish trend.

Relationship with Key Moving Averages
The DAX (Germany) is currently trading above its 50-day EMA at 22,860, significantly higher than both the 50-day EMA of 21,860.15 and the 200-day EMA of 20,512.23. This suggests a strong bullish momentum in the short to medium term.
Moving Averages Trend (MACD)
The DAX index is displaying a positive momentum with the MACD currently above the signal line, indicating a potential bullish trend. The MACD value is 139.68, while the signal line is at -96.96, suggesting a strengthening upward movement in the market.

RSI Analysis
The Relative Strength Index (RSI) for DAX (Germany) stands at 62.72, indicating that the index is currently experiencing moderately strong bullish momentum. An RSI value above 50 typically suggests a predominance of buying pressure, but it remains below the overbought threshold of 70.

Analysis for S&P 500 (US) - May 02, 2025

The S&P 500 (US) opened at 5625.14 and closed at 5604.14, marking a slight increase of 0.63% with a points change of 35.08. The trading volume was 4.935 billion. The RSI stands at 56.26, indicating a somewhat neutral momentum, while the MACD value of -4.78 suggests a potential continuation of the current trend.

Relationship with Key Moving Averages
The S&P 500 is currently trading below its 200-day EMA of 5640.44, indicating a potential bearish trend in the longer term. However, it is trading above its 50-day EMA of 5571.58, suggesting some short-term bullish momentum.
Moving Averages Trend (MACD)
MACD Analysis: For the S&P 500, the MACD is currently at -4.78, which is above the MACD signal line of -55.55. This indicates a bullish momentum, suggesting potential for upward movement in the short term. However, since the MACD is still negative, it signals a need for caution until a stronger positive trend is established.

RSI Analysis
The RSI for S&P 500 is 56.26, indicating a neutral position as it's neither near the overbought (above 70) nor oversold (below 30) thresholds. This suggests a steady momentum with balanced buying and selling pressure.

Analysis for Hang Seng Index (Hong Kong) - May 02, 2025

Hang Seng Index (Hong Kong) opened at 22,192.51 and closed at 22,504.68, marking a positive change with a percent increase of 1.74% from the previous close. The index experienced a high of 22,532.54 and a low of 22,058.30, with an impressive gain of 385.27 points. The technical indicators show an RSI of 55.29 and a MACD value that is still in negative territory but improving, indicating potential bullish momentum.

Relationship with Key Moving Averages
The Hang Seng Index closed above its 50-day EMA of 22,117.99 and 10-day EMA of 21,967.24, indicating short-term bullish momentum. It is significantly above the 200-day EMA of 20,600.02, suggesting a longer-term uptrend.
Moving Averages Trend (MACD)
The Hang Seng Index shows a MACD value of -139.46, which is higher than the MACD Signal of -301.98. This indicates that bullish momentum is building, as the MACD line is rising above the signal line.

RSI Analysis
The Hang Seng Index (Hong Kong) shows an RSI of 55.29, indicating a neutral momentum with neither oversold nor overbought conditions. This suggests that the index is relatively balanced, with the potential for either upward or downward movement in the near term.

Analysis for IBEX 35 (Spain) - May 02, 2025

The IBEX 35 (Spain) opened at 13,405.60 and closed slightly lower at 13,364.90, with a percentage change of 0.58% and a points gain of 77.10. The index showed moderate strength with an RSI of 58.52 and bullish momentum signaled by the MACD of 120.62 above the MACD Signal of 39.22.

Relationship with Key Moving Averages
The IBEX 35 is trading above its 10 EMA (13189.25), 20 EMA (13060.76), and 50 EMA (12914.77), indicating a potential upward trend or positive momentum. The MACD of 120.62 is also above the MACD Signal of 39.22, supporting the bullish outlook.
Moving Averages Trend (MACD)
The current MACD for the IBEX 35 index is 120.62, which is above the MACD Signal line at 39.22, indicating a bullish trend. The positive MACD suggests that the market momentum is upward, potentially signaling a buying opportunity.

RSI Analysis
The RSI for IBEX 35 is 58.52, indicating that the market is in a neutral zone, leaning toward bullish sentiment but not yet approaching overbought conditions (above 70). This suggests moderate strength in the current trend without immediate signals of reversal.

Analysis for NASDAQ Composite (US) - May 02, 2025

NASDAQ Composite (US) Performance Description: The NASDAQ Composite had an opening at 17,793.14 and closed slightly lower at 17,710.74, marking a 1.52% increase from the previous close of 17,446.34. Despite volatility within the range of 17,688.11 to 17,922.83, the index experienced a positive movement characterized by a points change of 264.40, with an increase reflected in its RSI of 57.44 and a modestly positive MACD value.

Relationship with Key Moving Averages
The NASDAQ Composite opened above its 50 EMA of 17513.73 and closed at 17710.74, which remains below its 200 EMA of 17938.32. The index is showing some strength, reflected by its position above the 50 EMA, but still faces resistance from the 200 EMA.
Moving Averages Trend (MACD)
The MACD value for NASDAQ Composite is 0.0501, which is above the MACD Signal of -207.2529. This suggests a potential bullish signal, indicating a possible upward momentum in the market.

RSI Analysis
The NASDAQ Composite's RSI value of 57.44 suggests a neutral to slightly bullish momentum, as it is above 50 but not in the overbought territory. This indicates that the market may continue to show strength unless external factors change the sentiment significantly.

Analysis for Nikkei 225 (Japan) - May 02, 2025

The Nikkei 225 (Japan) opened at 36,636.55 and closed at 36,830.69, marking a 1.04% increase from the previous close of 36,452.30 and a gain of 378.39 points. The index experienced a high of 36,976.51 and a low of 36,606.58, with a strong RSI of 59.93 indicating positive momentum. The MACD stands at 79.83, with a MACD Signal of -343.65, suggesting bullish sentiment in the market.

Relationship with Key Moving Averages
Nikkei 225 is trading above its 50-day EMA (36,057.37) and below its 200-day EMA (37,406.37), indicating a short-term bullish momentum but a longer-term bearish trend. The index's close (36,830.69) suggests a move away from recent short-term averages, implying increased volatility in recent market sessions.
Moving Averages Trend (MACD)
Nikkei 225 MACD Analysis: The MACD value is 79.83, which is above the MACD Signal of -343.65, indicating a bullish trend for the Nikkei 225. This suggests potential upward momentum in the market.

RSI Analysis
The RSI for Nikkei 225 is 59.93, which indicates a neutral to slightly bullish momentum as it is below the overbought threshold of 70. This suggests that the index is experiencing upward momentum but still has room before reaching technically overbought levels.

Analysis for Nifty Bank - May 02, 2025

Nifty Bank opened at 55,100.95, reached a high of 55,691.95 and closed at 55,115.35. It experienced a small positive percentage change of 0.05%, with a gain of 28.20 points from the previous close of 55,087.15. The RSI suggests a strong momentum at 67.14, and the MACD indicates a bullish sentiment being higher than its signal.

Relationship with Key Moving Averages
Nifty Bank's current close of 55115.35 is above its 50 EMA of 51869.54 and its 200 EMA of 50591.61, indicating a strong bullish trend. Additionally, it is also above the 10 EMA of 54668.33 and the 20 EMA of 53587.23, further reinforcing the current upward momentum.
Moving Averages Trend (MACD)
Nifty Bank MACD Analysis The MACD for Nifty Bank is 1372.89, while the MACD Signal is 1280.47. Since the MACD is above the MACD Signal, this suggests a bullish momentum in the stock's price.

RSI Analysis
Based on the provided stock data, the RSI (Relative Strength Index) of Nifty Bank is 67.14. An RSI value above 70 typically indicates that the stock might be overbought, while below 30 suggests it might be oversold. With an RSI of 67.14, Nifty Bank is approaching the overbought territory, indicating a potentially strong buying momentum.

Analysis for Nifty 50 - May 02, 2025

Nifty 50 opened at 24,311.90 and closed slightly higher at 24,346.70, recording a marginal gain of 0.05%. The index experienced a range between a high of 24,589.15 and a low of 24,238.50 during the trading session. The current Relative Strength Index (RSI) stands at 65.17, indicating bullish momentum.

Relationship with Key Moving Averages
For Nifty 50, the closing price is above the 50 EMA and 10 EMA, which indicates a potential upward trend. However, it is slightly below the 200 EMA, suggesting caution for long-term trends. The RSI is moderately high at 65.17, indicating momentum.
Moving Averages Trend (MACD)
The Nifty 50's MACD value of 367.84 being significantly higher than the MACD Signal of 291.98 suggests bullish momentum. This indicates potential upward momentum, but investors should also consider other indicators for a comprehensive analysis.

RSI Analysis
Nifty 50 RSI Analysis: The Relative Strength Index (RSI) for Nifty 50 is at 65.17, indicating that the index is approaching overbought levels but is still in the bullish momentum zone. An RSI above 70 would typically signal overbought conditions, while a reading below 30 indicates oversold conditions.

Up Next

Global stock market indices: How the world markets performed today - 02 May 2025

Centre plans to borrow Rs 8.20 lakh cr from market in first half of FY27

Reliance denies buying Iranian oil amid US sanctions waiver

Premium petrol price up Rs 2, industrial diesel up Rs 22; no change in normal petrol, diesel rates

India's GDP expected to register over 8 pc growth in Sep-Dec: Report

Govt announces seven measures to help boost exports

More videos

RBI keeps interest rates on hold after US trade deal boosts outlook

RBI proposes to compensate customers up to Rs 25,000 loss due to fraud

RBI raises GDP growth projection of Q1, Q2 of FY27

RBI pauses rate cuts, retains interest rate at 5.25 pc

Rupee jumps 122 paise to close at 90.27 against US dollar on India-US trade deal

Stock markets cheer India-US trade deal: Sensex, Nifty surge 2.5 pc

UPI transactions hit record high of Rs 230 lakh crore in 2025-26 till Dec: Govt

Explained: India-US trade deal, tariffs and trade benefits

Trade deal with US adds momentum to India's growth ambition: Industry leaders

Rupee jumps 119 paise to 90.30 against the US dollar on India-US trade deal