


Highlights
- Indices like DJI and GSPC demonstrated strength
- RSI and MACD readings across indices highlight mixed sentiments
- Caution warranted due to some oversold conditions and weak momentum
Latest news

Emma Roberts to return for 'Aquamarine' TV series 20 years after original film

IBM unveils first sub-1 nm chip; Packs nearly 100 bn transistors into a space the size of fingernail

ZTE Showcases Full-Stack AI Capabilities at MWC Shanghai 2026, Empowering New Era of Token Operations

Tailorworks Introduces a Modern Approach to Bespoke Fashion for Today's Luxury Consumer

Zoey Deutch says having two Taylor Swift songs in 'Voicemails For Isabelle' "meant a lot" to her

PNB MetLife records 99.81 percent Individual Claim Settlement Ratio in FY26

"India-Israel FTA may be signed in very near future": Israel Embassy's Economic Division head Ofir Amami

When Should You Review Your Term Life Insurance Policy?
Global stock market indices: How the world markets performed today - 10 March 2025


The international stock market indices showed varied performances on March 10, 2025, reflecting the economic sentiment across different regions.
In this article, we analyze the performance of key global indices including the S&P 500, Dow Jones Industrial Average, NASDAQ Composite, FTSE 100, DAX, CAC 40, IBEX 35, Nikkei 225, Hang Seng, Nifty 50, and BSE Sensex.

Analysis for Sensex - March 10, 2025

The Sensex opened at 74,474.98 and closed at 74,115.17, marking a decline with a points change of -217.41, resulting in a percentage decrease of -0.29%. The index's Relative Strength Index (RSI) stands at 38.45, indicating potential bearish momentum, while the MACD displays a slight negative divergence from the MACD Signal.

Relationship with Key Moving Averages
The Sensex closed below its 50-day and 200-day EMAs, with a close of 74115.17 compared to the 50 EMA at 76283.23 and the 200 EMA at 77322.20, indicating a bearish trend. Additionally, the current close is slightly below the 10 EMA of 74241.66 but above the 20 EMA of 74877.38, suggesting short-term weakness with potential resistance at higher moving averages.
Moving Averages Trend (MACD)
The MACD value of -846.80 is lower than the MACD Signal value of -839.85, suggesting a bearish trend for Sensex. This indicates that momentum may be shifting downwards, and investors might expect further declines unless a reversal occurs.

RSI Analysis
The Relative Strength Index (RSI) for the Sensex is 38.45, which suggests that the index is approaching the oversold region. An RSI below 30 often indicates that the stock or index is oversold, while an RSI above 70 suggests it is overbought. At 38.45, the Sensex is closer to being oversold, reflecting potential downward momentum.

Analysis for Dow Jones Industrial Average (US) - March 10, 2025
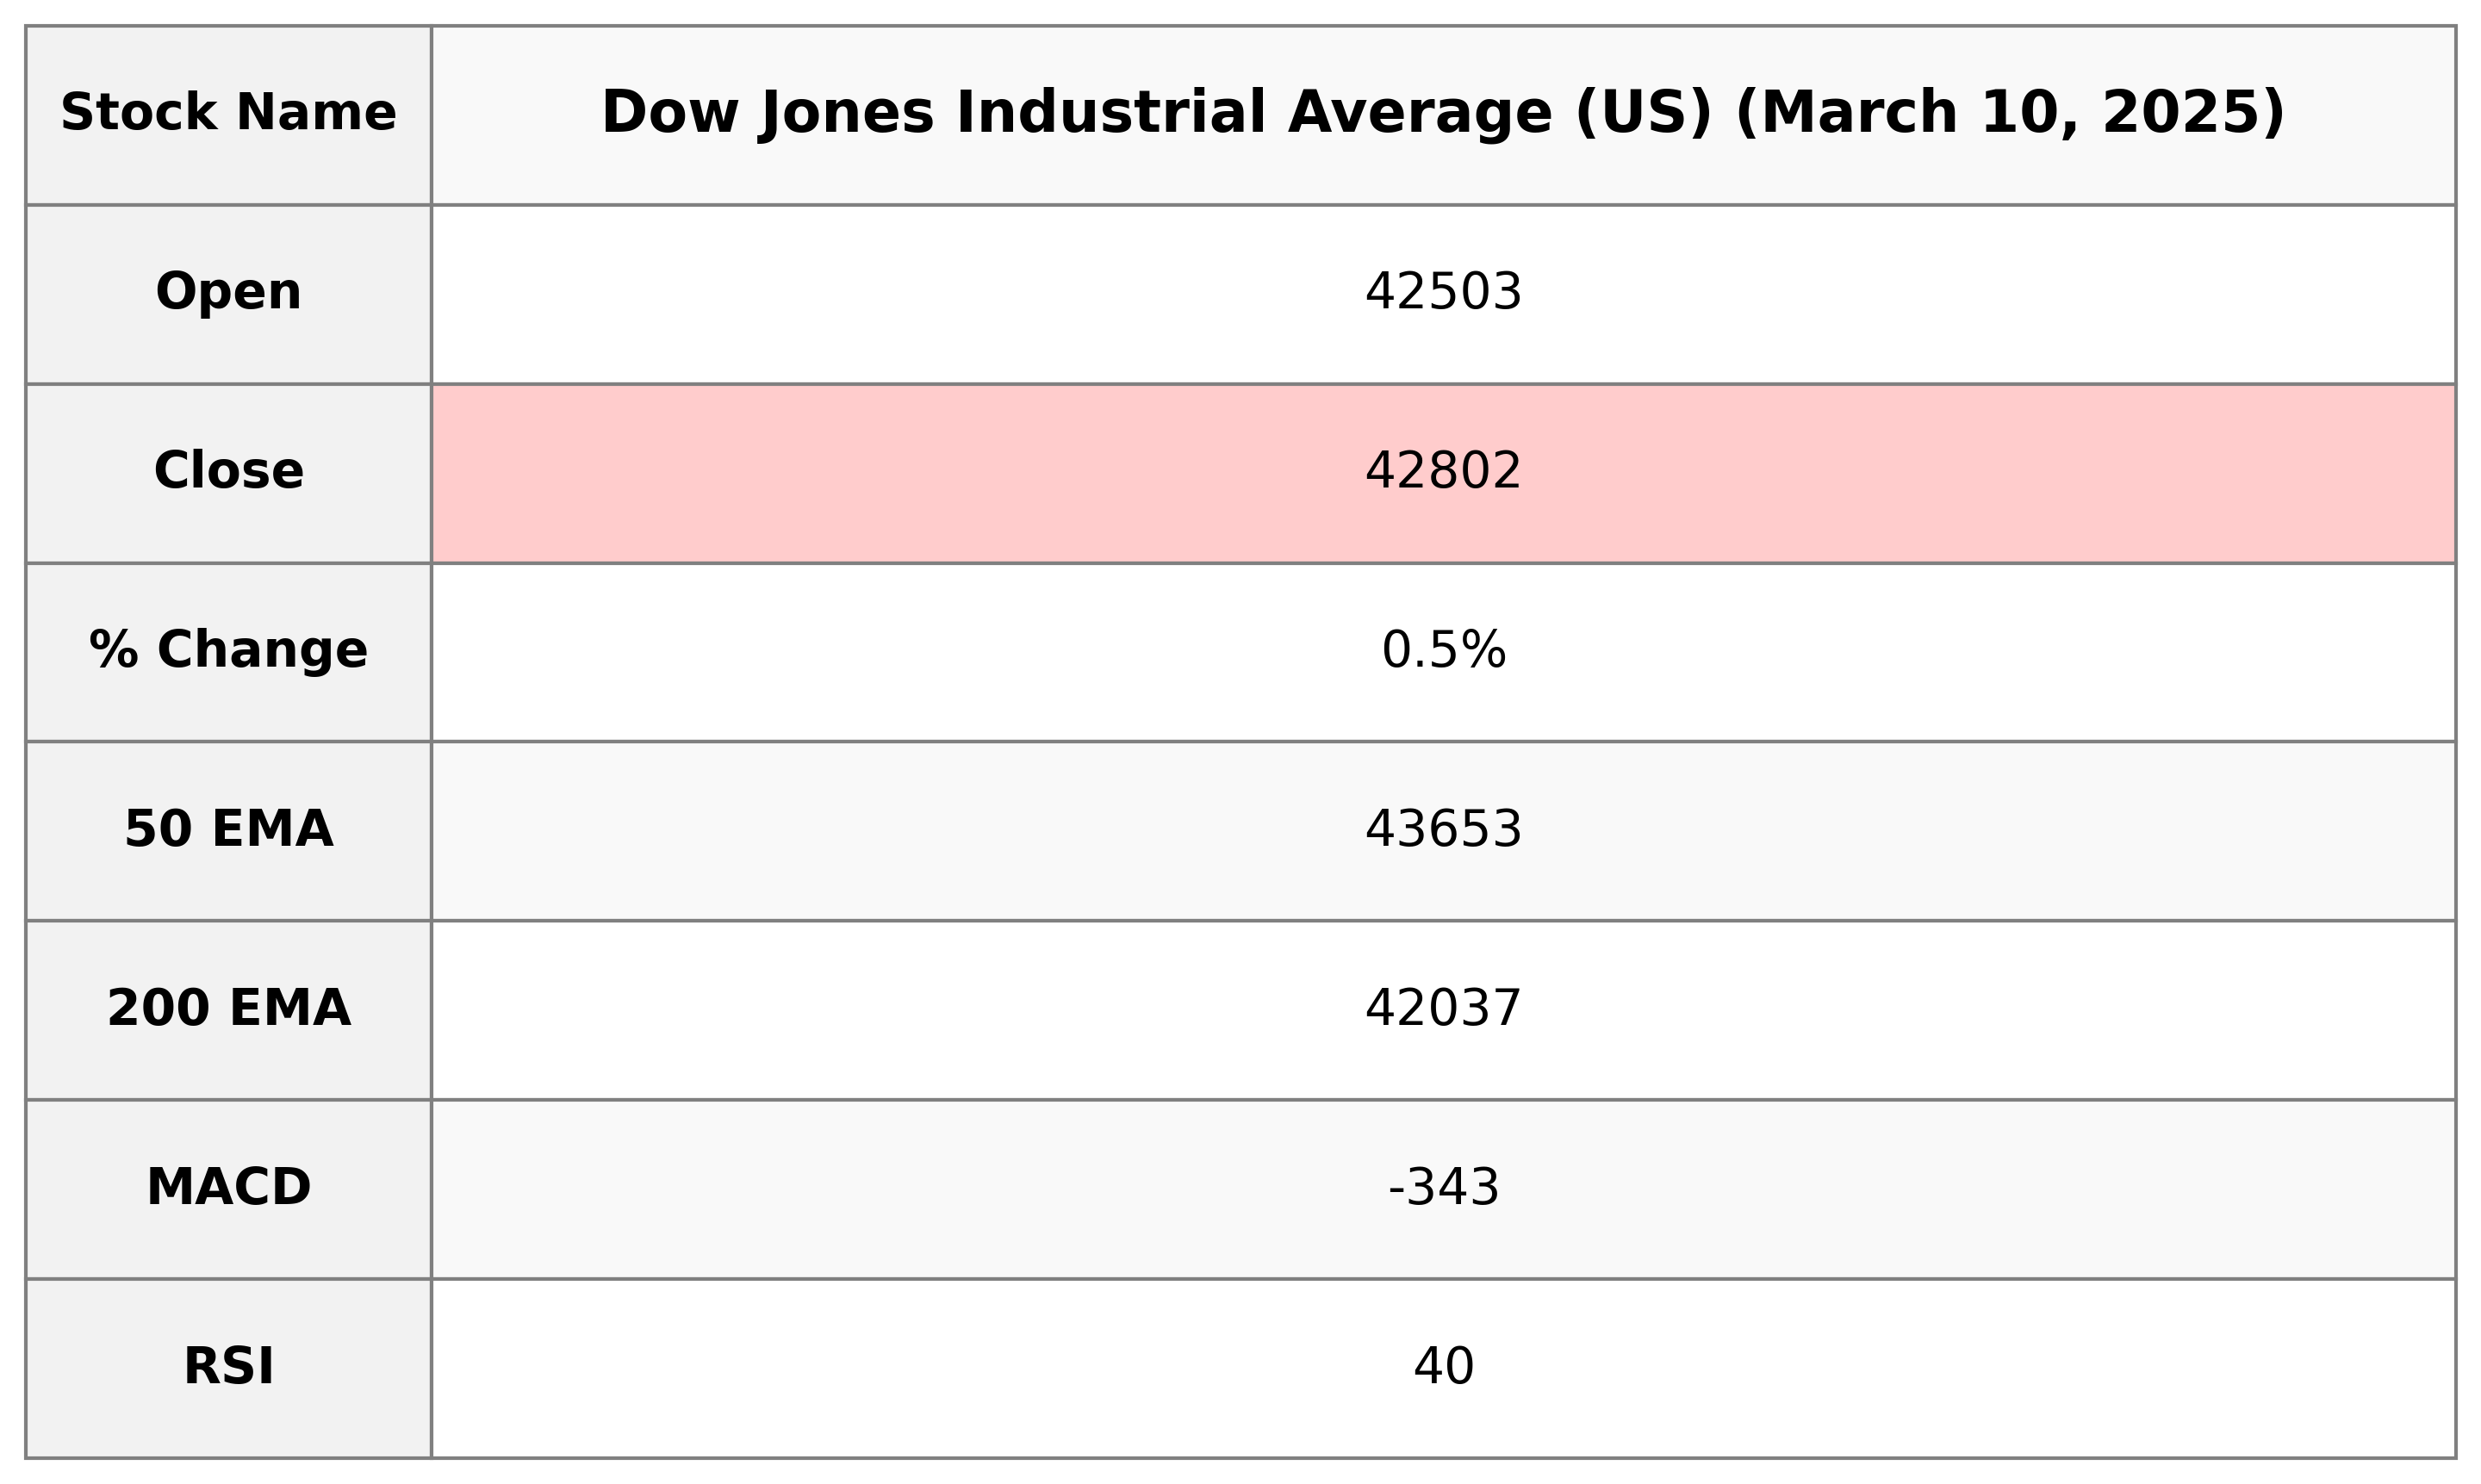
The Dow Jones Industrial Average (US) opened at 42,503.07 and closed at 42,801.72, marking a percentage gain of 0.52% with a points increase of 222.64. The RSI value of 40.45 suggests a neutral to near-oversold condition, and the MACD of -343.45 compared to the signal of -181.40 indicates potential bearish momentum.
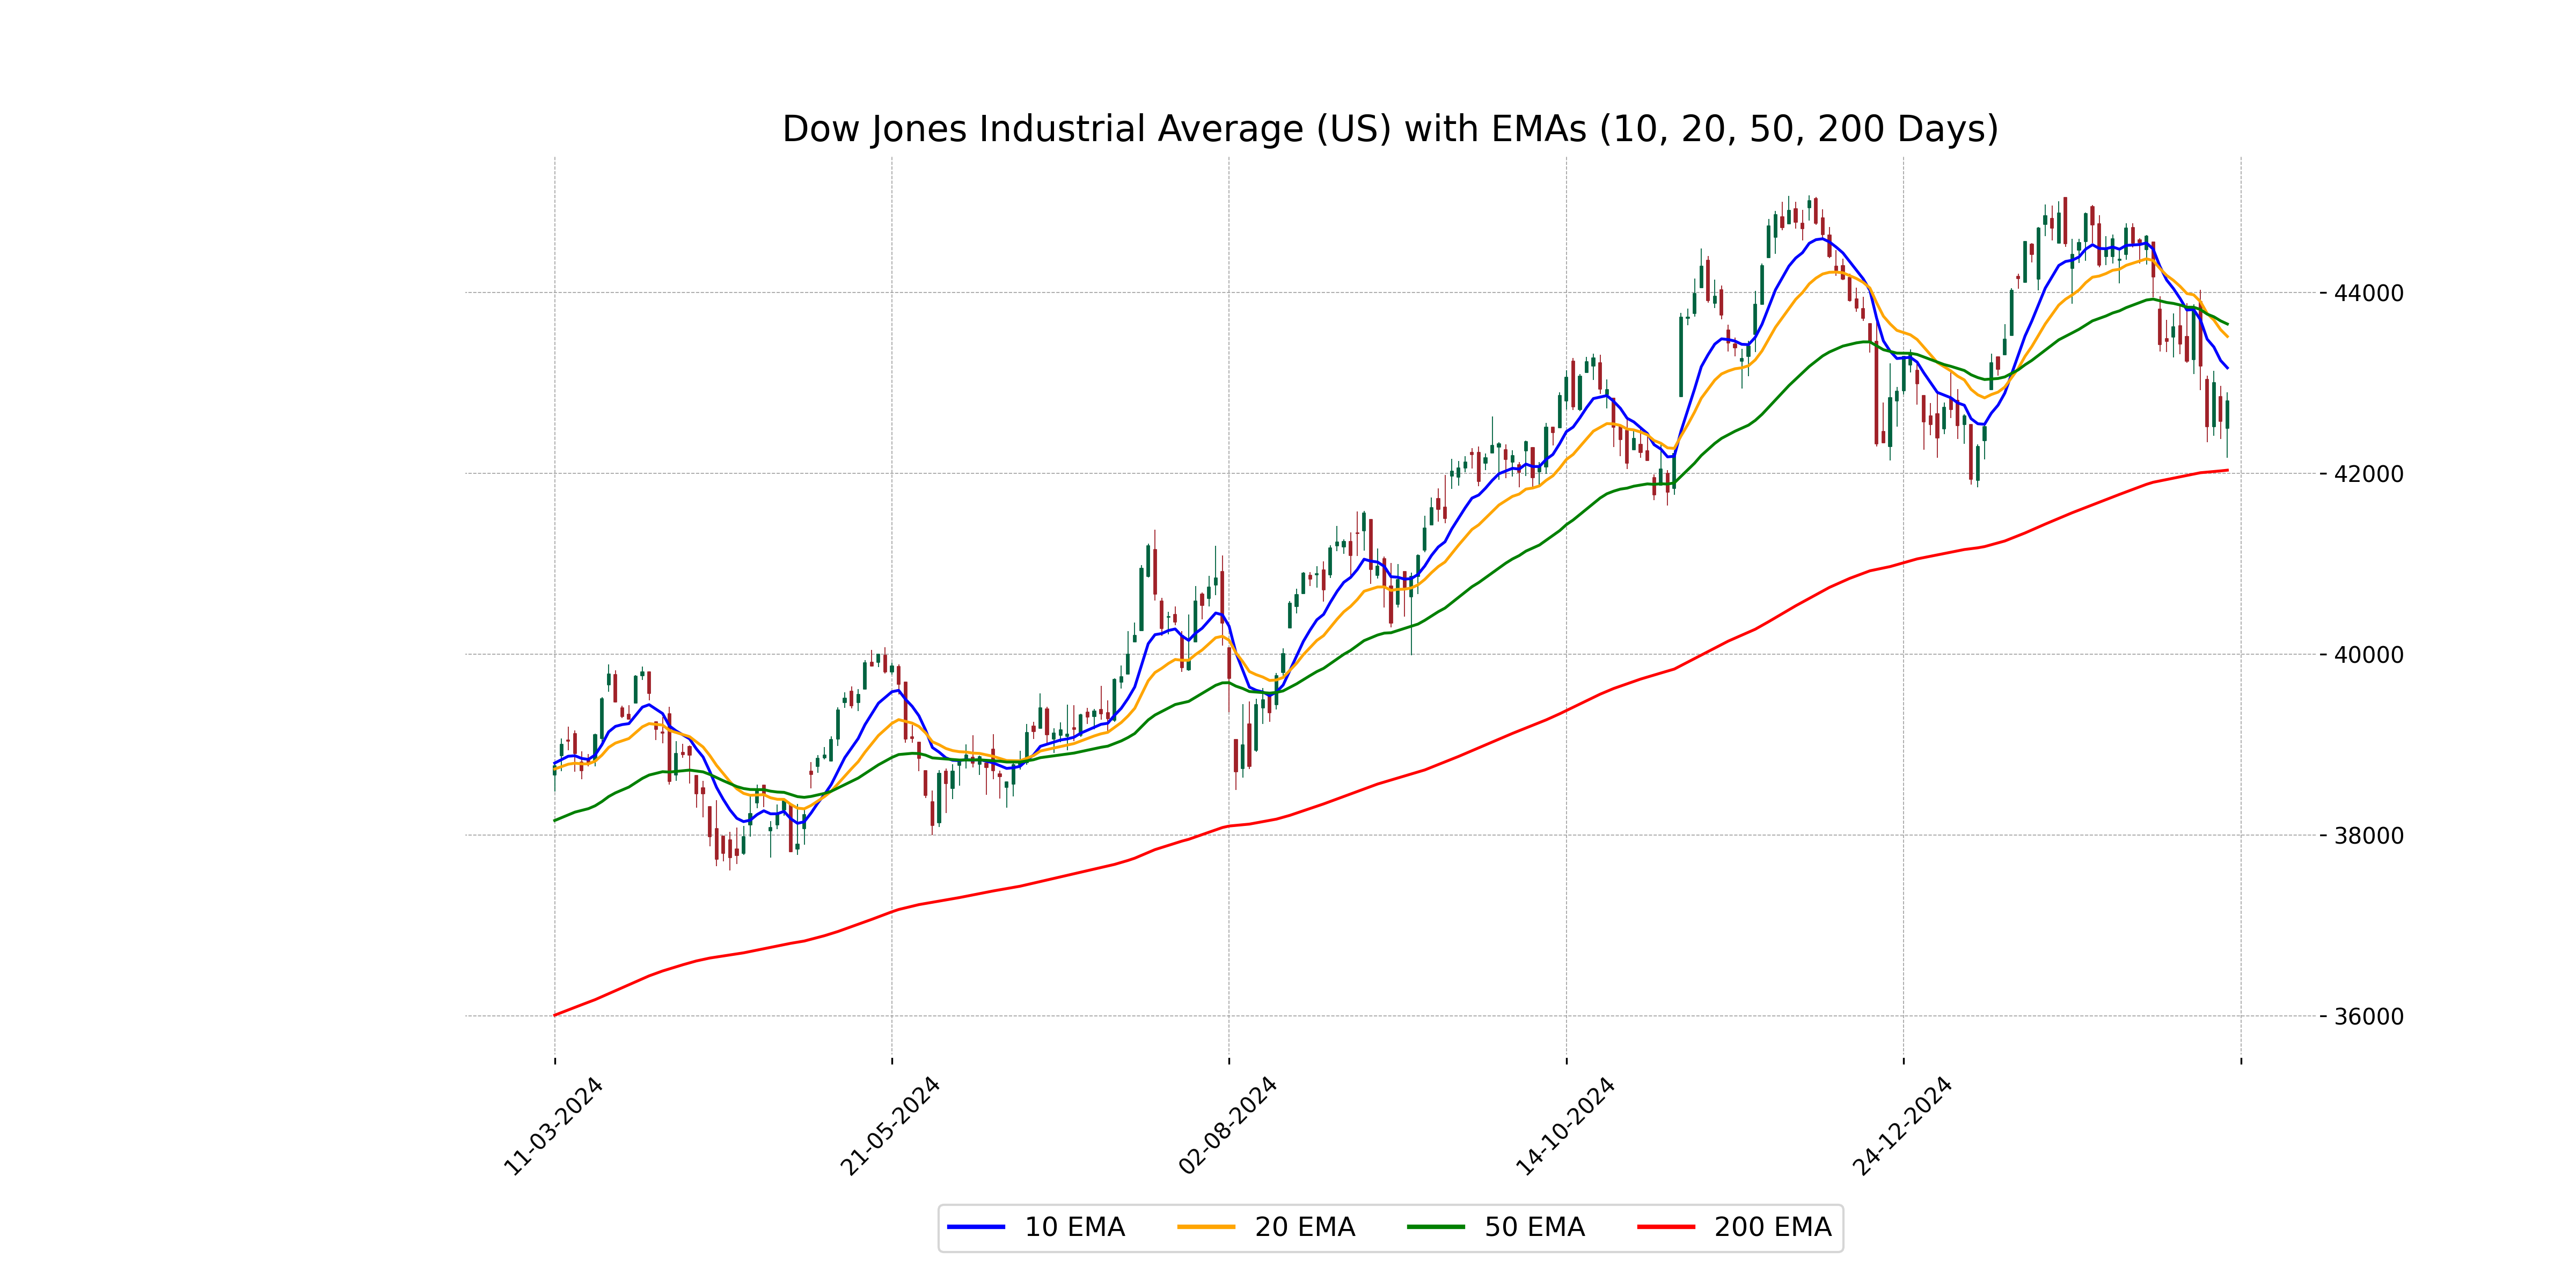
Relationship with Key Moving Averages
The Dow Jones Industrial Average closed at 42801.72, which is below its 50-day EMA of 43653.10 and 20-day EMA of 43515.38, but above the 200-day EMA of 42036.84. This suggests a short-term downtrend relative to the 50 and 20-day EMAs, while maintaining a longer-term upward trend above the 200-day EMA.
Moving Averages Trend (MACD)
The Dow Jones Industrial Average is exhibiting bearish momentum as indicated by a negative MACD of -343.45, which is below the MACD Signal line at -181.40. This suggests that the index may be facing downward pressure and potential bearish signals in the near term.

RSI Analysis
The Dow Jones Industrial Average currently has an RSI of 40.45, suggesting it is neither overbought nor oversold and is approaching oversold territory. This indicates potential weakness in the market, but not yet a strong sell or buy signal.

Analysis for CAC 40 (France) - March 10, 2025

CAC 40 (France) Performance Description: The CAC 40 index opened at 8161.53 and closed slightly lower at 8087.49, marking a decrease of 0.41% or 33.31 points compared to the previous close. The trading range for the day was between 8062.17 and 8174.59. The Relative Strength Index (RSI) is at 52.81, indicating a neutral sentiment, while the MACD is trending below the MACD Signal, suggesting potential bearish momentum.

Relationship with Key Moving Averages
The CAC 40 is trading below its 10 EMA of 8123.91, indicating short-term bearish momentum, and below its previous close, showing a recent decline. However, it's still above the 50 EMA of 7910.06 and 200 EMA of 7658.70, suggesting overall long-term bullish strength.
Moving Averages Trend (MACD)
The MACD value for CAC 40 is 67.99, while the MACD Signal line is 88.43. Since the MACD is below the Signal line, it suggests a bearish momentum for the index.

RSI Analysis
The RSI for CAC 40 is currently at 52.81, indicating a neutral position in the market dynamics. This suggests that the index is neither overbought nor oversold, and investors might remain on the lookout for further signals to assess forthcoming trends.

Analysis for FTSE 100 (UK) - March 10, 2025

FTSE 100 (UK) closed at 8645.82, a decrease of 0.39% from the previous close of 8679.90, with a points change of -34.08. The index experienced a daily high of 8700.79 and a low of 8624.95. The 50-EMA and 200-EMA stand at 8589.65 and 8310.43 respectively, indicating an upward trend in the medium to long-term average, while the RSI at 46.84 suggests a neutral strength in the current market.

Relationship with Key Moving Averages
The FTSE 100 opened below its 10 EMA and 20 EMA, indicating a short-term downtrend, as both are above the closing price of 8645.82. However, it remains above the 50 EMA and 200 EMA, suggesting that the index is still in a longer-term uptrend despite the recent dip.
Moving Averages Trend (MACD)
MACD Analysis for FTSE 100 (UK): The MACD is 34.13, while the MACD Signal is higher at 56.12, indicating a potential bearish signal as the MACD line is below the signal line. This suggests the possibility of downward momentum.

RSI Analysis
The FTSE 100 index has an RSI of 46.84, indicating that it is in a neutral zone and neither overbought nor oversold. This suggests that there isn't a strong momentum in either direction currently.

Analysis for DAX (Germany) - March 10, 2025

DAX (Germany) Performance: On the last trading day, the DAX opened at 23,163.78 and closed lower at 22,838.52, marking a decline of 0.74% from the previous close of 23,008.94, with a points drop of 170.42. The RSI is at 56.59, indicating a neutral momentum, while the MACD is slightly below the signal line, suggesting potential bearish sentiment.

Relationship with Key Moving Averages
The DAX (Germany) closed at 22,838.52, which is above both its 50-day EMA (21,787.34) and 200-day EMA (19,876.06), suggesting a bullish trend in a longer-term perspective. However, it is slightly below the 10-day EMA (22,827.15), indicating some possible short-term resistance.
Moving Averages Trend (MACD)
The MACD line for DAX (Germany) is currently at 384.33, which is below the MACD Signal line of 400.08. This suggests a bearish signal, indicating potential downward momentum in the market.

RSI Analysis
Based on the stock data provided, the DAX (Germany) has an RSI of approximately 56.59. This RSI value suggests that the index is neither overbought nor oversold, indicating a relatively neutral market momentum.

Analysis for S&P 500 (US) - March 10, 2025

S&P 500 (US) Performance: The S&P 500 opened at 5726.01, reached a high of 5783.01, and closed at 5770.20, reflecting a 0.55% increase with a points change of approximately 31.68 from the previous close of 5738.52. The RSI stands at 36.83, indicating potential oversold conditions, while the MACD is negative at -64.92, implying bearish momentum.

Relationship with Key Moving Averages
The S&P 500's current close of 5770.2002 is below its 50-day EMA of 5962.7488 and 10-day EMA of 5862.2374, indicating potential bearish sentiment in the short and medium term. However, it is slightly above the 200-day EMA of 5712.0015, suggesting some longer-term support.
Moving Averages Trend (MACD)
S&P 500 (US) is showing a bearish signal as the MACD value of -64.92 is below the MACD Signal of -33.23, indicating a potential downtrend. This suggests that the recent price action may be weakening, aligning with a bearish momentum scenario.

RSI Analysis
The relative strength index (RSI) for S&P 500 is 36.83, which suggests that the index is approaching oversold conditions. This typically indicates potential for a reversal or stabilization, as an RSI below 30 is generally considered oversold.

Analysis for Hang Seng Index (Hong Kong) - March 10, 2025

The Hang Seng Index opened at 24,115.98, reaching a high of 24,292.80 and a low of 23,632.42, before closing at 23,783.49. This marks a decrease of 1.85% from the previous close of 24,231.30, corresponding to a loss of 447.81 points. Technical indicators suggest the index is currently above key exponential moving averages, with an RSI of 63.13 indicating moderate momentum.

Relationship with Key Moving Averages
The Hang Seng Index is currently above its 50-day EMA of 21752.03 and 200-day EMA of 19813.87, indicating a potential upward trend despite today's decline. The index is slightly above the 10-day EMA of 23547.71, suggesting short-term momentum remains supportive.
Moving Averages Trend (MACD)
The Moving Average Convergence Divergence (MACD) line for the Hang Seng Index is slightly above the signal line, with values of 792.44 and 790.91 respectively, suggesting a bullish momentum. However, the small difference indicates the momentum could be weakening, warranting a cautious approach.

RSI Analysis
RSI Analysis: The Relative Strength Index (RSI) for the Hang Seng Index is 63.13, indicating a moderately strong performance. Typically, an RSI above 70 may suggest that the asset is overbought, while below 30 might indicate oversold conditions. In this case, the RSI suggests that the Hang Seng Index is near a balanced position but leaning more towards strength.

Analysis for IBEX 35 (Spain) - March 10, 2025

The IBEX 35 (Spain) opened at 13,260.70 and closed at 13,143.10, marking a percentage change of -0.86% and a point difference of -114. The index saw a high of 13,289.30 and a low of 13,061.20, with a trading volume of 43,776,189. The 50-day EMA was reported at 12,615.96, and the RSI stood at 58.64.

Relationship with Key Moving Averages
The IBEX 35 closed at 13143.10, which is above the 20 EMA (13035.47) but below the 10 EMA (13175.97). It is also above both the 50 EMA (12615.96) and the 200 EMA (11743.19), indicating a generally upward trend in the longer term.
Moving Averages Trend (MACD)
The MACD for IBEX 35 indicates a bearish divergence as it is currently below the MACD Signal line. This suggests a weakening upward momentum and potential selling pressure, as the MACD value is 216.46 compared to the MACD Signal of 251.27.

RSI Analysis
RSI Analysis for IBEX 35 (Spain): The relative strength index (RSI) for IBEX 35 is at 58.64, indicating that the index is in a neutral position and not in an overbought or oversold condition. This suggests a stable market sentiment with potential for upward or downward movement without immediate extremes.

Analysis for NASDAQ Composite (US) - March 10, 2025

The NASDAQ Composite closed at 18,196.22, showing a modest increase of 0.70% from the previous close of 18,069.26. Despite a strong trading volume of 8.13 billion, the index remains below its key moving averages, indicating potential bearish sentiment. Notably, the RSI at 34.58 suggests the market might be oversold, while the MACD indicates downward momentum.

Relationship with Key Moving Averages
The NASDAQ Composite closed at 18,196.22, which is below its 10-day EMA of 18,623.86, 20-day EMA of 18,977.52, 50-day EMA of 19,249.44, and 200-day EMA of 18,324.45. The current level suggests that the index is experiencing bearish momentum relative to these key moving averages.
Moving Averages Trend (MACD)
The MACD for NASDAQ Composite shows a negative value of -375.67, which is below its signal line at -234.00, indicating a bearish trend. This suggests that downward momentum could persist in the short term for the index.

RSI Analysis
NASDAQ Composite shows an RSI of 34.58, indicating that the index is approaching the oversold territory. This level suggests a potential buying opportunity as it nears the lower end of the RSI range. However, cautious analysis of other indicators and market conditions is essential for a comprehensive decision.

Analysis for Nikkei 225 (Japan) - March 10, 2025

Nikkei 225 (Japan) opened at 36,972.59, with a day's high of 37,113.48 and a low of 36,705.02, closing at 37,028.27. The index saw a slight increase of 0.38% from the previous close, showing a points change of 141.10. Despite a negative MACD of -519.94 and RSI at 36.19, the 50 EMA and 200 EMA remain higher than the current close, suggesting a bearish trend.

Relationship with Key Moving Averages
The closing price of the Nikkei 225 is 37,028.27, which is below the 10 EMA of 37,608.06, 20 EMA of 38,069.34, 50 EMA of 38,572.81, and 200 EMA of 38,255.63. This indicates a bearish trend as prices are trading below key moving averages.
Moving Averages Trend (MACD)
The MACD for Nikkei 225 indicates a bearish sentiment as the MACD line is lower than the signal line, with a value of -519.94 compared to -376.37. This suggests downward pressure on the market, as reflected by the negative difference, which could signal a continuation of the current downtrend.

RSI Analysis
RSI Analysis for Nikkei 225 (Japan): The RSI value for Nikkei 225 is 36.19, indicating that the index is nearing the oversold territory (below 30). This suggests potential bearish momentum, and traders may watch for any reversal signals to assess possible buying opportunities.

Analysis for Nifty Bank - March 10, 2025

Nifty Bank opened at 48,312.0 and closed at 48,216.80, reflecting a decrease of approximately 0.58% from the previous close of 48,497.5, with a points drop of 280.70. Technical indicators reveal a bearish trend with the price staying below 50 and 200 EMAs, a MACD below its signal line, and an RSI of 39.17, indicating potential overselling conditions.

Relationship with Key Moving Averages
The Nifty Bank closed below its 10-day, 20-day, 50-day, and 200-day EMAs, indicating a potential bearish trend. The RSI is at 39.17, suggesting it is nearing oversold territory and the MACD is below the signal line, reinforcing the bearish sentiment.
Moving Averages Trend (MACD)
The MACD for Nifty Bank is -337.58, which is below the MACD Signal of -306.05, suggesting a bearish trend. This indicates that the momentum may be shifting downwards, aligning with the negative % change observed in the stock's recent performance.

RSI Analysis
The Relative Strength Index (RSI) for Nifty Bank is 39.17, indicating that the stock is approaching the oversold territory. An RSI below 30 suggests that the stock might be oversold, which could potentially signal an opportunity for a price reversal or a buying opportunity if downward pressure persists.

Analysis for Nifty 50 - March 10, 2025

Nifty 50 experienced a decrease on the trading day with a closing value of 22,460.30, down by 0.41% from the previous close of 22,552.50, resulting in a points change of -92.20. The Relative Strength Index (RSI) is at 39.52, indicating weaker momentum, while the MACD remains slightly below its signal line. The index is trading below its 50-day and 200-day EMA, reflecting a bearish trend.

Relationship with Key Moving Averages
The Nifty 50 closed below both its 50-day EMA (23,093.47) and 200-day EMA (23,452.73), indicating a potential bearish trend. The current close (22,460.30) is also below the 10-day EMA (22,483.59) and 20-day EMA (22,665.12), suggesting short-term downward momentum.
Moving Averages Trend (MACD)
The MACD for Nifty 50 is negative at -247.11, which generally indicates a bearish trend. However, the MACD Signal is lower at -253.38, suggesting a potential convergence. Given the RSI of 39.52, which is below the neutral level of 50, the bearish sentiment might continue unless momentum shifts.

RSI Analysis
The Relative Strength Index (RSI) for Nifty 50 is at 39.52, indicating that the index is nearing oversold territory. An RSI below 30 typically suggests an oversold condition, while above 70 indicates overbought conditions, implying potential for a rebound if the trend continues downward.

Up Next
Global stock market indices: How the world markets performed today - 10 March 2025

Step-by-step guide to apply for a mortgage loan online with minimal documentation

Honda Activa 6G: Everything You Need to Know Before Buying

How much does a ULIP plan really cost? A break-down of all charges

Centre plans to borrow Rs 8.20 lakh cr from market in first half of FY27

Reliance denies buying Iranian oil amid US sanctions waiver

More videos

Premium petrol price up Rs 2, industrial diesel up Rs 22; no change in normal petrol, diesel rates

India's GDP expected to register over 8 pc growth in Sep-Dec: Report

Govt announces seven measures to help boost exports

RBI keeps interest rates on hold after US trade deal boosts outlook

RBI proposes to compensate customers up to Rs 25,000 loss due to fraud

RBI raises GDP growth projection of Q1, Q2 of FY27

RBI pauses rate cuts, retains interest rate at 5.25 pc

Rupee jumps 122 paise to close at 90.27 against US dollar on India-US trade deal

Stock markets cheer India-US trade deal: Sensex, Nifty surge 2.5 pc

UPI transactions hit record high of Rs 230 lakh crore in 2025-26 till Dec: Govt