


Highlights
- Market sentiment leaned towards a downtrend
- RSI for several indices suggested oversold conditions
- Market participants are advised to proceed with caution
Latest news

Attack on judicial officers 'black spot' in country's history, 'TMC goons' acted at CM's behest: BJP

AAP alleges irregularities in Gujarat exam system, raises concerns over paper leak case

AAP alleges police harassment of workers ahead of Gujarat local elections

AAP's Isudan Gadhvi alleges false FIRs after arrest during protest in Gujarat

Samsung Galaxy Buds4 Pro Review: Flagship Sound Meets Elite ANC

Realme 16 5G Review: Endurance Meets Everyday Use

Vivo V70 FE Review: Style Meets Serious Battery Power

Galgotias University Hosts 10th Convocation Ceremony; Leaders Highlight Resilience, Discipline, and Lifelong Learning
Global stock market indices: How the world markets performed today - 04 March 2025


The international stock market indices showed varied performances on March 04, 2025, reflecting the economic sentiment across different regions.
In this article, we analyze the performance of key global indices including the S&P 500, Dow Jones Industrial Average, NASDAQ Composite, FTSE 100, DAX, CAC 40, IBEX 35, Nikkei 225, Hang Seng, Nifty 50, and BSE Sensex.

Analysis for Sensex - March 04, 2025

The Sensex opened at 72,817.34 and closed slightly lower at 72,989.93, reflecting a decrease of 0.13% or 96.01 points. The indicators, such as the RSI at 23.50, suggest oversold conditions, and the MACD at -1027.26 shows bearish momentum compared to its signal. The trading volume for this session was zero, and other market capitalization metrics are not available.

Relationship with Key Moving Averages
The Sensex closed at 72,989.93, which is below its 50-day EMA of 76,656.01 and 200-day EMA of 77,451.51, indicating a bearish trend. It is also below its 10-day EMA of 74,349.71 and 20-day EMA of 75,239.04, further suggesting short-term downward momentum.
Moving Averages Trend (MACD)
Sensex MACD Analysis: The MACD value for Sensex is -1027.26, with the MACD Signal line at -737.75. A negative MACD value combined with a MACD value lower than the signal line suggests a bearish momentum in the market.

RSI Analysis
The RSI (Relative Strength Index) for Sensex is currently at 23.50, which indicates that it is in an oversold condition. An RSI below 30 typically suggests that the stock may be undervalued and could be a potential buying opportunity for investors.

Analysis for Dow Jones Industrial Average (US) - March 04, 2025

Dow Jones Industrial Average (US) opened at 43,900.49 and closed at 43,191.24, marking a decrease of 649.67 points or -1.48%. The Relative Strength Index (RSI) is at 40.31, suggesting bearish sentiment in the market. The index's MACD of -156.68 indicates a downward trend when compared to the MACD Signal of -2.67.

Relationship with Key Moving Averages
The Dow Jones Industrial Average is trading below its 50-day EMA (43,813.44) and 20-day EMA (43,901.07), indicating short-term bearish momentum. Additionally, trading below the 10-day EMA (43,700.50) suggests downward pressure in the very short term.
Moving Averages Trend (MACD)
The MACD for the Dow Jones Industrial Average is currently -156.68, indicating a bearish sentiment, as it is below the MACD Signal line at -2.67. This suggests that the recent trend has been downward, and the MACD crossing below the Signal line supports this bearish outlook.

RSI Analysis
Based on the provided stock data for the Dow Jones Industrial Average, the RSI is at 40.31. This indicates that the index is in the lower neutral range, suggesting potential weakness, but it is not yet in the oversold territory. Further declines could lead to an oversold condition if the RSI drops below 30.

Analysis for CAC 40 (France) - March 04, 2025

CAC 40 (France) opened at 8112.13, reaching a high of 8136.27 and closing at 8090.03, marking a decrease of 109.68 points from the previous close. The percentage change stands at -1.34%, indicating a downward trend. The RSI is at 55.49, suggesting a neutral market, while the MACD at 86.69 is below the signal line, highlighting potential bearish momentum.

Relationship with Key Moving Averages
The CAC 40 index closed at 8090.03, which is below its 10-day EMA of 8116.27 but above both its 50-day EMA of 7871.24 and 200-day EMA of 7639.23. This suggests short-term bearish pressure but maintains a longer-term bullish trend as it remains above key longer-term averages.
Moving Averages Trend (MACD)
Based on the MACD analysis for CAC 40 (France), the MACD value of 86.69 is below the MACD Signal line at 106.63, suggesting a bearish signal. This indicates a potential for continued downward price momentum.

RSI Analysis
The RSI (Relative Strength Index) for the CAC 40 is currently at 55.49, indicating a neutral market sentiment. Typically, an RSI above 70 suggests the market is overbought, while below 30 indicates oversold conditions; thus, the CAC 40 is neither overbought nor oversold at this level.

Analysis for FTSE 100 (UK) - March 04, 2025

The FTSE 100 (UK) opened at 8871.31 and closed at 8841.18, showing a slight decline with a percentage change of -0.34% and a points change of -30.12. The Relative Strength Index (RSI) stands at 66.47, indicating relatively strong performance, while the Moving Average Convergence Divergence (MACD) is slightly above its signal, suggesting a possible positive momentum.

Relationship with Key Moving Averages
The FTSE 100's closing price of 8841.18 is above both its 50-day EMA of 8575.56 and 200-day EMA of 8295.68, indicating a potential bullish trend. However, it is slightly above the 10-day EMA of 8769.55 and 20-day EMA of 8718.21, suggesting a recent upward momentum.
Moving Averages Trend (MACD)
### MACD Analysis for FTSE 100 (UK) The MACD value of 73.11 is above the signal line at 72.45, suggesting a bullish trend continuation. This indicates potential upward momentum in the market.

RSI Analysis
The Relative Strength Index (RSI) for the FTSE 100 is at 66.47. This value is close to the upper threshold, indicating that the market may be approaching overbought conditions, suggesting potential downward pressure if it exceeds 70. Generally, RSI values above 70 indicate overbought conditions, while values below 30 indicate oversold conditions.

Analysis for DAX (Germany) - March 04, 2025

The DAX (Germany) index opened at 22,852.72 and closed at 22,681.45, showing a decline of -2.01% with a points change of -465.57. The RSI stands at 59.94, suggesting relatively neutral momentum, while the MACD is slightly below the signal line, indicating a potential shift in trend.

Relationship with Key Moving Averages
The closing price for DAX (Germany) at 22,681.45 is below both the 50-day EMA of 21,576.71 and the 10-day EMA of 22,609.37, suggesting a short-term bearish trend. However, it remains above the 200-day EMA of 19,748.27, indicating a longer-term bullish perspective.
Moving Averages Trend (MACD)
MACD Analysis for DAX (Germany) based on Stock Data: The MACD for DAX is currently at 387.90 while the MACD Signal is at 410.15, indicating a bearish signal as the MACD line is below the signal line. This suggests a potential downtrend or weakening momentum.

RSI Analysis
RSI Analysis for DAX (Germany): The RSI (Relative Strength Index) for DAX is currently at 59.94, suggesting a neutral to slightly bullish momentum as it is close to the midpoint of the typical RSI range of 30 to 70. This indicates that the index is not currently in overbought or oversold territory, but could be closely monitored for potential shifts in momentum.

Analysis for S&P 500 (US) - March 04, 2025

The S&P 500 (US) opened at 5968.33, reaching a high of 5986.09 and a low of 5810.91, before closing at 5849.72. It experienced a decrease of approximately 1.76% from the previous close, with a change of -104.78 points. The current RSI stands at 37.16, suggesting that the index may be approaching an oversold condition.

Relationship with Key Moving Averages
The S&P 500 closed at 5849.72, which is below its 50-day EMA of 5994.16 and 20-day EMA of 5999.08, indicating a possible short-term downtrend. Additionally, it is above its 200-day EMA of 5709.06, suggesting that the long-term bullish trend may still be intact despite the recent dip.
Moving Averages Trend (MACD)
MACD Analysis for S&P 500 (US): The MACD value of -28.35, which is significantly lower than the MACD Signal line value of -1.18, indicates a potential bearish trend. This suggests downward momentum as the MACD line is diverging below the signal line.

RSI Analysis
The RSI for S&P 500 is 37.16, indicating a bearish sentiment as it is below the neutral 50 level. This suggests the index may be oversold and could potentially see a reversal or continuation of the downtrend if RSI approaches the 30 mark.

Analysis for Hang Seng Index (Hong Kong) - March 04, 2025

Hang Seng Index opened at 22,678.25 and closed lower at 22,941.77, with a percent decline of -0.28% and a points change of -64.5. Despite the negative trend, the RSI indicates a moderately strong market sentiment at 60.72, and the index trades above its 50 and 200-day EMAs.

Relationship with Key Moving Averages
The Hang Seng Index closed at 22941.77, slightly below its 10-day EMA of 22991.54, indicating potential short-term weakness. However, it remains well above its 50-day EMA of 21362.53 and 200-day EMA of 19643.11, suggesting an overall positive longer-term trend.
Moving Averages Trend (MACD)
The Hang Seng Index's MACD is currently at 743.13, which is below its MACD Signal of 788.30. This suggests a potential bearish trend as the MACD line is below the signal line, indicating a possible downward momentum.

RSI Analysis
For the Hang Seng Index (Hong Kong), the RSI value is 60.72, suggesting that the index is approaching overbought territory. This indicator reflects a potential consolidation or minor pullback if the trend continues without a strong upward movement.

Analysis for IBEX 35 (Spain) - March 04, 2025

The IBEX 35 index in Spain opened at 13,255.10, reached a high of 13,281.90, and closed at 13,069.40, marking a decrease of 2.27% from the previous close. The volume recorded was 67,772,426 with a noticeable points change of -303.70. The 10-day EMA is 13,144.96 while the RSI stands at 59.30, indicating relatively stable momentum despite the drop.

Relationship with Key Moving Averages
The IBEX 35 is trading below its 10 EMA of 13144.96, indicating a short-term bearish sentiment. It is, however, above the 50 EMA of 12514.15, suggesting some resilience in a slightly longer timeframe. The index remains substantially above the 200 EMA of 11683.45, pointing to a broader underlying bullish trend.
Moving Averages Trend (MACD)
The MACD value of 266.81 for IBEX 35 is slightly below its MACD Signal line of 277.26, indicating a potential bearish signal as the momentum might be shifting downwards. Monitoring if the MACD continues to diverge further below the signal line could provide insights into future price movements.

RSI Analysis
The RSI for IBEX 35 is 59.30, indicating a neutral trend as it is between the typical overbought and oversold thresholds (70 and 30, respectively). This suggests that the market is neither in a strong buying nor selling position at the moment.

Analysis for NASDAQ Composite (US) - March 04, 2025

The NASDAQ Composite (US) saw a decline with a closing value of 18,350.19, down from the previous close of 18,847.28, resulting in a percentage change of -2.64%. The index had a trading range with a high of 18,992.30 and a low of 18,216.63. The Relative Strength Index (RSI) stands at 31.97, indicating the market's oversold condition.

Relationship with Key Moving Averages
The NASDAQ Composite closed below its 50 EMA and 20 EMA, indicating potential bearish momentum, with a close price of 18350.19 against the 50 EMA of 19419.05 and the 20 EMA of 19327.66. However, it is trading near the 200 EMA, which is at 18326.18, suggesting a critical support level.
Moving Averages Trend (MACD)
The NASDAQ Composite is exhibiting bearish momentum as indicated by the negative MACD of -238.018 and the MACD Signal of -82.306. The downward crossover and negative MACD value suggest potential further declines.

RSI Analysis
The RSI of NASDAQ Composite (US) stands at 31.97, indicating that the index is approaching oversold territory. This could suggest potential undervaluation and a possibility of a price reversal if buying interest emerges.

Analysis for Nikkei 225 (Japan) - March 04, 2025
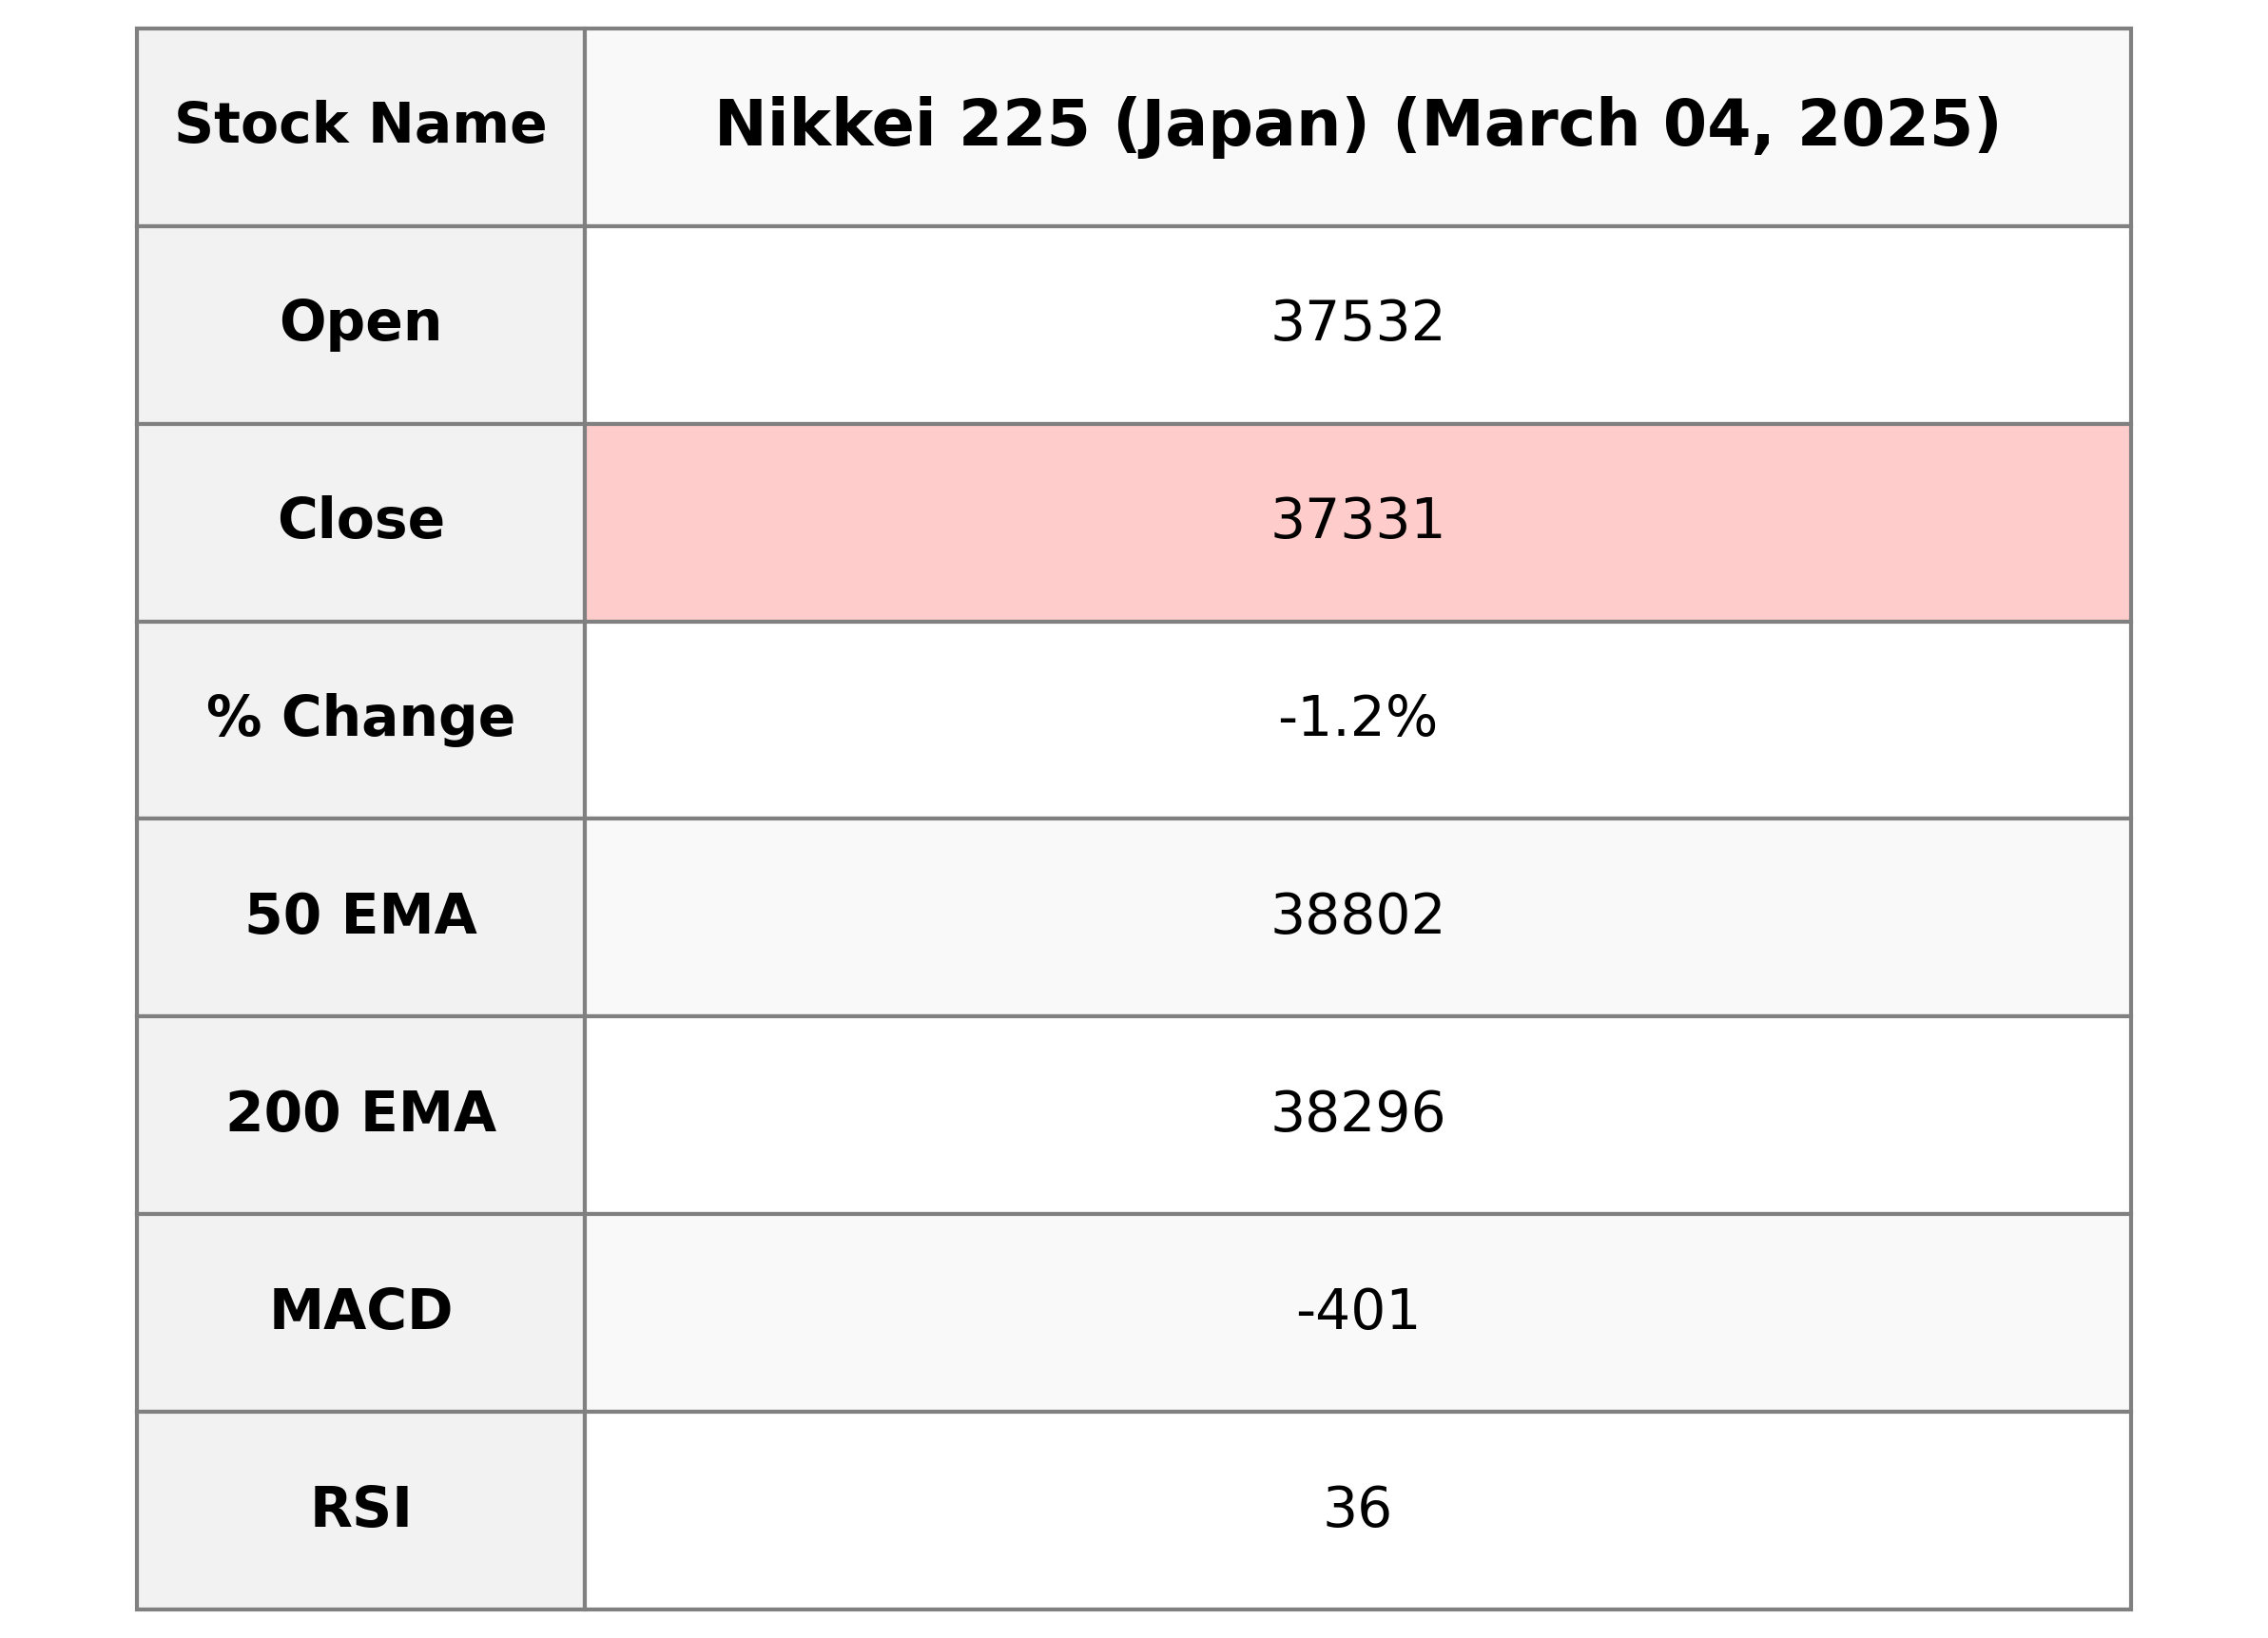
The Nikkei 225 in Japan experienced a decline, with a closing value of 37,331.18, down 1.20% or 454.29 points from the previous close of 37,785.47. Technical indicators suggest bearish momentum, as indicated by an RSI of 35.71 and a negative MACD of -401.39, while the stock is trading below its short-term and long-term moving averages.

Relationship with Key Moving Averages
The Nikkei 225 is trading below its key moving averages, with the current close of 37,331.18, below the 50 EMA at 38,802.42, the 200 EMA at 38,295.91, the 10 EMA at 38,098.49, and the 20 EMA at 38,480.25. This indicates a bearish sentiment as the index is underperforming compared to these benchmarks. The negative MACD value of -401.39 further supports the bearish trend.
Moving Averages Trend (MACD)
The MACD analysis for Nikkei 225 indicates bearish momentum as the MACD value of -401.39 is below the signal line value of -229.67. This suggests a potential downtrend continuation. Additionally, a low RSI of 35.71 supports the bearish sentiment, indicating that the index is nearing oversold territory.

RSI Analysis
The RSI value of 35.71 for Nikkei 225 indicates that the index is nearing oversold territory, suggesting a potential undervaluation. This could imply a possible buying opportunity if the downward trend reverses, although further analysis would be required to make a conclusive decision.

Analysis for Nifty Bank - March 04, 2025

The Nifty Bank index opened at 47,942.5 and closed at 48,245.2, marking a slight gain of 0.27%. The index recorded a points increase of 130.9 from the previous close of 48,114.3. The RSI value of 38.02 suggests it's currently in the oversold territory, and the negative MACD indicates a bearish trend.

Relationship with Key Moving Averages
The closing price of Nifty Bank is 48,245.20, which is below its key moving averages: the 50-day EMA of 49,618.08, the 200-day EMA of 50,039.51, the 10-day EMA of 48,671.06, and the 20-day EMA of 48,971.83. This indicates a bearish trend relative to these averages.
Moving Averages Trend (MACD)
The MACD analysis for Nifty Bank shows that the MACD value is -360.66, while the MACD Signal is -261.78. This indicates a bearish trend as the MACD line is below the signal line, suggesting possible continued downward momentum.

RSI Analysis
RSI Analysis for Nifty Bank: The Relative Strength Index (RSI) for Nifty Bank is at 38.02, indicating that the stock is approaching the oversold territory. This suggests that the current selling pressure may be easing, potentially signaling a buying opportunity if other indicators confirm.

Analysis for Nifty 50 - March 04, 2025

The Nifty 50 index closed at 22,082.65, experiencing a slight decline of 0.17% from the previous close of 22,119.30. The market showed volatility with a day's high of 22,105.05 and a low of 21,964.60. Technical indicators suggest a bearish trend, with the RSI at 22.43 indicating oversold conditions, and the MACD at -315.05 underscoring a downward momentum.

Relationship with Key Moving Averages
The Nifty 50 is trading below its 10 EMA (22486.08), 20 EMA (22757.23), and 50 EMA (23200.71), as well as the 200 EMA (23492.37), indicating a bearish trend. With an RSI of 22.43, it is in the oversold territory, further supporting a weak momentum outlook.
Moving Averages Trend (MACD)
The MACD value for Nifty 50 is significantly below the MACD Signal, indicating a strong bearish trend. With a MACD of -315.05 compared to the MACD Signal of -229.91, this suggests negative momentum in the index. Investors should be cautious as the MACD indicates potential further downside.

RSI Analysis
Nifty 50 RSI Analysis: The RSI for Nifty 50 is currently at 22.43, which indicates that the index is in the oversold territory. Generally, an RSI below 30 suggests that the stock or index might be undervalued and could be due for a corrective bounce or reversal.

Up Next
Global stock market indices: How the world markets performed today - 04 March 2025

Centre plans to borrow Rs 8.20 lakh cr from market in first half of FY27

Reliance denies buying Iranian oil amid US sanctions waiver

Premium petrol price up Rs 2, industrial diesel up Rs 22; no change in normal petrol, diesel rates

India's GDP expected to register over 8 pc growth in Sep-Dec: Report

Govt announces seven measures to help boost exports

More videos

RBI keeps interest rates on hold after US trade deal boosts outlook

RBI proposes to compensate customers up to Rs 25,000 loss due to fraud

RBI raises GDP growth projection of Q1, Q2 of FY27

RBI pauses rate cuts, retains interest rate at 5.25 pc

Rupee jumps 122 paise to close at 90.27 against US dollar on India-US trade deal

Stock markets cheer India-US trade deal: Sensex, Nifty surge 2.5 pc

UPI transactions hit record high of Rs 230 lakh crore in 2025-26 till Dec: Govt

Explained: India-US trade deal, tariffs and trade benefits

Trade deal with US adds momentum to India's growth ambition: Industry leaders

Rupee jumps 119 paise to 90.30 against the US dollar on India-US trade deal