


Highlights
- Major indices close higher amid mixed momentum
- MACD trends suggest caution despite bullish EMAs
- RSI levels show neutral to bullish sentiment
Latest news

Samsung Galaxy Z Fold 8, Fold 8 Ultra & Z Flip 8: A More Mature Foldable Family

Dell Launches New Alienware 16X Aurora, 16 Area-51 and 18 Area-51 Gaming Laptops in India

Samsung Takes on Premium Home Audio With New Music Studio Series

The End of OxygenOS: OnePlus Confirms Shift to Oppo's ColorOS

Fujifilm Instax Mini Evo Cinema Review: A Hybrid Camera That Prints Memories Differently

iQOO Teases Z11 Lite With AI Tools, Military-Grade Durability and a 6500mAh Battery

Editorji Launches Hook Global, Its International Digital News Brand

Samsung's Bespoke AI ACs Focus on Humidity, Hygiene and Smarter Cooling
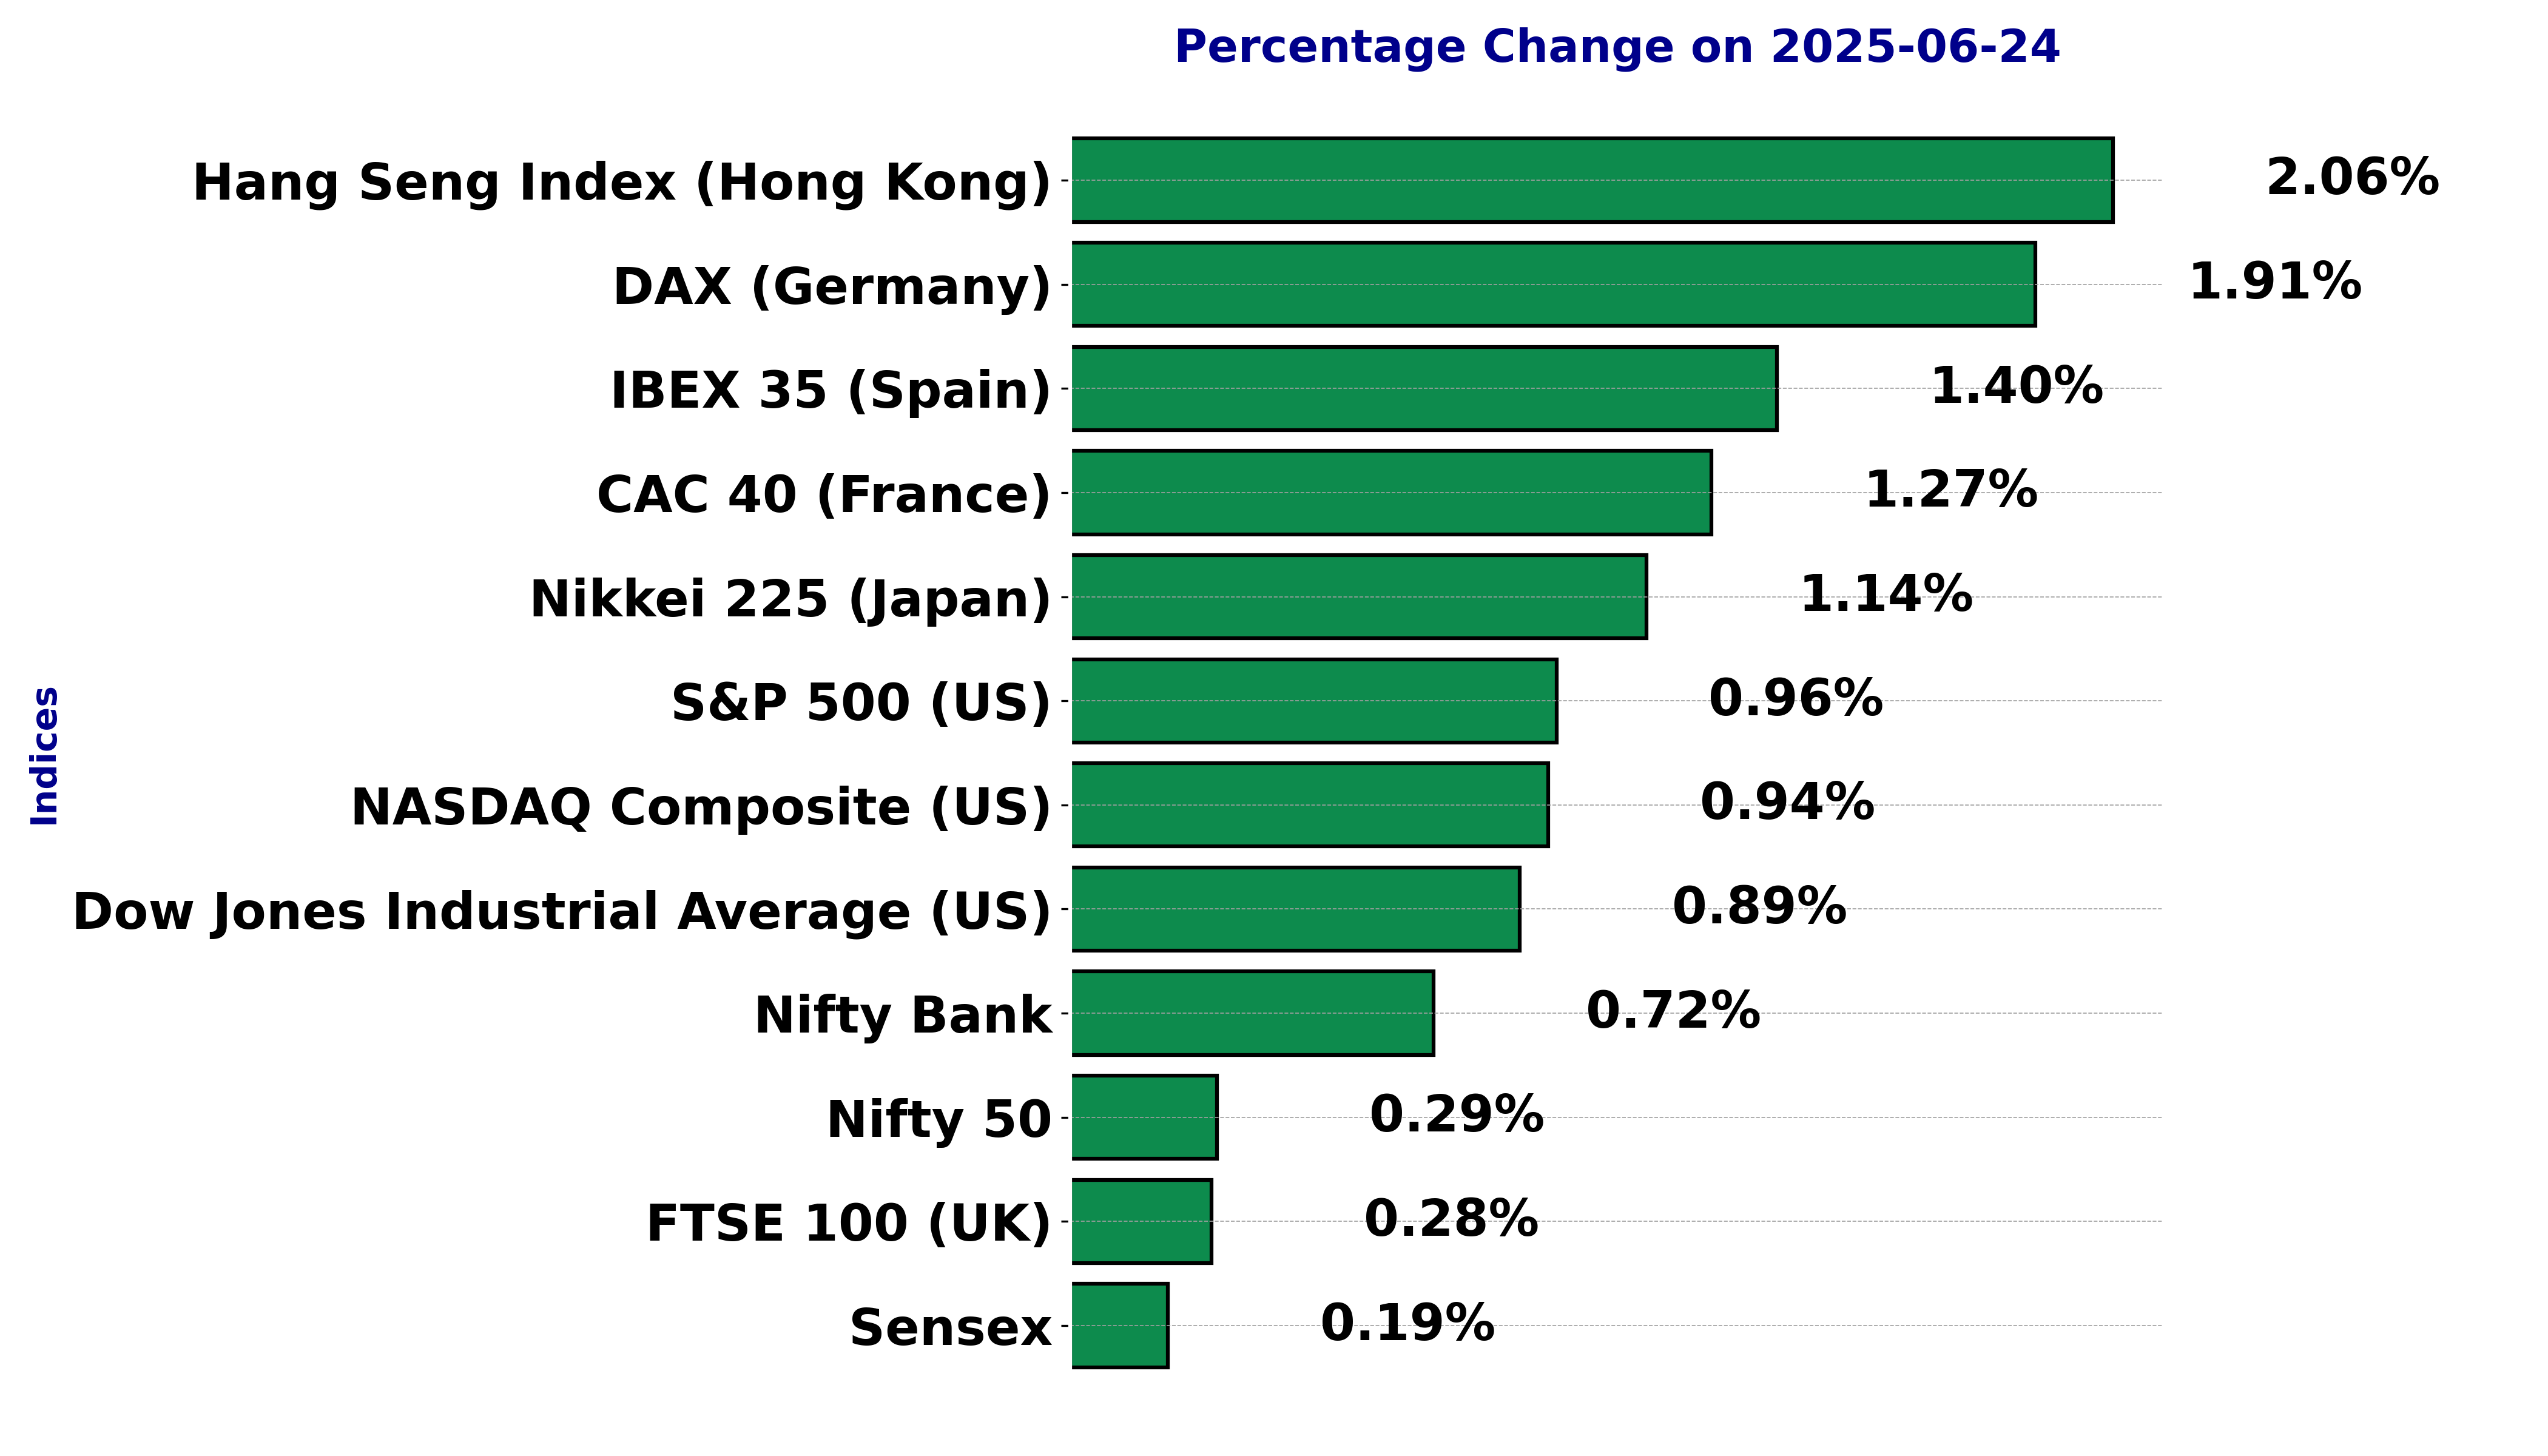
Global stock market indices: How the world markets performed today - 24 June 2025


The international stock market indices showed varied performances on June 24, 2025, reflecting the economic sentiment across different regions.
In this article, we analyze the performance of key global indices including the S&P 500, Dow Jones Industrial Average, NASDAQ Composite, FTSE 100, DAX, CAC 40, IBEX 35, Nikkei 225, Hang Seng, Nifty 50, and BSE Sensex.
Analysis for Sensex - June 24, 2025
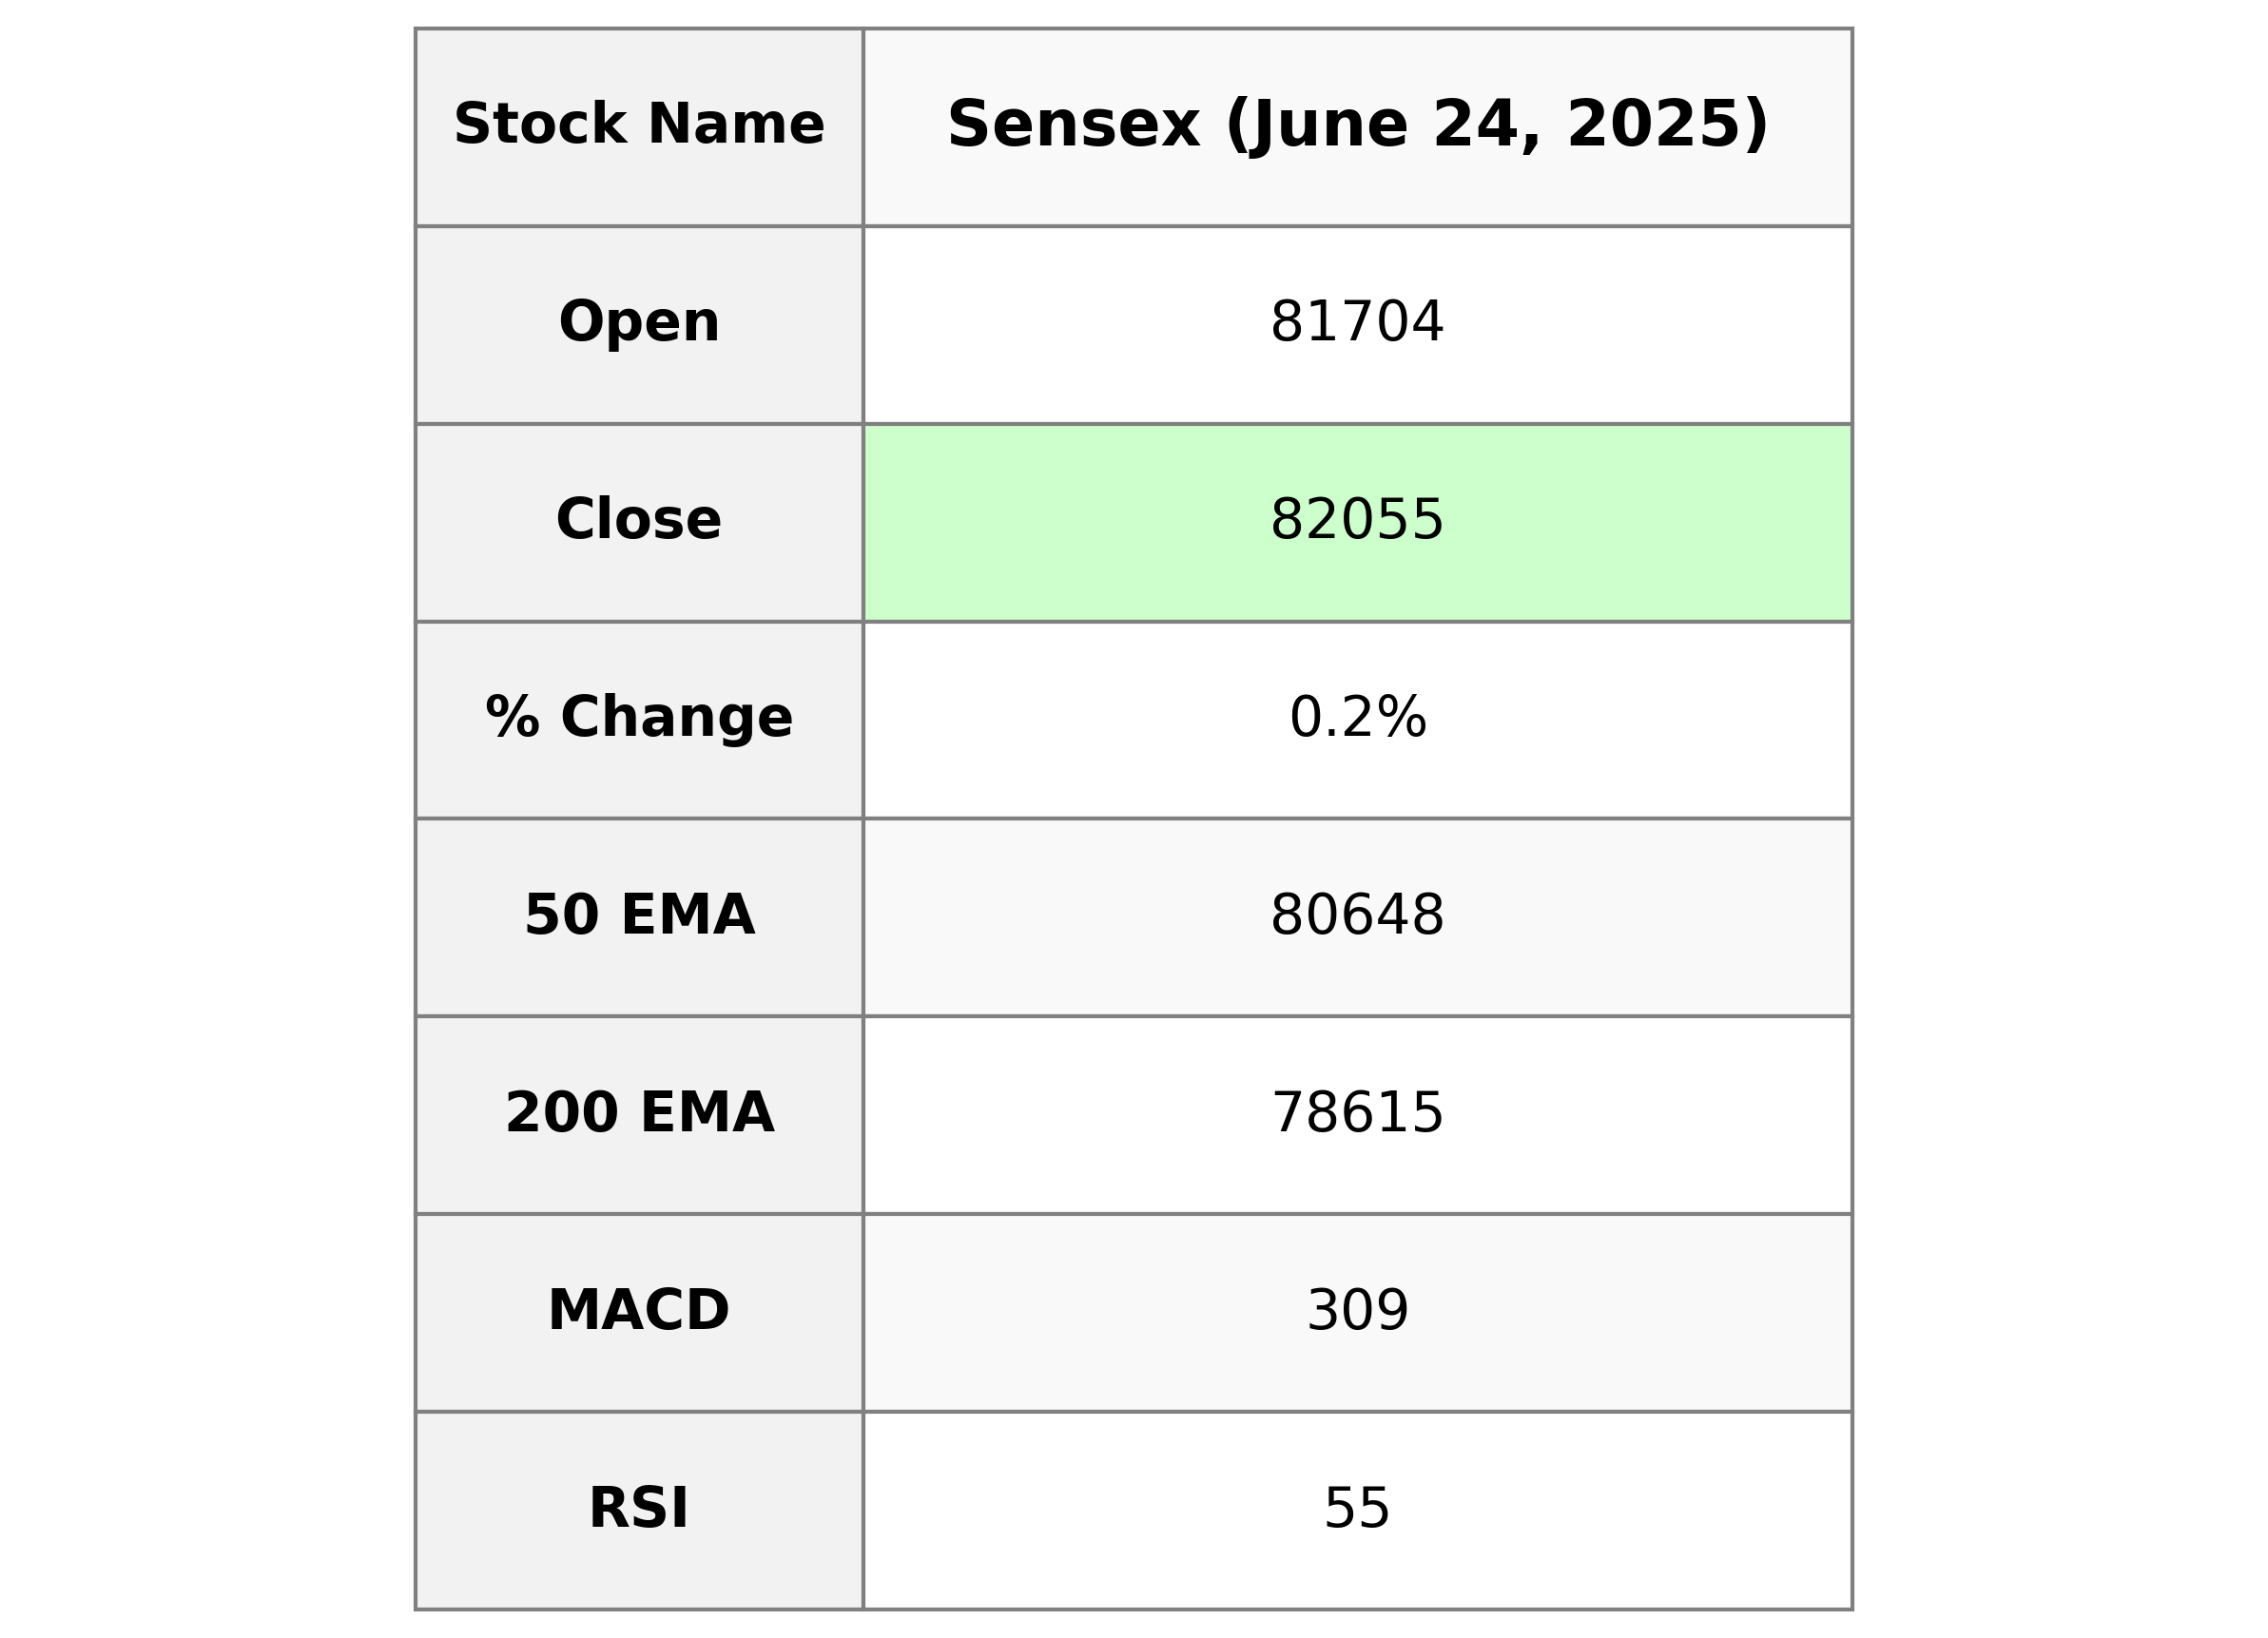
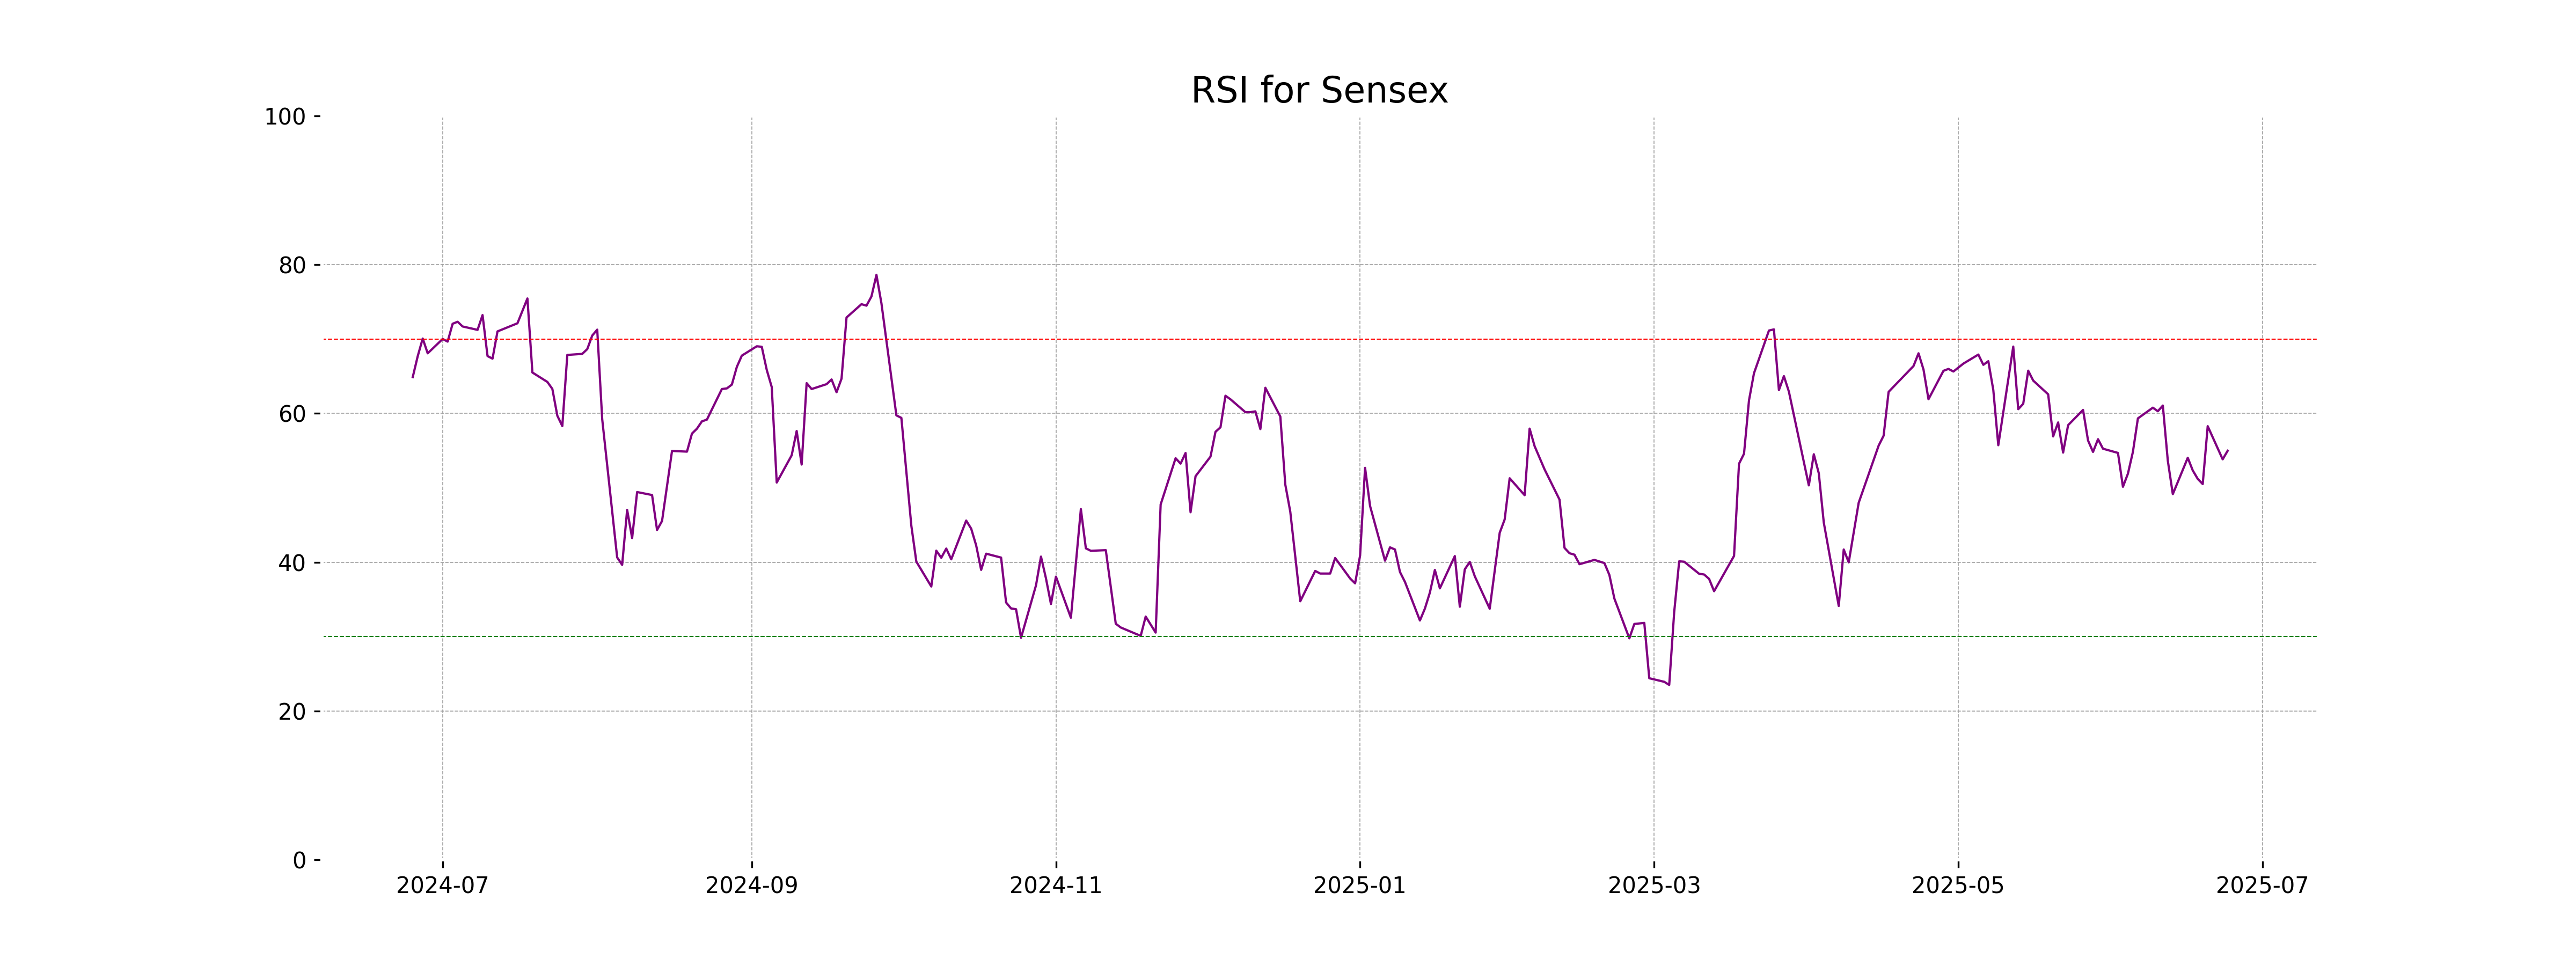
The Sensex started the day at 81,704.07, reaching a high of 83,018.16 and closing slightly up at 82,055.11. The percentage change was a modest 0.19%, with a points increase of 158.32. With an RSI of 54.98, the market is relatively neutral, while the MACD value of 309.48 indicates a less bullish trend as it remains below the signal line.
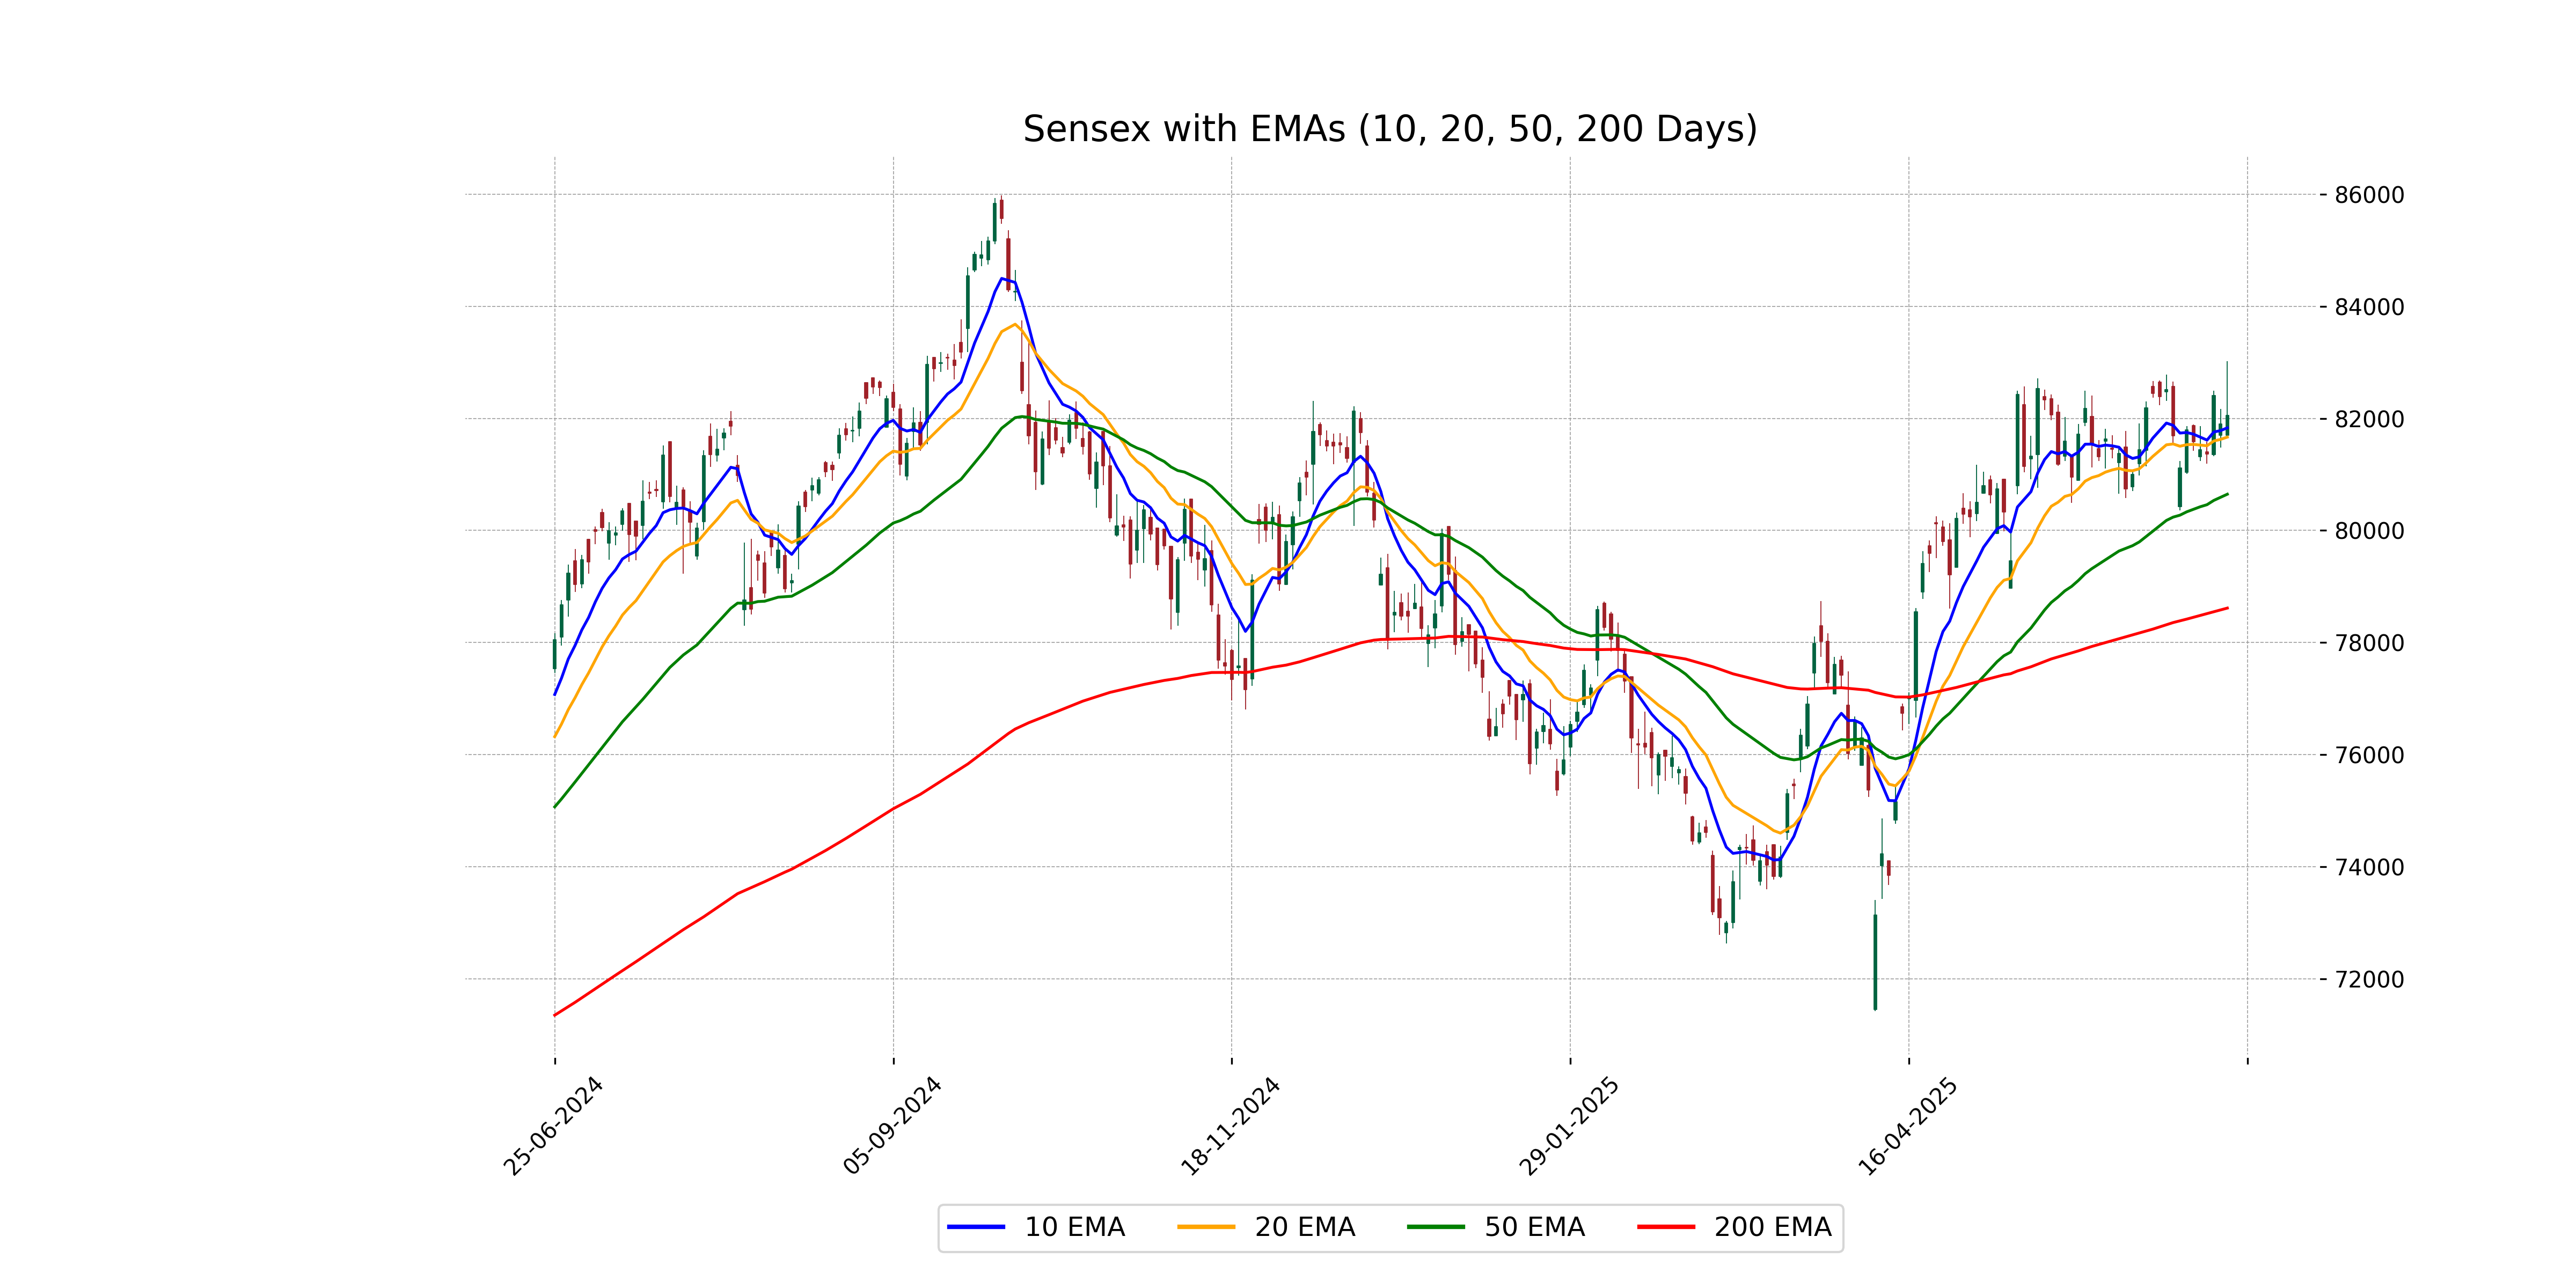
Relationship with Key Moving Averages
Based on the given data, the close value of Sensex at 82,055.109375 is above its 10 EMA at 81,832.5511, 20 EMA at 81,666.8285, 50 EMA at 80,647.7052, and 200 EMA at 78,615.1921, indicating a bullish trend as it is trading above key moving averages.
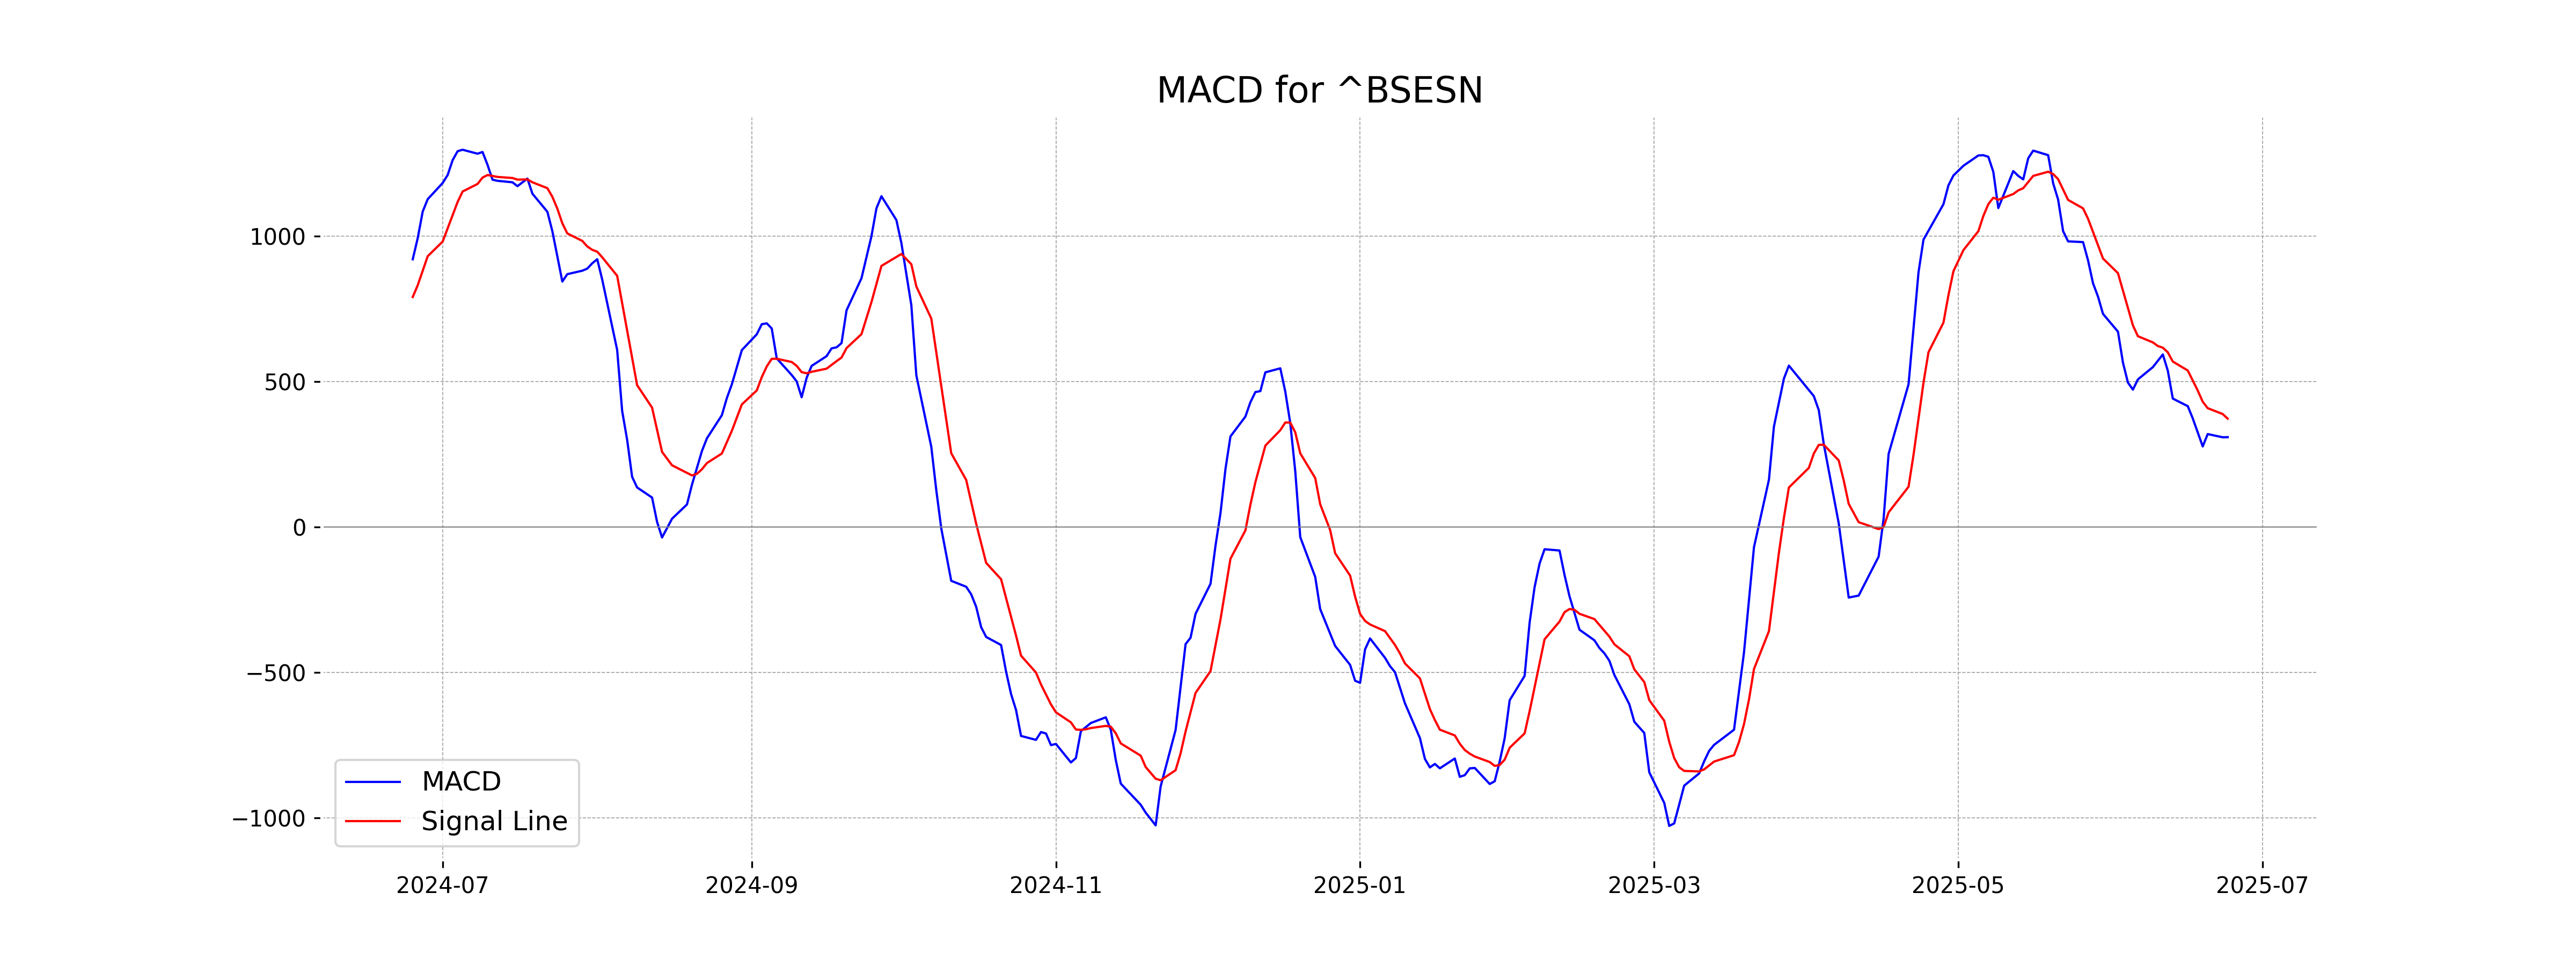
Moving Averages Trend (MACD)
The MACD value for Sensex is 309.48, which is below the MACD Signal of 373.17. This indicates a potential bearish setup, as the MACD line is below the signal line, suggesting possible downward momentum in the current trend.
RSI Analysis
RSI Analysis for Sensex: The Relative Strength Index (RSI) for Sensex is currently at 54.98. This indicates a neutral position, suggesting that the index is neither overbought nor oversold. It reflects a balanced sentiment in the market, with no strong indication for bullish or bearish trends.
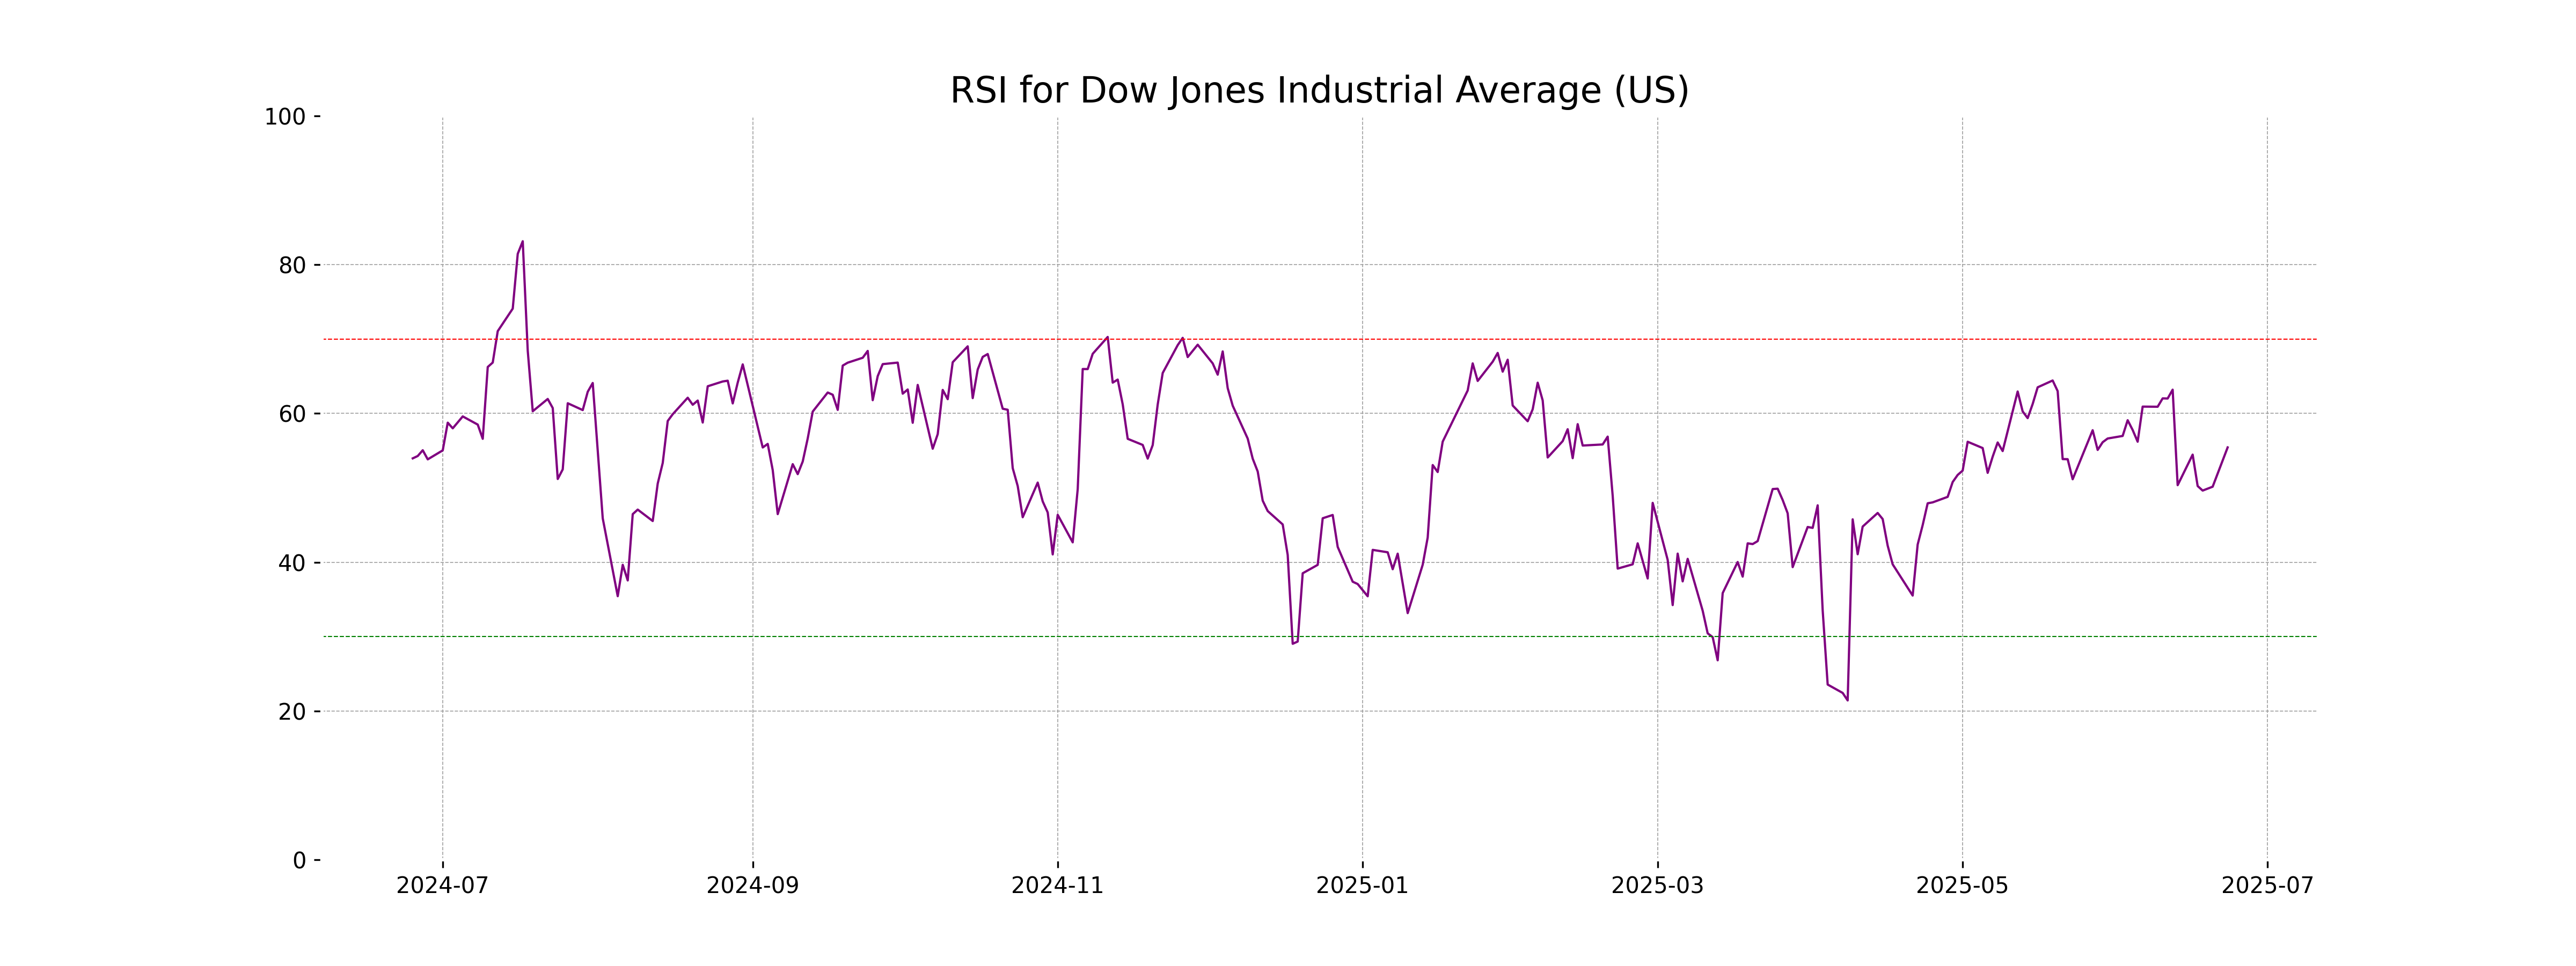
Analysis for Dow Jones Industrial Average (US) - June 24, 2025
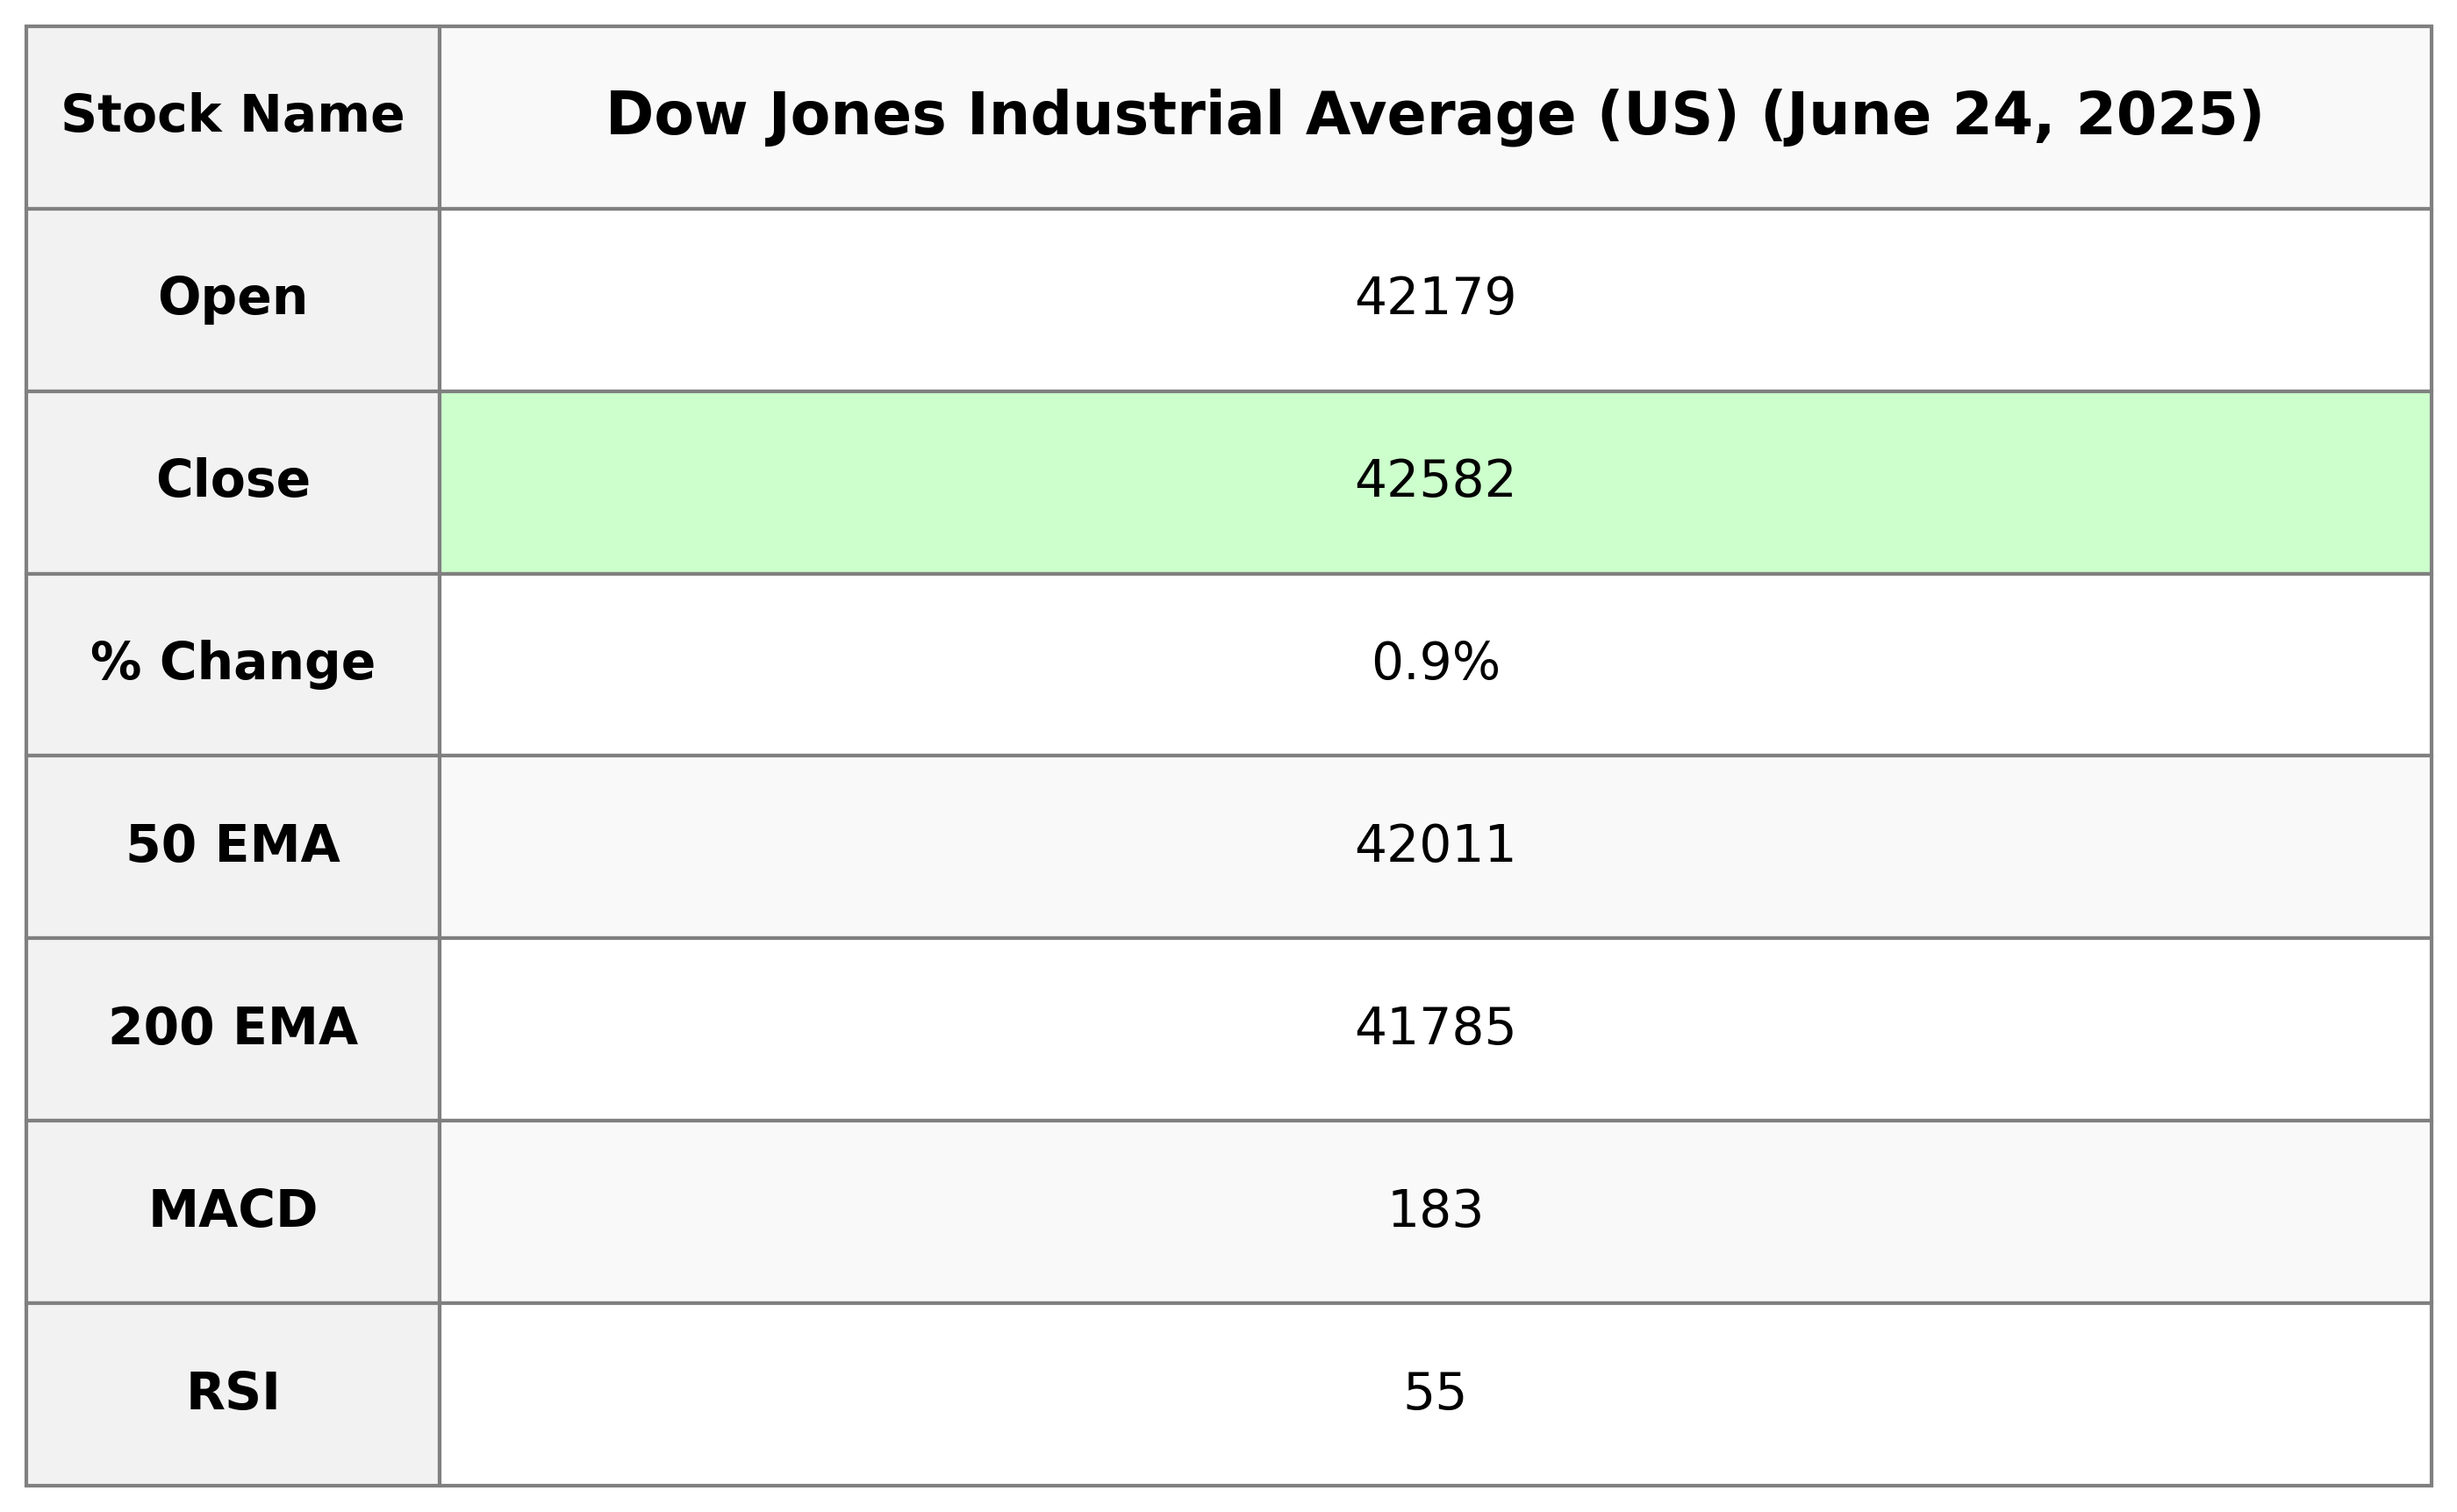
The Dow Jones Industrial Average (US) opened at 42,178.55 and closed higher at 42,581.78, registering a percentage change of 0.89% with a points increase of 374.96. The RSI indicates a moderately bullish momentum at 55.44, while the MACD is below the signal line, suggesting potential caution. The trading volume was 496,750,000.
Relationship with Key Moving Averages
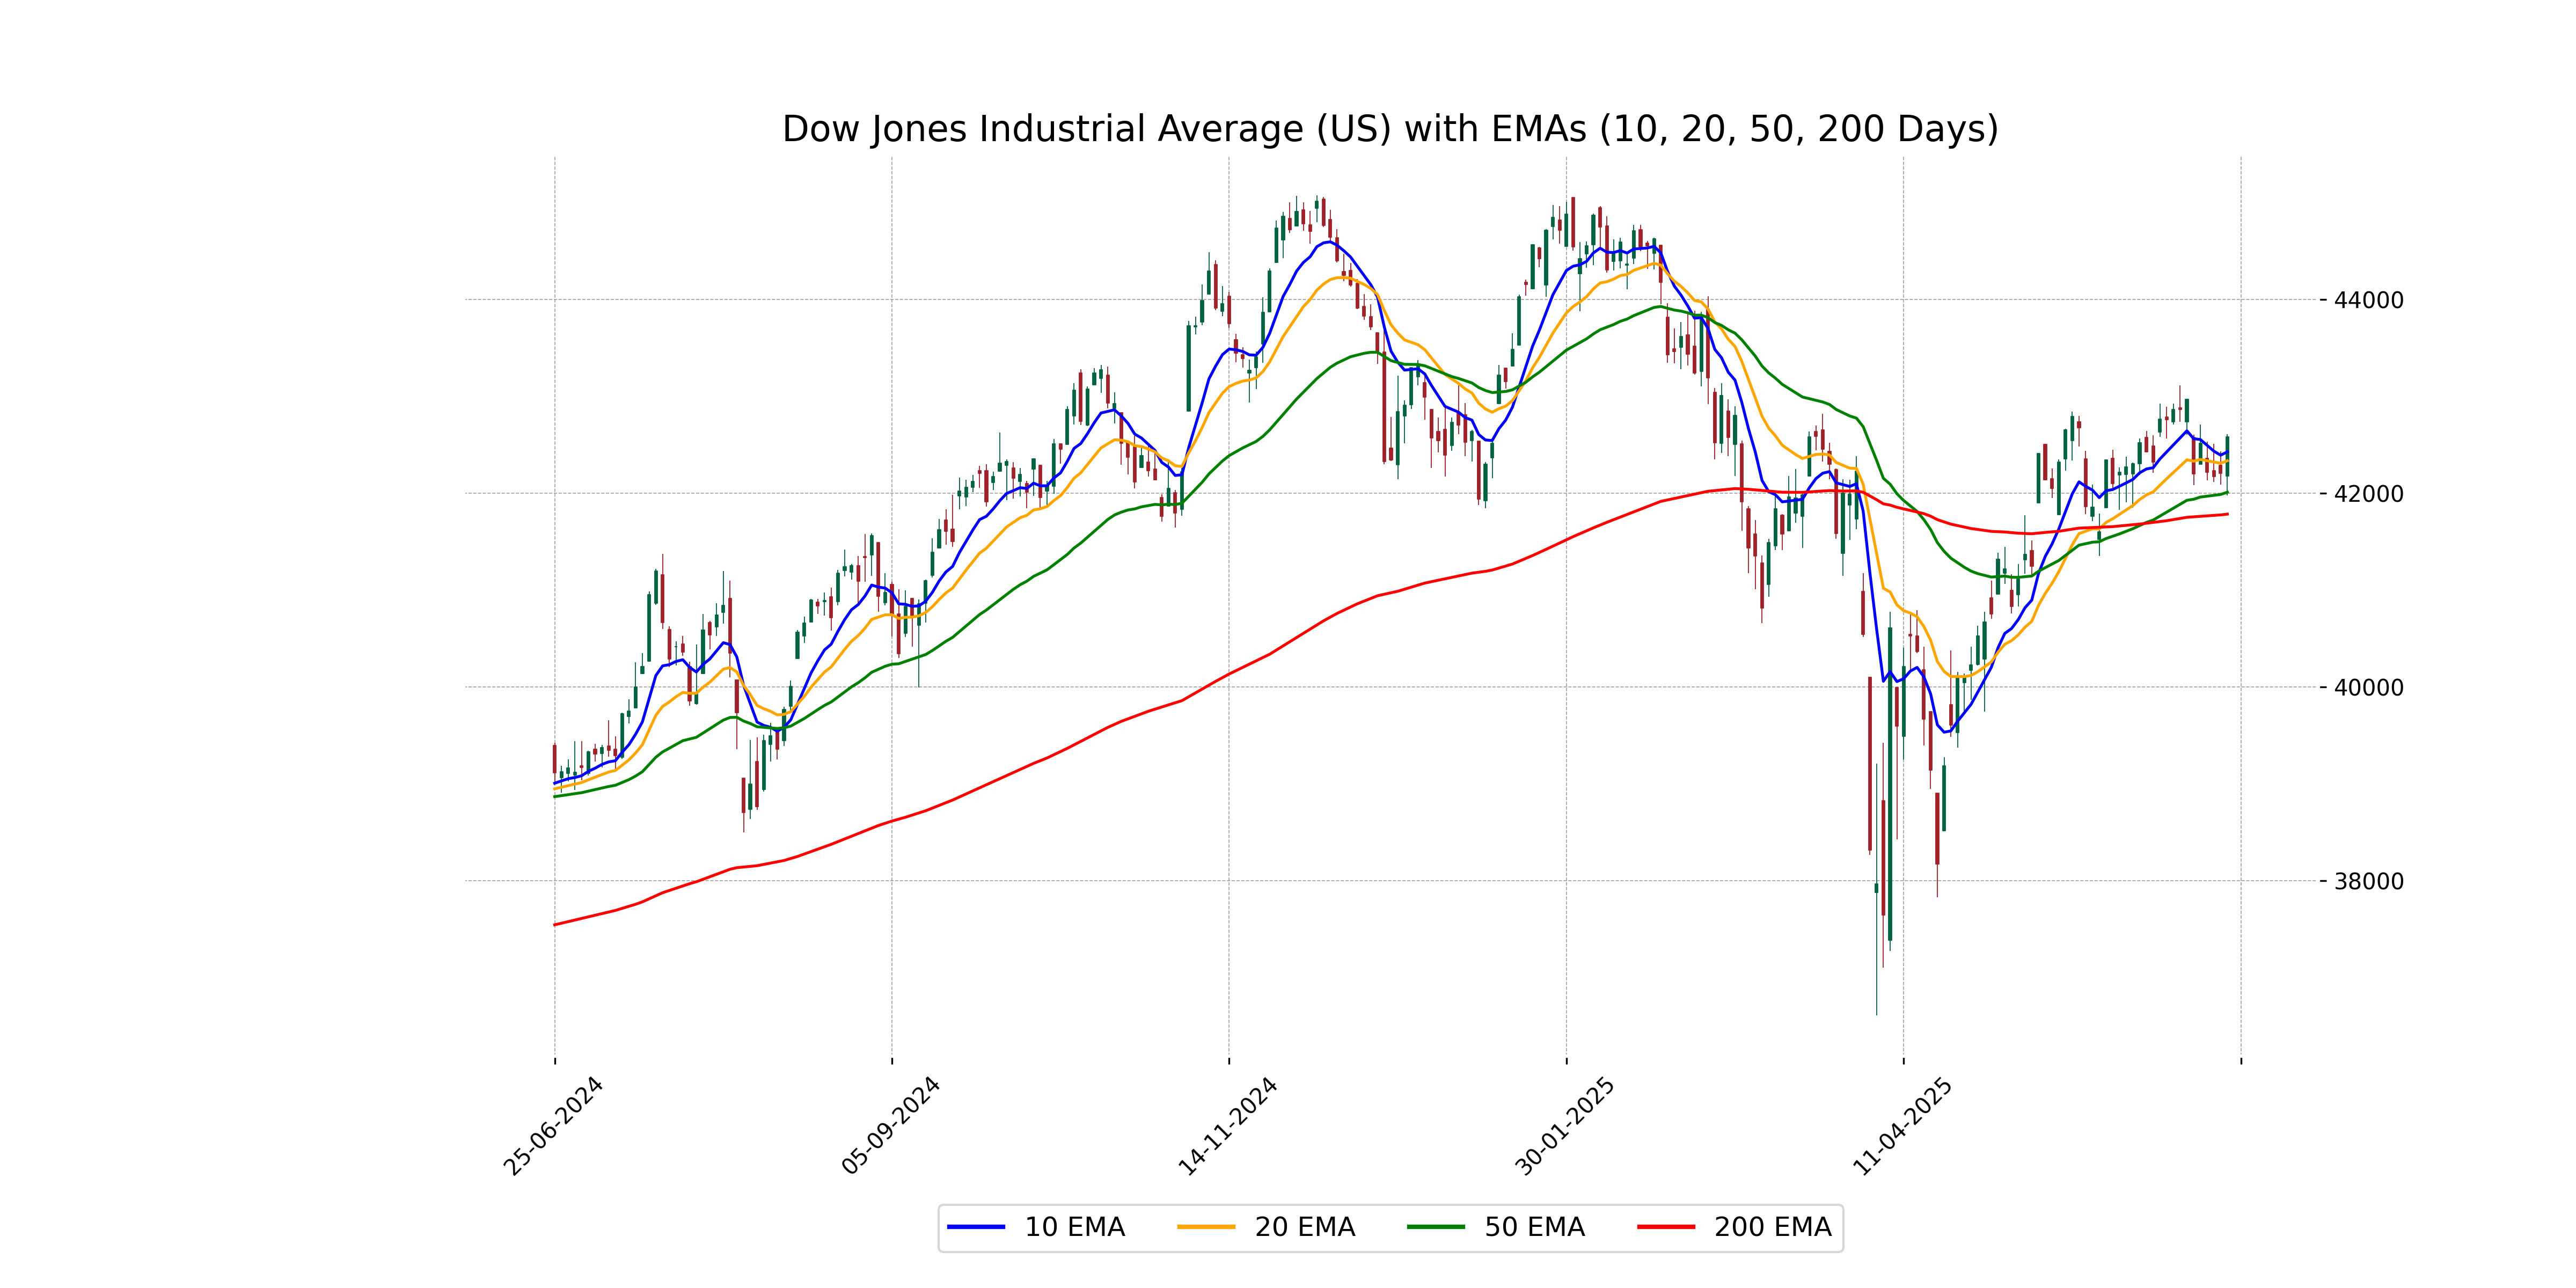
The Dow Jones Industrial Average closed at 42,581.78, above its 10-day EMA of 42,427.52, 20-day EMA of 42,335.68, and 50-day EMA of 42,010.90, indicating recent bullish momentum. It also remains above the 200-day EMA of 41,784.66, suggesting a longer-term positive trend.
Moving Averages Trend (MACD)
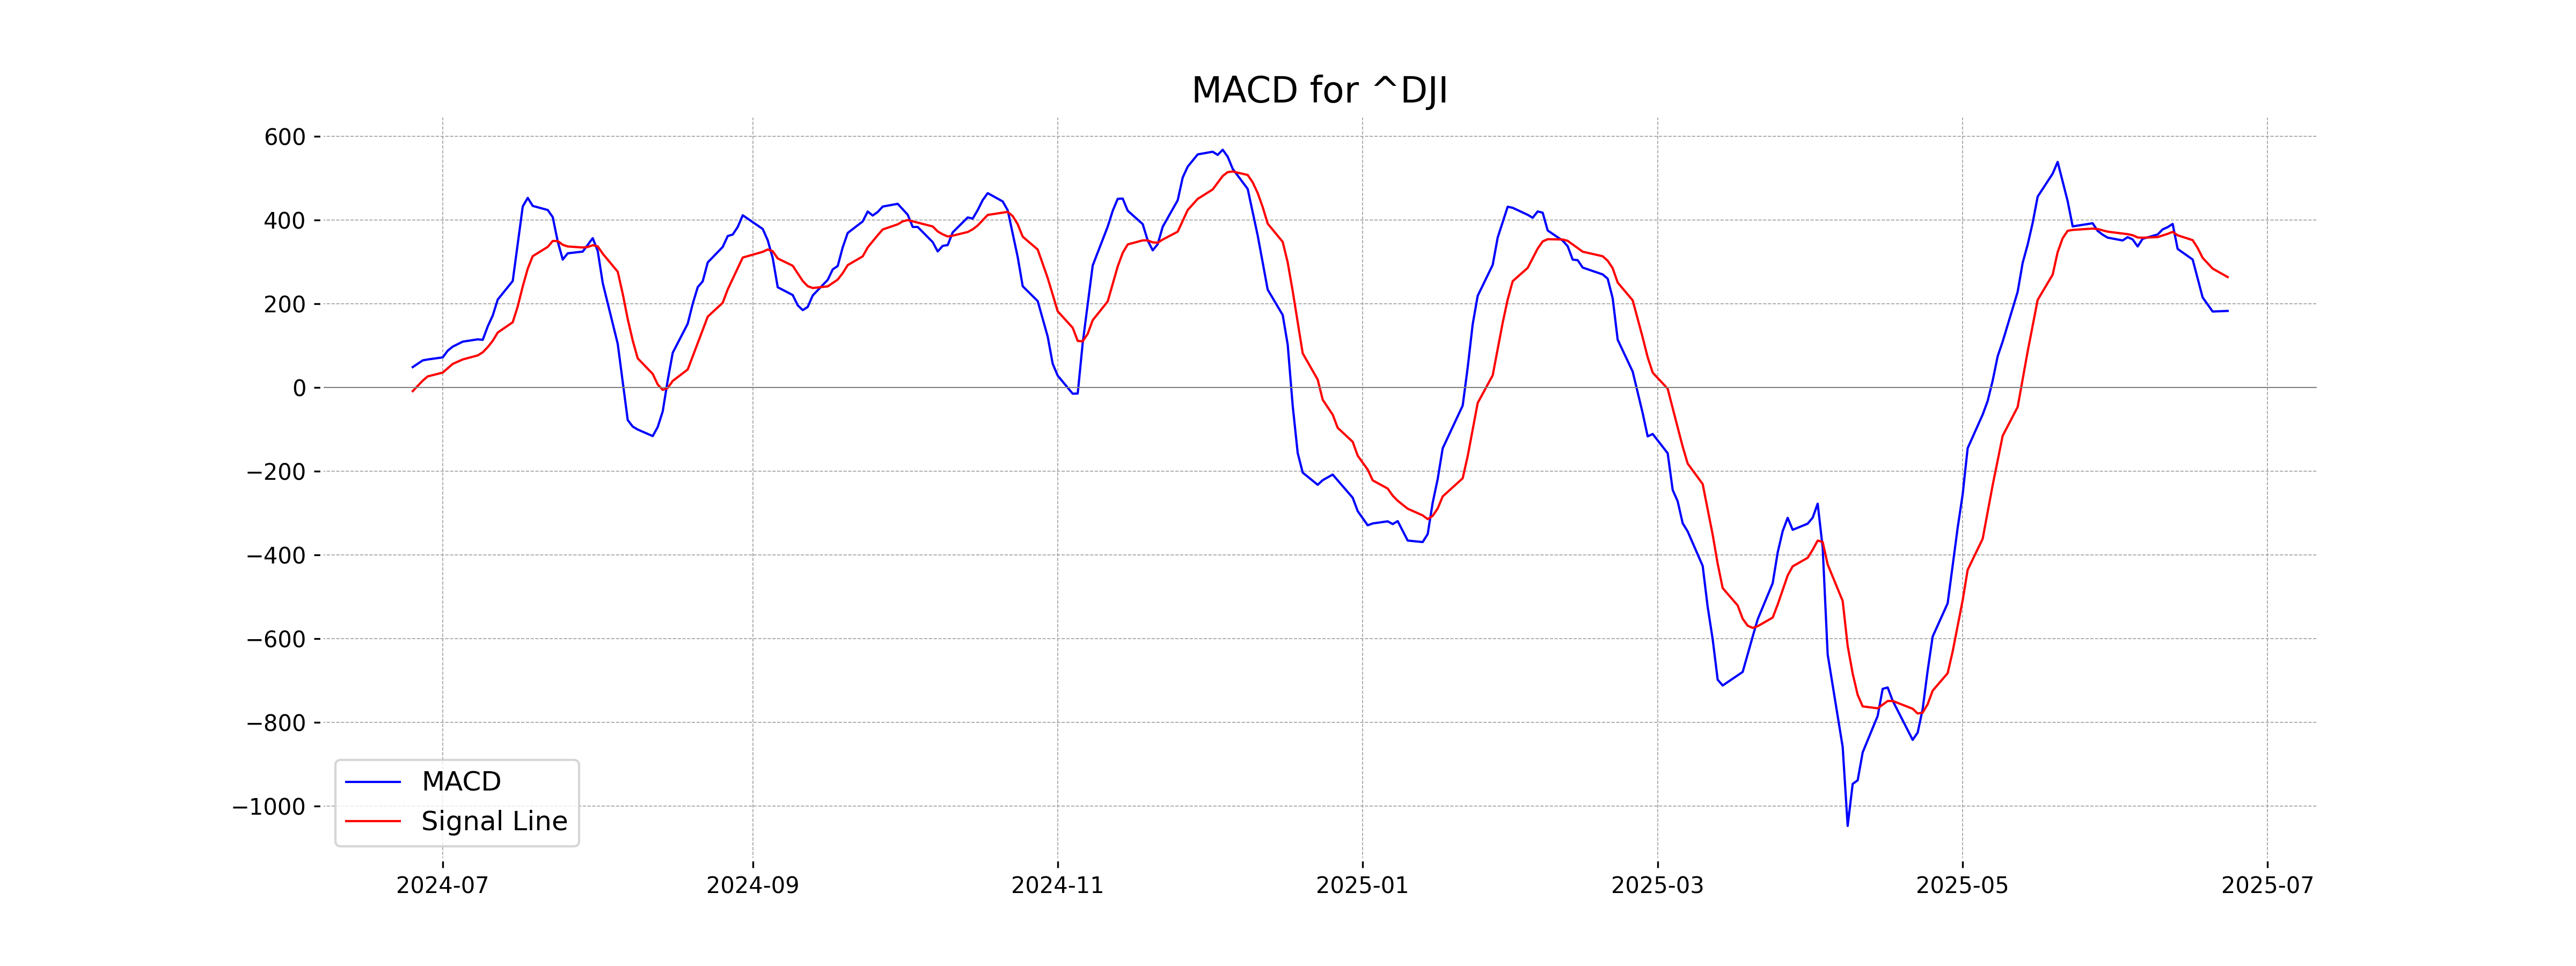
The MACD for the Dow Jones Industrial Average is 183.17, which is below the MACD Signal of 264.04. This suggests a bearish trend as the MACD line is below the signal line, indicating potential downside momentum.
RSI Analysis
The RSI (Relative Strength Index) for the Dow Jones Industrial Average is 55.44, which is a neutral position typically indicating that the stock is neither overbought nor oversold. This suggests a balanced momentum without strong directional pressure.
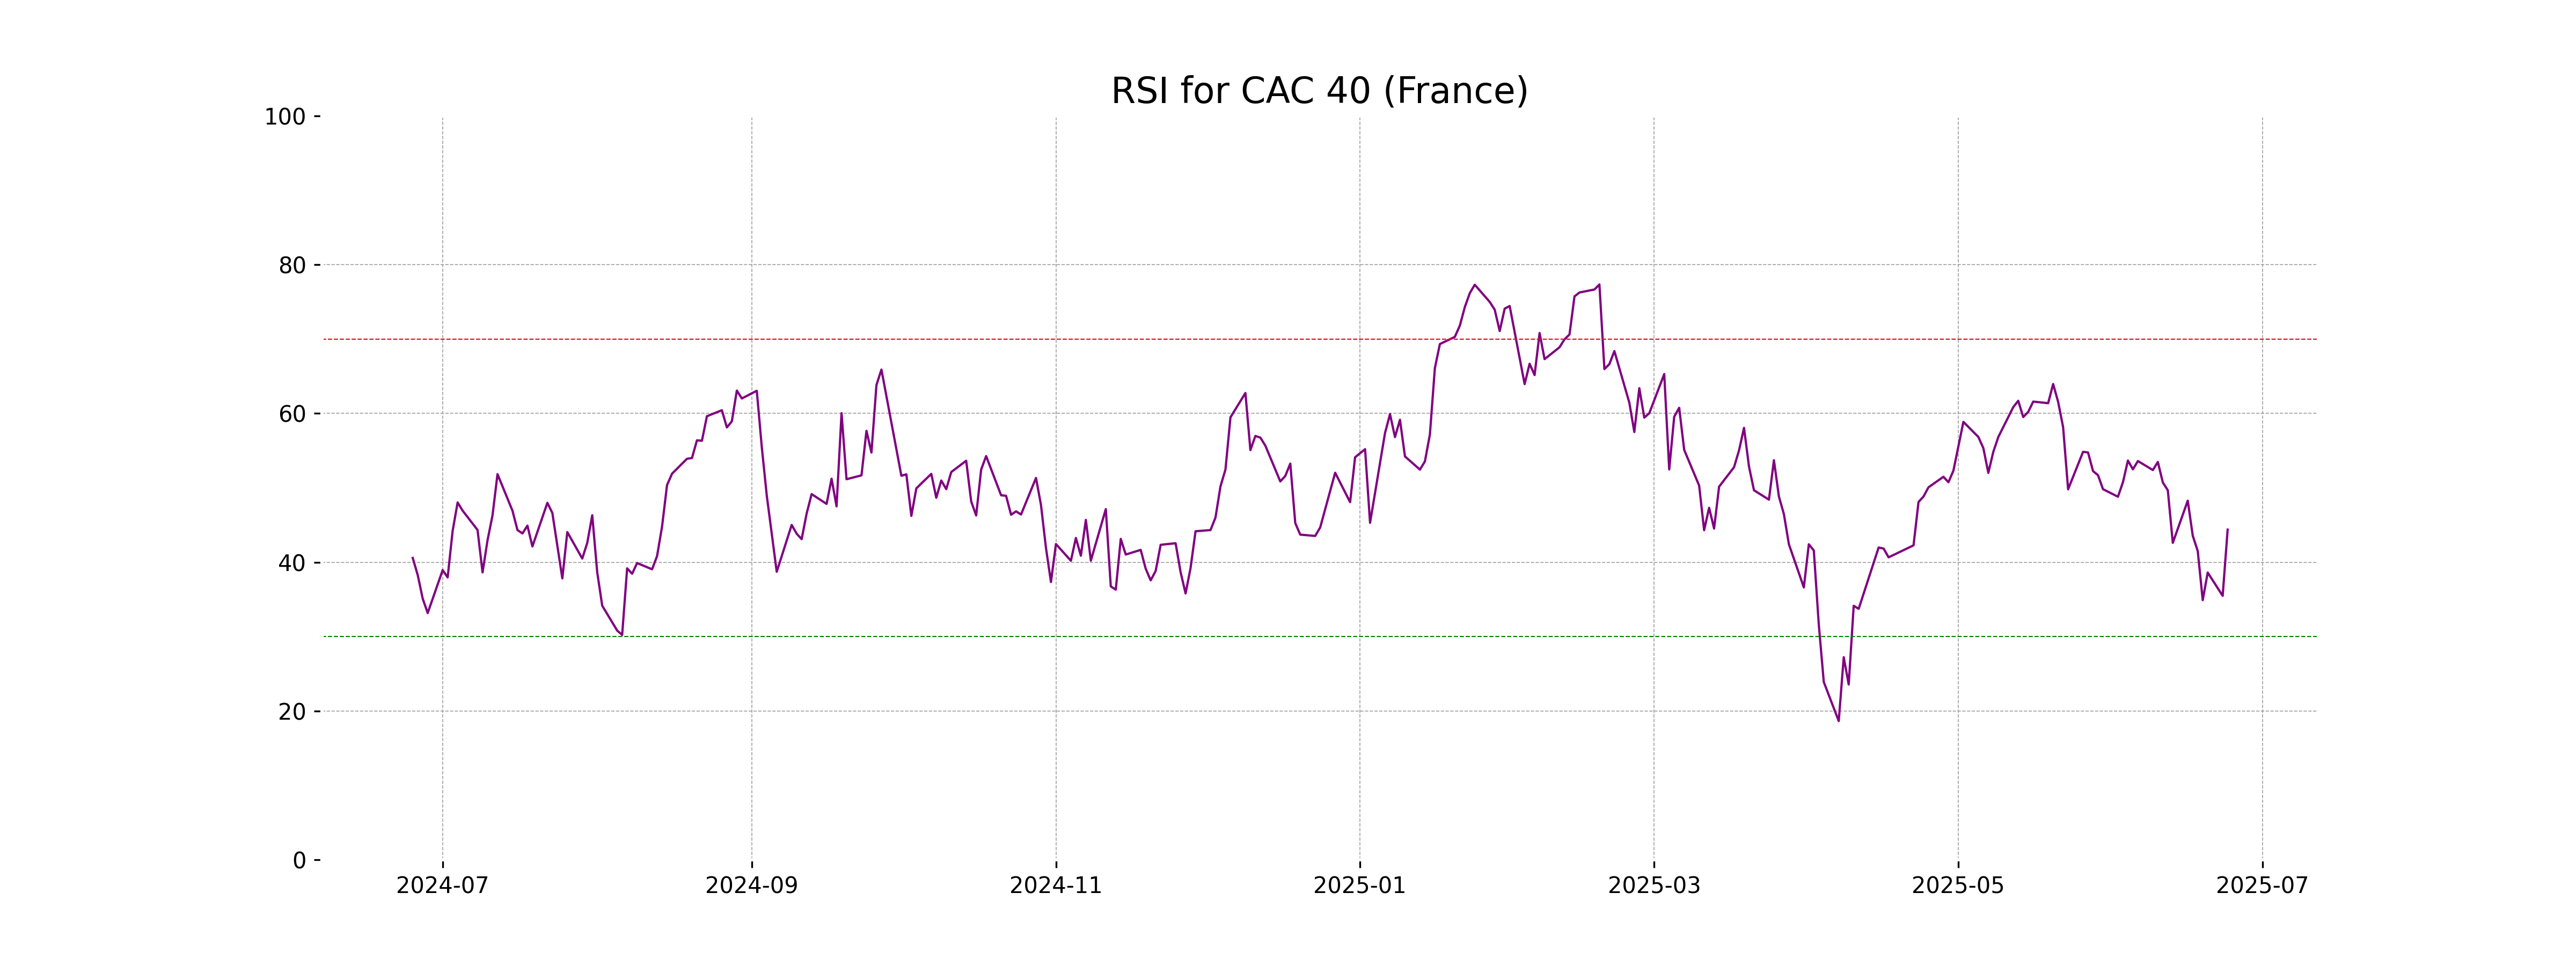
Analysis for CAC 40 (France) - June 24, 2025
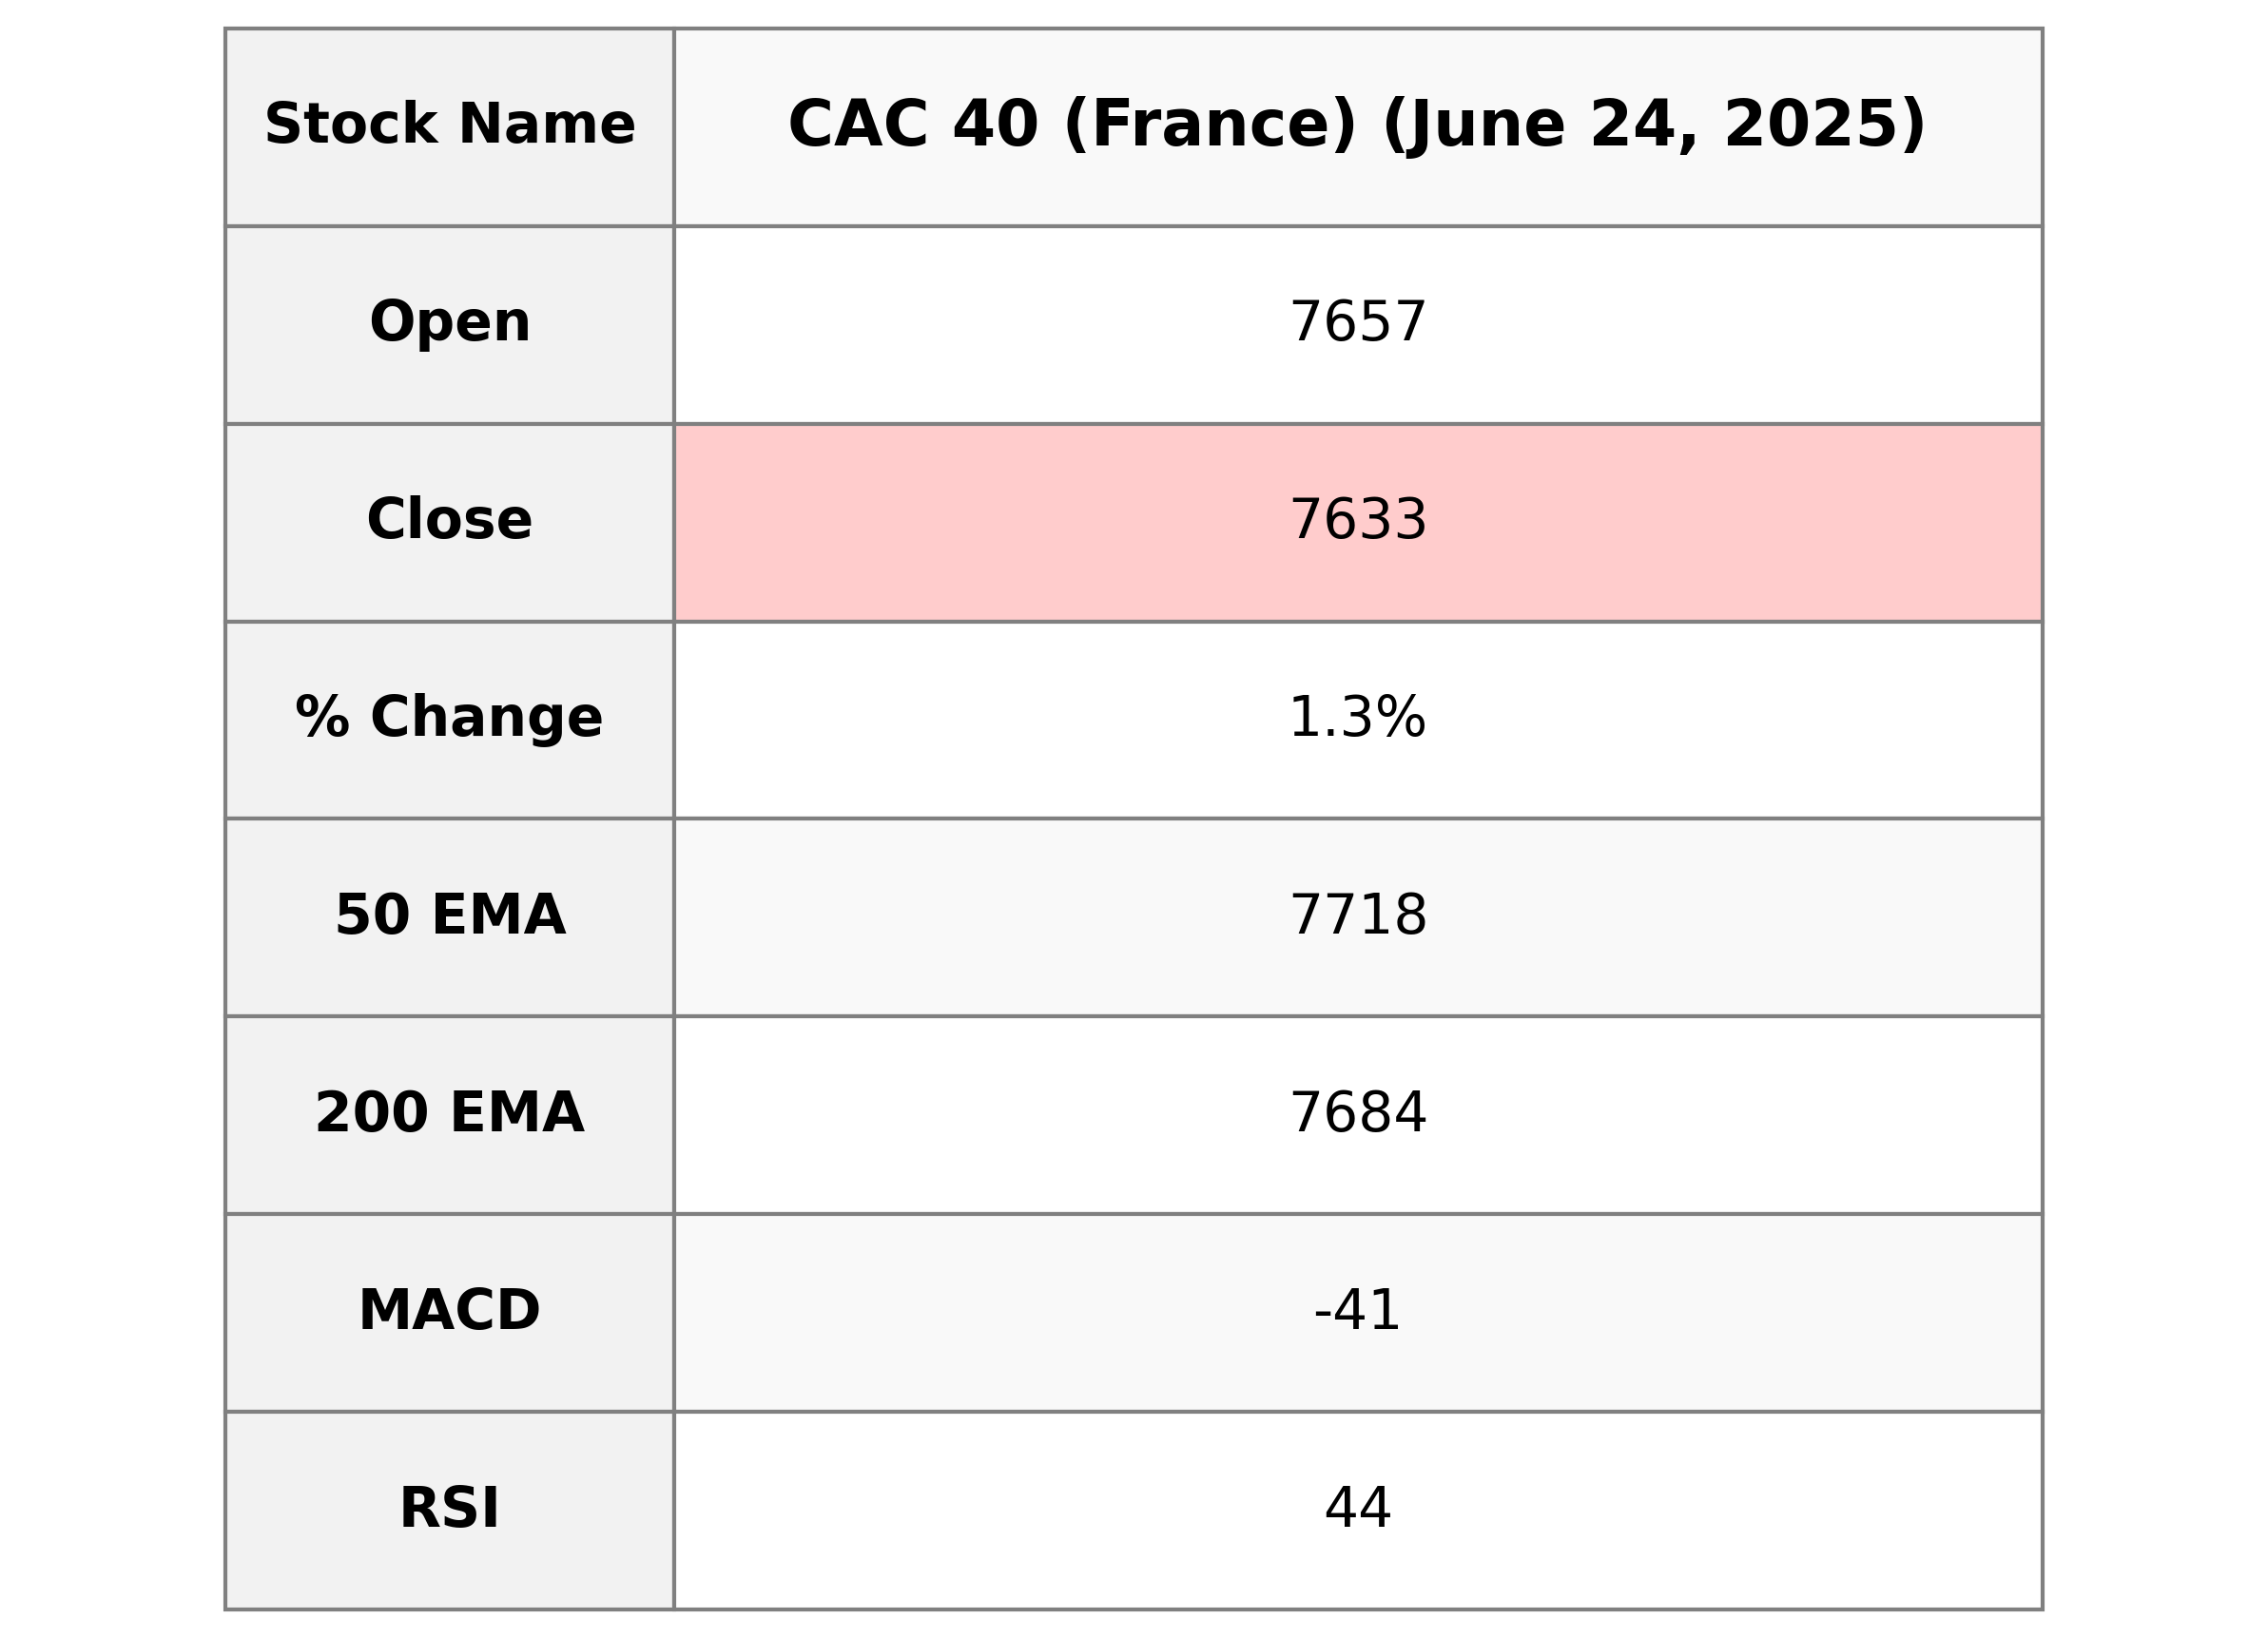
CAC 40 (France) Performance: The CAC 40 index opened at 7656.54 and closed at 7633.05, experiencing a slight dip during the trading session. The day's movement shows a 1.27% increase from the previous close of 7537.57, with a MACD indicating a bearish trend as it sits below the signal line. The RSI value of 44.39 suggests the index is approaching oversold territory, while the EMAs indicate mixed momentum in the market.
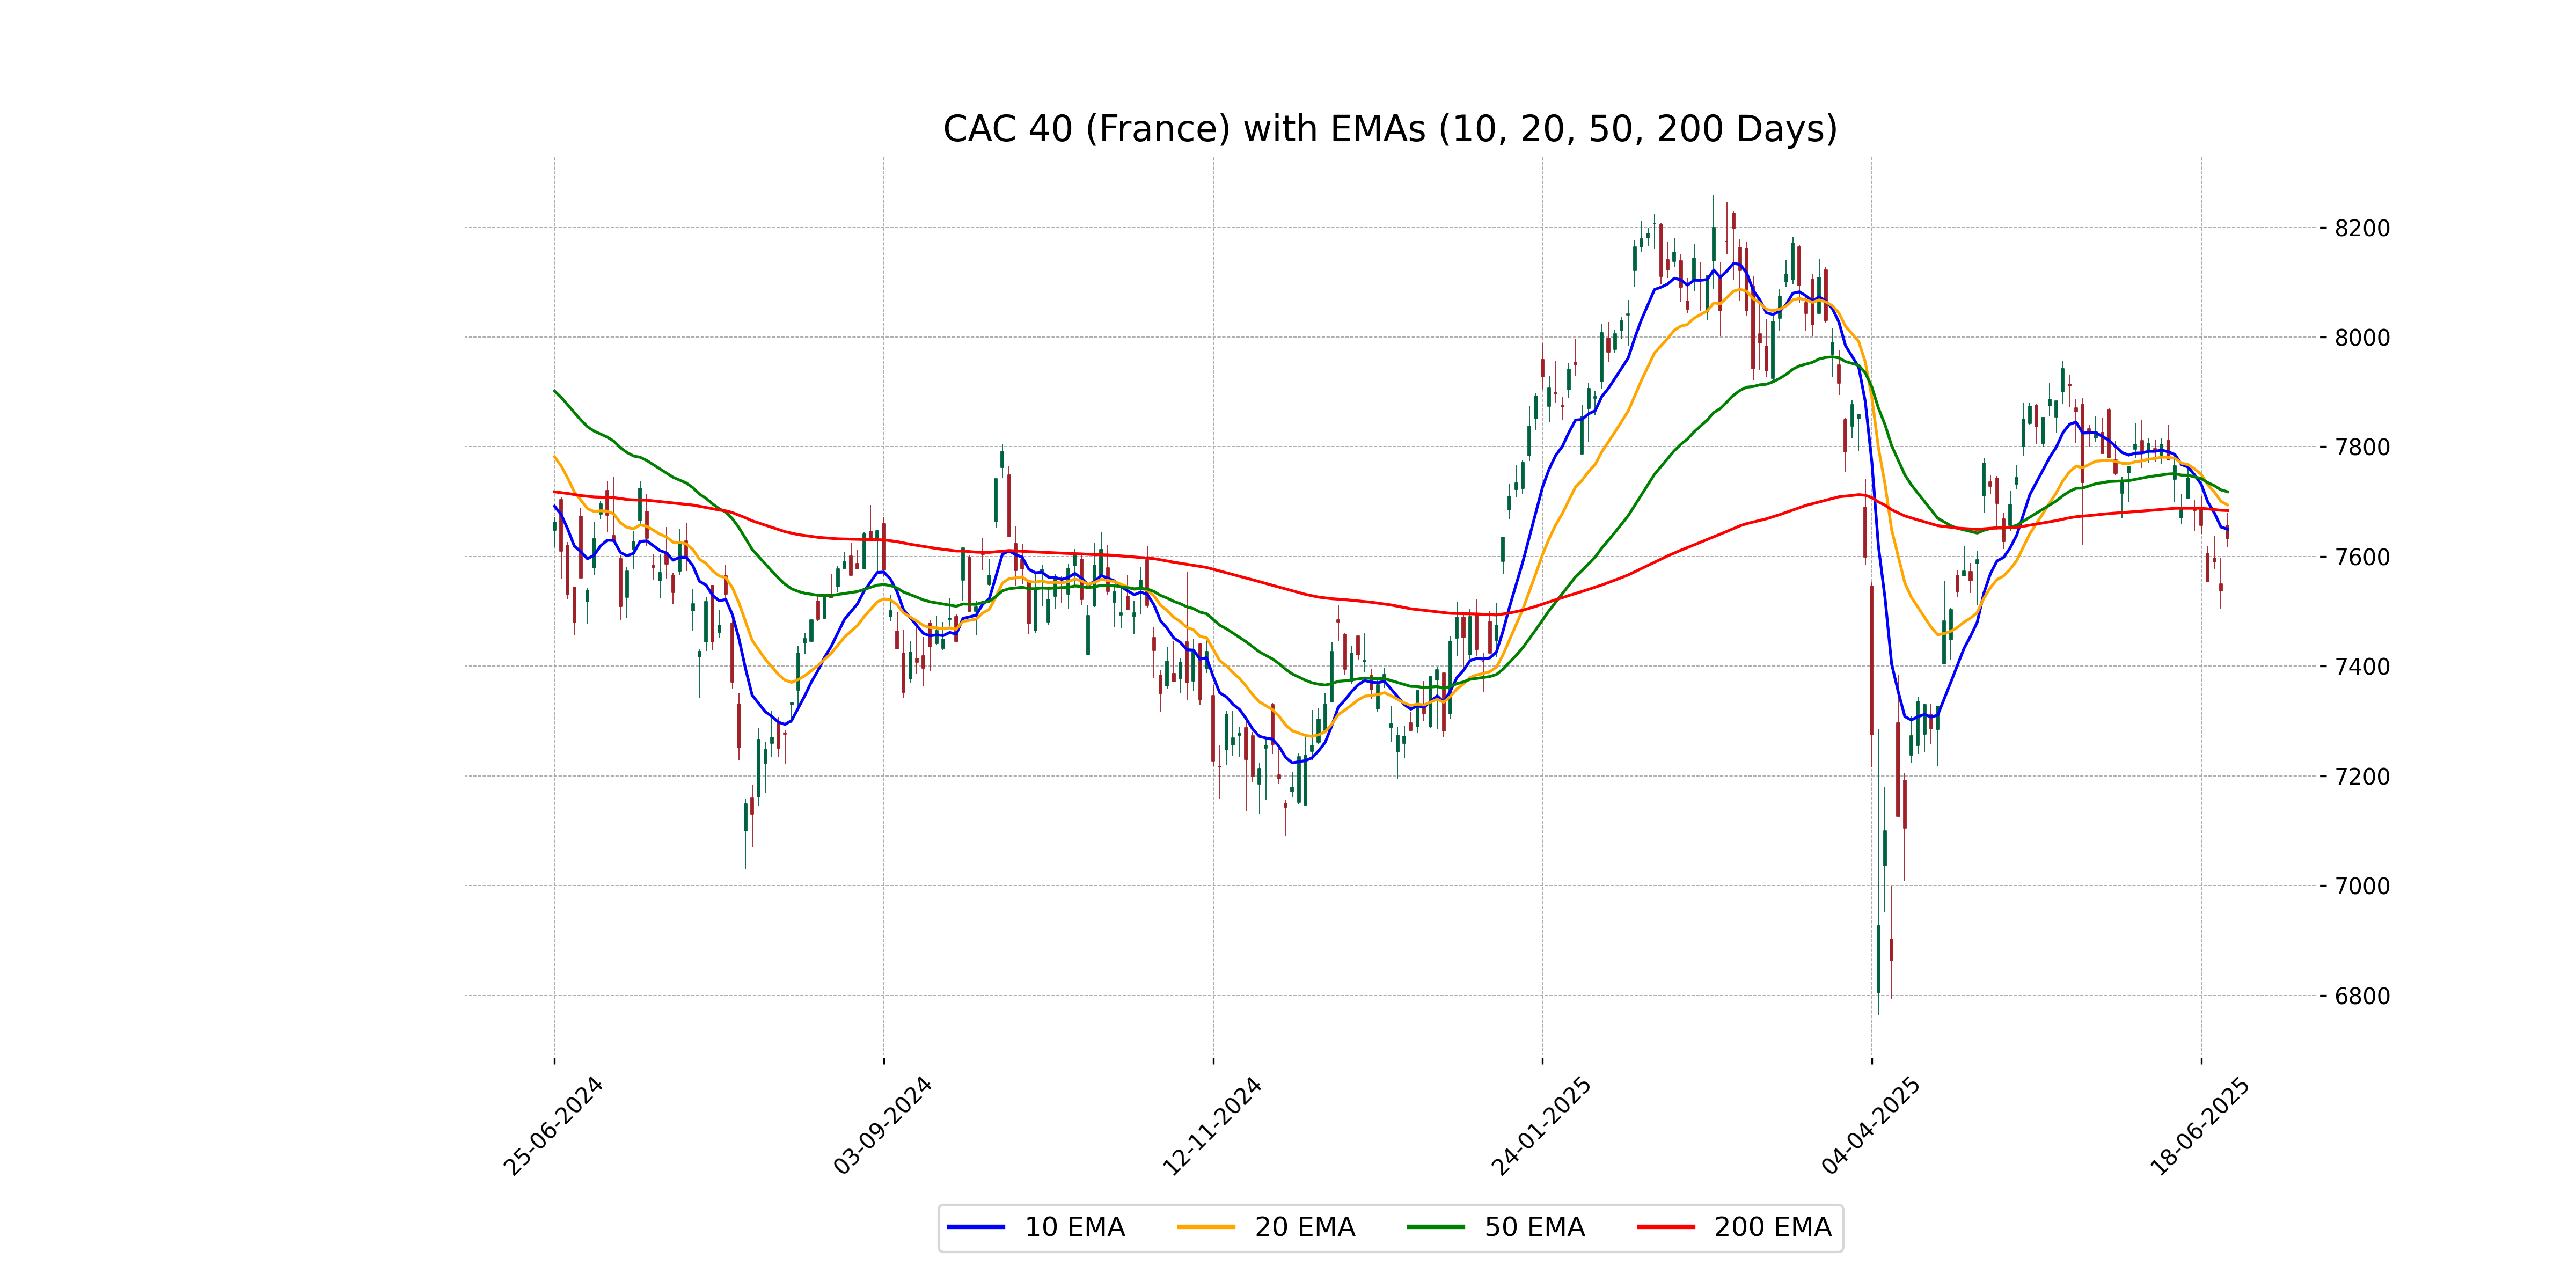
Relationship with Key Moving Averages
The CAC 40 index closed at 7633.05, which is below its 50-day EMA of 7717.93 and its 20-day EMA of 7693.93, indicating a short-term downside trend. However, it is slightly above the 200-day EMA of 7683.65, suggesting a potential long-term support level.
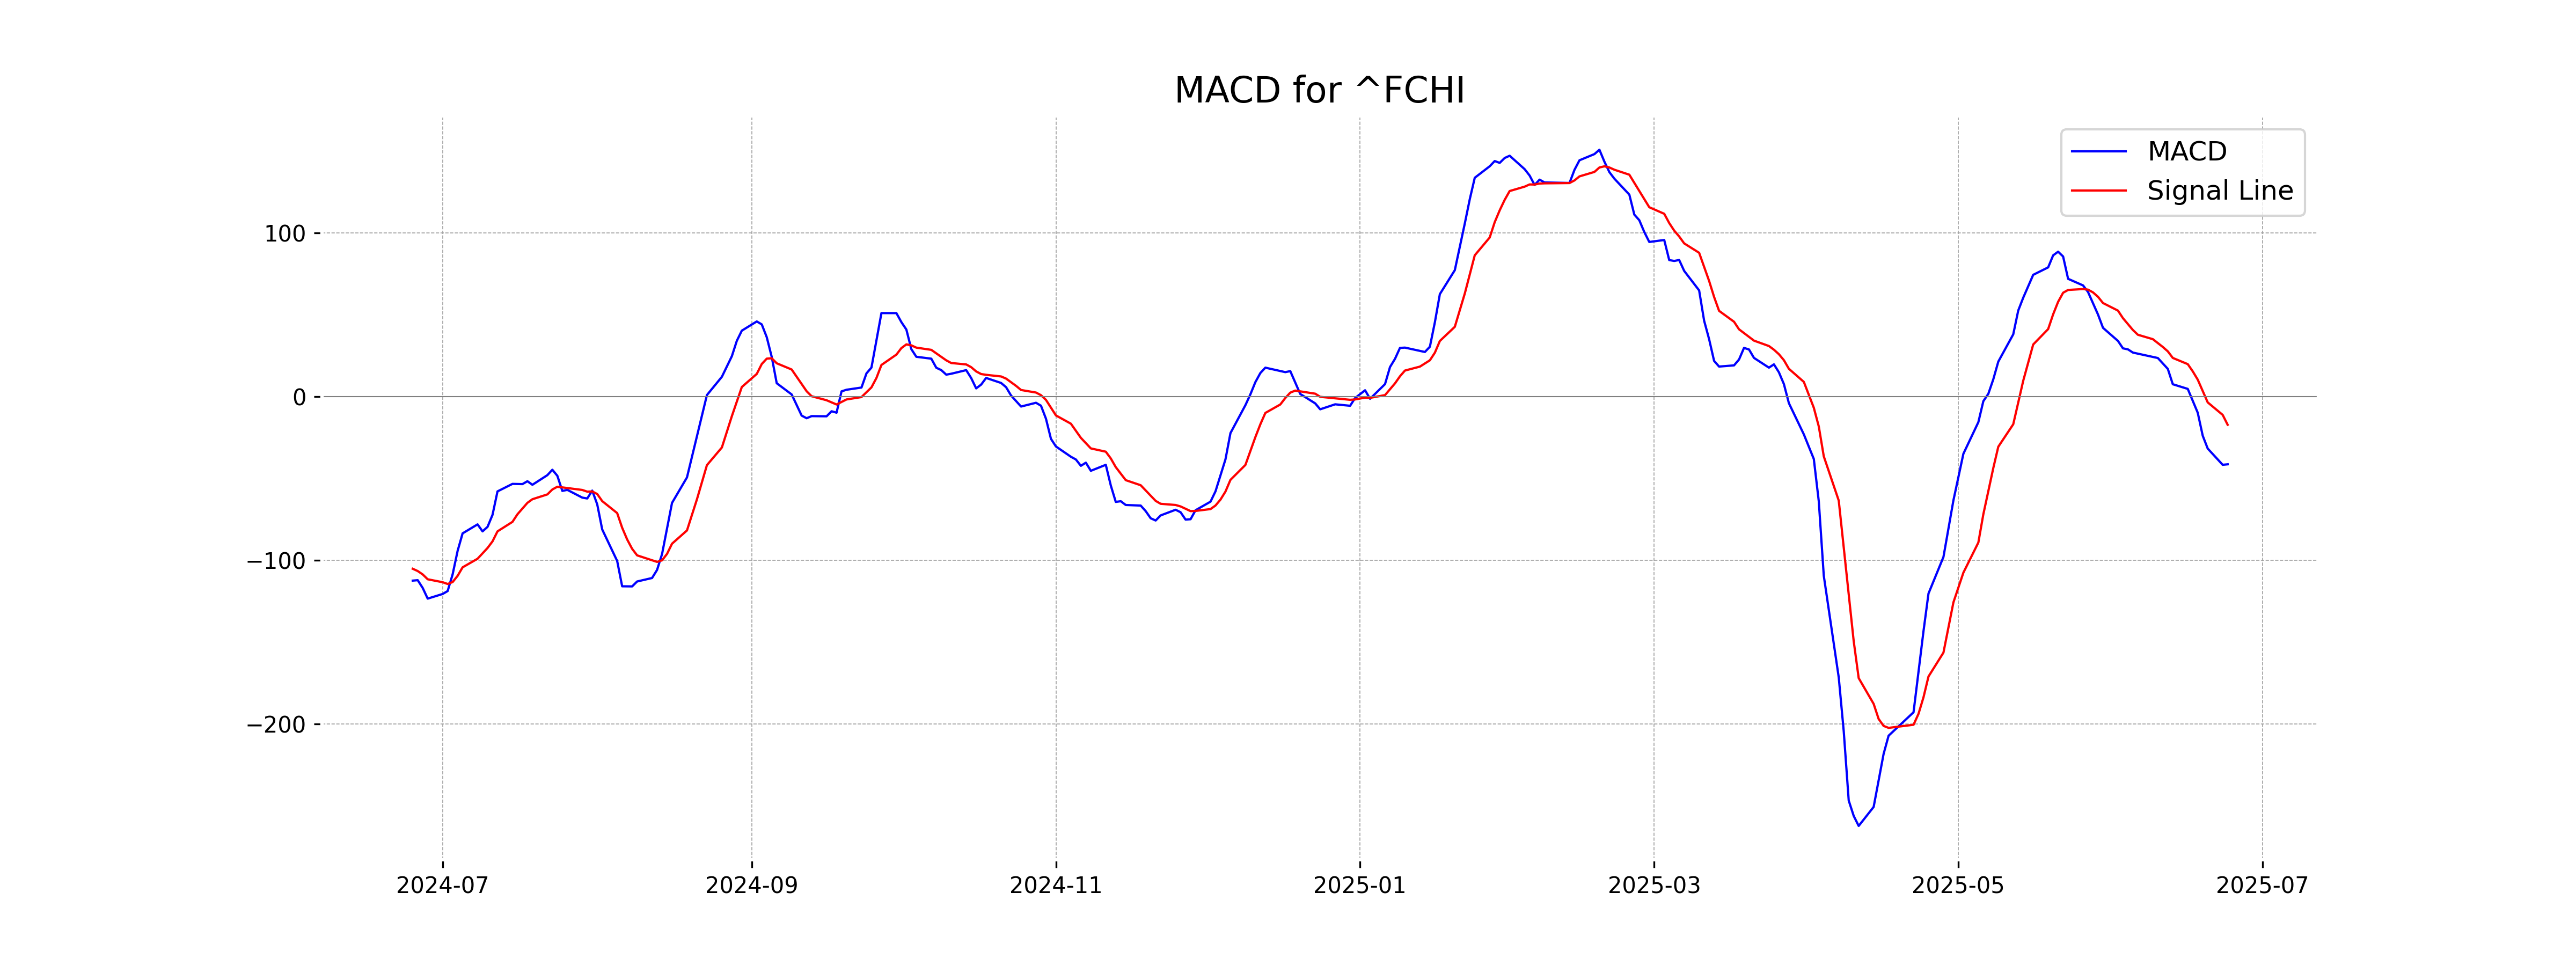
Moving Averages Trend (MACD)
The MACD for CAC 40 (France) is -41.45, which is below the MACD Signal of -17.29. This suggests a bearish signal and potential downward momentum in the stock price. The current MACD crossover indicates increasing selling pressure.
RSI Analysis
The CAC 40's RSI is at 44.39, suggesting it's entering an oversold territory as it's below 50. This could indicate that the index is closer to being undervalued, potentially signaling a buying opportunity if other indicators align.
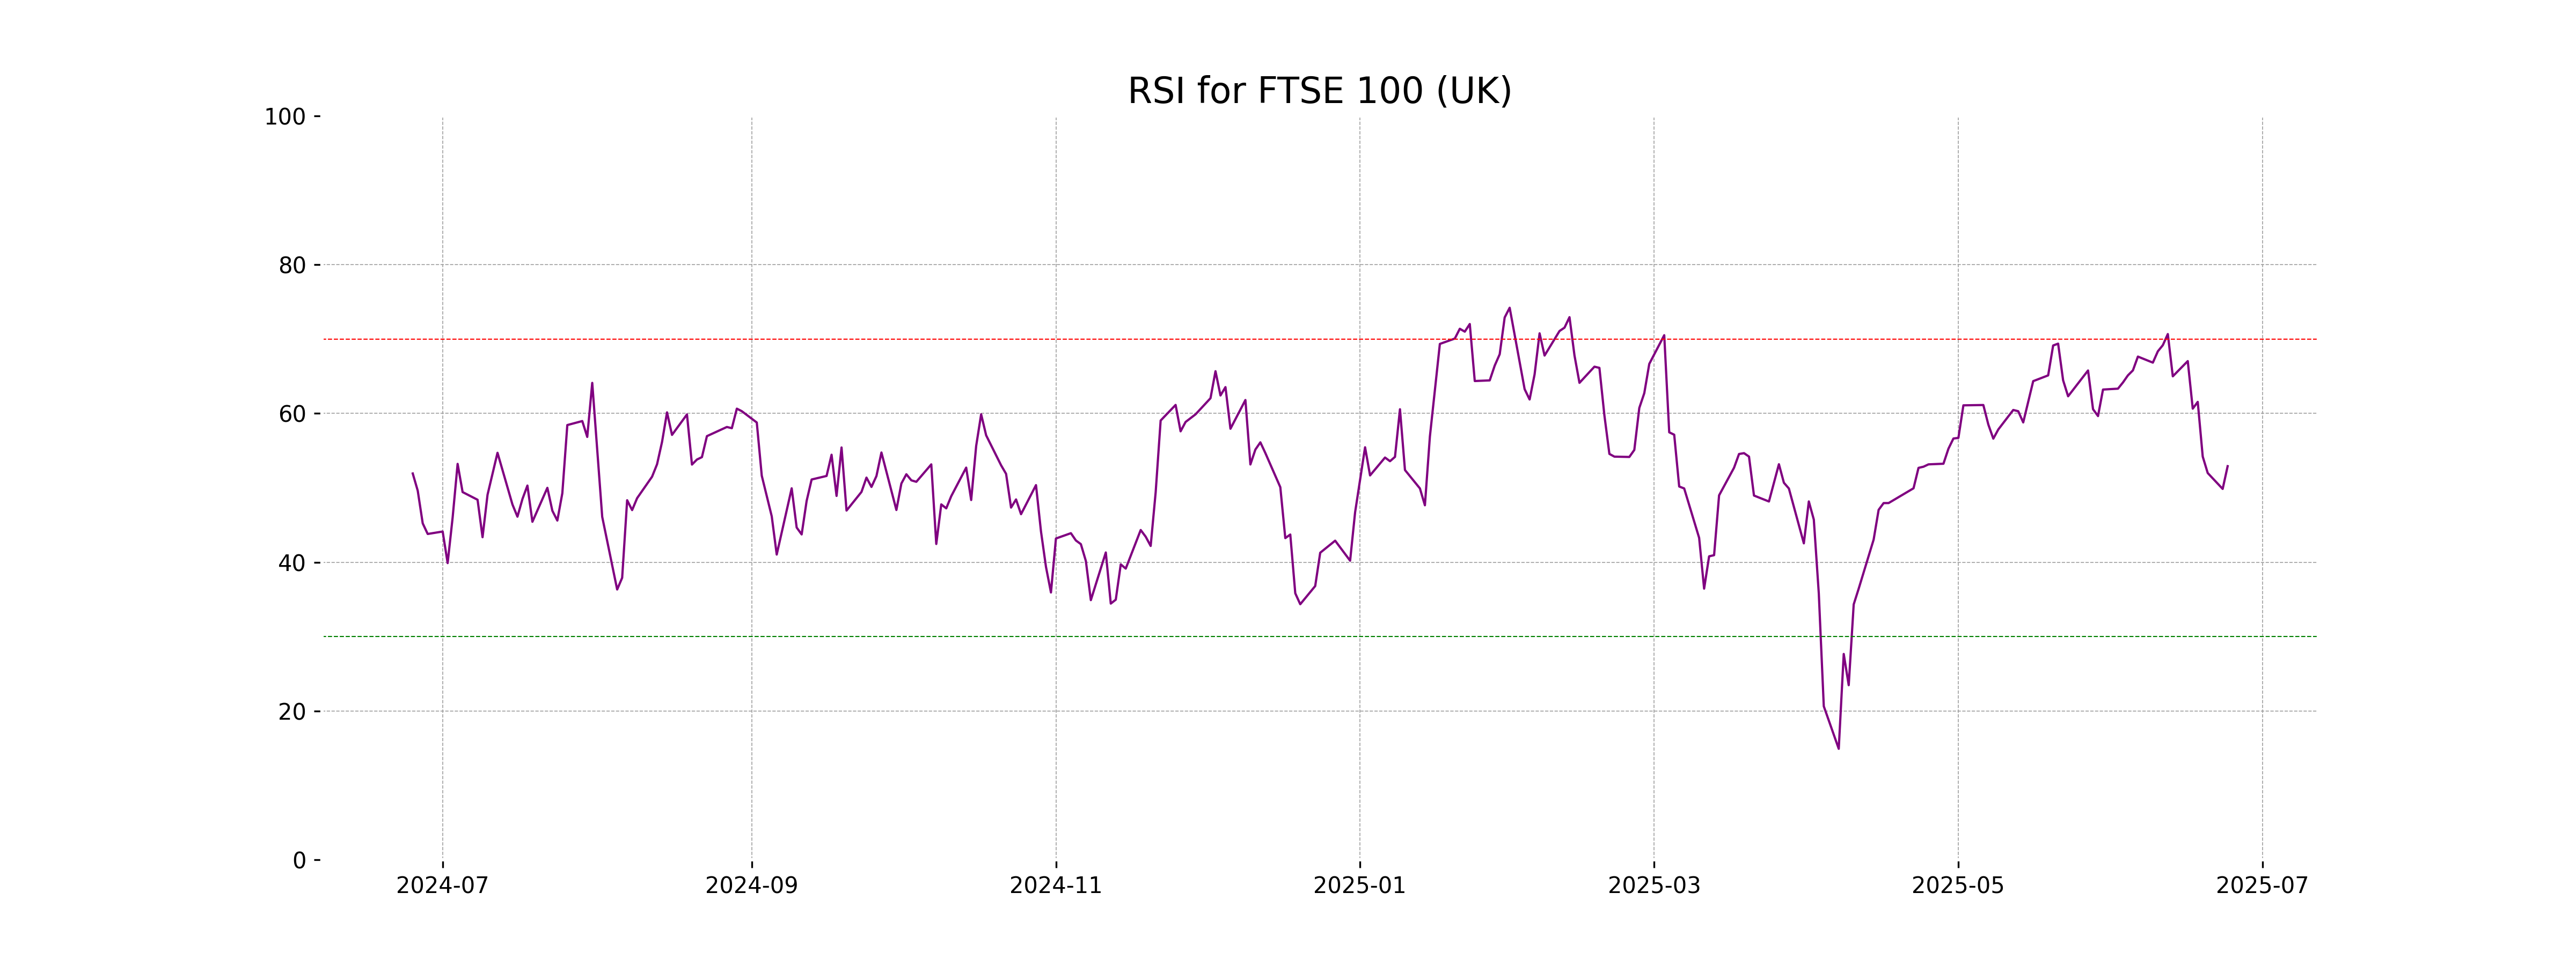
Analysis for FTSE 100 (UK) - June 24, 2025

The FTSE 100 index opened at 8758.04 and closed at 8782.48, showing a slight positive change of 0.28% or 24.48 points. The index has surpassed its 50-day EMA of 8688.50 and is below its 10-day EMA of 8803.64, indicating moderate short-term momentum. The RSI is at 52.91, suggesting a neutral market sentiment.
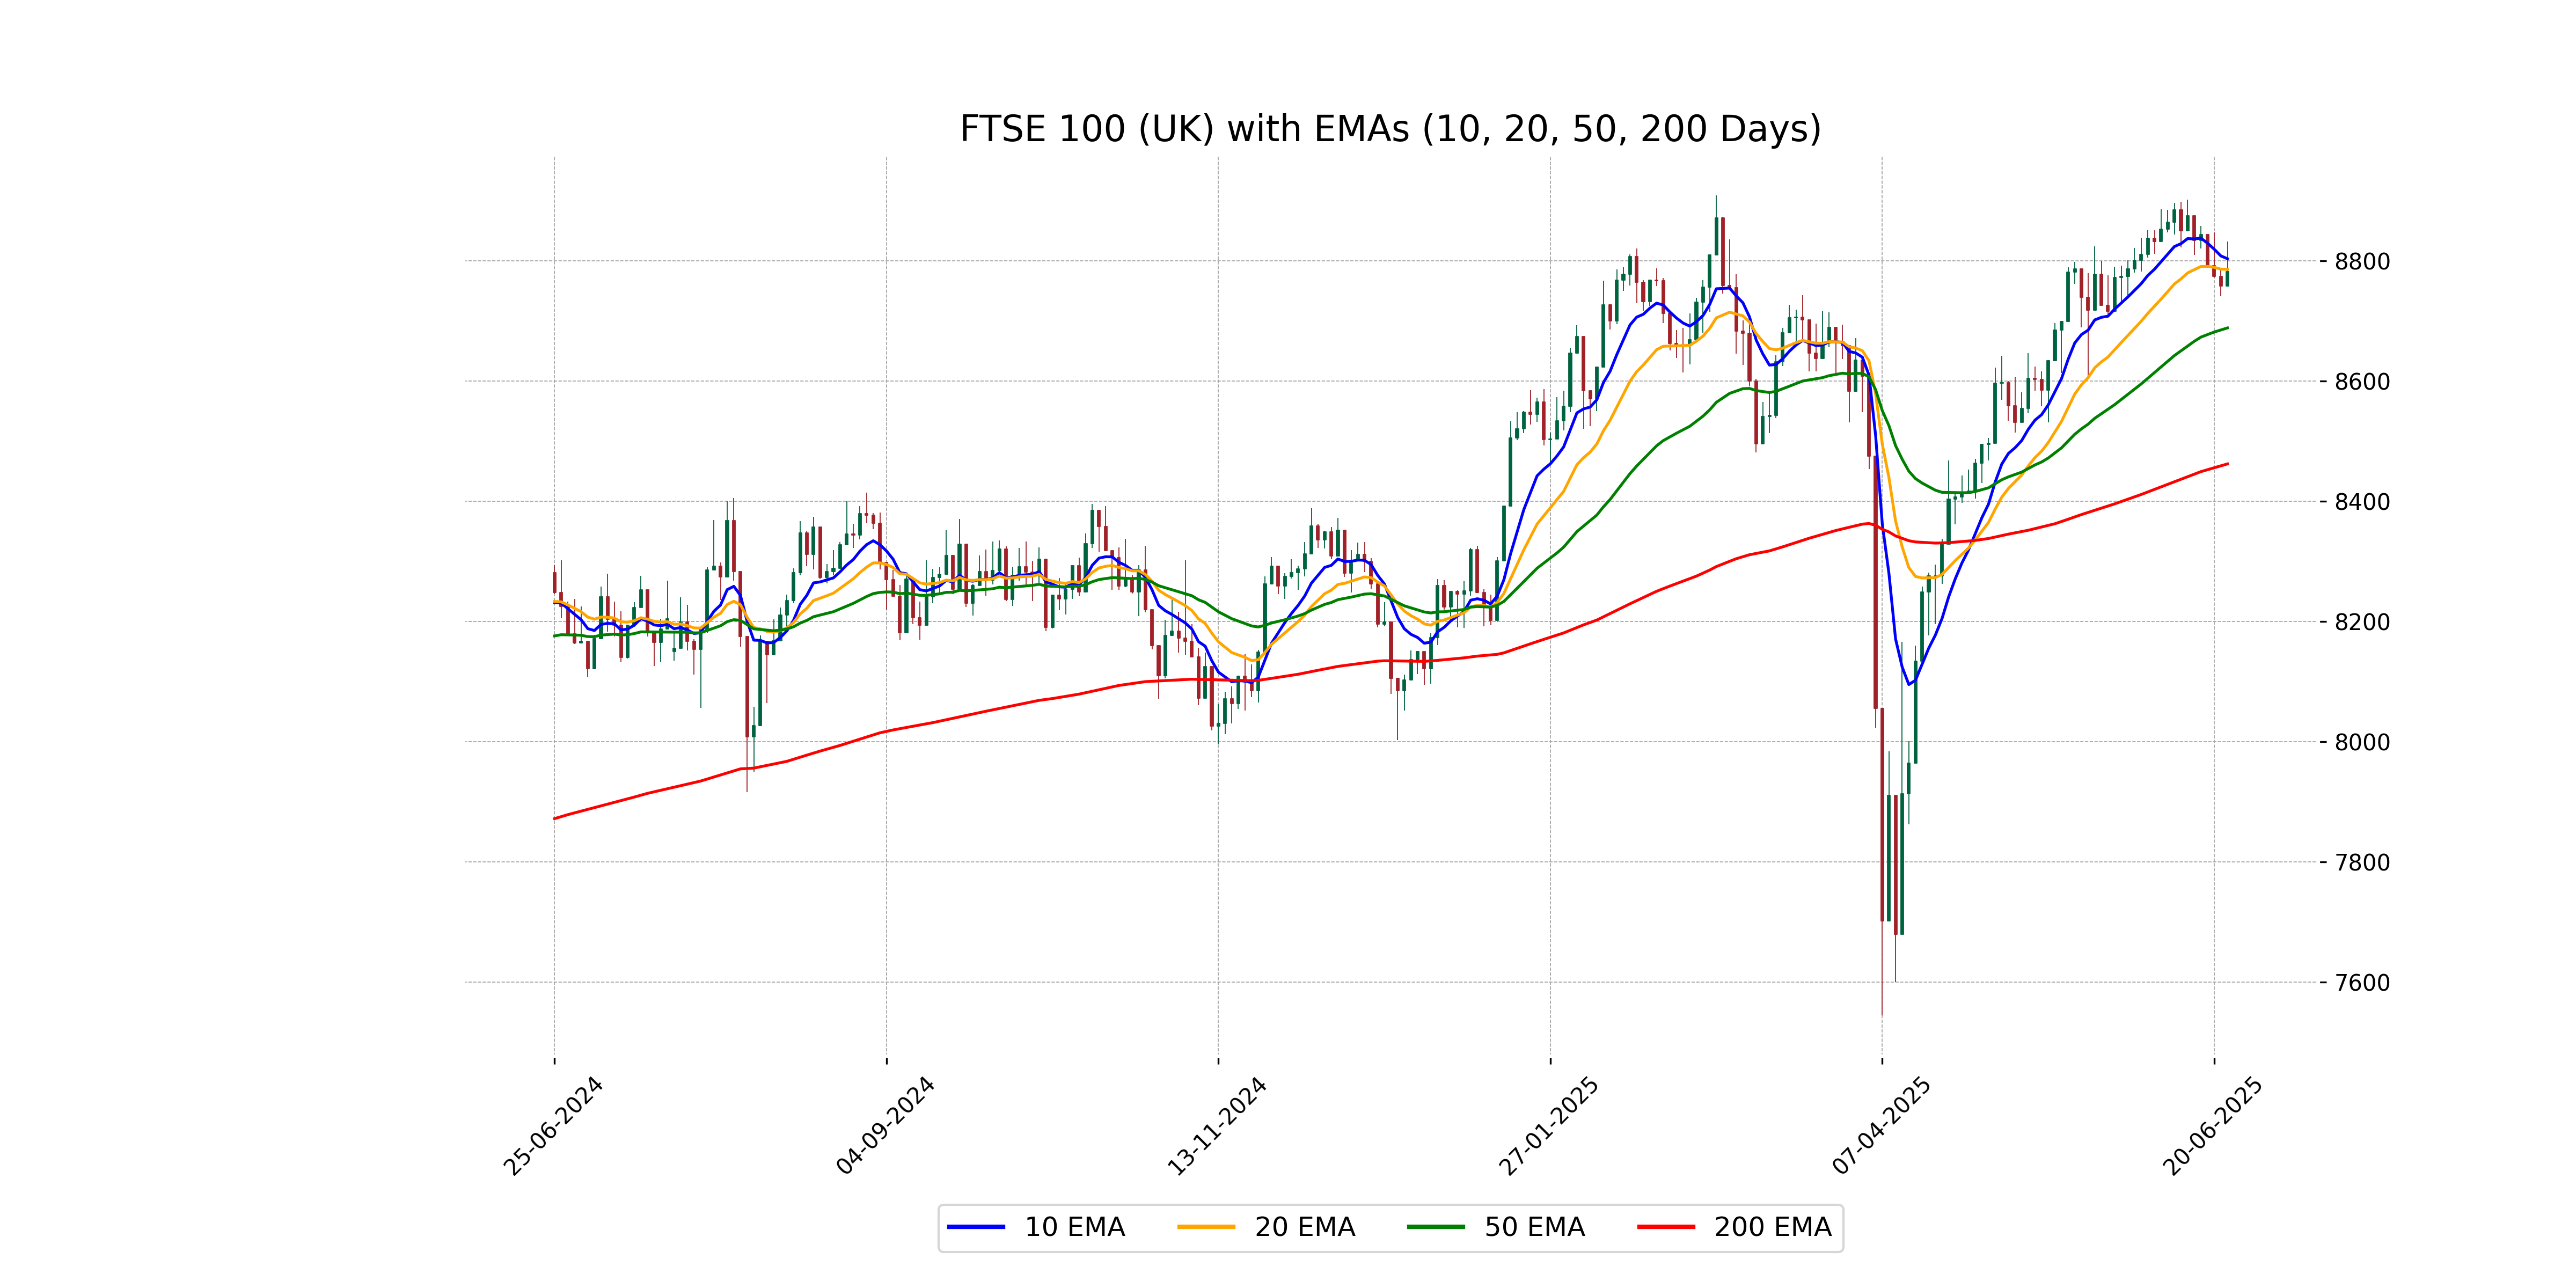
Relationship with Key Moving Averages
FTSE 100's current closing price at 8782.48 is above the 50 EMA of 8688.50 and the 200 EMA of 8462.20, indicating a short to long-term upward trend. However, it's slightly below the 10 EMA of 8803.64 and very close to the 20 EMA of 8785.97, suggesting potential short-term resistance.
Moving Averages Trend (MACD)
The MACD for FTSE 100 (UK) is at 39.22, while the MACD Signal line is at 60.16. Since the MACD is below the Signal line, it may suggest a bearish momentum, as it indicates the recent short-term average is lower than the long-term average.

RSI Analysis
The RSI (Relative Strength Index) for FTSE 100 is currently at 52.91, which suggests a neutral momentum, indicating that the index is neither overbought nor oversold. Investors might view this as a stable period with potential for change, depending on other market conditions.
Analysis for DAX (Germany) - June 24, 2025
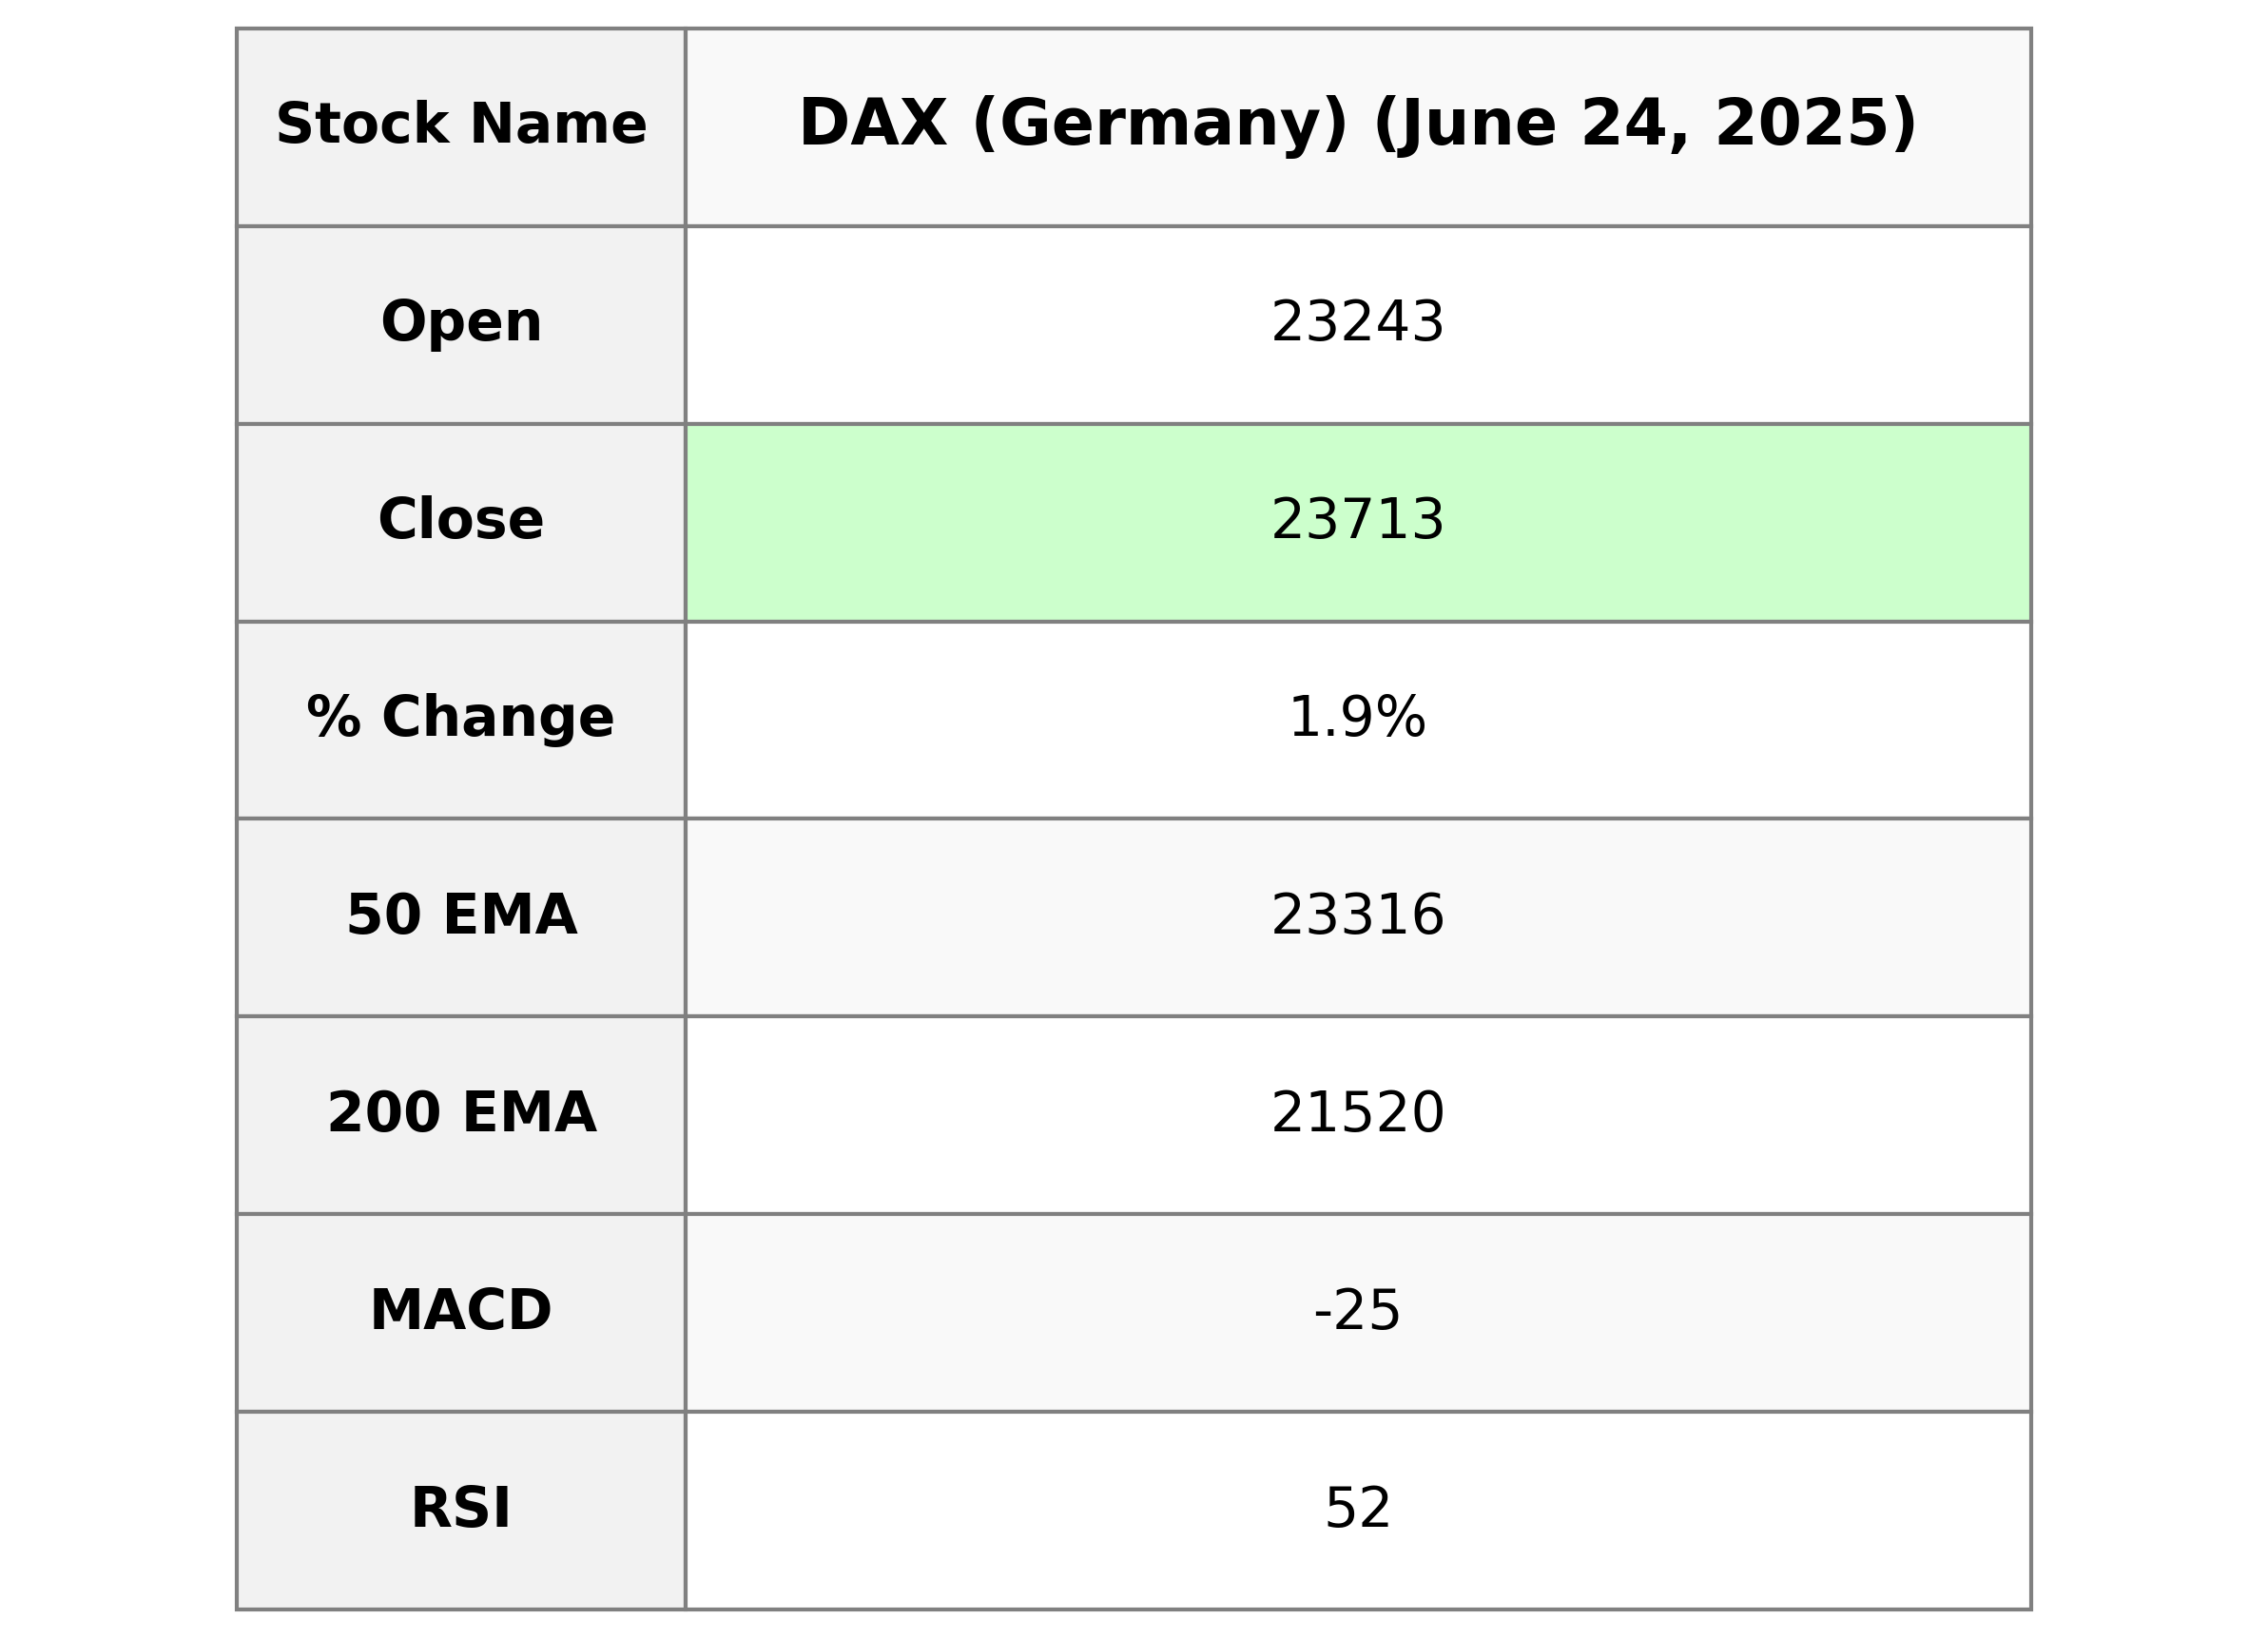
DAX (Germany) Performance: The DAX index opened at 23,242.90 and closed at 23,712.63, marking a 1.91% increase from the previous close of 23,269.01. Although the volume data is unavailable, the technical indicators such as the 50 EMA and 20 EMA suggest the index is performing above its short-term averages, while the RSI value of 52.46 indicates neutral market momentum.
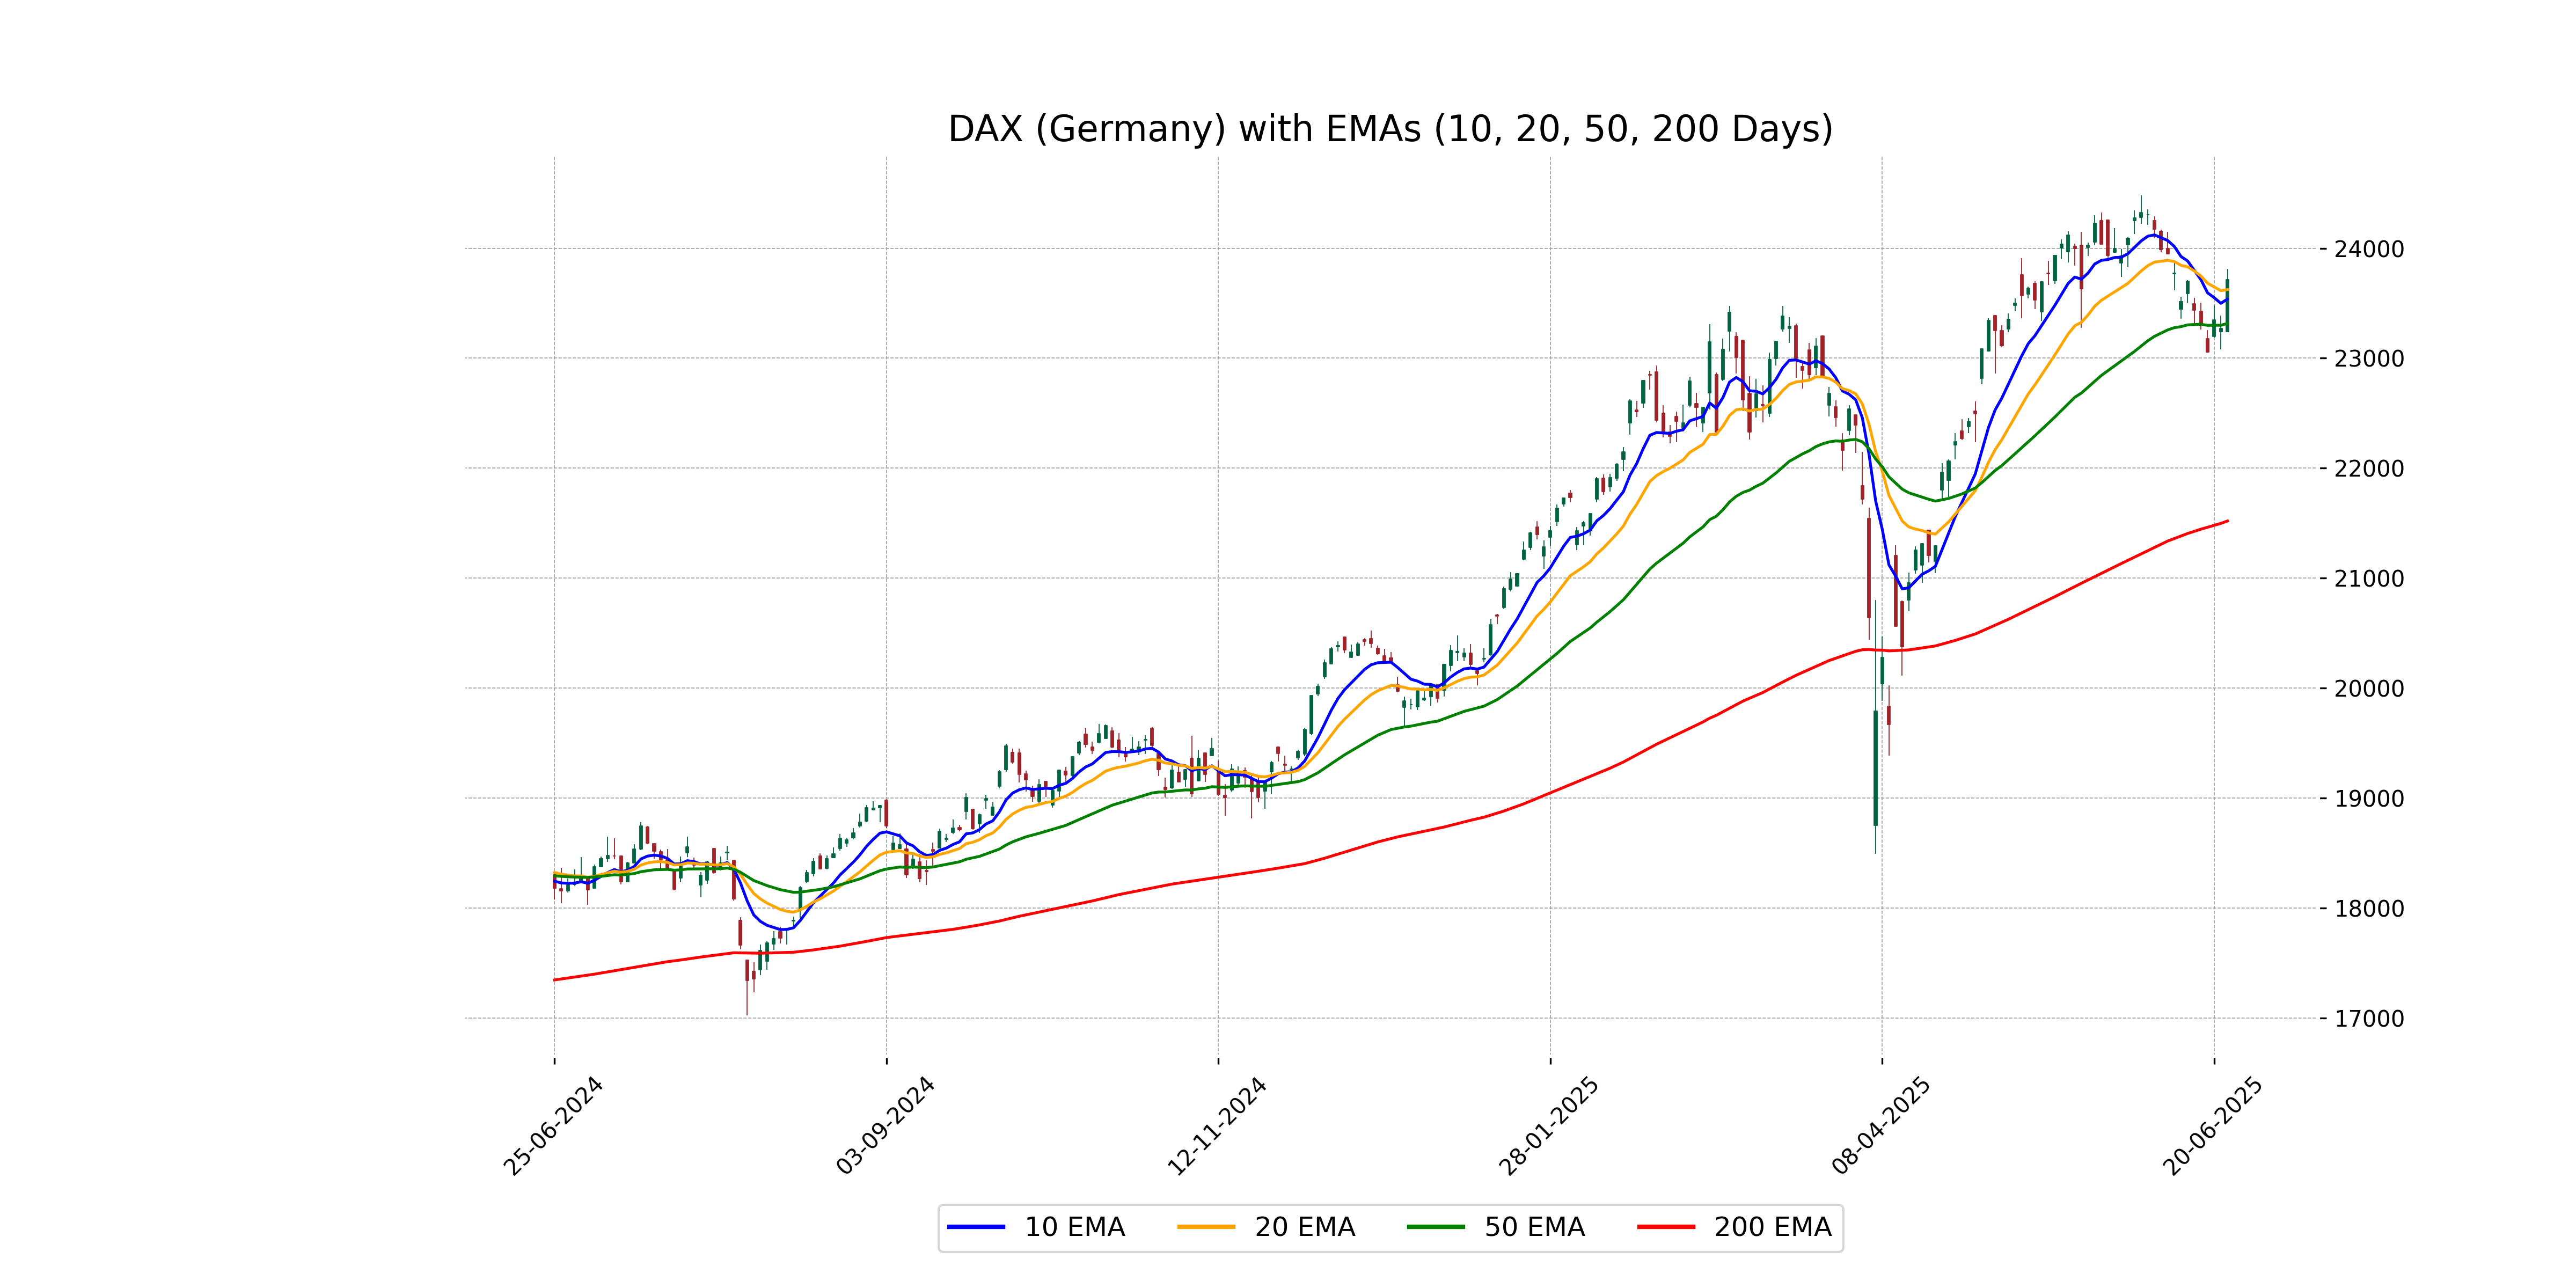
Relationship with Key Moving Averages
The DAX (Germany) closed at 23712.63, which is above its 10 EMA of 23538.01 and 50 EMA of 23315.88, indicating a potential bullish trend. However, it remains well above the 200 EMA of 21519.66, further confirming a longer-term positive momentum.
Moving Averages Trend (MACD)
MACD Analysis for DAX (Germany): The MACD for DAX is currently negative at -25.16, which is below the MACD Signal line at 75.75. This suggests that the market momentum is currently bearish, and the DAX may continue experiencing downward pressure unless there's a significant change in trends.

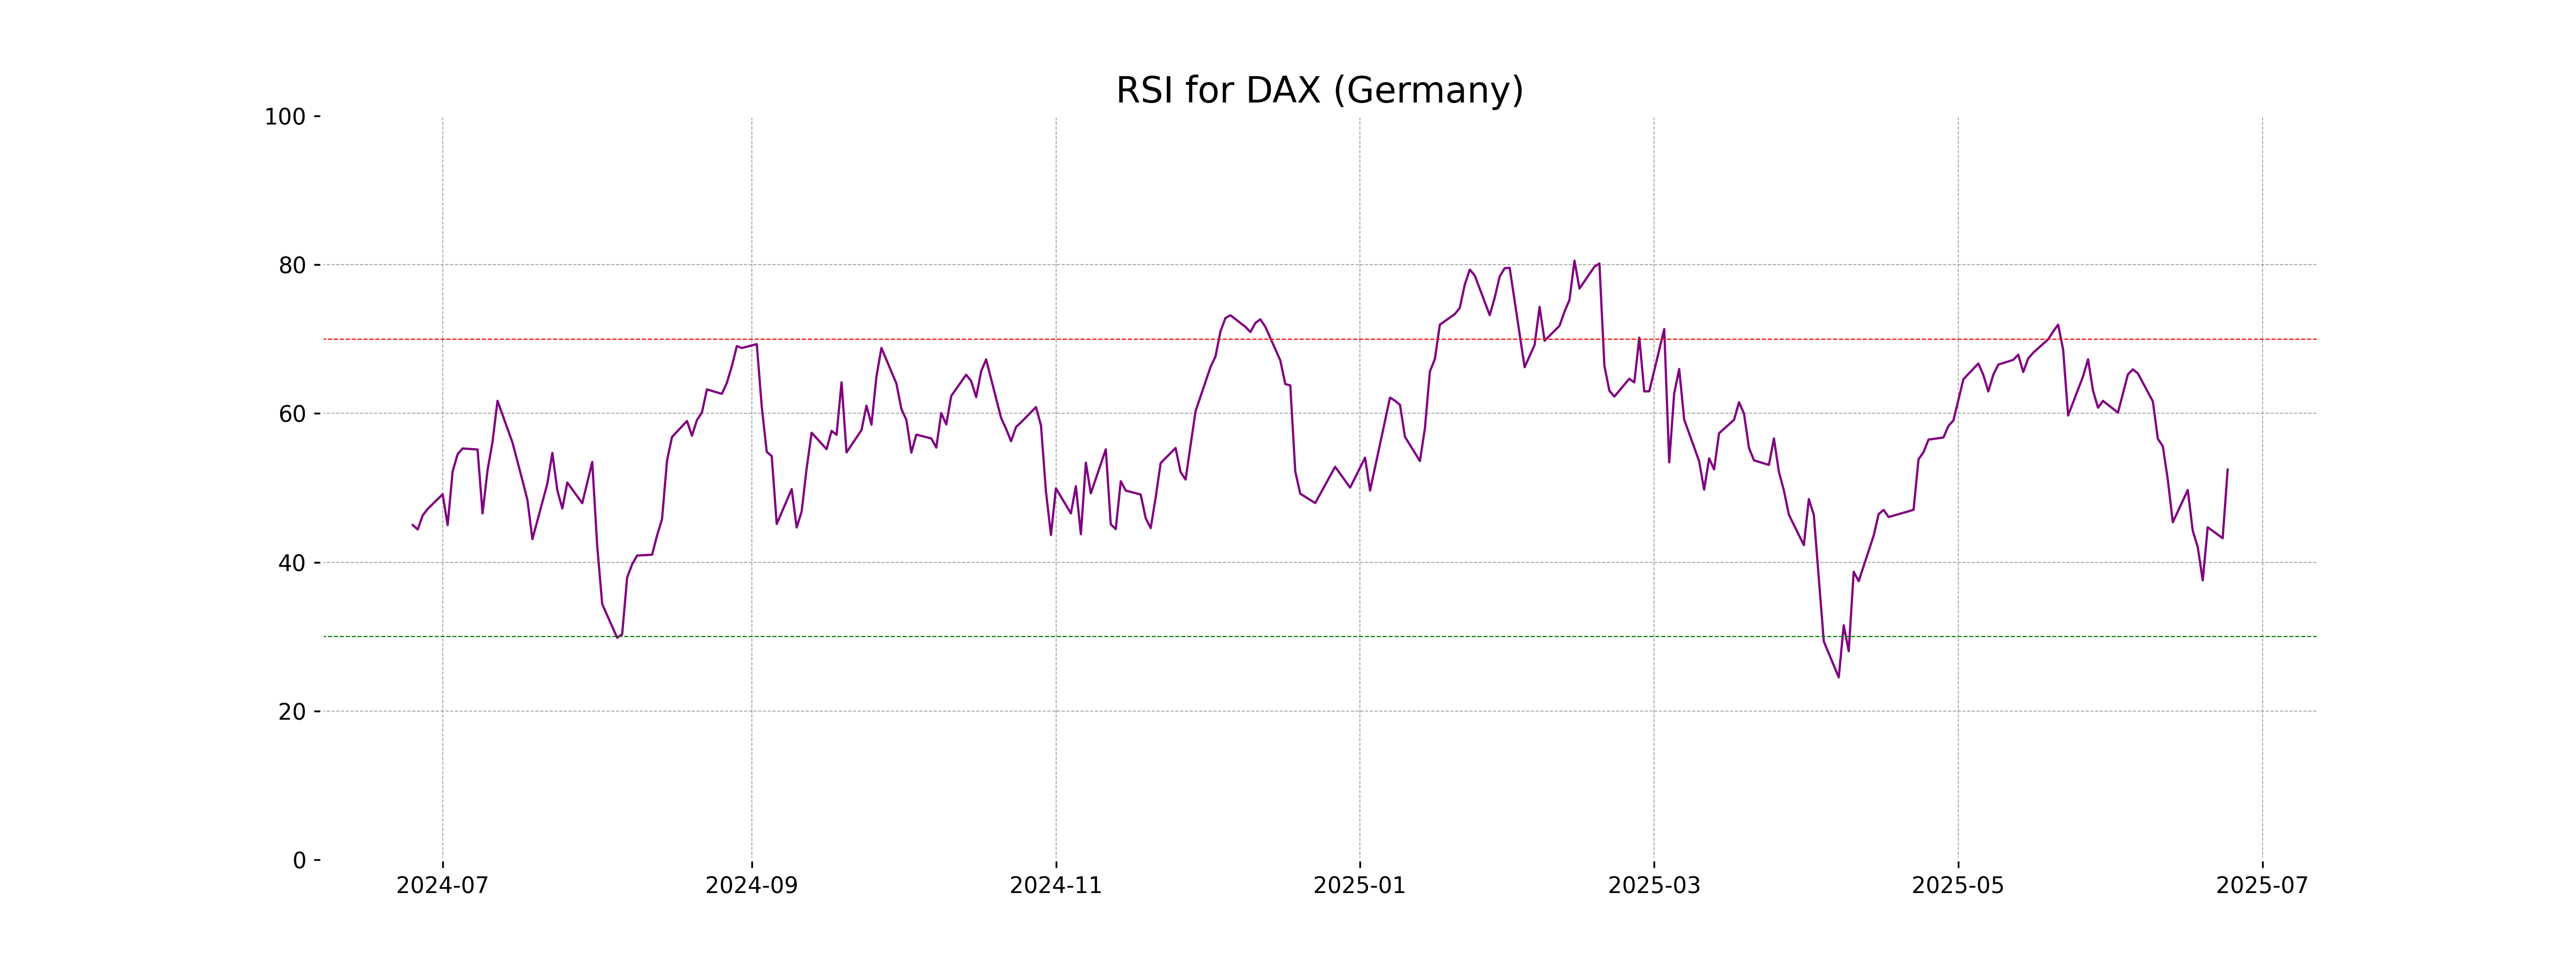
RSI Analysis
Based on the stock data provided for DAX (Germany), the RSI (Relative Strength Index) is 52.46, which is considered to be in the neutral range. This suggests that the index is neither overbought nor oversold, indicating a balance between buying and selling pressures at the moment.
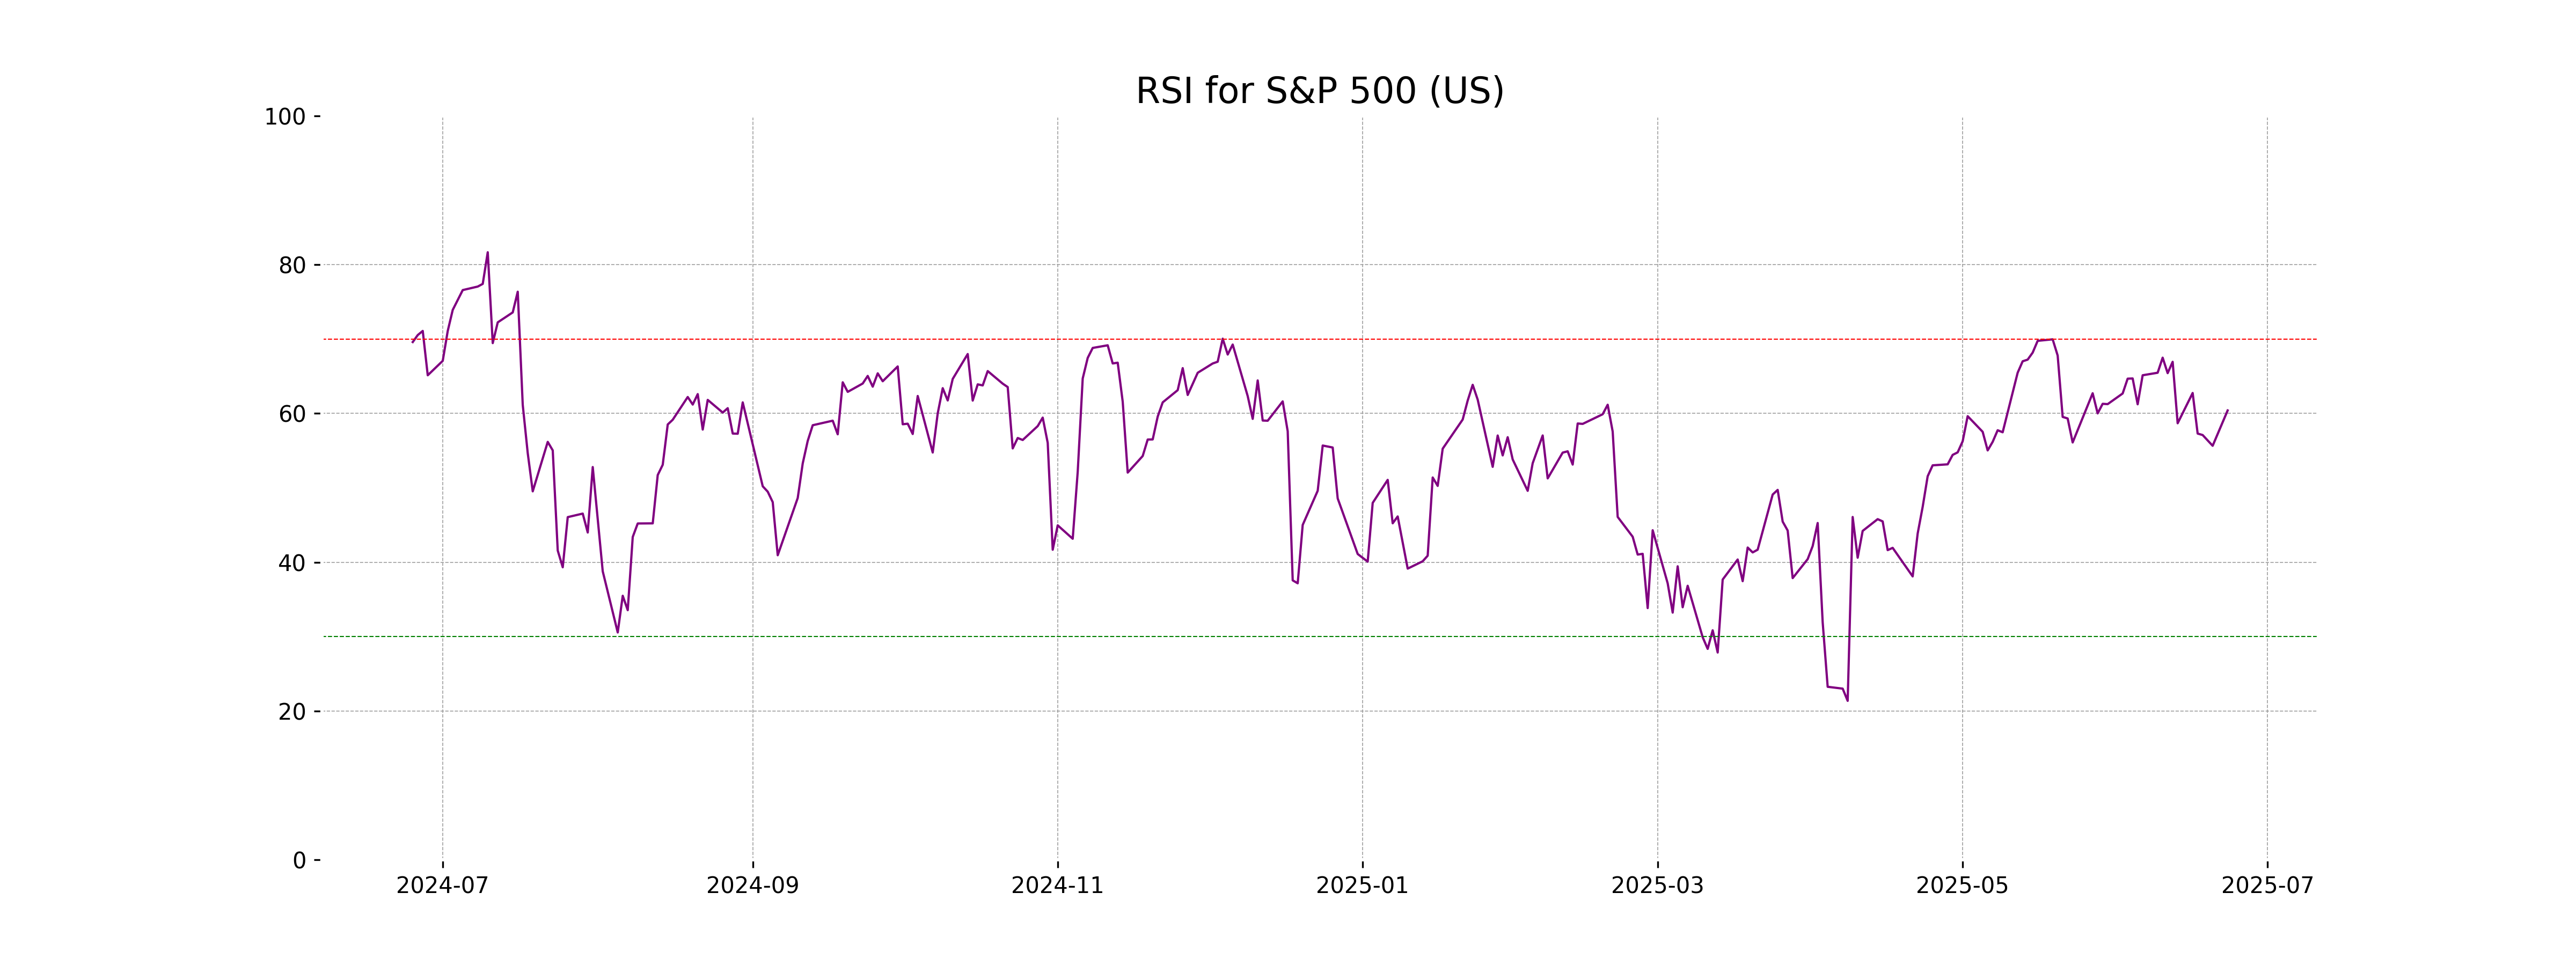
Analysis for S&P 500 (US) - June 24, 2025
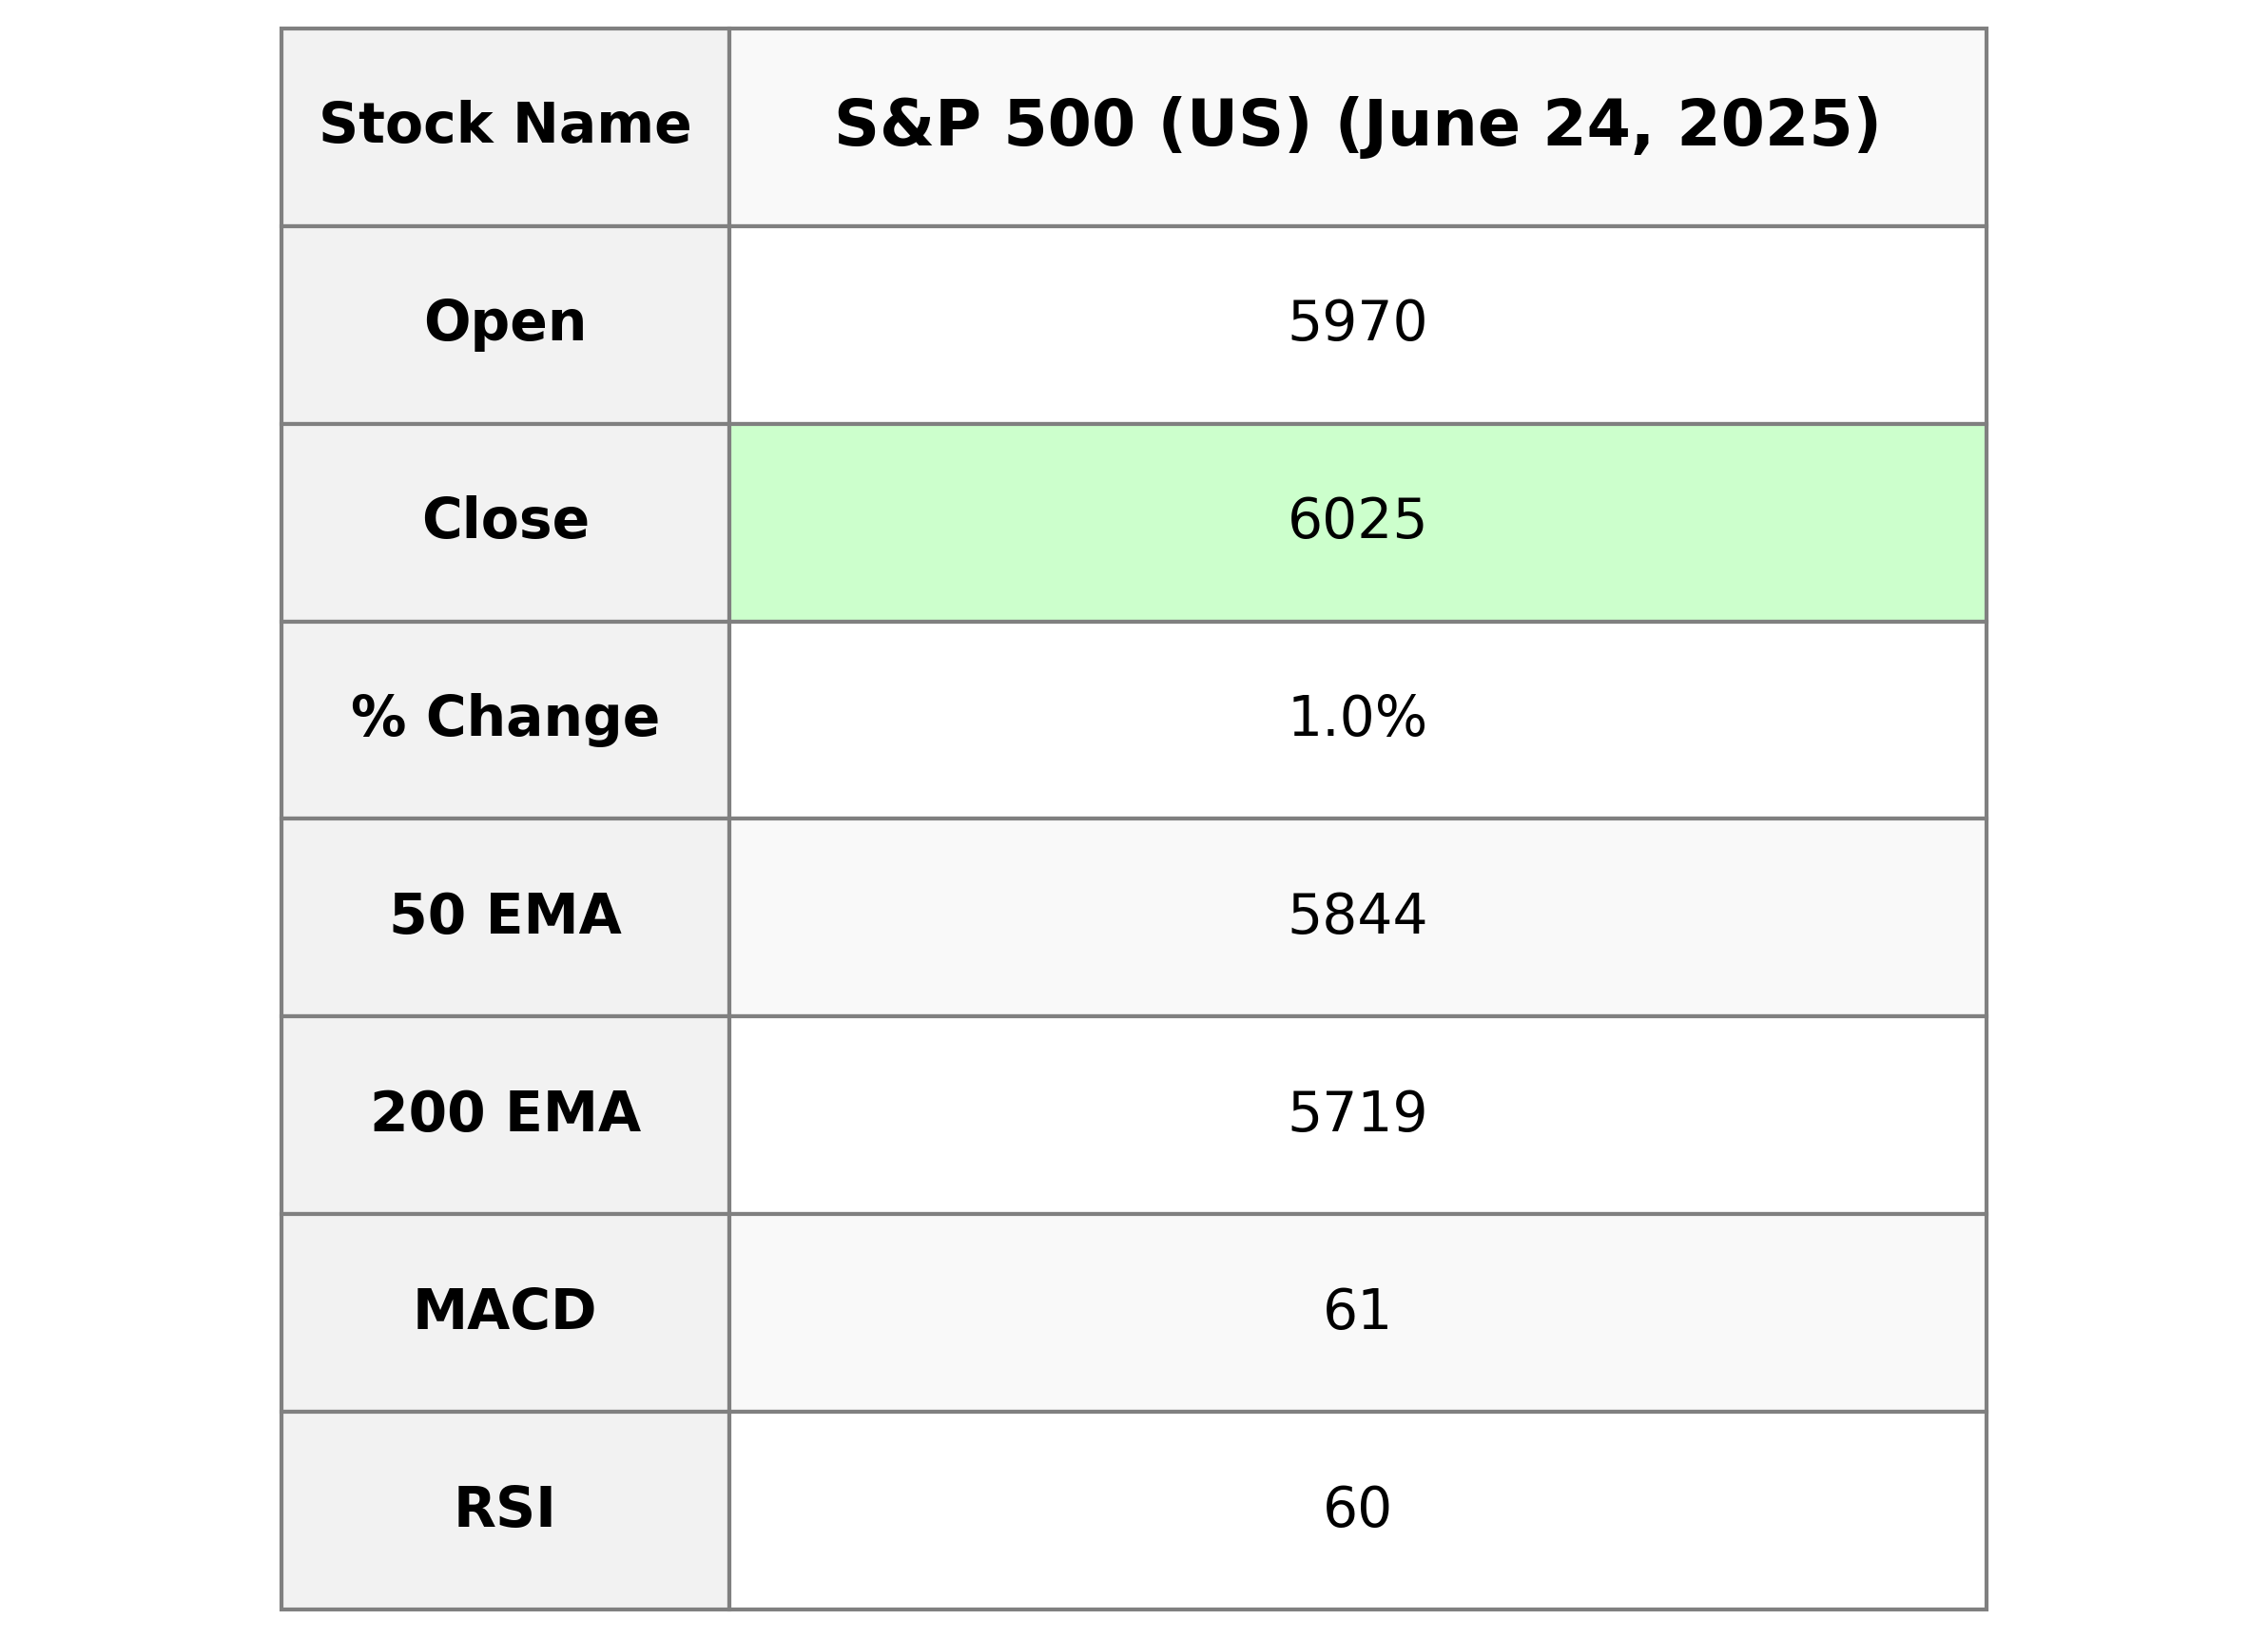
The S&P 500 (US) opened at 5969.67 and closed at 6025.17, marking a 0.96% increase with a points change of 57.33. The index saw a high of 6028.77 and a low of 5943.23, with a significant trading volume of 5.6 billion shares. The current RSI of 60.40 suggests moderate momentum, while the MACD indicates a slight bearish trend due to the MACD signal being above the MACD value.
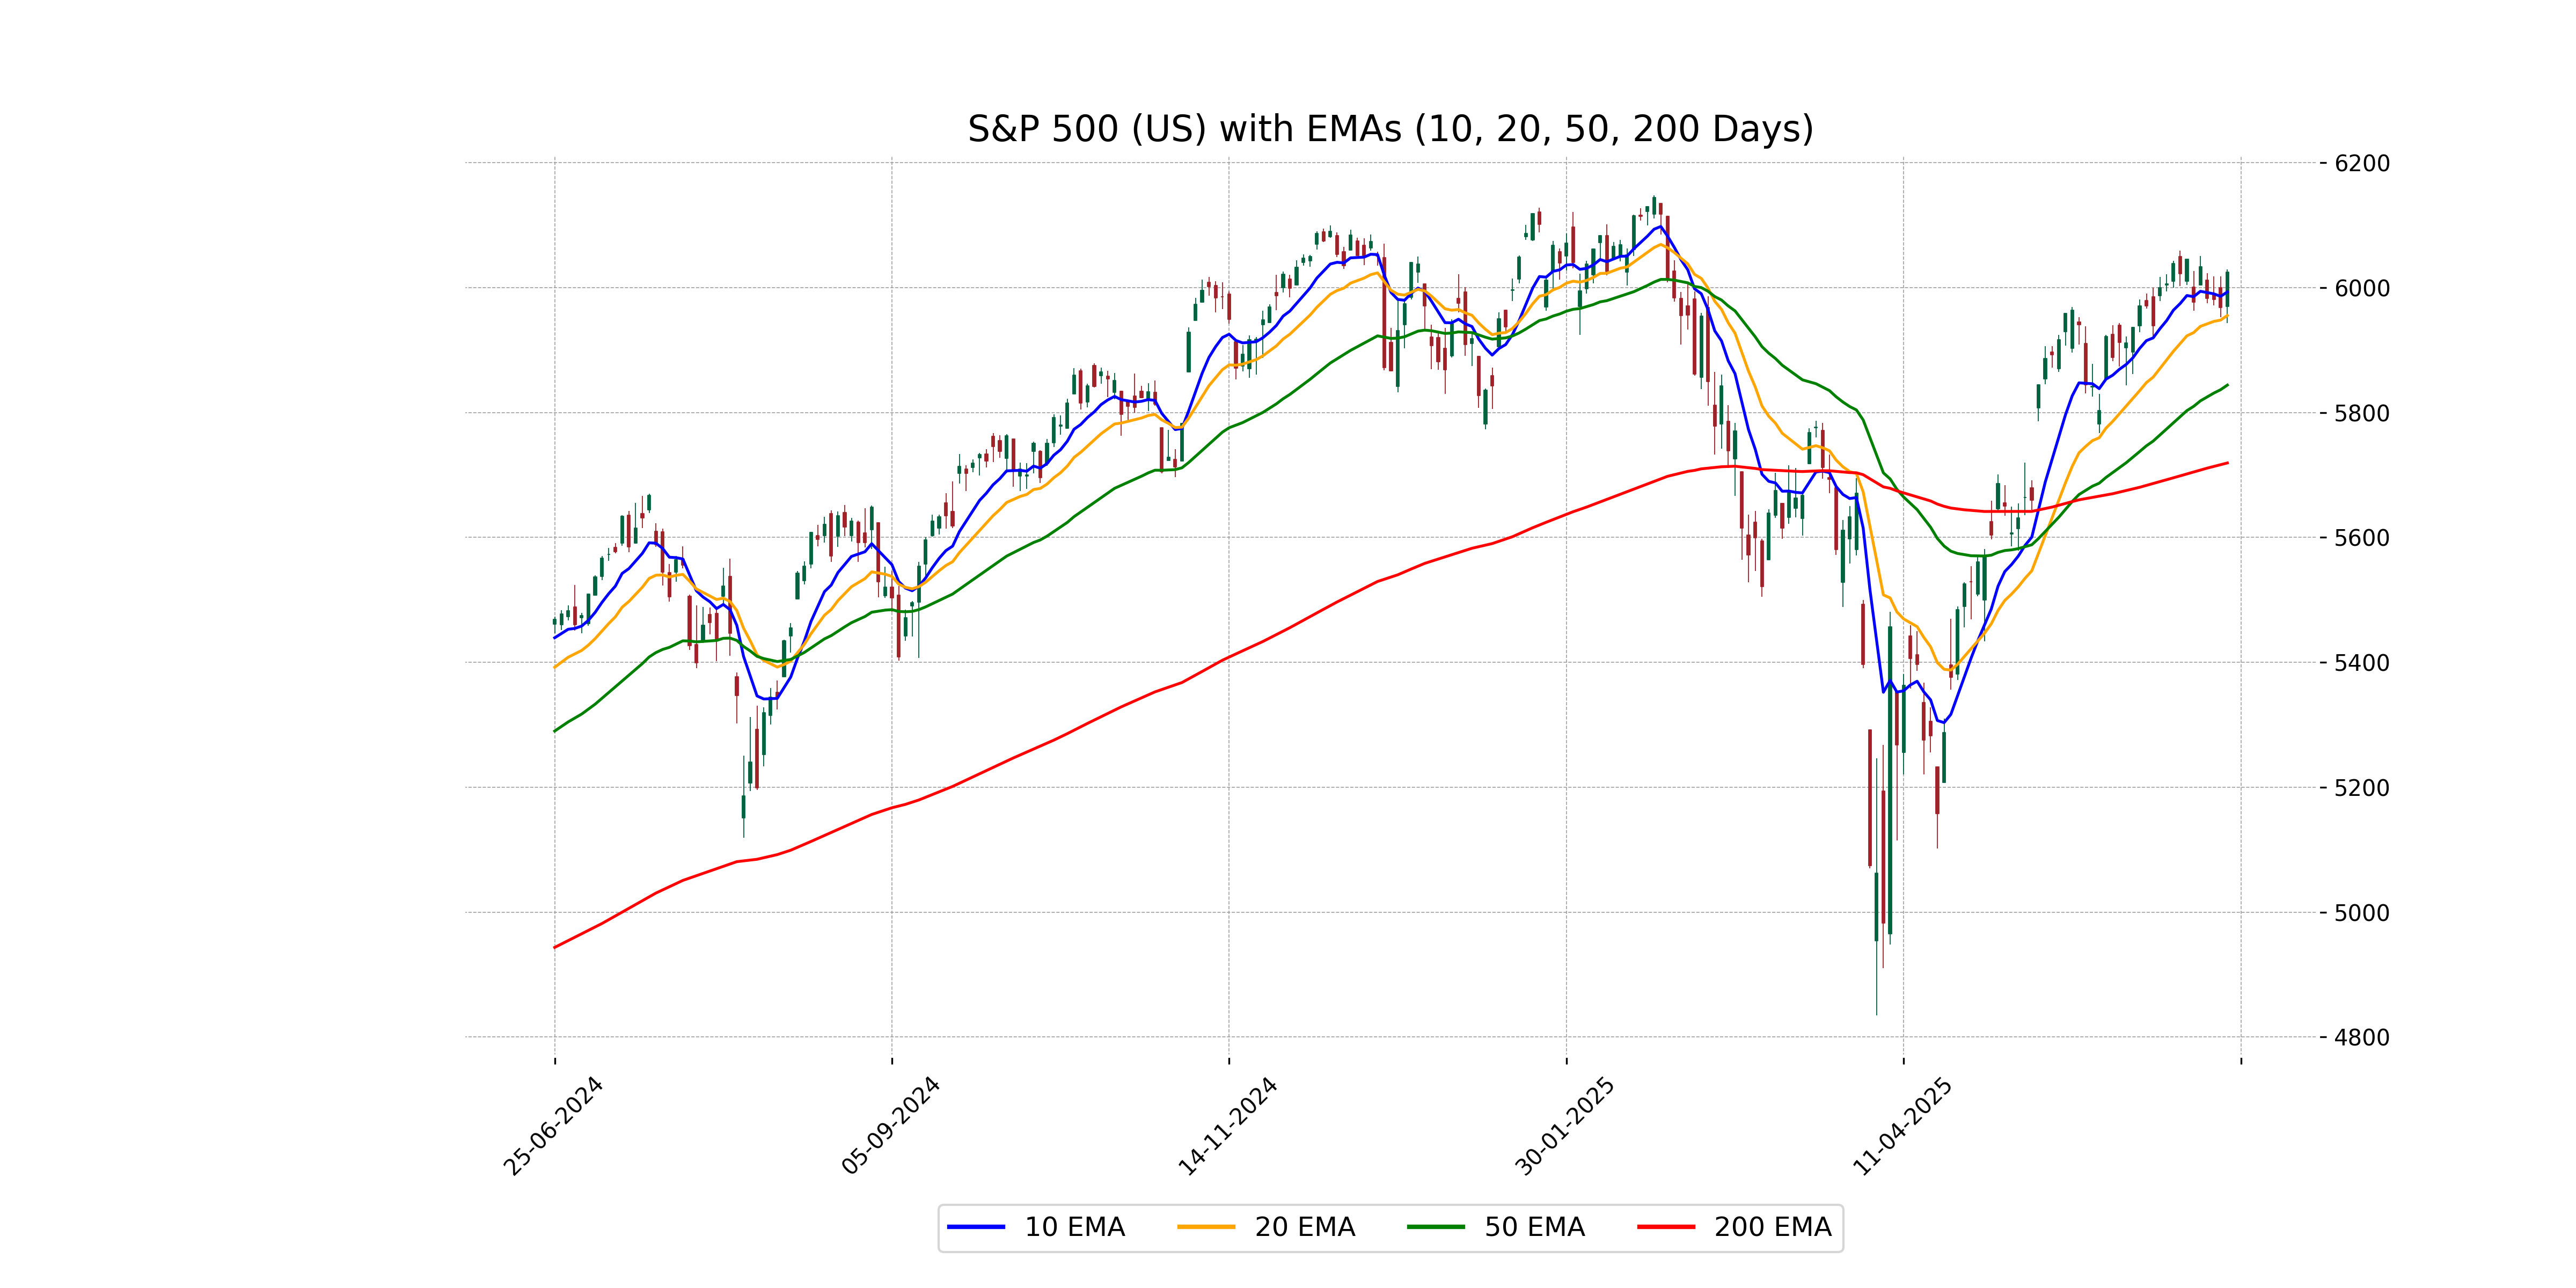
Relationship with Key Moving Averages
S&P 500 is trading above its 50 EMA (5843.94) and 200 EMA (5719.24), indicating a bullish trend. It is also slightly above its 10 EMA (5993.12) and 20 EMA (5955.35), reinforcing short-term strength.
Moving Averages Trend (MACD)
The MACD value for the S&P 500 is 61.34 while the MACD Signal is 74.07. The negative MACD line crossing below the signal line suggests a potential bearish momentum, indicating a possible signal of weakness or a sell signal in the near term.
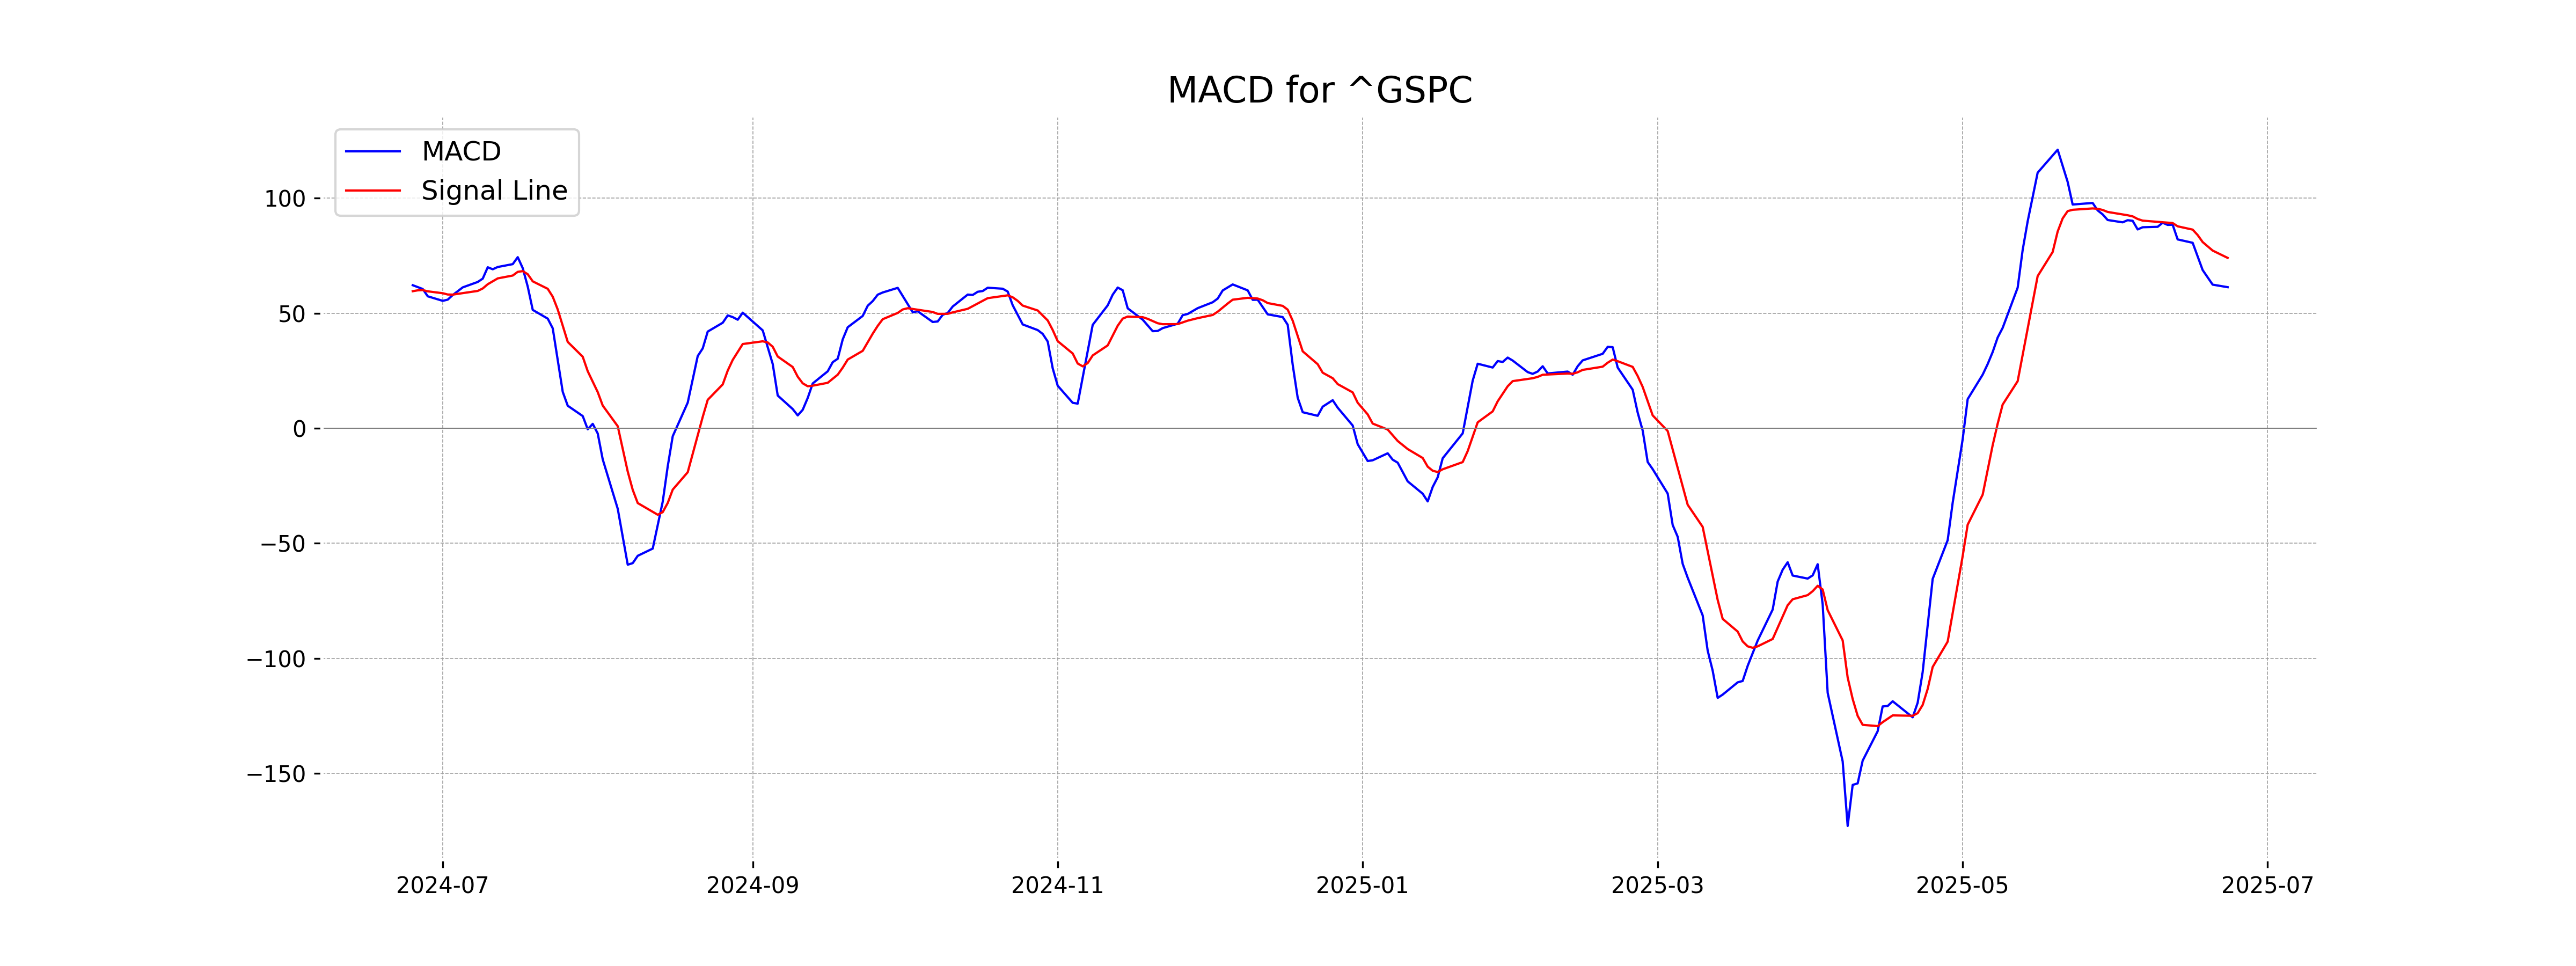
RSI Analysis
The S&P 500 has an RSI of 60.40, indicating that the index is experiencing moderate strength and momentum. It's not in overbought territory, suggesting there might still be room for upward movement without immediate risk of a downturn.
Analysis for Hang Seng Index (Hong Kong) - June 24, 2025
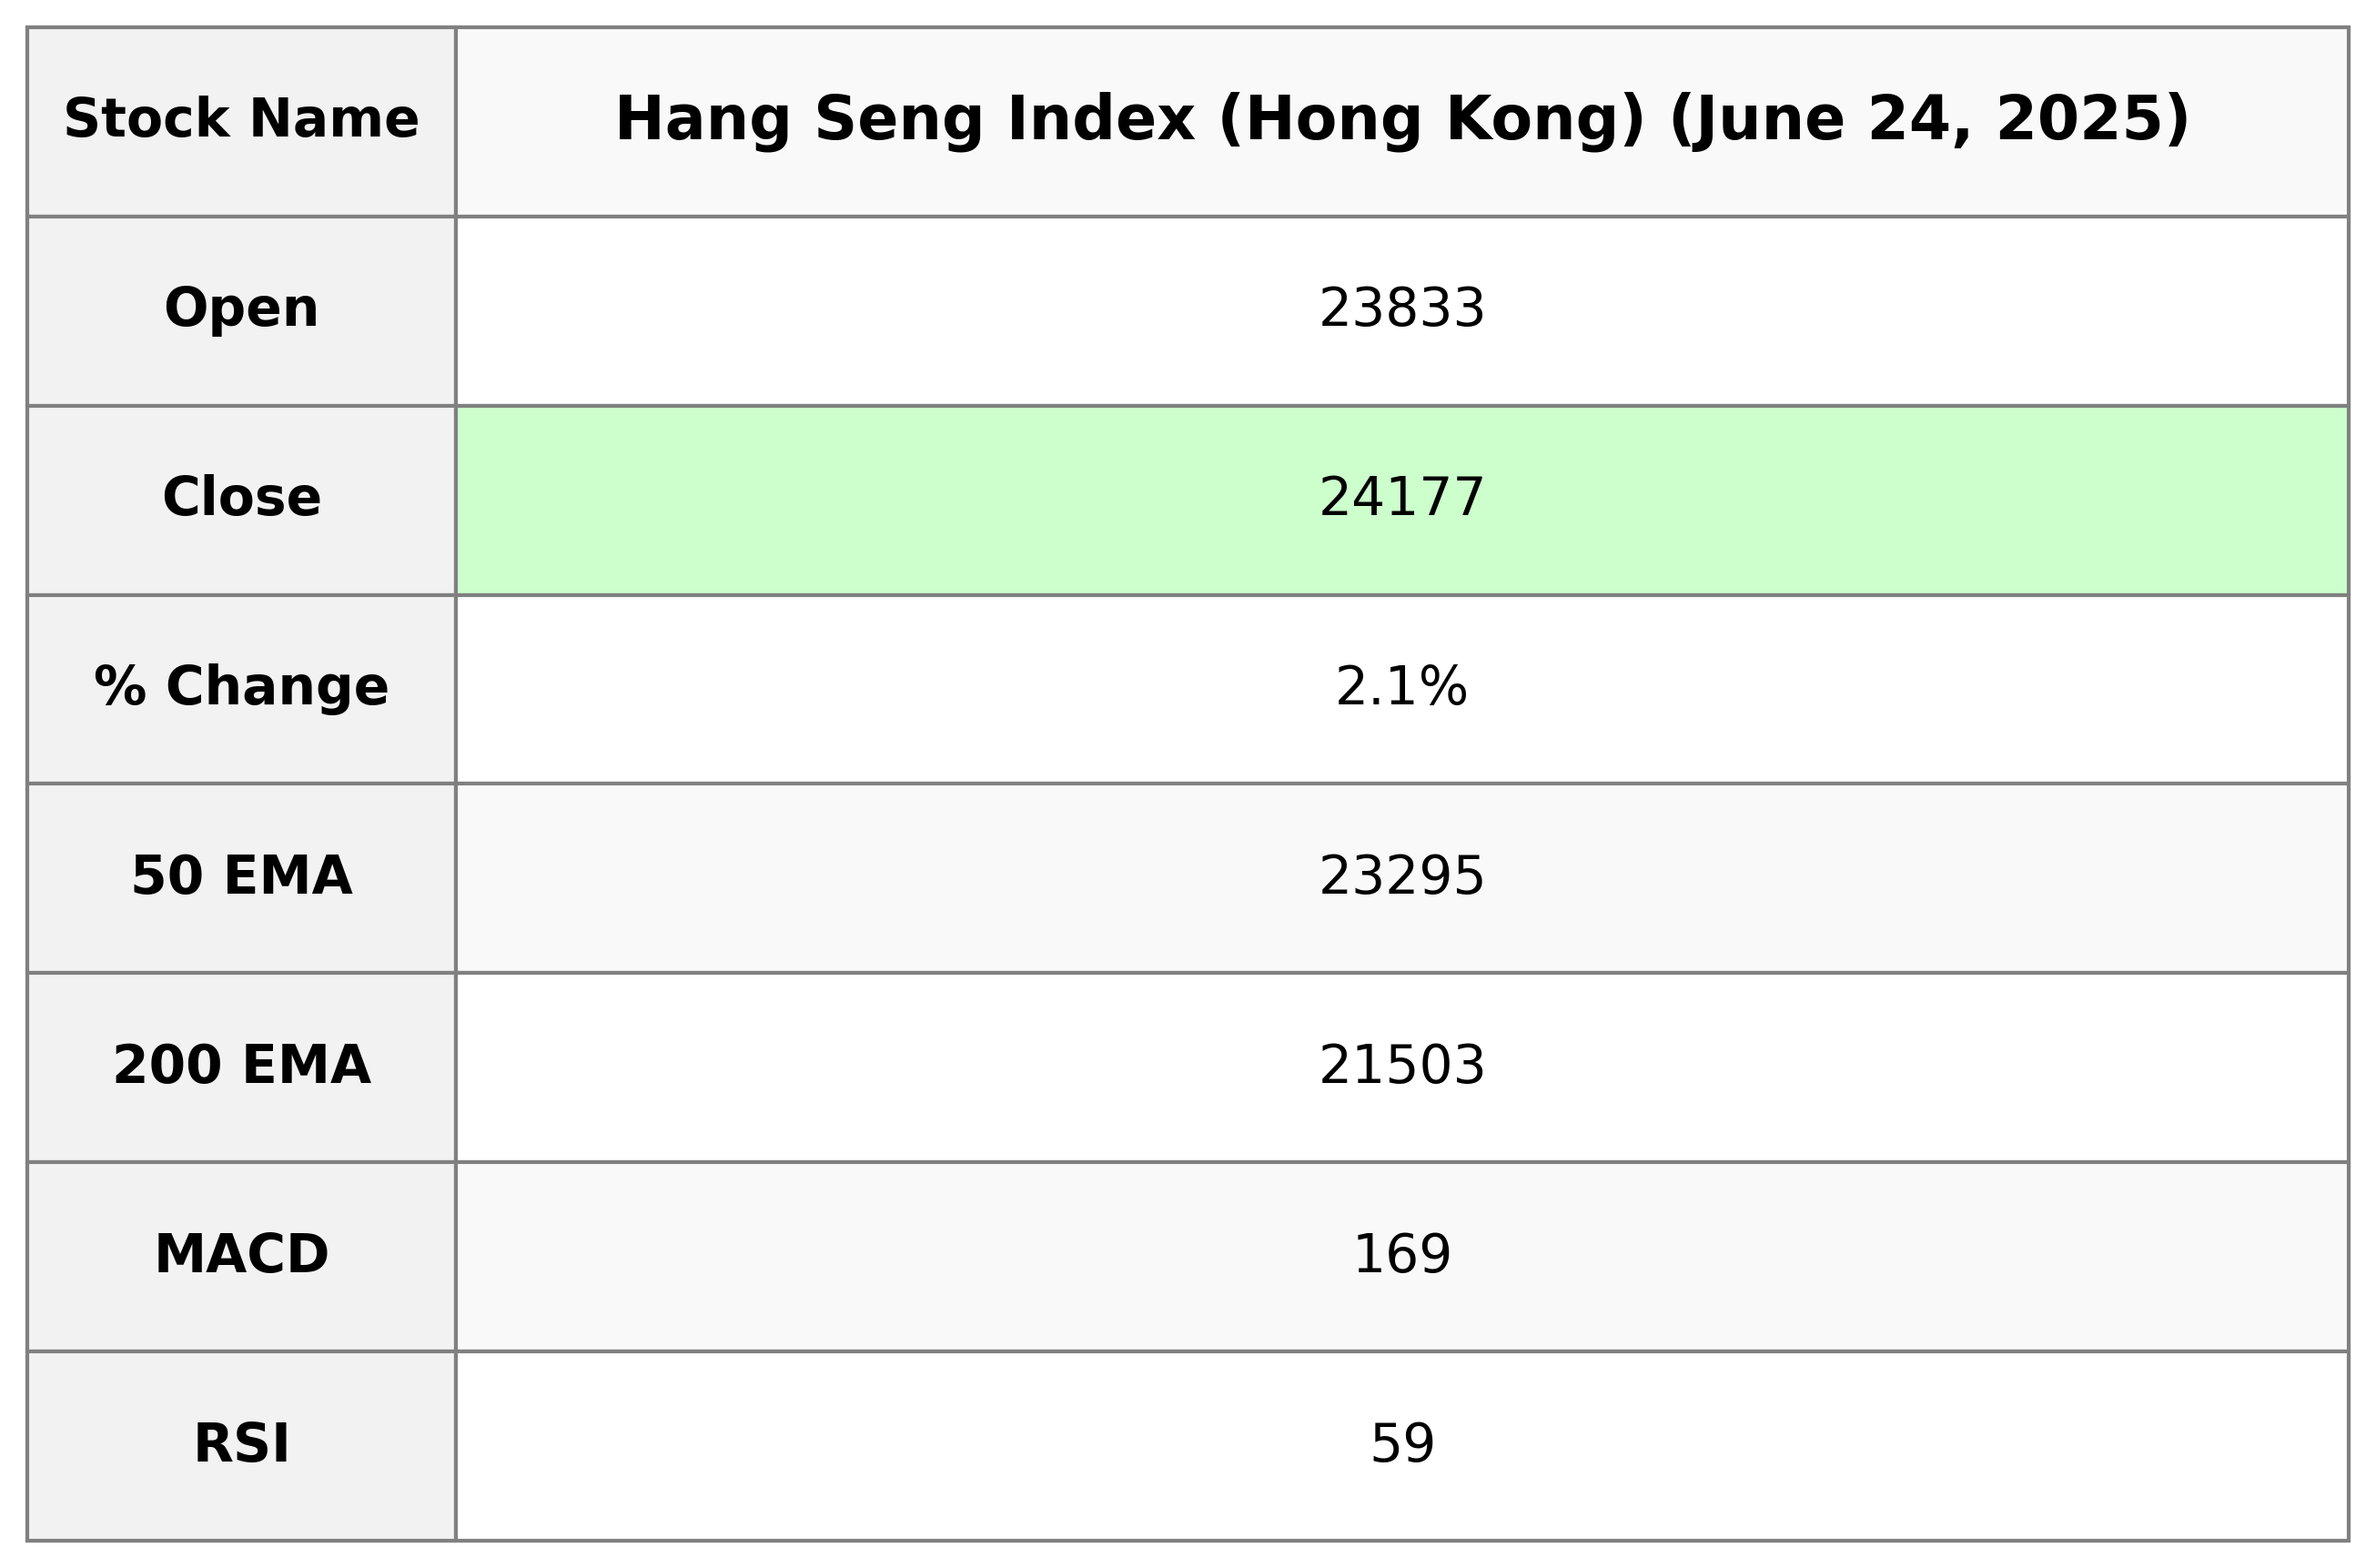
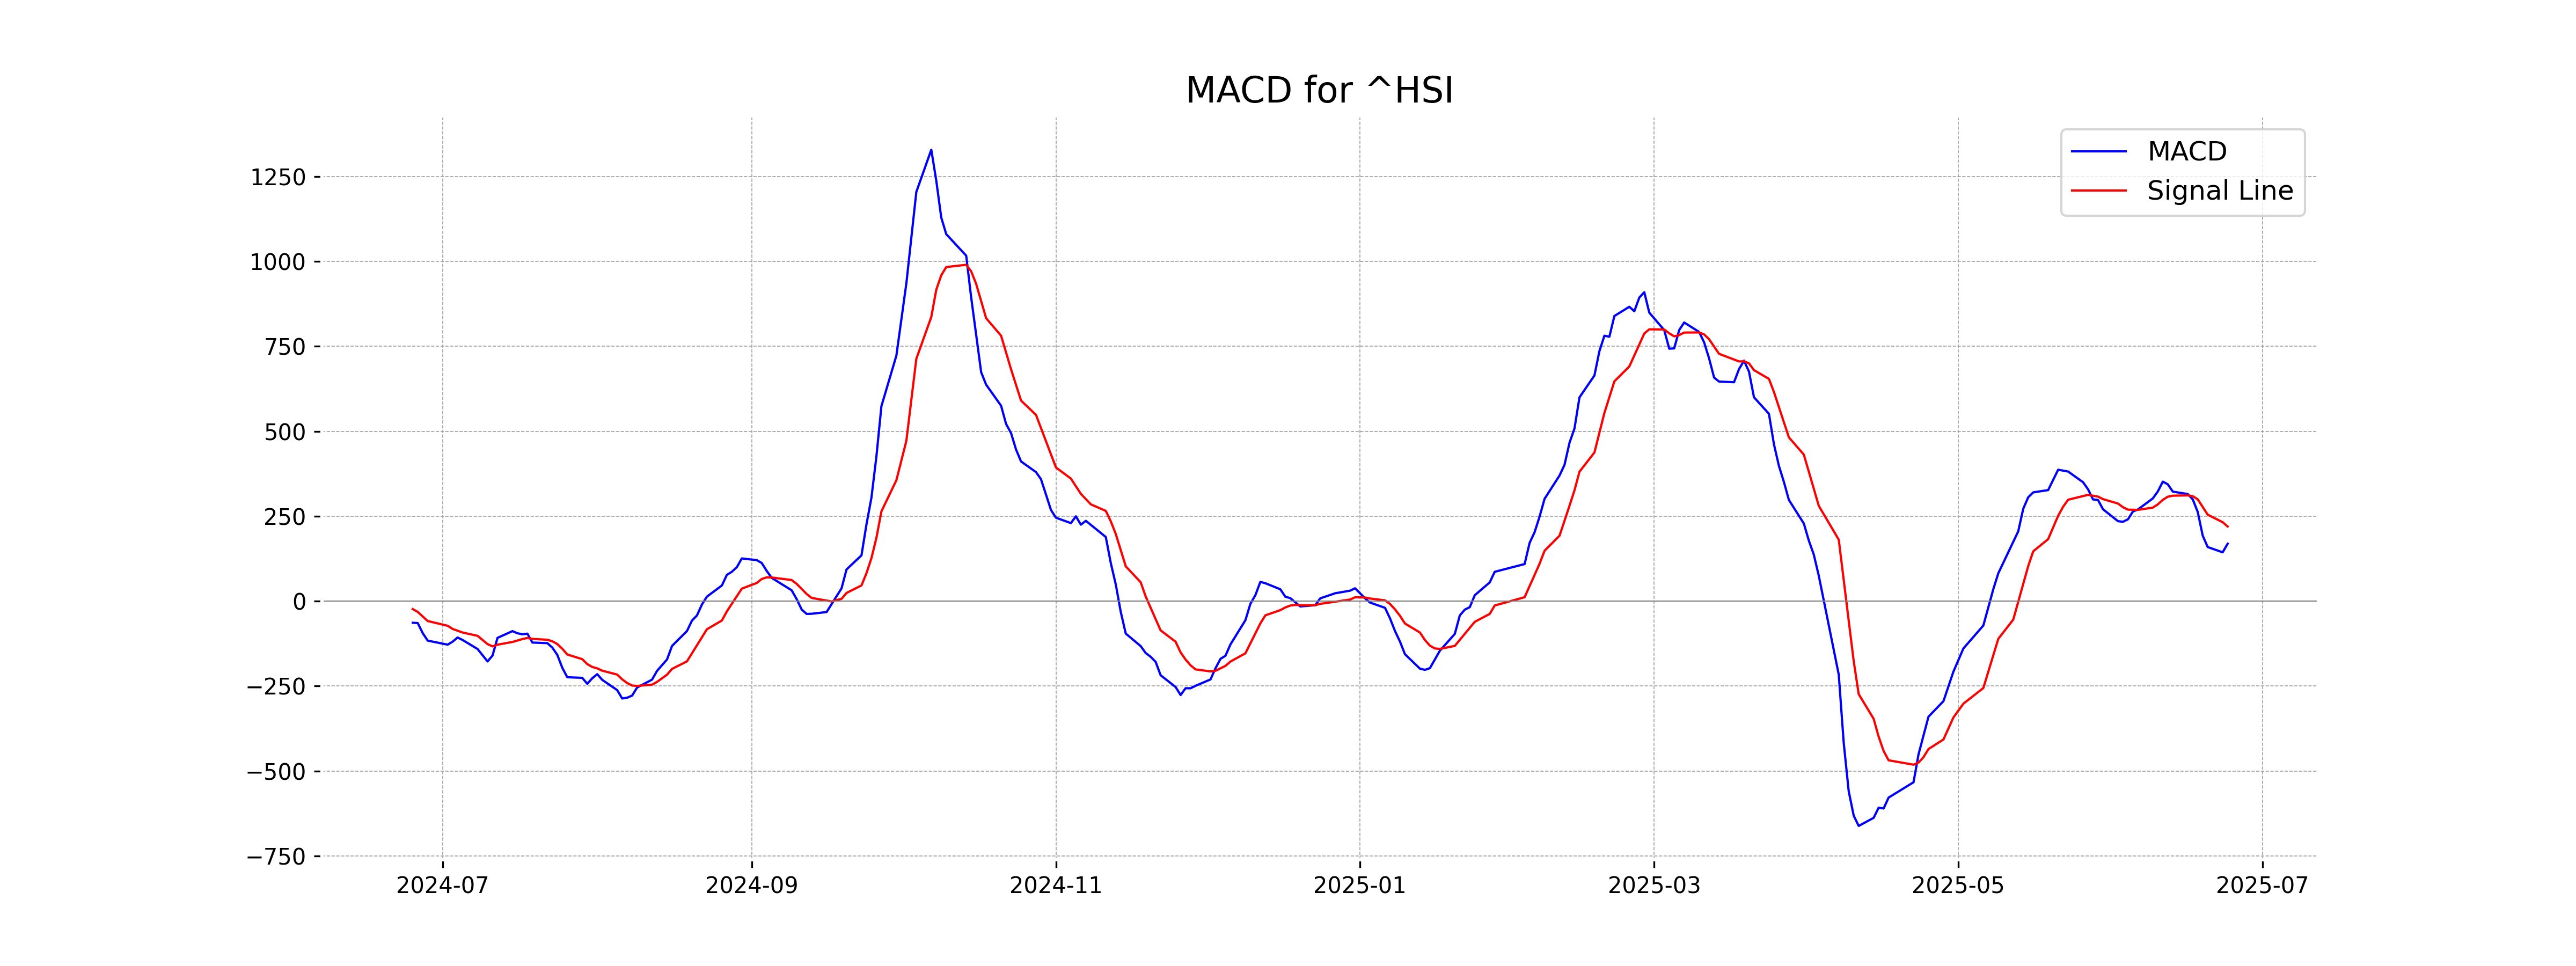
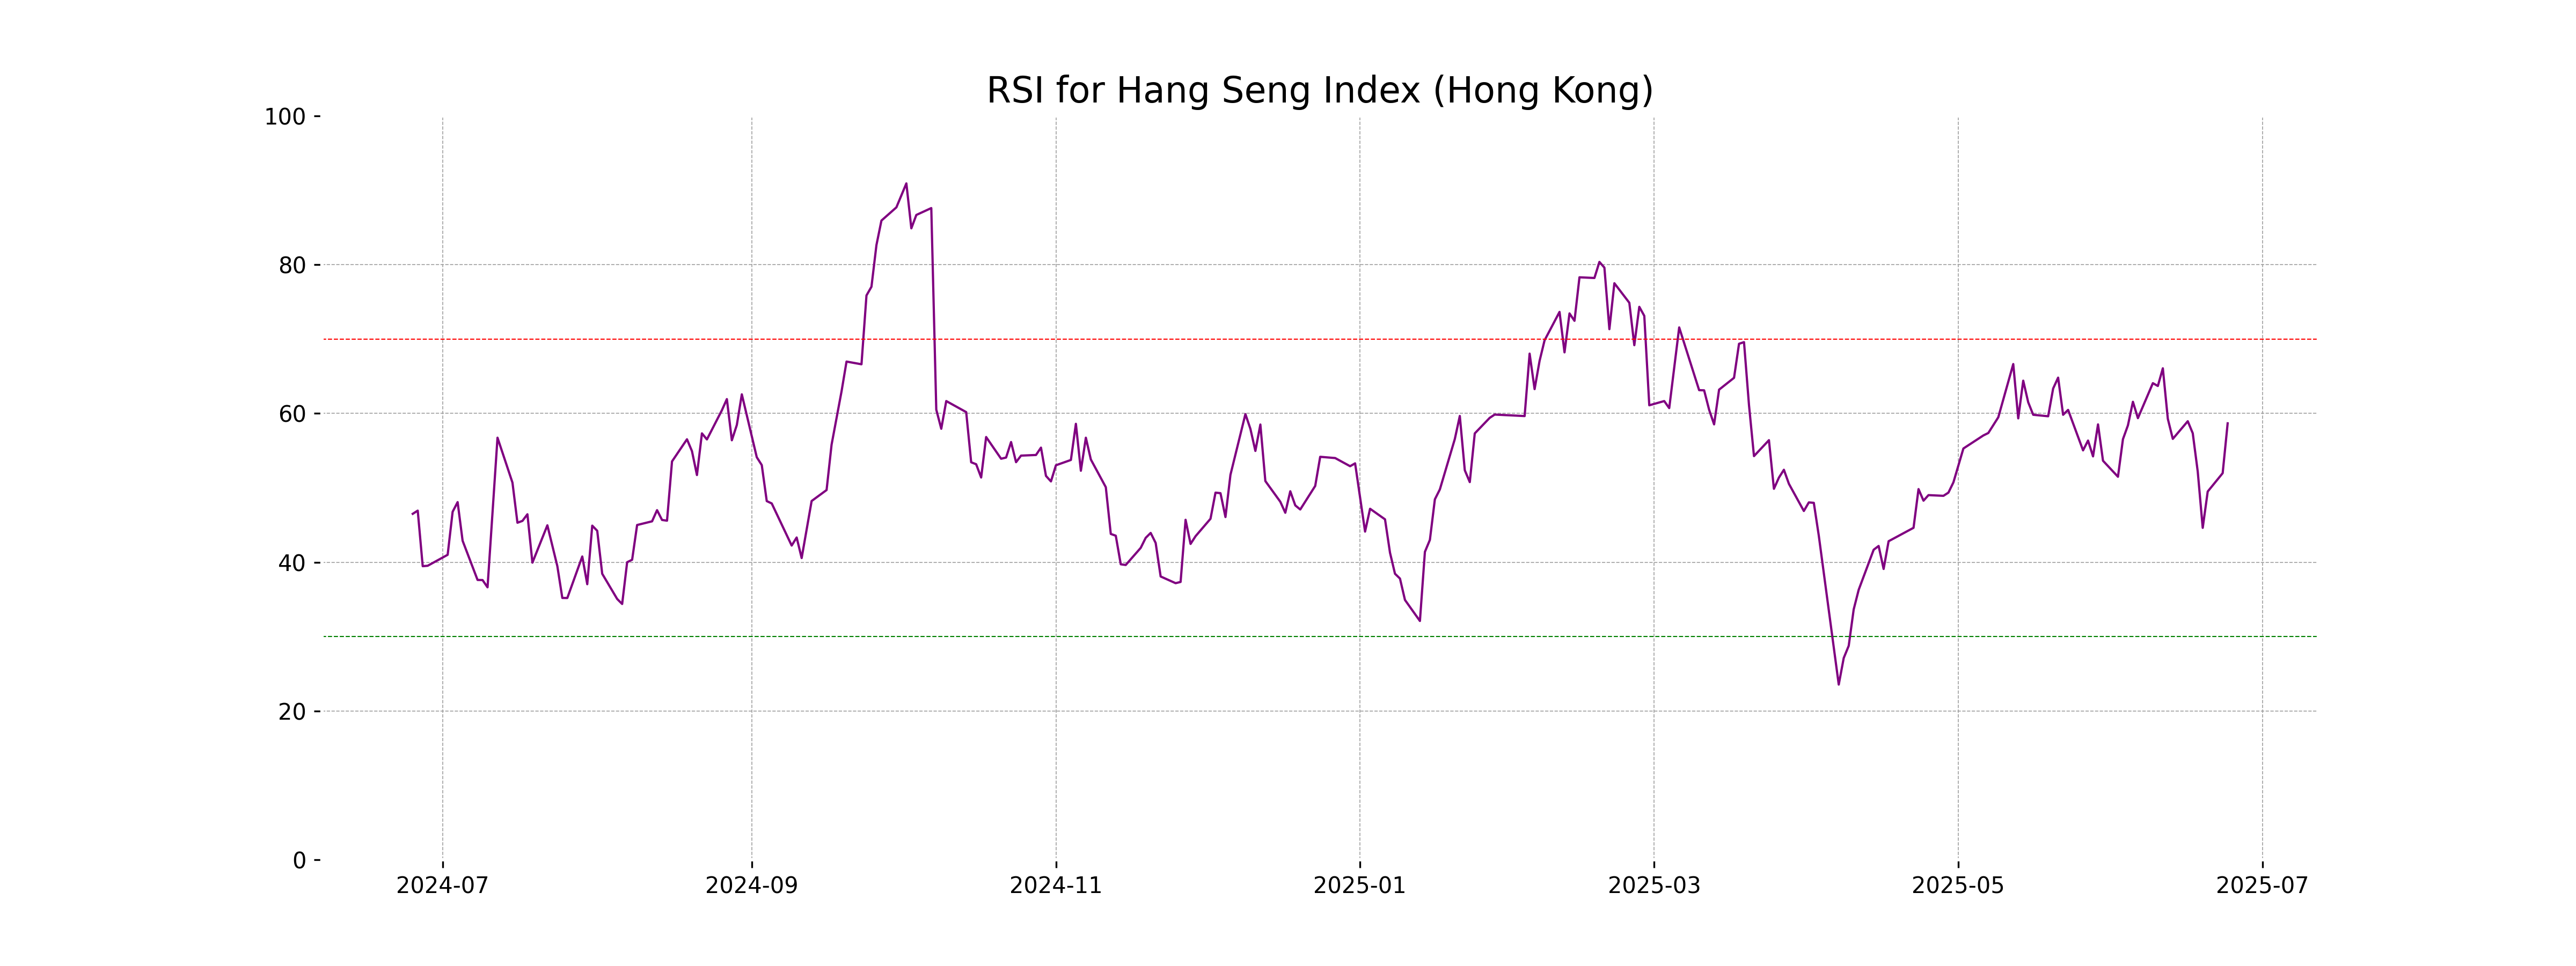
Hang Seng Index (Hong Kong) opened at 23,832.73 and closed at 24,177.07, marking a 2.06% increase with a 487.94-point gain from the previous close at 23,689.13. The technical indicators show a moderately bullish trend, with an RSI of 58.67 and a MACD of 168.82, although it is below the MACD Signal of 219.55, suggesting potential caution.
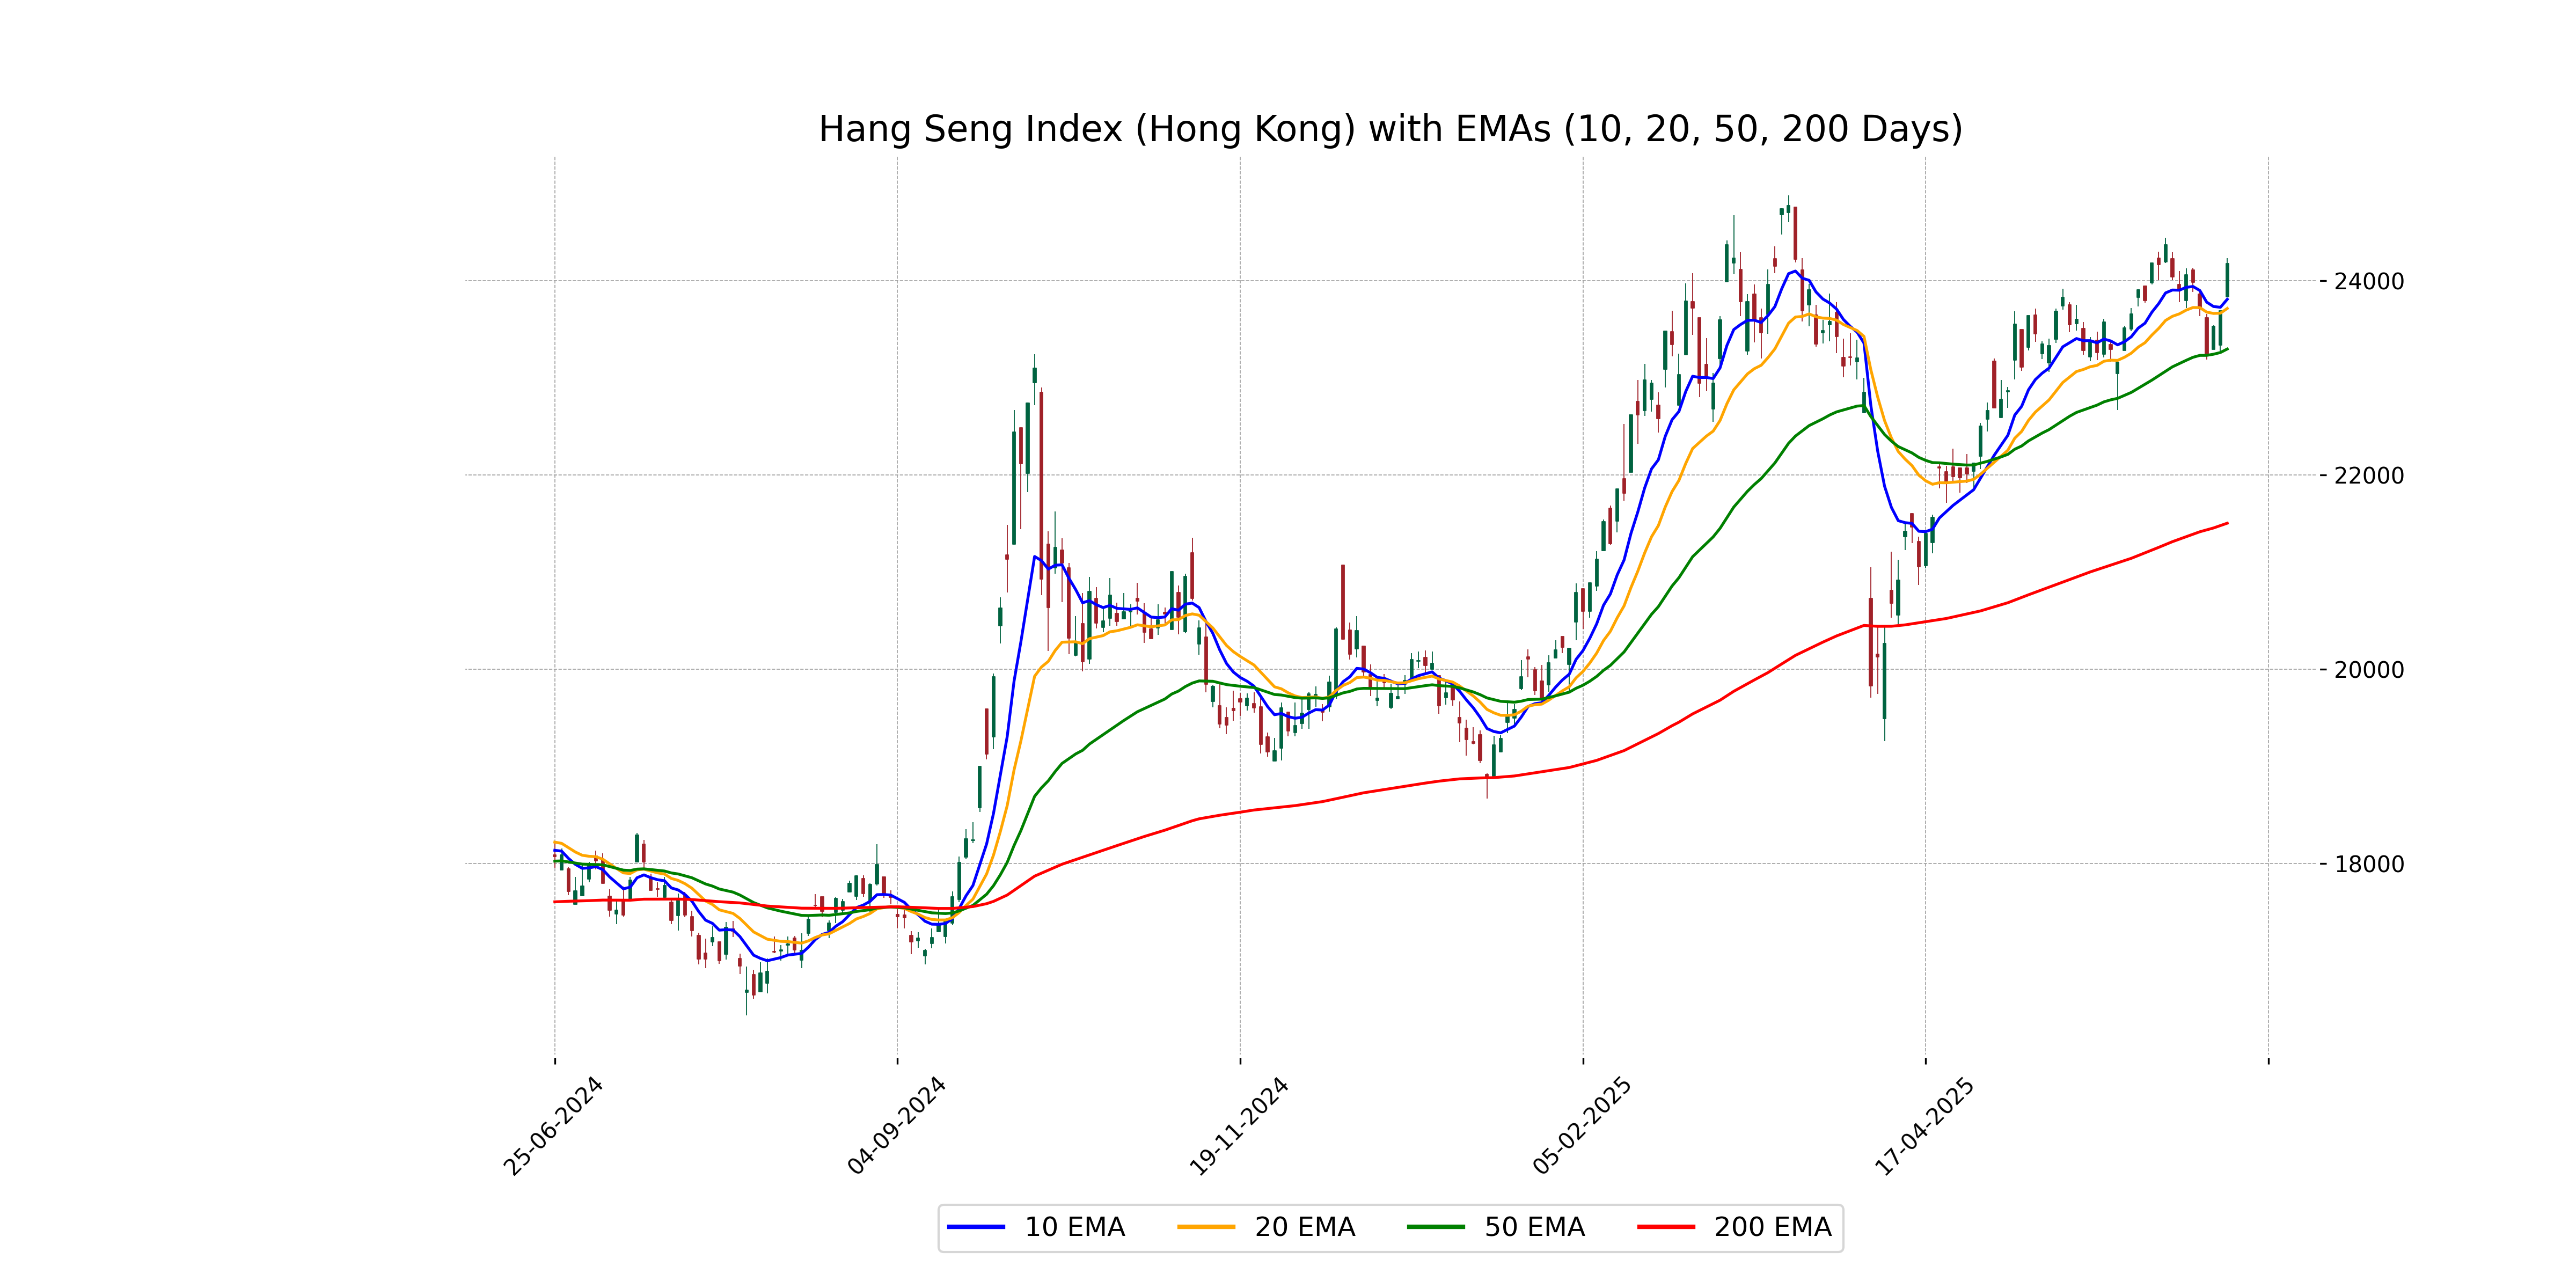
Relationship with Key Moving Averages
The Hang Seng Index is currently trading above its 10-day, 20-day, and 50-day EMAs, indicating a short to medium-term bullish trend. The close price of 24,177.07 is significantly higher than the 50-day EMA of 23,295.40, suggesting strong upward momentum.
Moving Averages Trend (MACD)
The MACD for Hang Seng Index shows a value of 168.82 which is below the MACD Signal line value of 219.55. This suggests a bearish signal, indicating potential weakness in the index's recent upward movement. Investors might be cautious as there could be a possibility of a reversal or continuation of the downtrend.
RSI Analysis
The RSI for Hang Seng Index (Hong Kong) is 58.67, indicating a neutral momentum, with neither overbought nor oversold conditions prevailing. It suggests a balanced level of recent gains and losses, hinting at stable market conditions.
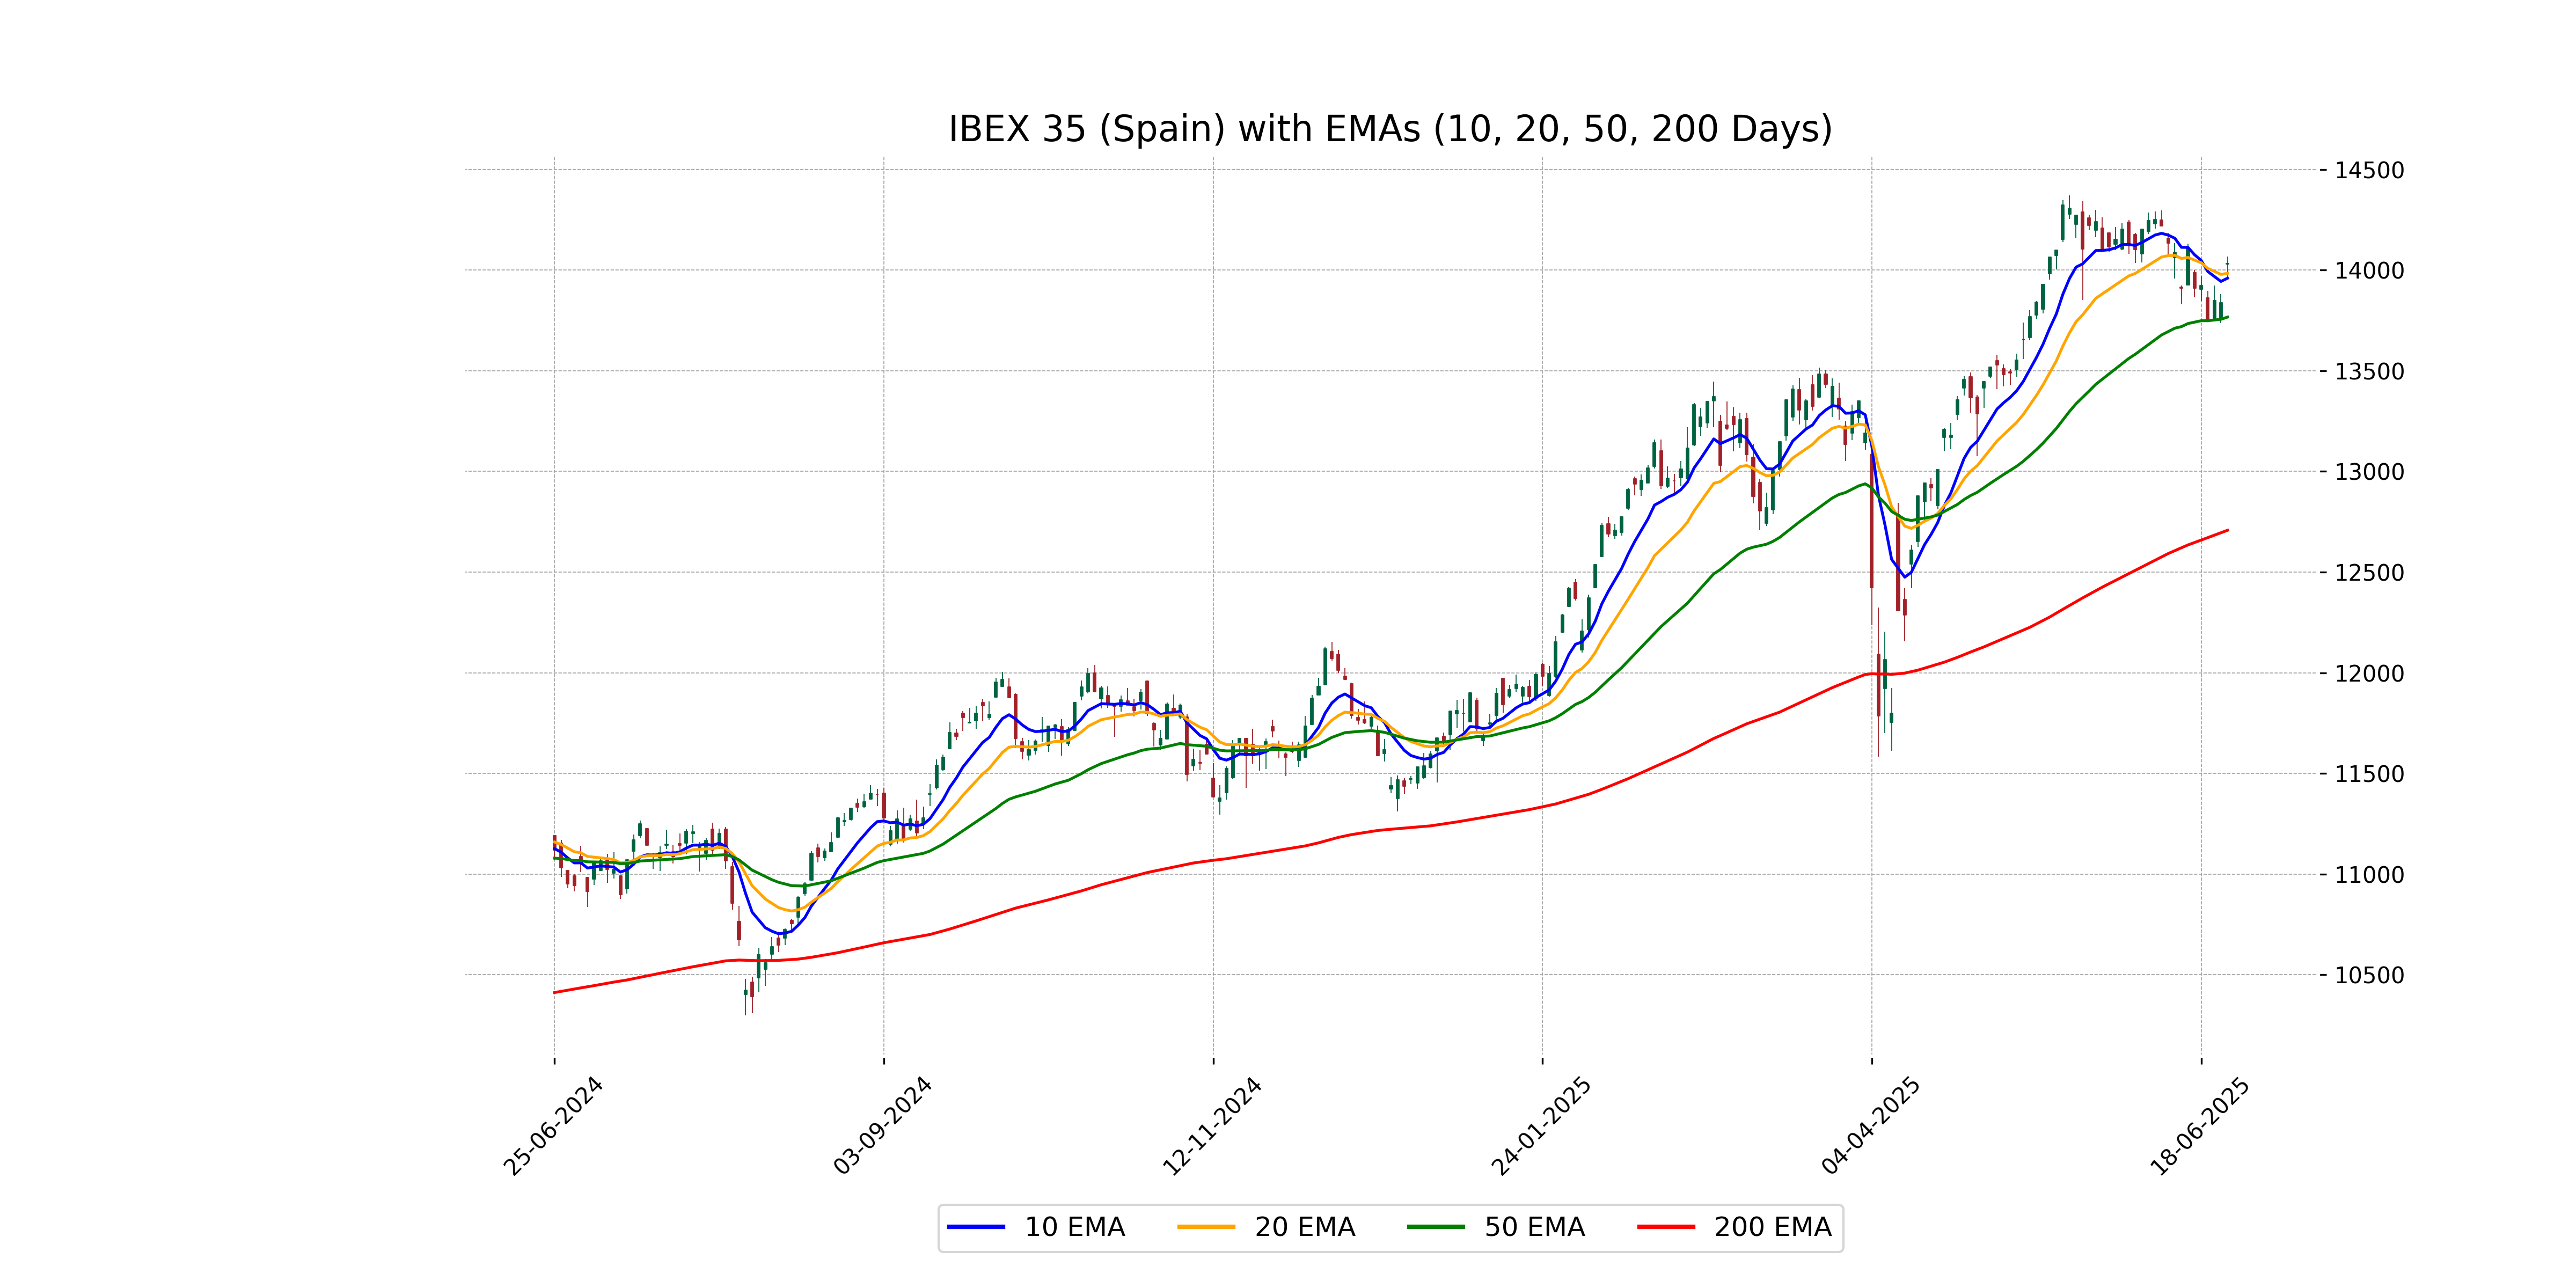
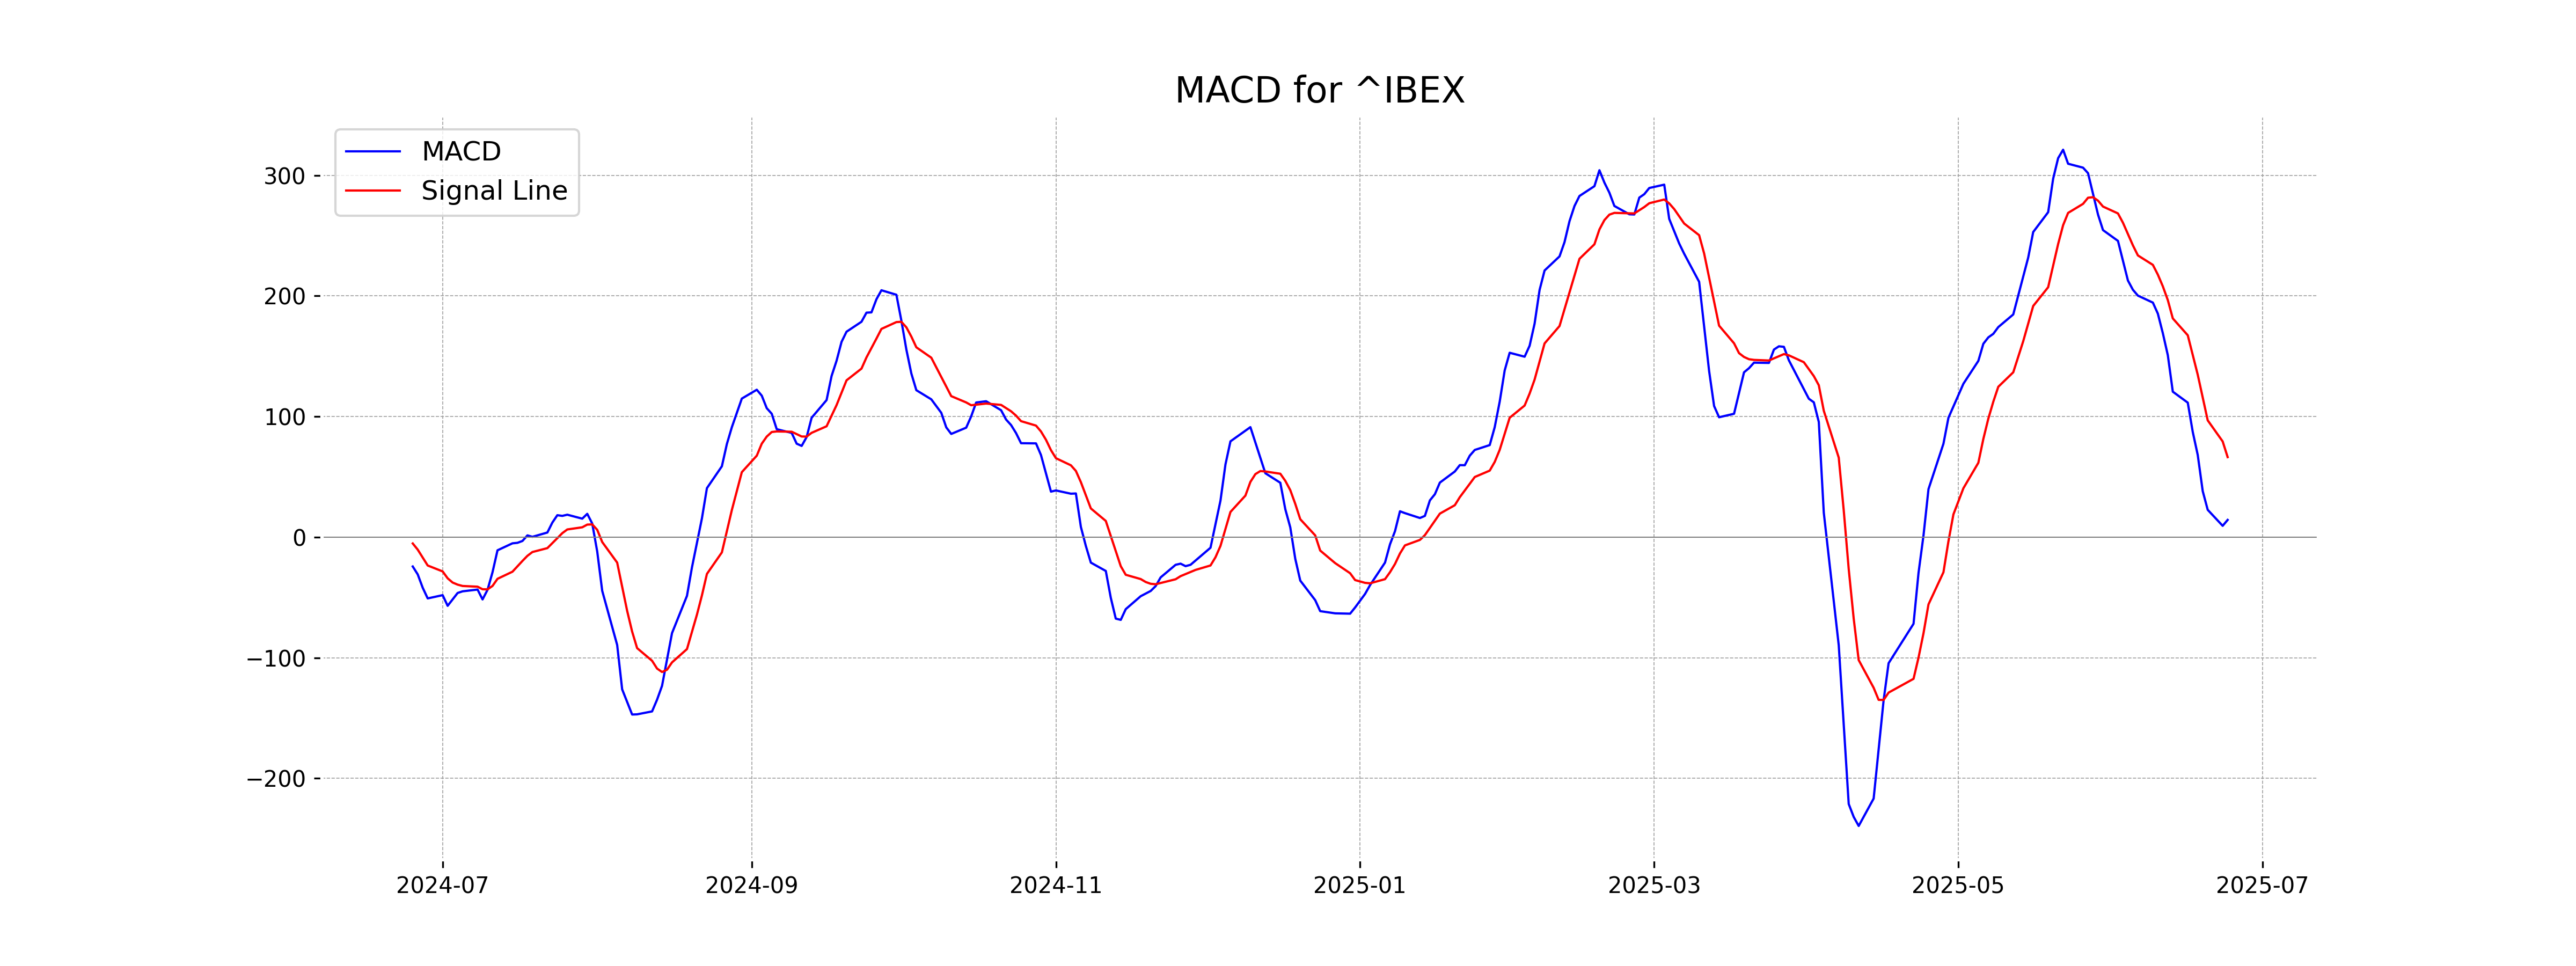
Analysis for IBEX 35 (Spain) - June 24, 2025
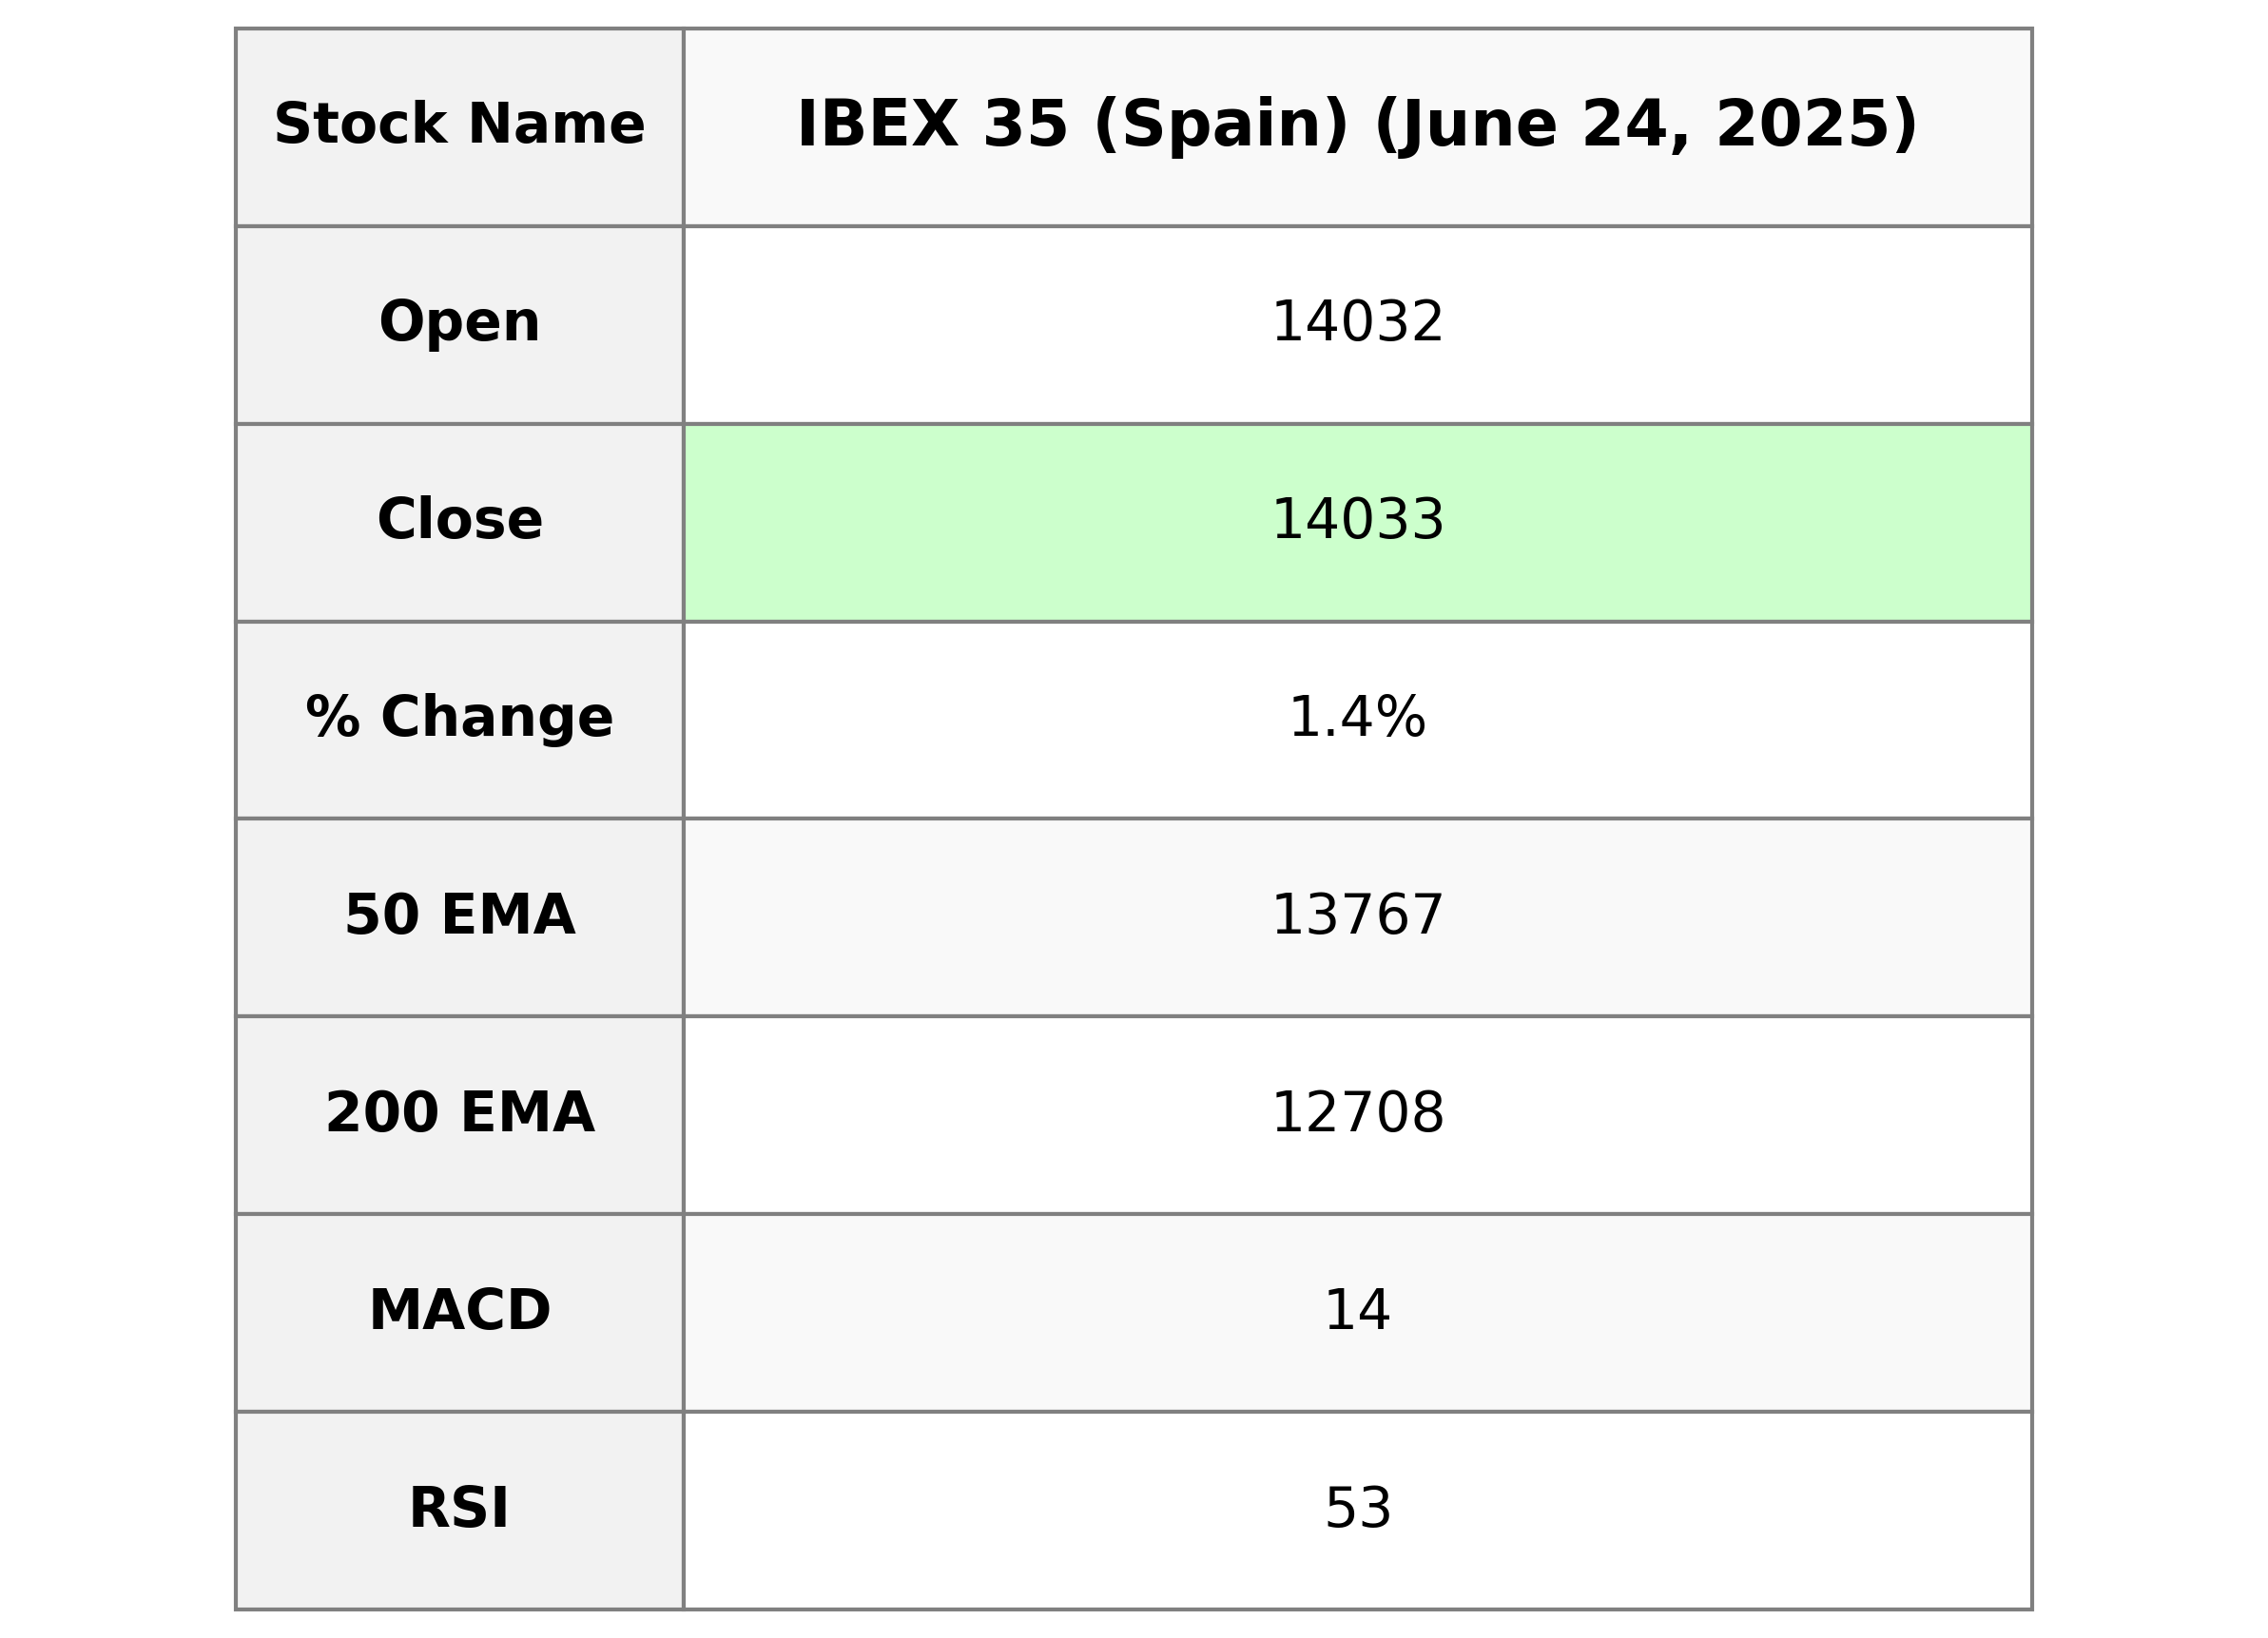
IBEX 35 (Spain) saw a positive performance, closing at 14,032.60 after opening at 14,031.80. The index recorded a 1.40% increase with a points change of 193.20. Key technical indicators include a Relative Strength Index (RSI) of 53.08 and a MACD of 14.28.
Relationship with Key Moving Averages
The IBEX 35 is trading above its 50-day EMA of 13766.96 and its 10-day EMA of 13960.18, indicating a short-term upward trend. Additionally, it is significantly above the 200-day EMA of 12707.80, suggesting a strong long-term trend.
Moving Averages Trend (MACD)
The MACD for IBEX 35 is 14.28, which is below the MACD Signal line of 66.33. This suggests a bearish momentum as the MACD is trailing the Signal line. Investors may interpret this as a potential overbought condition in the market movements.
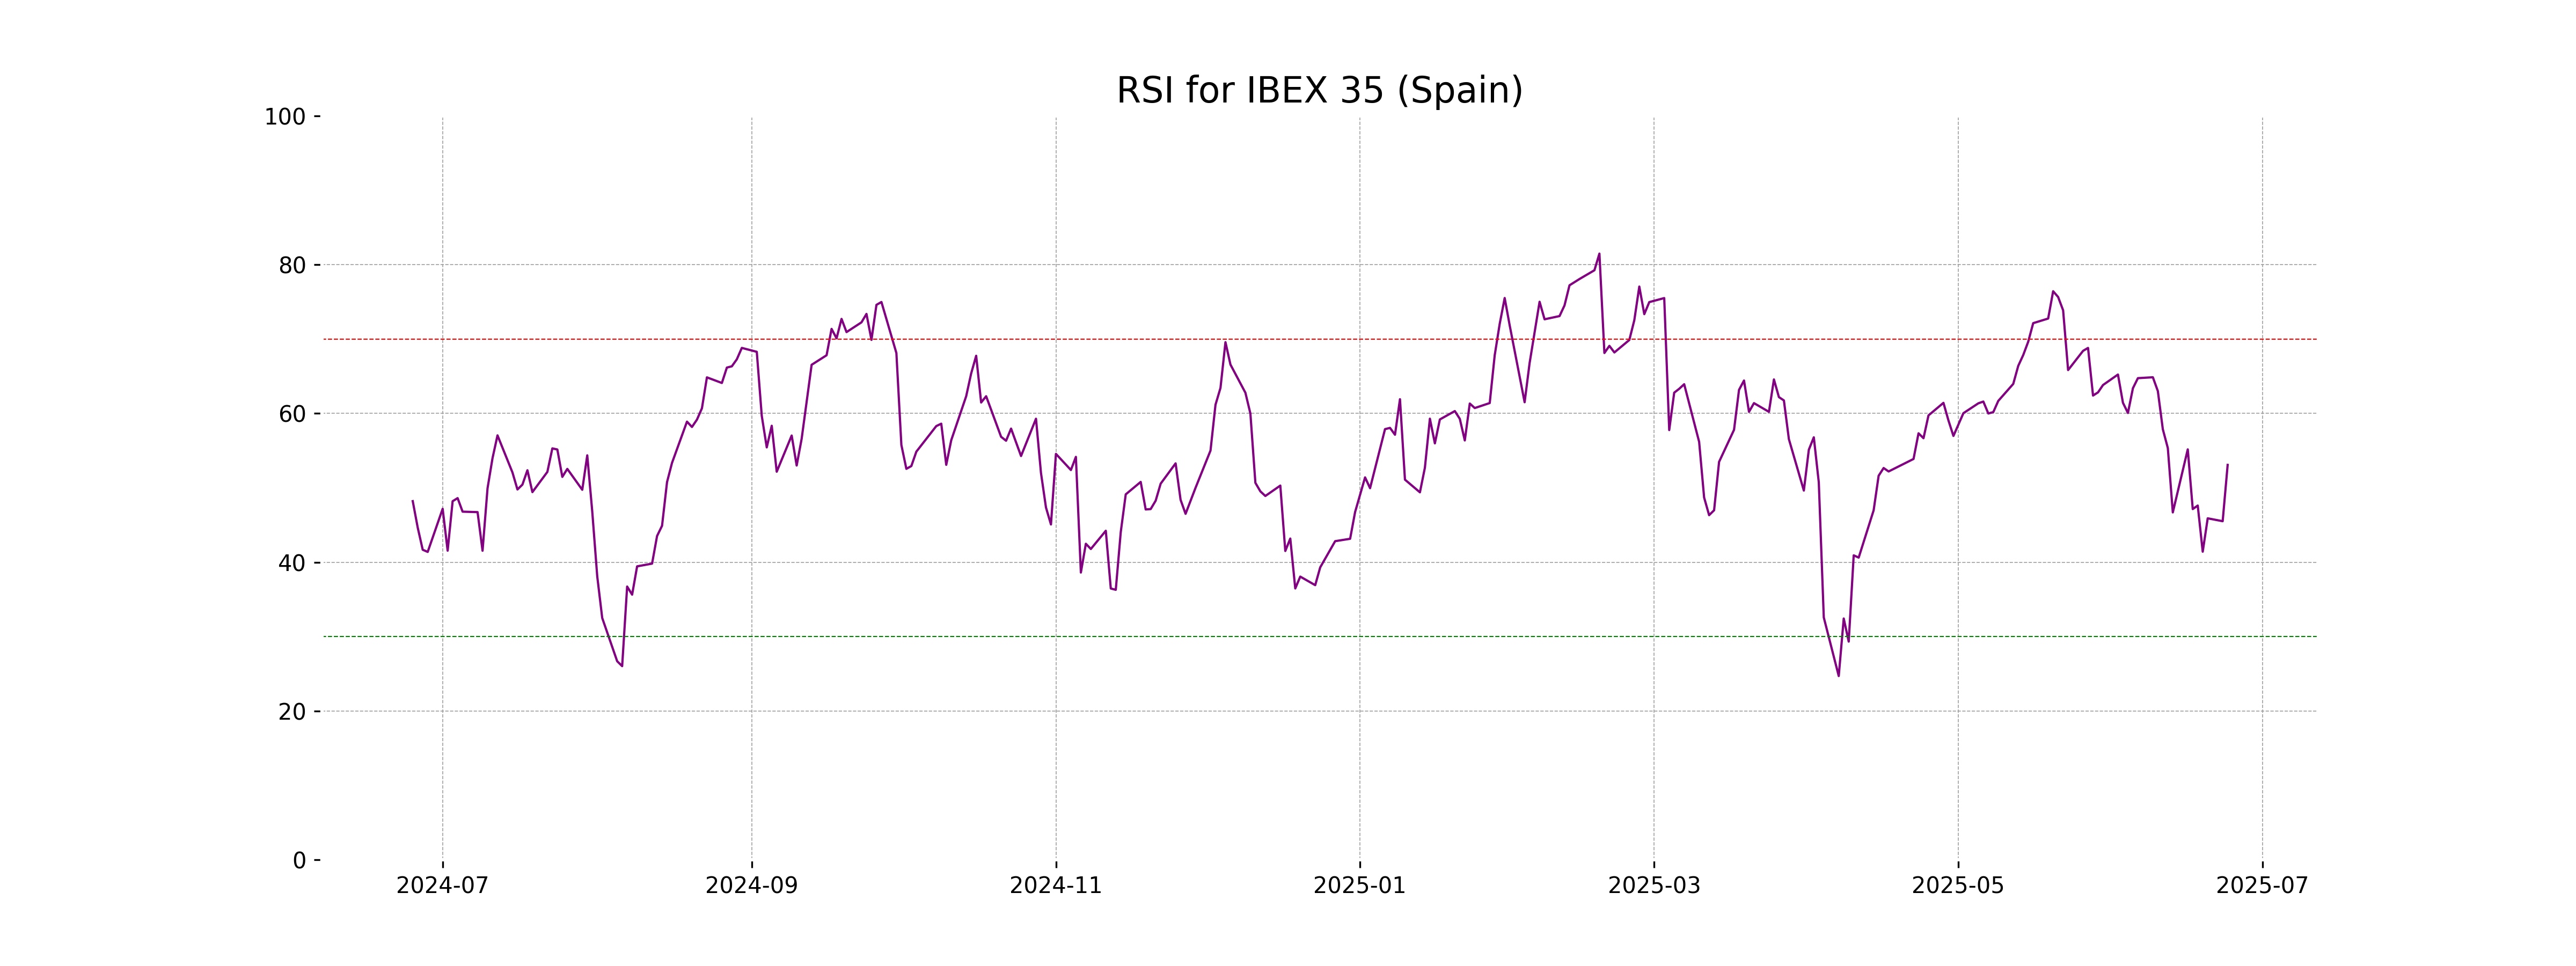
RSI Analysis
IBEX 35 (Spain) RSI Analysis: The Relative Strength Index (RSI) for IBEX 35 is at 53.08, which suggests a neutral market sentiment. Typically, an RSI above 70 indicates overbought conditions, while below 30 suggests oversold conditions; thus, IBEX 35 is currently balanced without clear overbought or oversold signals.
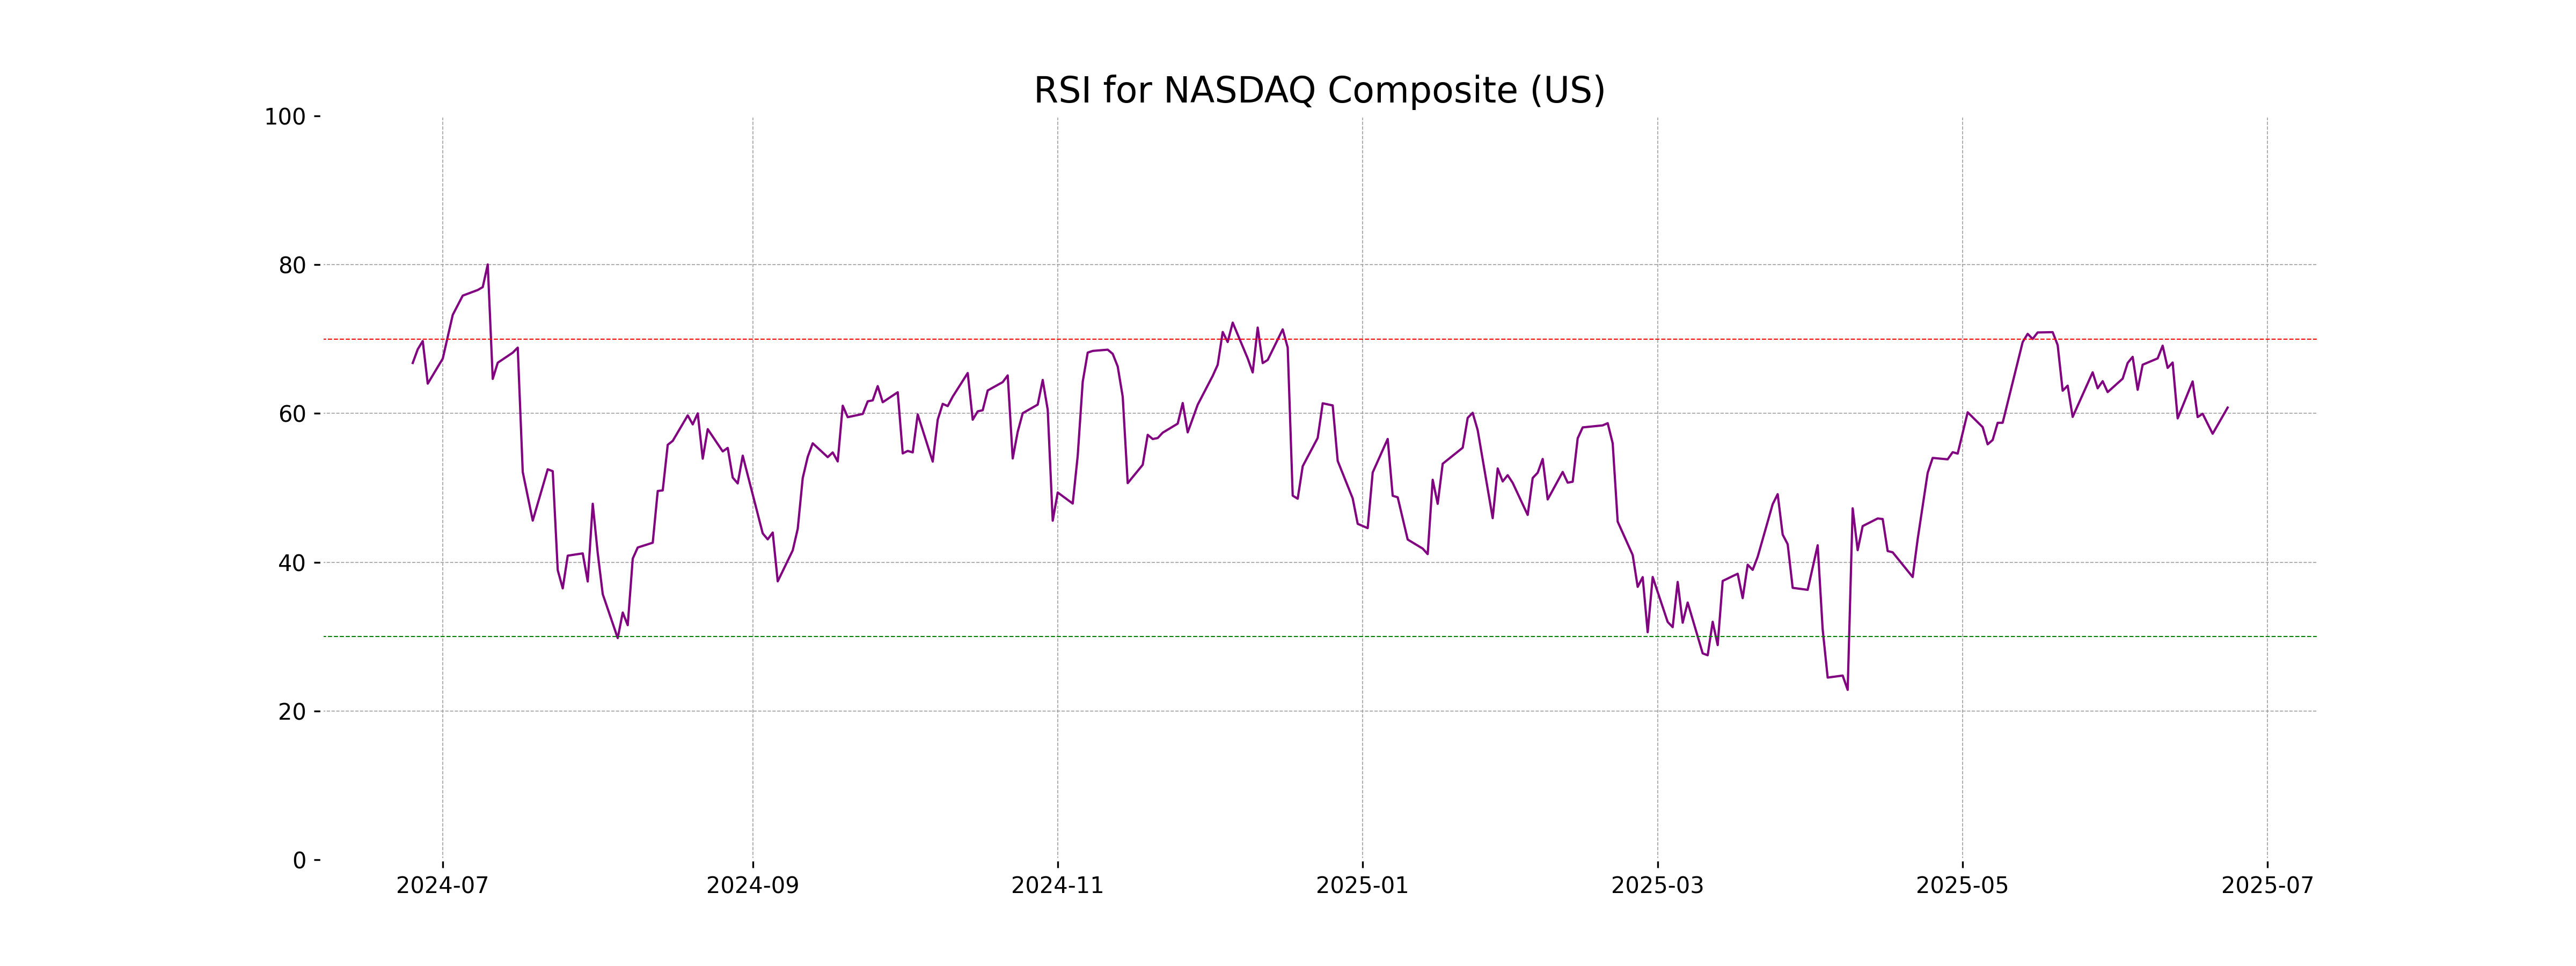
Analysis for NASDAQ Composite (US) - June 24, 2025
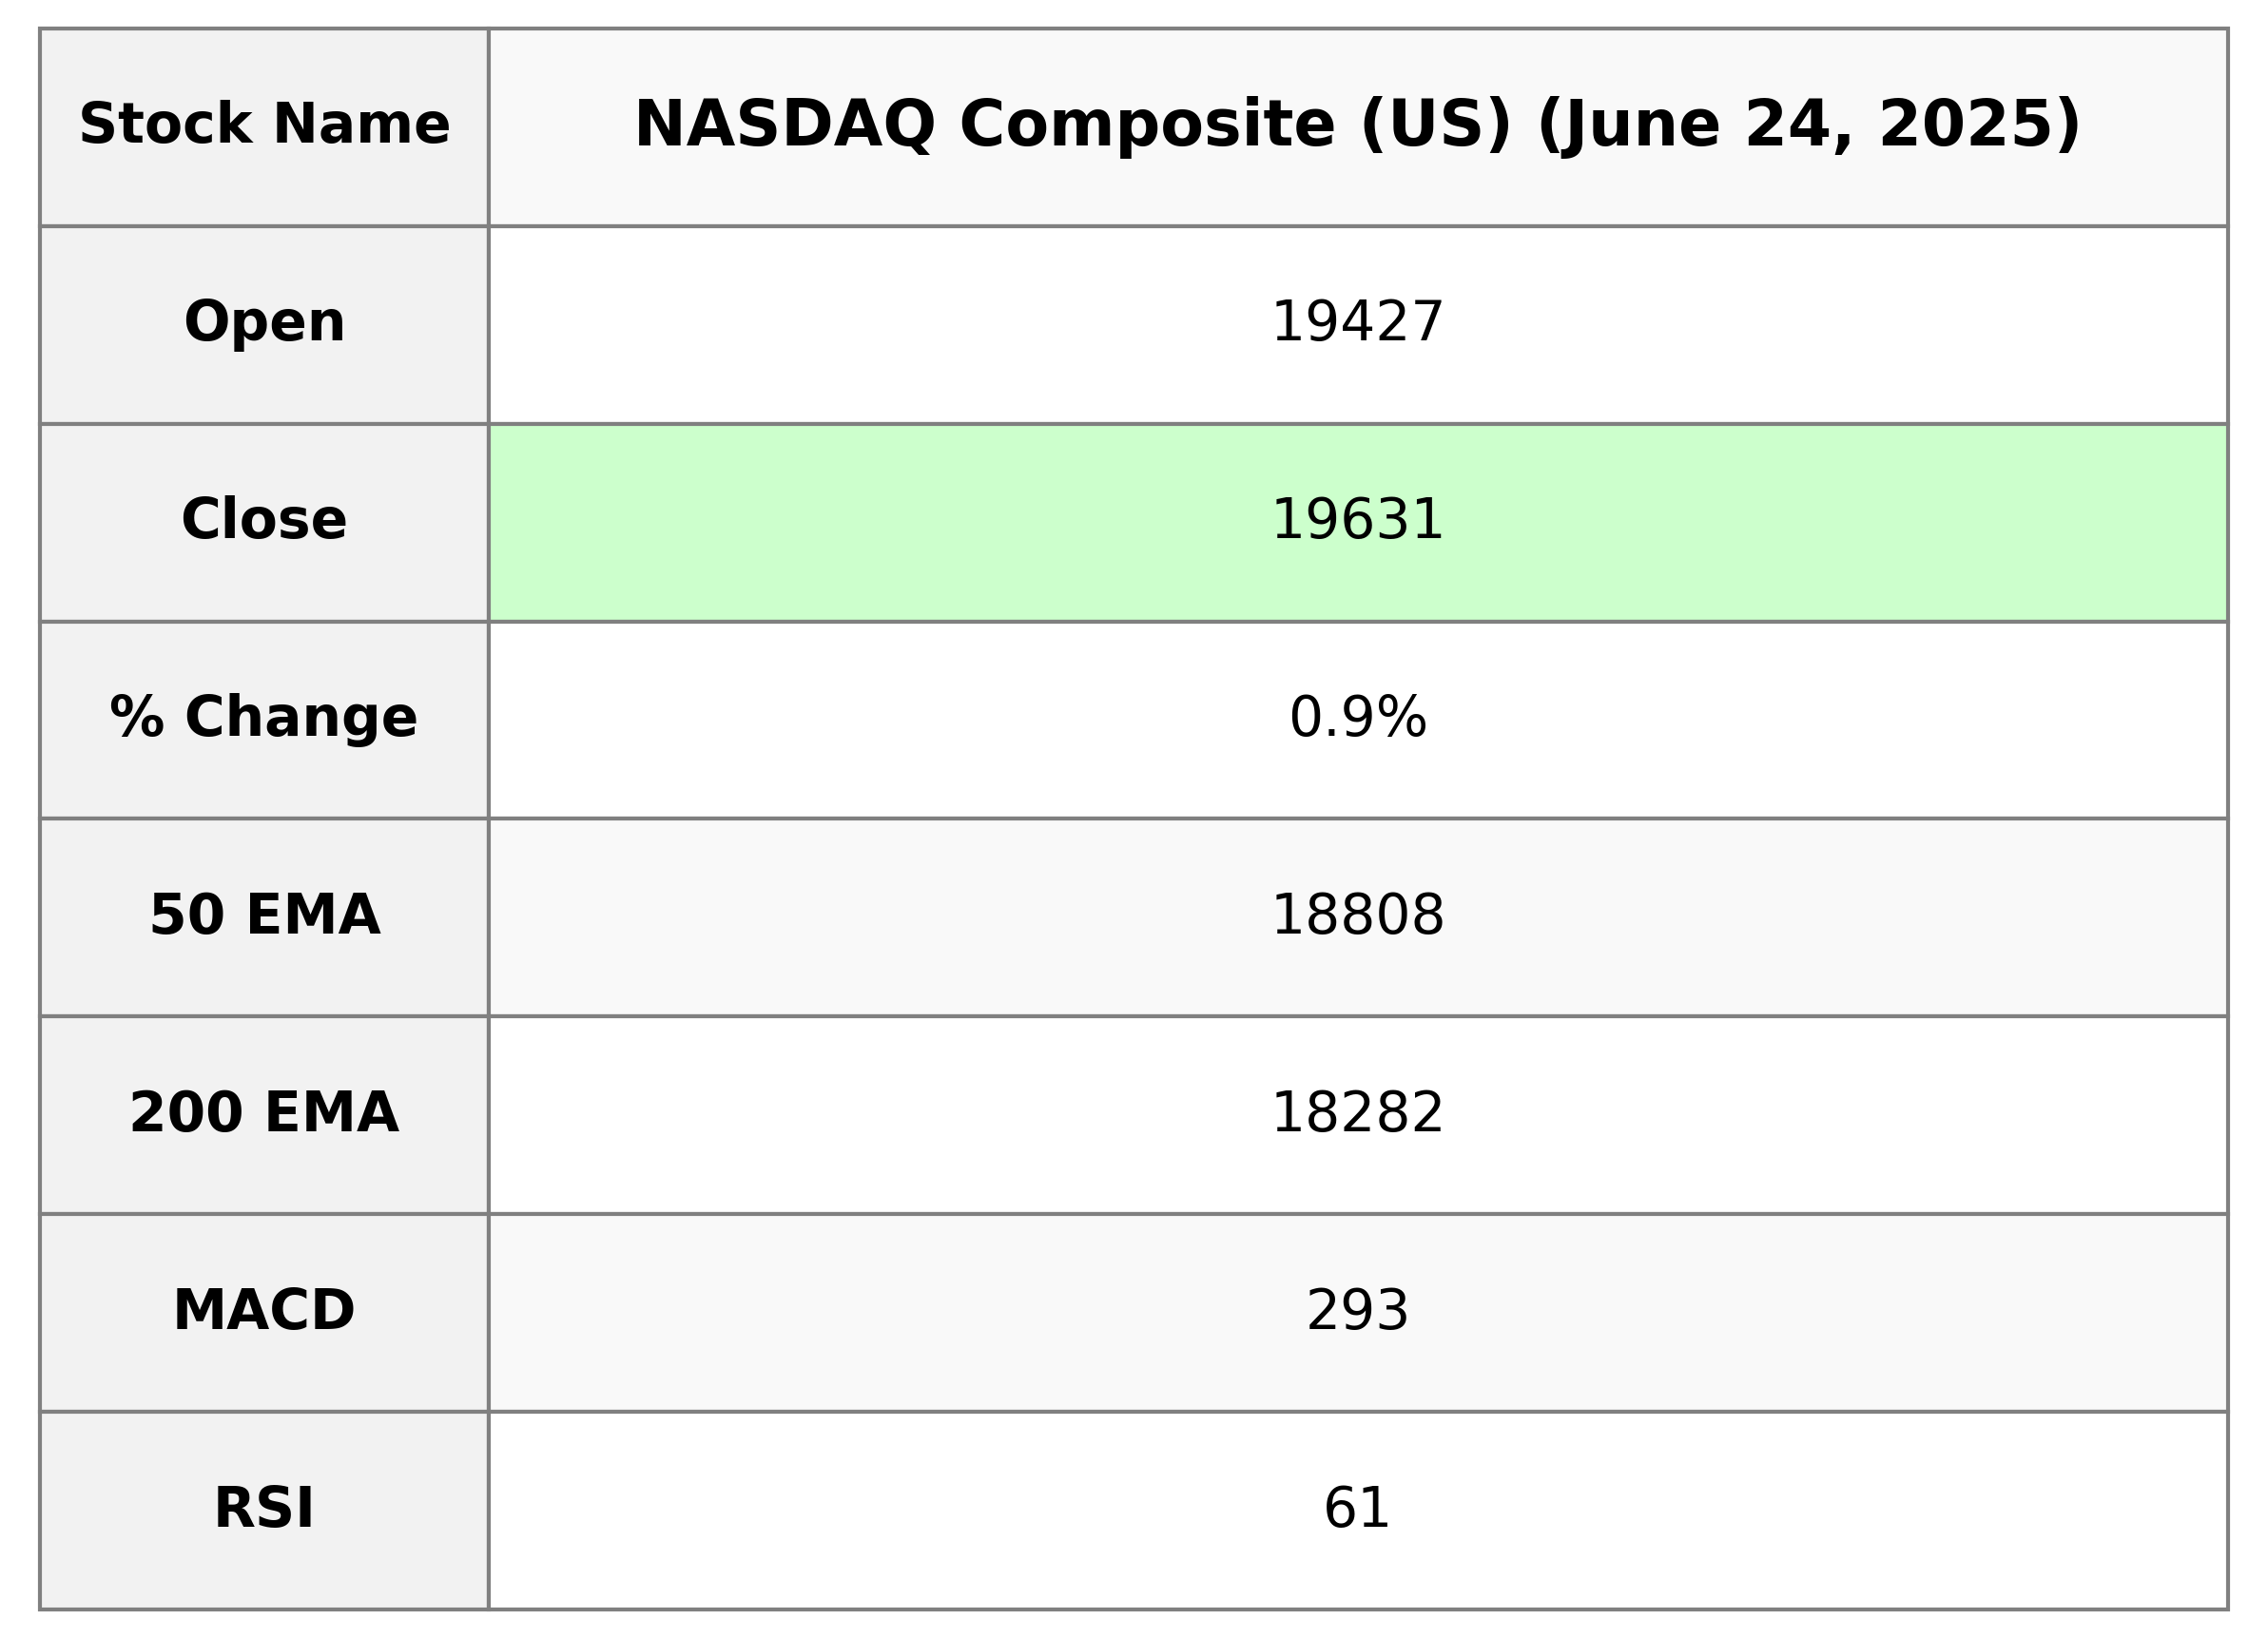
The NASDAQ Composite opened at 19,427.01 and closed at 19,630.97, marking a % Change of 0.94% and a Points Change of 183.56. The index experienced a high of 19,643.70 and a low of 19,334.98, with a trading volume of 9,088,000,000. The Relative Strength Index (RSI) was 60.79, suggesting moderately strong momentum, while the MACD was below the Signal line, indicating potential bearish sentiment.
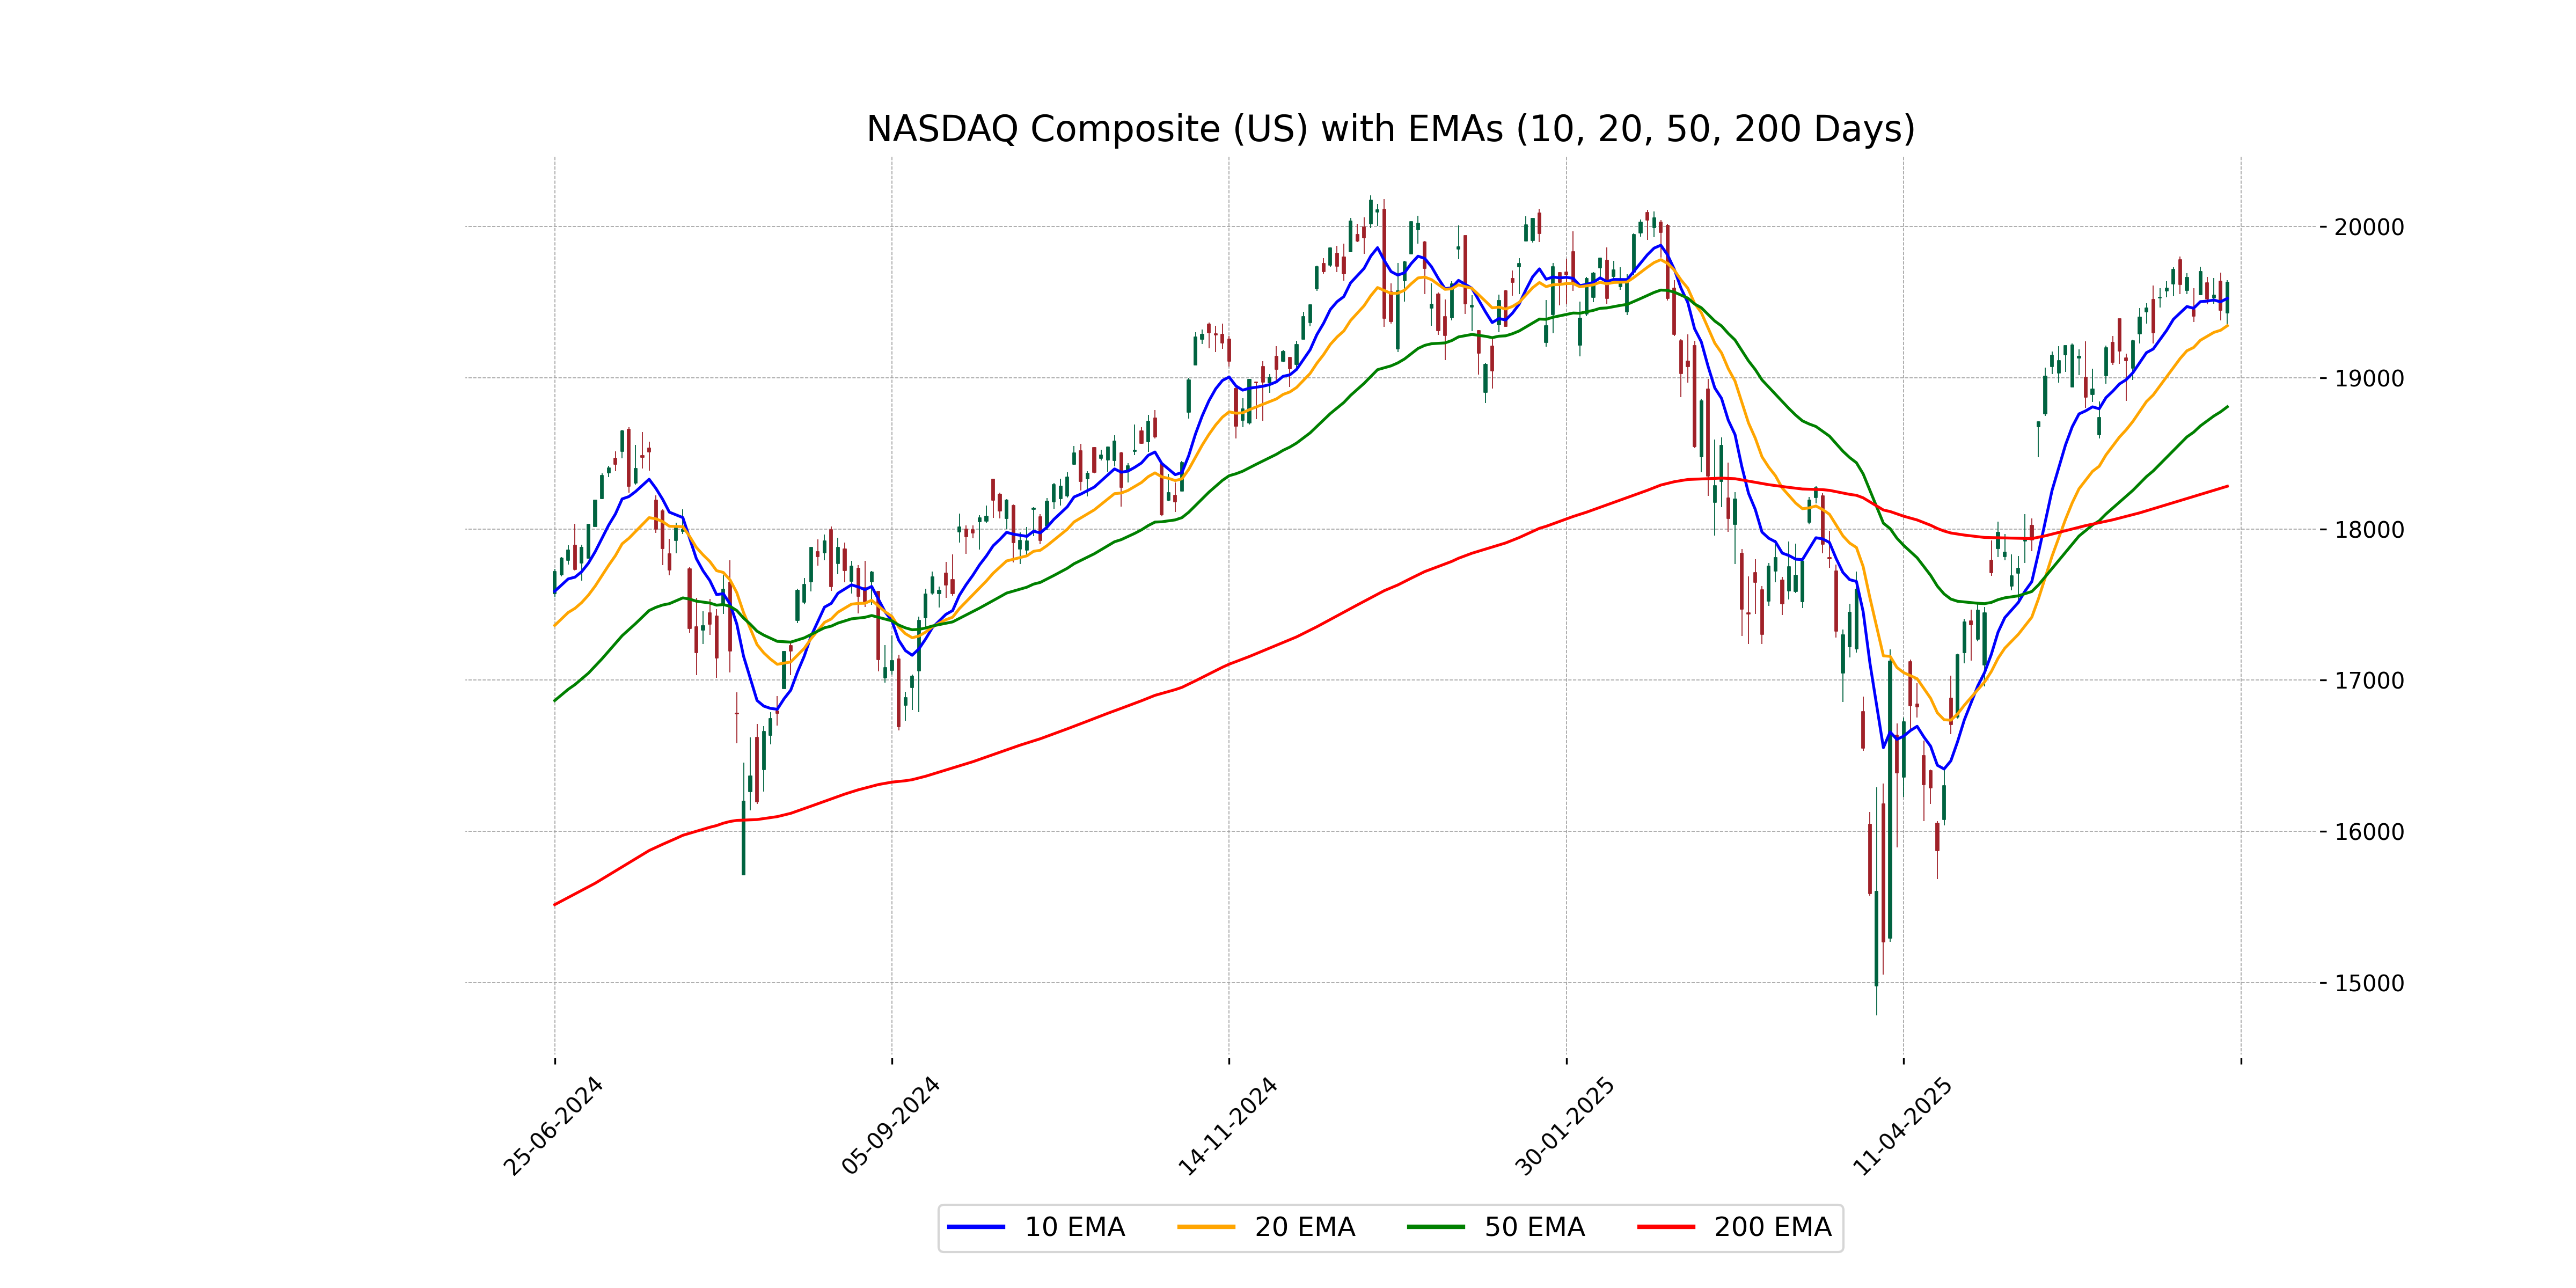
Relationship with Key Moving Averages
The NASDAQ Composite closed at 19630.97, remaining above its 10-day EMA of 19525.10, 50-day EMA of 18807.86, and 200-day EMA of 18282.16, indicating a bullish trend as it sustains levels above these key moving averages. The positive MACD of 292.60, albeit below the signal line of 350.59, suggests a continuation of upward momentum, although caution is advised.
Moving Averages Trend (MACD)
The MACD for NASDAQ Composite shows a value of 292.60, which is below the MACD Signal line of 350.59. This indicates that the current trend may be bearish as the MACD is lower than the signal line.

RSI Analysis
The RSI value for NASDAQ Composite is 60.79, indicating a moderately bullish trend as it is above the neutral 50 level. The RSI suggests that the index is currently in a state that is not overbought nor oversold, allowing potential for further upward movement if momentum continues.
Analysis for Nikkei 225 (Japan) - June 24, 2025
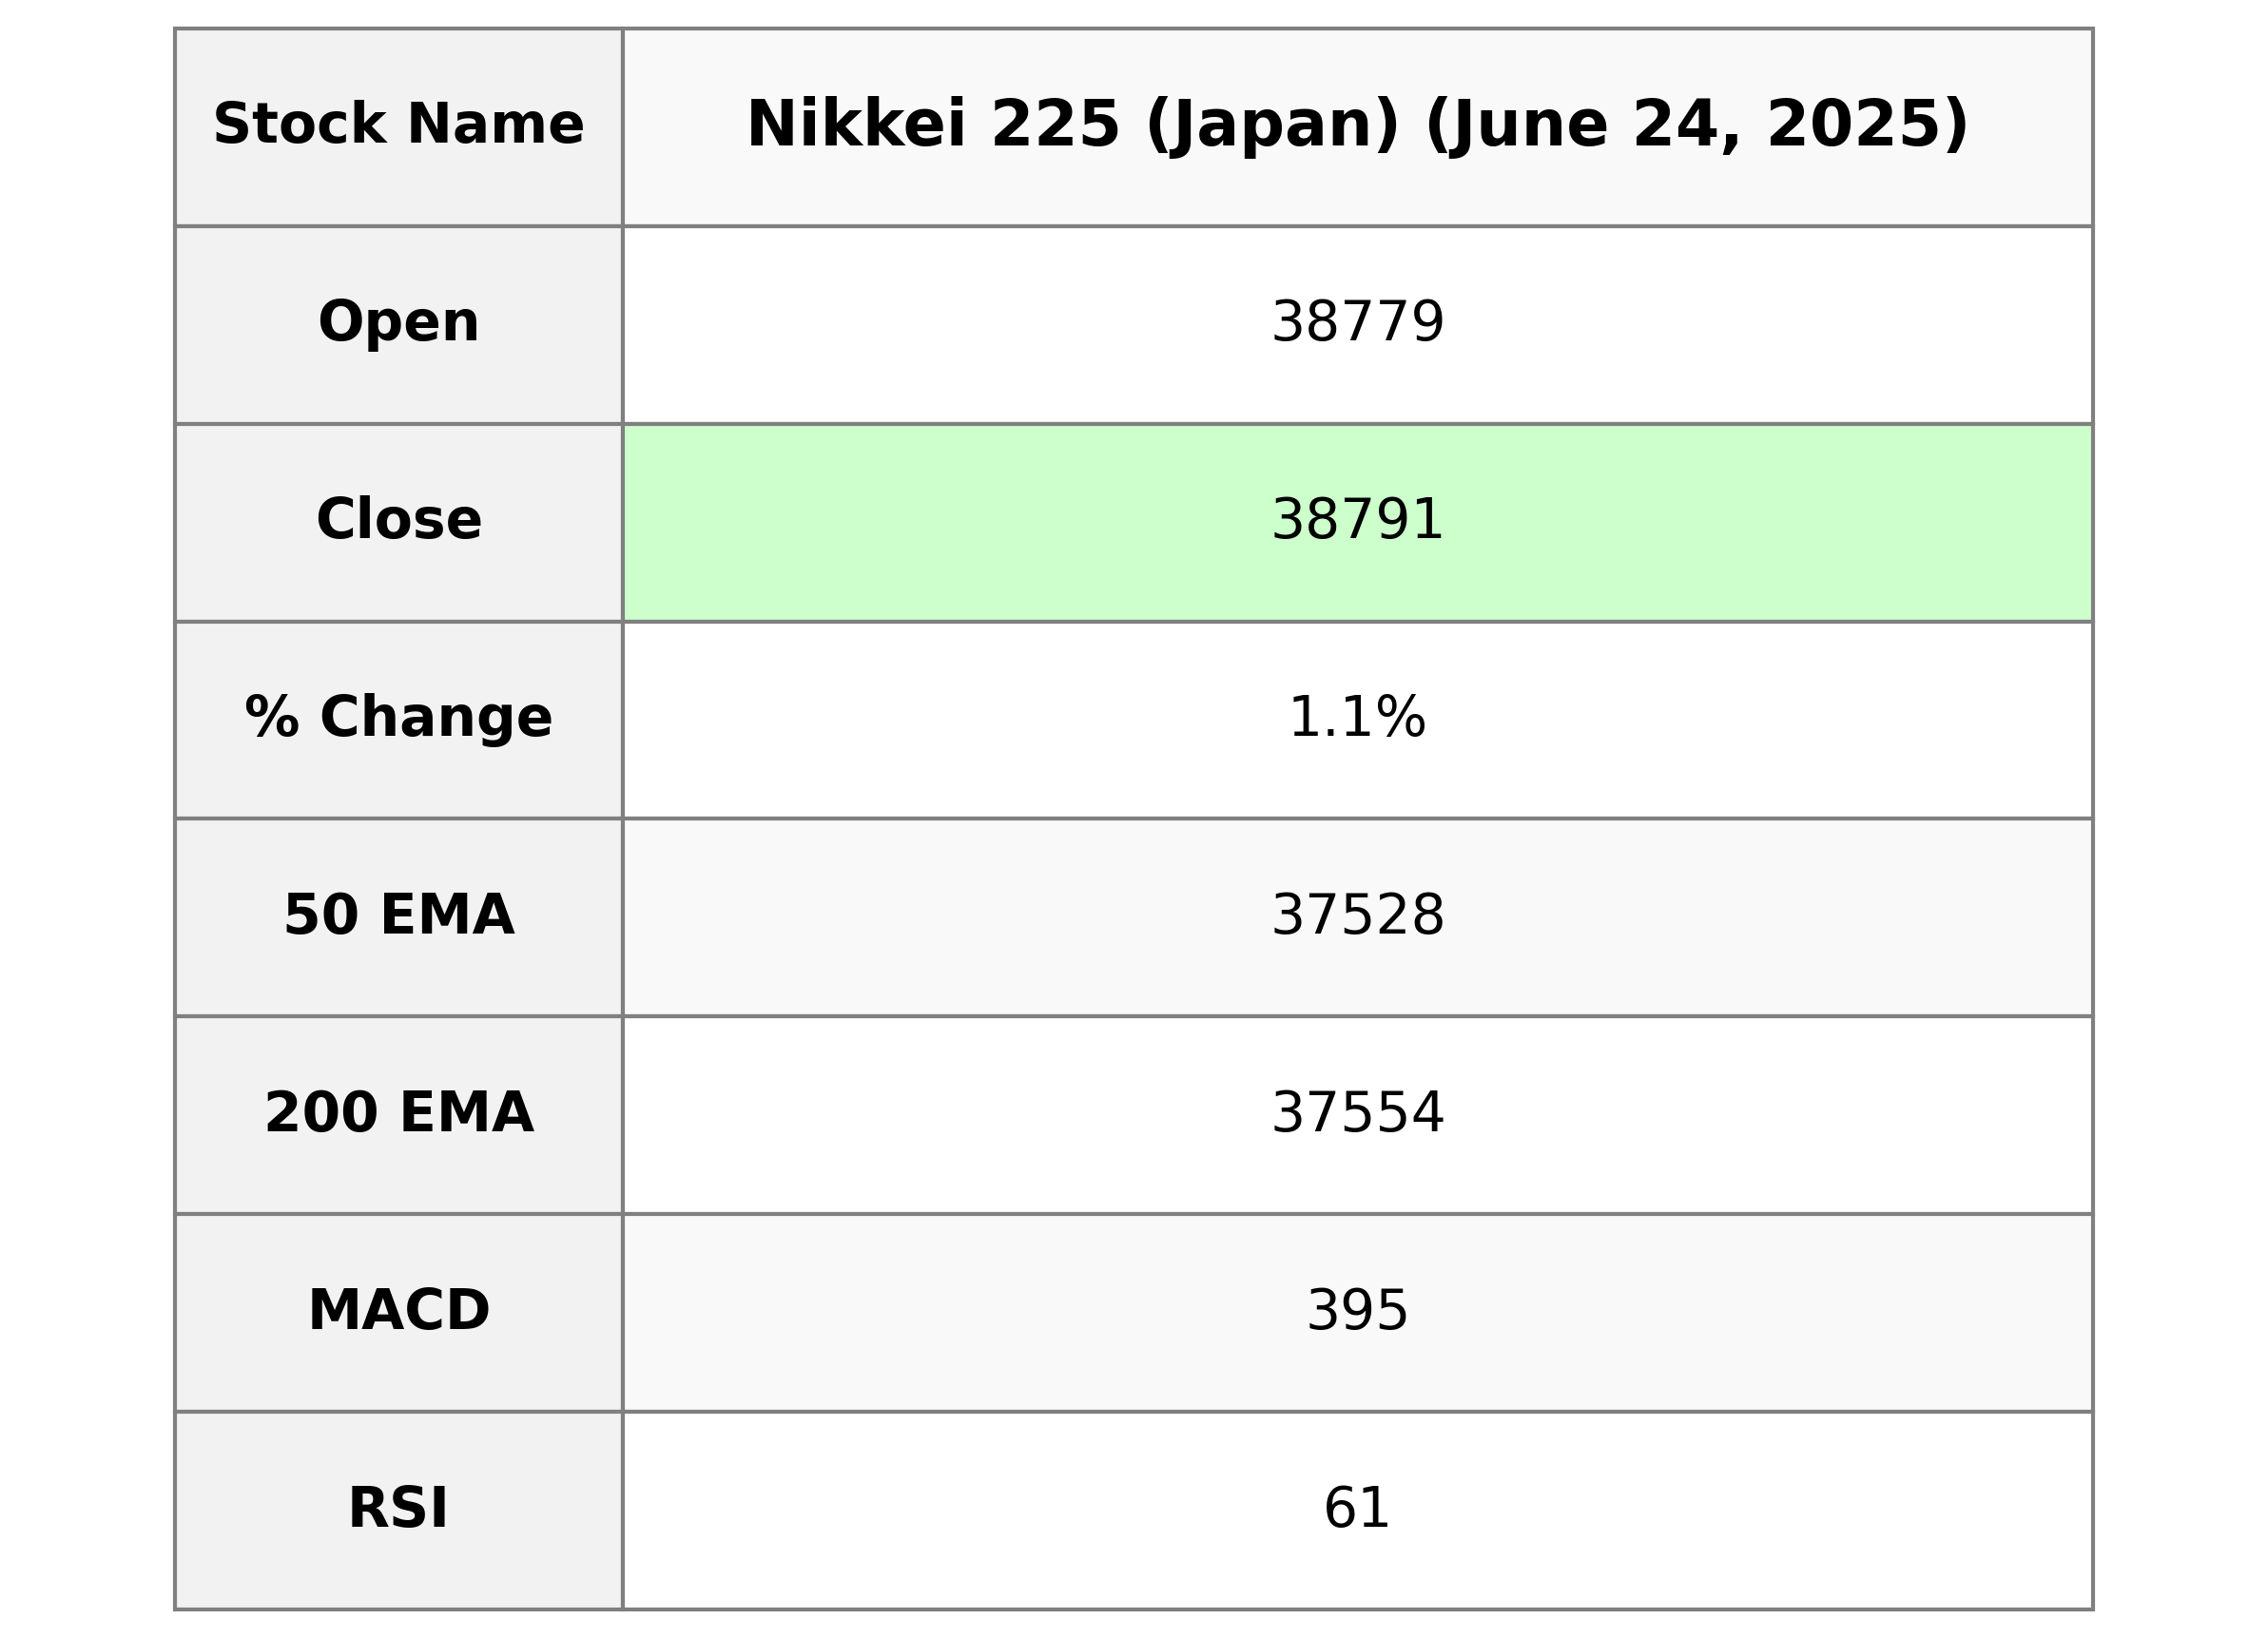
The Nikkei 225 (Japan) experienced a positive performance, closing at 38790.56 with a significant points increase of 436.47 from the previous close. The index saw a percentage change of 1.14%, with a slight bullish sentiment as indicated by an RSI of 61.47. Despite some discrepancy, the MACD is slightly below the signal line, suggesting cautious optimism.

Relationship with Key Moving Averages
The Nikkei 225 is trading above both its 50-period EMA (37527.86) and 200-period EMA (37554.01), indicating a bullish trend. Additionally, the index is positioned above its 10-period EMA (38405.42) and 20-period EMA (38123.62), suggesting short-term momentum is also bullish.
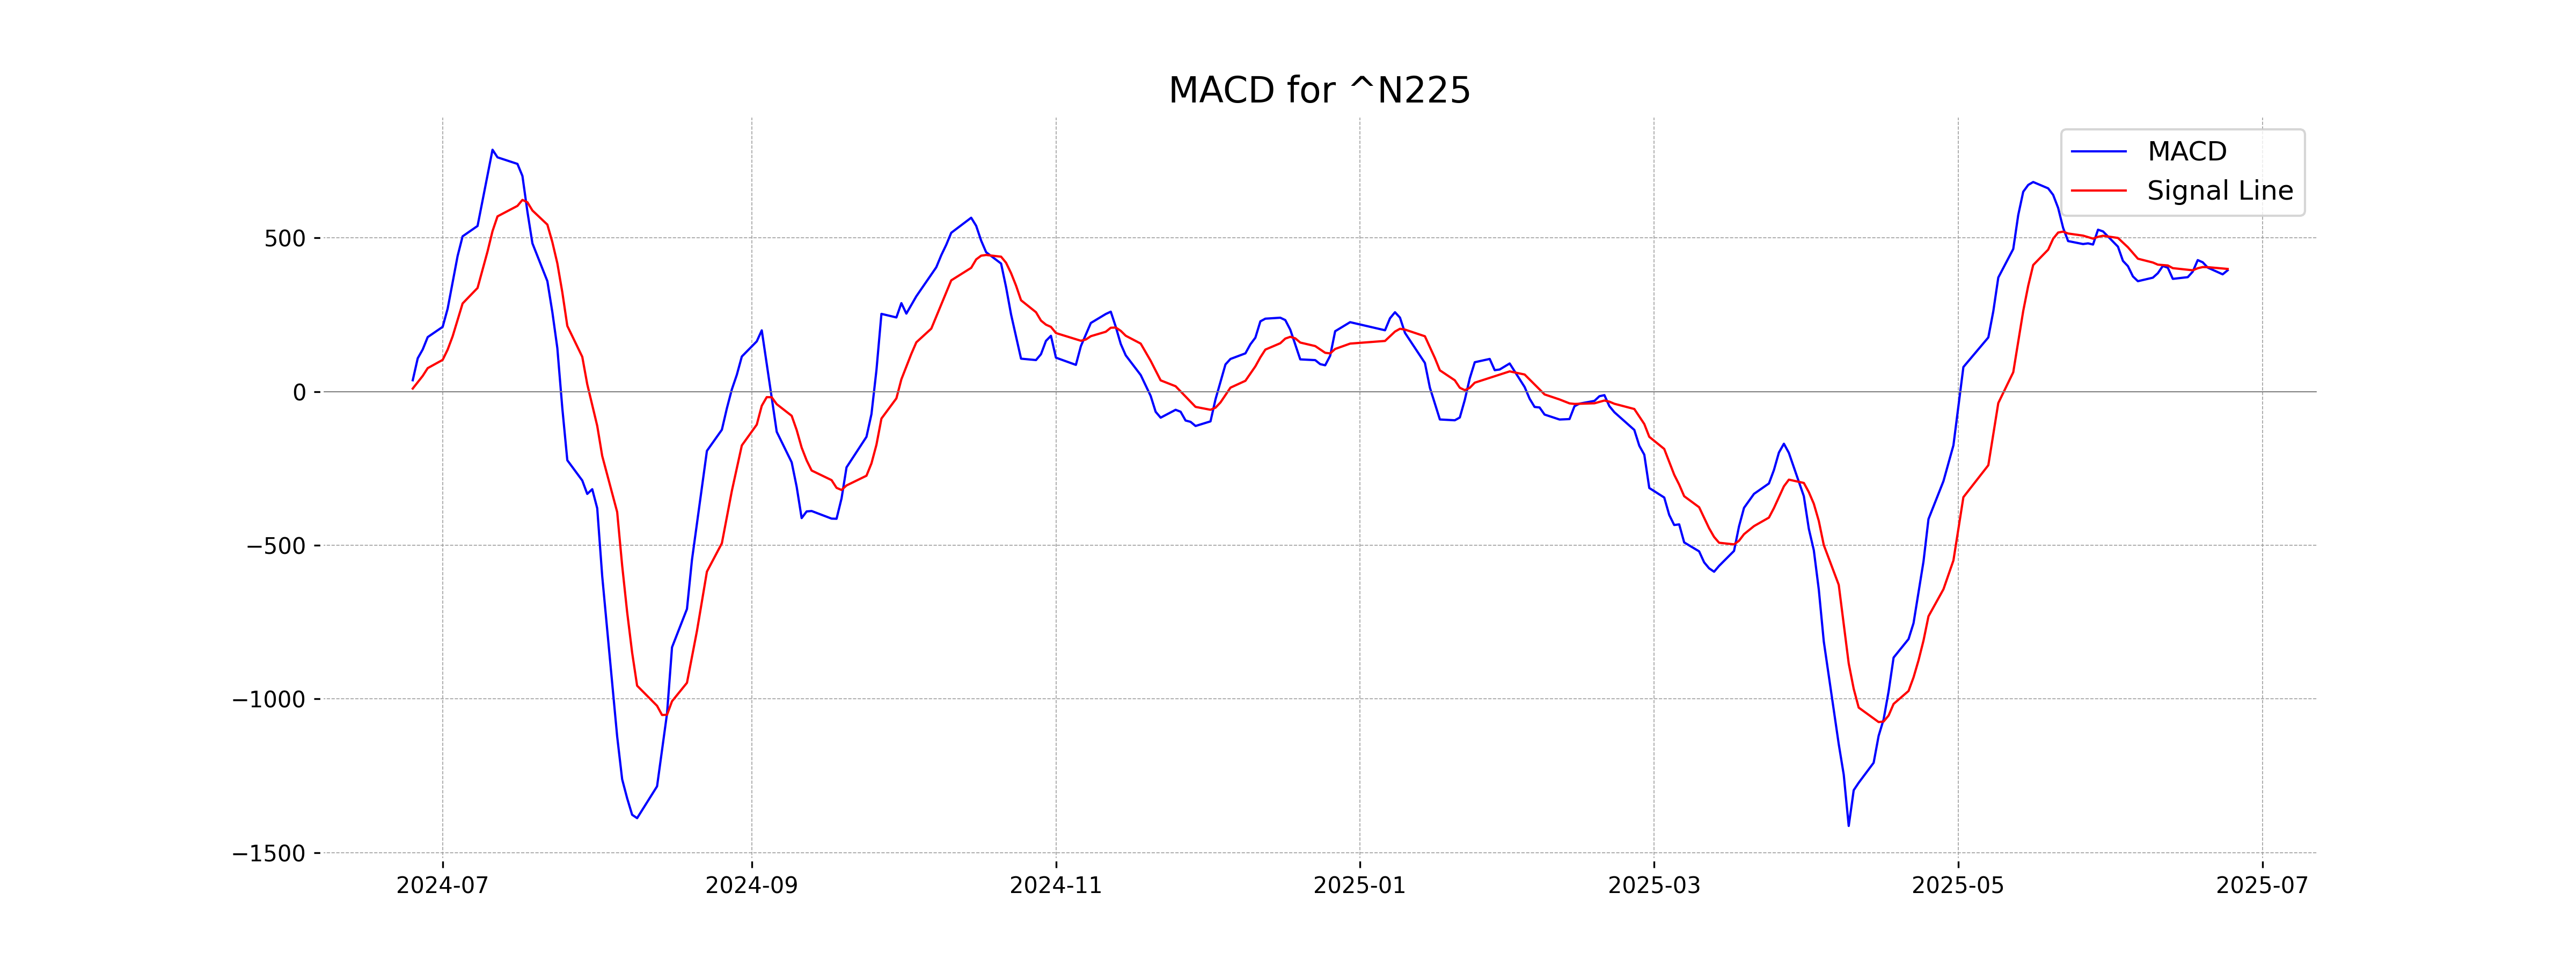
Moving Averages Trend (MACD)
The MACD for Nikkei 225 is 394.67, while the MACD Signal is 399.02. Since the MACD is slightly below the MACD Signal, this could indicate a potential downturn, though the difference is minimal, suggesting a relatively neutral near-term outlook.
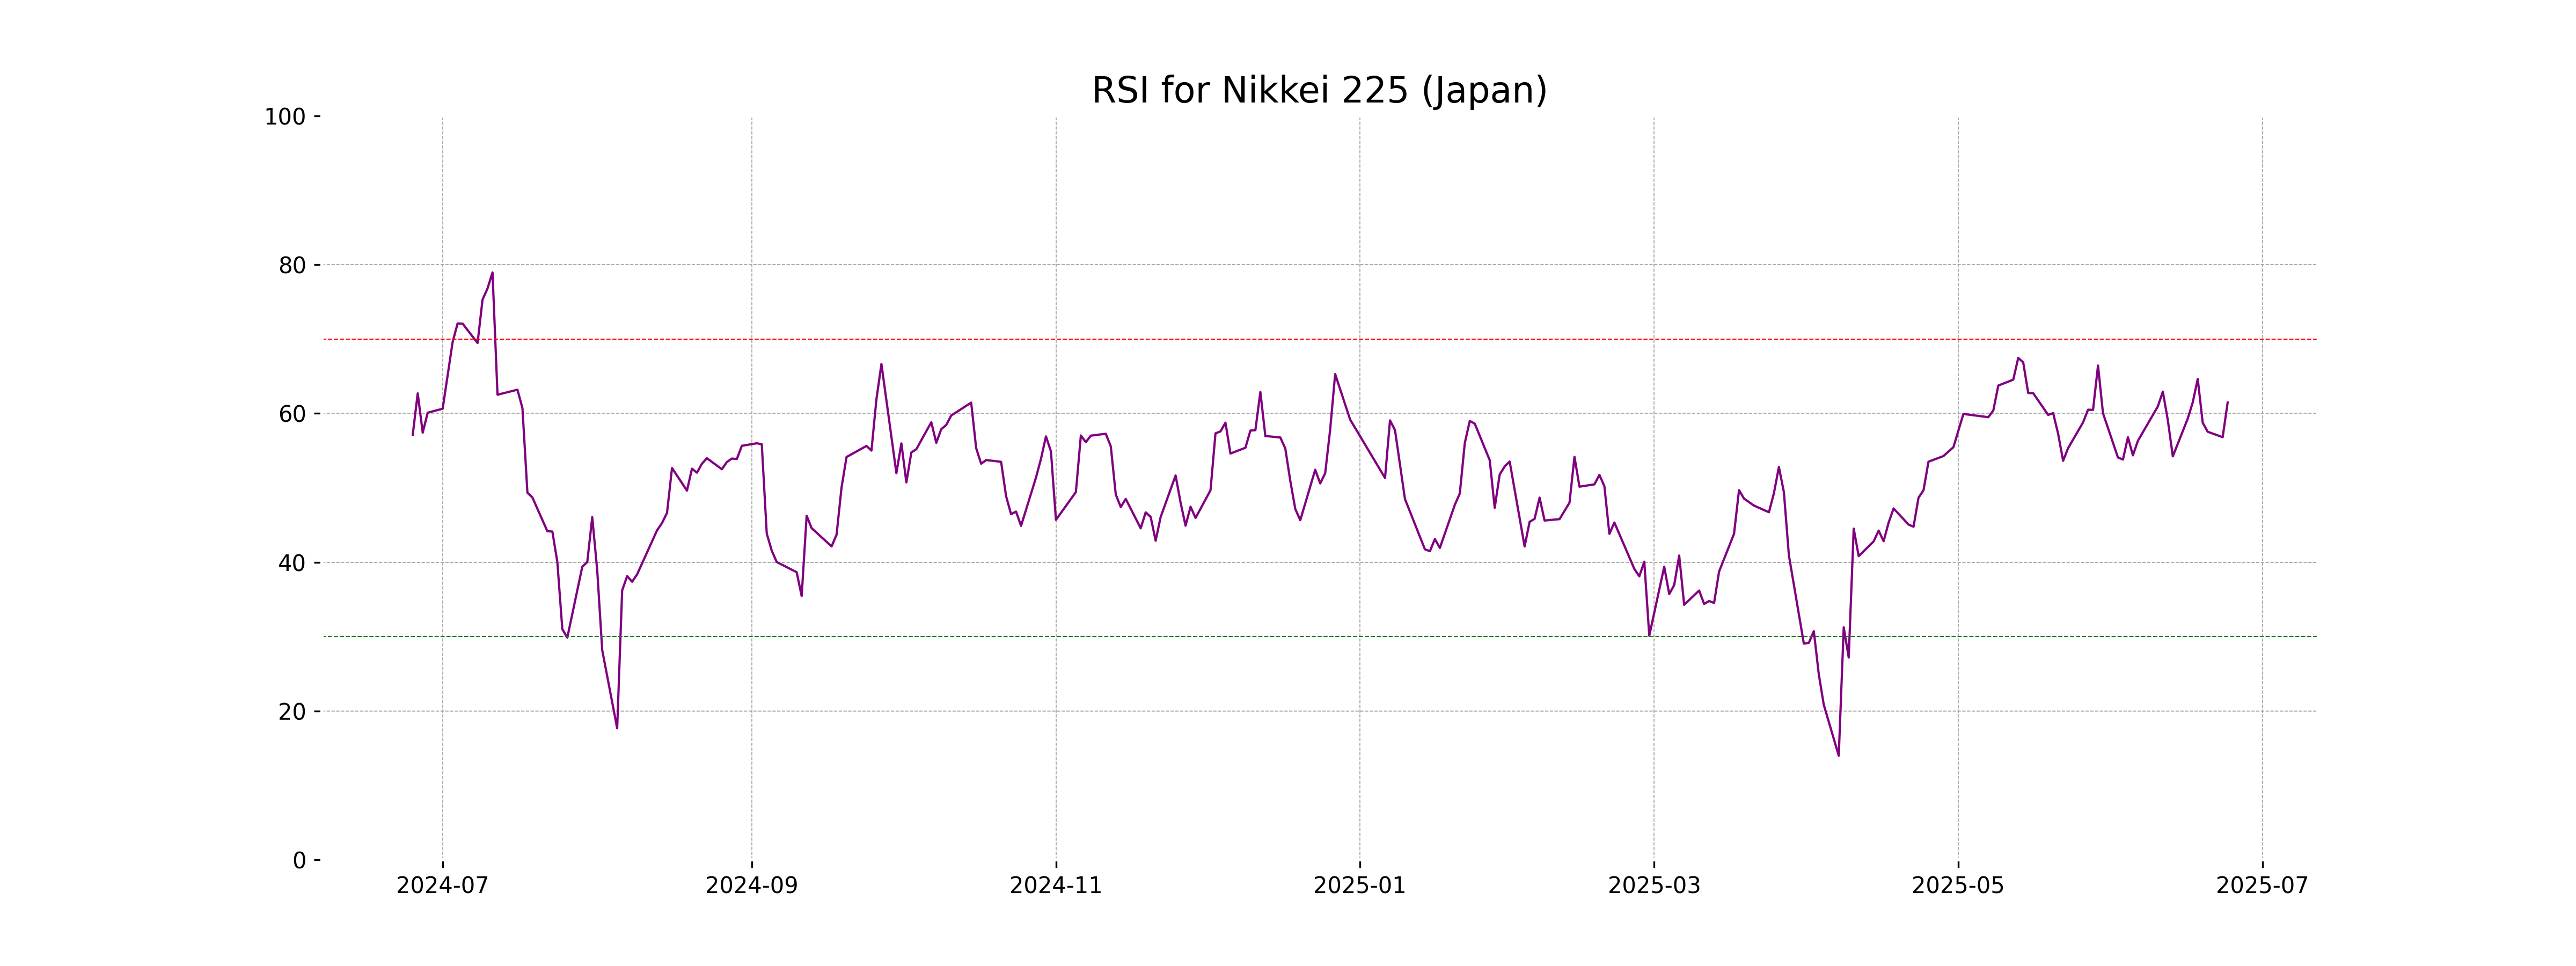
RSI Analysis
Based on the stock data provided, the RSI value for Nikkei 225 is 61.47. This suggests a bullish trend as it indicates a strength above the neutral level of 50. However, since it is below the overbought level of 70, there might still be room for further upward movement before potential corrections.
Analysis for Nifty Bank - June 24, 2025
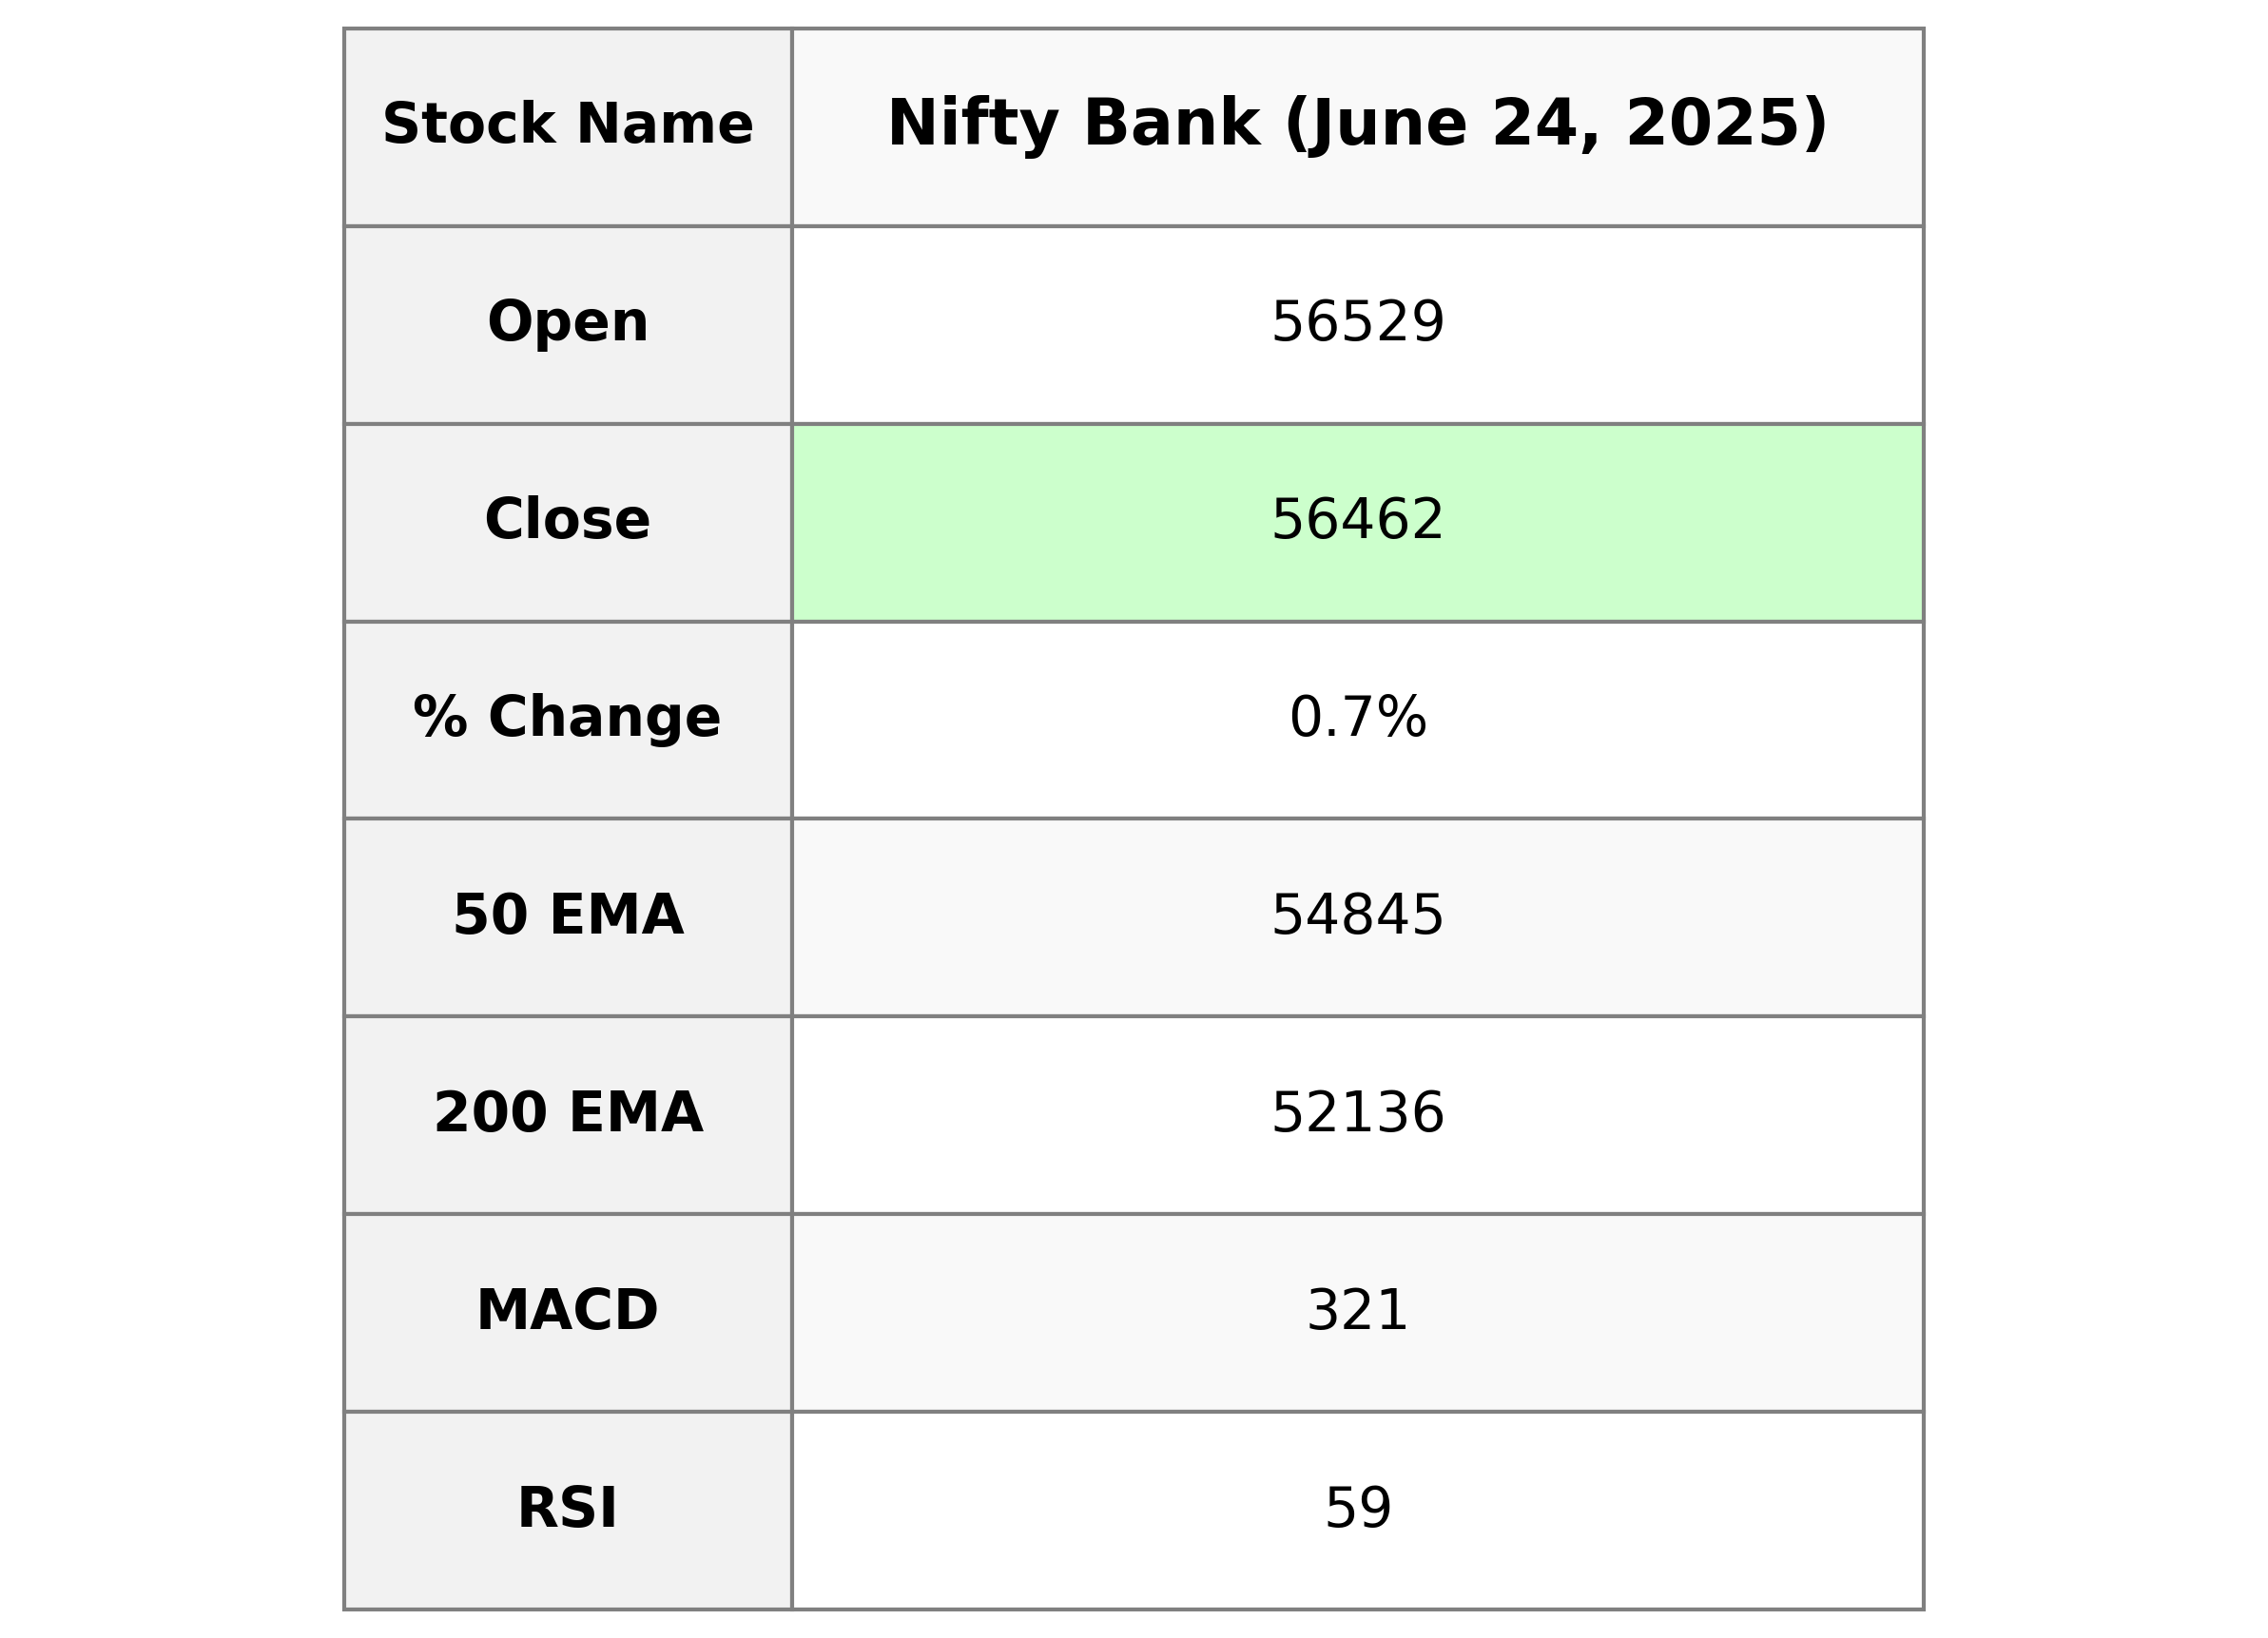
Nifty Bank opened at 56,529.45, reached a high of 56,862.00, and closed at 56,461.90 showing a percentage gain of 0.72% or 402.55 points. The index is trading above its 50-day and 200-day EMA, indicating a bullish trend, with an RSI of 59.20 suggesting moderate strength. The MACD line is below the signal line, which may indicate a potential slowdown in upward momentum.
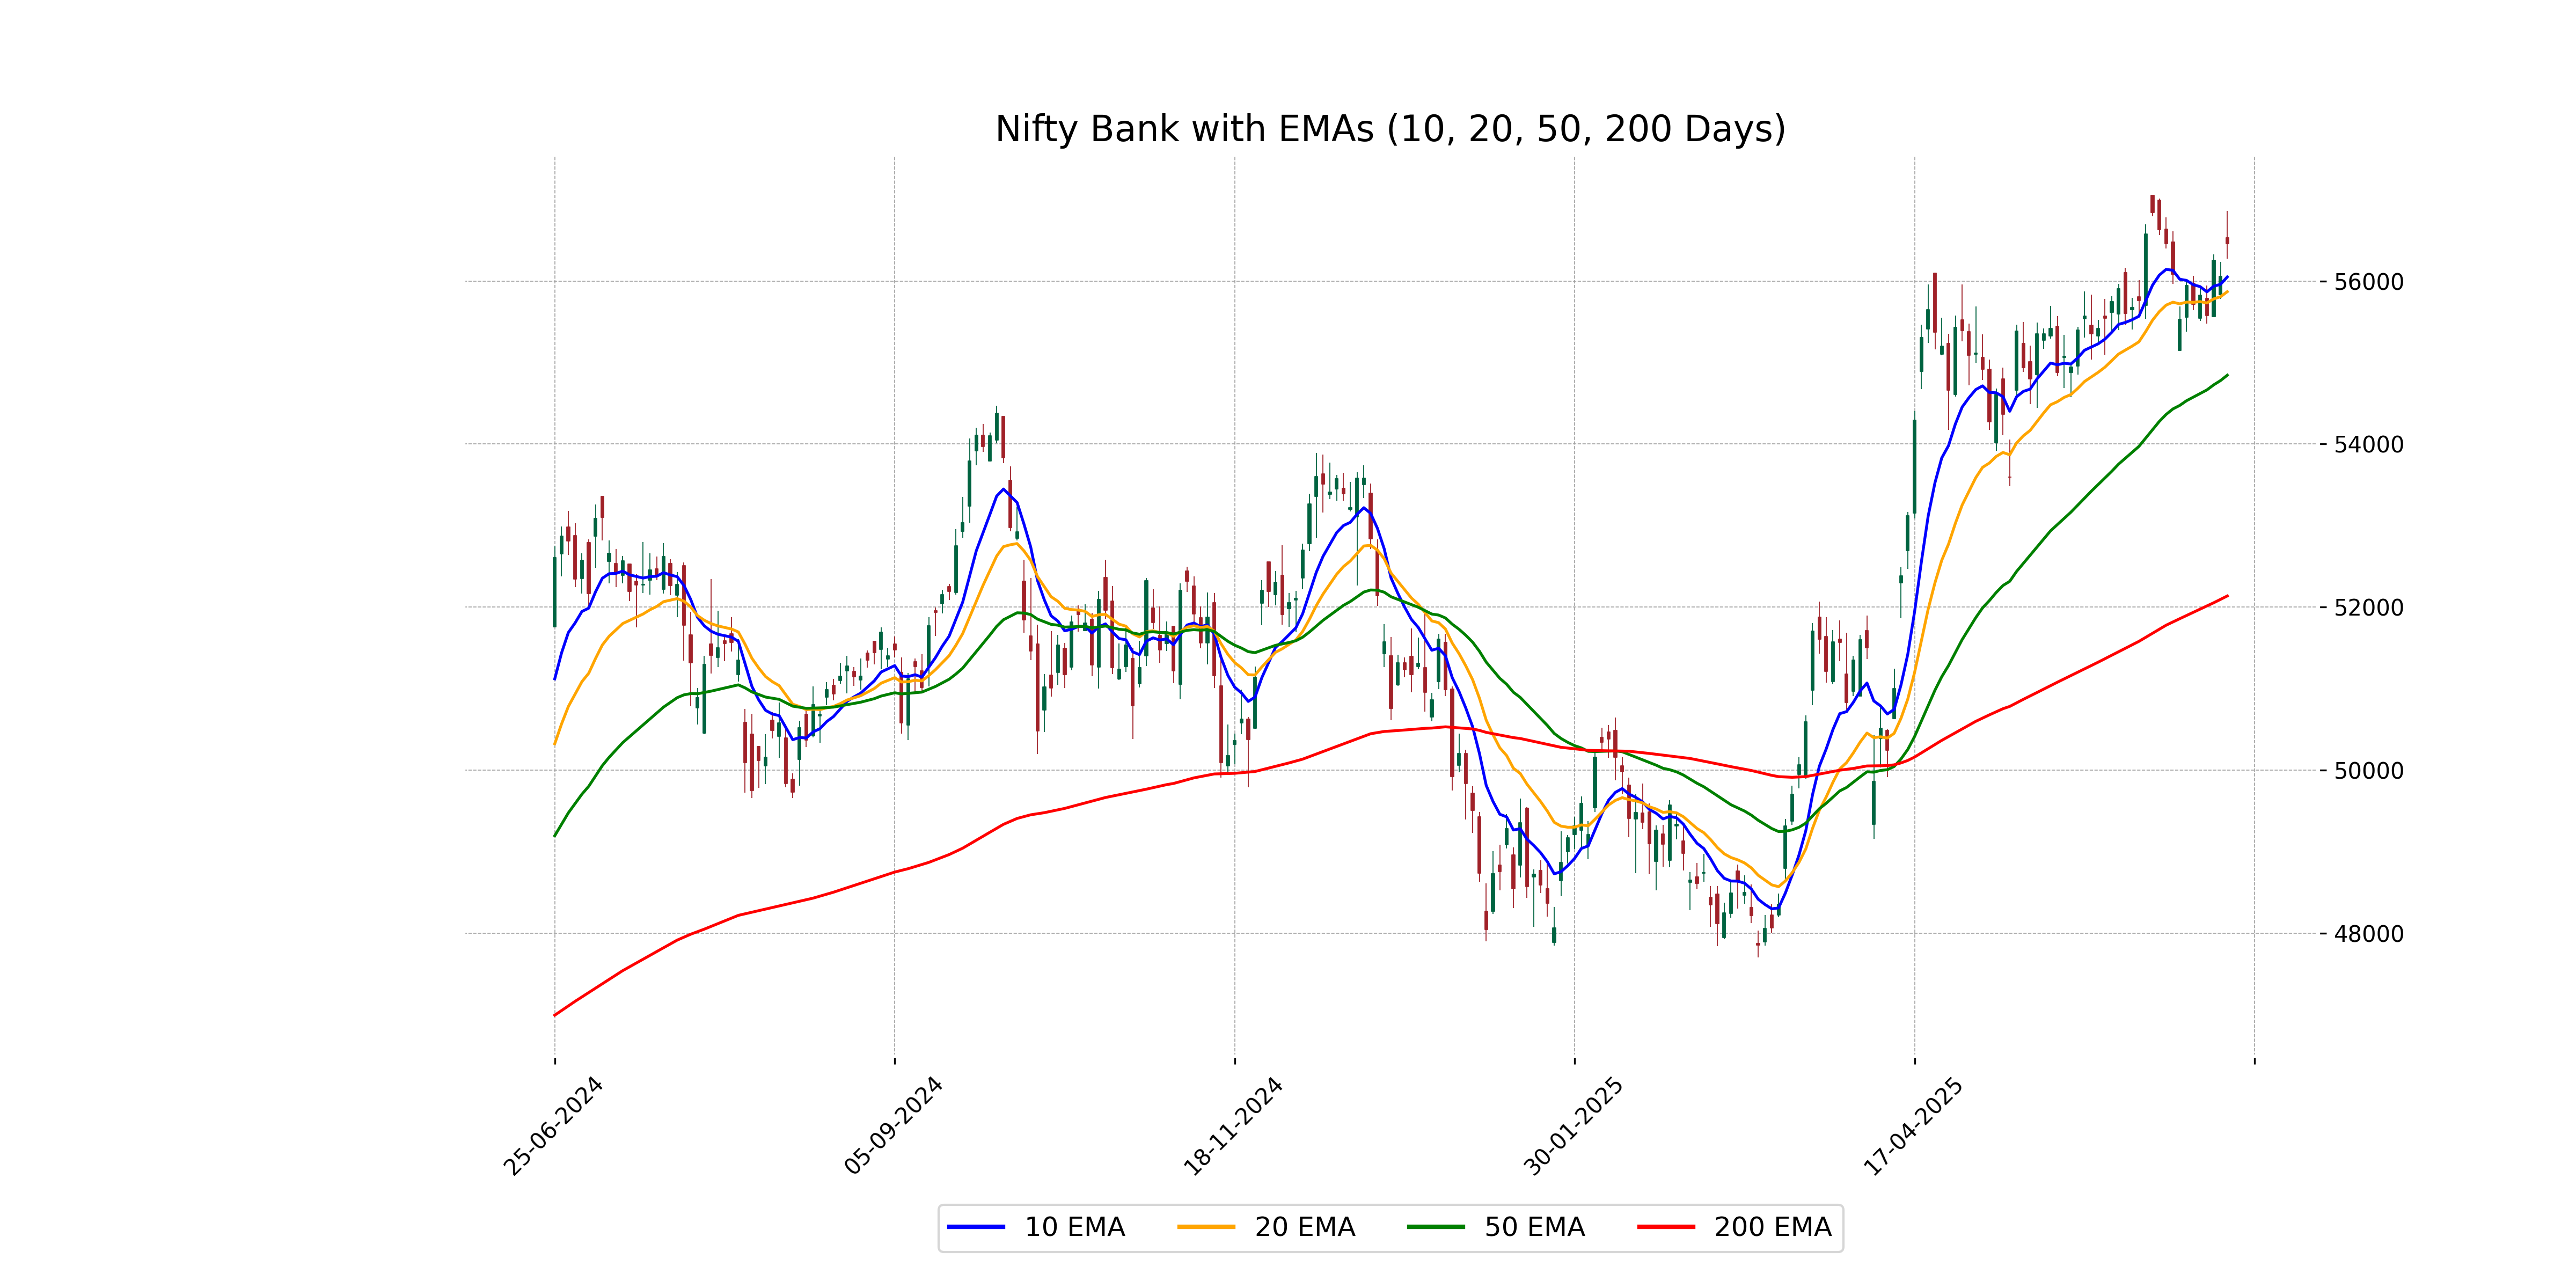
Relationship with Key Moving Averages
Nifty Bank closed at 56,461.90, which is above its 50-day EMA of 54,844.86 and 200-day EMA of 52,135.95, indicating a bullish trend over these longer periods. However, it remains very close to its 10-day EMA of 56,051.00 and 20-day EMA of 55,869.98, suggesting potential near-term indecision or consolidation.
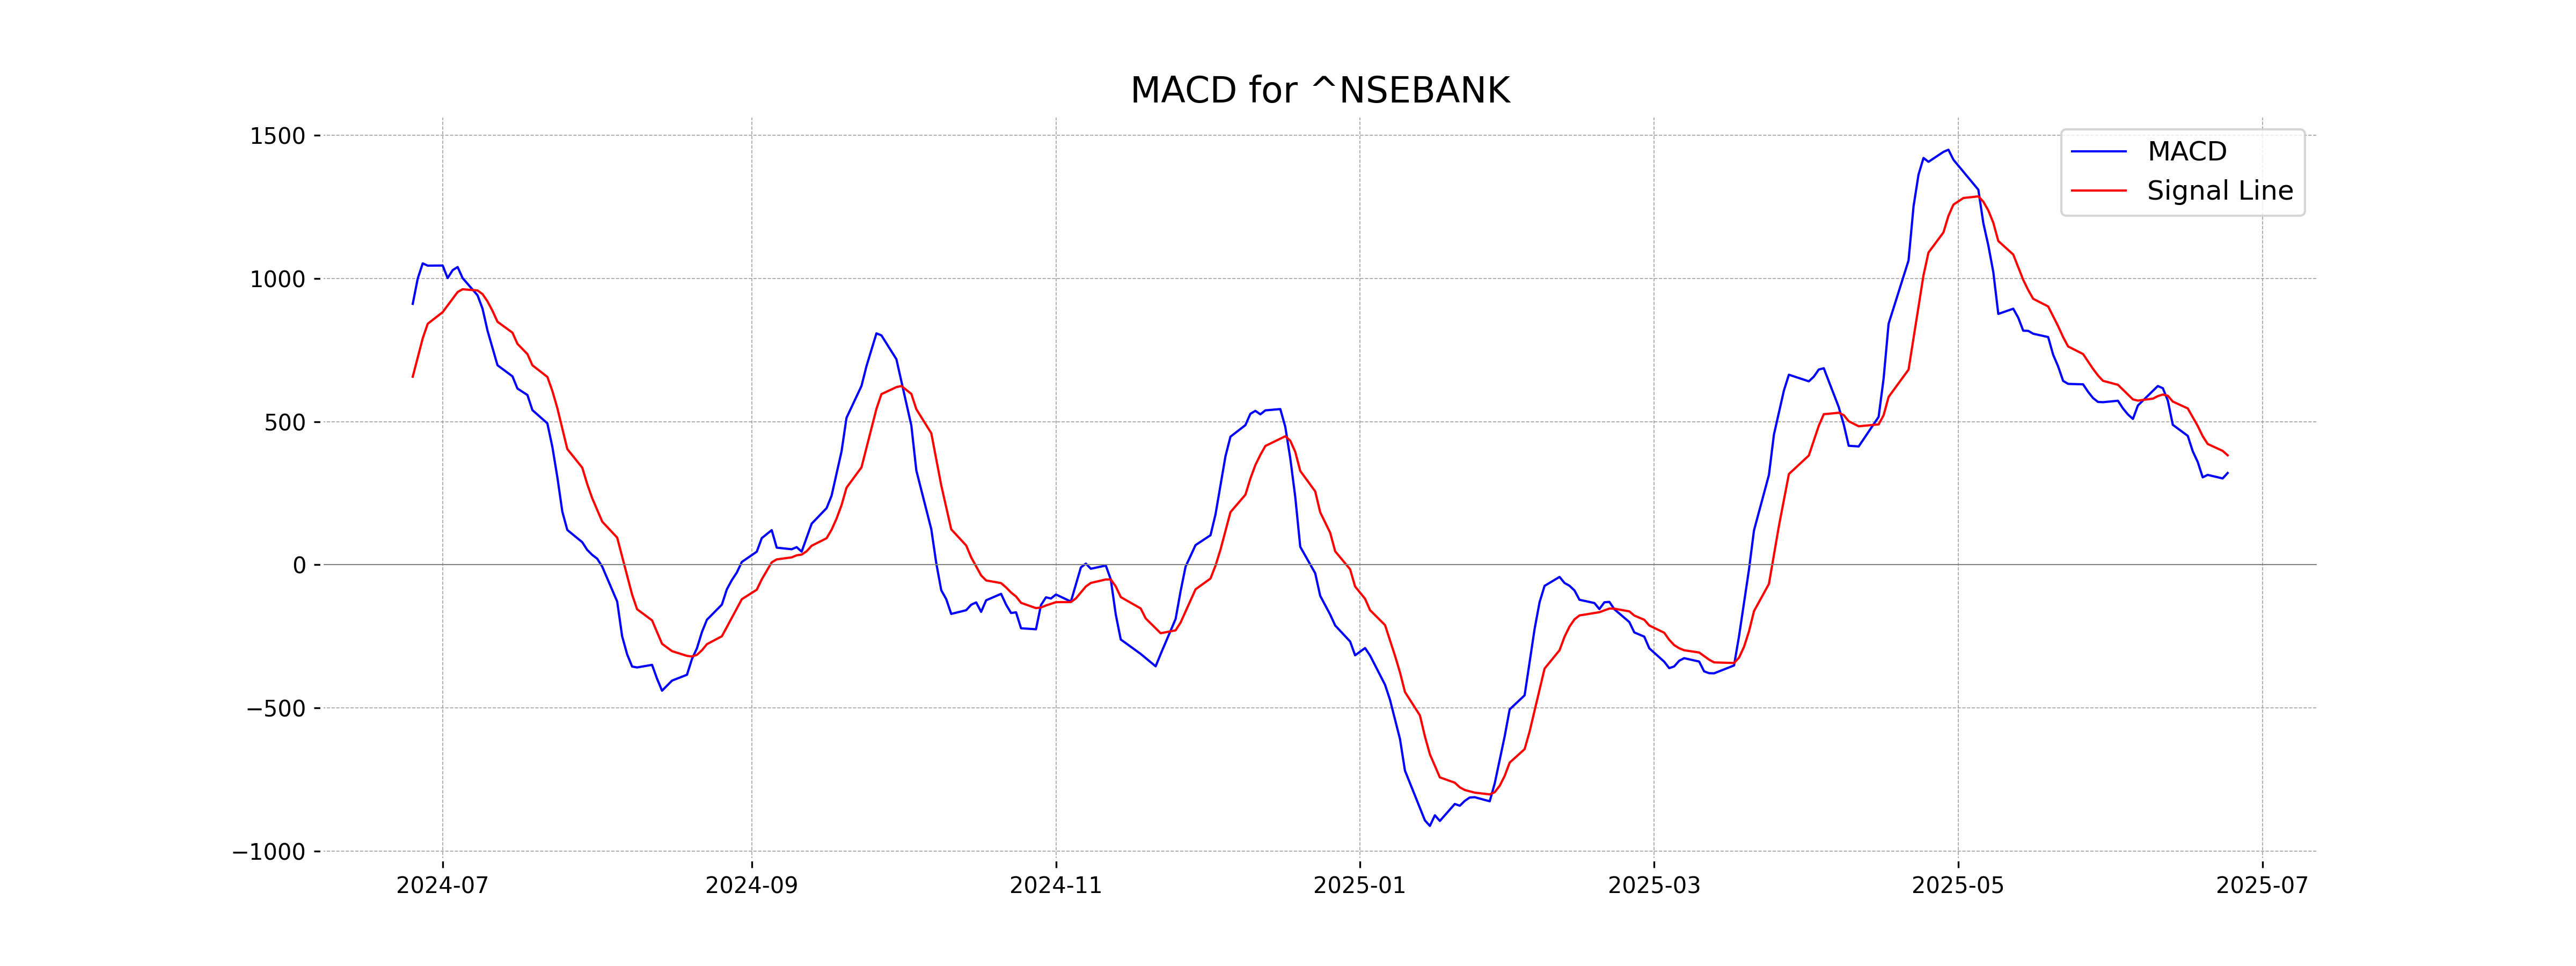
Moving Averages Trend (MACD)
Nifty Bank is currently showing a bearish crossover scenario as the MACD value of 320.58 is below the MACD Signal line of 382.37. This suggests a potential for downward momentum, indicating that traders should be cautious for possible declines.
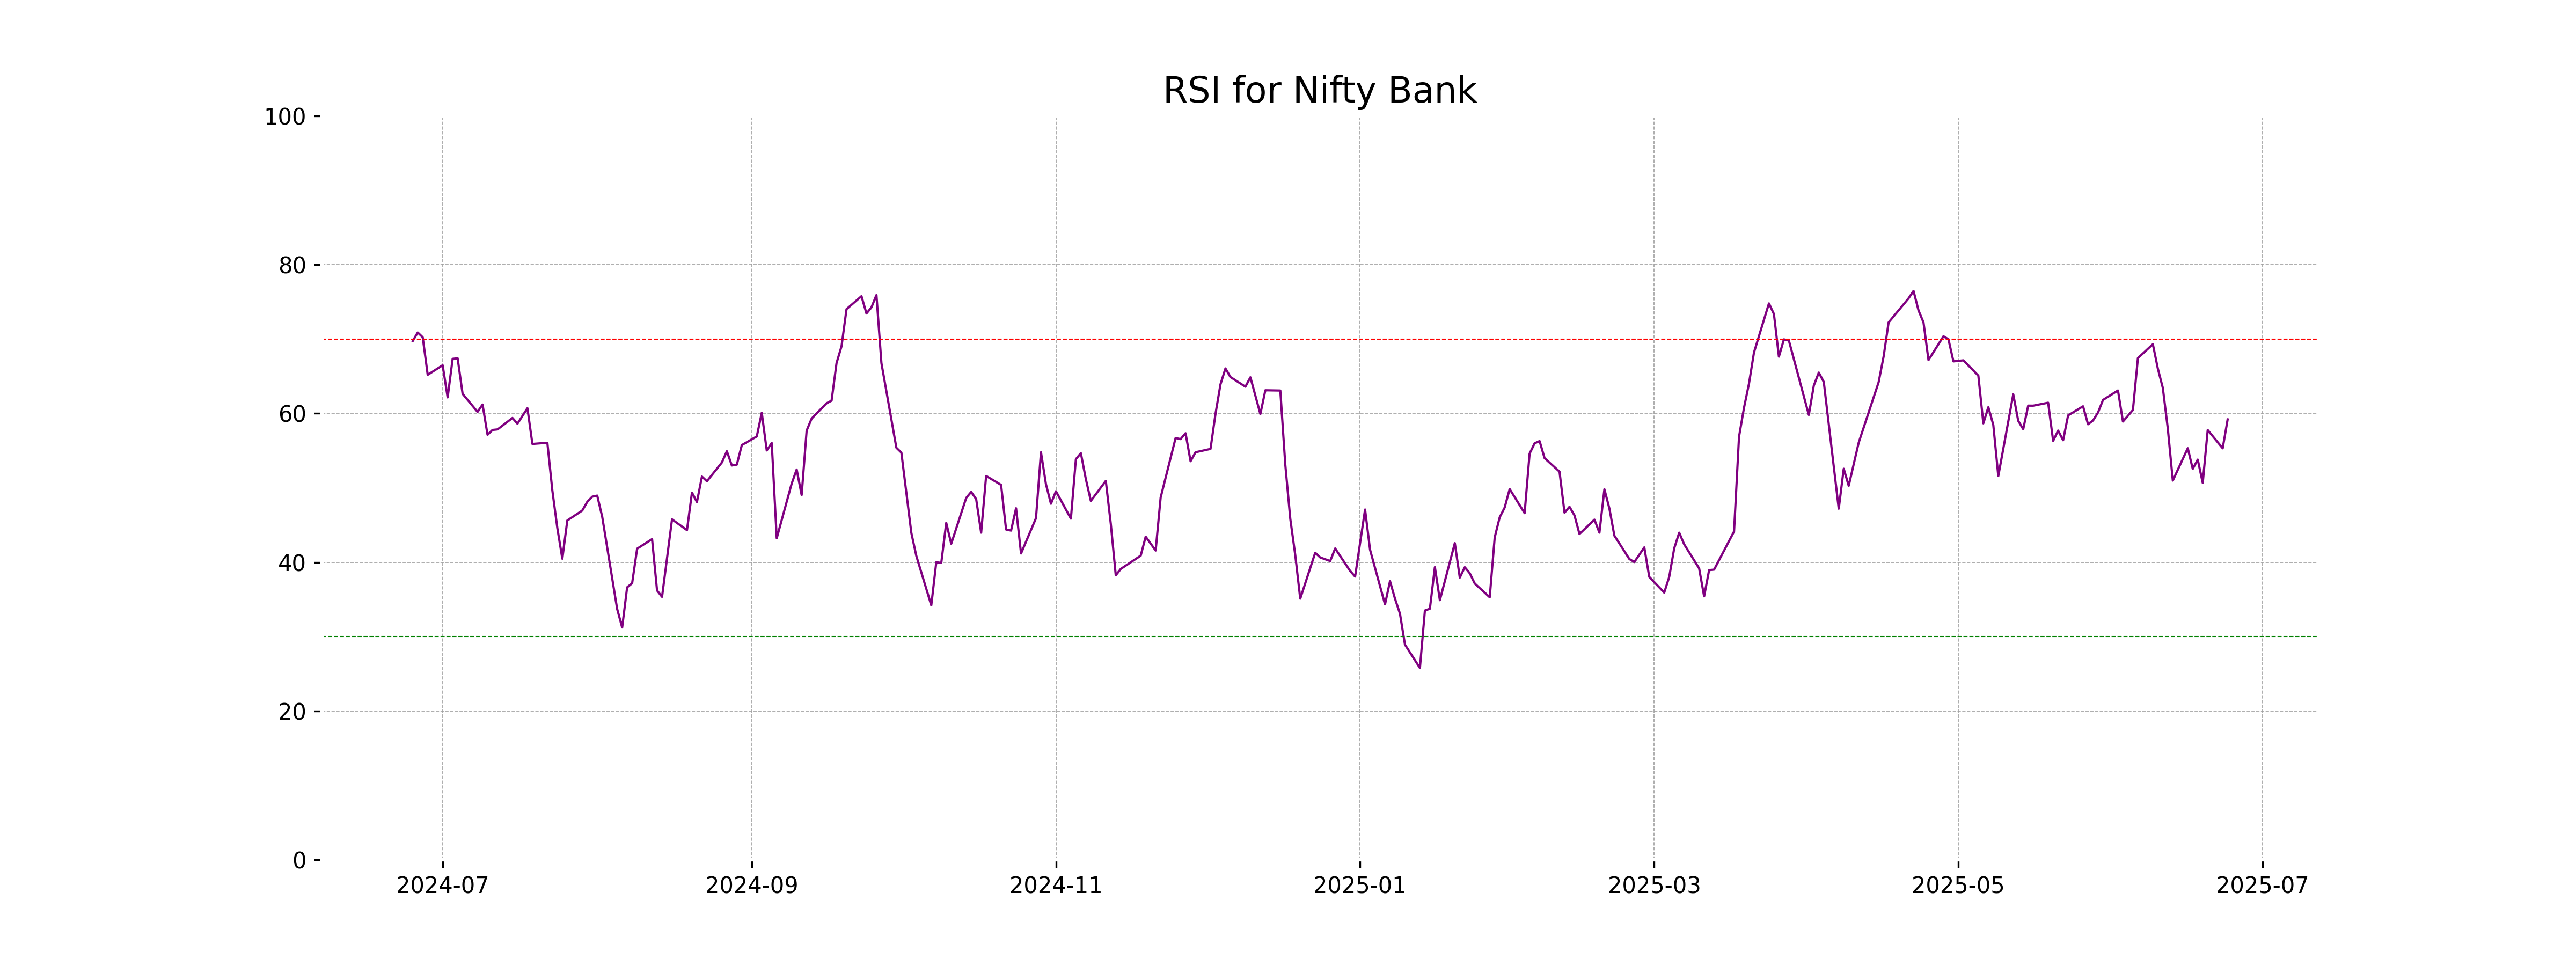
RSI Analysis
Nifty Bank's RSI stands at 59.20, which is below the typical overbought threshold of 70, suggesting that it is not yet in overbought territory. This indicates a relatively neutral momentum, with no significant signs of overbought or oversold conditions.
Analysis for Nifty 50 - June 24, 2025
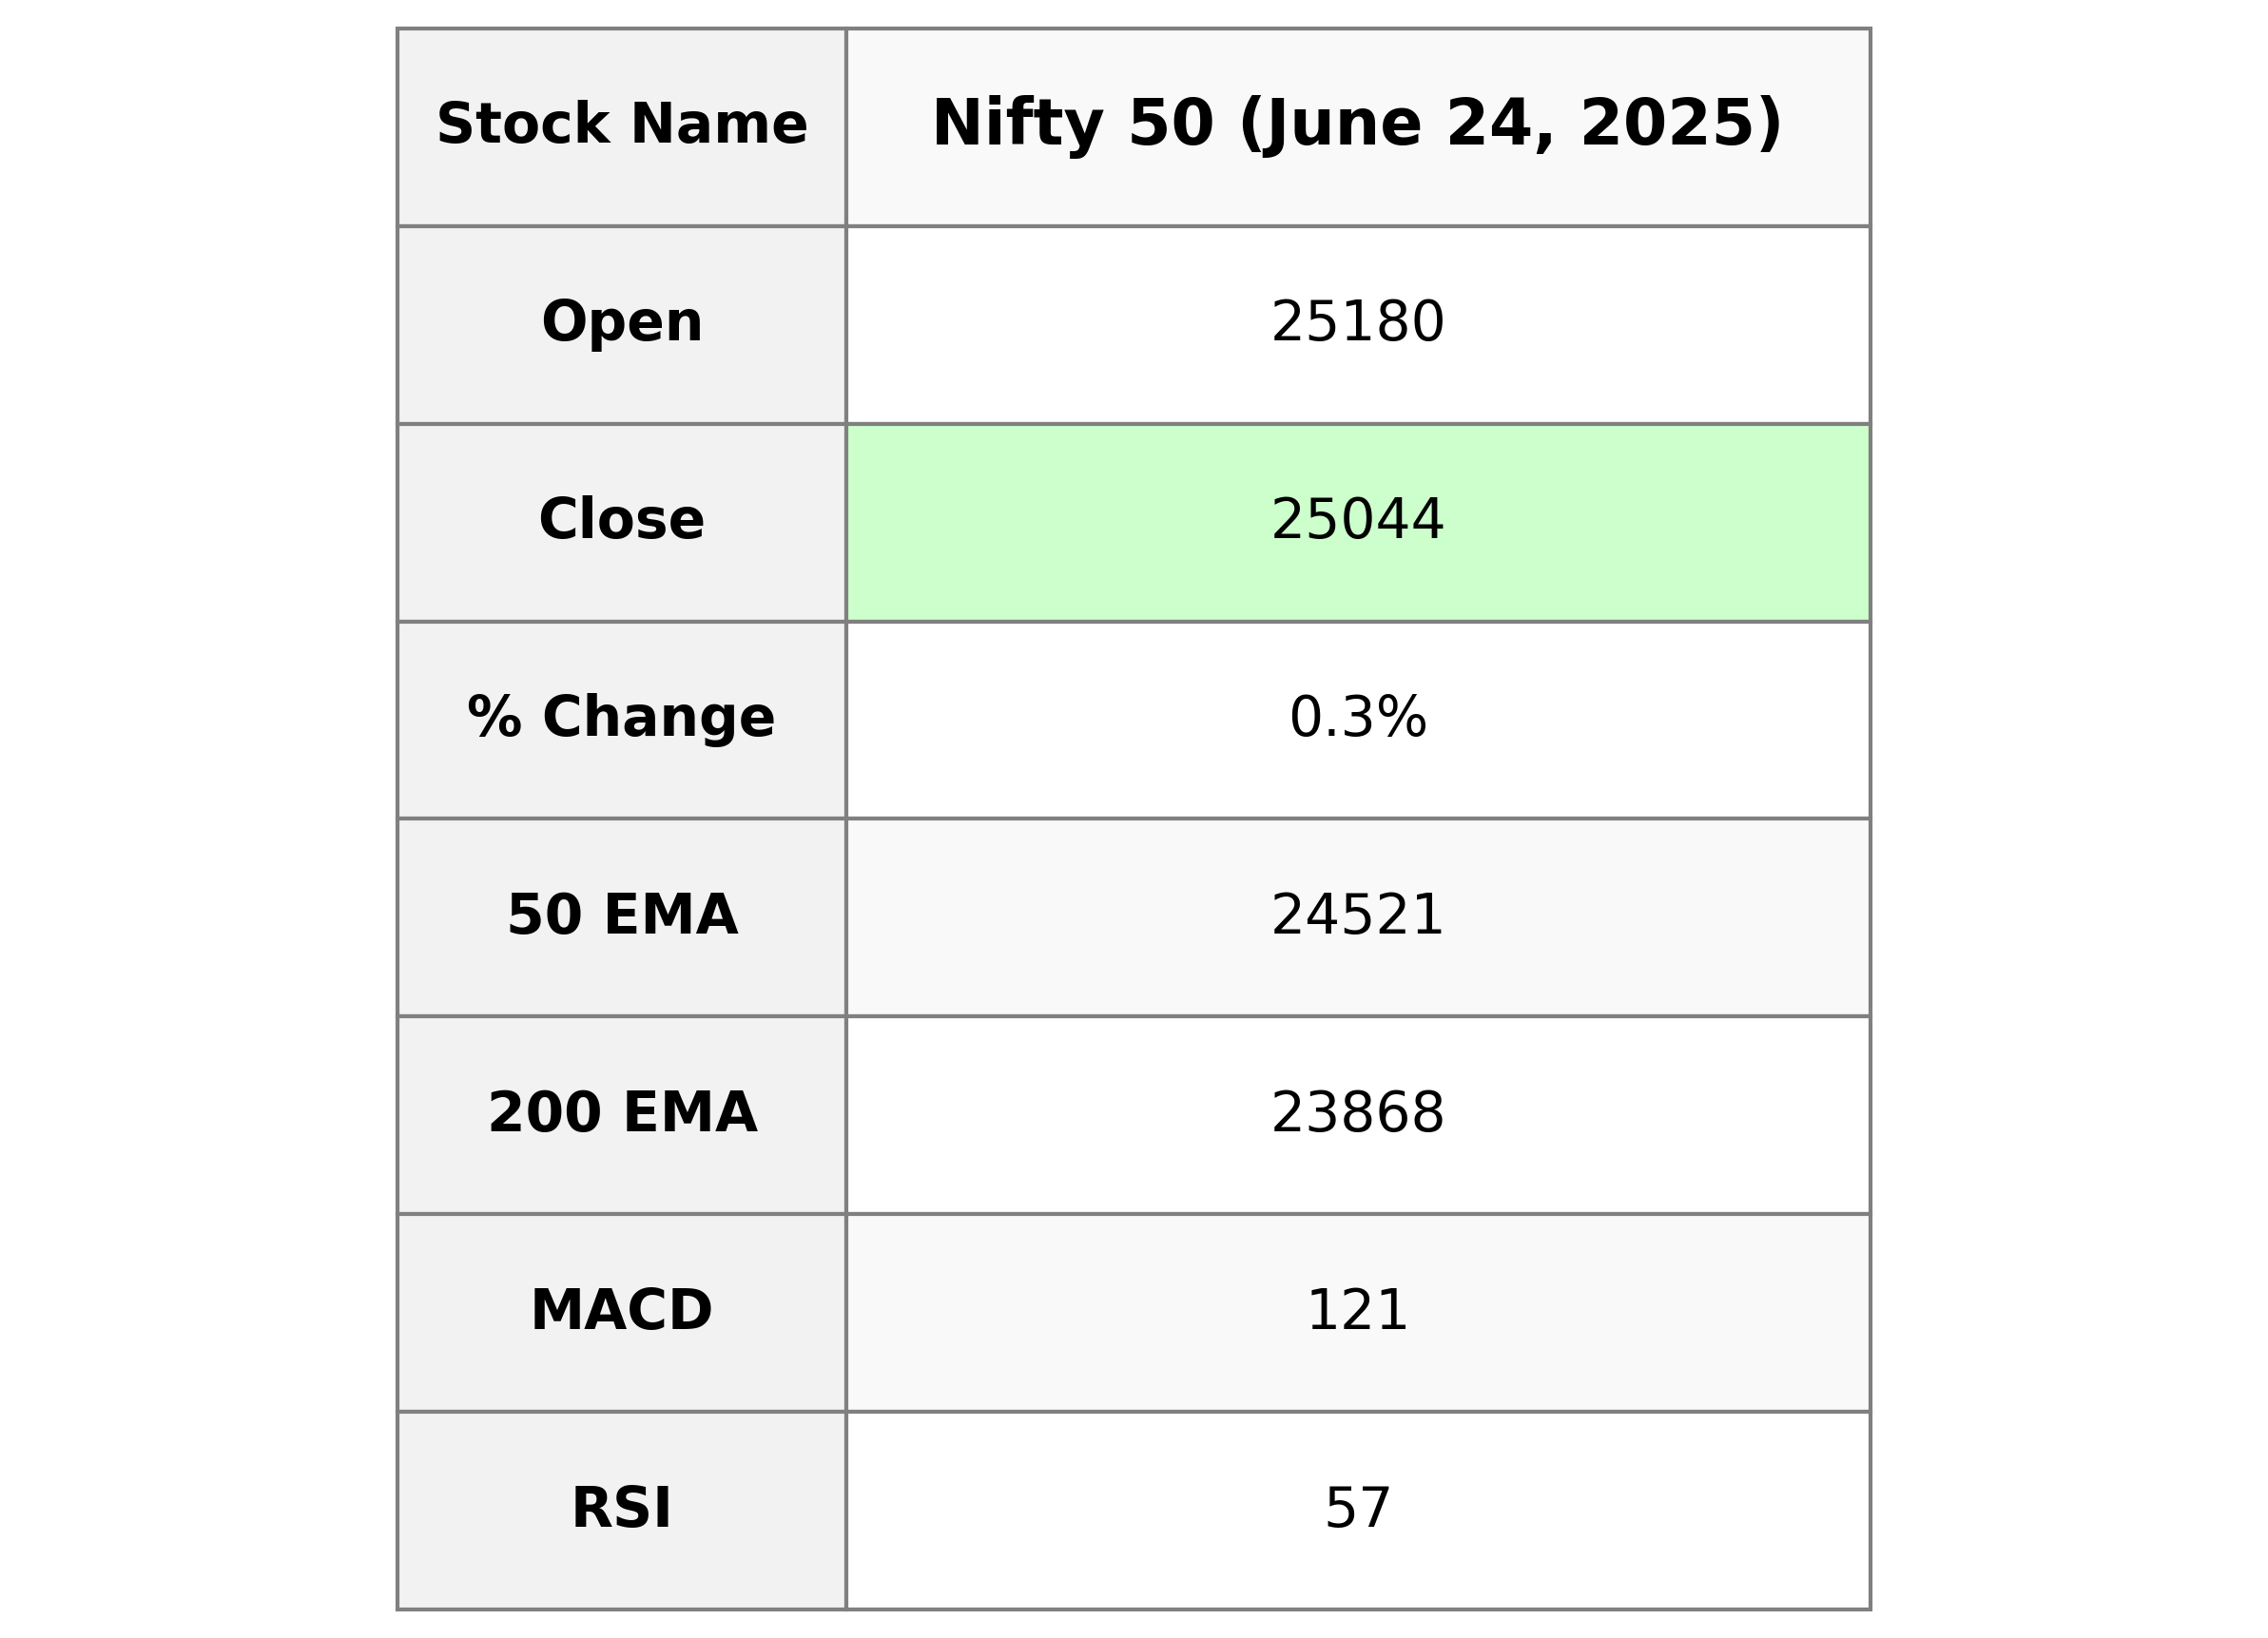
The Nifty 50 index opened at 25,179.90, reached a high of 25,317.70, and closed at 25,044.35, showing a marginal increase of 0.29% or 72.45 points from its previous close of 24,971.90. The RSI indicates moderate bullish momentum at 56.71, while the MACD shows a decreasing trend with a value below the signal line. The closing price is above the 10-day and 20-day EMAs, suggesting a short-term positive trend.
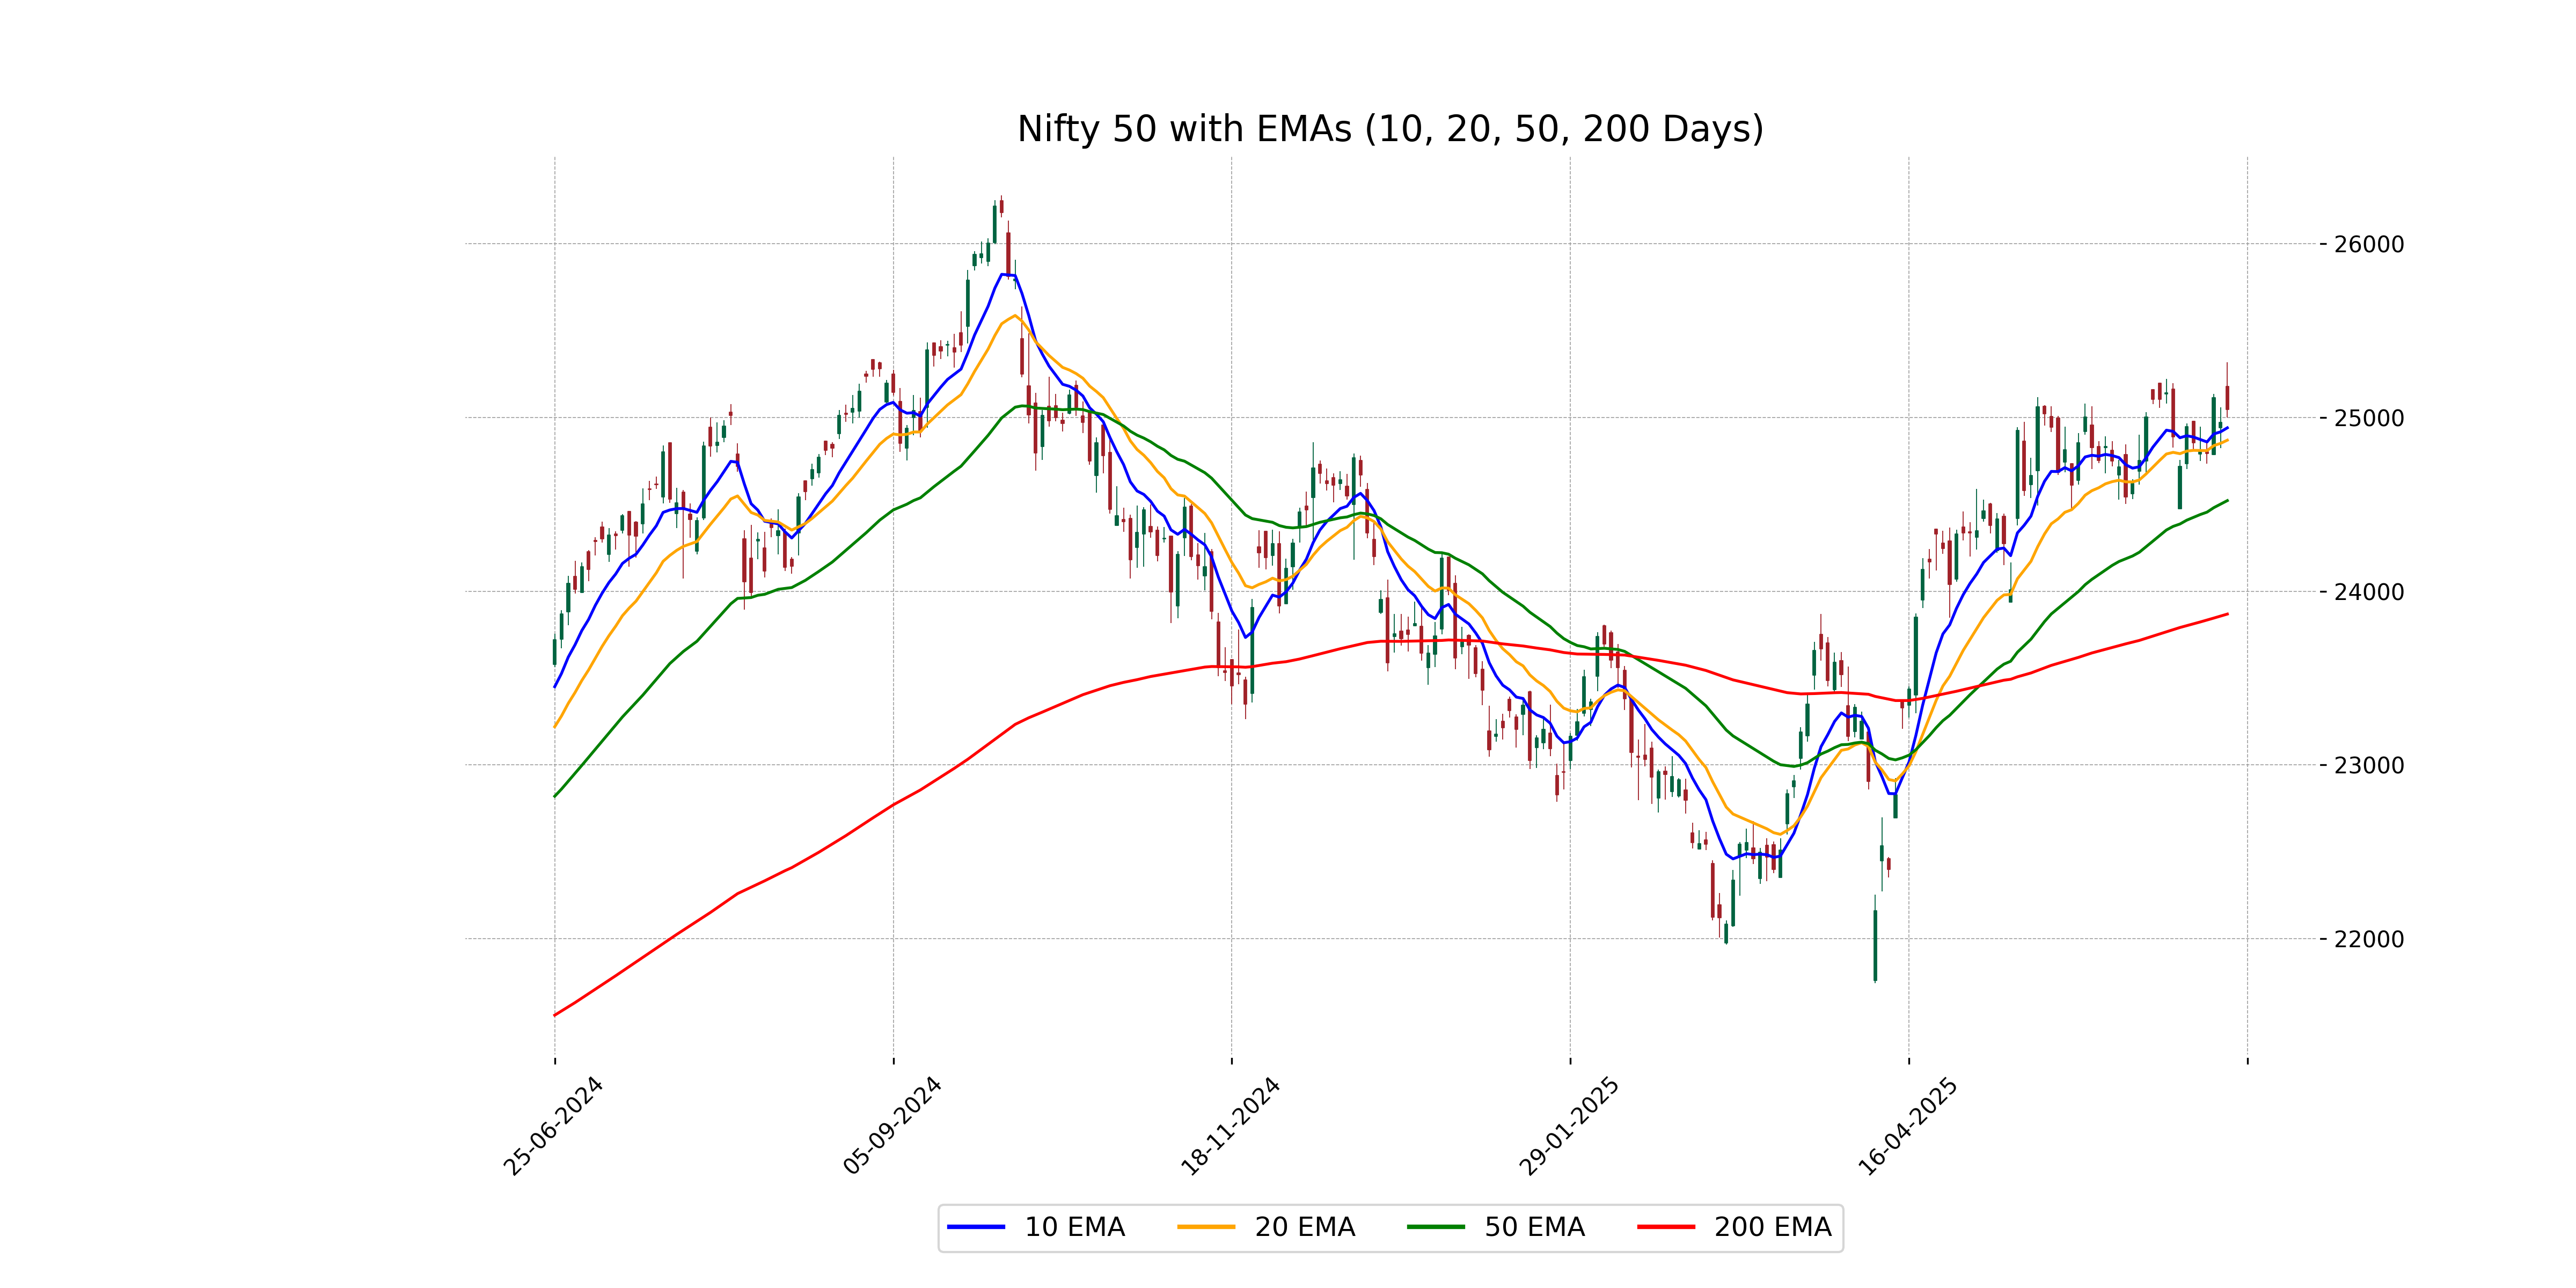
Relationship with Key Moving Averages
Nifty 50 is trading above its 10 EMA (24940.30) and 20 EMA (24869.20), indicating a short-term bullish trend. However, it remains below the MACD Signal line, suggesting a potential bearish reversal. The price is also above the 50 EMA (24521.35) and significantly above the 200 EMA (23868.23), reinforcing a continued longer-term upward momentum.
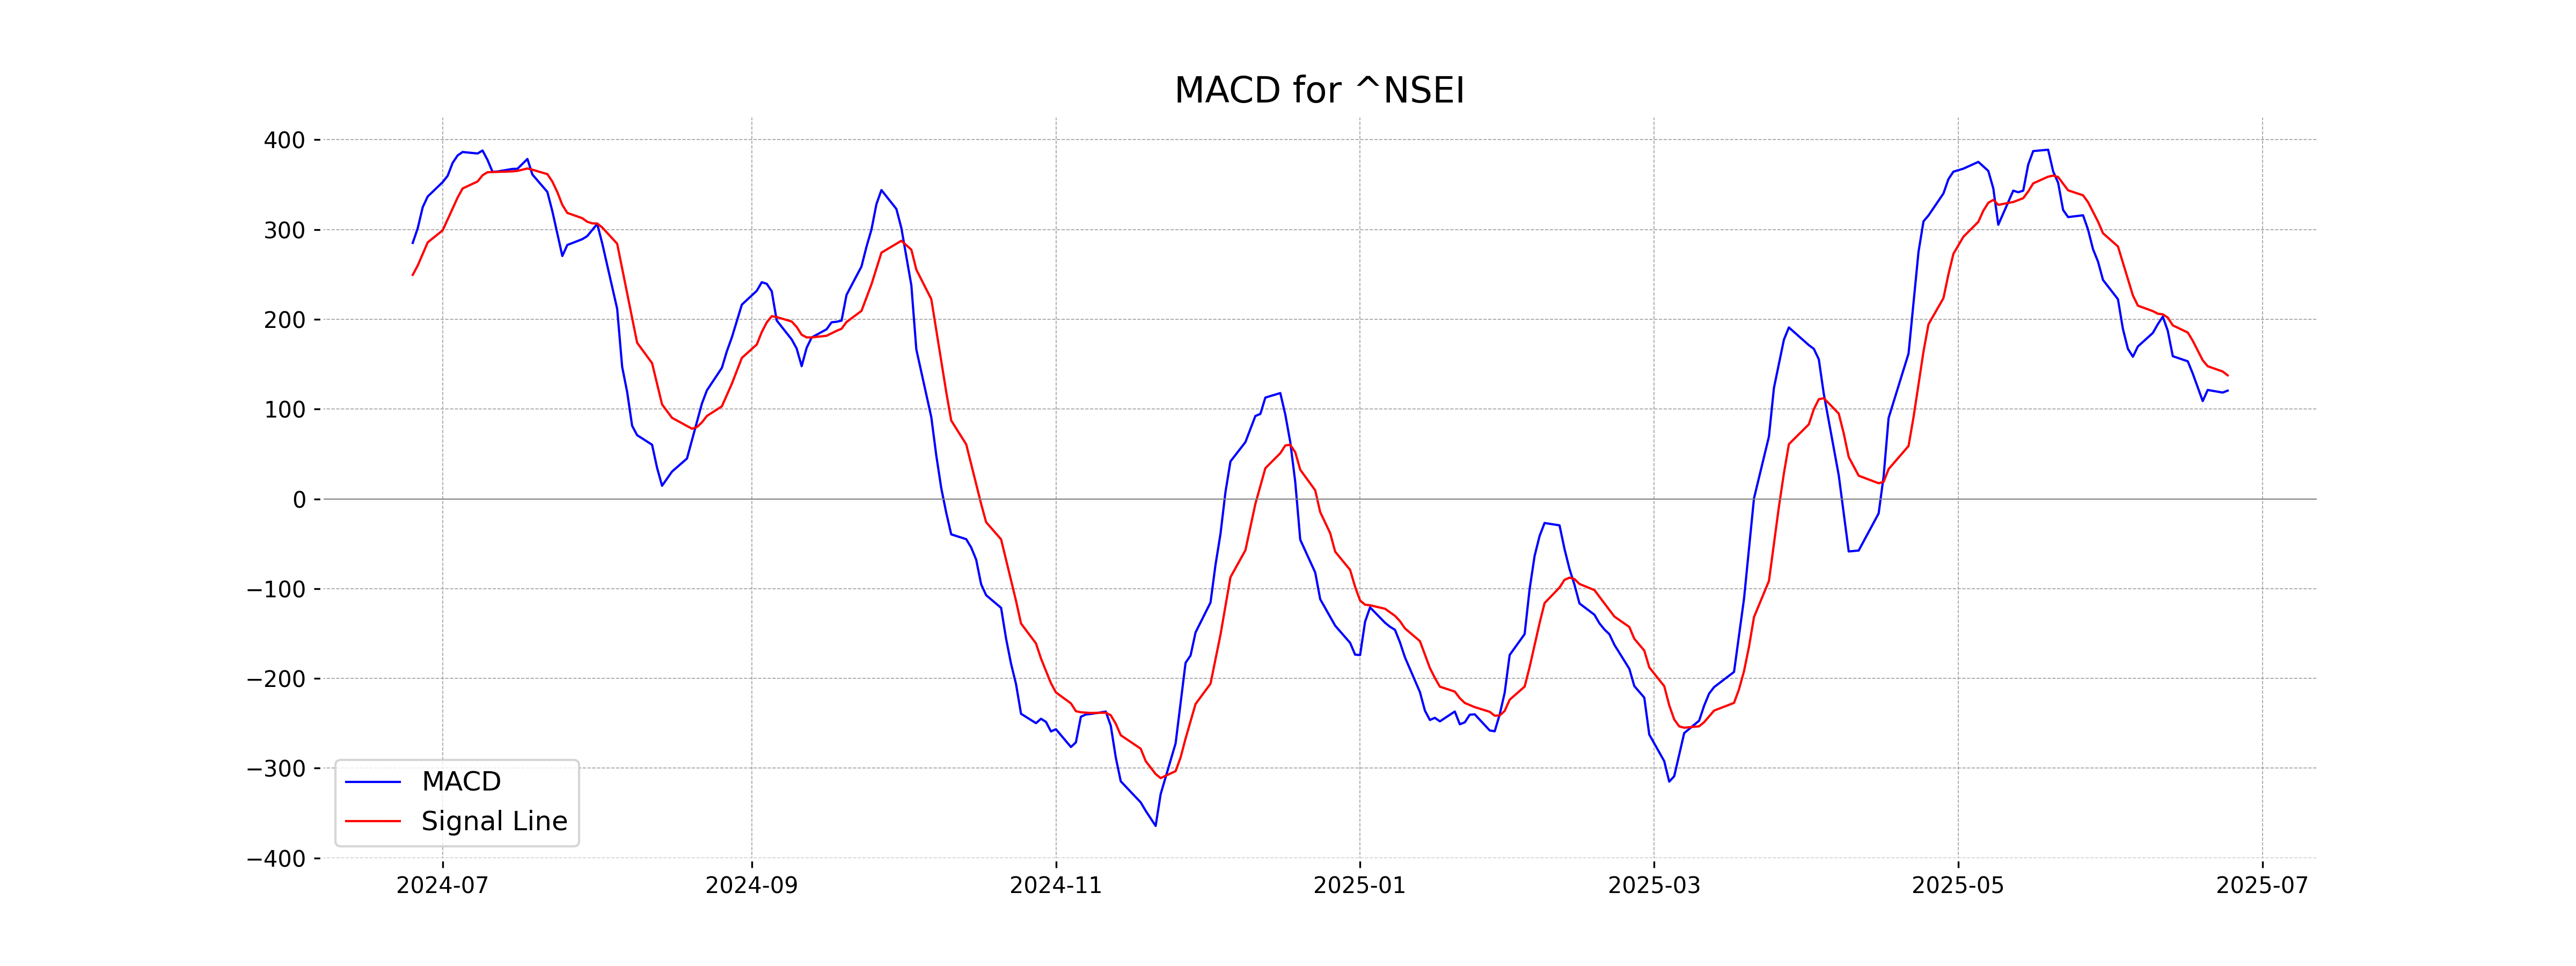
Moving Averages Trend (MACD)
The MACD for Nifty 50 is at 120.59, which is below its signal line of 137.63, suggesting a potential bearish momentum. This could indicate some selling pressure in the market. However, with the RSI at 56.71, the market is in neutral territory, not showing signs of being overbought or oversold.
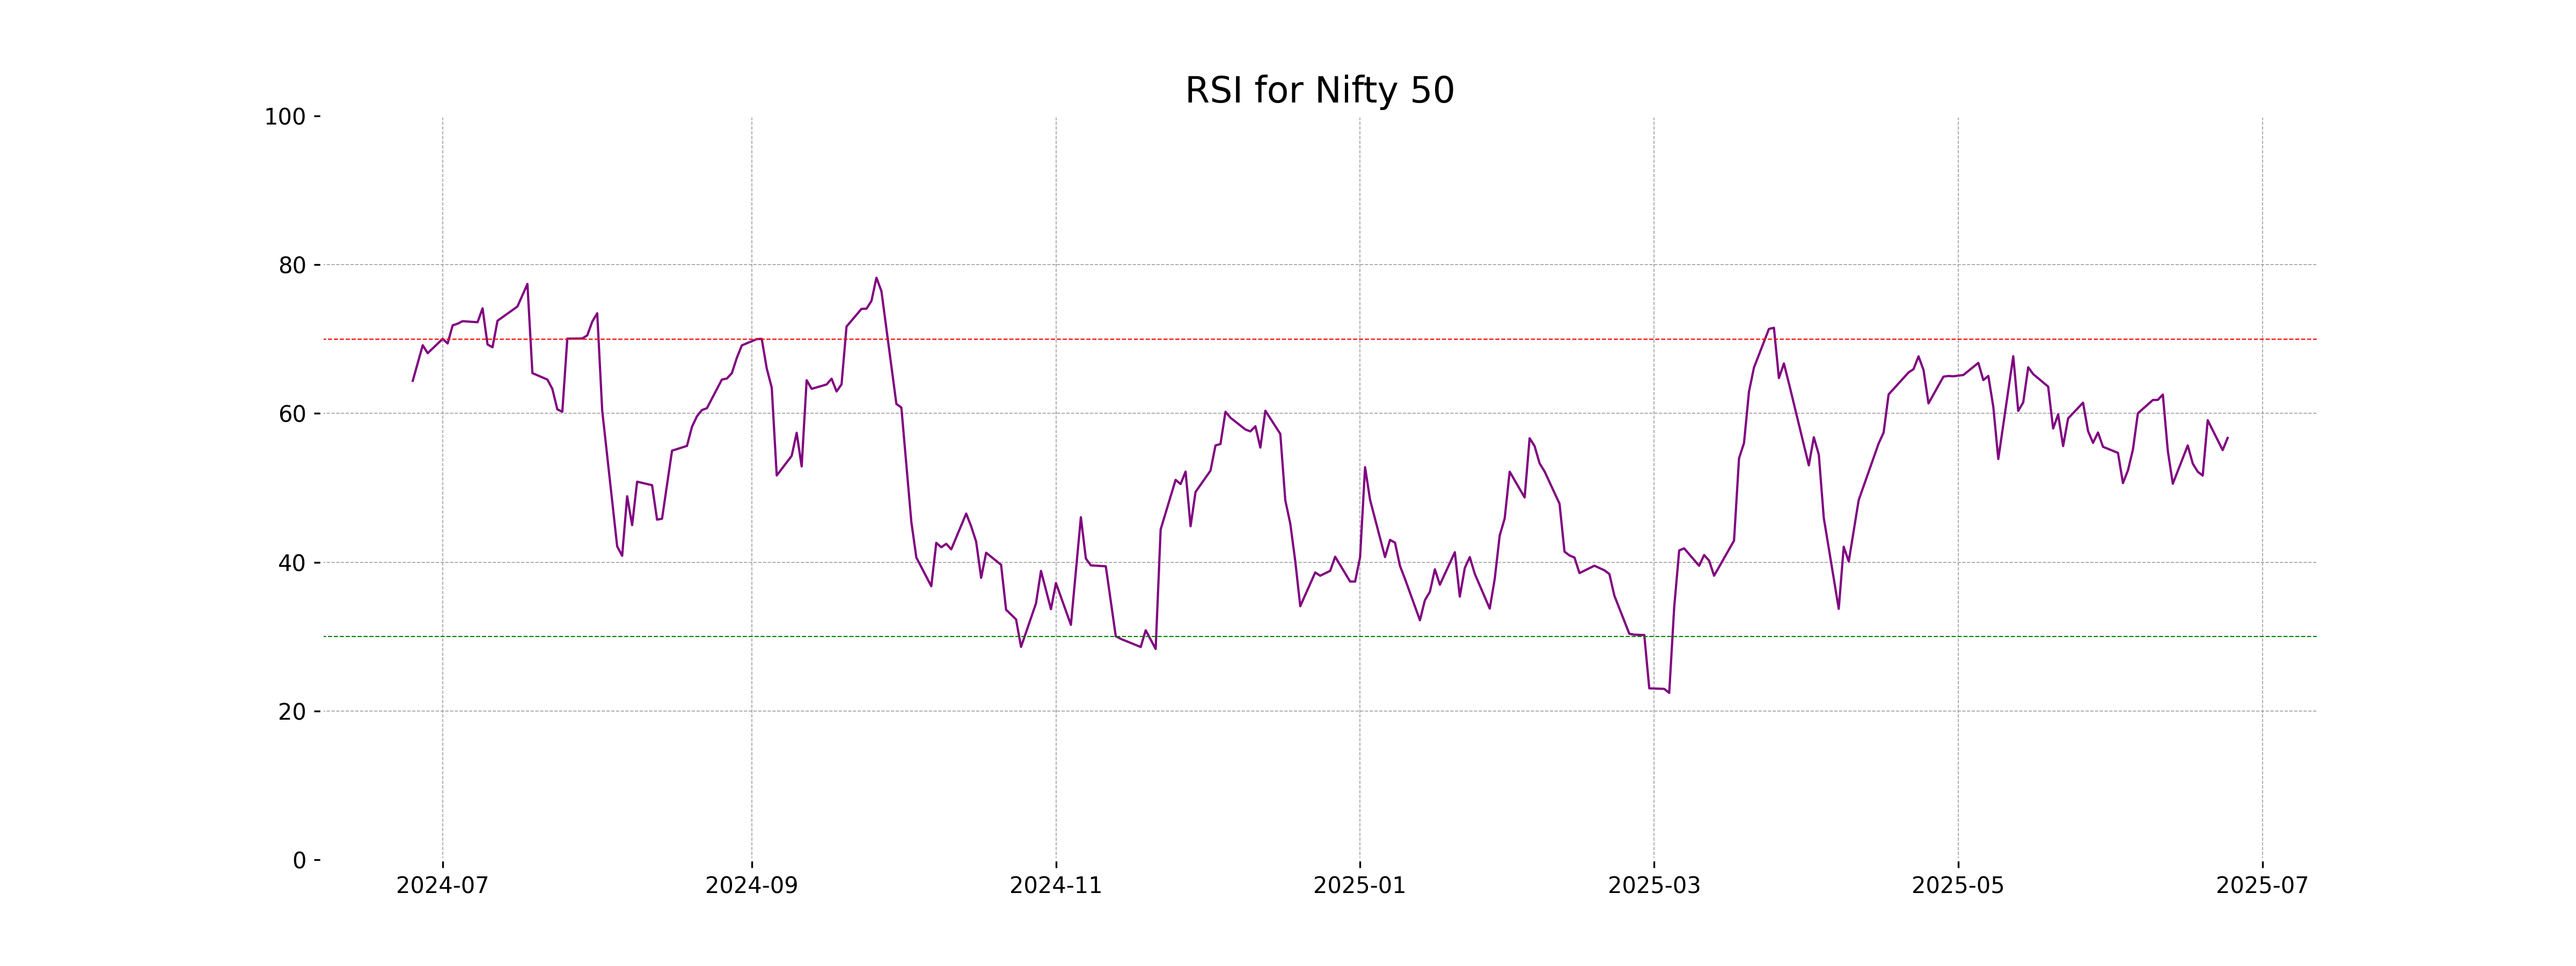
RSI Analysis
The RSI for Nifty 50 is 56.71, indicating a neutral momentum—neither overbought nor oversold. This suggests that the index may trade sideways unless further catalysts emerge to influence more definitive trends.
Up Next

Global stock market indices: How the world markets performed today - 24 June 2025

Step-by-step guide to apply for a mortgage loan online with minimal documentation

Honda Activa 6G: Everything You Need to Know Before Buying

How much does a ULIP plan really cost? A break-down of all charges

Centre plans to borrow Rs 8.20 lakh cr from market in first half of FY27

Reliance denies buying Iranian oil amid US sanctions waiver

More videos

Premium petrol price up Rs 2, industrial diesel up Rs 22; no change in normal petrol, diesel rates

India's GDP expected to register over 8 pc growth in Sep-Dec: Report

Govt announces seven measures to help boost exports

RBI keeps interest rates on hold after US trade deal boosts outlook

RBI proposes to compensate customers up to Rs 25,000 loss due to fraud

RBI raises GDP growth projection of Q1, Q2 of FY27

RBI pauses rate cuts, retains interest rate at 5.25 pc

Rupee jumps 122 paise to close at 90.27 against US dollar on India-US trade deal

Stock markets cheer India-US trade deal: Sensex, Nifty surge 2.5 pc

UPI transactions hit record high of Rs 230 lakh crore in 2025-26 till Dec: Govt