


Highlights
- Sensex, Dow Jones, Hang Seng end higher
- FTSE 100 nears overbought; DAX shows pressure
- MACD trends mixed; RSI signals cautious optimism
Latest news
: Annual Progress Report (2025-2026)")
Geeta University (Panipat, Delhi NCR): Annual Progress Report (2025-2026)

Shyam Group Highlights Shyam Serene: Prime Investment Gateway to Dholera SIR

Compassion Unites: Cross-Sector Mental Health Alliance Convened at UK Parliament

Pune RMC Plants Temporarily Pause Operations from April 16

Demi Moore to star in high-stakes culinary thriller 'Tyrant'

Anant National University to Offer Up to 100% Scholarships to UCEED 2026 Rankers

Focker-in-law trailer: Ariana Grande attempts to free her boyfriend from dependent relationship with Stiller

Ministry of coal to launch 15th round of commercial coal mine auctions on April 17
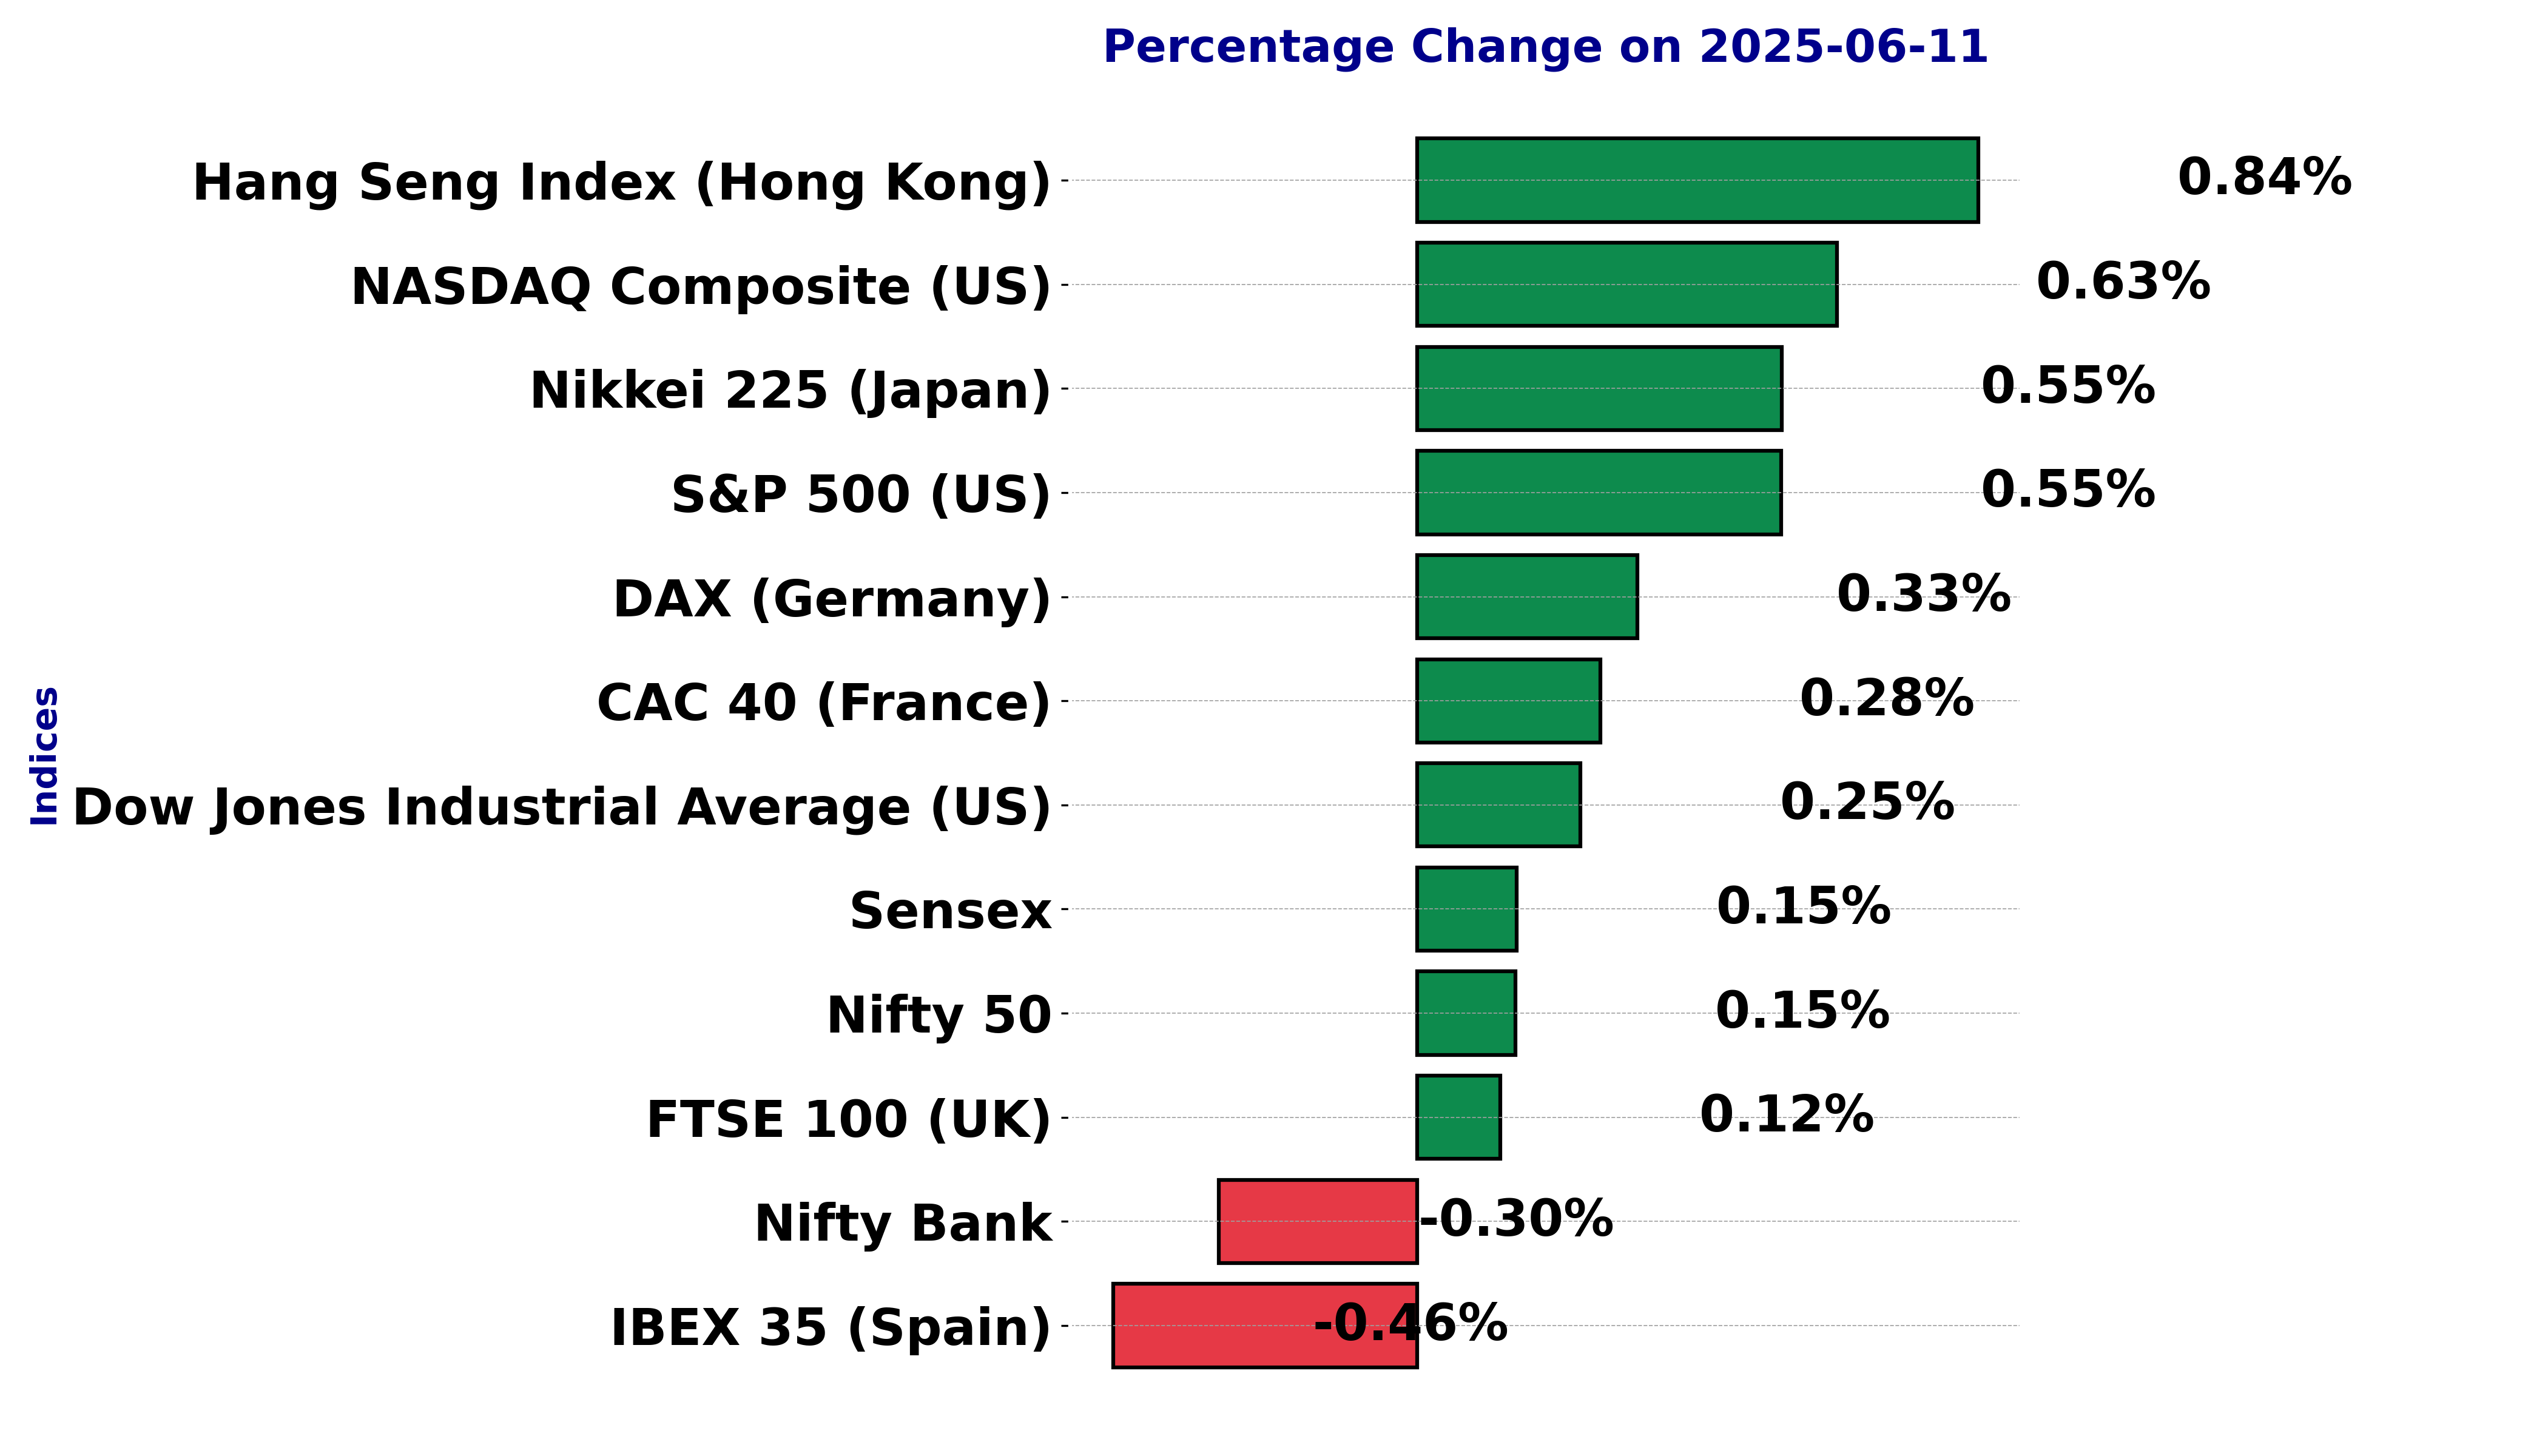
Global stock market indices: How the world markets performed today - 11 June 2025


The international stock market indices showed varied performances on June 11, 2025, reflecting the economic sentiment across different regions.
In this article, we analyze the performance of key global indices including the S&P 500, Dow Jones Industrial Average, NASDAQ Composite, FTSE 100, DAX, CAC 40, IBEX 35, Nikkei 225, Hang Seng, Nifty 50, and BSE Sensex.
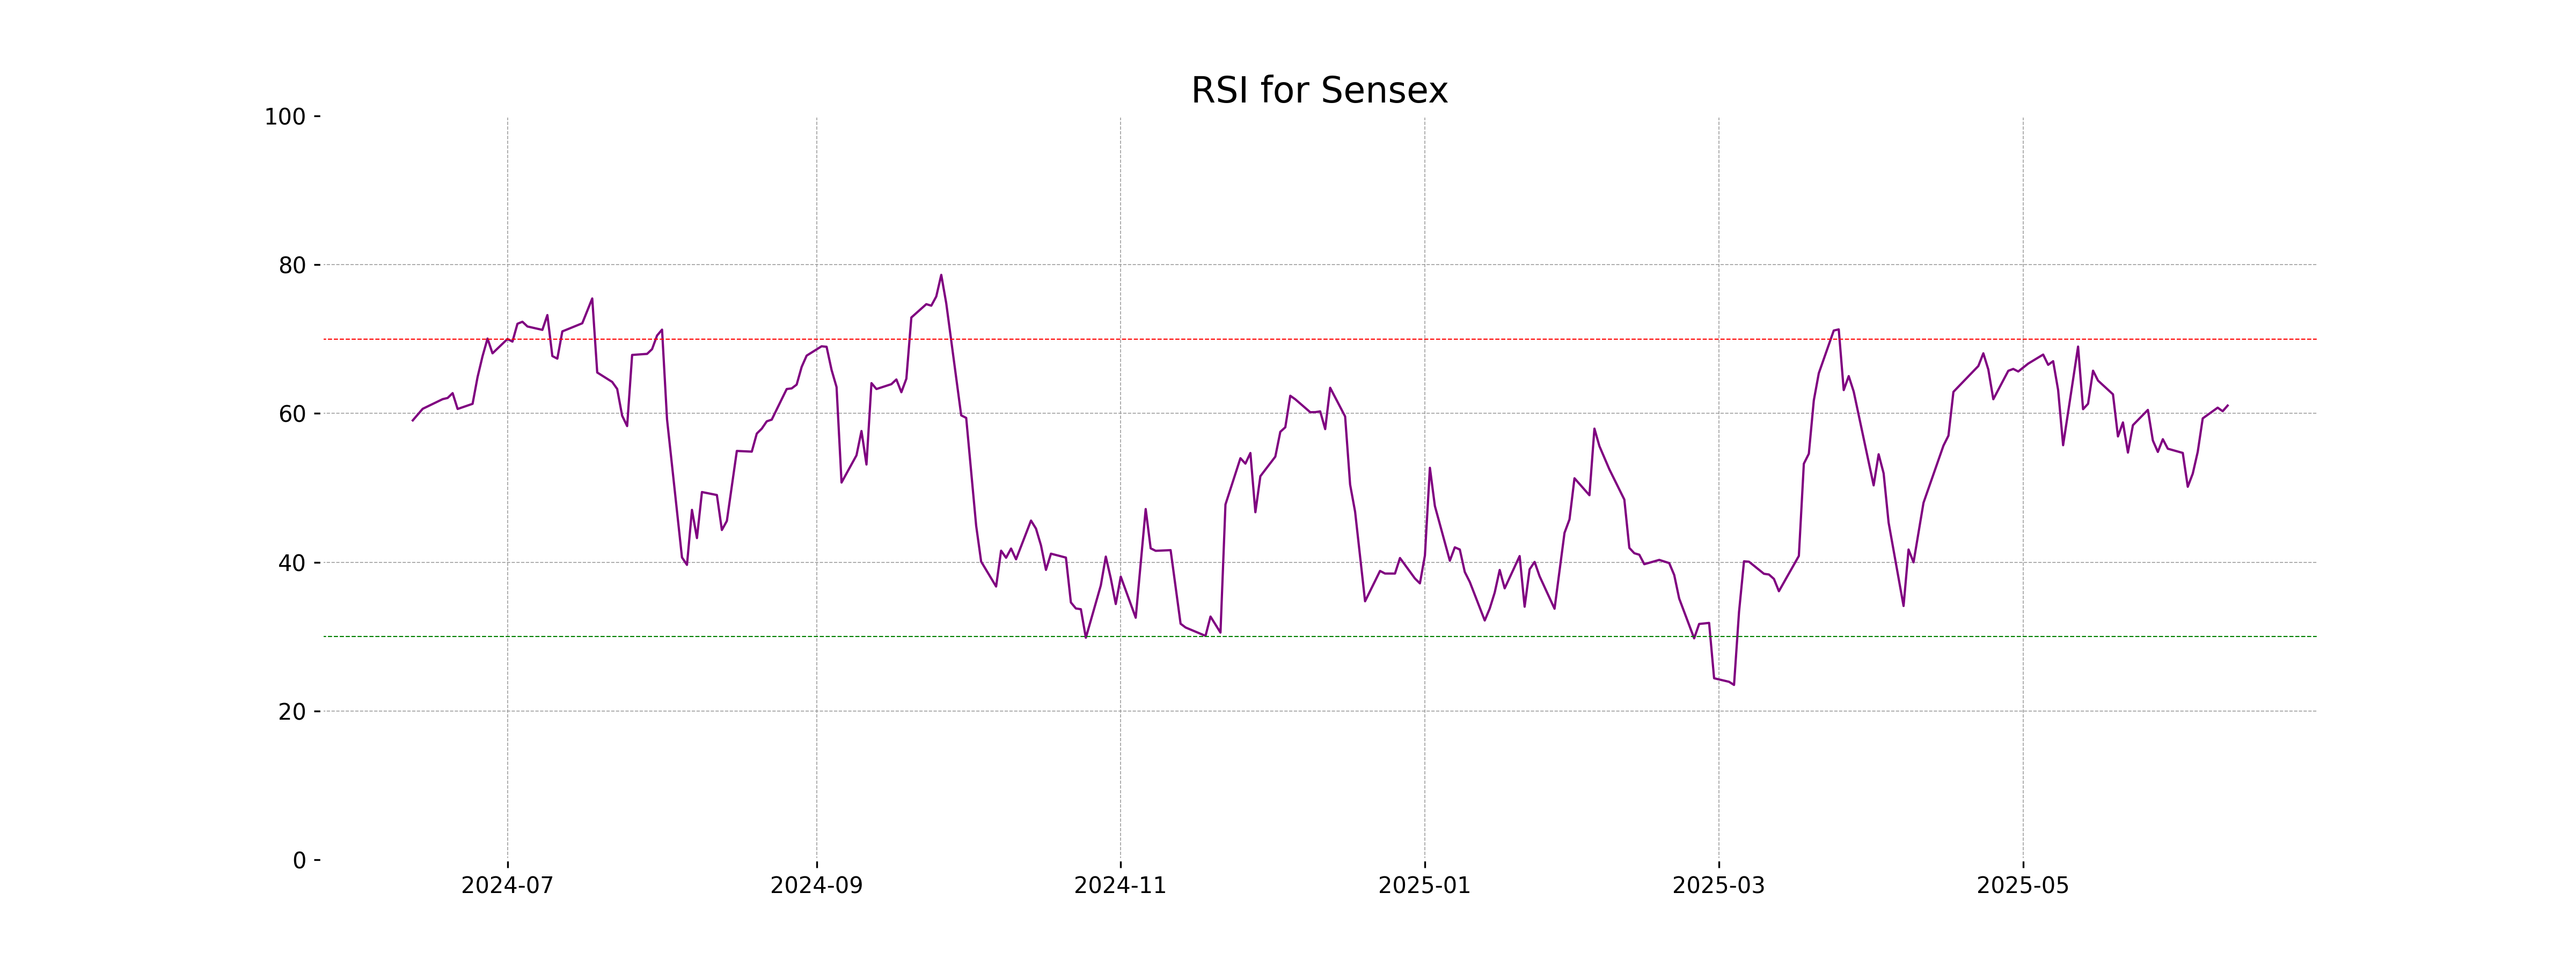
Analysis for Sensex - June 11, 2025
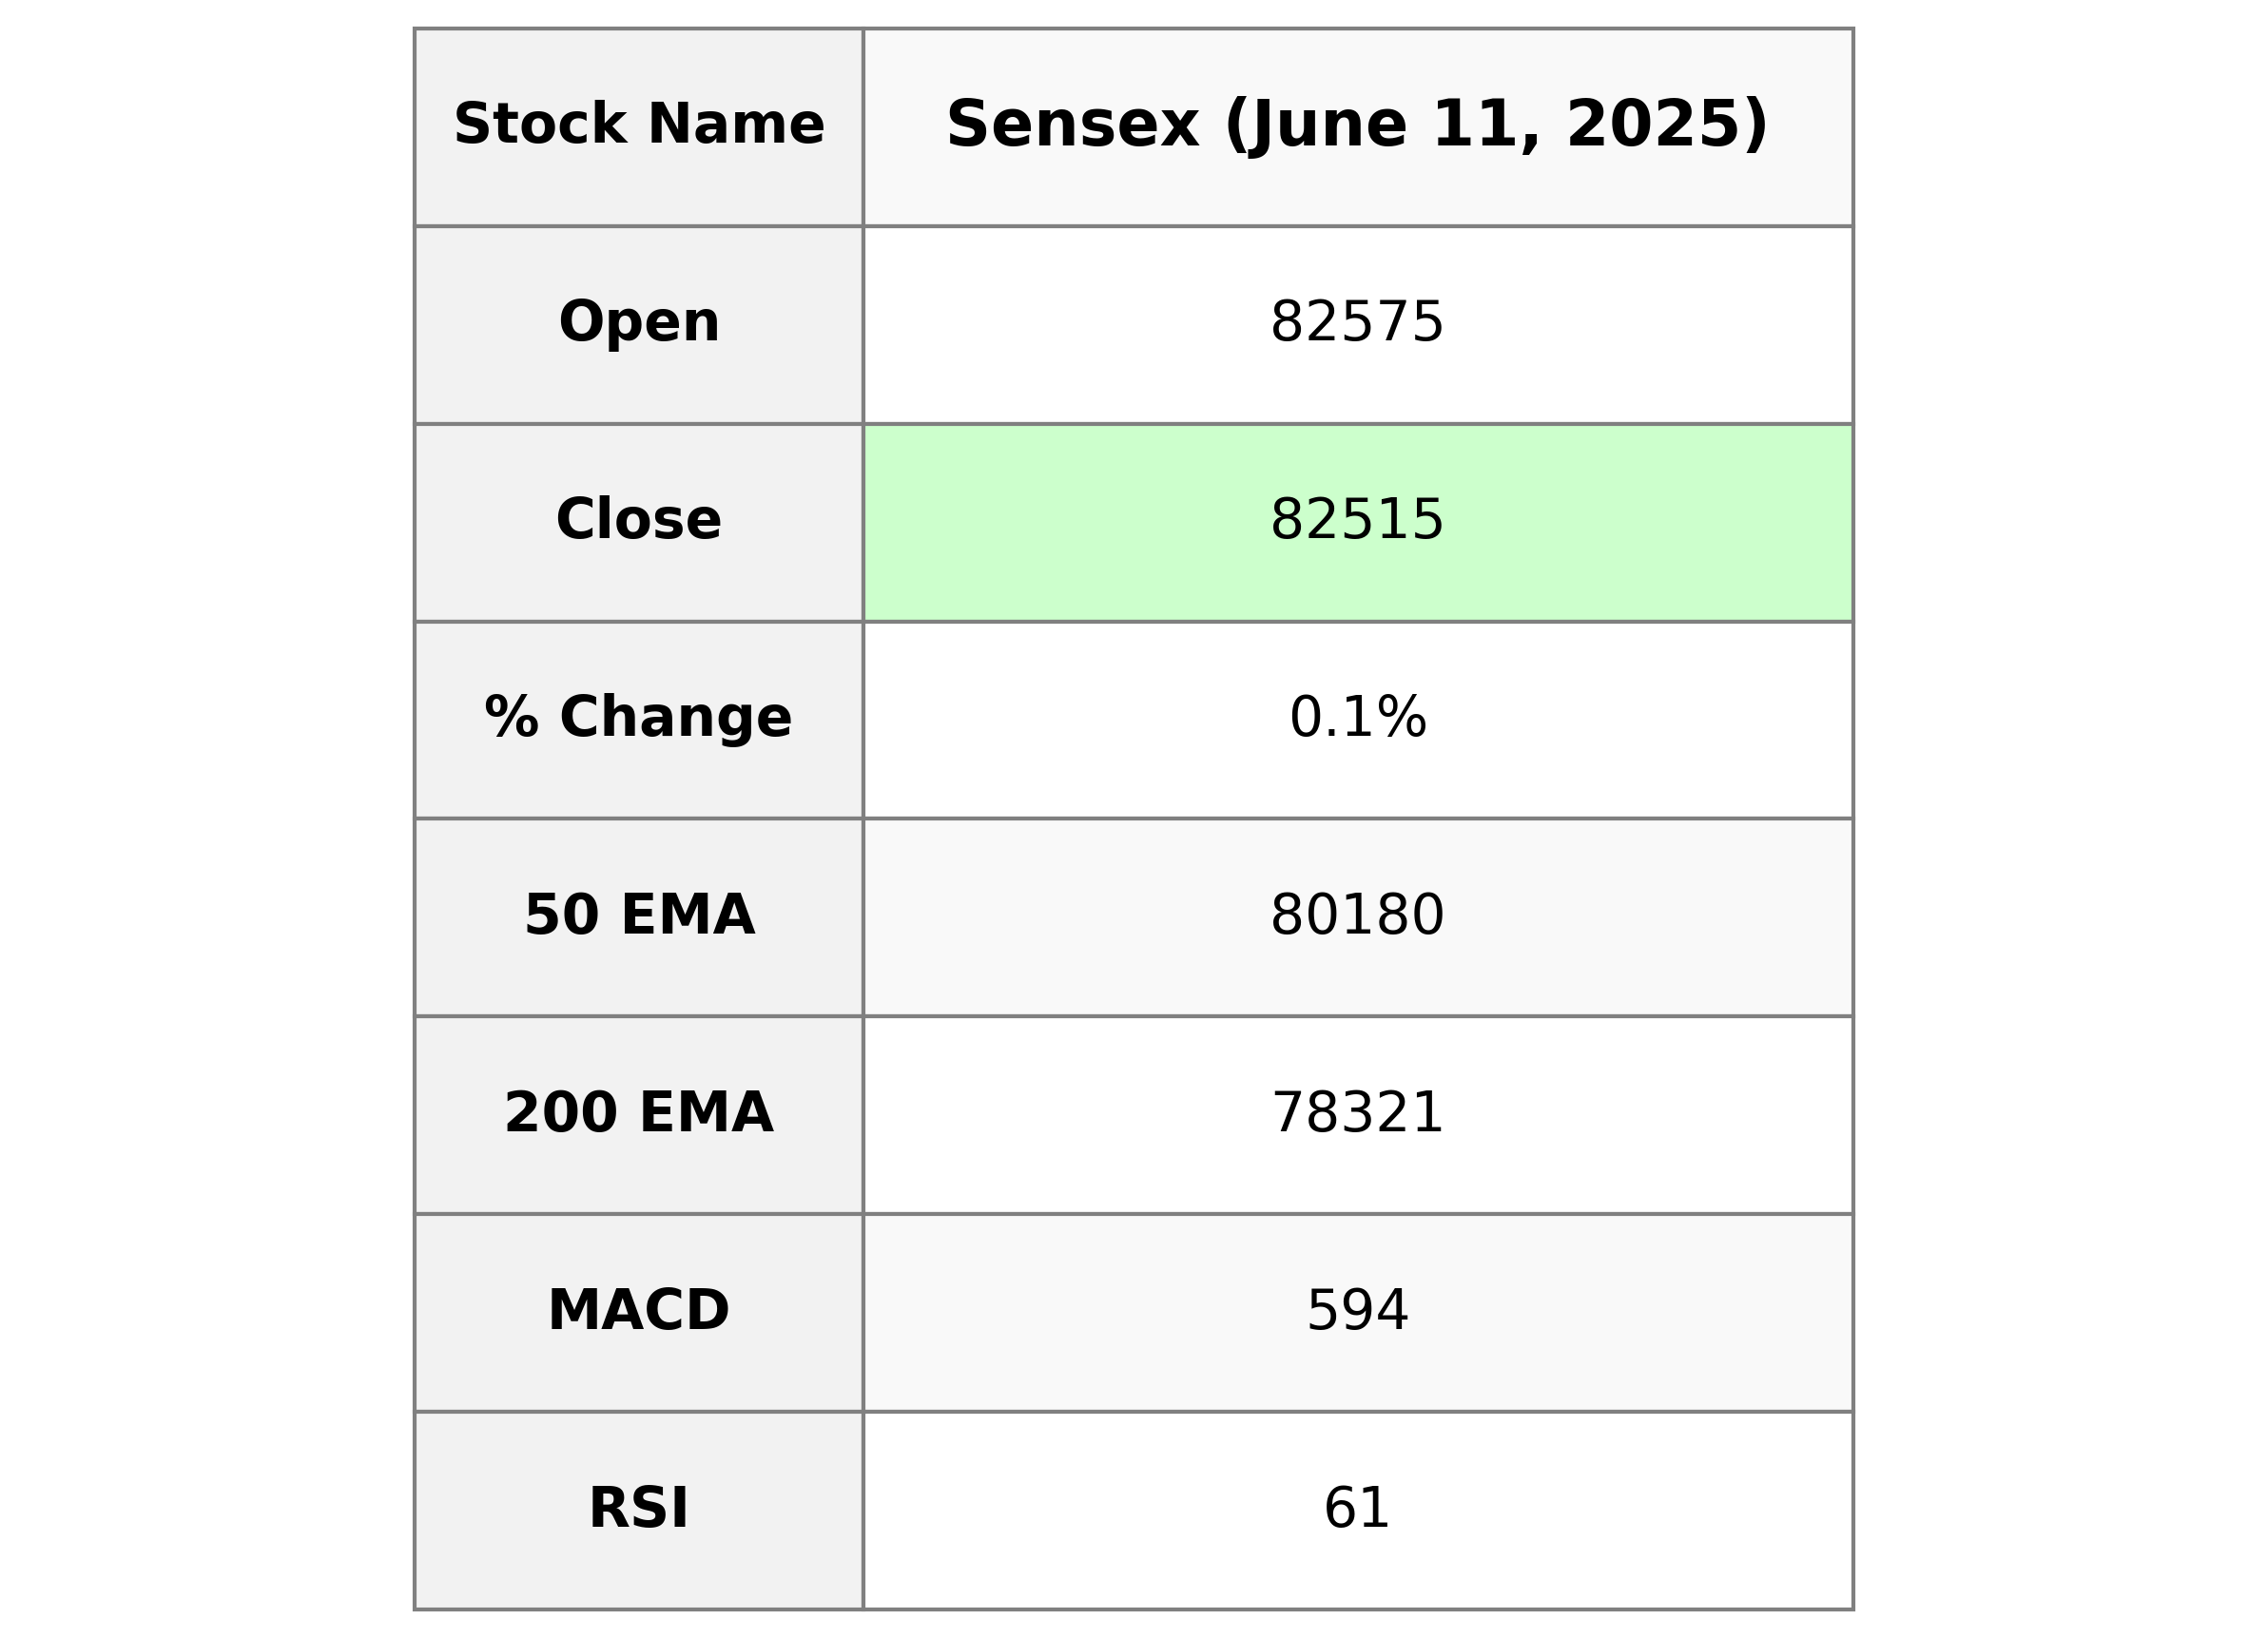
The Sensex opened at 82,574.55, reached a high of 82,783.51, and closed at 82,515.14, indicating a slight gain with a % change of 0.15% from the previous close of 82,391.72. Despite no volume data, the overall market momentum shows a positive trend with RSI at 61.06, suggesting stronger buying signals. The MACD indicates a minor bearish divergence as it is slightly below the MACD Signal.
Relationship with Key Moving Averages
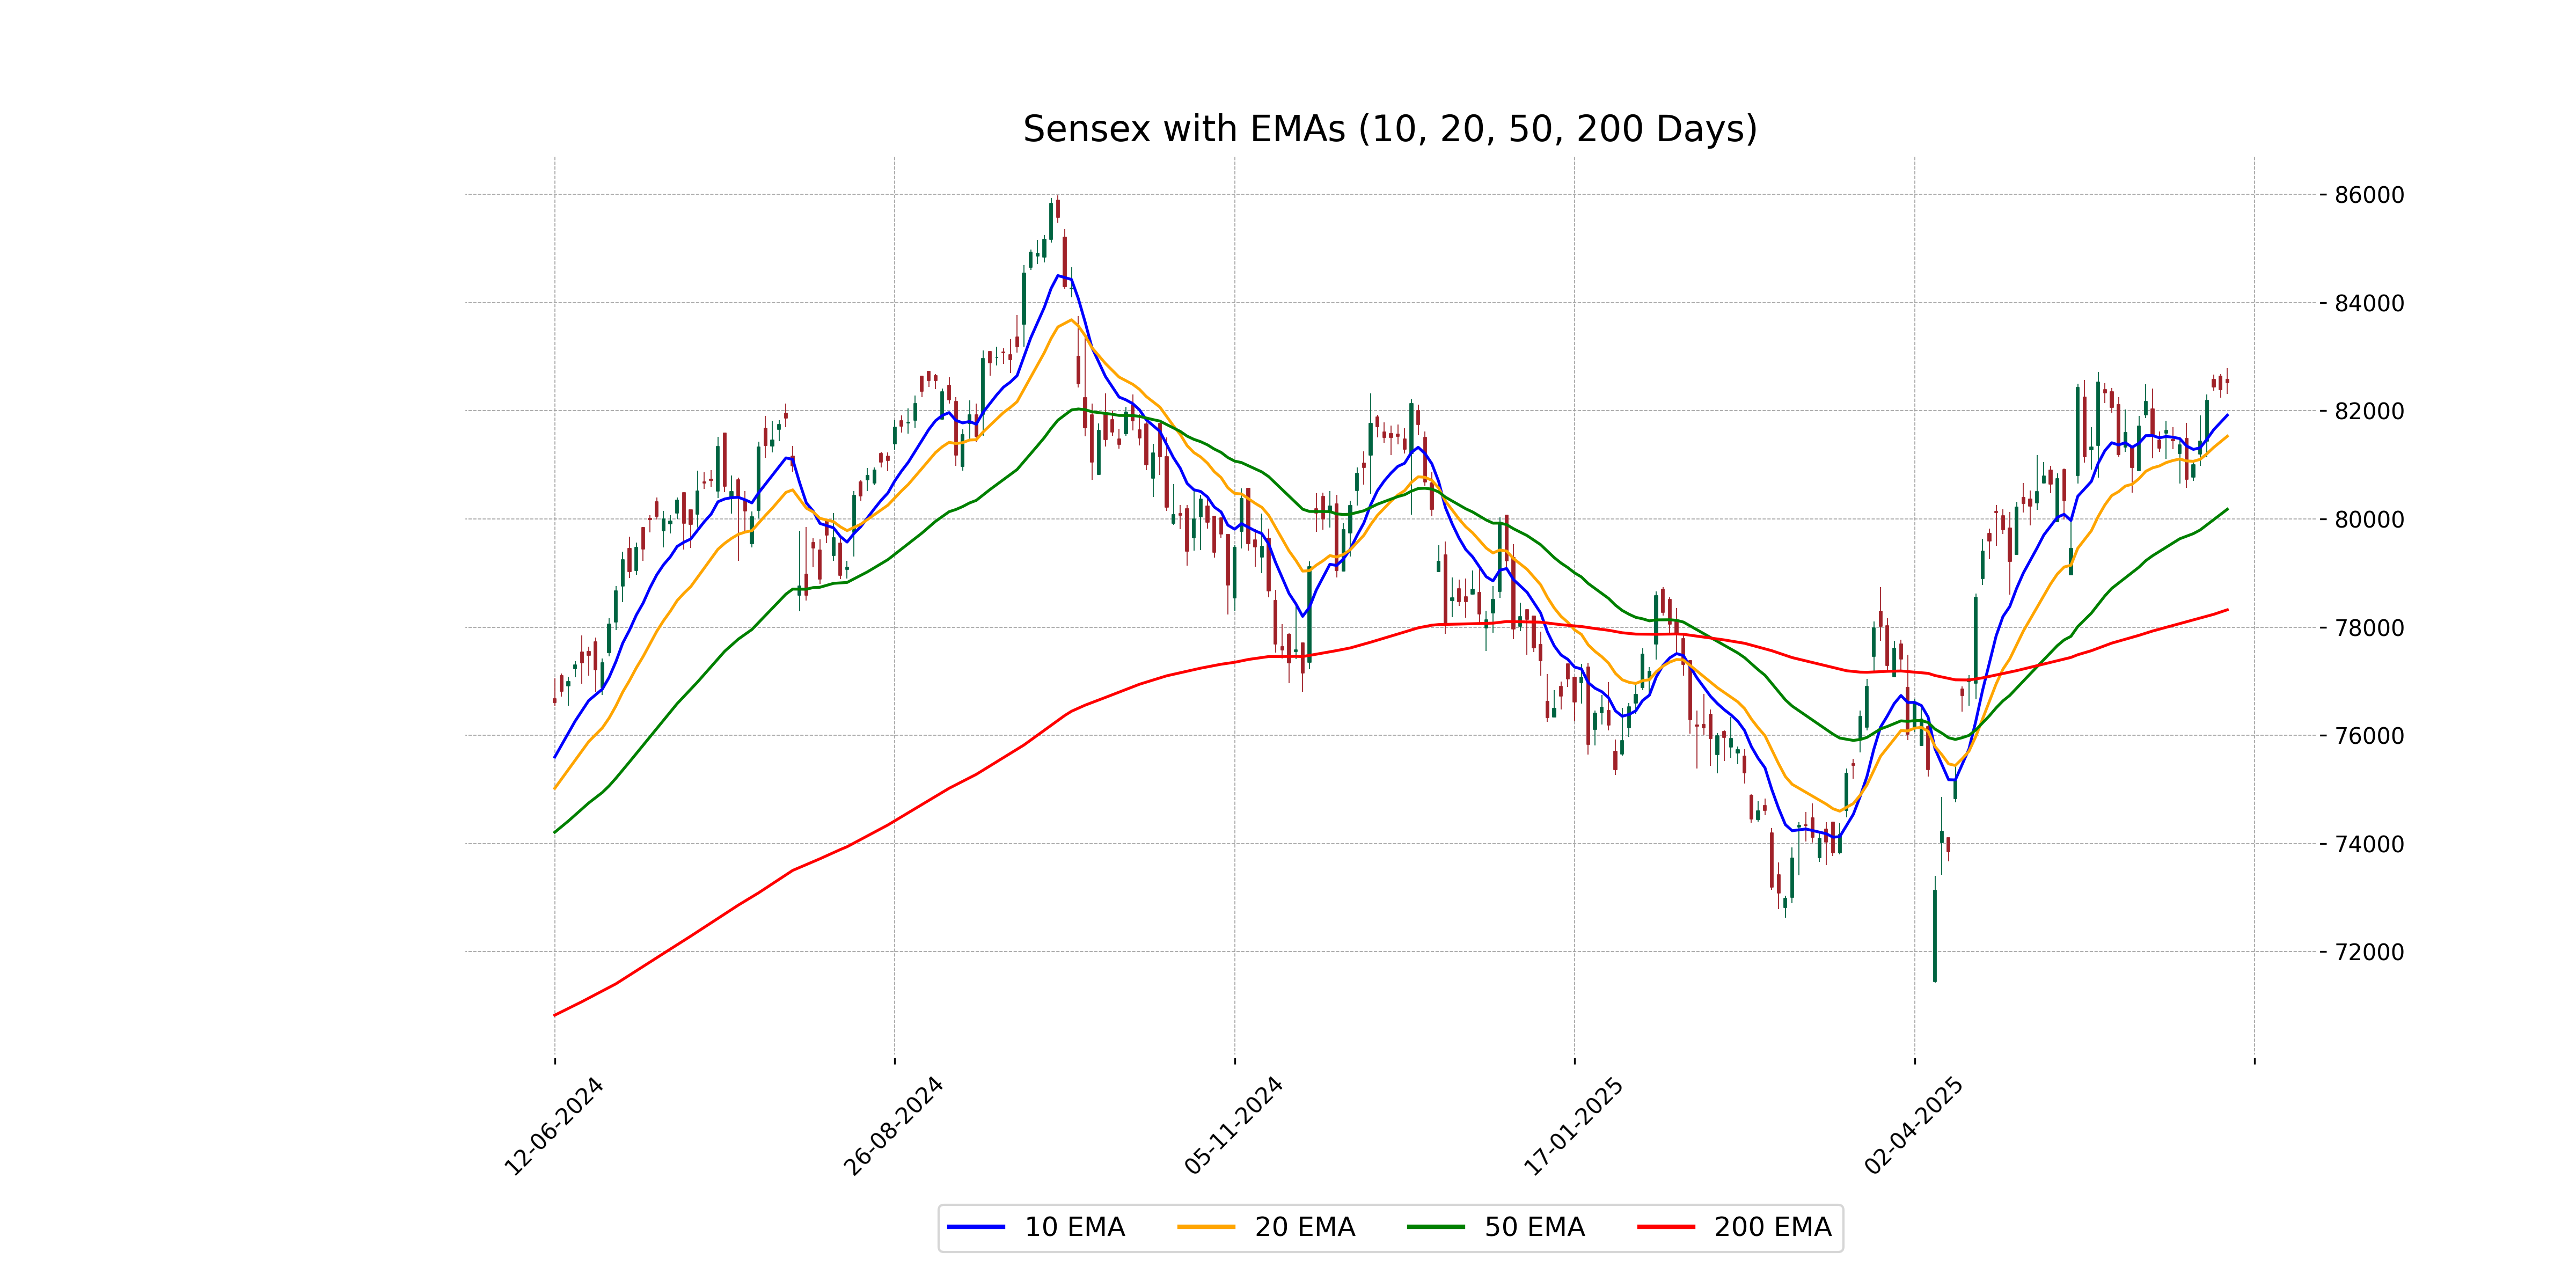
The Sensex, with a close of 82,515.14, is trading above its 50-day EMA of 80,179.54 and 200-day EMA of 78,320.99, indicating a bullish trend. Additionally, it is also above the 10-day EMA of 81,917.70 and the 20-day EMA of 81,528.99, suggesting short-term momentum is positive.
Moving Averages Trend (MACD)
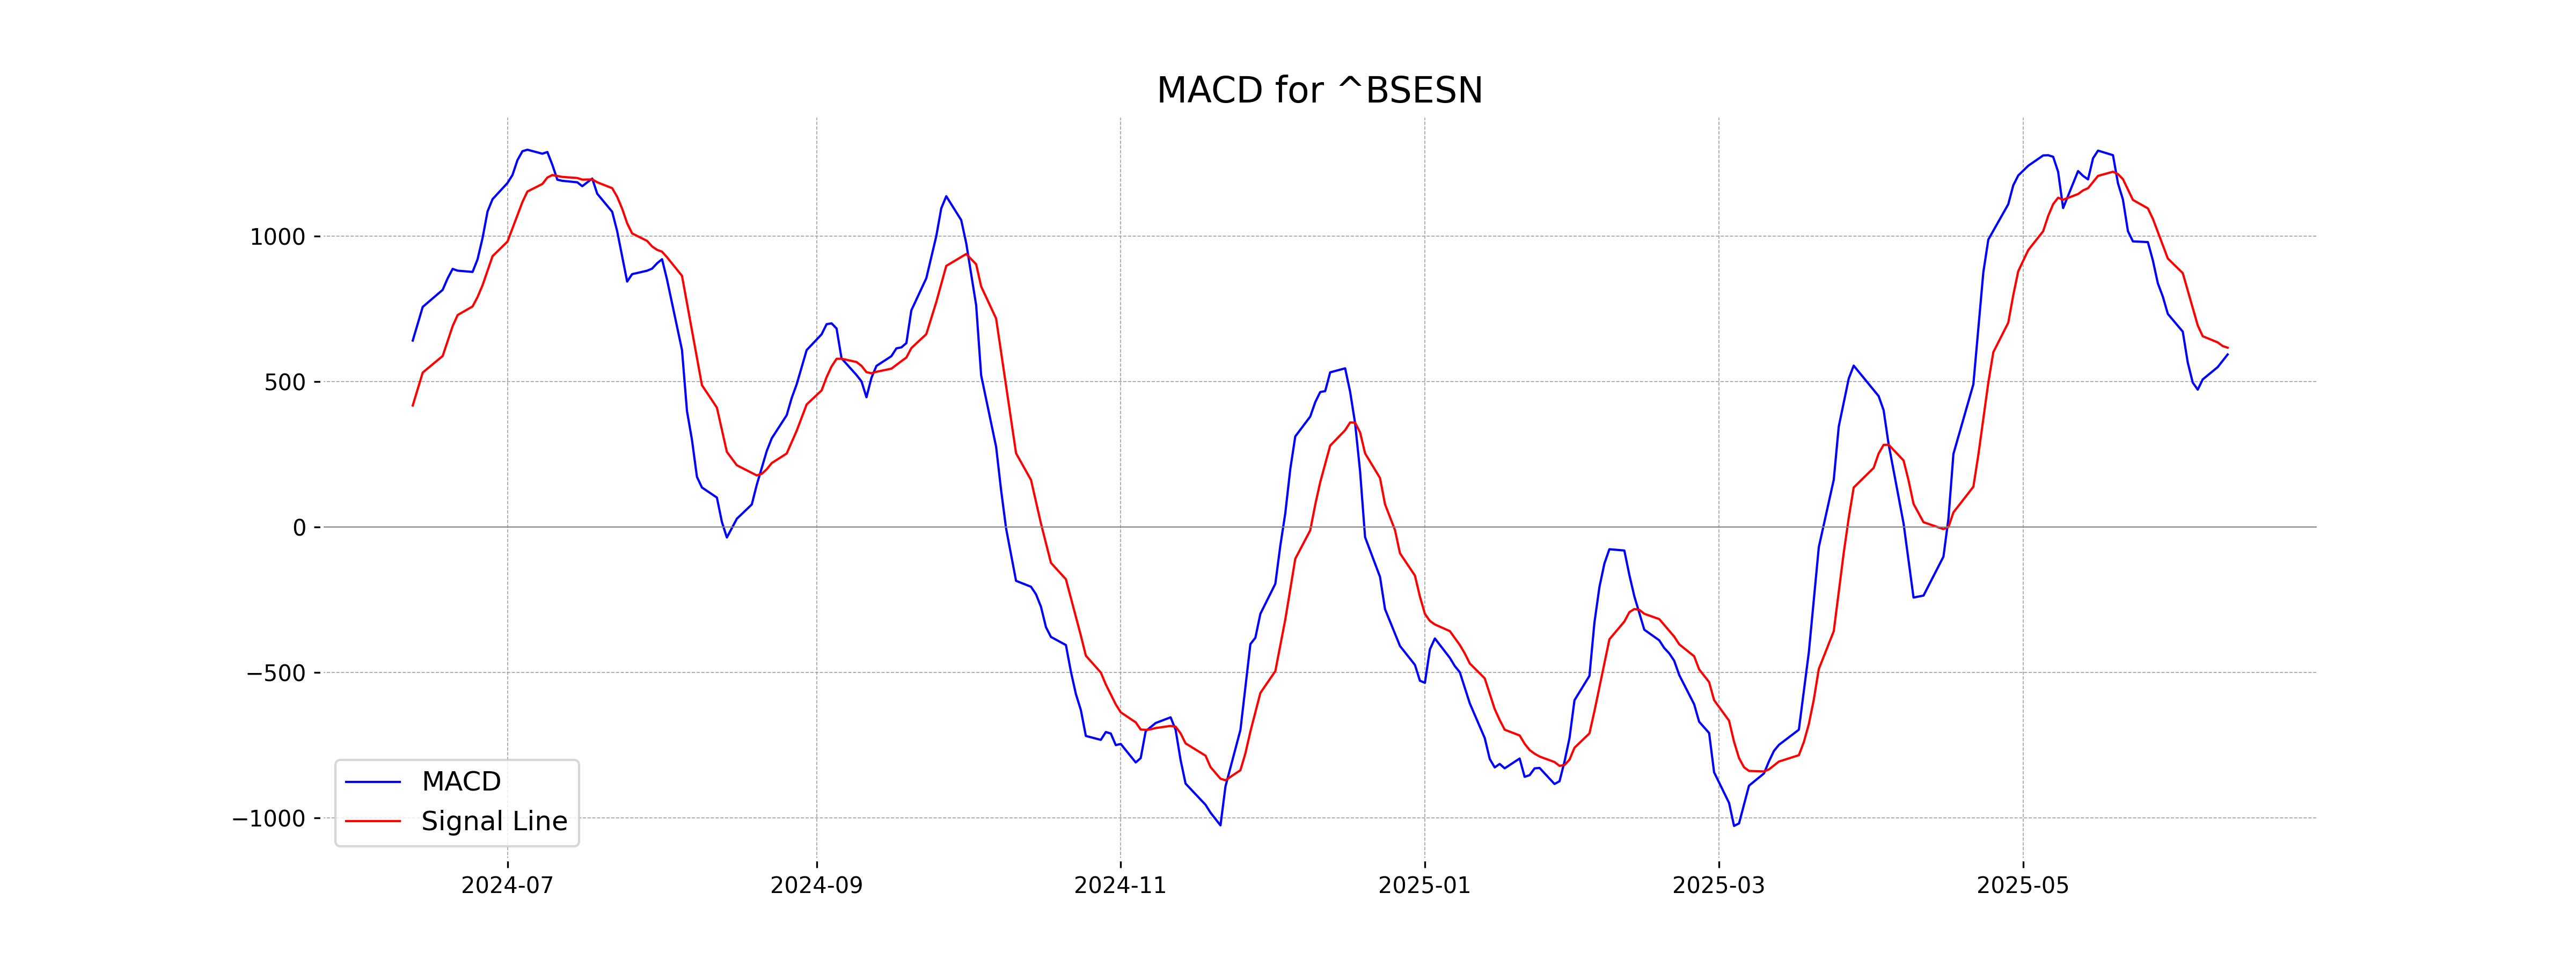
The MACD value for Sensex is 593.841, which is slightly below the MACD Signal line of 617.057, suggesting a potential short-term bearish signal. However, with the RSI at 61.06, the index is still in the bullish zone, indicating mixed momentum.
RSI Analysis
Based on the given stock data, the Relative Strength Index (RSI) for Sensex is 61.06, suggesting that the market is in a moderately bullish phase. An RSI above 50 typically indicates positive momentum, though it is not yet in overbought territory, which would be above 70.
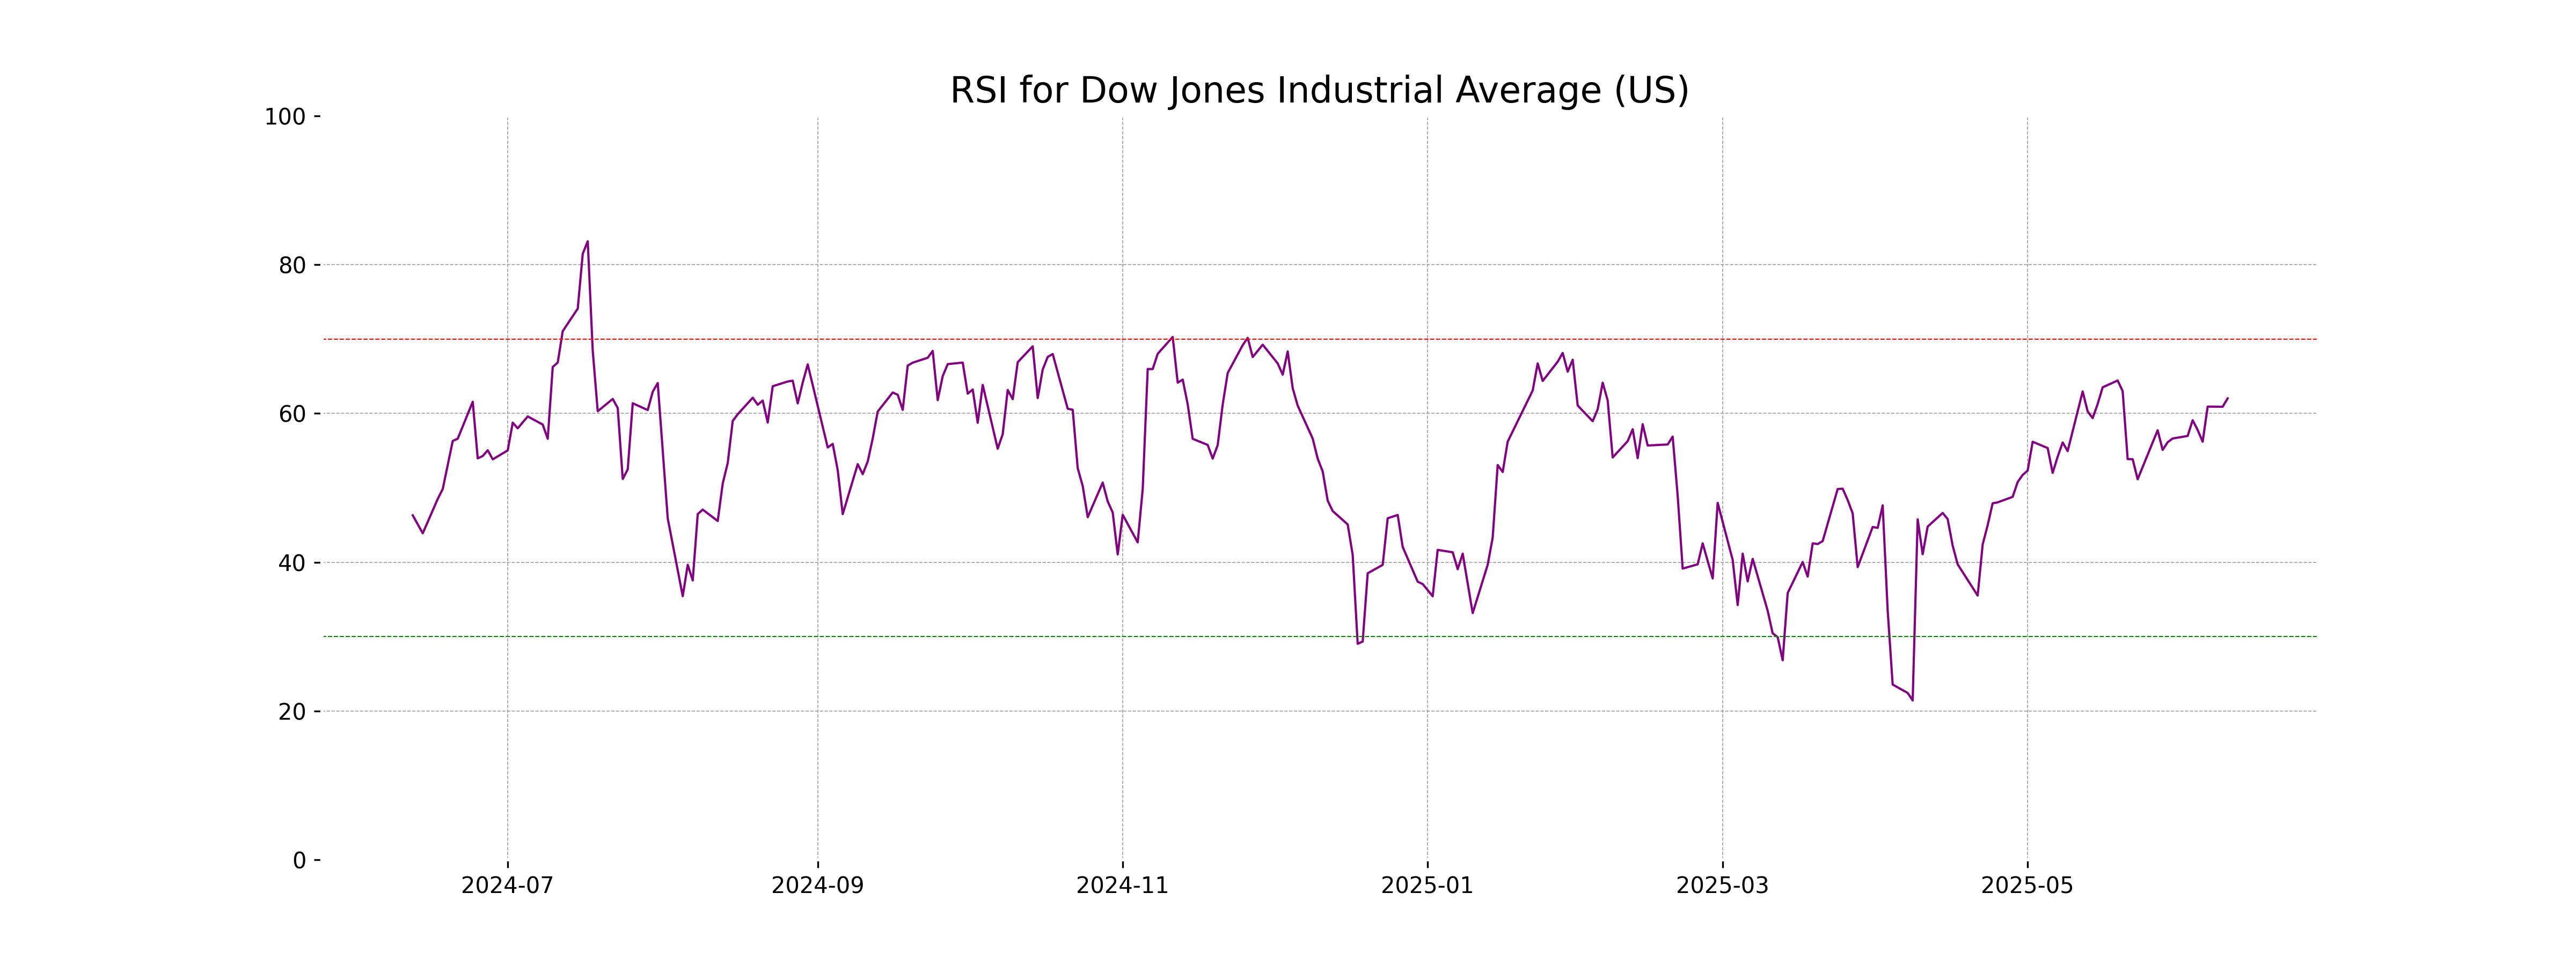
Analysis for Dow Jones Industrial Average (US) - June 11, 2025
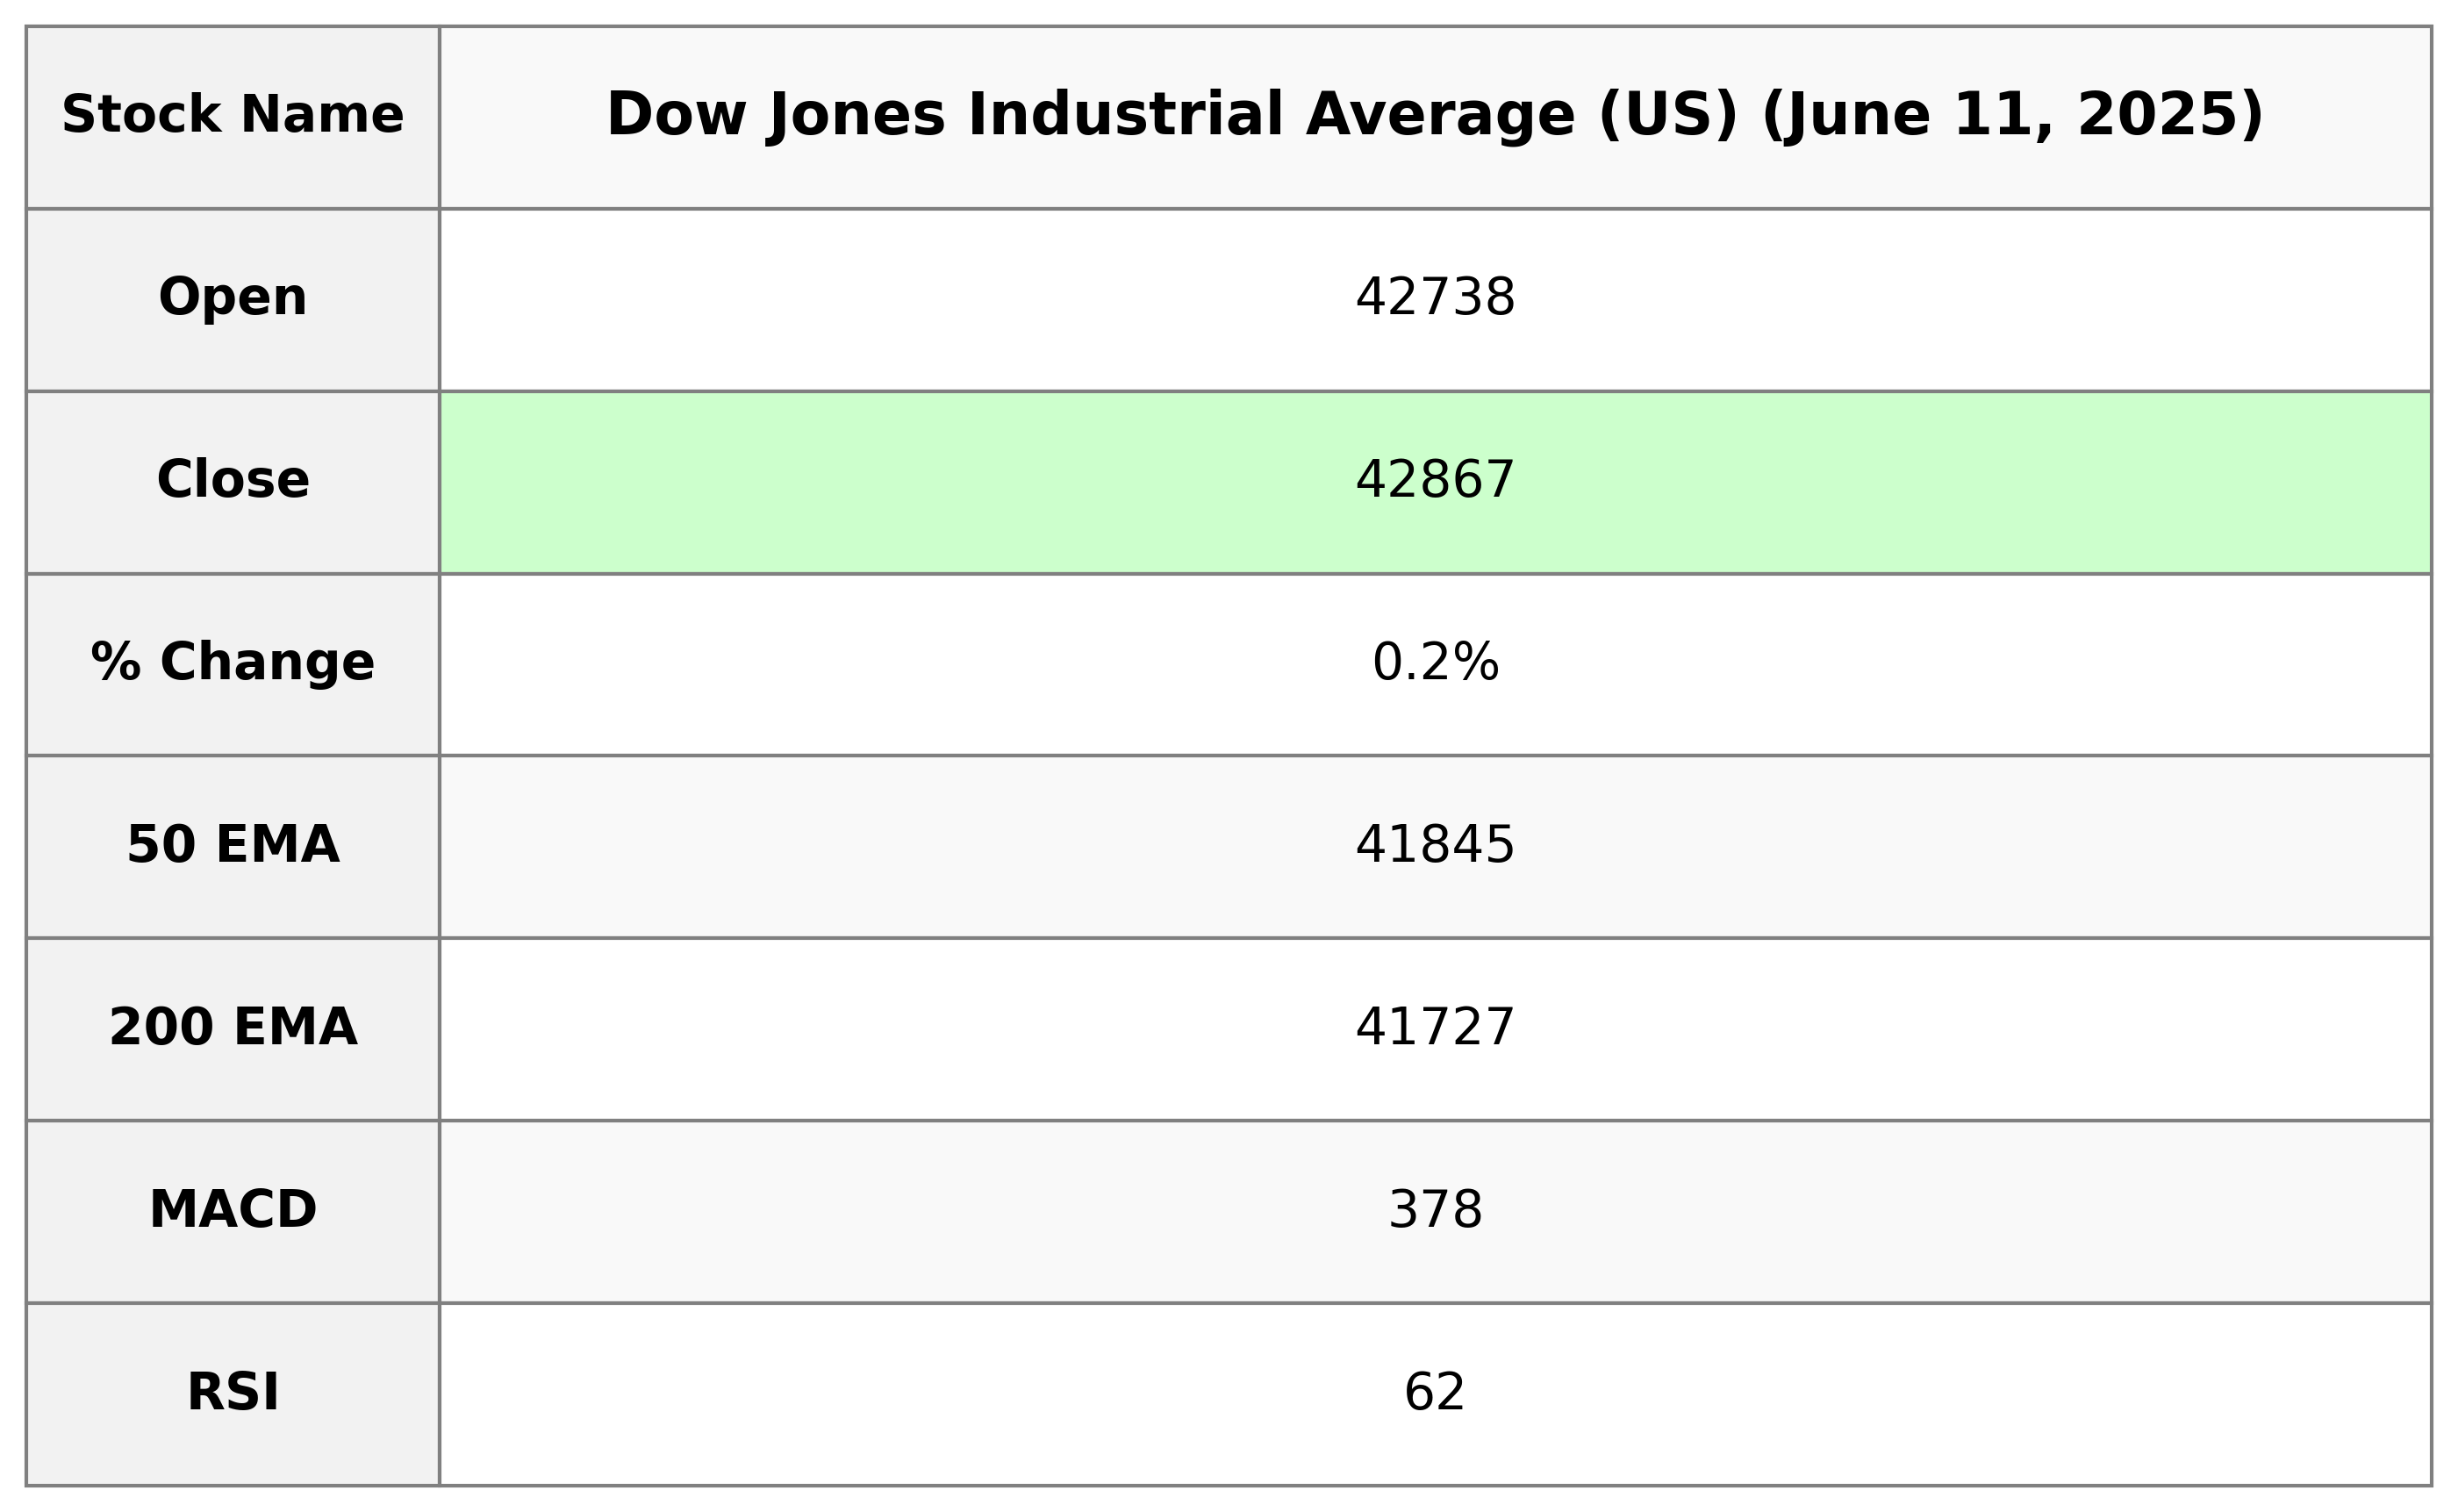
The Dow Jones Industrial Average (US) opened at 42738.27, reached a high of 42925.94, and closed at 42866.87 with a volume of 446.85 million. The index showed a positive change of 0.246%, reflecting a points change of 105.11. Key indicators include an RSI of 62.03, a MACD of 377.94, and it is presently trading above its 50-day and 200-day EMAs.
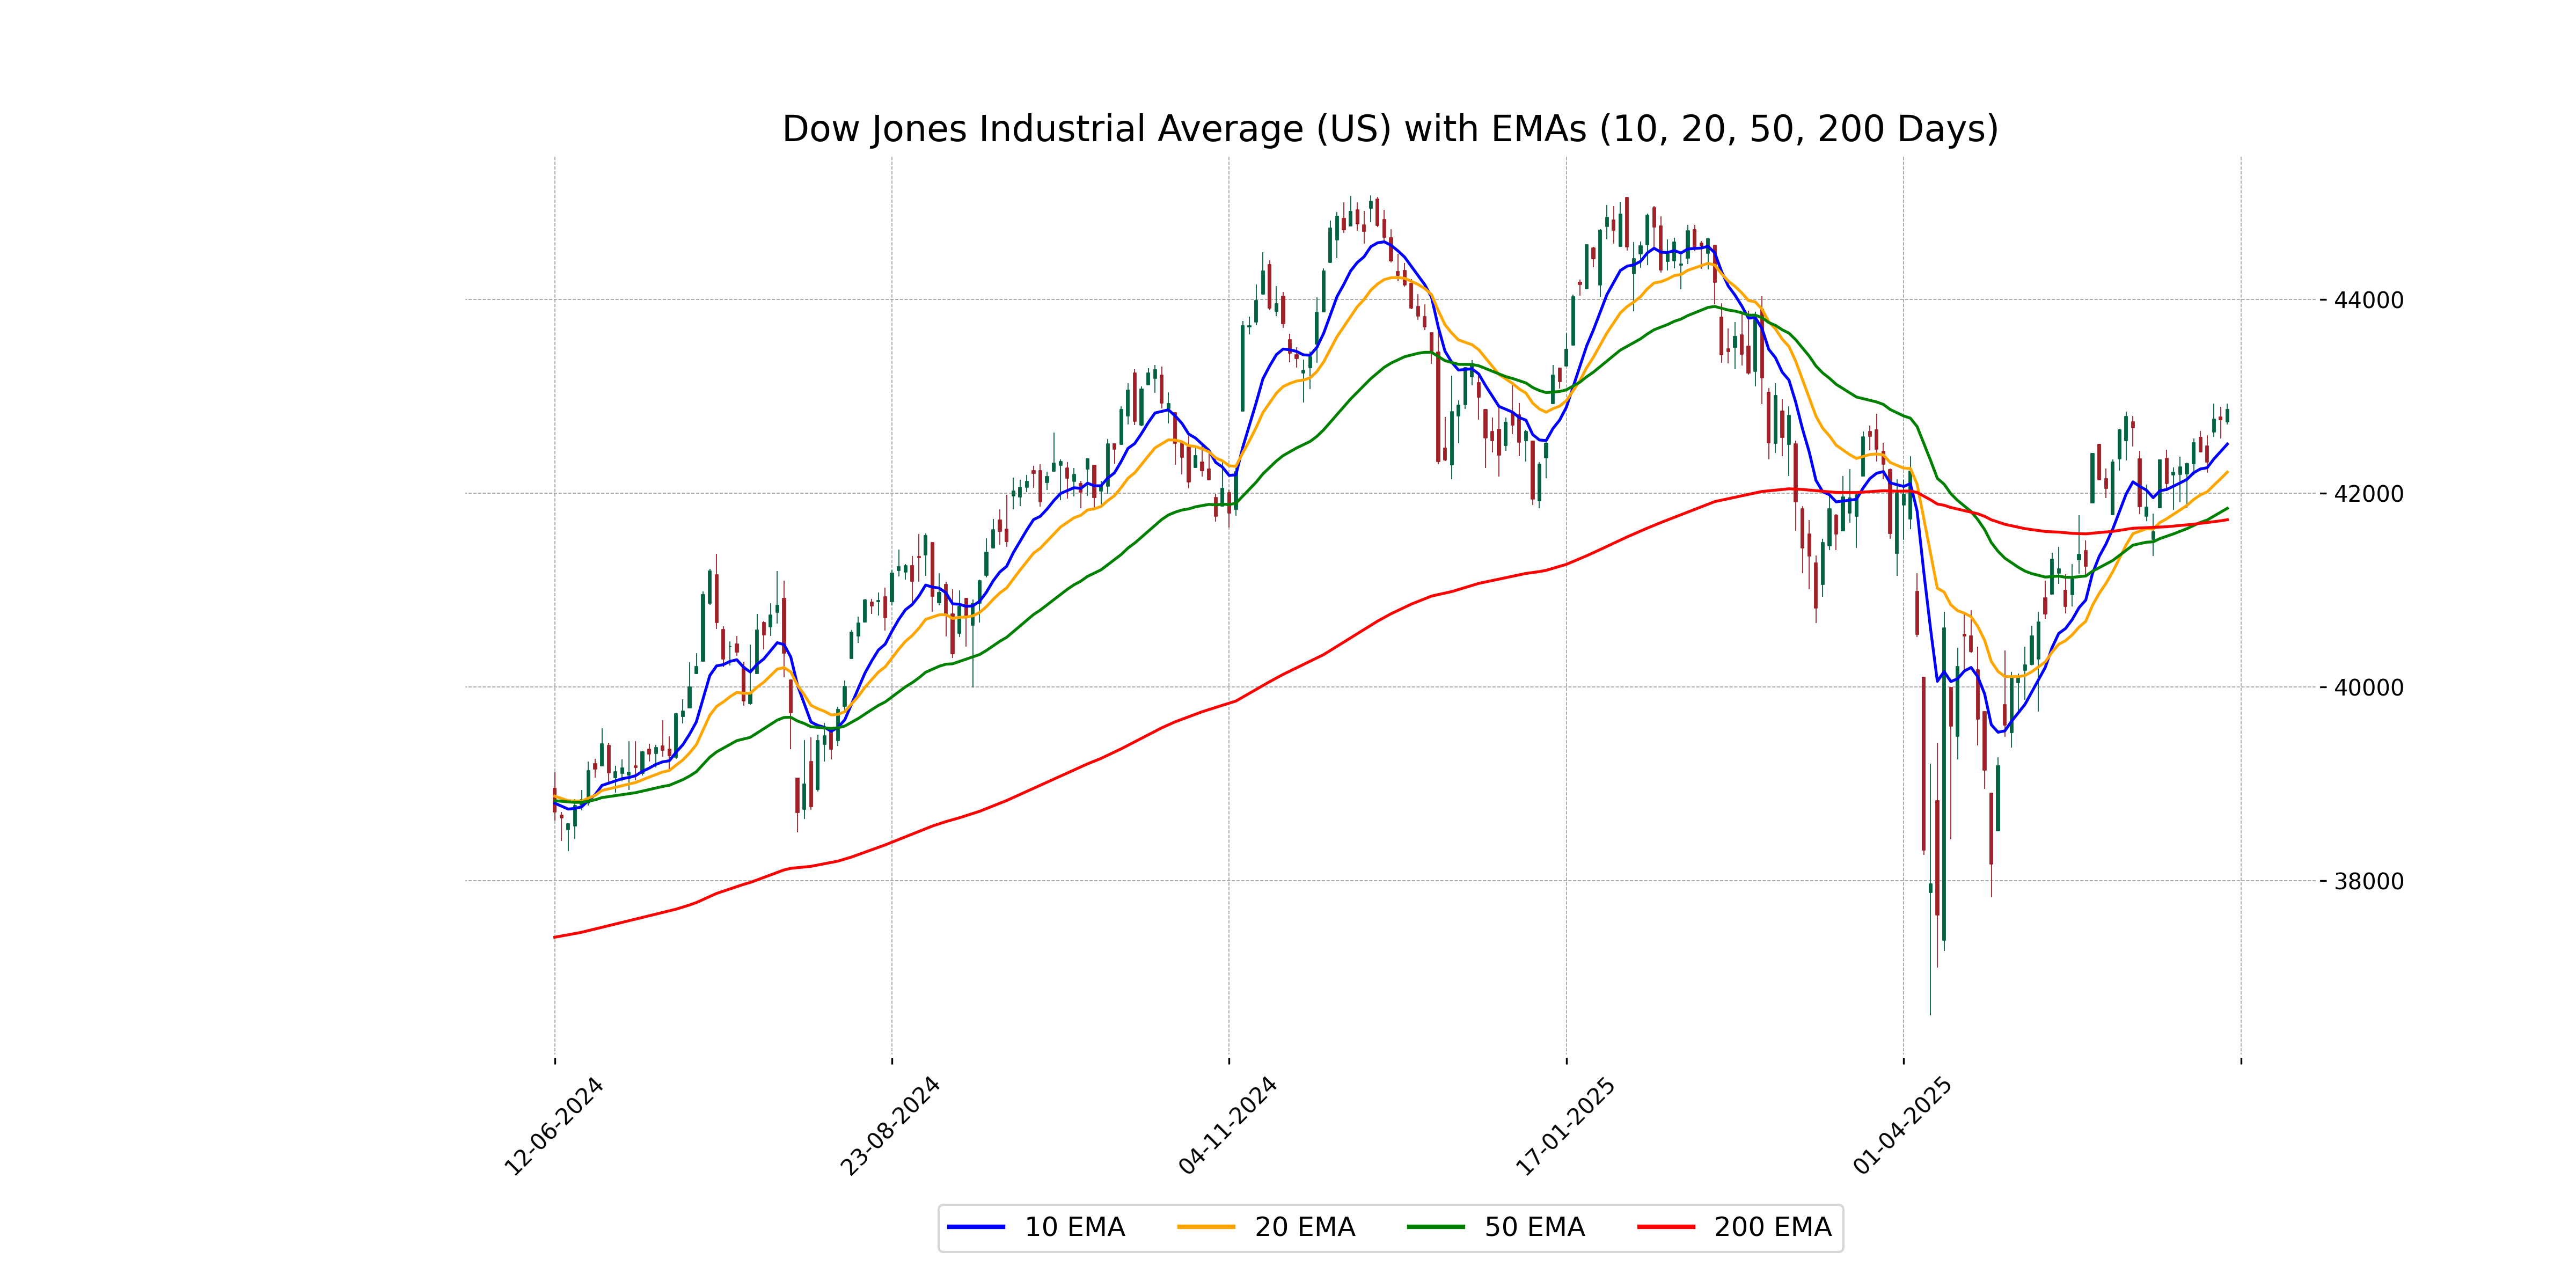
Relationship with Key Moving Averages
The Dow Jones Industrial Average closed at 42866.87, which is above its 50 EMA and 200 EMA, indicating a potential upward trend. It also lies above the 10 EMA and 20 EMA, suggesting short-term strength. The positive MACD above its signal line confirms bullish momentum.
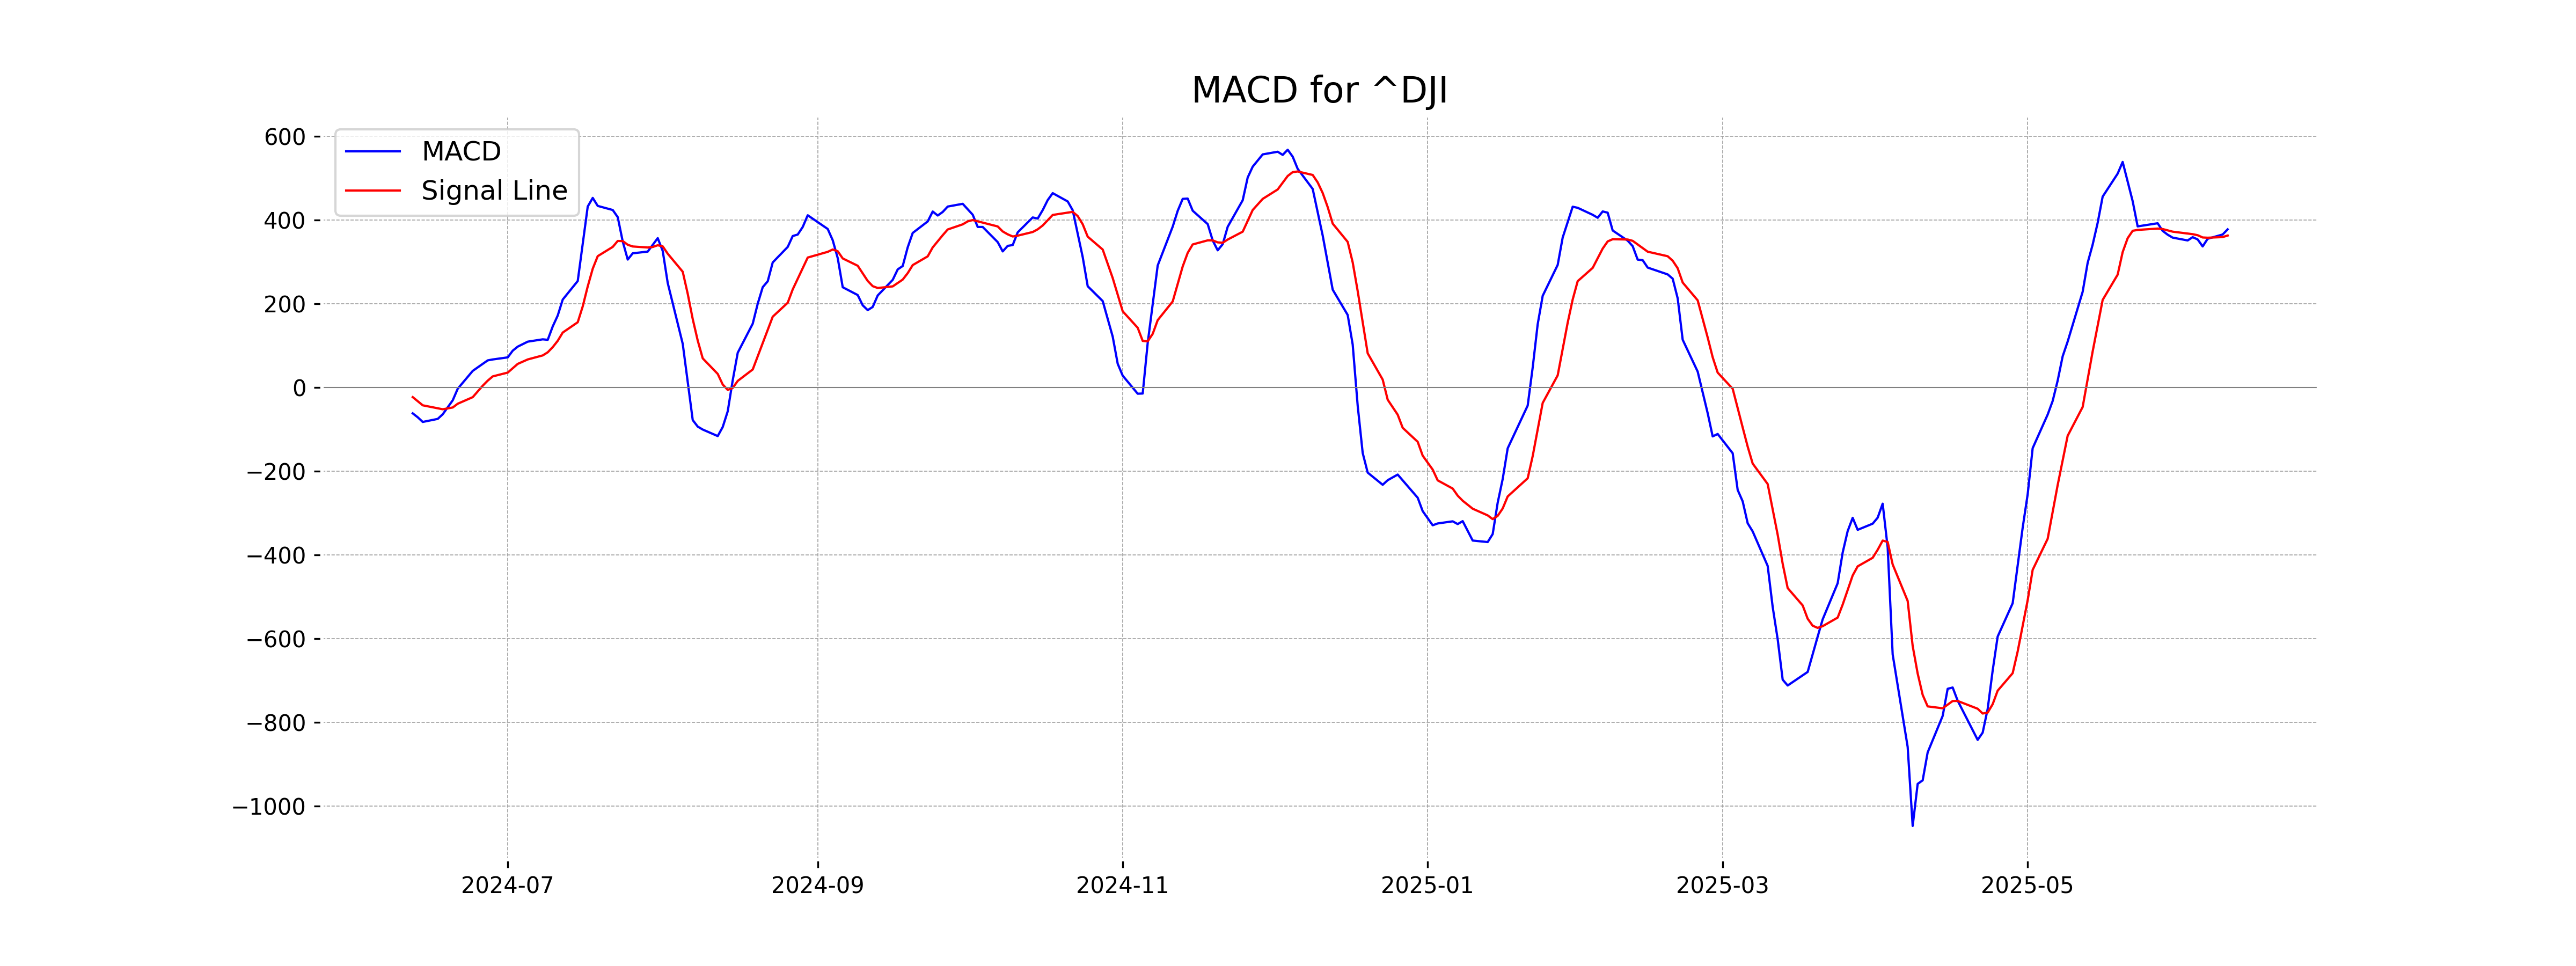
Moving Averages Trend (MACD)
Dow Jones Industrial Average (US) MACD Analysis The MACD for the Dow Jones Industrial Average stands at 377.94, while the MACD Signal is at 363.21. With MACD above the signal line, this indicates a bullish momentum for the index.
RSI Analysis
RSI Analysis: The Dow Jones Industrial Average shows a Relative Strength Index (RSI) of 62.03, which suggests that the index is approaching overbought territory but is not yet at an extreme level. It indicates a moderately strong momentum, as RSI values above 50 typically reflect bullish conditions.
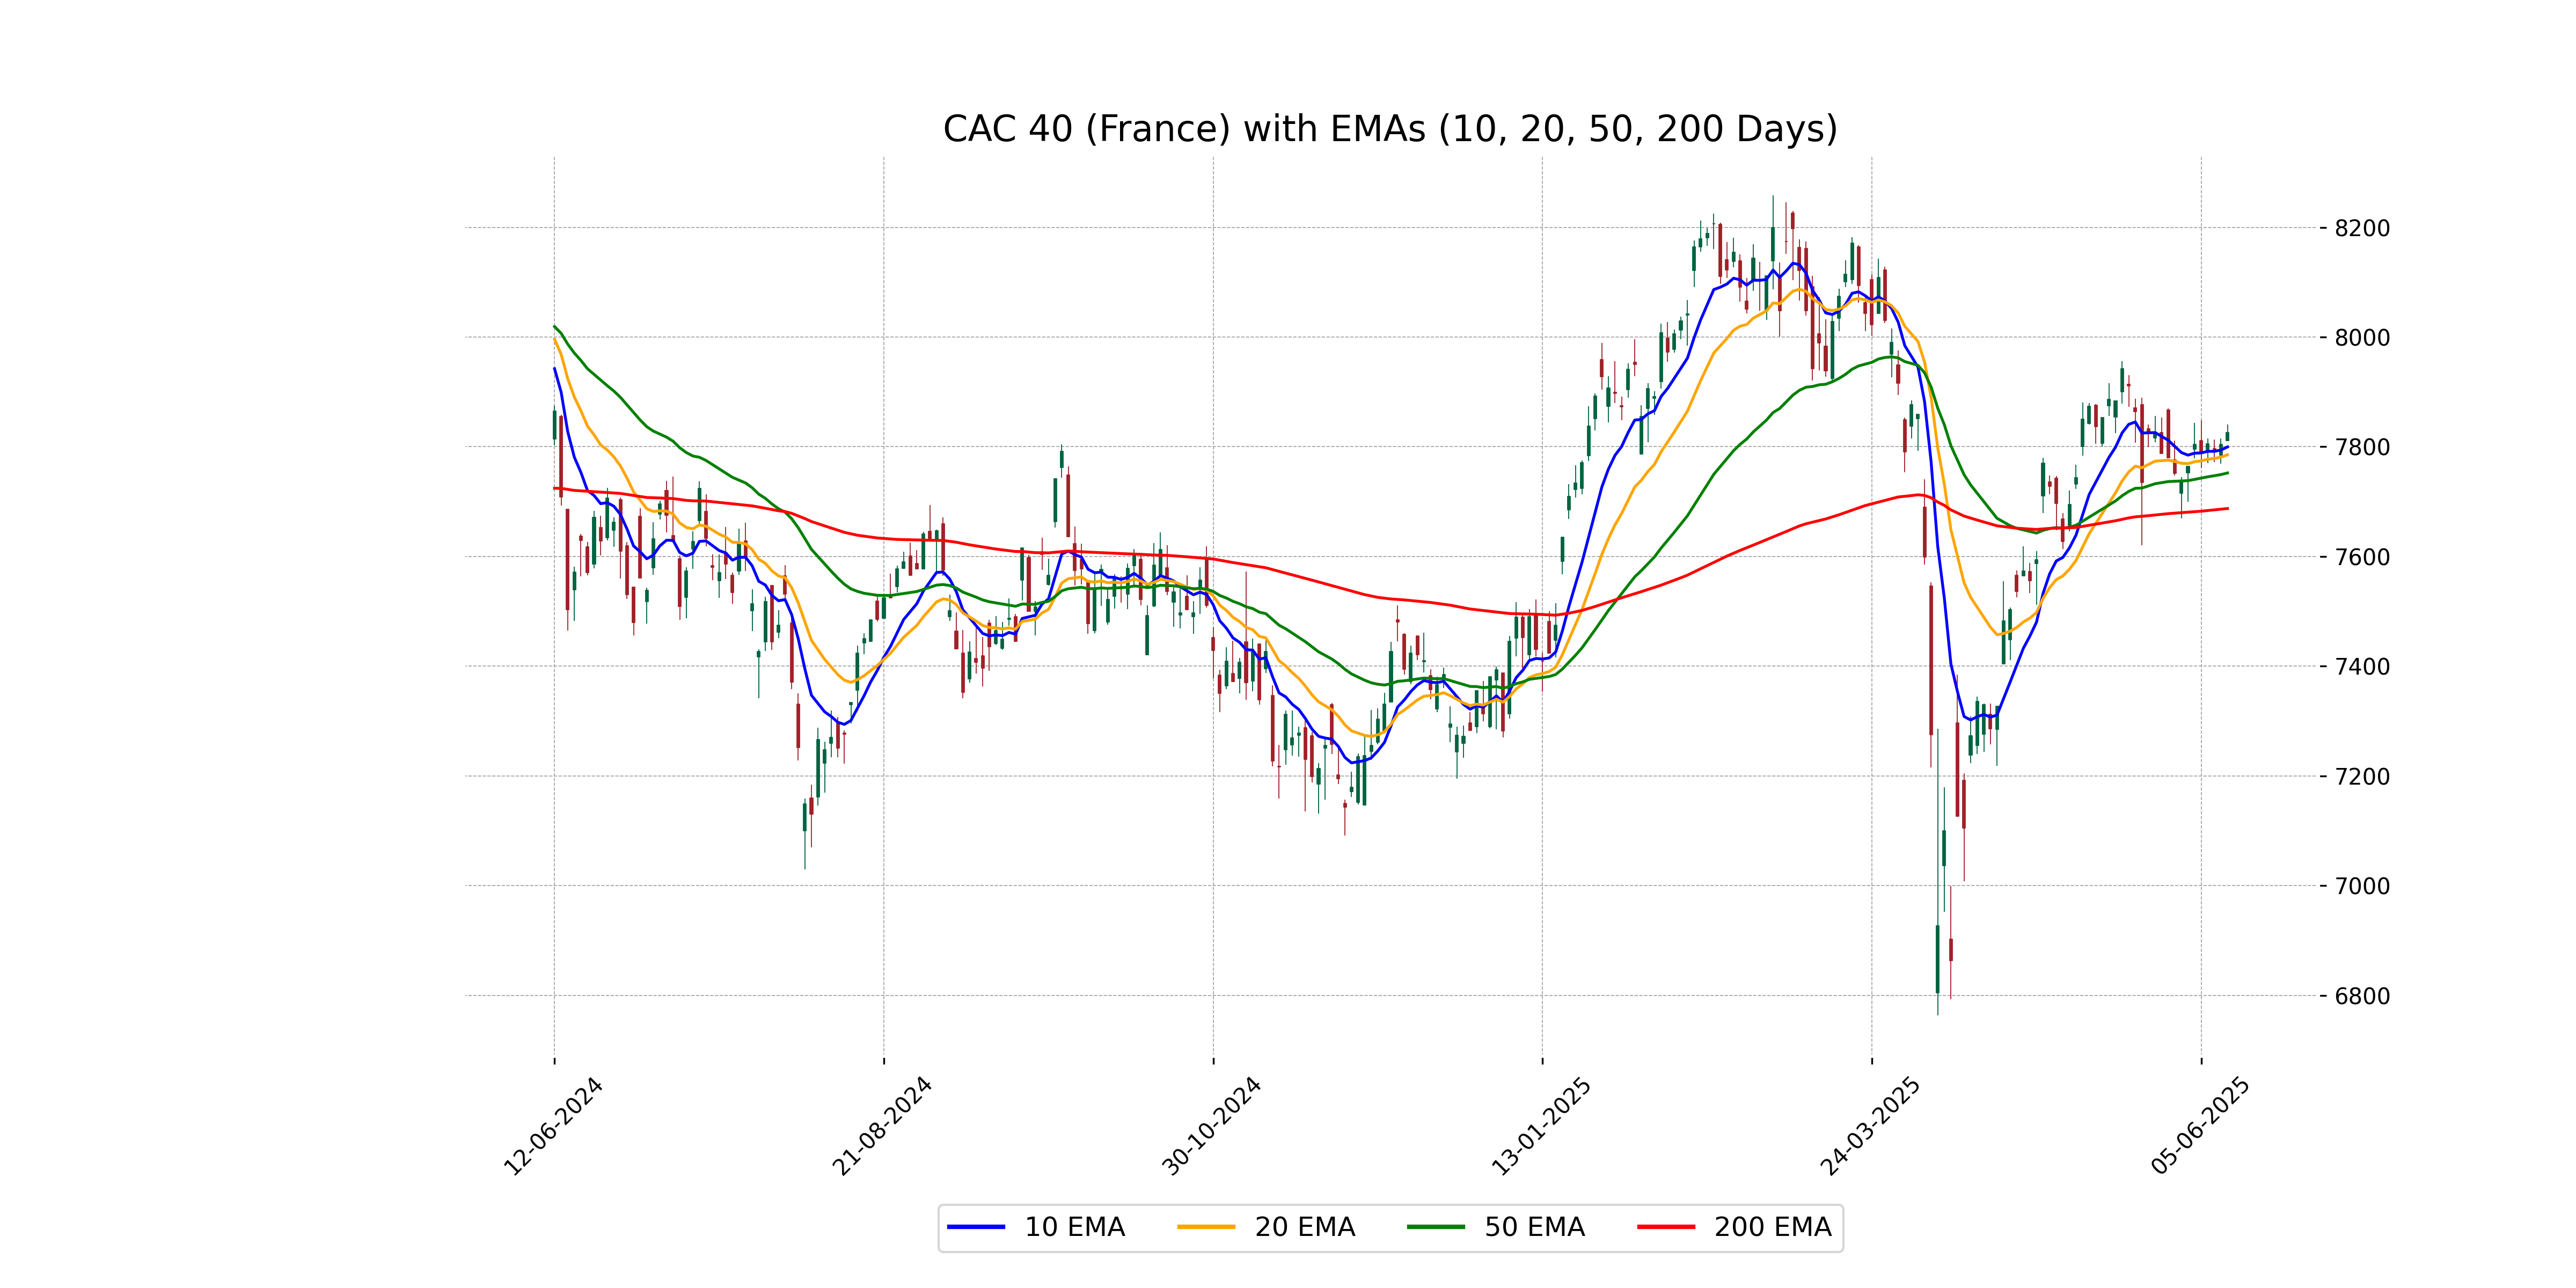
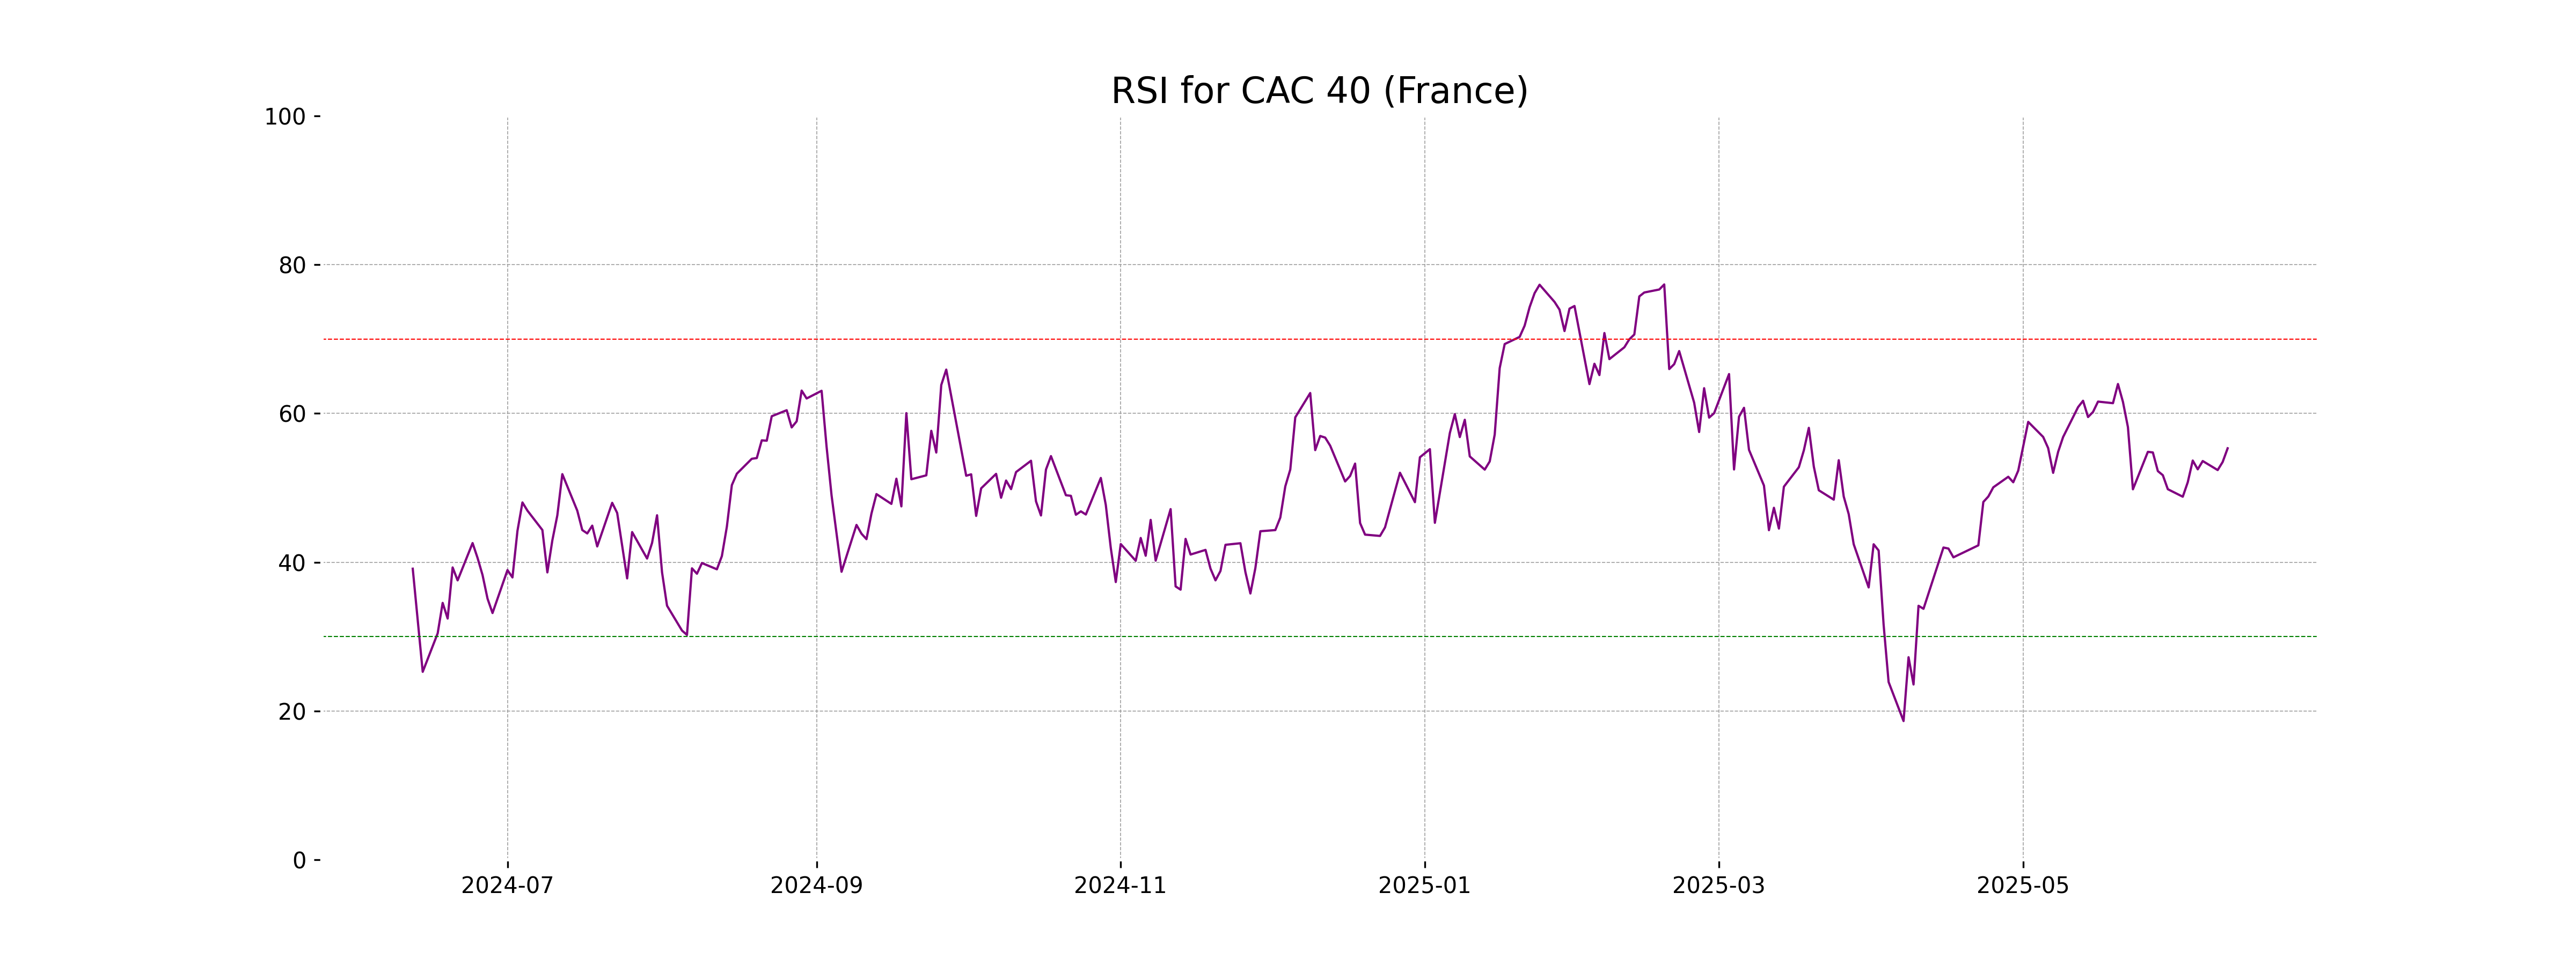
Analysis for CAC 40 (France) - June 11, 2025
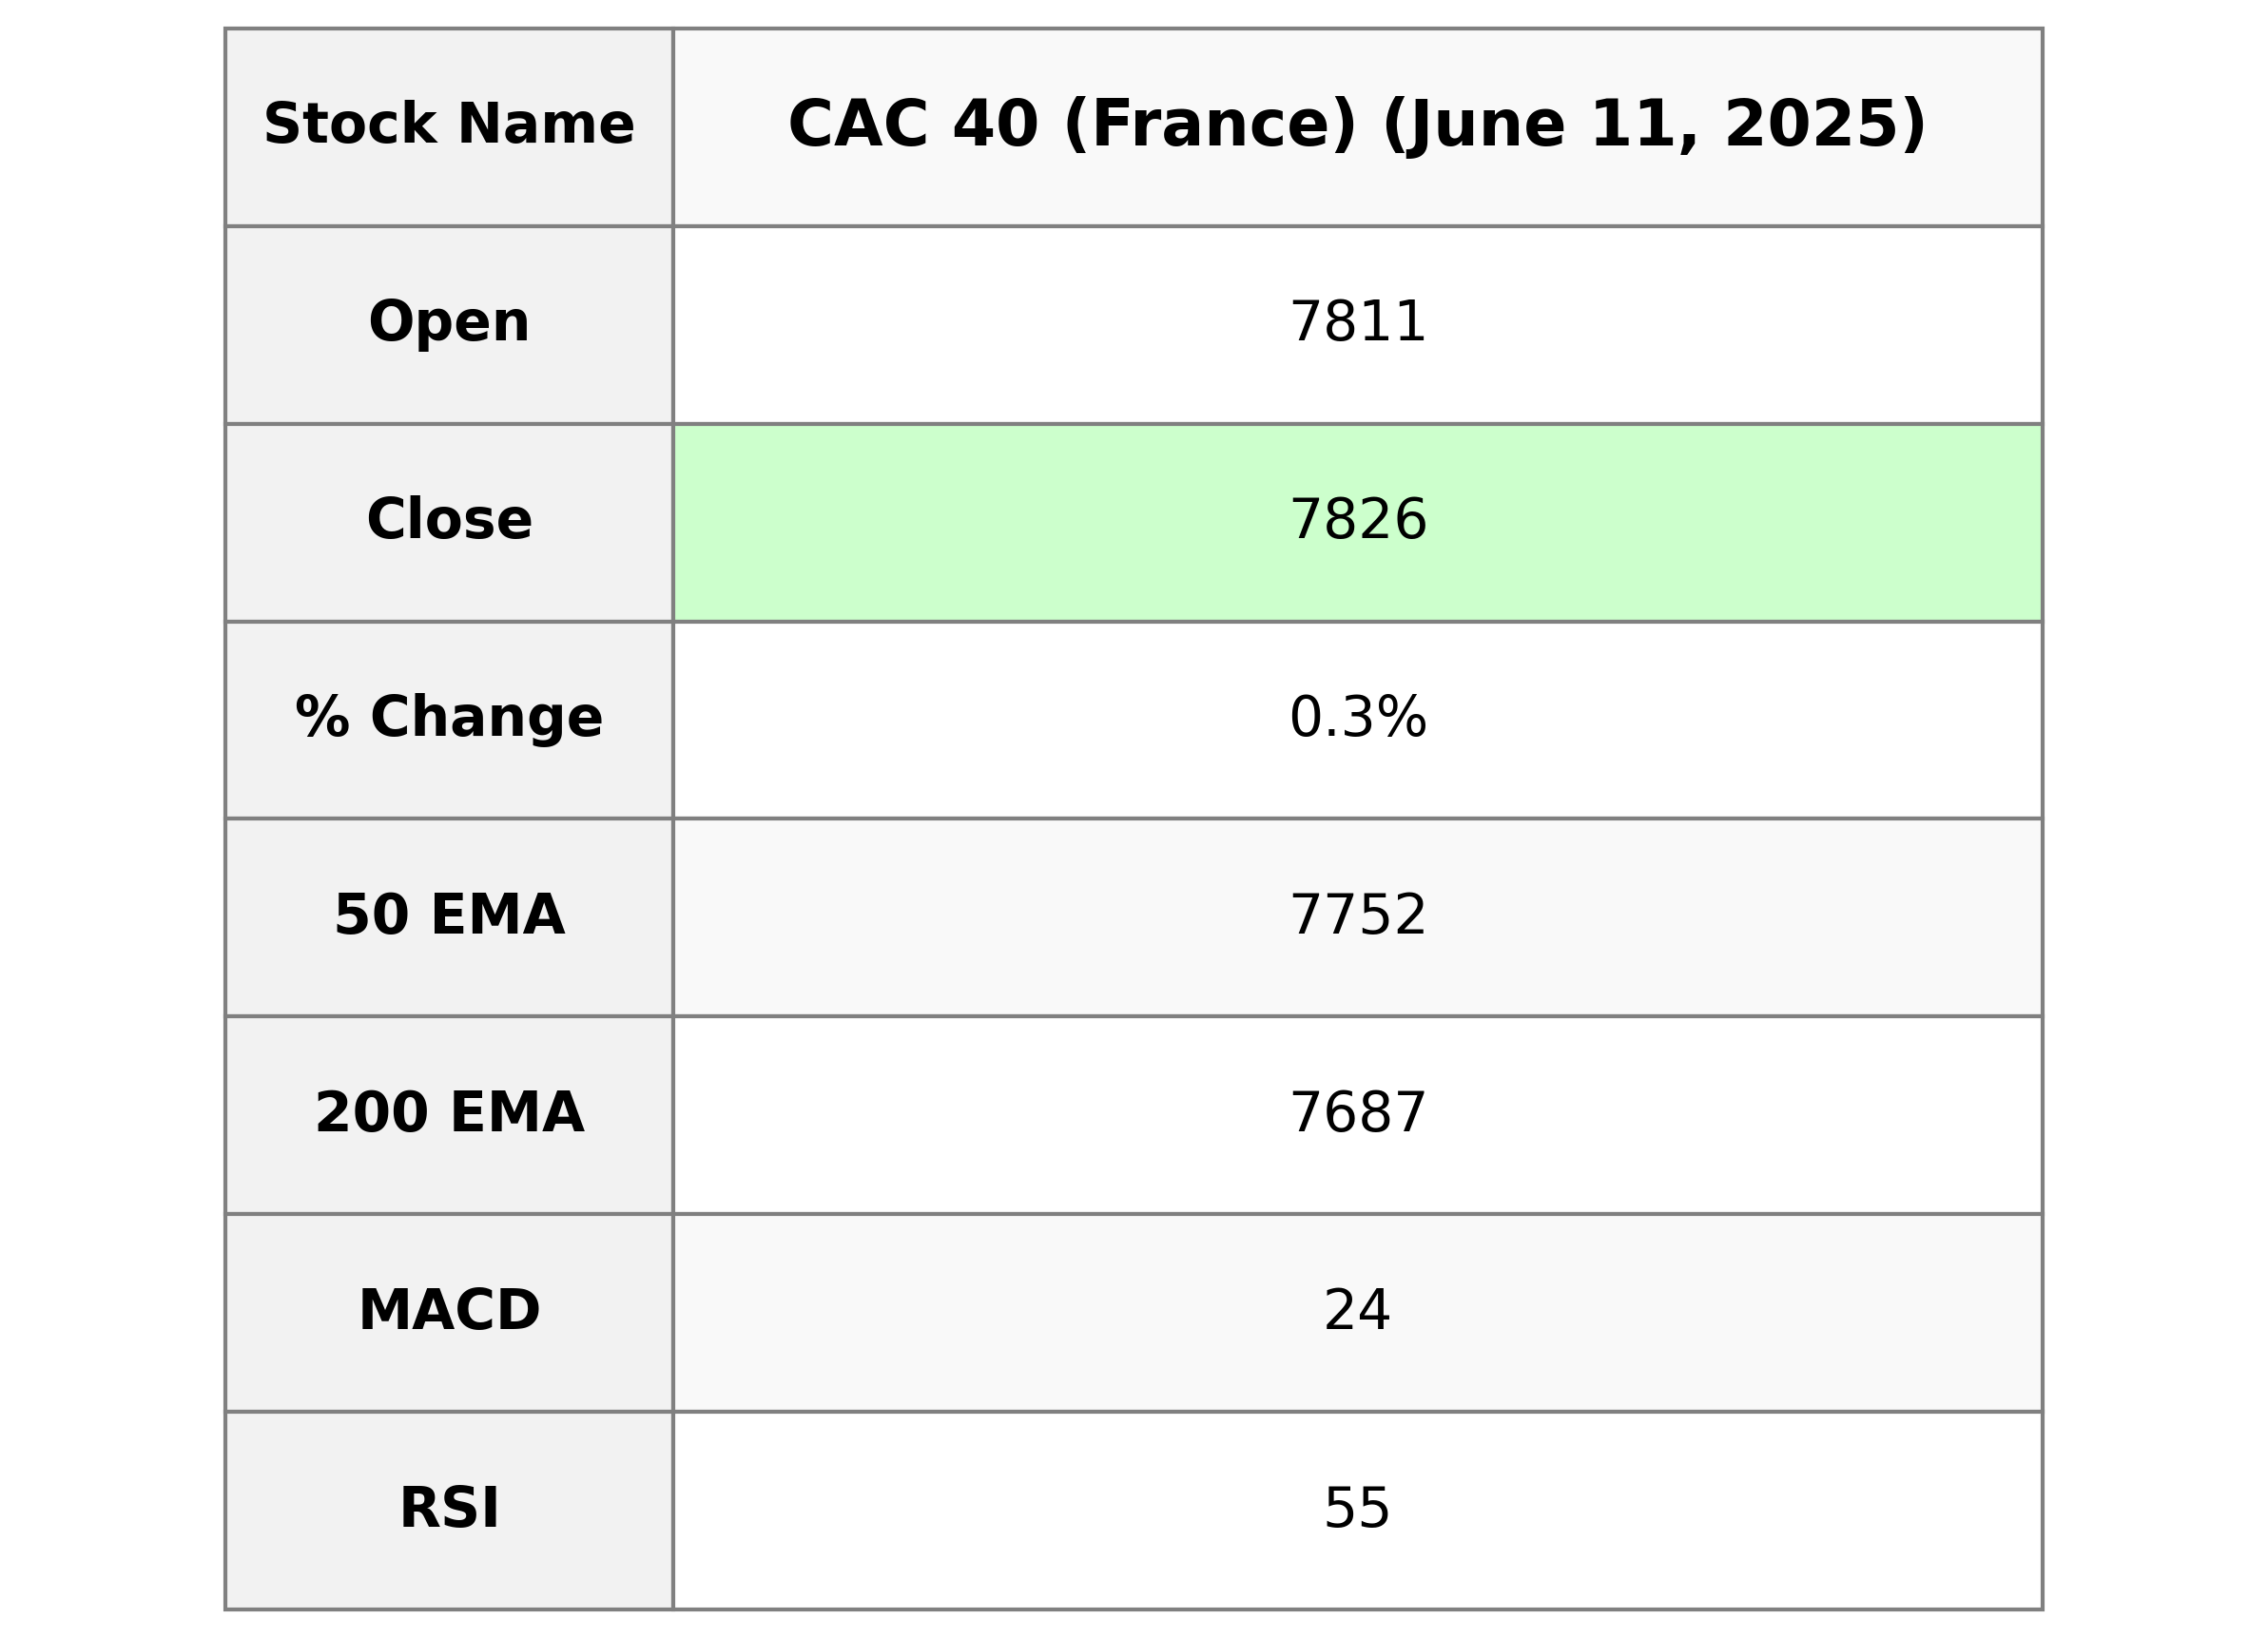
CAC 40 (France) Performance: The CAC 40 index opened at 7810.84 and closed at 7825.85, reflecting a slight increase with a 0.28% change and a points gain of 21.52. The Relative Strength Index (RSI) is at 55.32, indicating a generally stable market posture. The 10-day EMA stands at 7799.72, above the 20-day and 50-day EMAs, suggesting a short-term upward trend.
Relationship with Key Moving Averages
The closing price of CAC 40 is 7825.85, which is above its 50-day EMA of 7752.20 and 200-day EMA of 7687.36, indicating a potential bullish trend. It is also above the 10-day EMA of 7799.72 and the 20-day EMA of 7785.28, suggesting short-term momentum is strong.
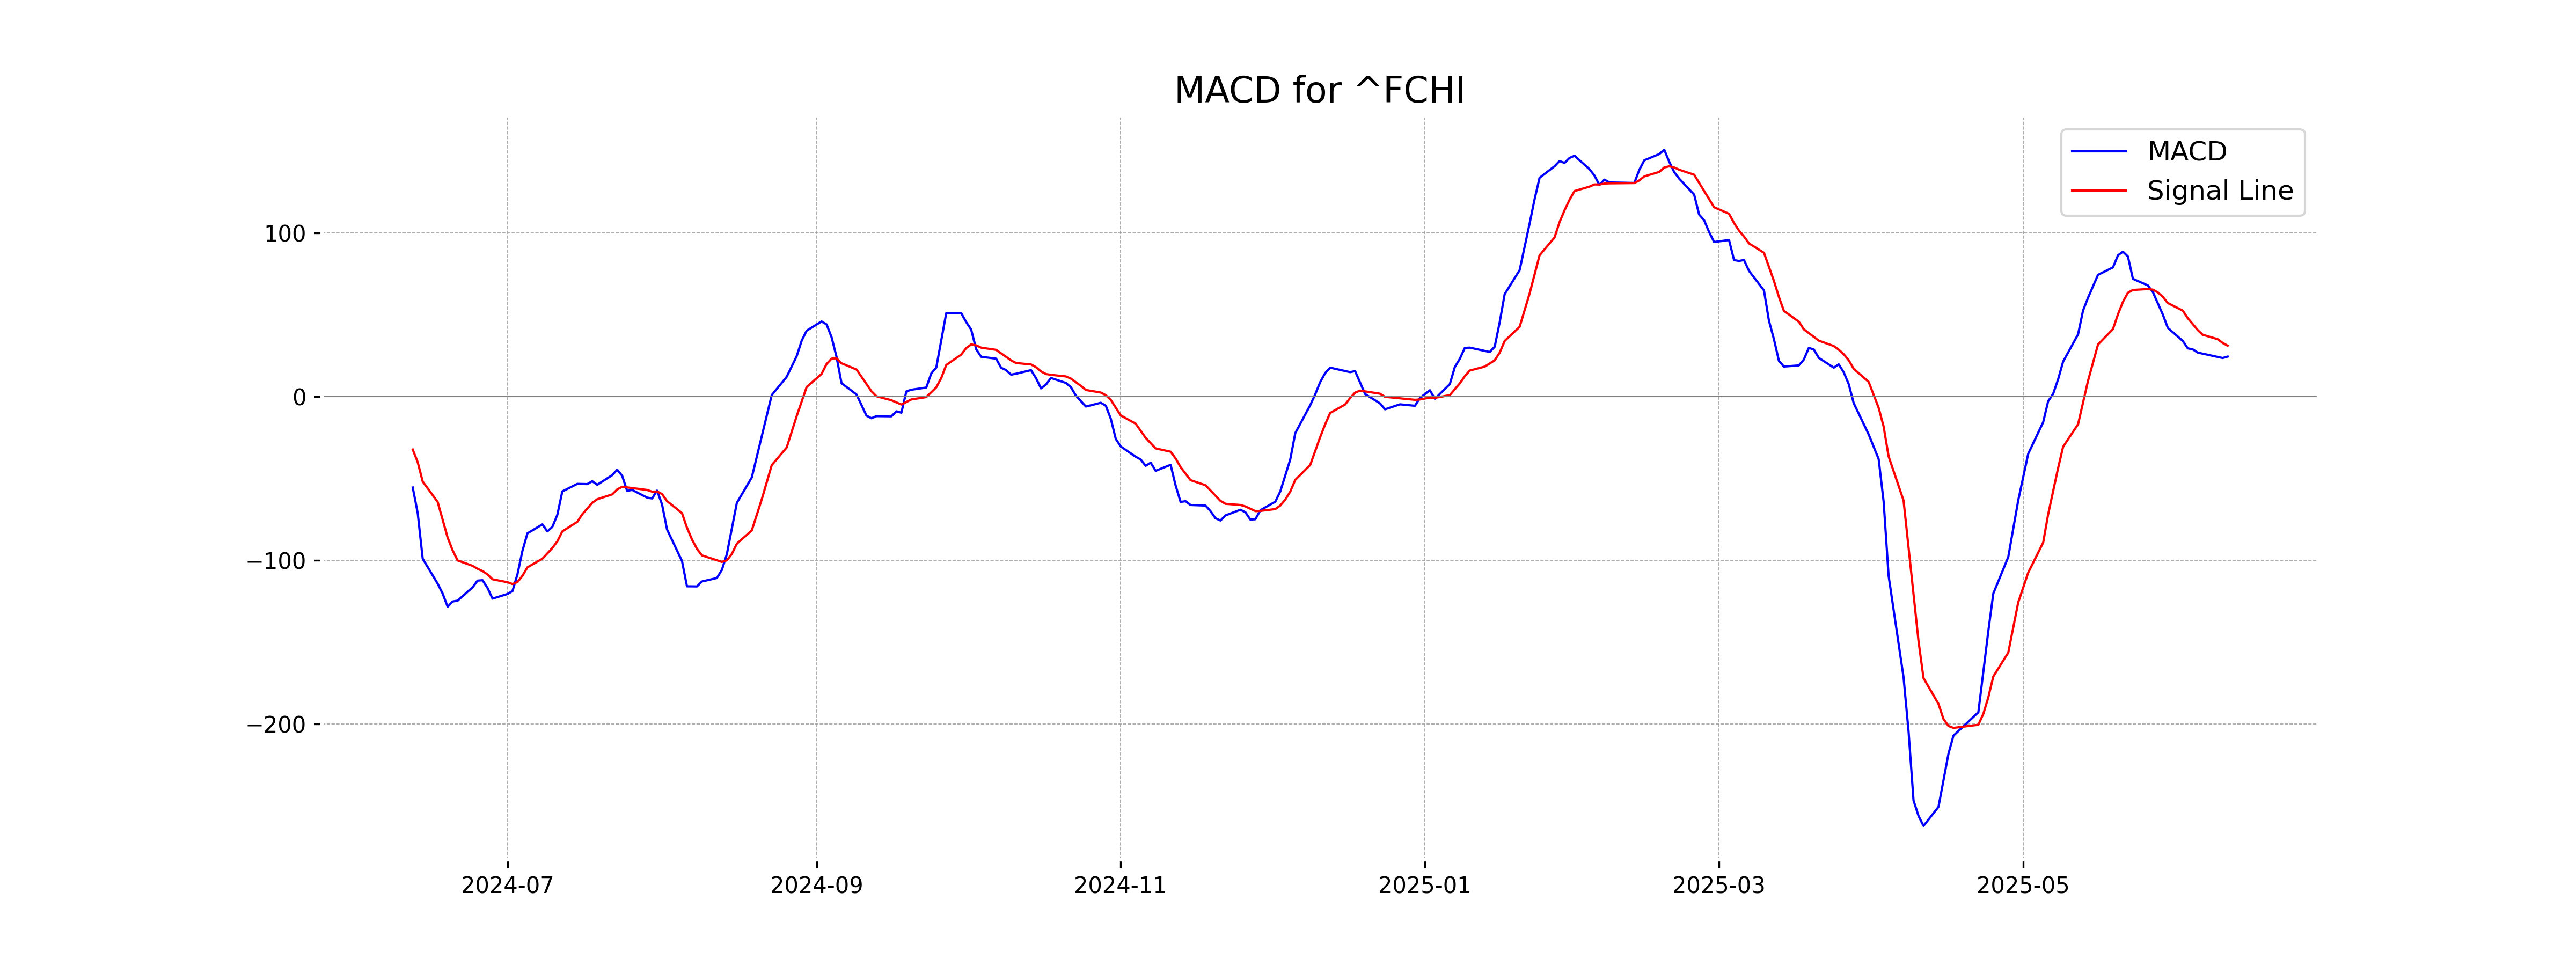
Moving Averages Trend (MACD)
The MACD for CAC 40 is 24.36, which is below the MACD Signal line at 31.04. This indicates a possible bearish trend, suggesting that the momentum may be slowing down. Investors should monitor this closely for any potential reversal or further decline.
RSI Analysis
Relative Strength Index (RSI) Analysis for CAC 40 (France): The RSI for CAC 40 is currently at 55.32, suggesting neutral momentum. With a value below 70, the index is neither in the overbought nor the oversold territory, indicating moderate buying and selling pressure.
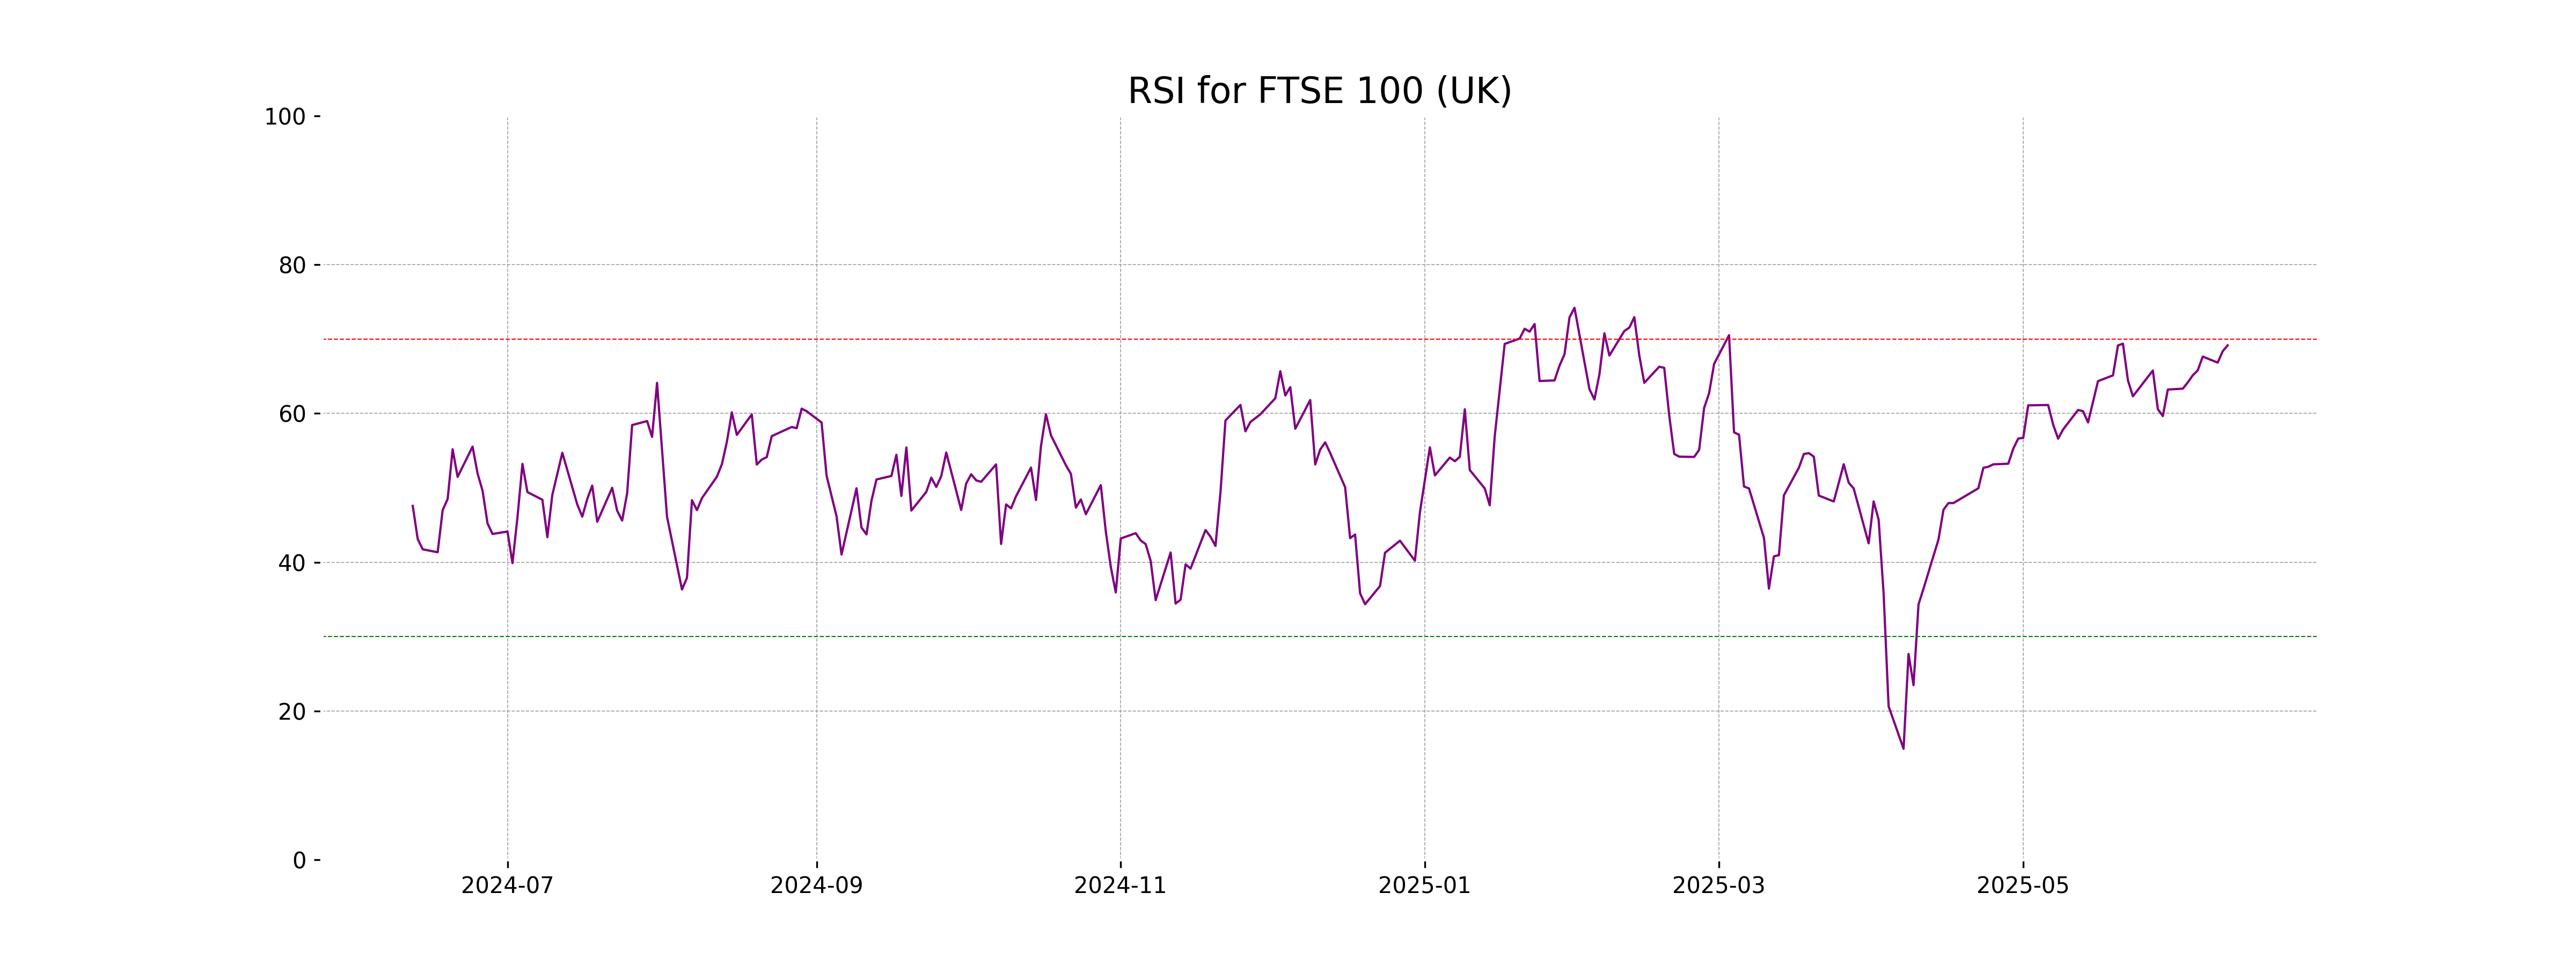
Analysis for FTSE 100 (UK) - June 11, 2025
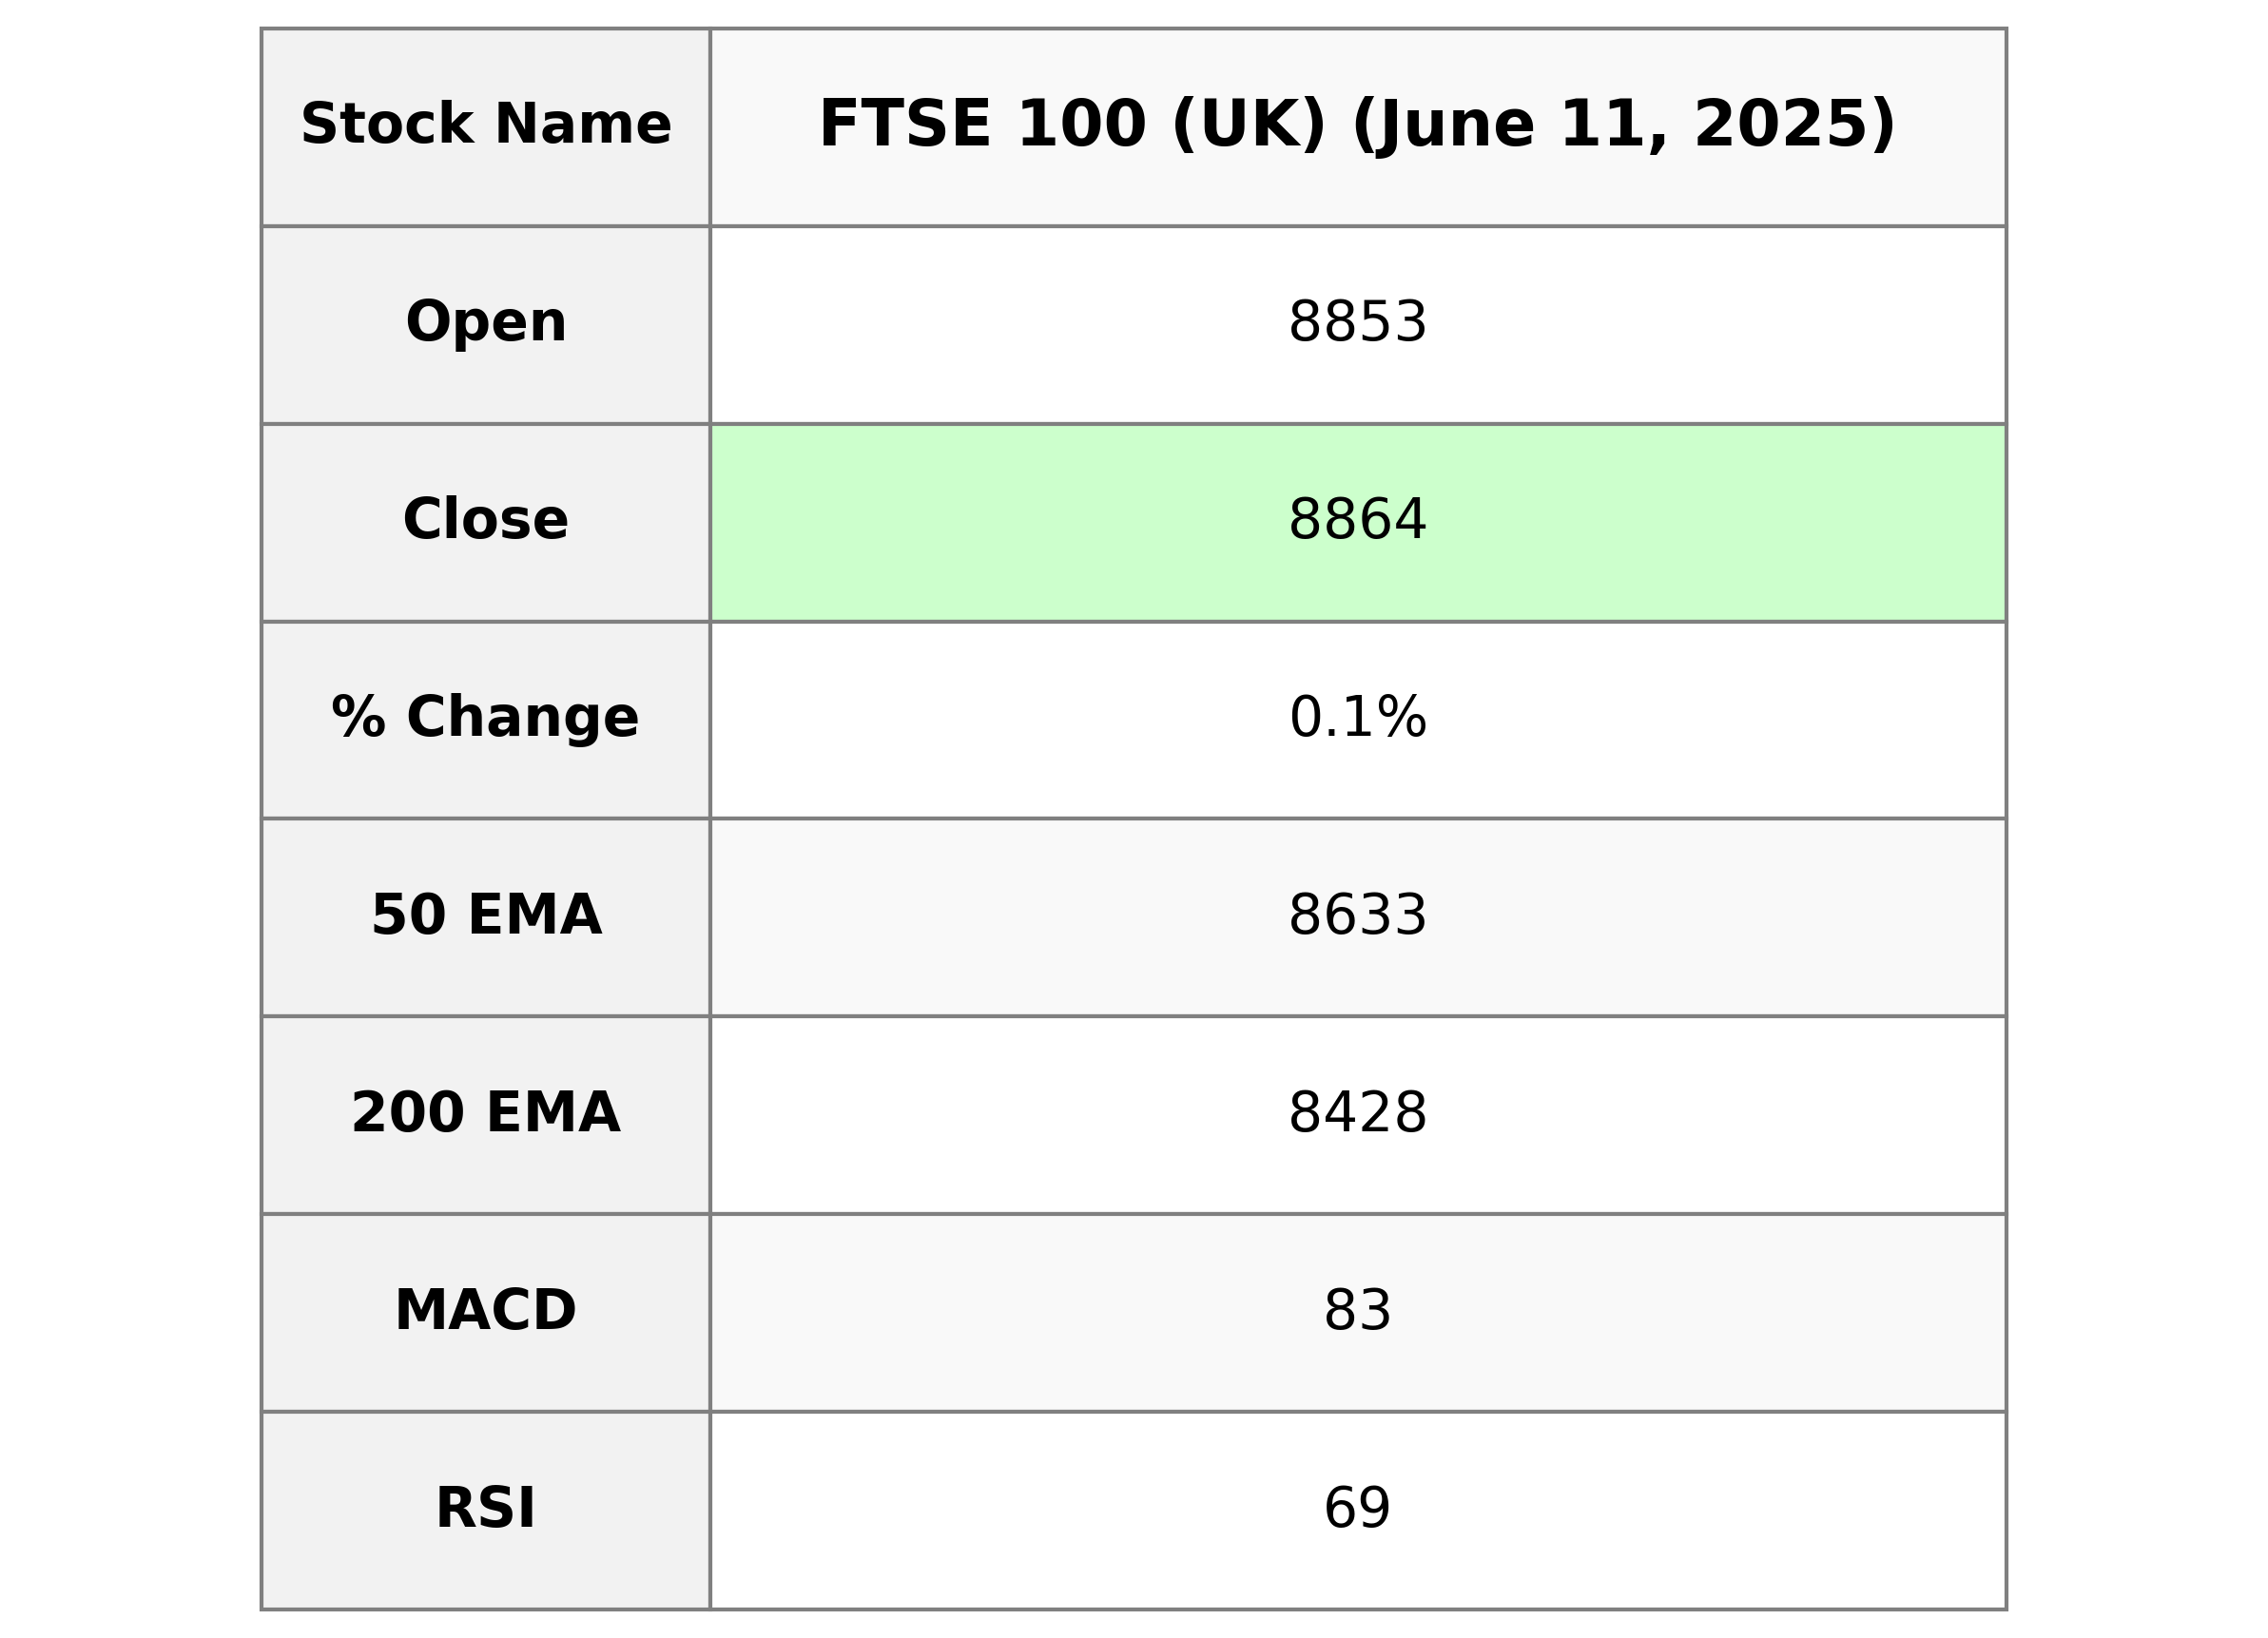
FTSE 100 (UK) opened at 8853.08 and closed at 8864.15, marking a 0.12% increase compared to the previous close, with a points change of 11.05. The RSI is at 69.16, indicating the index is nearing overbought levels, while the MACD slightly exceeds the signal line, hinting at positive momentum.
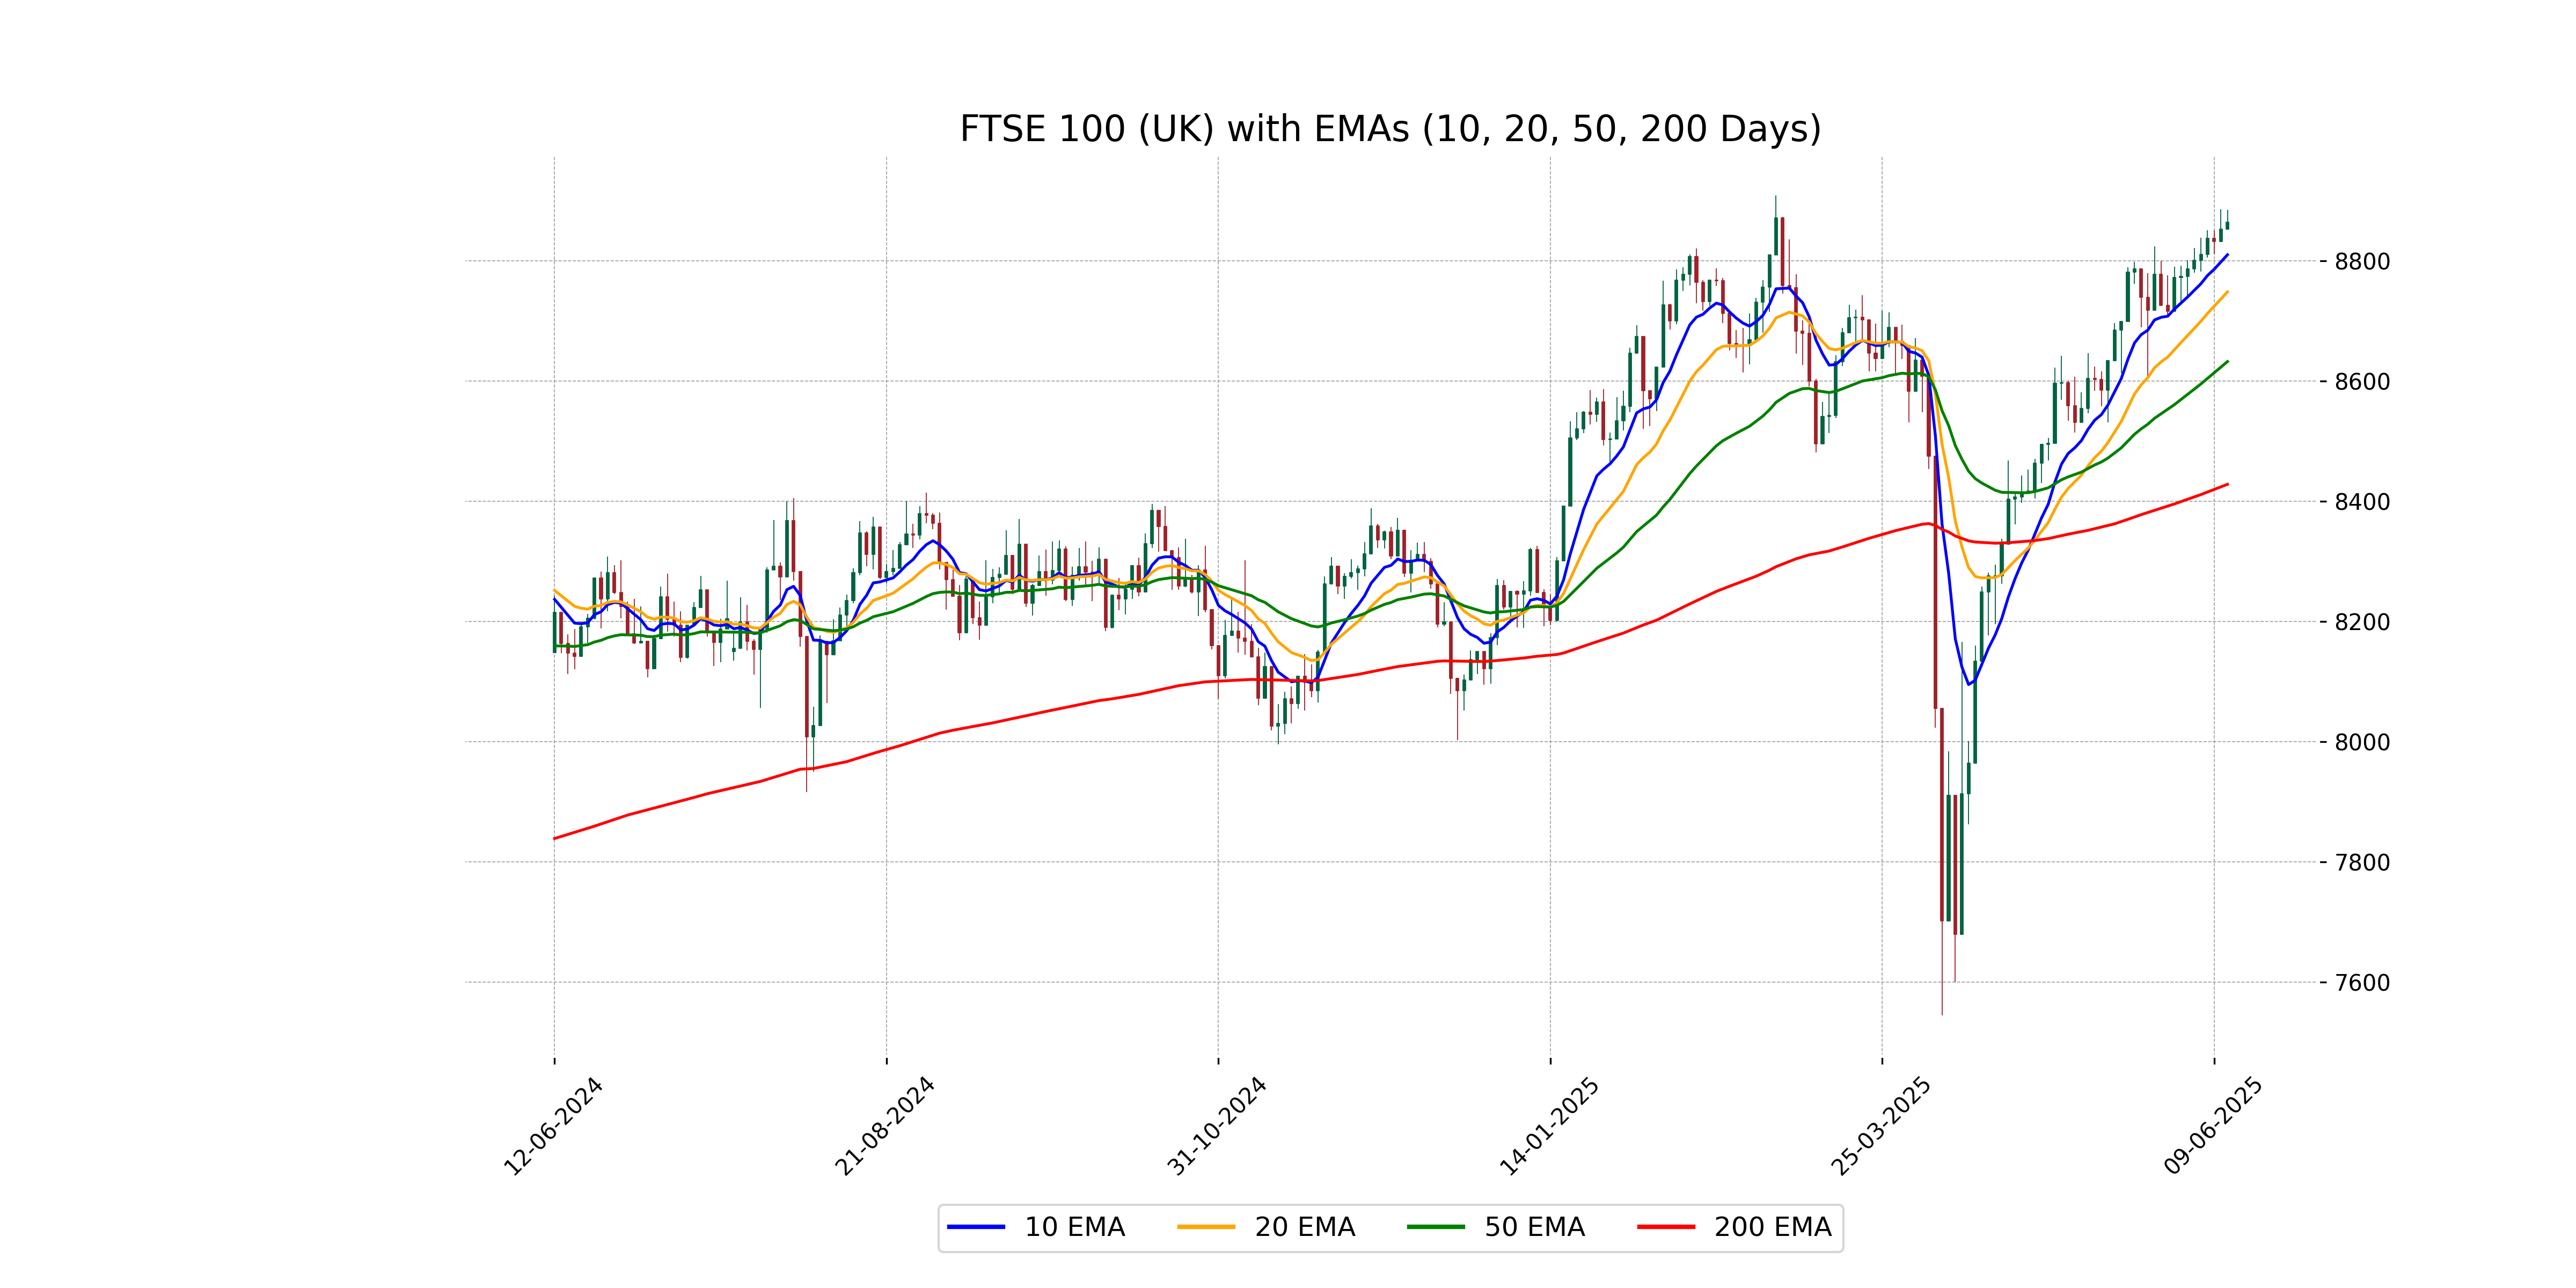
Relationship with Key Moving Averages
FTSE 100 is currently trading above its key moving averages, indicating a bullish trend. The latest close of 8864.15 is above the 10-day EMA of 8810.28, the 50-day EMA of 8632.55, and the 200-day EMA of 8428.29, suggesting positive momentum.
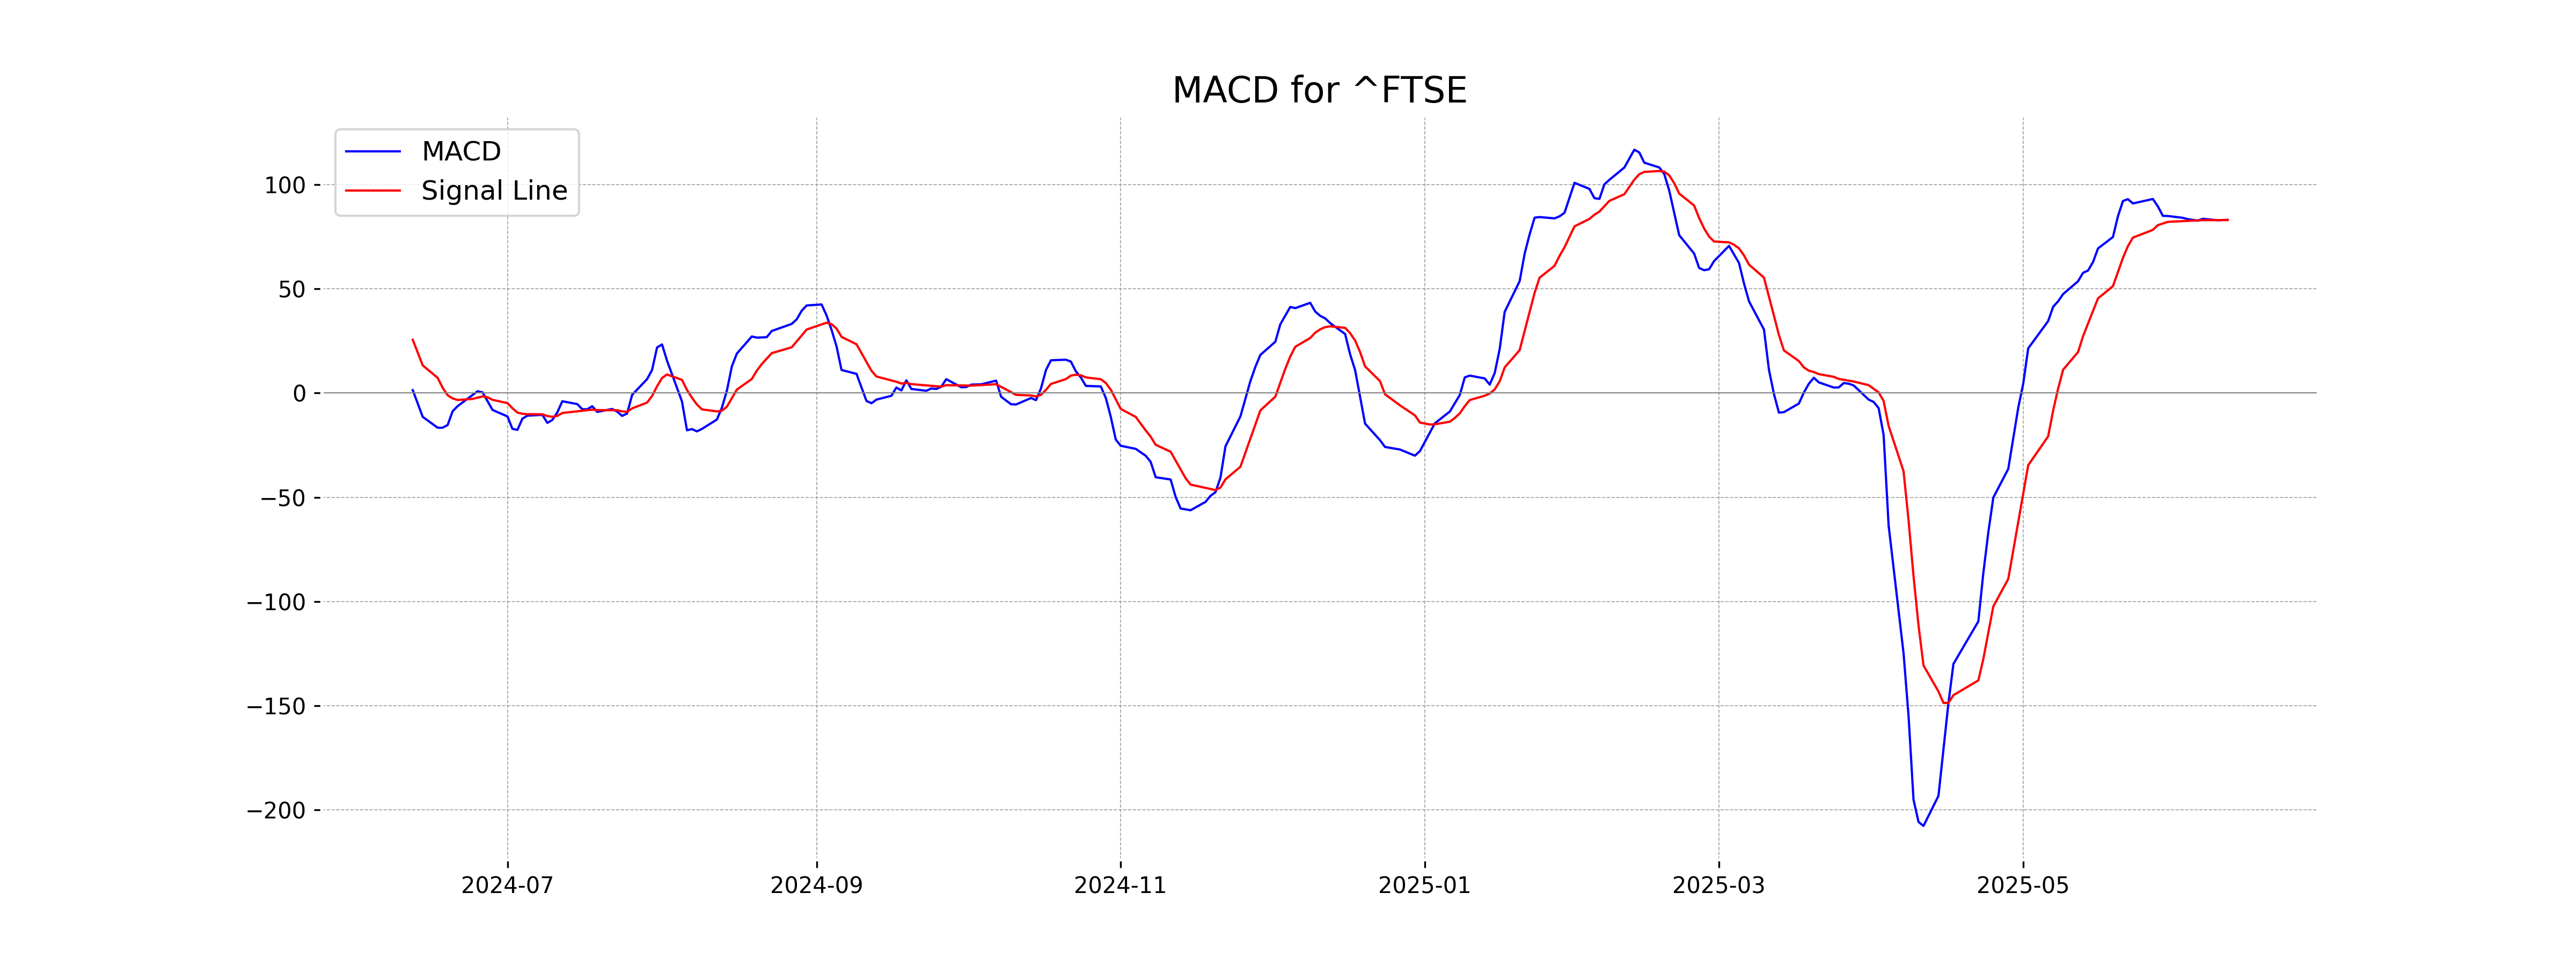
Moving Averages Trend (MACD)
The MACD for FTSE 100 is slightly above the MACD Signal (83.10 vs. 82.98), indicating a bullish momentum. This suggests that the price may continue to rise if the trend persists.
RSI Analysis
The RSI for FTSE 100 is 69.16, indicating it is approaching overbought territory. This suggests that the index might be subject to a potential pullback if the RSI continues to rise.
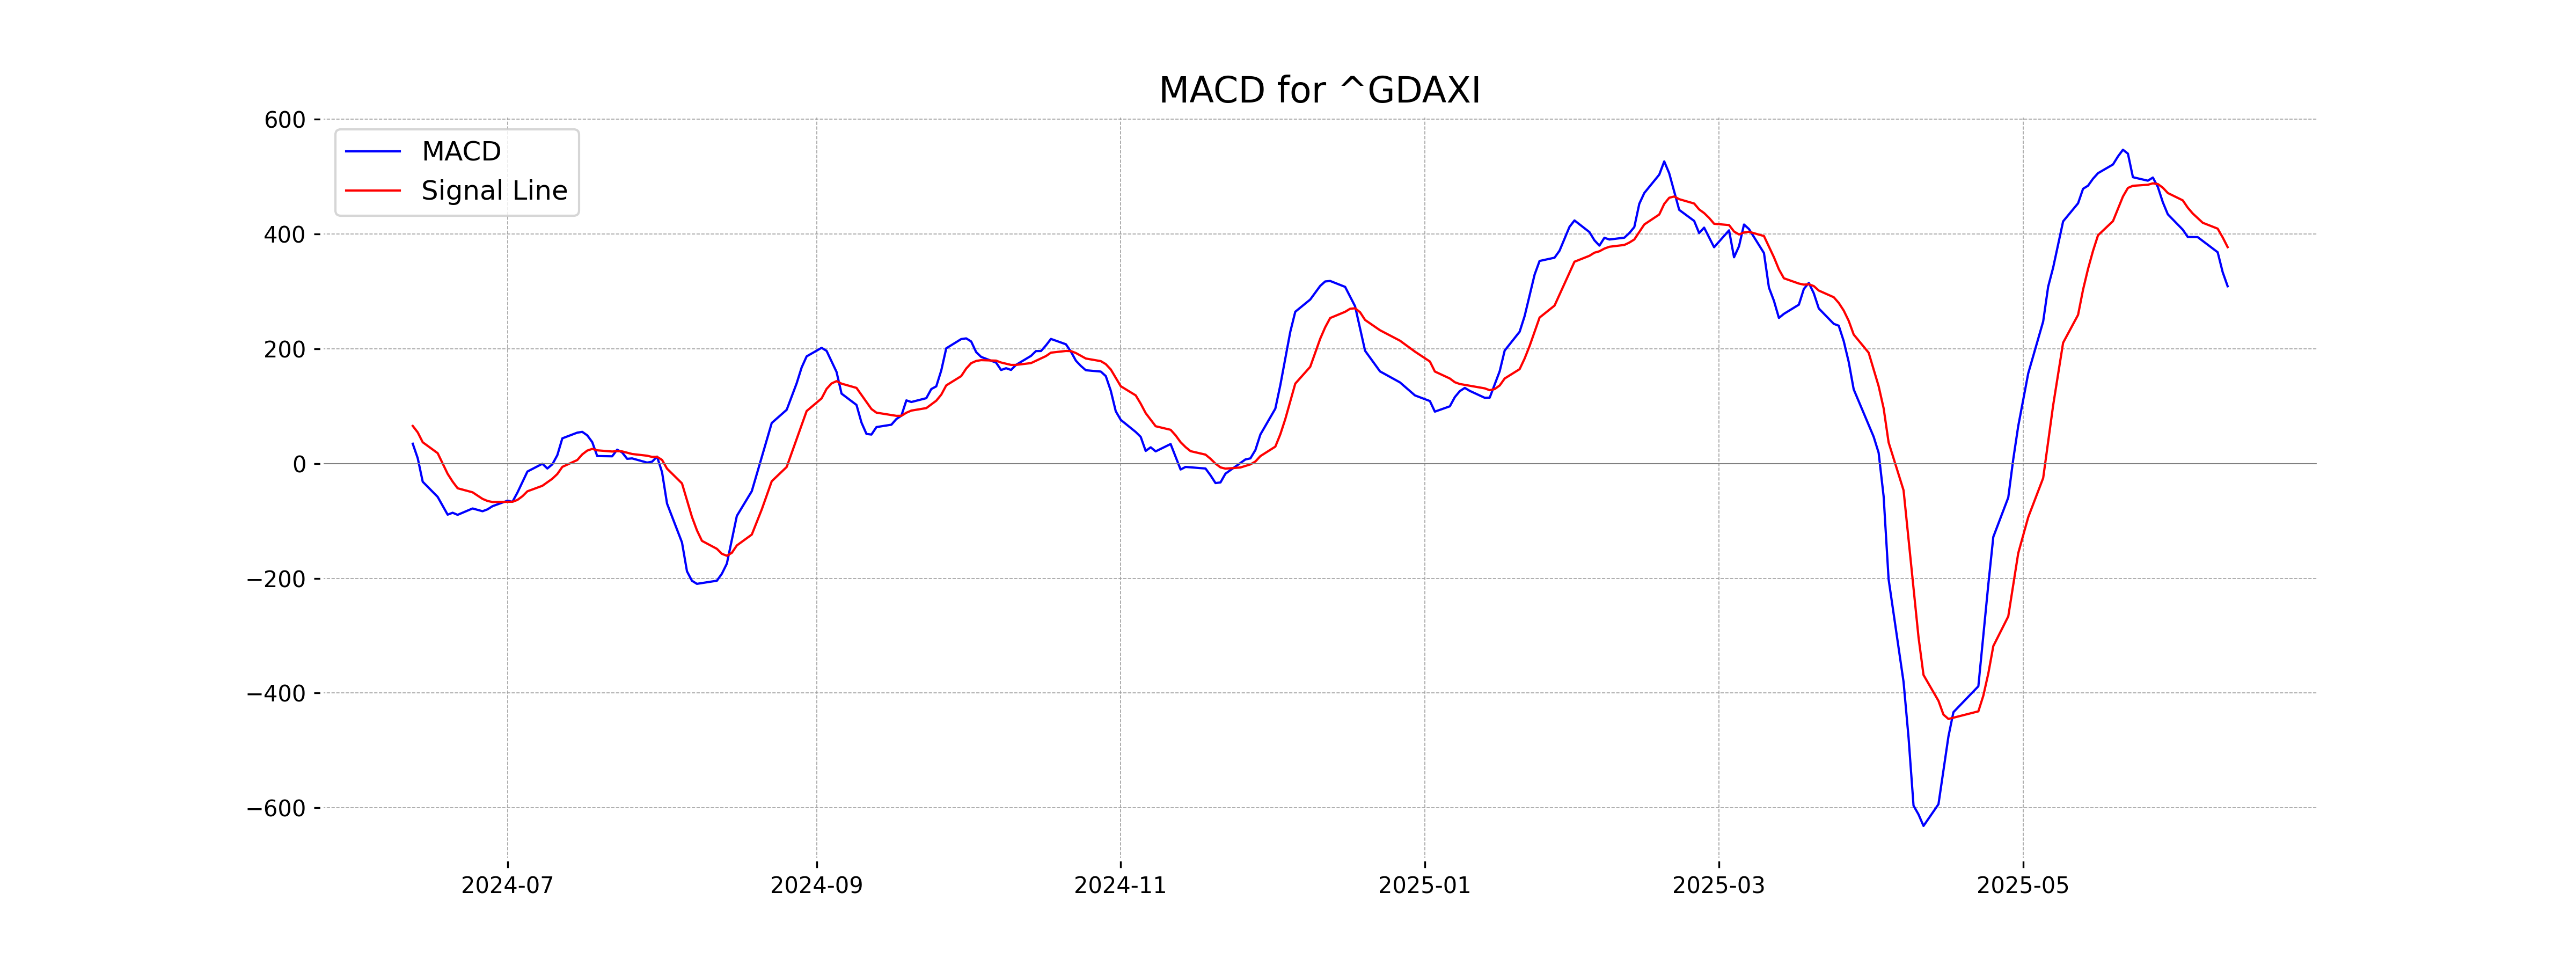
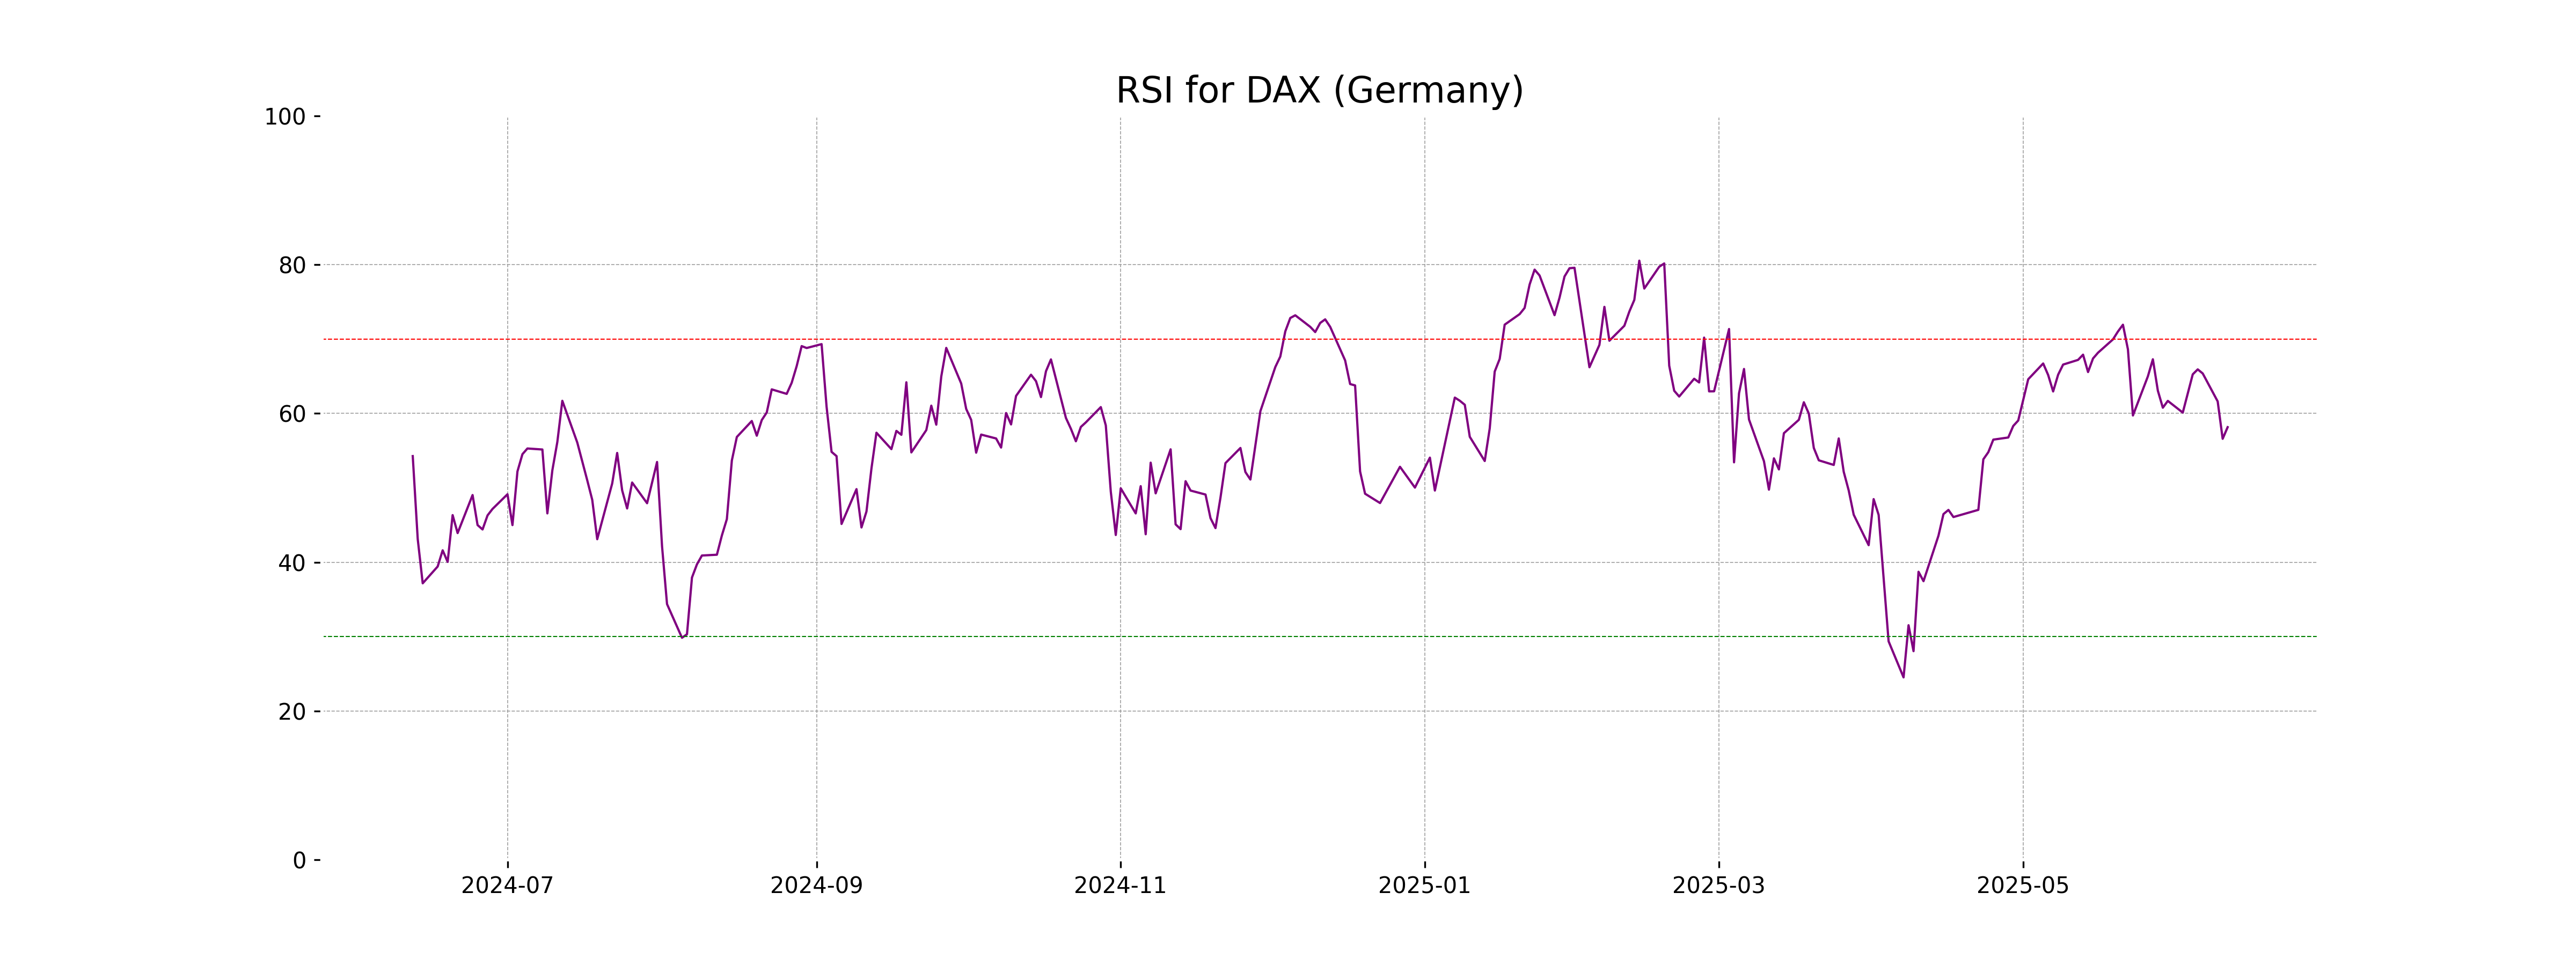
Analysis for DAX (Germany) - June 11, 2025
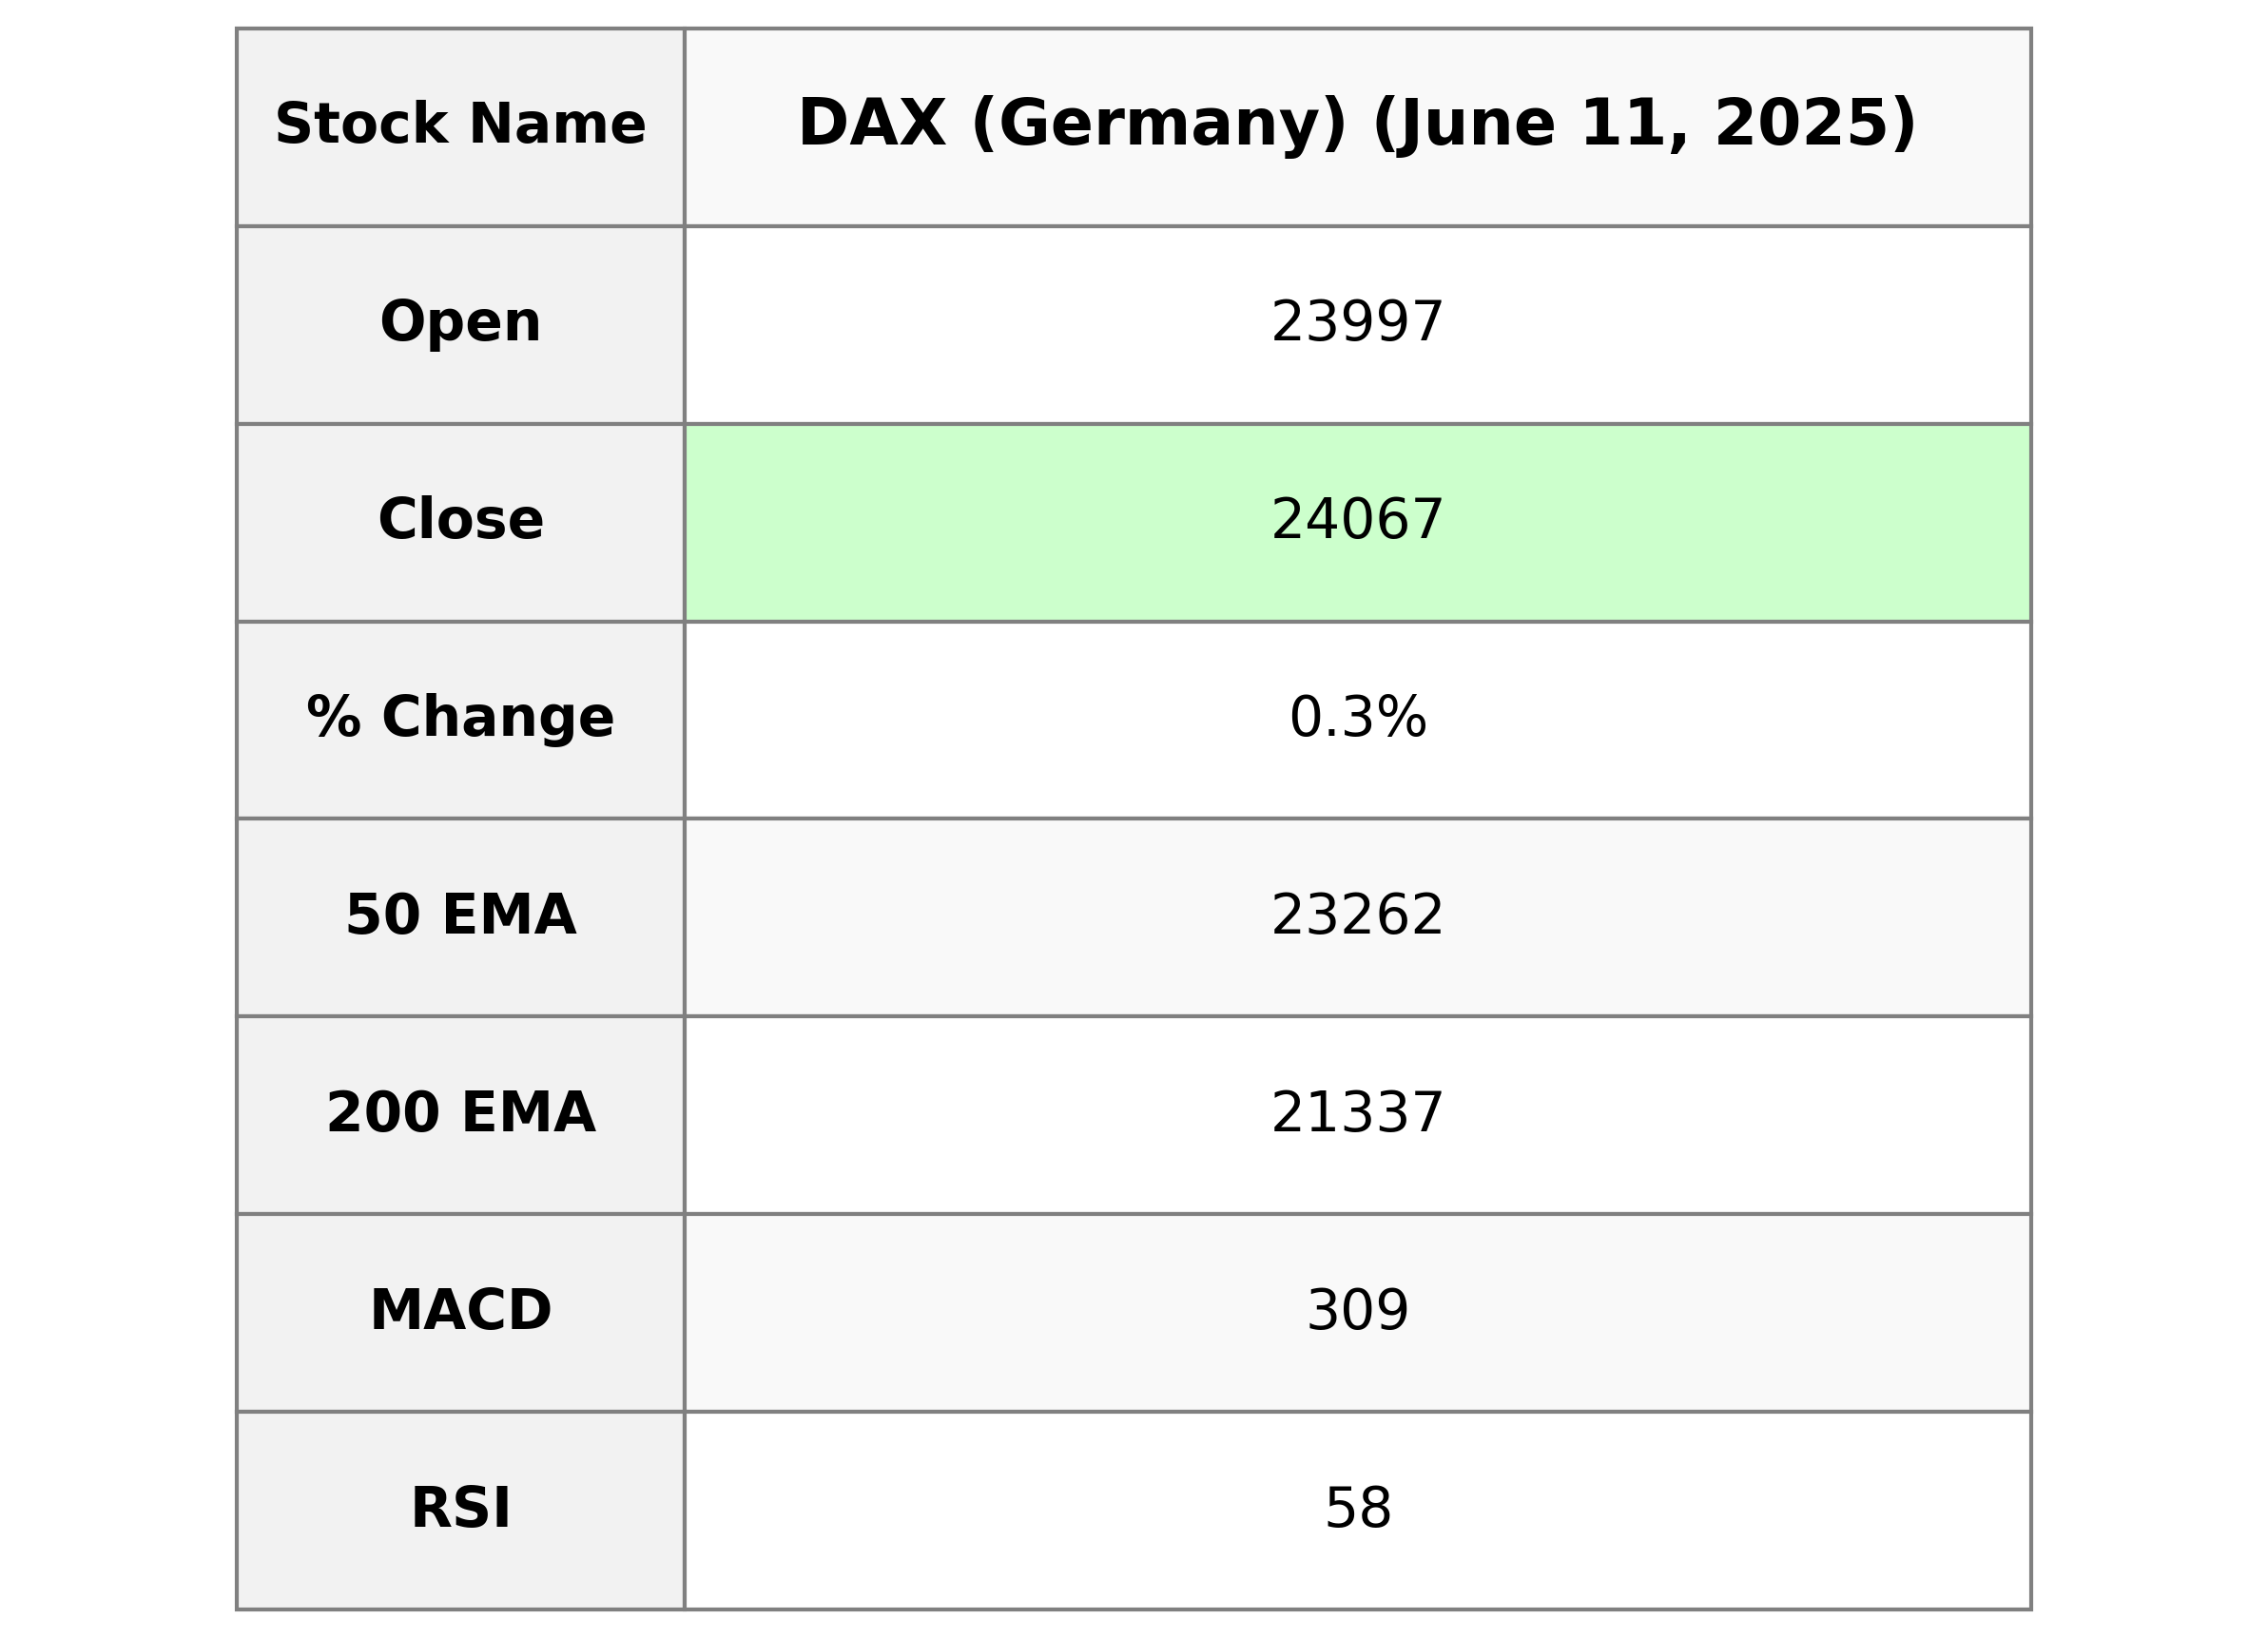
The DAX (Germany) showed a slight gain as evidenced by a 0.33% increase, closing at 24067.03, which is 79.47 points higher than the previous close. The RSI indicates moderate strength at 58.16, with the MACD below the MACD Signal suggesting a potential weakening trend.
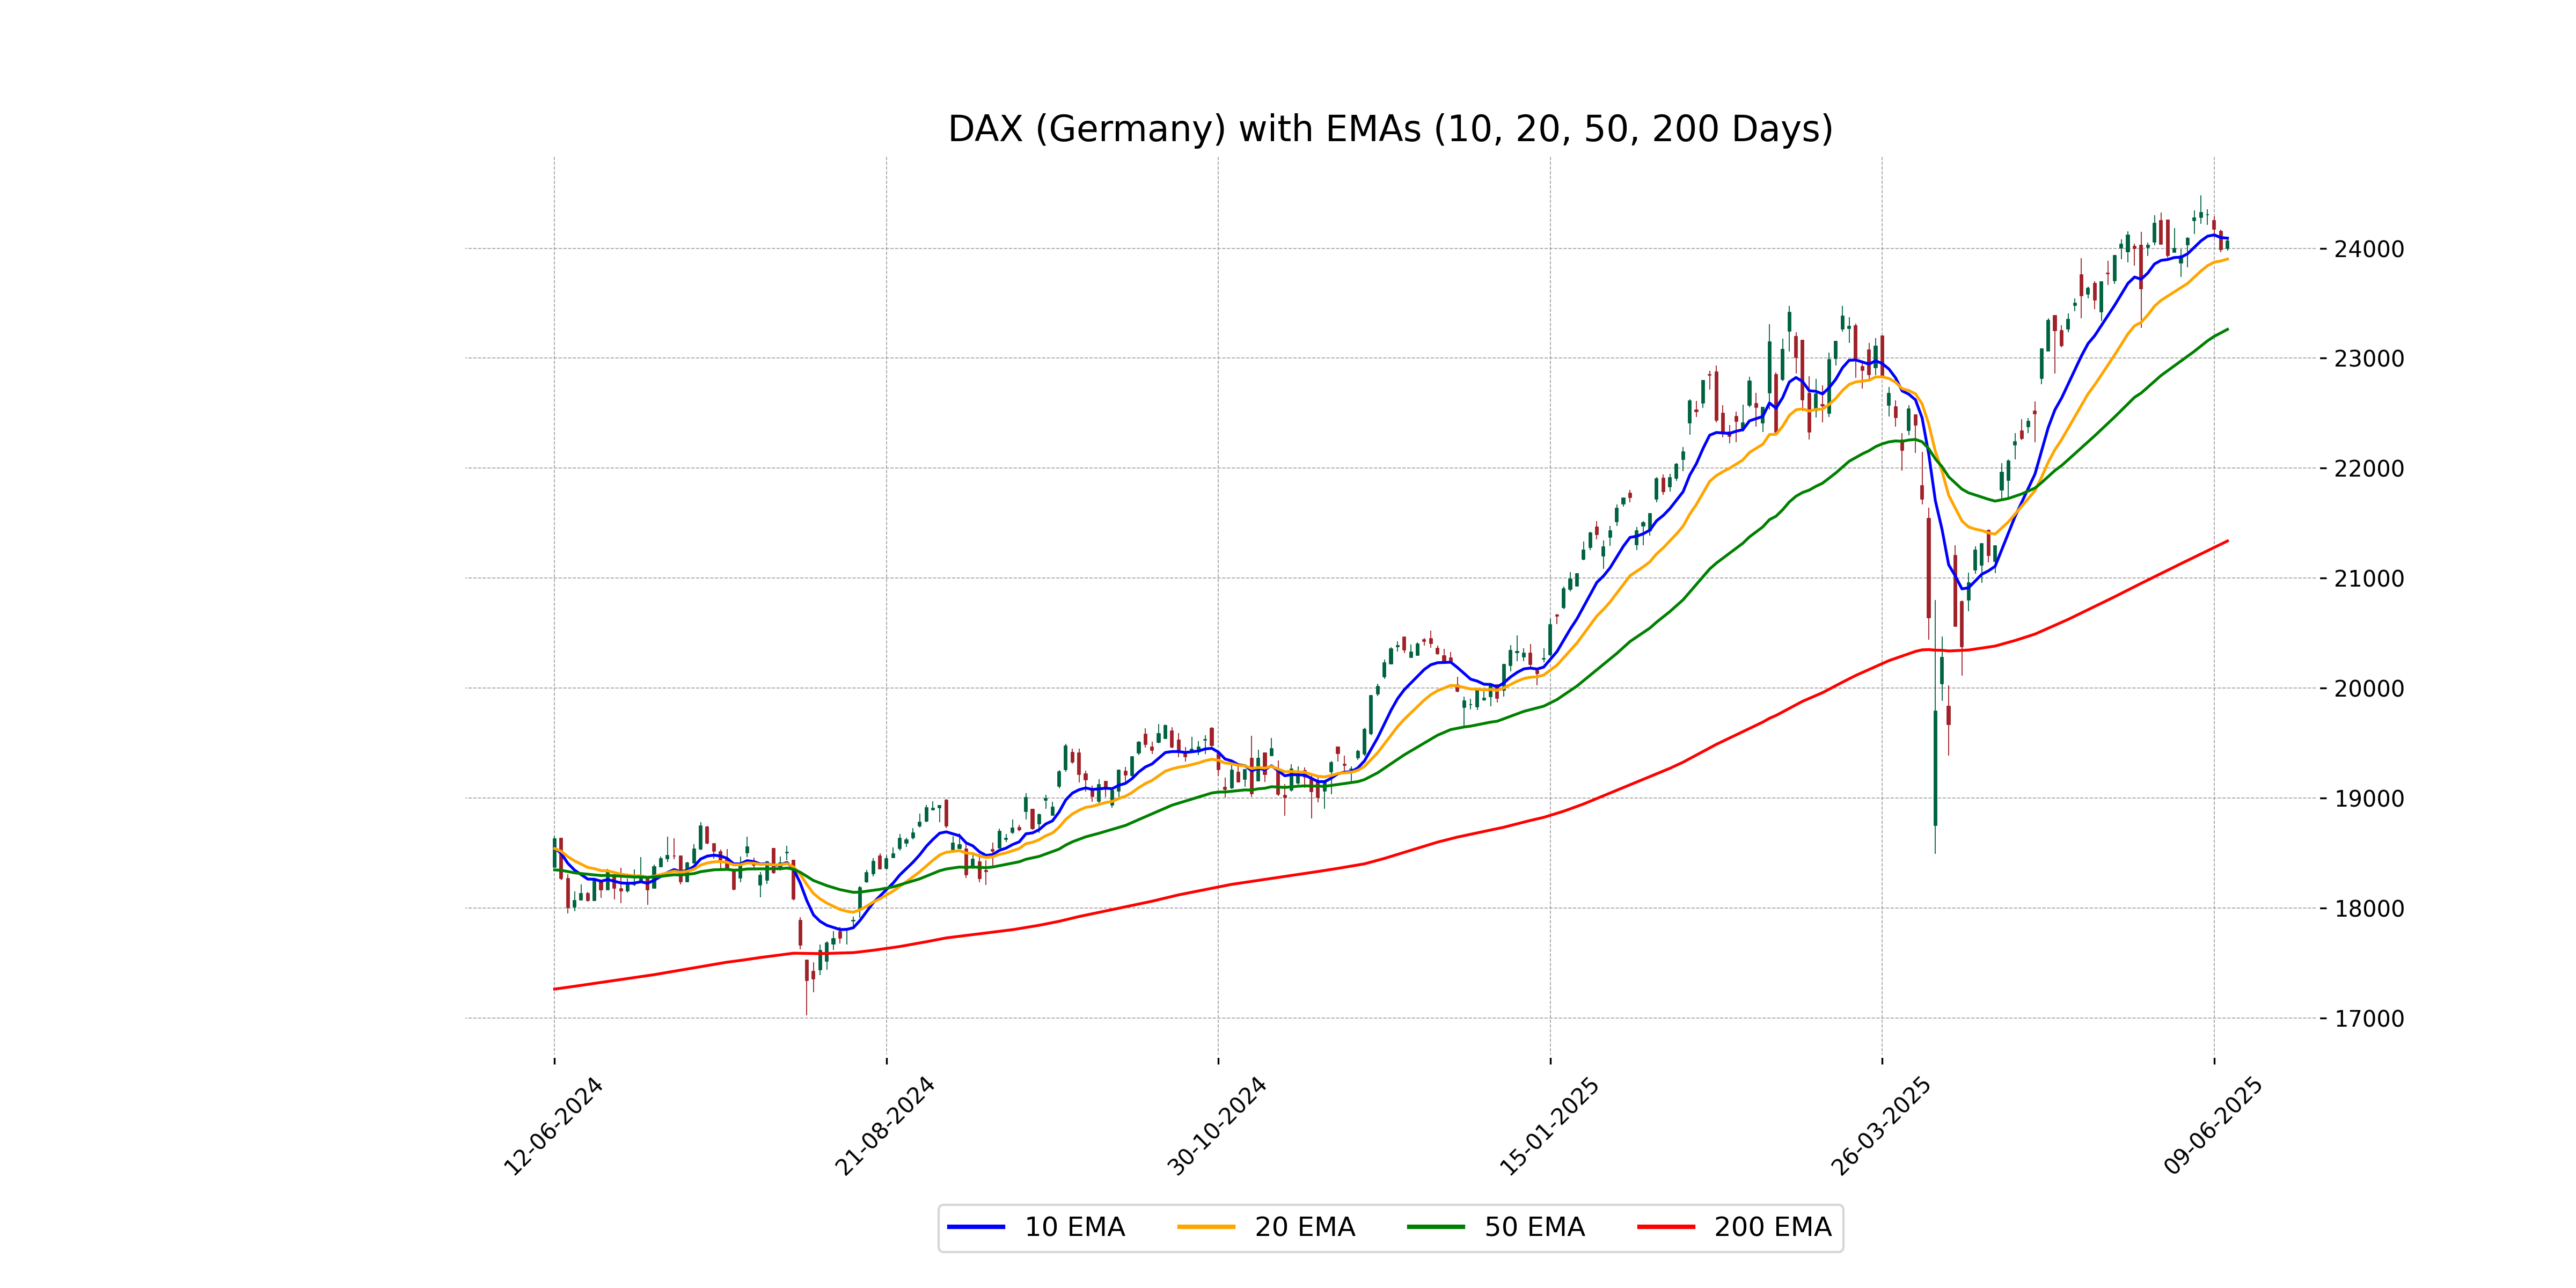
Relationship with Key Moving Averages
The DAX (Germany) closed at 24067.03, slightly below its 10-day EMA of 24091.67, indicating short-term pressure, but it remains above both the 50-day EMA of 23262.22 and the 200-day EMA of 21337.47, suggesting a generally strong bullish trend when considering longer time frames.
Moving Averages Trend (MACD)
The MACD for DAX is 309.08, which is below the MACD Signal of 377.27. This suggests a potential bearish sentiment, as the MACD line crossing below the signal line can indicate a possible downward momentum. However, further analysis and confirmation with other indicators are recommended for more precise insights.
RSI Analysis
The Relative Strength Index (RSI) for DAX (Germany) is 58.16, indicating a moderately bullish momentum. An RSI between 50 and 70 suggests that the index is gaining strength but hasn't reached overbought conditions yet.
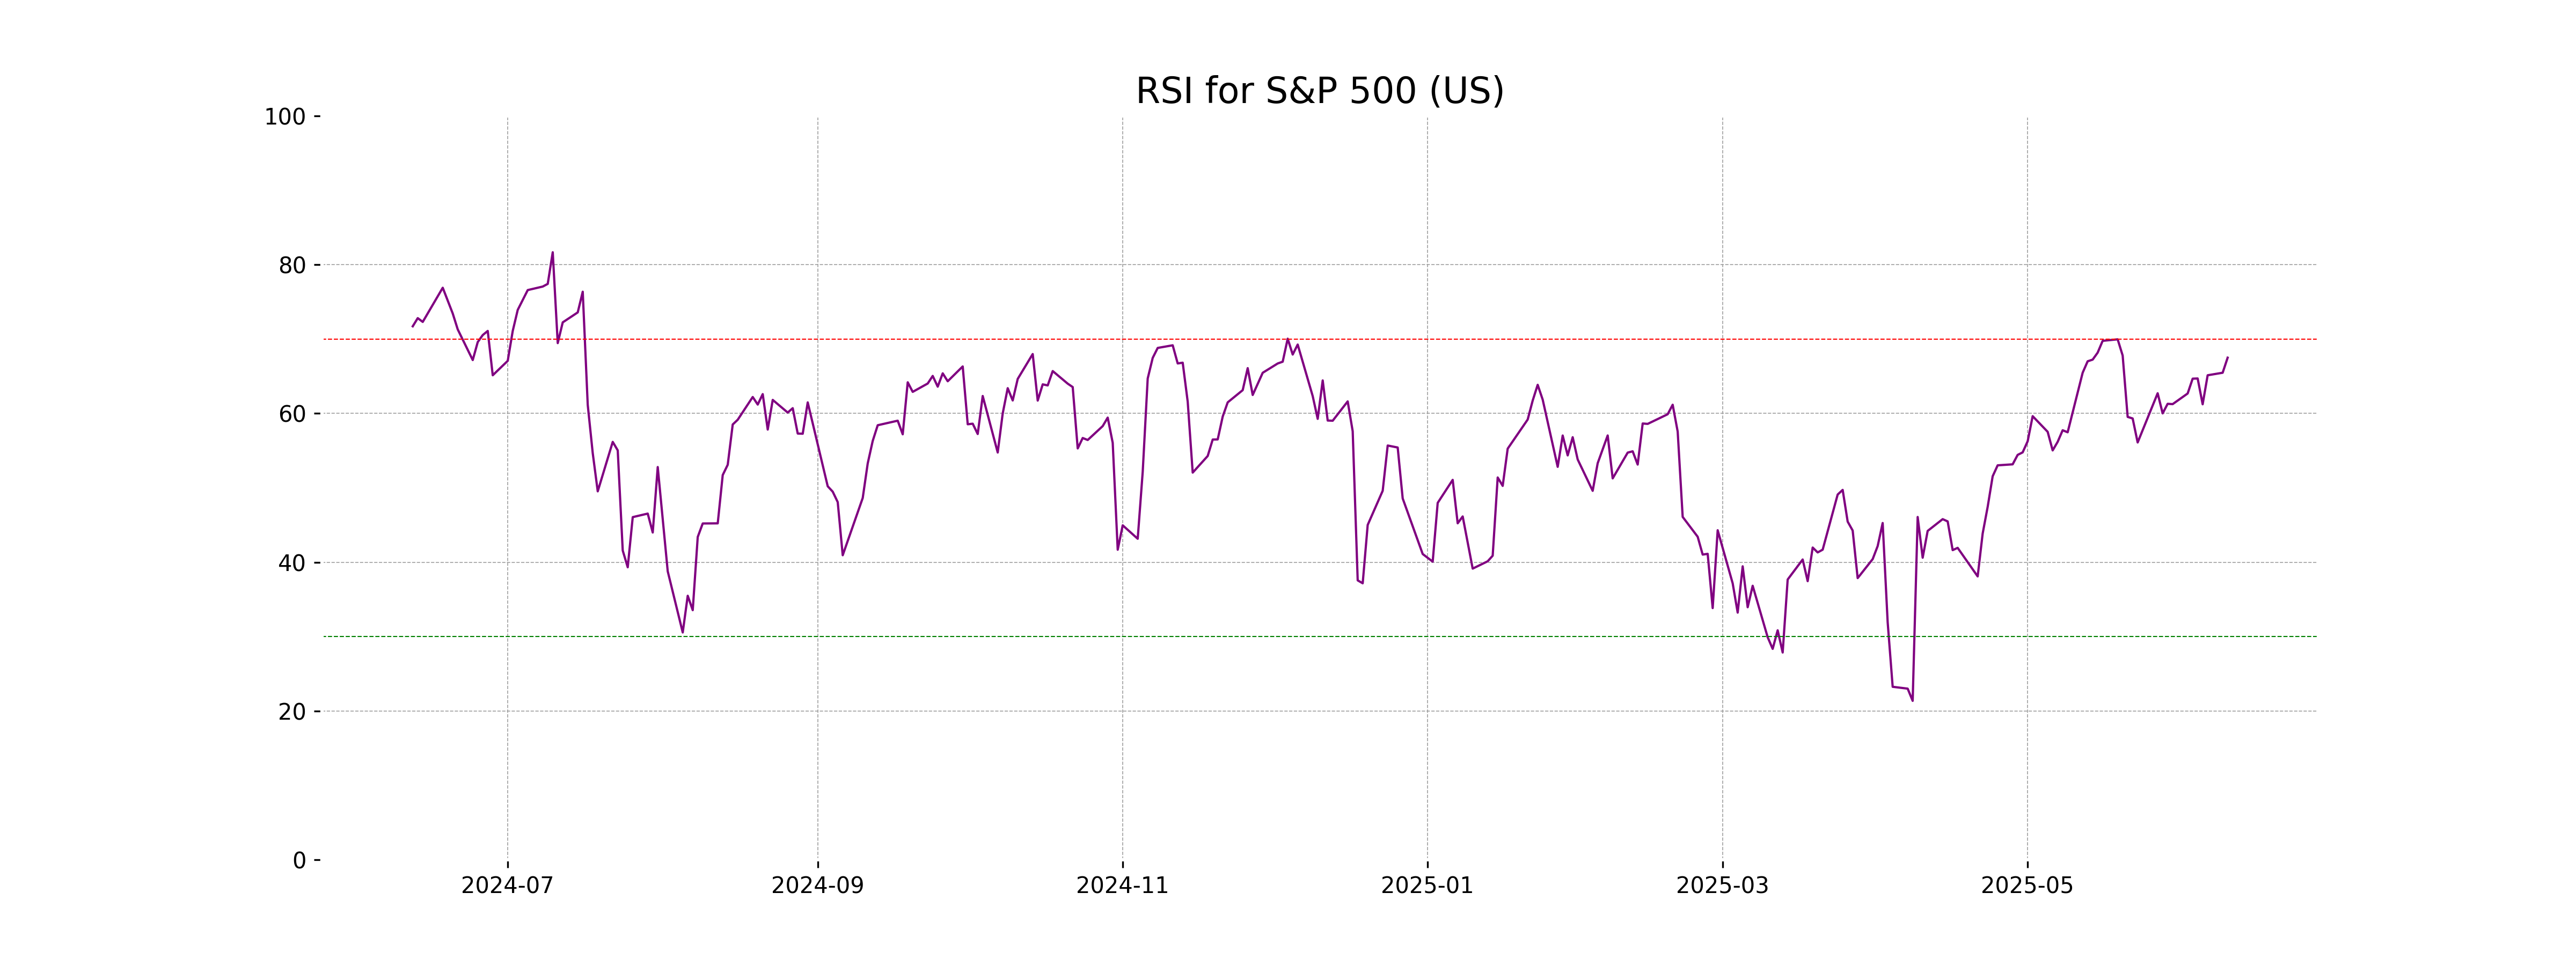
Analysis for S&P 500 (US) - June 11, 2025

The S&P 500 (US) opened at 6009.91, with a high of 6043.01 and a close of 6038.81. The index saw a positive percent change of 0.55% with a points increase of 32.93 from the previous close of 6005.88. Its RSI stands at 67.50, indicating relatively strong buying interest.
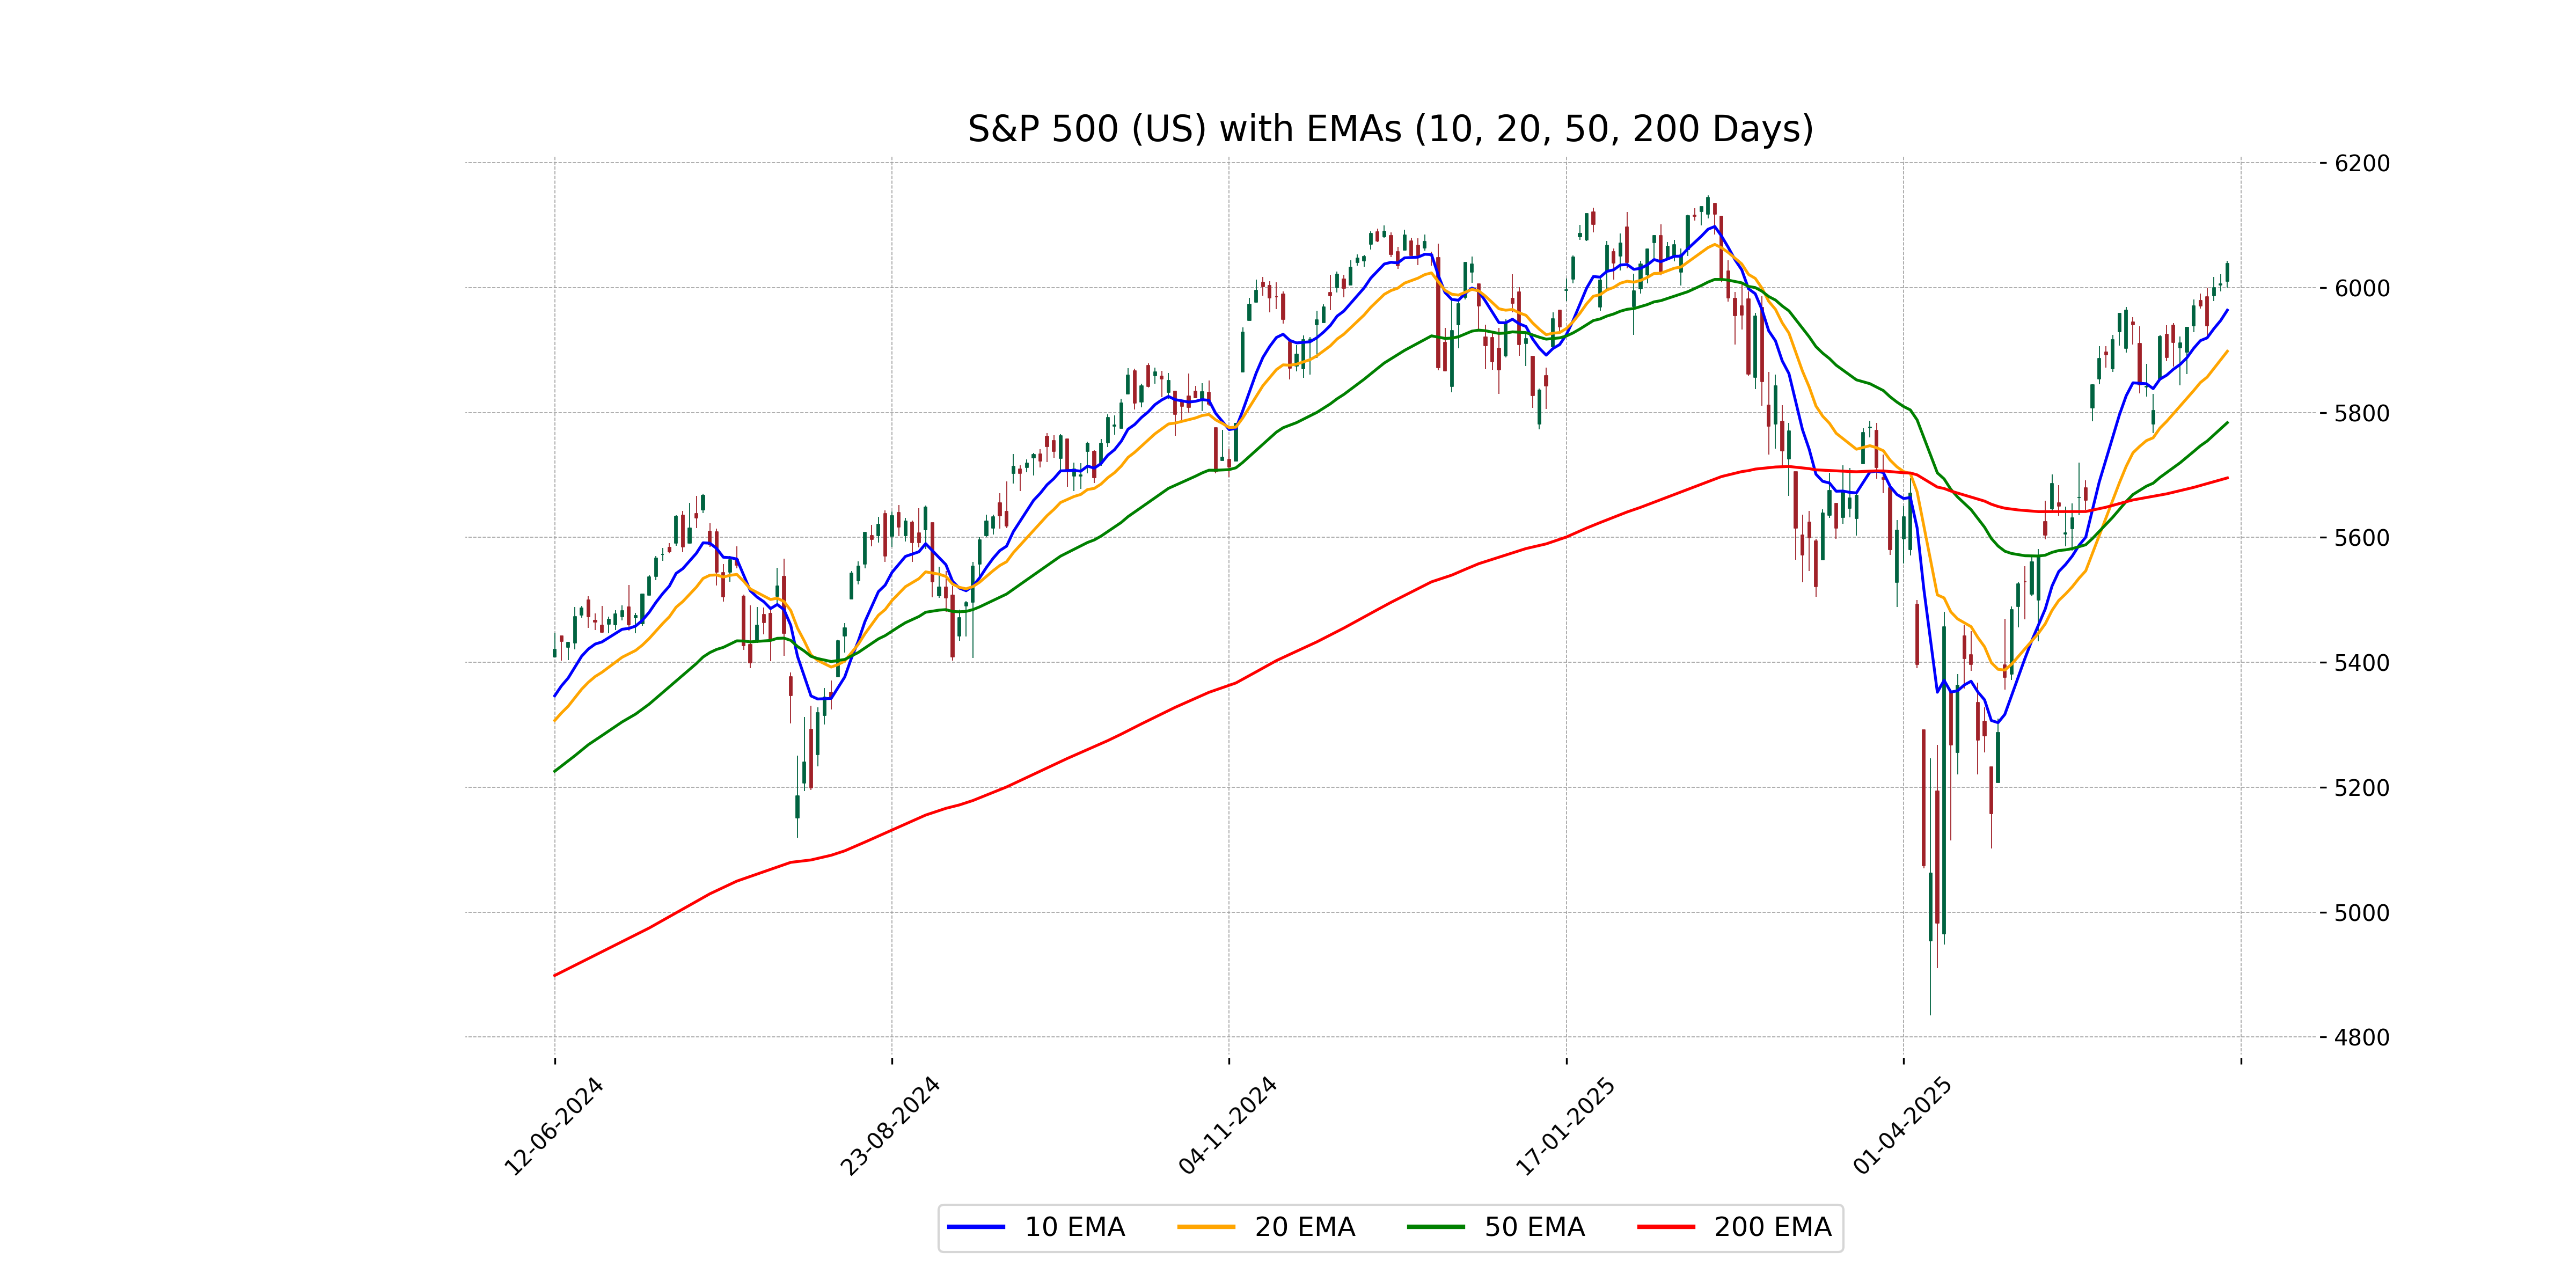
Relationship with Key Moving Averages
The S&P 500 is trading above its key moving averages: the 50-day EMA (5783.83) and the 200-day EMA (5695.30), indicating a bullish trend. Additionally, it is above the 10-day EMA (5963.89) and the 20-day EMA (5898.08), suggesting a recent upward momentum.
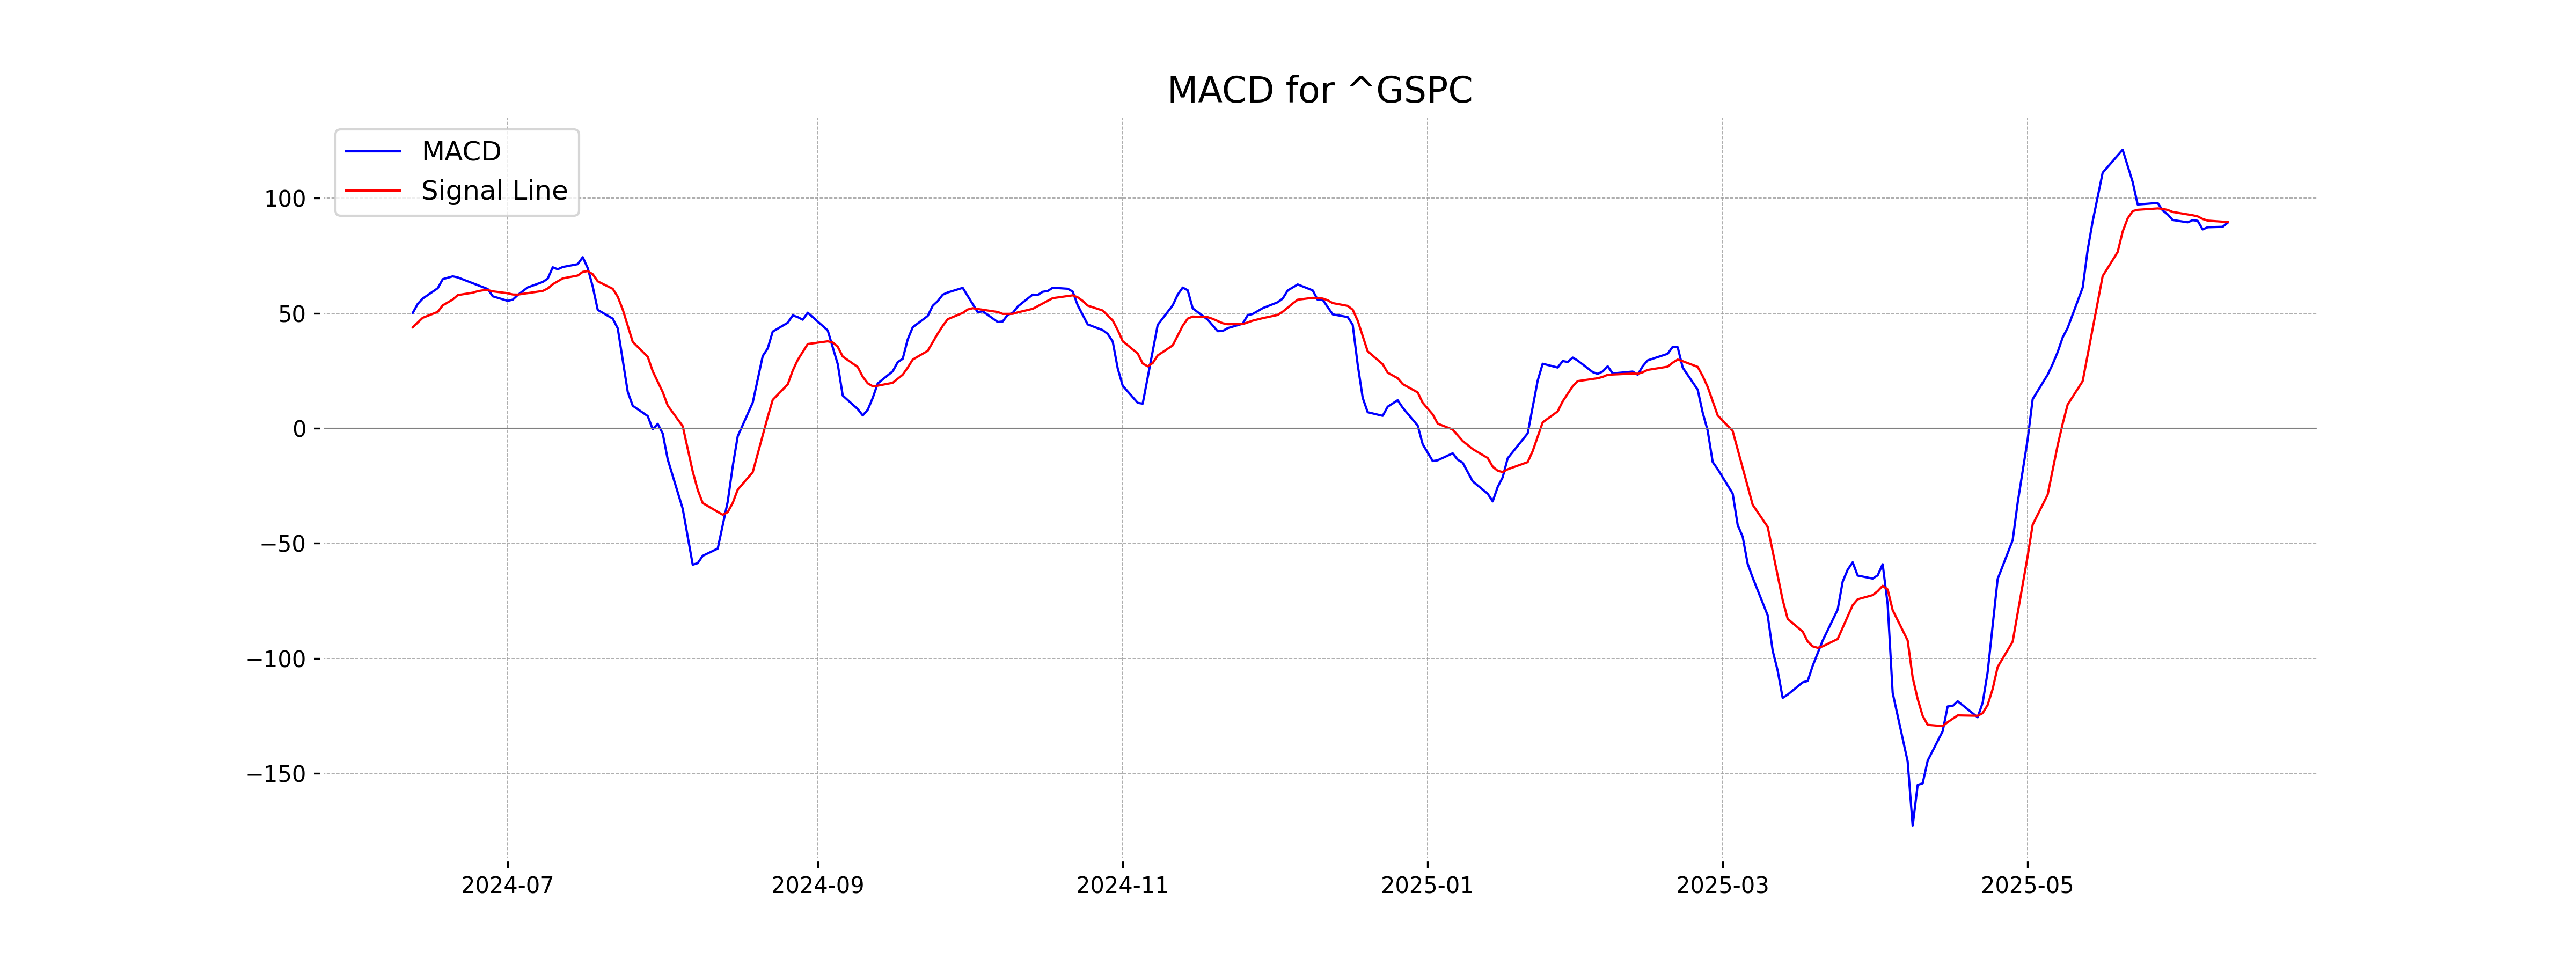
Moving Averages Trend (MACD)
The MACD for the S&P 500 is slightly below its signal line, with a MACD value of 89.35 compared to a MACD Signal of 89.65. This indicates a potential bearish momentum as the MACD line is turning downward.
RSI Analysis
The Relative Strength Index (RSI) for S&P 500 (US) is 67.50, indicating that the stock is approaching overbought territory. An RSI above 70 typically signals overbought conditions, suggesting potential for a price correction if the trend persists.
Analysis for Hang Seng Index (Hong Kong) - June 11, 2025
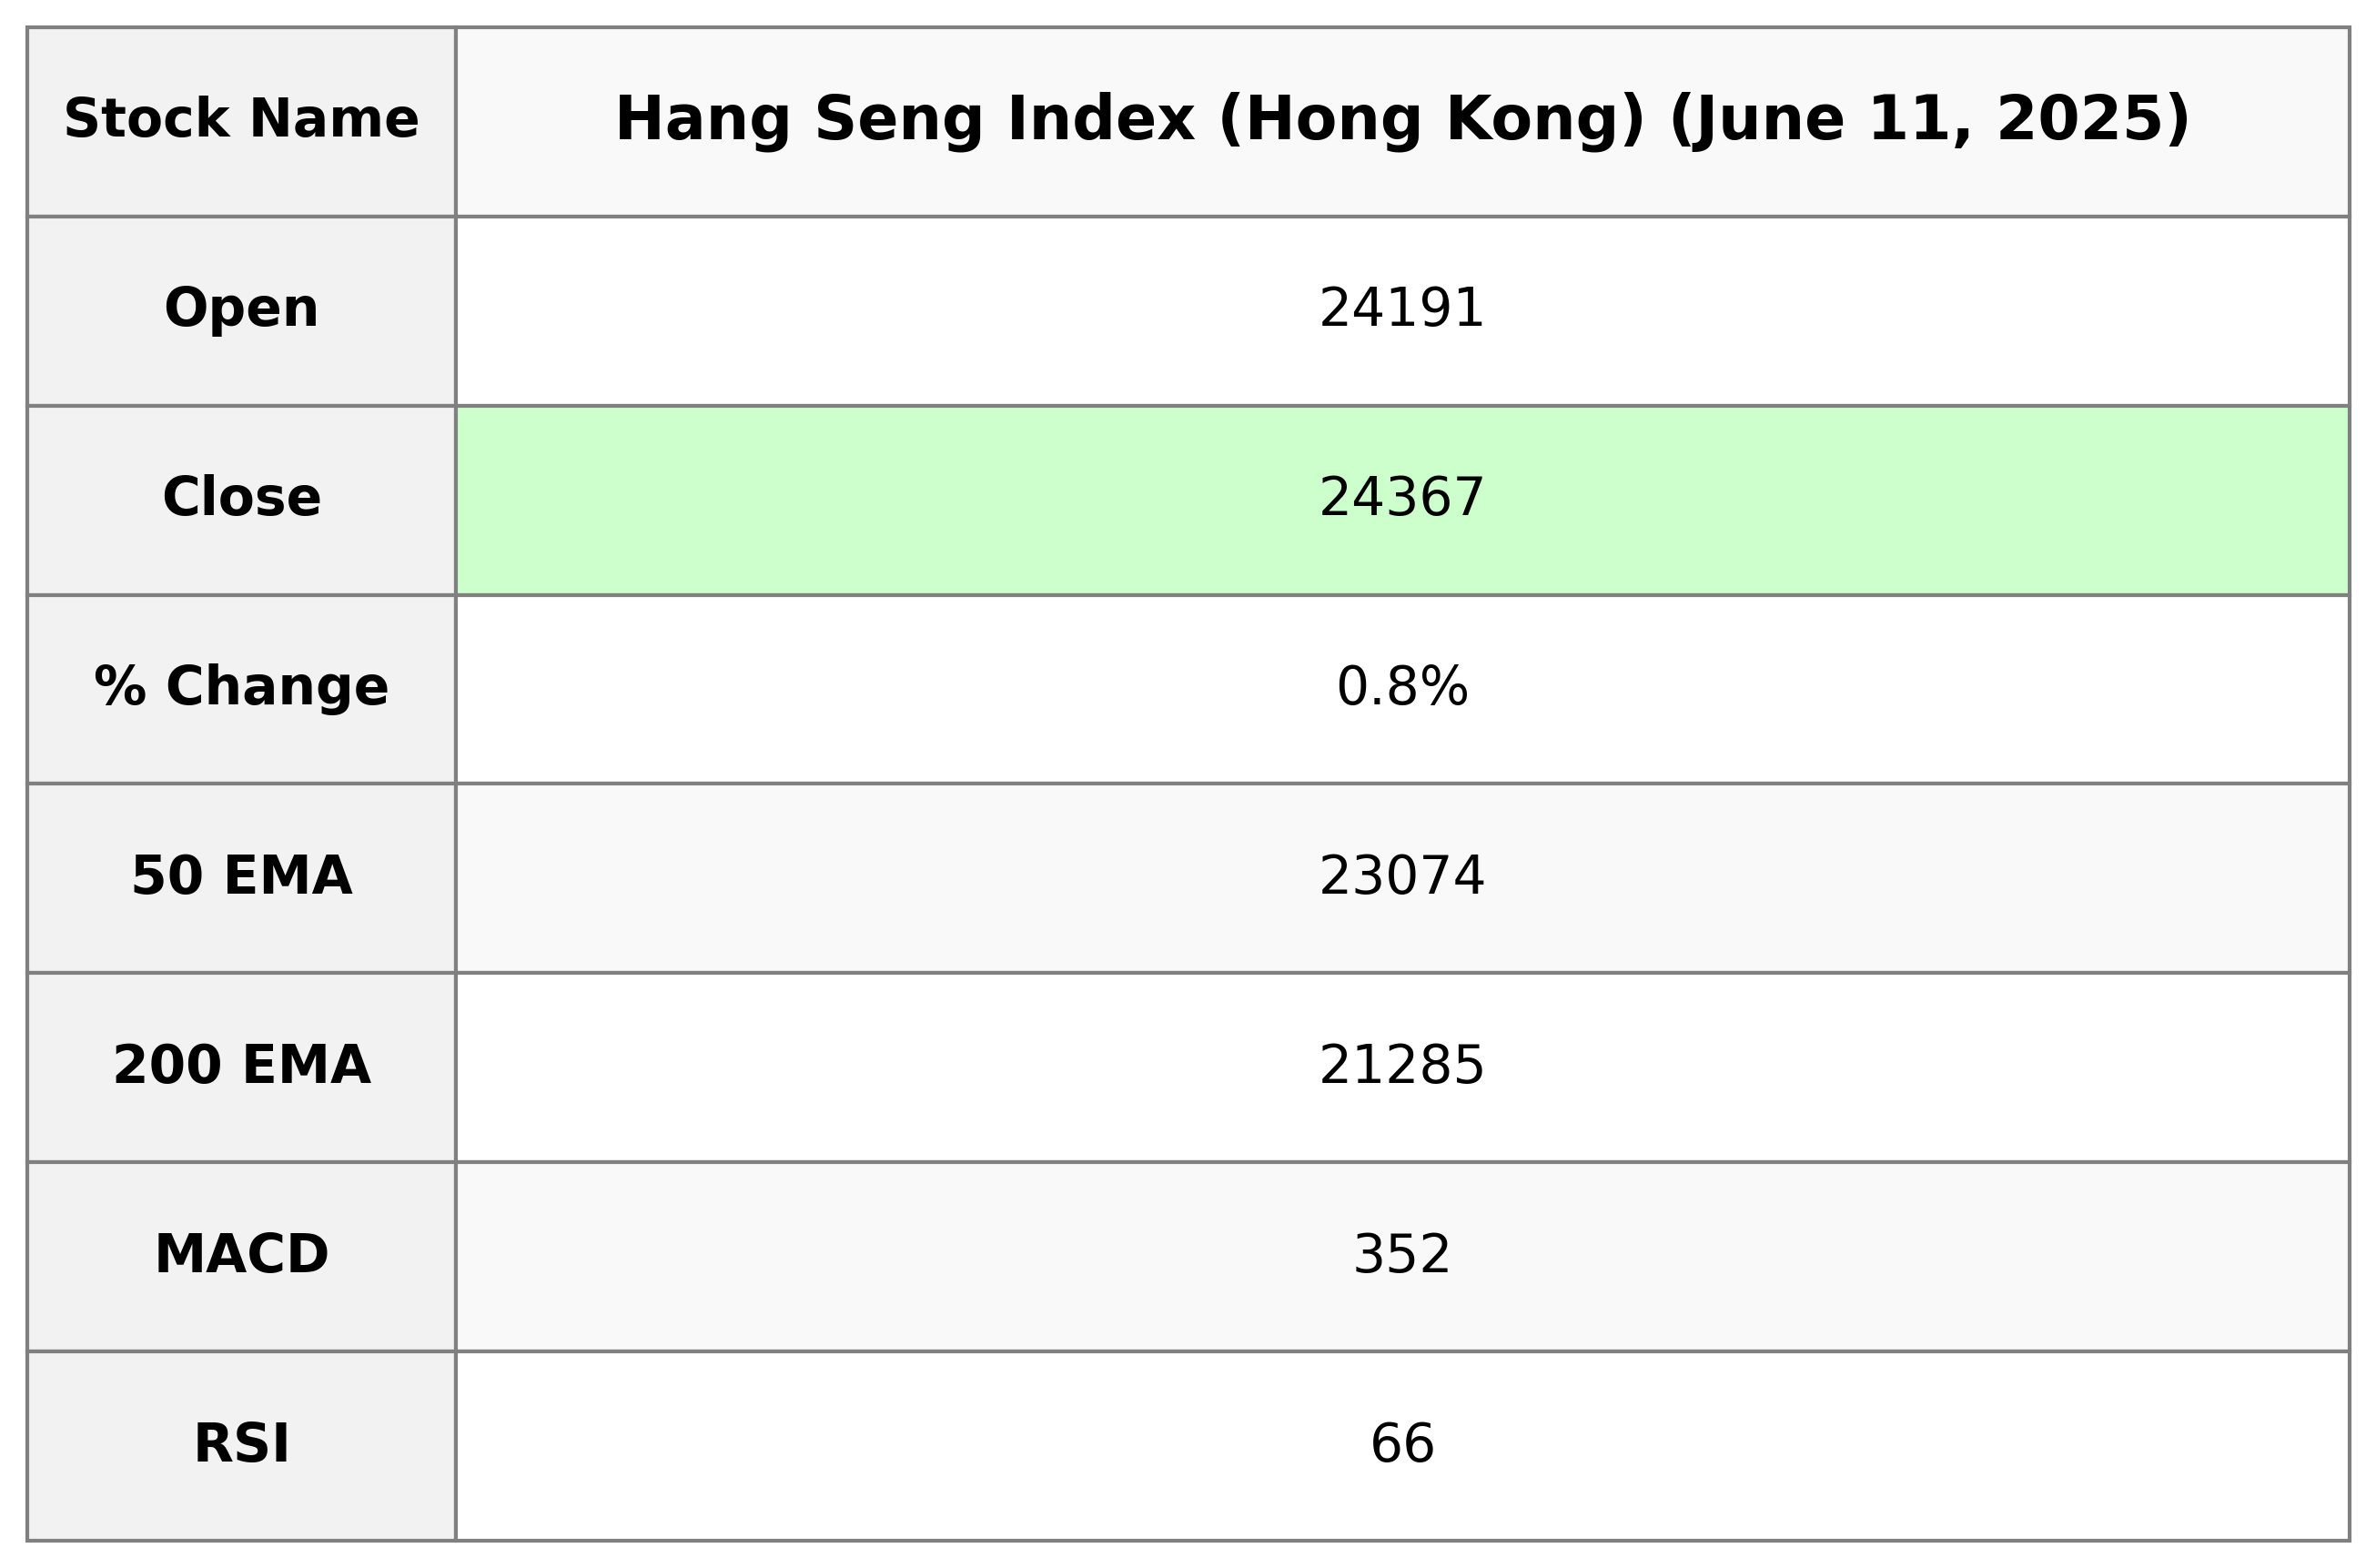
The Hang Seng Index (Hong Kong) opened at 24,191.32 and closed at 24,366.94, marking an increase of approximately 0.84%. It saw a high of 24,439.35 and a low of 24,179.35 during the trading session. The index displayed a positive momentum with a points change of 204.07, indicative of bullish sentiment, supported by a MACD greater than its signal and an RSI of 66.07, suggesting the index is nearing overbought levels.
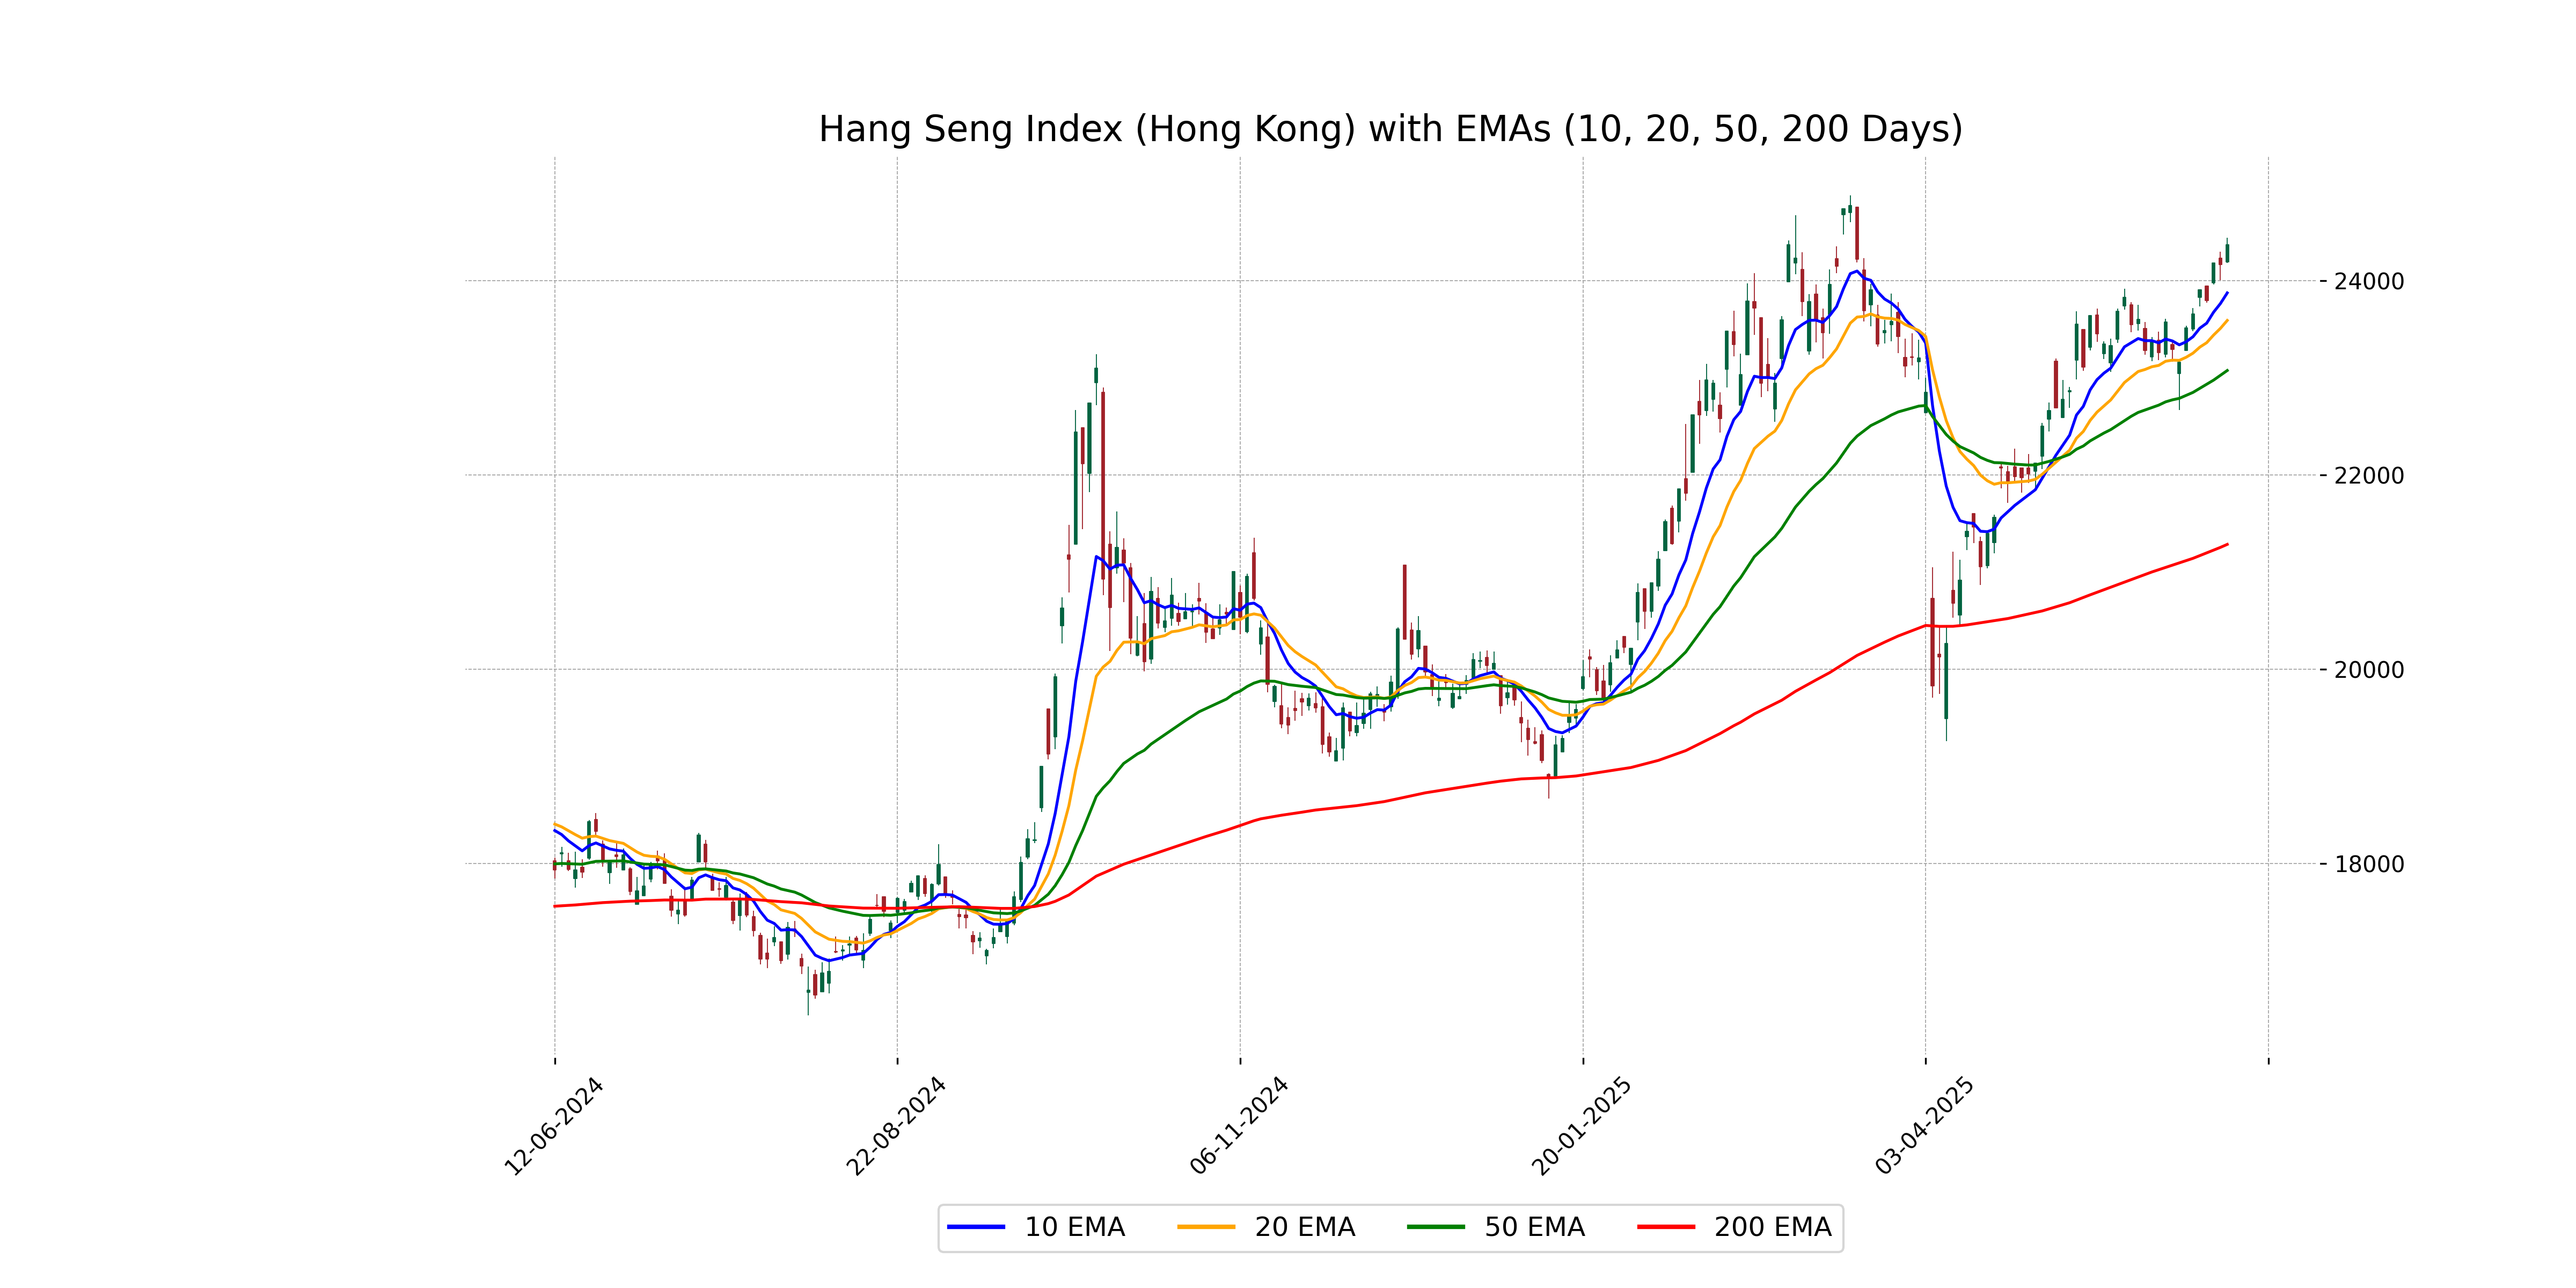
Relationship with Key Moving Averages
The closing price of the Hang Seng Index is above key moving averages, with the close at 24366.94 compared to the 50 EMA of 23074.42, 200 EMA of 21285.42, 10 EMA of 23872.71, and 20 EMA of 23589.46. This suggests a bullish trend.
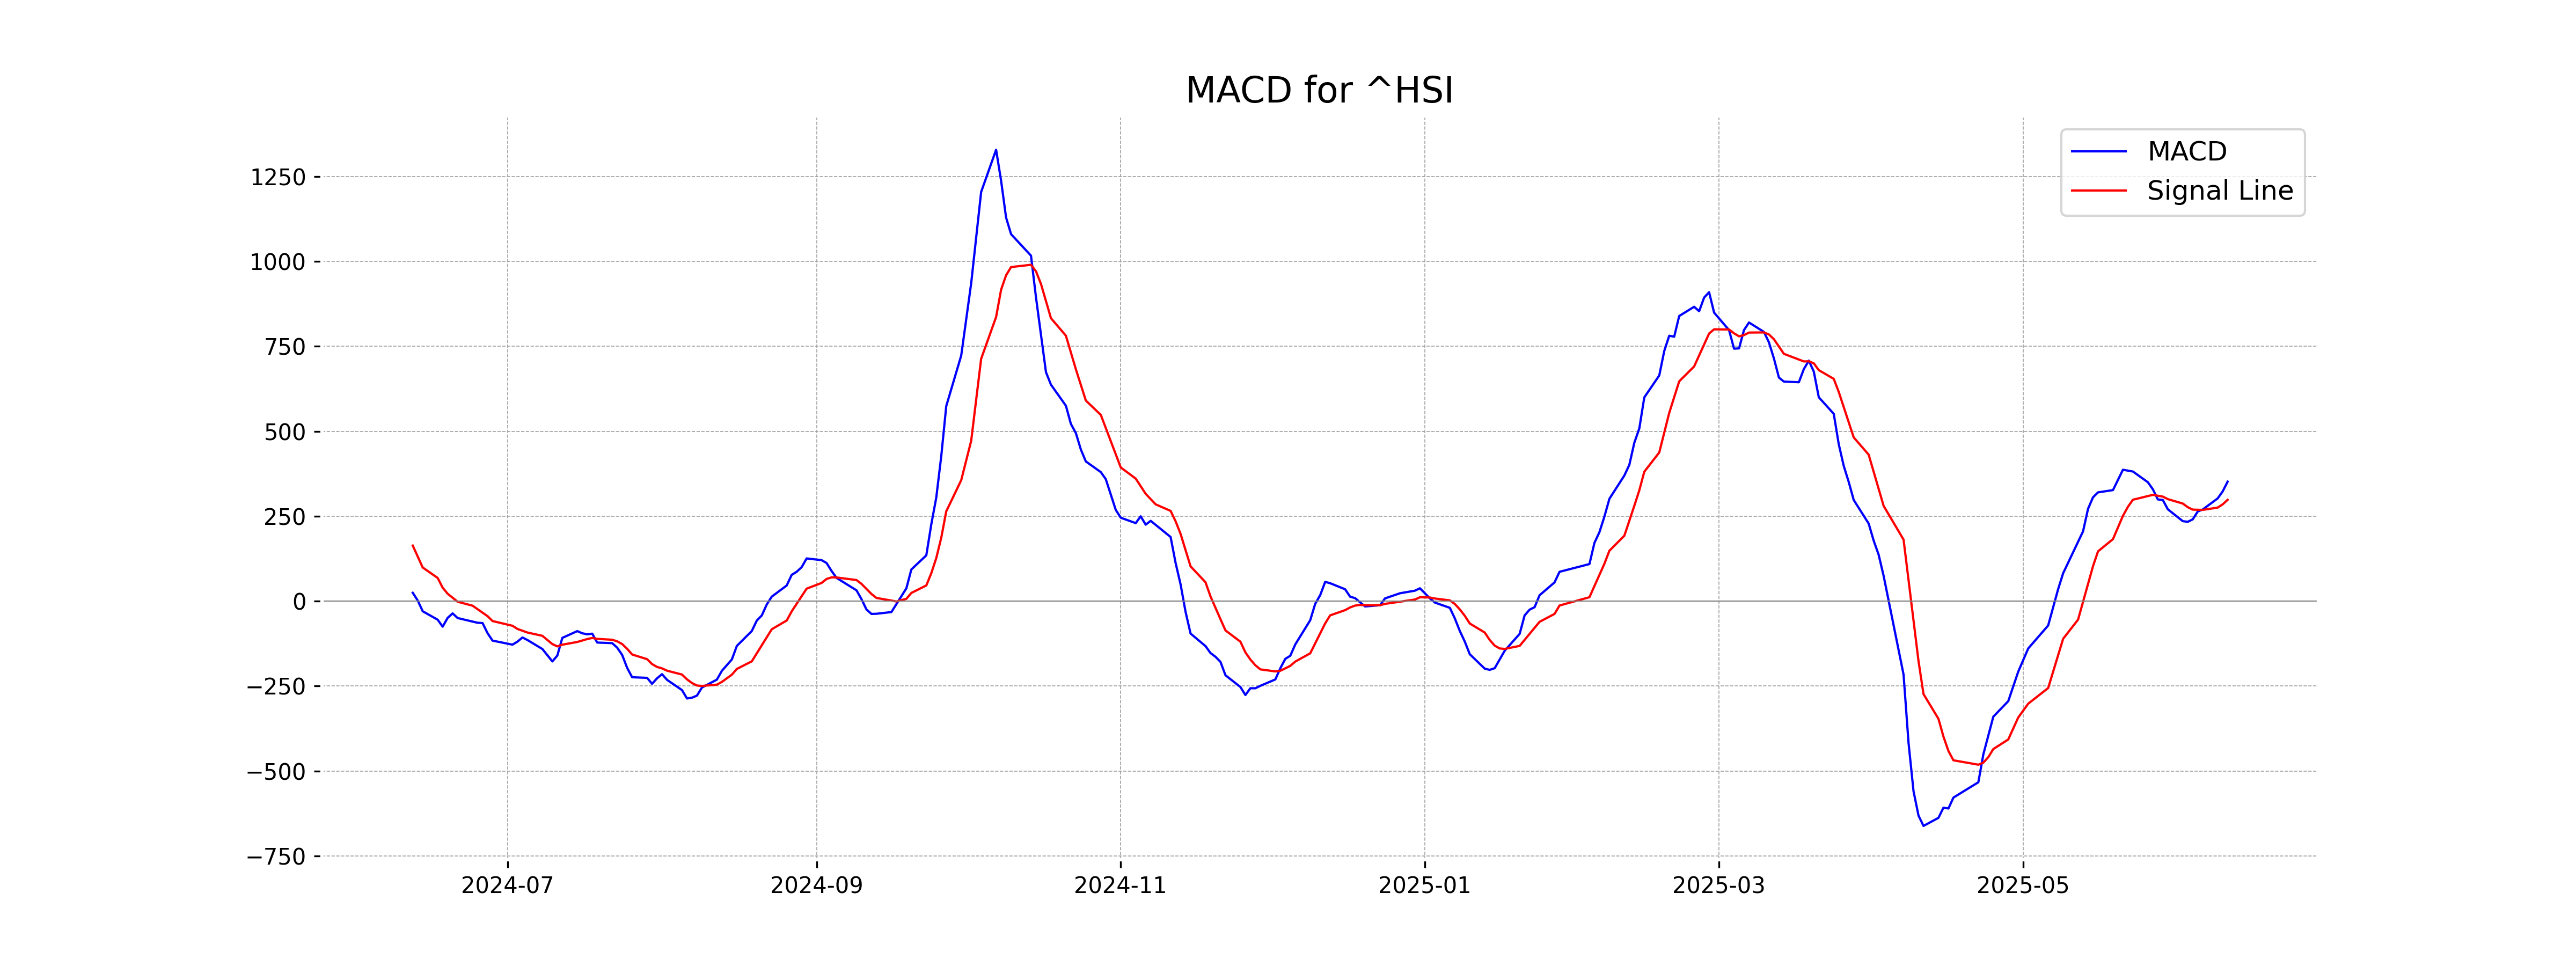
Moving Averages Trend (MACD)
The MACD value for the Hang Seng Index is 351.69, with a signal line of 298.17. This suggests a bullish momentum as the MACD line is above the signal line, which could indicate potential upward movement in the stock price.
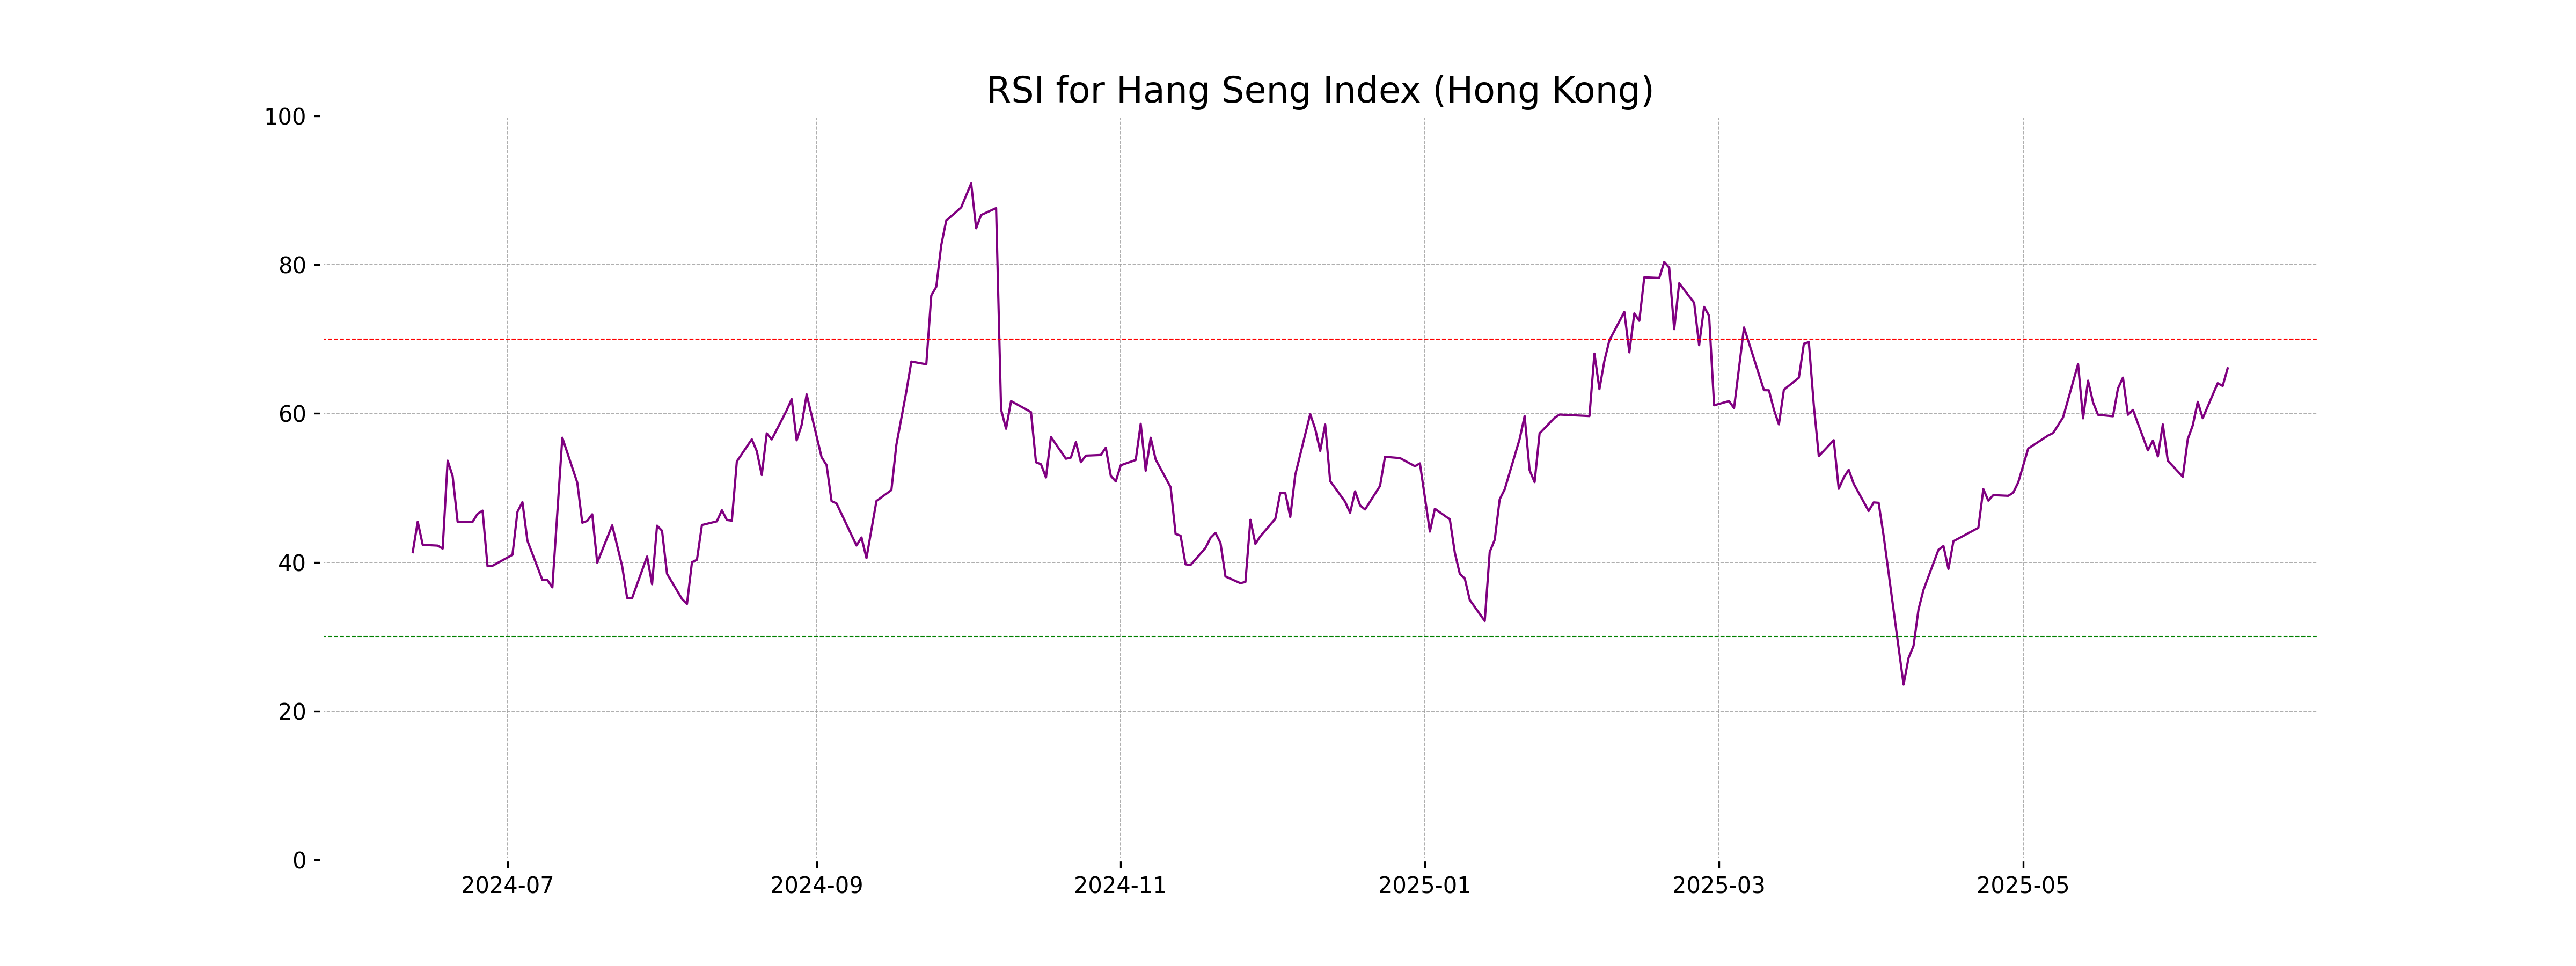
RSI Analysis
The RSI value for the Hang Seng Index is 66.07, which indicates that the index is approaching the overbought territory. An RSI above 70 typically suggests that a stock or index may be overvalued and a reversal or pullback could be imminent, while a value below 30 suggests it may be undervalued. Currently, 66.07 suggests bullish momentum but is nearing overbought levels.
Analysis for IBEX 35 (Spain) - June 11, 2025
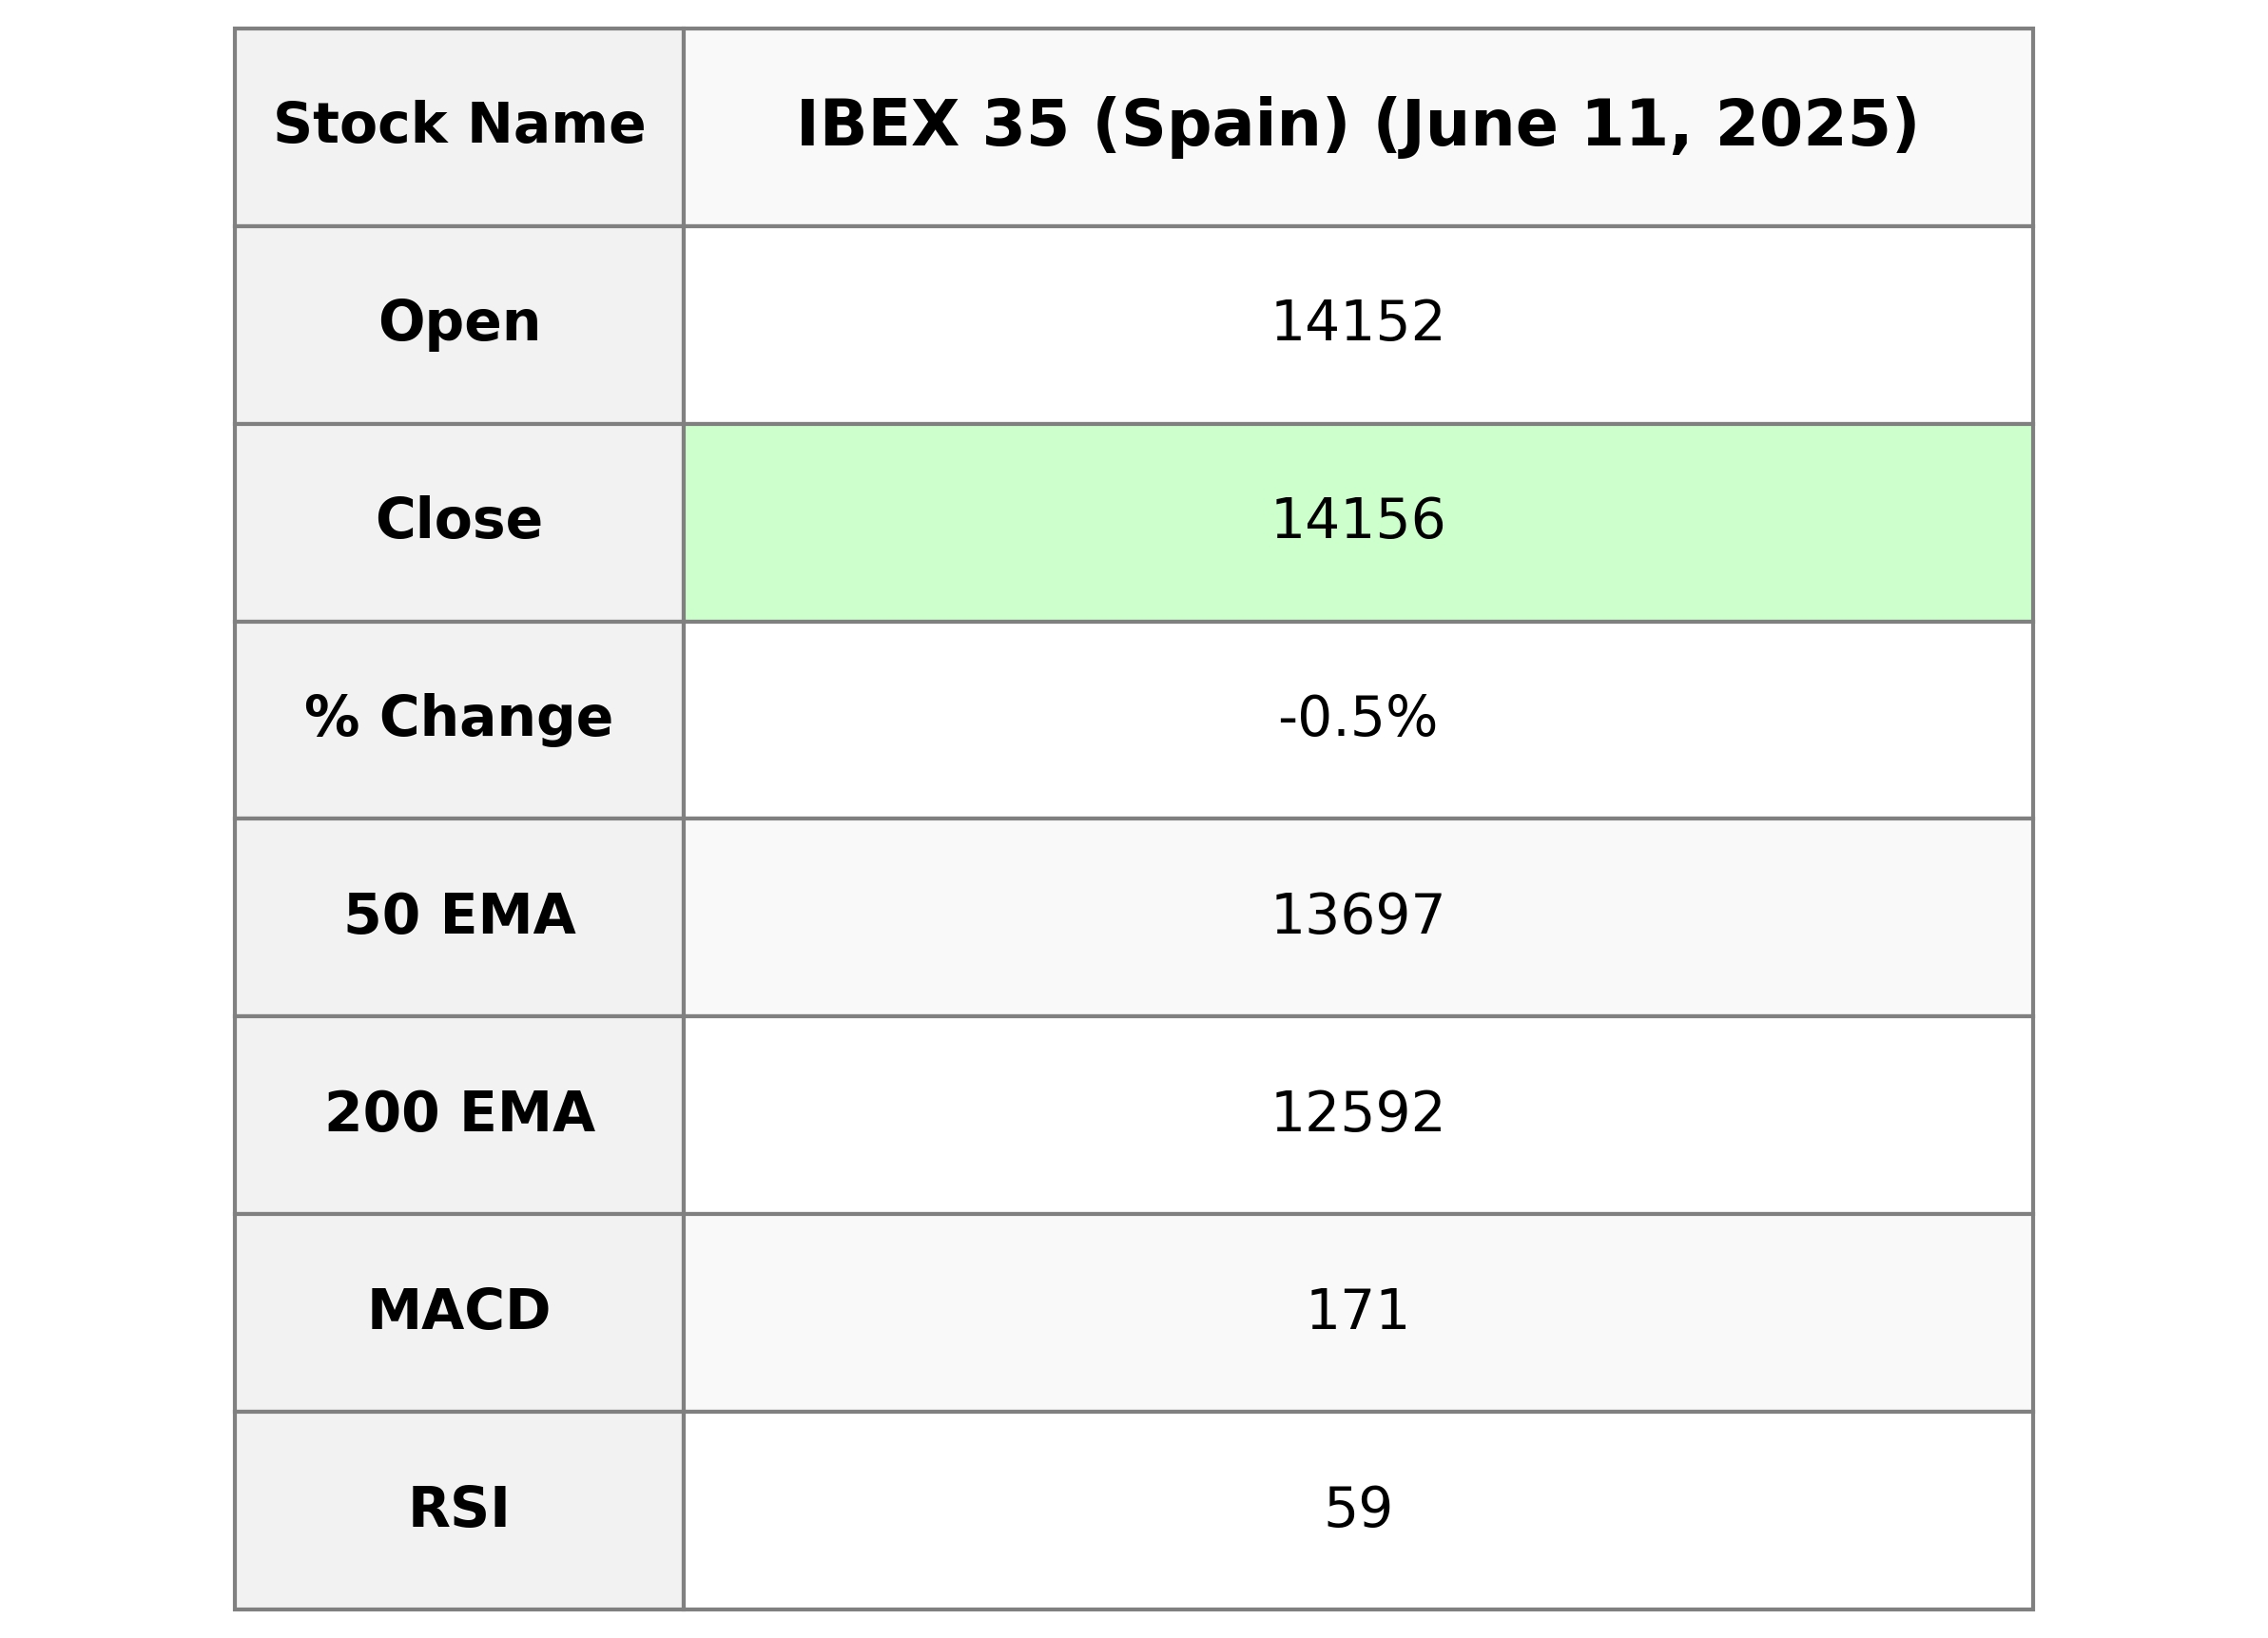
The IBEX 35 index opened at 14,152 and closed slightly lower at 14,156, which is a decrease of approximately 0.46% or 65.1 points from the previous close. The RSI value is 59.08, indicating a moderately strong trend, while the MACD suggests bearish momentum as it is below the MACD signal line. Trading volume was around 24,082,740 shares.
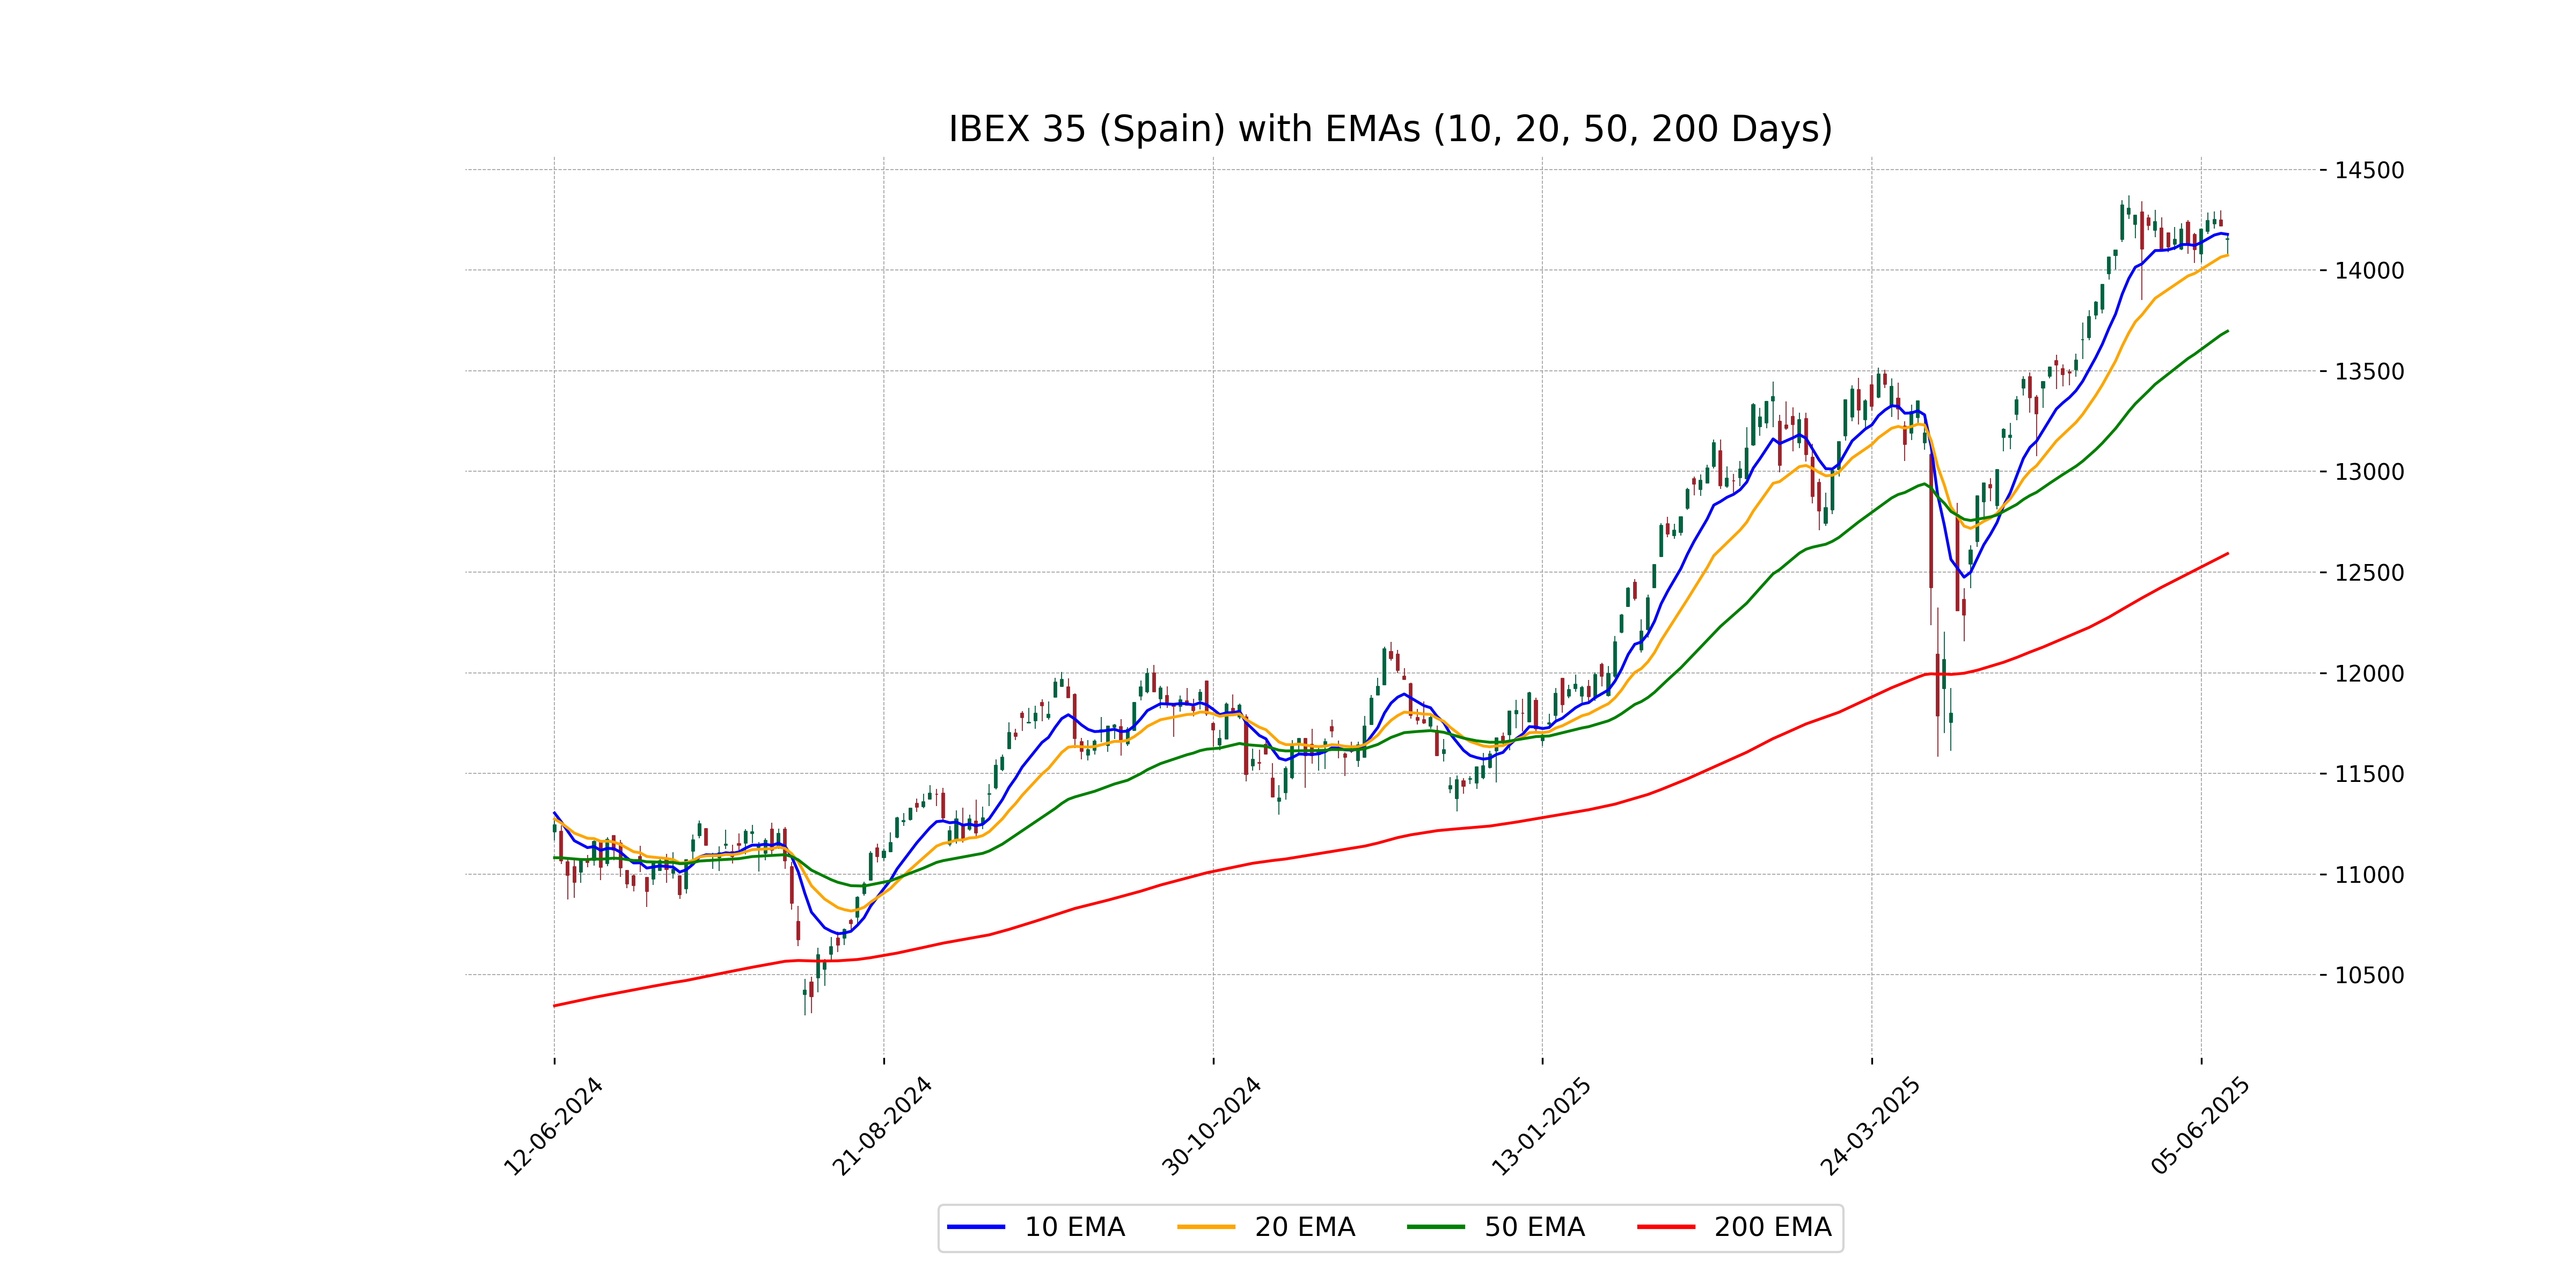
Relationship with Key Moving Averages
IBEX 35 opened and closed above its 50-day EMA of 13,697.16, indicating a potentially bullish short-term trend. However, the close was slightly below the 10-day EMA of 14,178.13, which might suggest a short-term resistance. The index also remained well above the longer-term 200-day EMA of 12,592.05, confirming a positive long-term trend.
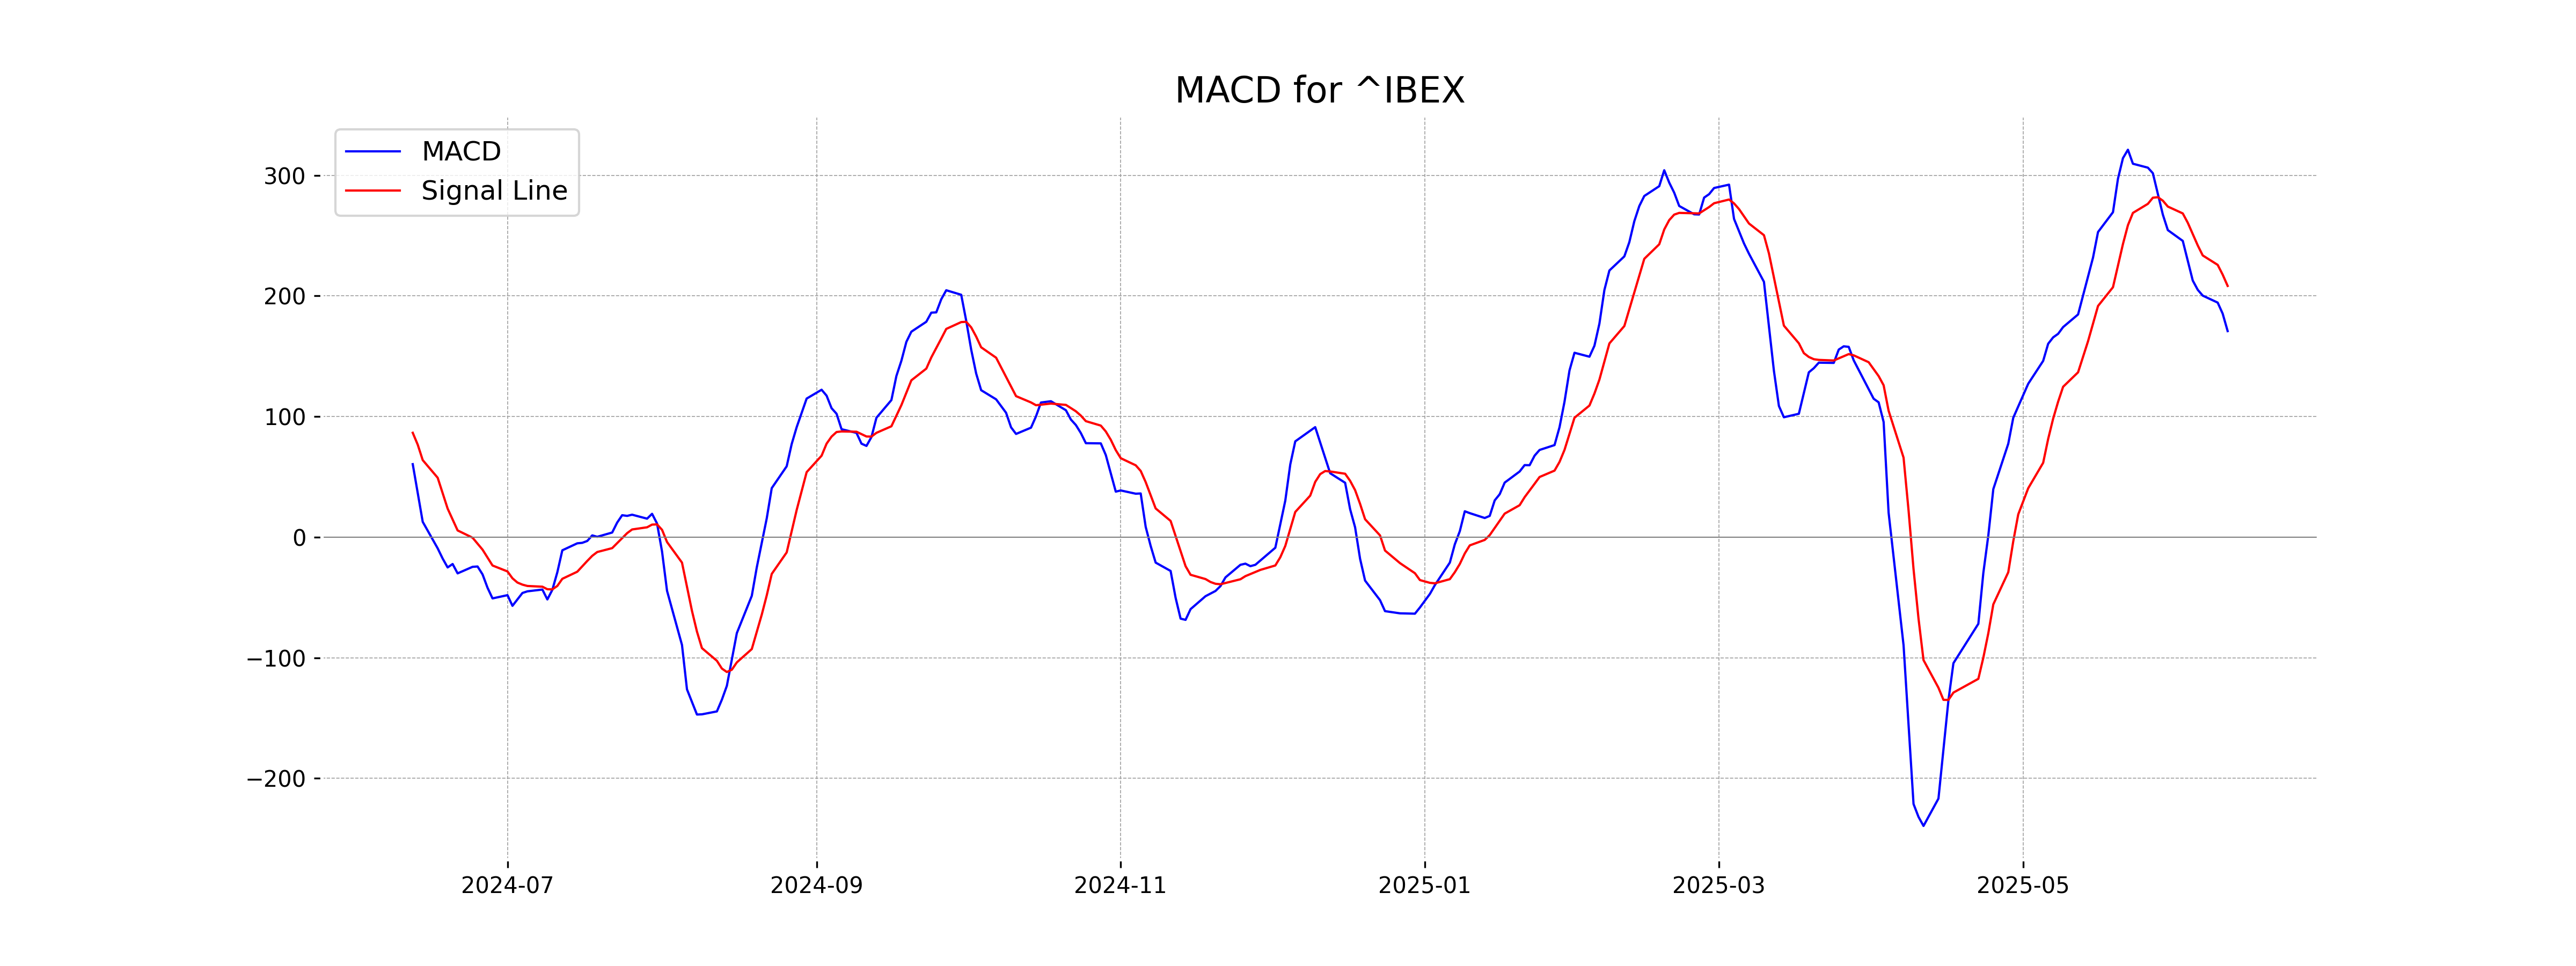
Moving Averages Trend (MACD)
The MACD value for IBEX 35 is 170.80, which is below its MACD Signal line of 208.26, suggesting a potential bearish indication. This could mean the index might experience downward momentum in the short term.
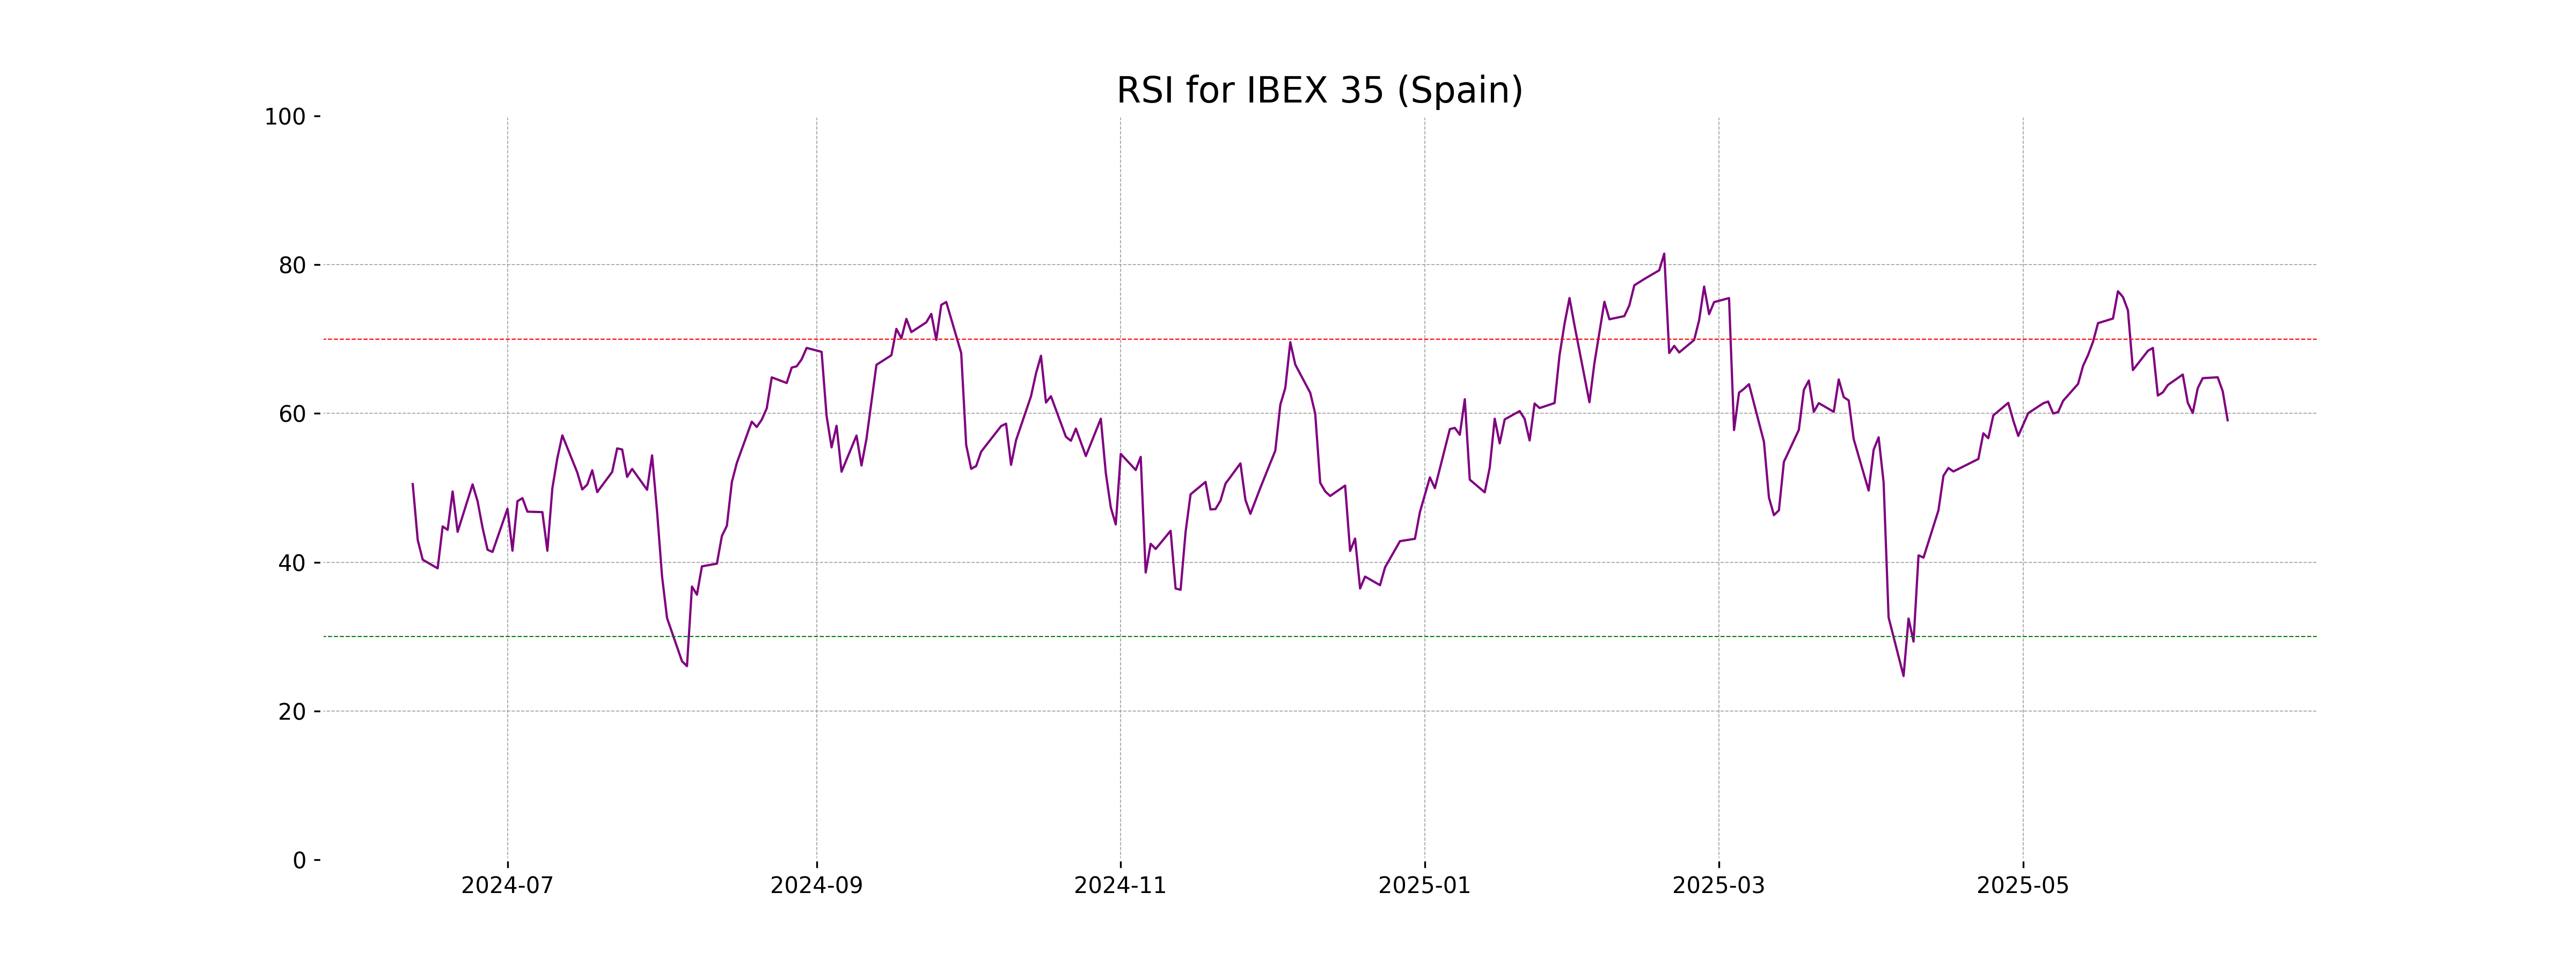
RSI Analysis
The IBEX 35 index currently has an RSI of 59.08, which suggests it is near the neutral zone but tending towards being overbought. This level does not indicate an immediate strong buy or sell signal but suggests watching for overbought conditions as it approaches higher RSI values.
Analysis for NASDAQ Composite (US) - June 11, 2025
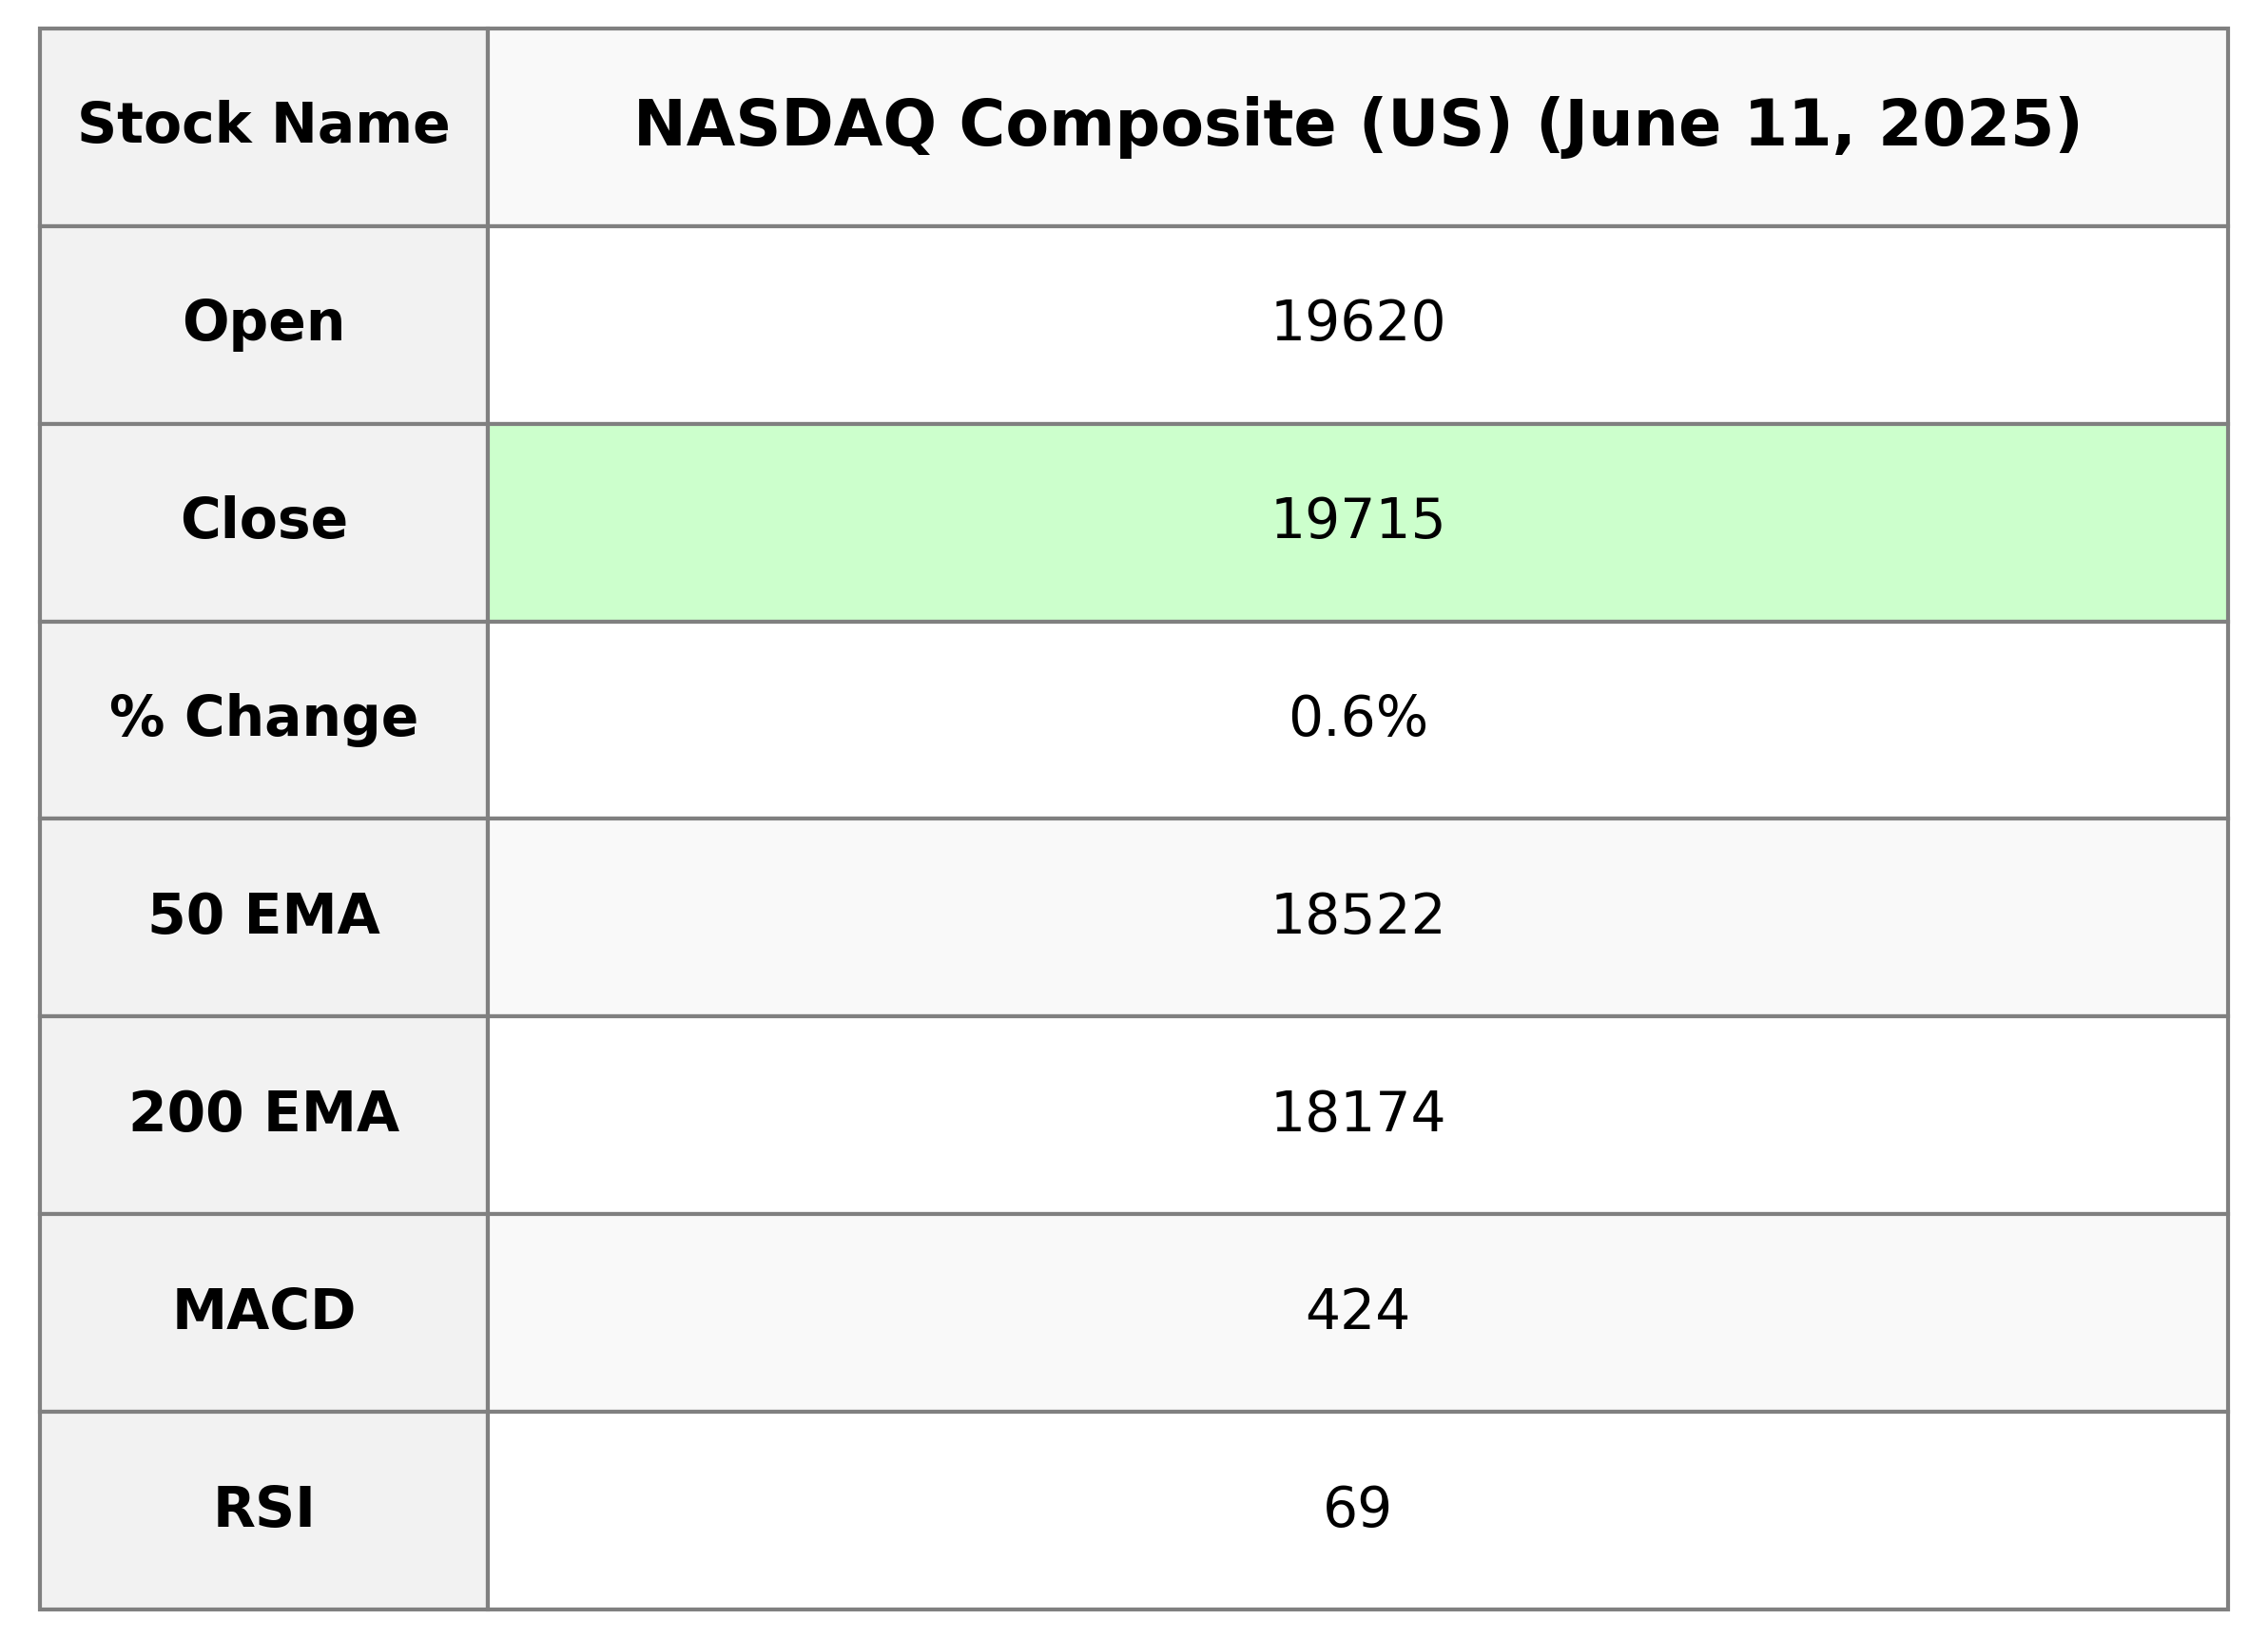
NASDAQ Composite (US) Performance: The NASDAQ Composite saw a positive movement with a % change of 0.63%, closing at 19,714.99 after an increase of 123.75 points from the previous close. The volume of shares traded was 11,221,560,000, indicating strong investor activity. The relative strength index (RSI) is at 69.11, suggesting the index is nearing an overbought condition.
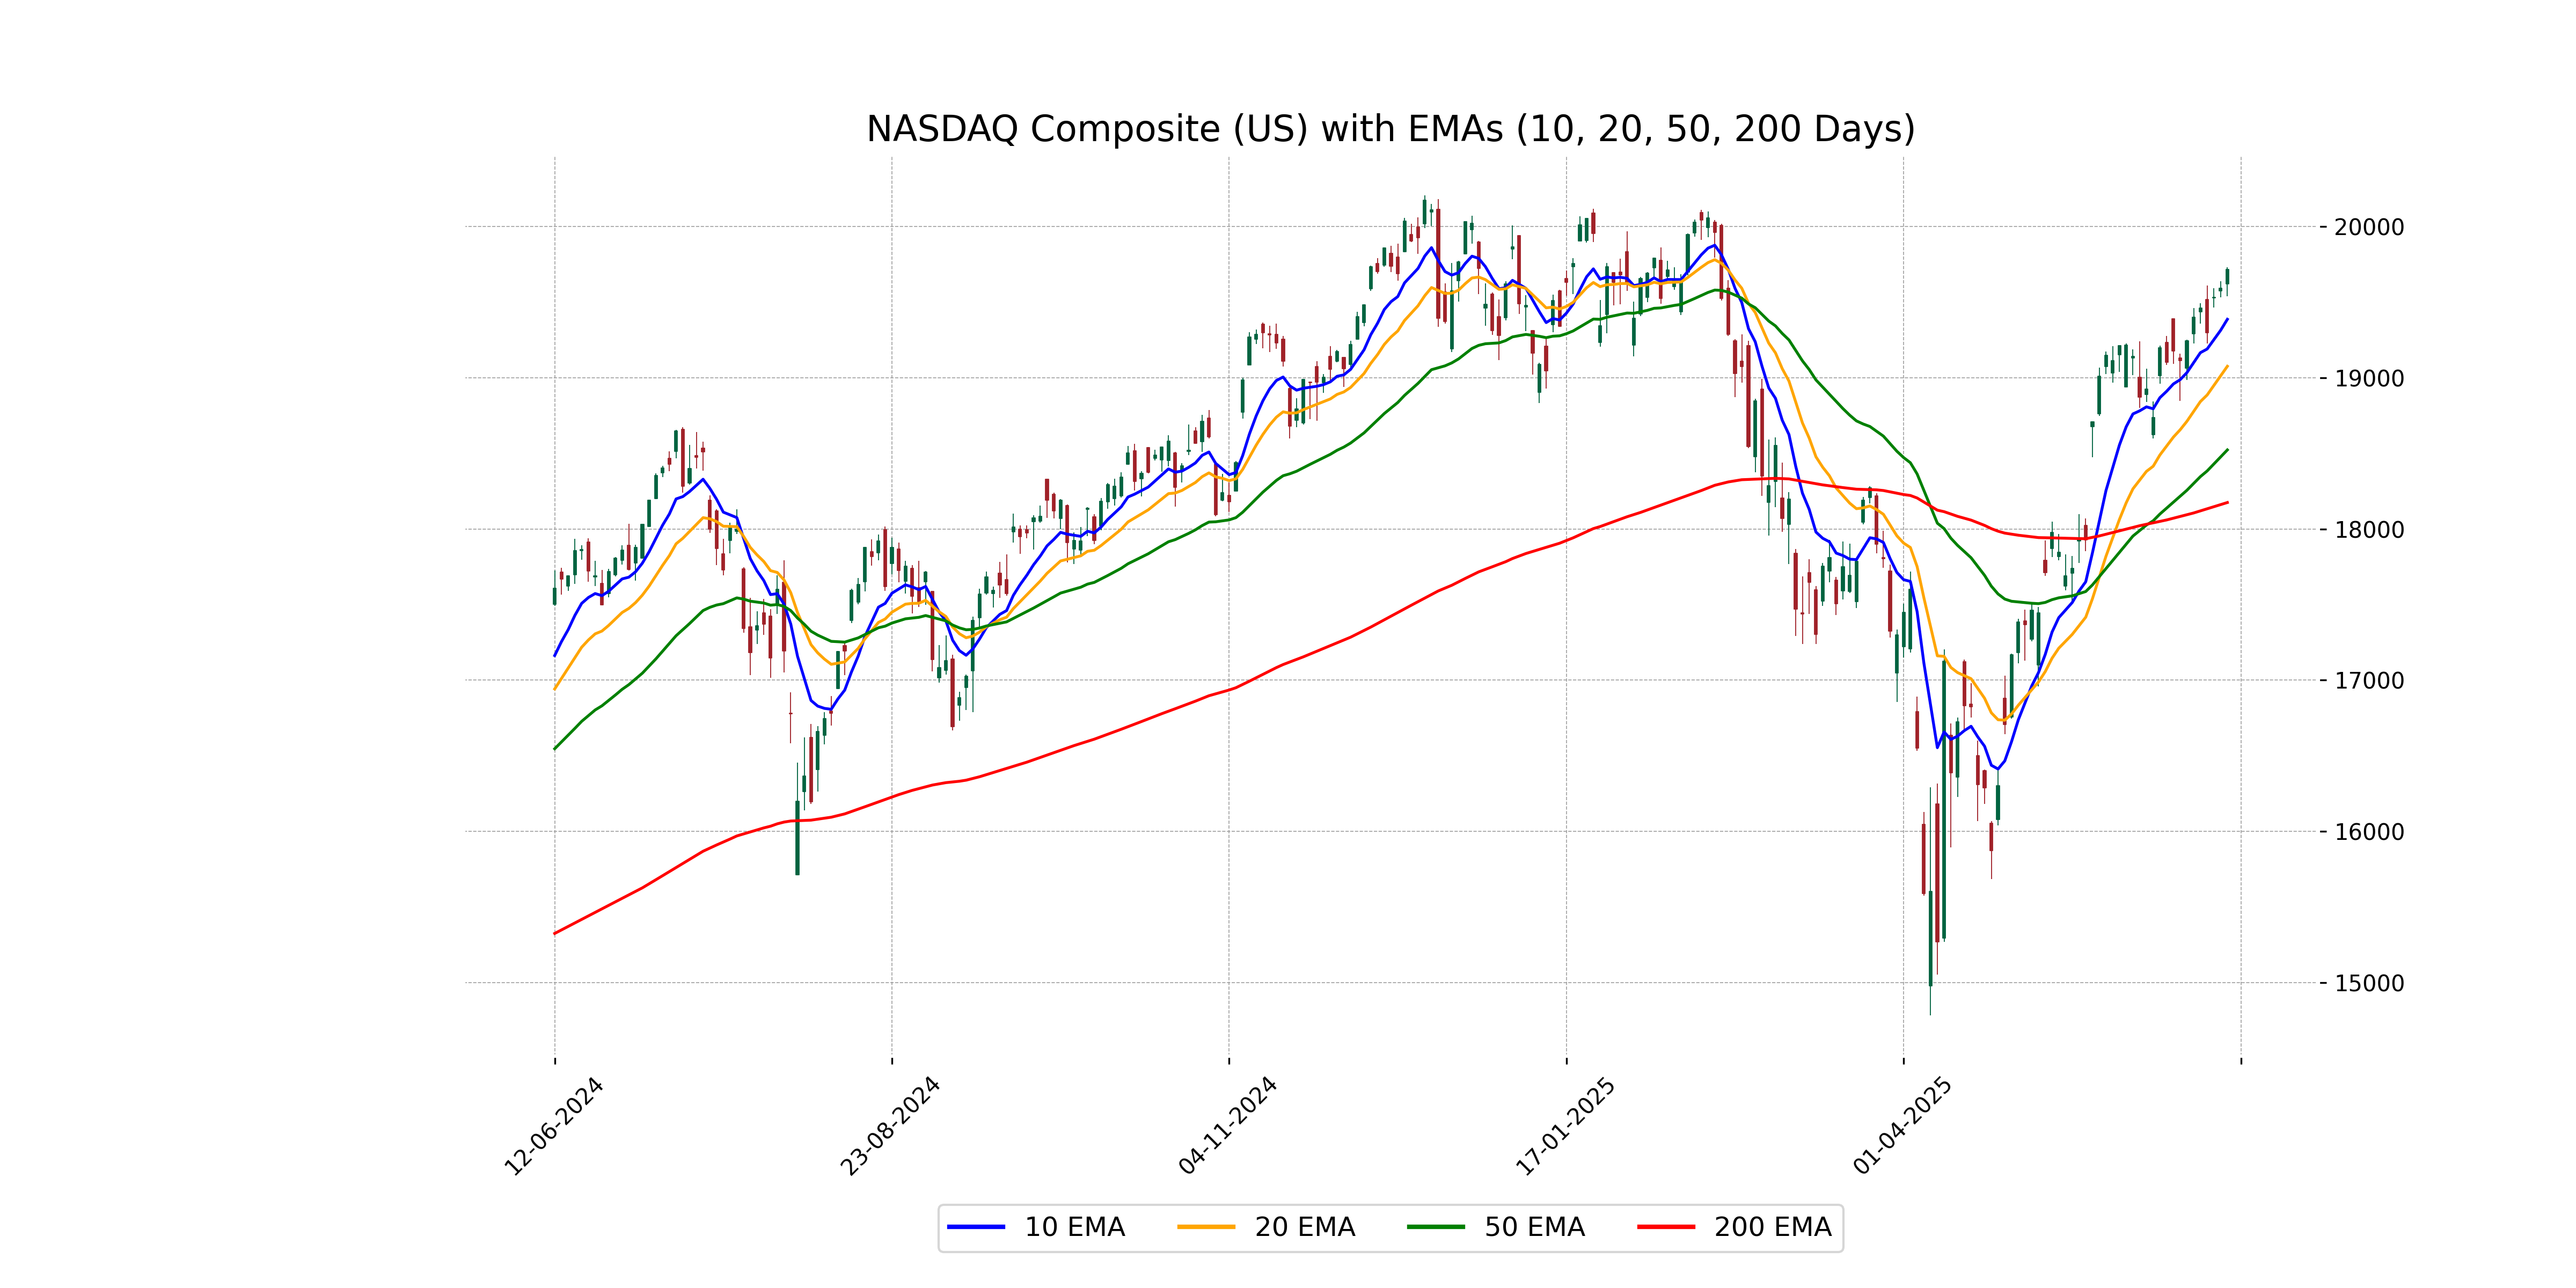
Relationship with Key Moving Averages
The NASDAQ Composite shows a strong upward momentum, as its current close of 19,714.99 is above the 10 EMA, 20 EMA, 50 EMA, and 200 EMA, all indicating a potential continuation of the bullish trend. Additionally, with an RSI of 69.11, the index is nearing overbought conditions, suggesting caution.
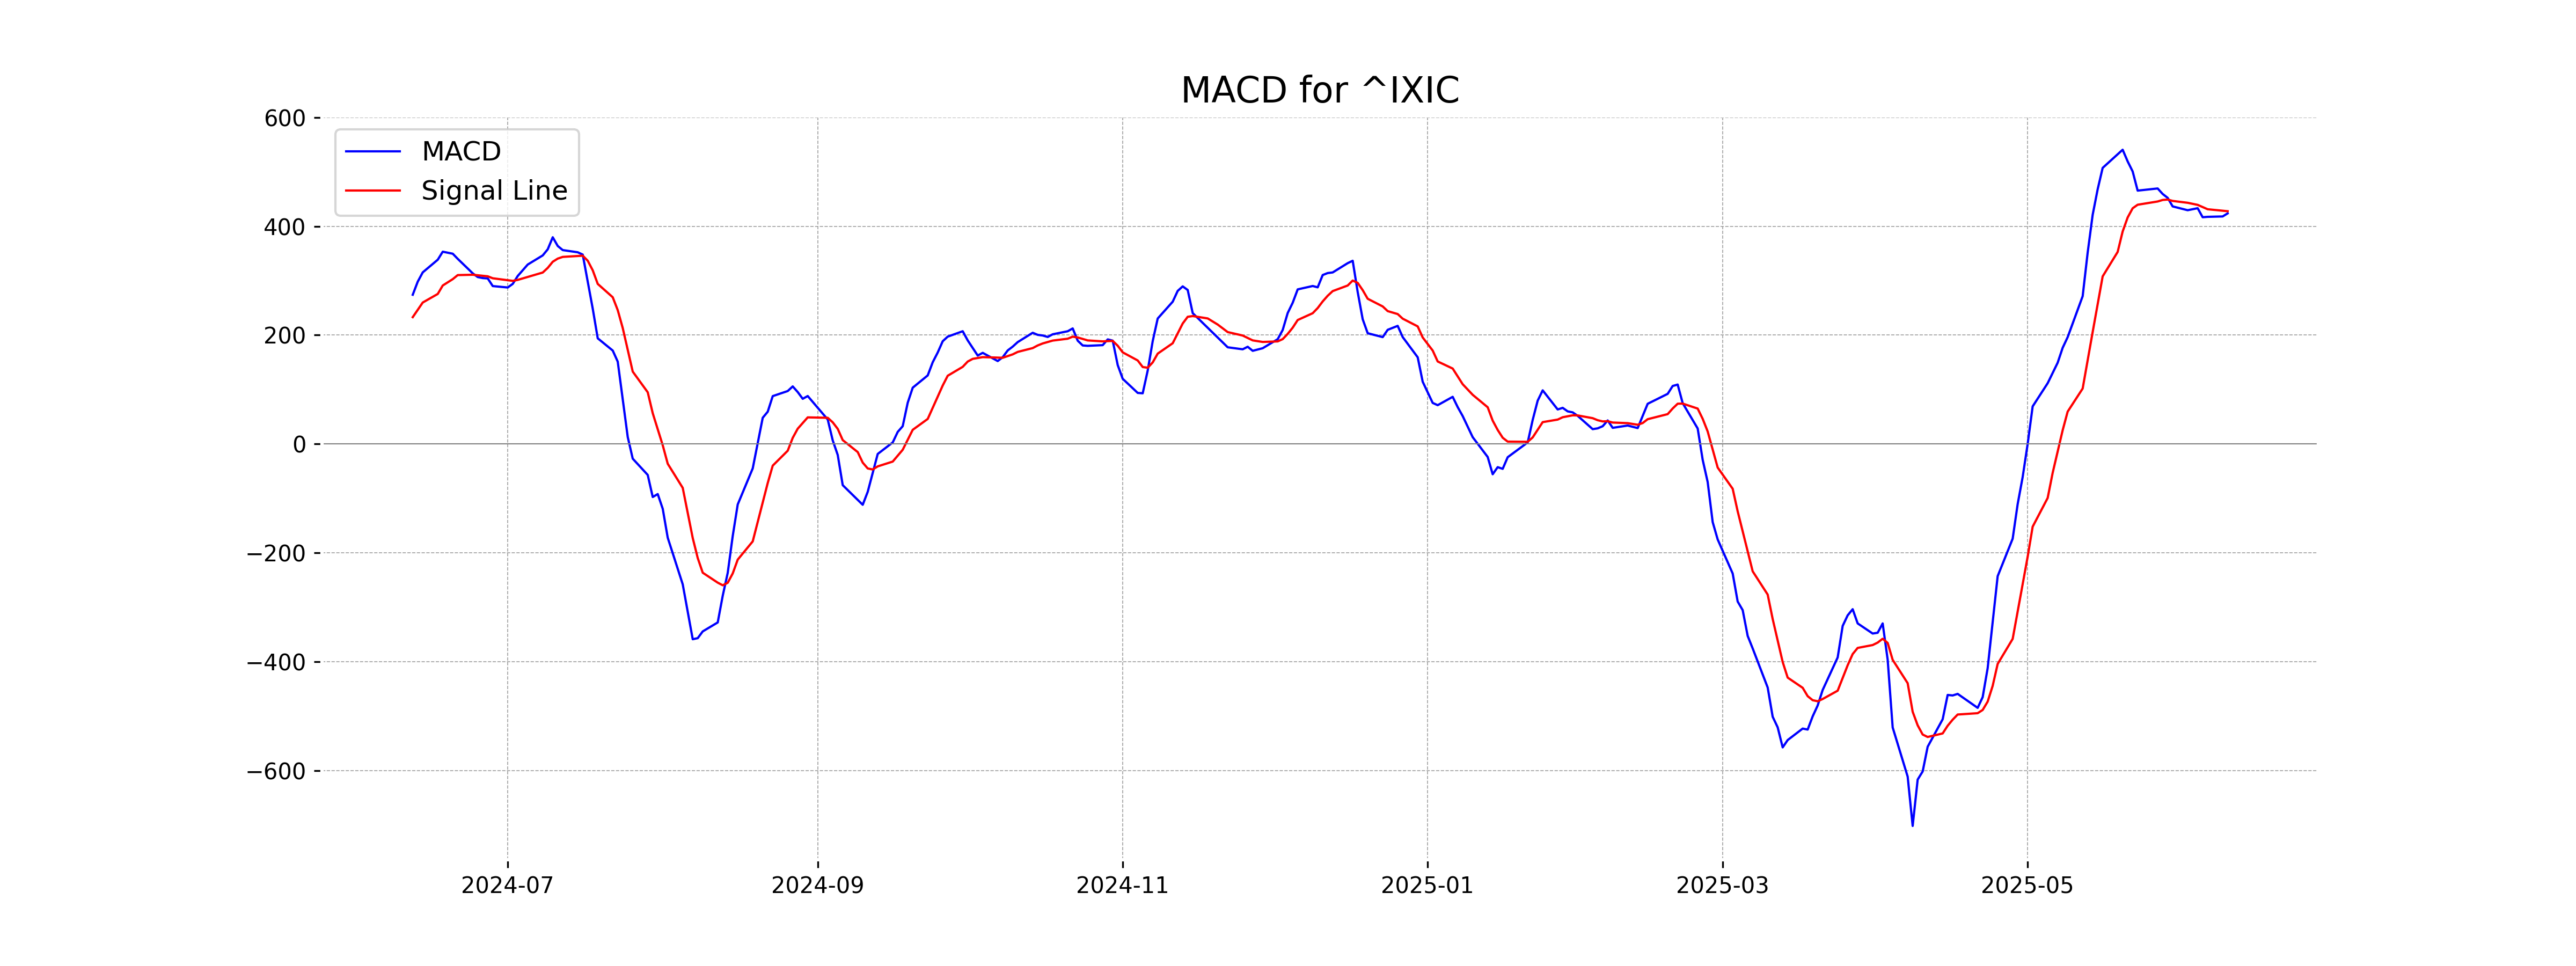
Moving Averages Trend (MACD)
For the NASDAQ Composite (US), the MACD is 423.63, which is slightly below the MACD Signal of 427.58. This indicates a potential slowing of upward momentum. Monitoring upcoming price movements could provide further insight into the trend direction.
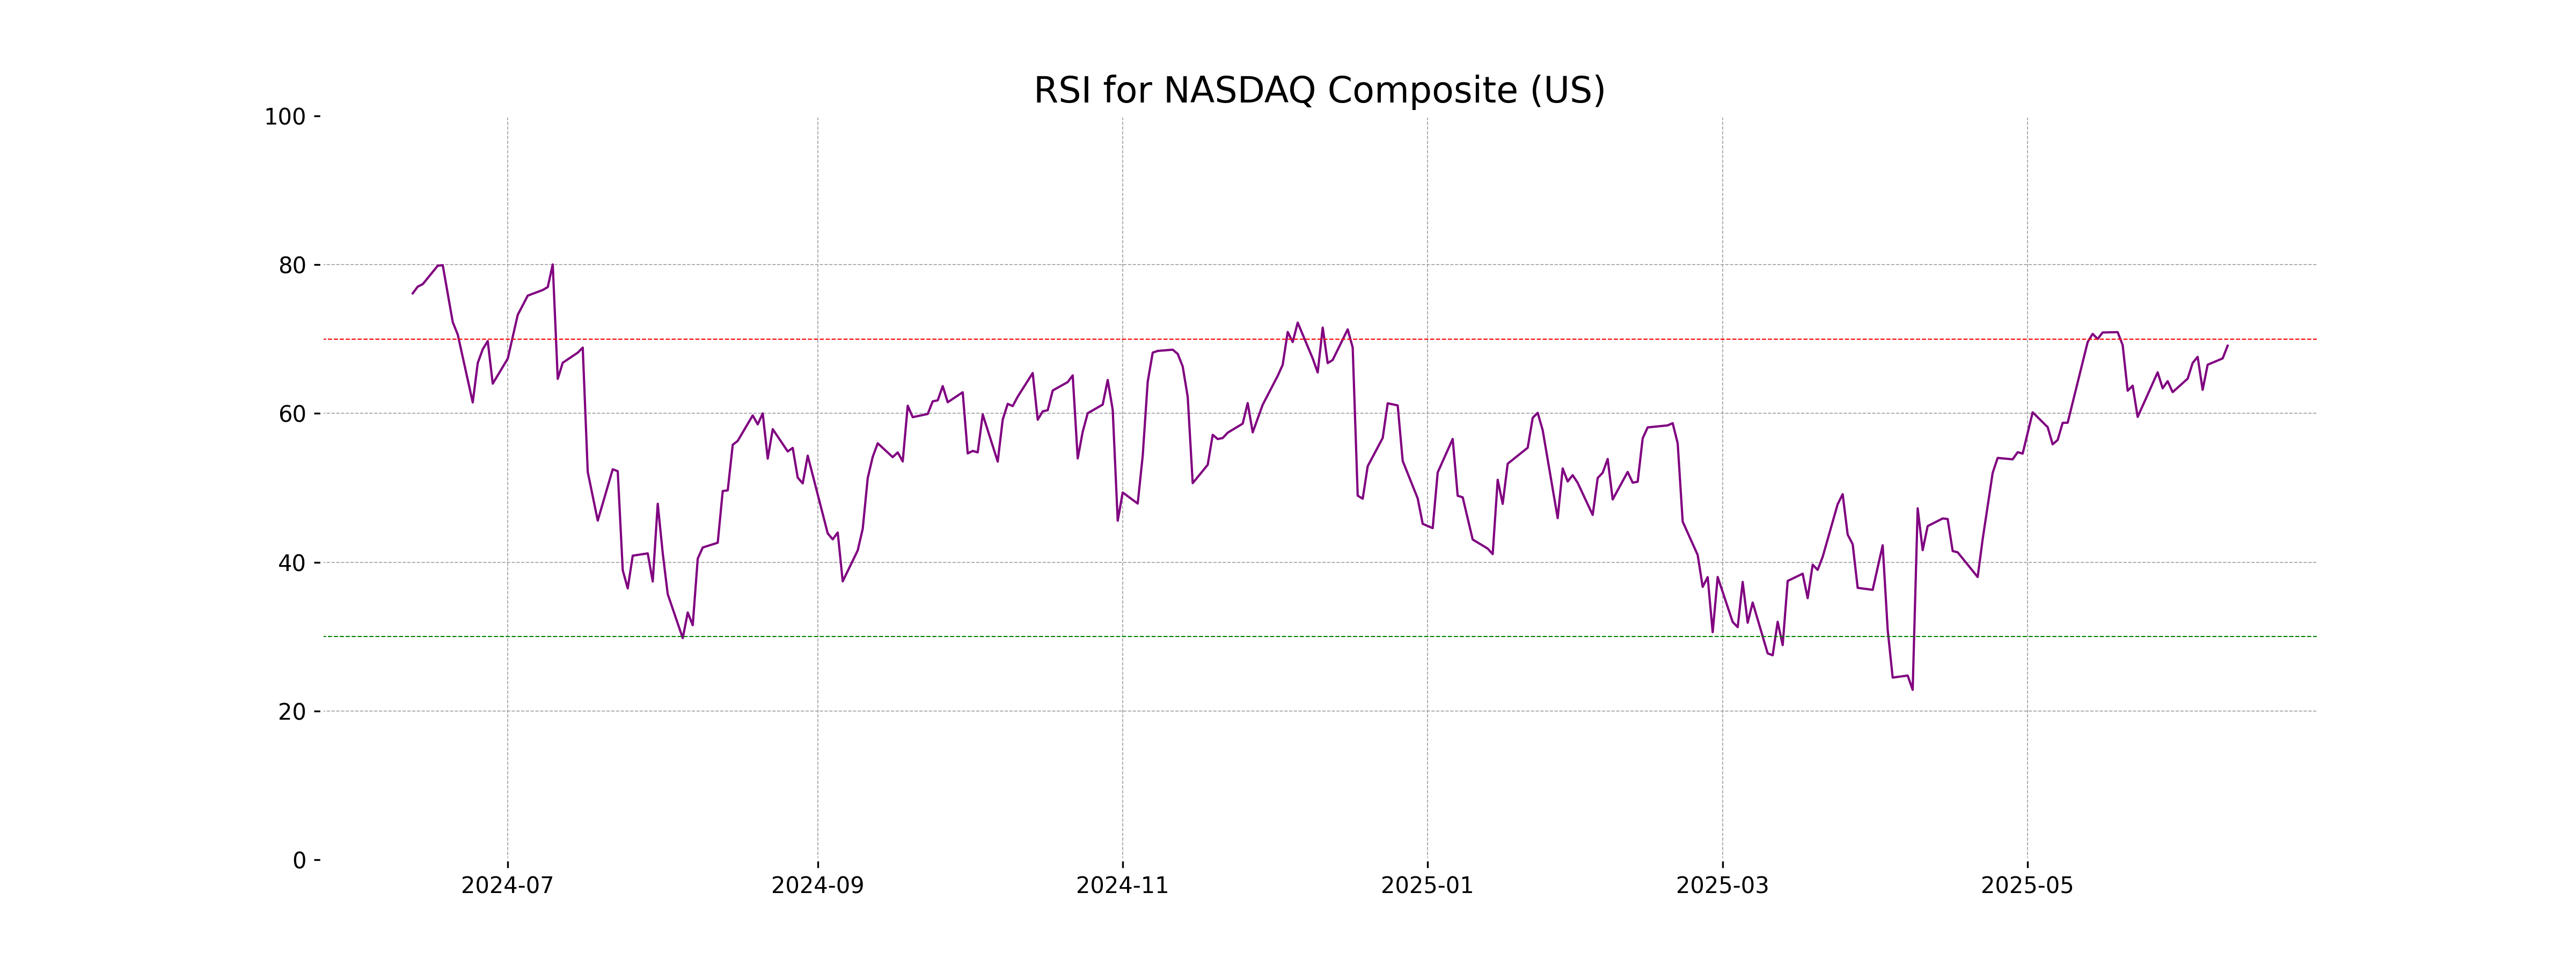
RSI Analysis
The NASDAQ Composite's RSI is 69.11, indicating that the index is close to being overbought, as RSI values above 70 often suggest overbought conditions. This could signal a potential pullback if the upward momentum slows.
Analysis for Nikkei 225 (Japan) - June 11, 2025
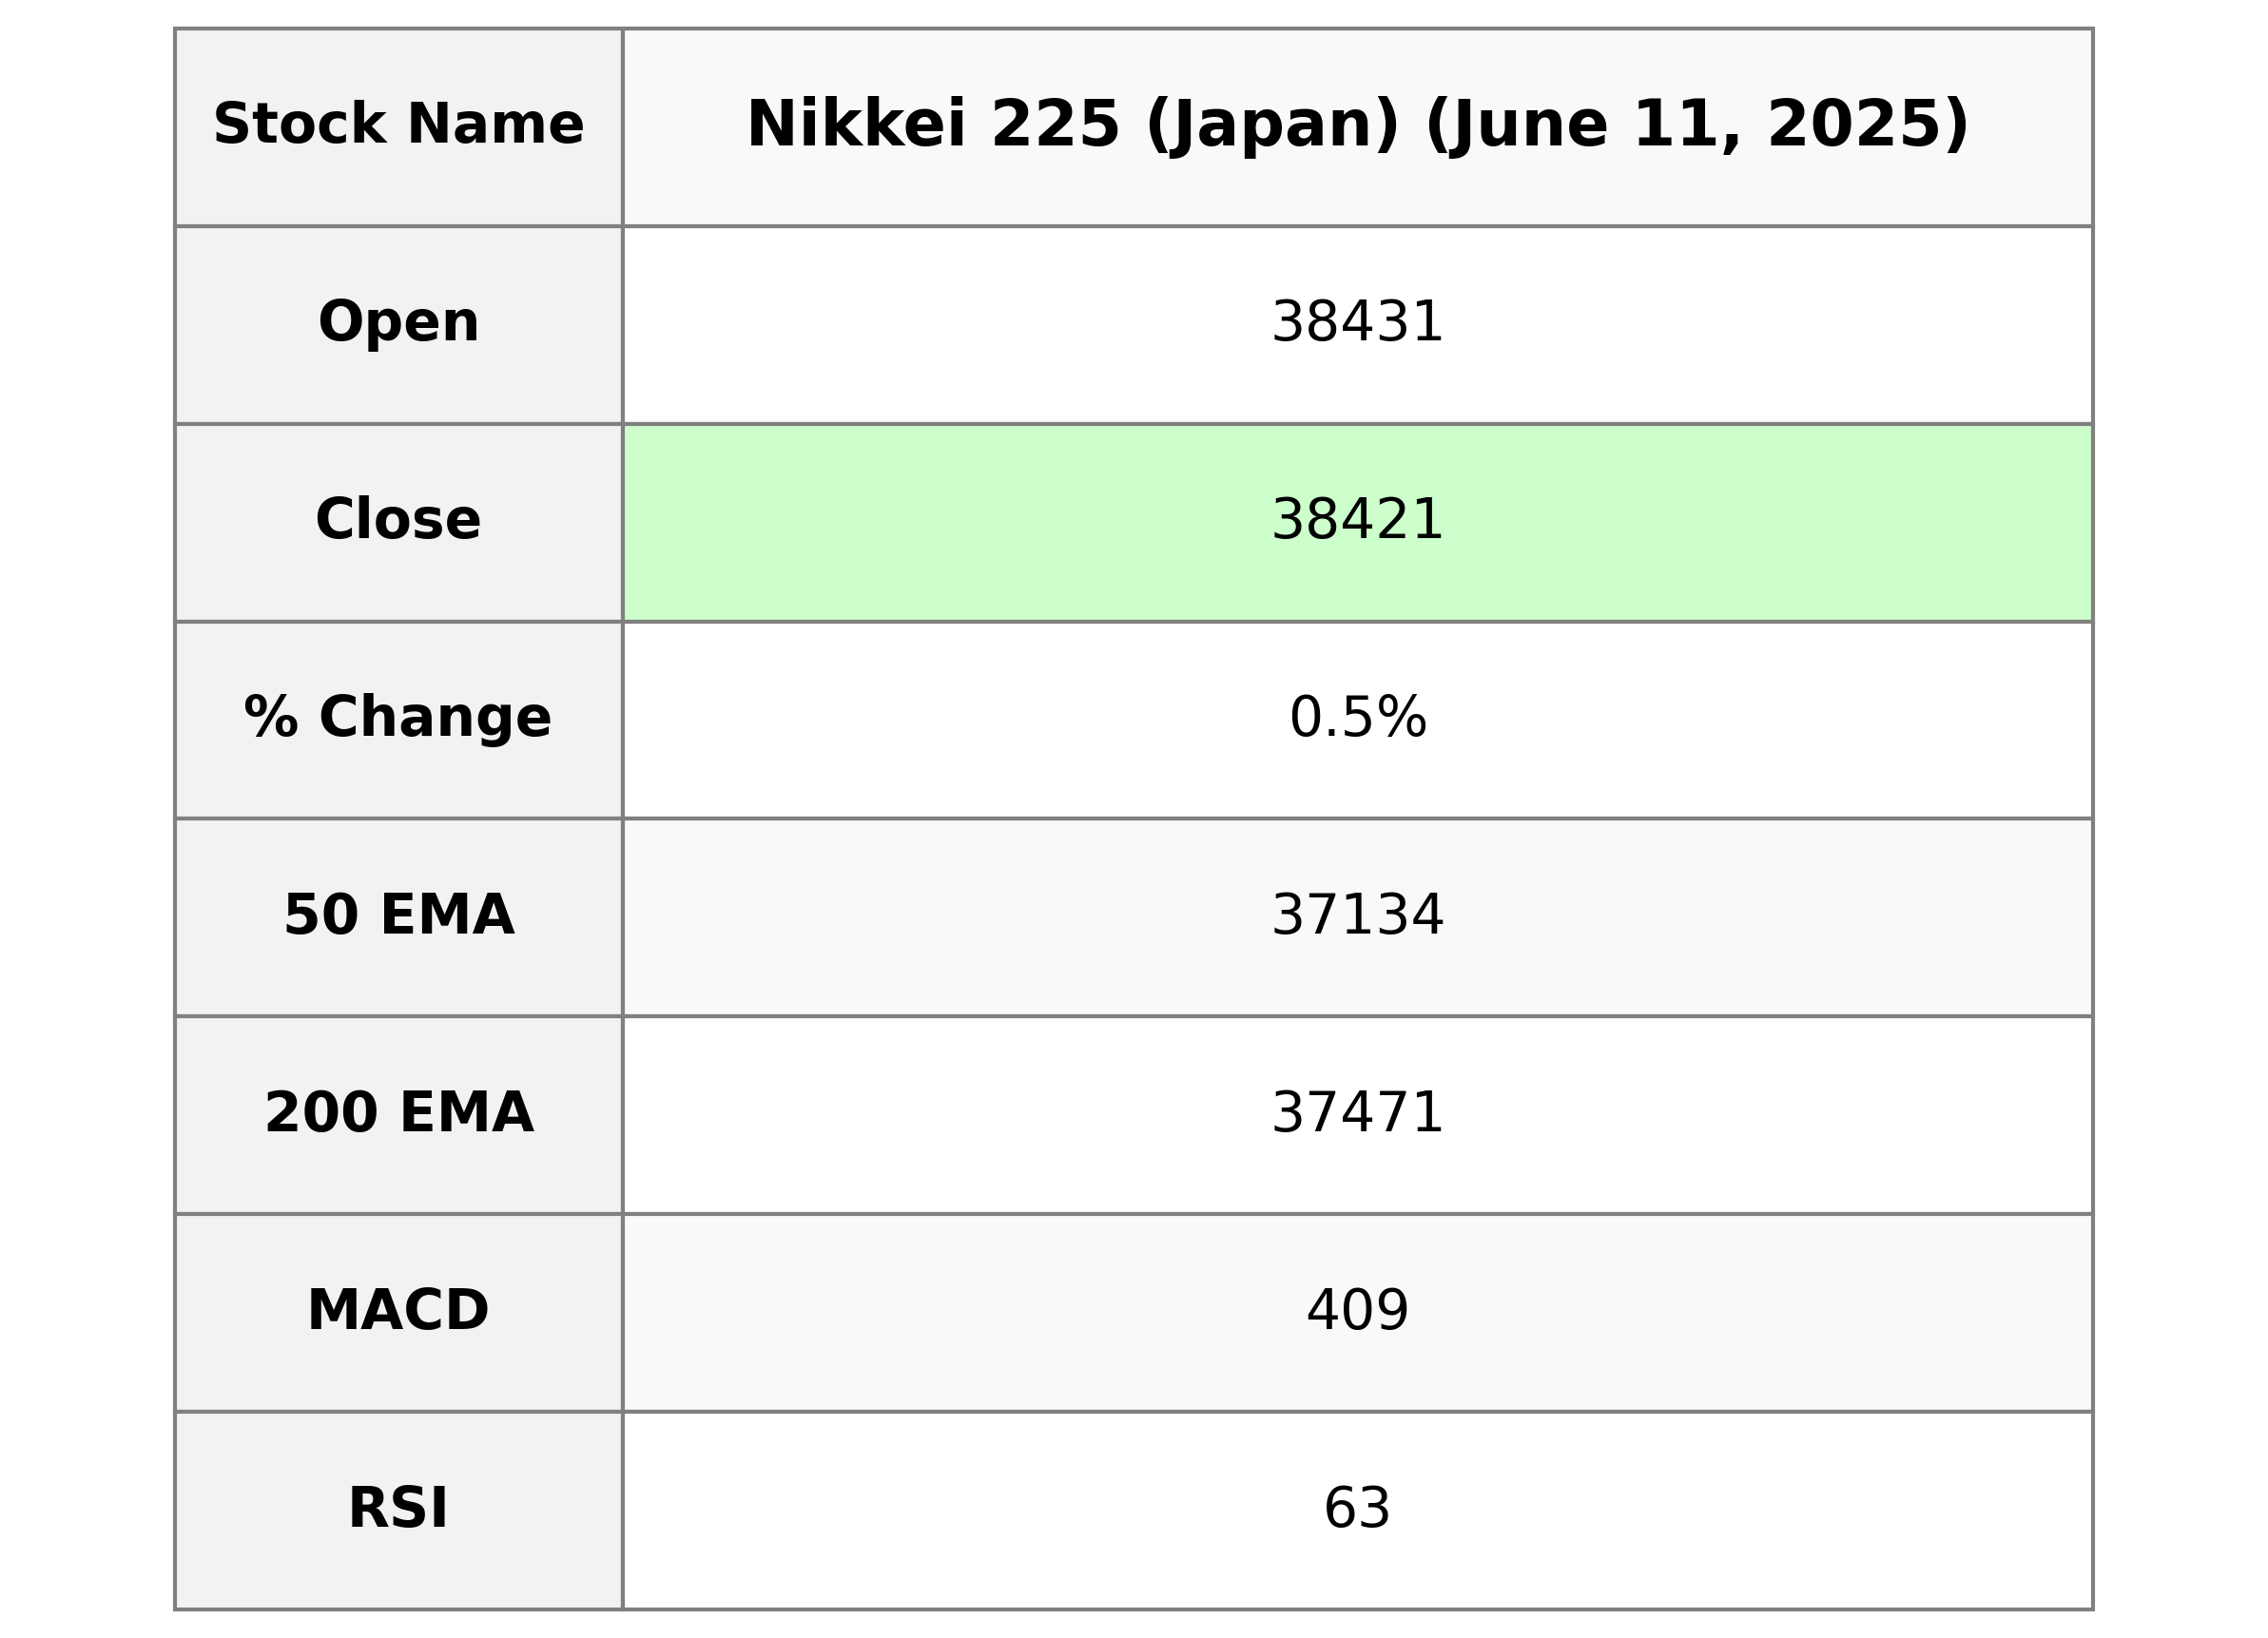
Nikkei 225 (Japan) opened at 38431.10, reaching a high of 38529.64 and a low of 38288.28, before closing at 38421.19. The index experienced a percent change of 0.55% with a 209.68 points increase from the previous close of 38211.51. The RSI stands at 62.94, indicating a possibly overbought condition.
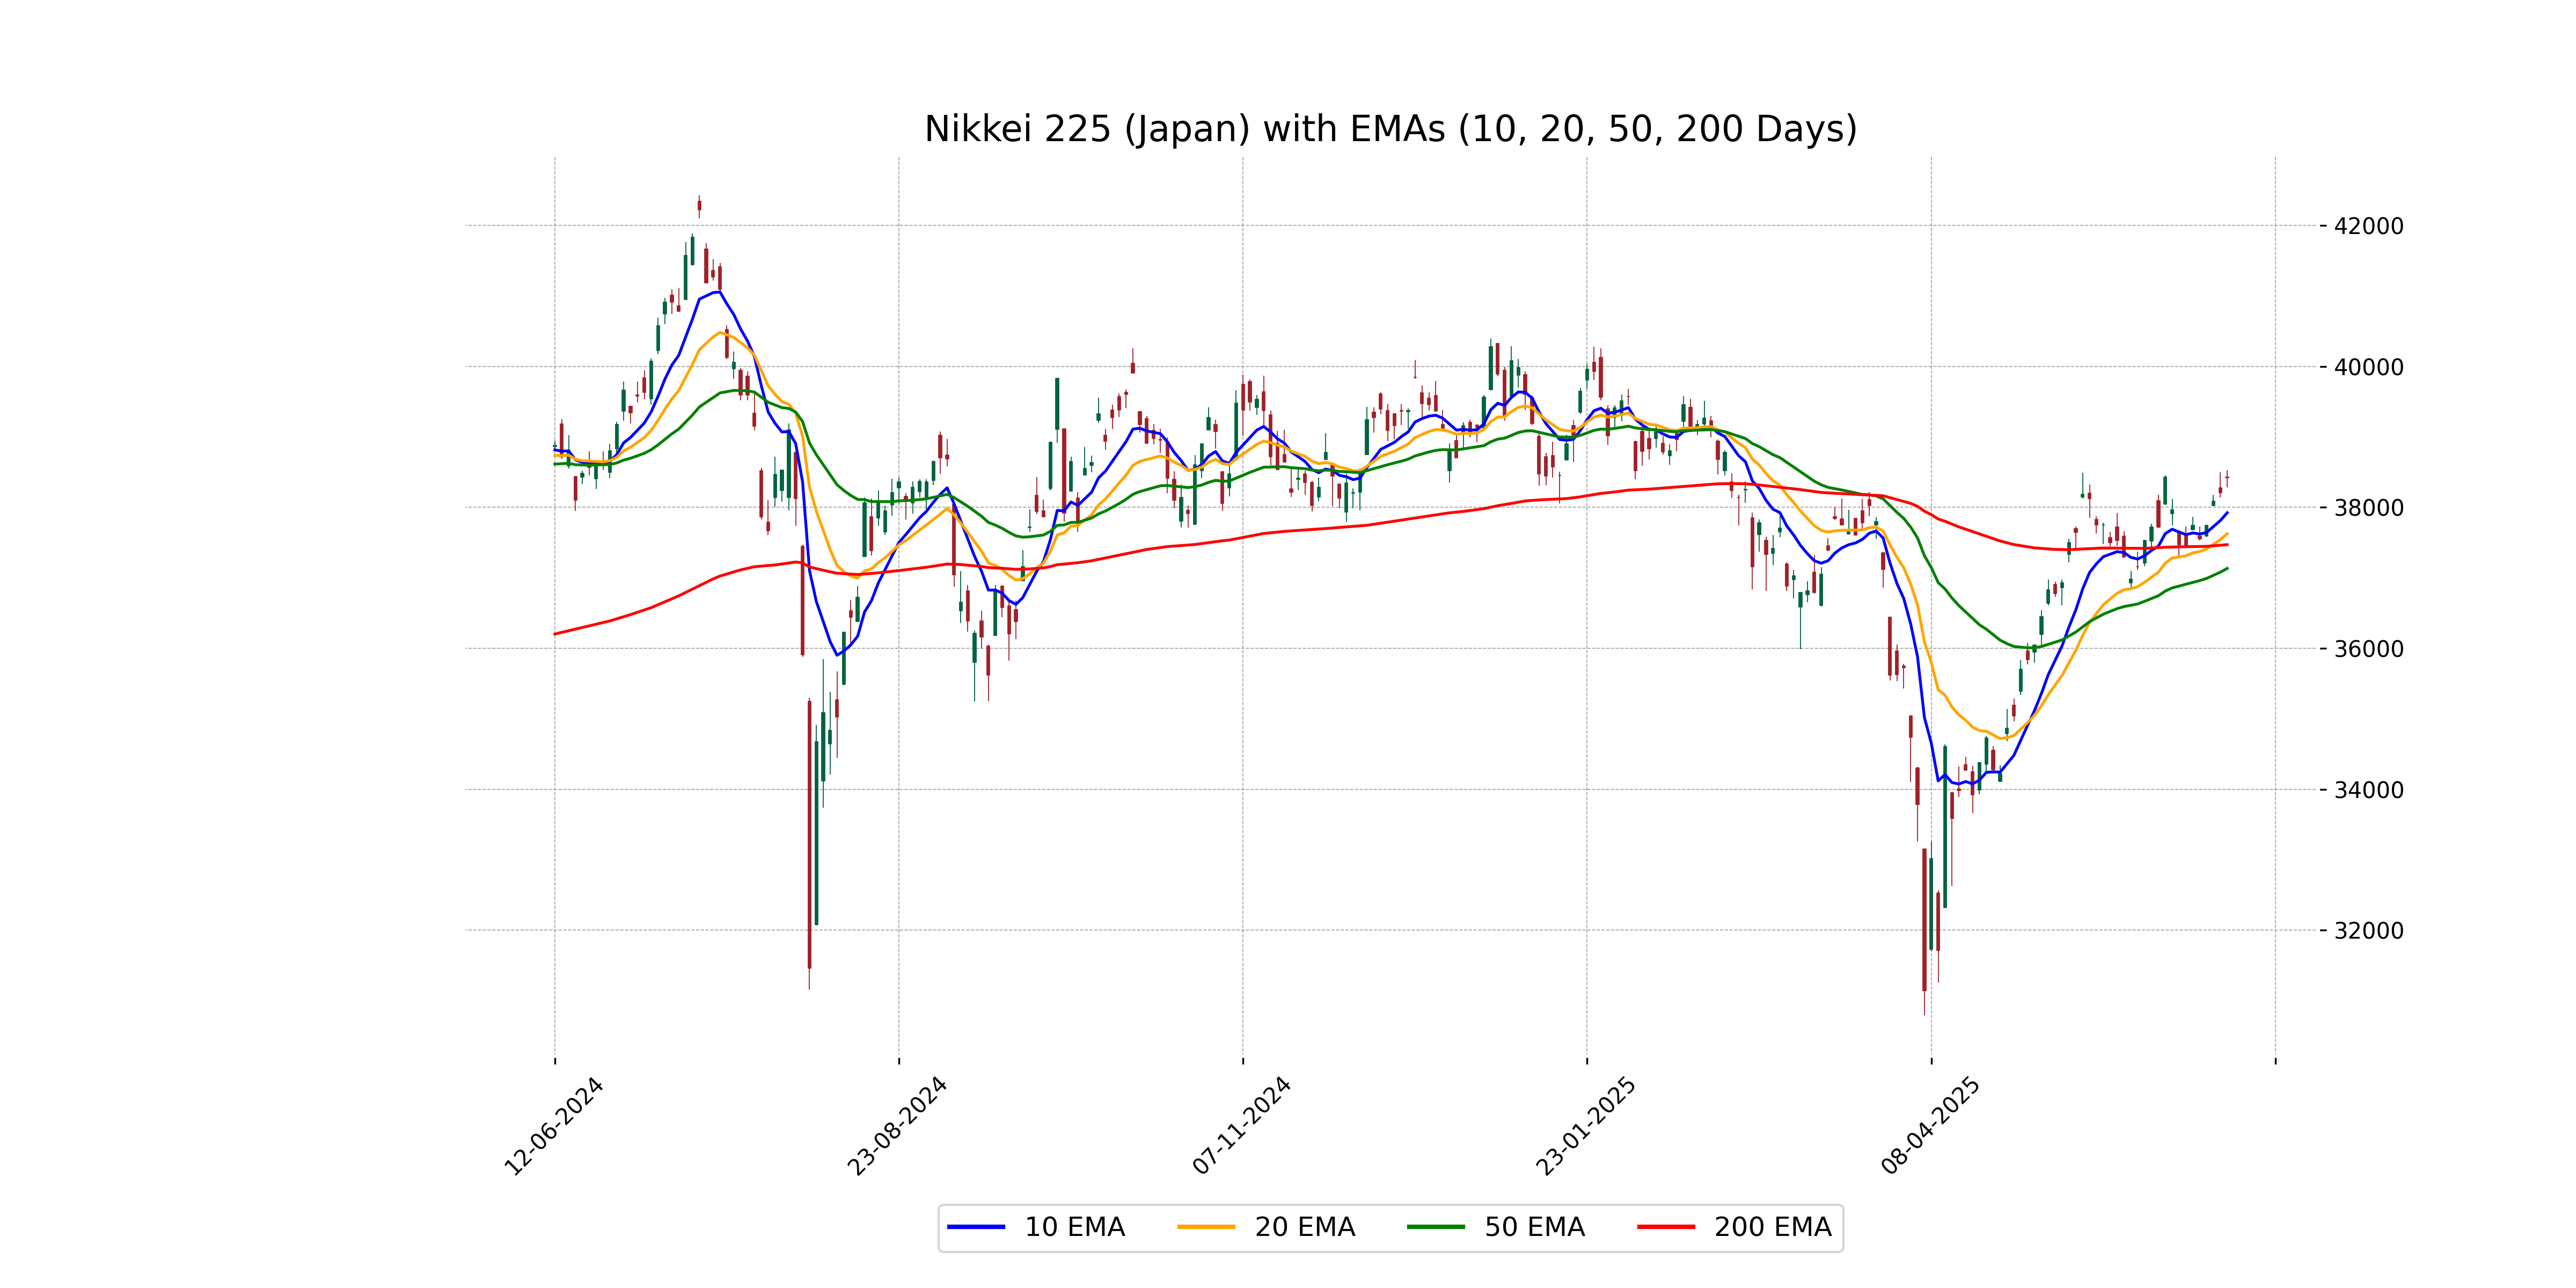
Relationship with Key Moving Averages
The Nikkei 225 is currently trading above its 10-day, 20-day, 50-day, and 200-day exponential moving averages, indicating a strong upward momentum. With a closing price of 38,421.19, it surpasses the 50 EMA (37,133.52) and 200 EMA (37,471.02), suggesting strong bullish sentiments in the market.
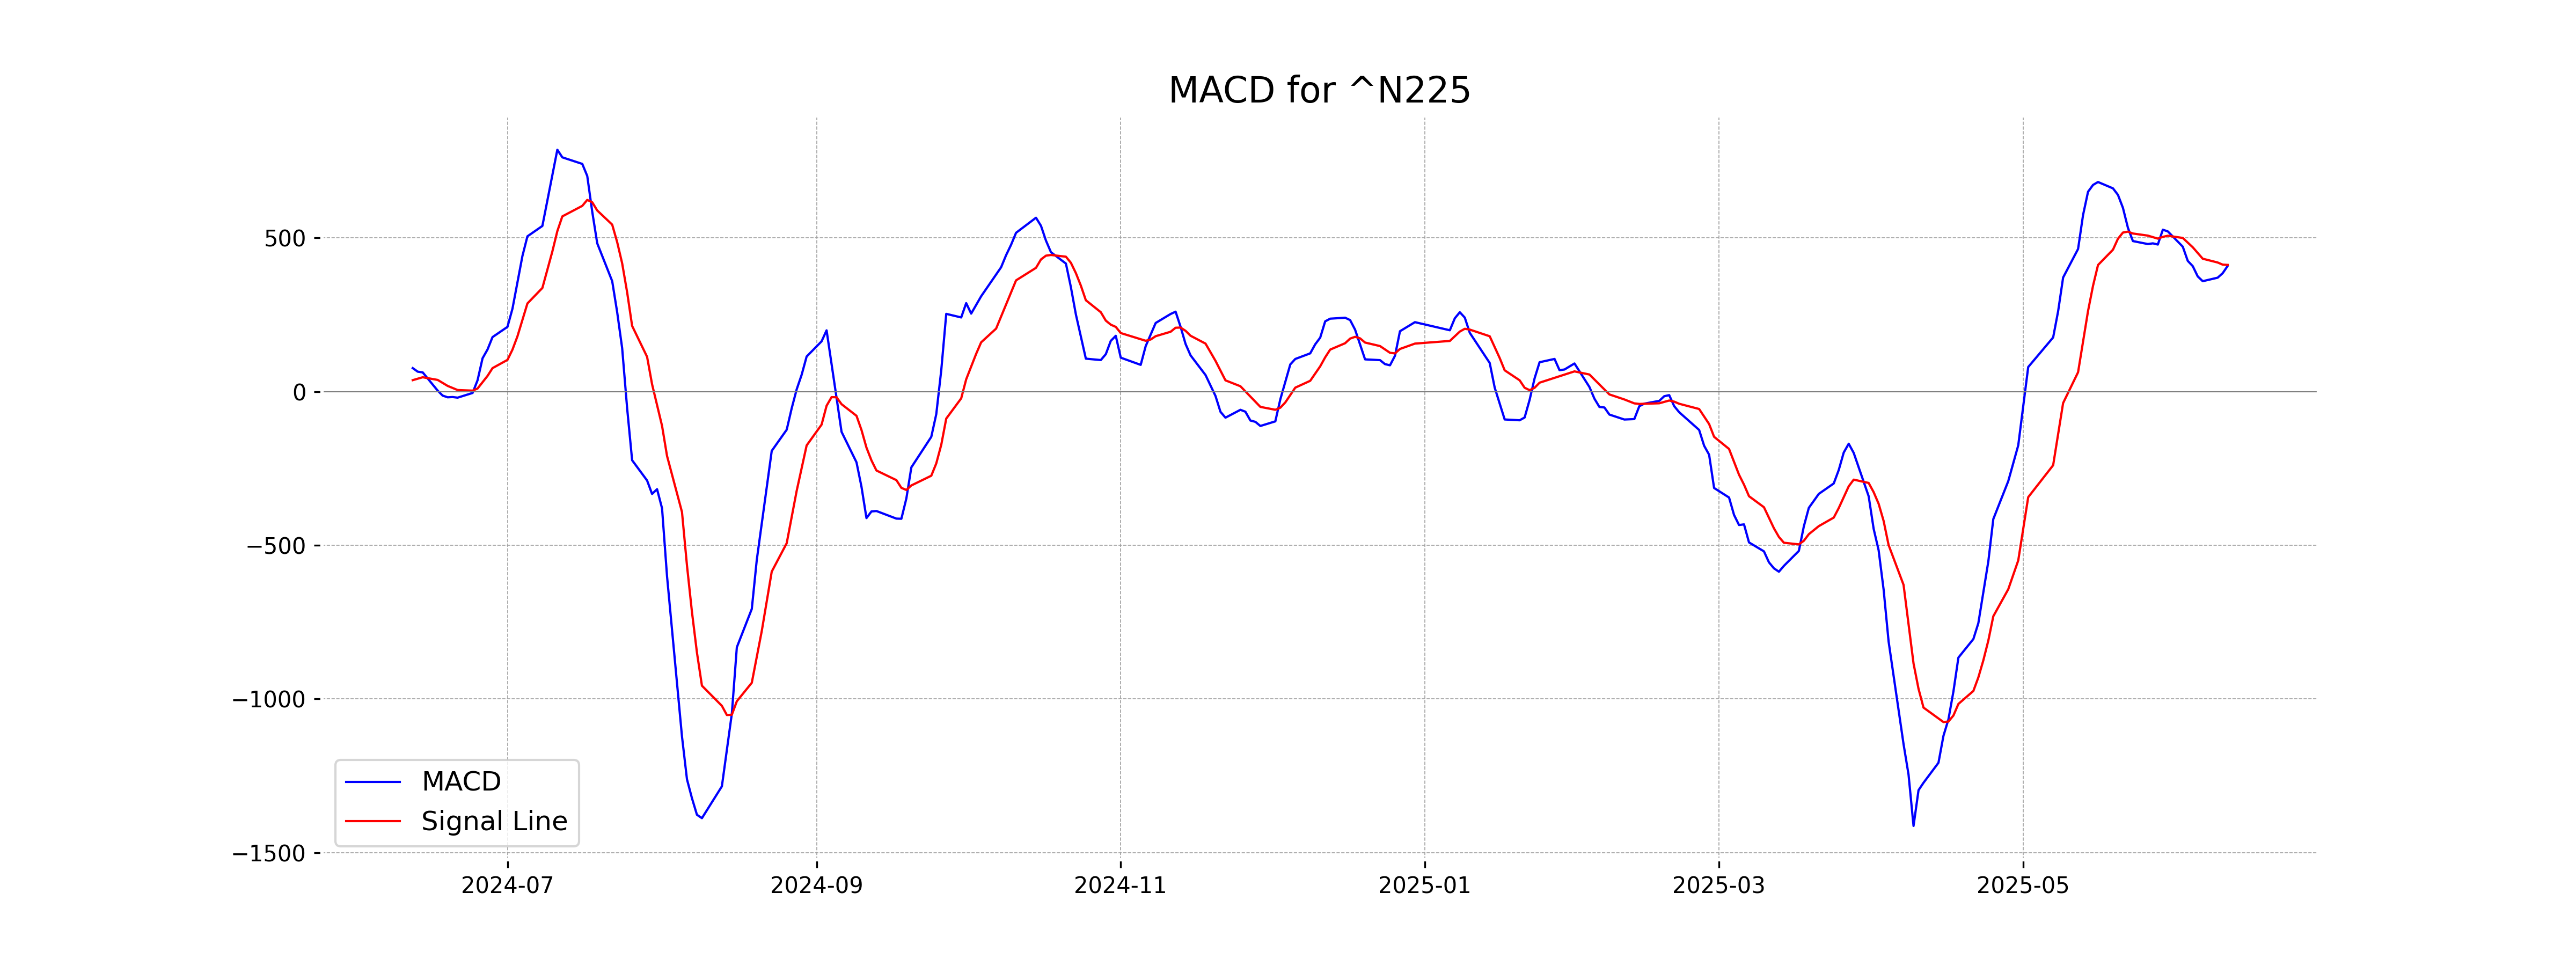
Moving Averages Trend (MACD)
The MACD value of 408.80 compared to the MACD Signal of 412.13 for Nikkei 225 indicates that it may be in a slightly bearish phase since the MACD is below the signal line. However, the difference is minimal, suggesting potential consolidation or a pending reversal.
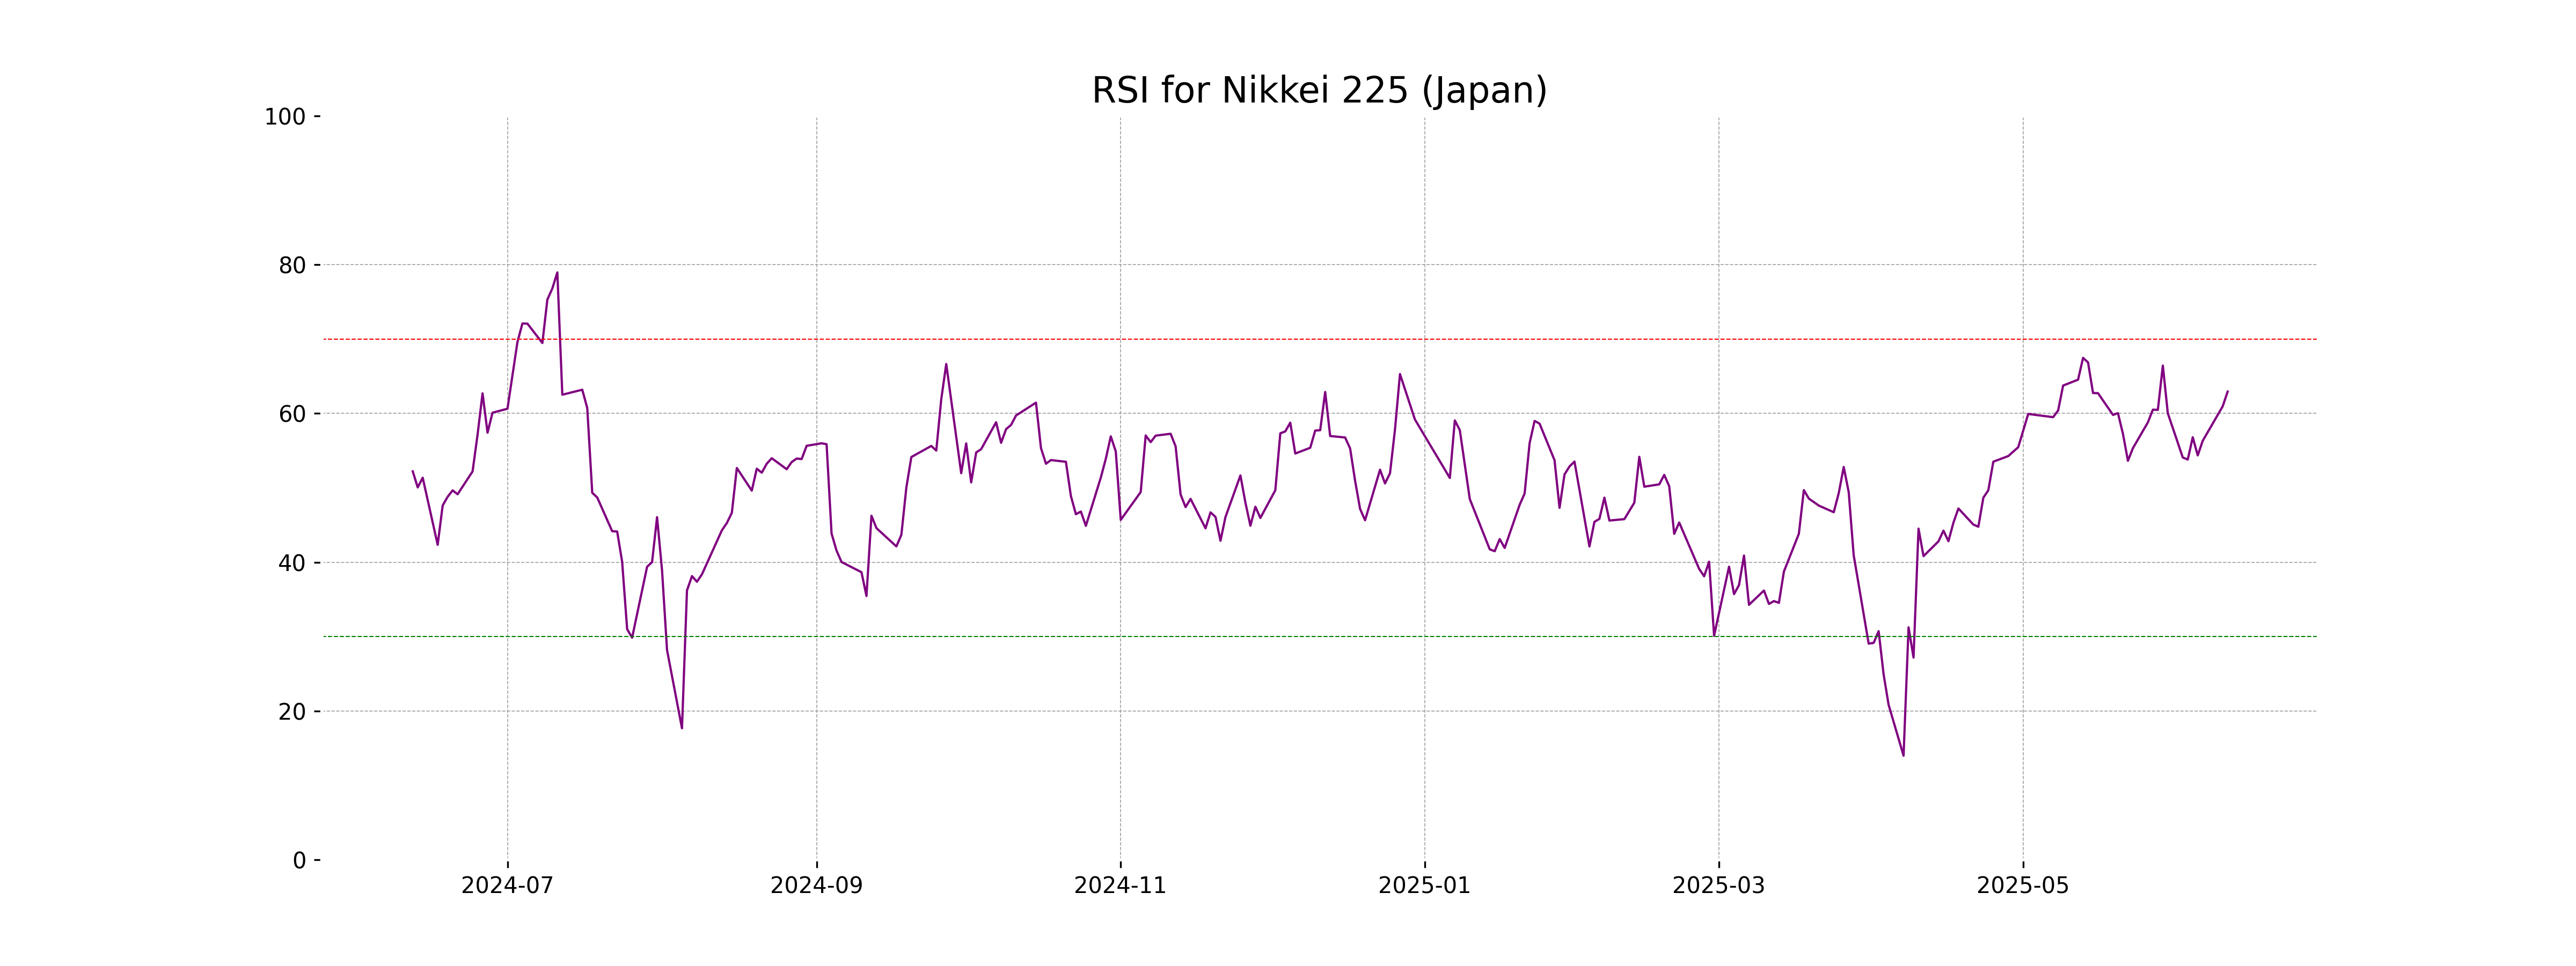
RSI Analysis
The RSI for the Nikkei 225 is 62.94, which indicates that the index is nearing an overbought condition. With the RSI close to 70, there could be a potential for a price pullback if upward momentum weakens.
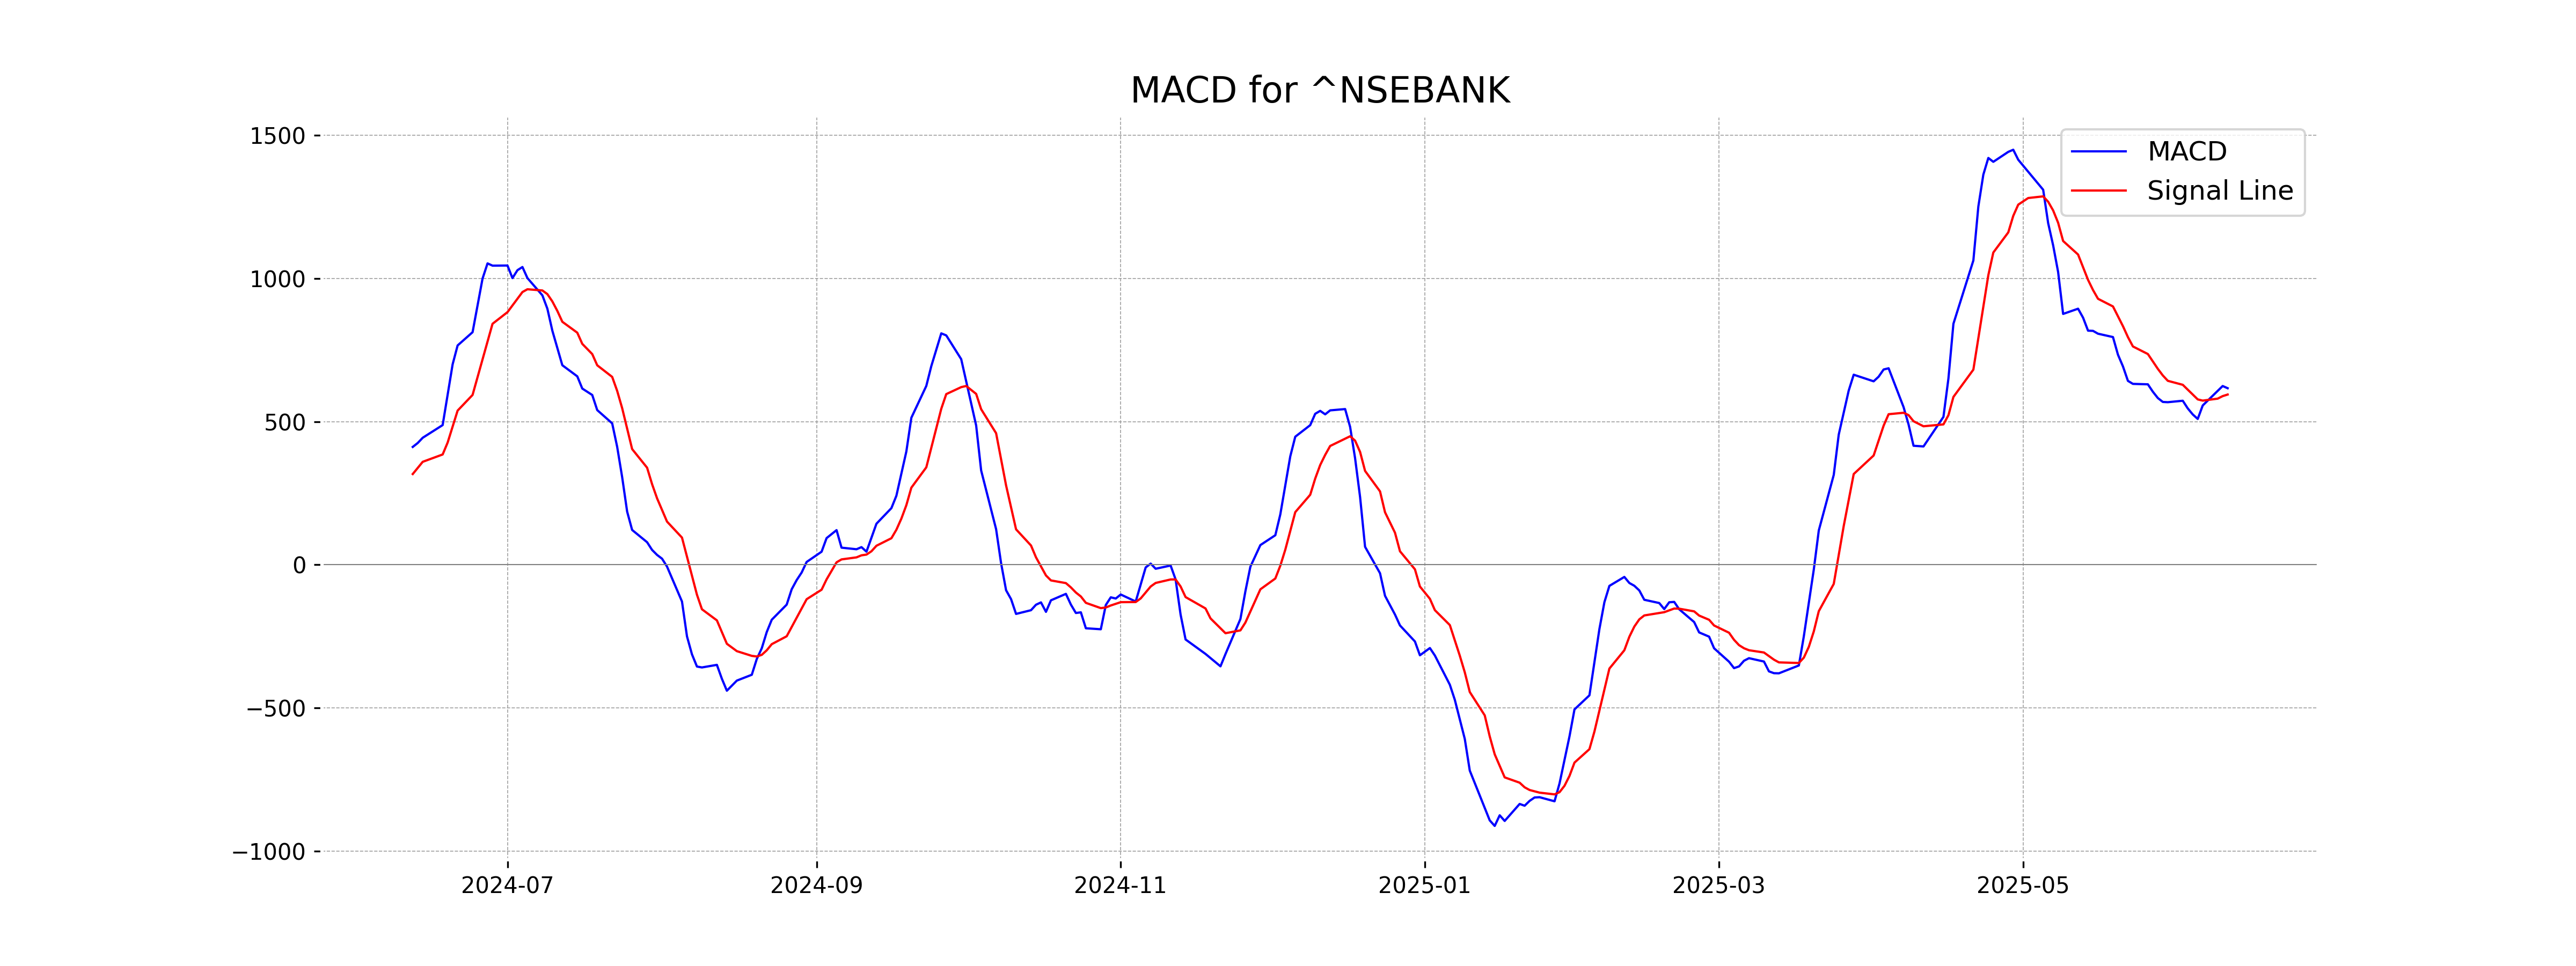
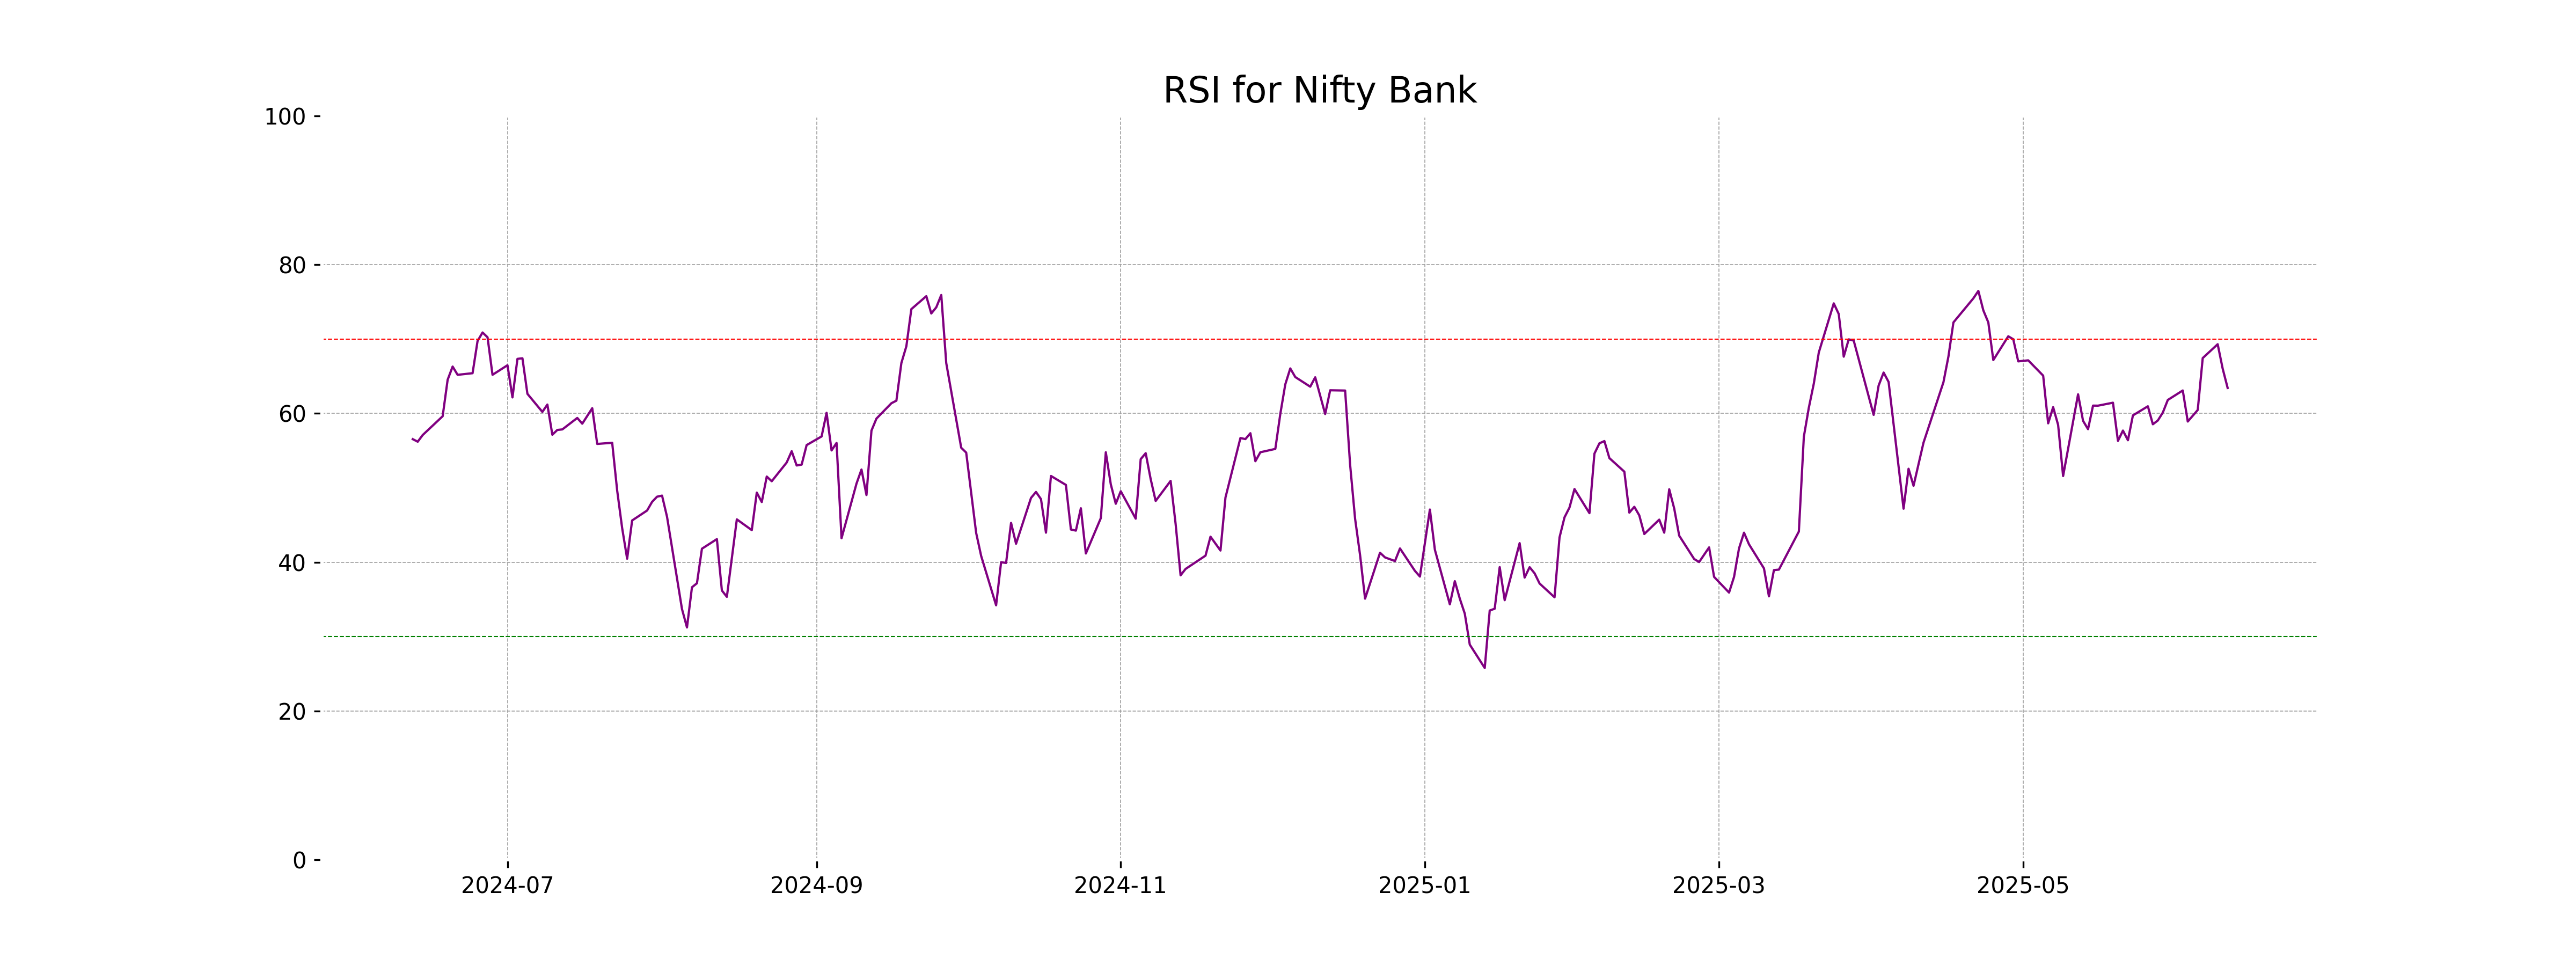
Analysis for Nifty Bank - June 11, 2025
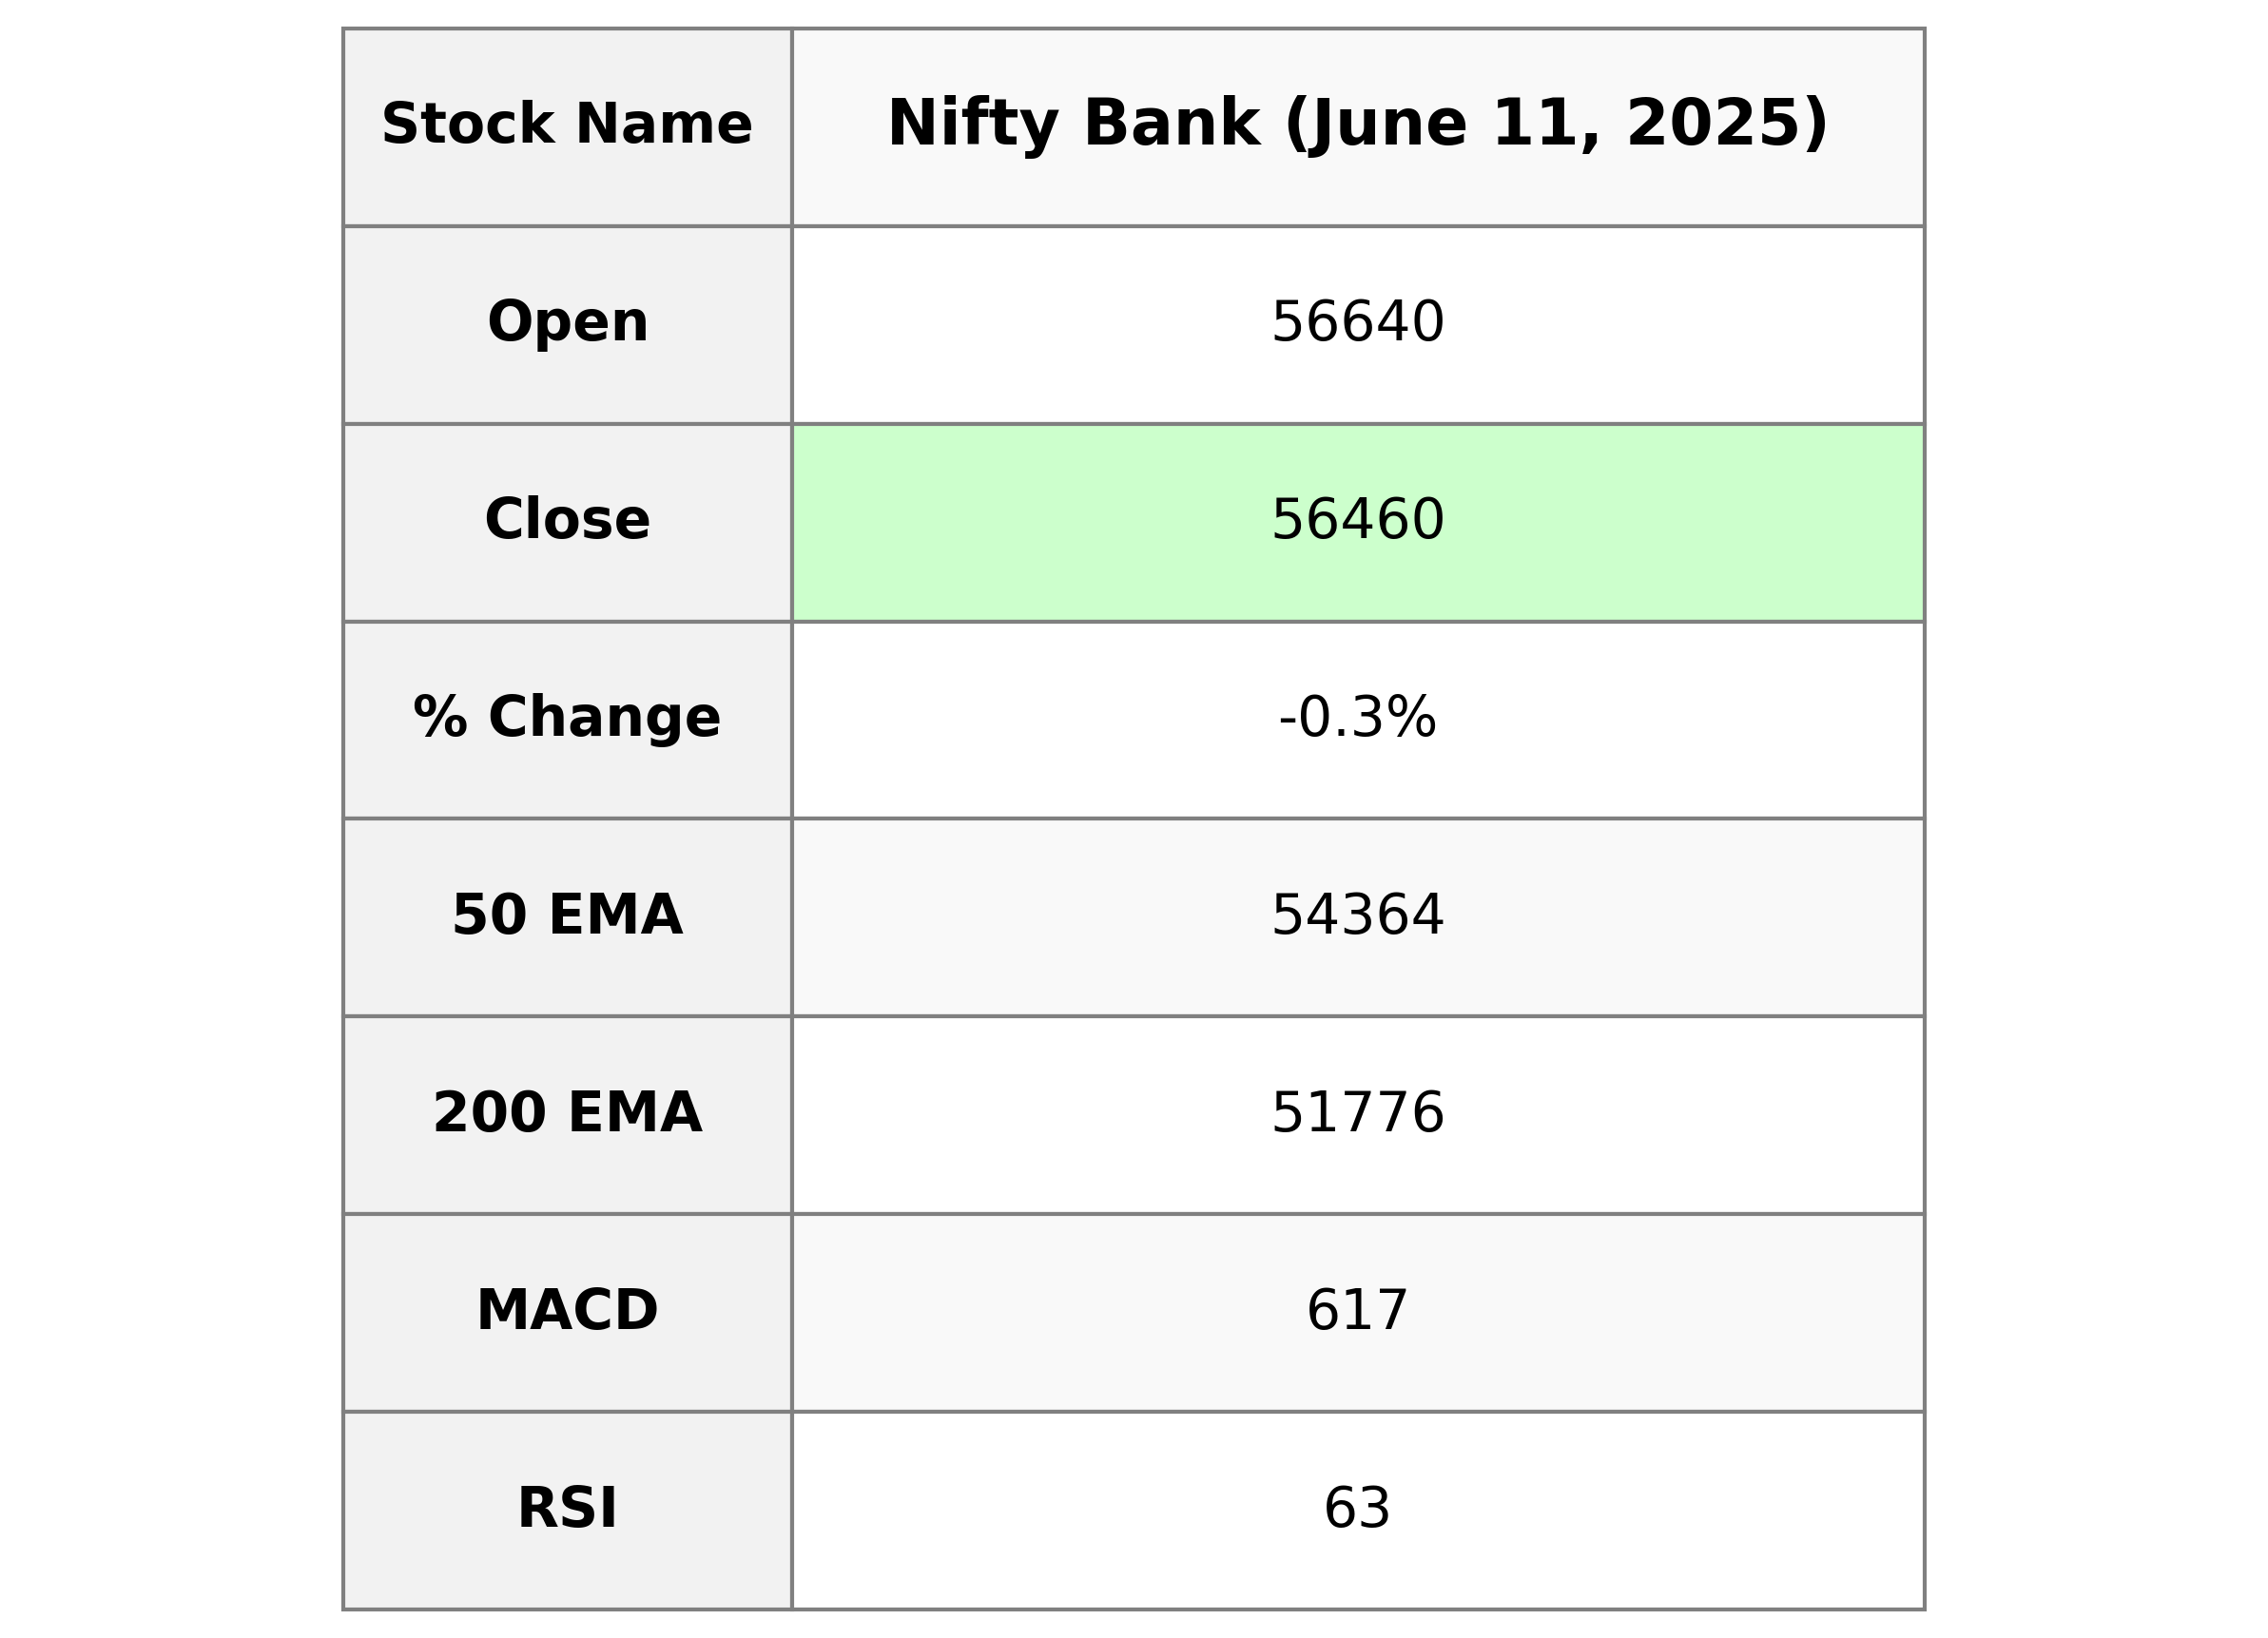
The Nifty Bank index opened at 56,639.85 and closed at 56,459.75, showing a slight decline of 0.30% with a points change of -169.35. The index's RSI is 63.43, indicating a moderately strong trend, while its MACD value of 616.52 suggests a positive momentum compared to the MACD signal of 594.46.
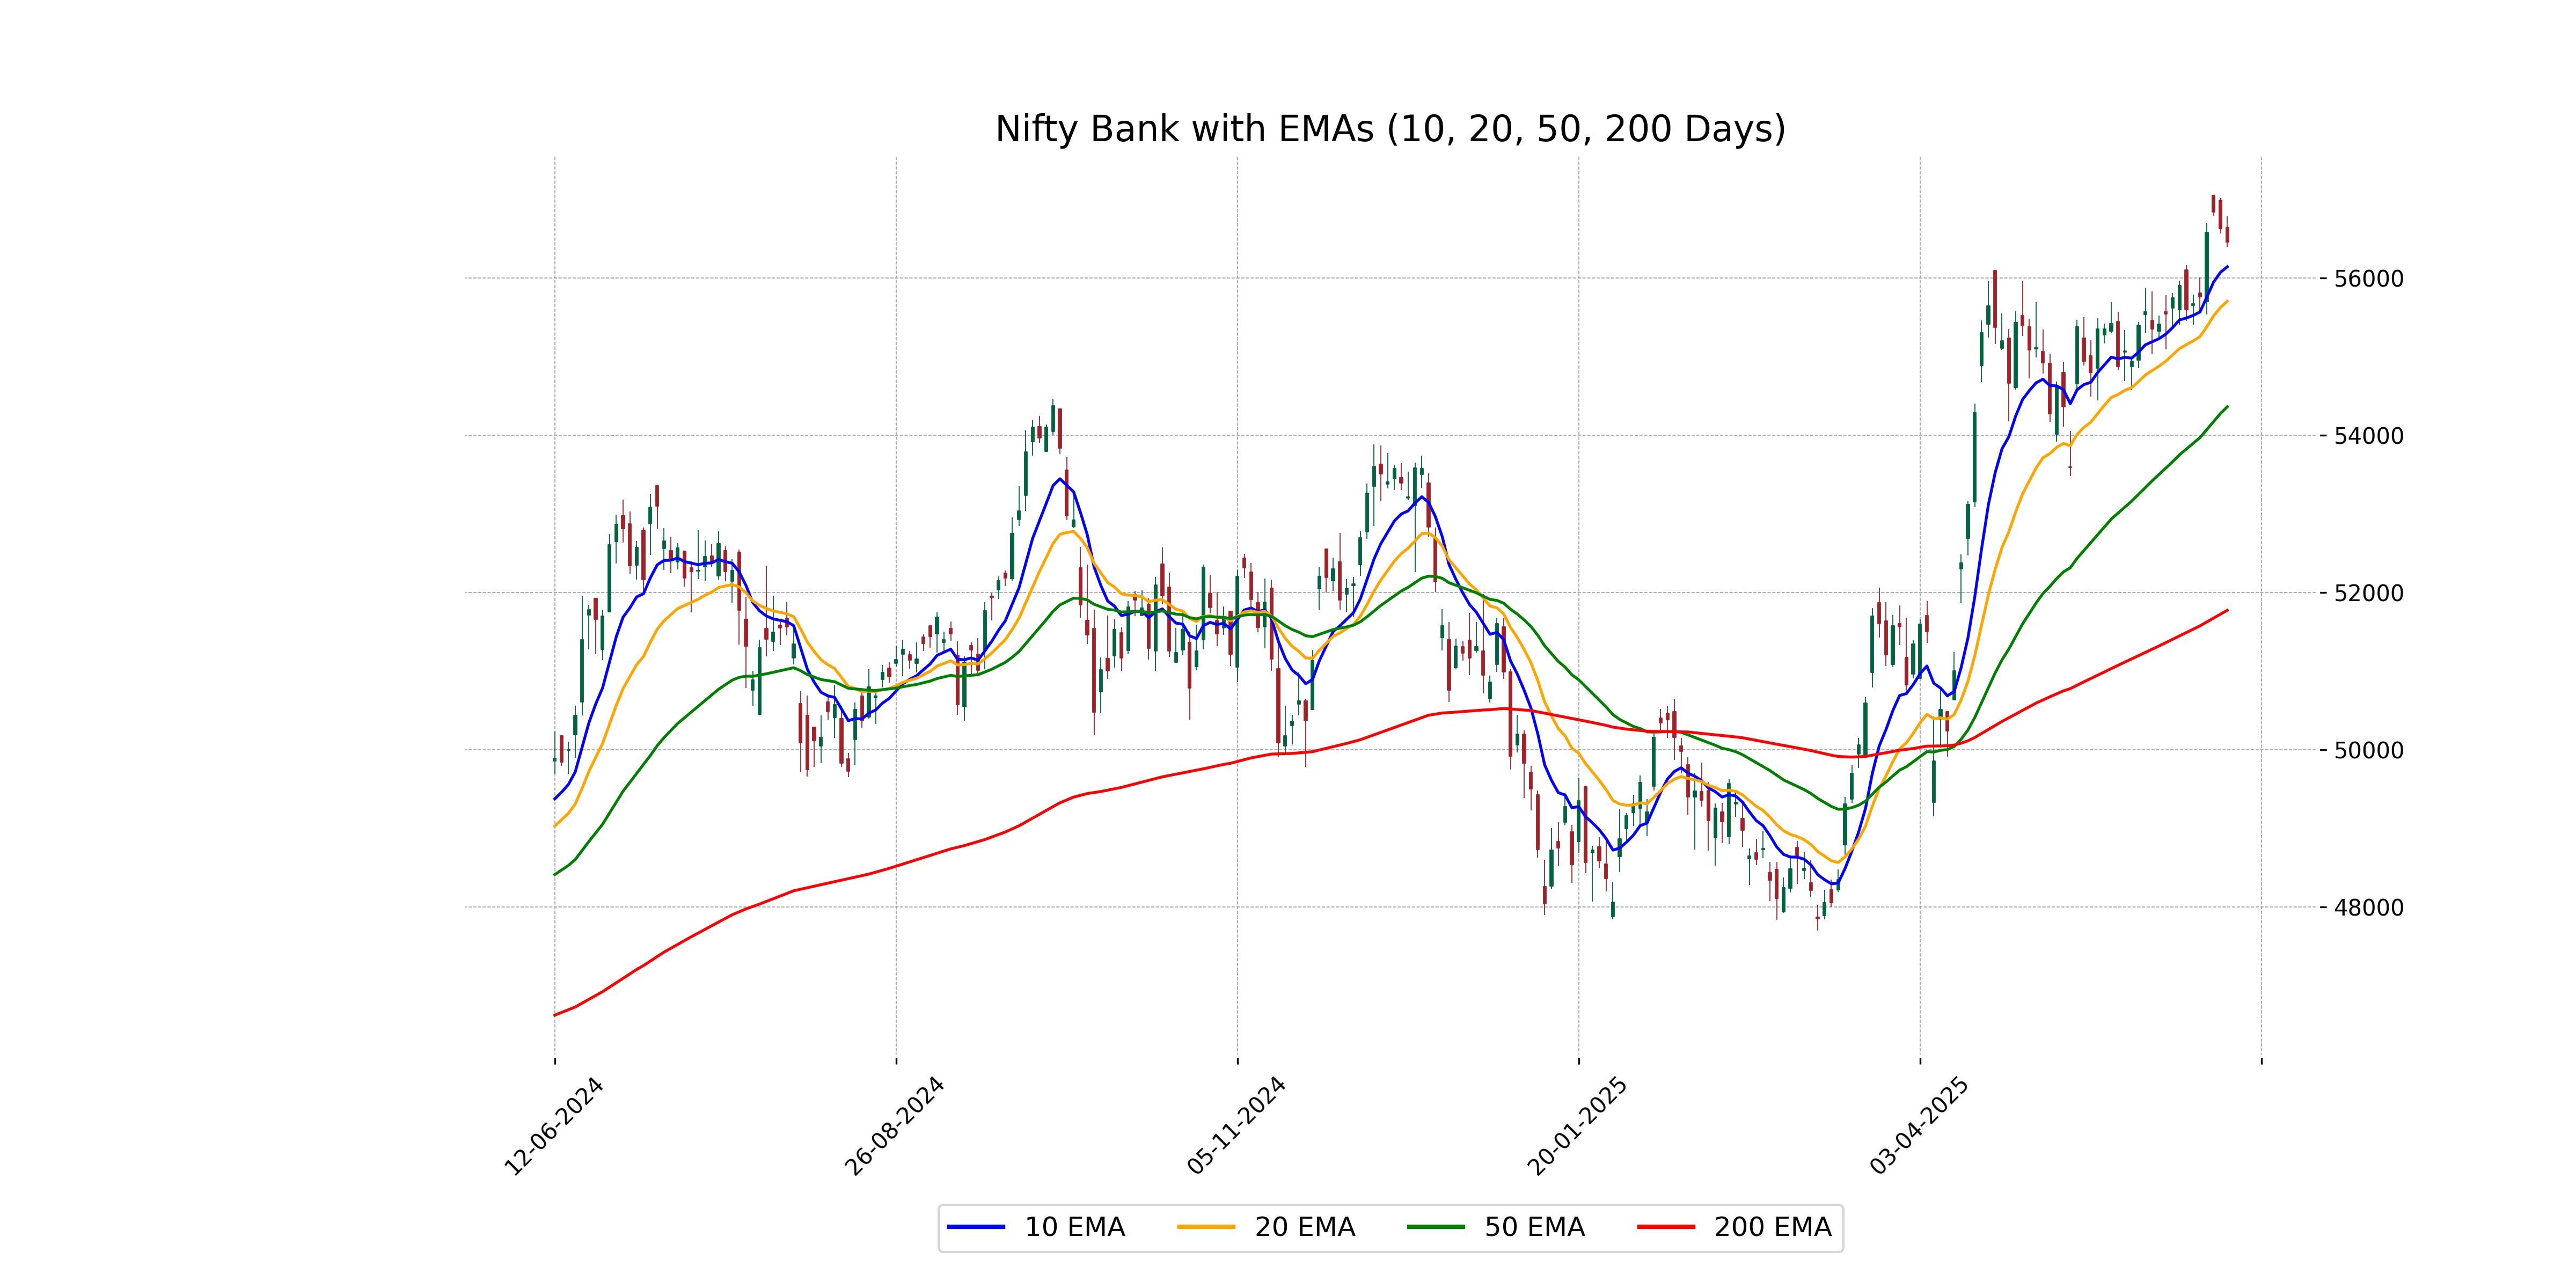
Relationship with Key Moving Averages
The Nifty Bank index closed at 56,459.75, which is below its 10-day EMA of 56,143.55 but above its 50-day EMA of 54,363.51 and 200-day EMA of 51,775.61. This suggests short-term weakness while still maintaining an overall positive trend in the medium to long term.
Moving Averages Trend (MACD)
The MACD for Nifty Bank is at 616.52, with a MACD Signal of 594.46, indicating a positive crossover. This suggests a bullish momentum, as the MACD line is above the Signal line.
RSI Analysis
The Relative Strength Index (RSI) for Nifty Bank is 63.43, suggesting that the stock is closer to being overbought than oversold. While it is not in extreme levels, it indicates positive momentum but investors should monitor closely for any signs of reversal.
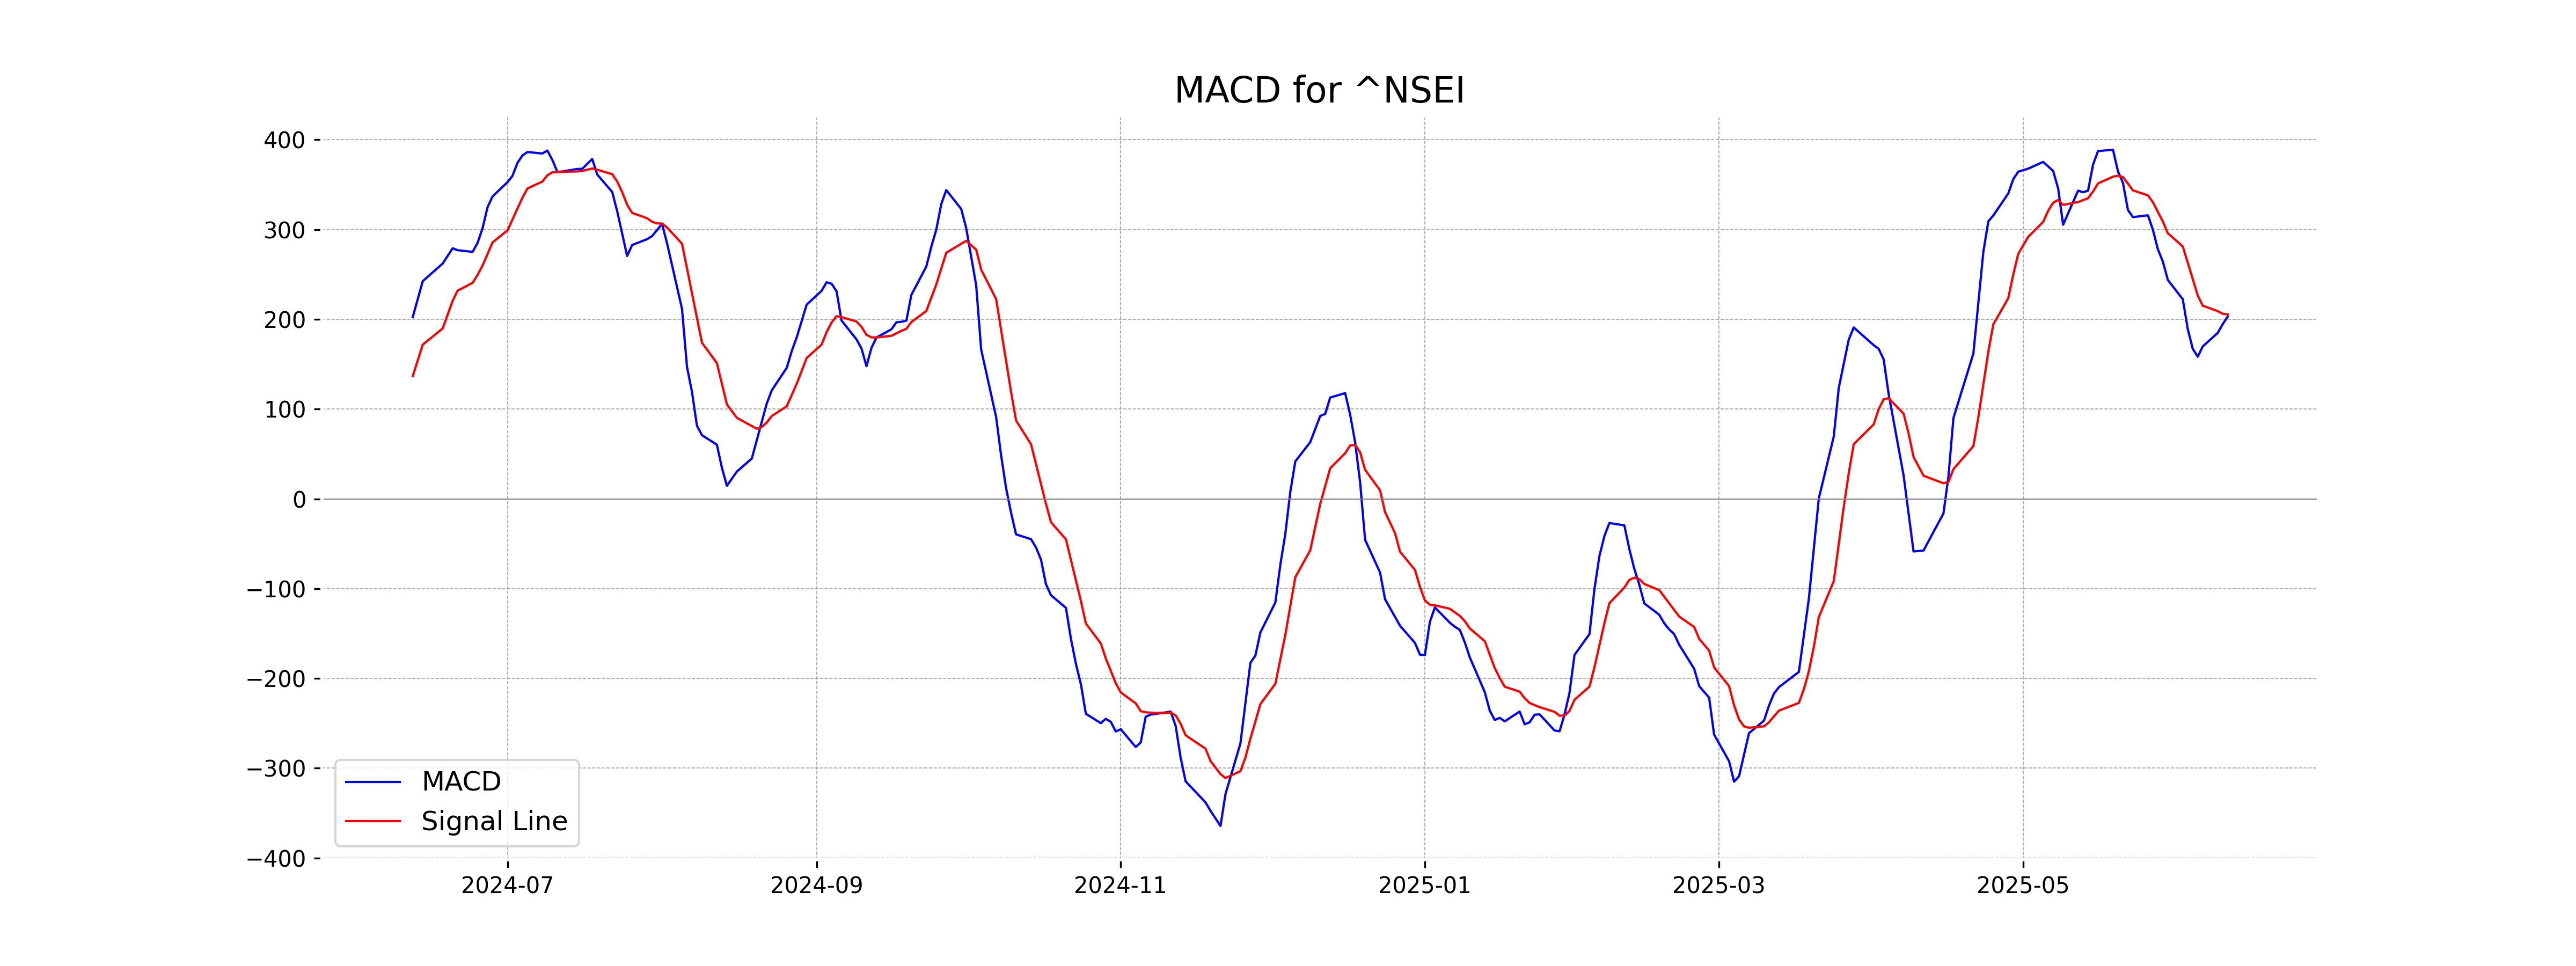
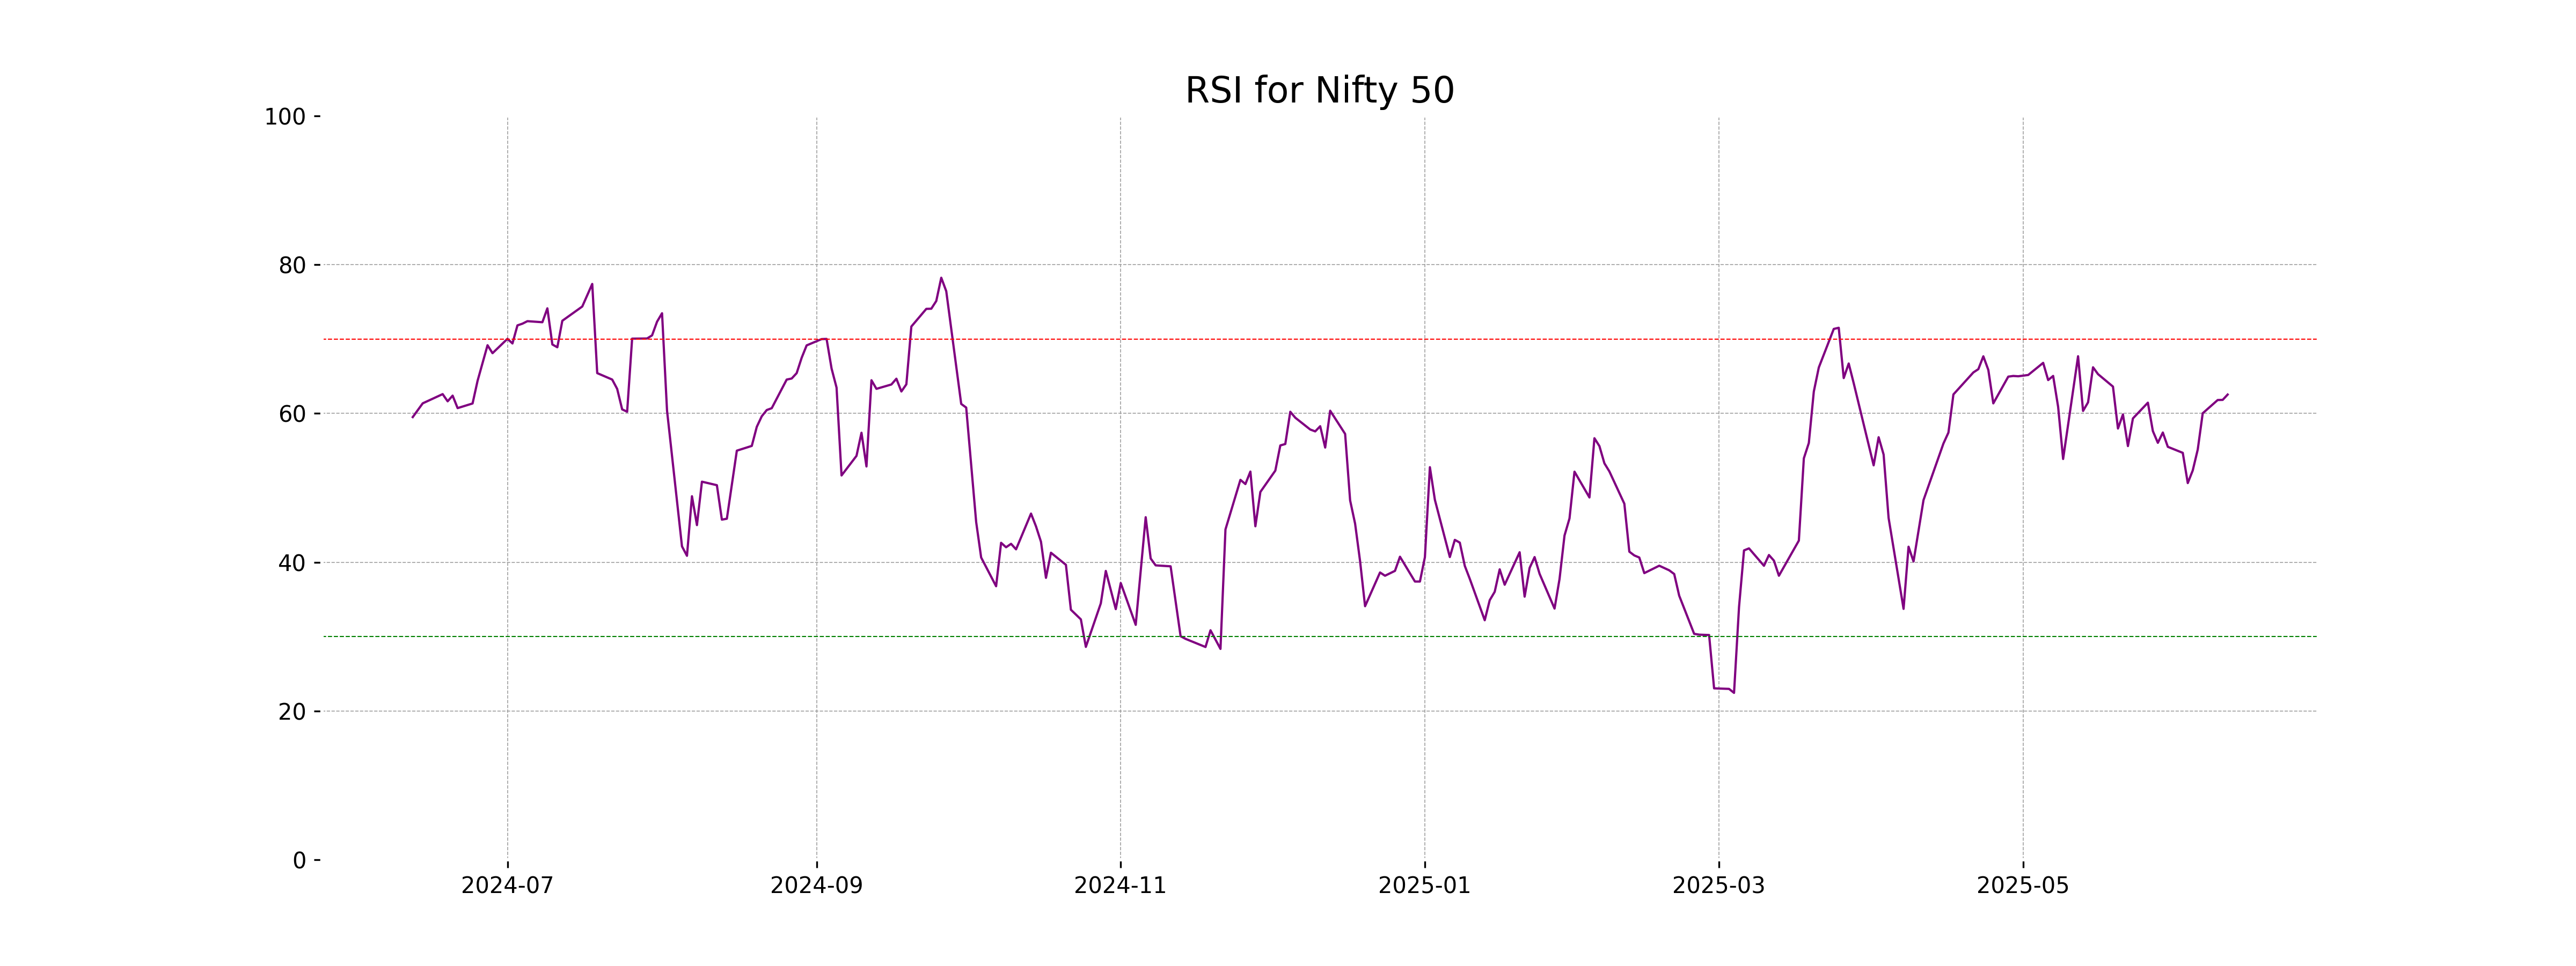
Analysis for Nifty 50 - June 11, 2025
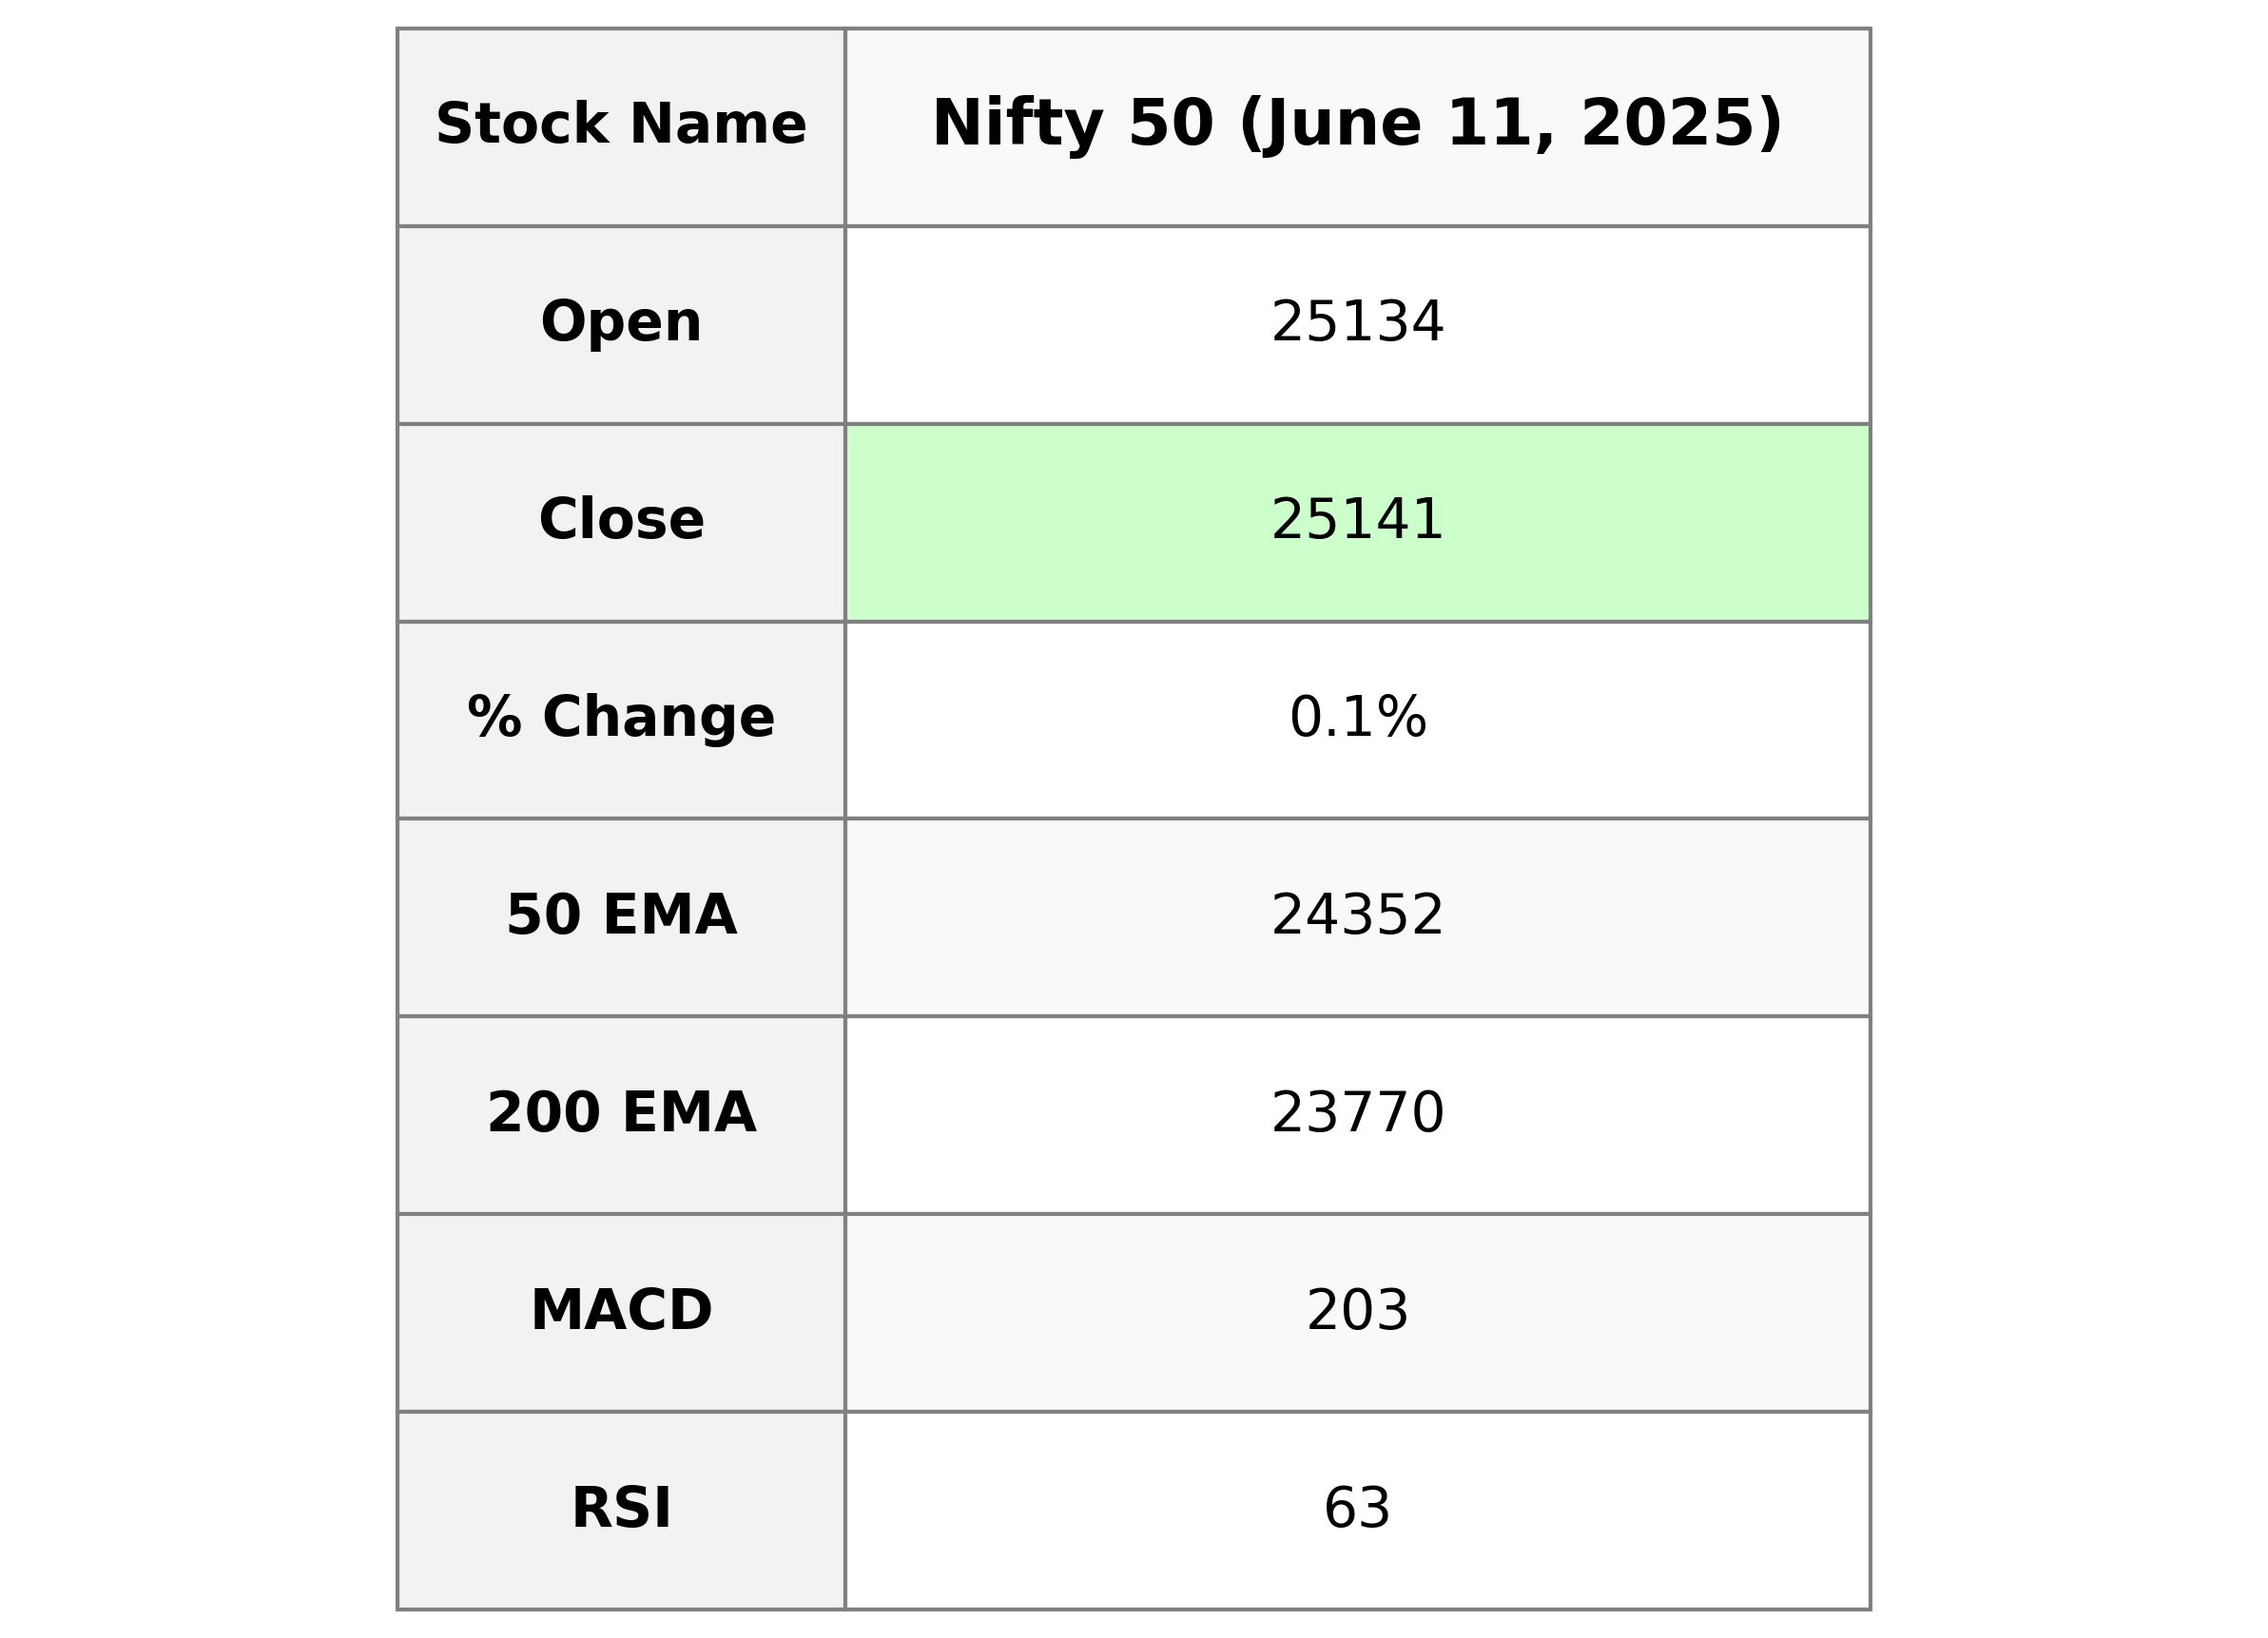
Nifty 50 opened at 25,134.15, reached a high of 25,222.40, and closed at 25,141.40, marking a 0.15% increase from the previous close. The RSI indicates a moderately strong position at 62.54, and the MACD shows a slight negative divergence from its signal line.
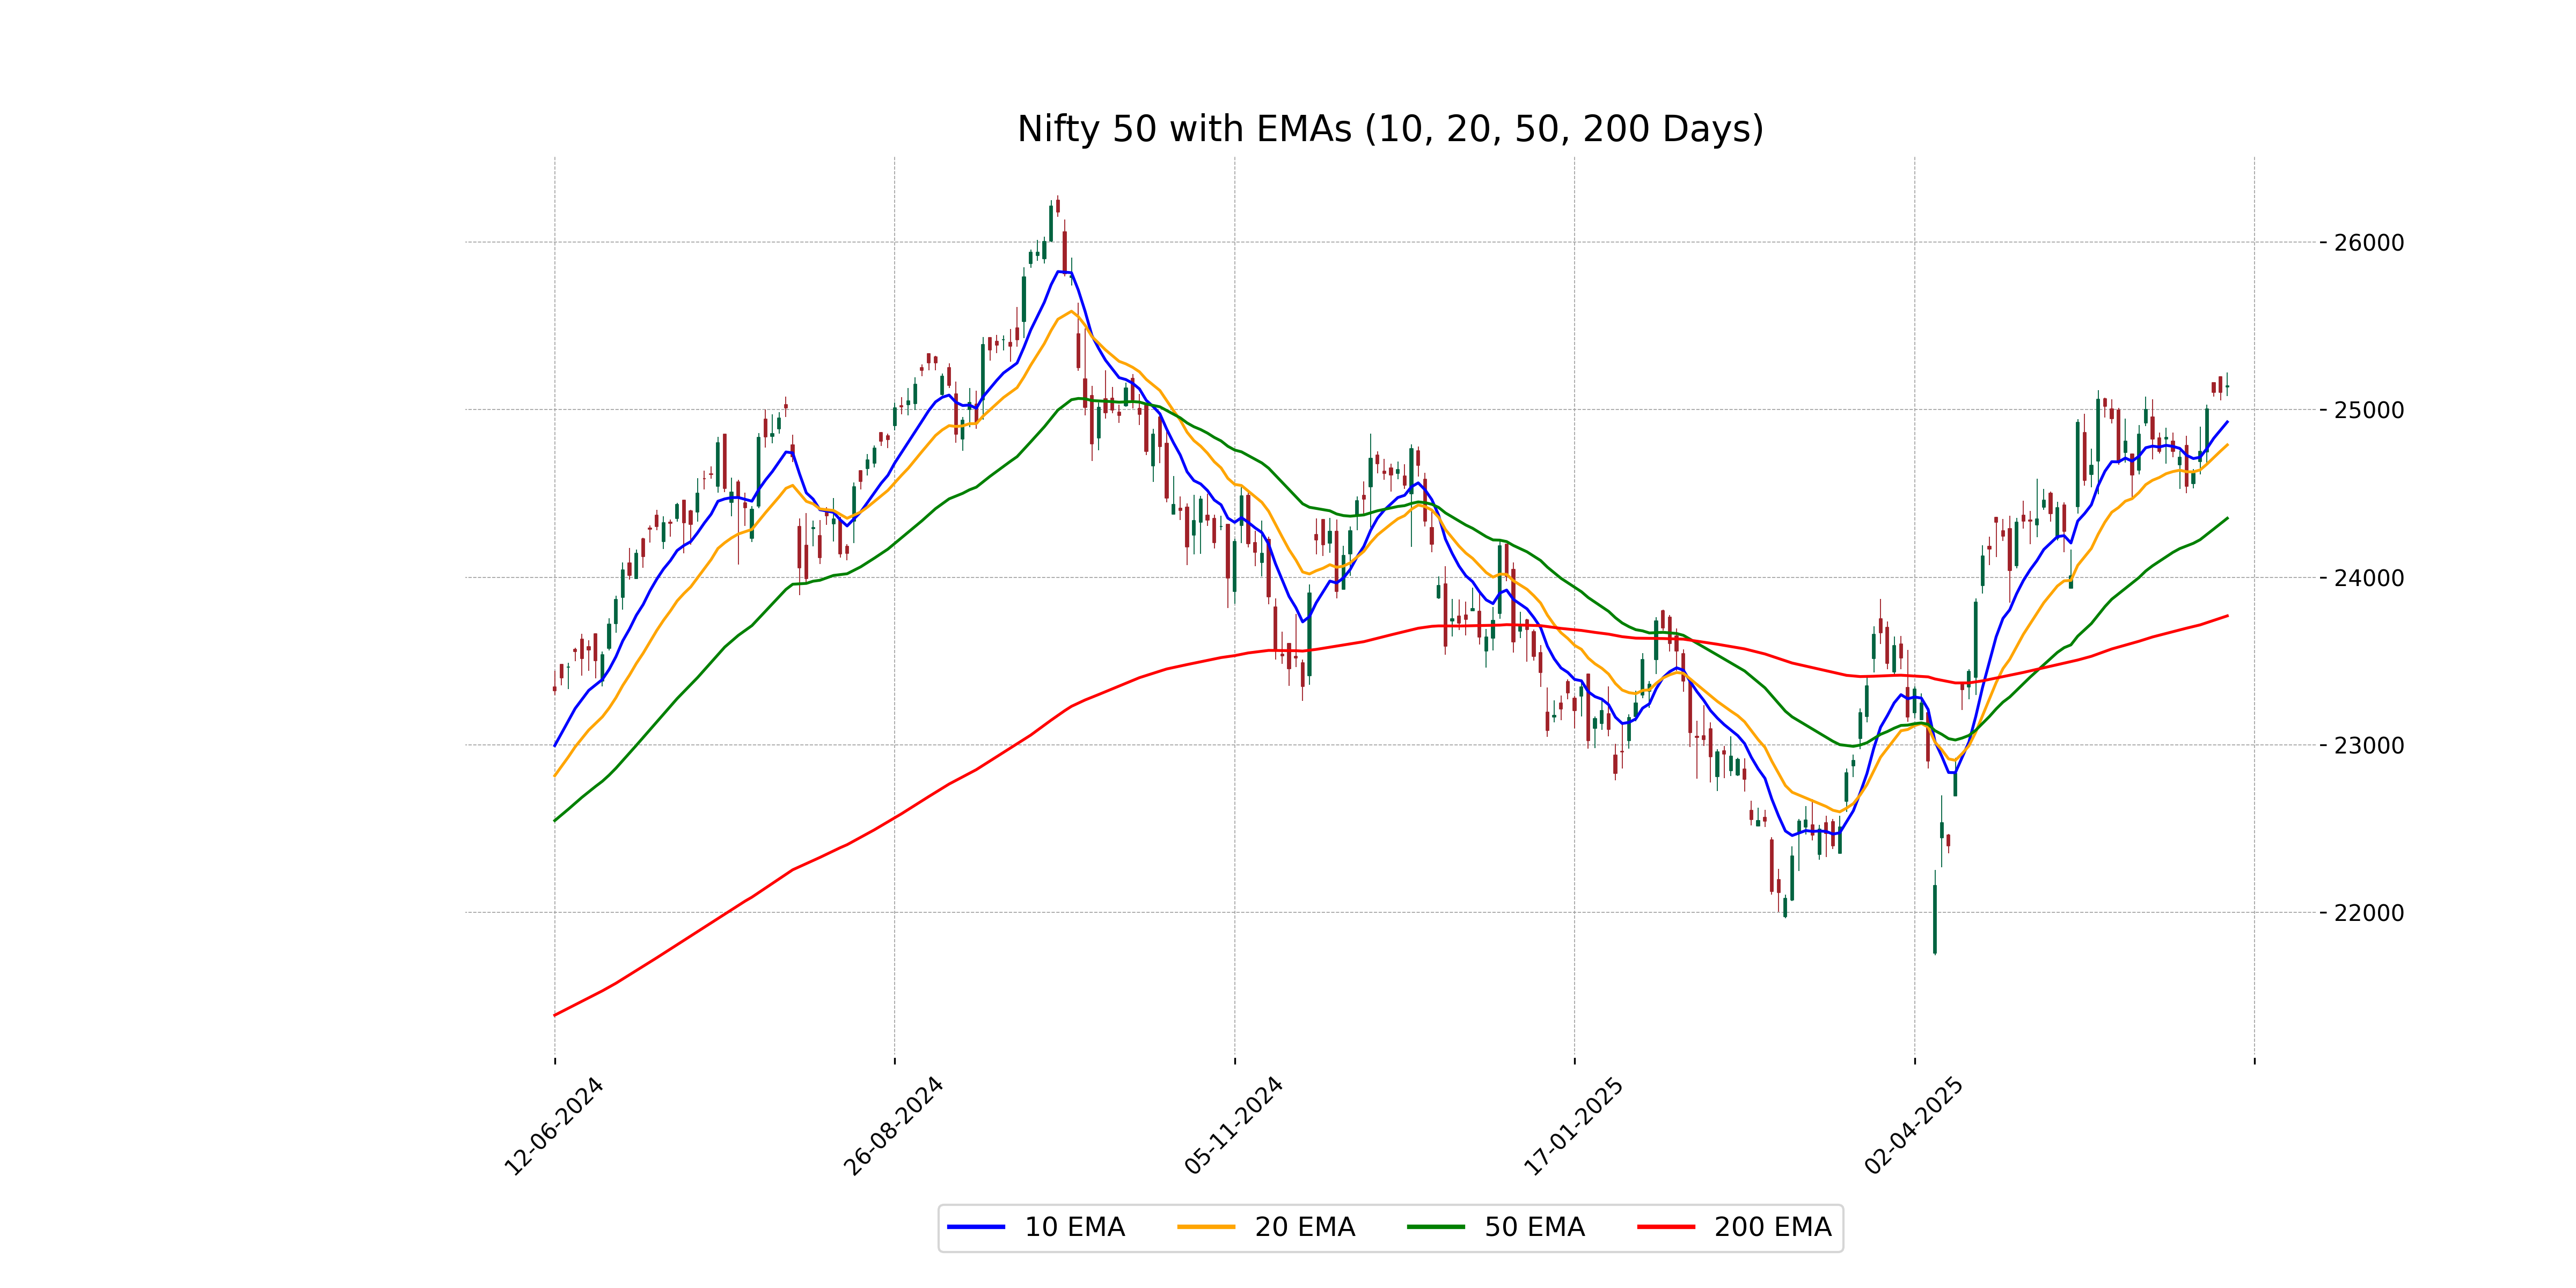
Relationship with Key Moving Averages
The current close of Nifty 50 at 25,141.40 is above its 50 EMA of 24,352.03 and 200 EMA of 23,769.63, indicating a bullish trend. It is also slightly above the 10 EMA of 24,926.81 and 20 EMA of 24,789.68, suggesting short-term bullish momentum.
Moving Averages Trend (MACD)
The MACD value for Nifty 50 is 202.99, which is slightly below the MACD Signal of 205.59. This can indicate a potential bearish signal as the MACD line is crossing below the signal line. However, the difference is minimal, suggesting that the momentum might not be strong.
RSI Analysis
The Relative Strength Index (RSI) for Nifty 50 is at 62.54, which indicates a moderately strong upward momentum approaching overbought conditions. Typically, an RSI above 70 may suggest that the asset is overbought, while an RSI below 30 indicates it may be oversold.
Up Next

Global stock market indices: How the world markets performed today - 11 June 2025

Centre plans to borrow Rs 8.20 lakh cr from market in first half of FY27

Reliance denies buying Iranian oil amid US sanctions waiver

Premium petrol price up Rs 2, industrial diesel up Rs 22; no change in normal petrol, diesel rates

India's GDP expected to register over 8 pc growth in Sep-Dec: Report

Govt announces seven measures to help boost exports

More videos

RBI keeps interest rates on hold after US trade deal boosts outlook

RBI proposes to compensate customers up to Rs 25,000 loss due to fraud

RBI raises GDP growth projection of Q1, Q2 of FY27

RBI pauses rate cuts, retains interest rate at 5.25 pc

Rupee jumps 122 paise to close at 90.27 against US dollar on India-US trade deal

Stock markets cheer India-US trade deal: Sensex, Nifty surge 2.5 pc

UPI transactions hit record high of Rs 230 lakh crore in 2025-26 till Dec: Govt

Explained: India-US trade deal, tariffs and trade benefits

Trade deal with US adds momentum to India's growth ambition: Industry leaders

Rupee jumps 119 paise to 90.30 against the US dollar on India-US trade deal