


Highlights
- Nasdaq and Hang Seng gained with strong MACD and RSI
- FTSE 100 held above EMAs despite weak RSI
- DAX and IBEX showed sideways momentum
Latest news

Samsung Galaxy Z Fold 8, Fold 8 Ultra & Z Flip 8: A More Mature Foldable Family

Dell Launches New Alienware 16X Aurora, 16 Area-51 and 18 Area-51 Gaming Laptops in India

Samsung Takes on Premium Home Audio With New Music Studio Series

The End of OxygenOS: OnePlus Confirms Shift to Oppo's ColorOS

Fujifilm Instax Mini Evo Cinema Review: A Hybrid Camera That Prints Memories Differently

iQOO Teases Z11 Lite With AI Tools, Military-Grade Durability and a 6500mAh Battery

Editorji Launches Hook Global, Its International Digital News Brand

Samsung's Bespoke AI ACs Focus on Humidity, Hygiene and Smarter Cooling
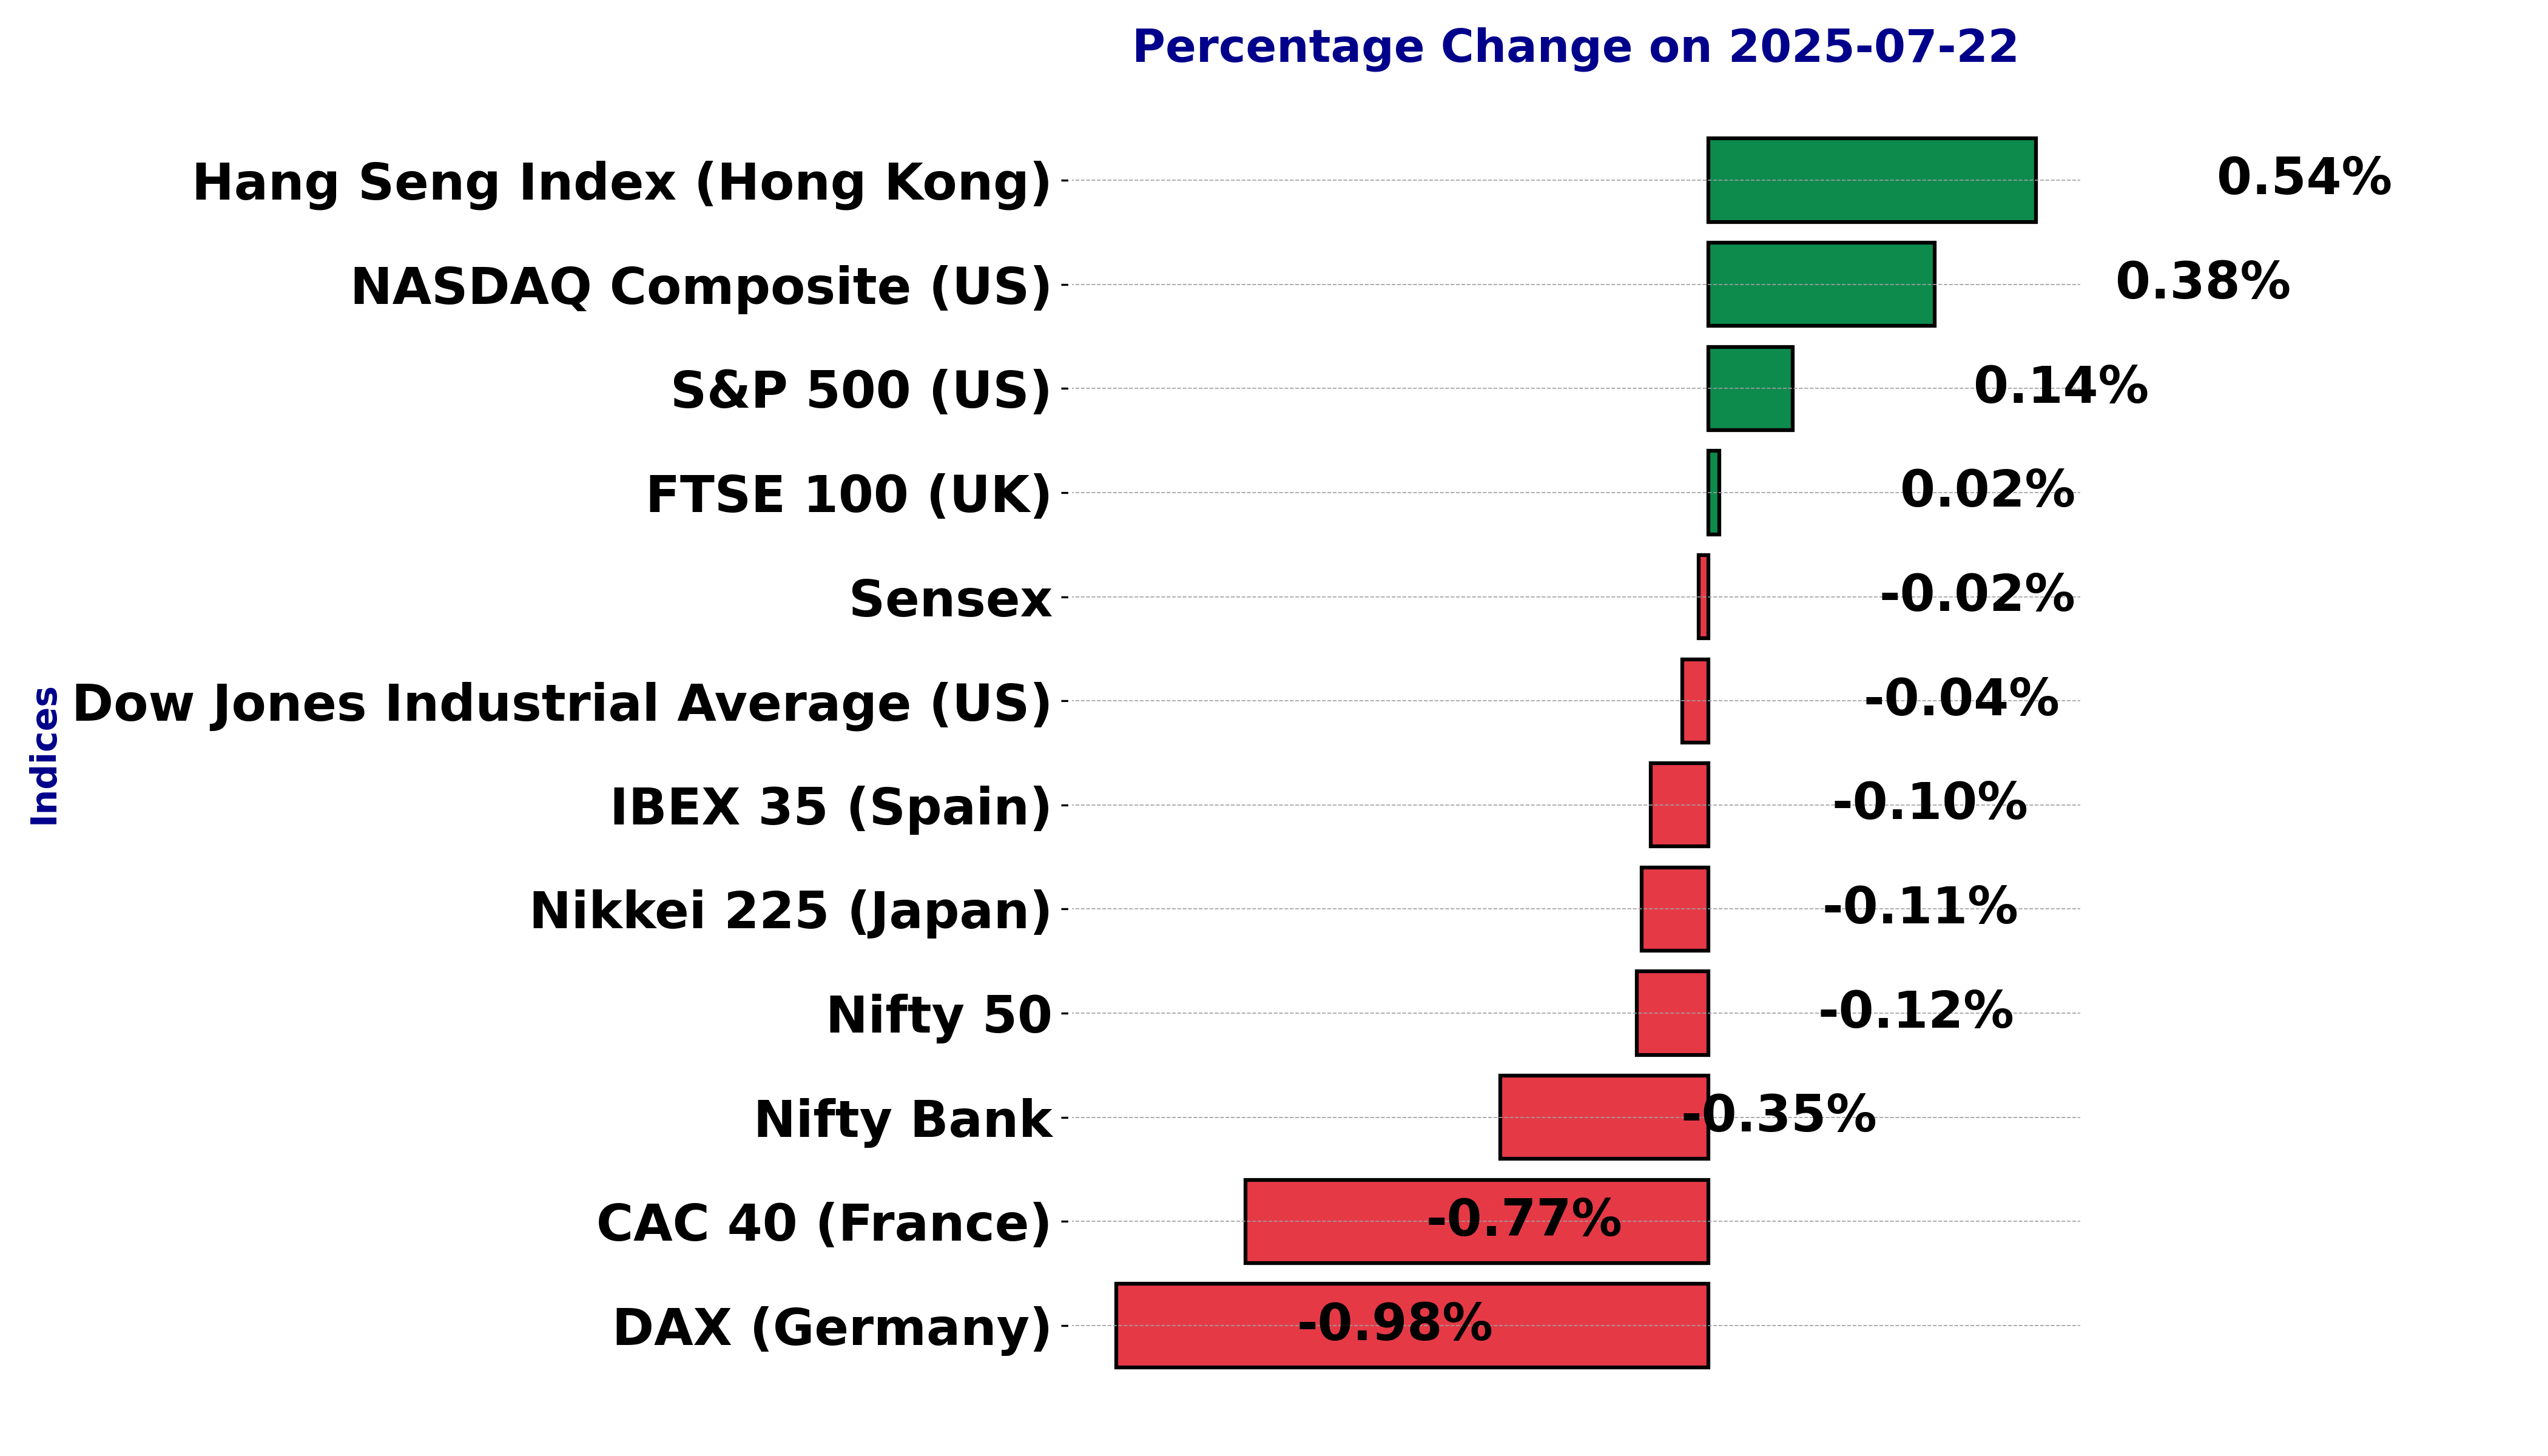
Global stock market indices: How the world markets performed today - 22 July 2025


The international stock market indices showed varied performances on July 22, 2025, reflecting the economic sentiment across different regions.
In this article, we analyze the performance of key global indices including the S&P 500, Dow Jones Industrial Average, NASDAQ Composite, FTSE 100, DAX, CAC 40, IBEX 35, Nikkei 225, Hang Seng, Nifty 50, and BSE Sensex.
Analysis for Sensex - July 22, 2025
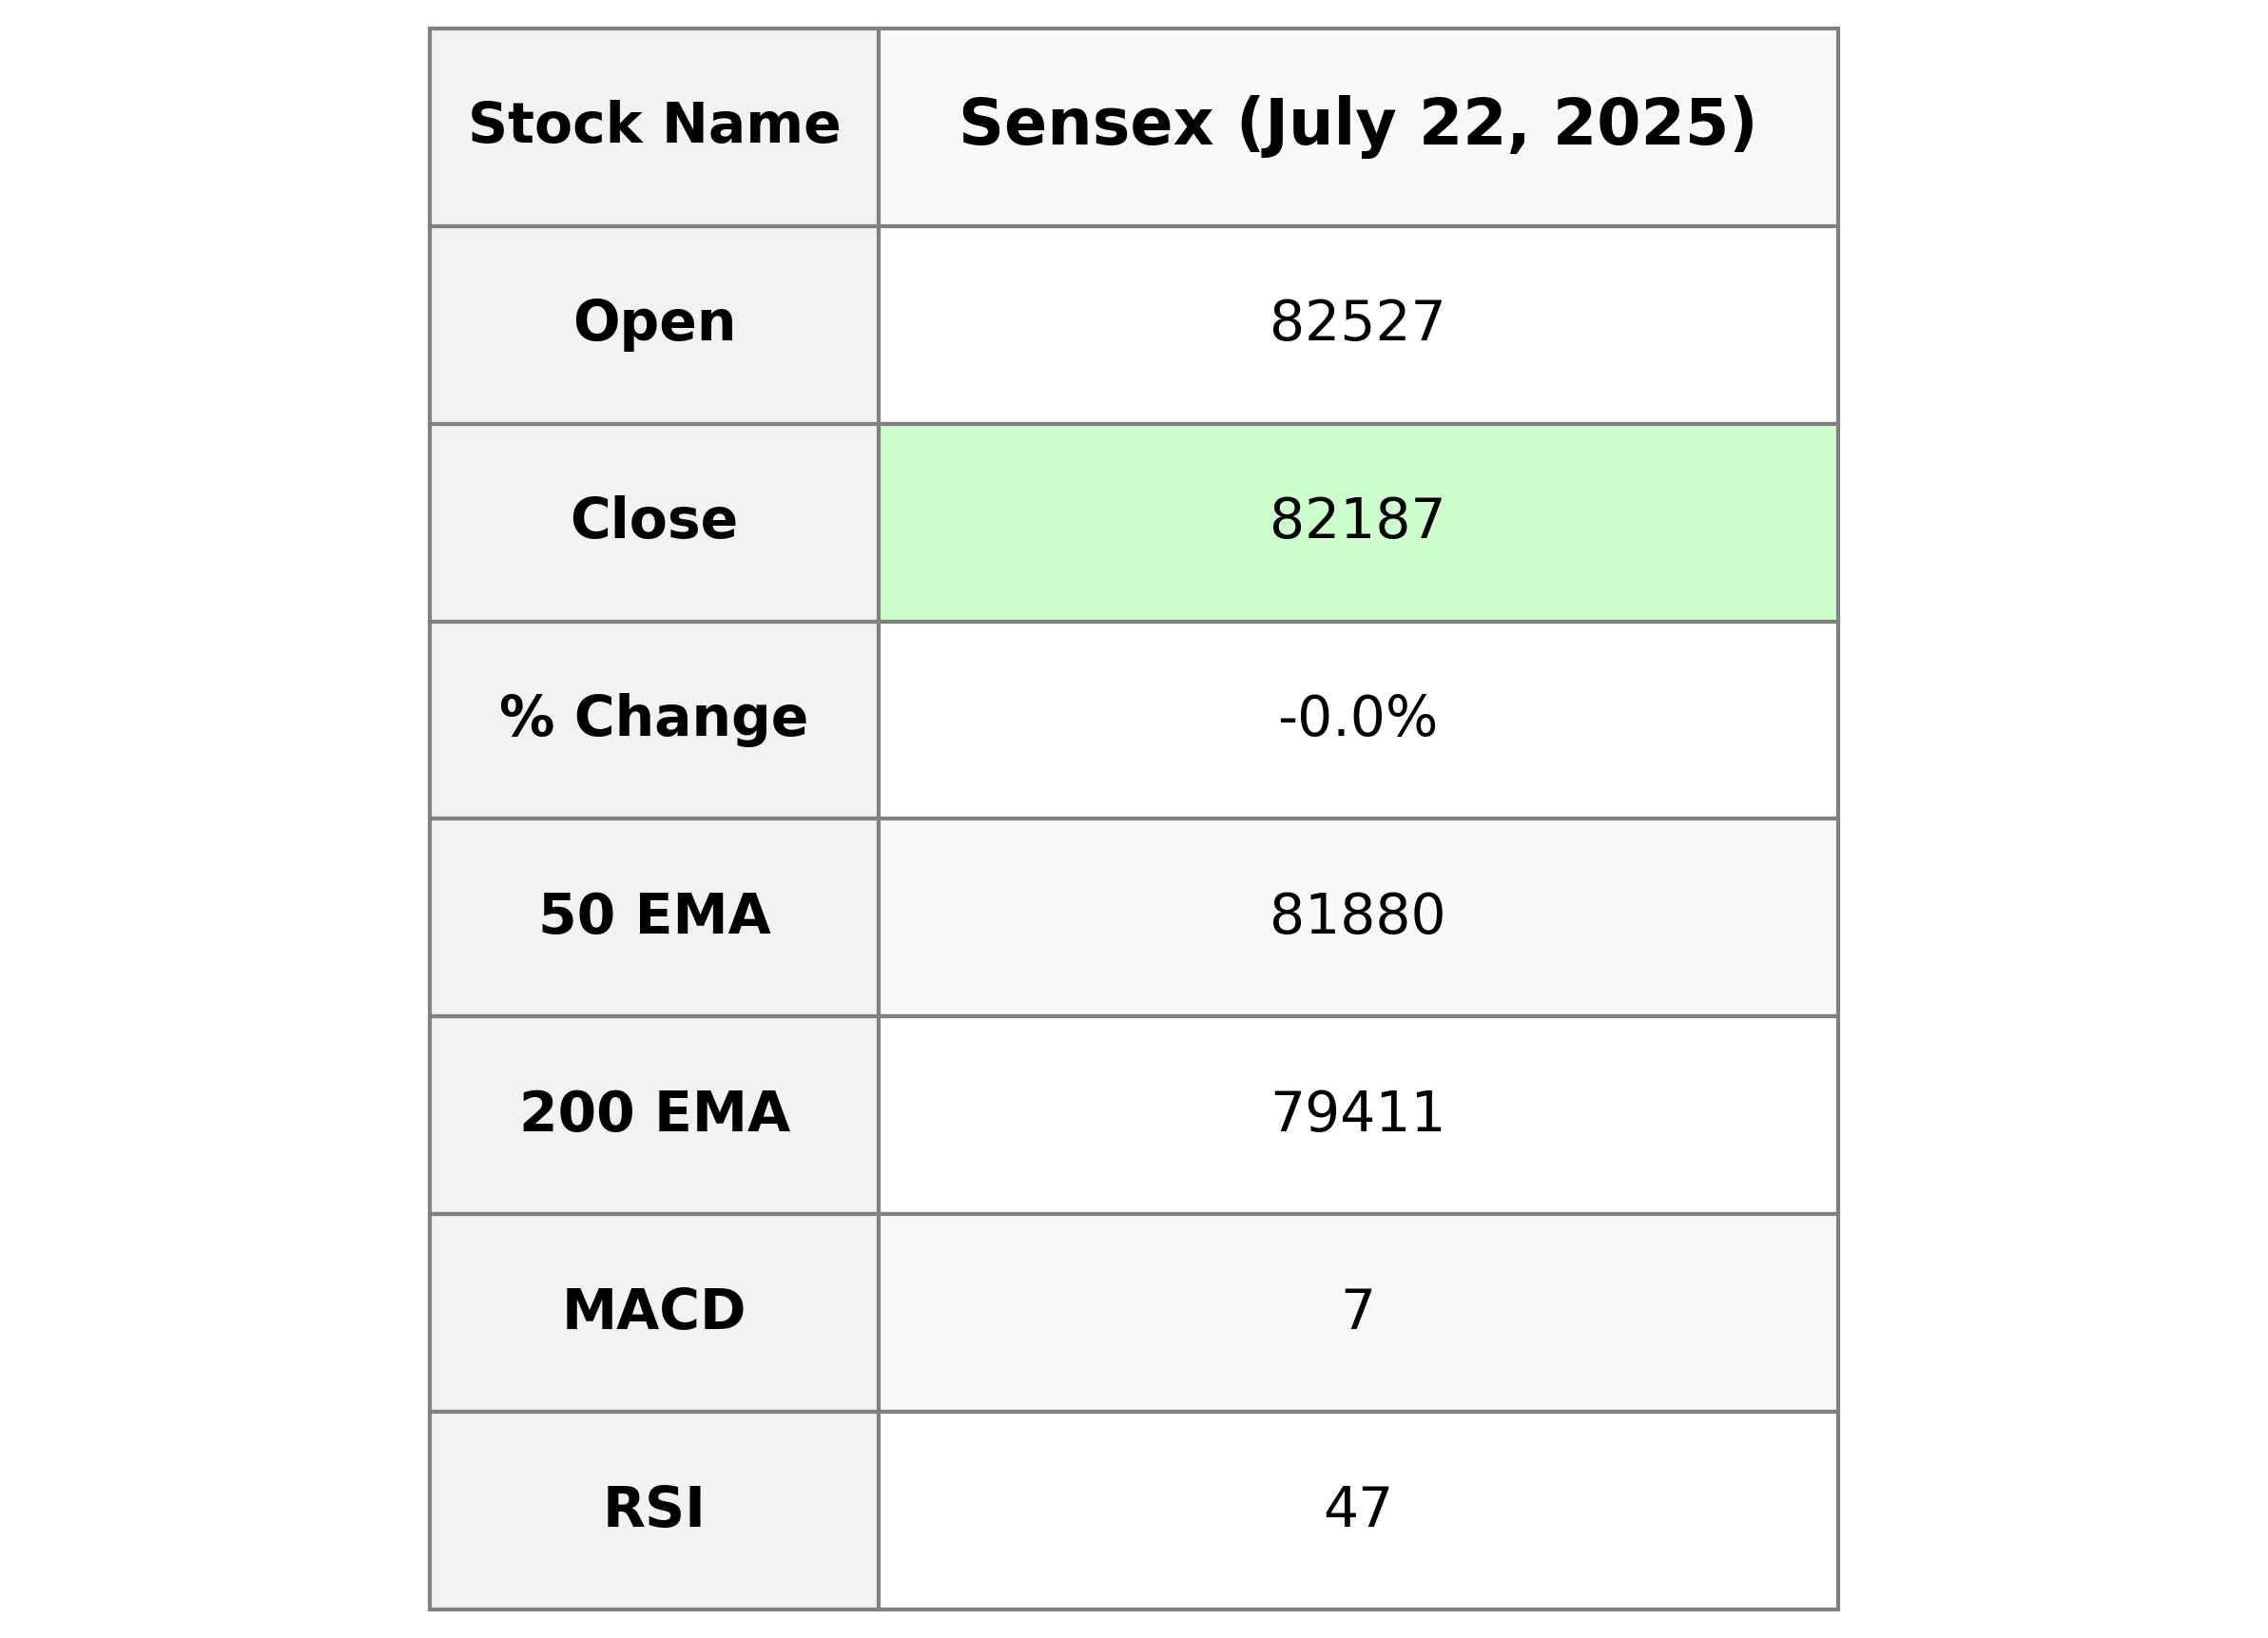
Sensex Performance Overview: The Sensex opened at 82,527.43 and closed at 82,186.81, experiencing a marginal decrease of 13.53 points or approximately -0.016% from the previous close of 82,200.34. The day's trading saw volatility with high and low points of 82,538.17 and 82,110.63, respectively. With an RSI of 46.69, the index is not in overbought or oversold territory, while the MACD stands at 6.57, indicating weaker bullish momentum.
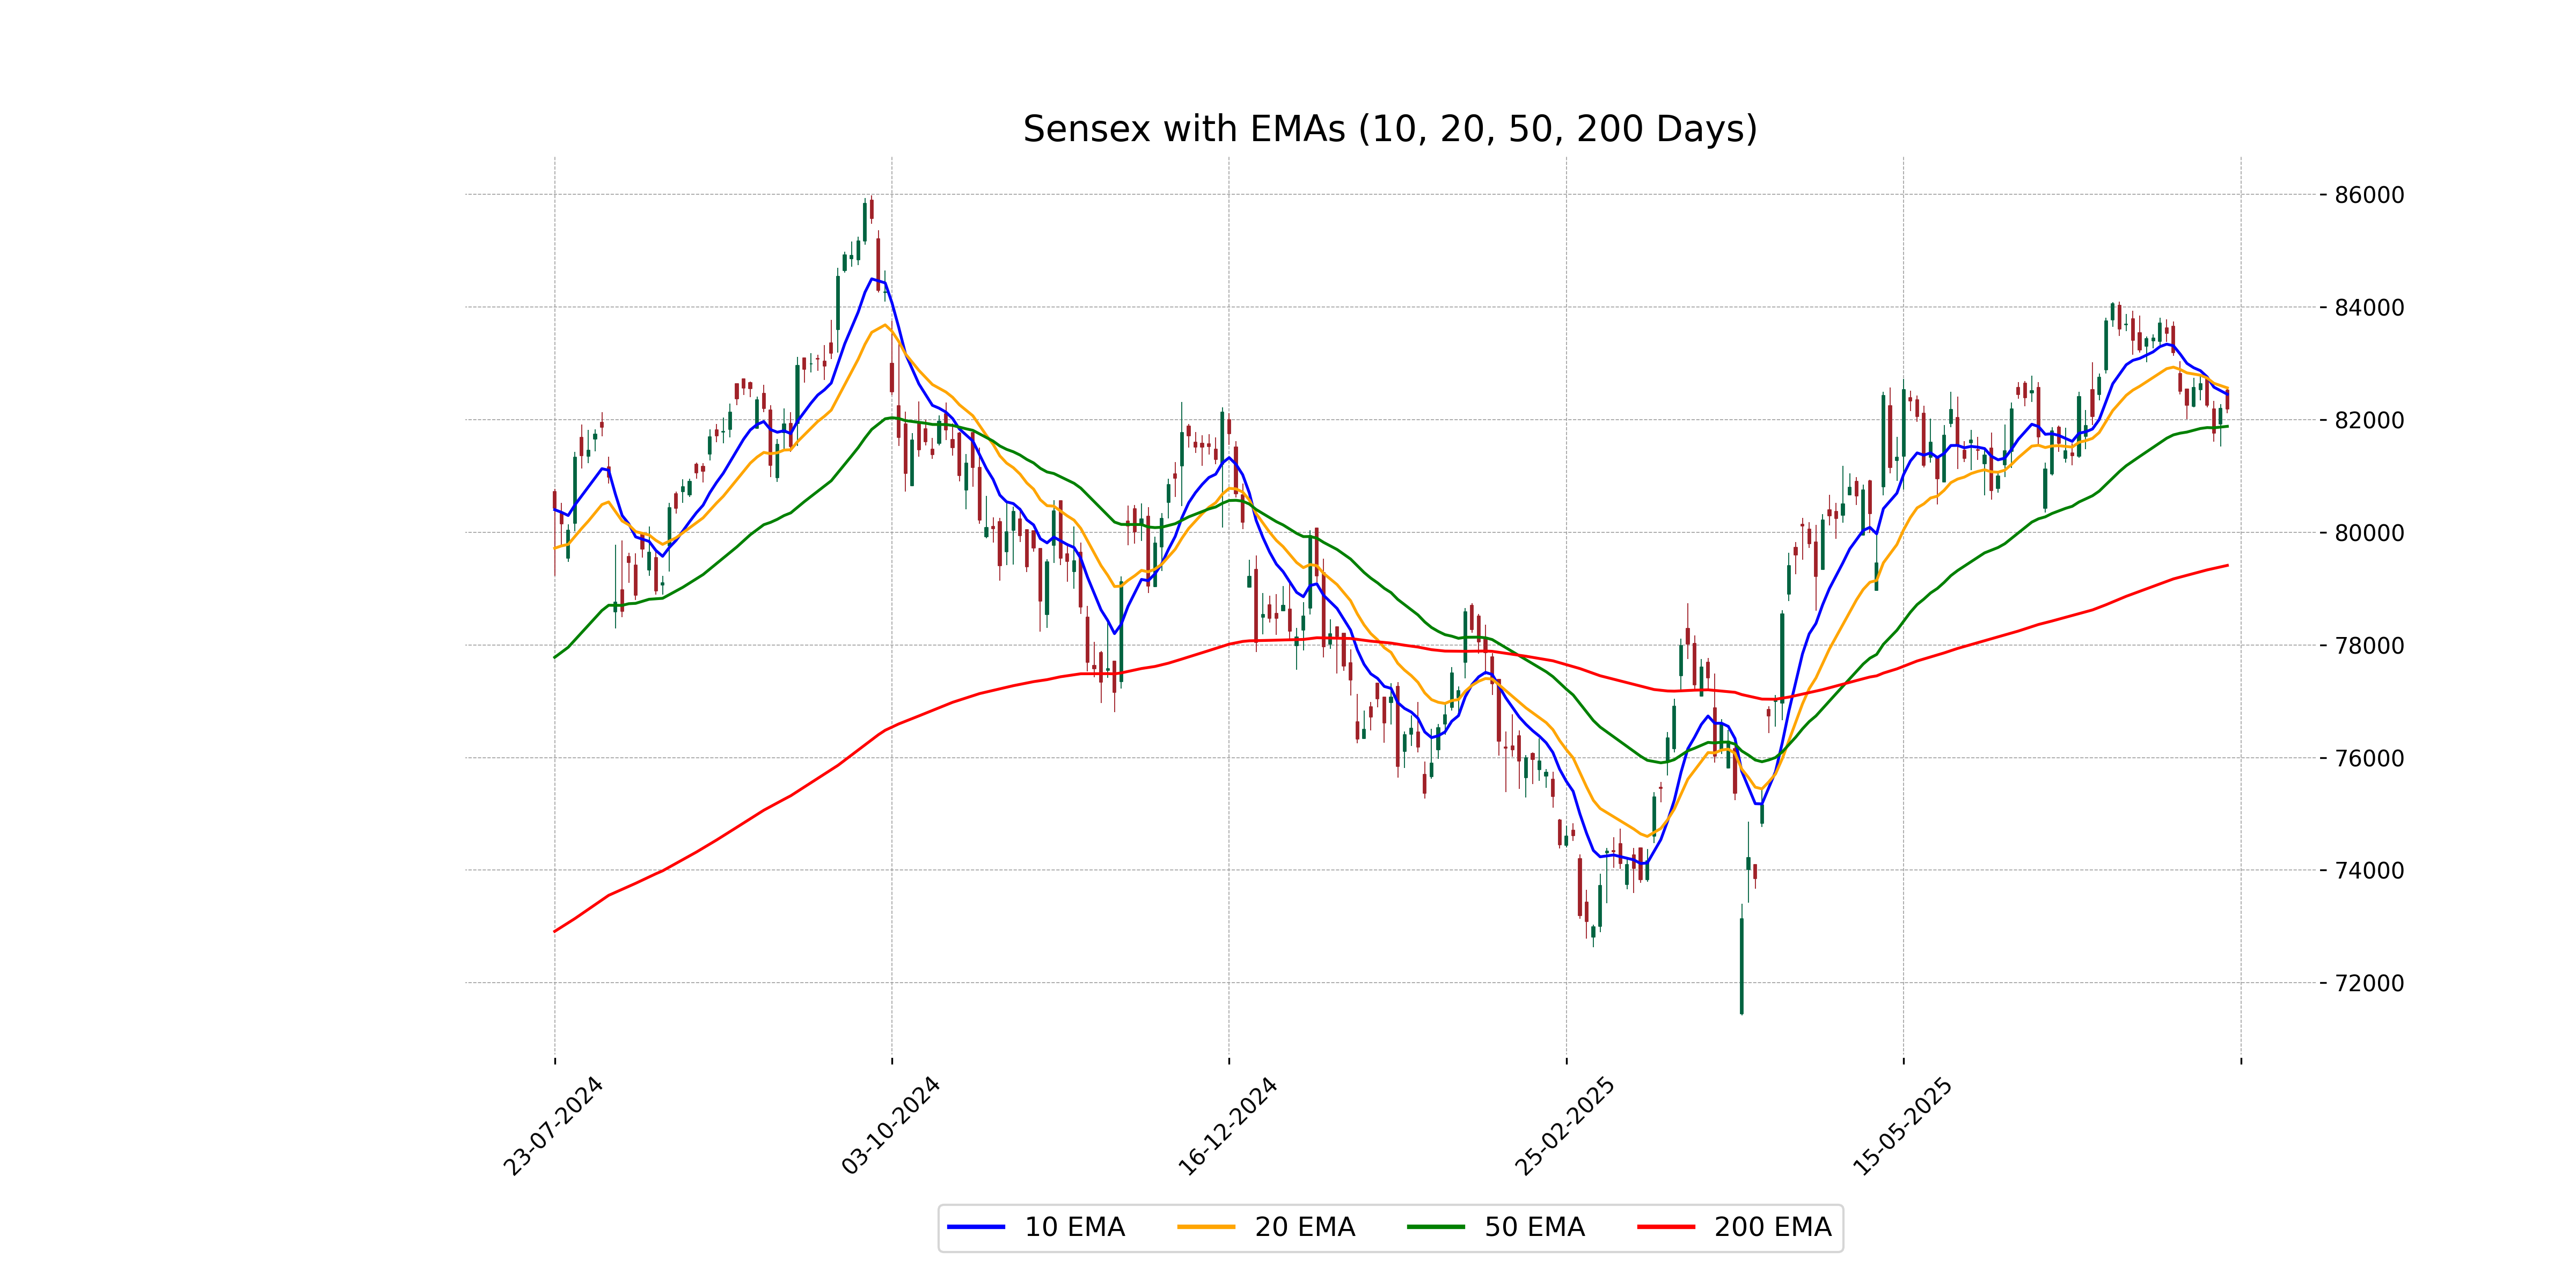
Relationship with Key Moving Averages
Sensex closed below both the 10-day (82449.51) and 20-day (82563.02) EMAs, indicating short-term bearish momentum. It remains above the 50-day EMA (81880.36), suggesting a longer-term bullish trend. The MACD is below its signal line, which may support a bearish outlook.
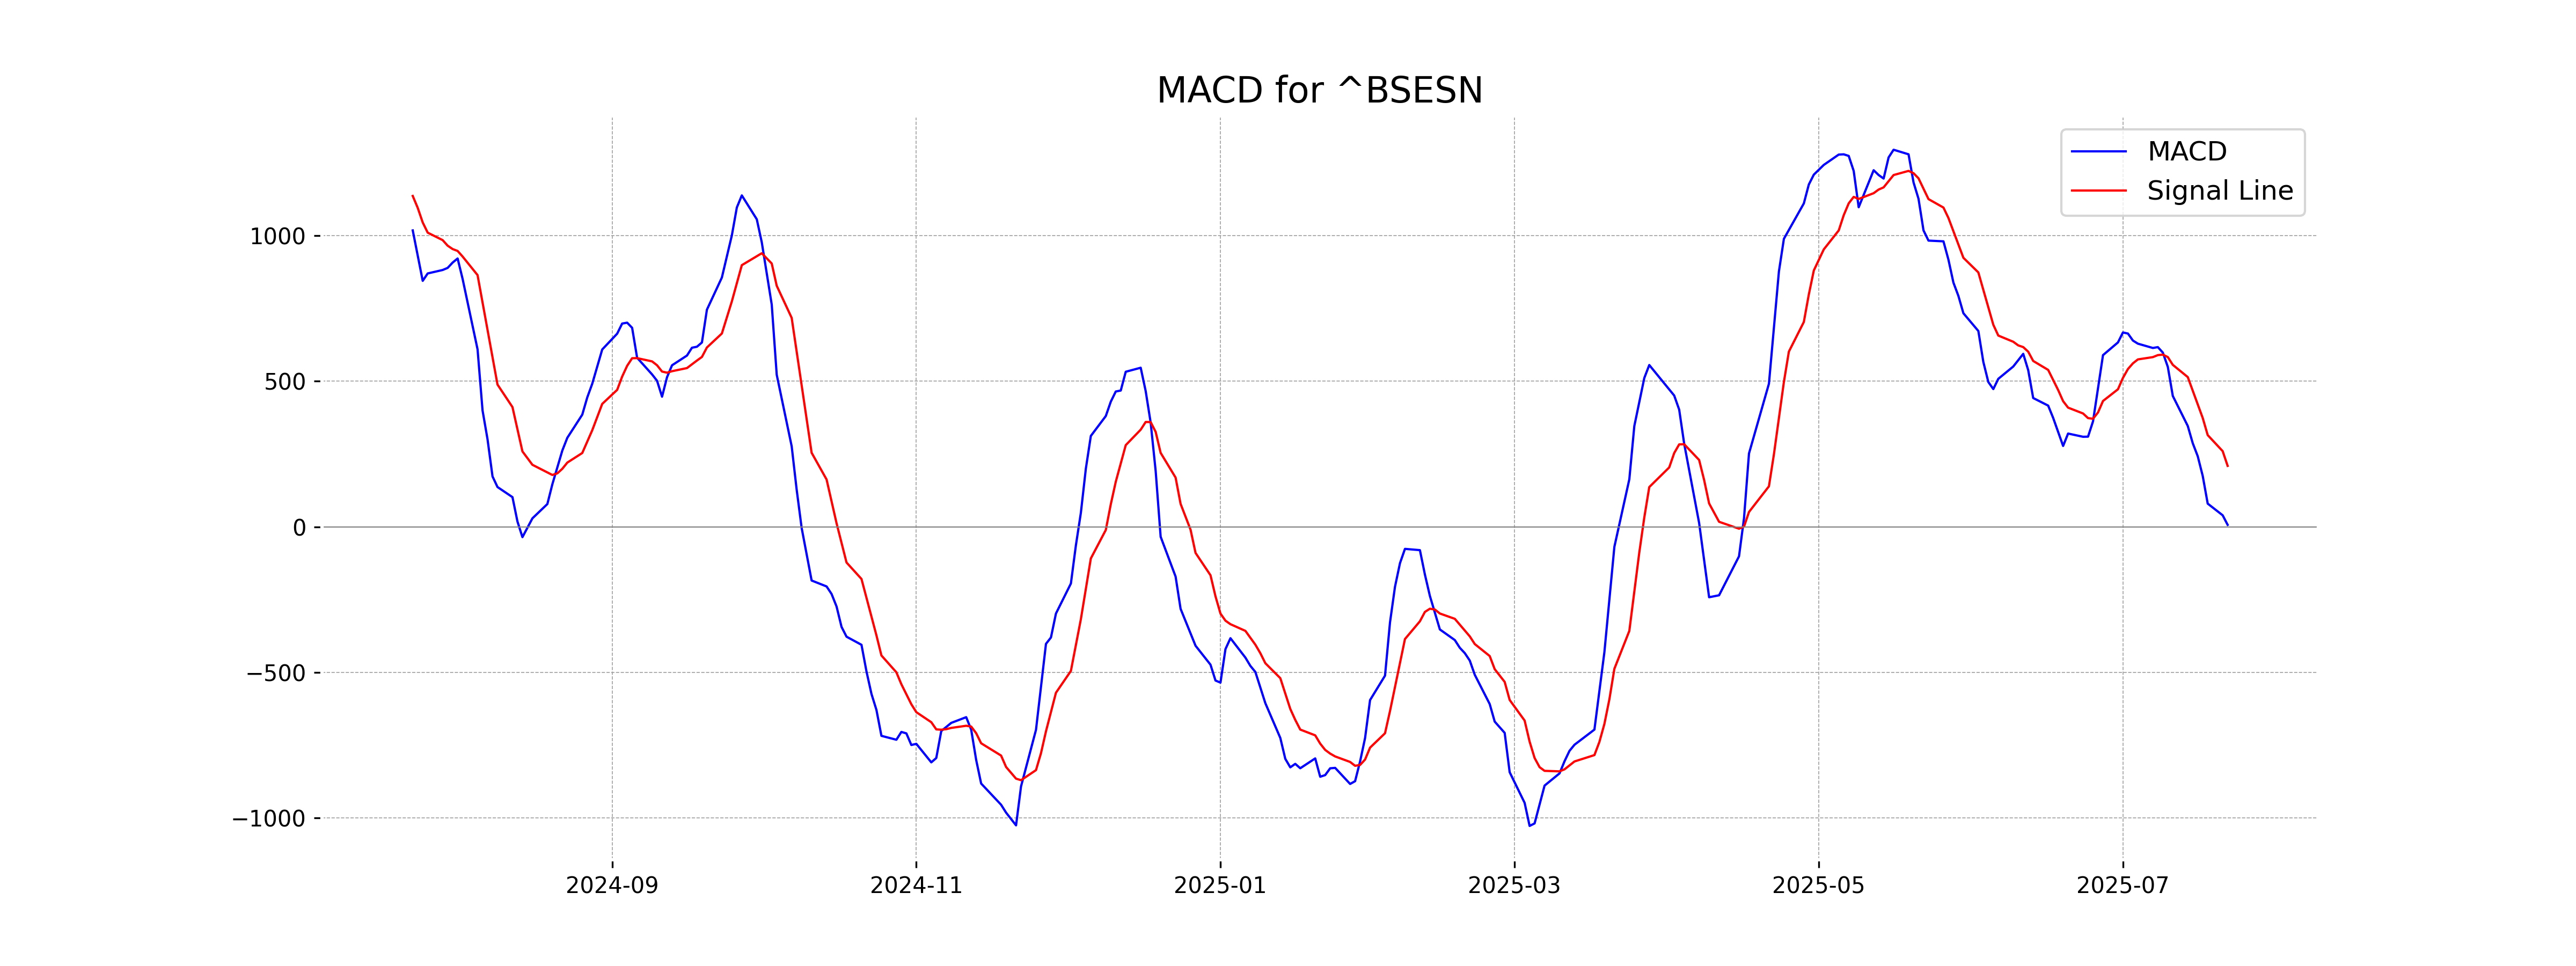
Moving Averages Trend (MACD)
MACD Analysis for Sensex: The MACD value is 6.57, which is significantly lower than the MACD Signal value of 209.10, indicating a bearish trend. This suggests that the momentum is currently weak and there might be an increased probability of a downward movement in the short term.
RSI Analysis
The RSI (Relative Strength Index) for Sensex is currently at 46.69, indicating a neutral position as it is near the middle of the range between 0 and 100. This suggests that the index is neither in overbought nor oversold territory, leaving room for potential movement in either direction.
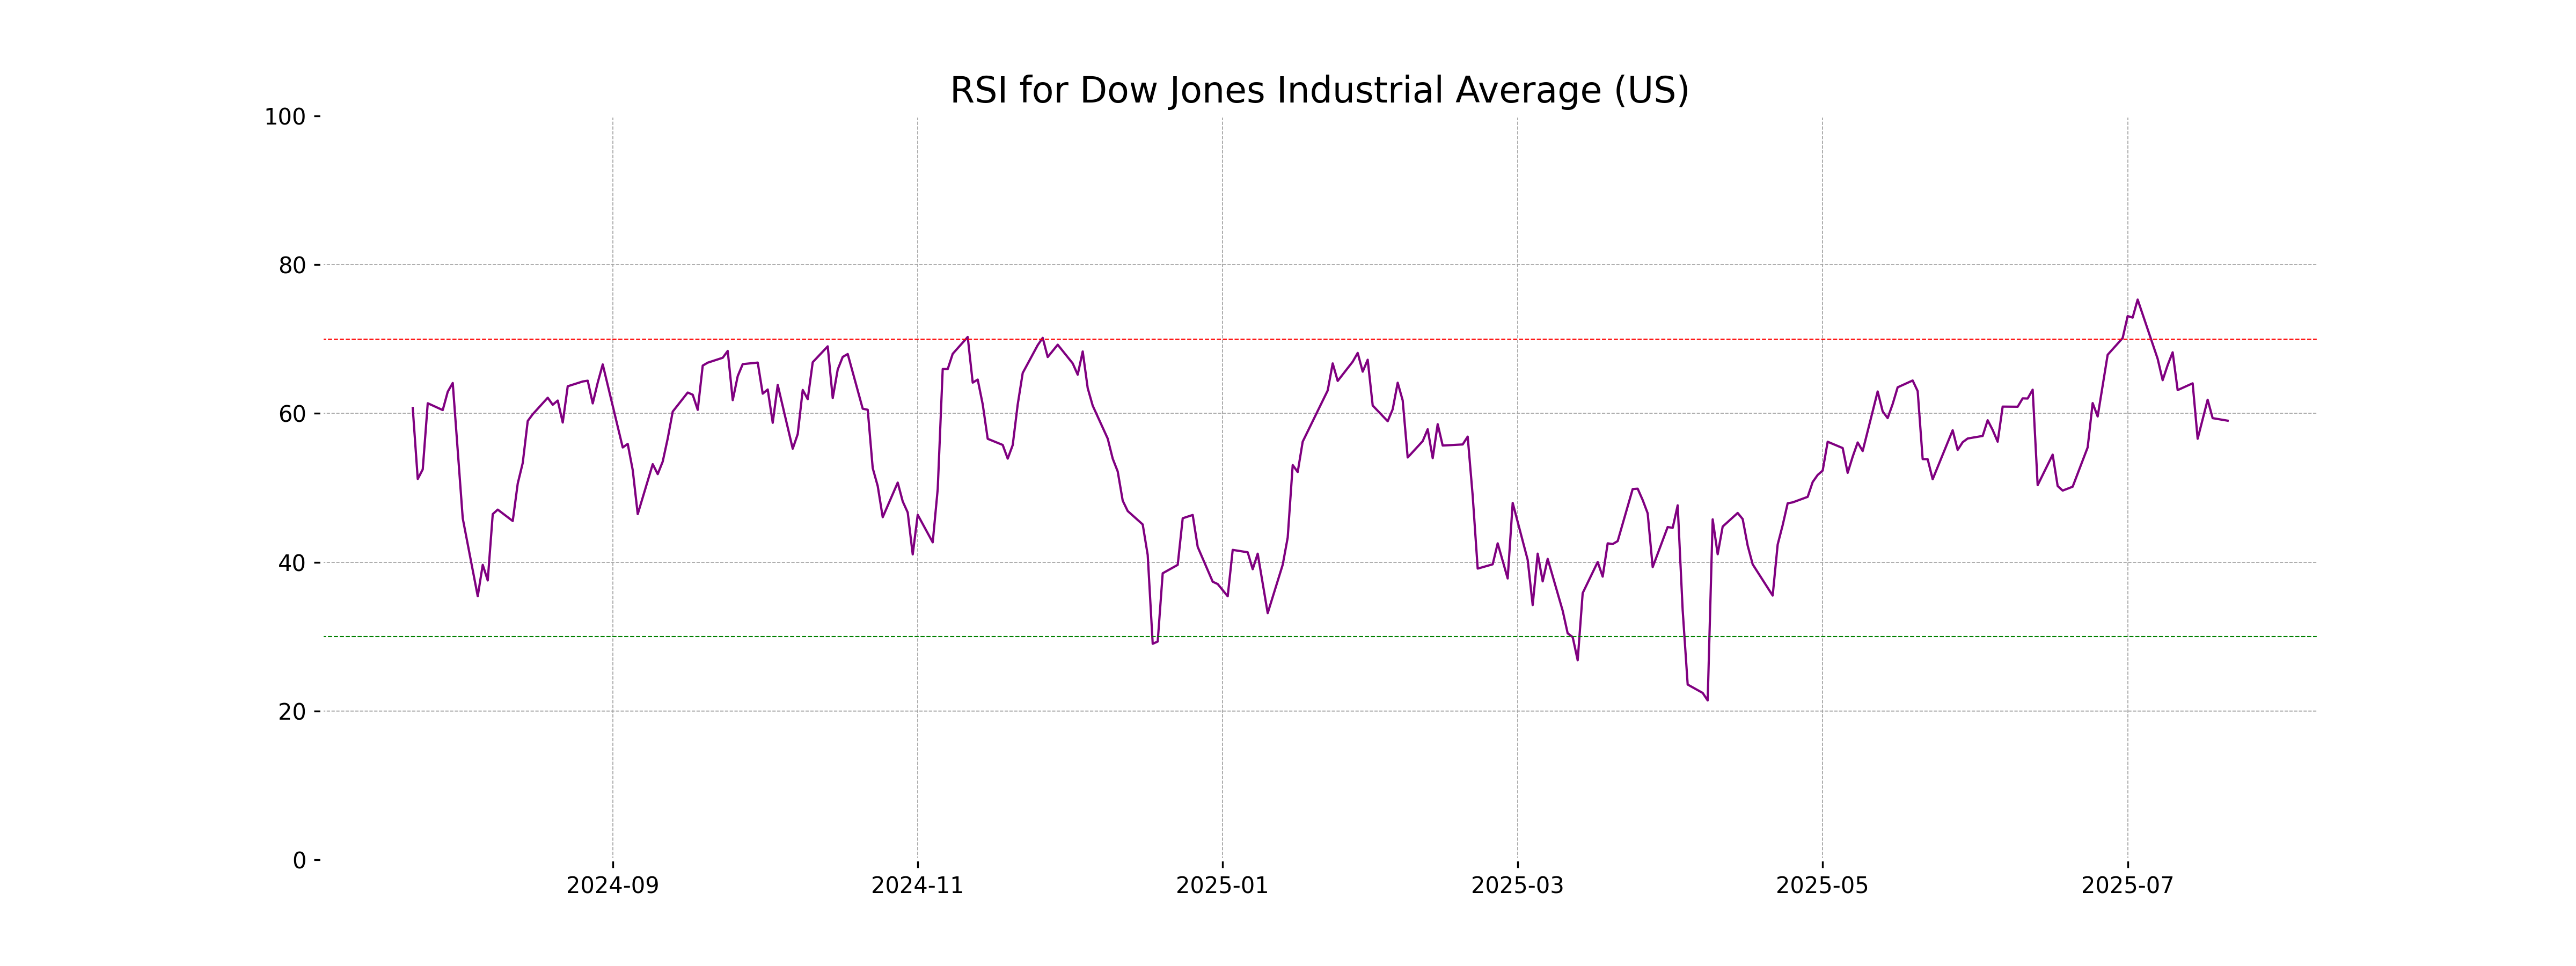
Analysis for Dow Jones Industrial Average (US) - July 22, 2025
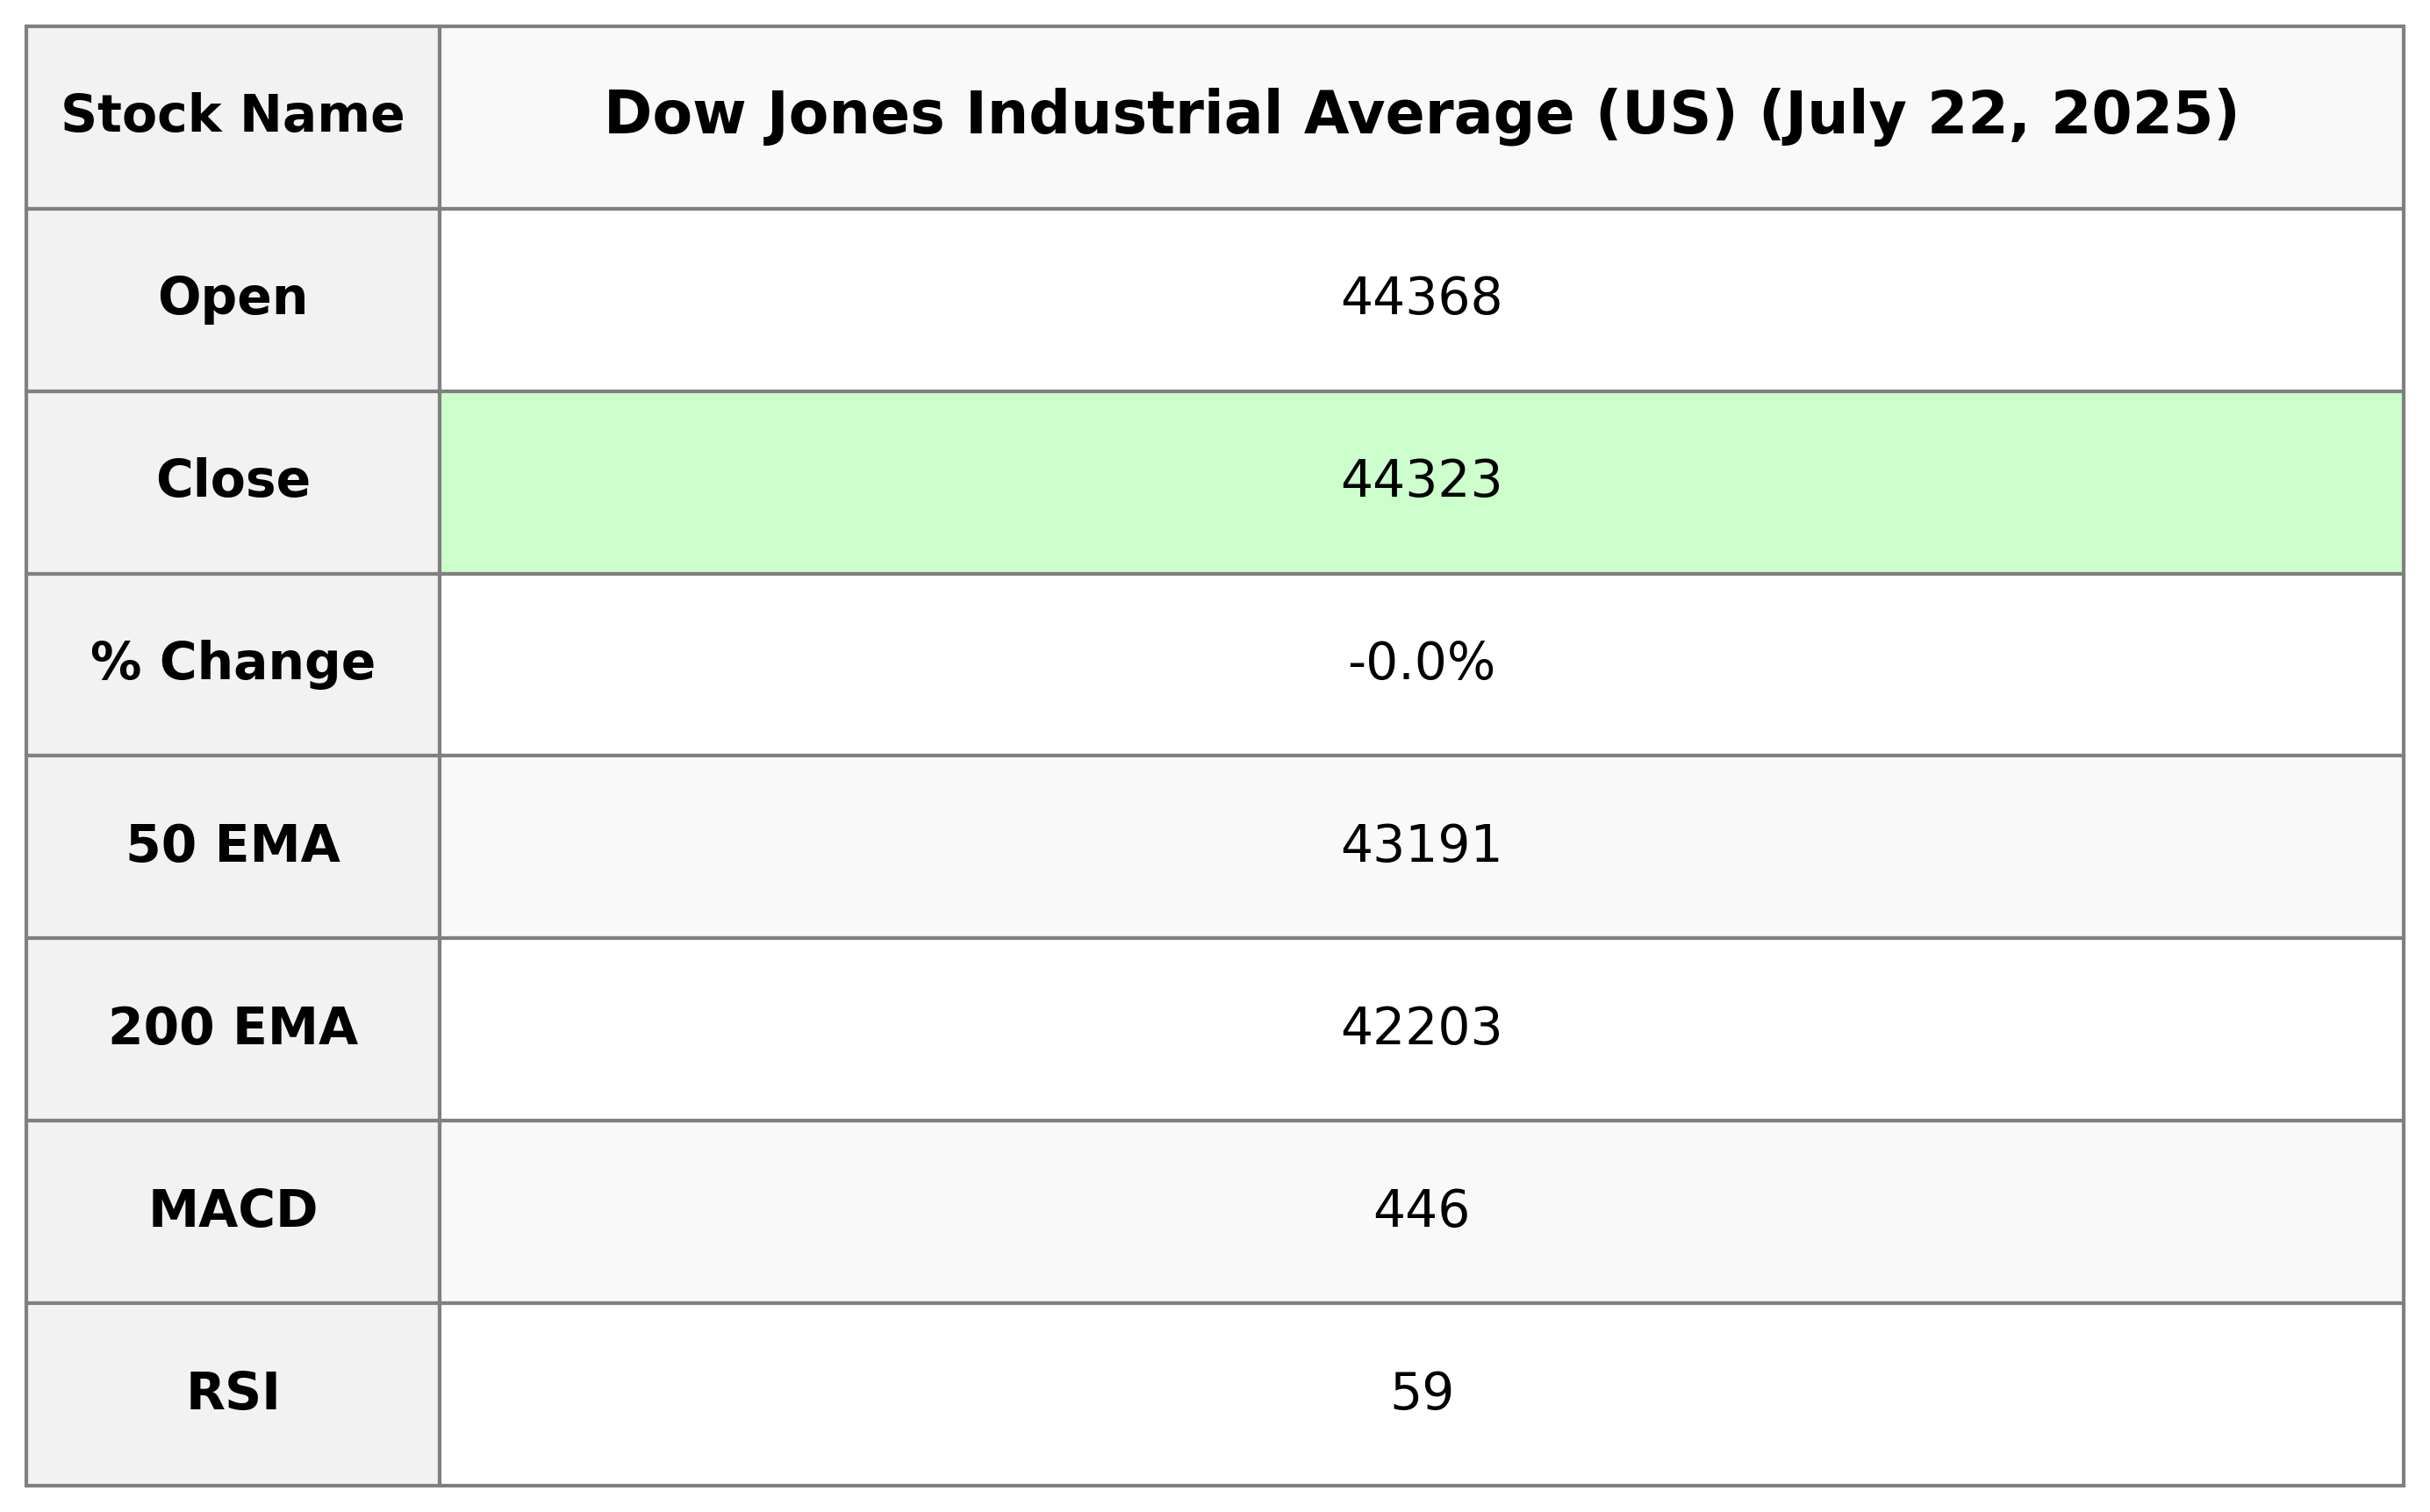
The Dow Jones Industrial Average (US) opened at 44,368.40 and closed at 44,323.07, reflecting a slight decline of 0.04%. It experienced a daily range with a high of 44,601.85 and a low of 44,311.42. The index's RSI is moderately positioned at 59.03, and its MACD indicator is below the signal line, suggesting bearish momentum.
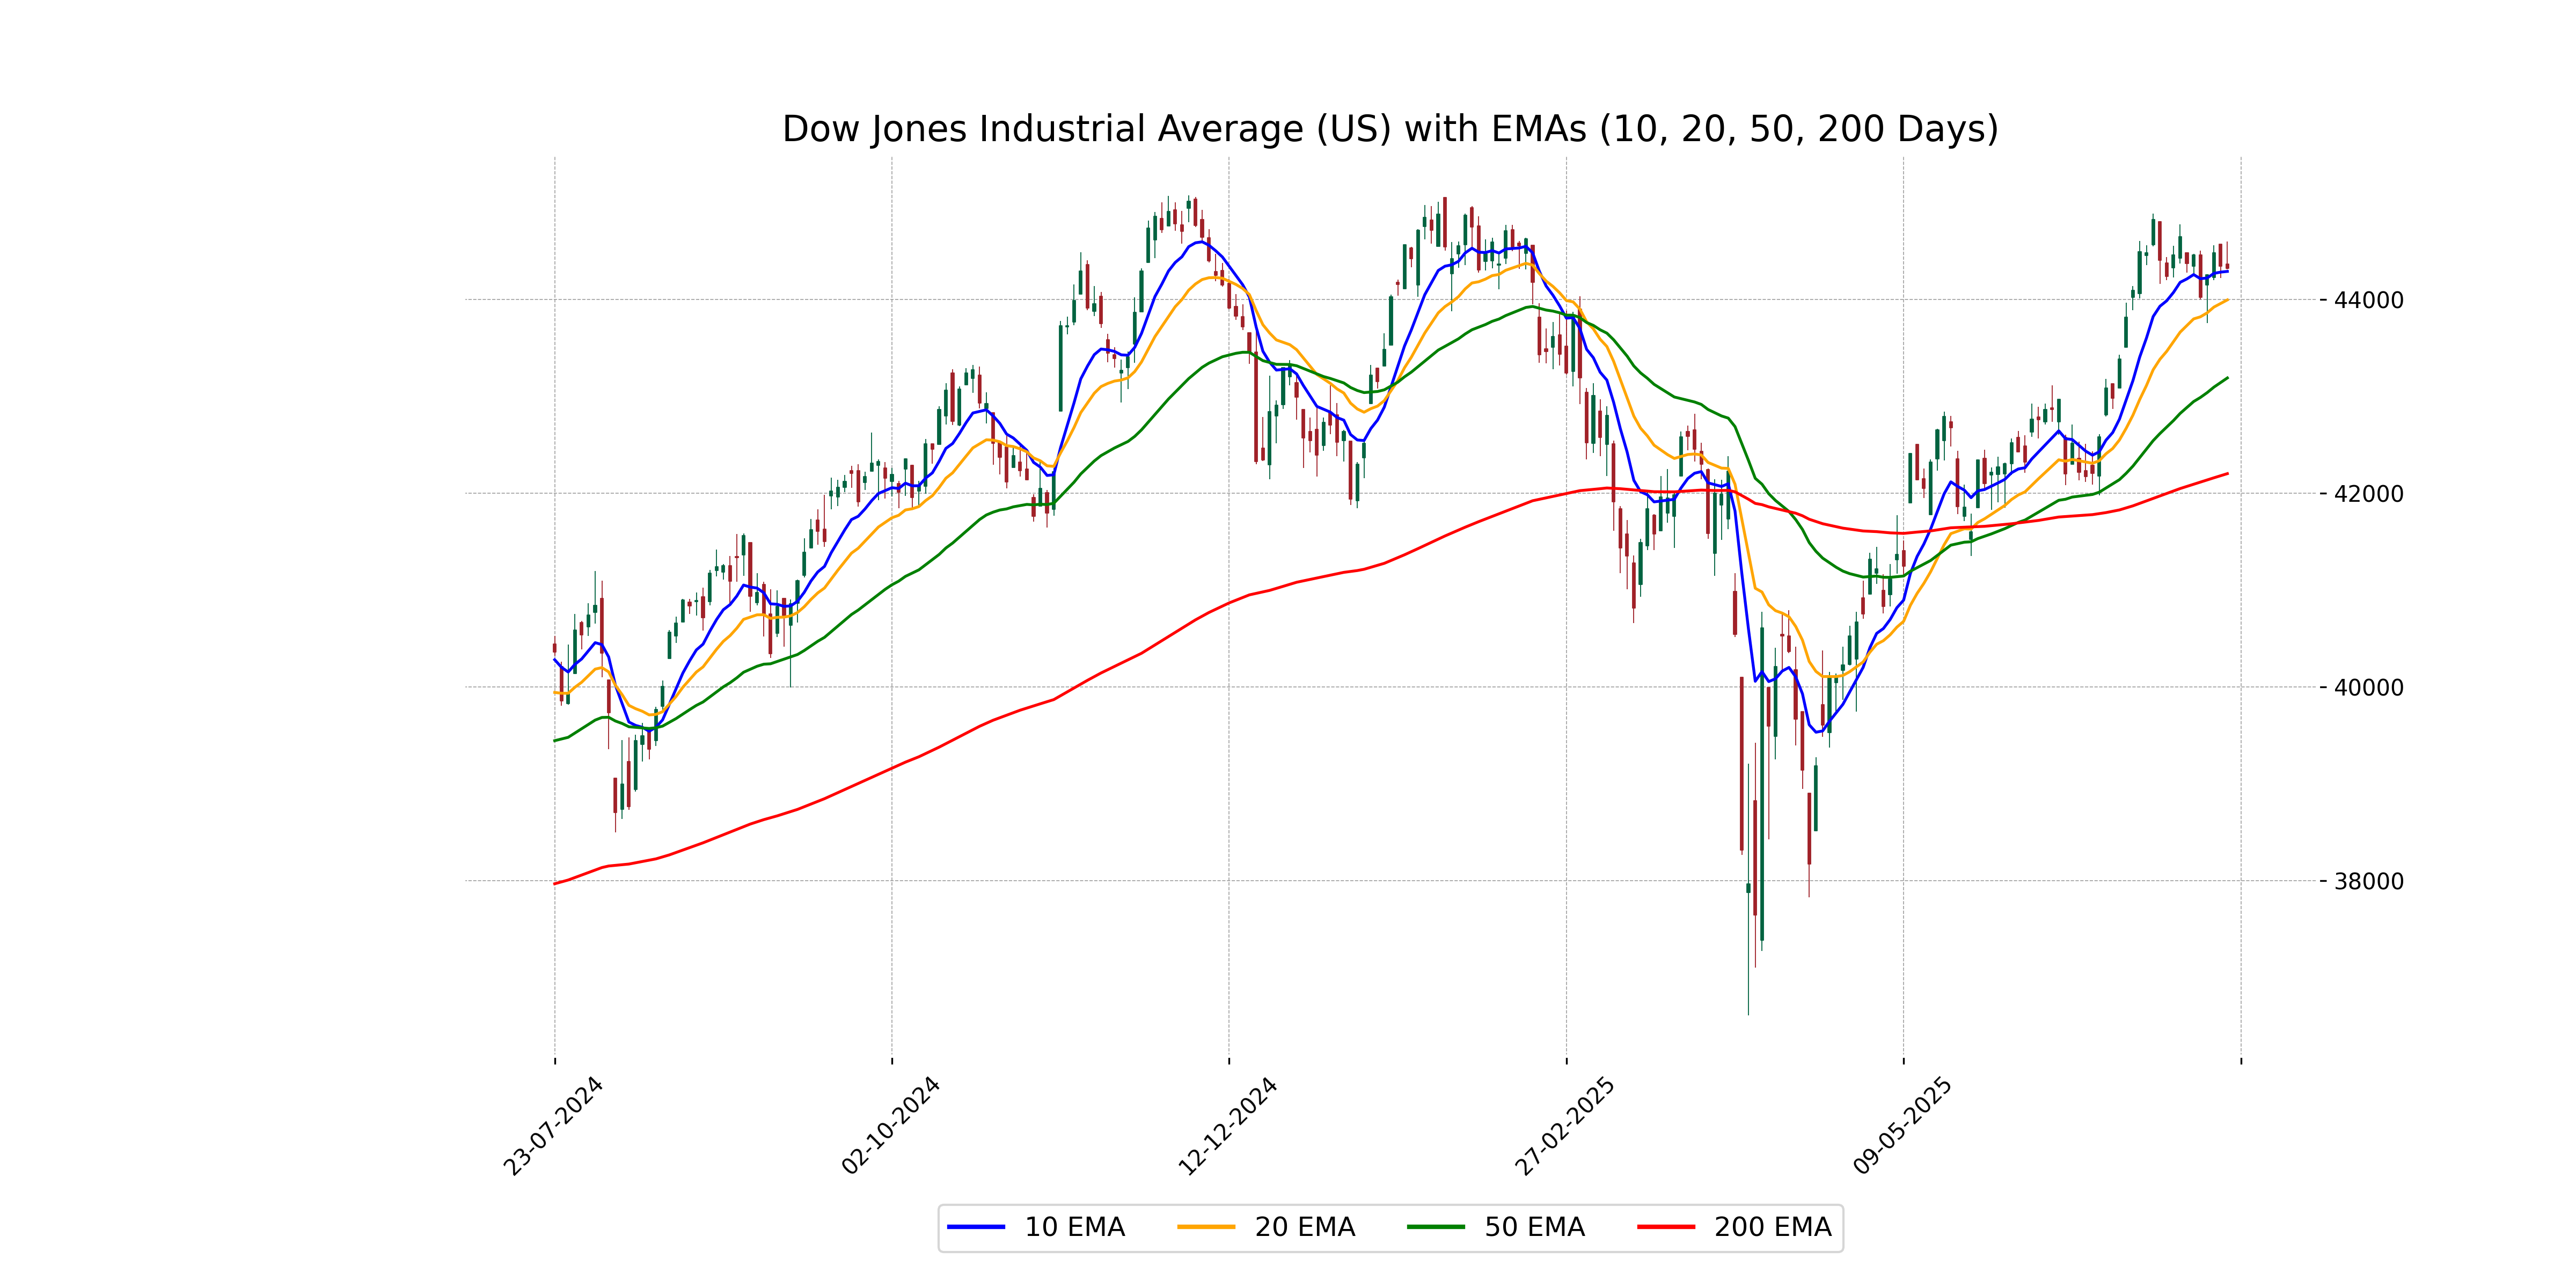
Relationship with Key Moving Averages
The Dow Jones Industrial Average opened above its 10, 20, 50, and 200-day EMAs, indicating a generally upward recent trend. However, it closed slightly below its opening, suggesting some short-term resistance. With an RSI around 59, the index shows mild bullish momentum.
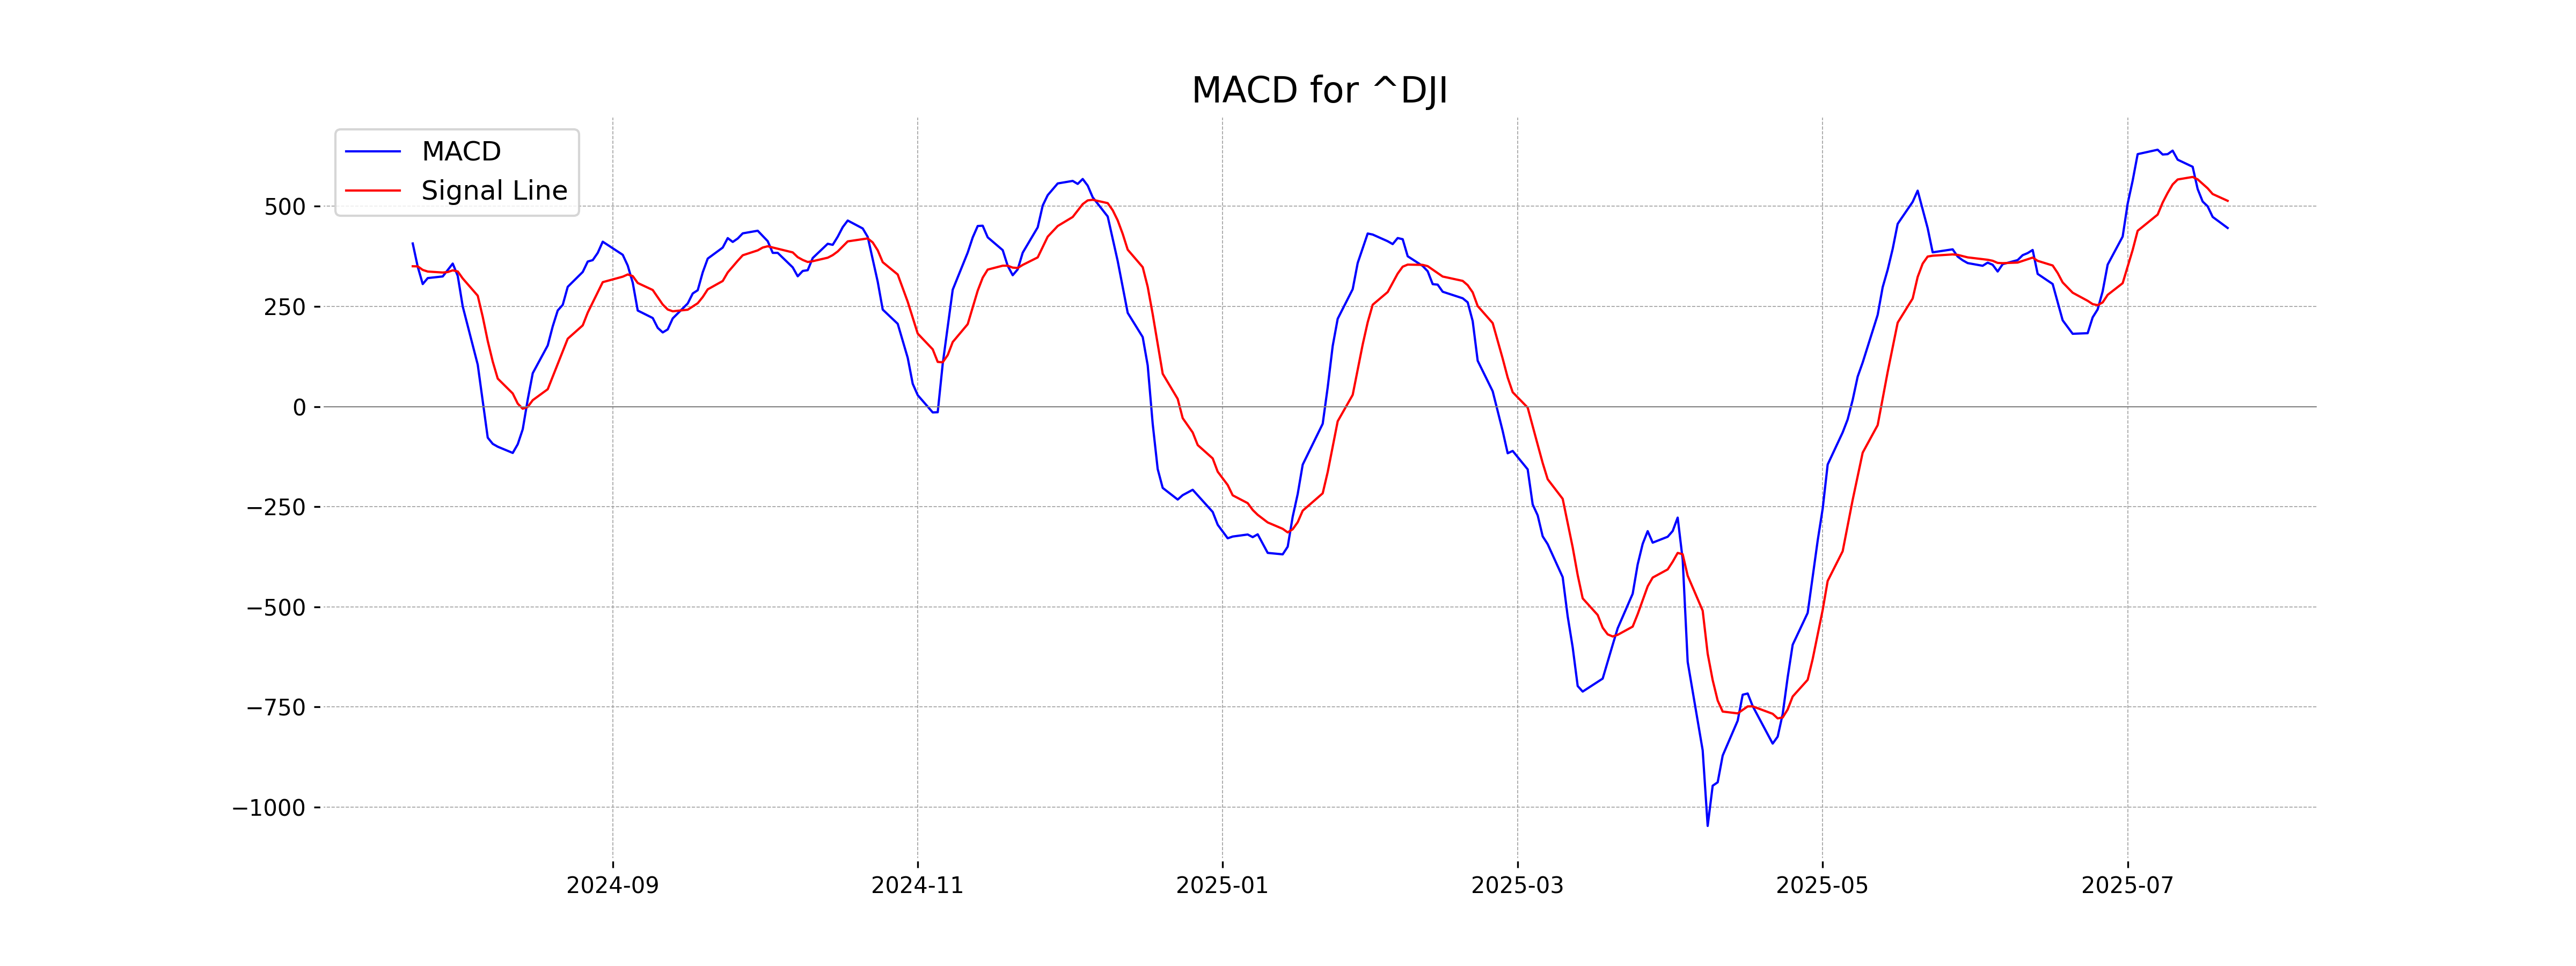
Moving Averages Trend (MACD)
The MACD for the Dow Jones Industrial Average shows a value of 445.84, which is below its MACD Signal line of 513.65. This suggests a bearish sentiment, indicating potential downside momentum for the index in the short term.
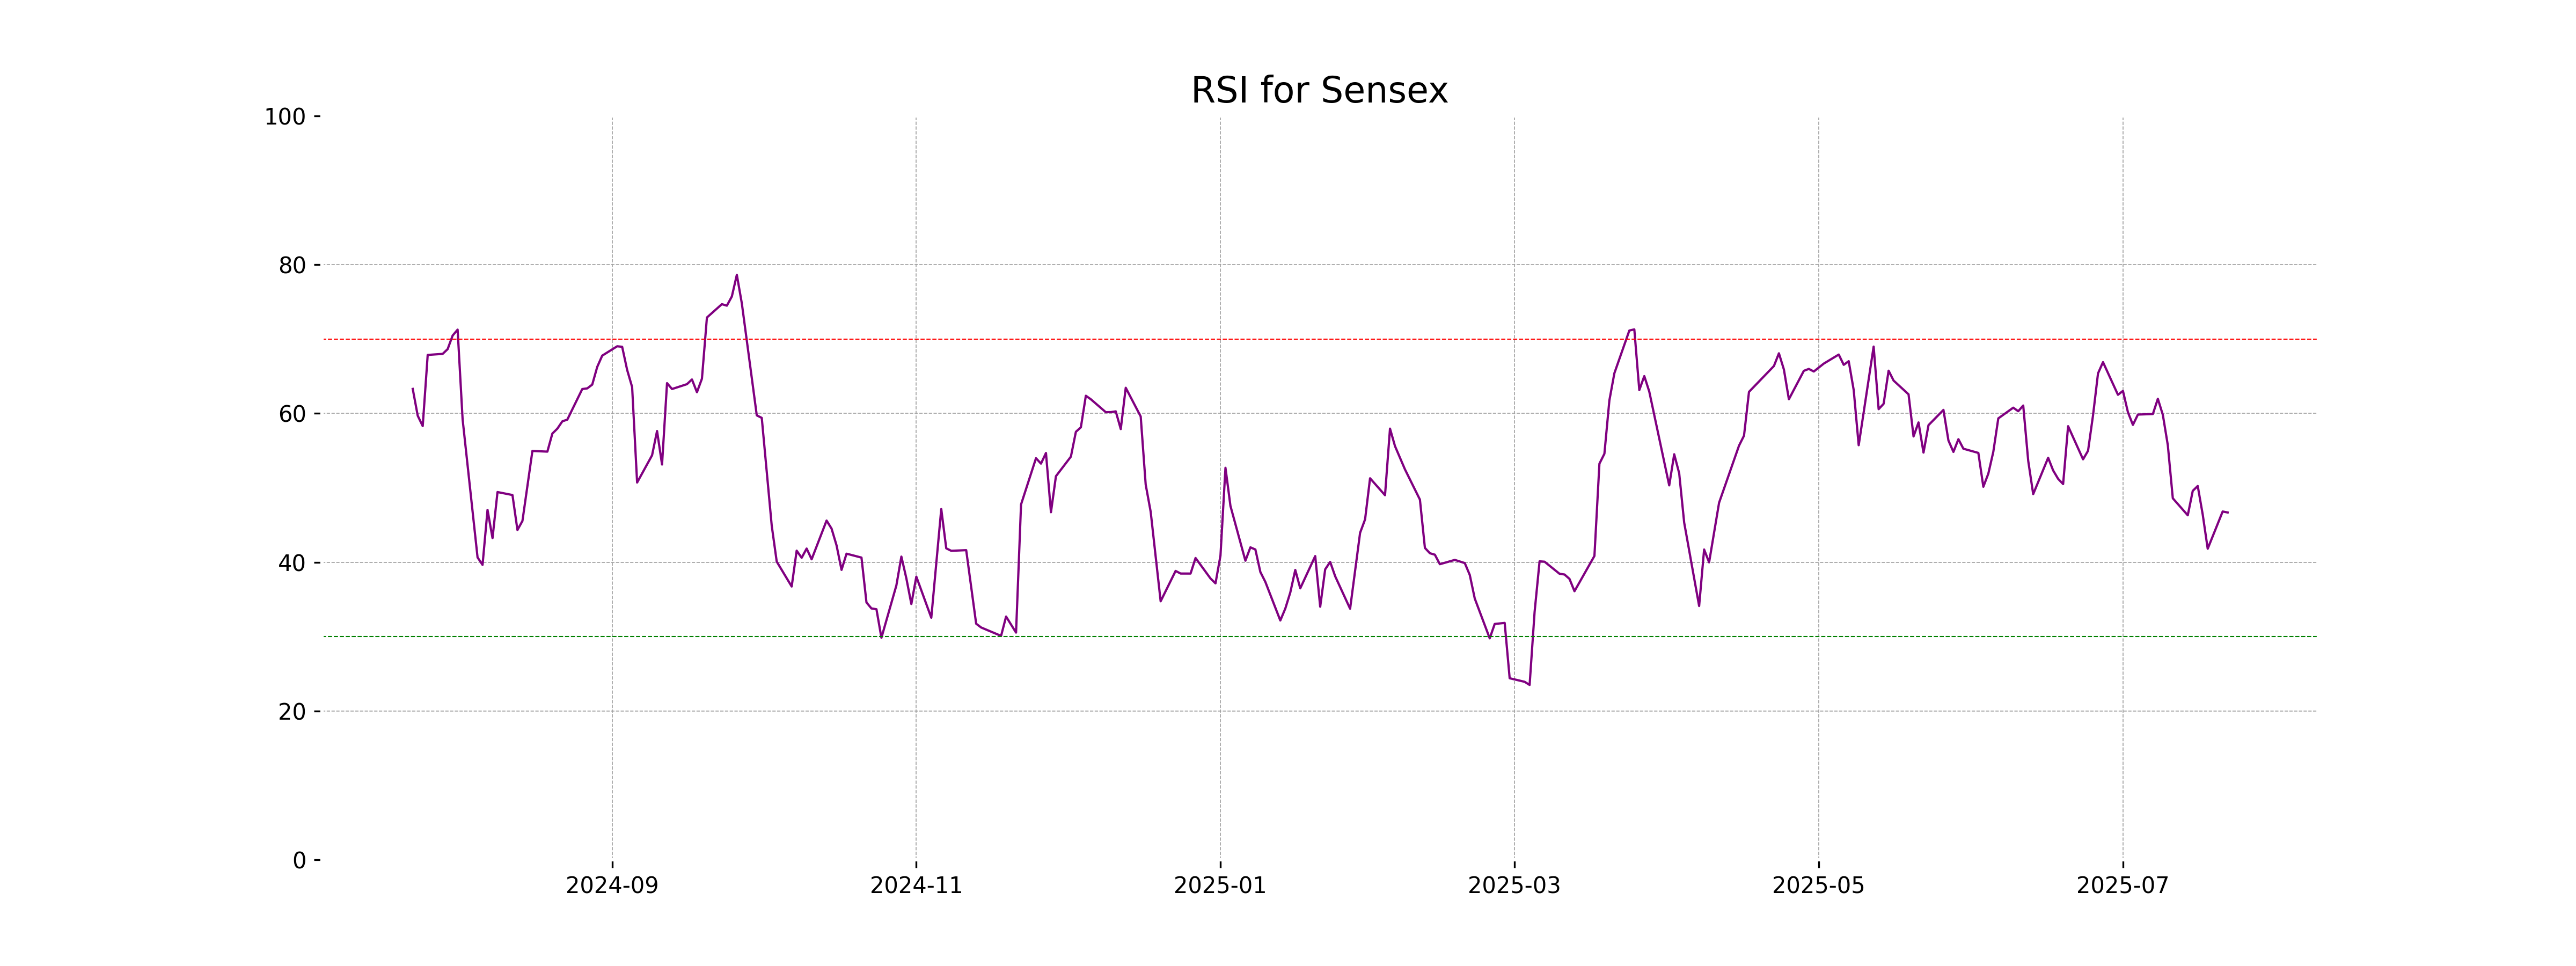
RSI Analysis
The Relative Strength Index (RSI) for the Dow Jones Industrial Average is at 59.03, indicating a neutral momentum. It suggests neither overbought nor oversold conditions in the current market, leaning slightly towards bullish territory.
Analysis for CAC 40 (France) - July 22, 2025
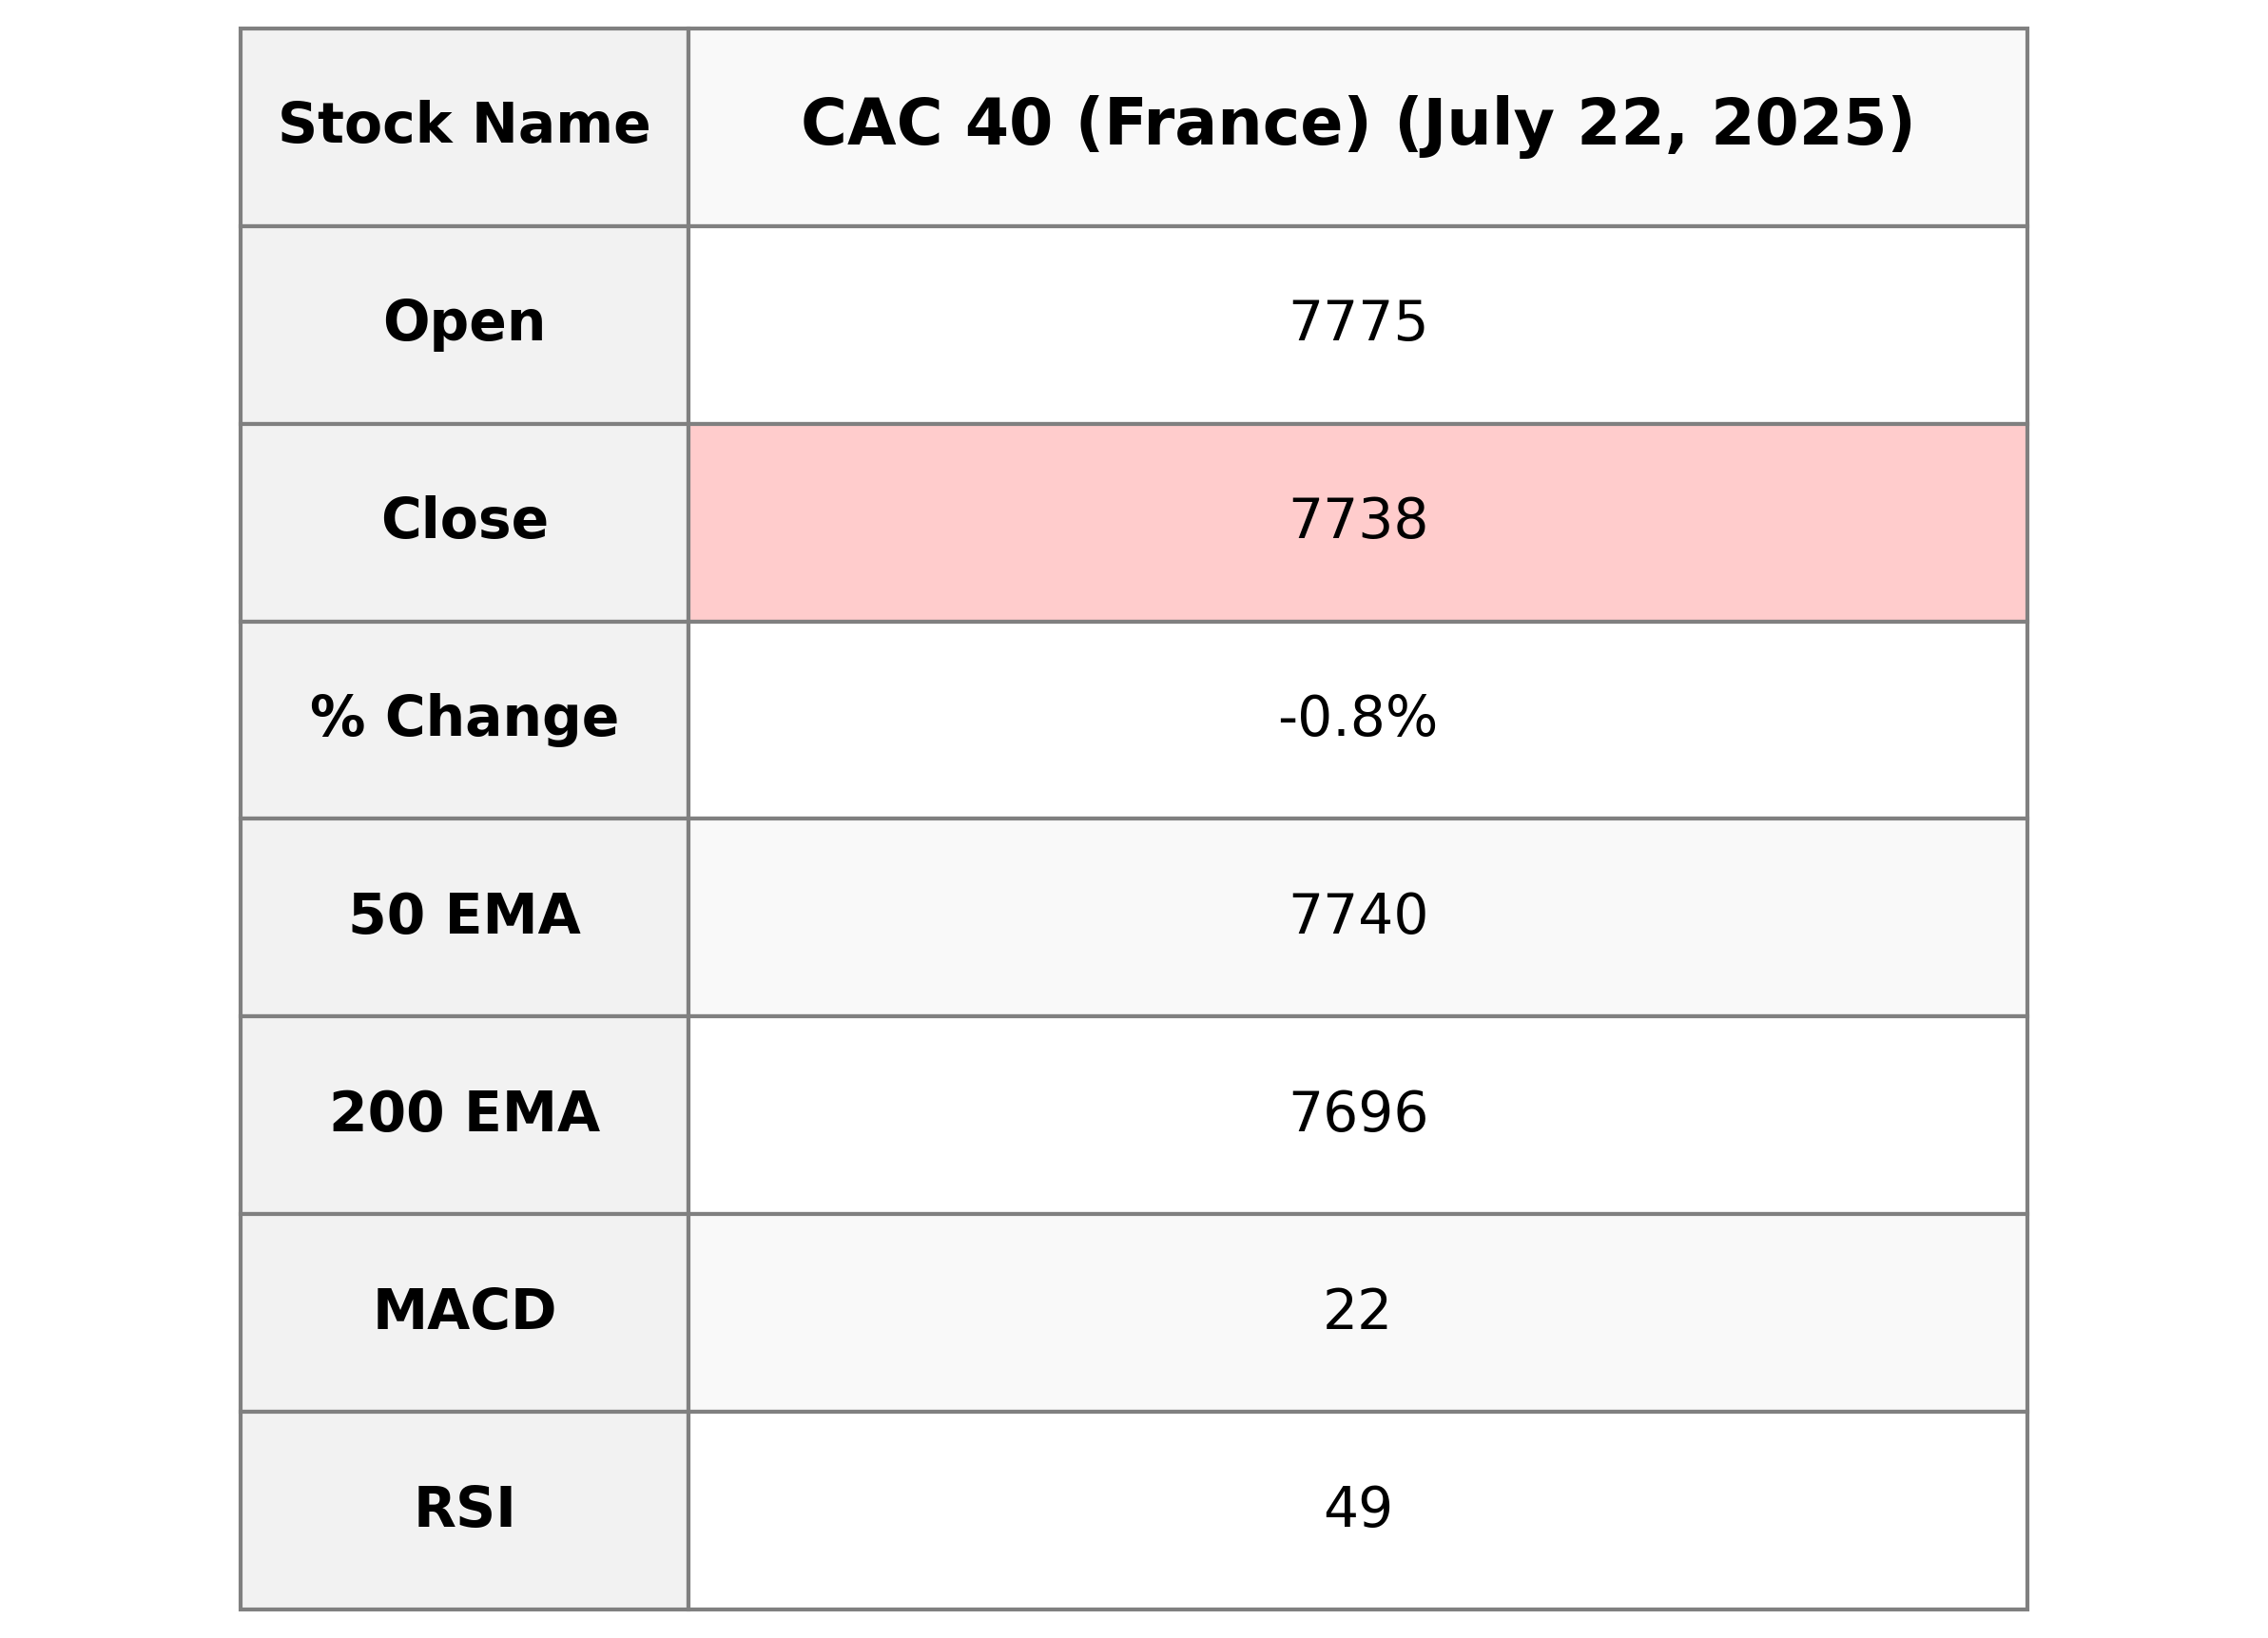
The CAC 40 (France) closed at 7738.27, marking a decrease of 0.77% from its previous close of 7798.22. The index experienced a daily high of 7782.66 and a low of 7738.12. With an RSI of 48.83, the index is approaching a balanced momentum, while its MACD remains slightly above the signal line, indicating potential mild bullishness.

Relationship with Key Moving Averages
The CAC 40 (France) closed at 7738.27, which is slightly below its 50-day EMA of 7739.70 and above its 200-day EMA of 7695.58, indicating short-term bearish and long-term bullish momentum. It is also below its 10-day EMA of 7779.57 and its 20-day EMA of 7761.22, suggesting near-term weakness.
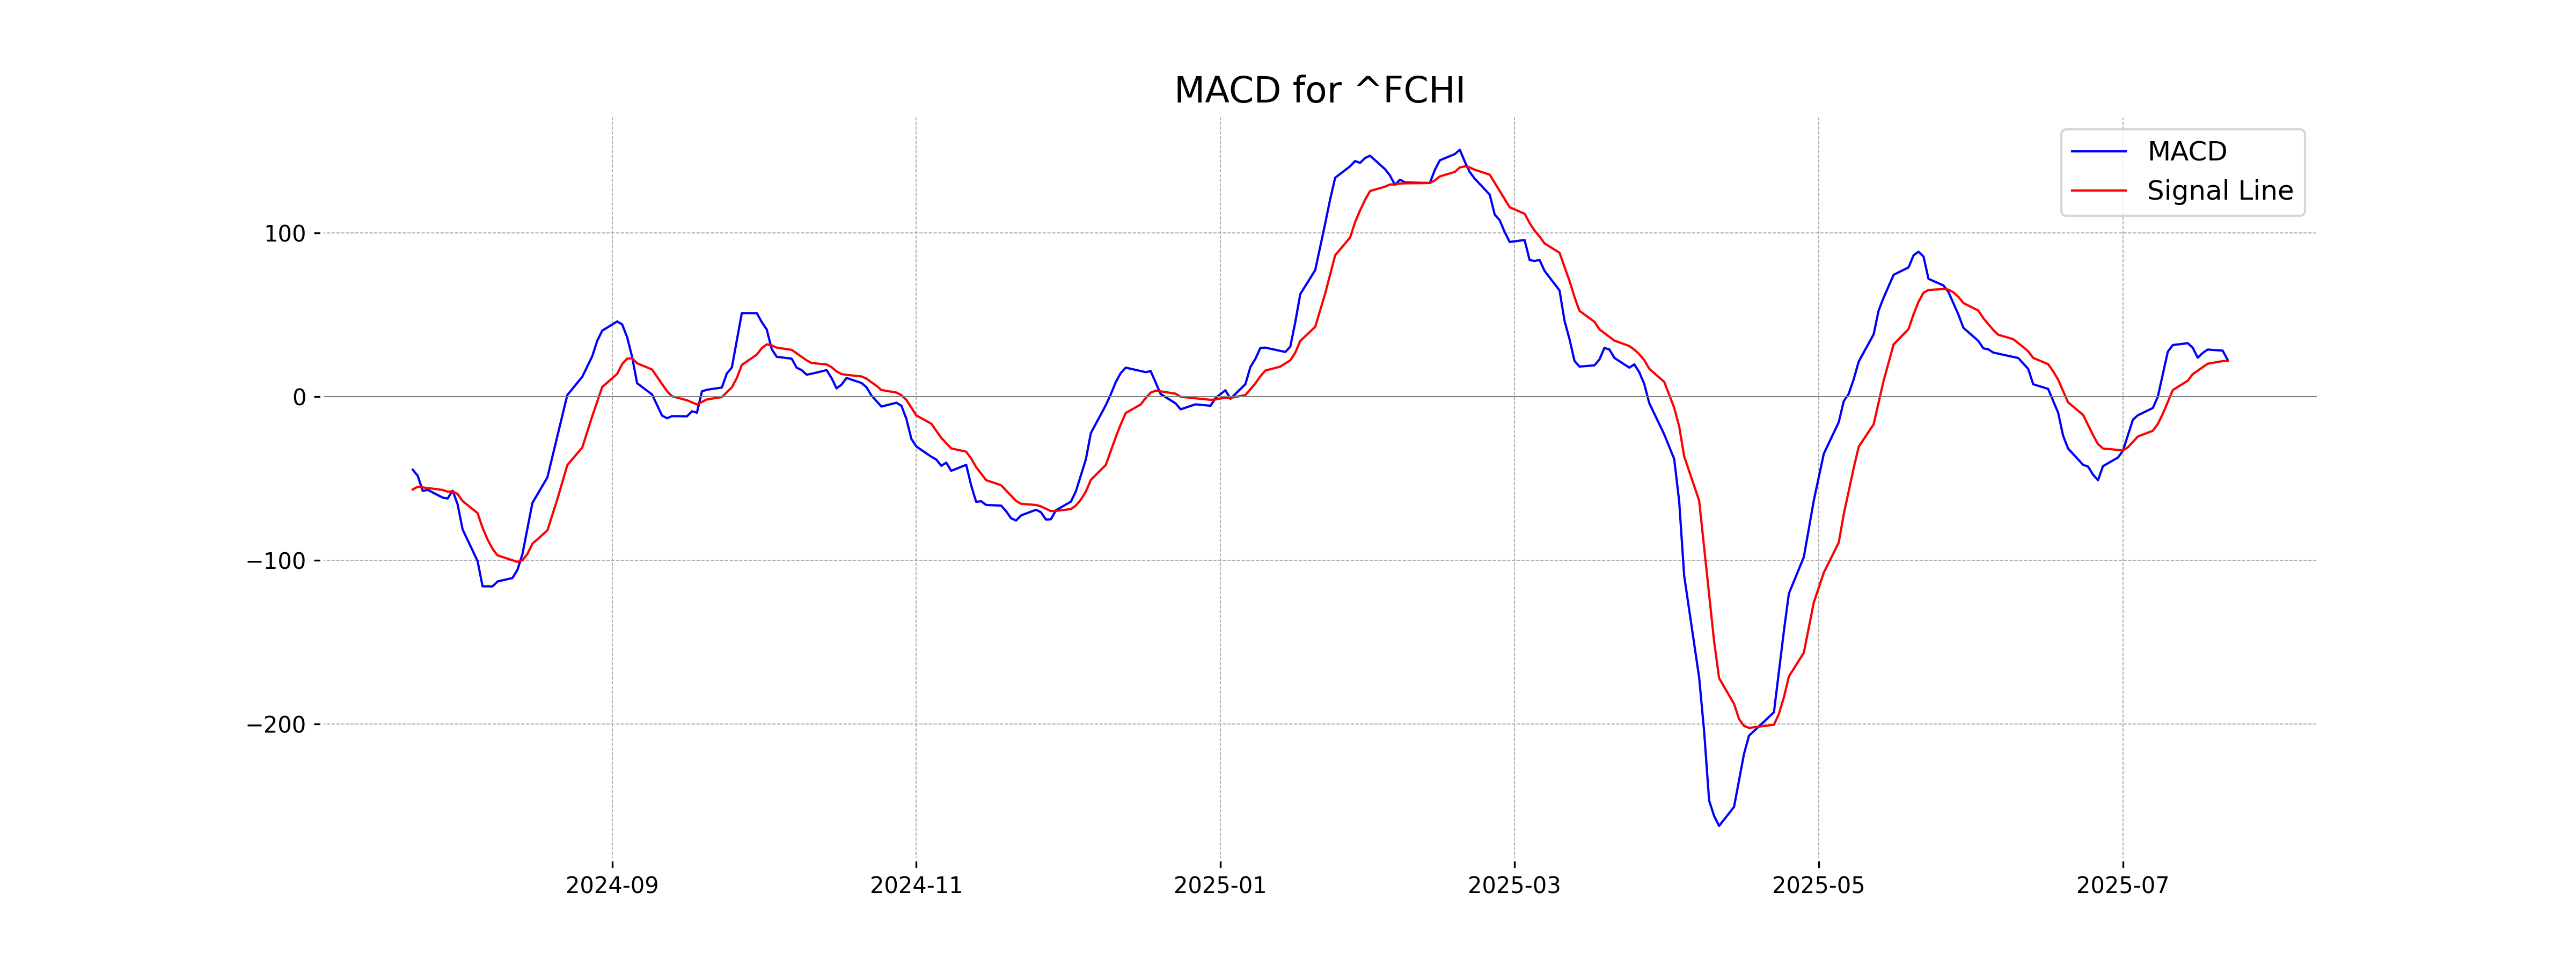
Moving Averages Trend (MACD)
MACD Analysis for CAC 40 (France): The MACD of 22.38 indicates a positive momentum compared to the signal line at 21.76, suggesting a potential buying opportunity. Given that the MACD line is above the signal line, it reflects bullish momentum, although investors should consider other indicators for a comprehensive analysis.
RSI Analysis
RSI Analysis for CAC 40 (France): The relative strength index (RSI) stands at 48.83, indicating that the market is currently in a neutral position. Generally, an RSI below 30 suggests an oversold condition, while above 70 indicates overbought. With the current value being close to 50, it reflects neither overbought nor oversold conditions, suggesting balanced market sentiment.

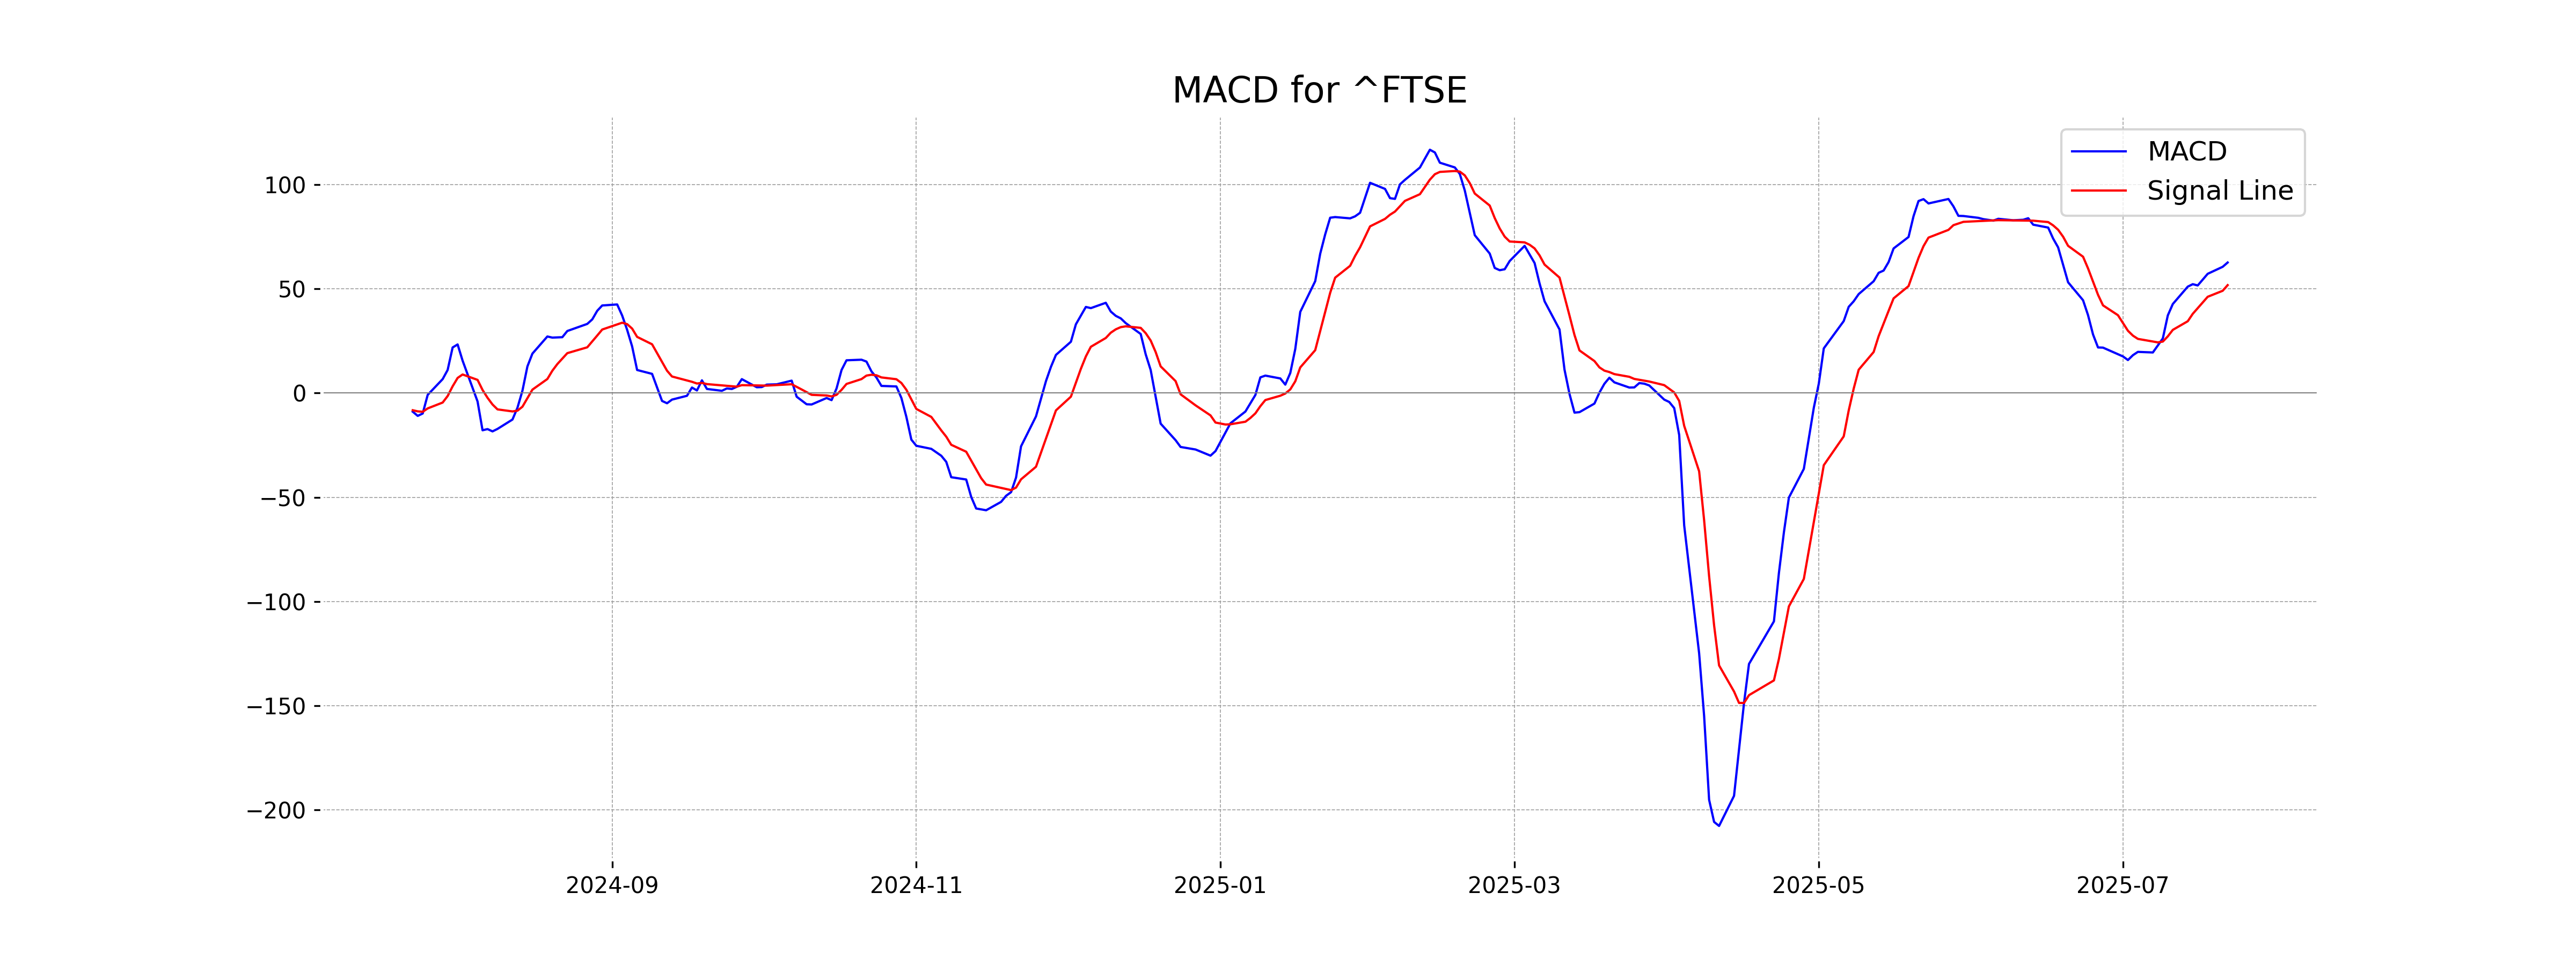
Analysis for FTSE 100 (UK) - July 22, 2025
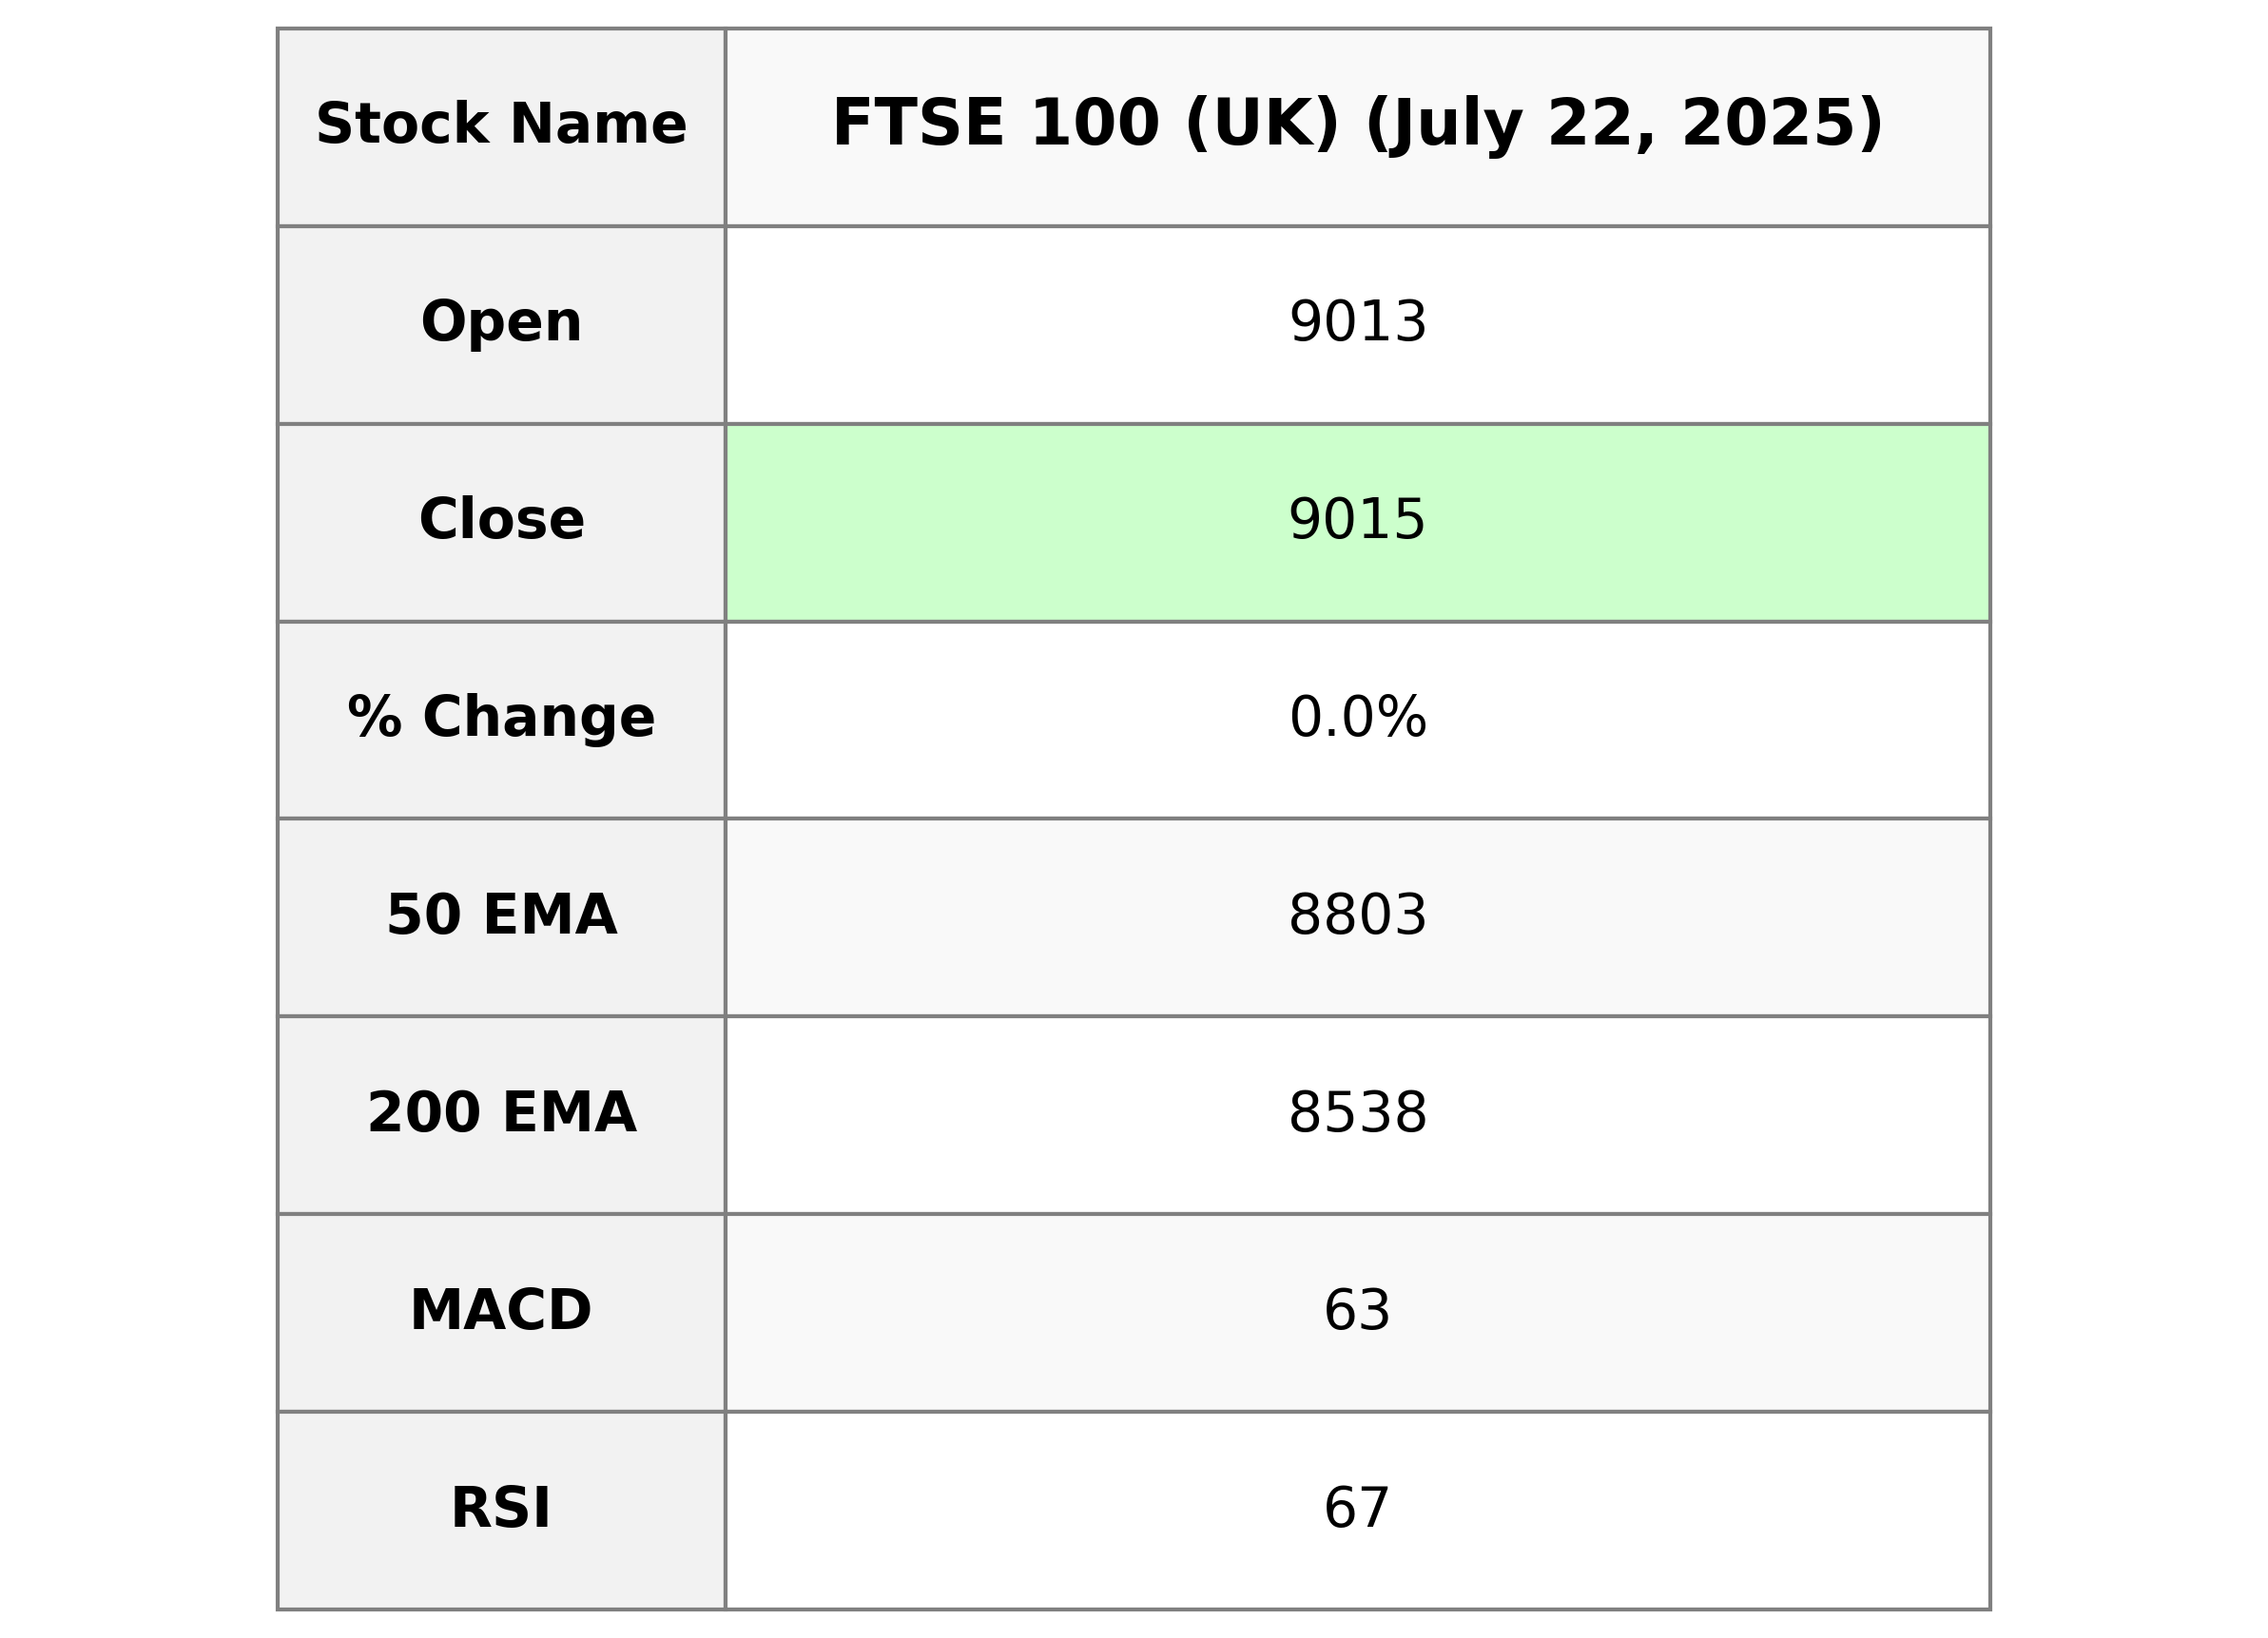
FTSE 100 (UK) opened at 9012.99 and closed slightly higher at 9014.60, reflecting a marginal positive change of 0.018%. The index experienced moderate volatility with a high of 9025.08 and a low of 8995.11. Technical indicators show a strong position with an RSI of 66.69 and a MACD above its signal line, indicating a bullish trend.

Relationship with Key Moving Averages
The FTSE 100 has closed at 9014.60, which is above its 10-day EMA of 8957.11, 20-day EMA of 8906.46, 50-day EMA of 8802.94, and 200-day EMA of 8538.33. This generally indicates a strong upward trend in the short to medium term.
Moving Averages Trend (MACD)
The MACD for the FTSE 100 is at 62.62, which is above the MACD Signal of 51.77, indicating a bullish momentum. This suggests potential positive movement in the short term as the MACD line has crossed above the signal line.
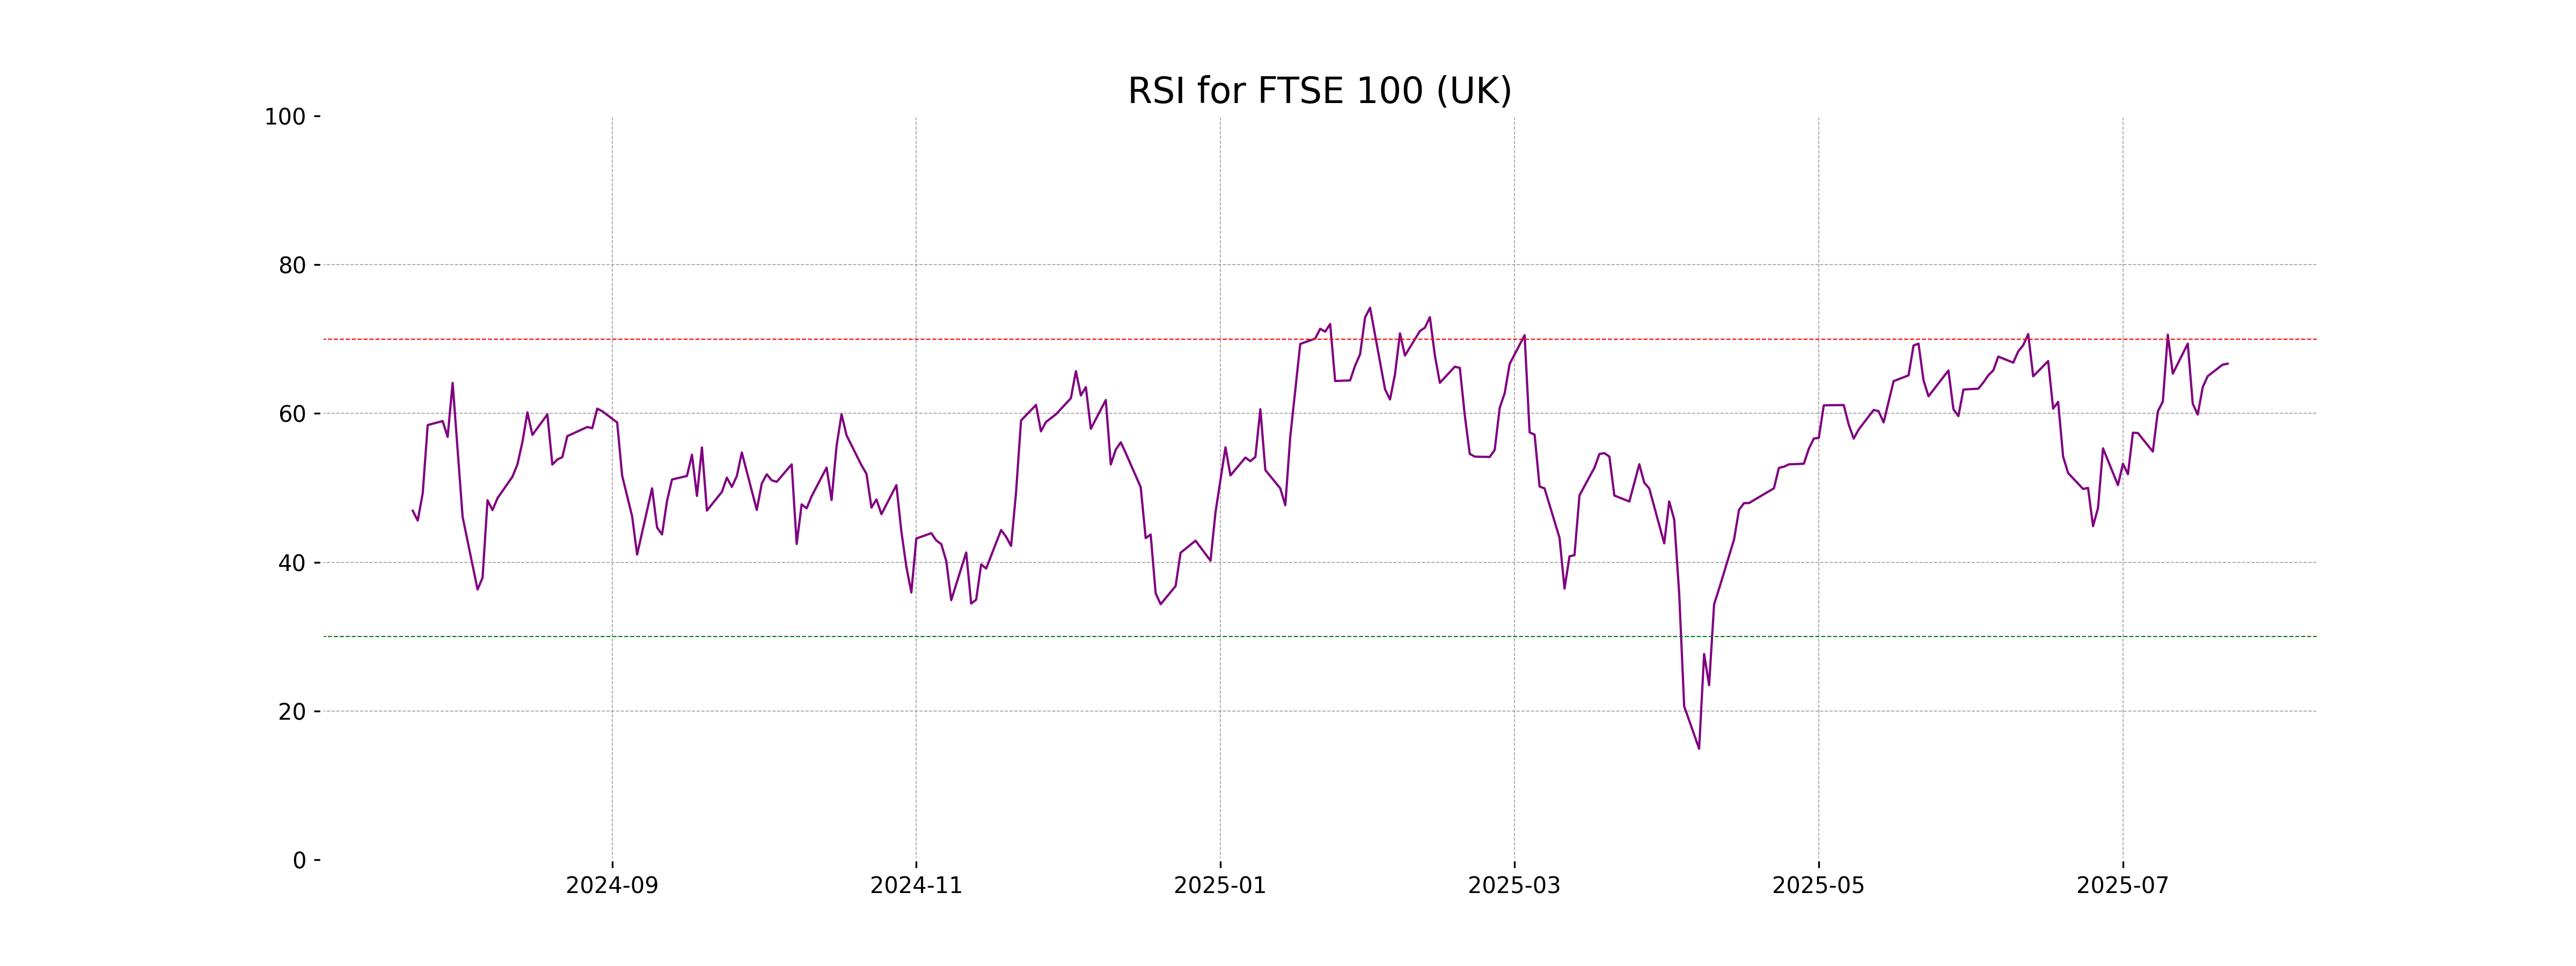
RSI Analysis
The Relative Strength Index (RSI) for FTSE 100 is at 66.69, which suggests that it is approaching overbought territory. An RSI value above 70 typically indicates overbought conditions, suggesting the potential for a pullback.
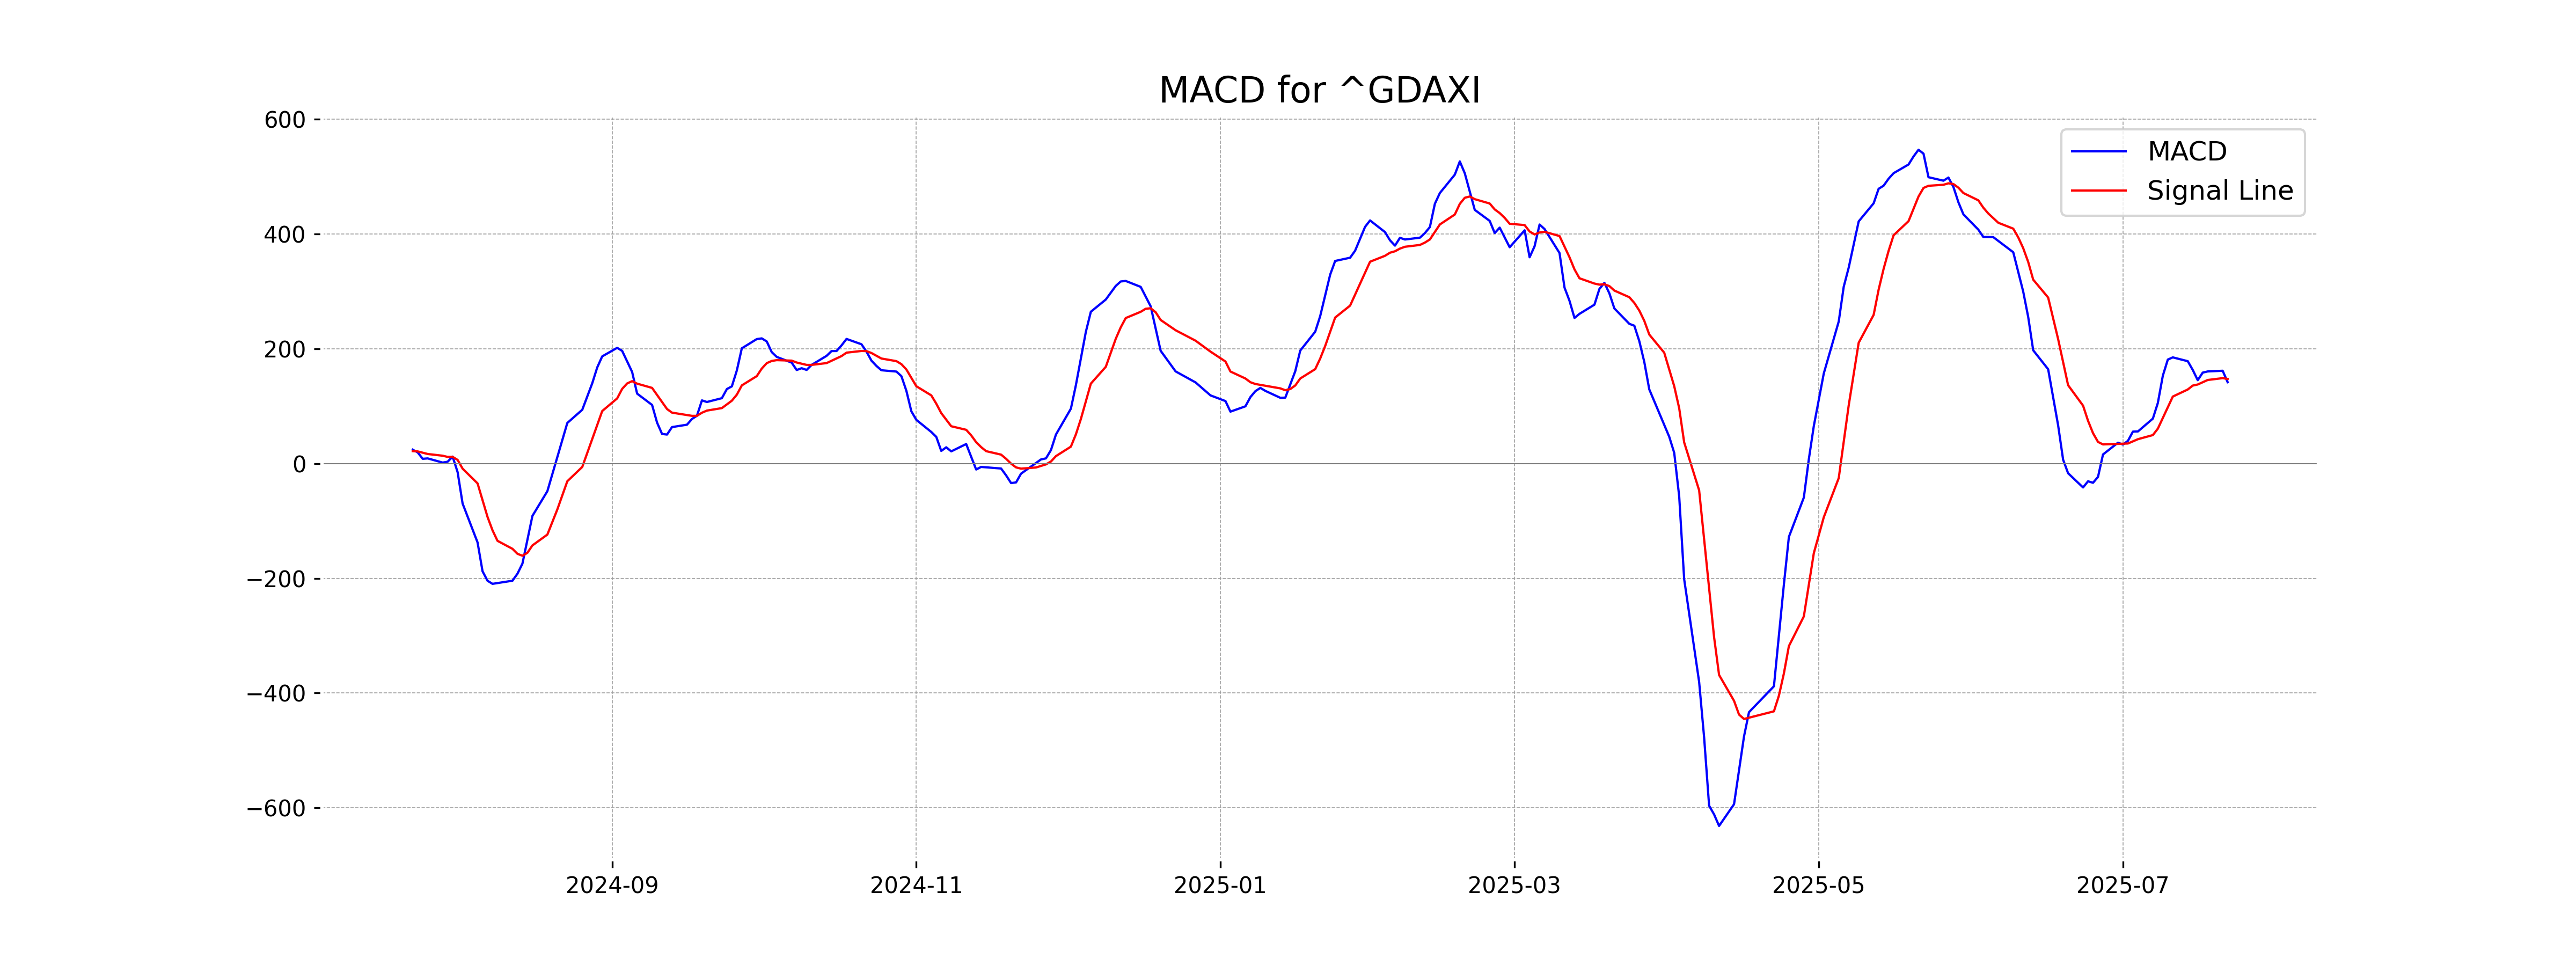
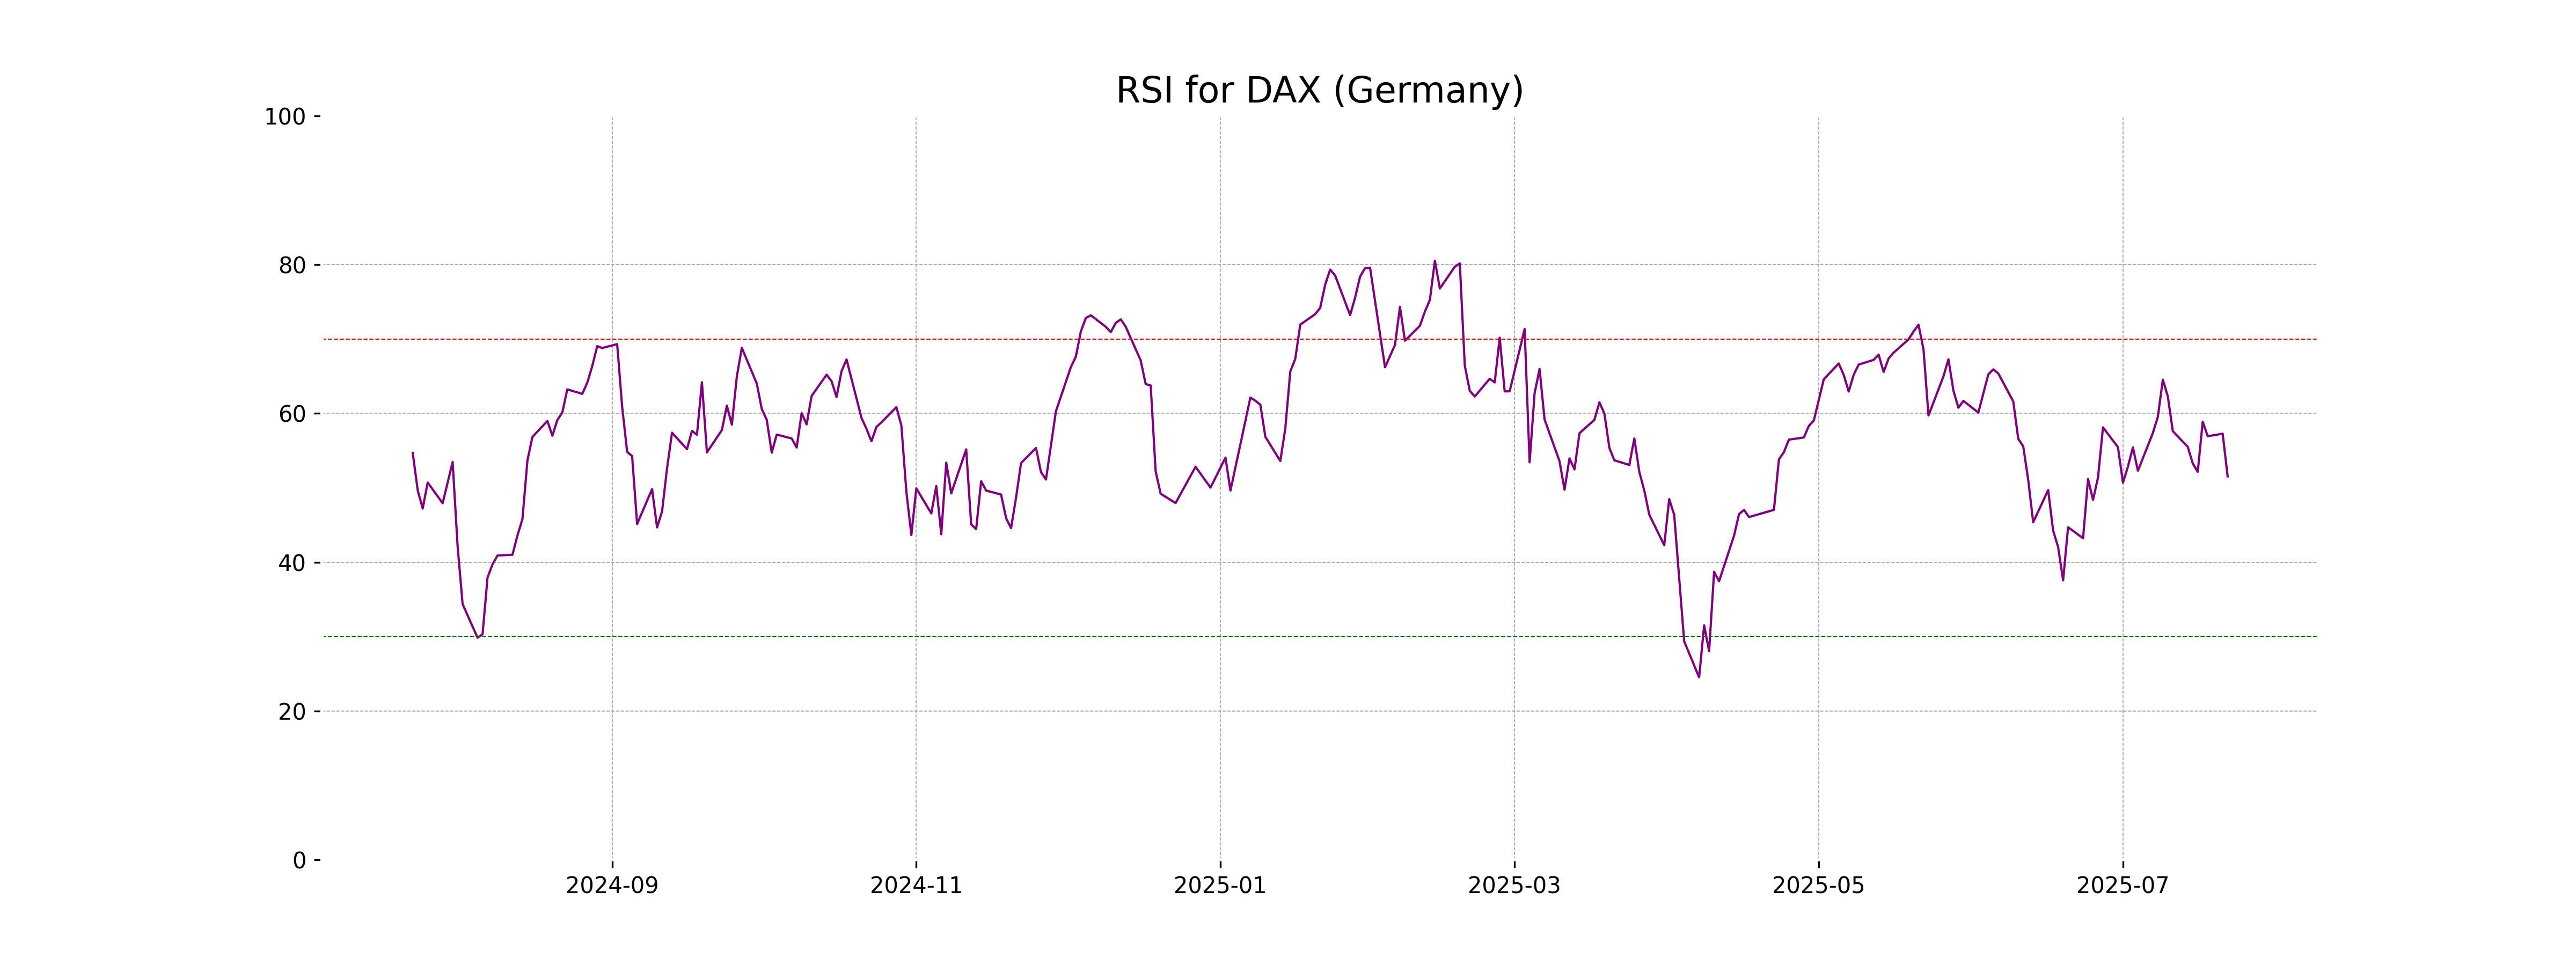
Analysis for DAX (Germany) - July 22, 2025
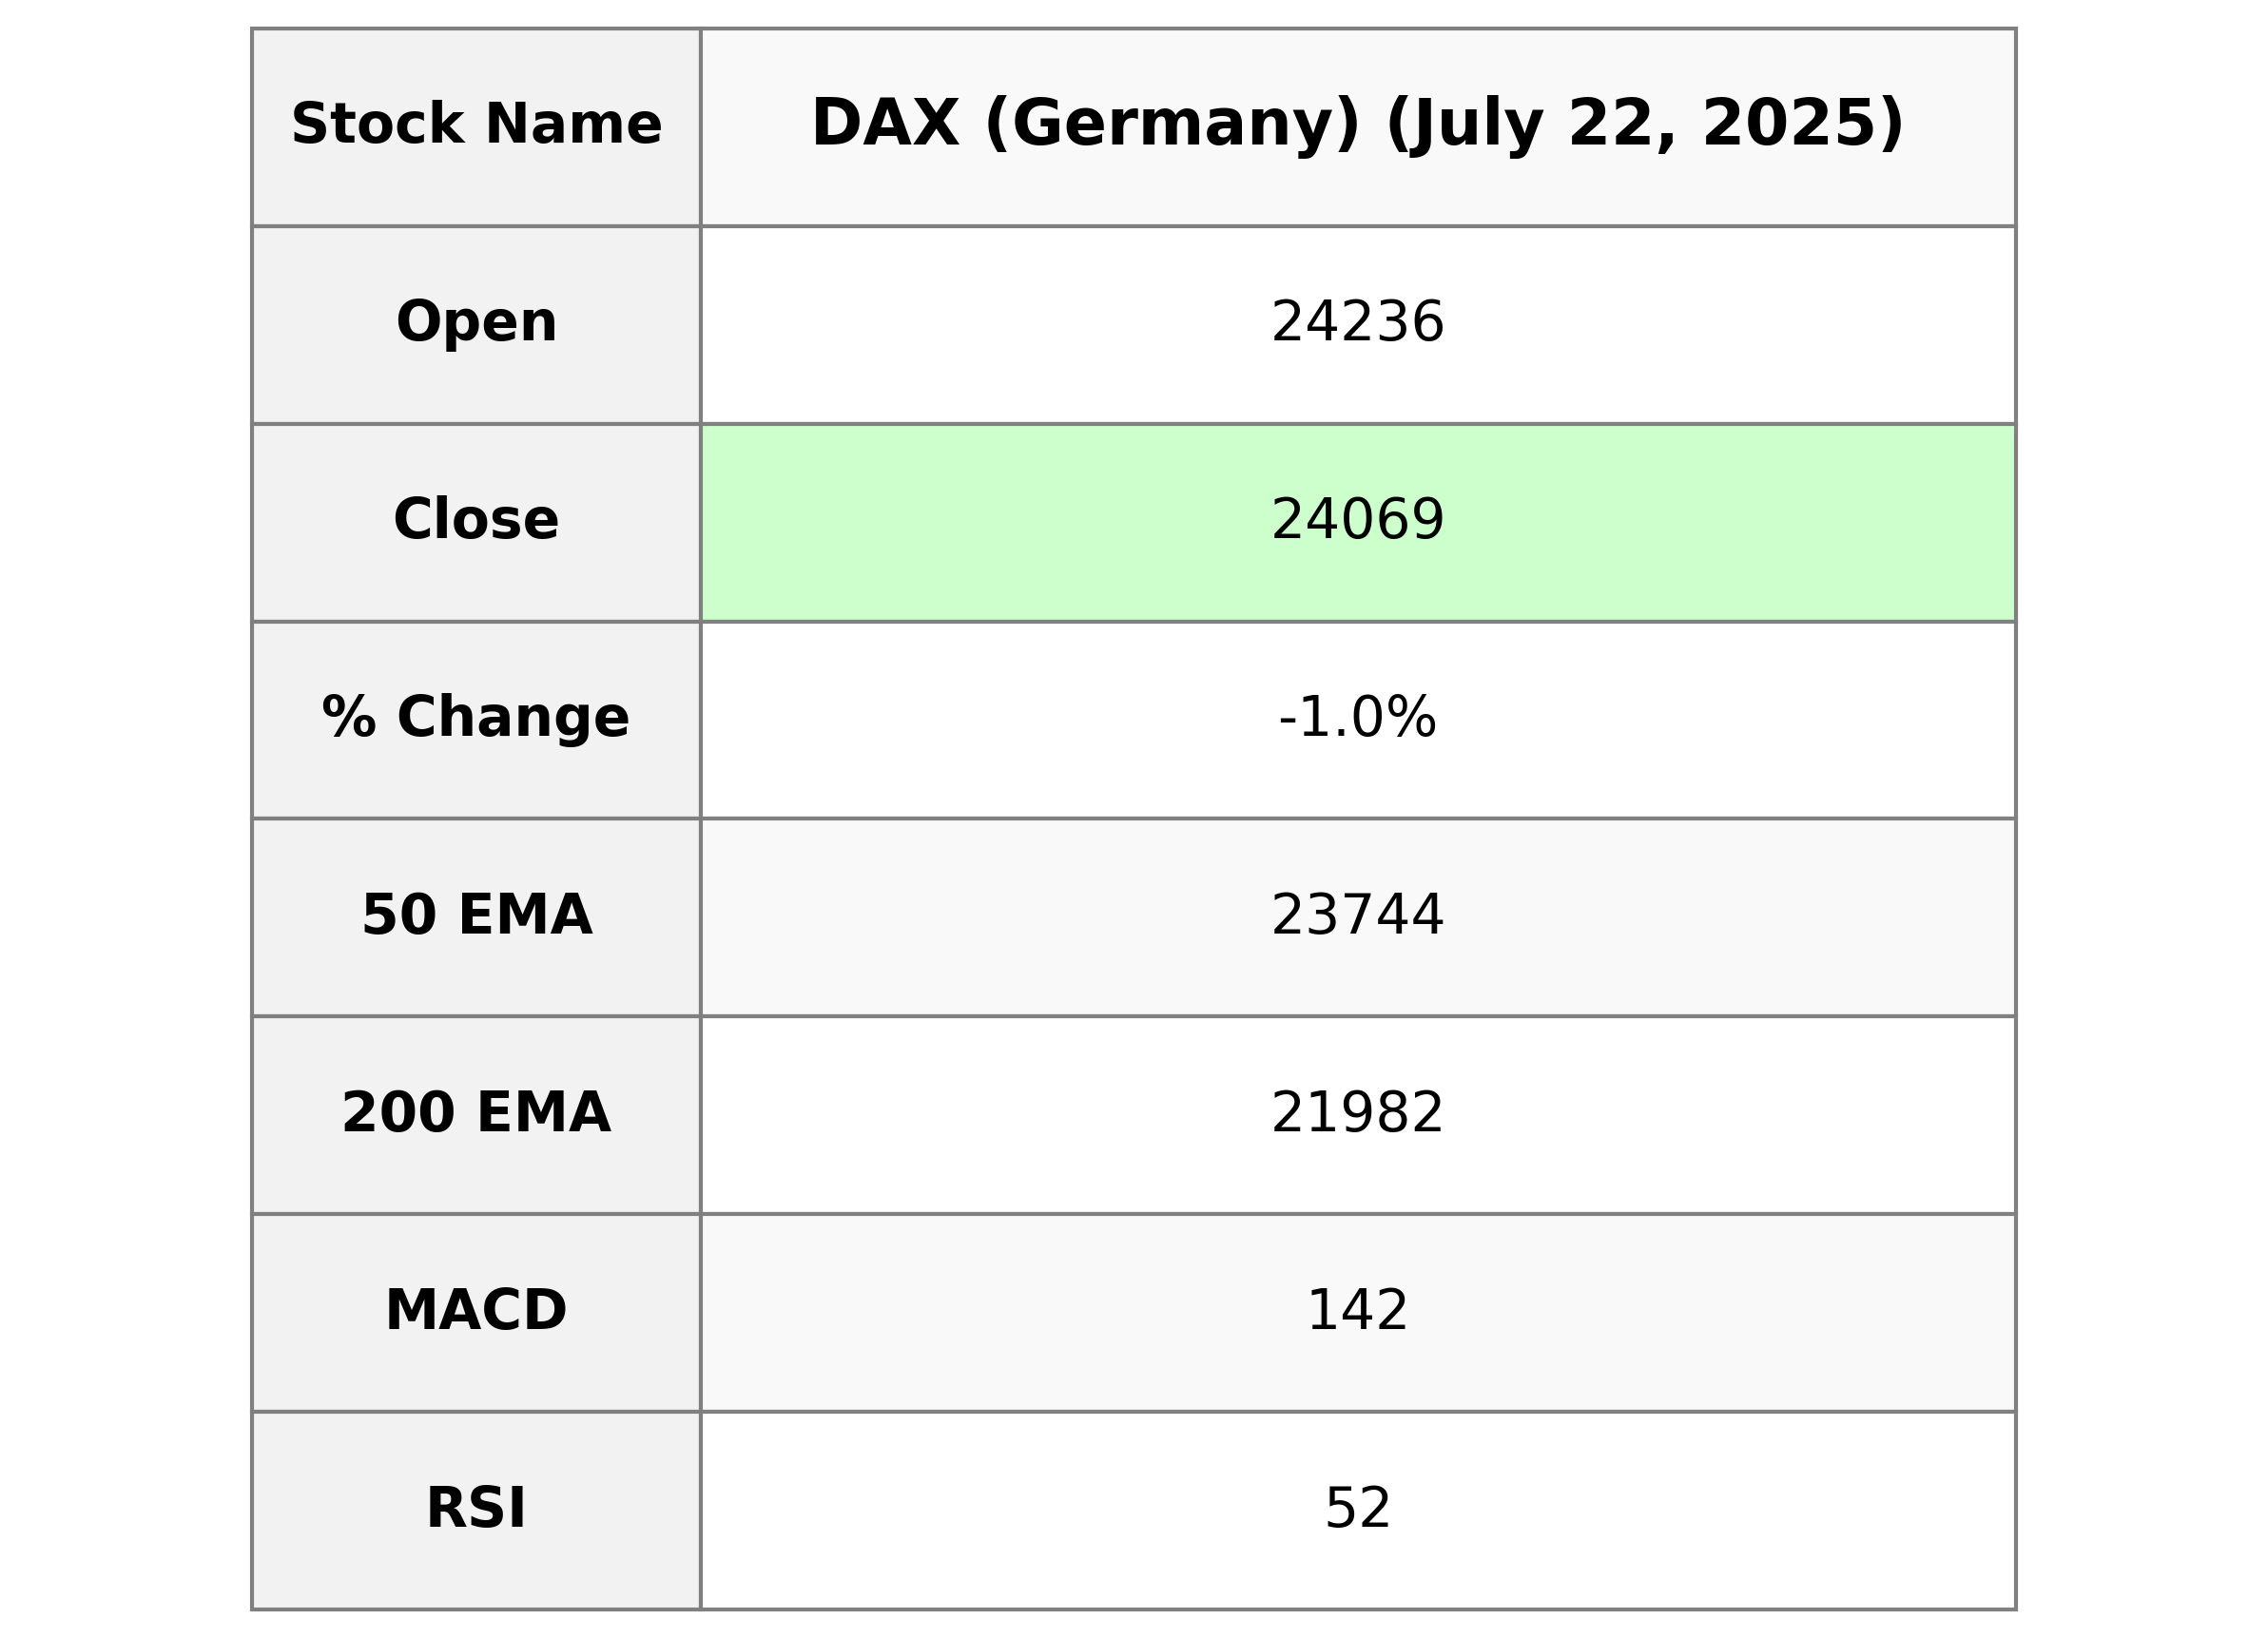
The DAX (Germany) index opened at 24,236.09 and closed at 24,068.79, exhibiting a decrease of 0.98%, equivalent to a points change of -239.01, against the previous close of 24,307.80. The index's Relative Strength Index (RSI) stands at 51.53, suggesting a neutral momentum, with the Moving Average Convergence Divergence (MACD) showing a slight bearish divergence as it is below the signal line.

Relationship with Key Moving Averages
The DAX (Germany) closed below its 10 EMA and 20 EMA, indicating a short-term bearish pressure, but above its 50 EMA and 200 EMA, suggesting a longer-term uptrend might still be intact. The MACD is below the signal line, which can signal a potential continuation of the downward momentum.
Moving Averages Trend (MACD)
Based on the stock data for DAX (Germany), the MACD value is 141.87, which is below the MACD Signal line at 147.52. This suggests a bearish signal, indicating potential downward momentum in the short term.
RSI Analysis
The RSI for DAX is currently at 51.53, which suggests that the index is neither overbought nor oversold and is in a neutral zone. This indicates a balance between buying and selling pressures, with no immediate trend direction suggested based on RSI alone.
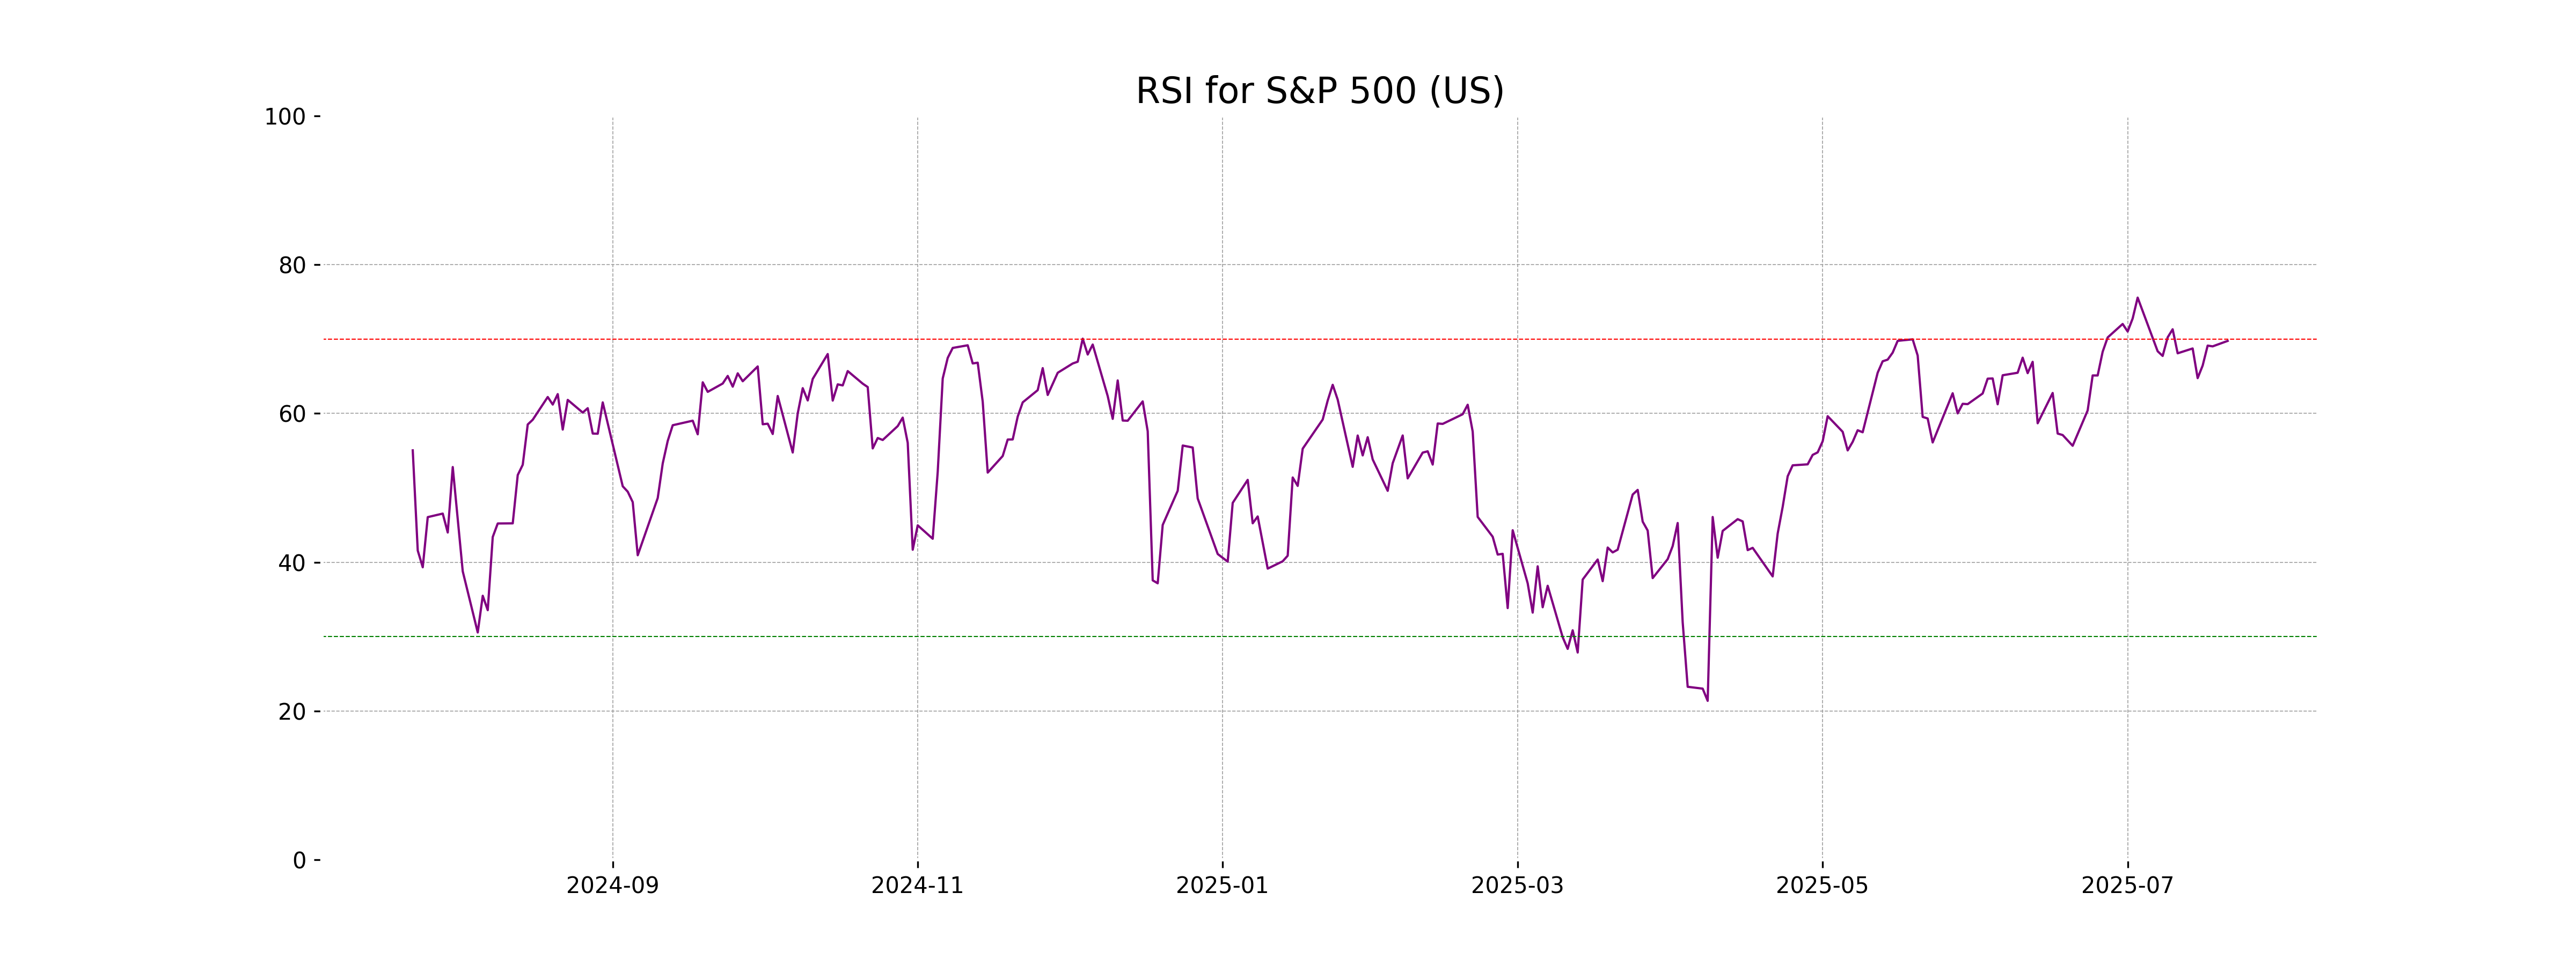
Analysis for S&P 500 (US) - July 22, 2025
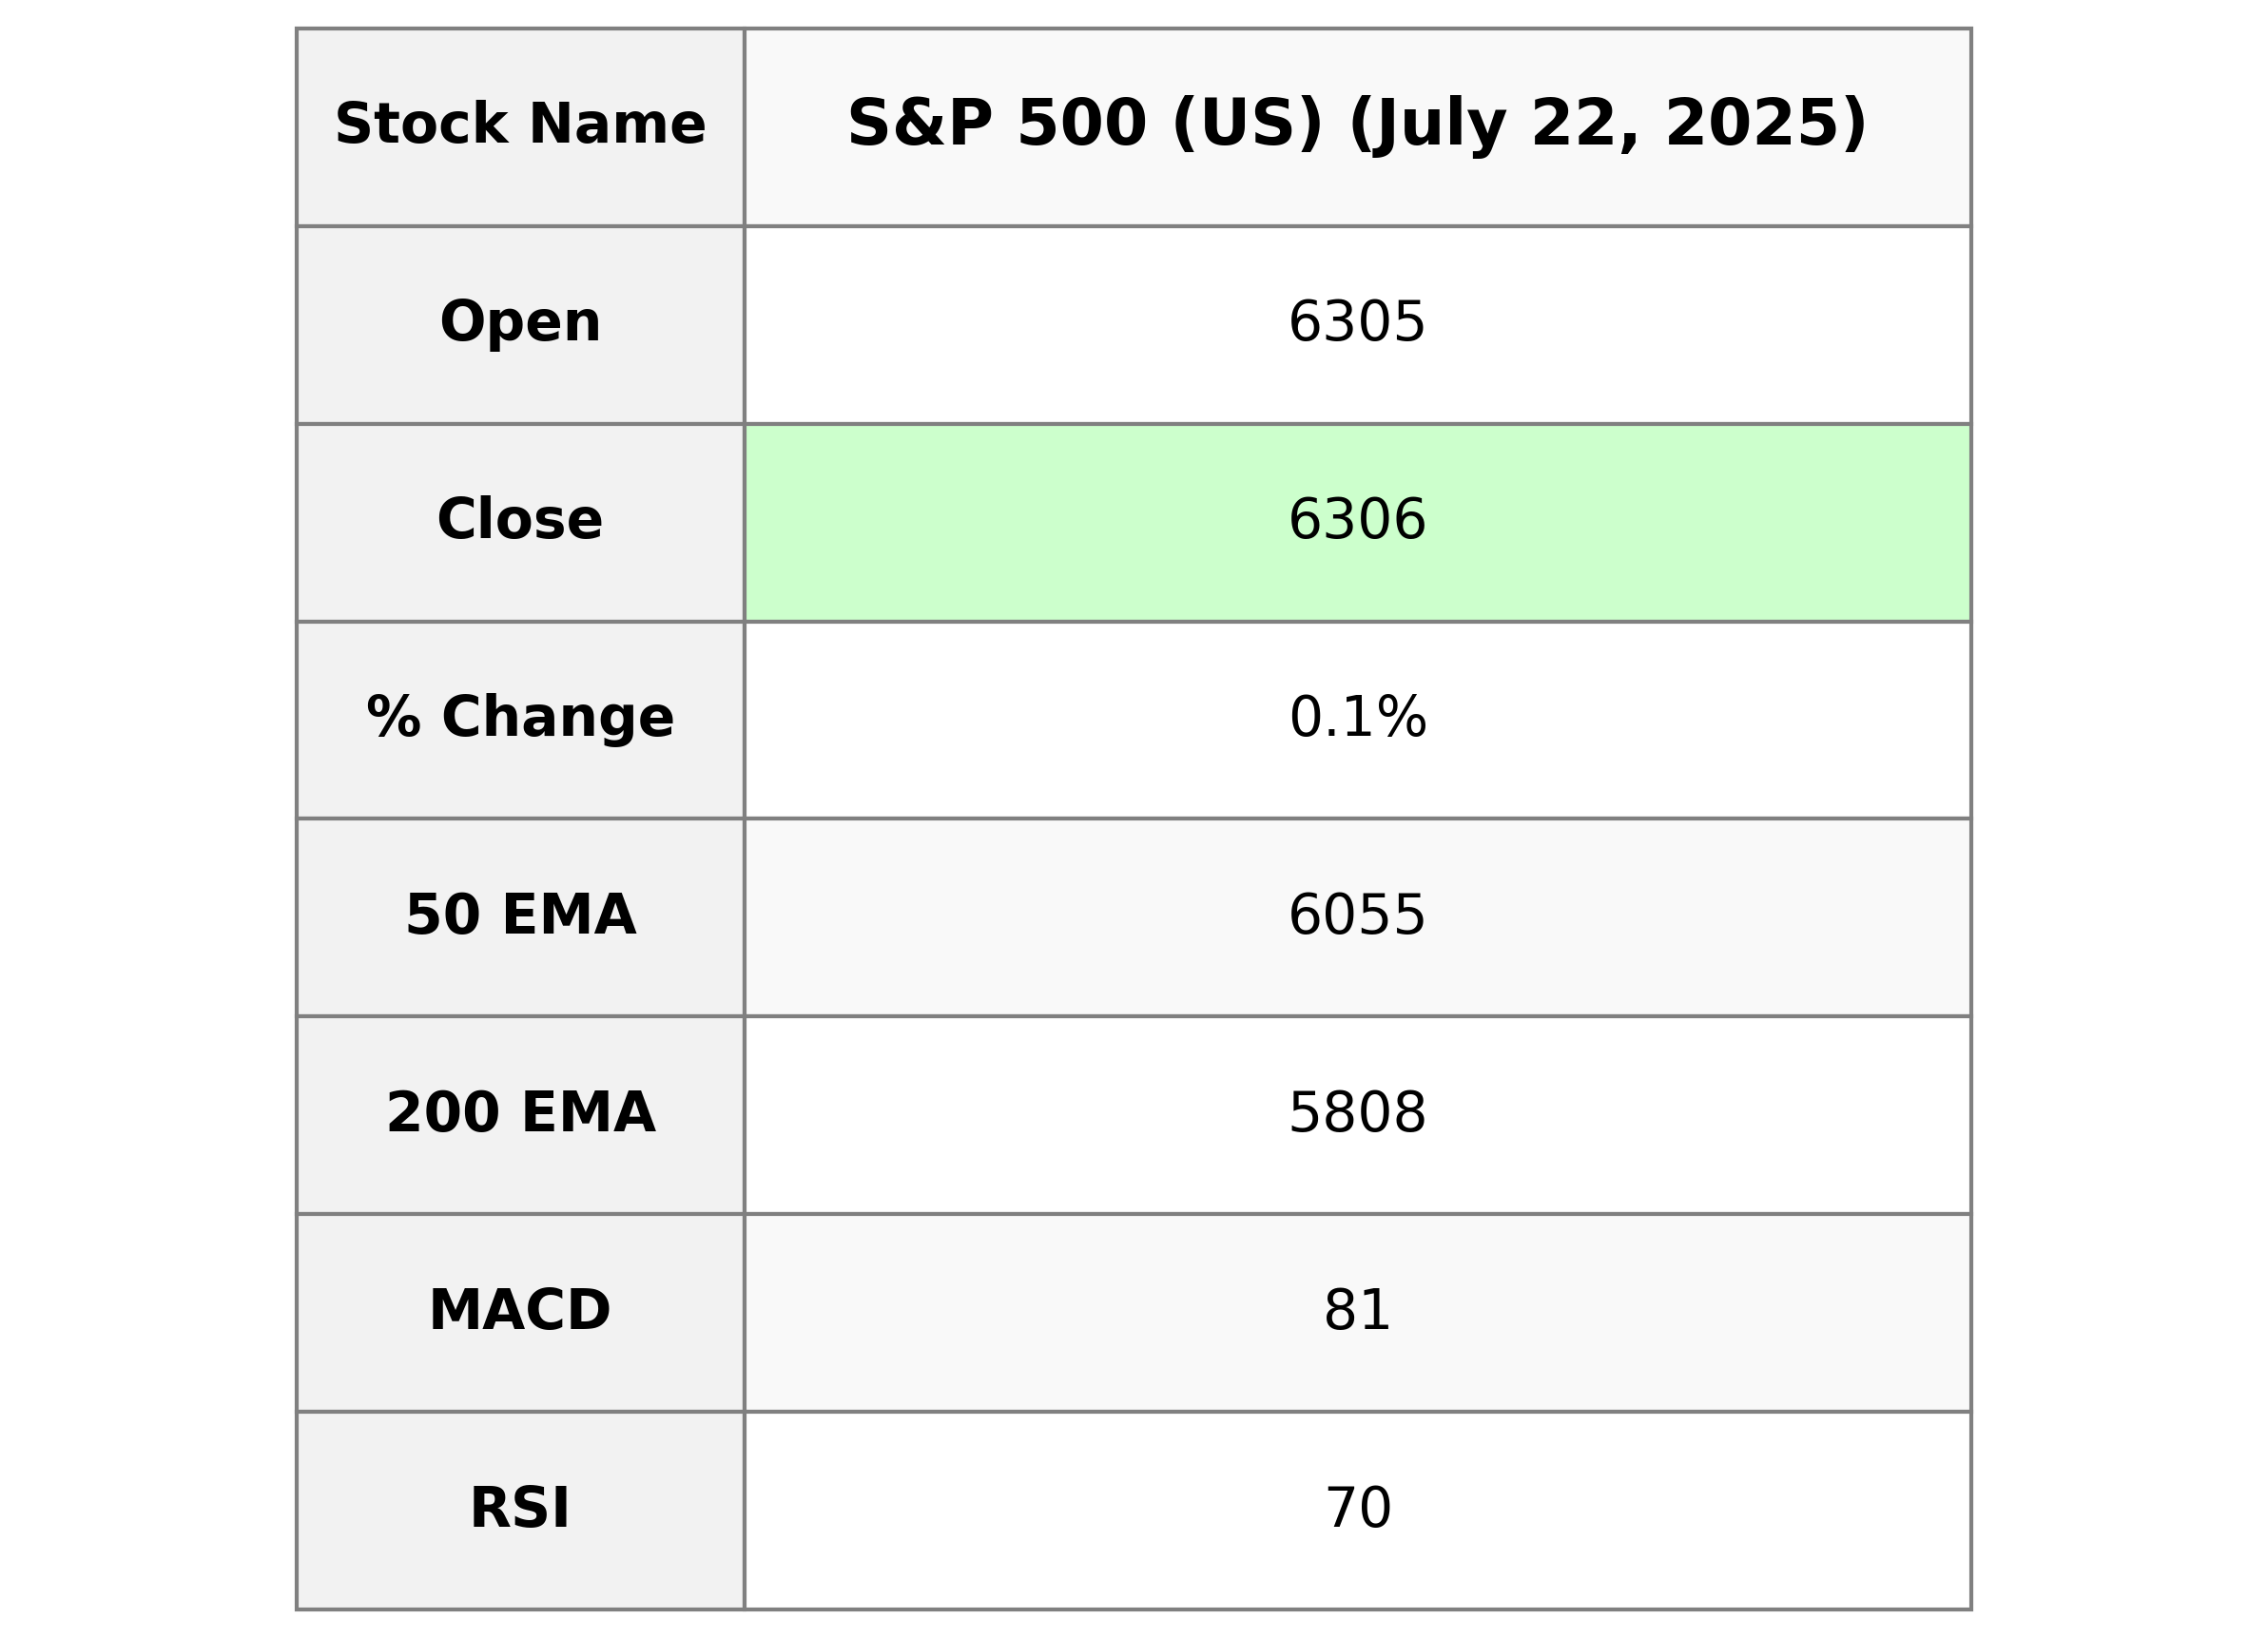
The S&P 500 (US) opened at 6304.74 and closed at 6305.60, indicating a small gain with a percentage change of 0.14%. The index showed a relatively stable day with a volume of 5,010,840,000. The RSI stands at 69.75, suggesting it's approaching overbought territory, while the MACD at 81.01 is slightly below its signal line.
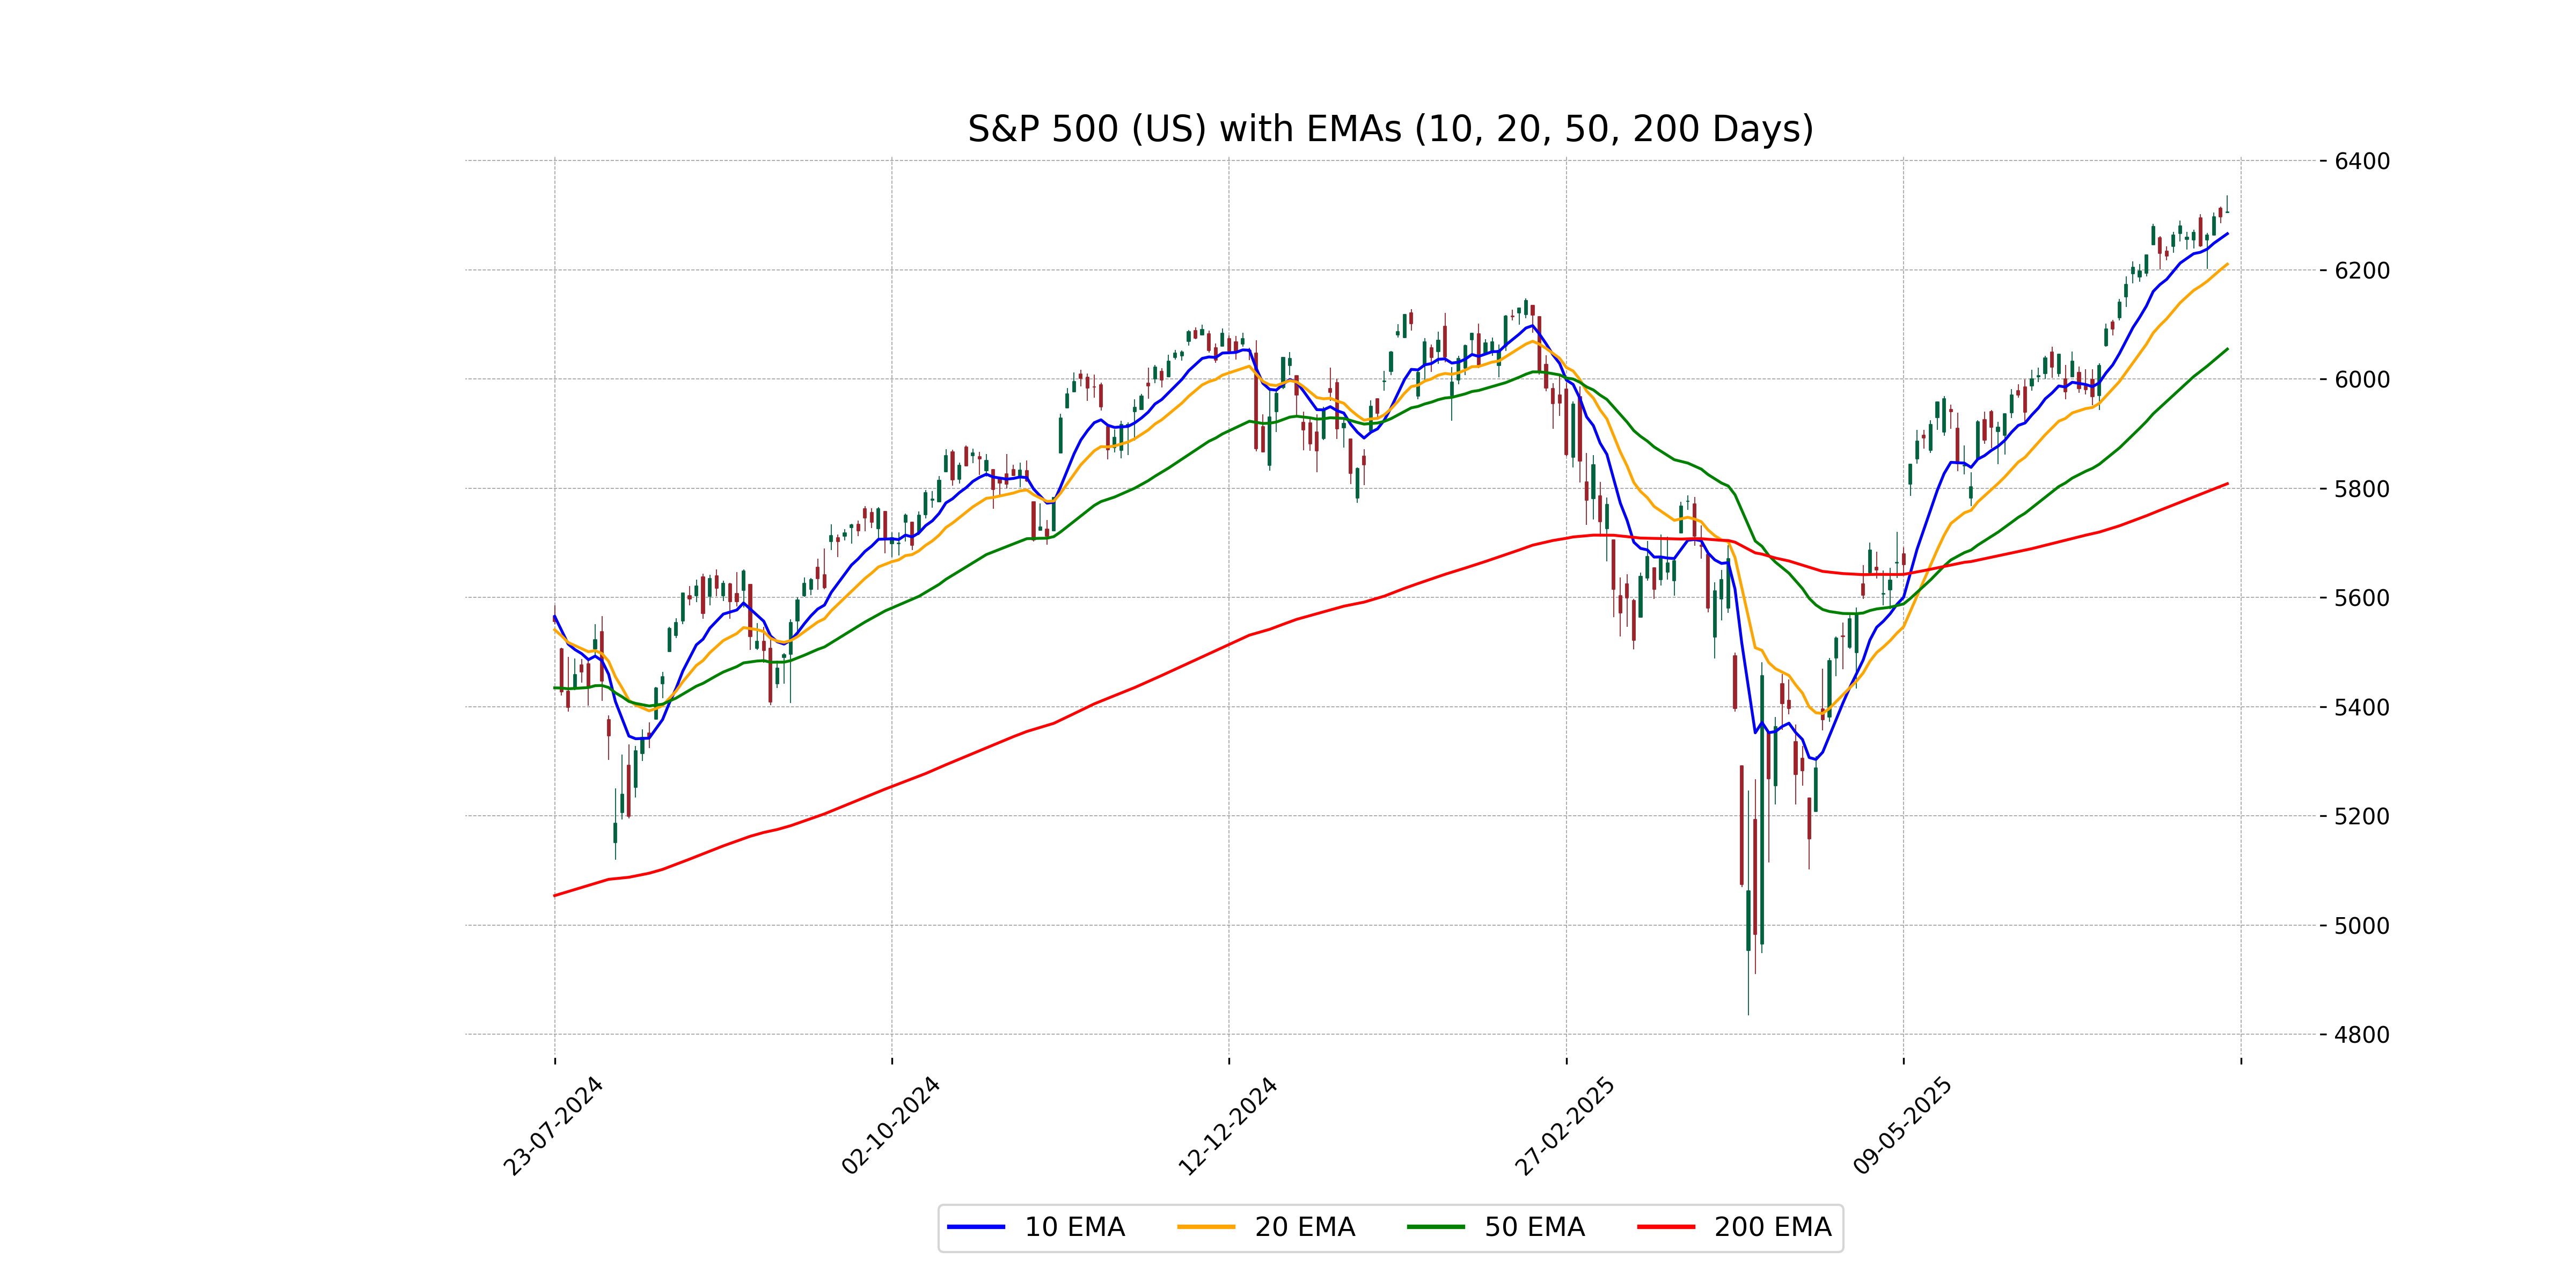
Relationship with Key Moving Averages
The S&P 500's current closing price of 6305.60 is above all key moving averages, including the 50-day EMA at 6054.94, the 200-day EMA at 5808.39, the 10-day EMA at 6266.23, and the 20-day EMA at 6210.46. This suggests a strong upward momentum in the market.
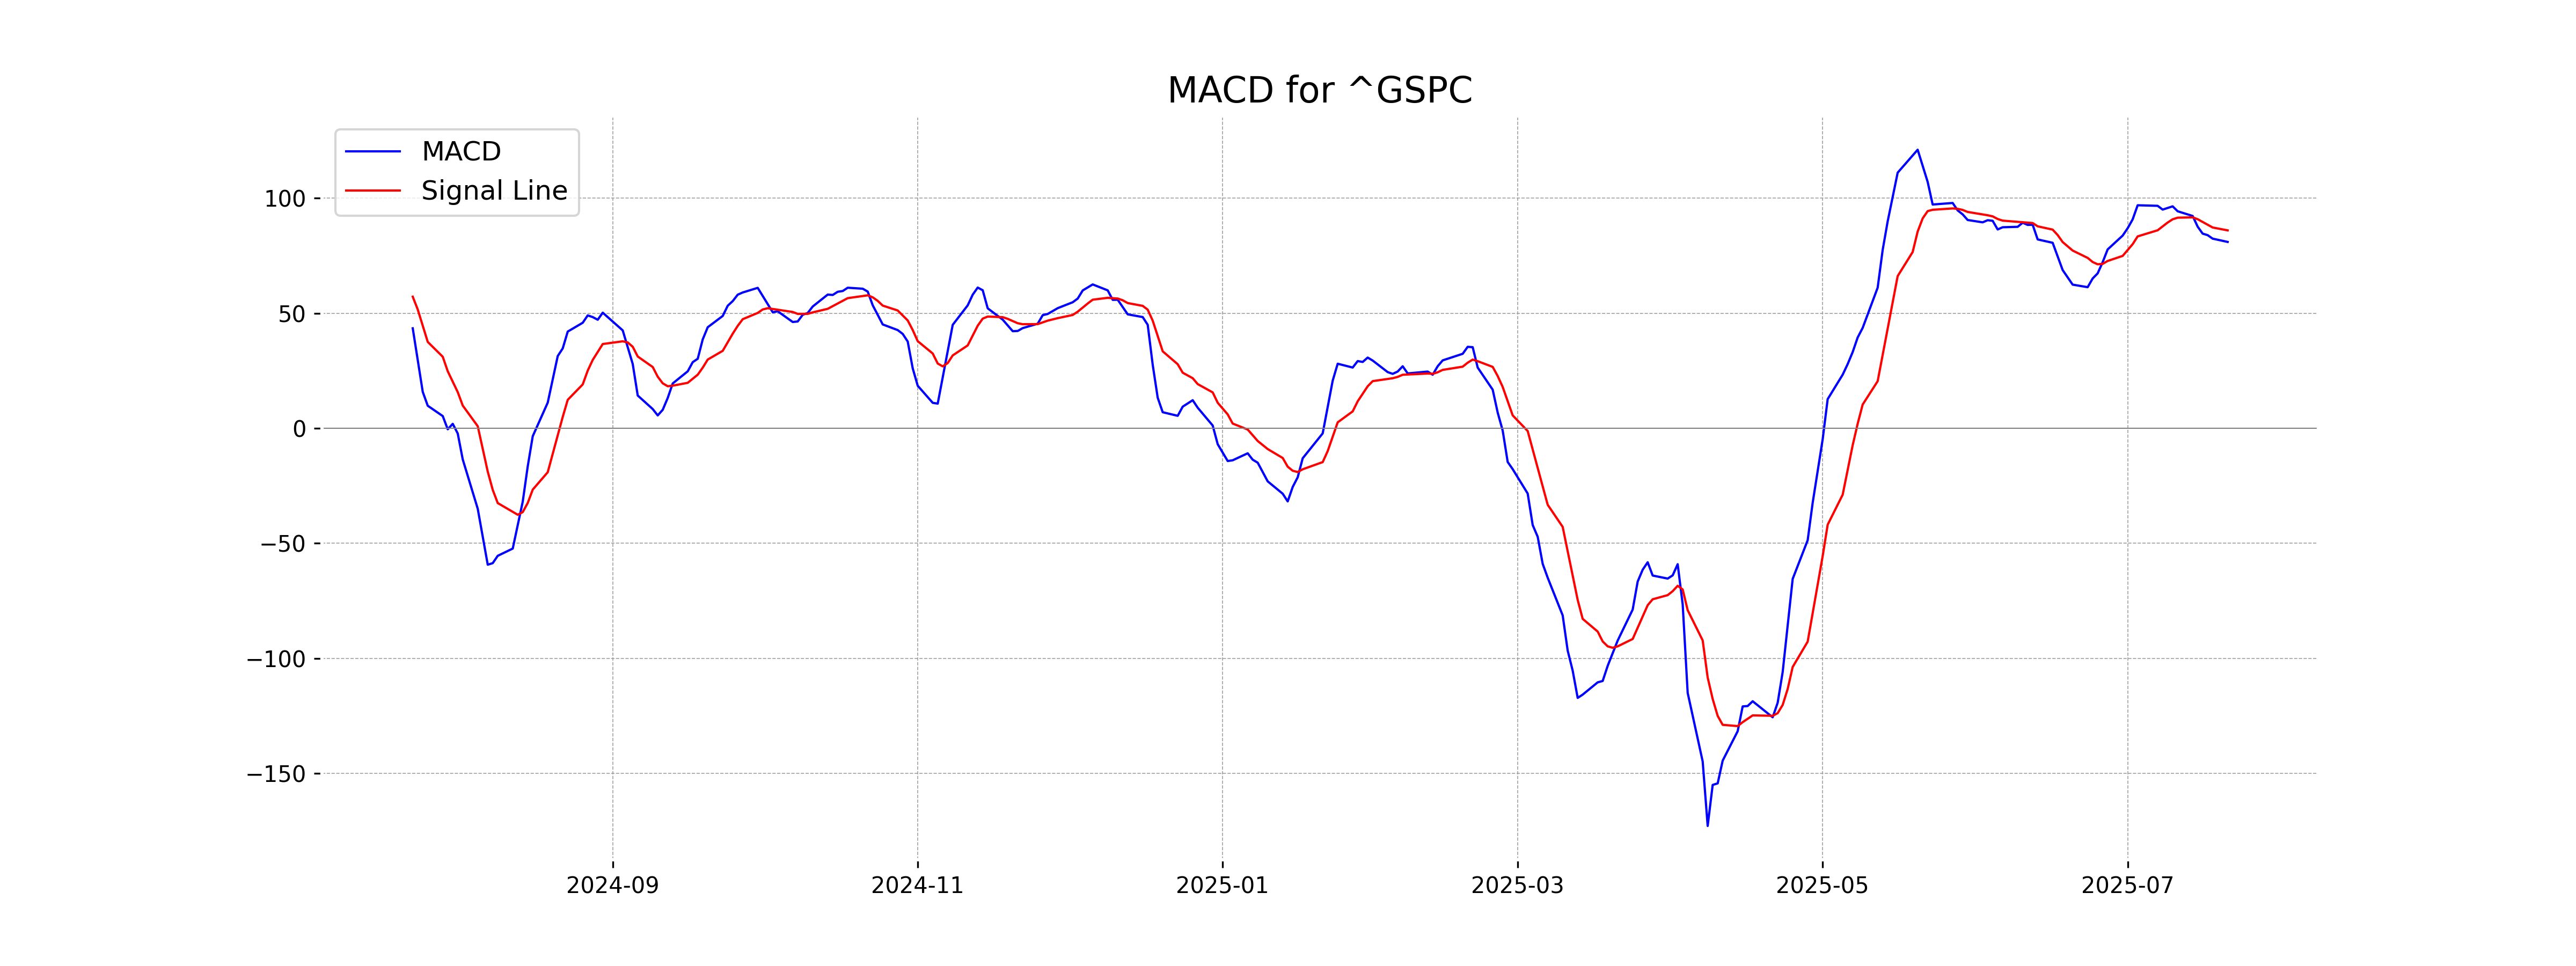
Moving Averages Trend (MACD)
MACD Analysis for S&P 500 (US): The MACD value for the S&P 500 is at 81.01, while the MACD Signal line is at 86.03. This indicates a slightly bearish crossover, suggesting a potential downtrend or consolidation phase in the near term.
RSI Analysis
The RSI for S&P 500 currently stands at 69.75, which indicates that the market is approaching overbought territory. This suggests that the index may experience a price correction or consolidation in the near future if the RSI continues to rise.
Analysis for Hang Seng Index (Hong Kong) - July 22, 2025
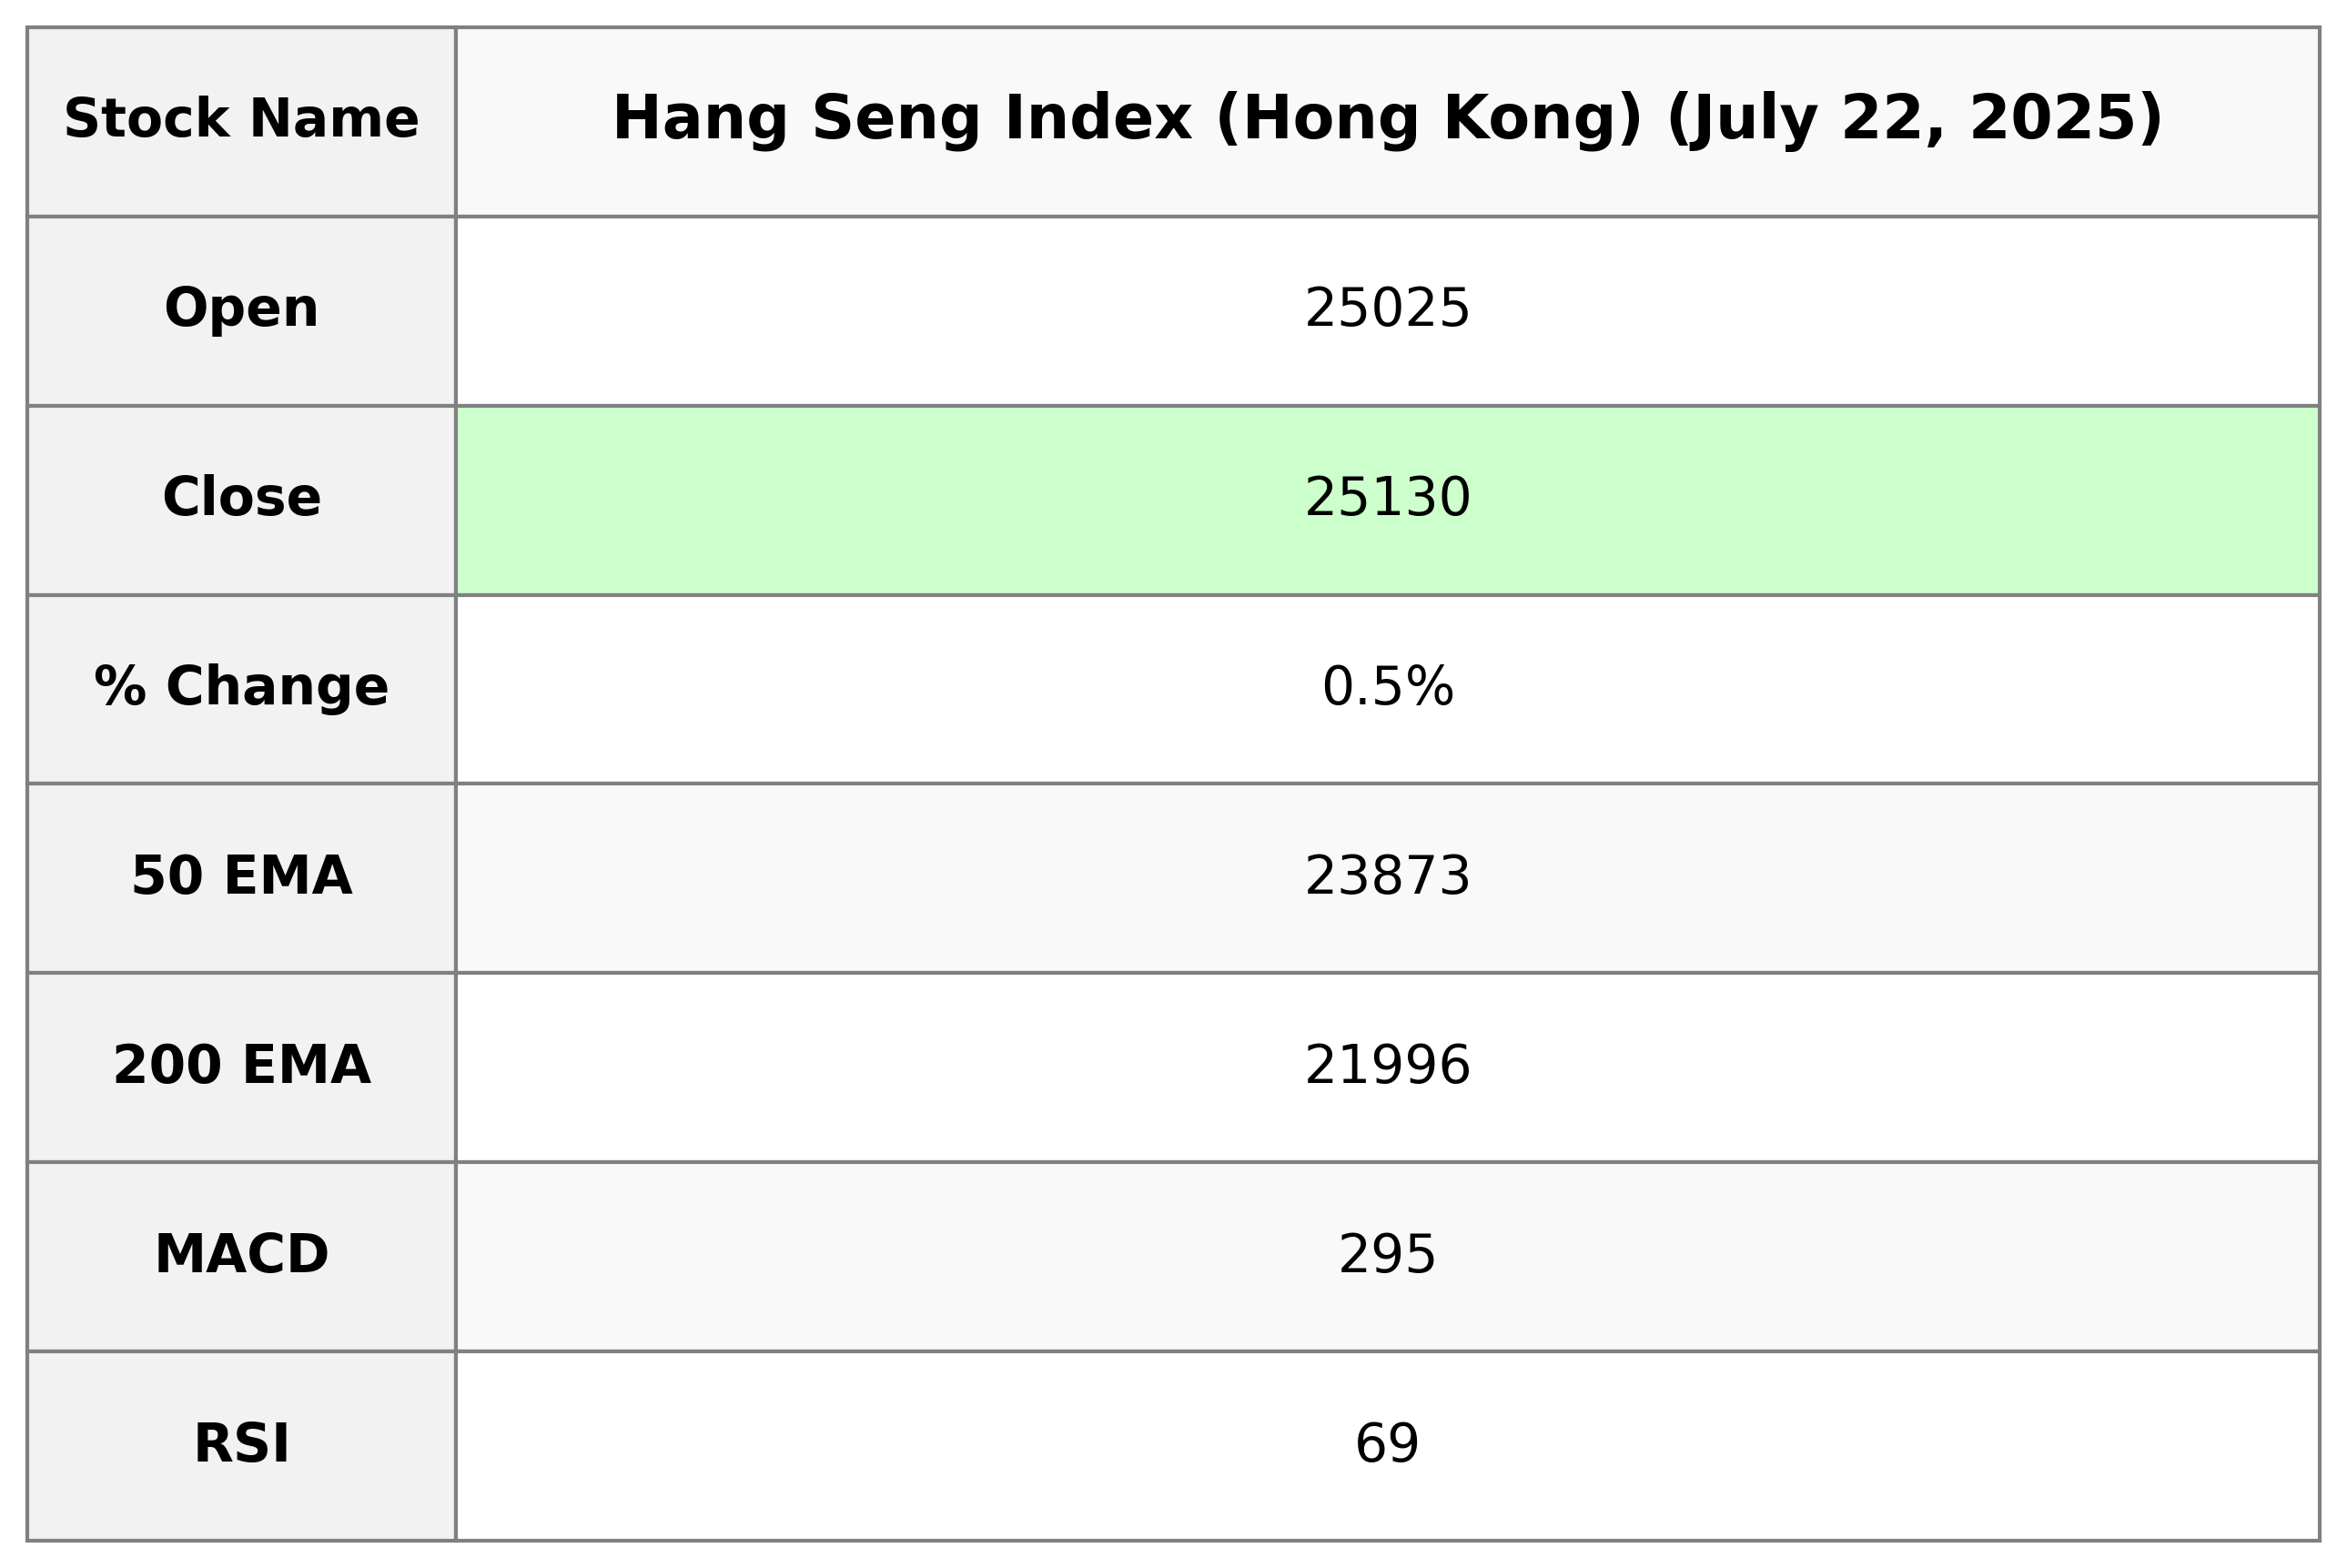
The Hang Seng Index opened at 25024.93, reached a high of 25130.03, and closed at the same high after reaching a low of 24900.59. This represents a percentage change of 0.54% with a points change of 135.89 compared to the previous close of 24994.14. The RSI stands at 68.68, indicating a strong trend, while the MACD value of 295.03 suggests bullish momentum.
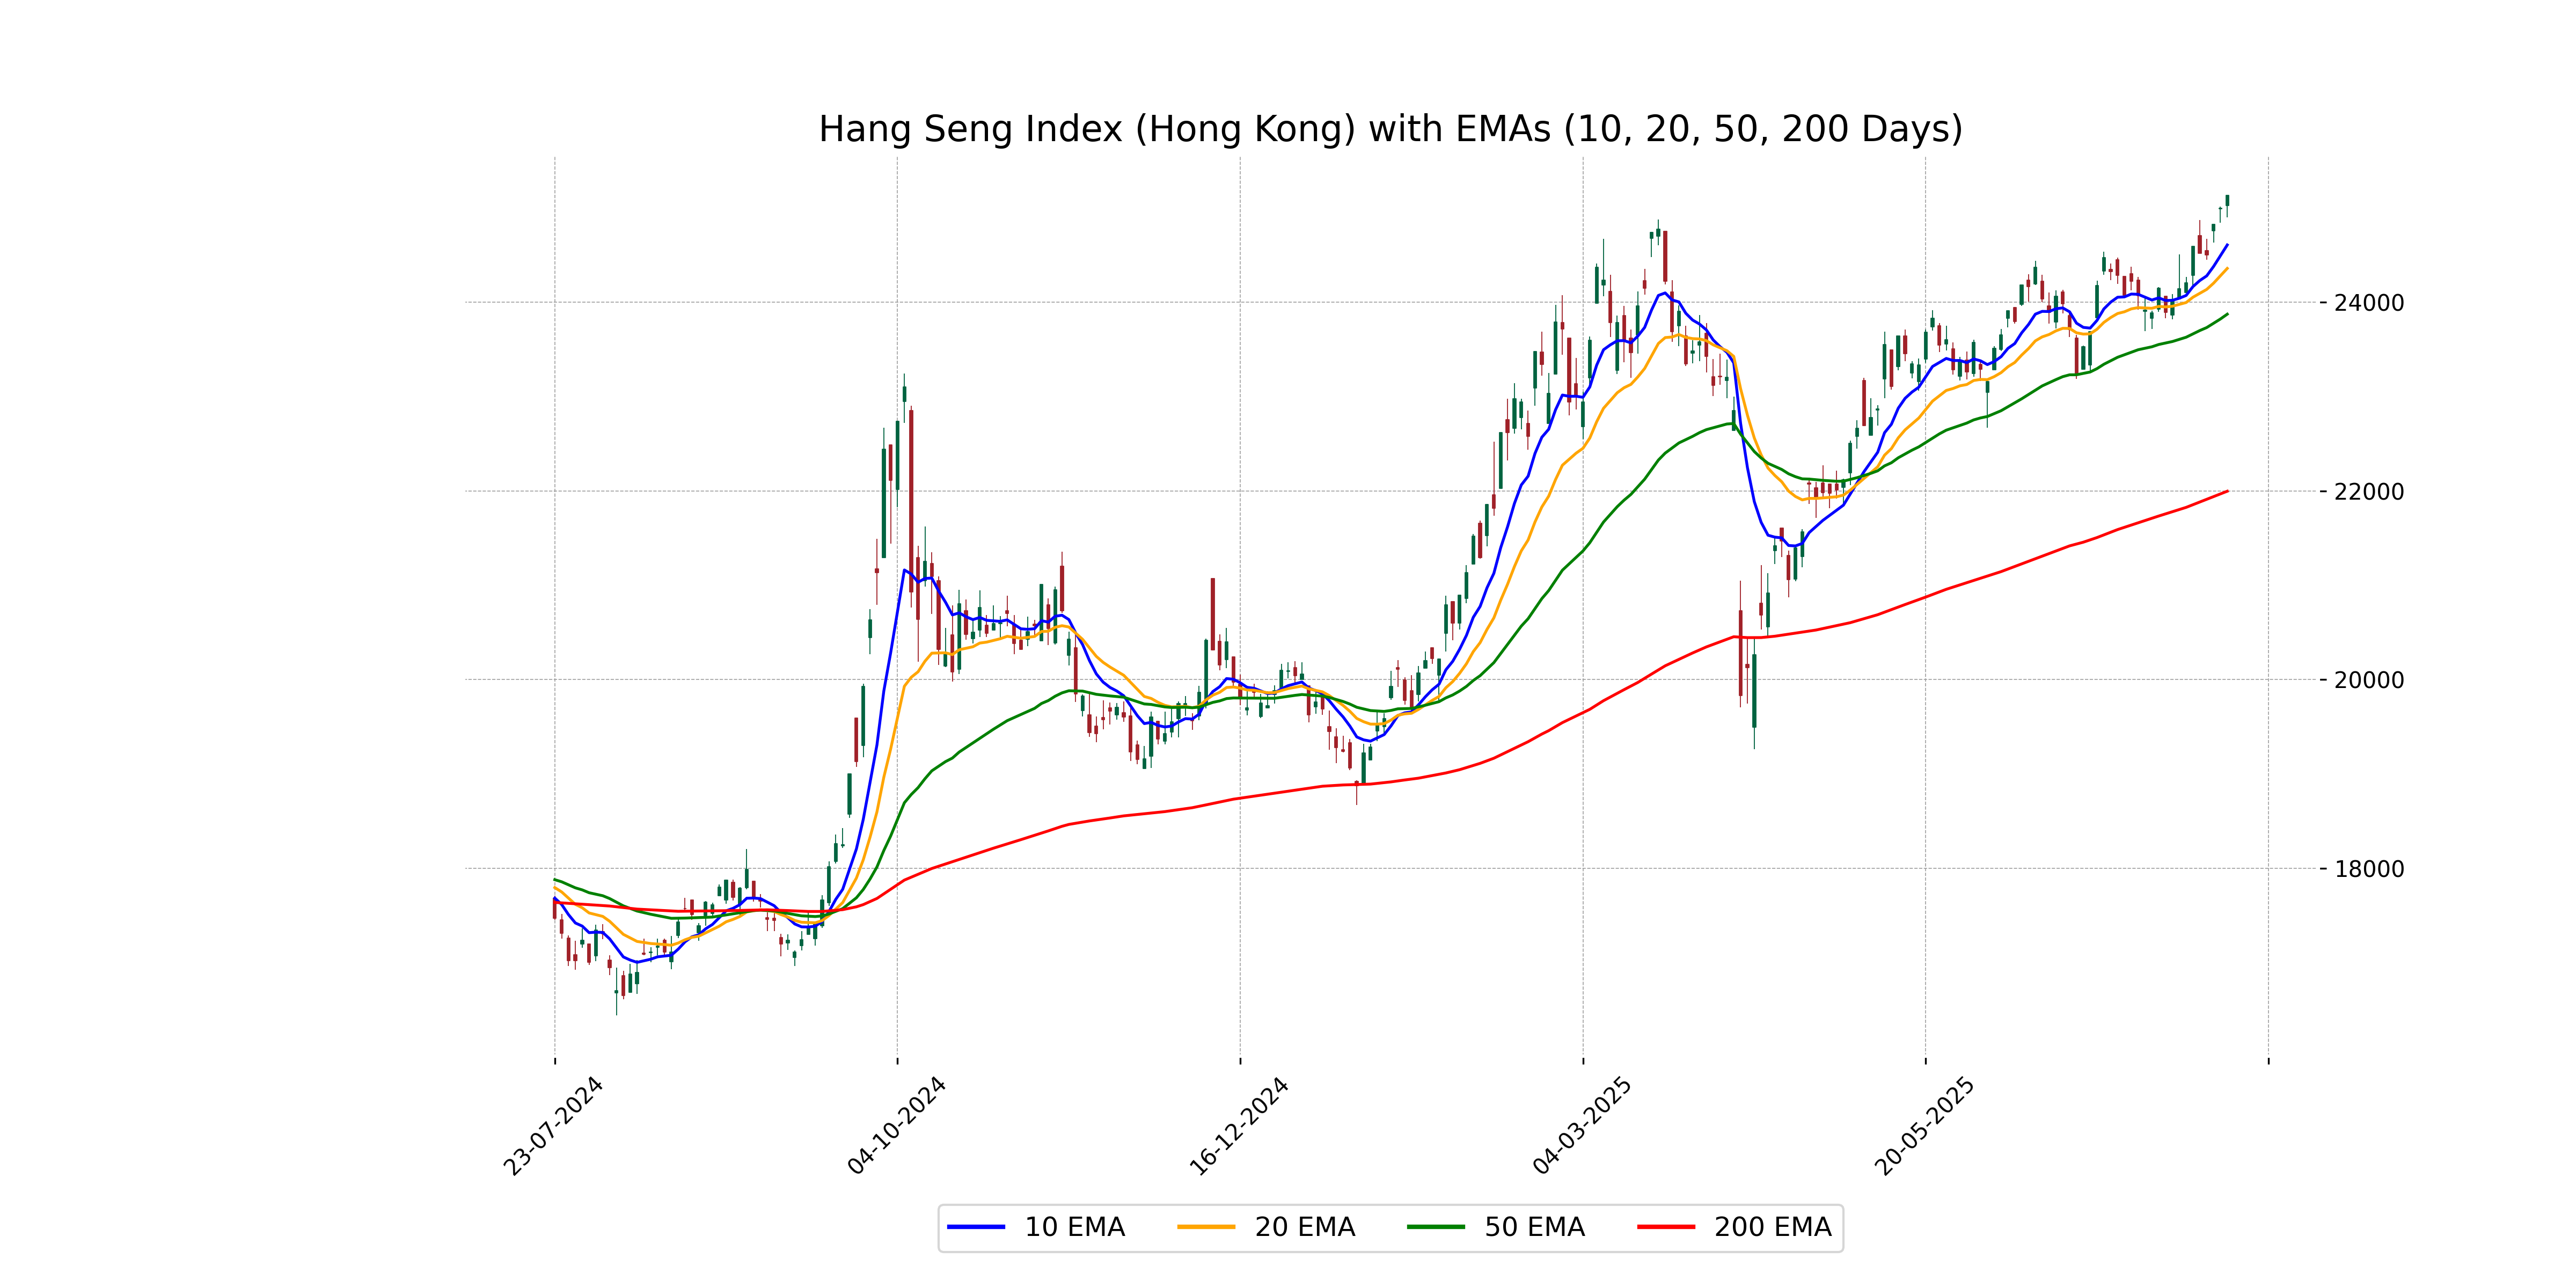
Relationship with Key Moving Averages
The Hang Seng Index's closing price of 25,130.03 is above all key moving averages: the 50 EMA at 23,872.62, the 200 EMA at 21,995.74, the 10 EMA at 24,606.30, and the 20 EMA at 24,357.70, indicating a bullish momentum. The positive MACD of 295.03 above the MACD Signal of 214.14 further supports the bullish trend.
Moving Averages Trend (MACD)
The MACD for Hang Seng Index indicates a strong bullish momentum, with the MACD line at 295.03 above the signal line at 214.14. This positive divergence suggests potential continued upward movement in the index.

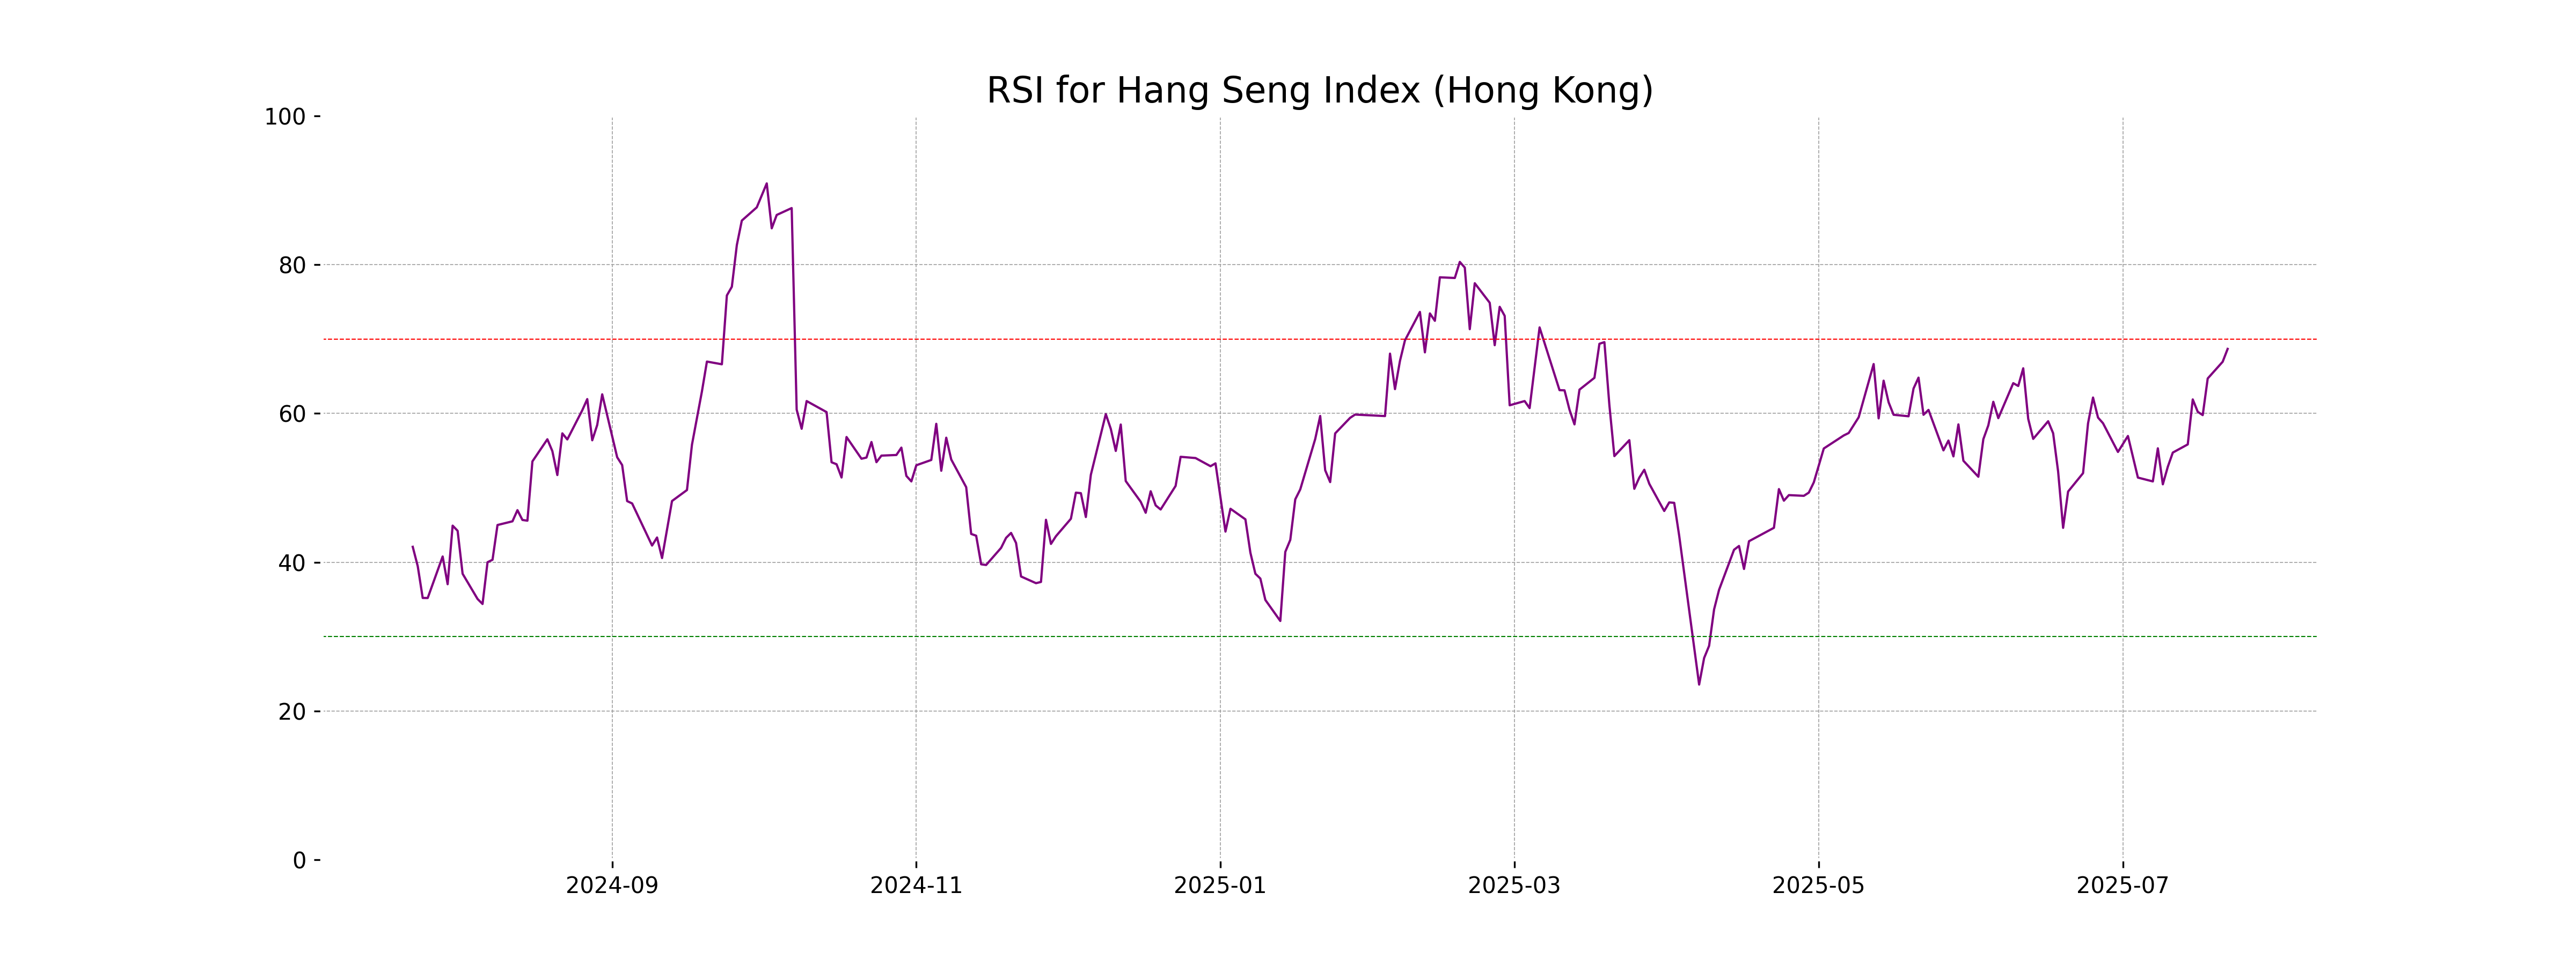
RSI Analysis
The RSI of the Hang Seng Index is 68.68, indicating that the index is nearing the overbought level, which typically signifies potential for a price correction or consolidation. Generally, an RSI above 70 suggests that an asset might be overbought.
Analysis for IBEX 35 (Spain) - July 22, 2025
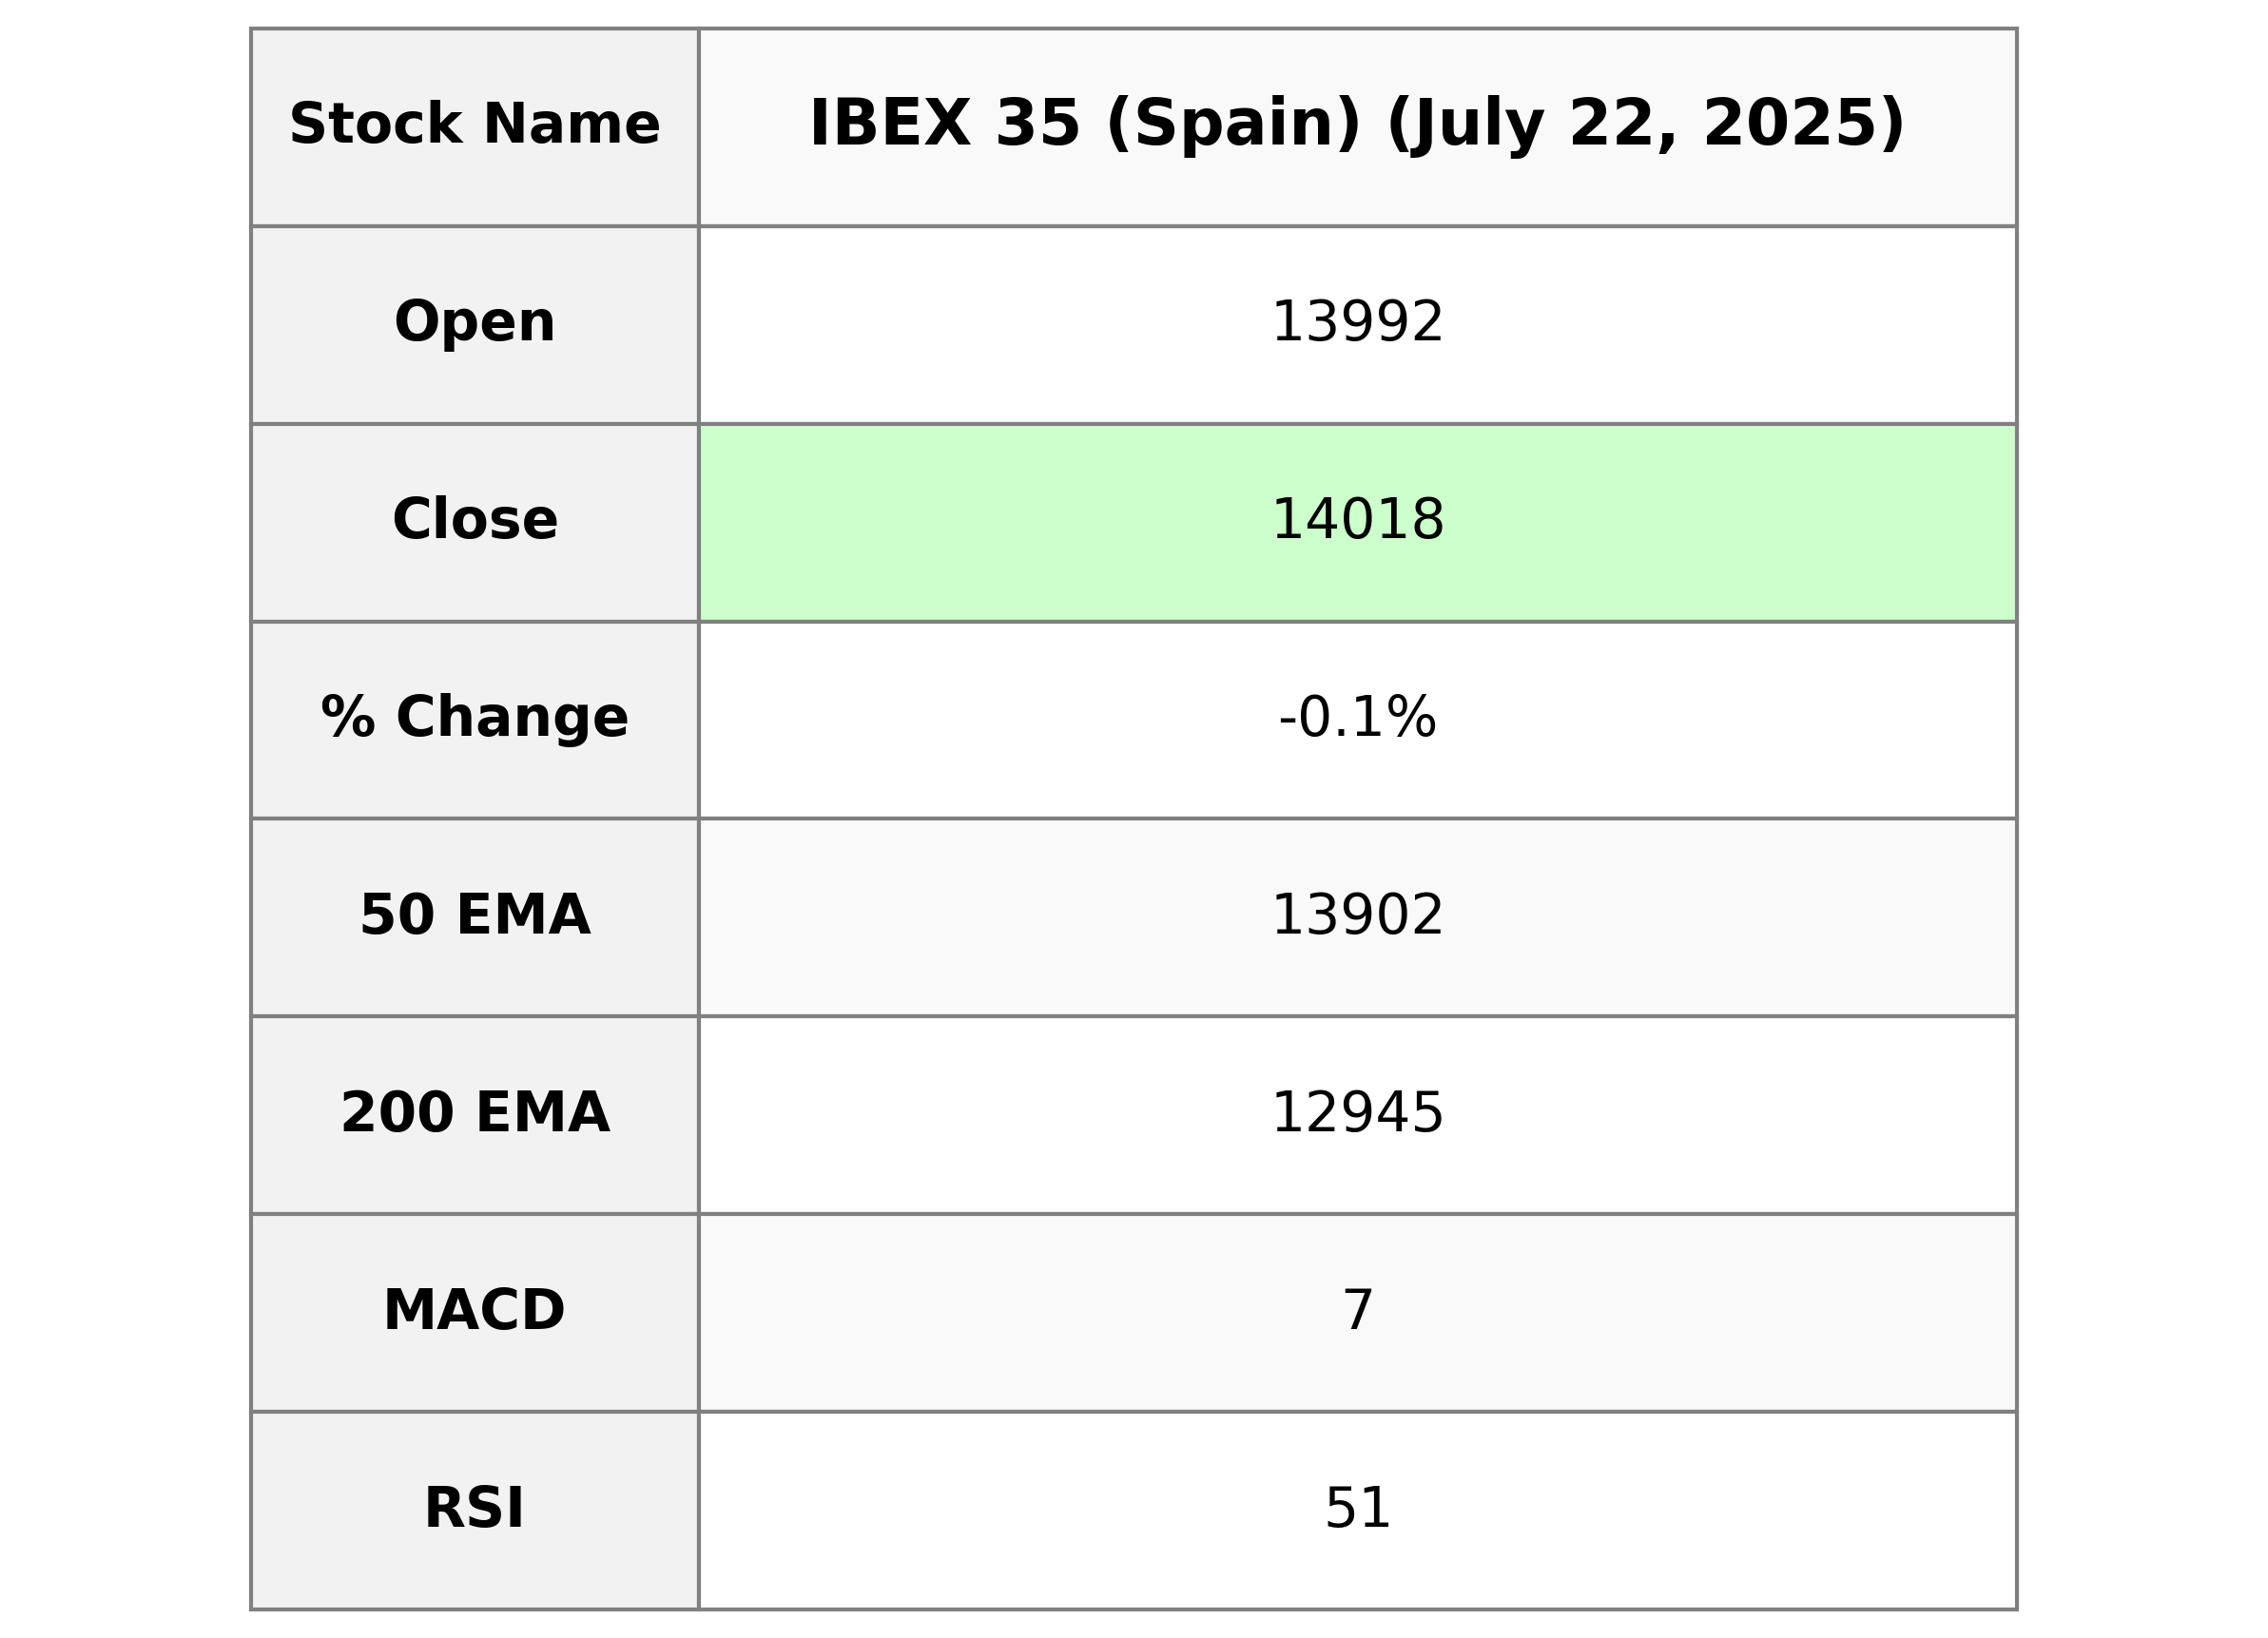
The IBEX 35 (Spain) opened at 13,992.0 and closed at 14,018.10, showing a slight points decrease from its previous close of 14,031.50. The index recorded a low of 13,992.0 and a high of 14,049.30, with a percentage change of -0.10%. The RSI stands at 50.90, suggesting a relatively neutral market stance, while the MACD of 7.05 indicates a bearish trend as it is below the MACD Signal of 14.94.
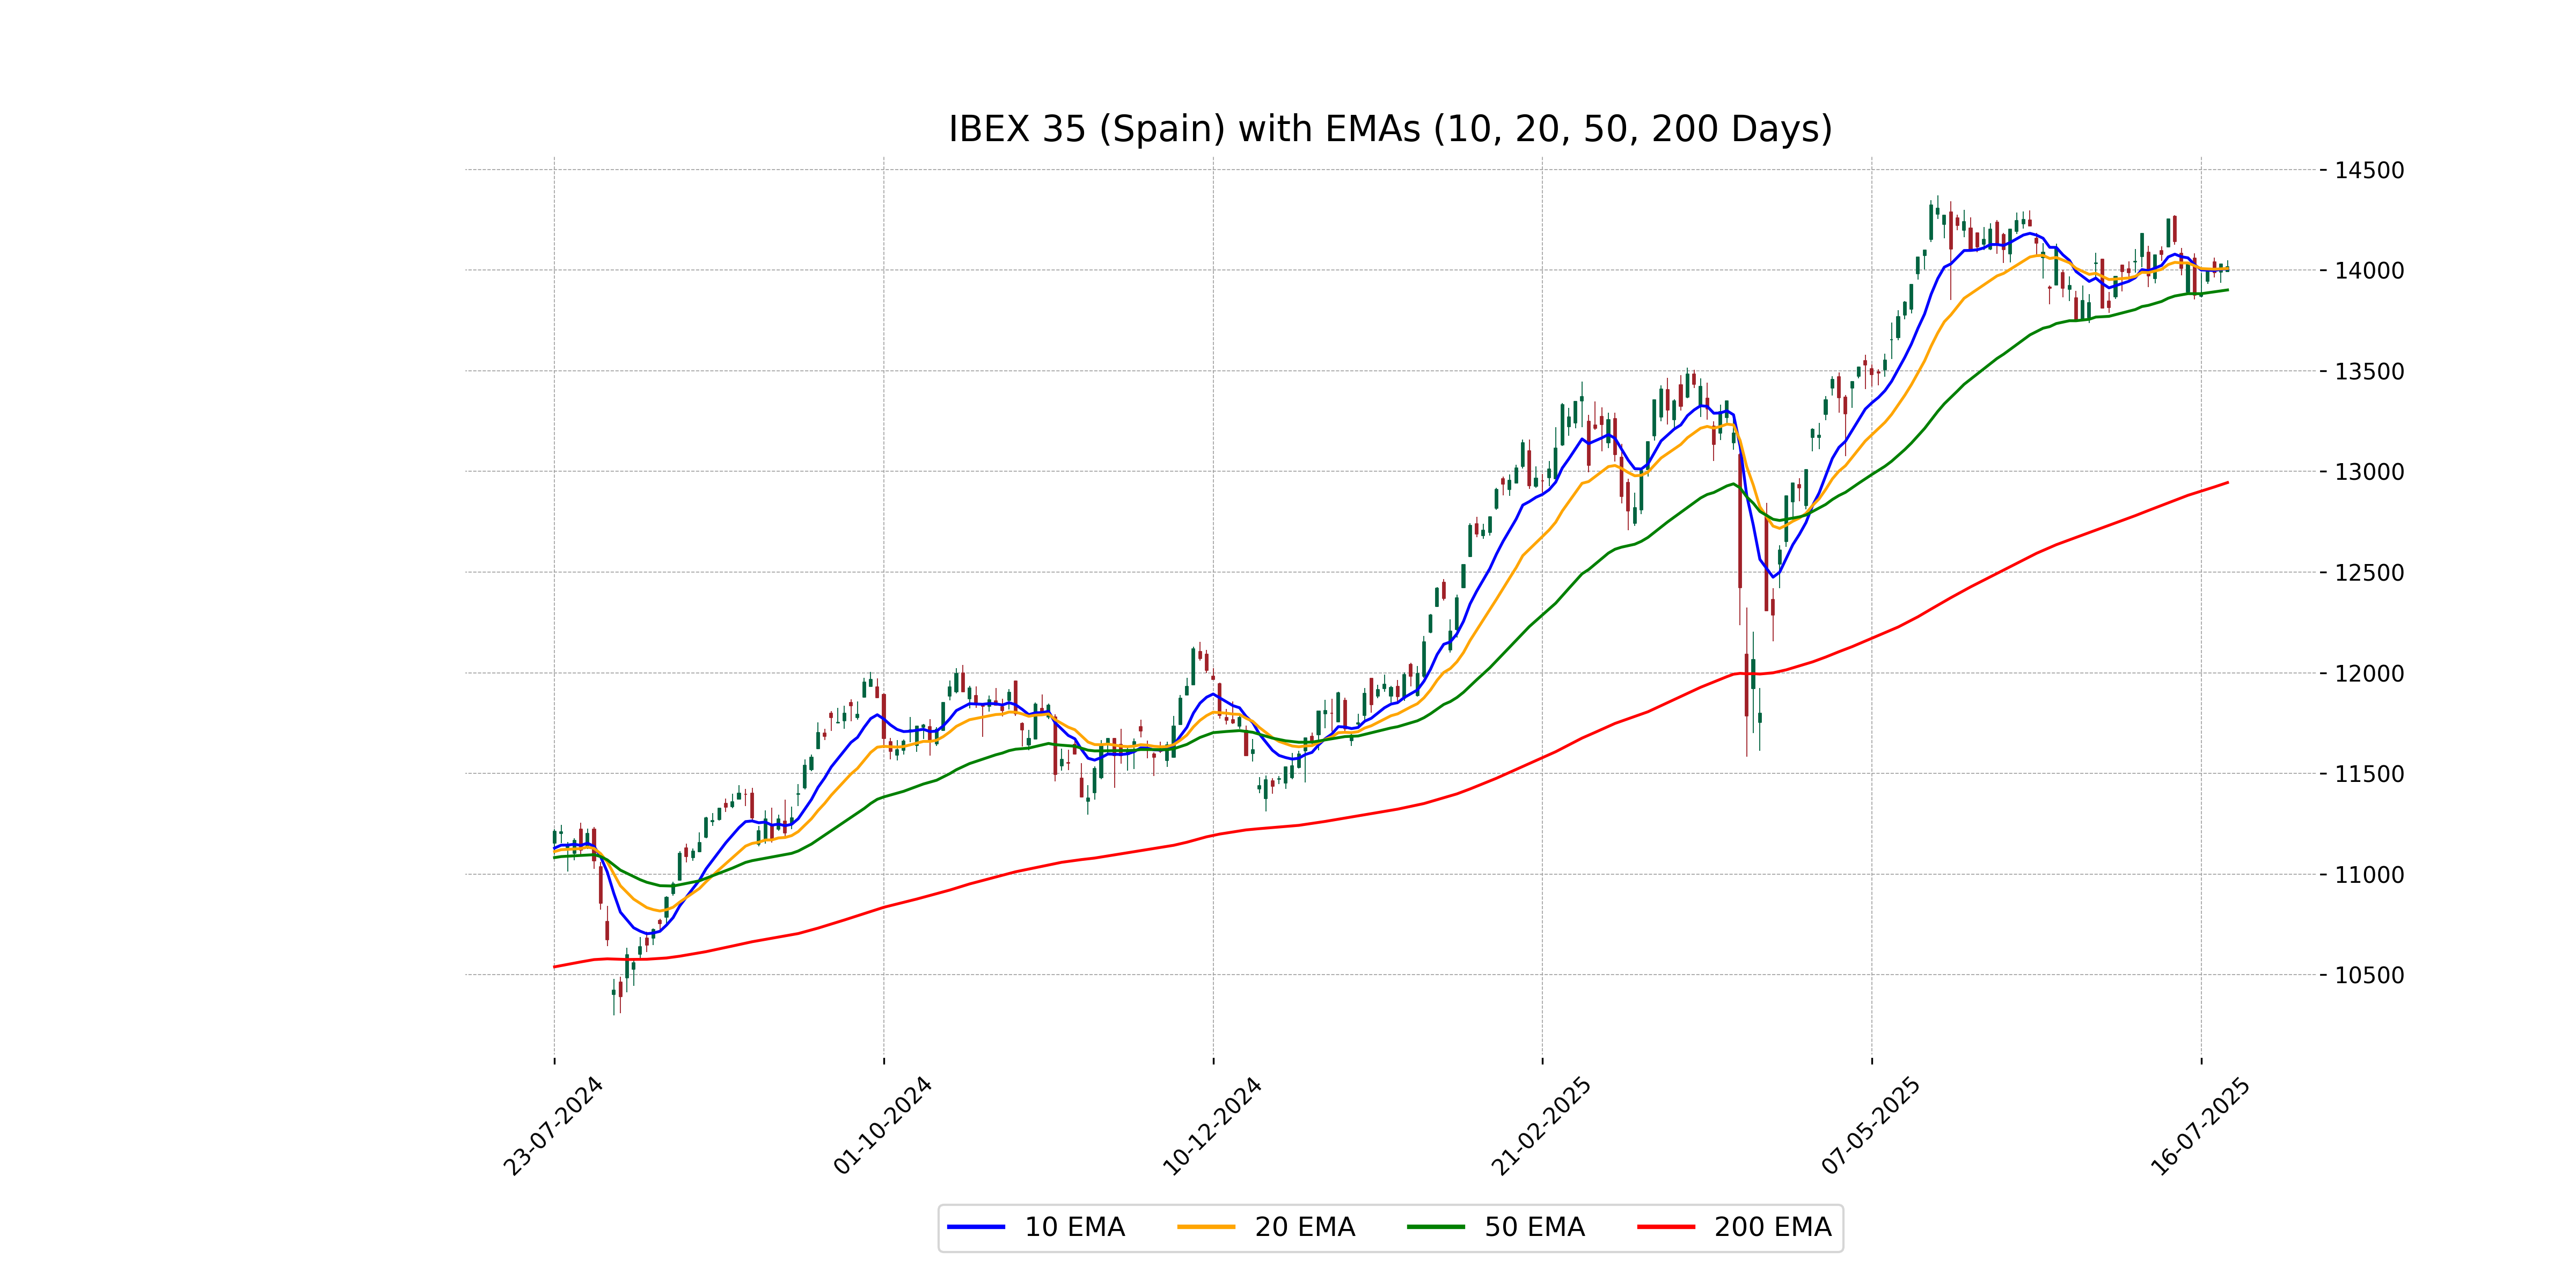
Relationship with Key Moving Averages
IBEX 35 (Spain) is trading above its 50-day EMA of 13,901.74 but below the 10-day EMA of 14,006.77 and the 20-day EMA of 14,008.41, suggesting mixed short-term momentum. Its current price of 14,018.10 indicates the index is navigating around the shorter-term moving averages, which may imply consolidation or indecision in the market.
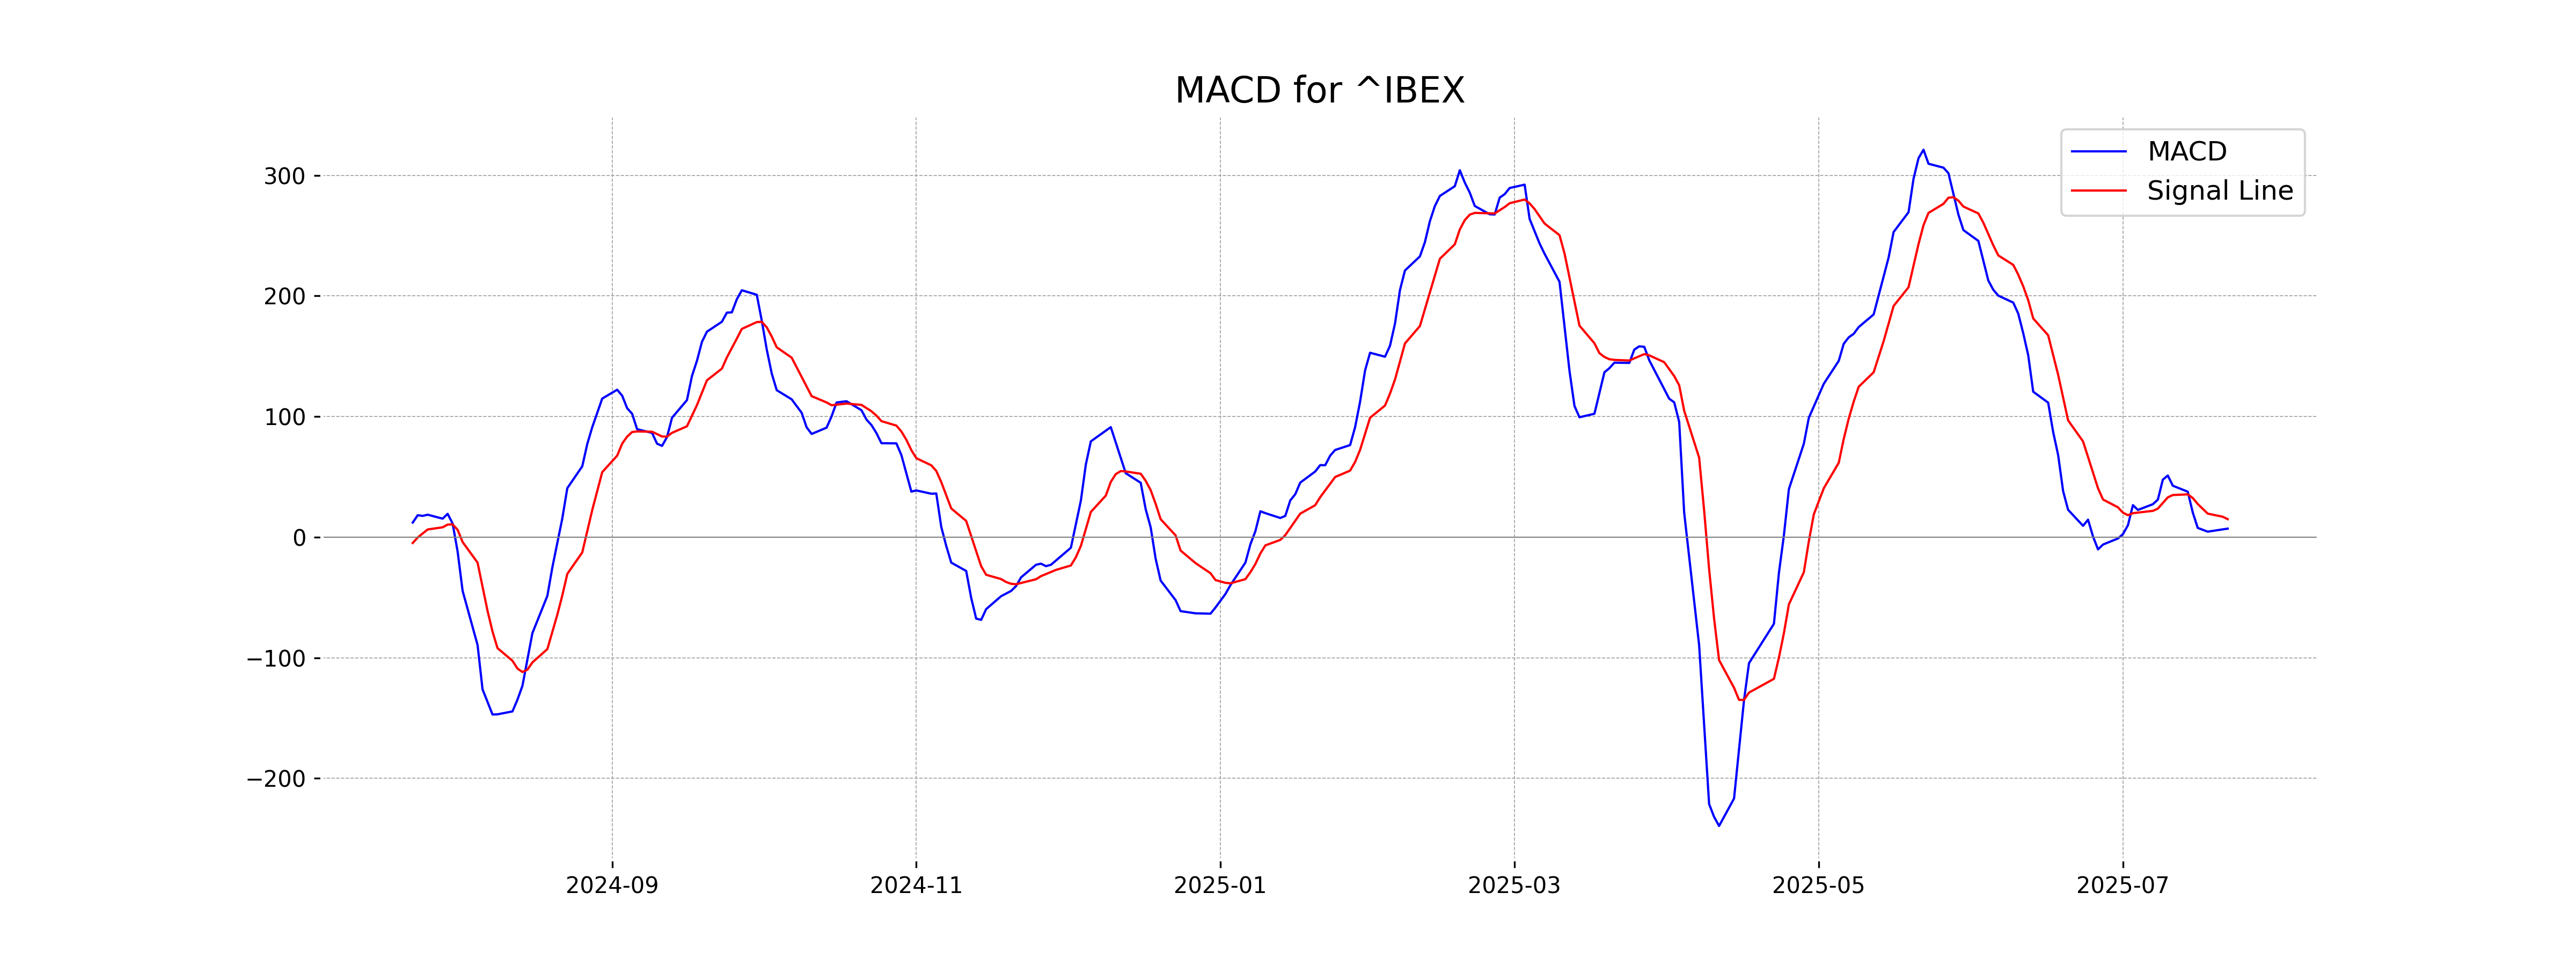
Moving Averages Trend (MACD)
For IBEX 35 (Spain), the MACD line is currently at 7.05, which is below the MACD Signal line of 14.94, indicating a potential bearish trend or that the recent upward movement might be losing momentum. Traders may look for crossover signals or additional confirmation before making trading decisions.
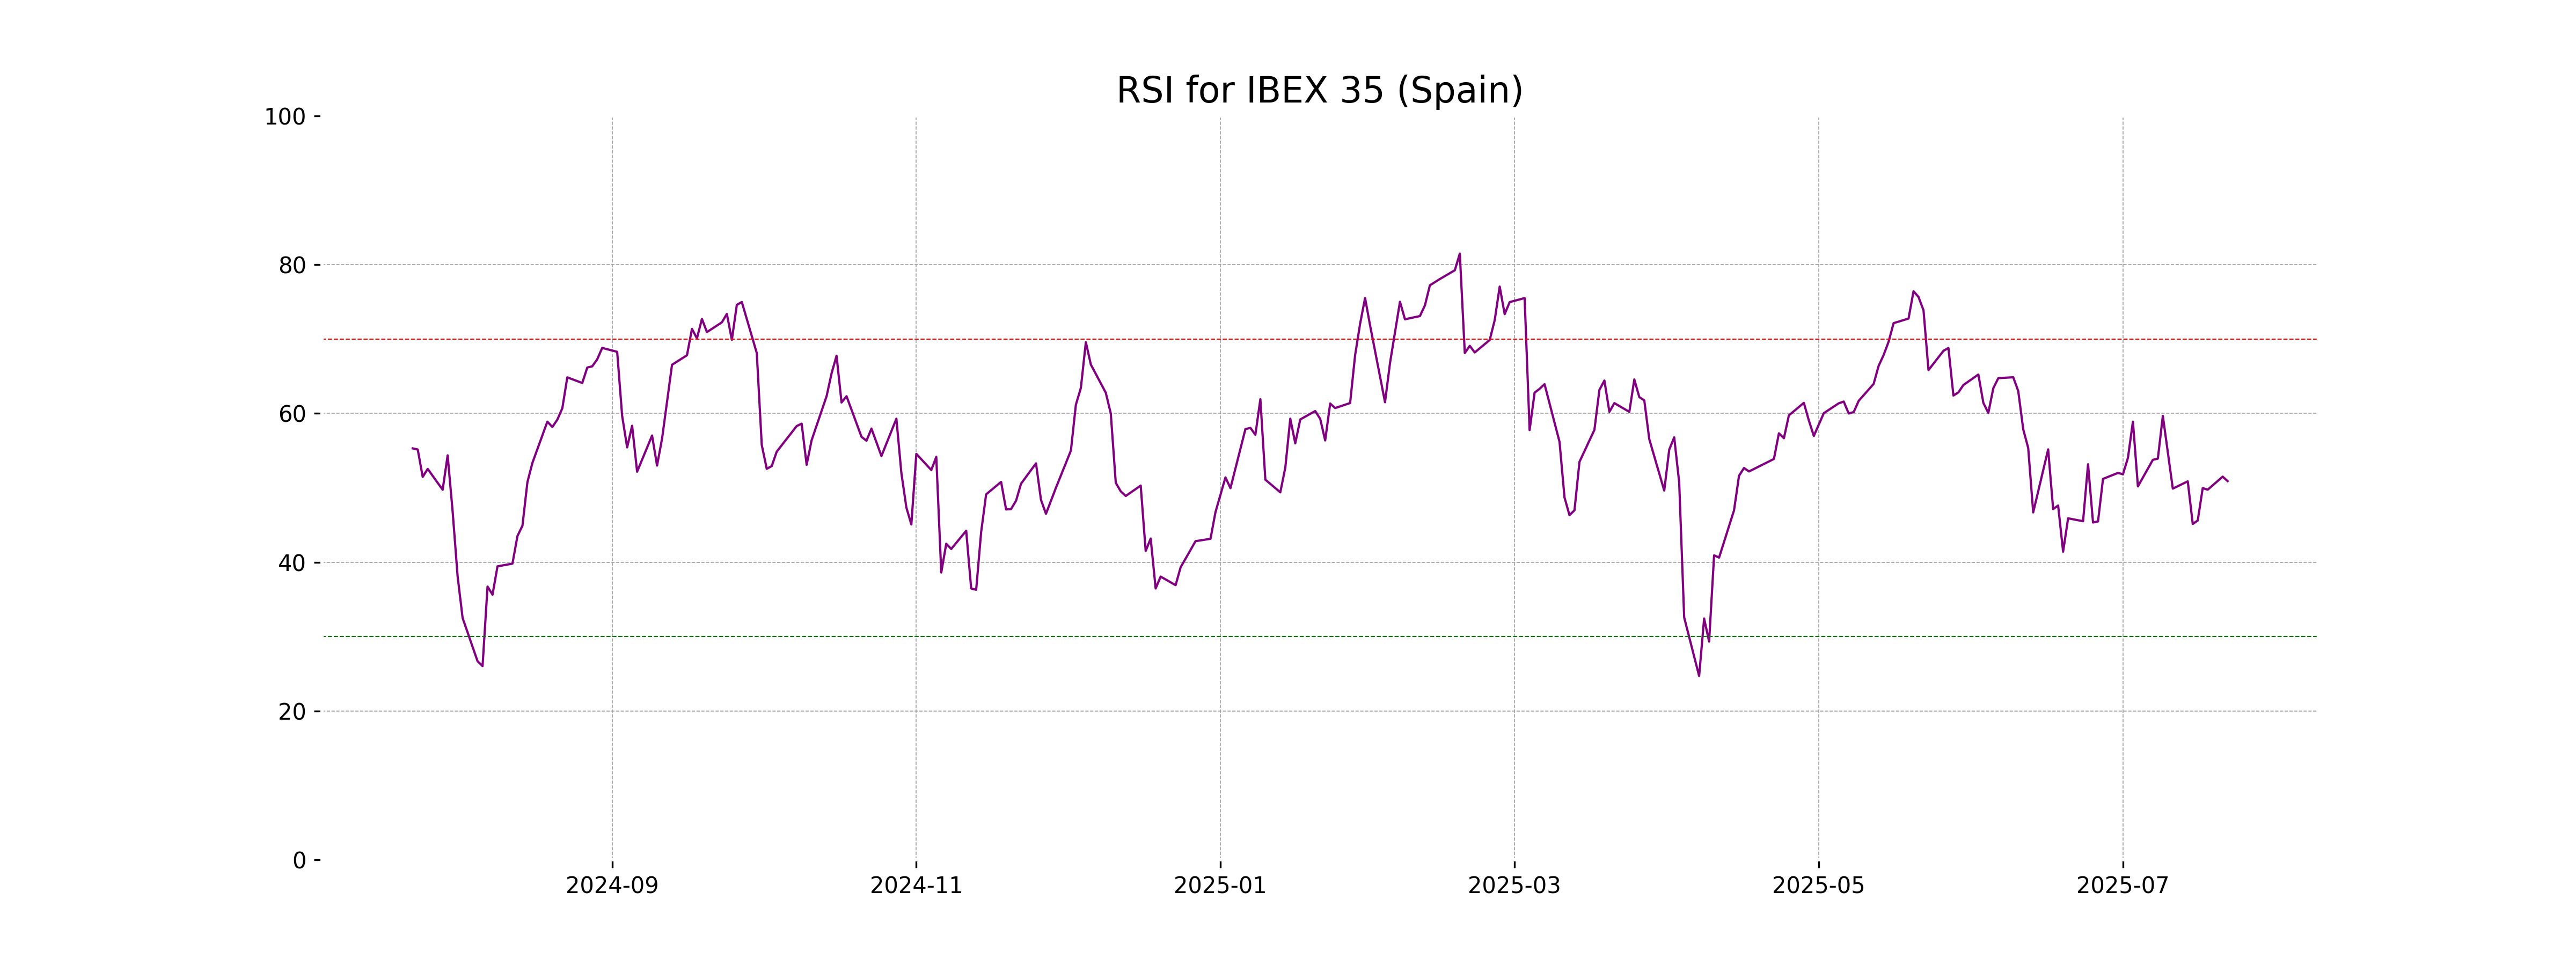
RSI Analysis
RSI for IBEX 35 stands at approximately 50.90, indicating a neutral market sentiment. Typically, an RSI value around 50 suggests neither overbought nor oversold conditions, suggesting a balance in buying and selling pressure.
Analysis for NASDAQ Composite (US) - July 22, 2025
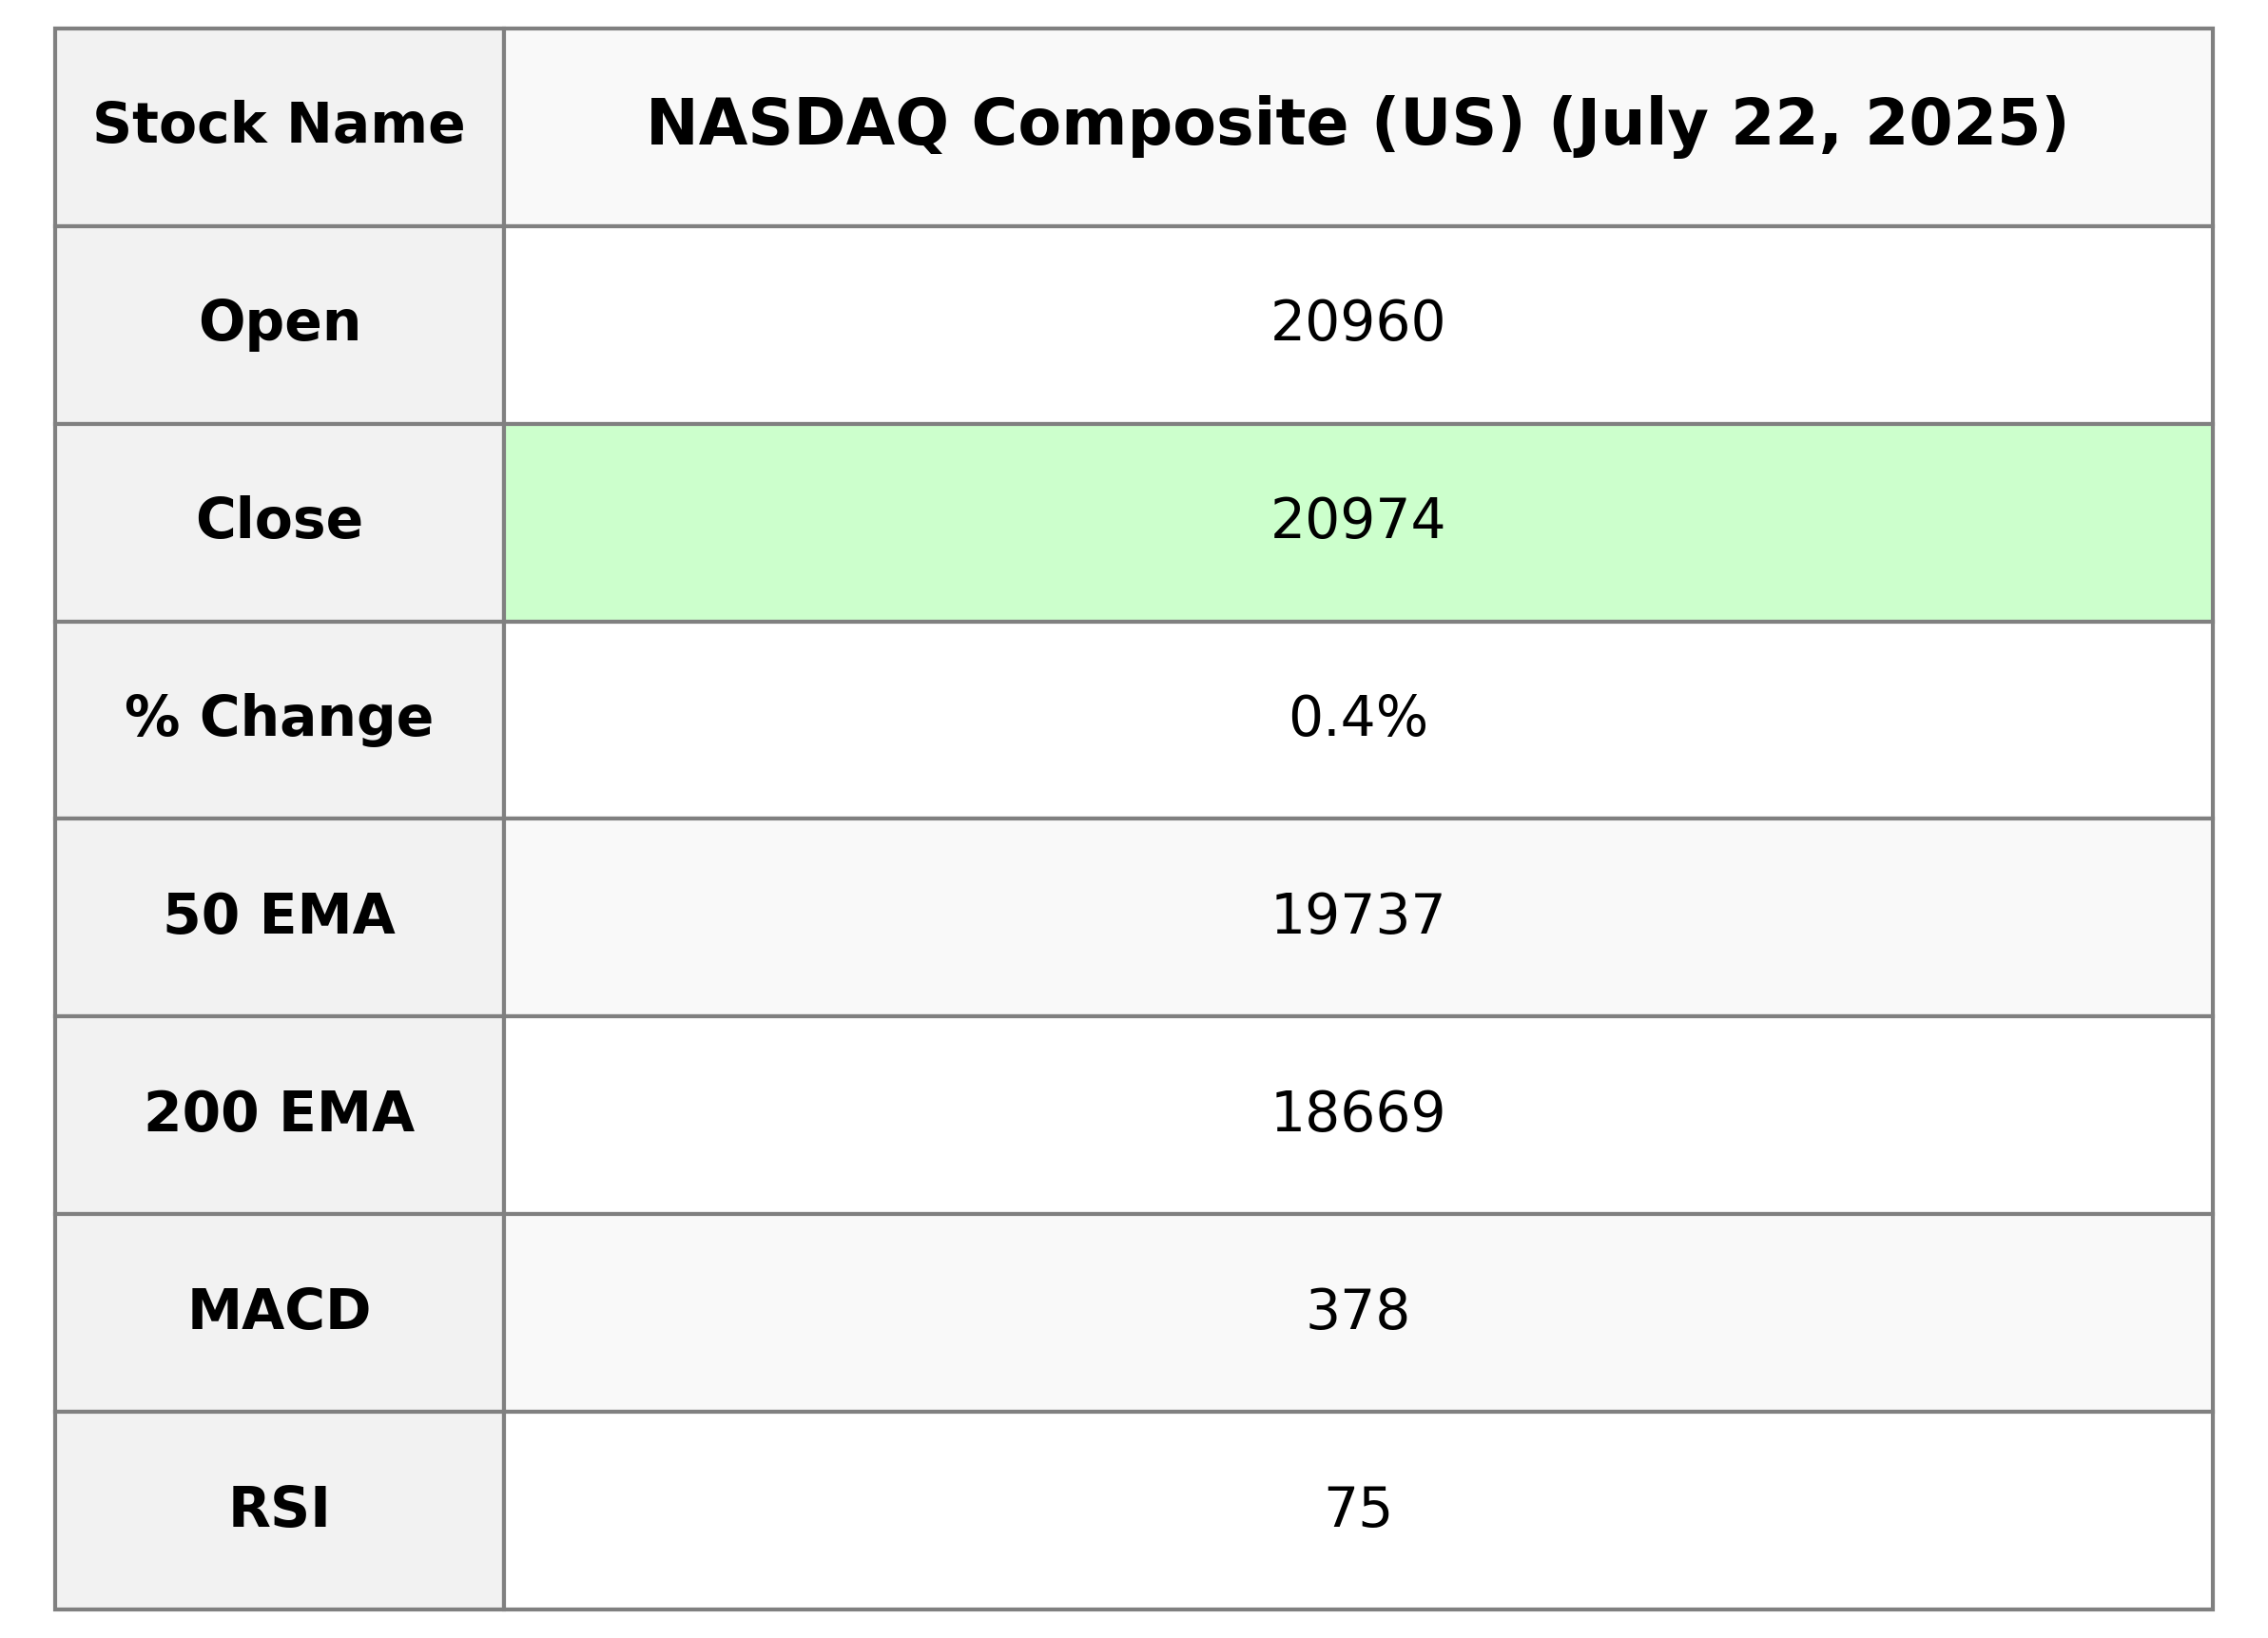
NASDAQ Composite (US) opened at 20960.33 and closed at 20974.18, registering a 0.38% increase with a 78.53 point rise from the previous close of 20895.65. The volume of shares traded was significant at 12.05 billion, while technical indicators show a strong momentum with the RSI at 74.73, suggesting the index is in overbought territory.
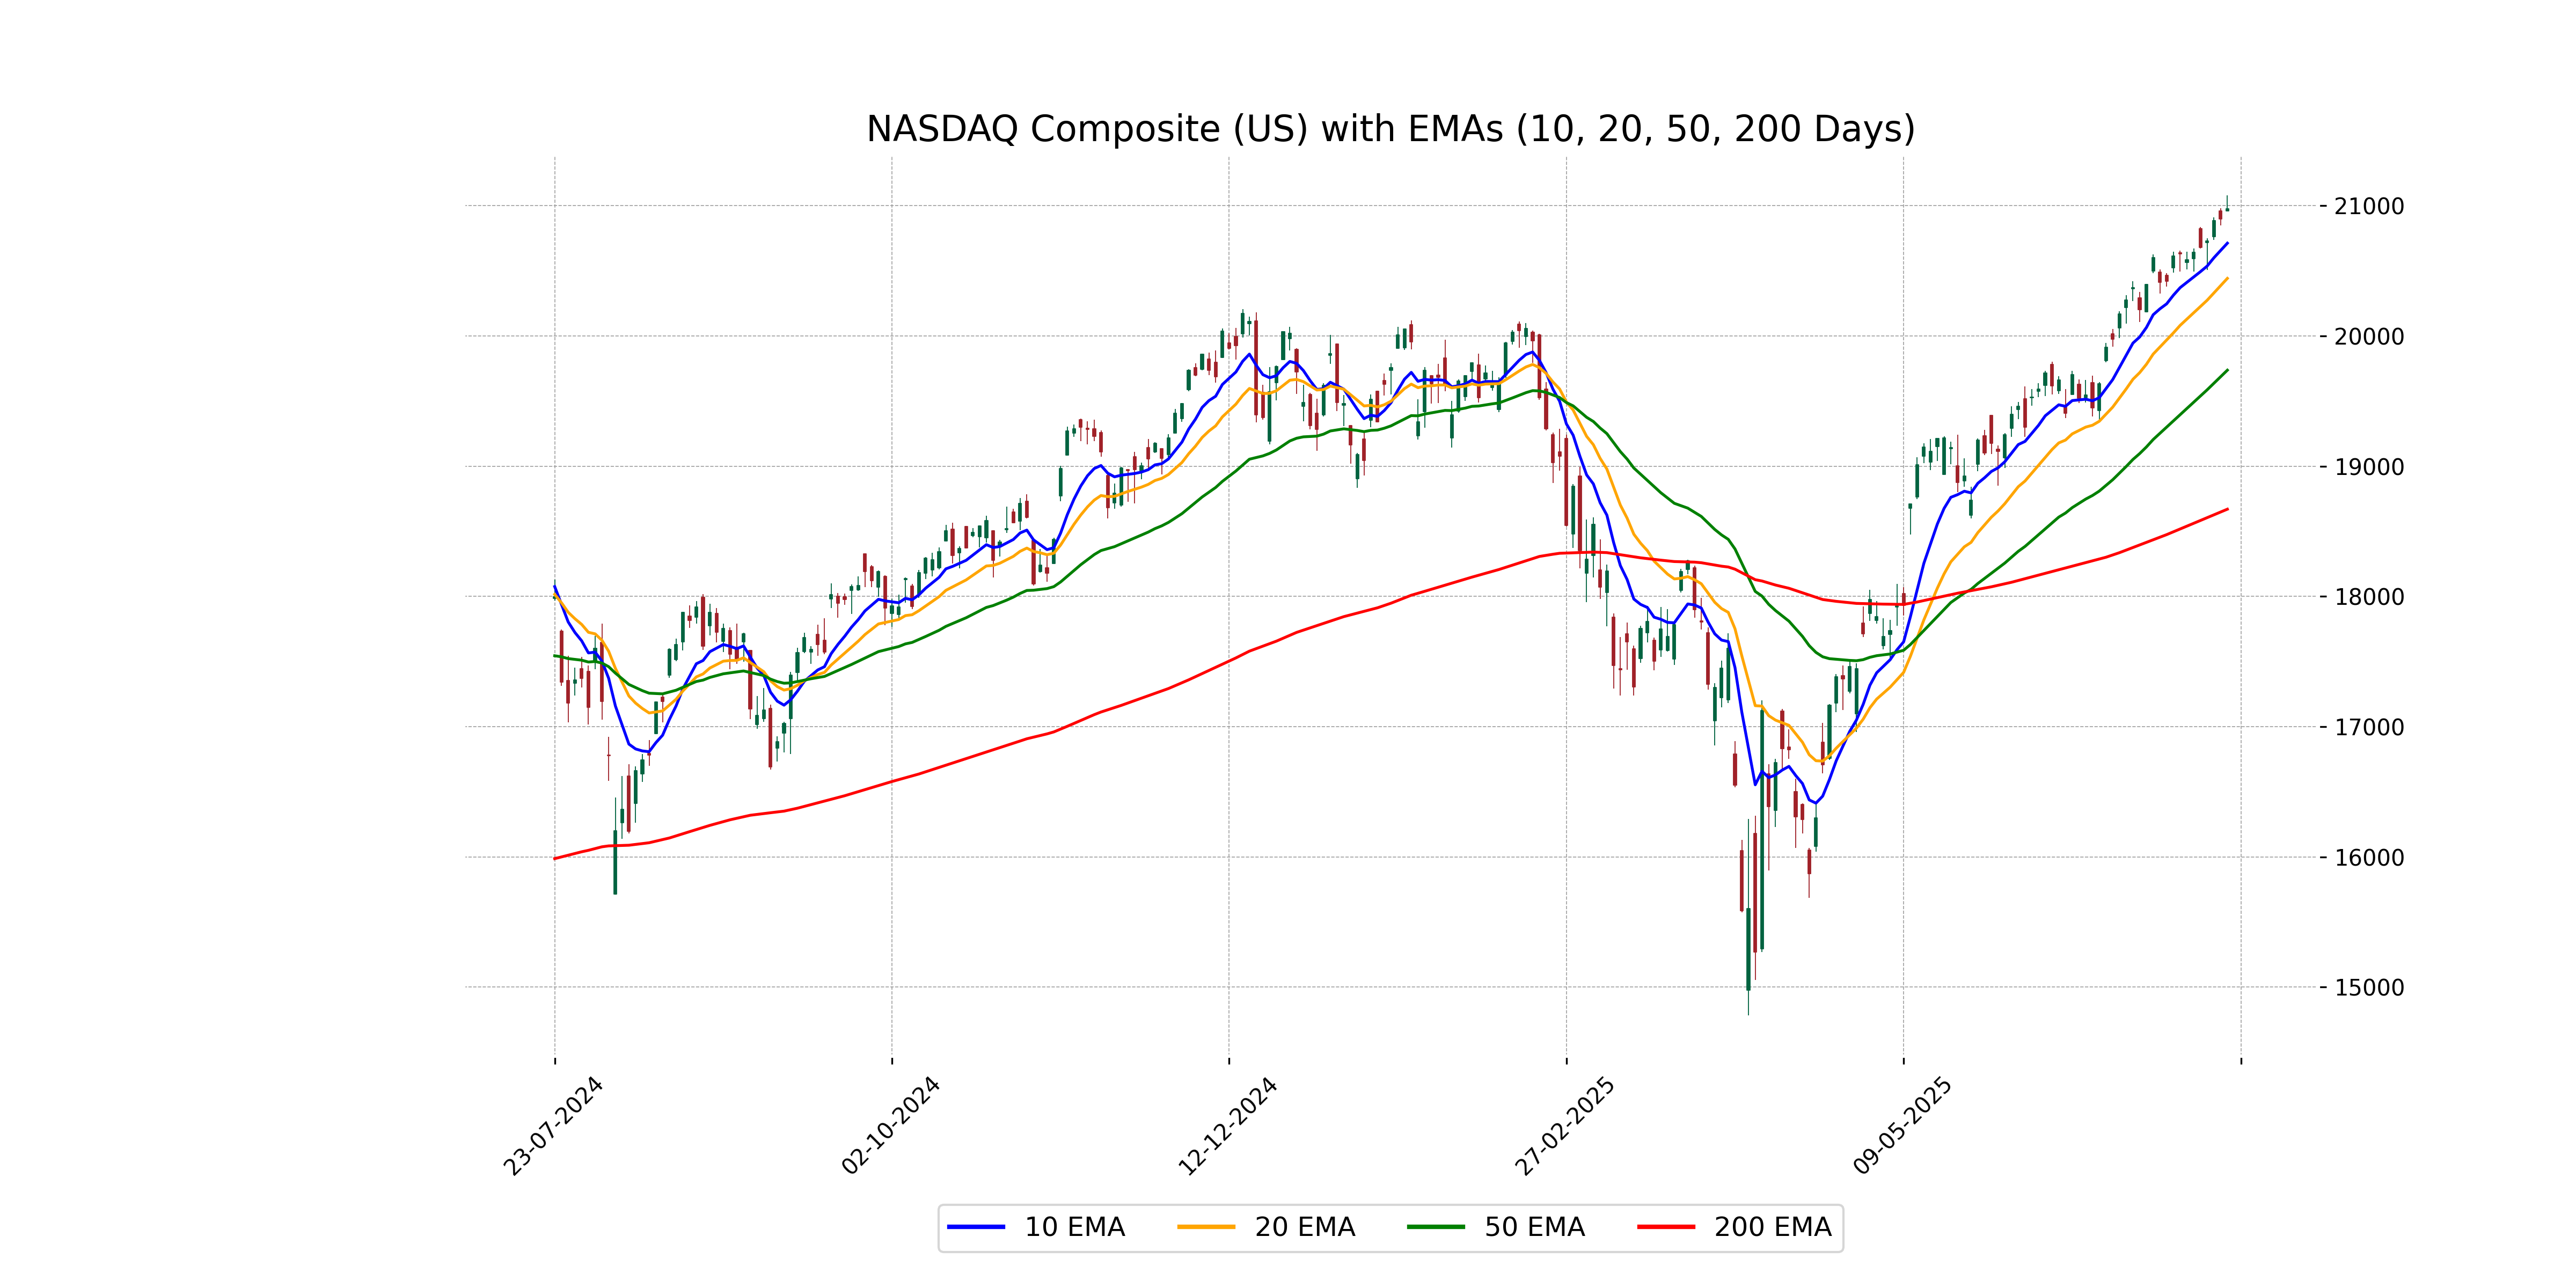
Relationship with Key Moving Averages
The NASDAQ Composite is trading above its key moving averages, with the closing price of 20974.1797 higher than the 50, 200, 10, and 20-period EMAs, indicating a bullish momentum. The RSI of 74.73 suggests that it is in the overbought region. However, the MACD slightly below its signal line could suggest a potential pause or correction in the upward trend.
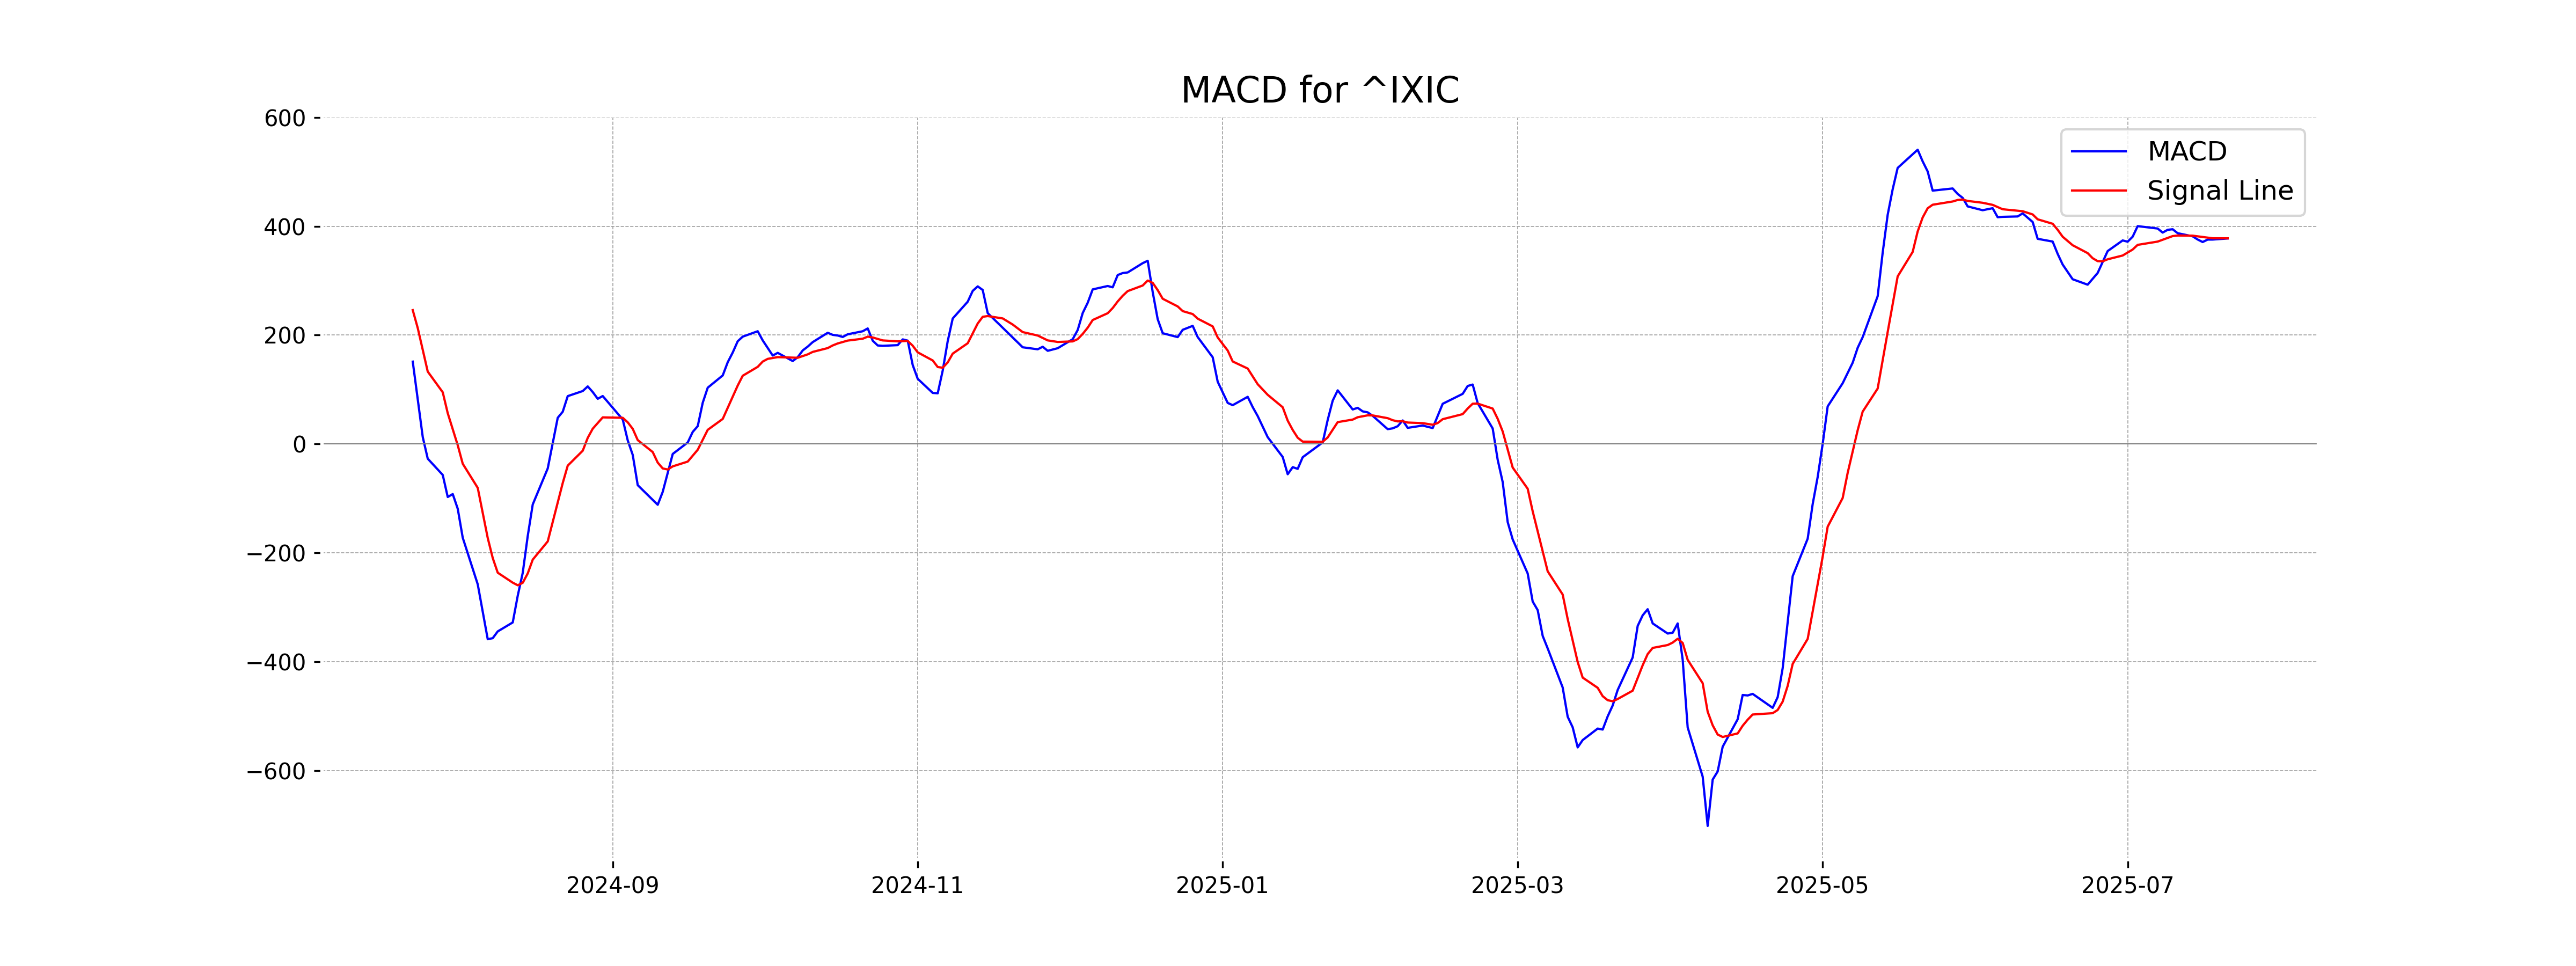
Moving Averages Trend (MACD)
MACD Analysis for NASDAQ Composite (US): The MACD value is 377.51, which is slightly below the MACD Signal line of 377.78. This suggests a potential decrease in bullish momentum. However, since the values are close, it may reflect a period of consolidation or a potential crossover.
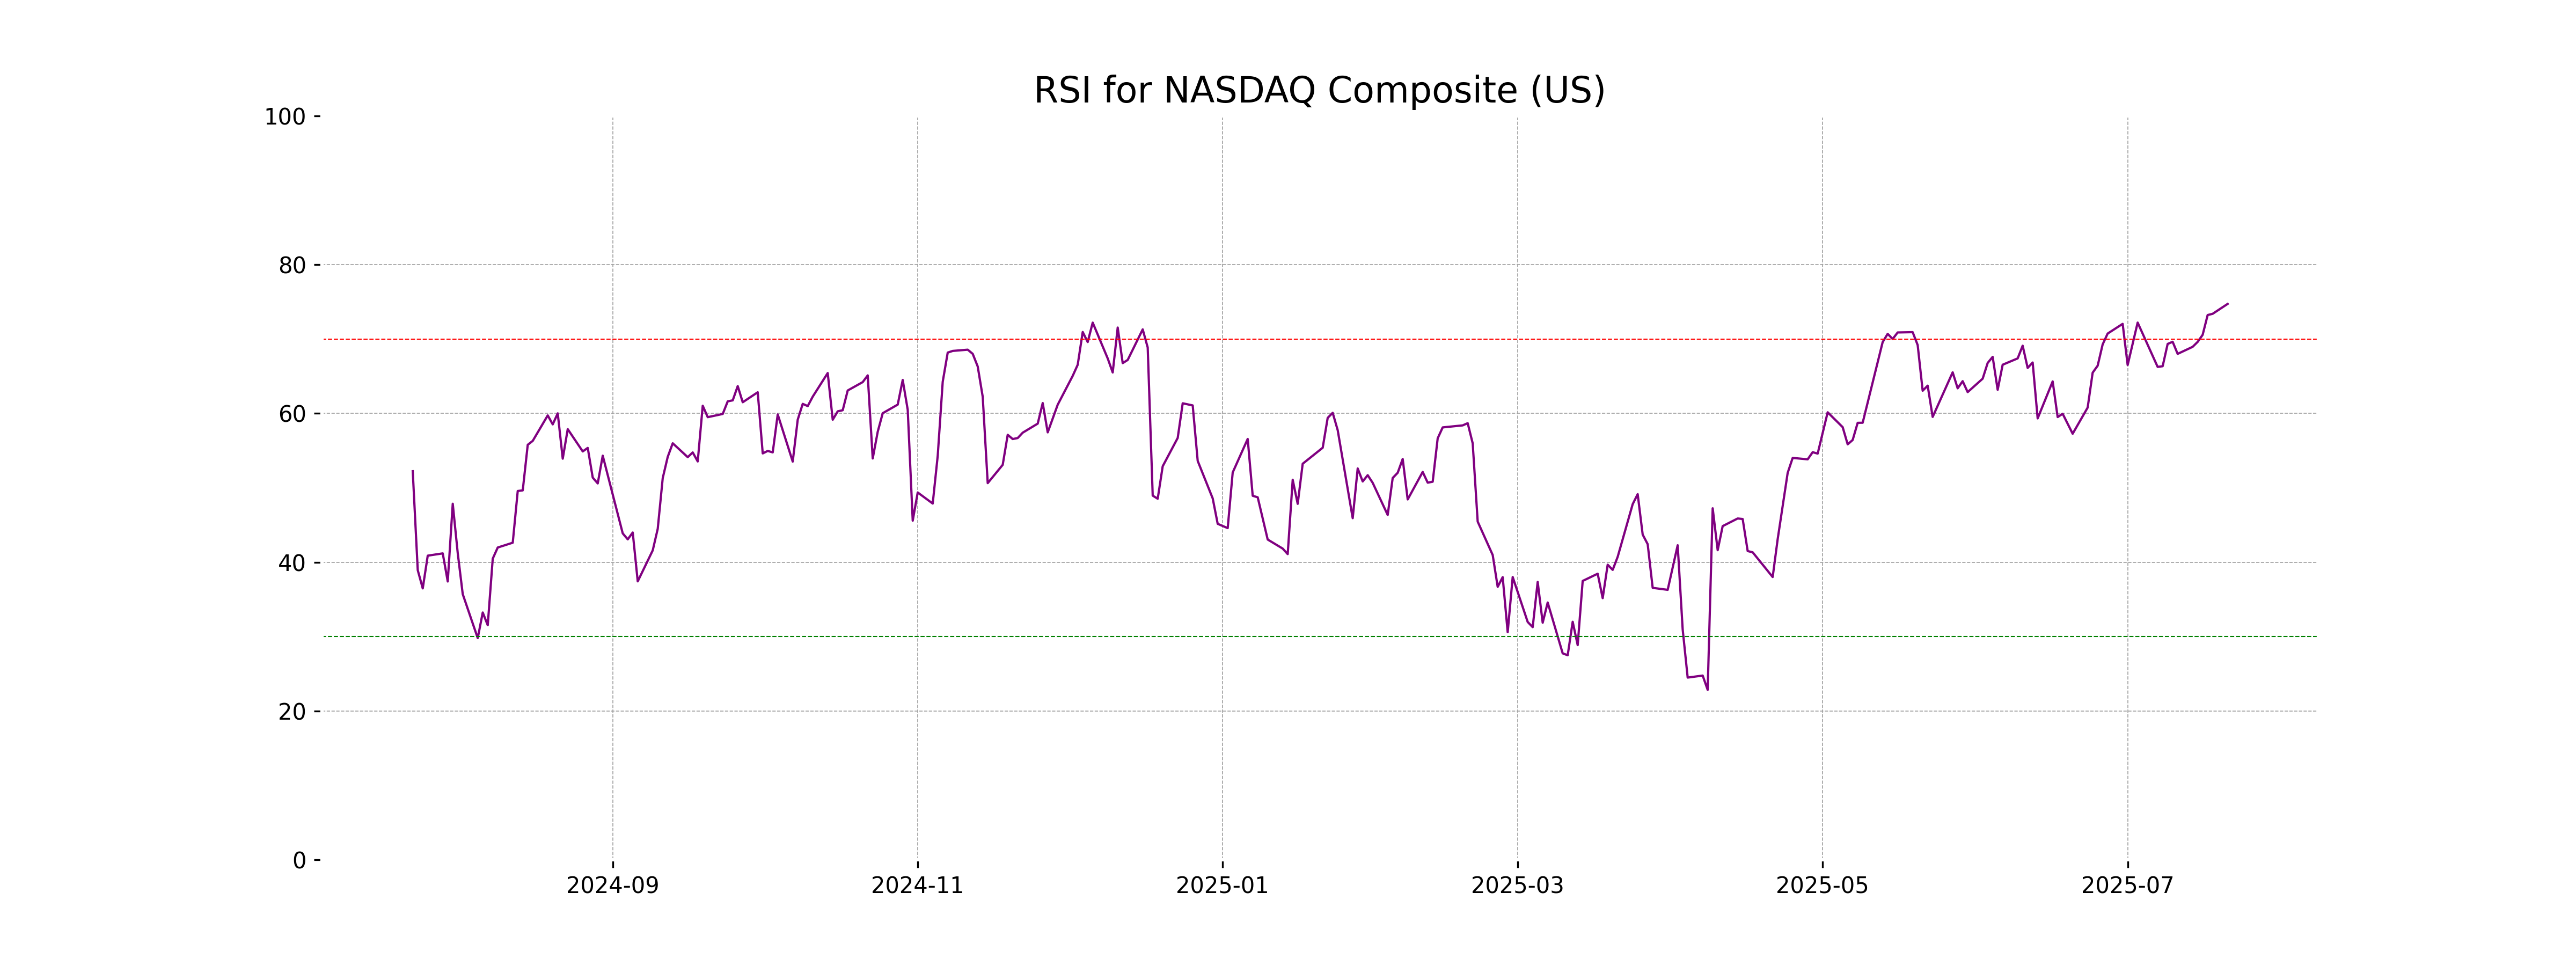
RSI Analysis
The RSI (Relative Strength Index) of the NASDAQ Composite is at 74.73, indicating that the index is in or approaching overbought territory. This suggests that the index might be due for a correction or consolidation, as values above 70 typically suggest overbought conditions.
Analysis for Nikkei 225 (Japan) - July 22, 2025
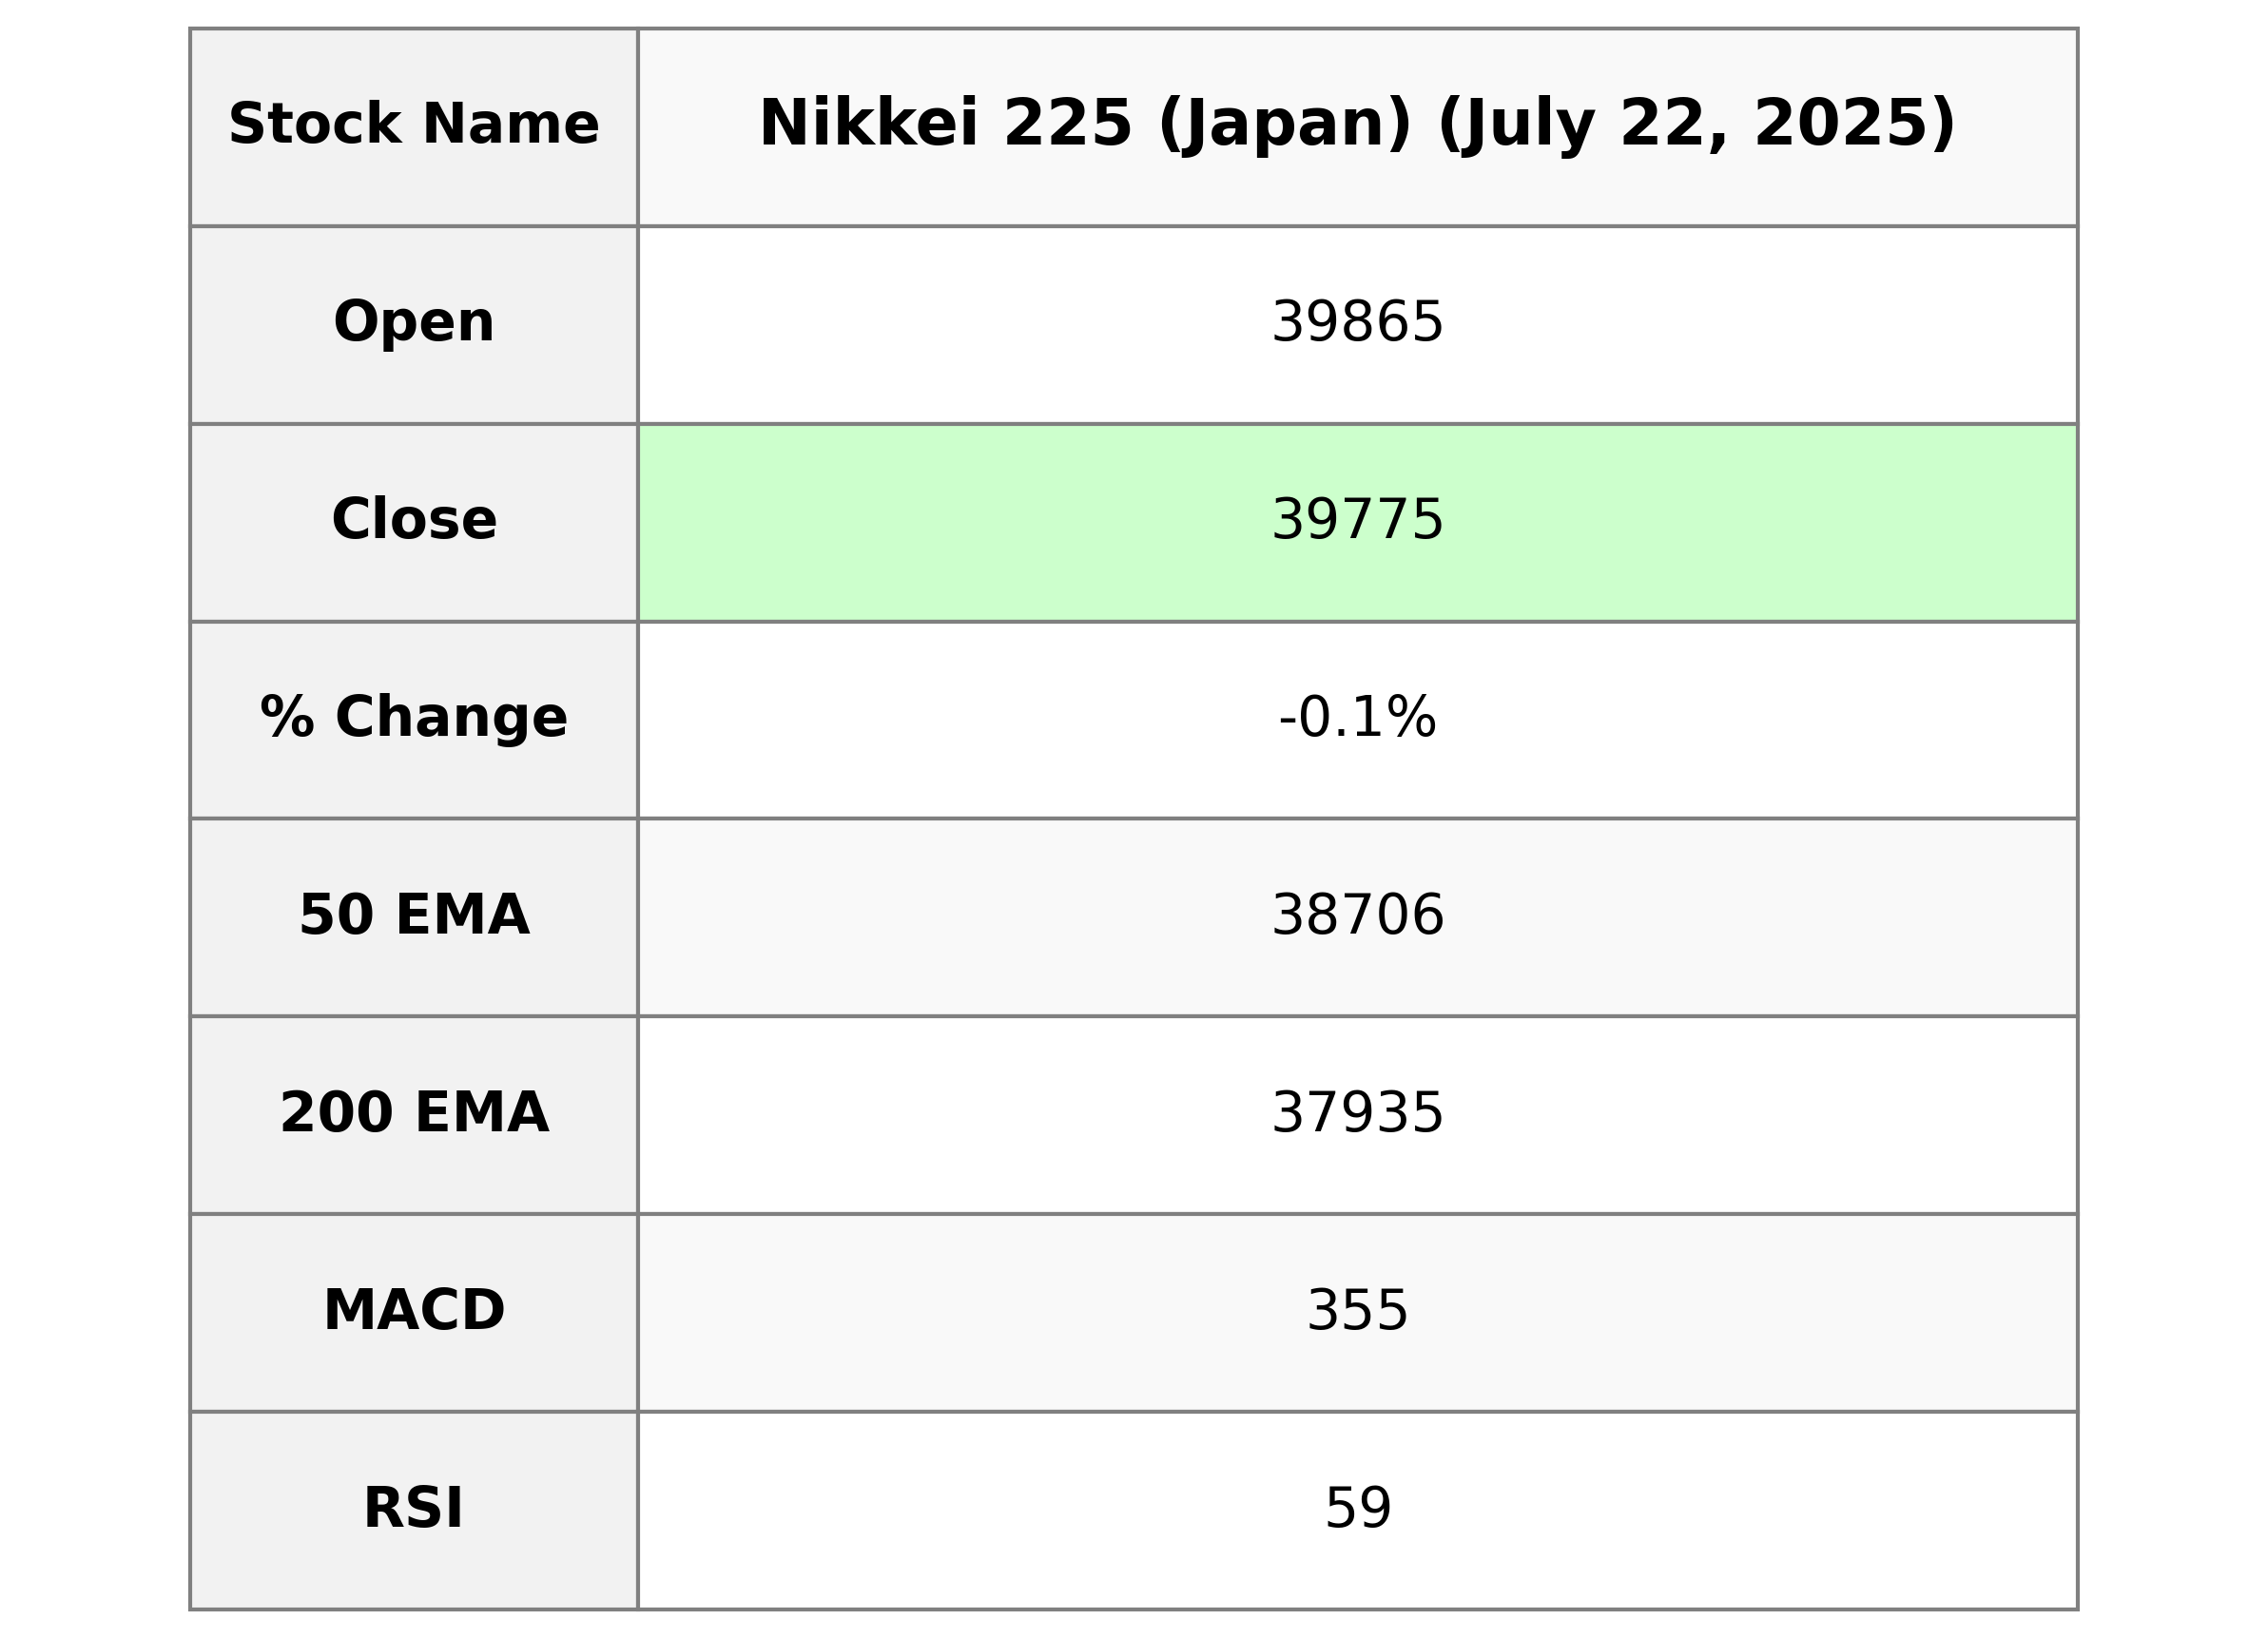
The Nikkei 225 (Japan) opened at 39,864.63 and closed at 39,774.92, marking a slight decline of 0.11% with a points change of -44.19. The RSI is at a moderate level of 59.41, indicating neither overbought nor oversold conditions, while the MACD is below its signal line, suggesting a potential bearish trend.
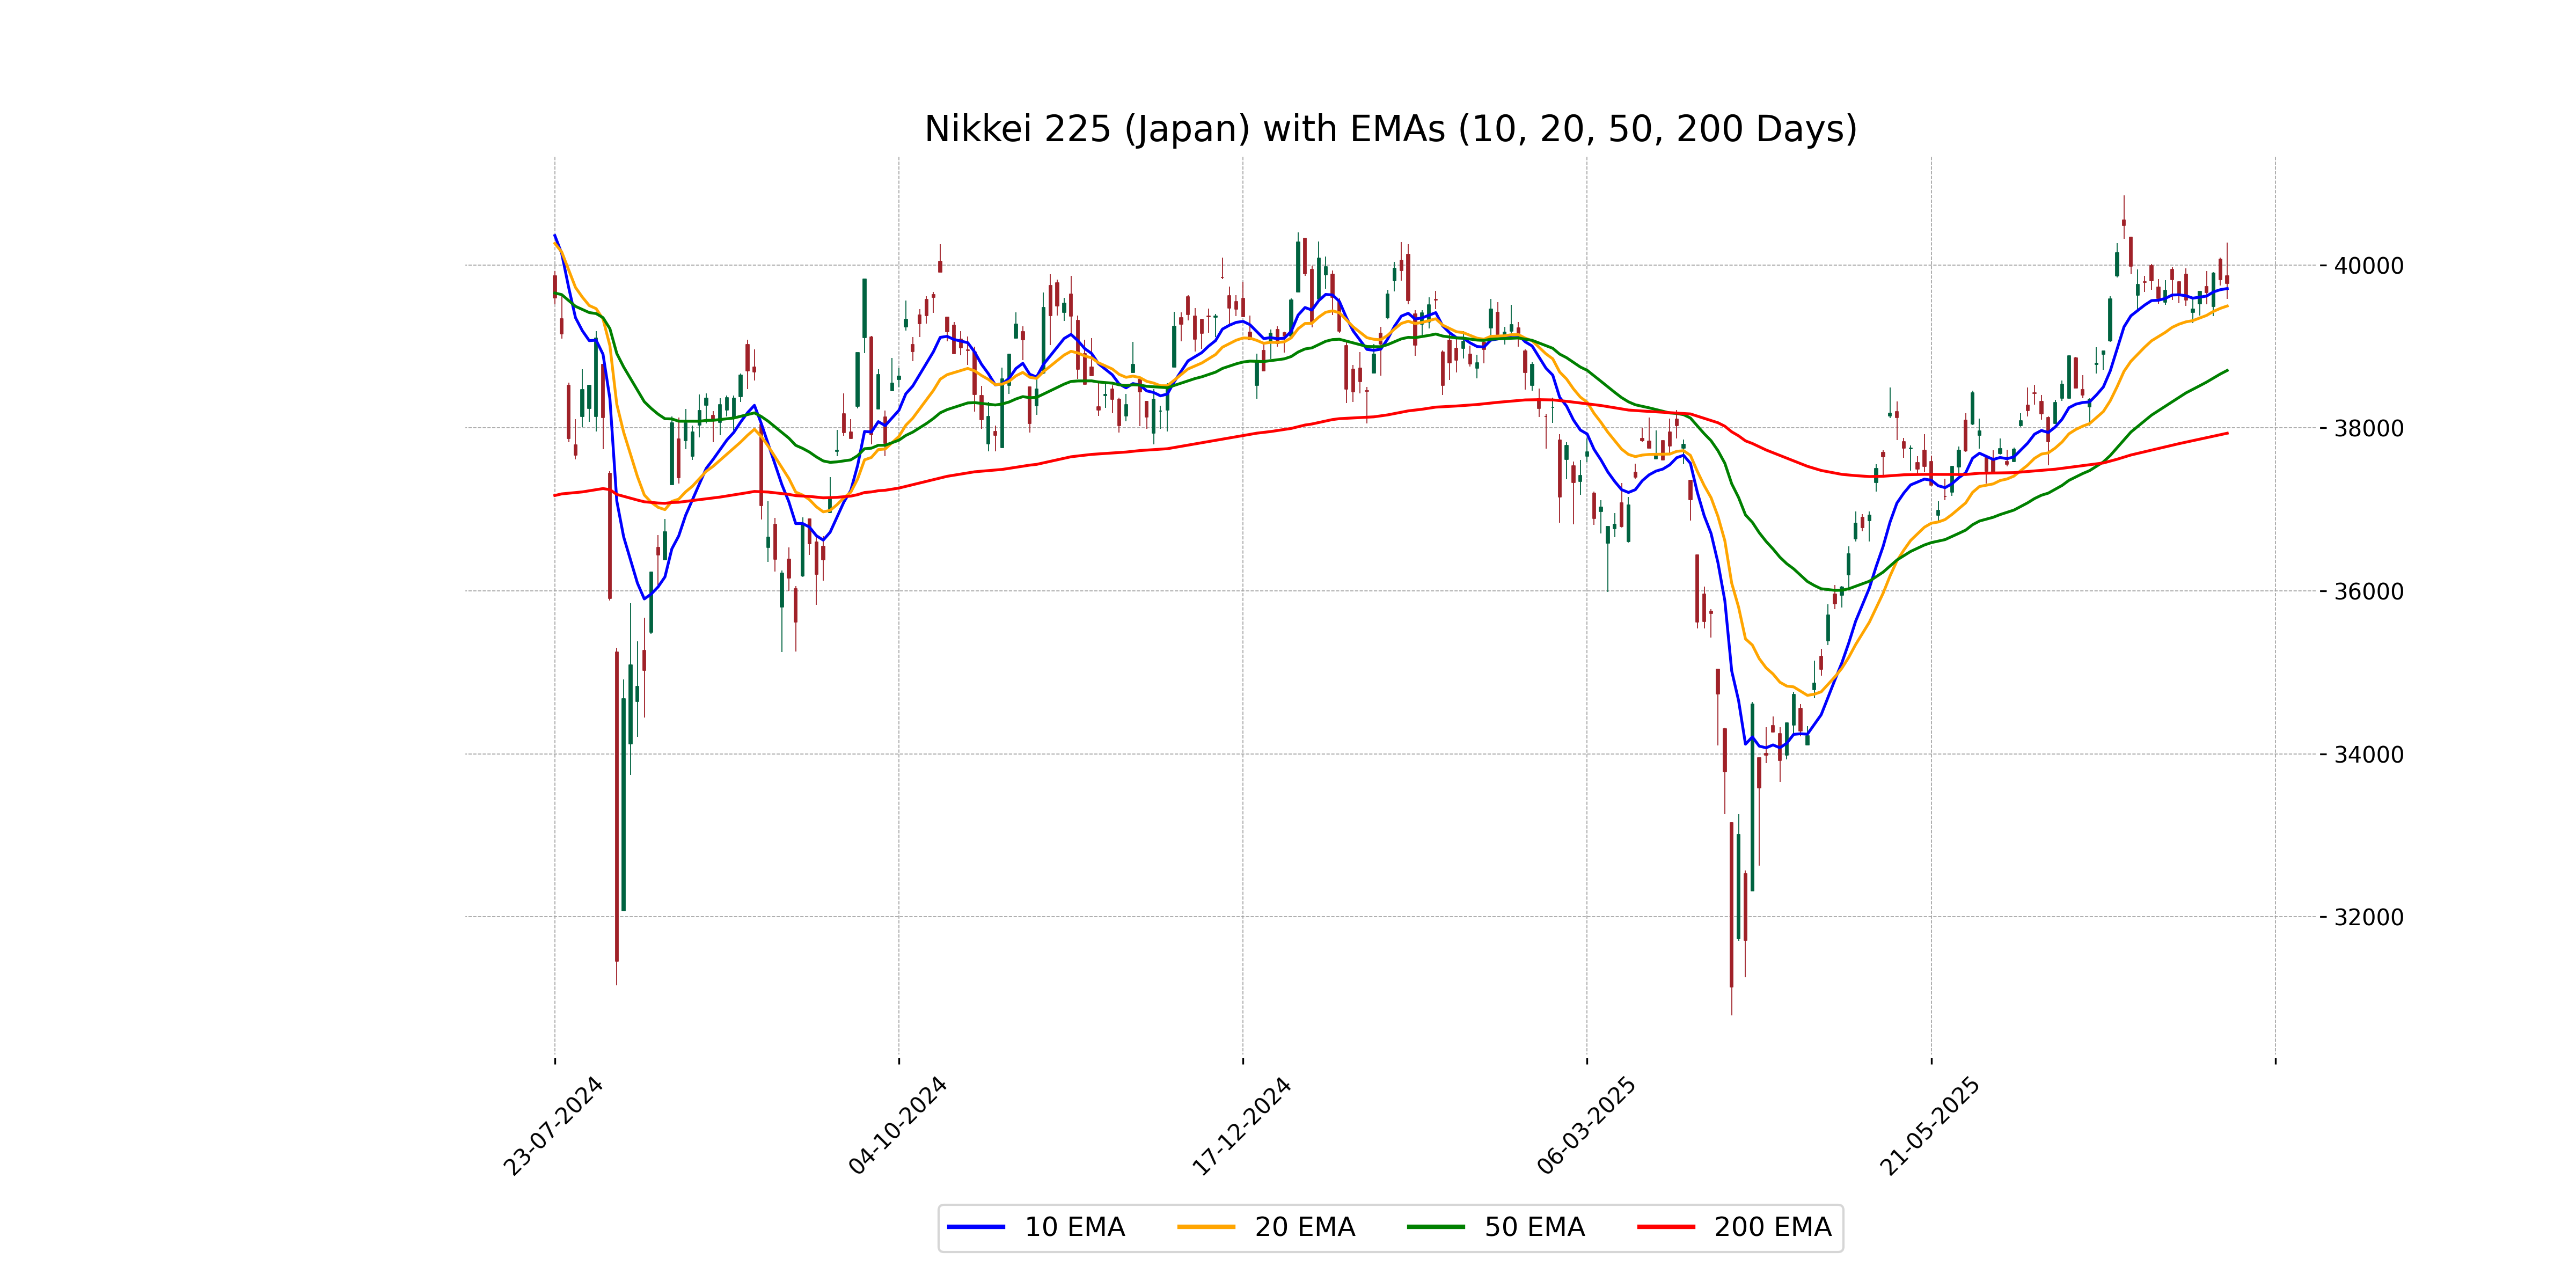
Relationship with Key Moving Averages
The Nikkei 225 closed at 39774.92, which is above its 50-day EMA of 38706.10, indicating a short-term bullish trend. However, it remains below its 10-day EMA of 39711.17, suggesting potential consolidation or slight downward movement in the immediate term. The index is also above its 200-day EMA of 37935.48, confirming an overall long-term upward trend.
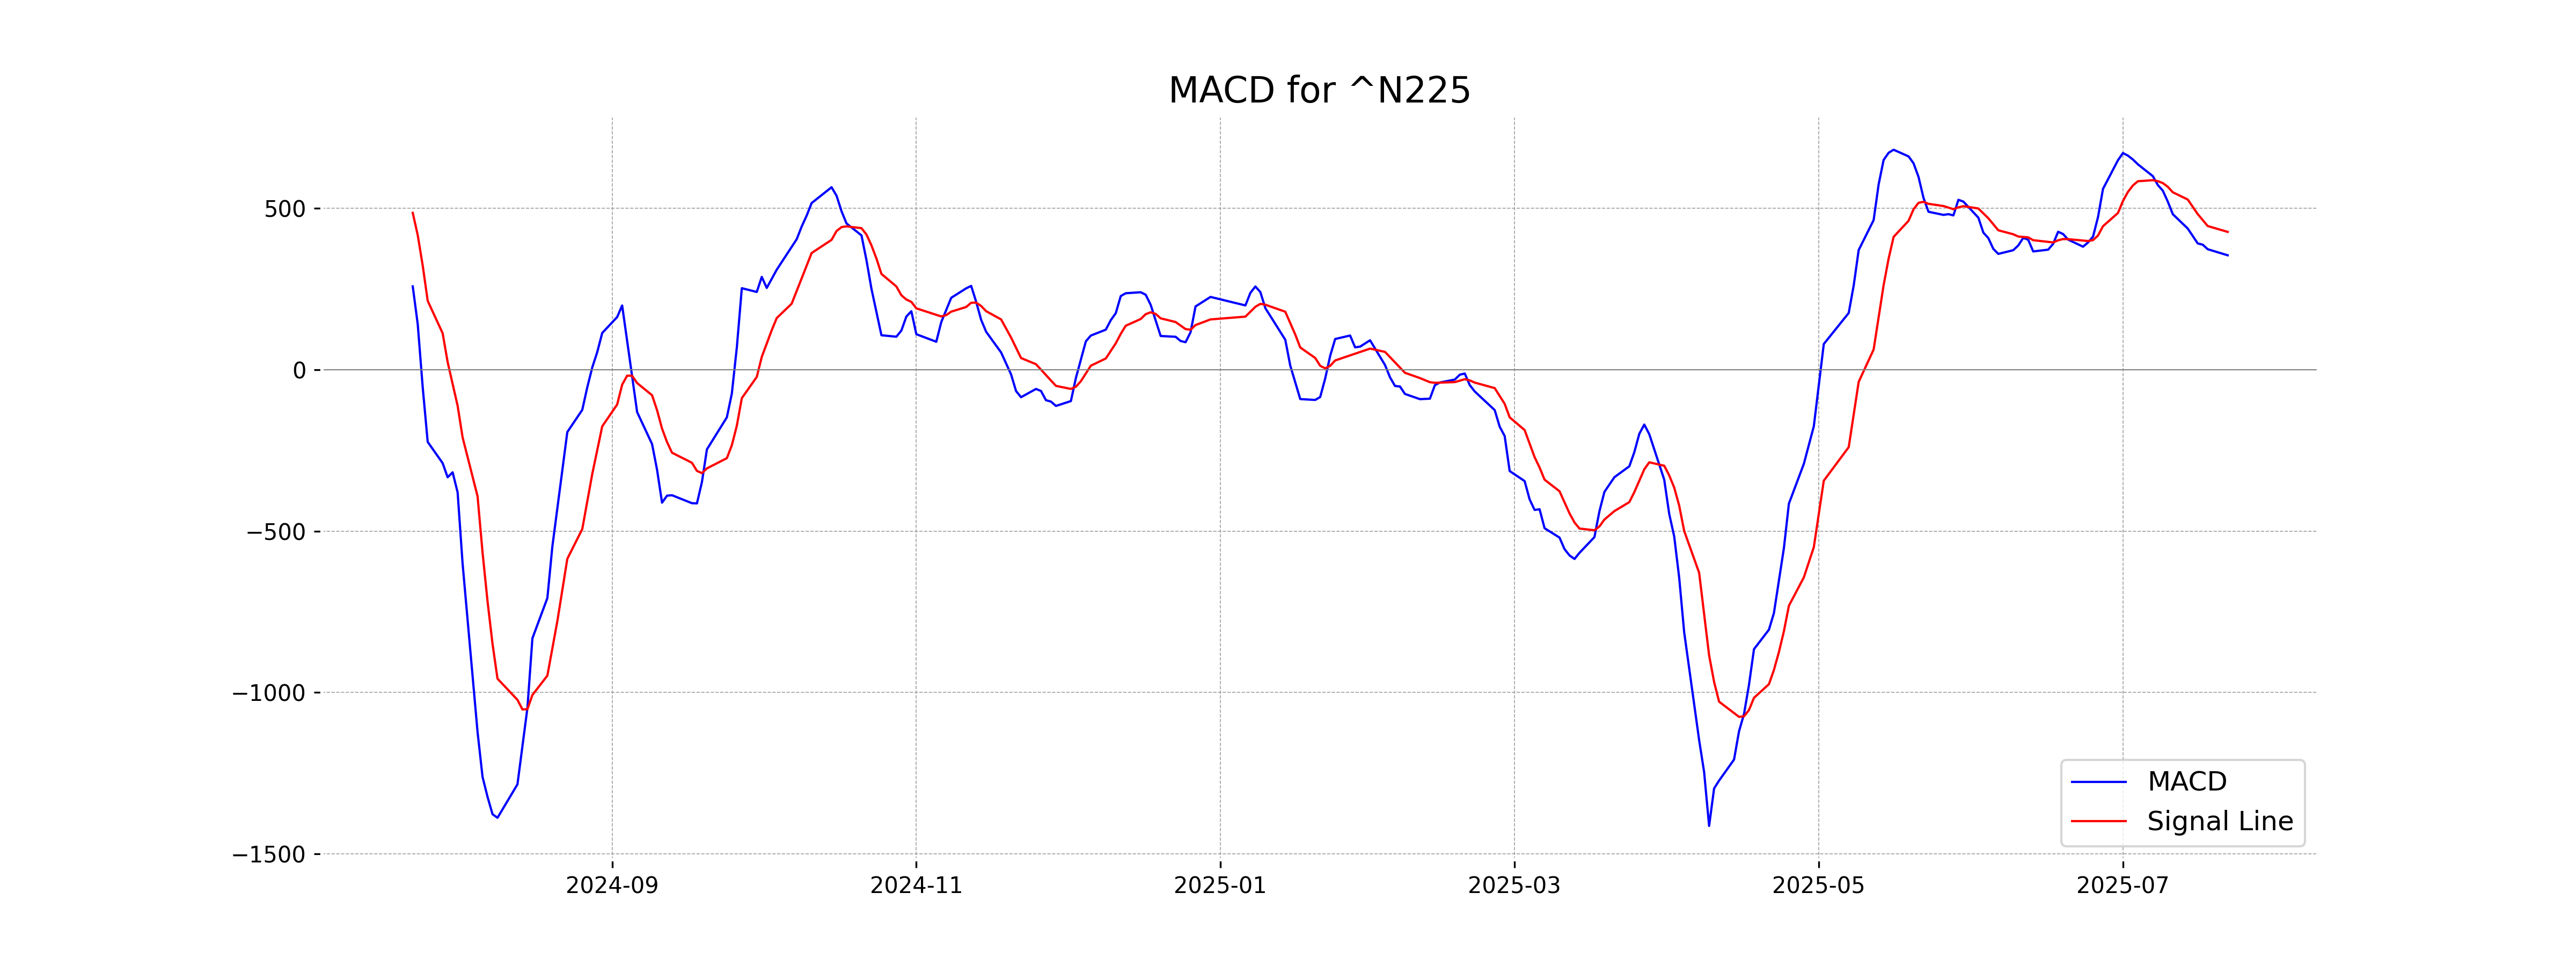
Moving Averages Trend (MACD)
The Nikkei 225 index shows a MACD value of 354.83, which is below the MACD Signal of 427.33, indicating a potential bearish sentiment as the MACD line is below its signal line. This may suggest the possibility of a short-term correction if the trend continues.
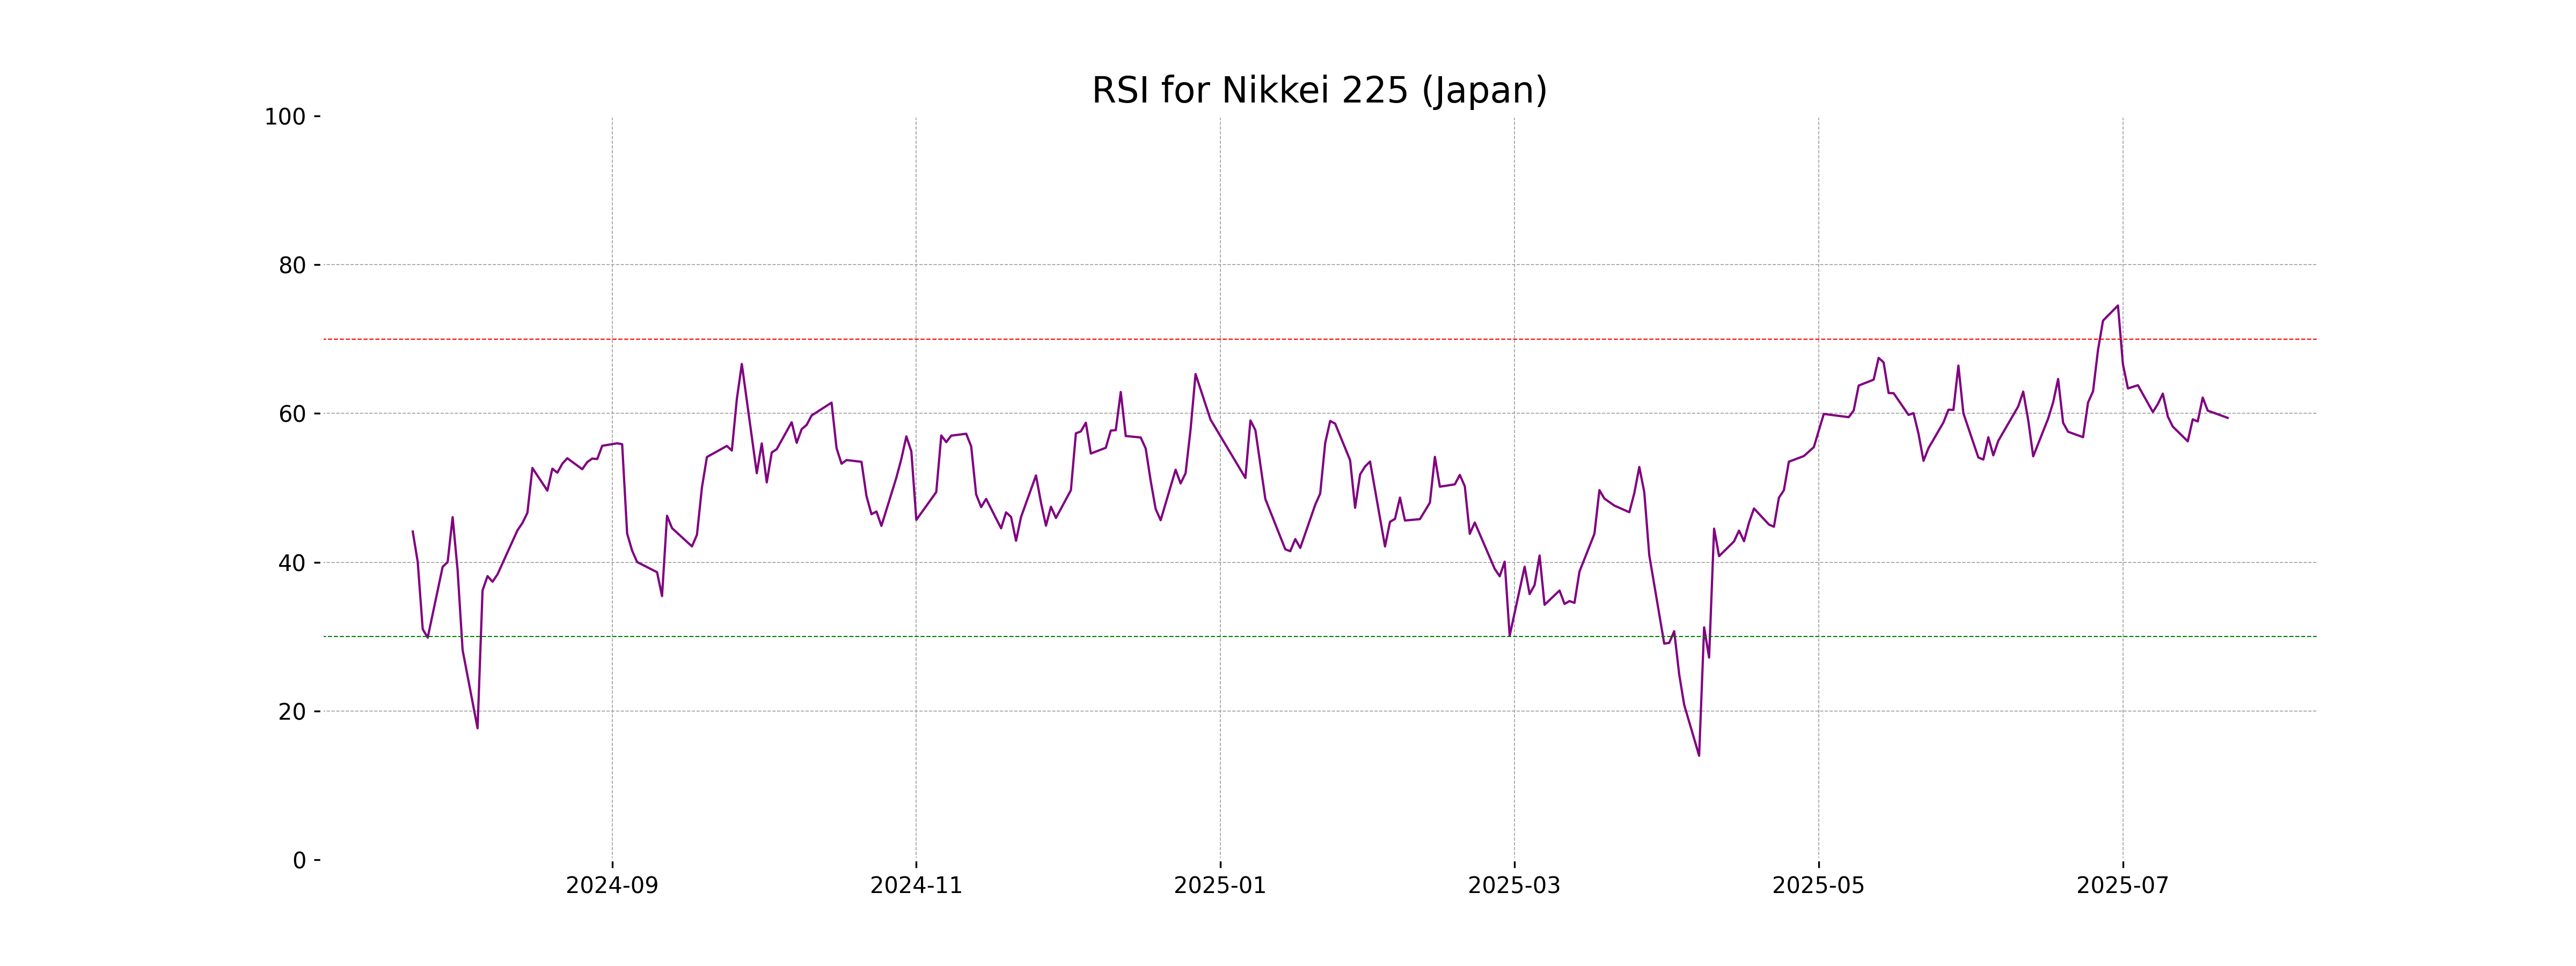
RSI Analysis
The RSI value for Nikkei 225 is 59.41, indicating a moderately strong position. Typically, an RSI between 50 and 70 suggests that the index is neither overbought nor oversold and is showing a stable trend.
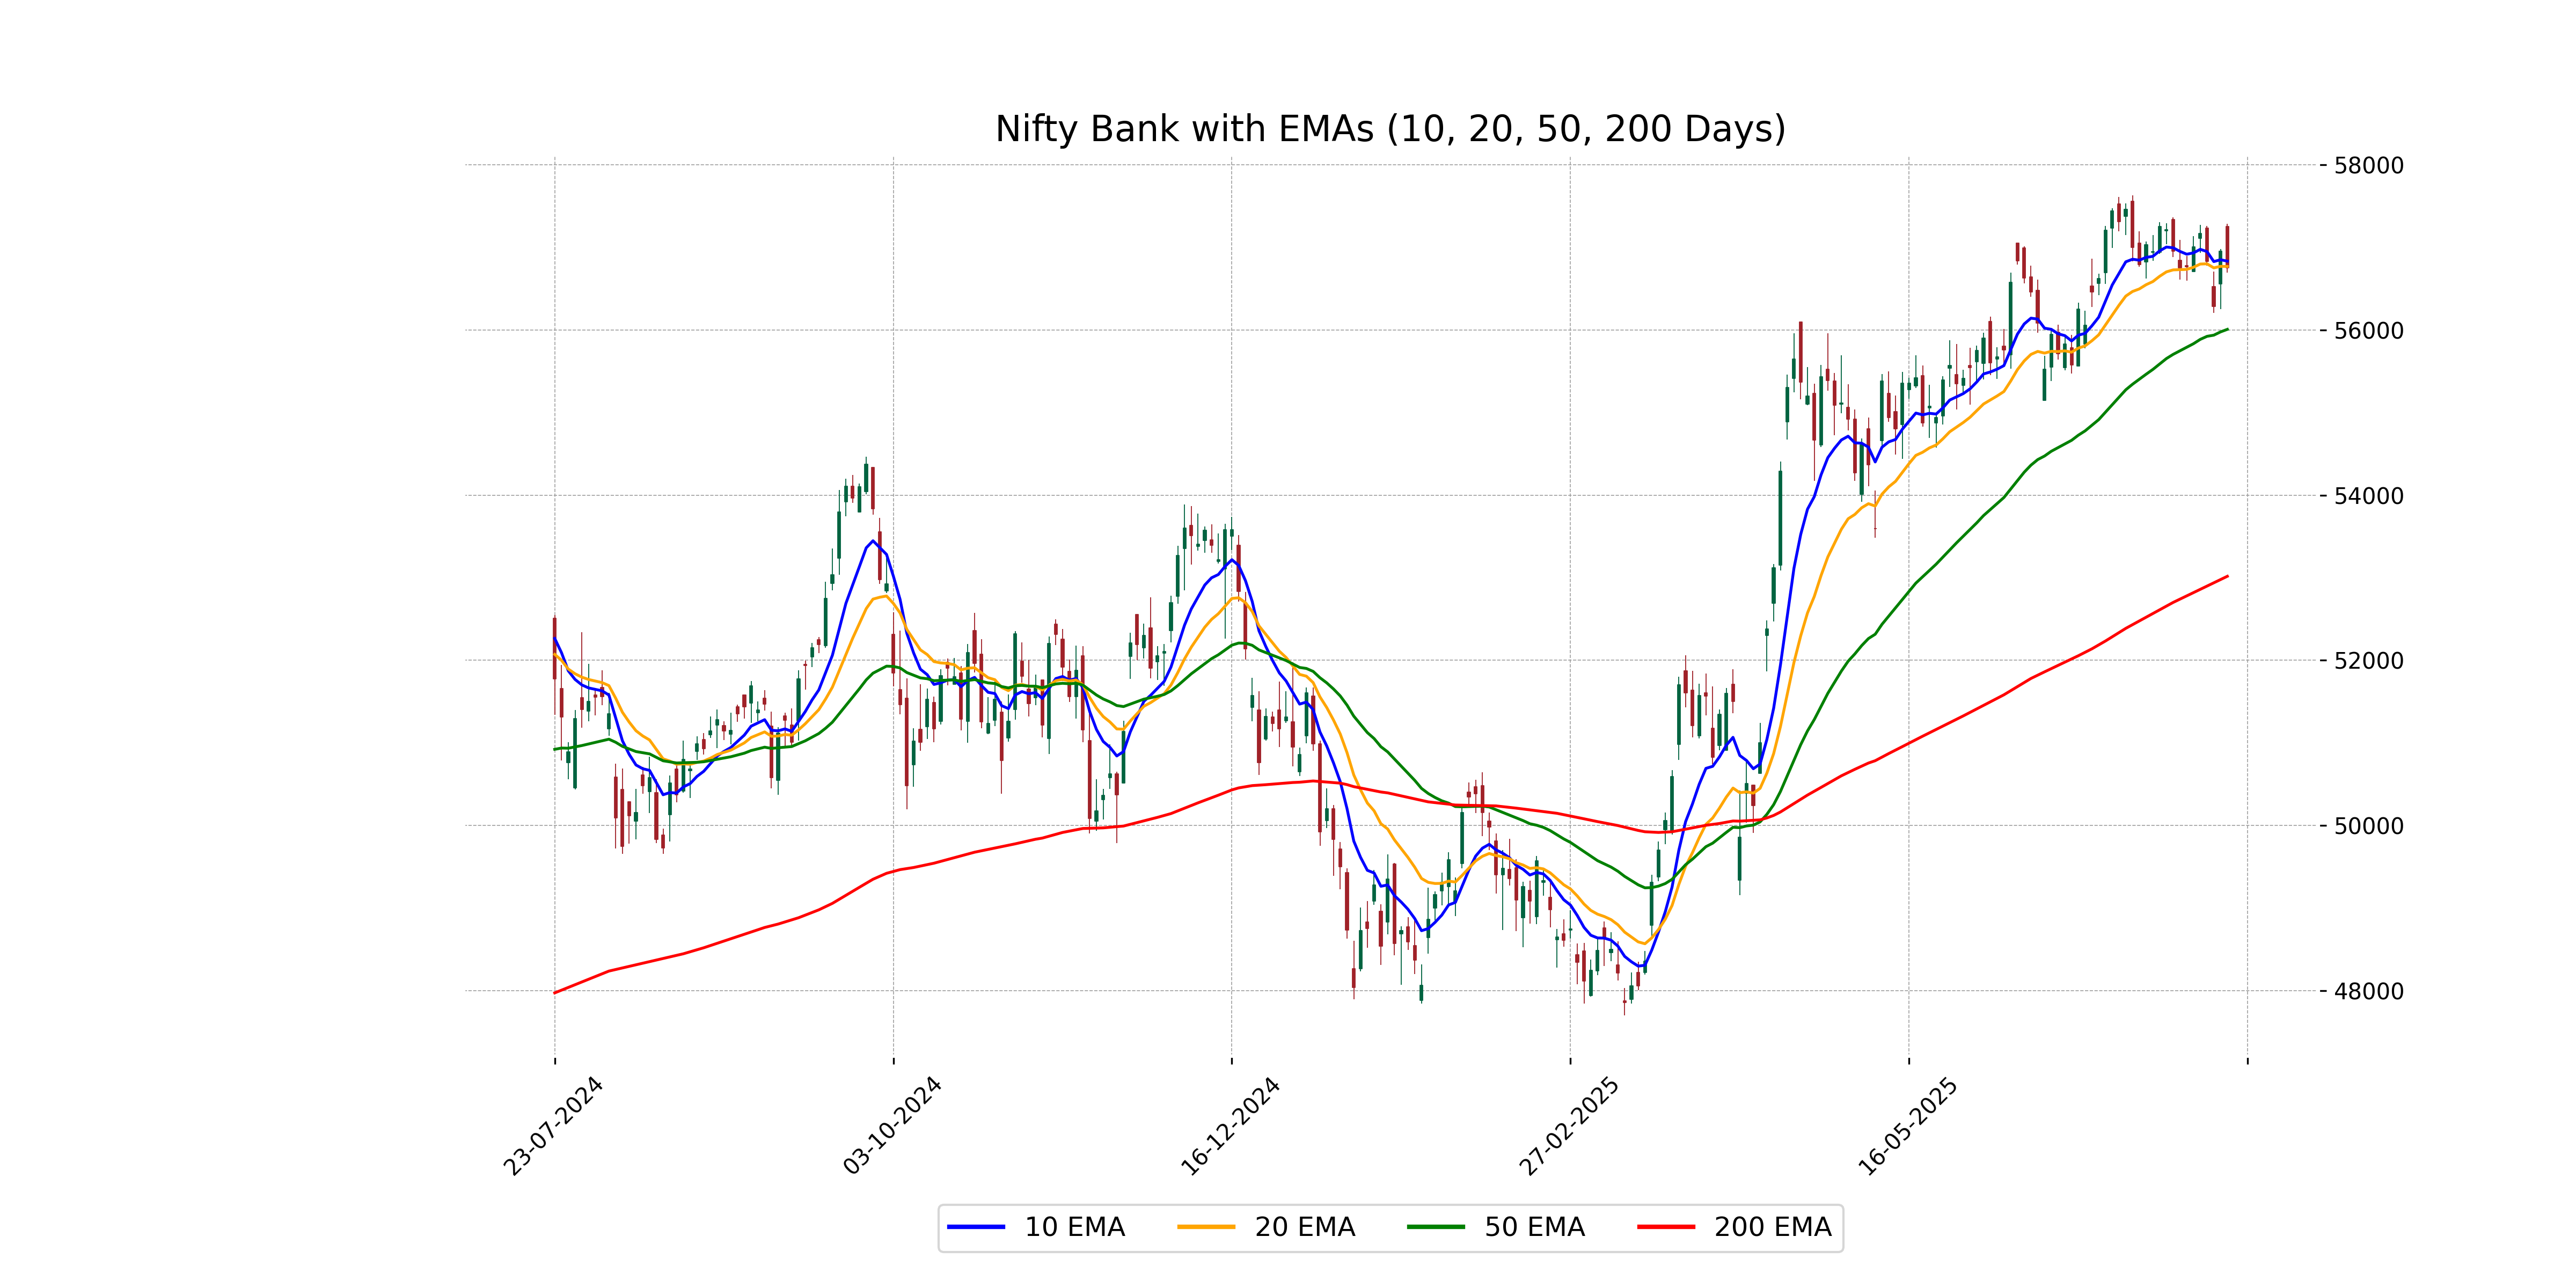
Analysis for Nifty Bank - July 22, 2025
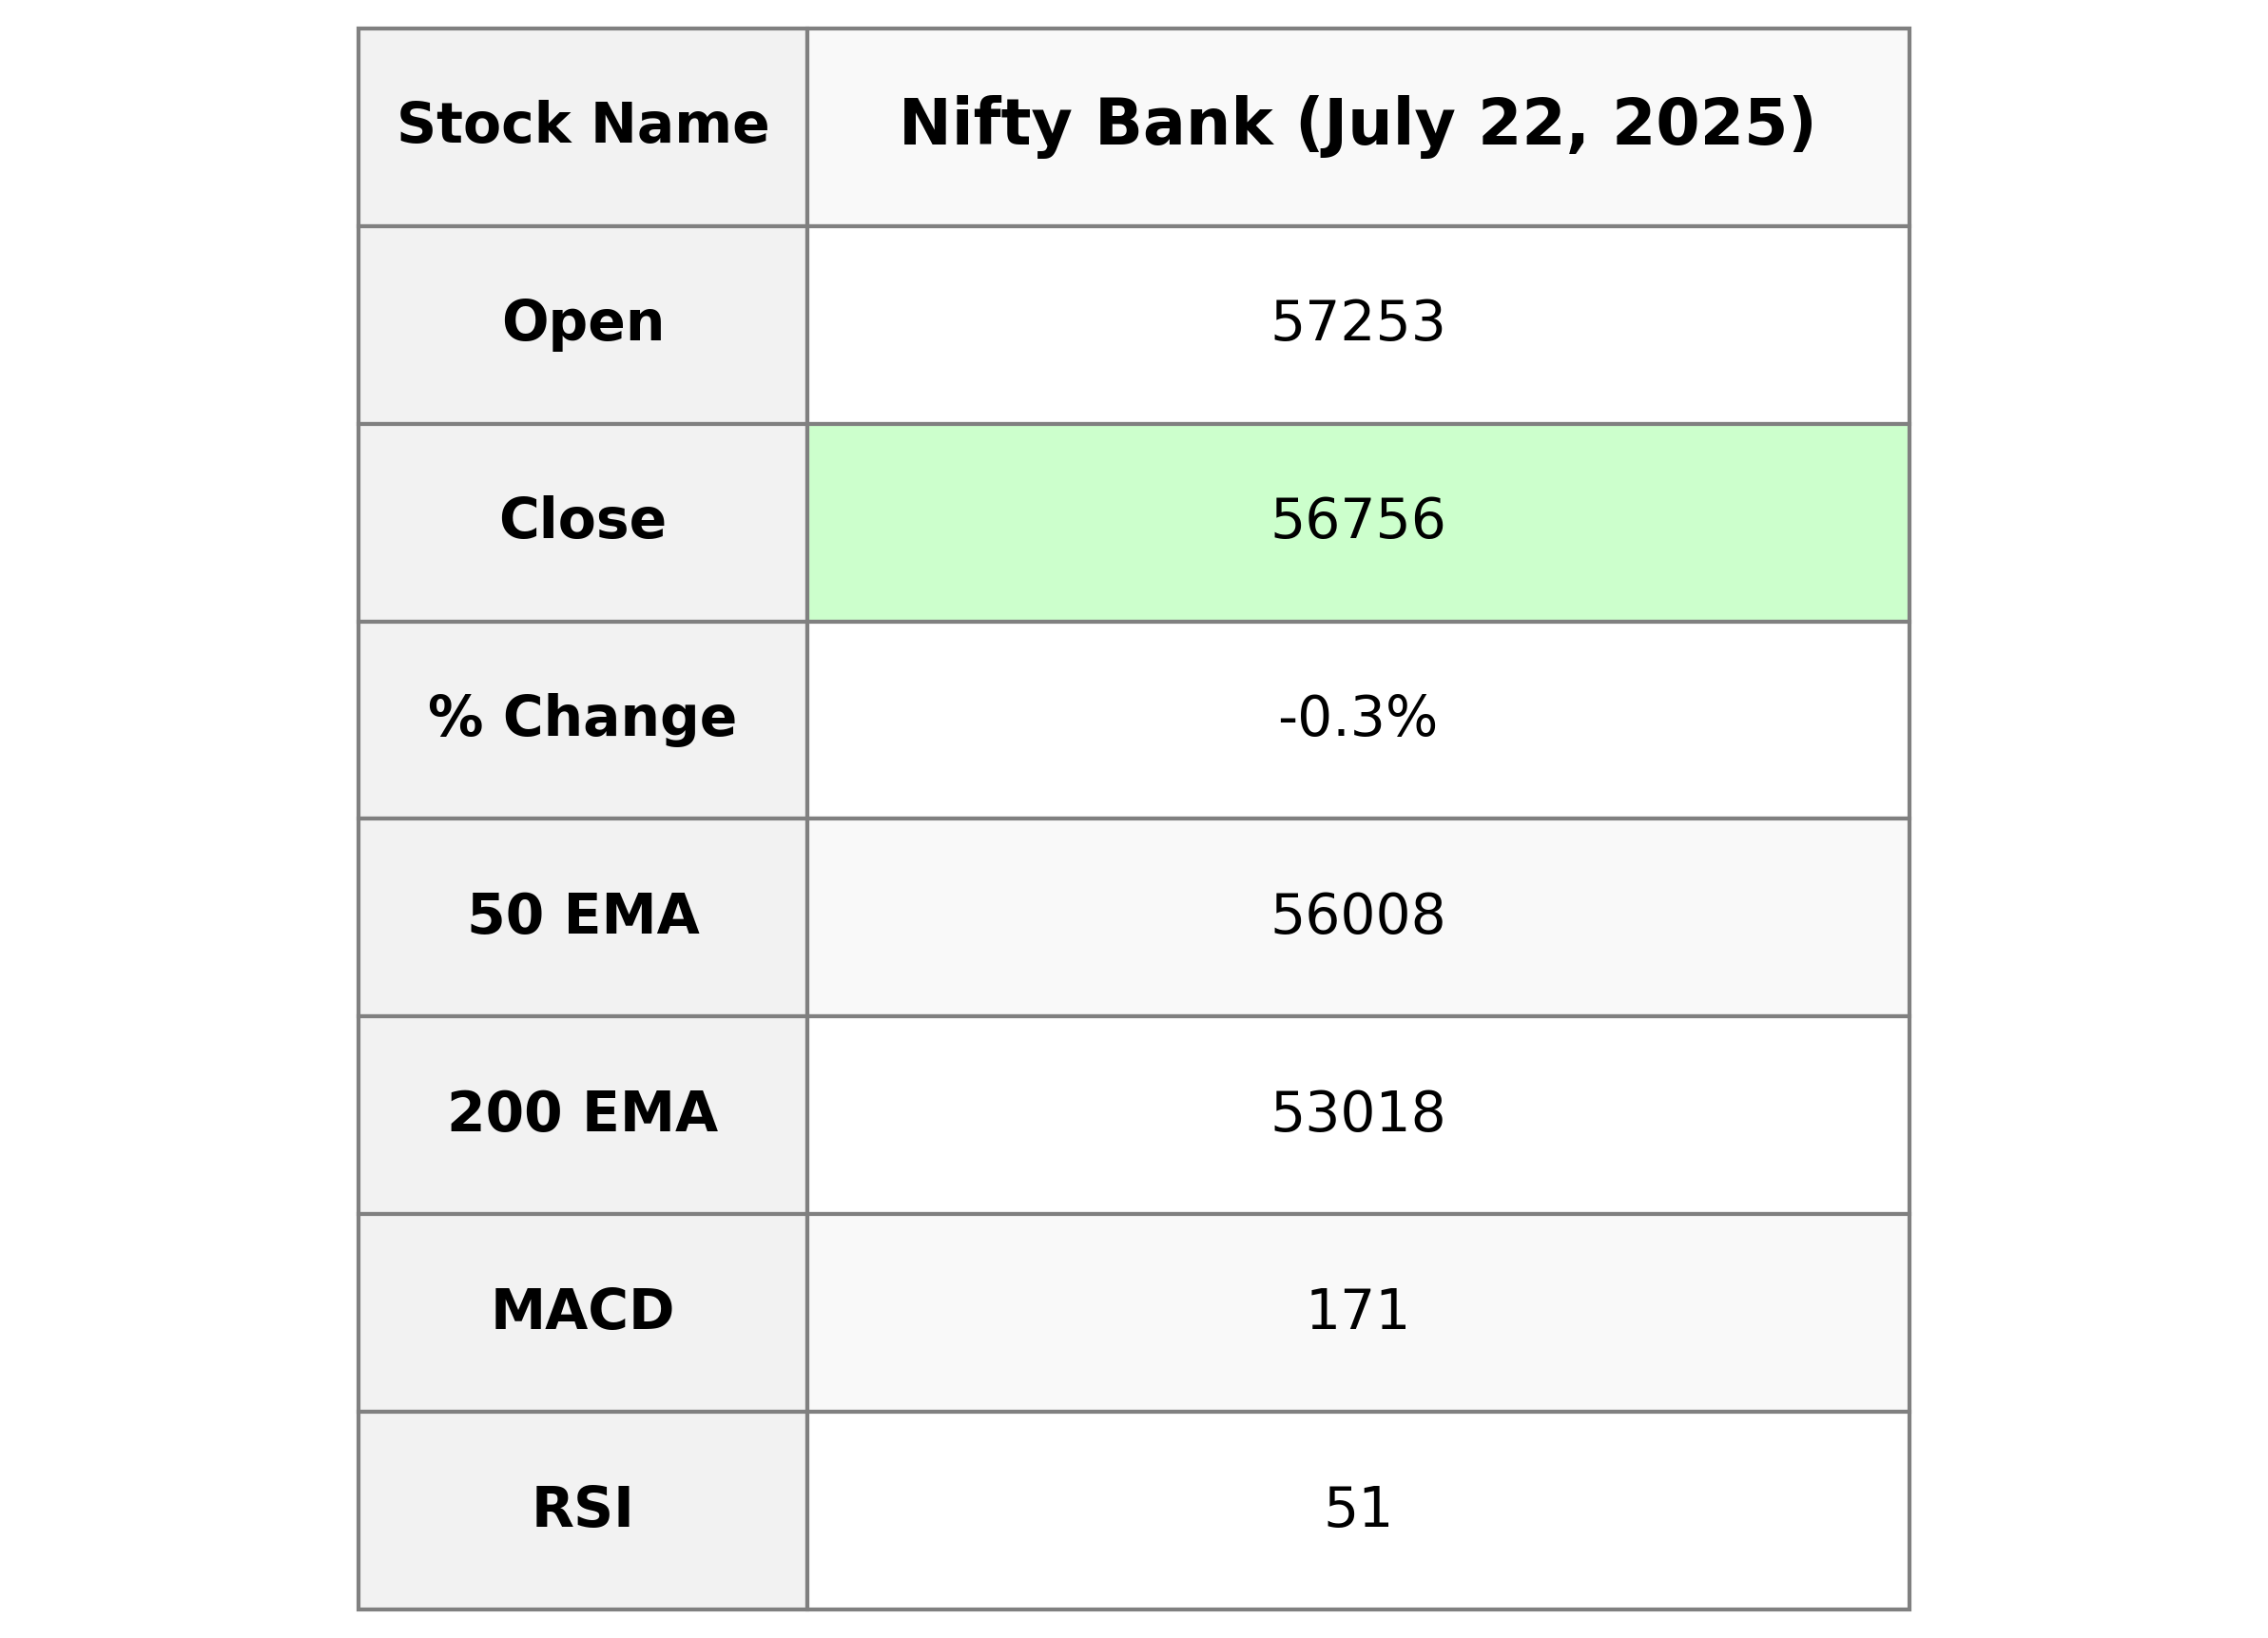
The Nifty Bank index opened at 57253.35 and experienced a decline, closing at 56756.0, representing a decrease of 0.35% from the previous close of 56952.75. Despite this downturn, the index remains above its 50-day EMA of 56007.95, indicating a relatively stable trend within the short-term period. Its RSI is 51.48, suggesting a neutral market sentiment with neither overbought nor oversold conditions.
Relationship with Key Moving Averages
Nifty Bank closed at 56756.0, slightly below its 10 EMA of 56833.92 yet above its 50 EMA of 56007.95, suggesting mild short-term weakness but overall strength over a longer period. It's also significantly above its 200 EMA of 53017.83, indicating a strong longer-term uptrend.
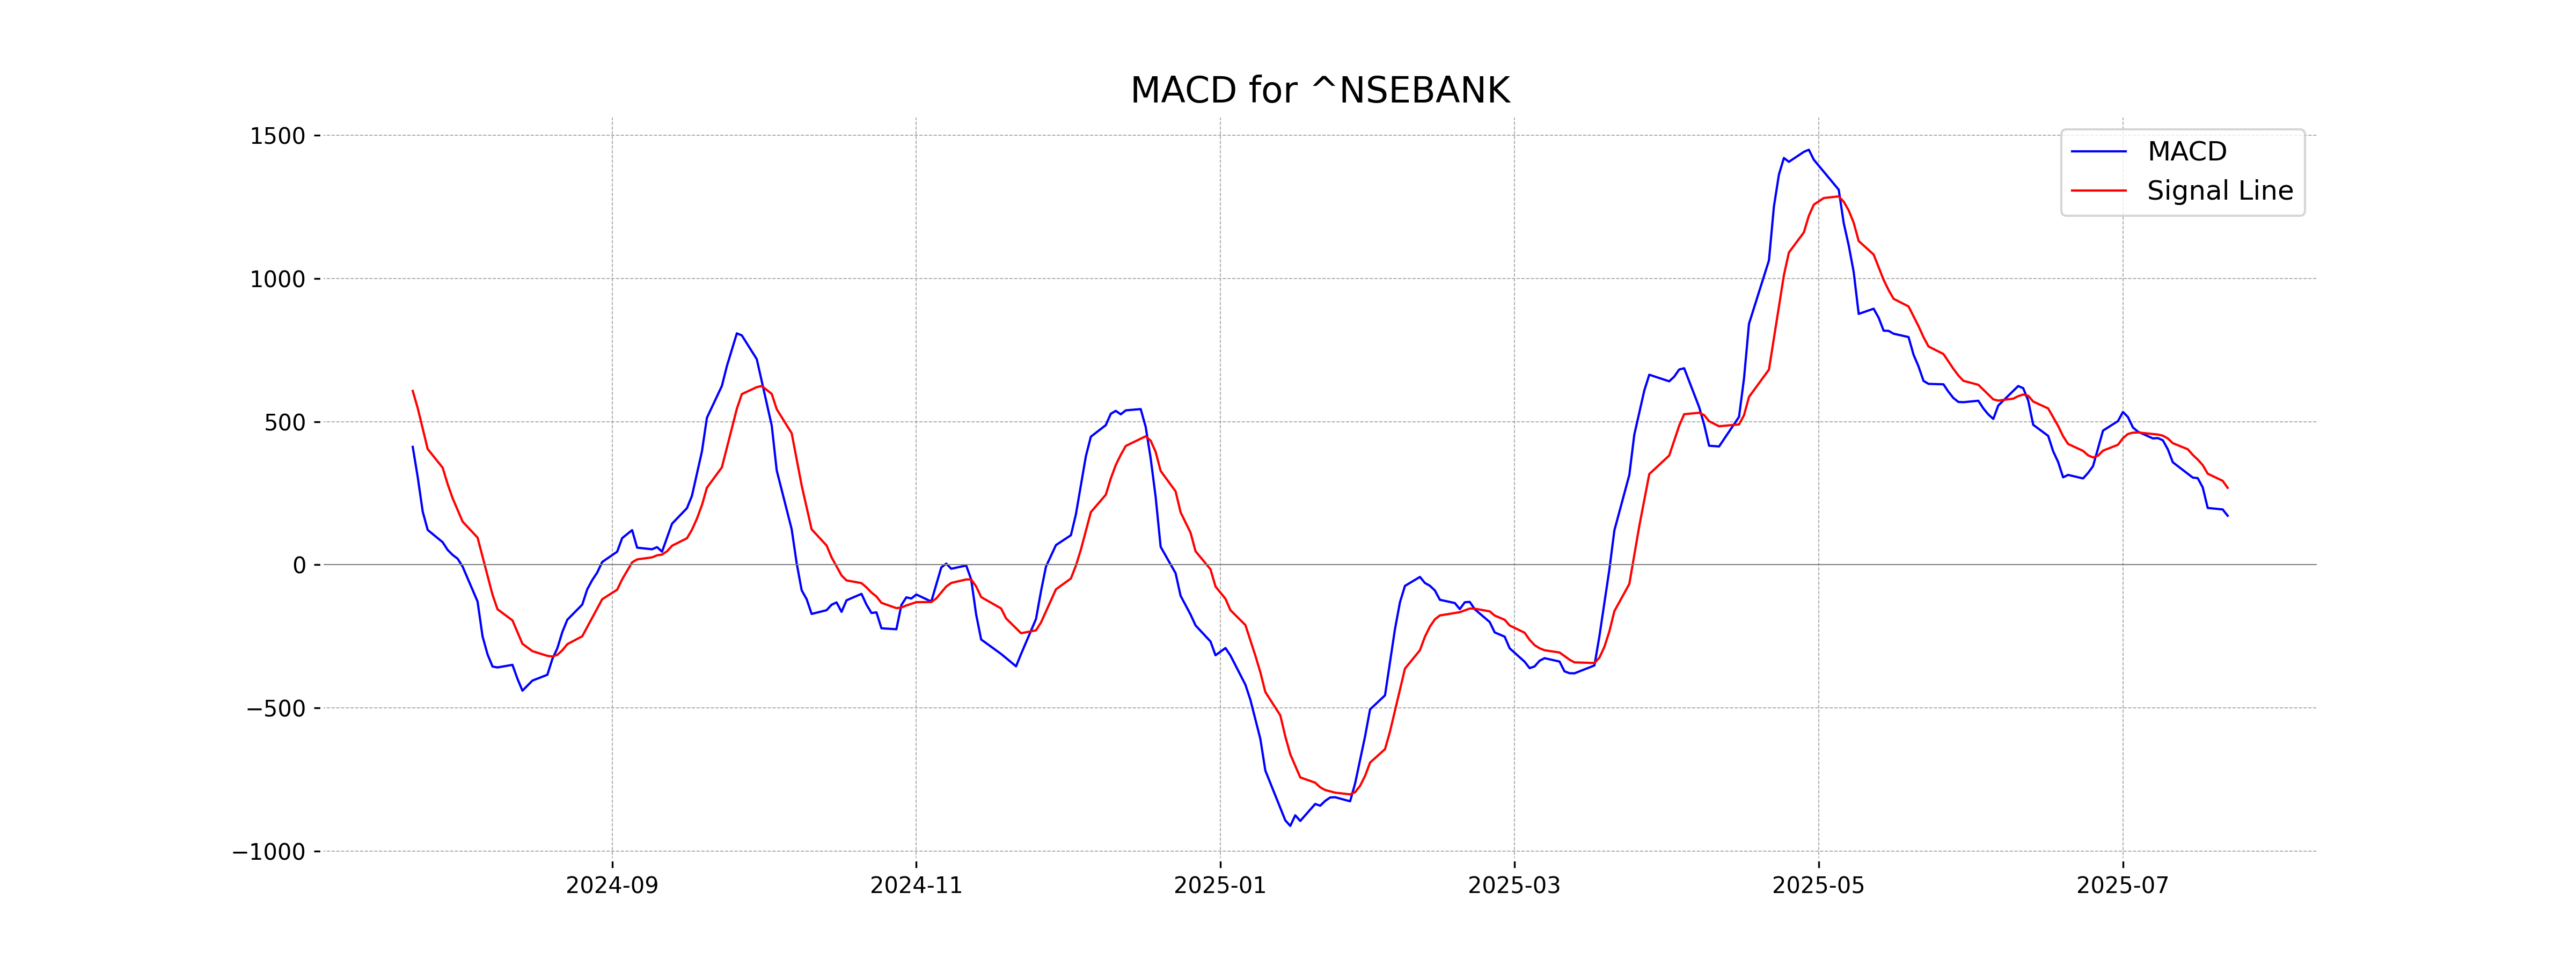
Moving Averages Trend (MACD)
MACD Analysis for Nifty Bank: The MACD value of 171.44 is below the MACD Signal of 268.86, indicating a potential bearish signal. This suggests a possible slowdown in upward momentum or a shift towards negative momentum.
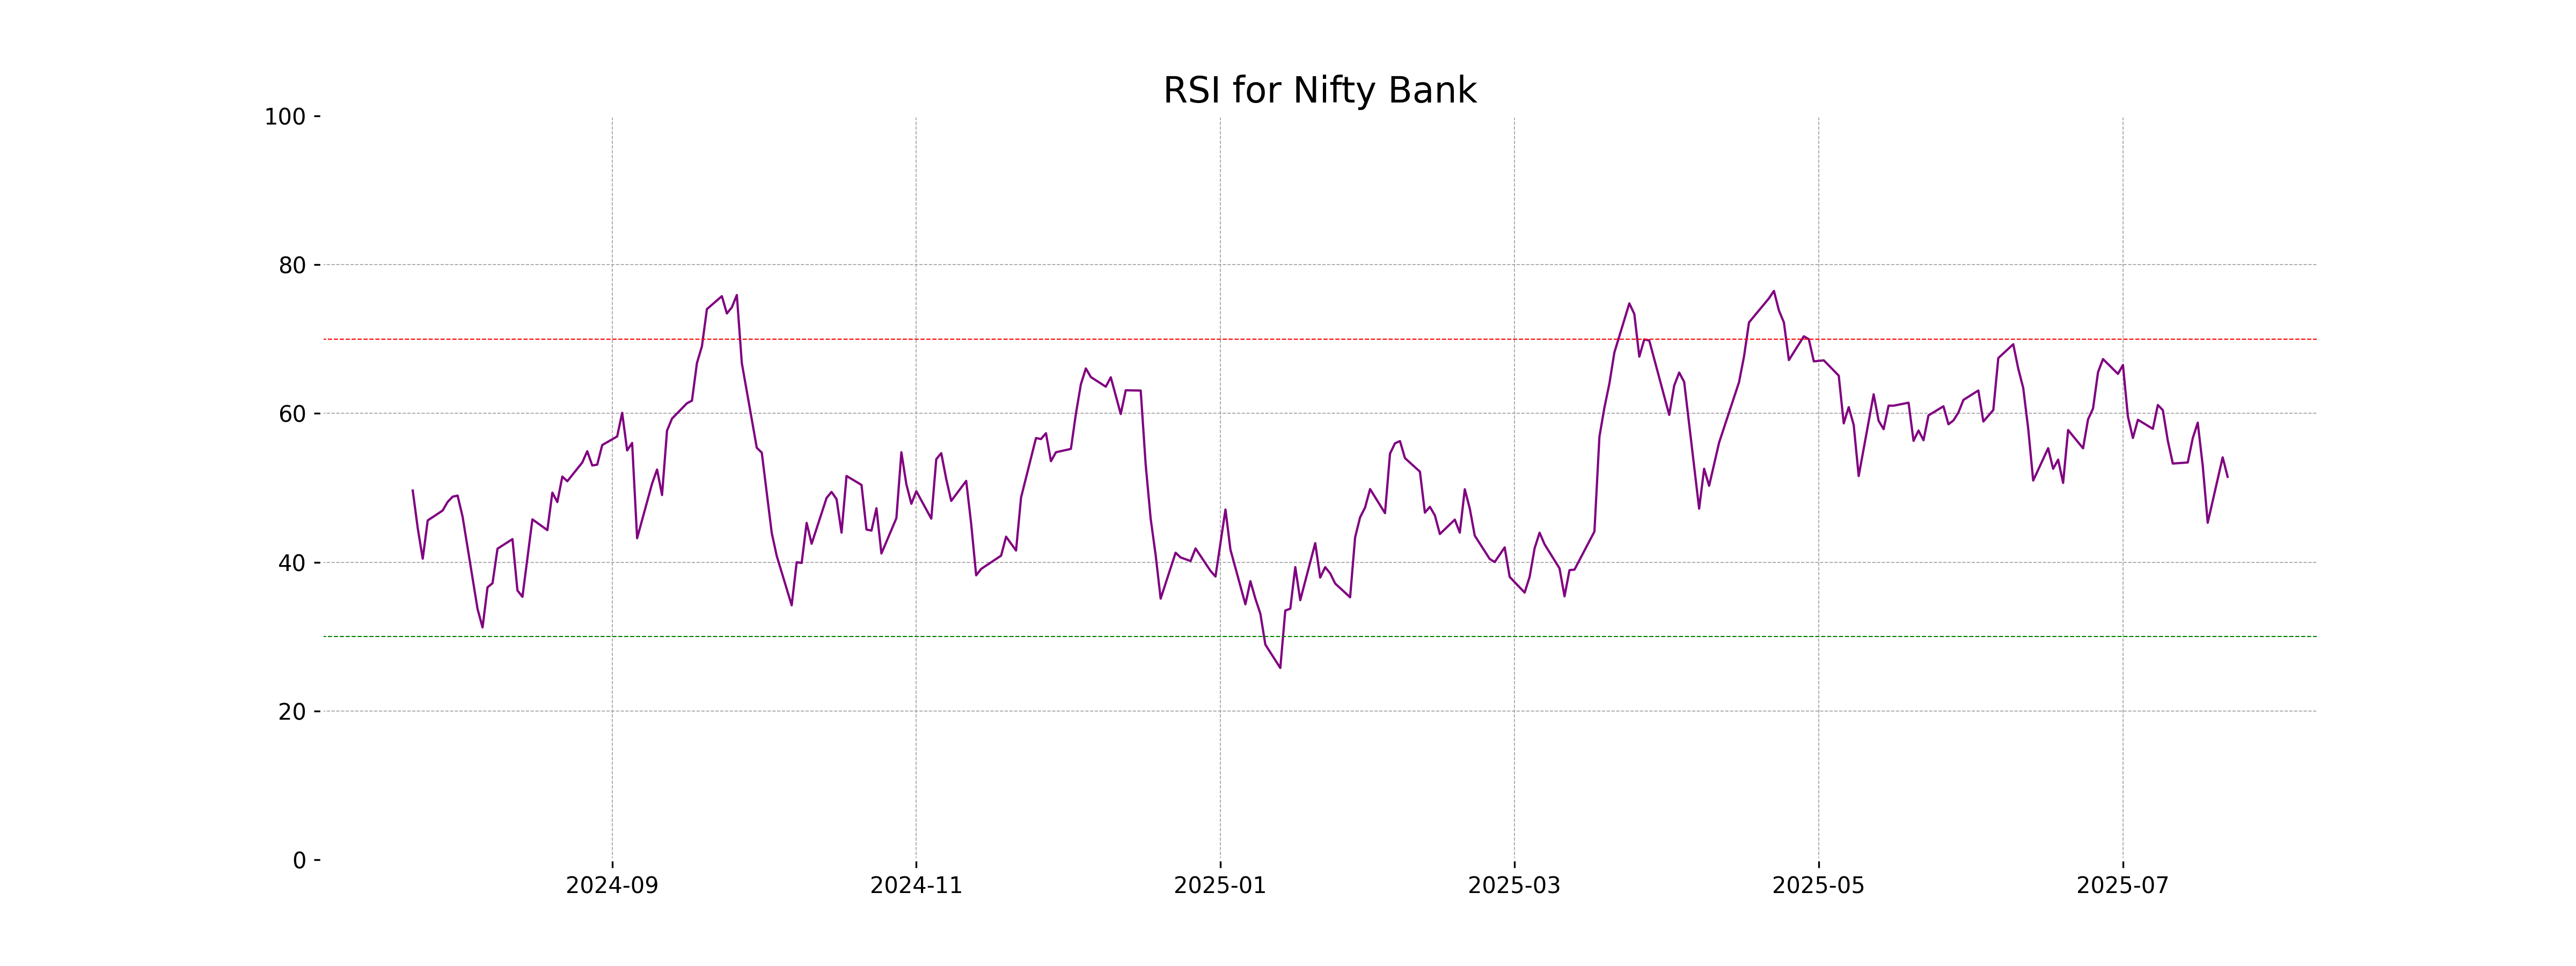
RSI Analysis
Certainly! The RSI for Nifty Bank is 51.48, indicating a neutral momentum. With an RSI between 30 and 70, the stock is neither overbought nor oversold. Monitoring RSI trends is essential for capturing potential shifts in market sentiment.
Analysis for Nifty 50 - July 22, 2025

Nifty 50 opened at 25,166.65 and closed at 25,060.90, registering a slight decrease of 0.12%, equivalent to a 29.80 point drop from its previous close. The Relative Strength Index (RSI) value stands at 46.65, suggesting a neutral market, while the Moving Average Convergence Divergence (MACD) is significantly below its signal line, indicating bearish momentum.
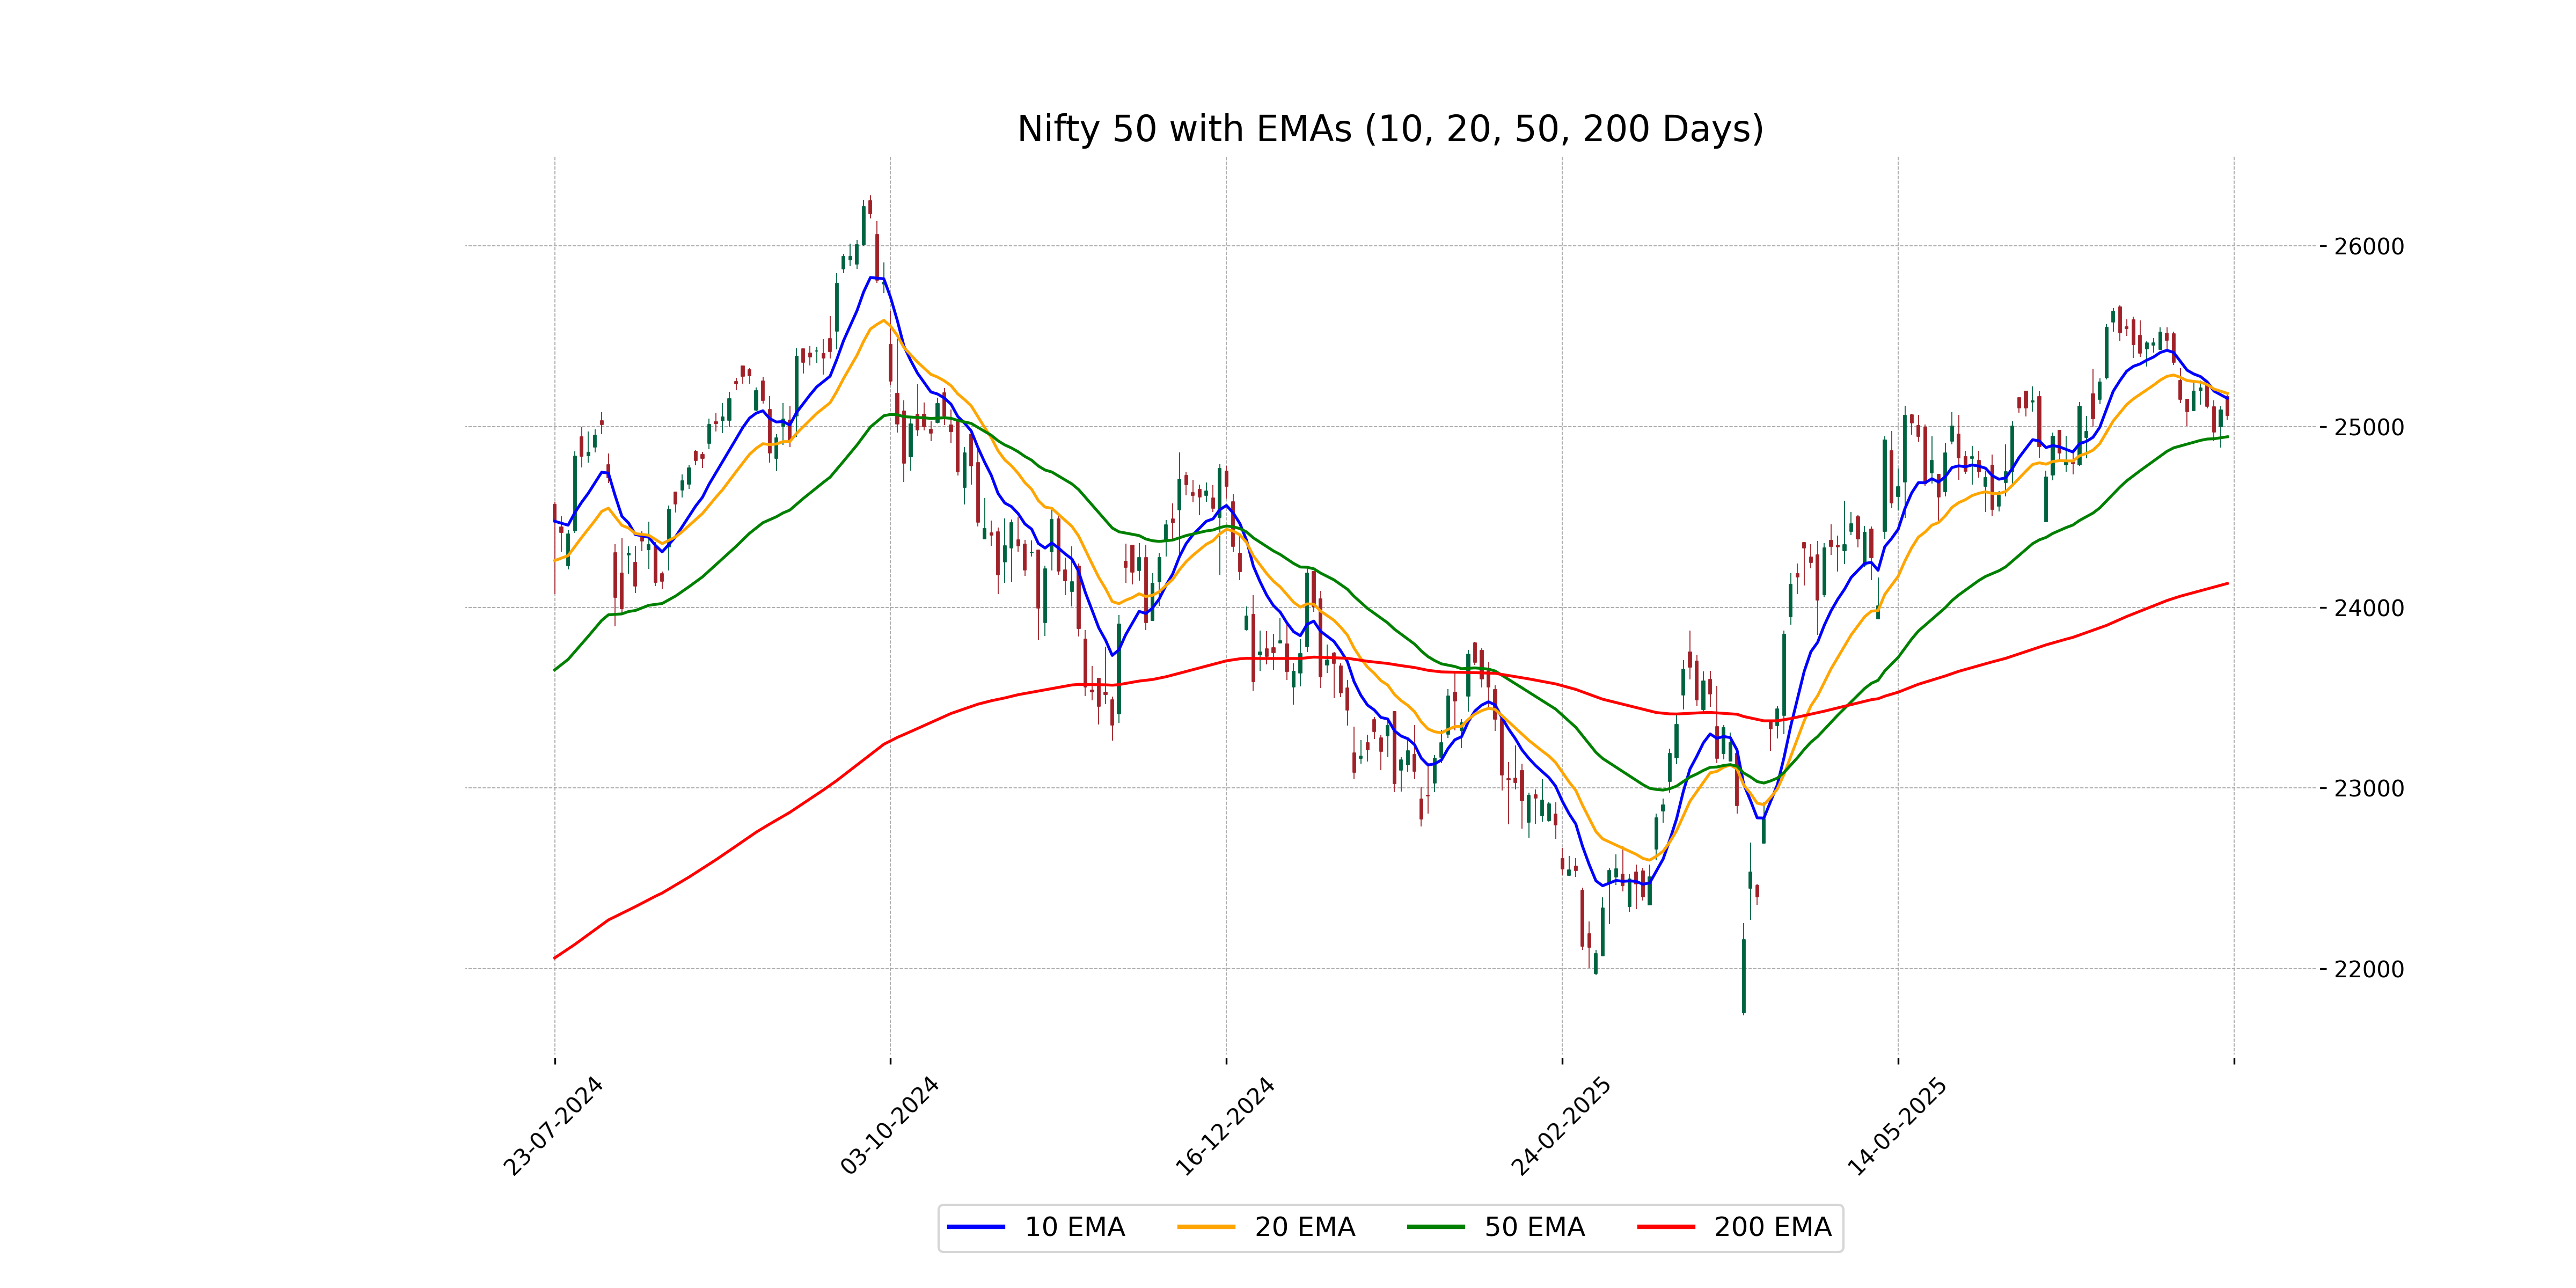
Relationship with Key Moving Averages
The Nifty 50's close of 25,060.90 is above the 200-day EMA of 24,131.73, suggesting a long-term bullish trend. However, it is below both the 50-day EMA of 24,943.07 and the 10-day EMA of 25,155.52, indicating potential short-term weaknesses. The close is also below the 20-day EMA of 25,183.05.
Moving Averages Trend (MACD)
Nifty 50's MACD value is 14.16, which is below the MACD Signal line of 78.43. This suggests a bearish trend in the market. Traders may interpret this as a potential signal for a continued downtrend or a sell signal.

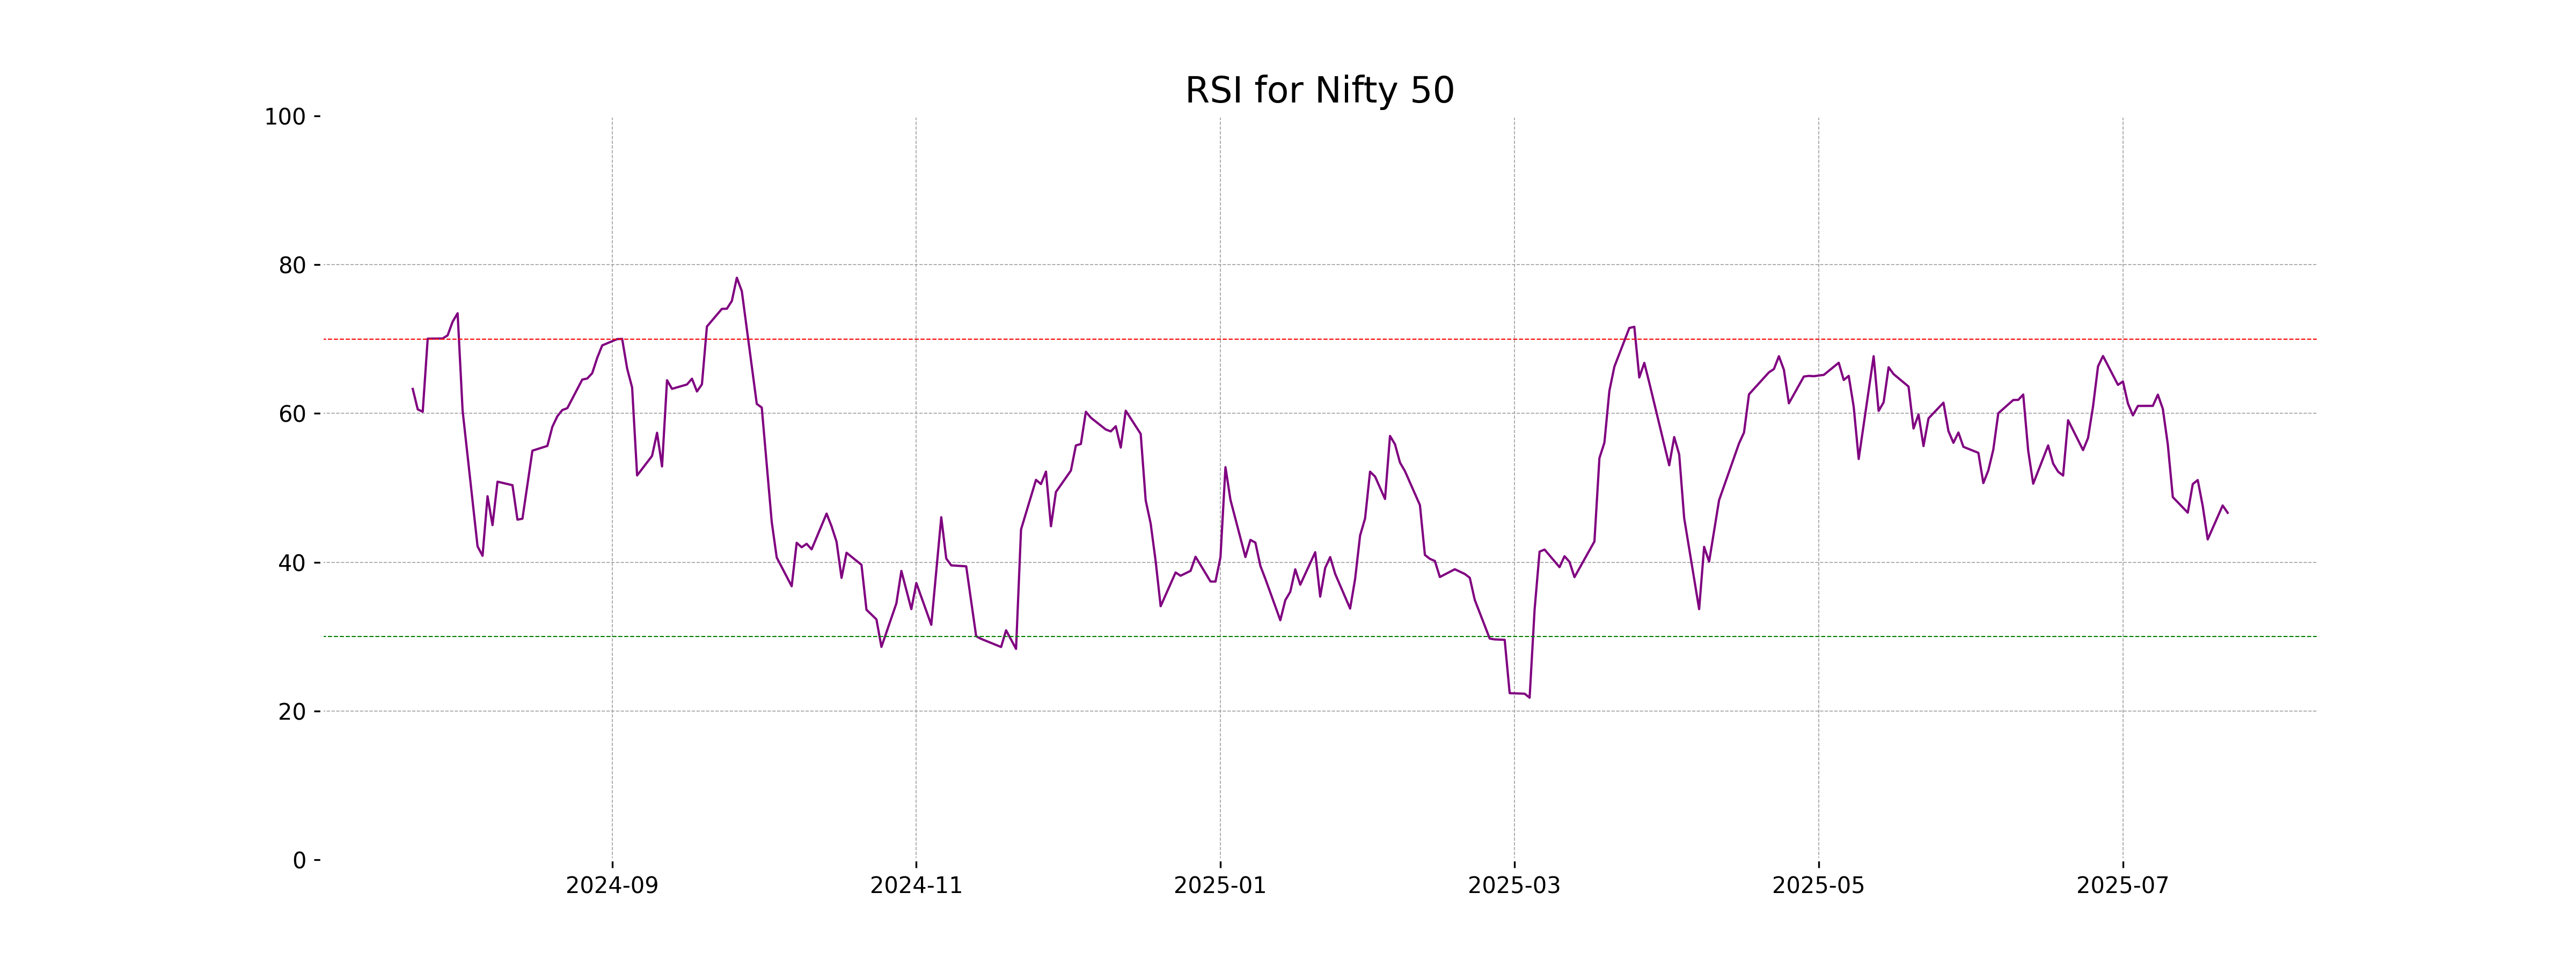
RSI Analysis
The current RSI for Nifty 50 is 46.65, which indicates a neutral market sentiment as it is neither in the overbought nor oversold territory. Typically, an RSI below 30 is considered oversold, and above 70 is overbought, suggesting Nifty 50 is currently stable but could go either direction depending on market conditions.
Up Next

Global stock market indices: How the world markets performed today - 22 July 2025

Step-by-step guide to apply for a mortgage loan online with minimal documentation

Honda Activa 6G: Everything You Need to Know Before Buying

How much does a ULIP plan really cost? A break-down of all charges

Centre plans to borrow Rs 8.20 lakh cr from market in first half of FY27

Reliance denies buying Iranian oil amid US sanctions waiver

More videos

Premium petrol price up Rs 2, industrial diesel up Rs 22; no change in normal petrol, diesel rates

India's GDP expected to register over 8 pc growth in Sep-Dec: Report

Govt announces seven measures to help boost exports

RBI keeps interest rates on hold after US trade deal boosts outlook

RBI proposes to compensate customers up to Rs 25,000 loss due to fraud

RBI raises GDP growth projection of Q1, Q2 of FY27

RBI pauses rate cuts, retains interest rate at 5.25 pc

Rupee jumps 122 paise to close at 90.27 against US dollar on India-US trade deal

Stock markets cheer India-US trade deal: Sensex, Nifty surge 2.5 pc

UPI transactions hit record high of Rs 230 lakh crore in 2025-26 till Dec: Govt