


Highlights
- Bullish markets like DJI excelled beyond expectations
- Insightful RSI and MACD readings reveal pressure variations
- Investors may monitor these indicators for potential reversals
Latest news

Samsung Galaxy A57 & A37 Review: Safe Upgrades or Missed Opportunity?

Trust-based governance, Jan Vishwas Bill will decriminalise minor offences, boosts ease of doing business: Piyush Goyal
, Marking a New Era for Inclusive Sport")
India Set to Launch Korfball Premier League (KPL), Marking a New Era for Inclusive Sport

"It belongs to all Dogras": Kathua's Thakur Khajoor Singh after receiving Sahitya Akademi Award

fischer Strengthens Production in Asia: New Production Sites in India and China

Punjab Carbonic Limited Files DRHP With SEBI, NSE and BSE

Cupid Limited Deploys Rs 82.88 crore as Strategic Investment into Baazar Style Retail Limited

Selena Gomez to direct 'Wizards Beyond Waverly Place' finale, series ends this summer
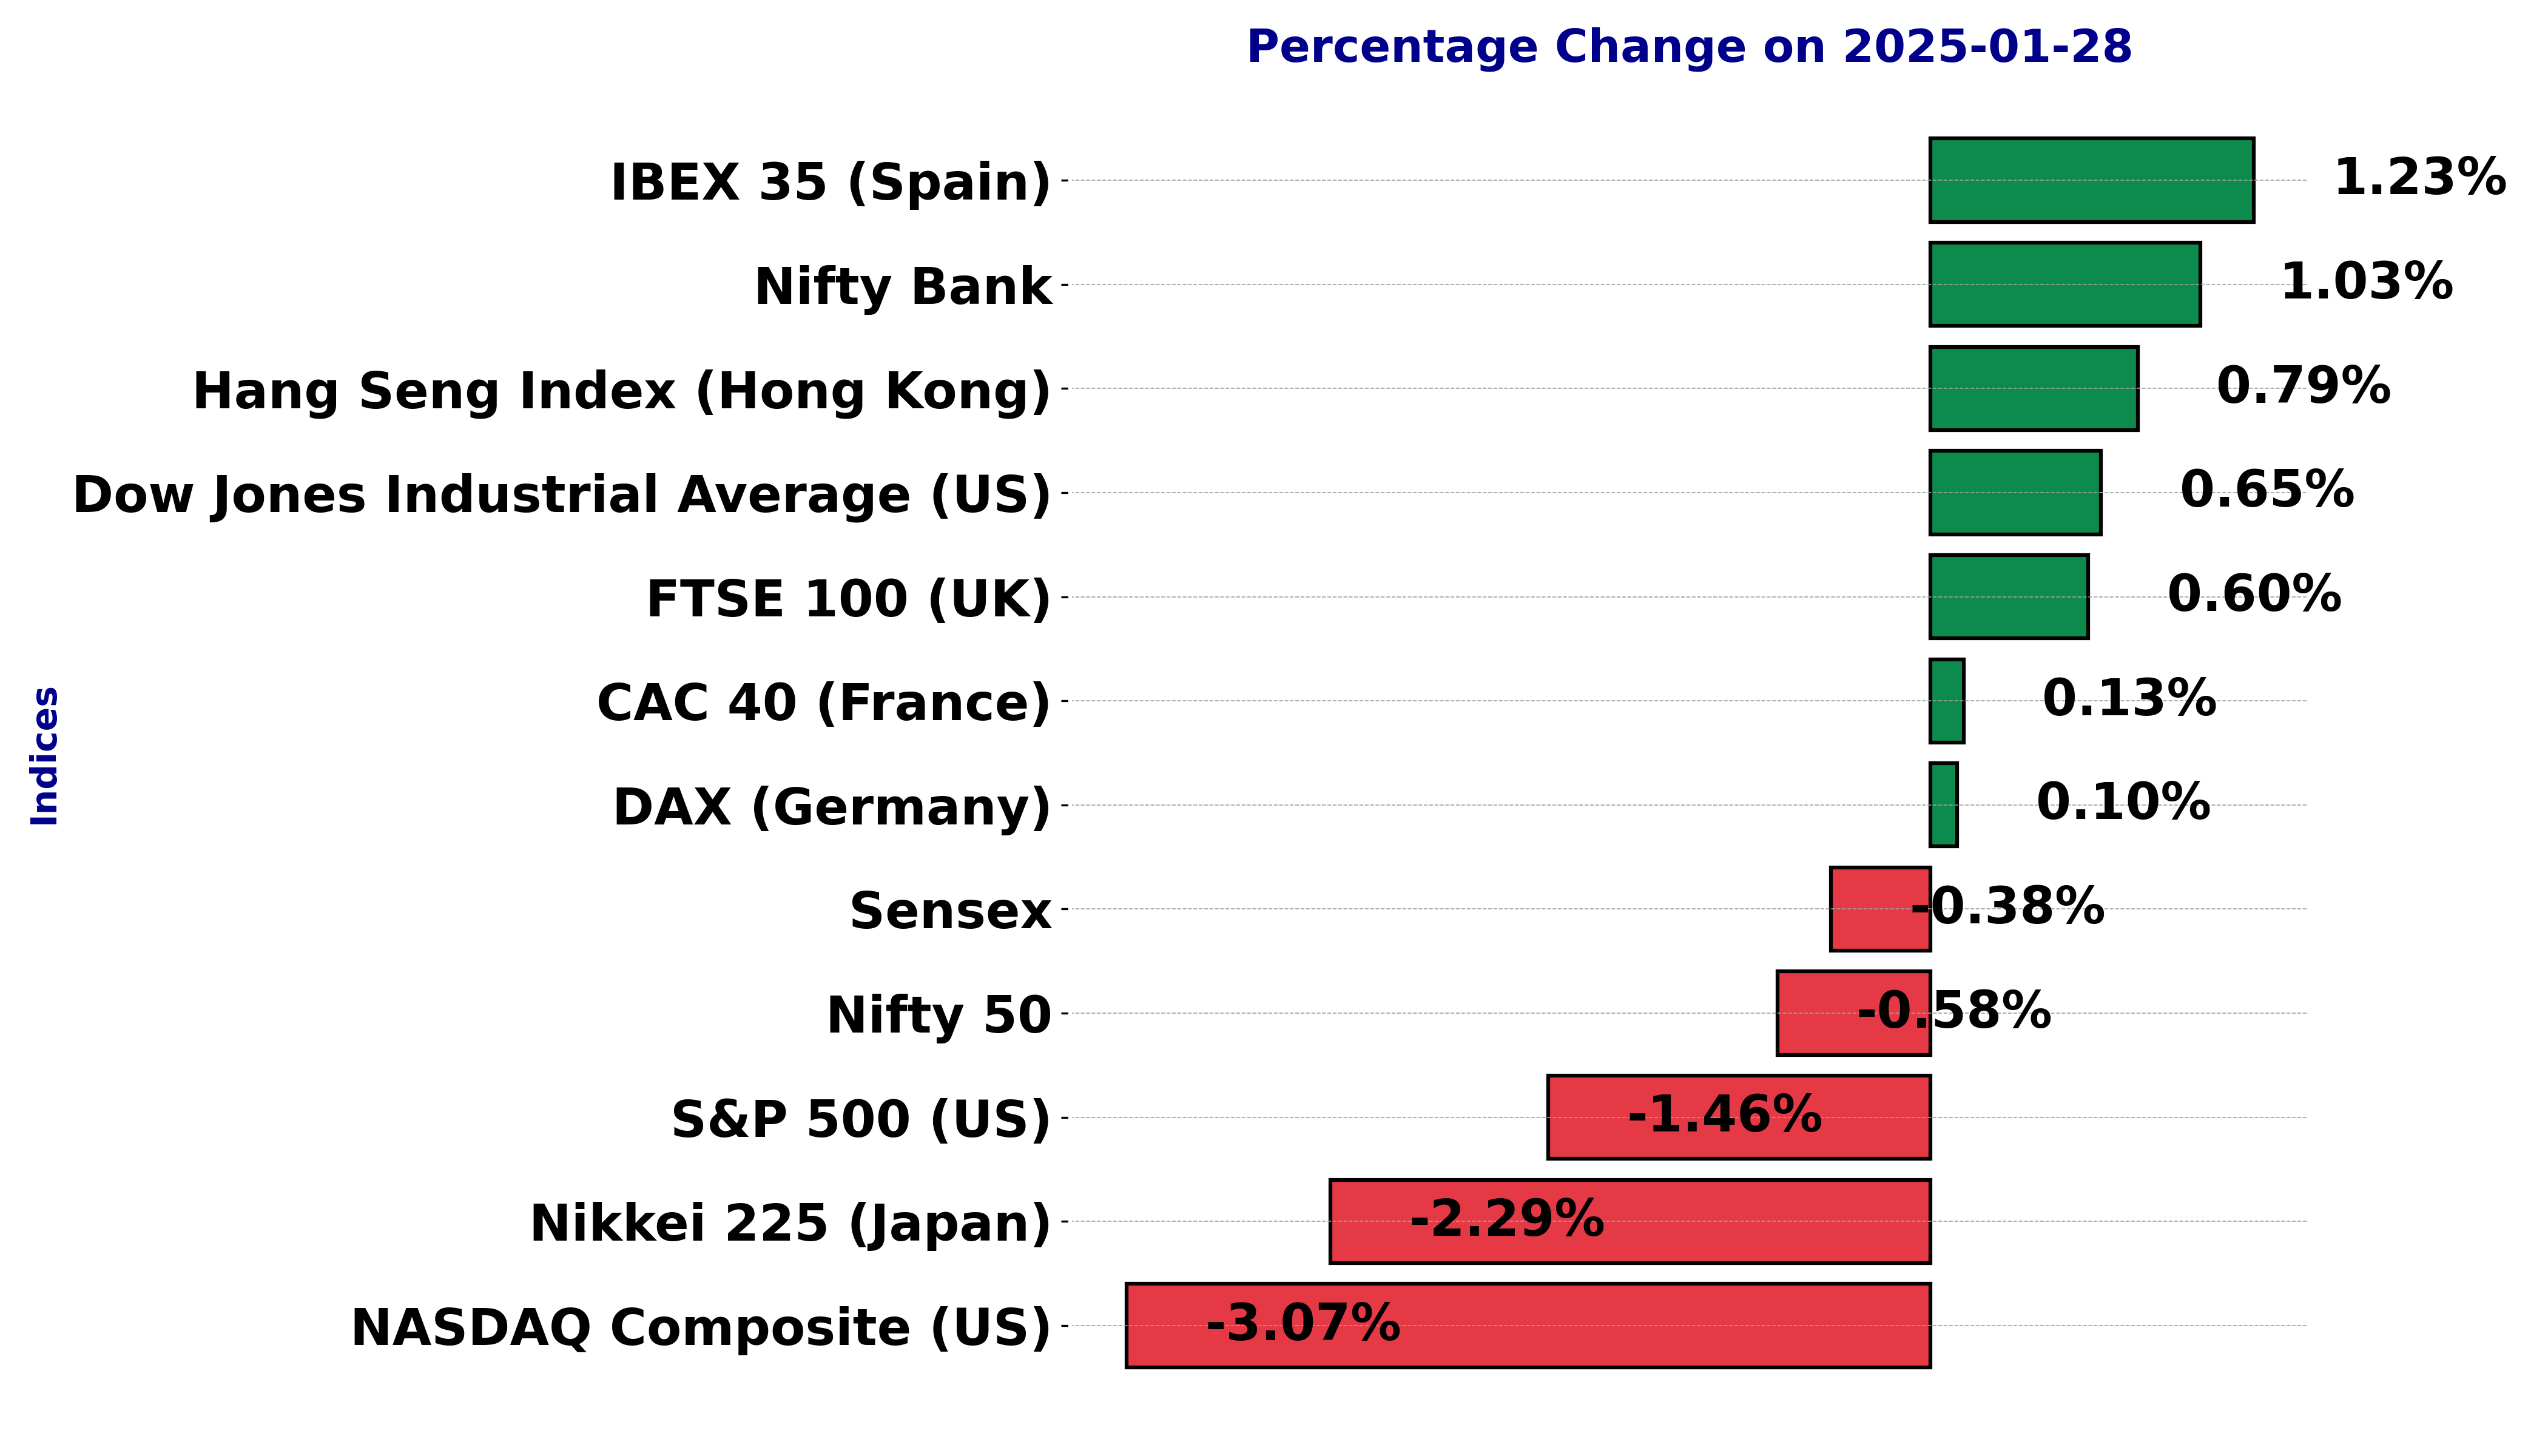
Global stock market indices: How the world markets performed today - 28 January 2025


The international stock market indices showed varied performances on January 28, 2025, reflecting the economic sentiment across different regions.
In this article, we analyze the performance of key global indices including the S&P 500, Dow Jones Industrial Average, NASDAQ Composite, FTSE 100, DAX, CAC 40, IBEX 35, Nikkei 225, Hang Seng, Nifty 50, and BSE Sensex.
Stock Performance for ^BSESN on January 28, 2025:

The ^BSESN opened at 75,659.0, reached a high of 76,512.96, and a low of 75,622.88 before closing at 75,901.41. The previous close was 76,190.46, marking a points change of -289.05 and a percentage change of -0.38%.

Relationship with Key Moving Averages:
The 10-EMA (76,551.12) and the 20-EMA (77,197.27) are currently below the 50-EMA (78,428.15) and the 200-EMA (77,883.57). This indicates a bearish trend for ^BSESN, as the moving averages are showing a downward trend which signifies a potential weakness in the current stock movement.
Moving Averages and MACD Trend:
The MACD line is at -840.42 and the Signal line is at -799.01, suggesting that the stock is in a bearish phase as the MACD is below the Signal line and moving further away, which often signals continuing downward momentum.

RSI Analysis:
The RSI value stands at 36.46, indicating that the stock is nearing the oversold territory. This typically suggests that there may be a potential for a price uptick or reversal, although caution is advised as further decline could continue if bearish conditions persist.

Stock Performance for ^DJI on January 28, 2025:
On January 28, 2025, the stock opened at 44,148.80, reached a high of 44,727.85, and a low of 44,026.27, closing at 44,713.58. This resulted in a percentage change of 0.65% compared to the previous close of 44,424.25, with a points change of 289.33. The trading volume for the day was 1,230,156,731.


Moving Averages:
The stock's current close (44,713.578125) is above all key moving averages (10-EMA: 43,871.96, 20-EMA: 43,528.25, 50-EMA: 43,307.62, and 200-EMA: 41,403.51), suggesting a bullish trend.
MACD Analysis:
The Moving Average Convergence Divergence (MACD) value is 293.03, which is above the MACD Signal value of 29.28. This divergence indicates a strong positive momentum, supporting the bullish outlook for the stock.

RSI Overview:
The Relative Strength Index (RSI) stands at 66.96. An RSI above 70 typically indicates the asset is overbought, whereas below 30 signals oversold. Currently, the RSI suggests the stock is approaching overbought territory, reflecting the recent upward price movement.

Stock Performance for ^FCHI on January 28, 2025:
The stock opened at 7899.28 and closed at 7937.66, marking a slight increase of 0.13% compared to the previous closing of 7927.62. The day's high was 7950.26, while the low was 7879.33. The trading volume was reported as 0, indicating no trades were recorded.


Relationship with Key Moving Averages:
The ^FCHI stock price is currently above its 10-EMA (7764.77), 20-EMA (7635.28), 50-EMA (7502.56), and 200-EMA (7515.37). This indicates a bullish trend as the stock is maintaining levels above these key moving averages, showing strong upward momentum.
Technical Indicators:
RSI Analysis:
The RSI is at 77.64, suggesting that the stock is in an overbought condition. This high RSI value typically indicates that the stock might be overvalued and could experience a price correction in the near future.

MACD Analysis:
The MACD is 143.15, with a signal line of 97.65, indicating strong bullish momentum. Since the MACD line is above the signal line, it suggests further upward price movement. This crossover is often seen as a buy signal by traders.

Stock Symbol: ^FTSE
Stock Performance for January 28, 2025:
The FTSE 100 index opened at 8503.71, reached a high of 8555.43, and closed at 8553.73 with a low of 8503.62. Compared to the previous close of 8502.40, the index gained 0.60% or 51.33 points. Trading volume was minimal at 0.

Moving Averages Analysis:
The 10-EMA stands at 8471.56, suggesting recent positive momentum. With the 20-EMA at 8392.43 and the 50-EMA at 8307.05, both are below the current price and the 10-EMA. The 200-EMA at 8172.49 is also below these levels, indicating a solid bullish trend.
MACD Analysis:
The MACD is at 87.79, significantly above the MACD Signal line at 61.84, indicating bullish momentum is strengthening as the stock continues to rise.
RSI Analysis:
The RSI sits at 67.41, which is approaching overbought territory. This indicates strong buying pressure, yet caution should be taken as it nears levels typically associated with overbought conditions.
Stock Performance for ^GDAXI on January 28, 2025:
The ^GDAXI opened at 21,374.29, reached a high of 21,438.13, and a low of 21,296.33 before closing at 21,416.99. This is compared to the previous close of 21,394.93. The percentage change was an increase of 0.103%, with a points change of 22.06.


Relationship with Key Moving Averages:
The current price of ^GDAXI at 21,416.99 is above all key moving averages (10-EMA: 21,043.60, 20-EMA: 20,728.07, 50-EMA: 20,218.16, and 200-EMA: 19,010.10). This positioning indicates a strong bullish trend as it shows the stock is trading higher than recent past averages which often suggests upward momentum. The 10-EMA being the closest to the current price shows more recent support and continued strength in its short-term bullish trend.
Trend Analysis Using MACD and RSI:
The MACD for ^GDAXI is 369.59 which is above its signal line of 277.53, suggesting a bullish momentum. As the MACD is positive and trending above its signal, it shows increased buying pressure. The RSI stands at 78.85, which falls into the overbought category. This might indicate that the stock could be due for a short-term correction, yet in strong trending markets, RSI can remain overbought for extended periods, continuing the bullish trajectory.


Technical Analysis for ^GSPC (January 28, 2025)
The stock opened at 5969.04 and closed at 6012.28, with a high of 6017.17 and a low of 5962.92. The stock has experienced a points change of -88.96 from the previous close of 6101.24, equating to a -1.46% change.


Relationship with Key Moving Averages
The current price of 6012.28 is above the 200-EMA (5621.21) and 50-EMA (5949.83), suggesting a bullish mid to long-term trend. However, it remains below the 10-EMA (6016.78), indicating short-term bearishness. The 20-EMA stands at 5988.70, which the stock price has surpassed, potentially supporting a transition in trend.
Moving Averages Trend (MACD) and RSI
The MACD of 26.41 is significantly above the MACD Signal of 7.36, which suggests a strong bullish momentum. This indicates that the stock might continue its positive momentum if the bullish signal persists.

The RSI value of 52.82 indicates a neutral condition, neither overbought nor oversold, suggesting a potential stability or indecisiveness in market trends for the stock.

Stock Performance for ^HSI on January 28, 2025:
On January 28, 2025, the Hang Seng Index (^HSI) opened at 20,337.46, with a high of 20,337.46 and a low of 20,165.73, closing at 20,225.11. The previous closing value was 20,066.19, resulting in a percentage increase of 0.79%, equivalent to a points change of 158.92. Trading volume for the day was recorded at 0.0.


Relationship with Key Moving Averages:
The current price of ^HSI is above its 10-EMA (19,820.81) and 20-EMA (19,734.00), which shows a bullish short-term trend. The price is also above the 50-EMA (19,727.83) and 200-EMA (18,967.30), suggesting an overall uptrend confirming bullish market sentiment.
Technical Indicators Analysis:
RSI (Relative Strength Index): The RSI is at 59.82, indicating that the index is neither overbought nor oversold, but closer to the bullish side, suggesting moderate upward pressure.

MACD (Moving Average Convergence Divergence): The MACD value is at 57.23, with the signal line at -37.33, showing a strong positive momentum. This divergence implies sustained bullish momentum in the market.

^IBEX Stock Performance on January 28, 2025:
The ^IBEX opened at 11,977.90 and closed at 12,130.50, achieving a high of 12,133.10 and a low of 11,976.00. The previous close was at 11,982.60, resulting in a percentage change of 1.23% with a points change of +147.90. The total volume traded was 30,867,074 shares. This reflects a positive sentiment, indicating a bullish trend for the day.


Relationship with Key Moving Averages:
The stock closes above all the key moving averages — 10-EMA (11,938.67), 20-EMA (11,858.88), 50-EMA (11,766.37), and 200-EMA (11,335.84), clearly depicting a strong and sustained bullish trend in the market. Staying above these averages signals rising momentum and investor confidence.
RSI Analysis:
The Relative Strength Index (RSI) is at 66.65, suggesting that the stock is approaching overbought territory. However, this also signals strength in the stock, as it is above the 50 level, reinforcing the bullish sentiment.

MACD Trend:
The MACD line (86.96) is above the MACD signal line (57.27), indicating a positive momentum and further confirming the upward trend. This crossover is a widely observed sign of a potential buy or the continuation of a bullish phase.

Stock Performance for ^IXIC on January 28, 2025:
The Nasdaq Composite Index (^IXIC) opened at 19,234.0, reached a high of 19,514.35, and recorded a low of 19,204.95. It closed the day at 19,341.83, which represents a decrease of 3.07% or a points change of -612.47 from the previous close of 19,954.30. The trading volume was 8,026,800,000. This significant drop suggests a bearish sentiment in the market on this day.


Moving Averages Analysis:
The 10-EMA (19,651.00) and 20-EMA (19,602.05) are both above the closing price, indicating recent selling pressure or a possible bearish trend. The 50-EMA (19,385.94) is slightly above the closing price but below both the 10-EMA and 20-EMA, confirming shorter-term downside momentum. The 200-EMA (18,005.64) remains well below all other measures, suggesting a continued long-term uptrend despite short-term corrections.
MACD Analysis:
The MACD is at 63.35 with the MACD Signal at 44.76, and the difference suggests bullish momentum might be returning, as the MACD line is above the signal line. Investors should watch for further confirmation as it could suggest a change in short-term momentum.

RSI Analysis:
The RSI stands at 45.92, which suggests the stock is neither overbought nor oversold. This position near the midpoint of 50 implies neutrality or slight bearishness, with potential for a reversal or continuation of the current trend.

^N225 Stock Performance for January 28, 2025
The stock opened at 39,400.02, reached a high of 39,448.55, and dropped to a low of 38,886.05 before closing at 39,016.87. This closing price is a decrease from the previous close of 39,931.98, with a percentage change of -2.29% and a points change of -915.11. The volume recorded was 0, indicating no trades were made on this day.

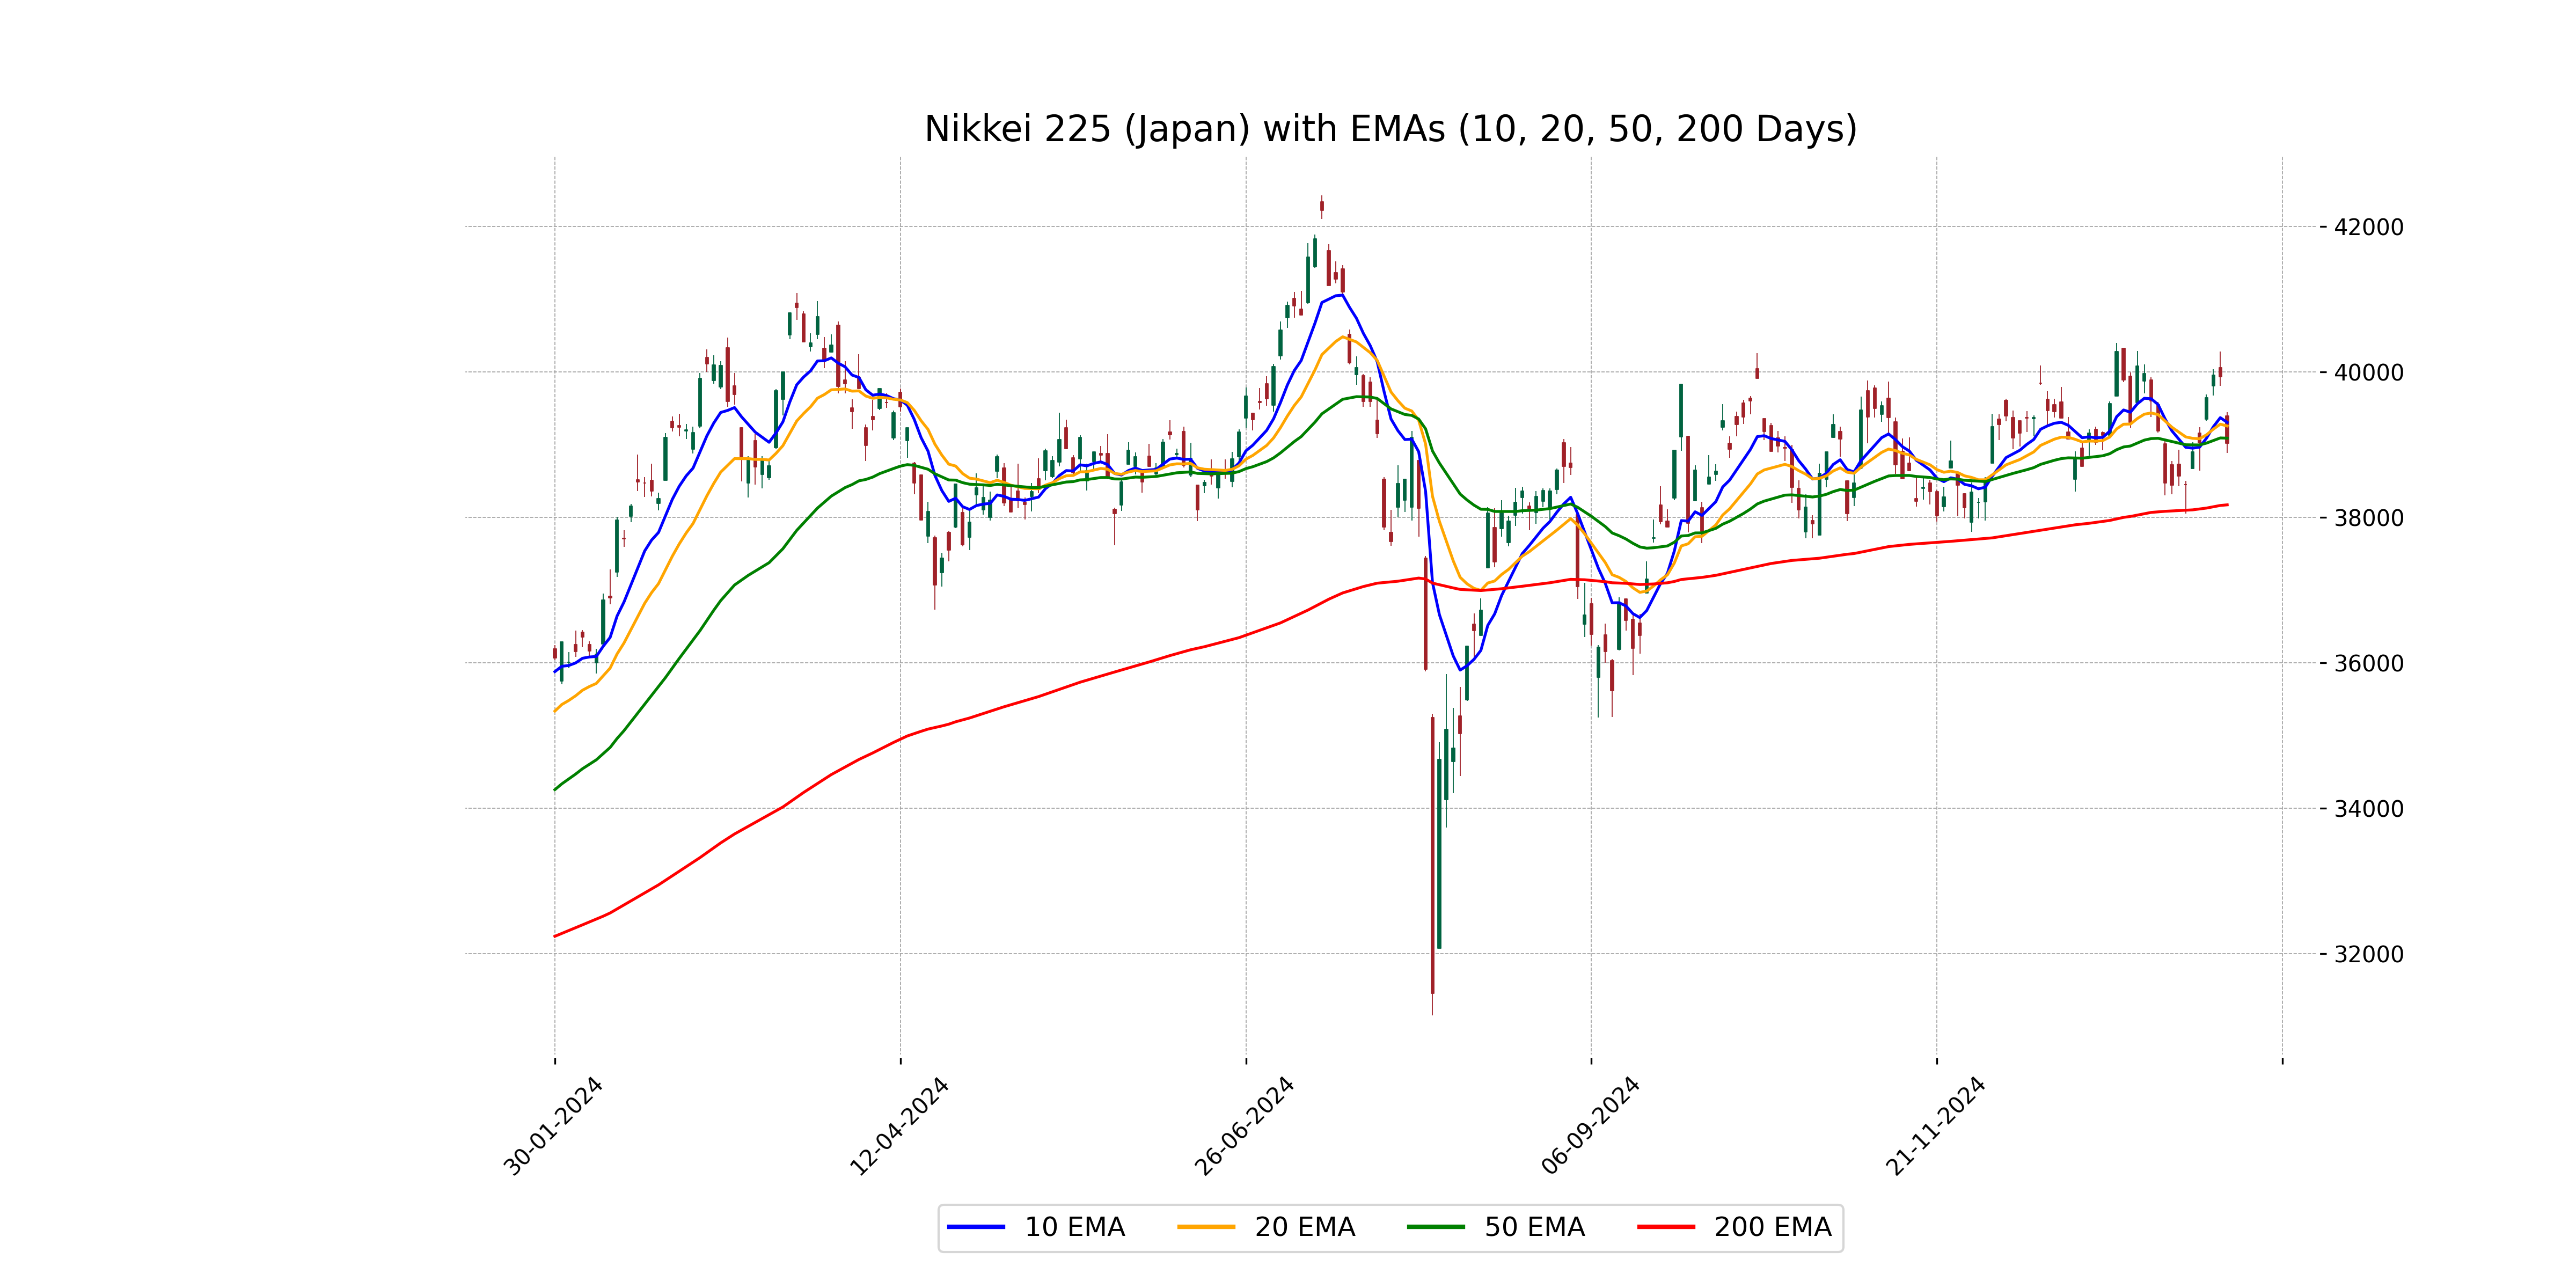
Relationship with Key Moving Averages
The ^N225's current closing price is below both the 10-EMA (39,307.82) and 20-EMA (39,257.59), indicating a short-term bearish trend. However, it is slightly above the 50-EMA (39,090.51), suggesting that although there is recent bearish pressure, the longer-term trend may still hold as support. The price remains significantly higher than the 200-EMA (38,173.70), reinforcing a longer-term upward trend despite current fluctuations.
Technical Indicators: MACD and RSI
The MACD value of 62.37 is above the MACD Signal of 35.59, which traditionally indicates a bullish signal. This suggests that while there is immediate bearish sentiment, there could be underlying bullish momentum.
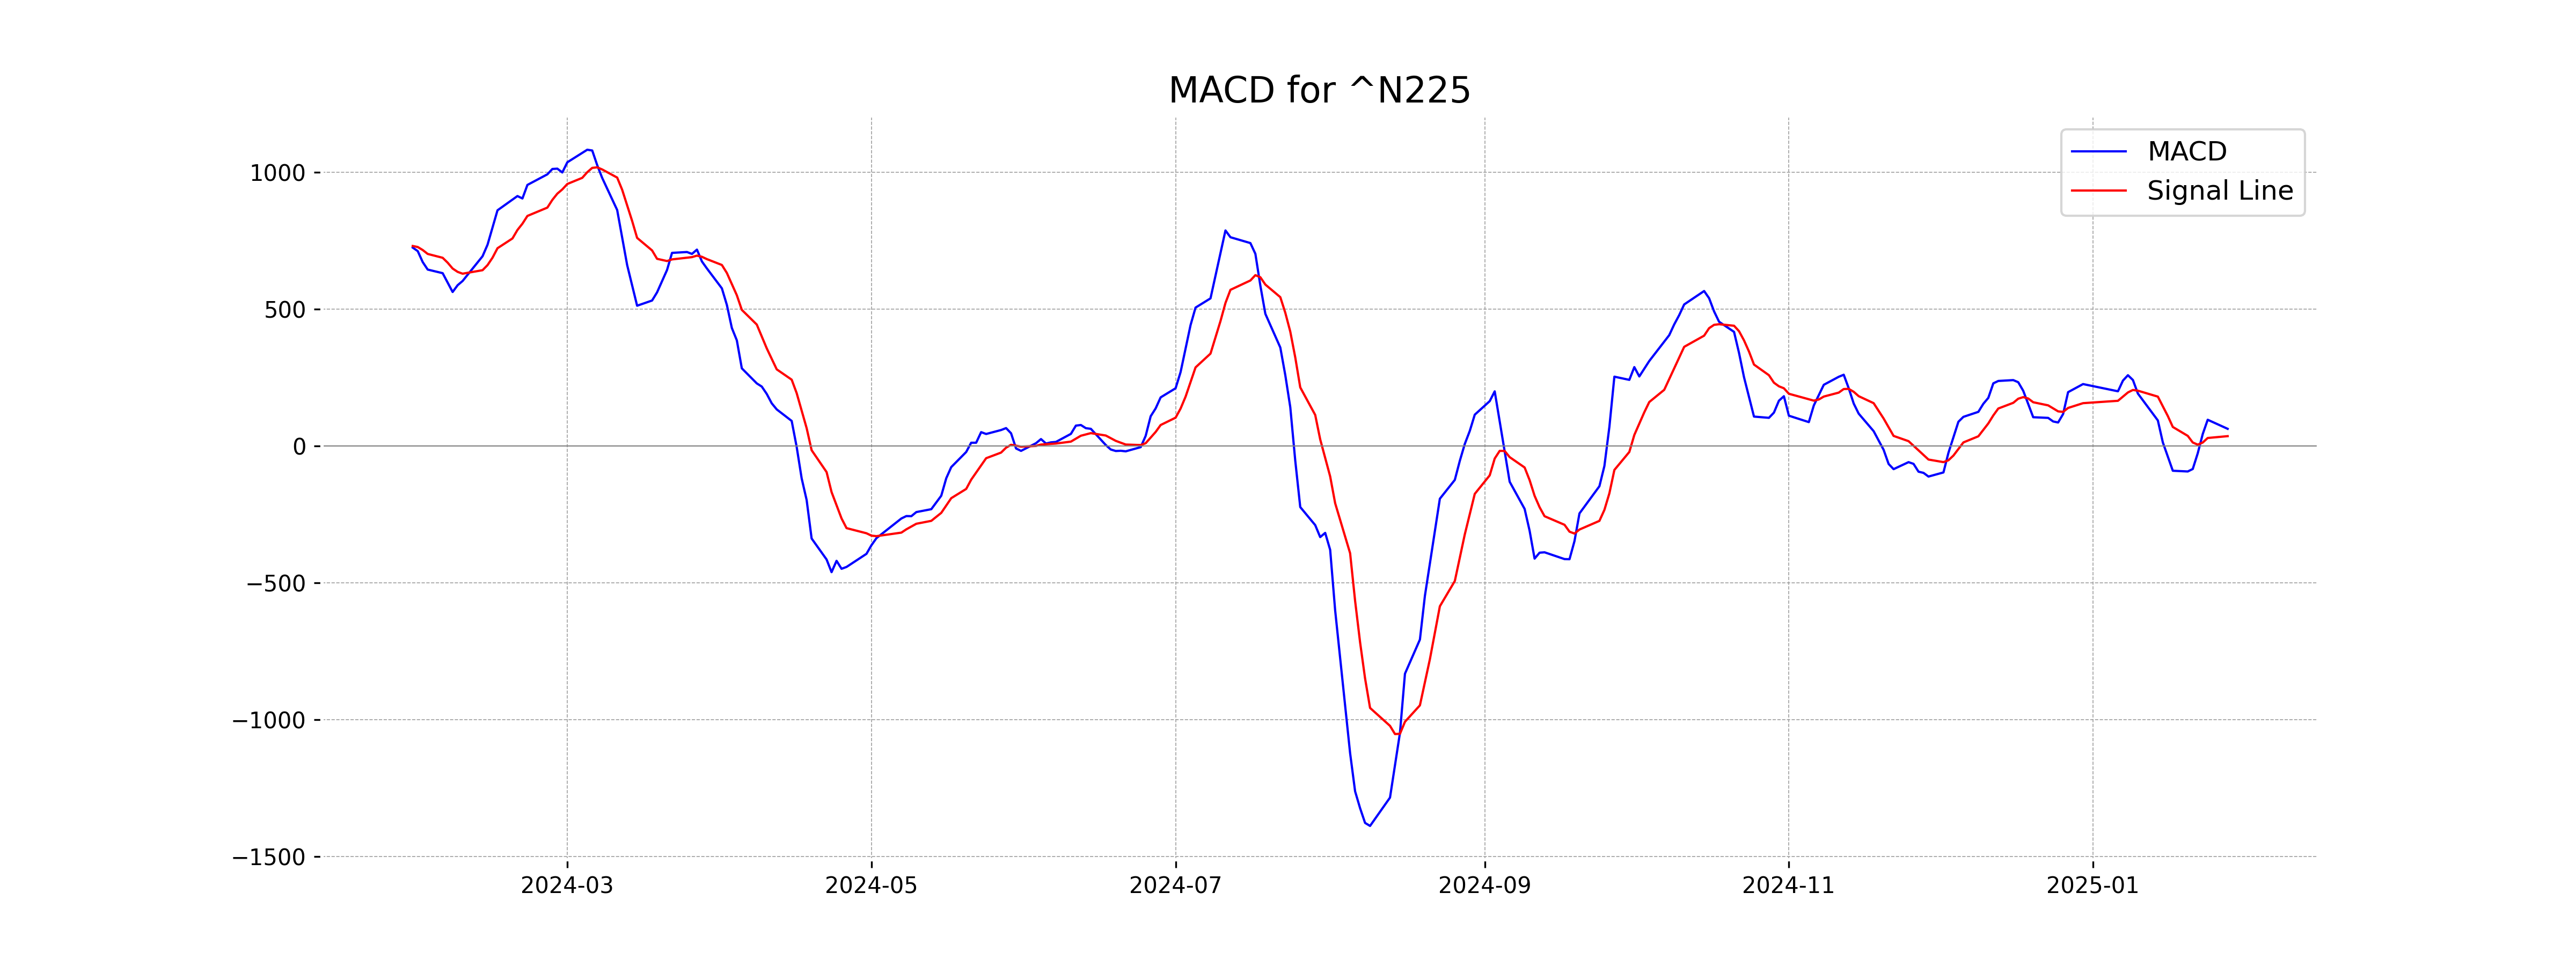
The RSI stands at 47.72, a neutral zone indicating that the stock is neither overbought nor oversold. The RSI's positioning supports a cautious stance, where price movements are likely dictated by market sentiment shifts rather than intrinsic value drivers.

Stock Performance for ^NSEBANK on January 28, 2025:
The stock opened at 48,642.50, reached a high of 49,247.14, a low of 48,449.05, and closed at 48,866.85. This represents a percentage change of 1.03% and a point change of 499.05 from the previous close of 48,367.80. Notably, the volume recorded was 0.0, indicating a lack of traded shares for this day.


^NSEBANK's Relationship with Key Moving Averages:
The close price of ^NSEBANK at 48,866.85 is slightly above the 10-EMA of 48,871.91, indicating that there might be an attempt to trend upwards. However, it's below the 20-EMA of 49,434.64, the 50-EMA of 50,480.54, and the 200-EMA of 50,272.81, suggesting a bearish trend overall. These moving averages determine the resistance levels, with the stock needing to break above these to enter a potential bullish phase.
Technical Indicators - Moving Averages Trend (MACD) and RSI:
The MACD value of -761.44 with a signal line value of -788.51 indicates a bearish trend as the MACD line is above the signal line but remains in negative territory. This suggests that there is still bearish momentum.
Meanwhile, the RSI value of 42.14 indicates that the stock is neither overbought nor oversold, hovering in a neutral zone, which might imply consolidation around the current price levels.
Technical Analysis for Stock: ^NSEI on January 28, 2025
Stock Performance:
The stock opened at 22960.45, reached a high of 23137.95, and a low of 22857.65, before closing at 22957.25. The previous closing price was 23092.20, resulting in a percentage change of -0.58%, equating to a points change of -134.95. This indicates a downward momentum in today's trading session.


Key Moving Averages Relationship:
The ^NSEI is currently trading below its 10-EMA of 23188.52, 20-EMA of 23378.02, 50-EMA of 23763.48, and the 200-EMA of 23641.44. This positioning below these key exponential moving averages indicates a bearish trend in the current market sentiment.
RSI Analysis:
The RSI is at 35.89, which is below the neutral 50 level, often indicating bearish momentum or a possibility for the stock being oversold. A low RSI suggests that the stock may find buying interest soon but, as of now, the trend remains bearish.

MACD Analysis:
The MACD is at -247.79, and while its signal line is at -235.18, the MACD being below the signal line reflects a continuation of the bearish trend. The negative MACD values indicate a dominant bearish theme, and any divergence can signal potential trend reversals.

Up Next
Global stock market indices: How the world markets performed today - 28 January 2025

Centre plans to borrow Rs 8.20 lakh cr from market in first half of FY27

Reliance denies buying Iranian oil amid US sanctions waiver

Premium petrol price up Rs 2, industrial diesel up Rs 22; no change in normal petrol, diesel rates

India's GDP expected to register over 8 pc growth in Sep-Dec: Report

Govt announces seven measures to help boost exports

More videos

RBI keeps interest rates on hold after US trade deal boosts outlook

RBI proposes to compensate customers up to Rs 25,000 loss due to fraud

RBI raises GDP growth projection of Q1, Q2 of FY27

RBI pauses rate cuts, retains interest rate at 5.25 pc

Rupee jumps 122 paise to close at 90.27 against US dollar on India-US trade deal

Stock markets cheer India-US trade deal: Sensex, Nifty surge 2.5 pc

UPI transactions hit record high of Rs 230 lakh crore in 2025-26 till Dec: Govt

Explained: India-US trade deal, tariffs and trade benefits

Trade deal with US adds momentum to India's growth ambition: Industry leaders

Rupee jumps 119 paise to 90.30 against the US dollar on India-US trade deal