


Highlights
- NASDAQ and DAX indicated strong uptrends
- High RSI and MACD values
- Hang Seng Index and BSE Sensex showed bearish trends
Latest news

Putin hails Ukraine gains, threatens more, in annual press conference

OnePlus Pad Go 2 Review: No drama, just a good tablet

Parliament Moment: Priyanka Gandhi shares tea with Rajnath Singh. PM Modi and Om Birla

Cold wave deepens in Kashmir as Chillai-Kalan nears, temperatures dip below freezing

Pakistan accuses India of attempting to undermine Indus treaty

Vande Mataram discussion in UP legislature to mark 150th anniversary: Yogi Adityanath

Ashes 2025: Travis Head slams unbeaten 142 to crush England's Ashes hopes

Tipra Motha youth wing protests Bangladesh leader's anti-India remarks in Agartala
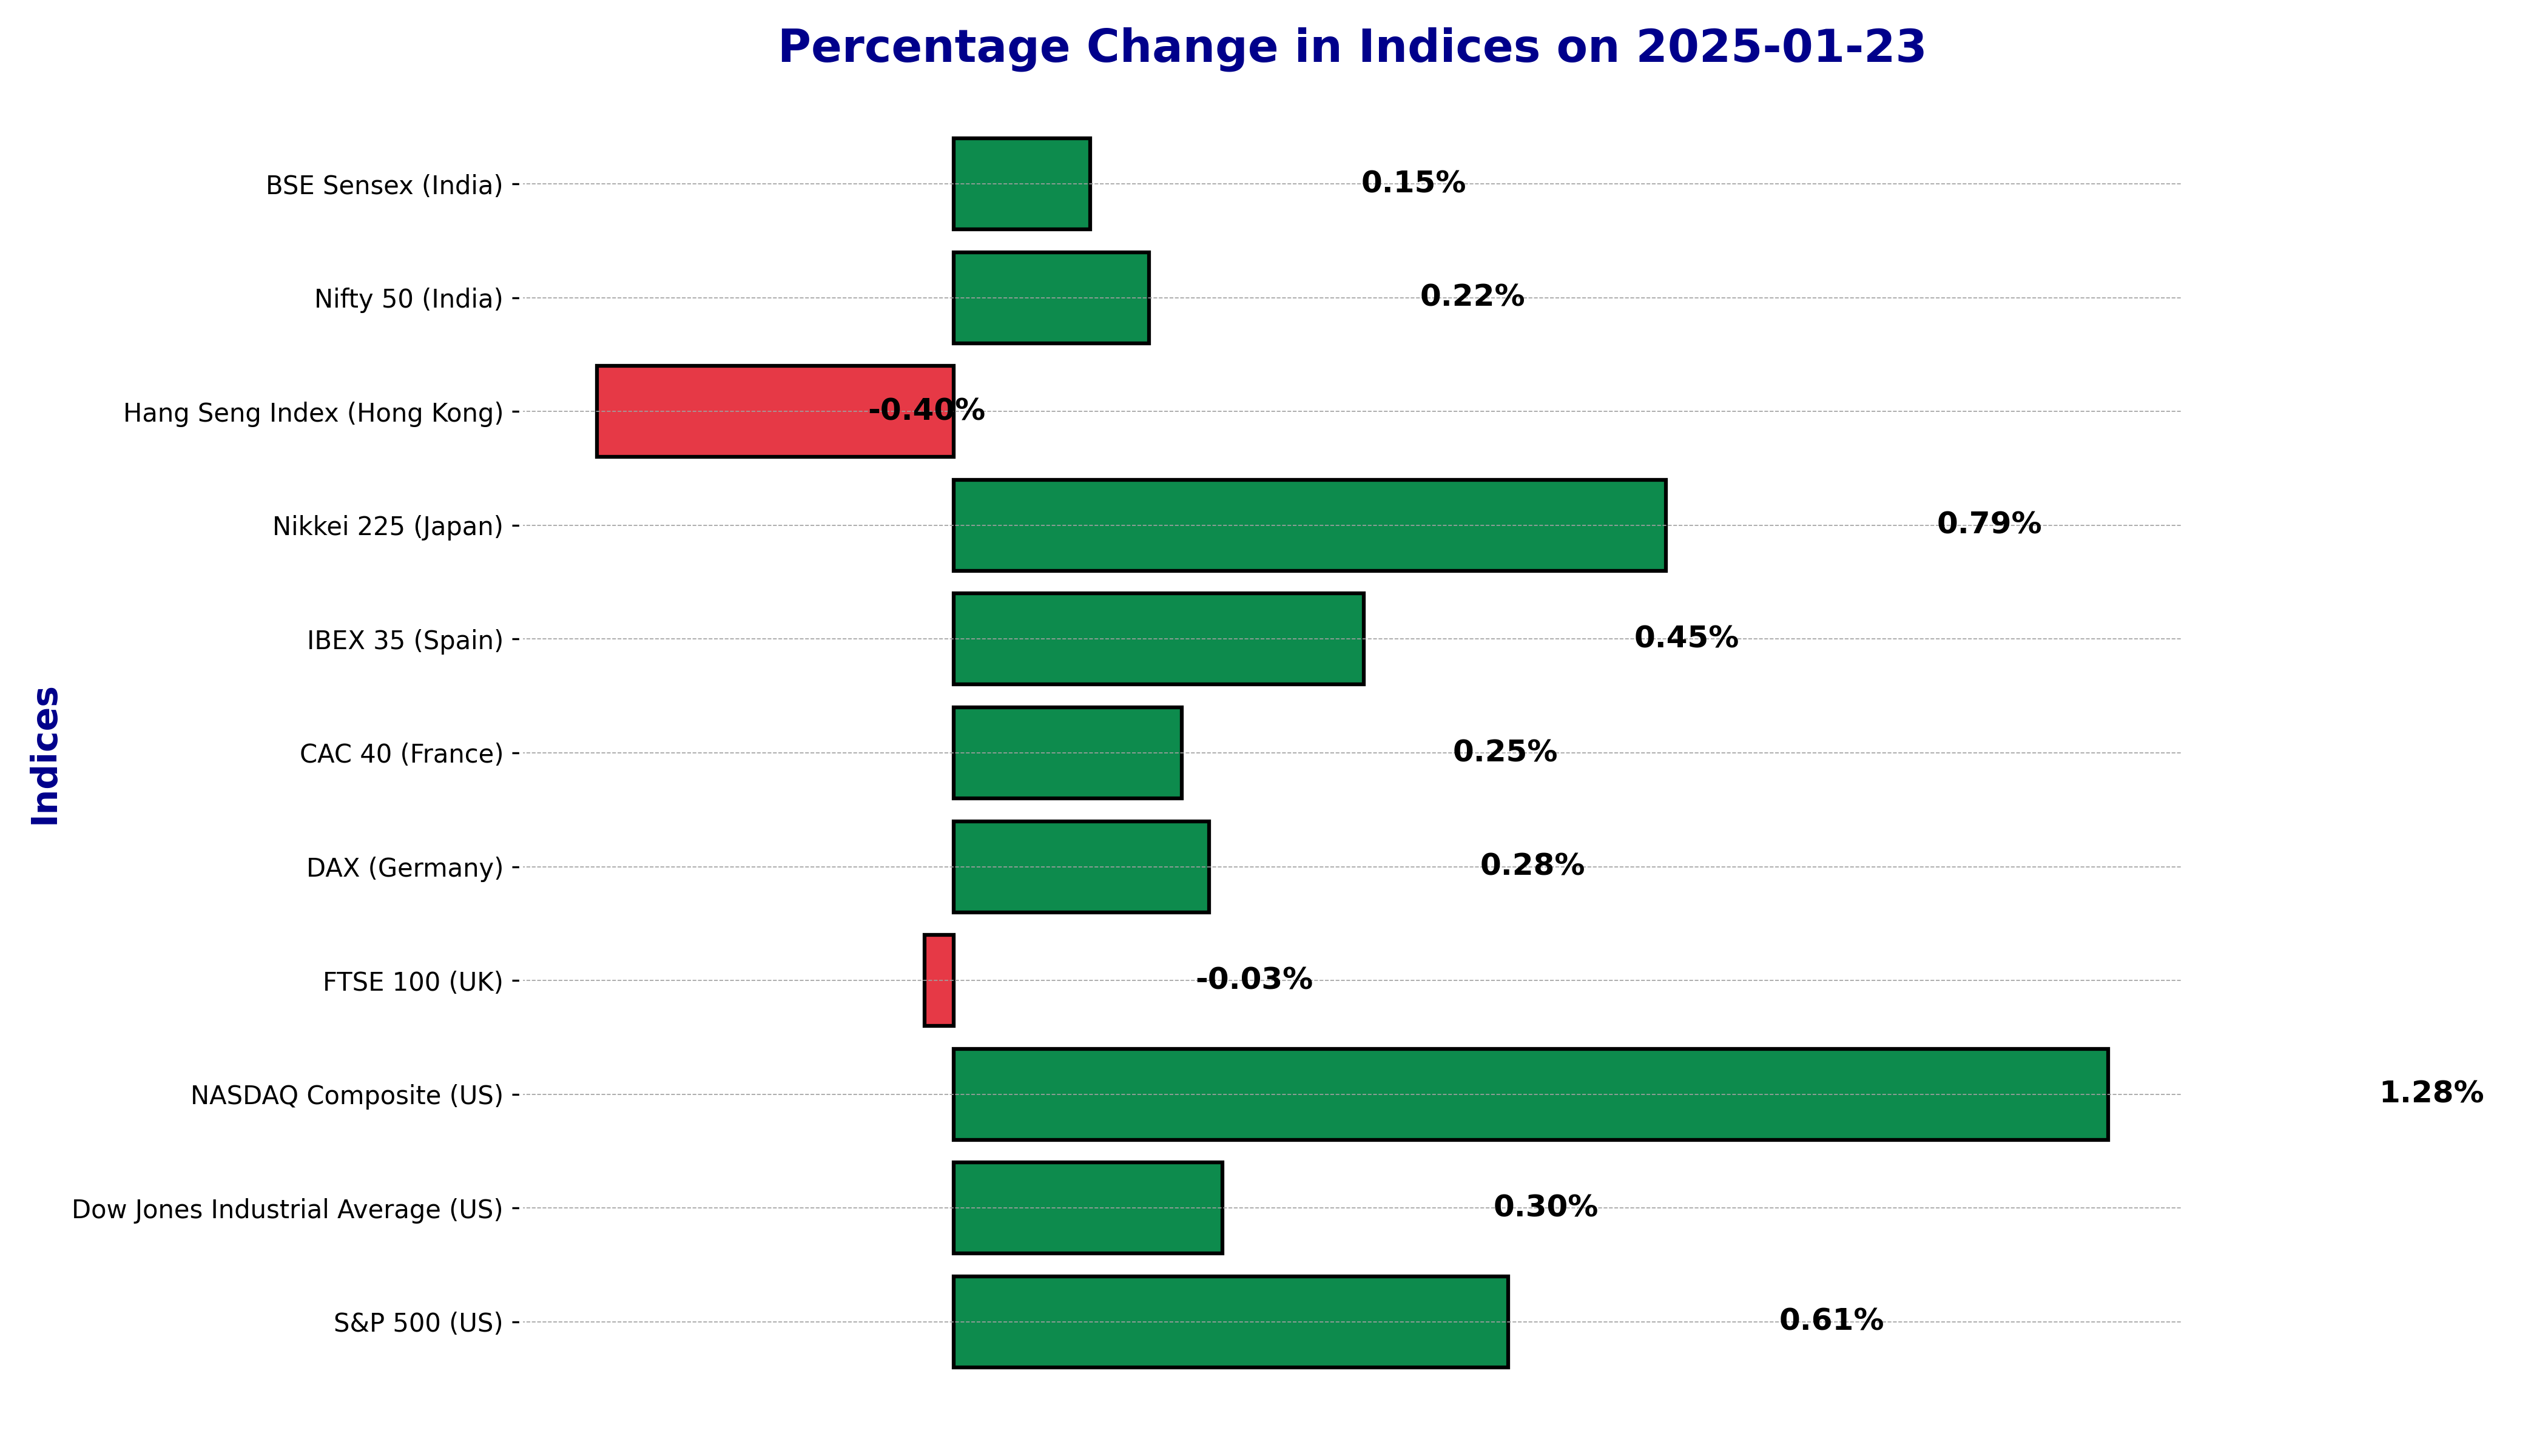
Global stock market indices: How the world markets performed today - 23 January 2025


It’s always interesting to check in on how the global stock markets are doing, especially when things aren’t all heading in the same direction.
On January 23, 2025, some markets were seeing a little more momentum, while others were slowing down. If you’ve been following the market trends, you might have noticed some ups and downs.
In this update, we’ll take a look at how major global indices like the S&P 500, DAX, BSE Sensex and others performed today, and what that could mean for the broader economic picture.
Let’s break it down together!
BSE Sensex (India) Analysis for January 23, 2025
_candlestick_with_ema_1_year.png)
On January 23, 2025, the BSE Sensex (India) experienced a modest increase with a percentage change of 0.151% and a points change of 115.39, closing at 76,520.38.
Technical Indicators:
50 EMA: The 50-day Exponential Moving Average (EMA) was calculated at 78,236.67. This value being higher than the current closing price indicates a potential downtrend in the medium-term outlook.
200 EMA: The 200-day Exponential Moving Average (EMA) stood at 78,780.44. Given the closing price is well below this level, it suggests a bearish market sentiment for the longer-term trend.
RSI: The Relative Strength Index (RSI) was recorded at 39.16. An RSI below 50 typically signals that the market is in a bearish phase, with significant downward pressure.
MACD: The Moving Average Convergence Divergence (MACD) was at -741.84, with the signal line at -704.84. The negative MACD and its position below the signal line suggest a bearish momentum, reinforcing the downtrend sentiment.
Market Sentiment:
Based on the technical indicators, the BSE Sensex (India) appears to be in a downtrend. The RSI value of 39.16 further confirms a bearish market condition as it approaches the lower threshold. The MACD indicator also highlights bearish momentum as it remains negative and below the signal line. Combined, these indicators paint a picture of a market currently experiencing a negative trend. Investors might interpret this as a signal to remain cautious or consider bearish strategies until more substantial indicators of a trend reversal appear.
Technical Analysis for CAC 40 (France) on January 23, 2025:
_candlestick_with_ema_1_year.png)
Stock Name: CAC 40 (France)
On January 23, 2025, the CAC 40 (France) closed at 7857.20 points, marking a positive change of 0.25% from the previous close of 7837.40 points. This represents a points change of 19.80 on the day.
Technical Indicators:
- 50 EMA (Exponential Moving Average): The 50-day EMA for the CAC 40 is 7488.76. Being below the current closing price, this suggests a notated support level for the medium-term trend.
- 200 EMA: The 200-day EMA stands at 7446.44. The index being above this level indicates a strong positive long-term trend and supports potential bullish market sentiment.
- RSI (Relative Strength Index): The RSI for the CAC 40 is currently at 77.19. Generally, RSI values above 70 suggest an overbought condition, indicating potential correction in the future. However, high RSI levels can also reflect strong upward momentum.
- MACD (Moving Average Convergence Divergence): The MACD indicator is at 105.18, with a Signal line at 64.28. The MACD being above the Signal line is a bullish indicator, suggesting an upward momentum in the price trend.
Market Sentiment:
The technical indicators collectively suggest that the CAC 40 is currently experiencing an uptrend. The index is trading above both the 50 EMA and 200 EMA, indicating sustained strength over the medium and long term.
Moreover, the RSI indicates a potential overbought situation despite the upwards momentum, cautioned by a possible near-term correction or consolidation. However, the strong MACD reading, well above the Signal line, corroborates ongoing bullish sentiment. Together, the RSI and MACD paint a picture of a market that's on a robust upward trajectory but might be cautiously approaching a resistance zone.
DAX (Germany) Technical Analysis - January 23, 2025
_candlestick_with_ema_1_year.png)
The DAX (Germany) experienced a positive trading session today, closing at 21314.39. This marks a percentage change of 0.28% and a points change of 60.12 from its previous close of 21254.27.
Technical Indicators:
50 EMA Analysis: The 50-day Exponential Moving Average (EMA) for DAX is positioned at 20431.66. As the current closing price is above the 50 EMA, this suggests a bullish sentiment and indicates potential continued upward momentum.
200 EMA Analysis: The 200-day EMA stands at 20349.00. The DAX trading above this longer-term average further supports the view of a sustained uptrend in the market, reinforcing overall bullish market conditions.
RSI (Relative Strength Index): The RSI is at 79.91, which falls in the overbought territory. This might suggest that the index could be overvalued in the short term and may witness a correction if the RSI levels remain elevated without corresponding stronger price movements.
MACD (Moving Average Convergence Divergence): The MACD is recorded at 238.05 with the MACD Signal at 132.24. The fact that the MACD is above the signal line indicates a continuing bullish trend, providing further confirmation of strong upward market momentum.
Market Sentiment:
Based on the analysis of these technical indicators, the DAX (Germany) appears to be in a pronounced uptrend. The alignment of the price above both the 50-day and 200-day EMAs is indicative of a strong upward movement in the market. The RSI nearing 80 suggests possible overbought conditions, yet the persistently high MACD illustrates that buyers continue to dominate the market sentiment. Thus, the combination of RSI and MACD points to a robust bullish market trend, albeit with caution advised due to potential short-term overvaluation as signaled by the elevated RSI levels.
Technical Analysis for the Dow Jones Industrial Average (US) on January 23, 2025
_candlestick_with_ema_1_year.png)
The Dow Jones Industrial Average (US), listed with the Stock Symbol DJI, exhibited a percentage change of 0.297% on January 23, 2025, marking a points change of 130.92. This movement reflects a promising uptick, indicating a positive momentum in market sentiment for this specific date.
Technical Indicators Analysis:
The 50-day Exponential Moving Average (EMA) for the Dow Jones stands at 43,229.45, while the 200-day EMA is at 43,358.25. The proximity of these two moving averages suggests a consolidating market. Typically, when the current price is above these EMAs, it indicates strength; however, if it's nearing or below them, it suggests cautiousness.
Additionally, the Relative Strength Index (RSI) is measured at 62.60. This level is above the neutral 50 mark but below the overbought threshold of 70, indicating a moderate bullish sentiment. The RSI suggests that the stock isn't overbought, leaving room for potential upward movement.
The Moving Average Convergence Divergence (MACD) value of 70.85, compared to its signal line at -133.36, indicates a bullish crossover. This provides a positive signal for the market, suggesting that the momentum is in favor of an uptrend.
Market Sentiment:
Based on these indicators, the current trend of the Dow Jones Industrial Average is in an uptrend. The RSI well above 50 confirms that the momentum is in favor of the buyers without suggesting overbought conditions. Meanwhile, the MACD line crossing above its signal line reinforces the strength of the bullish movement. Both indicators, RSI and MACD, support the notion of an ongoing uptrend, implying an optimistic outlook for continued growth. Investors might consider maintaining a positive stance while observing for any potential changes in these technical readings for future trading sessions.
Technical Analysis of FTSE 100 (UK) on January 23, 2025
_candlestick_with_ema_1_year.png)
The FTSE 100, with the stock symbol FTSE, witnessed a slight decline in its performance on January 23, 2025. The index closed at 8542.32, reflecting a percentage change of -0.033% and a points change of -2.78. This marginal decline indicates a stable yet slightly bearish sentiment in the market.
Technical Indicators:
The 50-day Exponential Moving Average (EMA) for FTSE 100 stands at 8311.80, while the 200-day EMA is at 8291.66. The current price is trading above both the 50 EMA and the 200 EMA, suggesting a bullish undertone in the long-term trend.
The Relative Strength Index (RSI) value is 71.34, which typically indicates an overbought condition. This high RSI reading could suggest potential exhaustion in the buying momentum.
The Moving Average Convergence Divergence (MACD) is recorded at 73.91, with the MACD Signal line at 41.20. The MACD being significantly higher than the Signal line reflects a strong bullish momentum in the market.
Market Sentiment:
Analyzing the technical indicators, the market appears to be in an uptrend due to the price's position above the EMAs and the positive MACD. However, caution is advised due to the RSI being in the overbought territory, signaling potential overextension in buying pressure. The elevated MACD reinforces the bullish sentiment but traders should be wary of any reversals indicated by changes in the RSI and MACD alignment.
Stock Name:
_candlestick_with_ema_1_year.png)
Hang Seng Index (Hong Kong)
As of January 23, 2025, the Hang Seng Index (Hong Kong) saw some noticeable movements in its market parameters. The index recorded a % change of -0.3954% and a Points Change of -78.21 points. This suggests a slight downward trend in the market for the day.
Technical Indicators:
The technical indicators provide a crucial insight into the market's behavior:
- 50 EMA (Exponential Moving Average): 19,684.65
- 200 EMA: 19,723.08
The comparison of the 50 EMA with the 200 EMA shows that the 50 EMA is slightly below the 200 EMA. This can be a signal that the market is not enjoying strong upward momentum, and may suggest a weakening trend.
- RSI (Relative Strength Index): 51.45
A RSI reading around 51 indicates that the market is roughly at equilibrium between overbought and oversold conditions. It suggests that there is no extreme trend in either direction, and traders might expect some level of consolidation.
- MACD (Moving Average Convergence Divergence): -7.46
- MACD Signal Line: -66.57
The MACD still being negative indicates the presence of bearish sentiment; however, given that the MACD line is converging towards the signal line, there could be a potential reversal or reduction in bearish momentum.
Market Sentiment:
Evaluating the performance of the Hang Seng Index (Hong Kong) using these technical indicators reveals a broadly neutral to slightly bearish sentiment. Despite the absence of a strong upward trend (as seen with the 50 EMA being under the 200 EMA), the RSI close to the midpoint and the MACD approaching the signal line signal lack of strong bearish pressure. Therefore, the market may be in a consolidation phase with potential for reversal. RSI and MACD are aligned in showing that the market trend is cautious, allowing traders to look for signs of possible bullish reversals if the market sentiment improves.
Technical Analysis for IBEX 35 (Spain) on January 23, 2025
_candlestick_with_ema_1_year.png)
The IBEX 35, Spain's benchmark stock index, witnessed a noteworthy performance today, moving up by 0.45%, equivalent to a points change of 53.90, closing at 11936.60. This positive movement is a highlight for investors keeping tabs on the European market indices.
Technical Indicators:
The assessment of the IBEX 35's trend relies on several key technical indicators:
50 EMA and 200 EMA: The 50-day Exponential Moving Average (EMA) stands at 11776.23, while the 200-day EMA is at 11765.62. Given that the current closing price is above both the 50 EMA and the 200 EMA, this suggests sustained bullish momentum, supporting an overall uptrend. This crossover indicates ongoing strength in the market.
RSI: The Relative Strength Index (RSI) is at 59.66. Typically, an RSI above 50 is viewed as a signal of market strength. Since this is comfortably placed below the overbought condition threshold of 70, it implies a potential for continued growth without immediate risk of reversal.
MACD: The Moving Average Convergence Divergence (MACD) reveals a figure of 54.51, with the MACD Signal line at 35.22. The positive MACD and its superiority over the Signal line confirm bullish sentiment, suggesting that upward momentum may persist in the near term.
Market Sentiment:
The technical indicators clearly depict a market that is experiencing an uptrend. Both the 50 EMA and the 200 EMA serve as notable support levels, reinforcing the prevailing bullish outlook. The RSI, not yet in overbought territory, indicates that there might still be room for further appreciation without an immediate correction. Meanwhile, the MACD's alignment above the signal line corroborates existing optimistic market perspectives.
To summarize, the current trend for the IBEX 35 (Spain) can be seen as positive based on its percentage change, points growth, and supportive technical indicators, including EMA, RSI, and MACD. This bullish outlook is likely to continue unless any contrasting market signals emerge.
Technical Analysis of NASDAQ Composite (US) - January 23, 2025
_candlestick_with_ema_1_year.png)
The NASDAQ Composite (US), represented by the Stock Name 'NASDAQ Composite (US)', closed on January 23, 2025, with a slight positive market shift. The index saw a % Change of 1.28%, indicating positive movement, and a Points Change of 252.56 points, closing at 20009.34 points, marking a notable gain from the previous close of 19756.78 points.
Technical Indicators:
The 50-day Exponential Moving Average (EMA) for NASDAQ Composite is noted at 19596.78, which is closely aligned with the current levels, indicating that the market is reflecting its average momentum over the past 50 days. The 200-day EMA stands at 19619.06, also suggesting that the index is hovering around its long-term average, showing neutral to slightly bullish sentiment. The Relative Strength Index (RSI) is positioned at 59.31, comfortably above the midpoint, pointing towards moderately bullish sentiment, indicating that the market is more in control of buyers than sellers but not yet overbought. The Moving Average Convergence Divergence (MACD) is at -4.73, with the MACD Signal line at -58.03, indicating a recent upward momentum as the MACD has crossed above its signal line, suggesting an ongoing recovery.
Market Sentiment:
The technical indicators collectively suggest that the NASDAQ Composite (US) is currently experiencing a slight uptrend. The proximity of the 50 EMA and 200 EMA to current price levels reflects a market potentially gearing up for further momentum. The RSI further indicates that the market is not overbought, providing room for continued upwards movement without triggering significant selling pressure. Additionally, the MACD's recent cross above the signal line corroborates an emerging uptrend by signifying the strengthening of the short-term market trend. Thus, the market sentiment based on these technical indicators suggests a cautiously optimistic outlook for the NASDAQ Composite (US).
Nifty 50 (India) Technical Analysis - January 23, 2025
_candlestick_with_ema_1_year.png)
The Nifty 50 (India) witnessed a slight movement as it closed at 23,205.35, reflecting a positive change of 0.22%. This was a gain of 50.0 points compared to the previous closing value of 23,155.35. Below is a detailed analysis based on the technical indicators for the Nifty 50 on this date.
Technical Indicators:
50 EMA: The 50-period Exponential Moving Average for Nifty 50 stood at 23,678.21. The current close is below the 50 EMA suggesting a bearish sentiment over this time frame.
200 EMA: The 200-period Exponential Moving Average is at 23,833.53. The index closing below the 200 EMA indicates a long-term bearish outlook, as it is a critical level watched by many traders.
RSI: The Relative Strength Index is currently at 39.98. An RSI below 50 indicates that the stock is in the bearish or sold territory, which aligns with the recent downtrend.
MACD: The Moving Average Convergence Divergence (MACD) is at -210.31, with a MACD Signal line of -201.35. A negative MACD, which is below its signal line, provides added confirmation of the bearish trend.
Market Sentiment:
Evaluating the performance of the Nifty 50 based on the technical indicators, it shows signs of a downtrend considering both the 50 EMA and 200 EMA are above the current price level. Additionally, the RSI under 50 confirms the weakness in momentum, indicating potential oversold conditions. The MACD further supports this by being negative and below the signal line, which can signal continued downward pressure.
In conclusion, based on the technical analysis of the Nifty 50 on January 23, 2025, the market appears to be in a downtrend. Both the RSI and MACD indicators were instrumental in identifying this bearish sentiment, highlighting caution for investors and traders.
Nikkei 225 (Japan) Technical Analysis - January 23, 2025
_candlestick_with_ema_1_year.png)
The Nikkei 225 (Japan) closed at 39,958.87, marking a percentage change of 0.79% and a points change of 312.62 points from the previous close of 39,646.25.
Technical Indicators:
The Exponential Moving Averages (EMAs) provide insight into the stock's trend over different time frames:
- 50 EMA: At 39,240.71, this is often used to gauge the intermediate trend of the index.
- 200 EMA: At 39,235.30, a significant long-term indicator suggesting the broader market trend.
The positioning of the 50 EMA above the 200 EMA typically denotes a bullish sentiment, indicating a potential uptrend in the market.
The Relative Strength Index (RSI) is at 60.09, which suggests a moderately bullish condition as it is above the neutral 50 level but below the overbought level of 70. This indicates potential for further gains before hitting overbought conditions.
The Moving Average Convergence Divergence (MACD) has a current value of -0.0567 with a signal line of -47.47. This implies a recent crossover which could be indicative of changing momentum, and it's near the zero line, suggesting the bearish pressure might be easing.
Market Sentiment:
Based on the technical indicators, the Nikkei 225 (Japan) appears to be experiencing an uptrend. The alignment of the 50 EMA above the 200 EMA, along with an RSI above 60, supports a bullish outlook. Although the MACD is slightly negative, it is close to the signal line and zero, suggesting potential for positive crossover soon. The overall market sentiment is cautiously optimistic, with technical indicators pointing towards continued strength in the index.
Technical Analysis for S&P 500 (US) on January 23, 2025
_candlestick_with_ema_1_year.png)
The S&P 500 (US) exhibited a positive performance today, with a percentage change of 0.61% and a points change of 37.13. This movement reflects the current market conditions and investor sentiment.
Technical Indicators:
50 EMA: The 50-day Exponential Moving Average (EMA) stands at 5,968.03, offering a mid-term indicator of the market's performance. A price above this level often suggests a bullish sentiment.
200 EMA: The 200 EMA is noted at 5,978.58, which serves as a long-term trend indicator. The current price exceeding this level further supports the bullish outlook, indicating that the S&P 500 may be in a sustained uptrend.
RSI: The Relative Strength Index (RSI) is currently valued at 61.51, which sits in the neutral to slightly overbought range. This suggests moderate buying pressure in the market without reaching excessively high levels.
MACD: The Moving Average Convergence Divergence (MACD) shows a value of 5.50, with a signal line at -15.34. As the MACD is above the signal line, this could be indicative of further bullish momentum for the S&P 500.
Market Sentiment:
The overall market sentiment for the S&P 500 is leaning towards an uptrend based on the current analysis of technical indicators. The price surpassing both the 50 EMA and 200 EMA points to bullish momentum, showing that the market might continue to trend upwards. The RSI, lying above 50 yet below overbought levels, suggests some room for further upward movement. Moreover, the MACD crossing above its signal line corroborates the optimistic outlook, hinting at possible continued price gains.
In summary, the current technical indicators depict a favorable environment for the S&P 500 (US), with potential for sustained upward movement as long as these bullish signals remain strong.
Up Next
Global stock market indices: How the world markets performed today - 23 January 2025

Rupee breaches 91-mark against US dollar for first time in intra-day trade

Microsoft commits USD 17.5 billion investment in India: CEO Satya Nadella

CBI books Anil Ambani's son, Reliance Home Finance Ltd. in Rs 228 crore bank fraud case

RBI raises FY26 GDP growth projection to 7.3 pc

RBI trims policy interest rate by 25bps to 5.25pc, loans to get cheaper

More videos

Rupee slumps to all-time low of 90.25 against US dollar in intra-day trade

Reliance completes merger of Star Television Productions with Jiostar

India to lead emerging market growth with 7pc GDP rise in 2025: Moody’s

Nifty hits record high after 14 months; Sensex nears all-time peak

Reliance stops Russian oil use at its only-for-export refinery to comply with EU sanctions

ED attaches fresh assets worth over Rs 1,400 cr in case against Anil Ambani's Reliance Group

India signs one-year deal to import 2.2 million tonnes of LPG from US

India International Trade Fair begins at Pragati Maidan amid tight security

Stock markets decline in initial trade on foreign fund outflows, weak Asian peers

Amazon to lay off 30,000 office workers amid AI-driven cost cuts