


Highlights
- Market showed mixed indications with resilience in European sectors
- Challenges in tech-heavy indices like NASDAQ
- CAC 40 remains above key EMAs, signaling upward momentum
Latest news

Haier Launches HQLED P7 Pro Series TVs With Google Gemini, 50W Audio And AI Picture Enhancements

Nothing's Latest Pokémon Teasers Hint At New Hardware, RCB Collaboration May Also Be In The Works

OnePlus N6 Set To Debut With Massive 8,000mAh Battery And Long-Term Performance Focus

Roblox Introduces Age-Based Accounts for Younger Users, Expands Parental Controls Globally

IIFL Capital Launches Algo Marketplace with Over 100 Ready-Made Strategies

LUMIQ Raises INR 50 Crore Pre-Series B to Become the AI Decision Layer for Financial Services

Tay Keith, producer behind Travis Scott's 'Sicko Mode' dies at 29

GenAI could lift realty sales velocity by up to 50%, speed up launches by 30%: Report
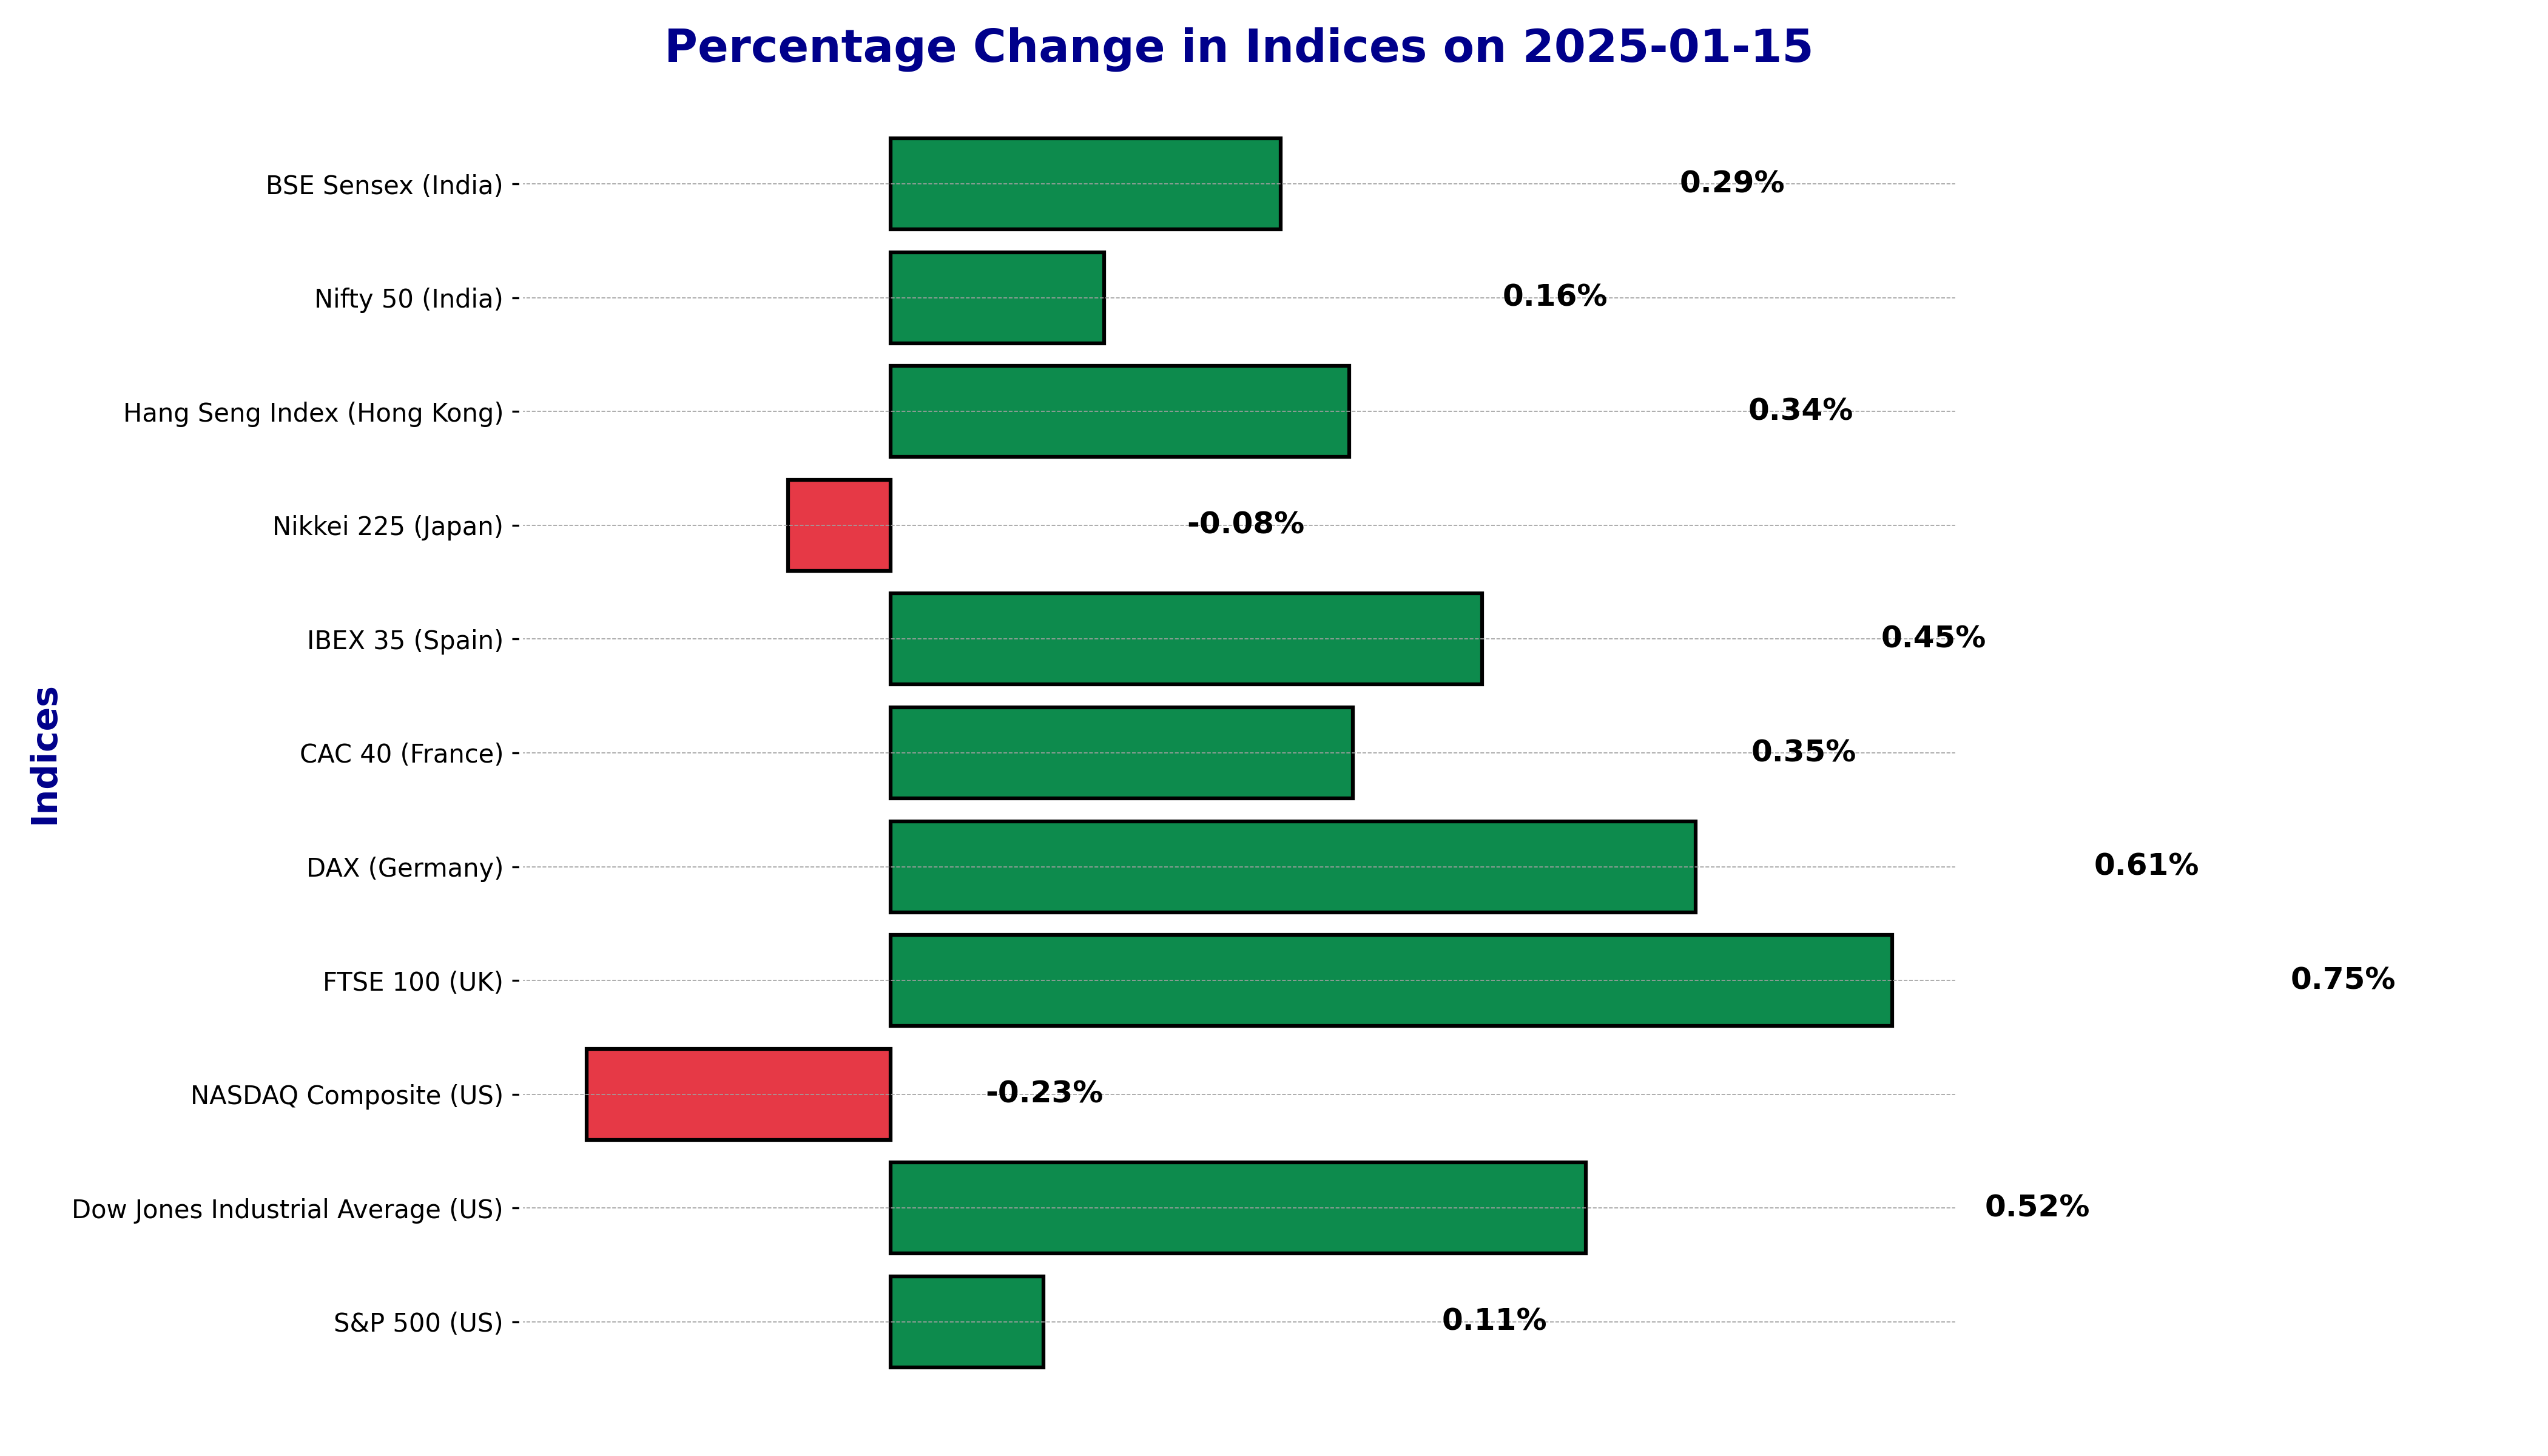
Global Stock Market Indices Performance Today - January 15, 2025


The international stock market indices showed varied performances on January 15, 2025, reflecting the economic sentiment across different regions.
In this article, we analyze the performance of key global indices including the S&P 500, Dow Jones Industrial Average, NASDAQ Composite, FTSE 100, DAX, CAC 40, IBEX 35, Nikkei 225, Hang Seng, Nifty 50, and BSE Sensex.
Technical Analysis of BSE Sensex (India) as of January 15, 2025
_candlestick_with_ema_1_year.png)
The BSE Sensex, India's leading stock market index, witnessed a noticeable fluctuation in its price action as of January 15, 2025. The index closed at 76,724.08 points, marking a percentage change of 0.29% with an upward points change of 224.45 from the previous close of 76,499.63 points.
Technical Indicators Analysis
The technical indicators present a mixed outlook for the BSE Sensex:
- 50 EMA: The 50-day Exponential Moving Average (EMA) is at 78,887.60. The current close is below the 50 EMA, indicating a potential bearish sentiment or a correction phase in the market.
- 200 EMA: The 200-day EMA stands at 79,267.66. The current close being below the longer-term EMA suggests an overall bearish market trend when considering a broader market time frame.
- RSI: The Relative Strength Index (RSI) is at 36.24, which is below the neutral 50 mark. An RSI below 40 often suggests that the market is in oversold territory, which could indicate a potential buying opportunity unless the RSI continues to indicate bearish momentum.
- MACD: The Moving Average Convergence Divergence (MACD) is at -769.33, with the MACD Signal line at -592.47. A negative MACD value below the signal line is typically bearish, suggesting the market may be in a downtrend. This formation reinforces the bearish sentiment indicated by other indicators.
Market Sentiment Evaluation
The current technical analysis suggests that the BSE Sensex is experiencing a downtrend. The RSI underlines this sentiment, with a reading below the mid-point level of 50, indicating the lack of bullish strength and possibly an oversold condition. Meanwhile, the negative divergence in the MACD, being below both zero and its signal line, reinforces the bearish outlook. Together, these indicators imply that the BSE Sensex might continue to face bearish pressure unless future data suggests a reversal or a solid support level is found. Investors should be cautious, monitoring these indicators closely for any signs of trend reversals.
CAC 40 (France) Technical Analysis - January 15, 2025
_candlestick_with_ema_1_year.png)
The CAC 40 index, representing the top publicly listed companies in France, saw a % Change of 0.35% on January 15, 2025. The index closed at 7449.46, marking a Points Change of 25.79 from its previous close of 7423.67.
Technical Indicators:
The 50-day Exponential Moving Average (EMA) for CAC 40 is noted at 7368.72, indicating a positive trend as the index's current price is above this level. The 200-day EMA is at 7350.11, reinforcing the longer-term bullish momentum as the current closing price is also above this threshold. These EMAs suggest sustained market confidence in the index's upward trajectory.
The Relative Strength Index (RSI) is at 56.92. RSI values between 50 and 70 usually indicate a somewhat bullish sentiment, but not yet in the overbought territory, suggesting potential for further price increases without immediate risk of a reversal solely based on RSI.
Regarding the MACD (Moving Average Convergence Divergence), the current MACD line is at 27.86, while the MACD Signal line is at 23.41. This positive difference between the MACD and its Signal line is indicative of a bullish signal, as the MACD remains in positive territory, which correlates with continued upward momentum in the index price.
Market Sentiment:
The market sentiment for the CAC 40 on January 15, 2025, can be characterized as upbeat, considering the positive movement is observed through key technical indicators. The current uptrend is validated by the price maintaining above both the 50 EMA and 200 EMA. The RSI level shows a neutral to slightly bullish attitude, suggesting room for the market to climb higher without straying into overbought conditions. Meanwhile, the MACD divergence above its Signal line enhances the prospect of an ongoing bullish trend. In summary, the confluence of these indicators suggests that the CAC 40 is in an uptrend, bolstered by stable sentiment and technical strength.
Technical Analysis of DAX (Germany) on January 15, 2025
_candlestick_with_ema_1_year.png)
The DAX (Germany) has witnessed a noteworthy session today, marking a significant move in its daily performance. The index closed at 20,394.04, realizing a percentage change of 0.61%. This corresponds to a points change of 122.71, highlighting a positive trend in the daily trading activity.
Technical Indicators Evaluation
The 50-day Exponential Moving Average (EMA) for DAX (Germany) stands at 20,103.48. This indicator is often used to judge the medium-term trend and, here, it clearly shows that the current market price is above this level, suggesting upward momentum in the index.
Meanwhile, the 200-day EMA is observed at 20,047.02, providing a long-term perspective on the market. Similar to the 50-day EMA, the price is trading above this EMA, reinforcing a bullish undertone in the market trend over a longer horizon.
The Relative Strength Index (RSI) is computed to be 62.93. The RSI is a momentum oscillator that helps identify overbought or oversold conditions. Values above 70 typically denote an overbought condition, and values below 30 indicate an oversold condition. With the current RSI slightly above 60, it's evident that the market sentiment for DAX (Germany) is leaning towards the bullish side, but still in a healthy range indicating upward momentum without being overheated.
The Moving Average Convergence Divergence (MACD) is measured at 62.14 with a MACD Signal line at 47.80. The MACD is a trend-following momentum indicator, and a MACD higher than the signal line is a typical bullish sign. The difference between the MACD and its signal line indicates that there is a robust bullish momentum sustaining the current uptrend of the DAX (Germany).
Market Sentiment Analysis
Overall, the performance of the DAX (Germany) based on today's technical indicators suggests the market is in an uptrend. The presence of the price above both the 50 EMA and the 200 EMA affirms the robustness of this upward trajectory. The RSI and MACD both play pivotal roles in identifying the market trend. The RSI, being comfortably positioned, mirrors a market that has vigor but isn't overly euphoric, suggesting that investors may anticipate further gains in the short term. The MACD further consolidates this bullish sentiment by staying above the signal line, suggesting that momentum remains positive.
Technical Analysis for Dow Jones Industrial Average (US) on January 15, 2025
_candlestick_with_ema_1_year.png)
The Dow Jones Industrial Average (US) showed a 0.52% change with a points change of 221.16 on January 15, 2025. This movement has numerous implications based on the underlying technical indicators.
Technical Indicators Discussion:
50 EMA: The 50-day Exponential Moving Average (EMA) stands at 43,204.58. When compared to the current close of 42,518.28, the index trades below its 50 EMA, suggesting a bearish short-to-mid-term trend.
200 EMA: The longer-term 200-day EMA is positioned at 43,453.65. With the index also trading below this level, it reinforces the bearish sentiment. Typically, trading below the 200 EMA is seen as a signal of potential prolonged downward pressure.
RSI: At a level of 41.70, the Relative Strength Index (RSI) is below the neutral midpoint of 50. This suggests that the index is neither oversold nor overbought, but rather leaning towards the lower spectrum, indicating prevailing selling pressure.
MACD: The Moving Average Convergence Divergence (MACD) sits at -344.94, slightly below its signal line of -341.84. This crossover indicates a bearish sentiment, as the MACD falling below its signal line is typically a precursor to downward pressure.
Market Sentiment and Trend Evaluation:
The technical indicators suggest that the Dow Jones Industrial Average is currently in a downtrend. Both the 50 EMA and 200 EMA are above the closing price, while the RSI's value below 50 highlights a weakening momentum. Additionally, the MACD being slightly below its signal line confirms the bearish outlook. Traders often use the RSI and MACD together to confirm the bearish trend, as they both indicate weakening momentum and potential for further declines.
FTSE 100 (UK) Technical Analysis on January 15, 2025
_candlestick_with_ema_1_year.png)
Stock Name: FTSE 100 (UK)
Percentage Change: 0.75%
Points Change: 61.78
The FTSE 100 (UK) demonstrated a noticeable performance on January 15, 2025, with a percentage change of 0.75%, resulting in a points increase of 61.78. This bullish movement can be analyzed through various technical indicators.
Technical Indicators:
The 50-Day Exponential Moving Average (EMA) of 8235.10 indicates a slightly positive market momentum, closely aligned with the 20 EMA and 10 EMA, which suggests short to medium-term bullishness.
The 200-Day EMA stands at 8241.59, above the current close, indicating a longer-term trend that is still upward but with less intensity compared to the short-term movements. This could hint at potential resistance near the 200 EMA level.
The Relative Strength Index (RSI) is at 54.12, which suggests that the market is neither overbought nor oversold, thereby indicating a neutral stance in terms of market sentiment.
The MACD (Moving Average Convergence Divergence) is at 2.35, with a MACD Signal line at -4.60, which implies a bullish crossover has recently occurred. This is often interpreted as a potential buying signal.
Market Sentiment:
The overall performance of the FTSE 100 (UK), as analyzed through these technical indicators, suggests that the market was in an uptrend on January 15, 2025.
The RSI being above 50 supports this bullish sentiment, indicating stronger buying pressure without reaching overbought conditions. The positive MACD value and the crossing over the MACD Signal line further reinforce an optimistic market trend, signaling increased momentum in the upward direction.
In summary, the technical indicators reflect a robust performance for the FTSE 100 (UK), implying an uptrend based on the EMA crossovers, neutral RSI, and a positive MACD trend, suggesting favorable market conditions for investors.
Analysis Date:
_candlestick_with_ema_1_year.png)
January 15, 2025
Stock Name: Hang Seng Index (Hong Kong)
On January 15, 2025, the Hang Seng Index (Hong Kong) experienced a positive trading session. The index recorded a % change of 0.34%, reflecting an increase of points change 66.29 points from the previous close to settle at 19286.07.
Technical Indicators:
1. 50 EMA: The 50-day Exponential Moving Average (EMA) is at 19626.34, indicating that the index is trading below this level, which may imply a bearish outlook in the medium term.
2. 200 EMA: The 200-day EMA stands at 19662.21, which is also above the current closing price. Traditionally, trading below the 200-day EMA suggests a prevailing long-term downtrend.
3. RSI: The Relative Strength Index (RSI) is at 43.05. An RSI value below 50 typically signifies a bearish sentiment, suggesting the market is showing less buying strength.
4. MACD: The Moving Average Convergence Divergence (MACD) is calculated at -166.95 with the signal line at -99.52. The negative value of the MACD below the signal line reaffirms the bearish sentiment in the market.
Market Sentiment:
The technical indicators for the Hang Seng Index (Hong Kong) collectively suggest a bearish sentiment. The index is currently in a downtrend, as evidenced by the price trading below both the 50 EMA and the 200 EMA. Additionally, the RSI value below 50 indicates that the momentum is not supportive of a strong upside move, remaining in bearish territory.
The MACD further substantiates this sentiment with its negative value, signaling that the momentum is lagging. This indicator, combined with others, helps identify the market trend as downward.
Technical Analysis for IBEX 35 (Spain) on January 15, 2025
_candlestick_with_ema_1_year.png)
On January 15, 2025, the IBEX 35 (Spain) demonstrated a favorable movement with a percentage change of 0.45% and a points change of 52.30. This reflects a position of growth and a generally positive sentiment among investors in the market.
Technical Indicators:
The 50 EMA (Exponential Moving Average) for the IBEX 35 stands at 11,713.13, whereas the 200 EMA is slightly higher at 11,715.51. This close proximity between the 50 EMA and the 200 EMA suggests a narrowly focused support line around this range, which traders often monitor for potential indicative shifts in trend.
The Relative Strength Index (RSI), a popular momentum oscillator, is registered at 55.87. Typically, an RSI reading above 50 is viewed as a sign of strength, indicating that the IBEX 35 is currently not in the overbought or oversold territory, but skewed towards a bullish sentiment. The MACD, another vital momentum indicator, shows a positive value of 19.30 with a MACD Signal of 2.17. Such a spread between the MACD and its signal line frequently points towards an upward momentum in price.
Market Sentiment:
The technical indicators for the IBEX 35 suggest a market in an uptrend, illustrative of strengthening investor confidence and a preference for buying. The RSI, being above 50, is a supporting indicator of bullish momentum, reinforcing the notion that the market is steering towards positive performance. Meanwhile, a positive MACD establishes that the short-term momentum is gaining over the long-term, a condition that generally favors continued upward trends. Together, these indicators form a coherent picture of growth potential that could suggest promising returns for stakeholders in the IBEX 35.
Investors might watch for further increases in the RSI towards 70, as reaching closer to that level could indicate a stronger potential for continued growth but also caution towards an overbought condition. Similarly, a diverging MACD from its signal would highlight sustained and potentially accelerating positive momentum, driving anticipation for continued gains in the market.
Stock Name: NASDAQ Composite (US)
_candlestick_with_ema_1_year.png)
On January 15, 2025, the NASDAQ Composite closed at 19,044.39, reflecting a decrease of 43.71 points, which is approximately a -0.23% change from its previous close of 19,088.10.
Technical Indicators
The NASDAQ Composite's current performance offers critical insights through various technical indicators:
50 EMA: The 50-day Exponential Moving Average stands at 19,538.83, which is above the current closing price of 19,044.39. This suggests that the market might be experiencing a bearish phase in the short to mid-term.
200 EMA: The 200-day EMA is at 19,544.19, also above the closing price. A price below the 200 EMA often signals a downtrend in the long-term perspective.
RSI: The Relative Strength Index is at 40.00, which is below the neutral mark of 50. This indicates that the market is leaning towards the oversold territory, but not excessively so. A rising RSI from this level could hint at a potential reversal.
MACD: The Moving Average Convergence Divergence (MACD) is -107.57, with a MACD Signal of -38.50. Both values being negative highlight bearish momentum in the market. The MACD being lower than its signal line further supports the downtrend outlook.
Market Sentiment: Based on the analysis of these technical indicators, the NASDAQ Composite appears to be in a downtrend. The closing price remaining under both 50 and 200 EMA, along with a negative MACD, outlines a continuation of bearish sentiment. The RSI value close to 40, however, indicates a potential oversold market condition, suggesting that investors should watch for signs of a reversal. The combination of MACD and RSI signifies current market weakness, but close monitoring of these indicators may reveal opportunities as the trend develops.
Technical Analysis of Nifty 50 (India) on January 15, 2025
_candlestick_with_ema_1_year.png)
The "Nifty 50 (India)" saw a percentage change of 0.16% today, with a points increase of 37.15. This performance highlights the stock's slight upward movement from the previous close.
Technical Indicators Overview:
The 50-day Exponential Moving Average (EMA) is currently at 23,863.44, while the 200-day EMA stands at 23,972.58. The position of the shorter-term 50 EMA below the longer-term 200 EMA may indicate a potential downtrend, signaling that the recent price action is weaker than the long-term trend.
The Relative Strength Index (RSI) is at 36.50, a reading typically indicating that the stock is near the oversold territory. This suggests that the stock may be undervalued and could potentially see a bounce back if other conditions favor a reversal.
The Moving Average Convergence Divergence (MACD) is recorded at -222.07, with its Signal Line at -167.54. The negative MACD indicates that the downside momentum is strong as the MACD line is below the Signal line.
Market Sentiment:
Based on the evaluated technical indicators, it appears that the Nifty 50 is experiencing a downtrend. The 50 EMA being lower than the 200 EMA supports this view, while the RSI near the oversold level suggests caution as the market may be nearing a potential reversal point. The MACD's position further confirms this bearish sentiment, highlighting a dominant bearish momentum. Investors should keep an eye on these indicators, especially the RSI, as a movement back towards 50 could signify strengthening bullish activity.
Technical Analysis of Nikkei 225 (Japan) on January 15, 2025
_candlestick_with_ema_1_year.png)
The Nikkei 225 index, representing Japan's stock market performance, saw a slight decline on January 15, 2025. With a percentage change of -0.08%, the index decreased by 29.72 points, closing at 38,444.58 from the previous close of 38,474.30.
Technical Indicators:
Examining the Exponential Moving Averages (EMAs) provides insights into the market trend. The 50-day EMA stands at 39,200.86, while the 200-day EMA is slightly lower at 39,130.59. Such a configuration, where the 50 EMA is above the 200 EMA, might usually suggest a potential uptrend. However, this must be analyzed in conjunction with other indicators for a comprehensive understanding.
The Relative Strength Index (RSI) is currently at 41.36. Since the RSI is below the 50-level mark, it indicates a bearish sentiment prevailing in the market. Values below 30 are typically considered oversold, and values above 70 are considered overbought.
The Moving Average Convergence Divergence (MACD) indicator stands at -22.79, with the MACD Signal line at 97.90. The negative MACD signifies bearish momentum, and being below the signal line further confirms the downtrend.
Market Sentiment:
Based on the technical indicators, the Nikkei 225 appears to be in a downtrend. The RSI suggests the market is neither oversold nor overheated, indicating room for further downward movement. The MACD's position below the signal line reinforces the bearish sentiment. Overall, these combined indicators reflect a cautious market sentiment towards the Nikkei 225 at this time. Investors should consider these technical analyses when evaluating their investment decisions in the Japanese market.
S&P 500 (US) - Technical Analysis for January 15, 2025
_candlestick_with_ema_1_year.png)
On January 15, 2025, the S&P 500 (US) recorded a percentage change of 0.1146%, with a points change of 6.69. This movement presents an interesting scenario for technical analysts examining the intricacies of market trends and influences.
Technical Indicators
50 EMA and 200 EMA: The 50-day Exponential Moving Average (EMA) stands at 5957.90, while the 200-day EMA is positioned at 5974.90. The current trade stands below both these EMAs, suggesting a prevailing bearish sentiment as the price is not maintaining above these commonly observed support levels. This scenario can indicate potential resistance levels and a possible downtrend.
Relative Strength Index (RSI): The RSI is valued at 39.52. Typically, an RSI below 50 is seen as an indication of bearish momentum. Given that the value is closer to the oversold boundary of 30 than to the neutral midpoint of 50, there might be a likelihood of continued pressure on prices, although it also suggests potential for near-term bounces as buyers seek value.
MACD: The Moving Average Convergence Divergence (MACD) indicator reads -36.61, with a signal line at -26.82. The negative MACD value, coupled with it being lower than the MACD signal, aligns with bearish signals, suggesting a continuation of the downward trend and waning upward momentum.
Market Sentiment
The overall sentiment for the S&P 500, based on these technical indicators, seems to lean towards a cautious or bearish outlook. The persistence of values below key EMAs reflects a market that might be in a corrective phase or downtrend. Meanwhile, the RSI indicates potential overselling pressures but not quite at extreme levels yet. The MACD also confirms a bearish outlook with negative divergence. Hence, the S&P 500 is likely reflecting a broader market sentiment that suggests brief rallies may encounter seller resistance unless these technicals begin to show signs of positive convergence and momentum shifts upward.
Up Next
Global Stock Market Indices Performance Today - January 15, 2025

Honda Activa 6G: Everything You Need to Know Before Buying

How much does a ULIP plan really cost? A break-down of all charges

Centre plans to borrow Rs 8.20 lakh cr from market in first half of FY27

Reliance denies buying Iranian oil amid US sanctions waiver

Premium petrol price up Rs 2, industrial diesel up Rs 22; no change in normal petrol, diesel rates

More videos

India's GDP expected to register over 8 pc growth in Sep-Dec: Report

Govt announces seven measures to help boost exports

RBI keeps interest rates on hold after US trade deal boosts outlook

RBI proposes to compensate customers up to Rs 25,000 loss due to fraud

RBI raises GDP growth projection of Q1, Q2 of FY27

RBI pauses rate cuts, retains interest rate at 5.25 pc

Rupee jumps 122 paise to close at 90.27 against US dollar on India-US trade deal

Stock markets cheer India-US trade deal: Sensex, Nifty surge 2.5 pc

UPI transactions hit record high of Rs 230 lakh crore in 2025-26 till Dec: Govt

Explained: India-US trade deal, tariffs and trade benefits