


Highlights
- DAX shows strong bullish momentum with a high RSI
- CAC 40 trades above key moving averages, signaling strength
- FTSE 100's neutral RSI suggests cautious market sentiment
Latest news

Samsung's Bespoke AI ACs Focus on Humidity, Hygiene and Smarter Cooling

Samsung CEO Says Next Galaxy Foldables Will Be Thinner, Lighter and Smarter

Dell Launches New Pro Precision AI Workstations In India, Introduces Deskside Agentic AI Platform

Oppo Enco Air5 Review: Incredible Value at ₹3,099

Samsung Galaxy A27 5G Goes On Sale In India With Cashback Offers, Zero Down Payment Schemes
 First Impressions: A Strong Debut For The New 'b' Series")
Nothing Phone (4b) First Impressions: A Strong Debut For The New 'b' Series

Samsung Galaxy A27 Review: A Dependable Mid-Ranger With Few Surprises

Union Finance Minister Nirmala Sitharaman Inaugurates Muzhiyan Kulam, Restored by Lumina Datamatics and Community Stakeholders in Puducherry
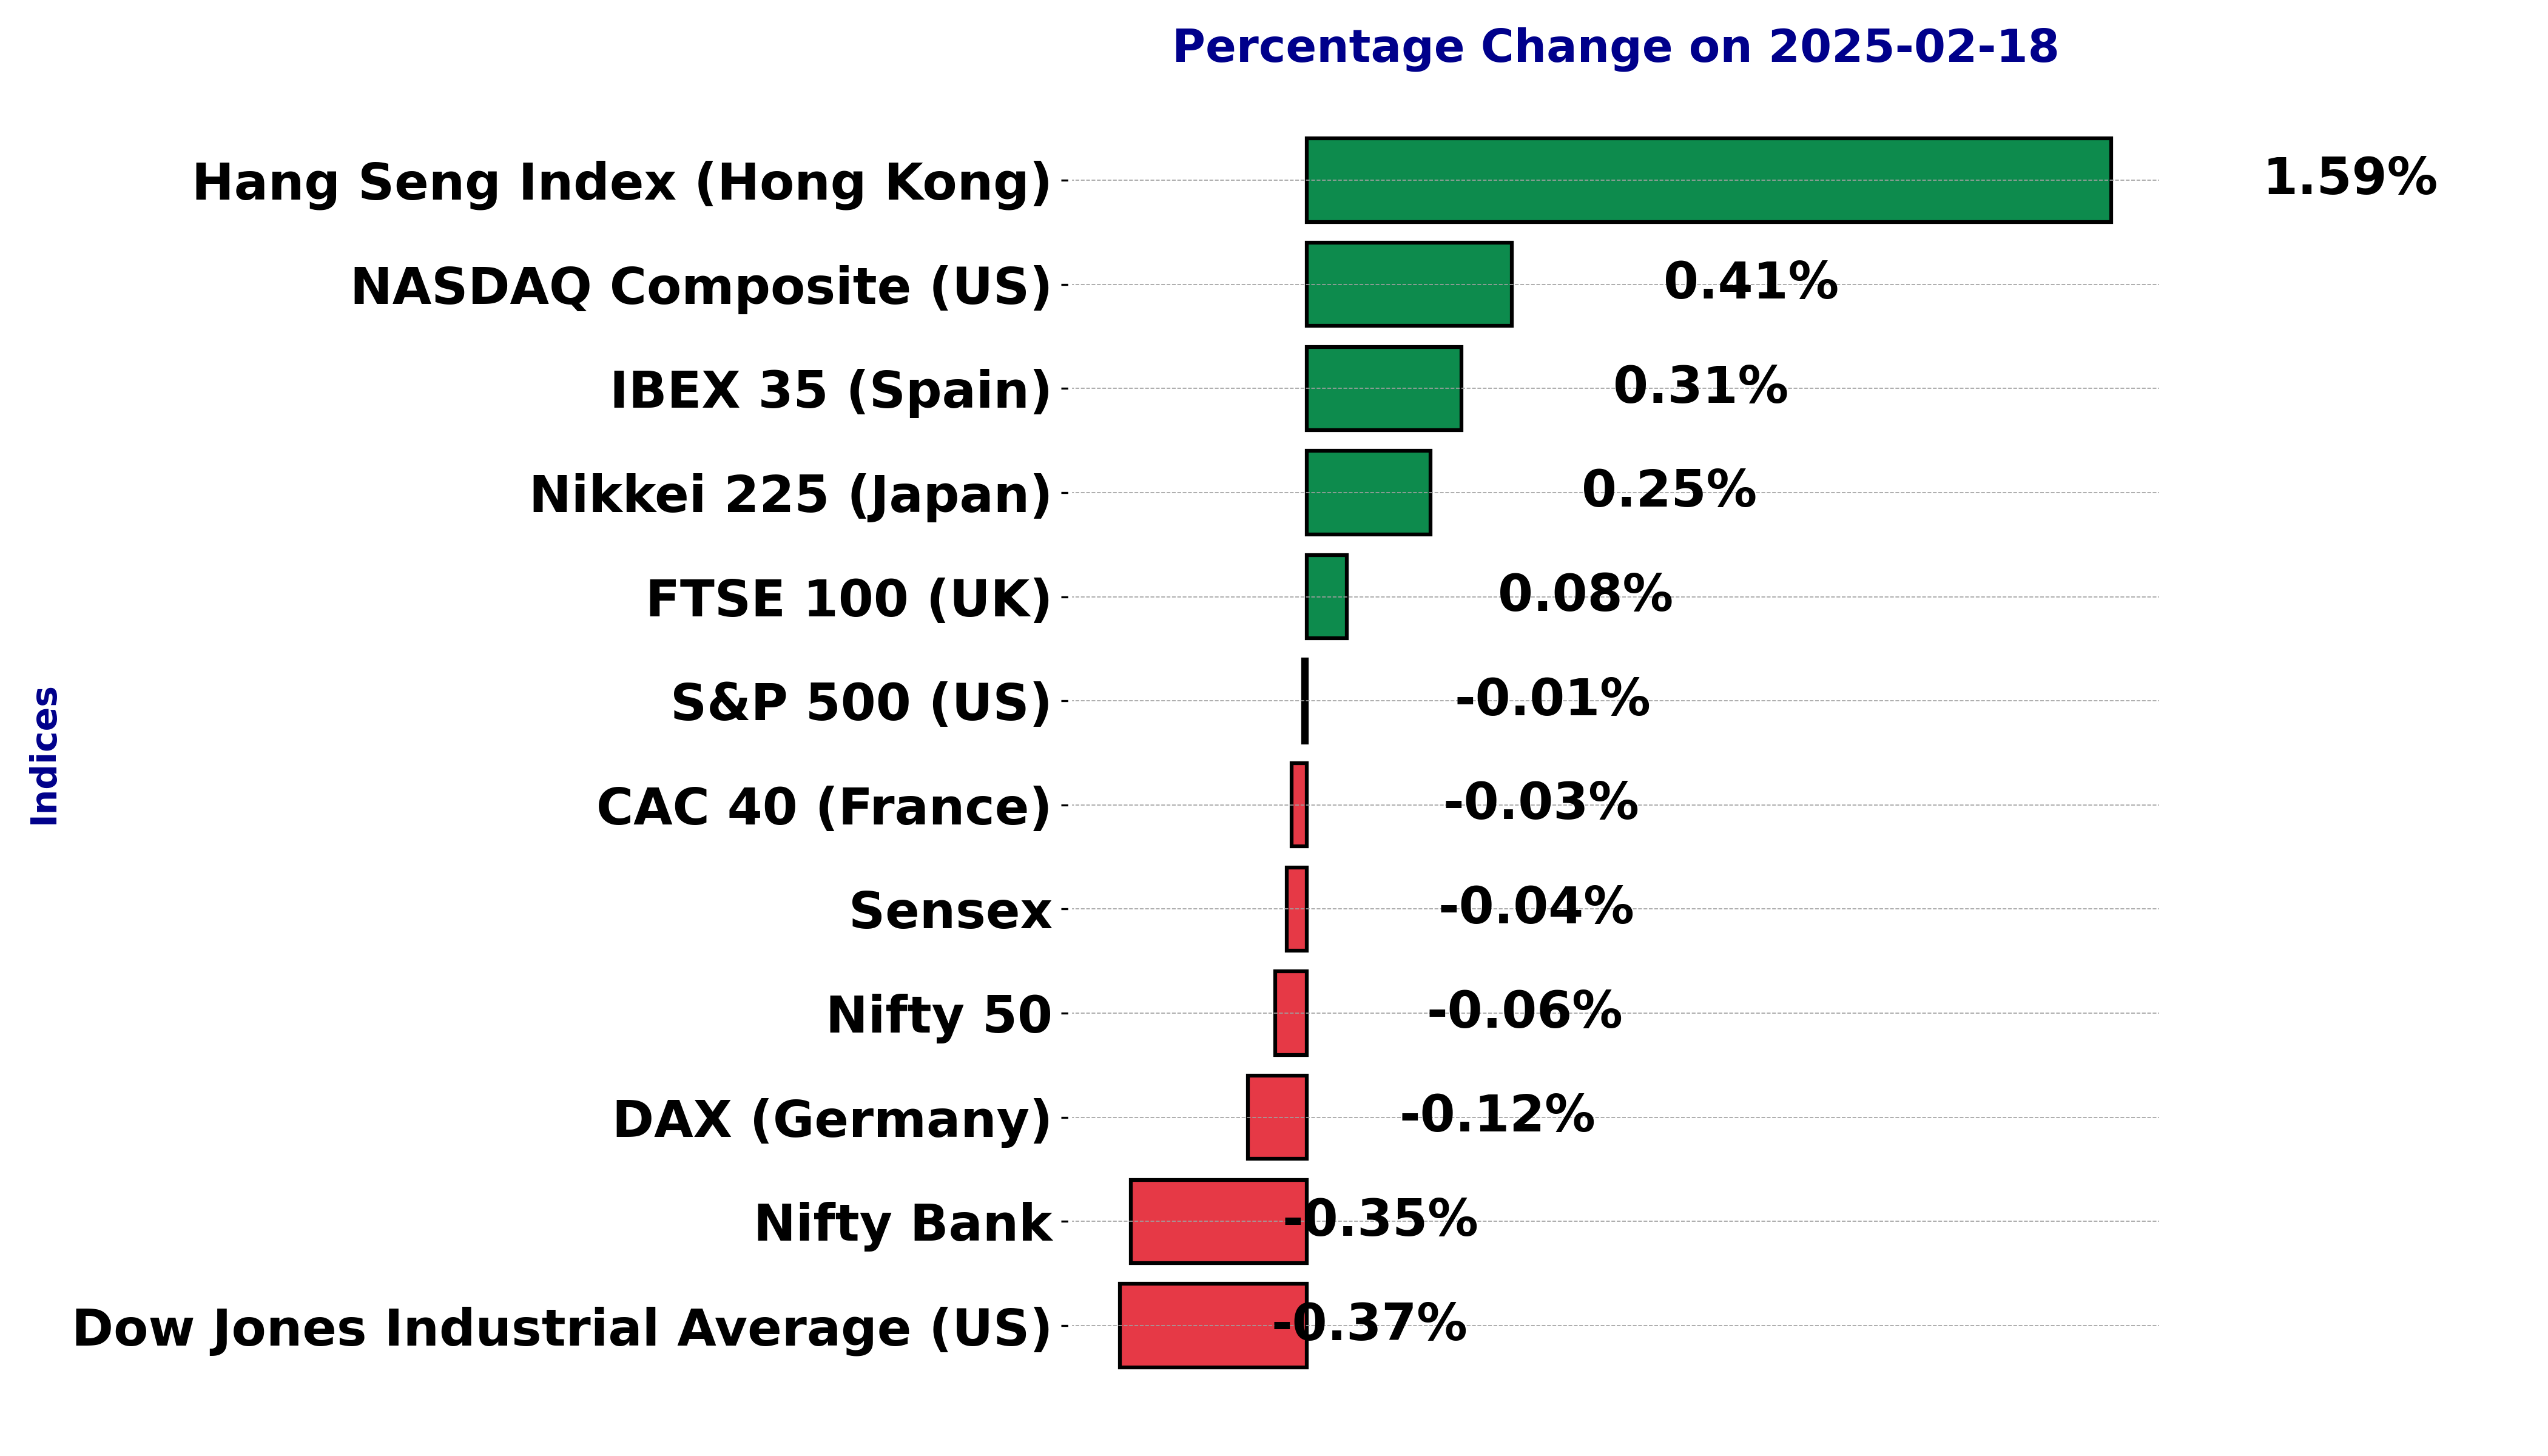
Global stock market indices: How the world markets performed today - 18 February 2025


The international stock market indices showed varied performances on February 18, 2025, reflecting the economic sentiment across different regions.
In this article, we analyze the performance of key global indices including the S&P 500, Dow Jones Industrial Average, NASDAQ Composite, FTSE 100, DAX, CAC 40, IBEX 35, Nikkei 225, Hang Seng, Nifty 50, and BSE Sensex.
Analysis for Sensex - February 18, 2025
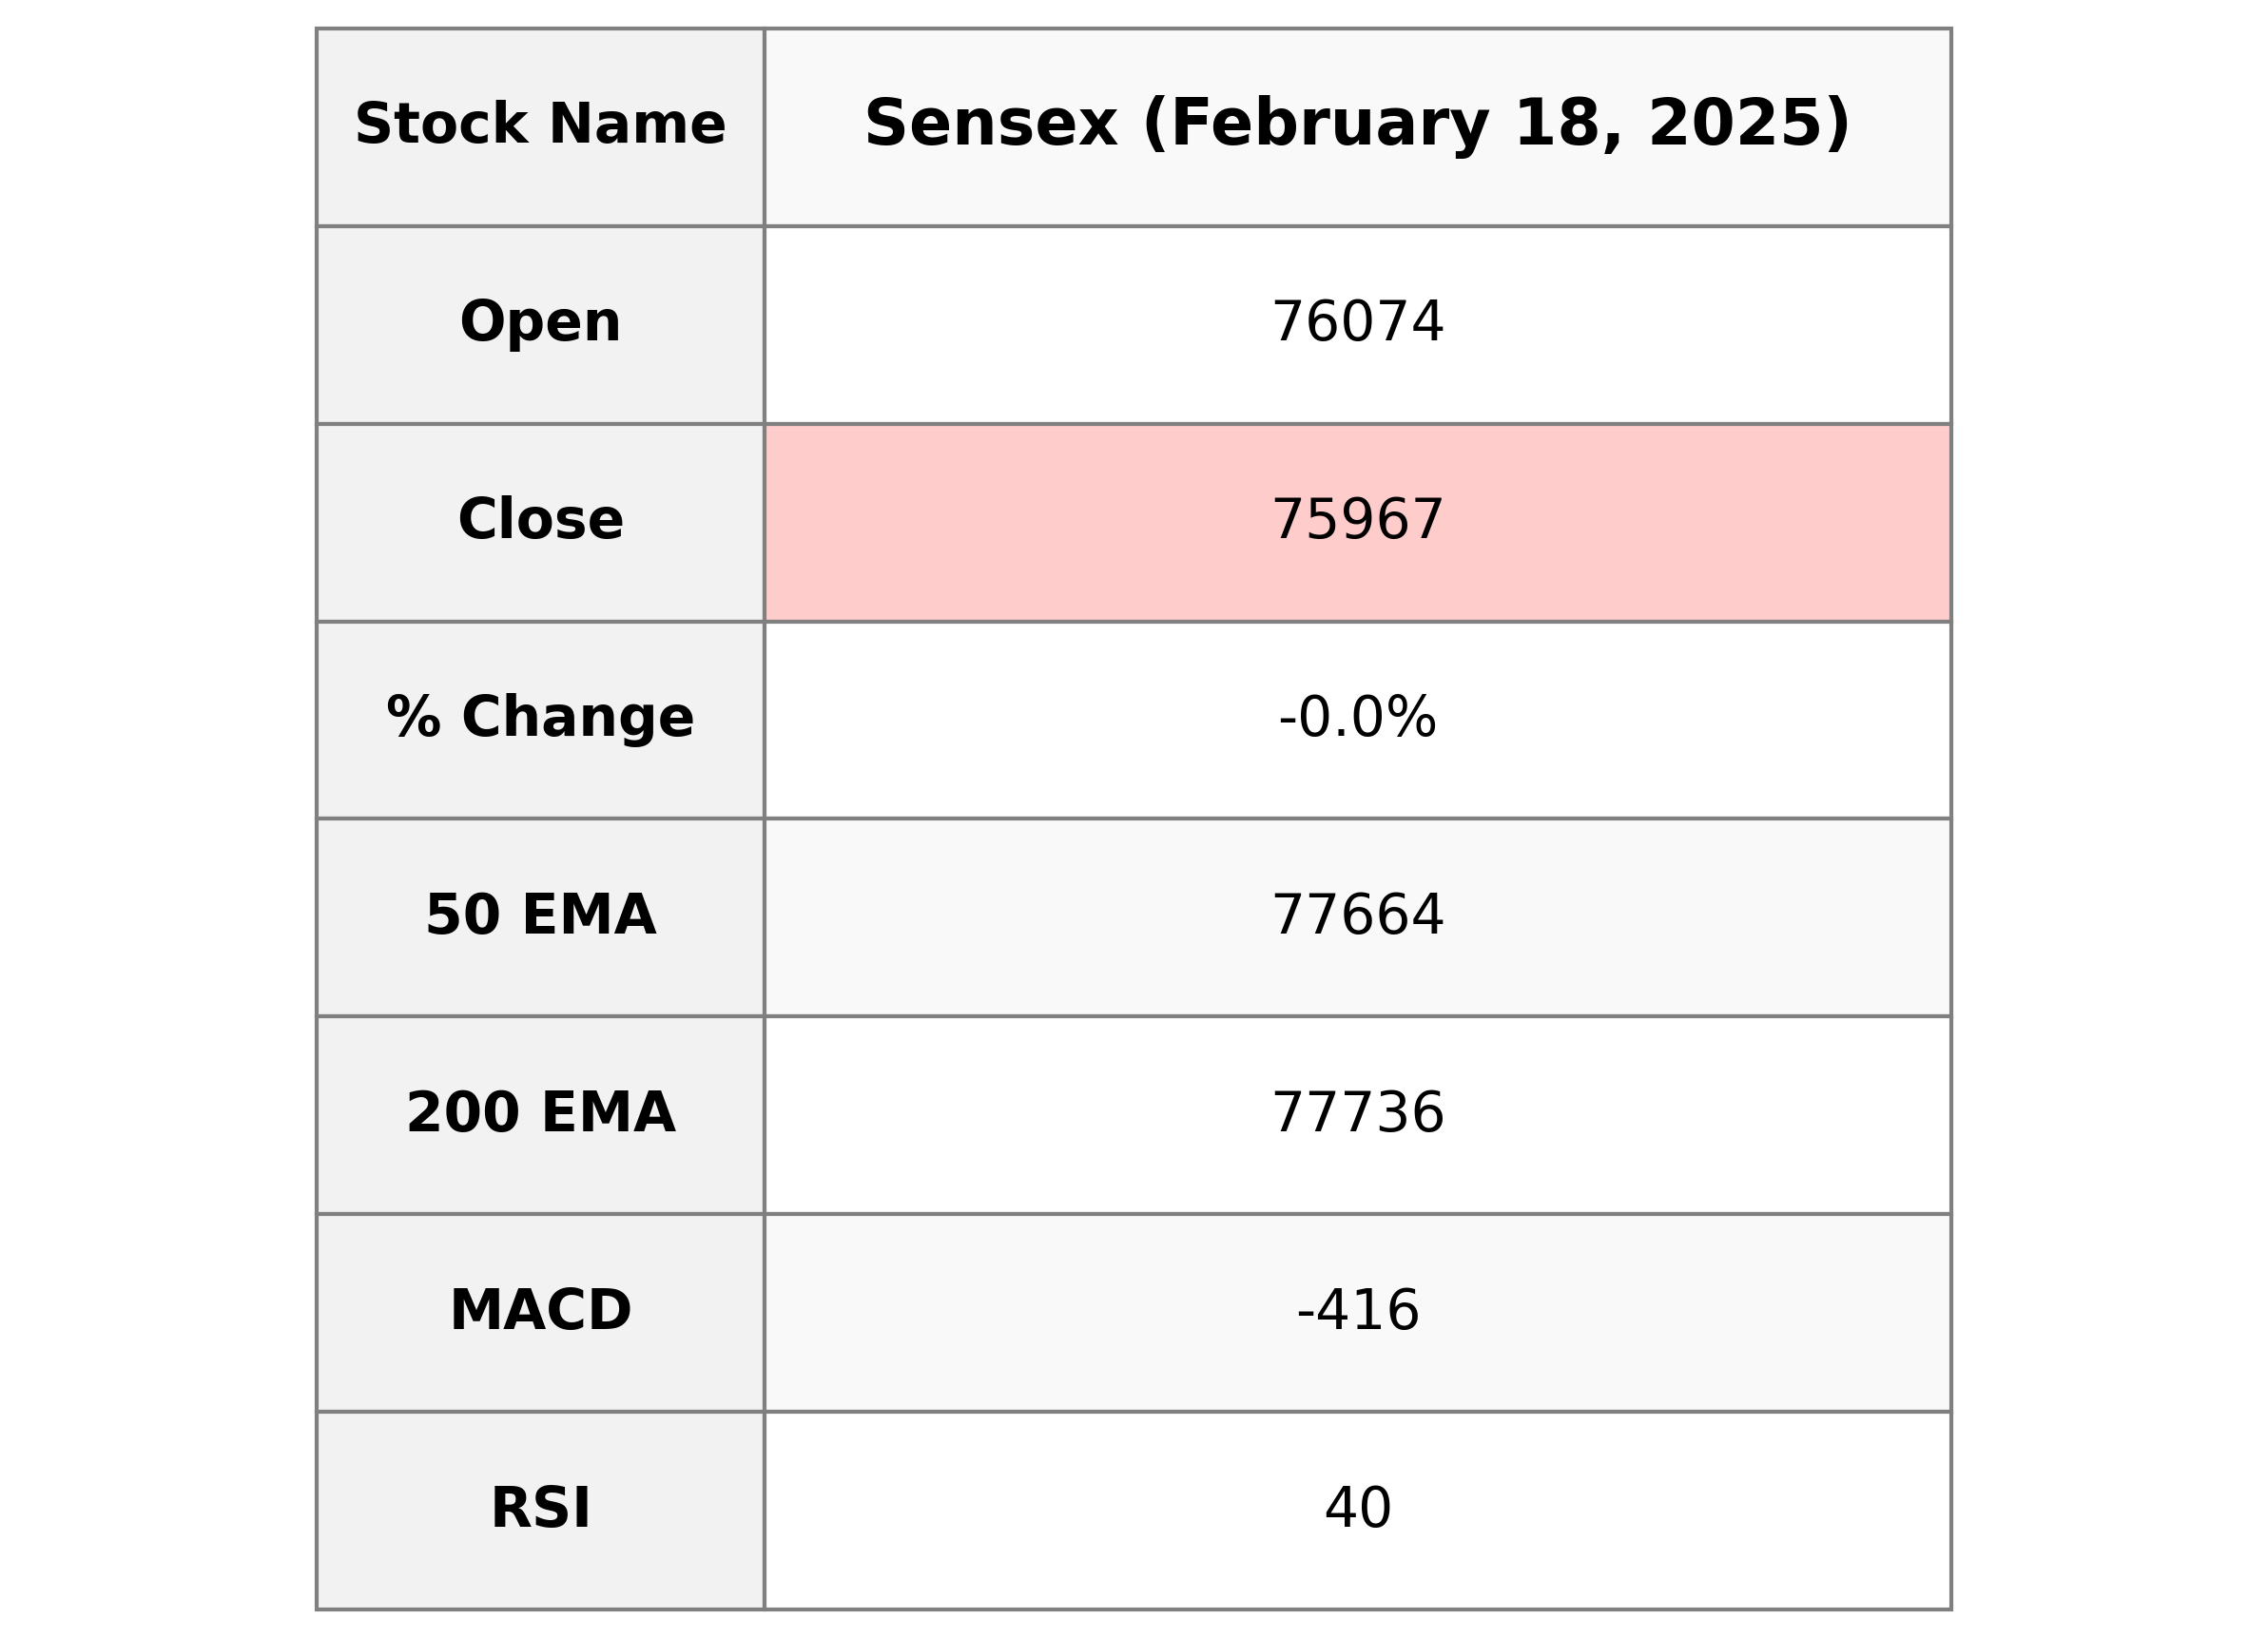
The Sensex opened at 76,073.71 and closed slightly lower at 75,967.39, reflecting a marginal decline with a points change of -29.47 and a percent change of -0.04%. The trading volume was negligible. Technical indicators show a bearish sentiment, with MACD at -415.54 and RSI at 40.10, indicating weakness in bullish momentum.
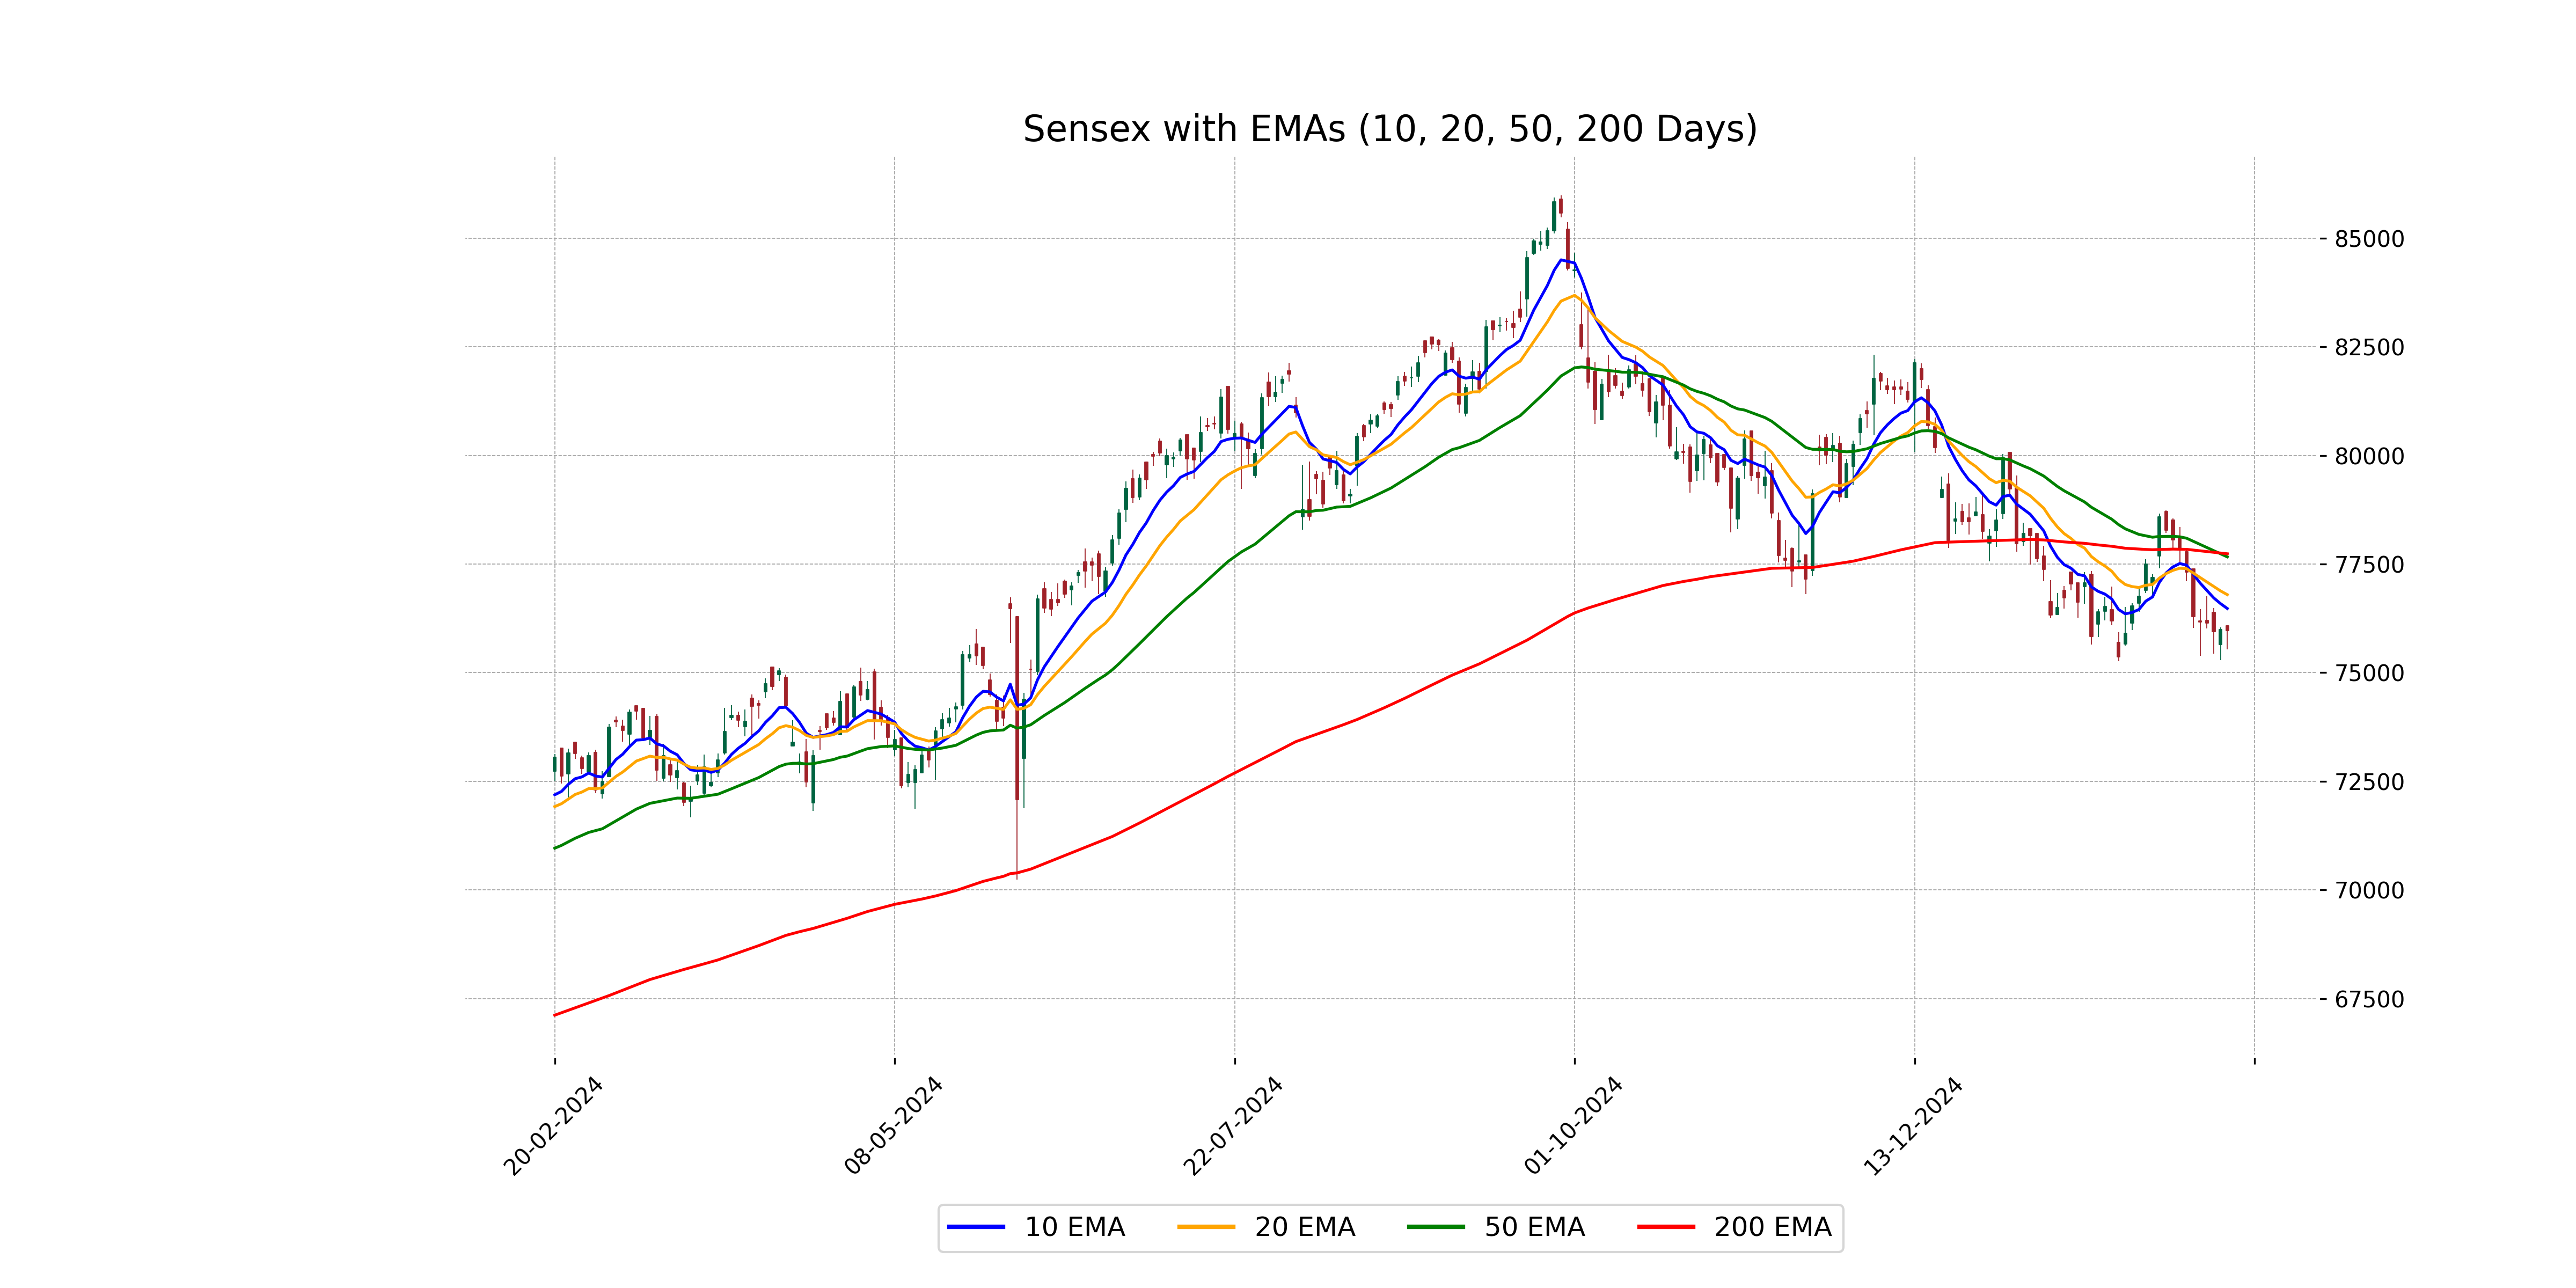
Relationship with Key Moving Averages
The Sensex closed below its key moving averages, with the closing price of 75,967.39 being below the 50-day EMA (77,663.72), 200-day EMA (77,735.57), 10-day EMA (76,475.98), and 20-day EMA (76,794.18). This indicates a short-term bearish trend as the price is below these averages.
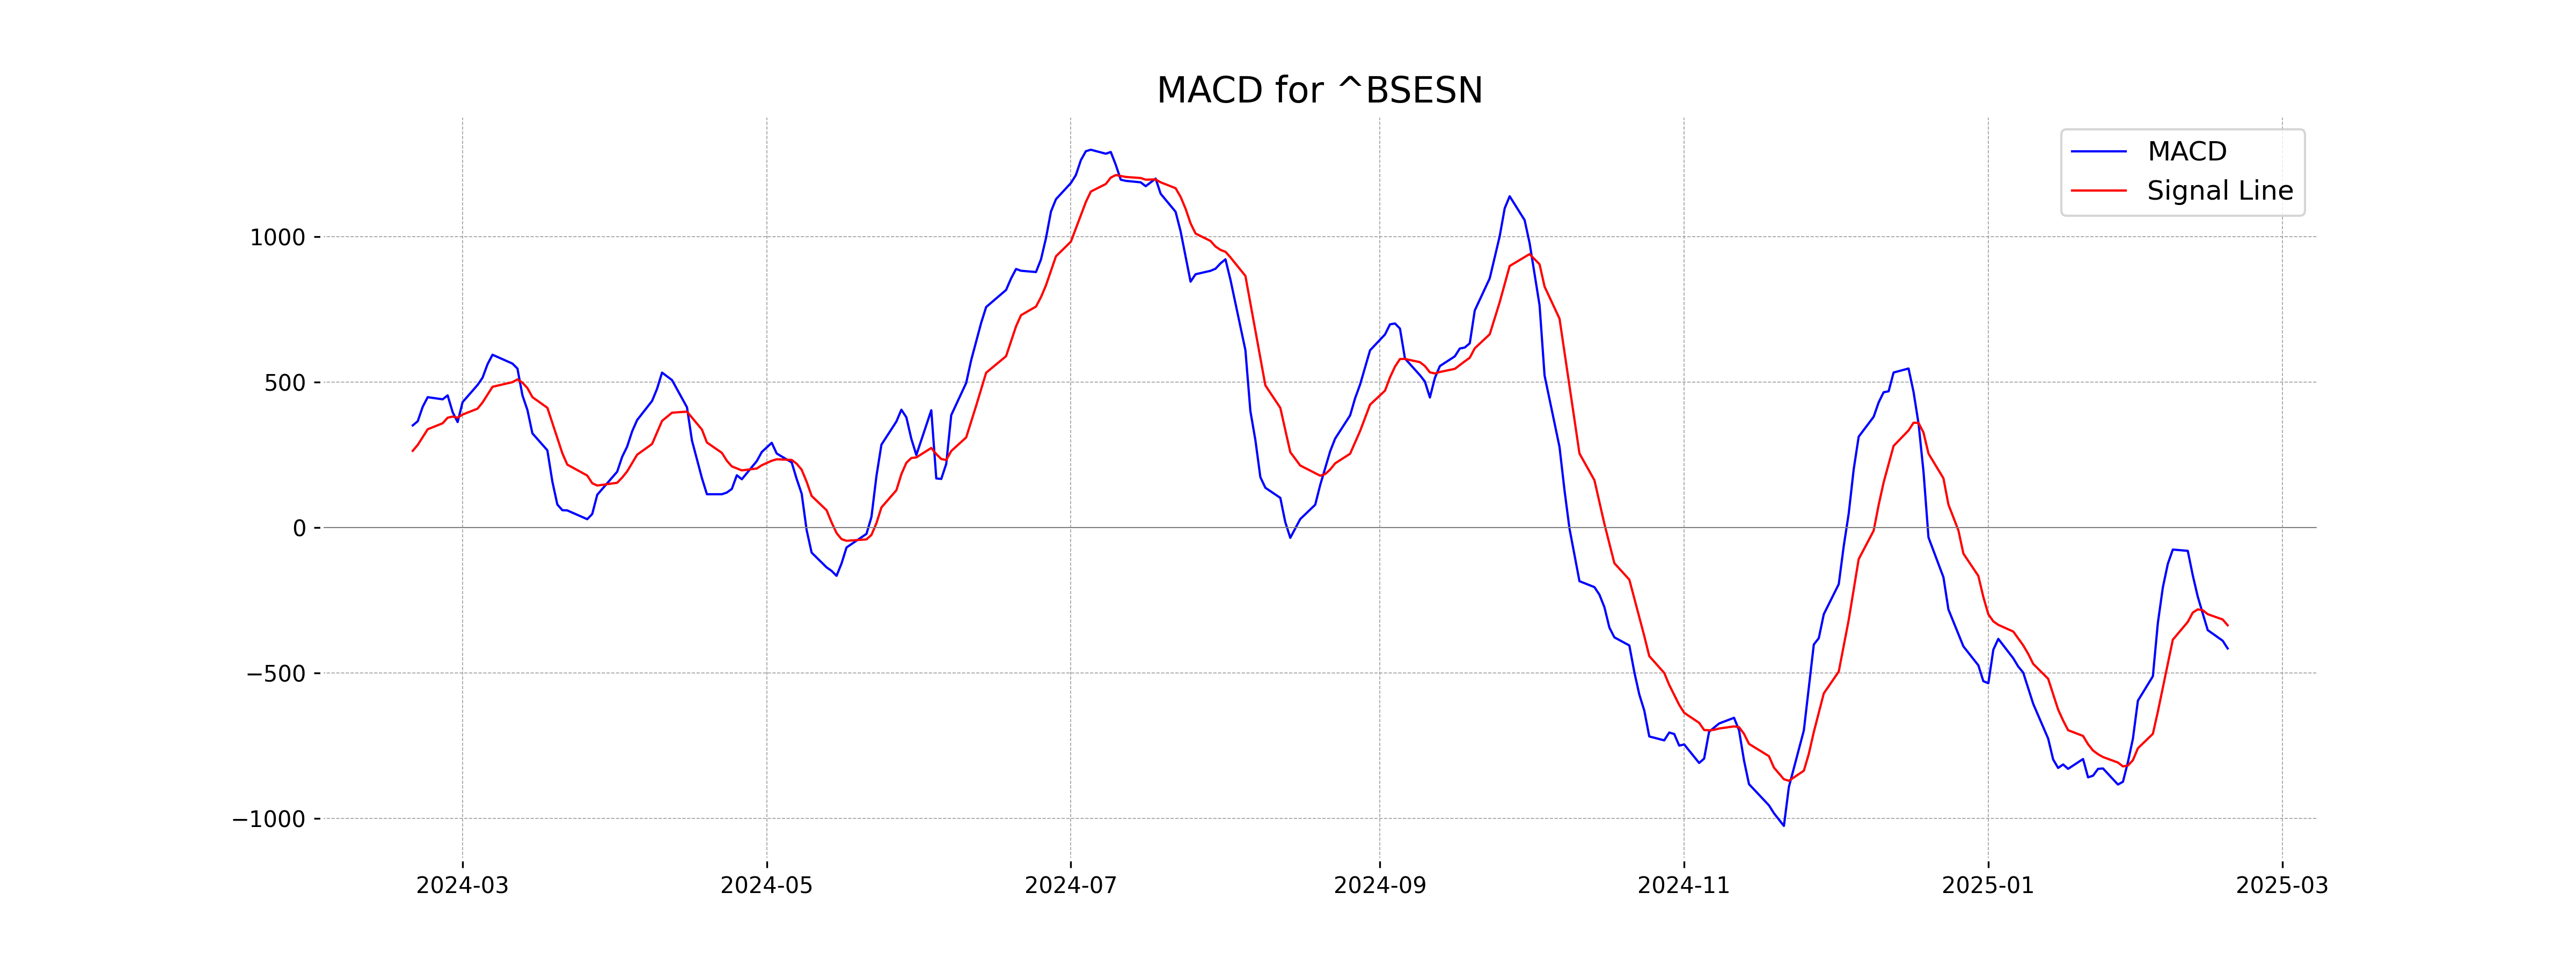
Moving Averages Trend (MACD)
The MACD for Sensex is -415.54, with a signal line of -335.95, indicating a bearish trend as the MACD is below the signal line. This suggests a potential continuation of the downward momentum.
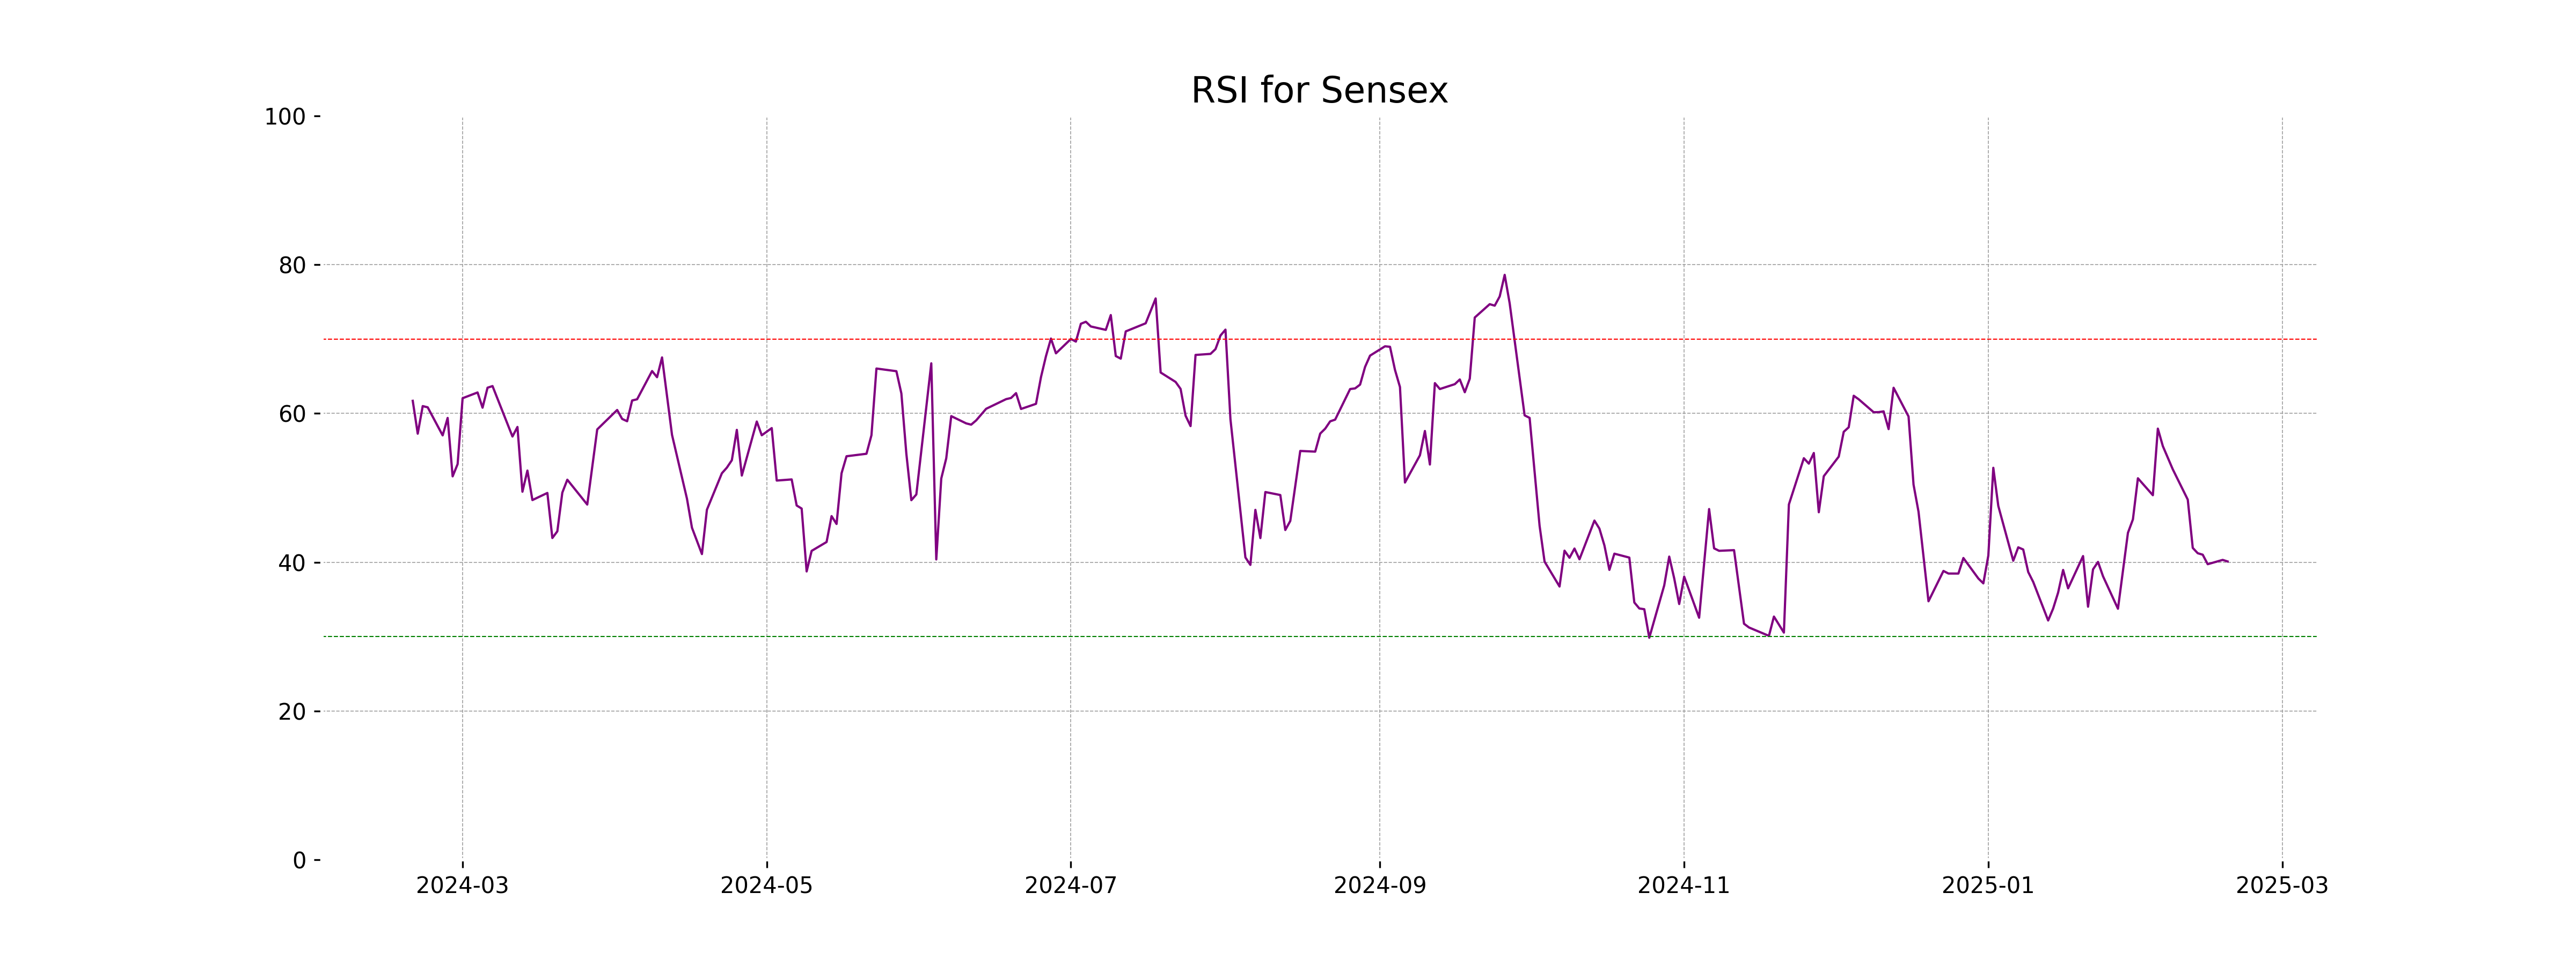
RSI Analysis
Sensex RSI Analysis: The Relative Strength Index (RSI) for Sensex is currently at 40.10, indicating that the index is nearing oversold territory. Generally, an RSI below 30 is considered oversold, suggesting potential for a rebound, while an RSI above 70 is considered overbought.
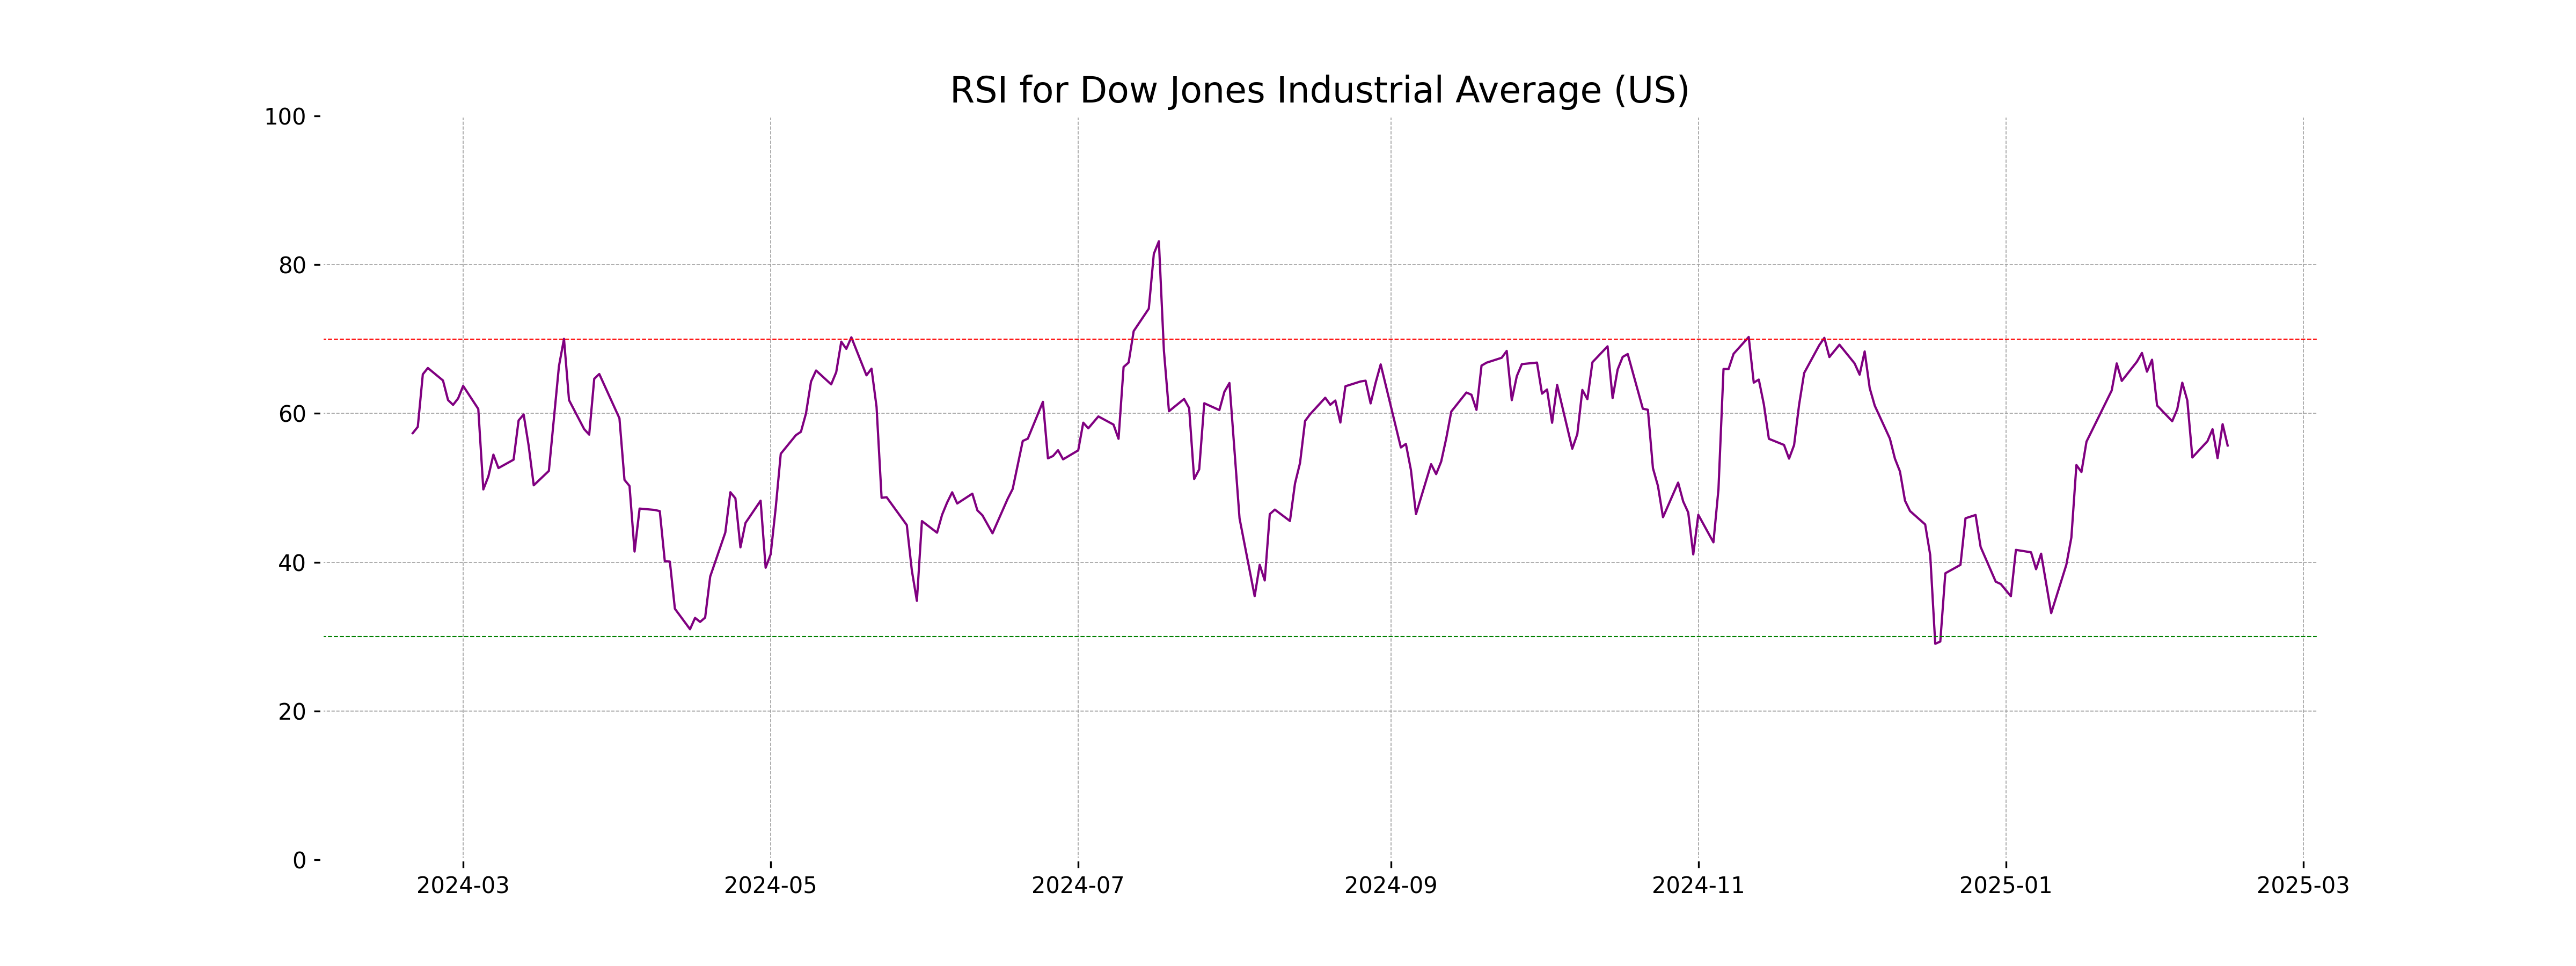
Analysis for Dow Jones Industrial Average (US) - February 18, 2025
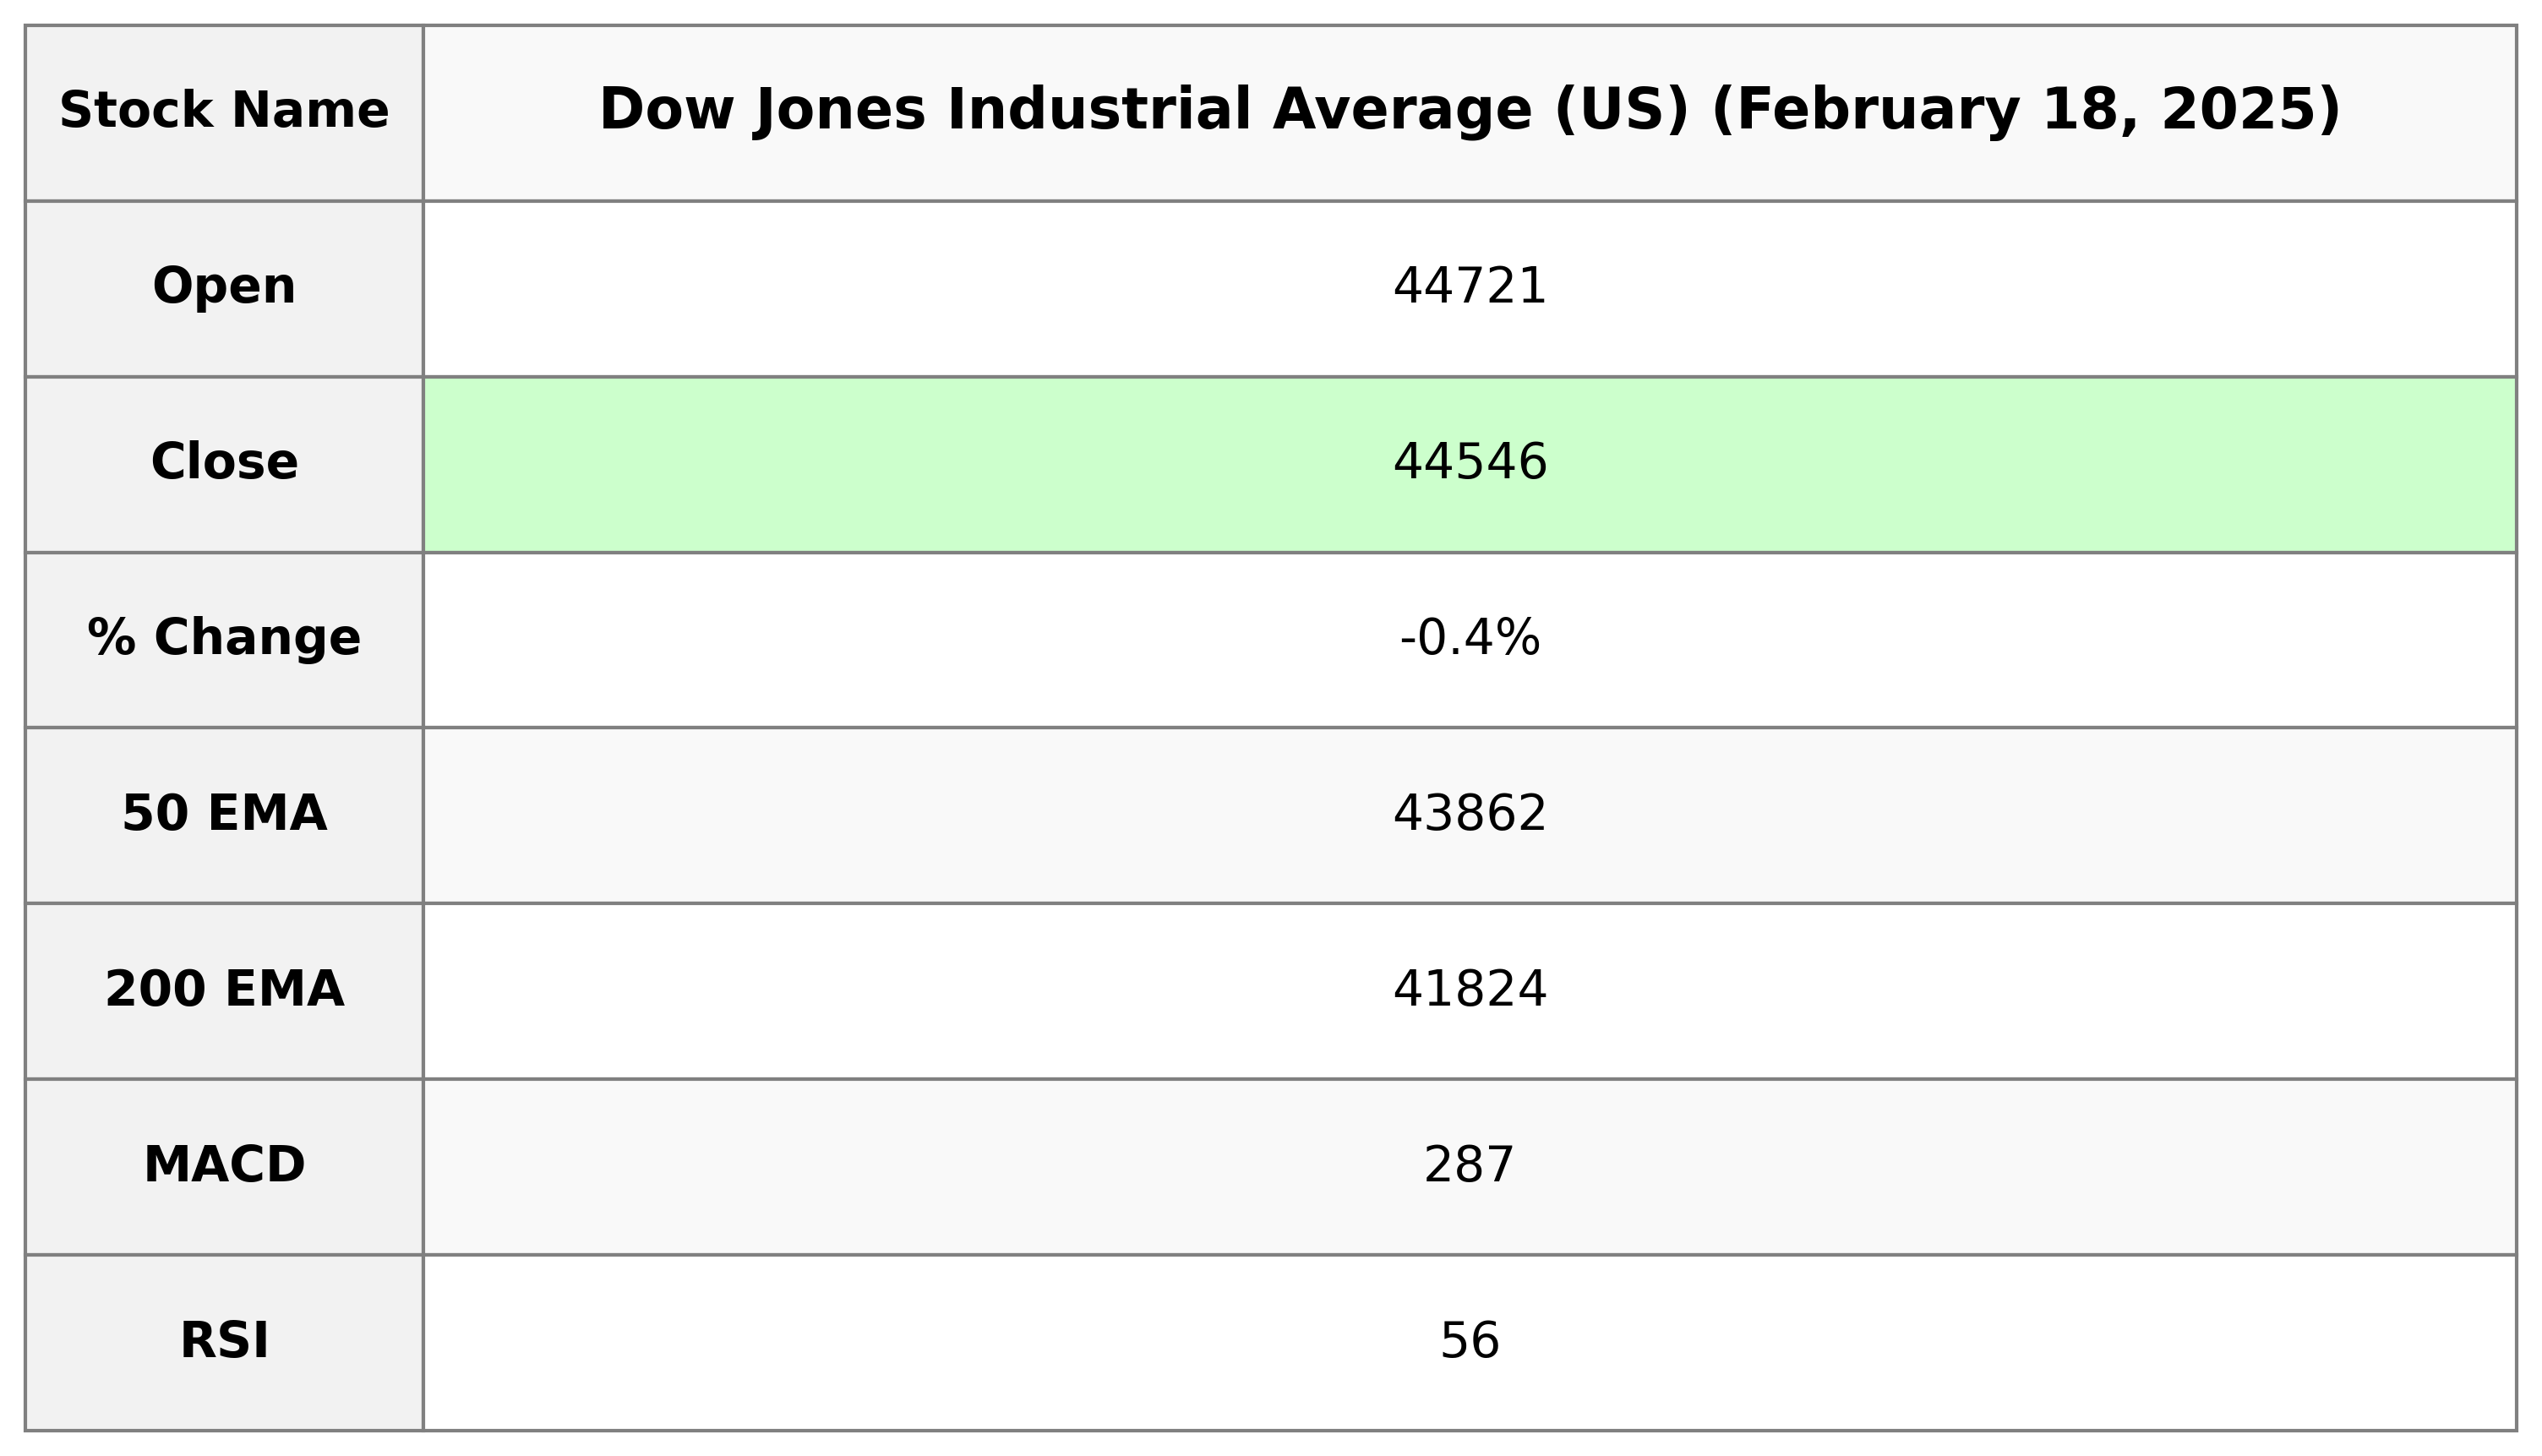
The Dow Jones Industrial Average opened at 44,720.99 and closed at 44,546.08, showing a decrease of 165.35 points or -0.37% from the previous close. Despite a slight downturn, the 50 EMA (43,862.26) and 200 EMA (41,824.23) indicate a higher long-term trend. The RSI of 55.69 suggests the index is neither overbought nor oversold at the moment.
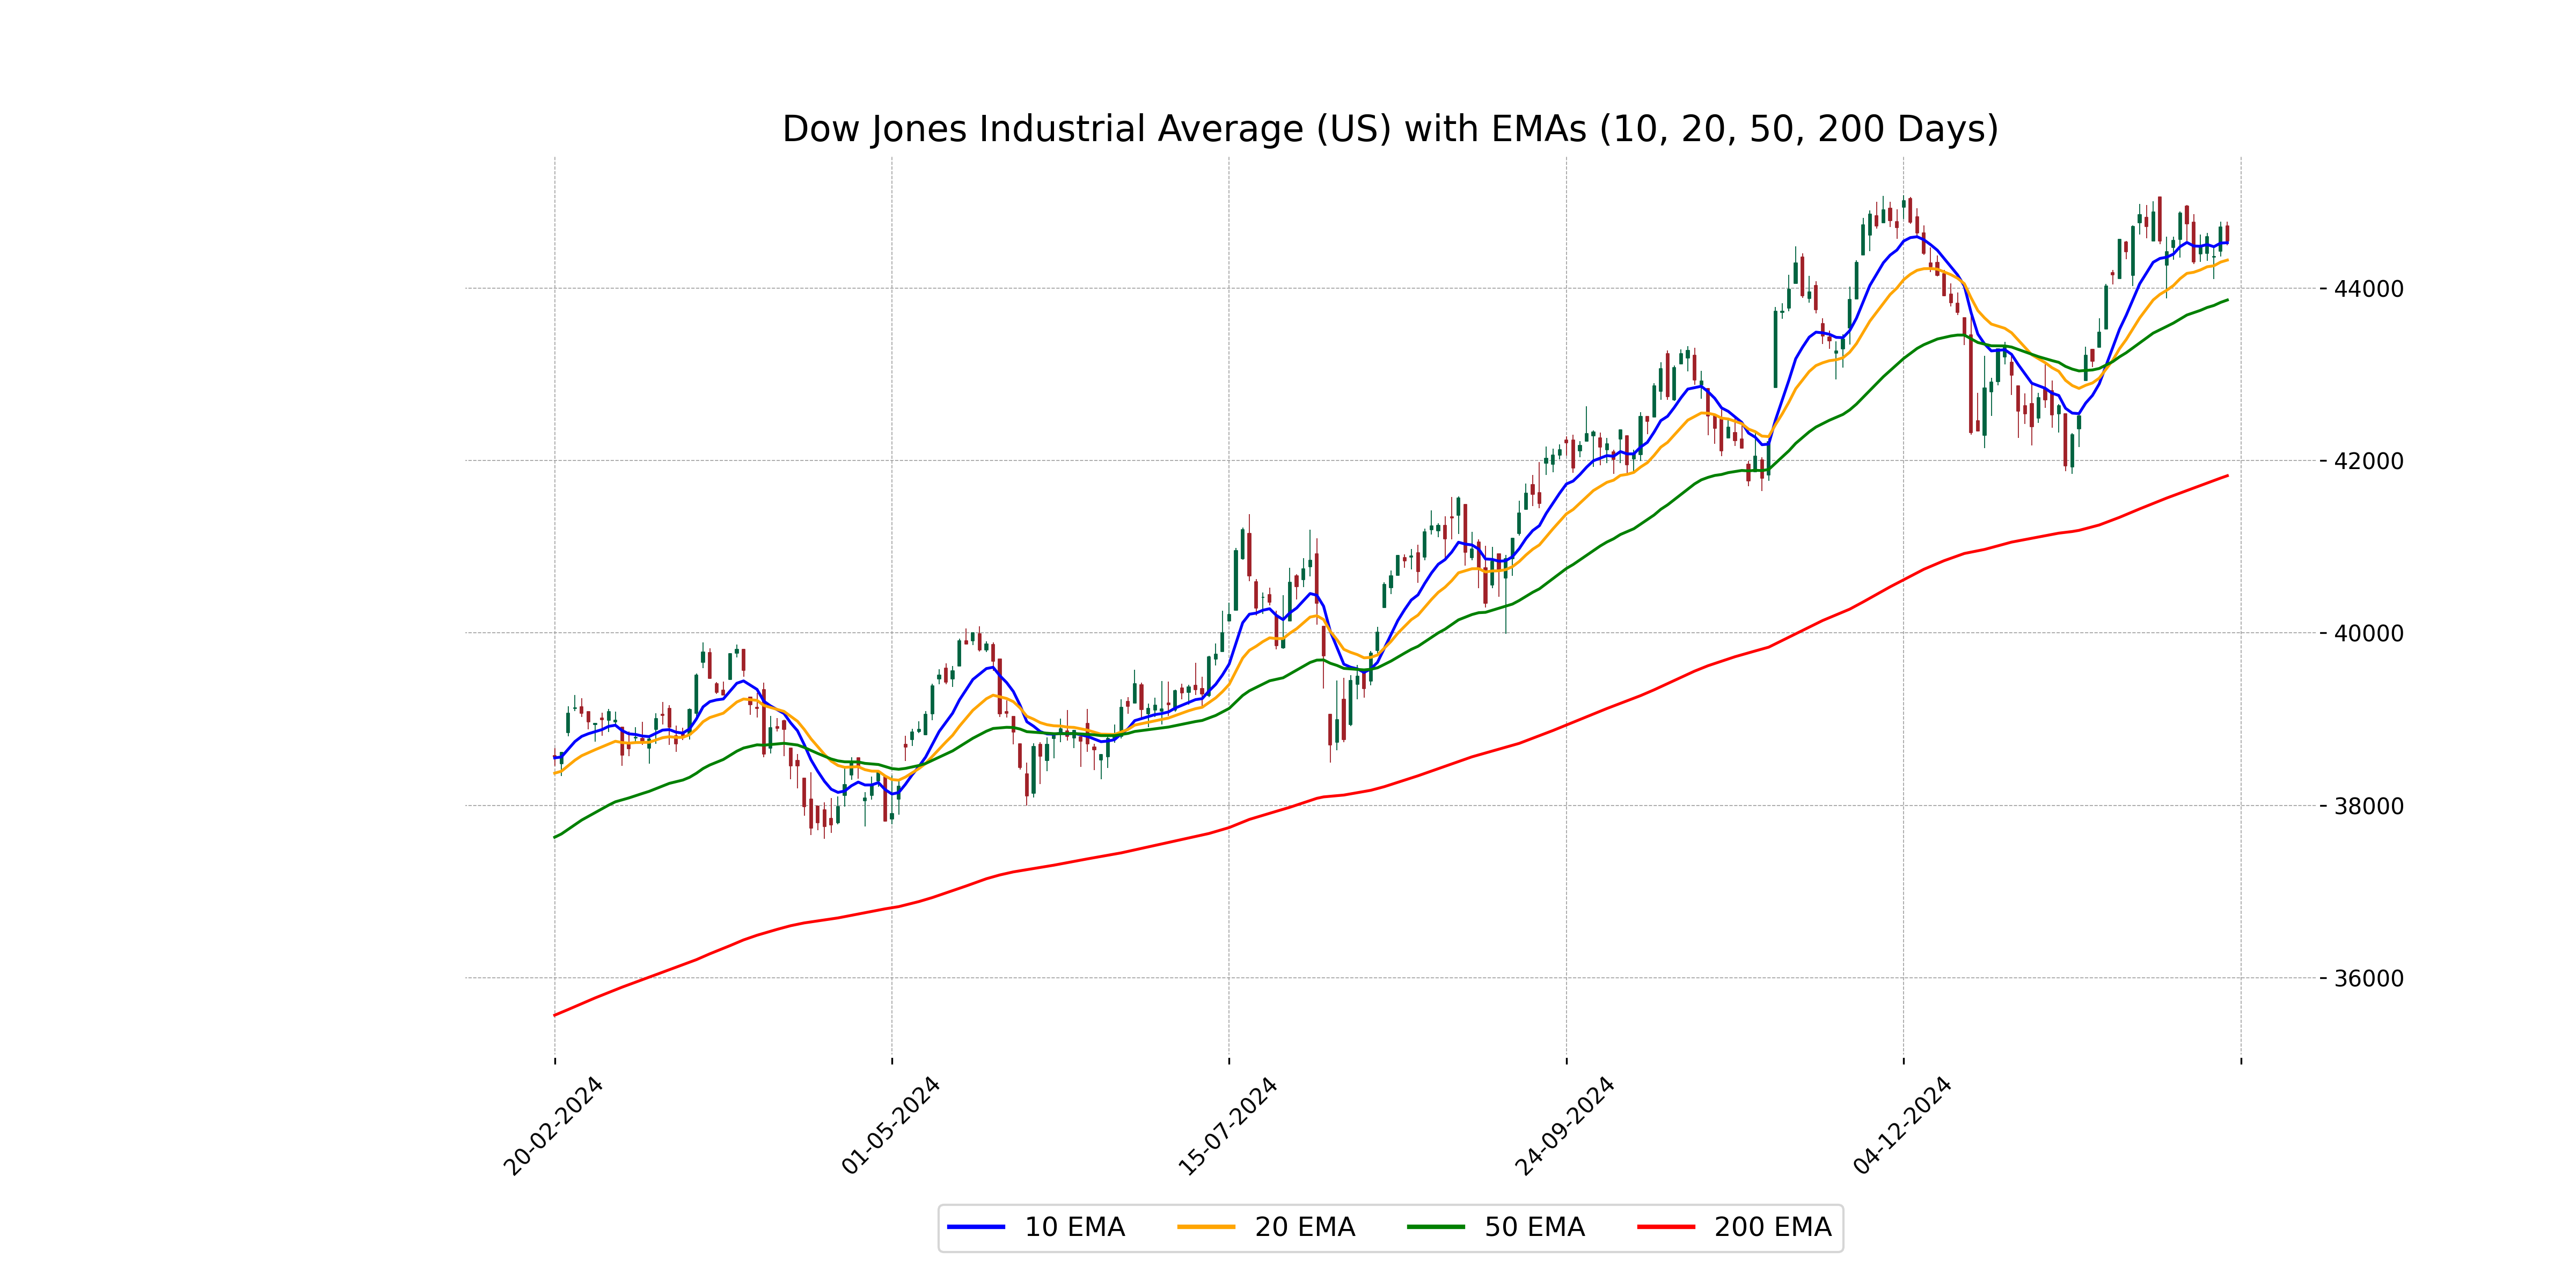
Relationship with Key Moving Averages
The Dow Jones Industrial Average closed at 44,546.08, slightly below its 10-day EMA of 44,526.60, suggesting short-term bearishness. It remains above the 50-day EMA of 43,862.26 and the 200-day EMA of 41,824.23, indicating a longer-term bullish trend.
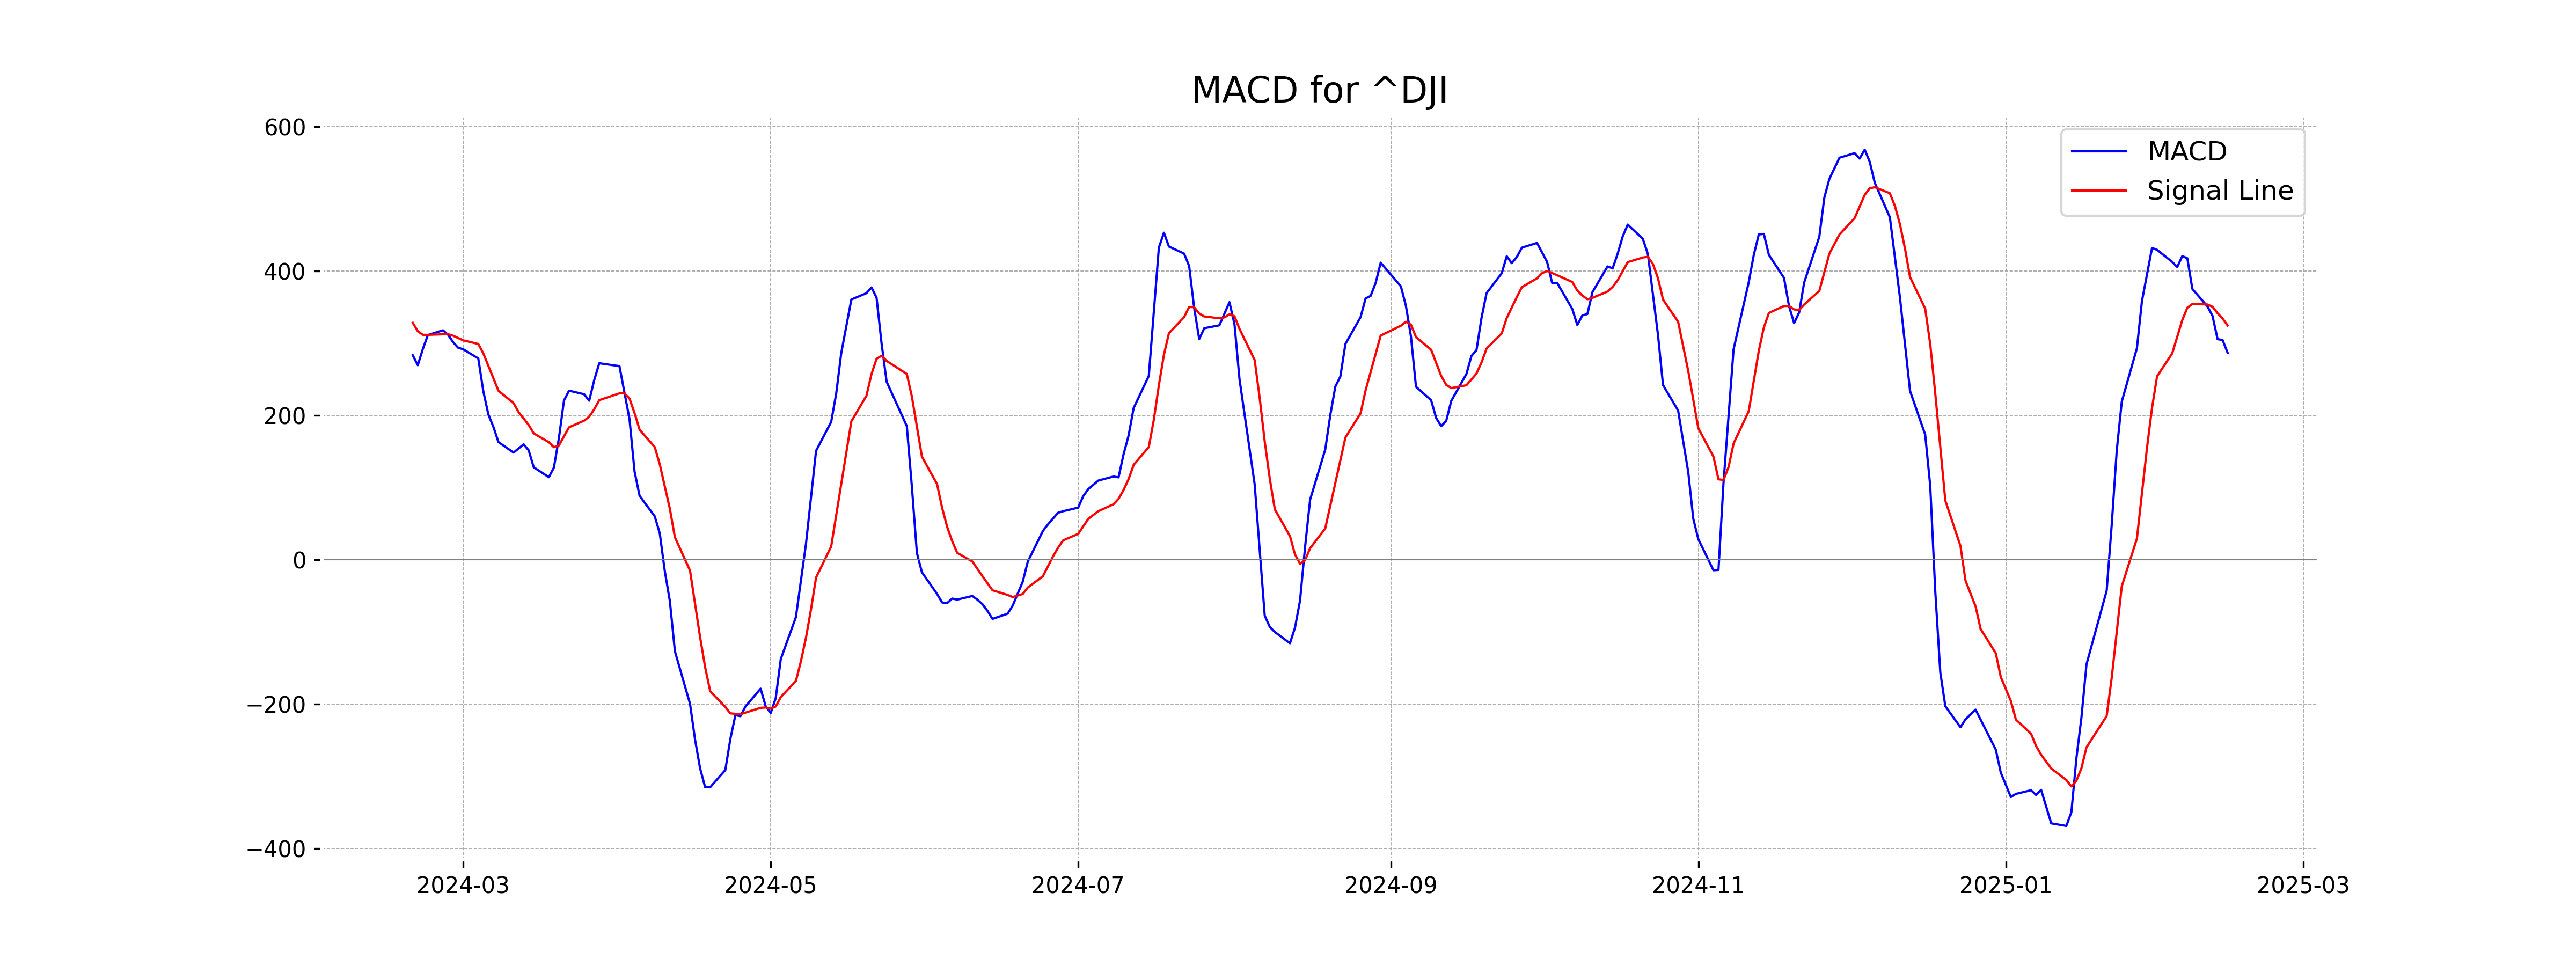
Moving Averages Trend (MACD)
The MACD for the Dow Jones Industrial Average indicates a bearish trend, as the MACD value of 286.67 is below the MACD Signal line of 324.63. This suggests a declining momentum in the moving average convergence divergence analysis.
RSI Analysis
RSI Analysis for Dow Jones Industrial Average (US): The RSI (Relative Strength Index) value for the Dow Jones Industrial Average is approximately 55.69. This suggests a neutral momentum, indicating that the index is neither in an overbought nor oversold condition at present.
Analysis for CAC 40 (France) - February 18, 2025
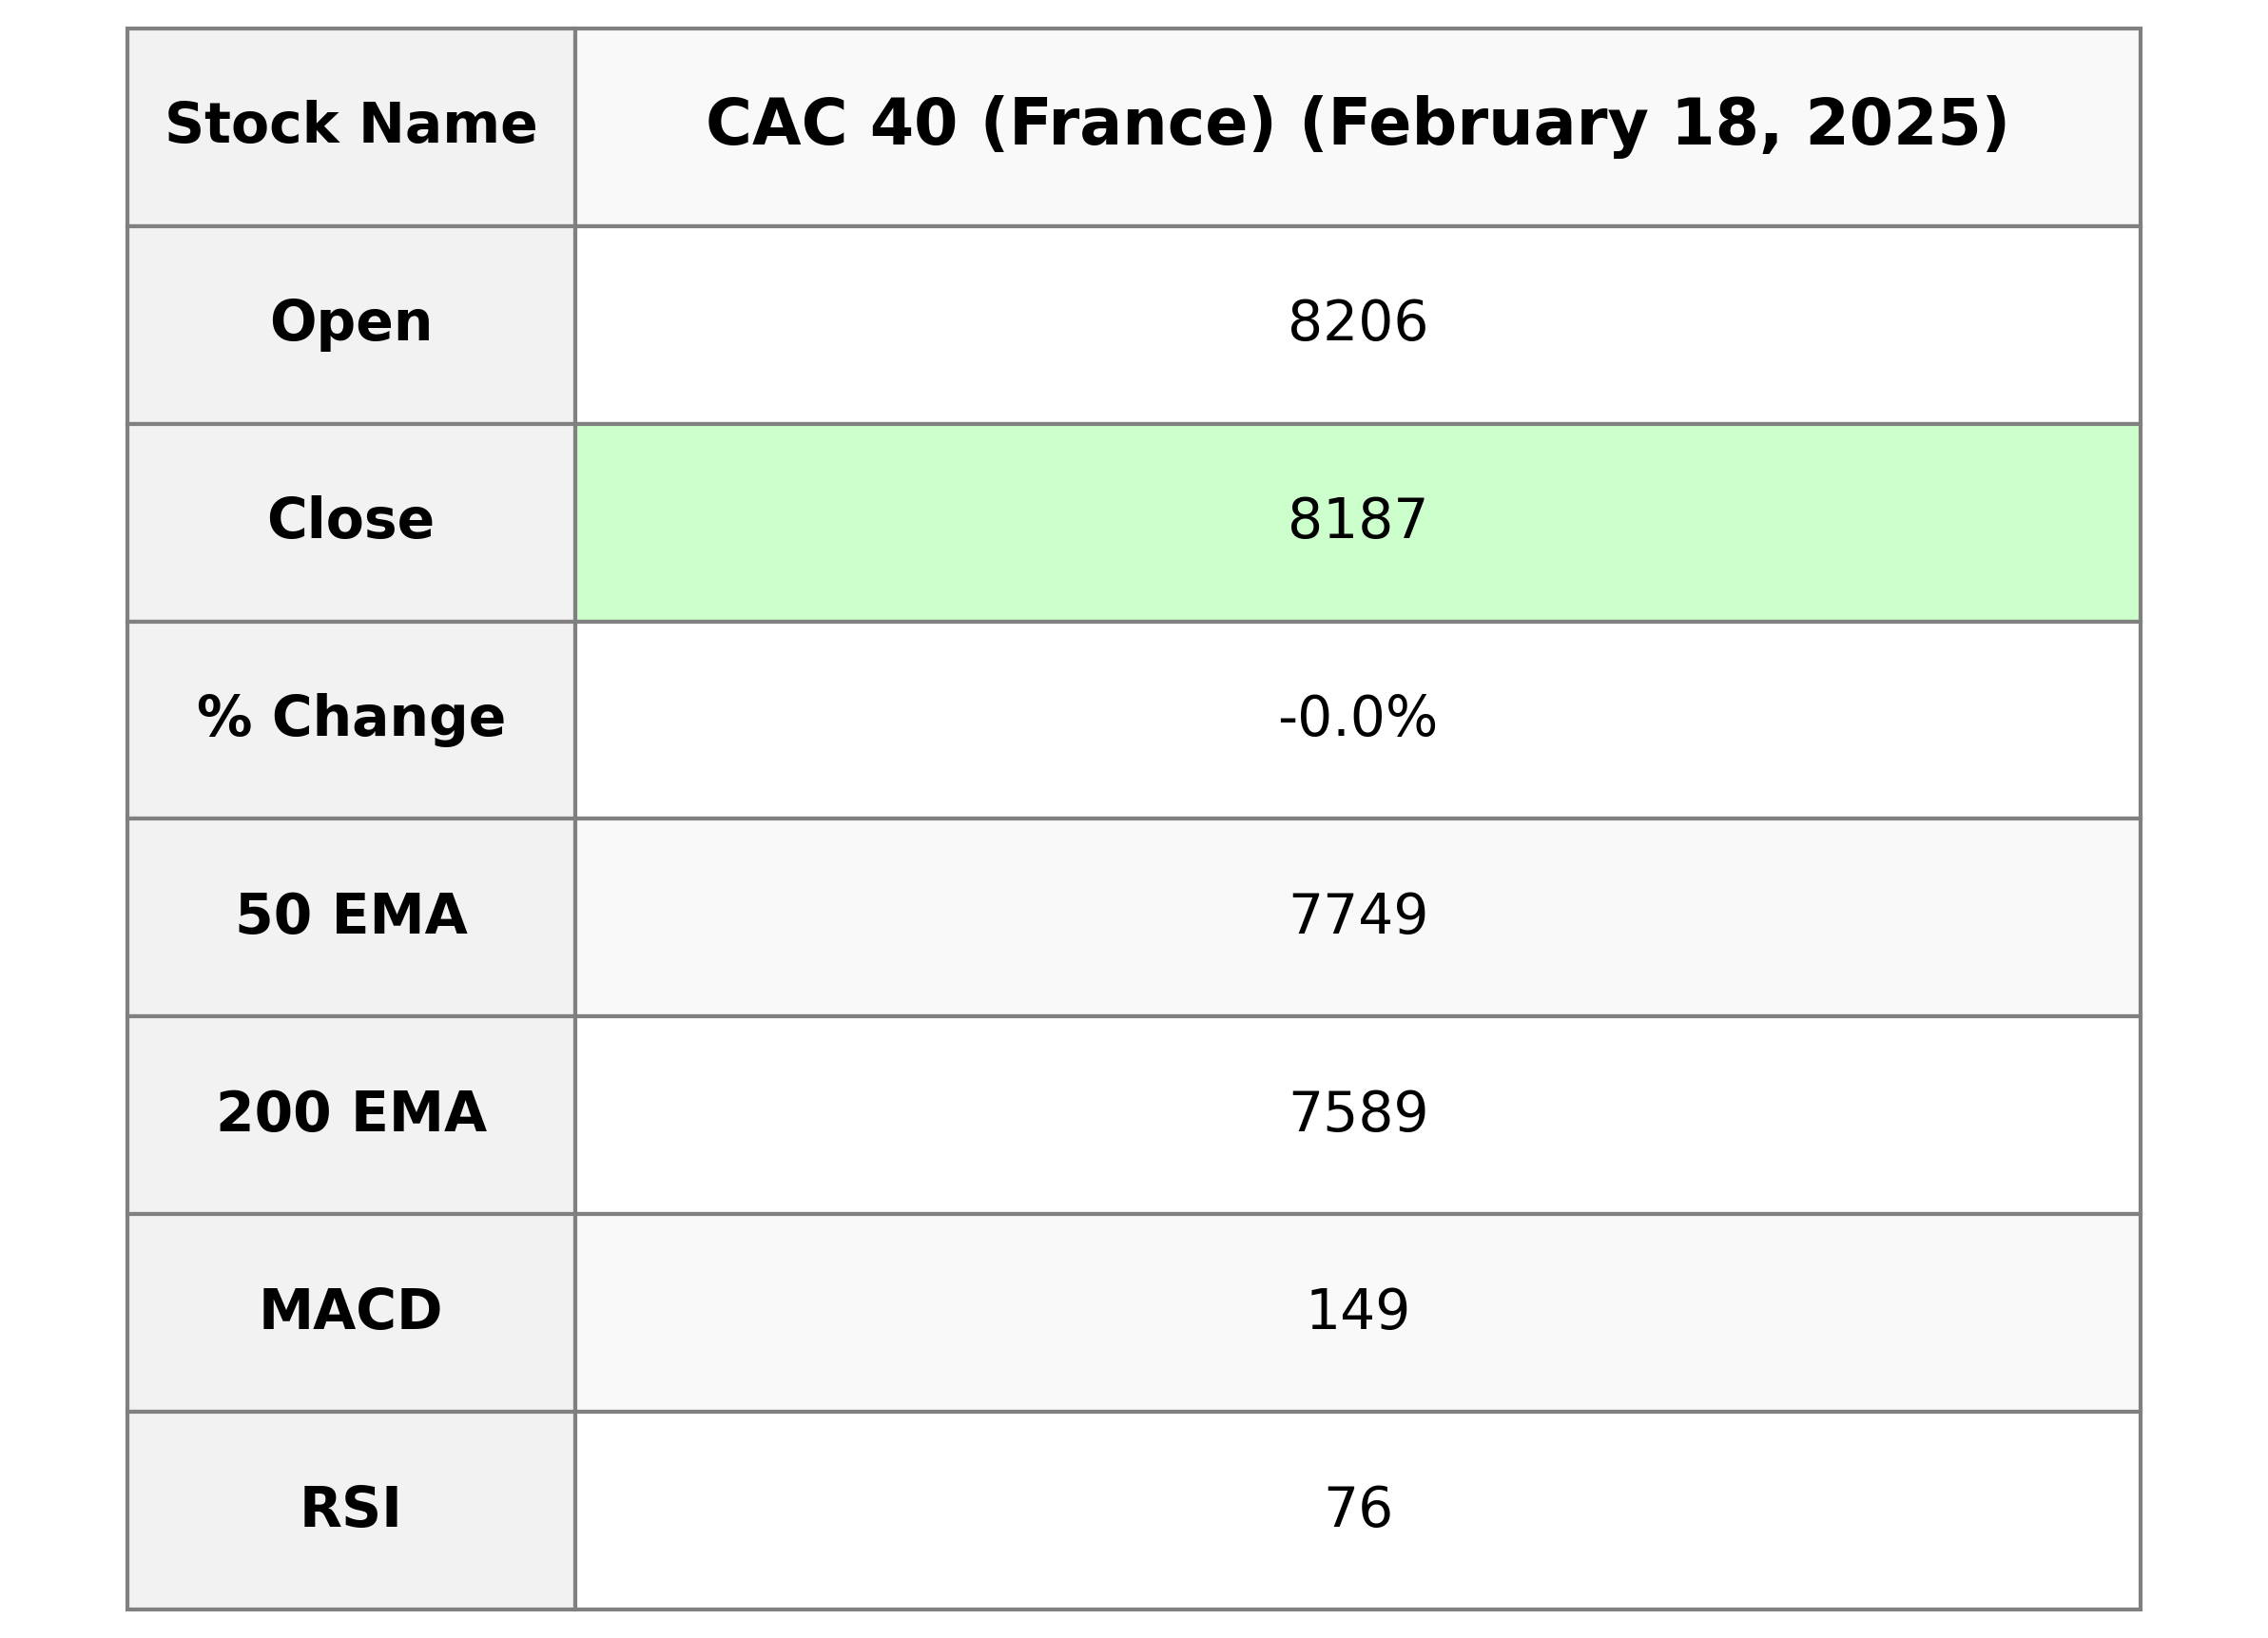
The CAC 40 (France) opened at 8205.94 and closed slightly lower at 8186.71, reflecting a minor percentage change of -0.03% from the previous close of 8189.13. The trading session saw a high of 8206.64 and a low of 8160.61. Despite a lack of trading volume, the market displayed strength with a notable RSI of 76.35 and MACD above the signal line, suggesting strong momentum.

Relationship with Key Moving Averages
CAC 40 (France) is trading above its key moving averages, as its latest closing price of 8186.71 is above the 50-EMA of 7748.93, the 200-EMA of 7588.53, the 10-EMA of 8082.88, and the 20-EMA of 7969.00. This indicates a bullish trend in the short, medium, and long term.
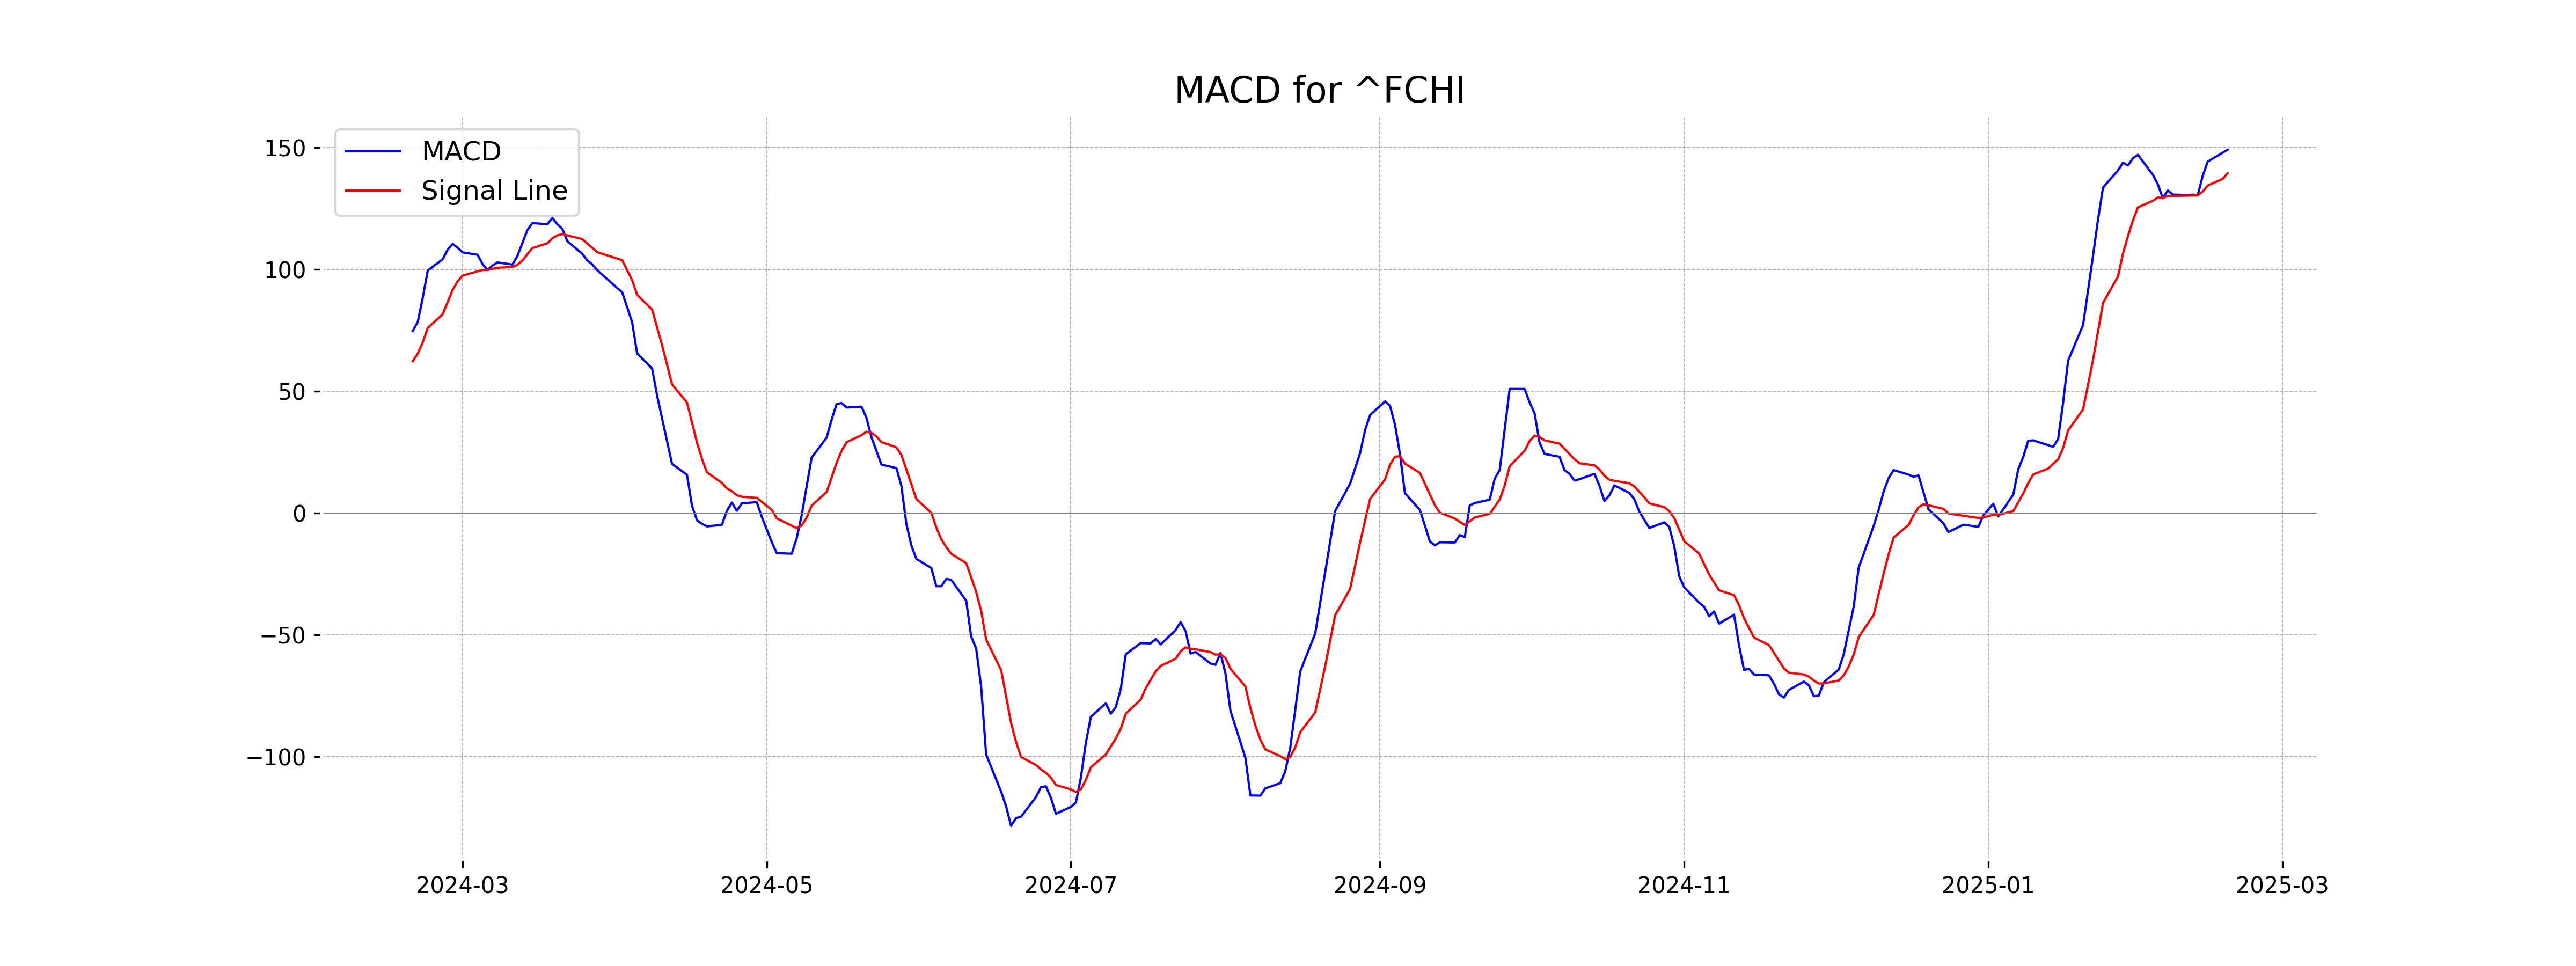
Moving Averages Trend (MACD)
The MACD line (149.18) is above the MACD Signal line (139.60) for CAC 40 (France), indicating a bullish momentum. This suggests a potential uptrend as the MACD Histogram is positive. However, the high RSI of 76.35 indicates overbought conditions which may lead to a pullback.
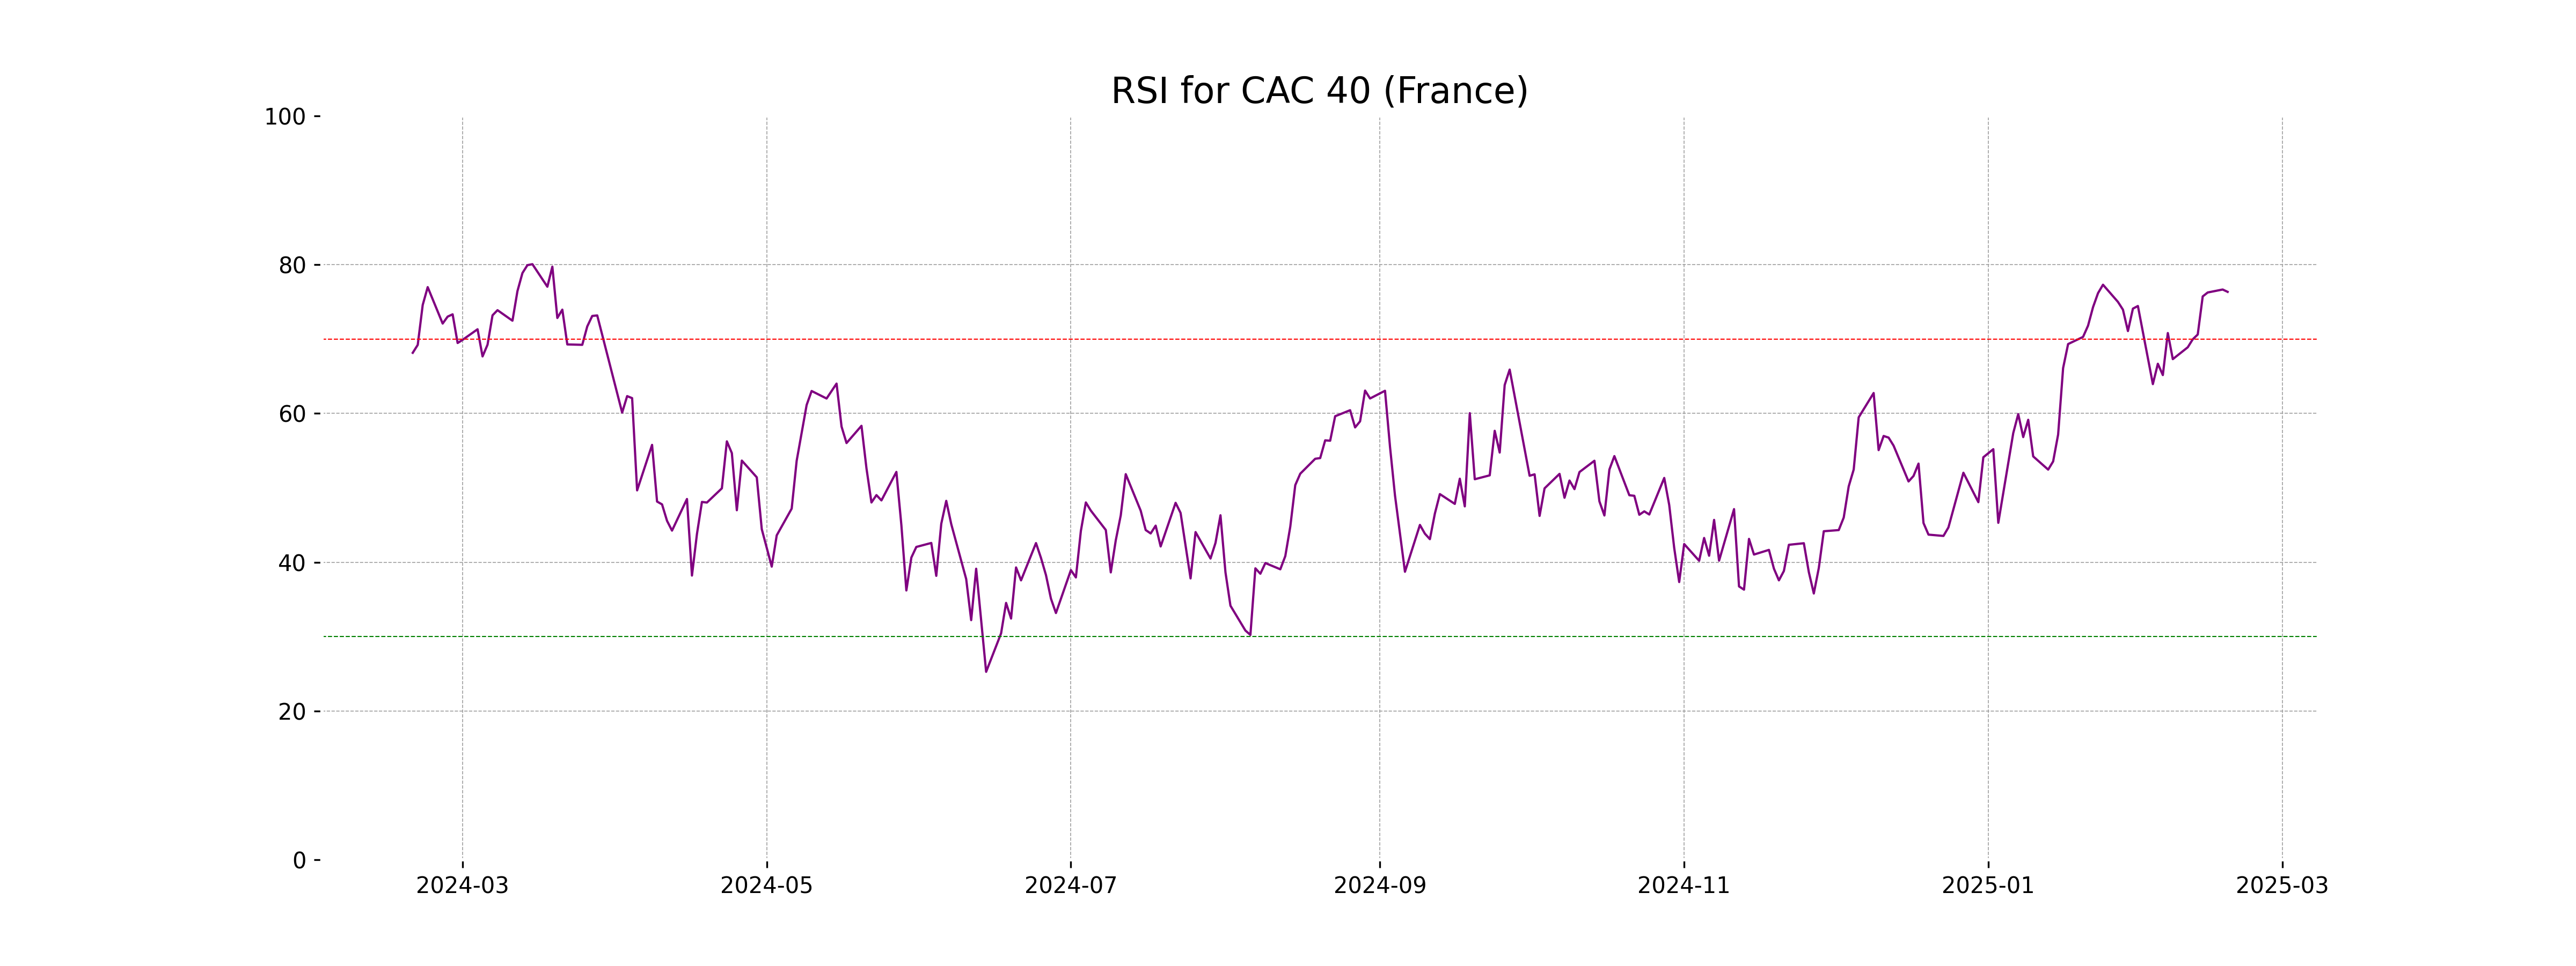
RSI Analysis
The CAC 40 (France) has an RSI value of 76.35, indicating that the index is currently in an overbought condition. Typically, an RSI value above 70 suggests that the stock or index might be overvalued, which could precede a pullback or reversal.
Analysis for FTSE 100 (UK) - February 18, 2025
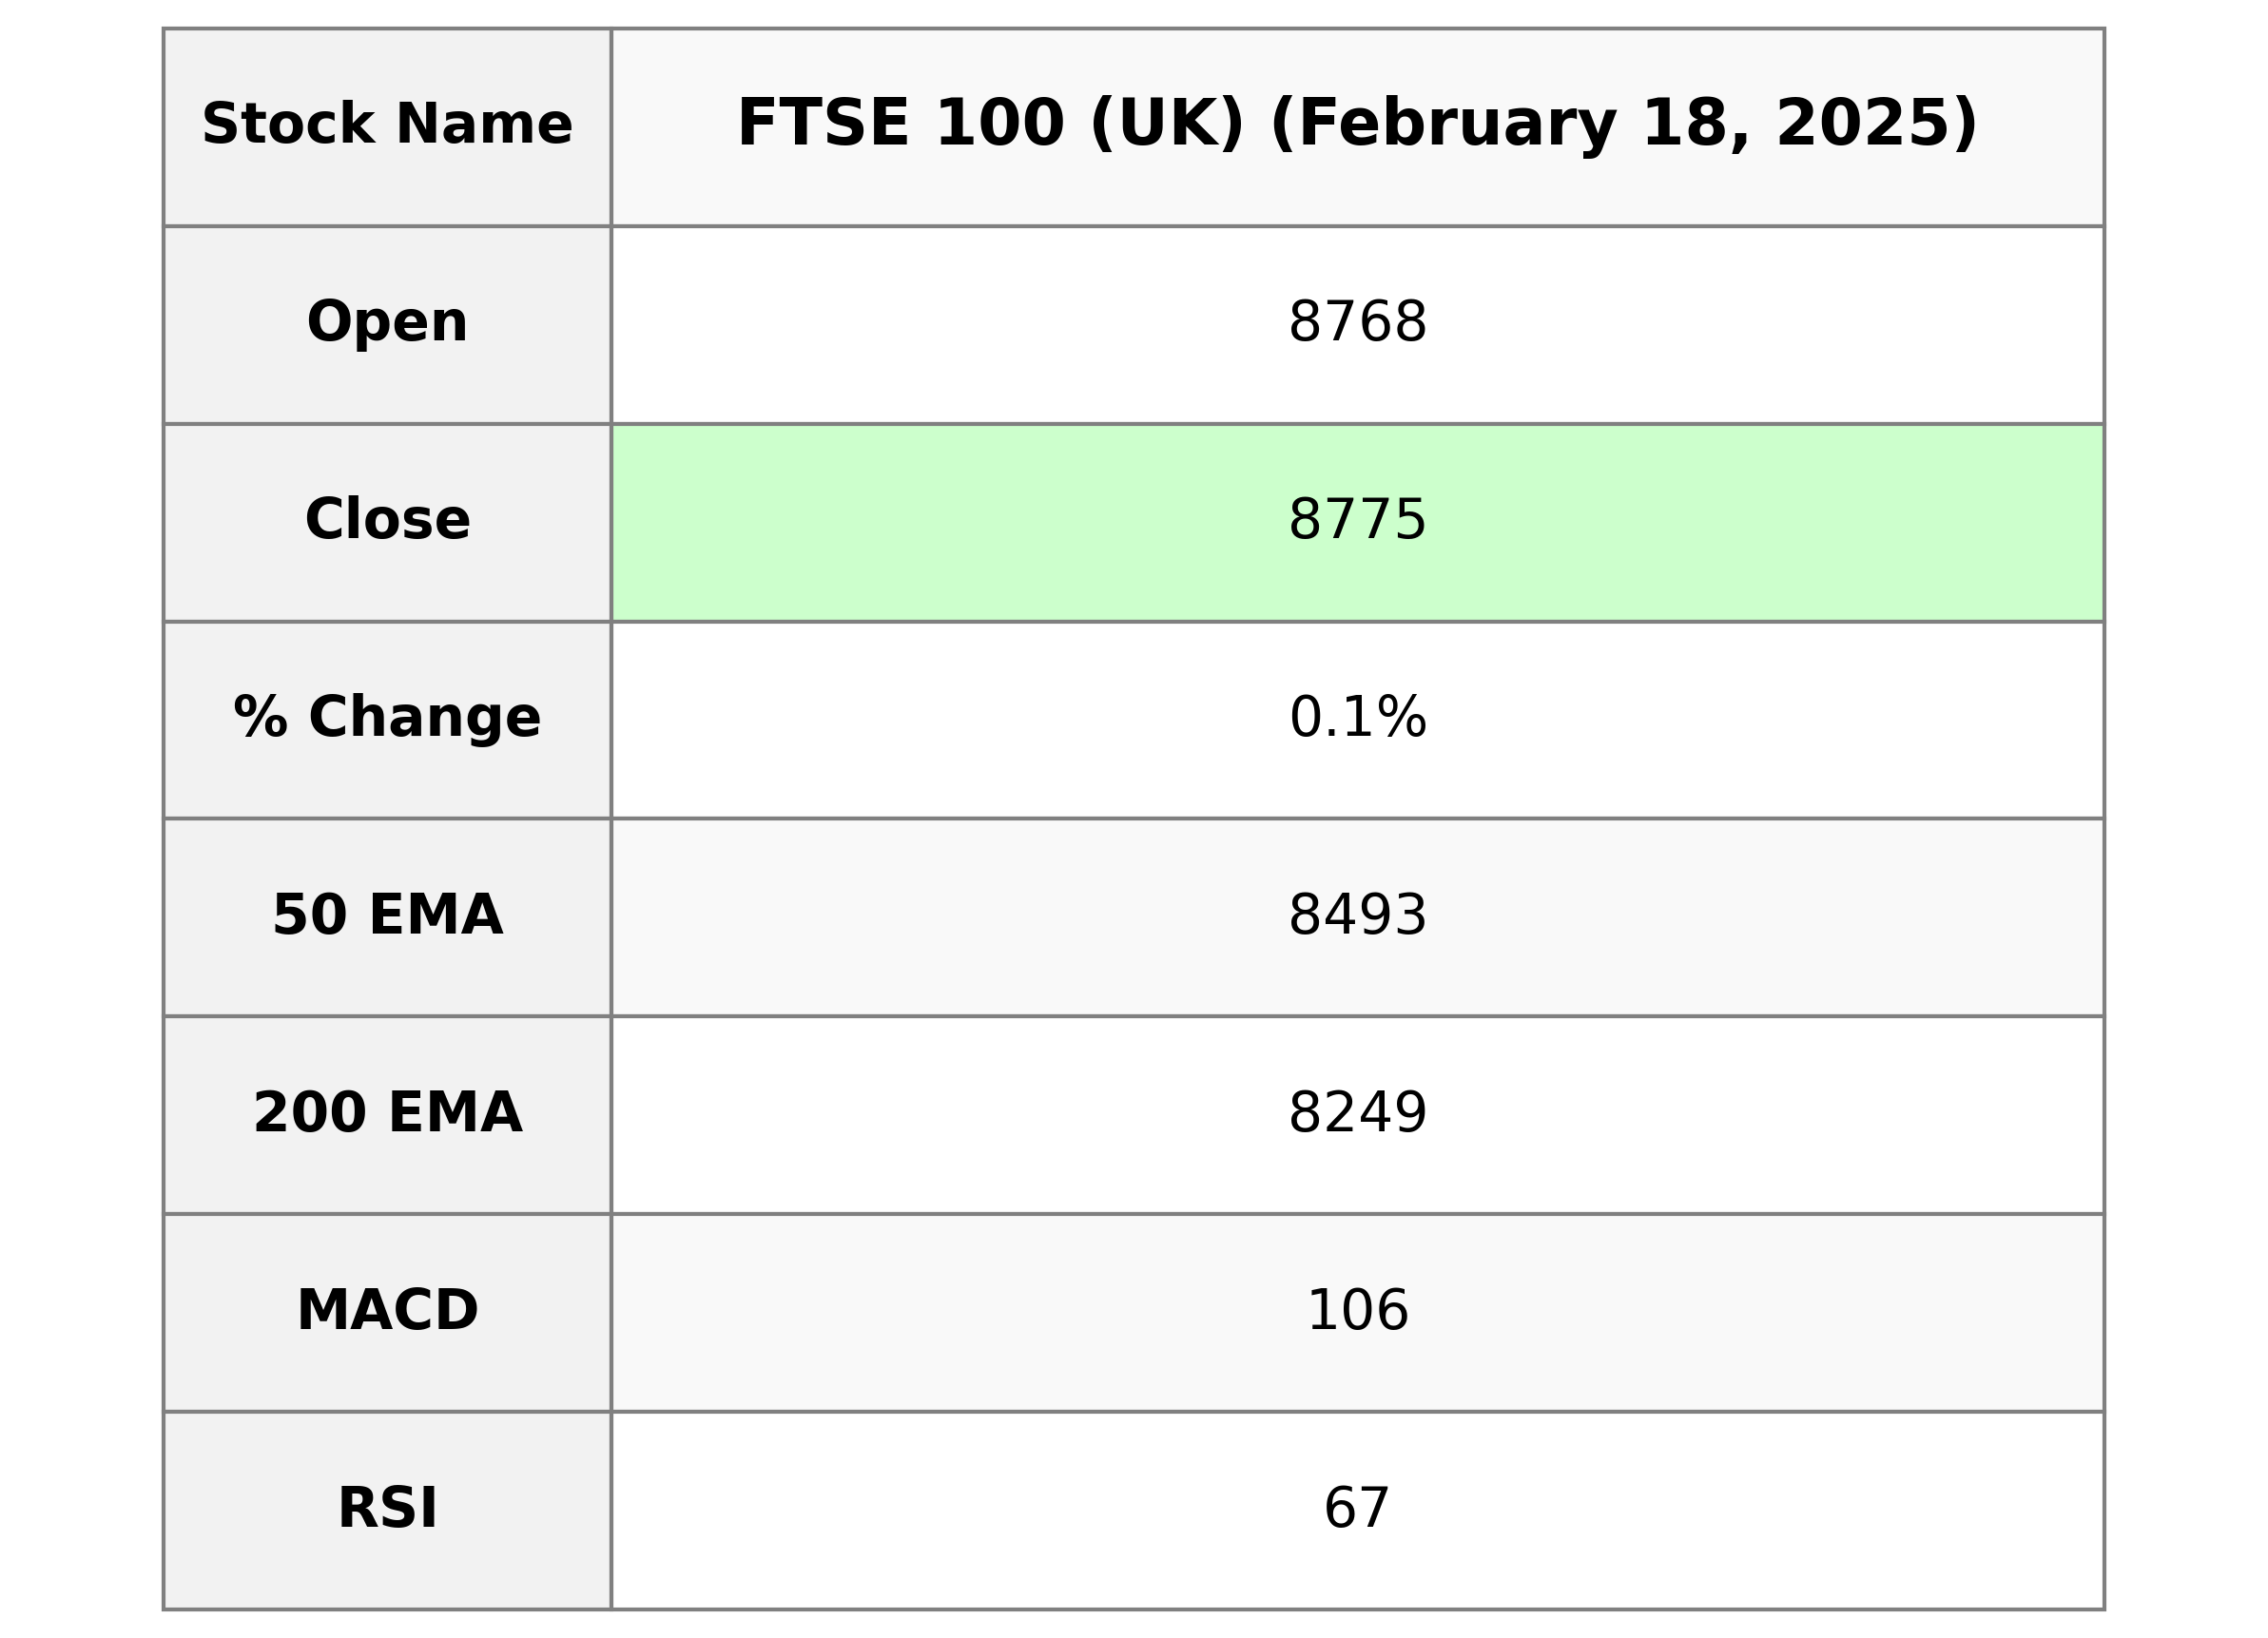
FTSE 100 (UK) opened at 8768.01 and closed at 8774.99 on the trading day, marking a slight increase of 0.08% with a point change of 6.99. The index reached a high of 8787.66 and a low of 8757.82, with a current RSI of 66.71, indicating a relatively strong market sentiment.
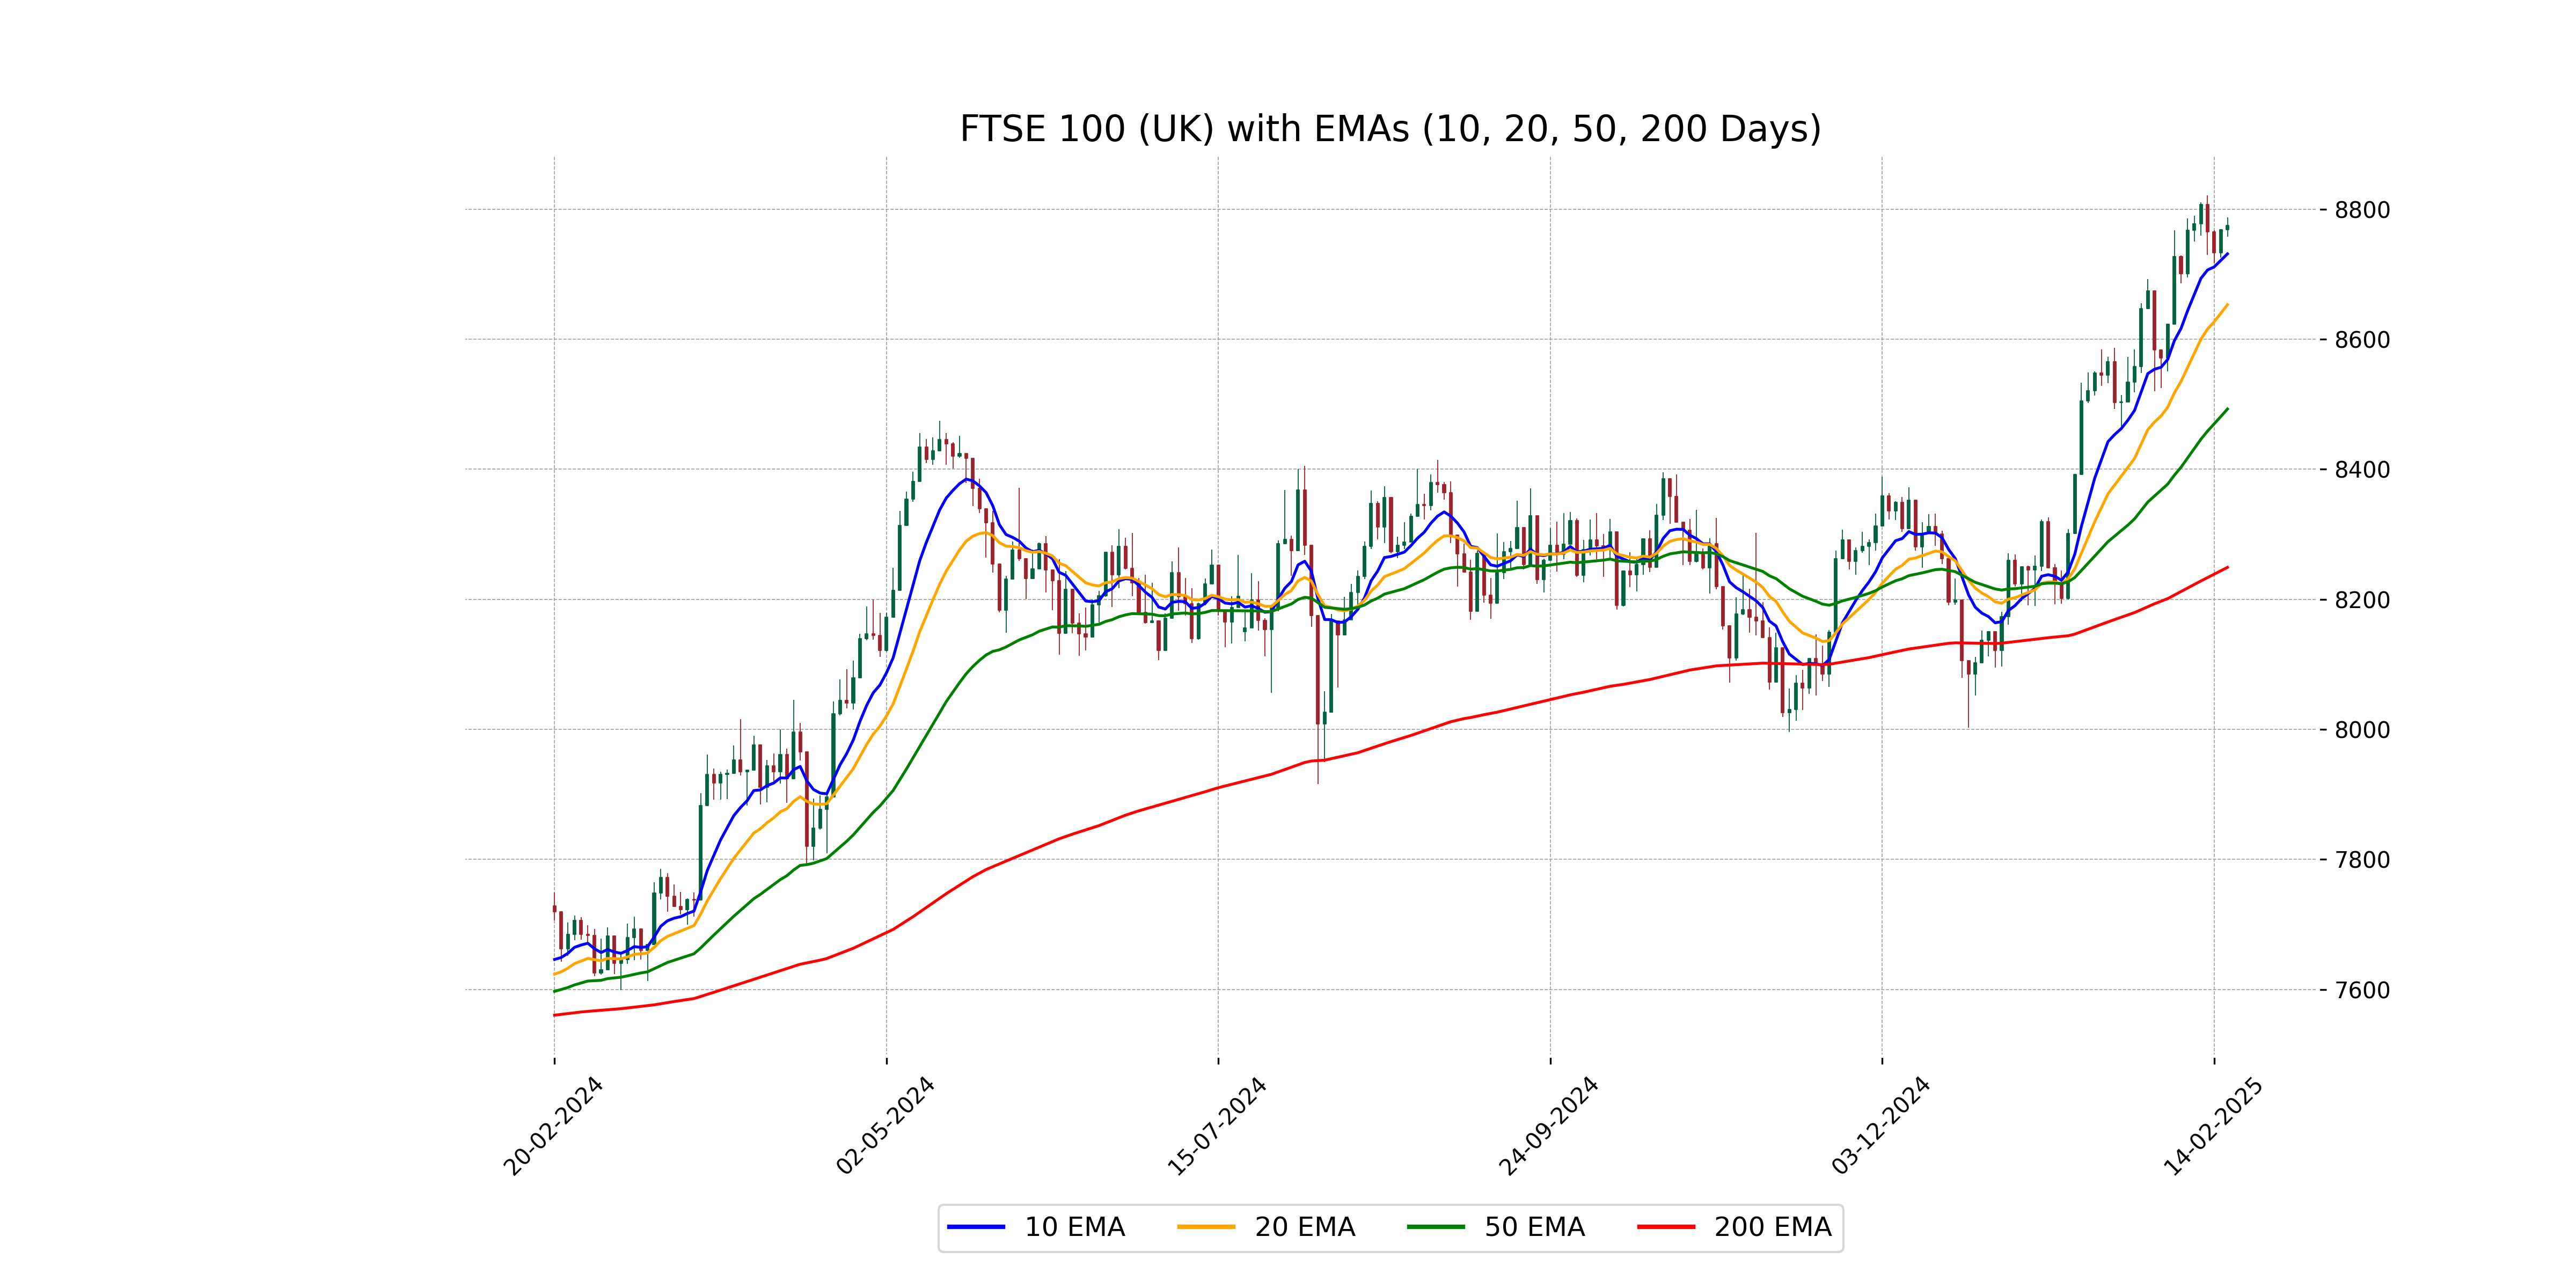
Relationship with Key Moving Averages
The FTSE 100 is trading above its key moving averages, indicating a bullish momentum. It is above the 50-day EMA of 8492.61, 200-day EMA of 8249.01, and marginally above the 10-day EMA of 8731.24. This suggests strong short- to long-term relative strength in the market index.
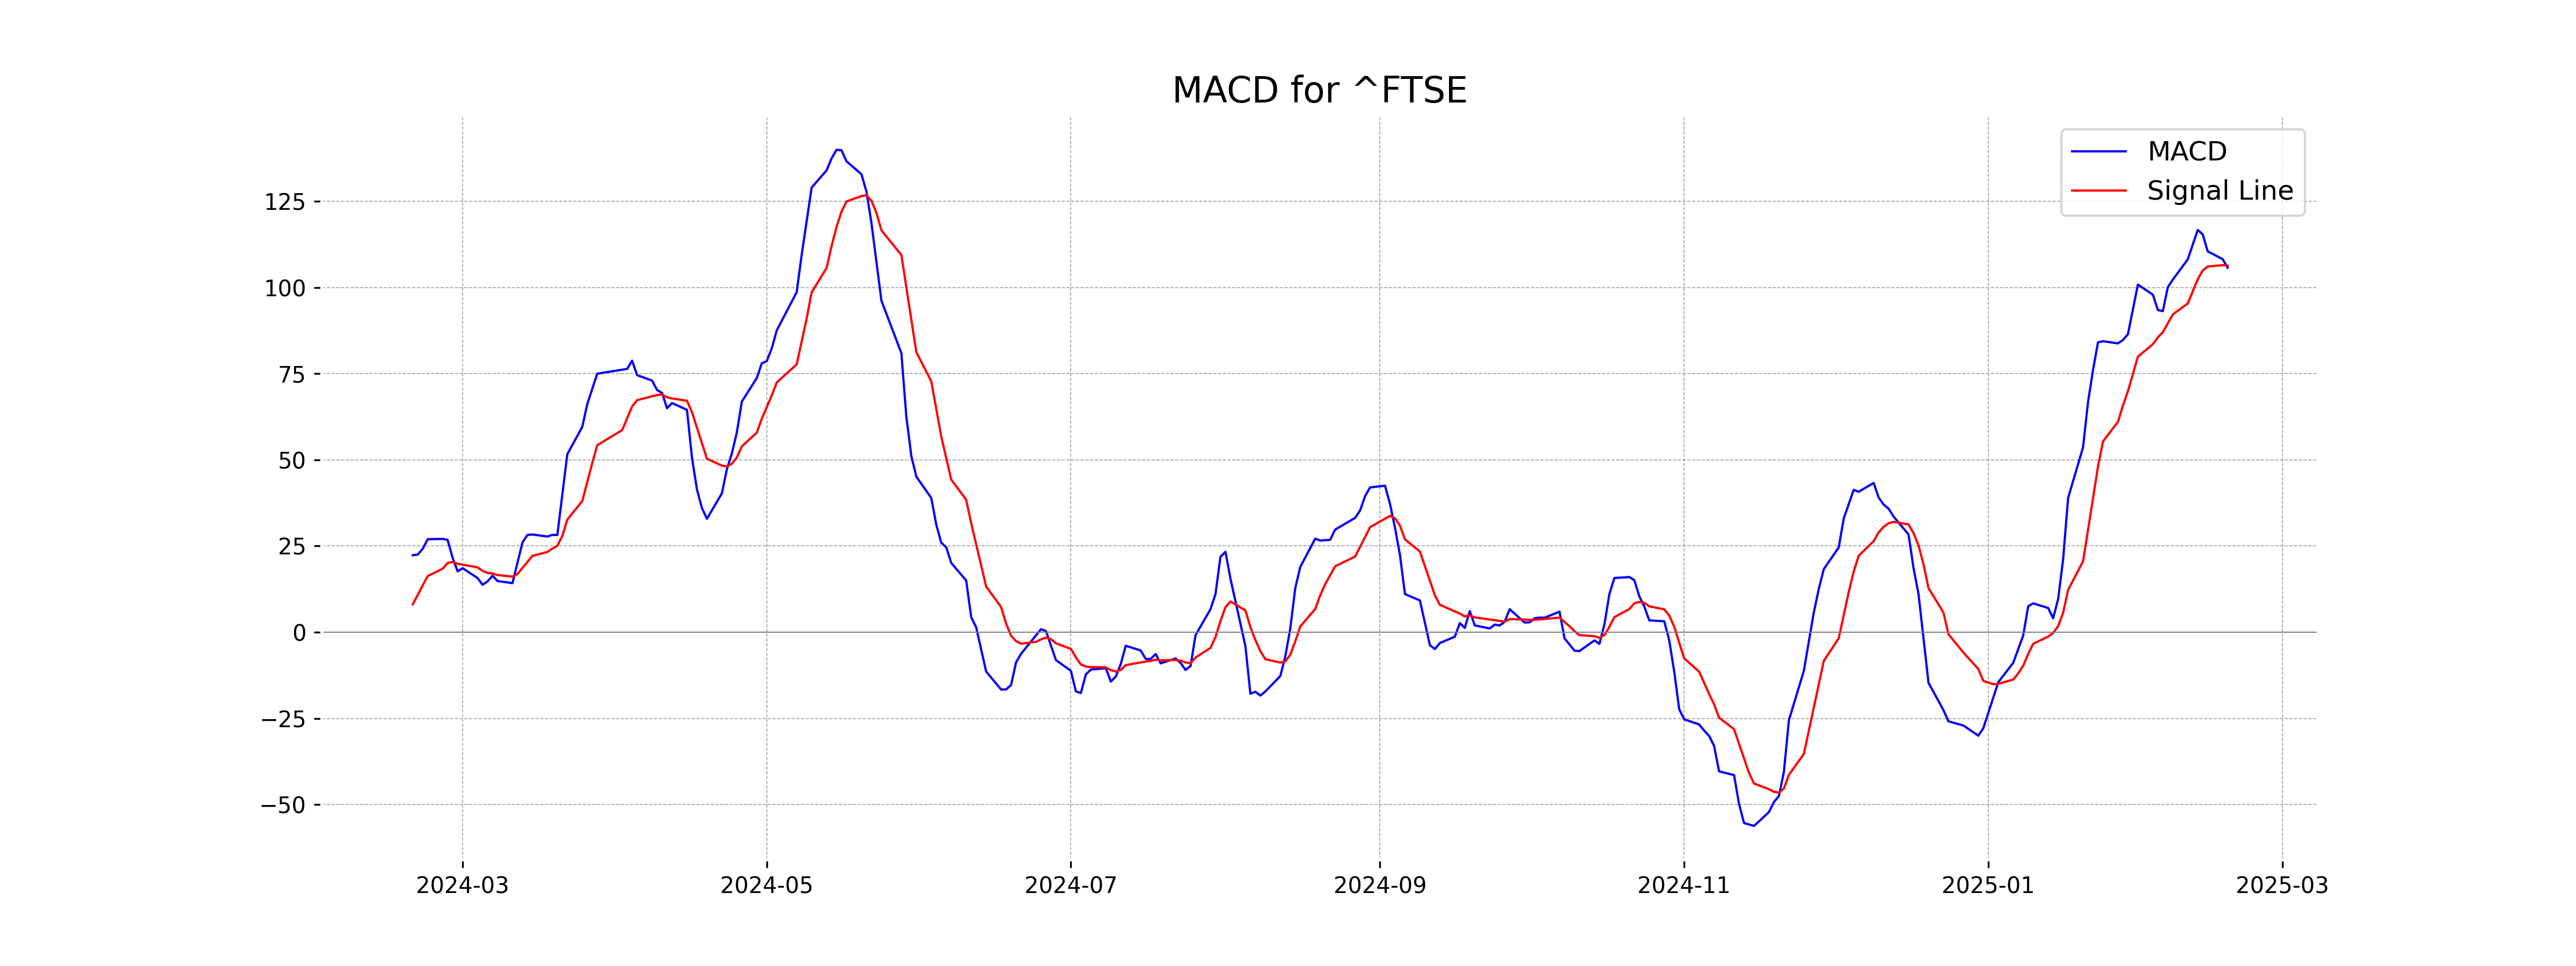
Moving Averages Trend (MACD)
FTSE 100 shows a MACD of 105.77, which is slightly below the MACD Signal value of 106.36. This indicates a bearish momentum in the short term as the MACD line crosses below the signal line.
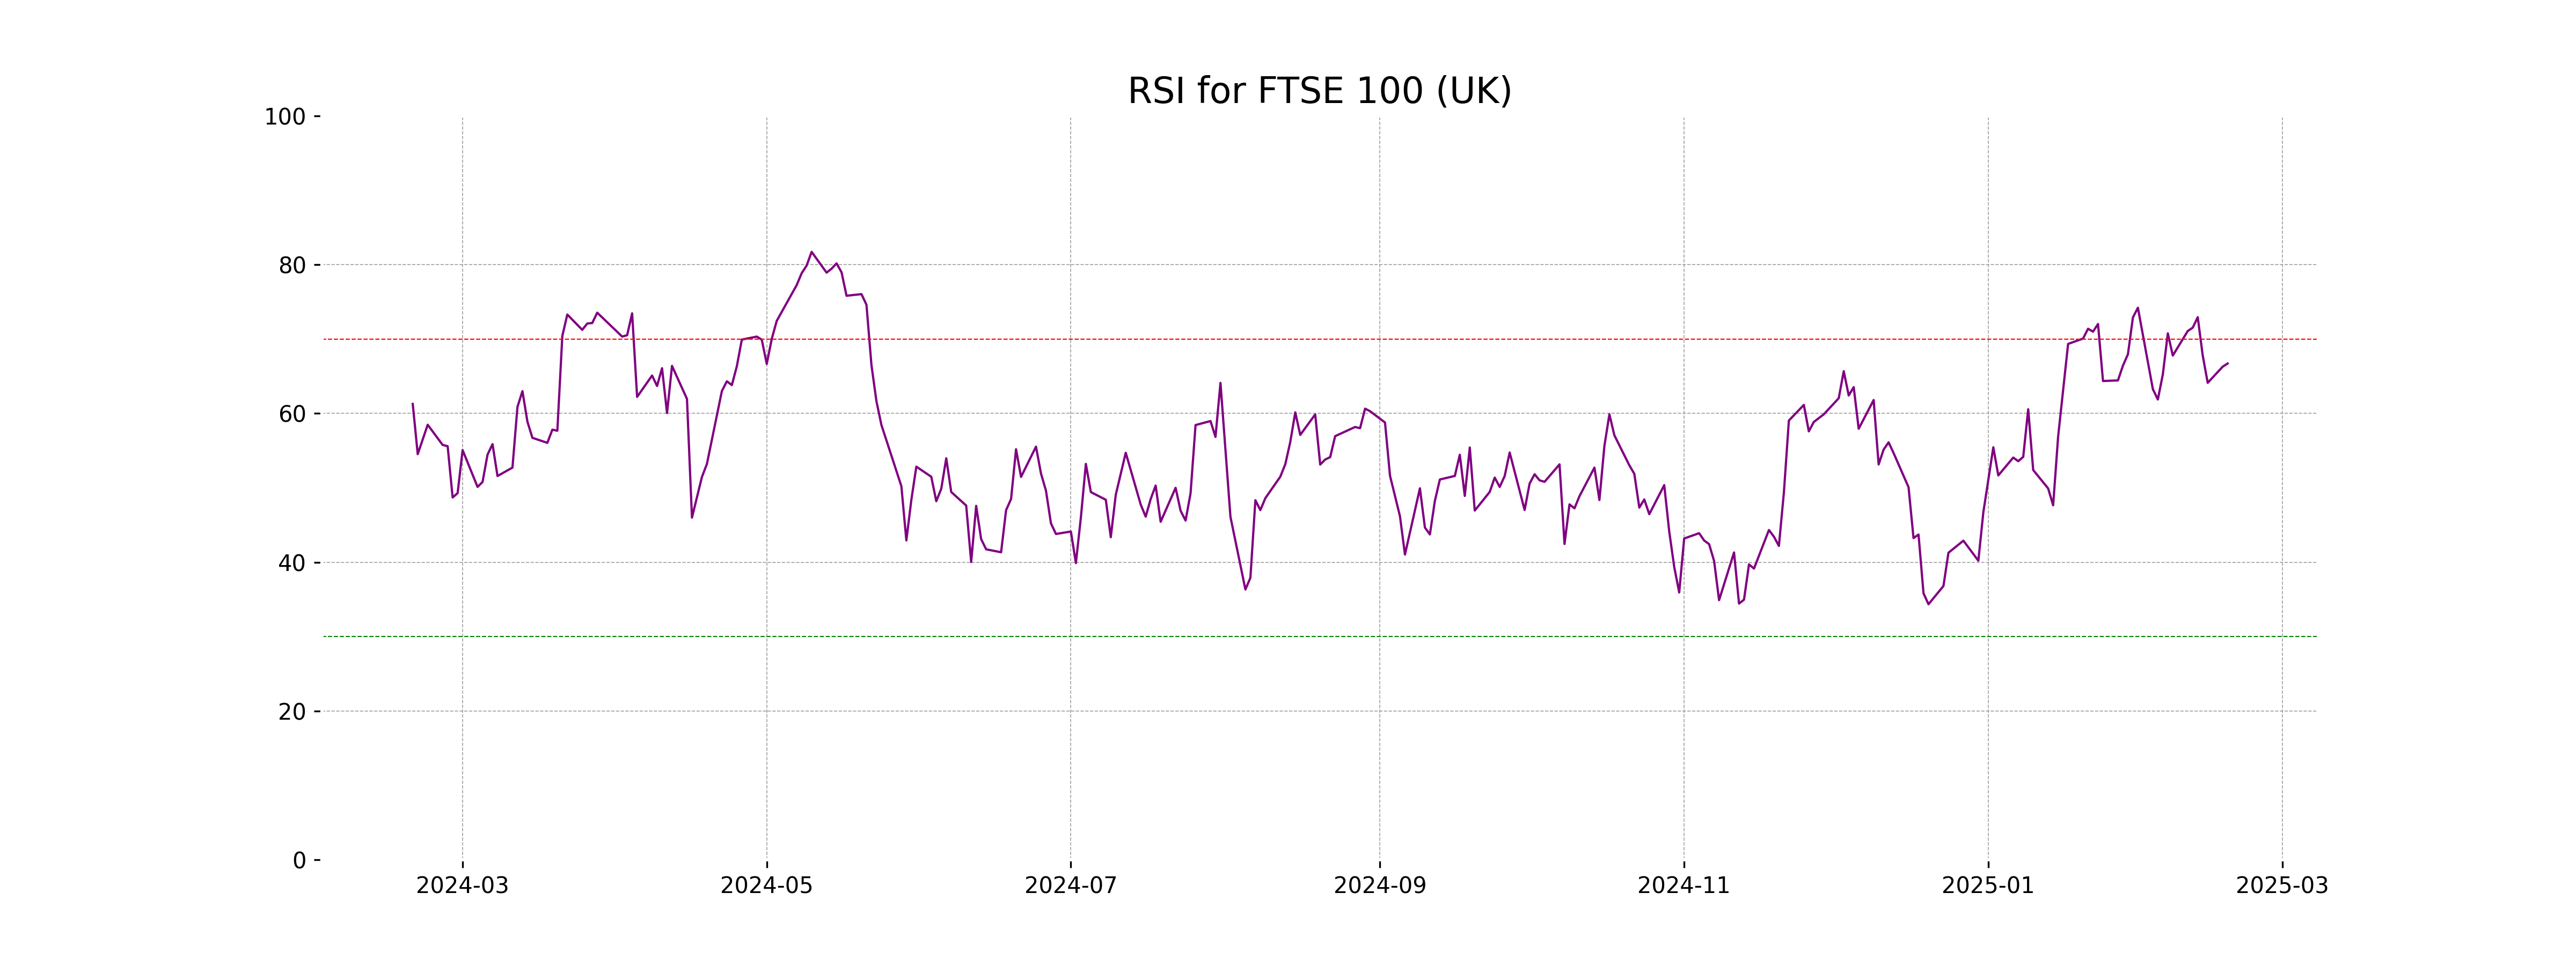
RSI Analysis
The FTSE 100's RSI is 66.71, indicating that it is approaching overbought territory. This suggests potential upward momentum but also signals caution for a possible price pullback if it continues to rise above 70.
Analysis for DAX (Germany) - February 18, 2025
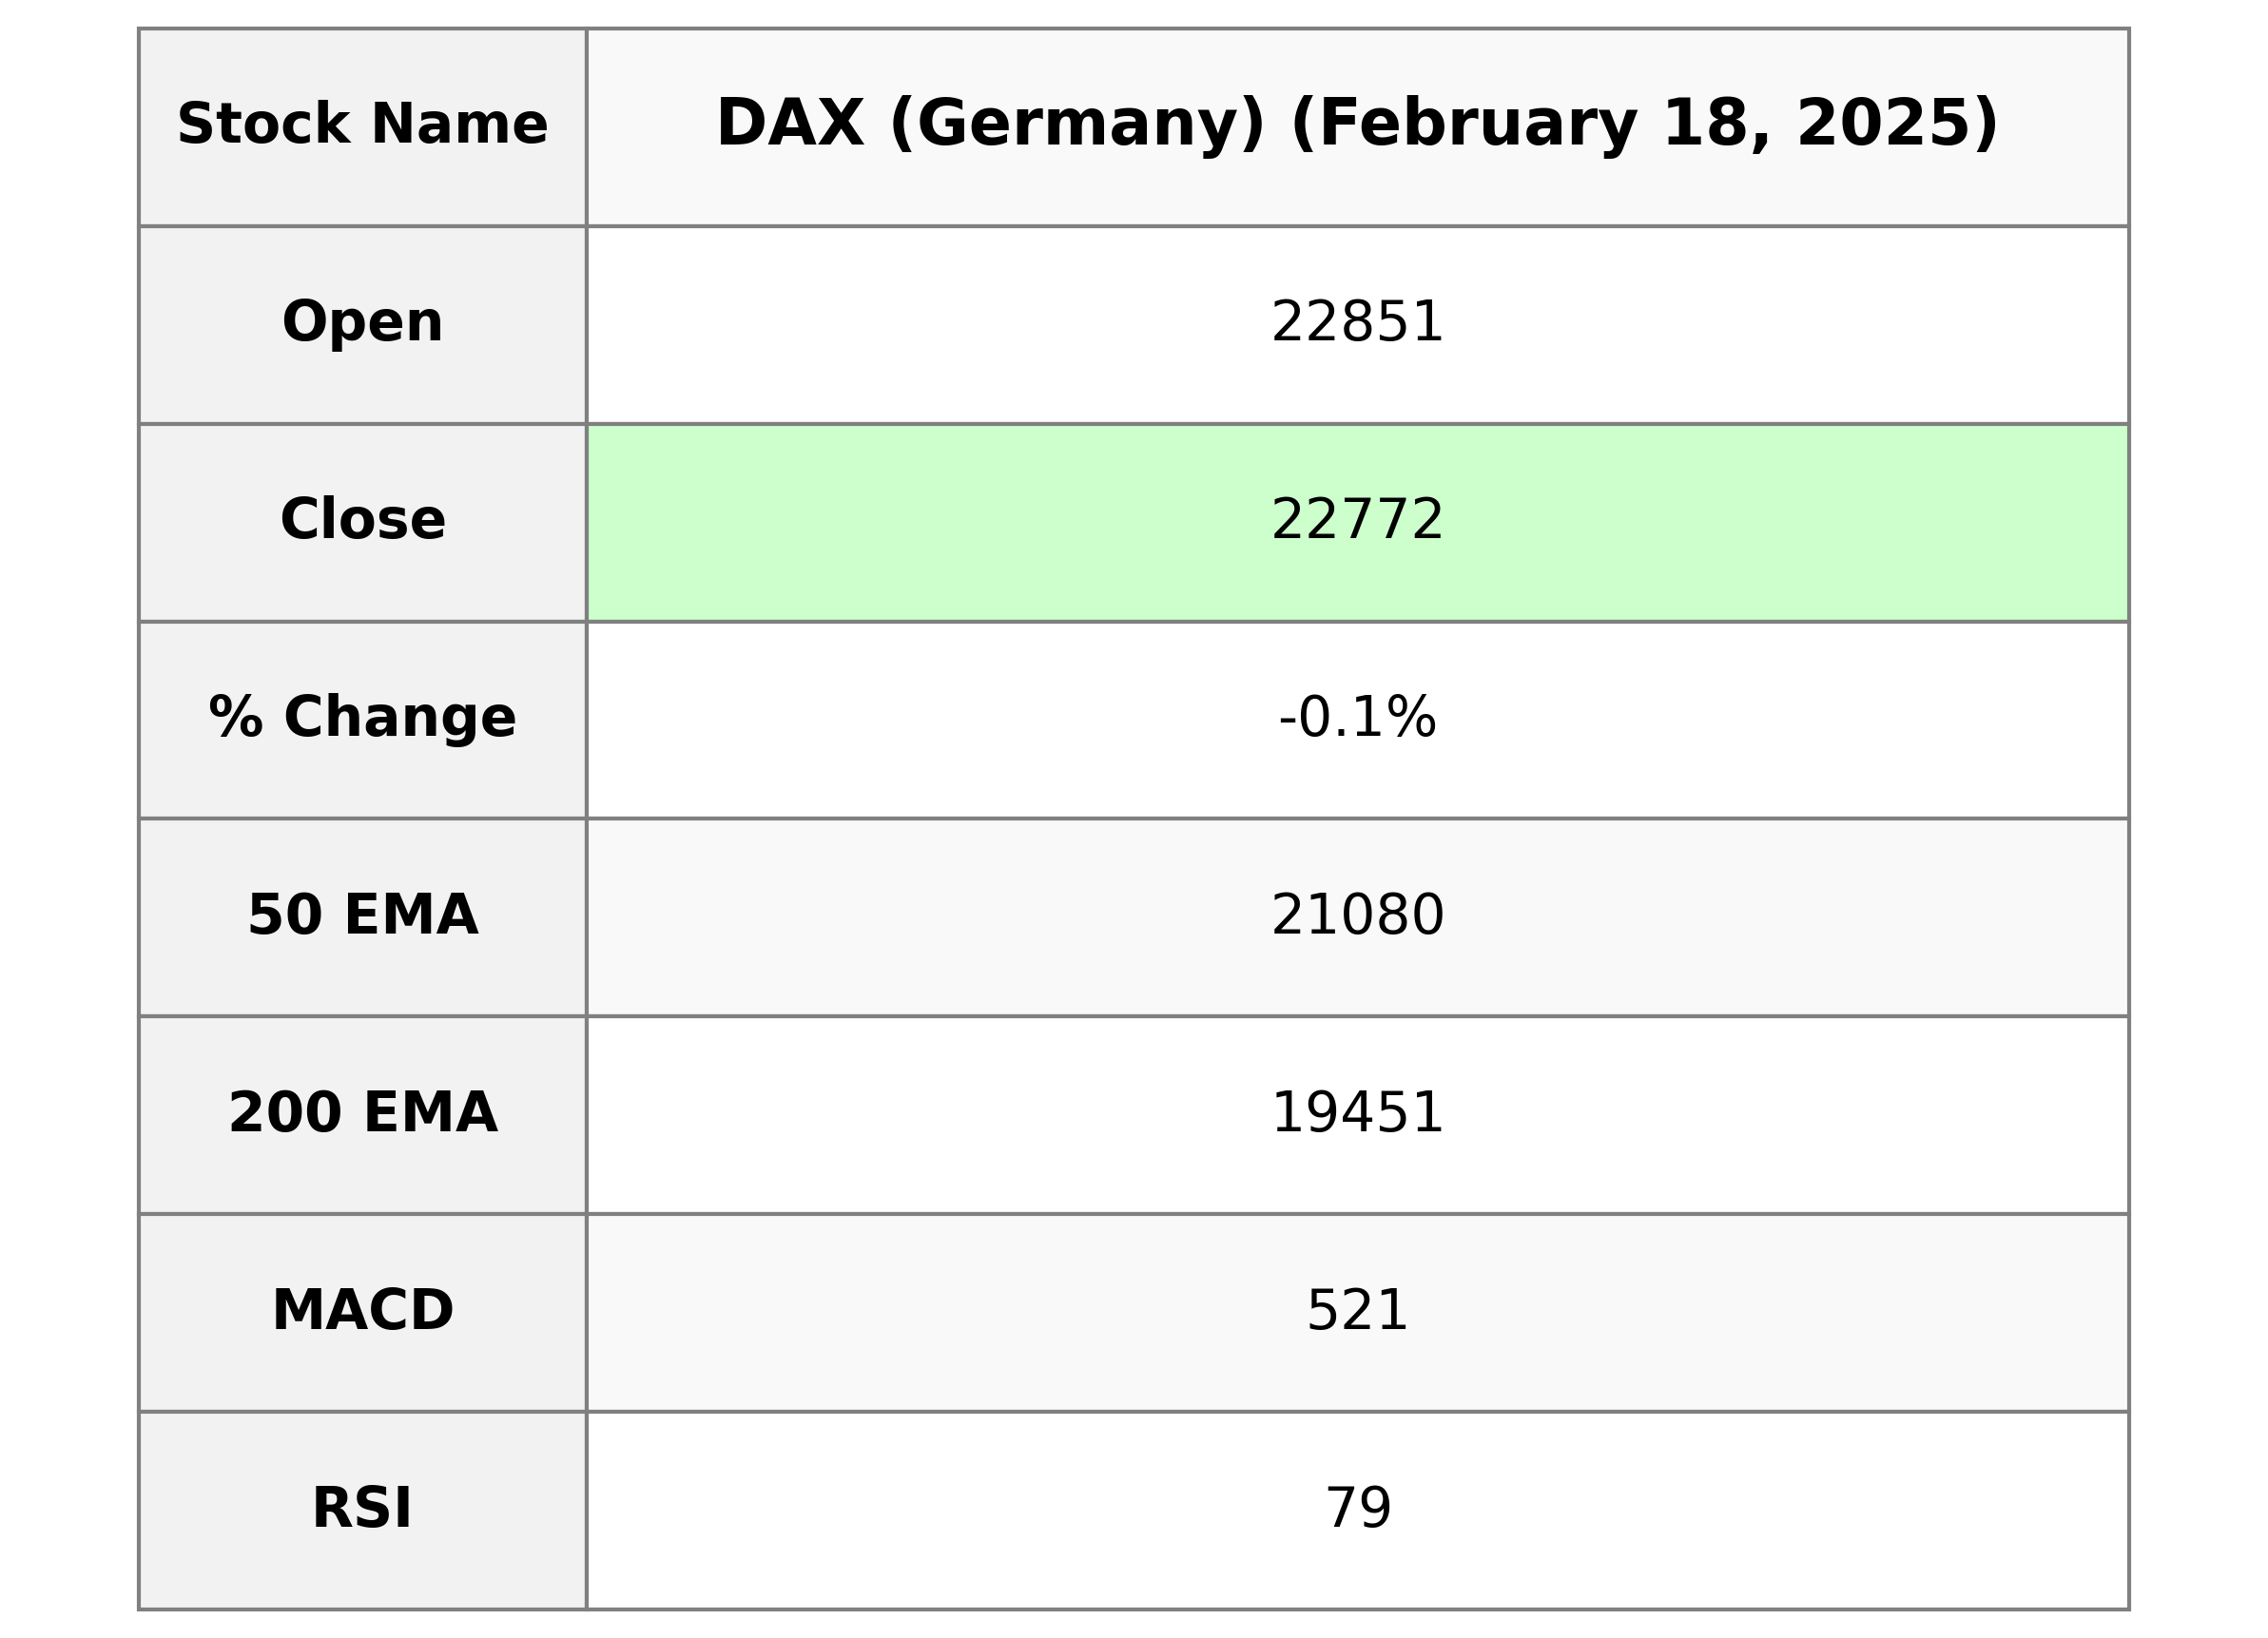
DAX (Germany) opened at 22,851.37, with a high of the same value and a low of 22,715.25, closing at 22,771.55. The index experienced a slight decline of 0.12% from the previous close. Notably, the RSI indicated overbought conditions at 78.73, and the MACD was above its signal line, suggesting bullish momentum.
Relationship with Key Moving Averages
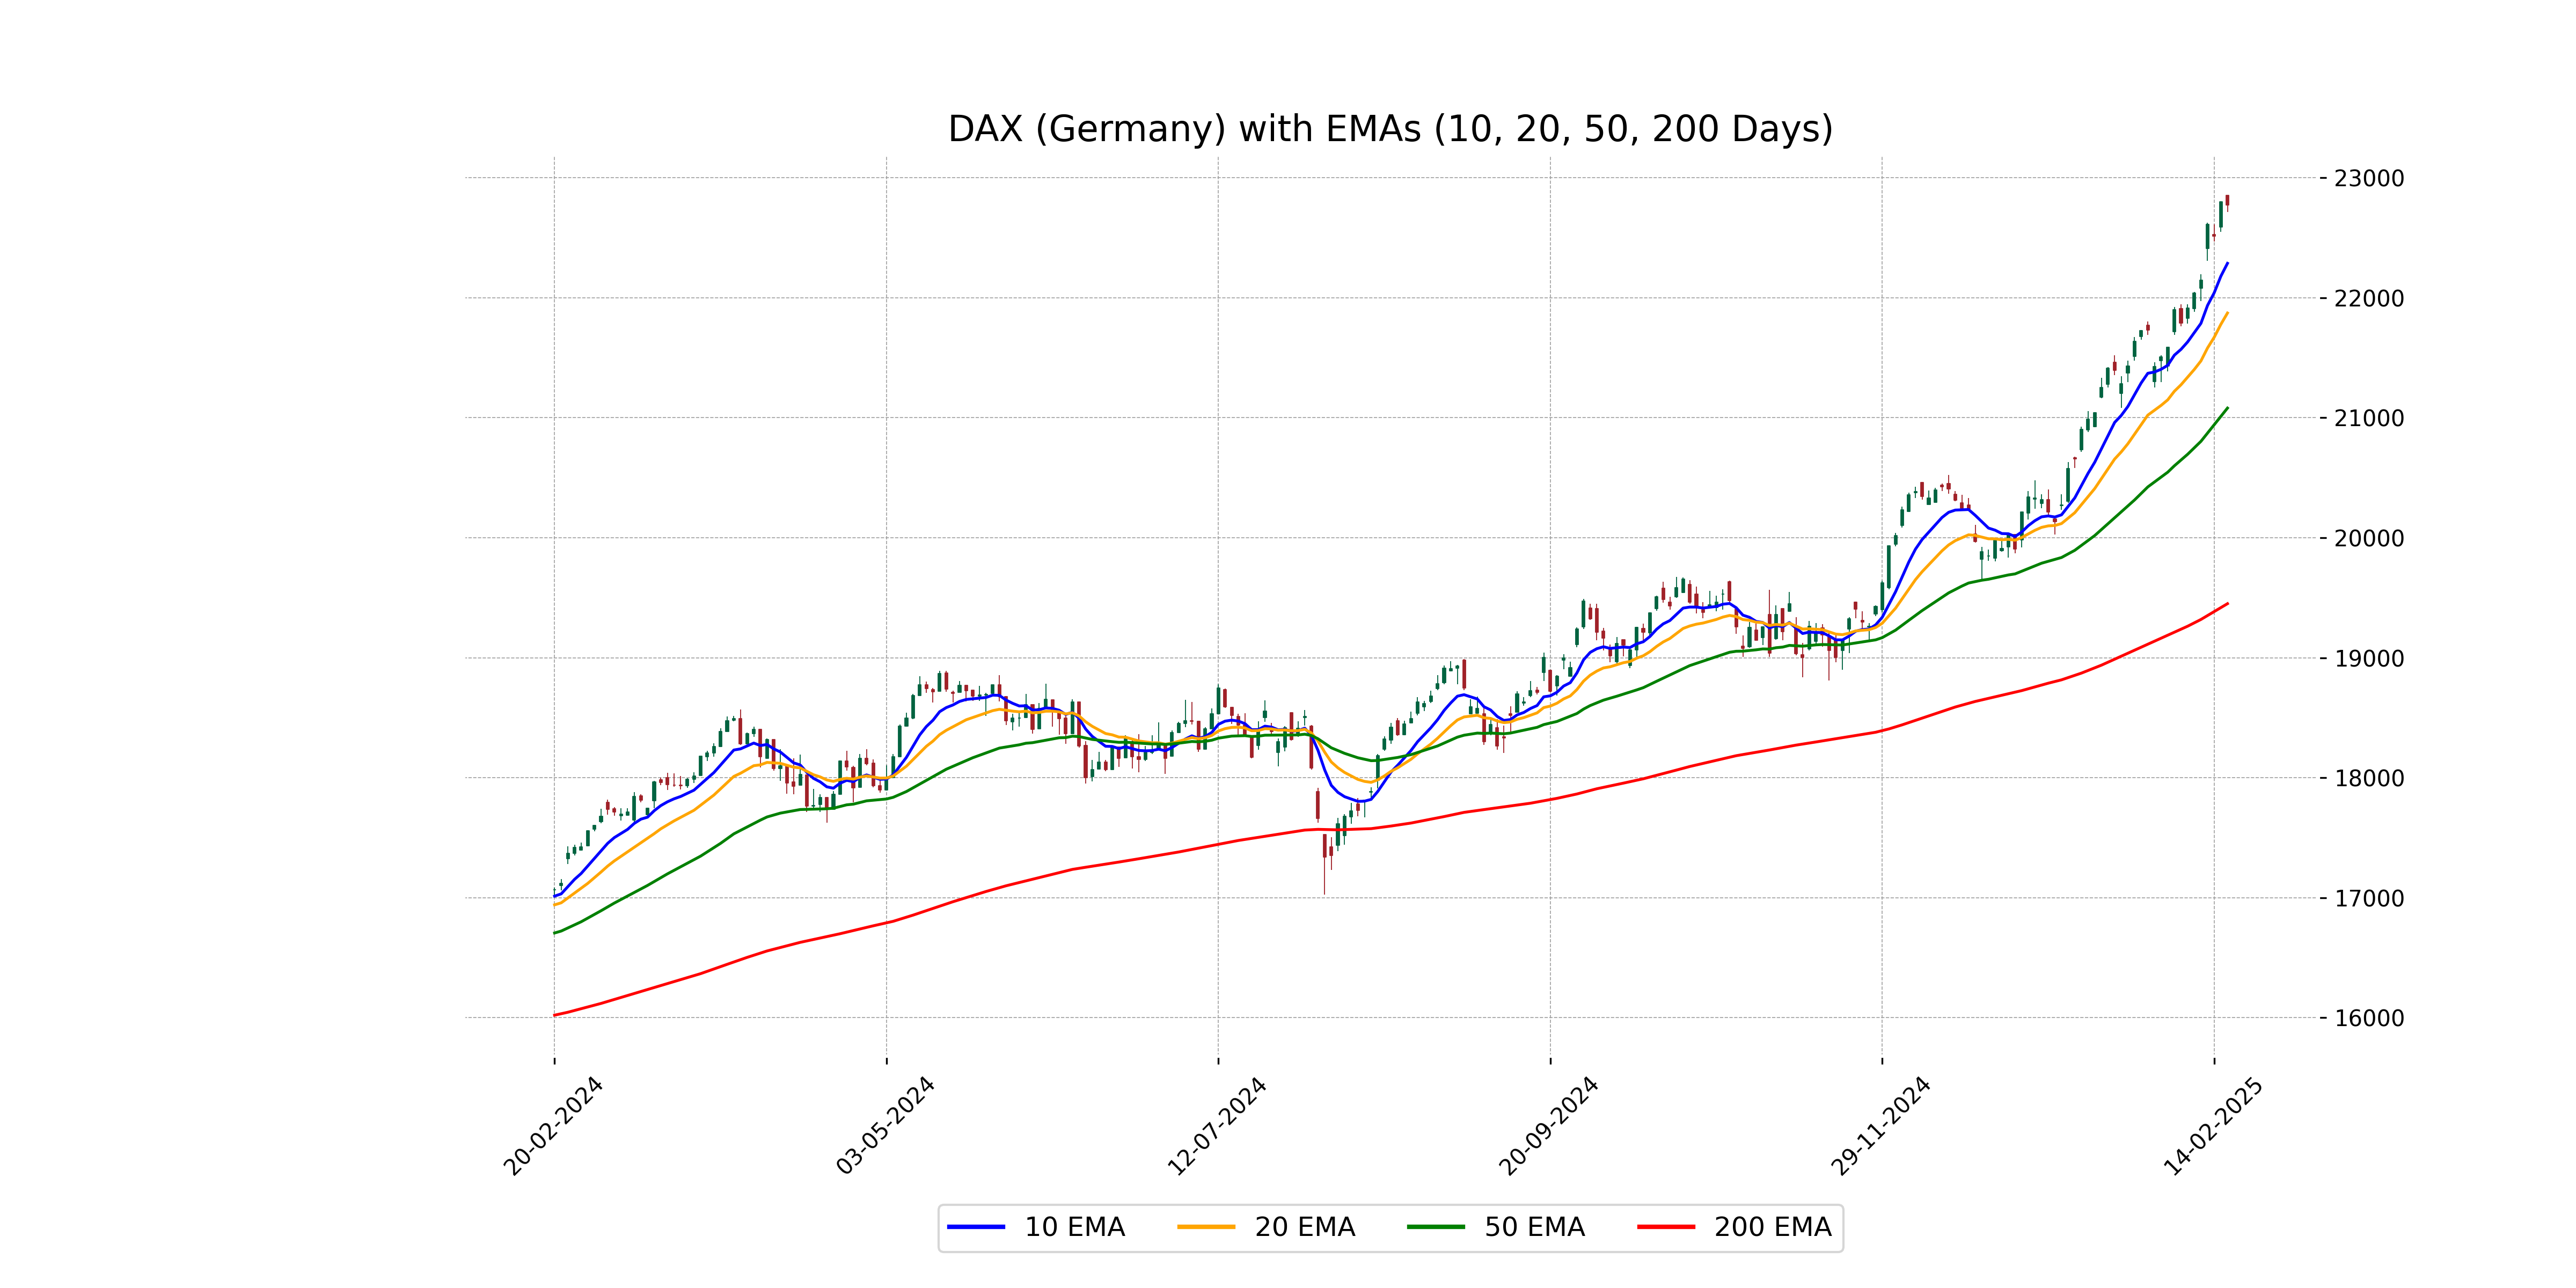
The DAX (Germany) index is currently trading above its key moving averages, with the close of 22771.55 exceeding the 50 EMA of 21080.30, 200 EMA of 19450.55, 10 EMA of 22286.59, and 20 EMA of 21872.41. This indicates a strong bullish trend, particularly given the RSI of 78.73, which suggests overbought conditions.
Moving Averages Trend (MACD)
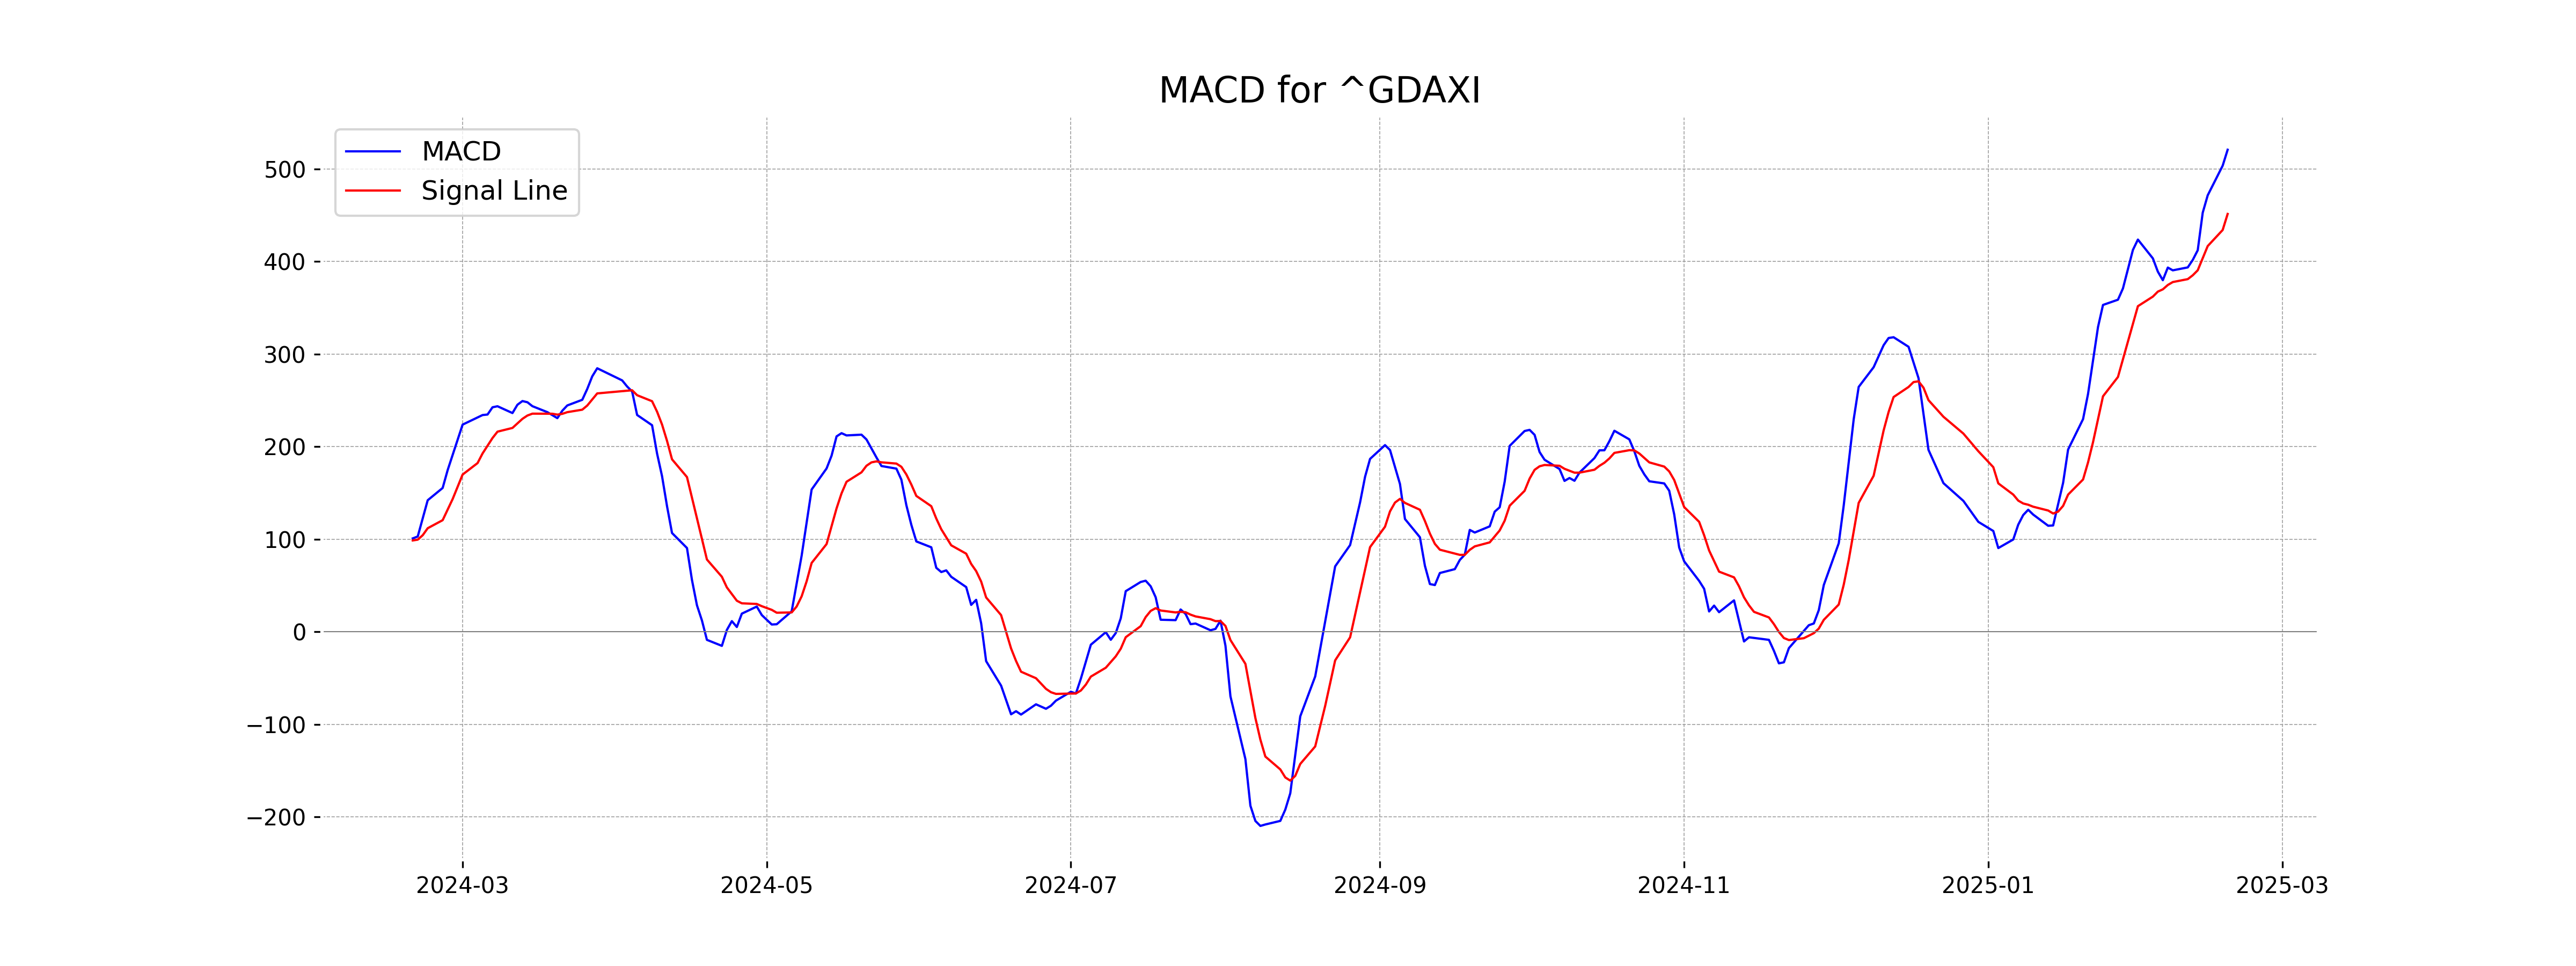
Based on the stock data for DAX (Germany), the MACD value is 520.85, which is above the MACD Signal line at 451.49, indicating a bullish signal. This suggests potential upward momentum in the market.
RSI Analysis
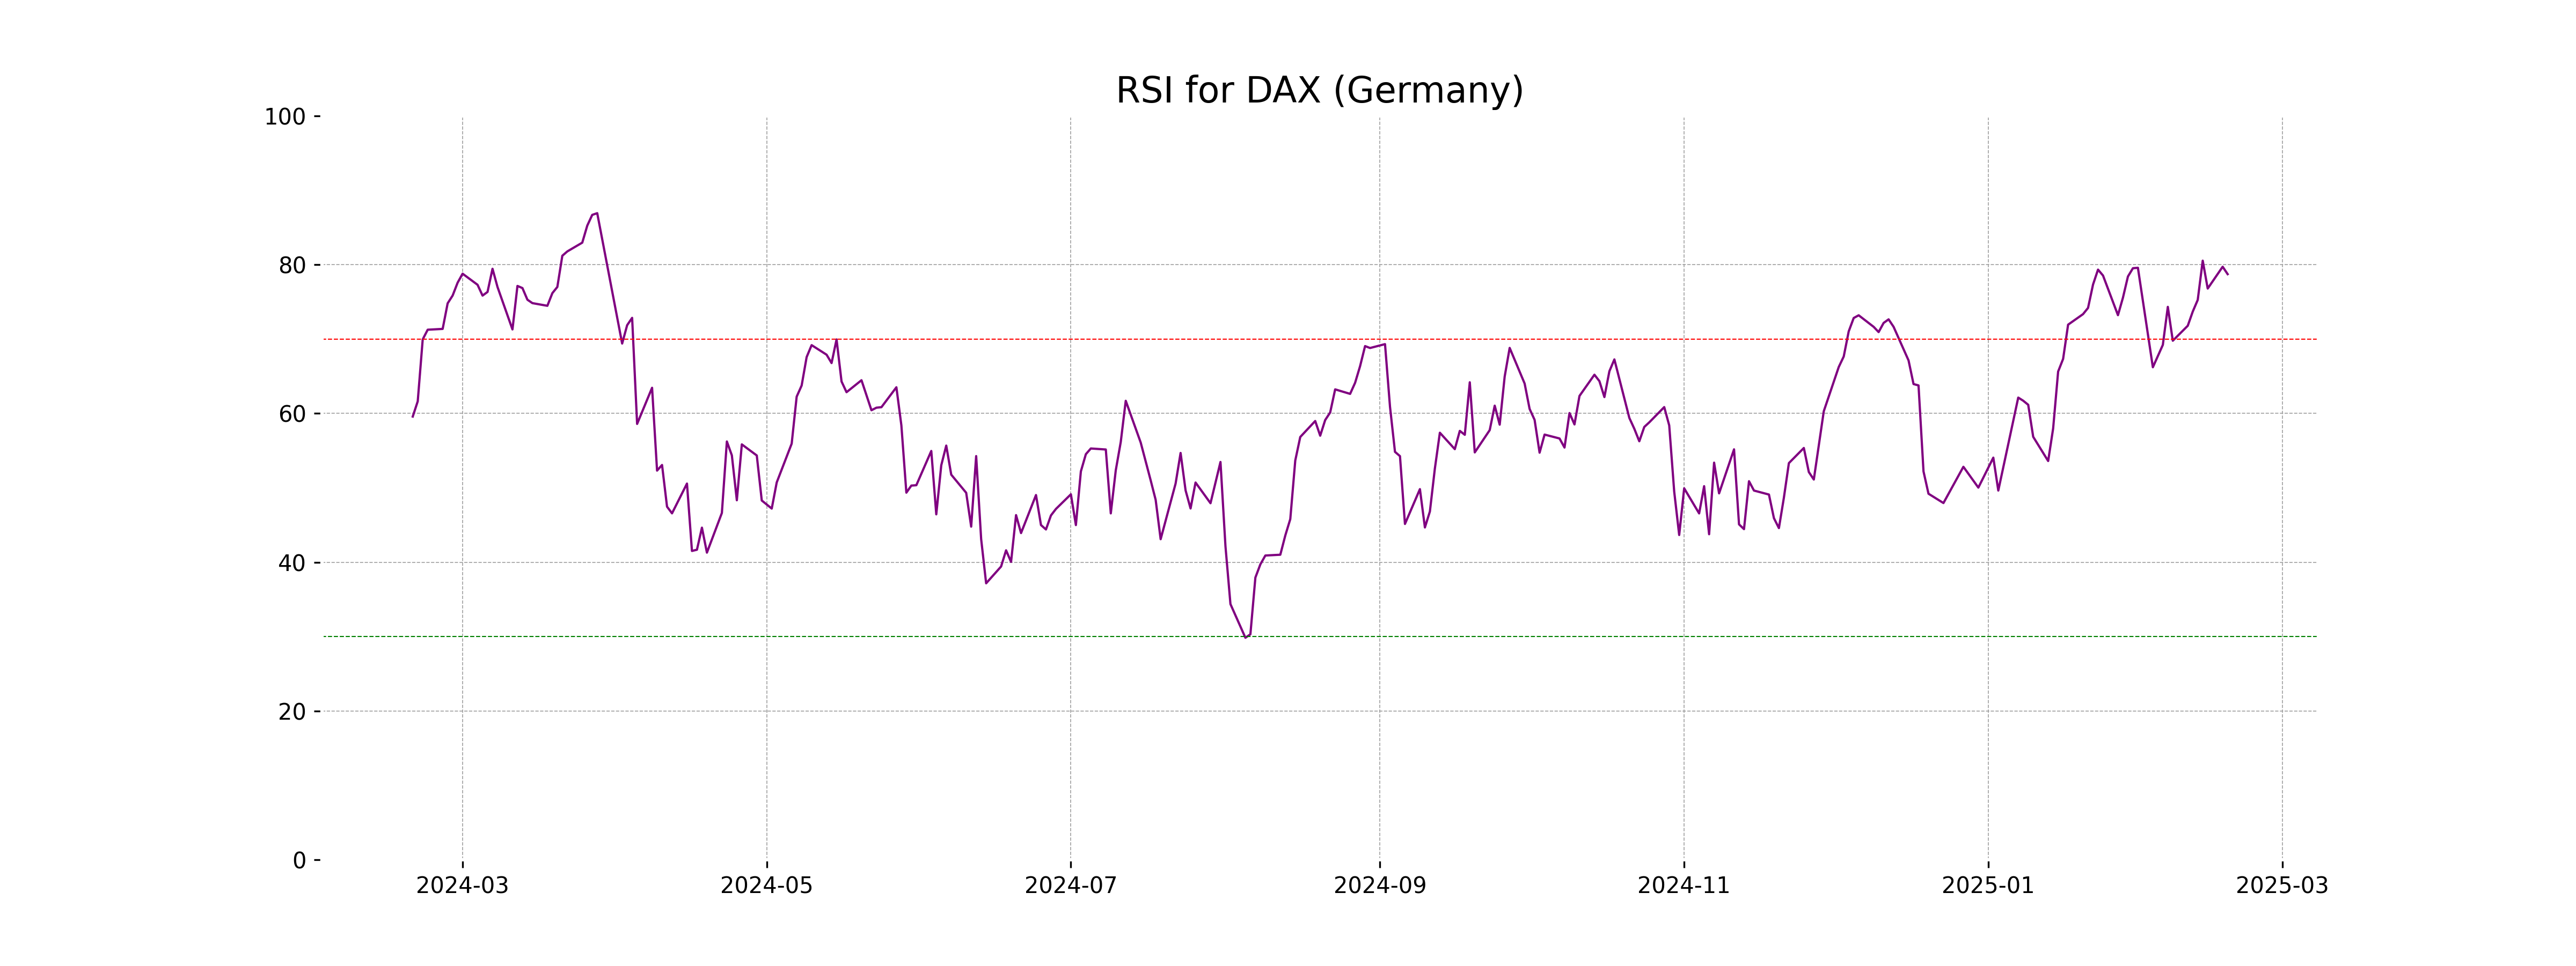
The RSI for DAX (Germany) is 78.73, which typically indicates an overbought condition. This suggests that the index might be at a high point with potential for a price correction in the near future. Traders often consider an RSI above 70 as a signal for a potential market pullback.
Analysis for S&P 500 (US) - February 18, 2025
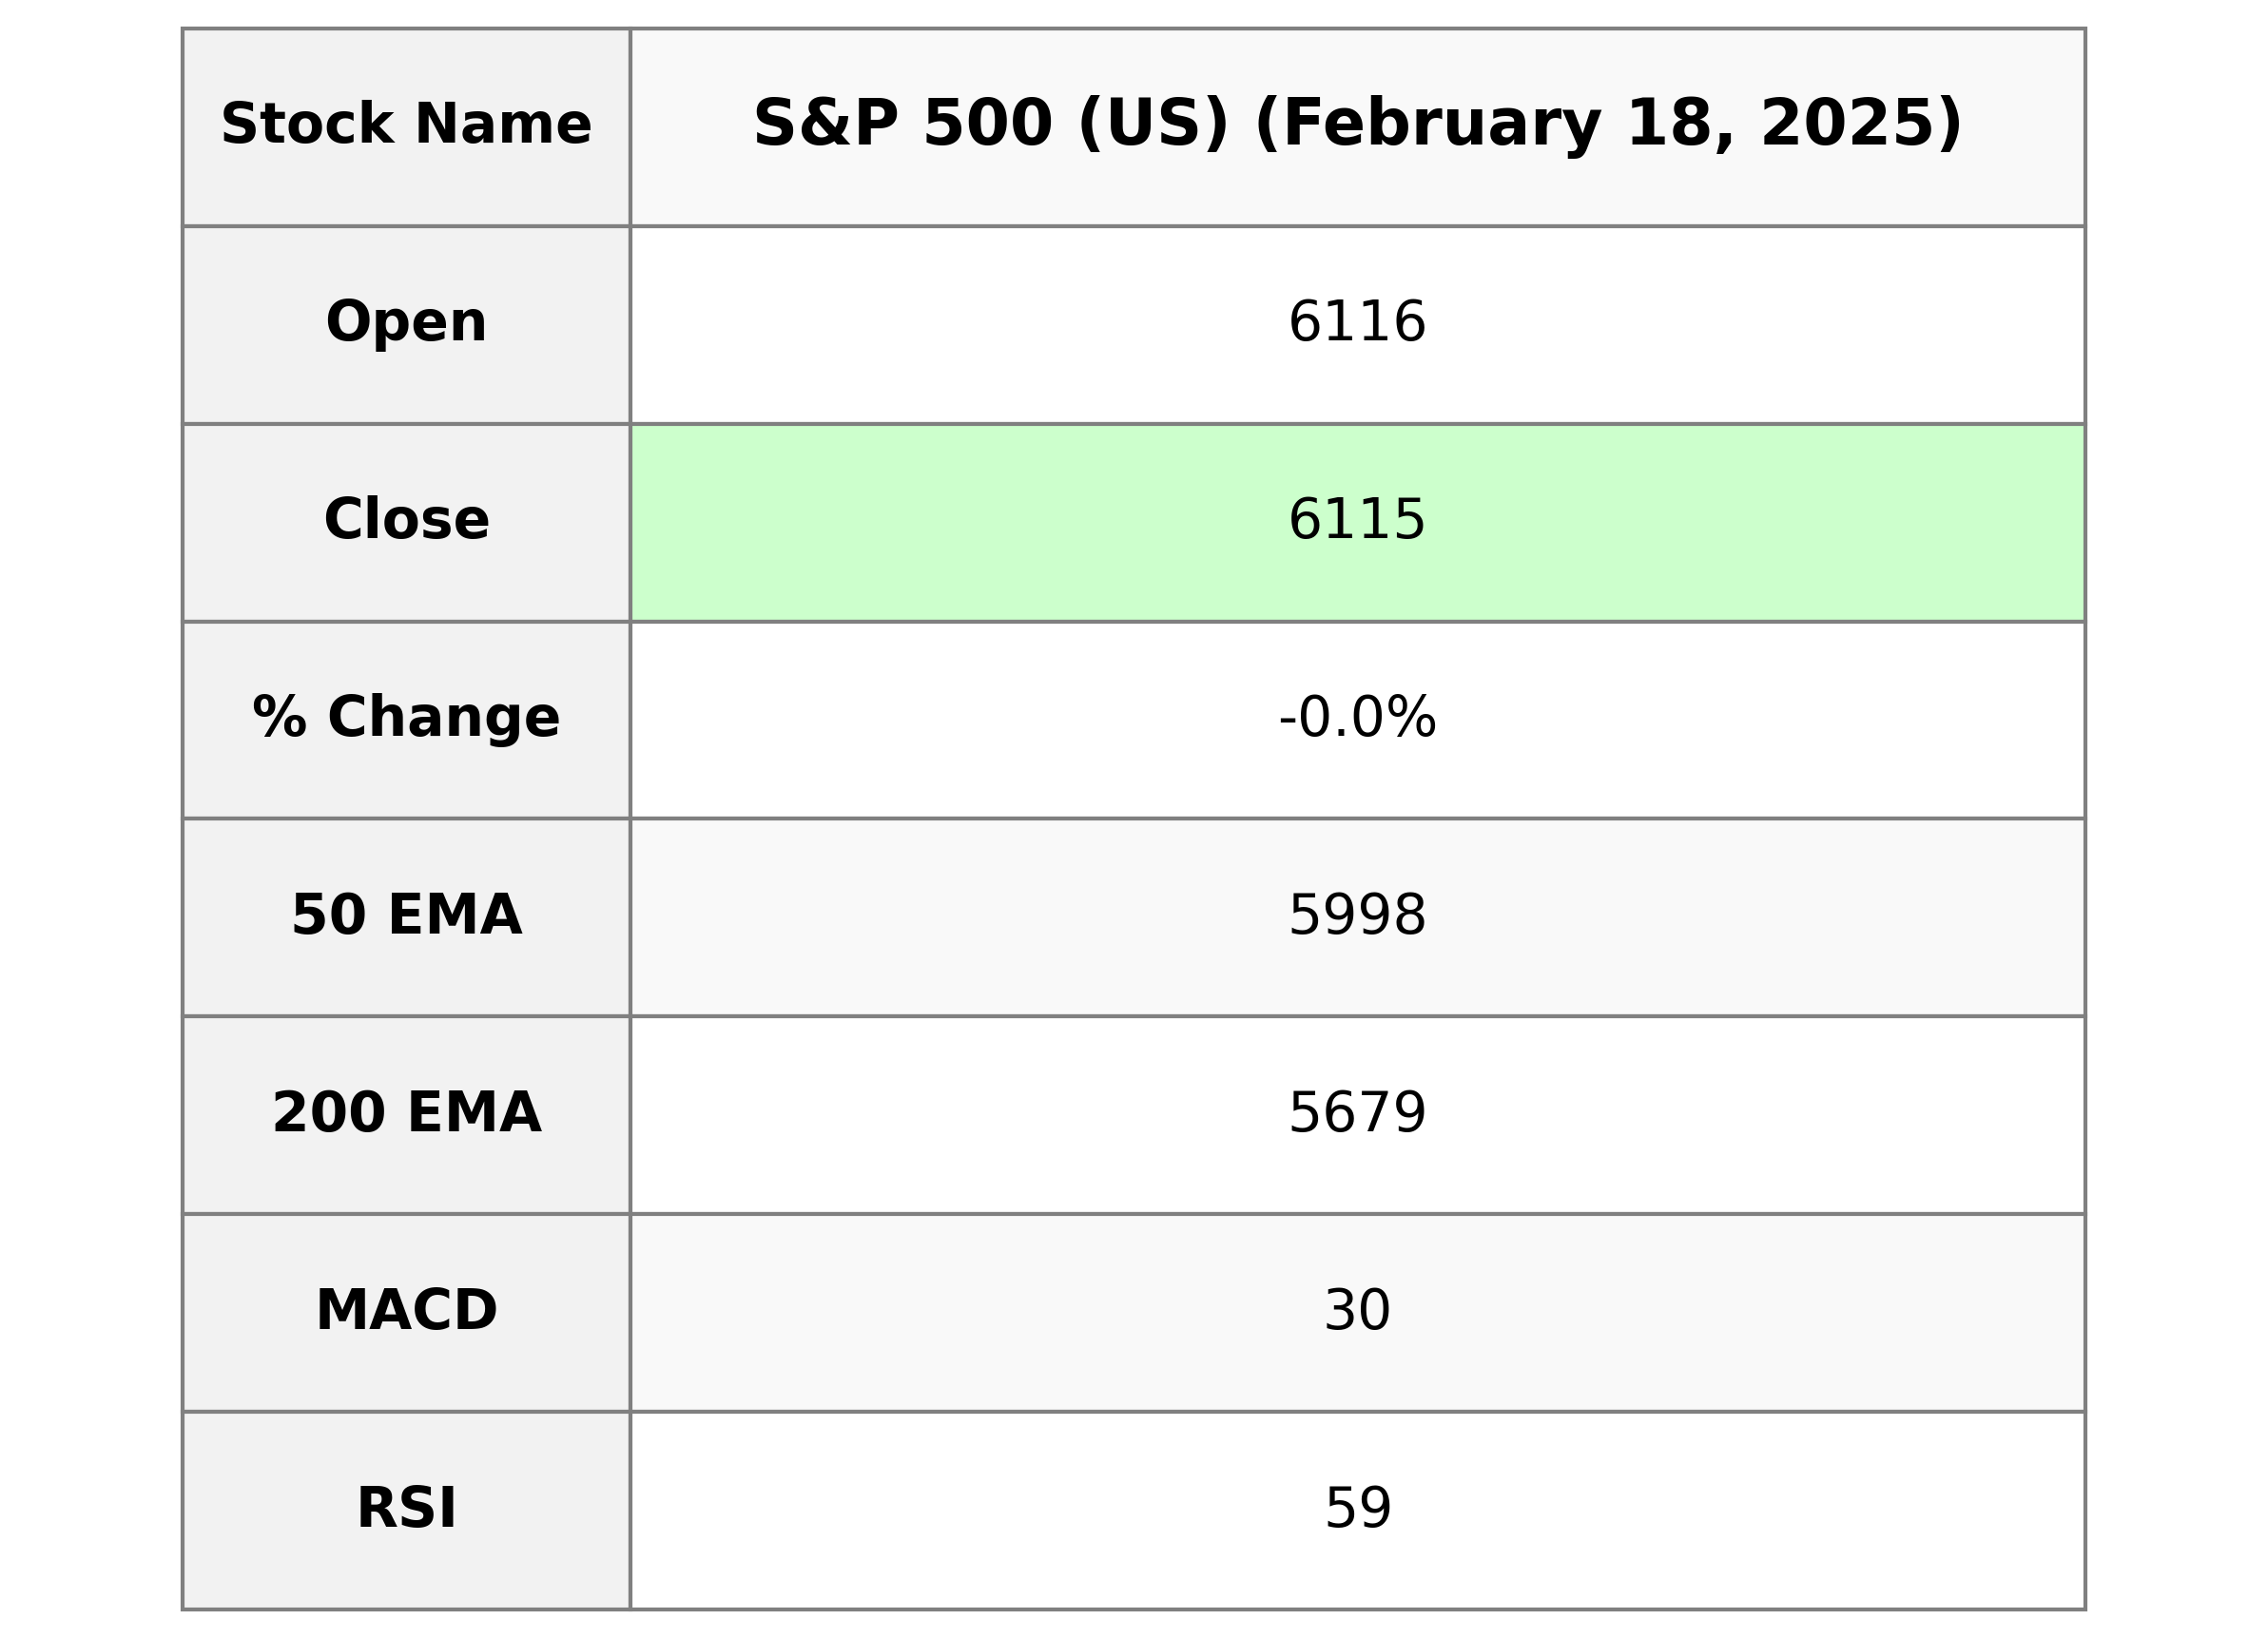
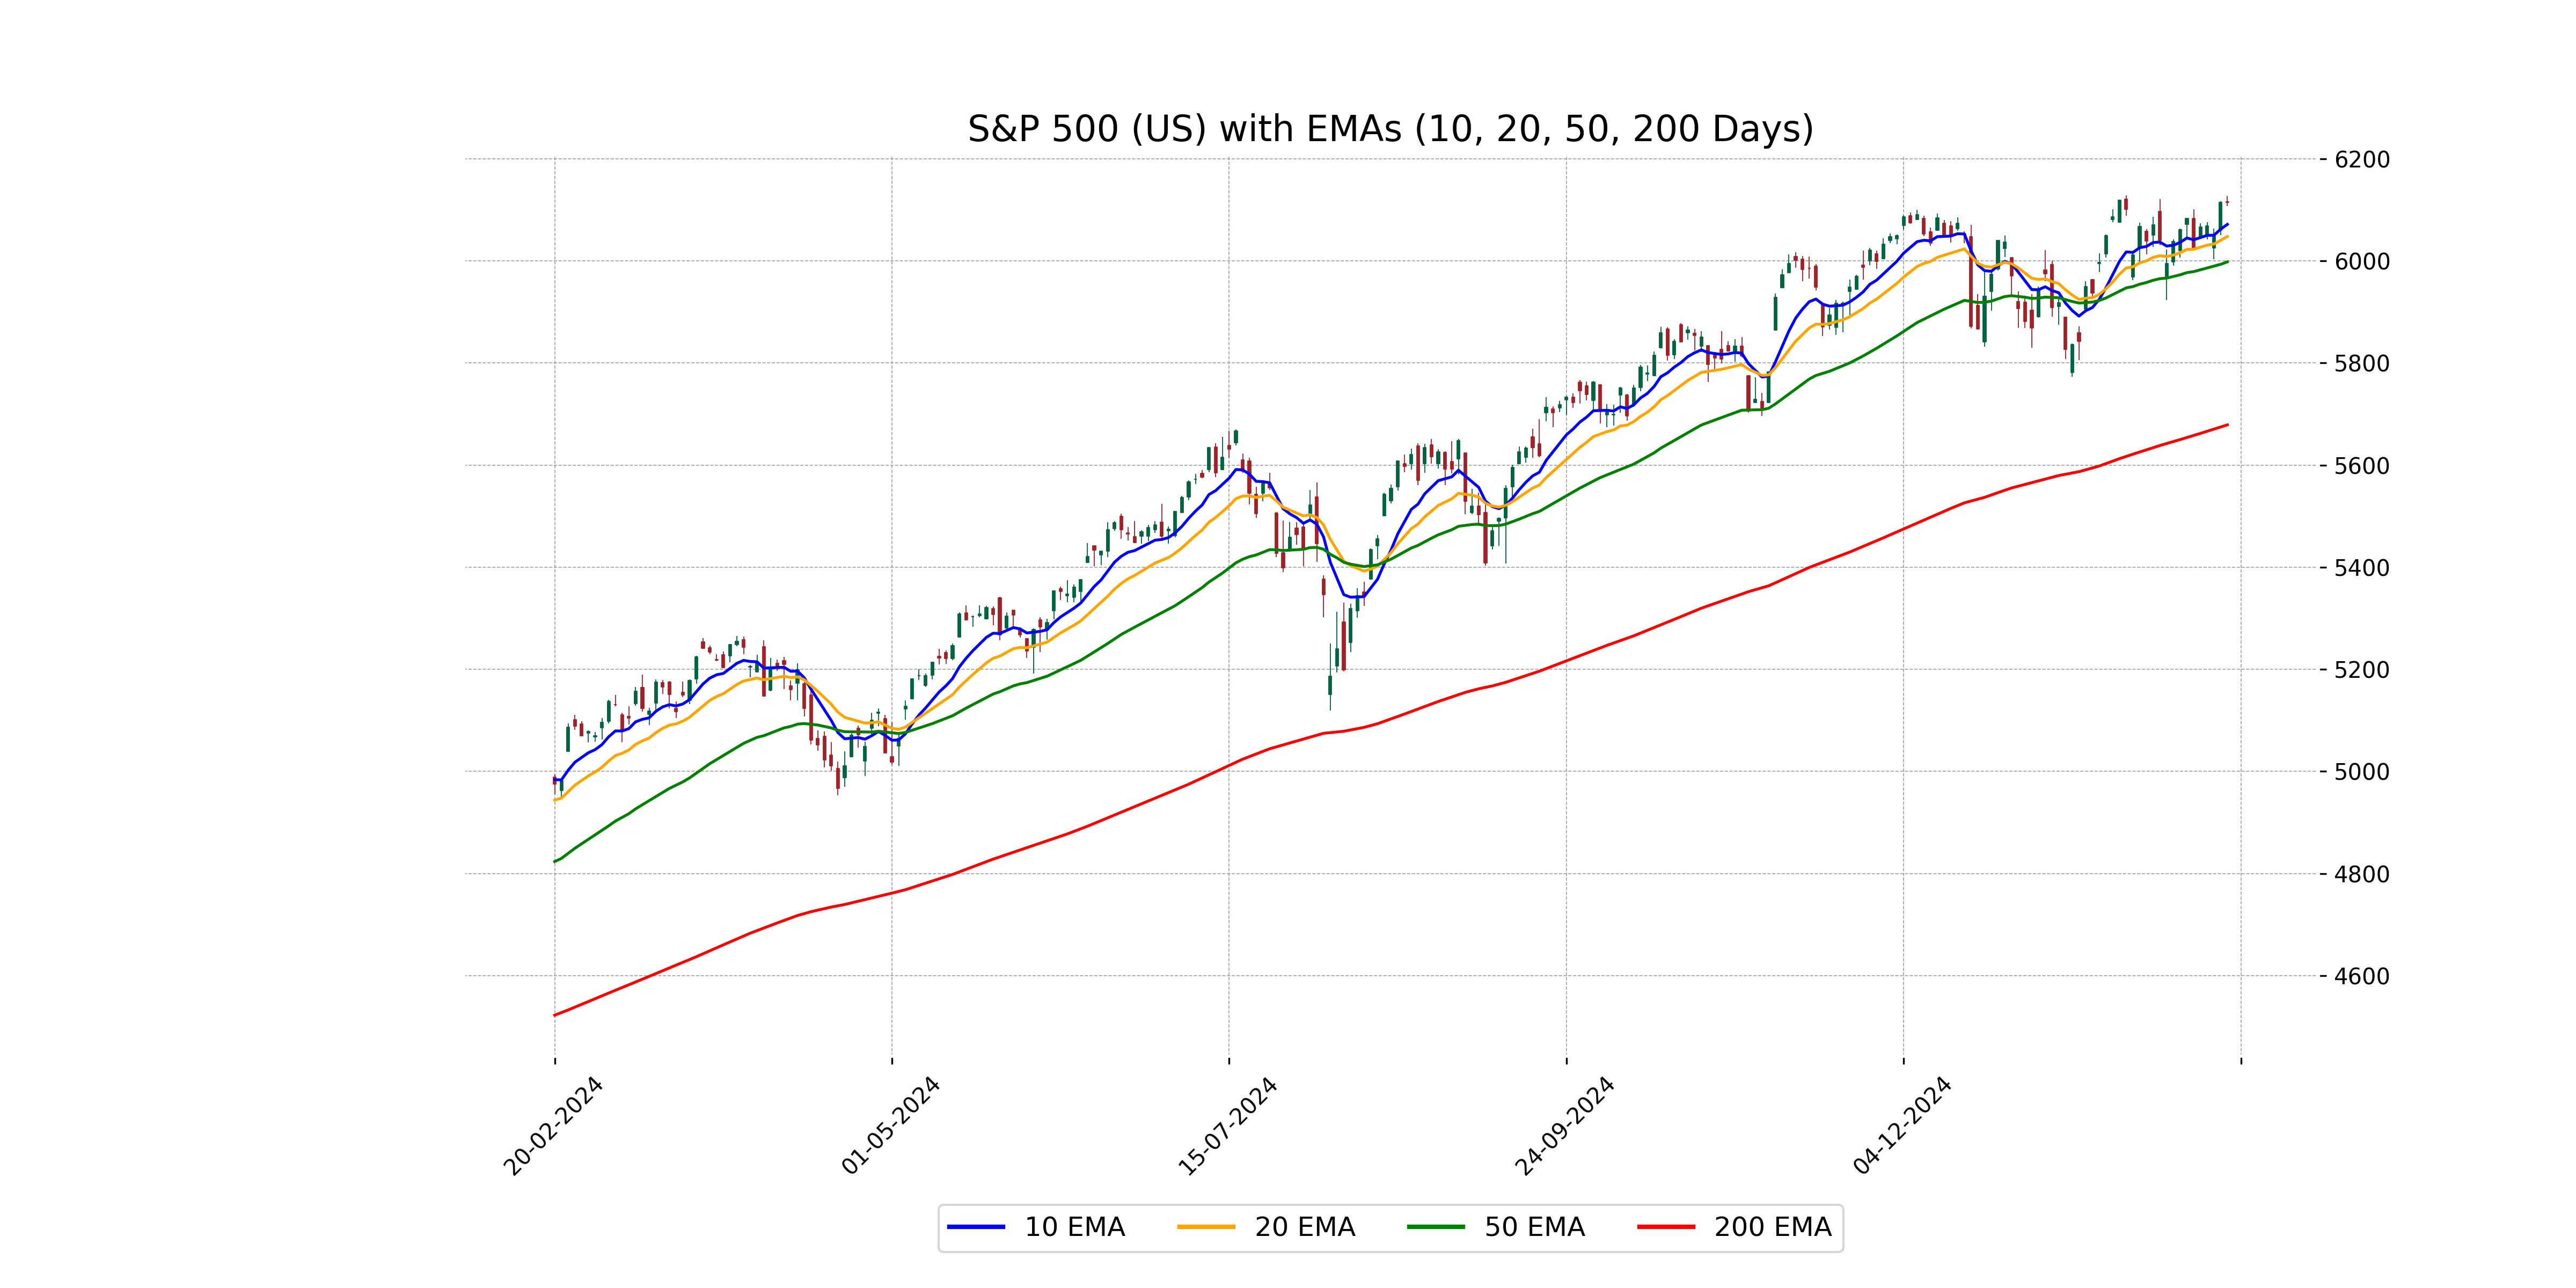
The S&P 500 (US) index experienced a slight decline with a closing value of 6114.63, marking a decrease of 0.44 points or 0.0072% from the previous close. The trading range was between a high of 6127.47 and a low of 6107.62. The index's technical indicators showed a 50-day EMA of 5998.22 and a 200-day EMA of 5678.91, with a relative strength index (RSI) of 58.60 and a MACD of 29.53, indicating a generally positive trend with moderate momentum.
Relationship with Key Moving Averages
The S&P 500 (US) closed at 6114.63, slightly below its open of 6115.52, reflecting a minor decrease with a -0.007% change. It is trading above its 50-day EMA of 5998.22 and its 200-day EMA of 5678.91, indicating a bullish trend. Additionally, it is also above its 10-day EMA of 6071.75 and 20-day EMA of 6047.91, further supporting the upward momentum.
Moving Averages Trend (MACD)
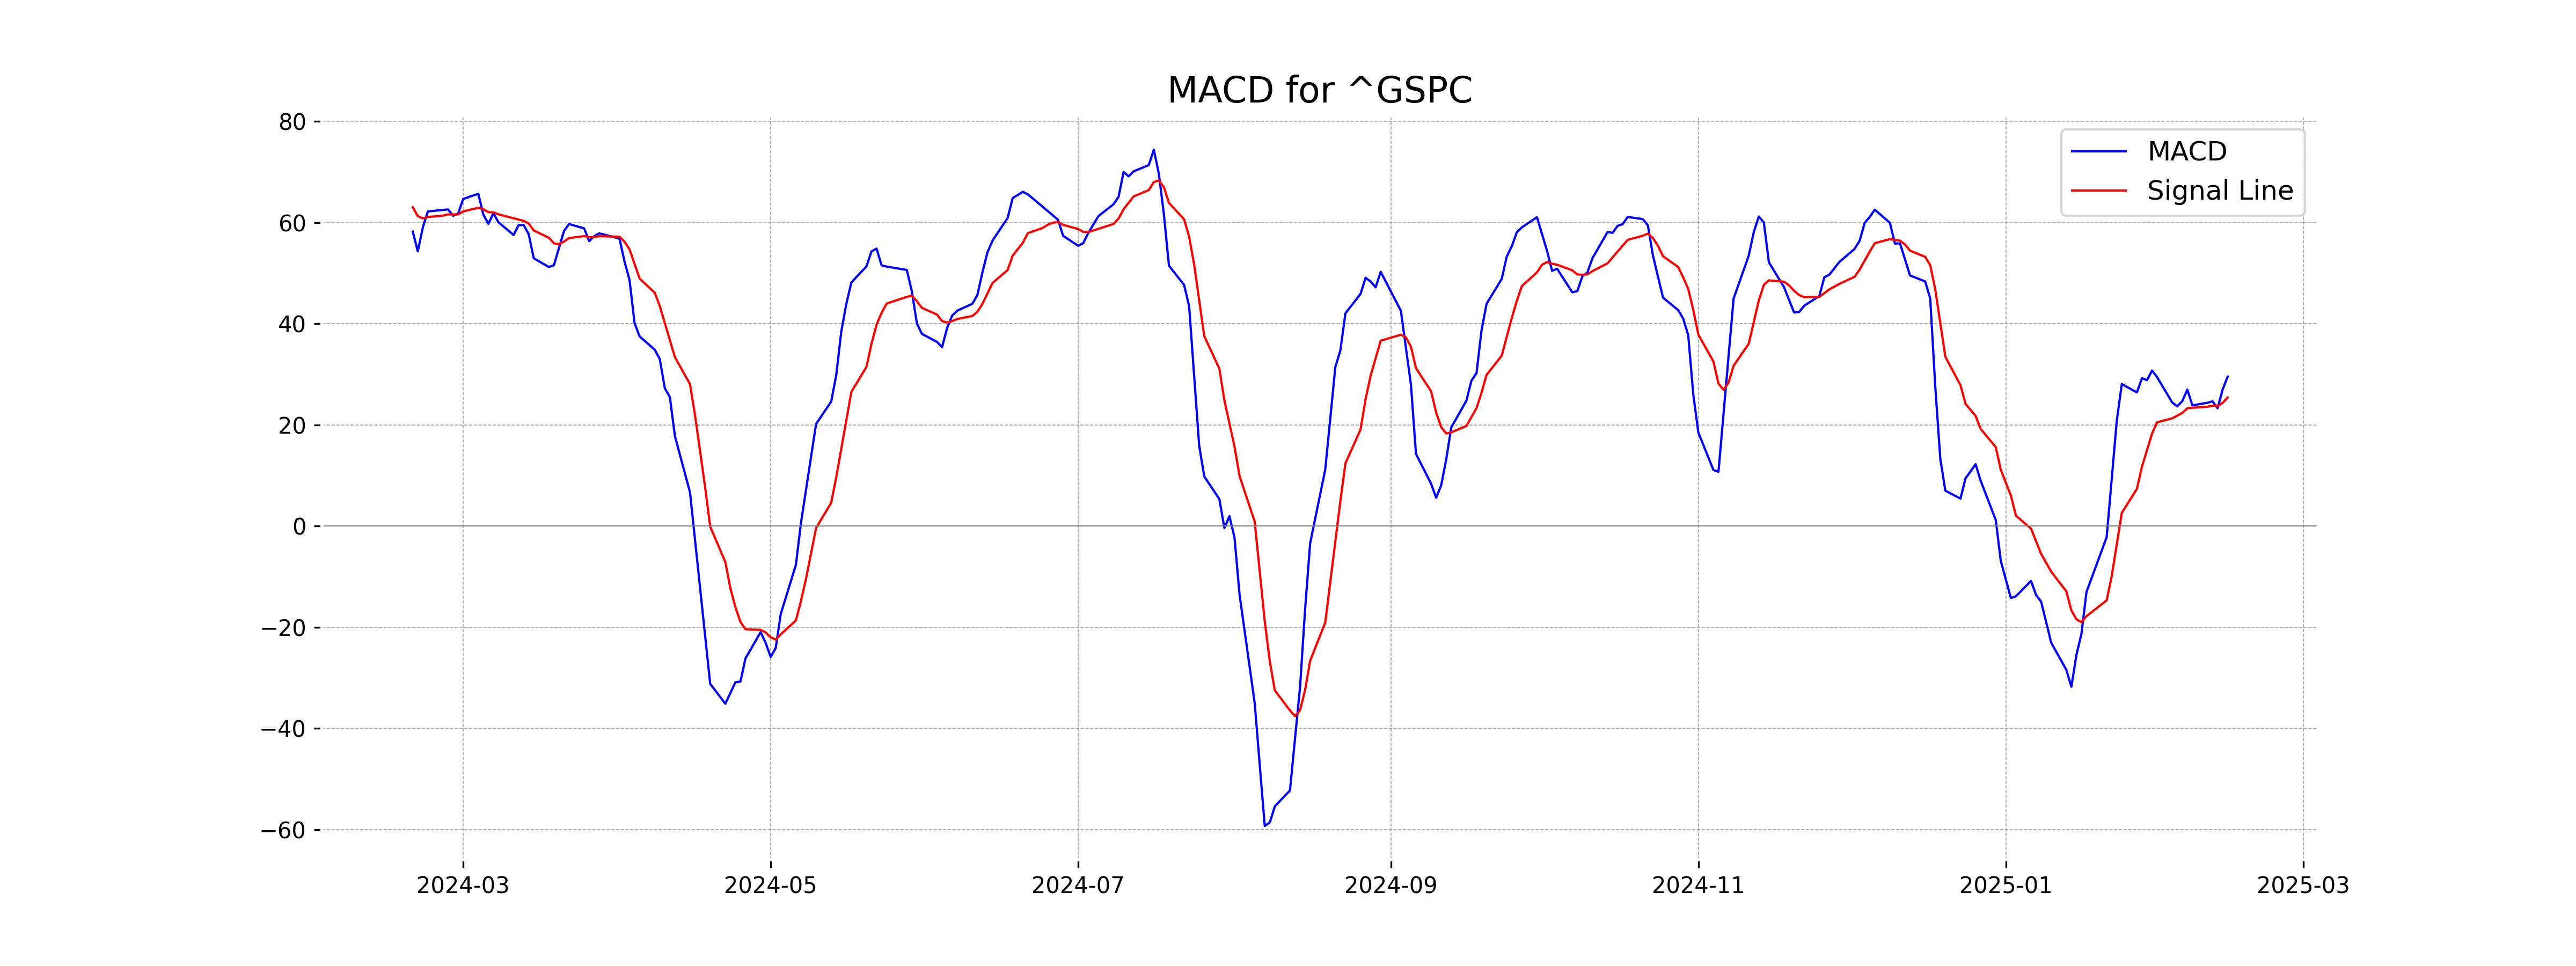
The MACD for S&P 500 indicates a bullish trend as the MACD value (29.53) is significantly above the MACD Signal (25.39). This suggests a strong upward momentum in the market.
RSI Analysis
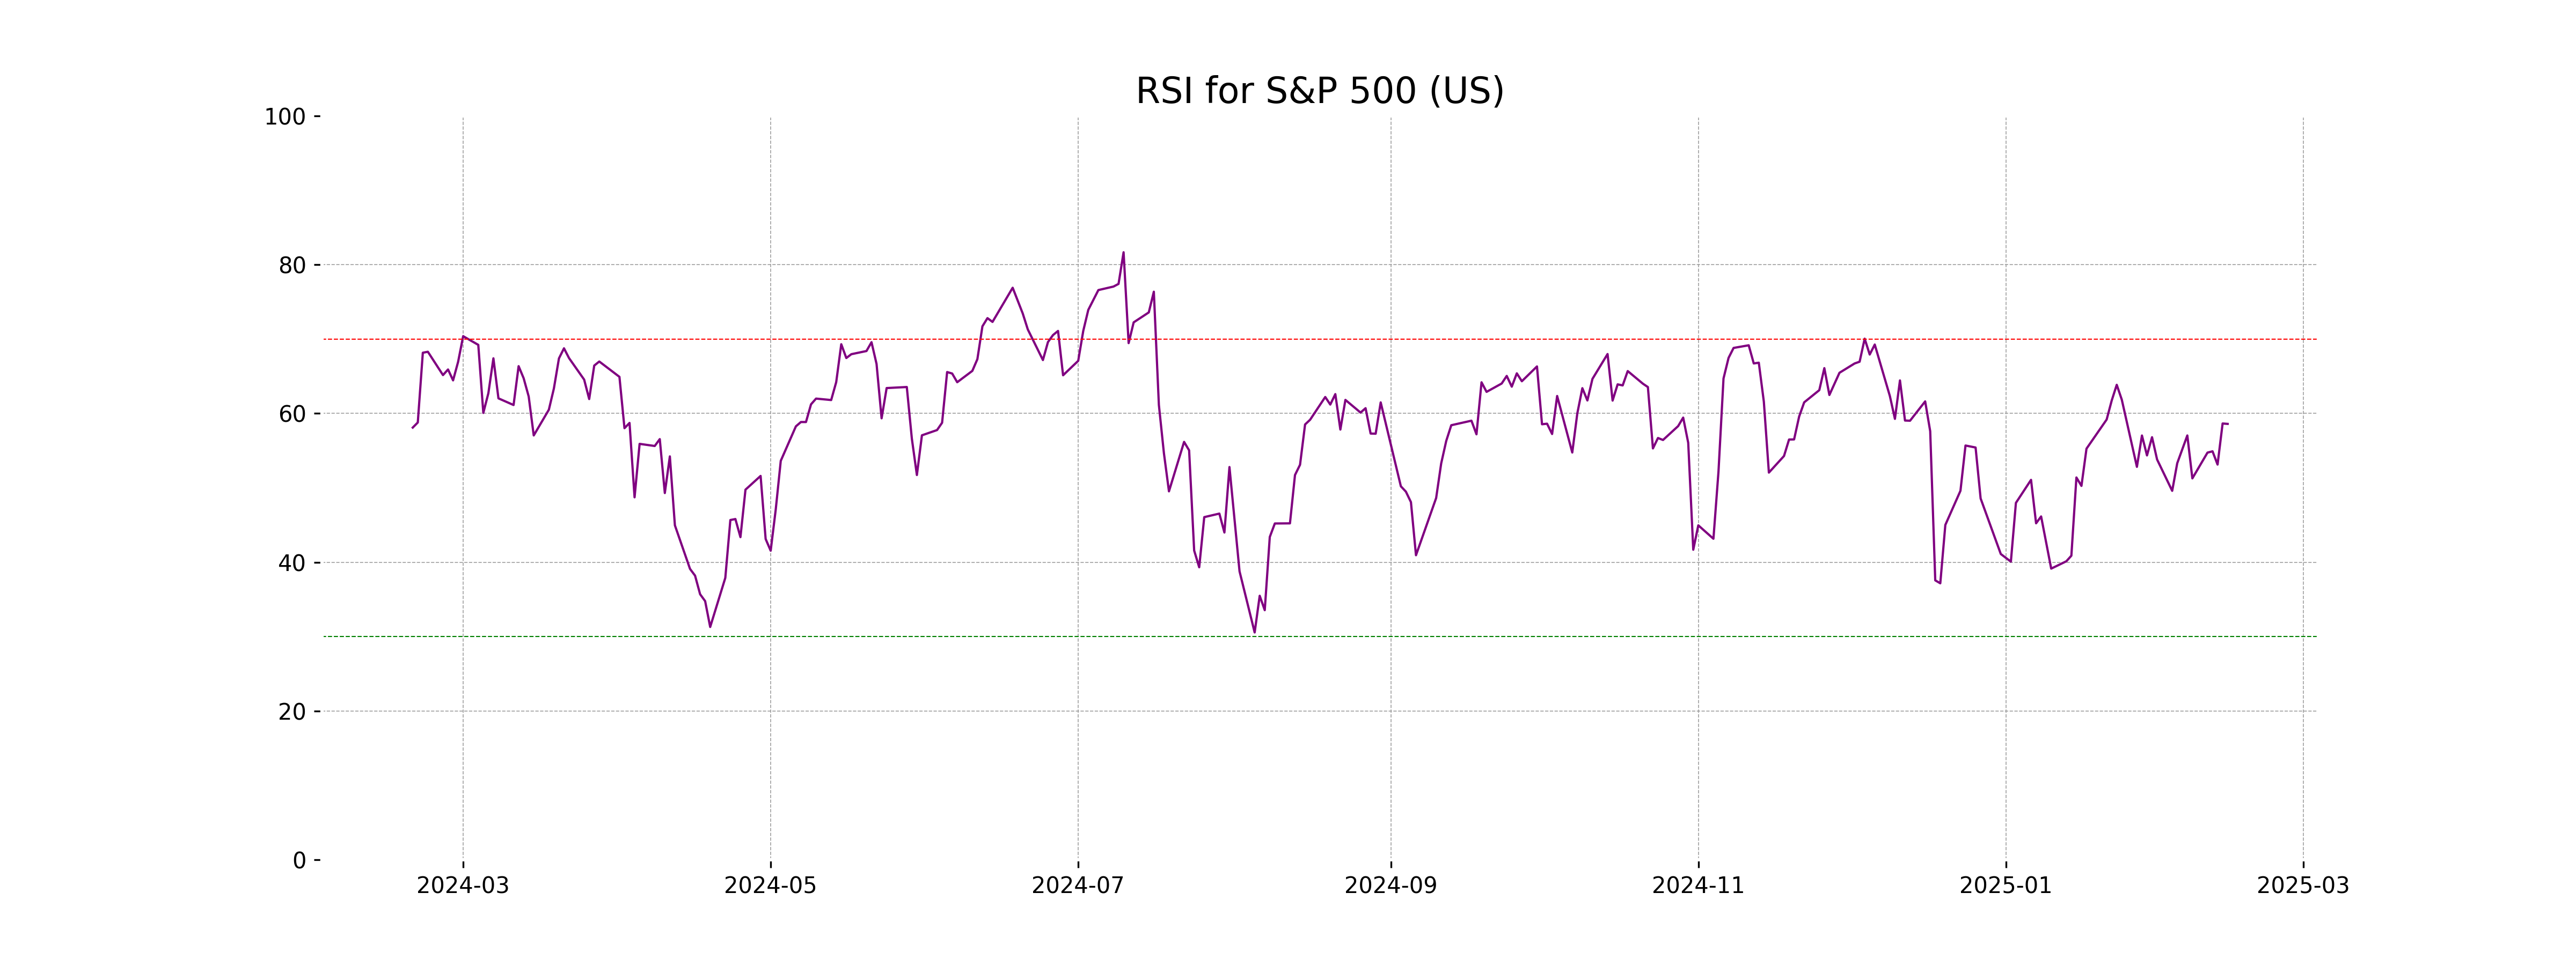
{'Analysis': 'The S&P 500 has an RSI of 58.60, which indicates that the index is in a neutral territory, showing neither overbought nor oversold conditions. Typically, RSI values above 70 suggest overbought conditions, while values below 30 point to oversold territory.'}
Analysis for Hang Seng Index (Hong Kong) - February 18, 2025
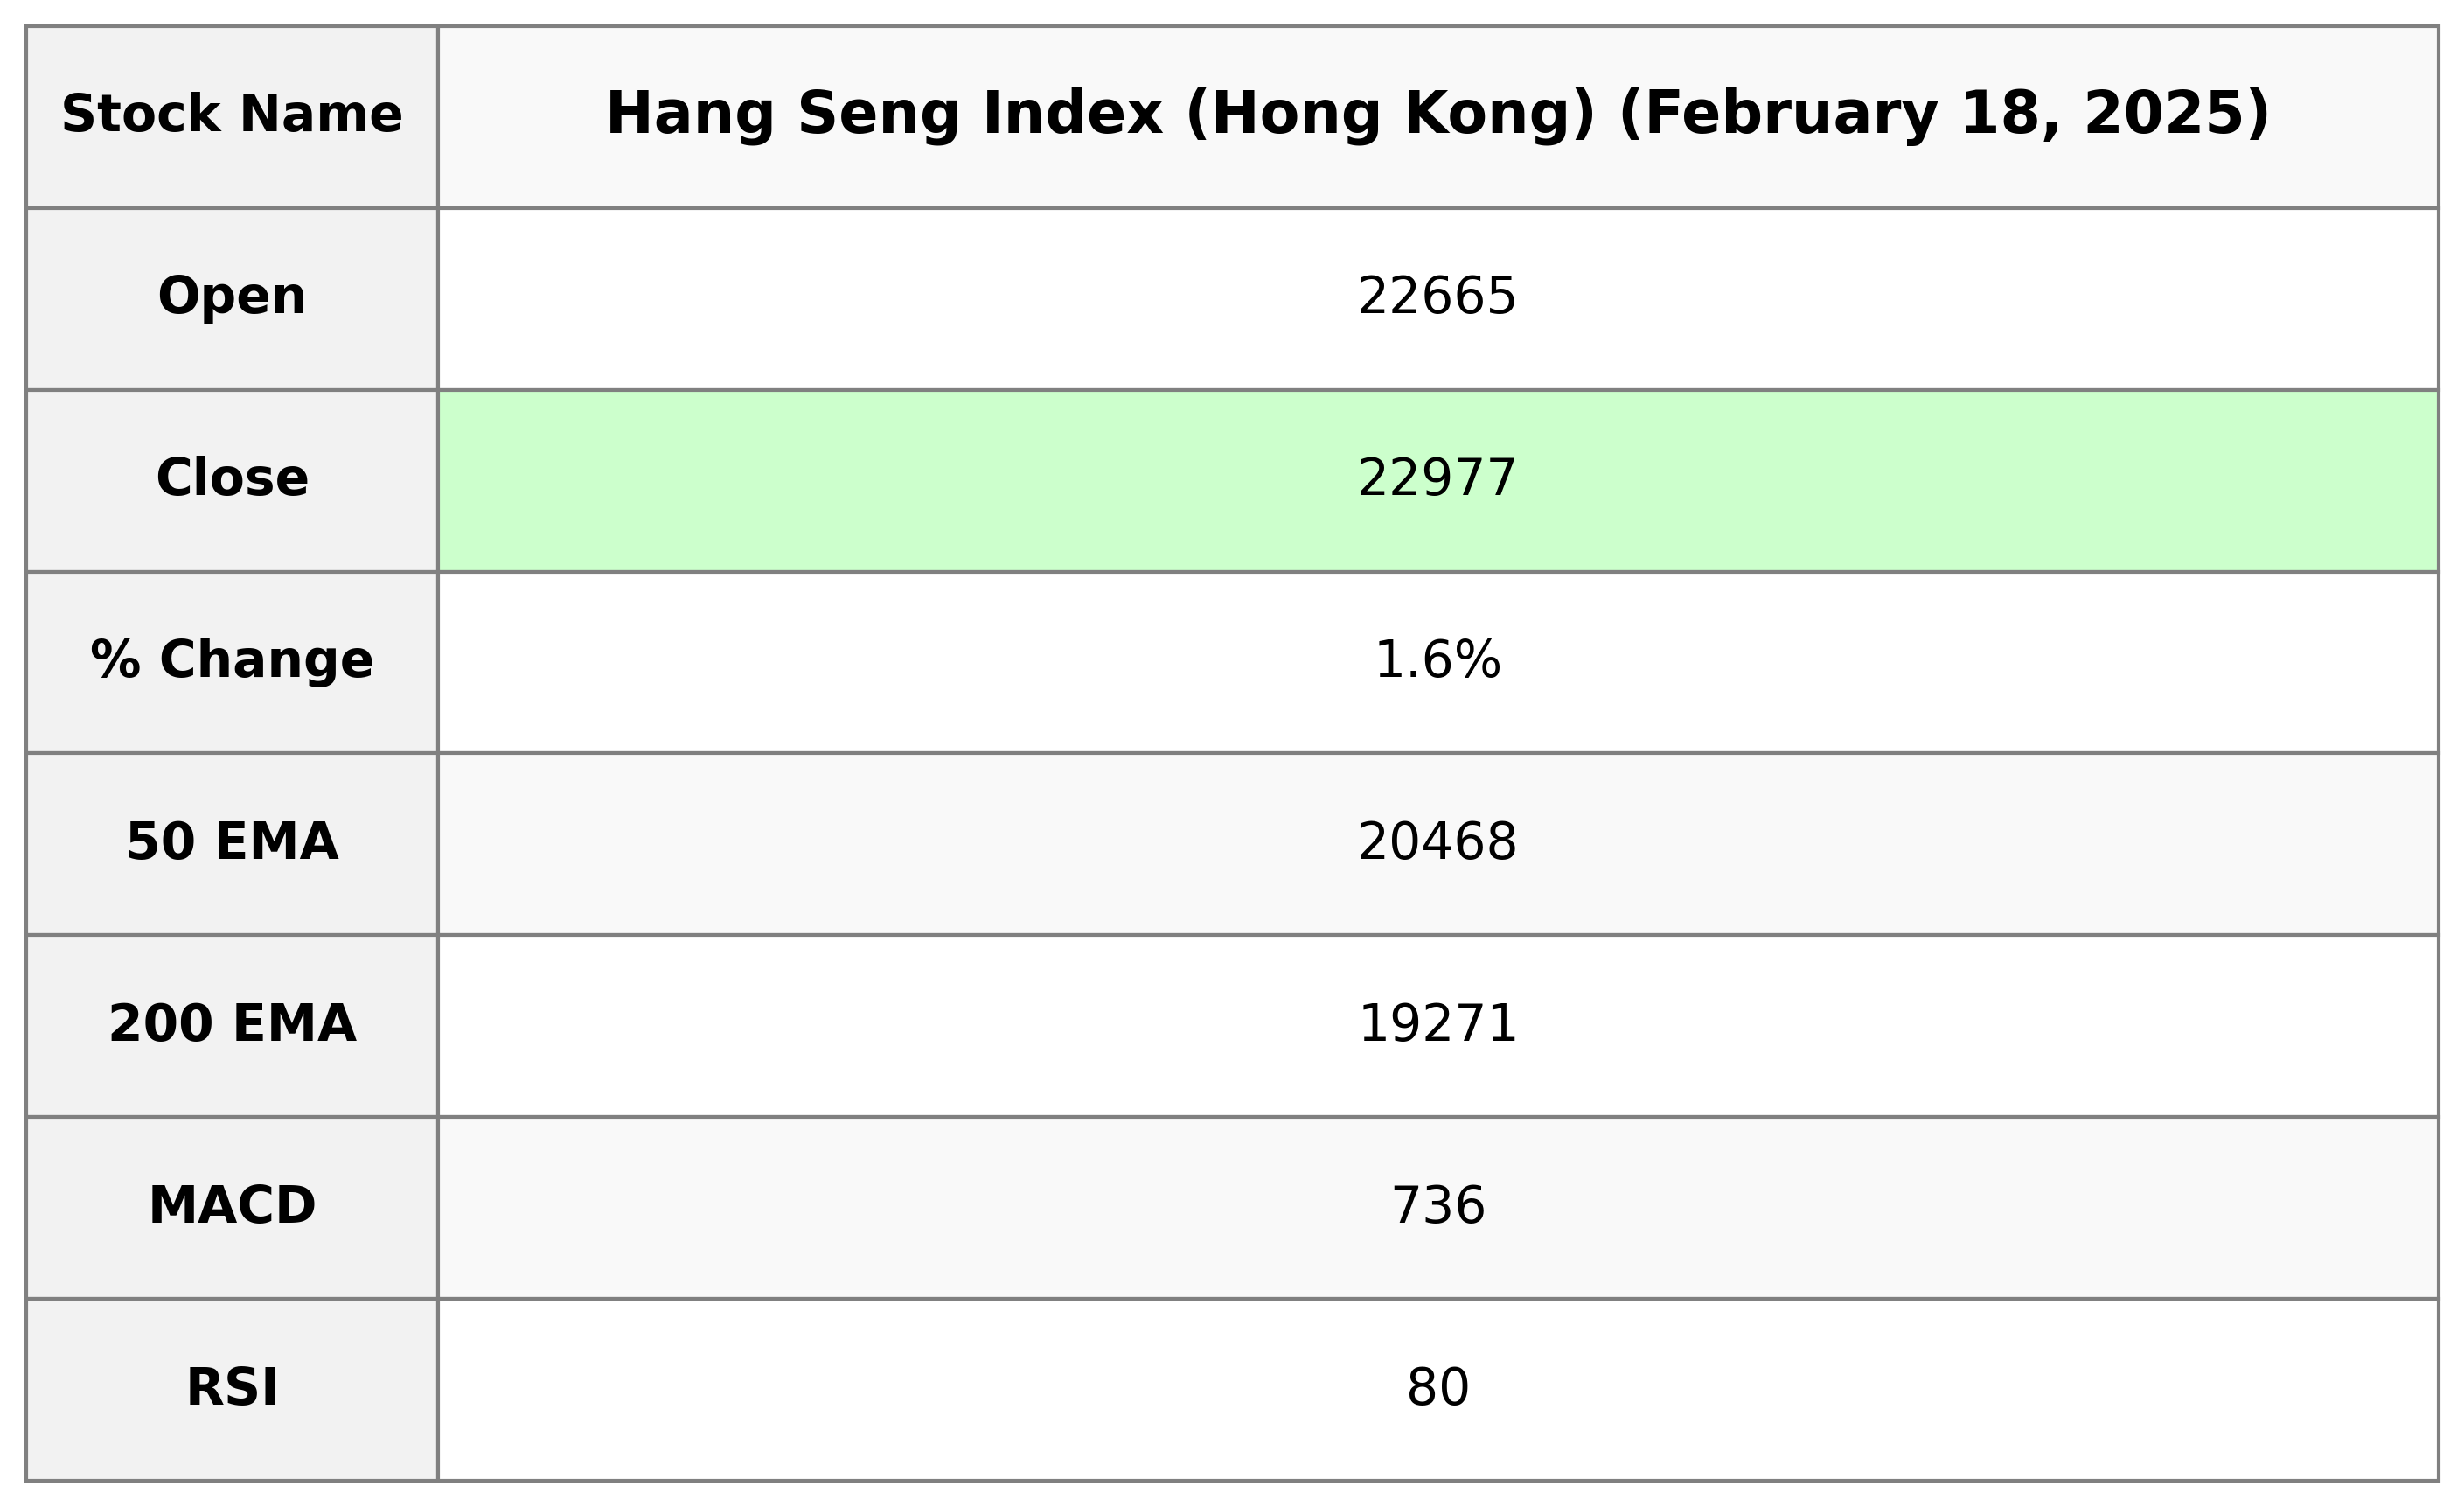
The Hang Seng Index (Hong Kong) opened at 22,664.73 and closed at 22,976.81, with a significant percentage change of 1.59% and a points change of 360.58. The RSI is notably high at 80.37, indicating overbought conditions. The MACD is above the signal line, suggesting bullish momentum.
Relationship with Key Moving Averages
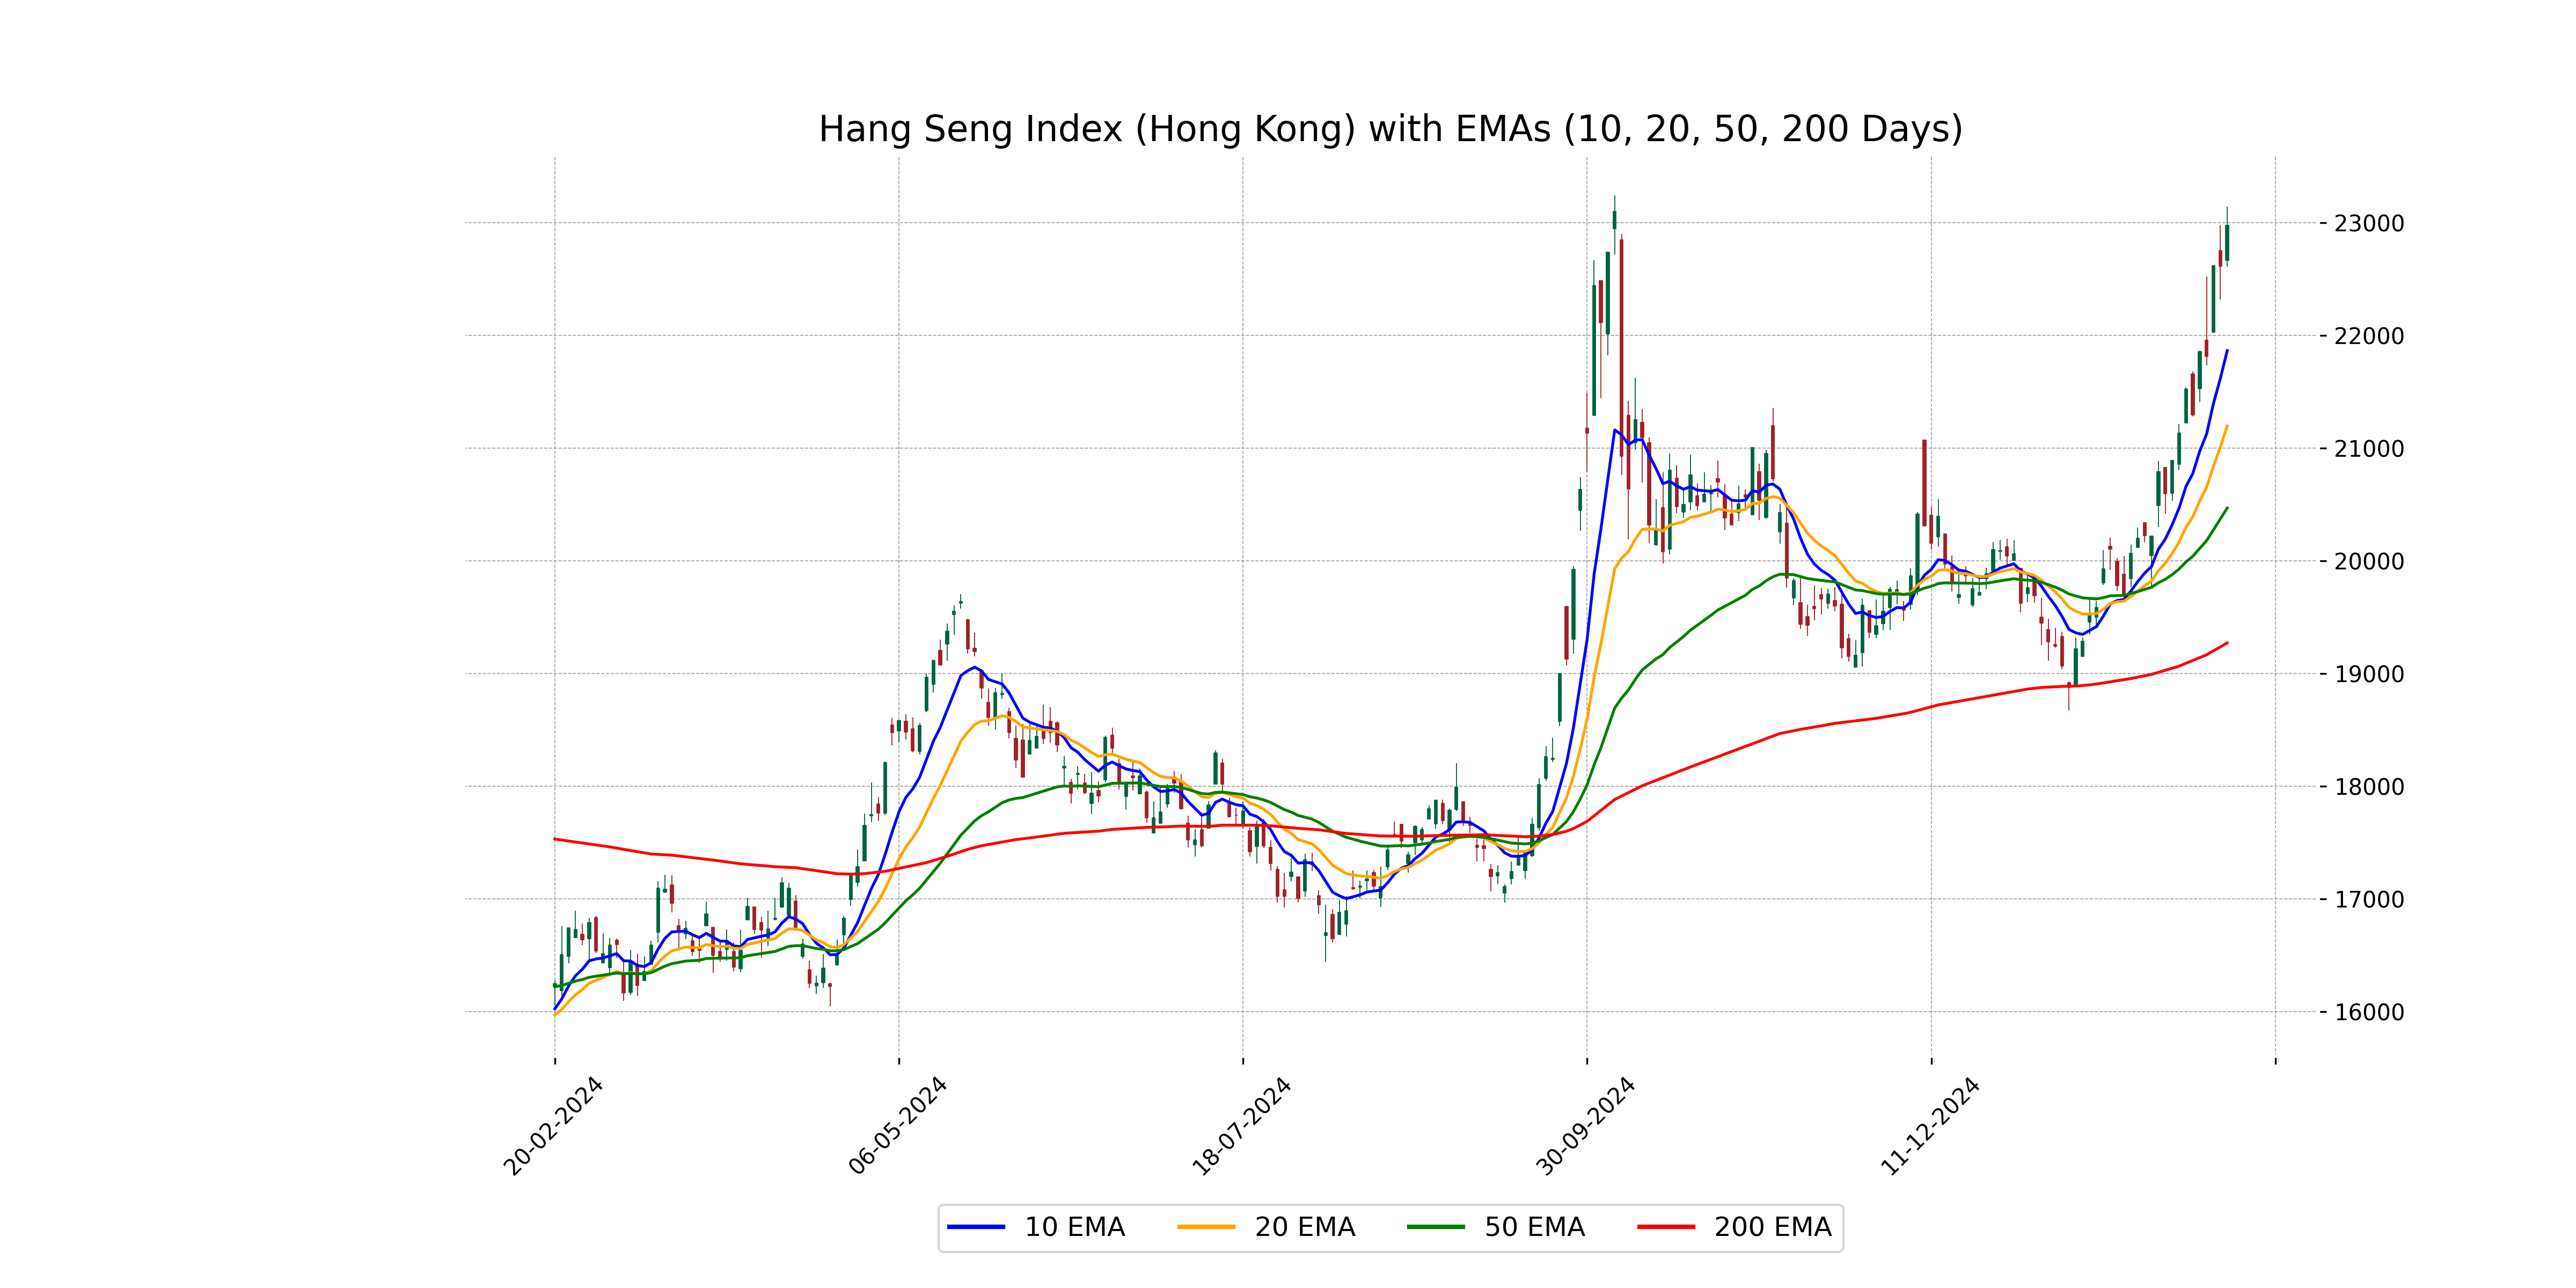
The Hang Seng Index closed at 22976.81, which is above its 50-day EMA of 20468.48, 200-day EMA of 19271.05, 10-day EMA of 21865.50, and 20-day EMA of 21196.73, indicating a bullish trend in the short and long term. The RSI of 80.37 suggests the index is currently in overbought territory.
Moving Averages Trend (MACD)
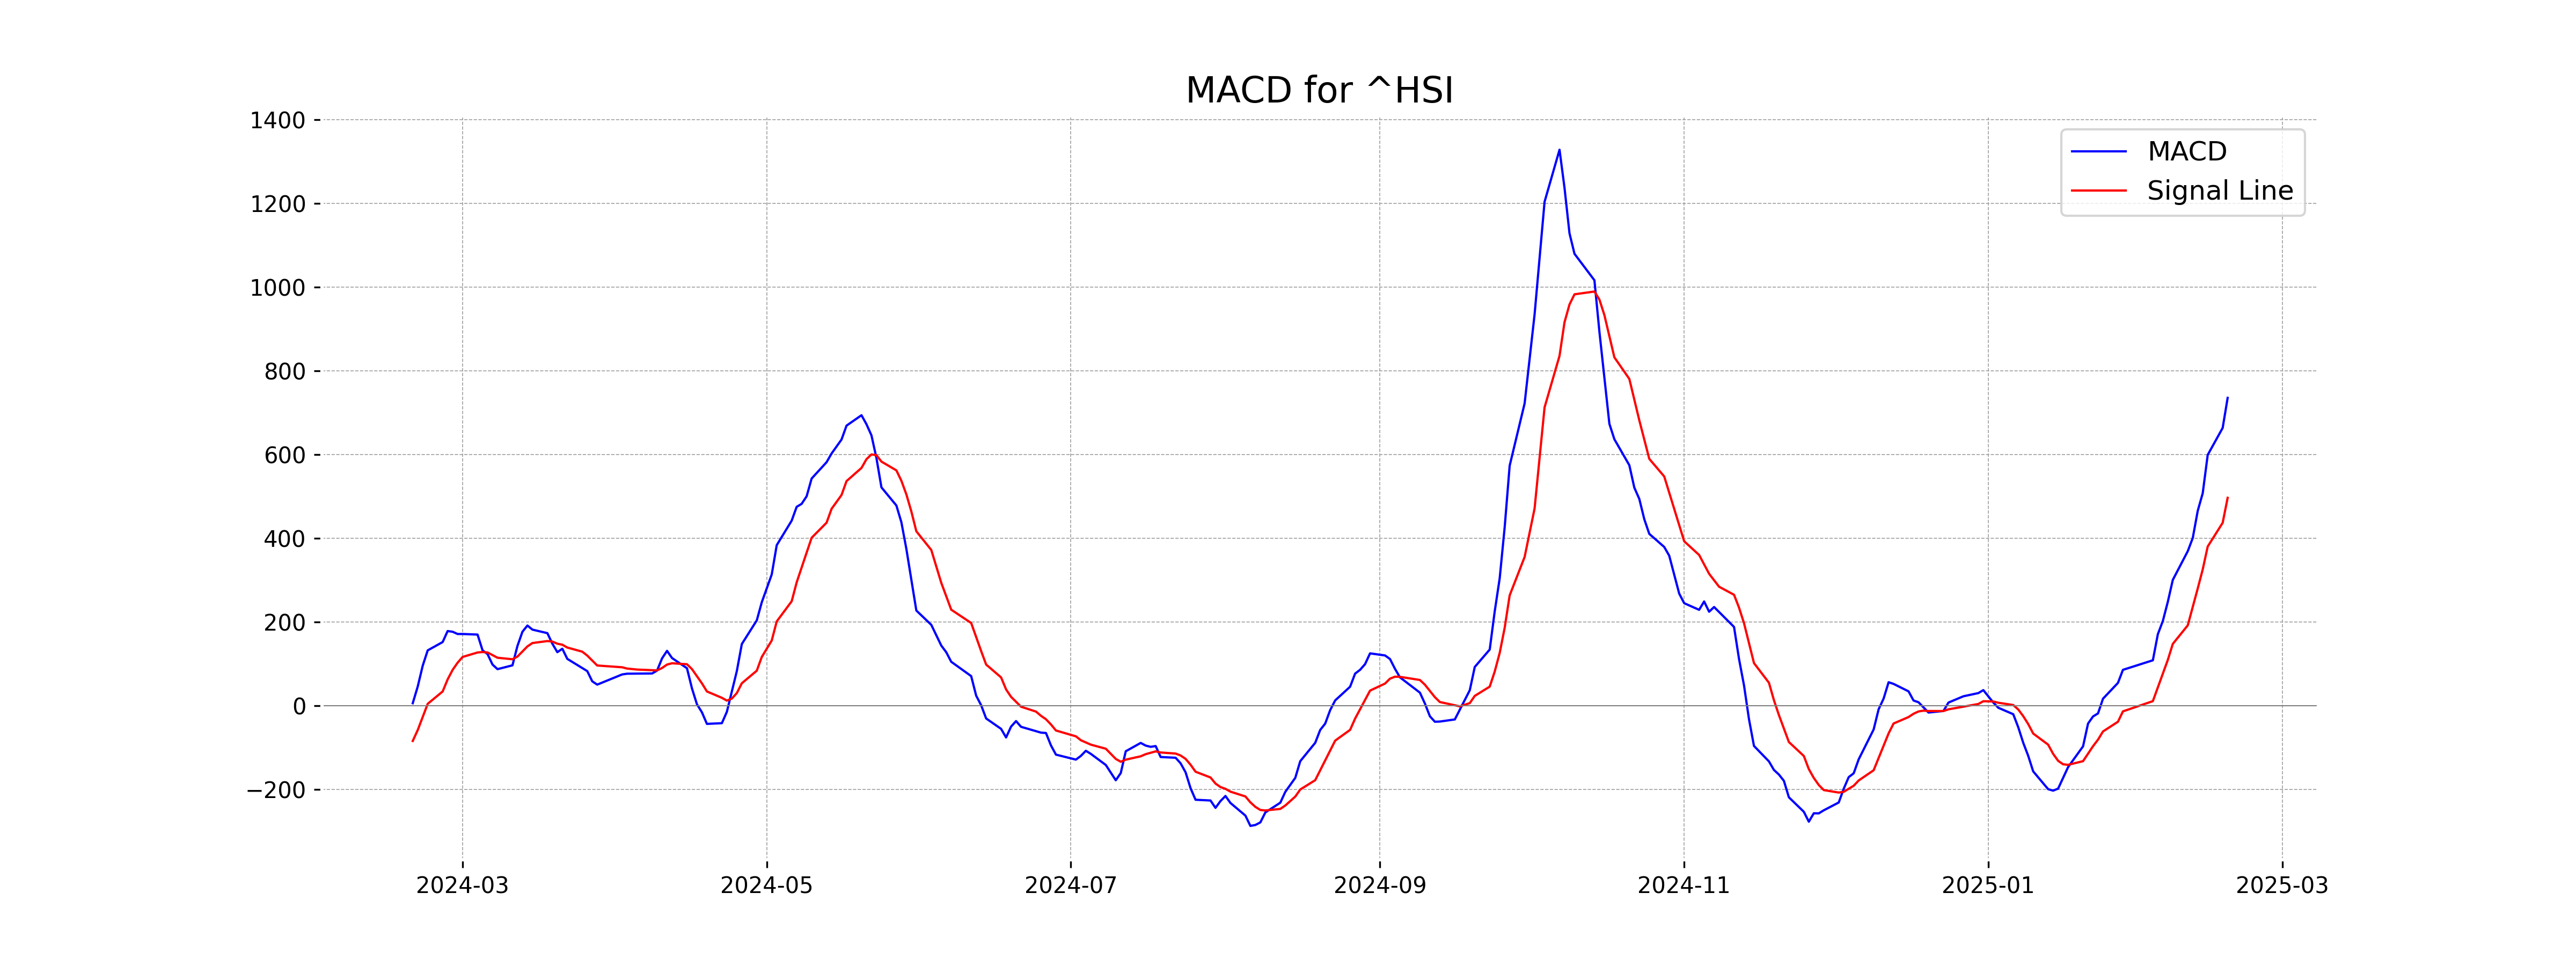
The Hang Seng Index shows a strong bullish trend as indicated by the MACD of 735.93, which is significantly above the MACD Signal line of 497.18. This suggests increased upward momentum in the market.
RSI Analysis
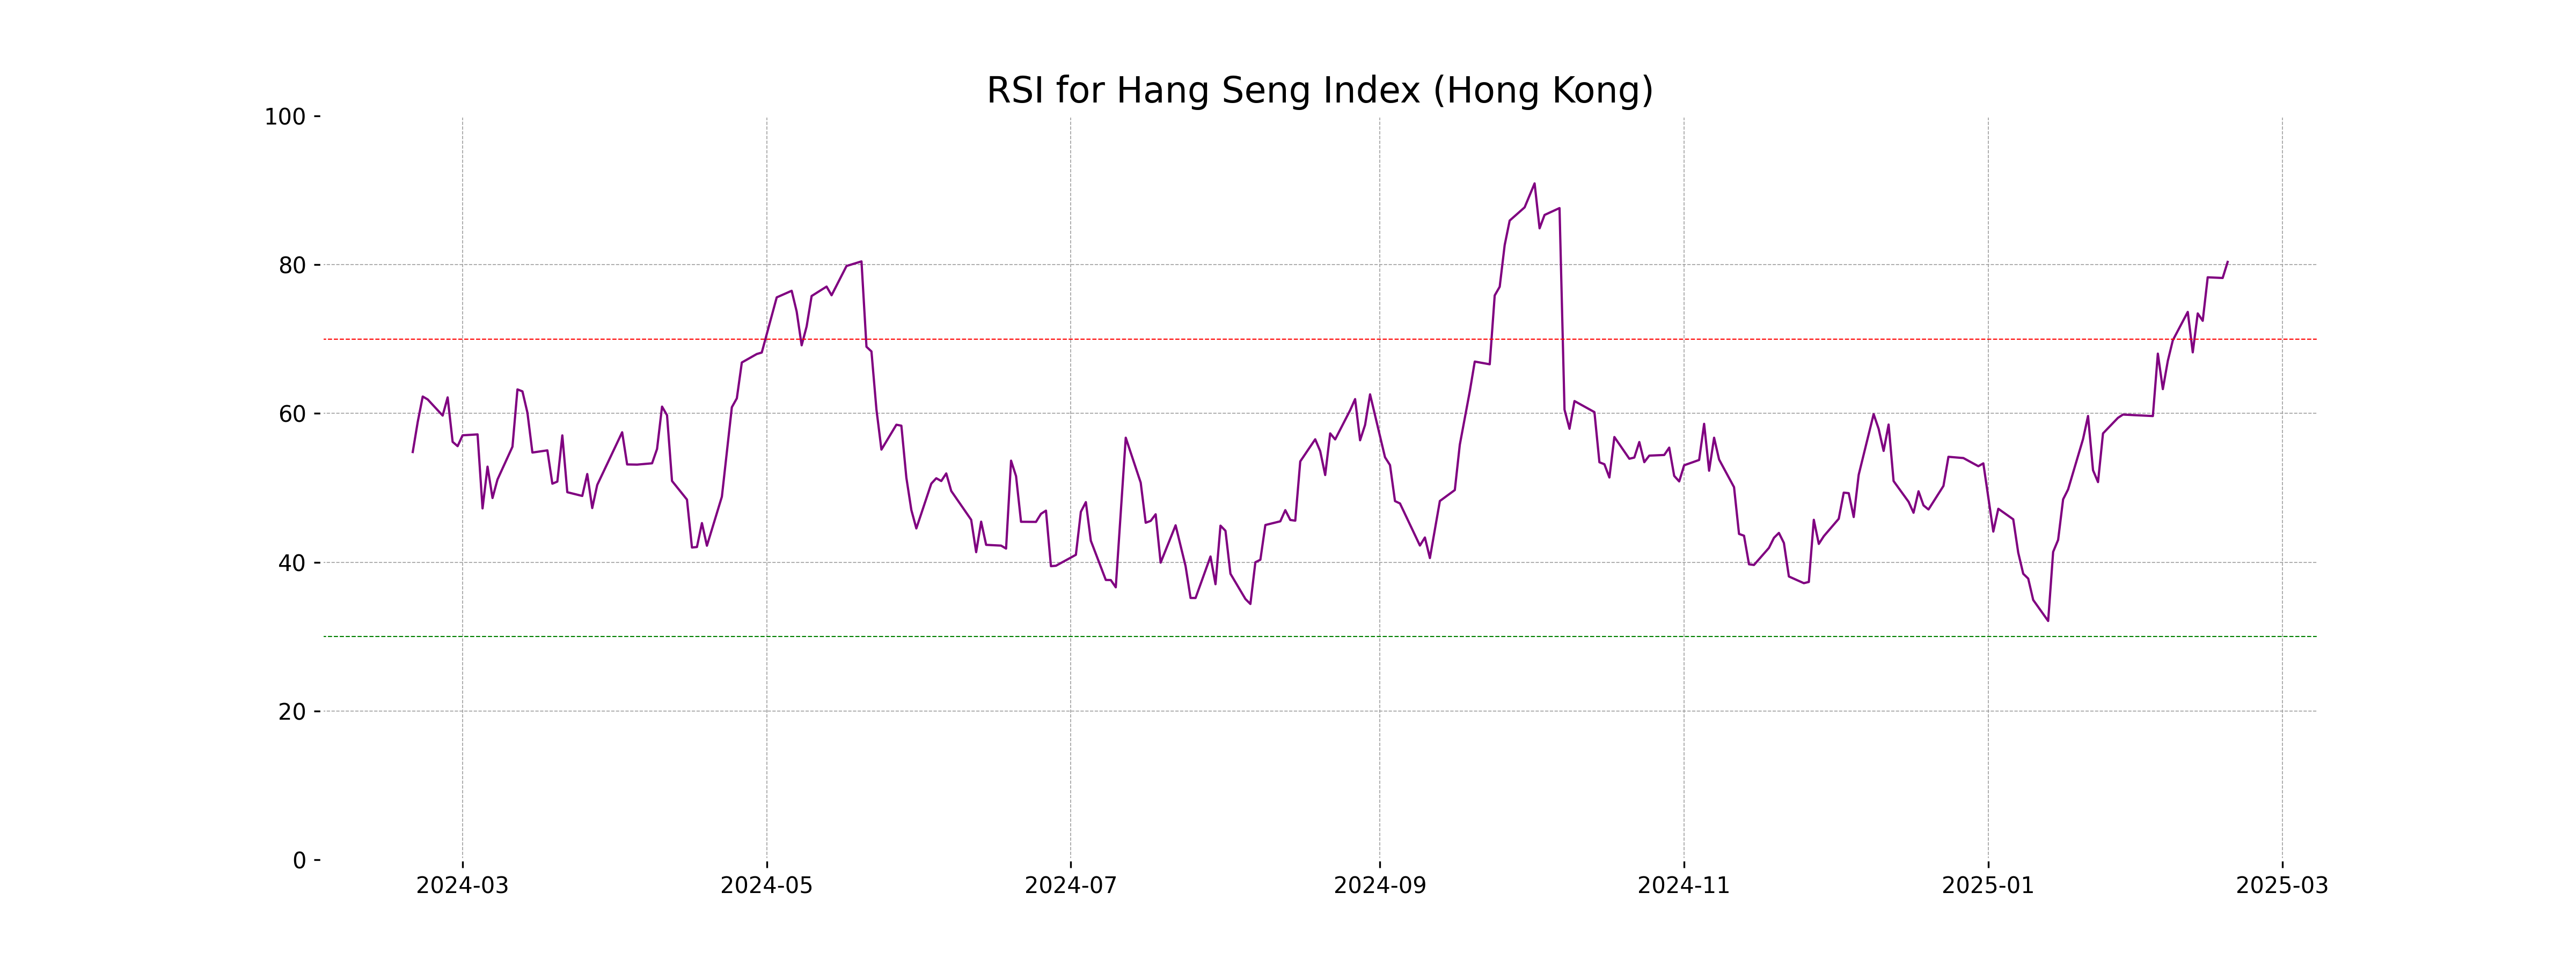
The RSI for the Hang Seng Index is 80.37, indicating that the index is in an overbought condition. An RSI above 70 often suggests that a security may be overvalued and could be subject to a price correction or pullback.
Analysis for IBEX 35 (Spain) - February 18, 2025
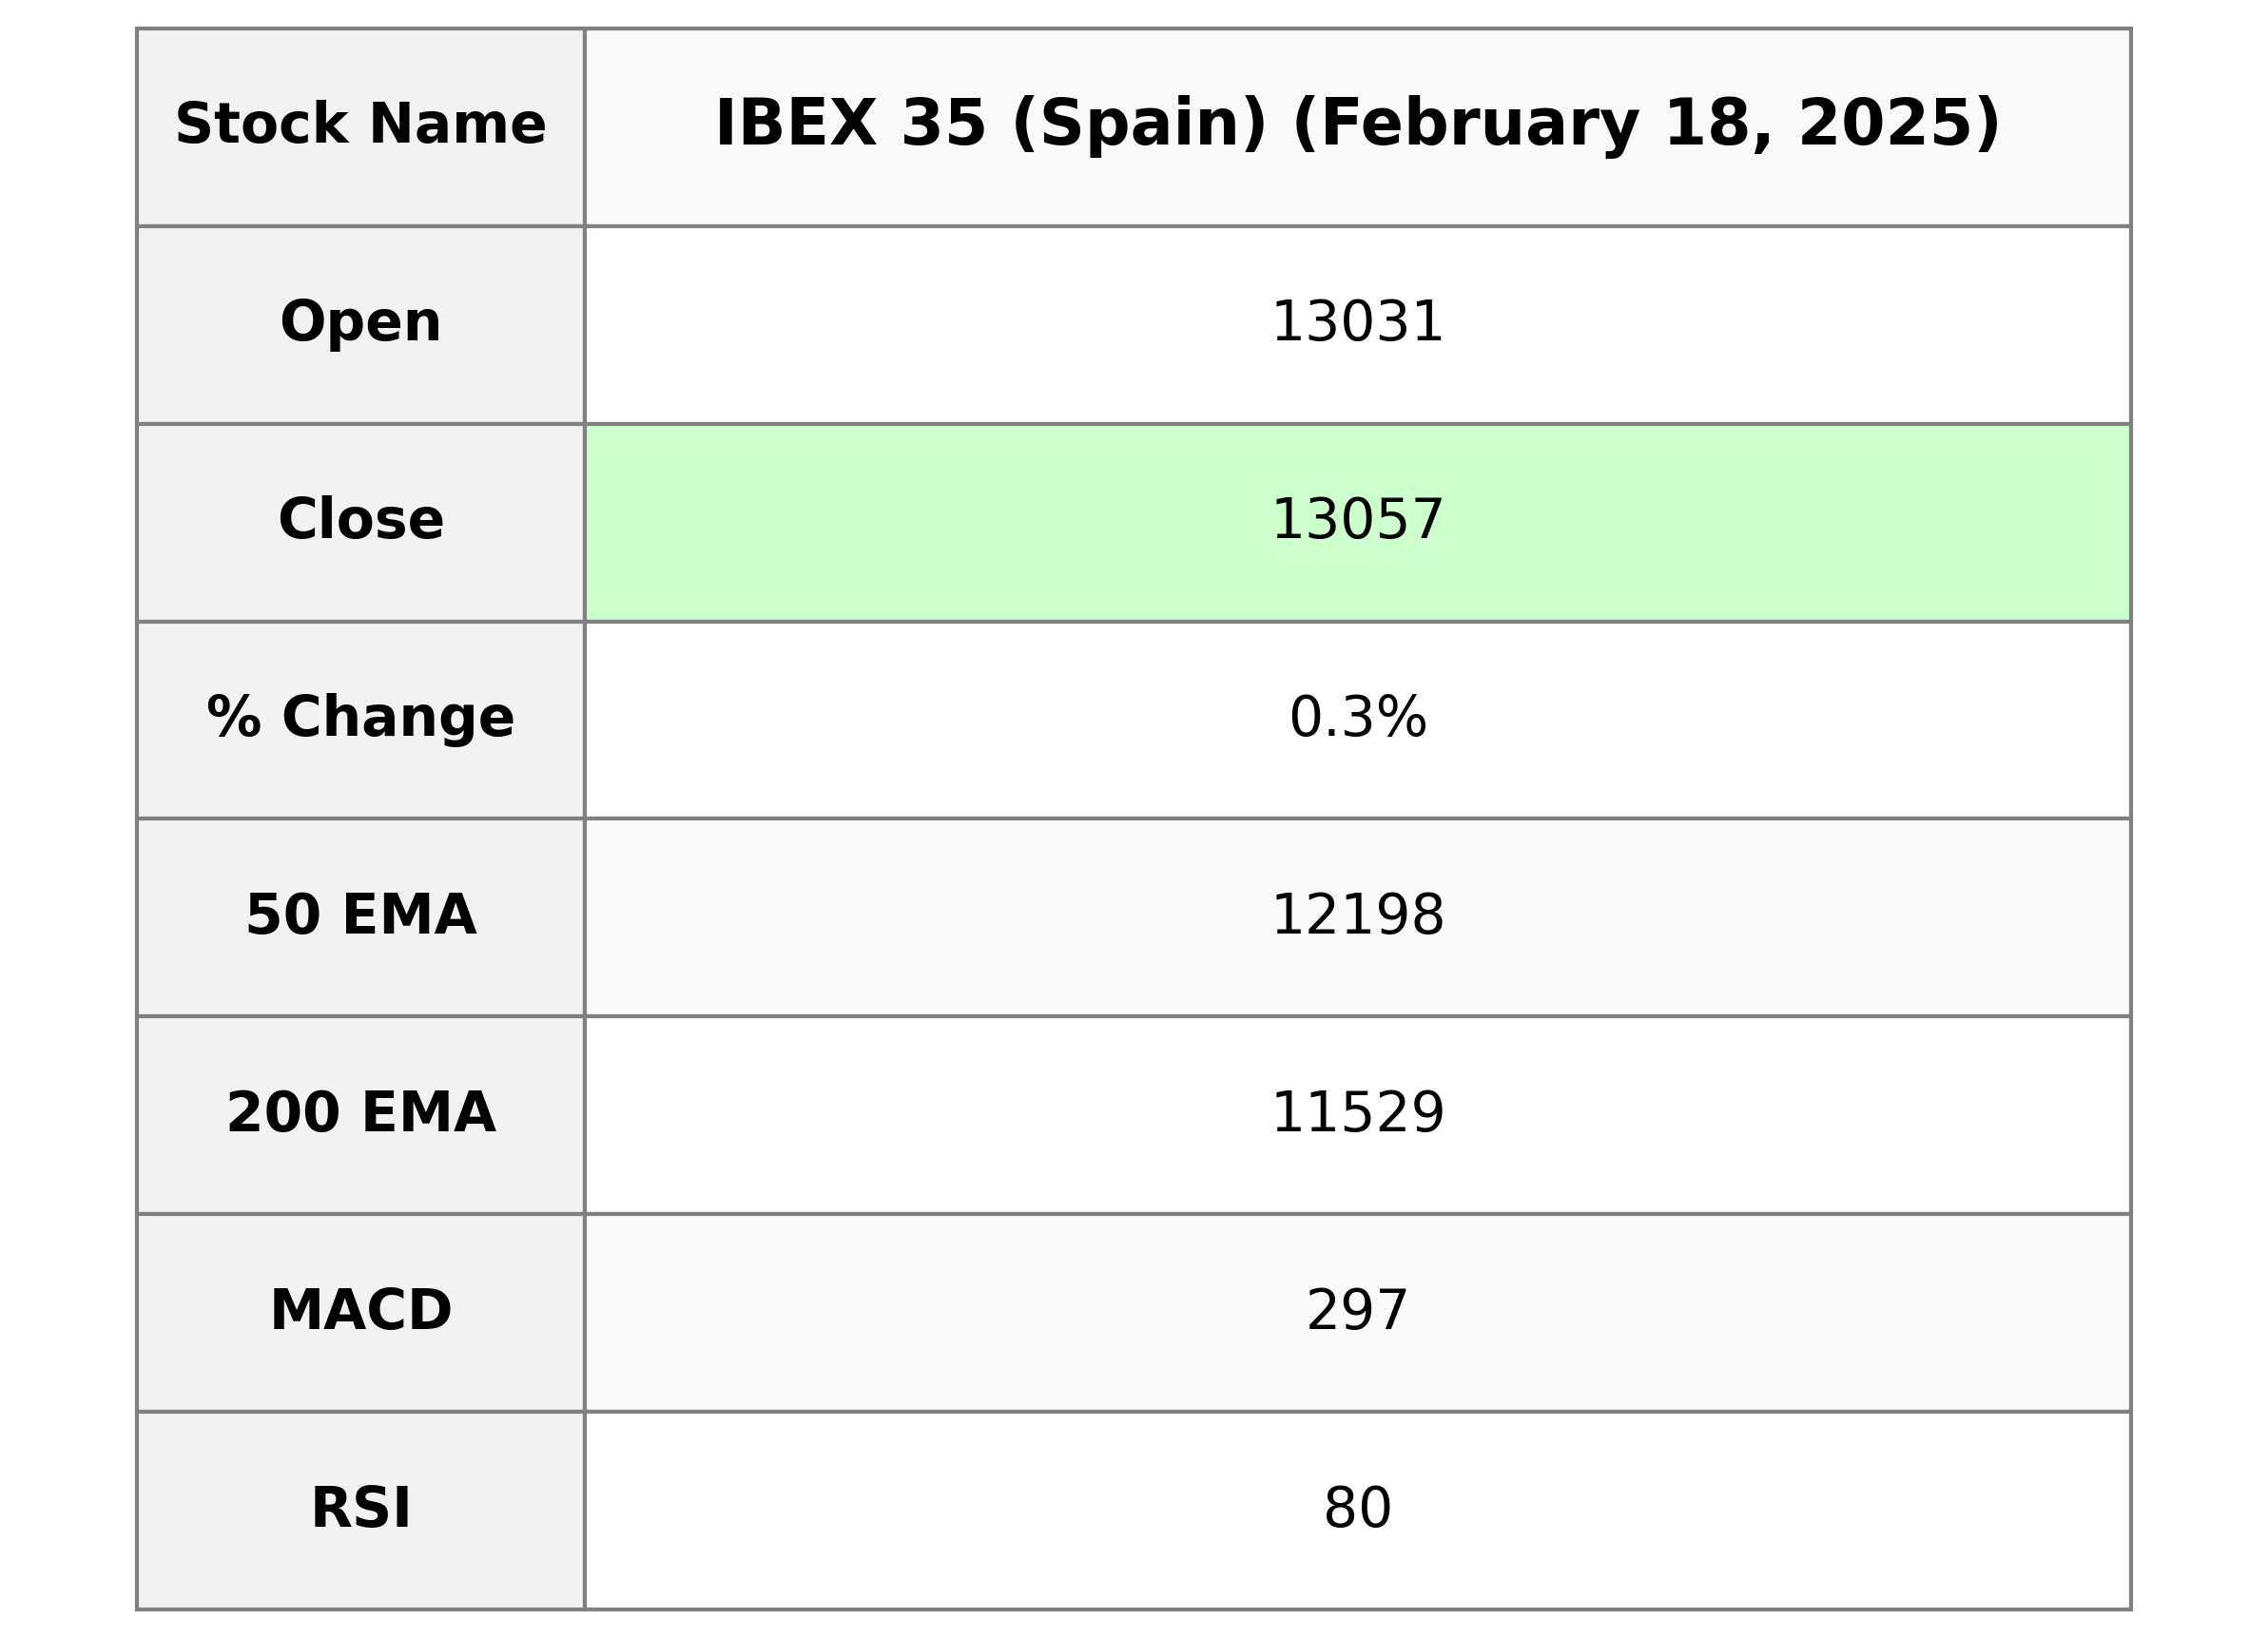
The IBEX 35 index opened at 13031.40 and closed higher at 13056.90, marking a slight increase of 0.31% or 40 points from the previous close of 13016.90. The index has strong momentum with an RSI of 80.01, suggesting it may be overbought. Its trading volume was 25,904,286, and the index is currently trading above its 50, 200, 10, and 20-day EMAs.
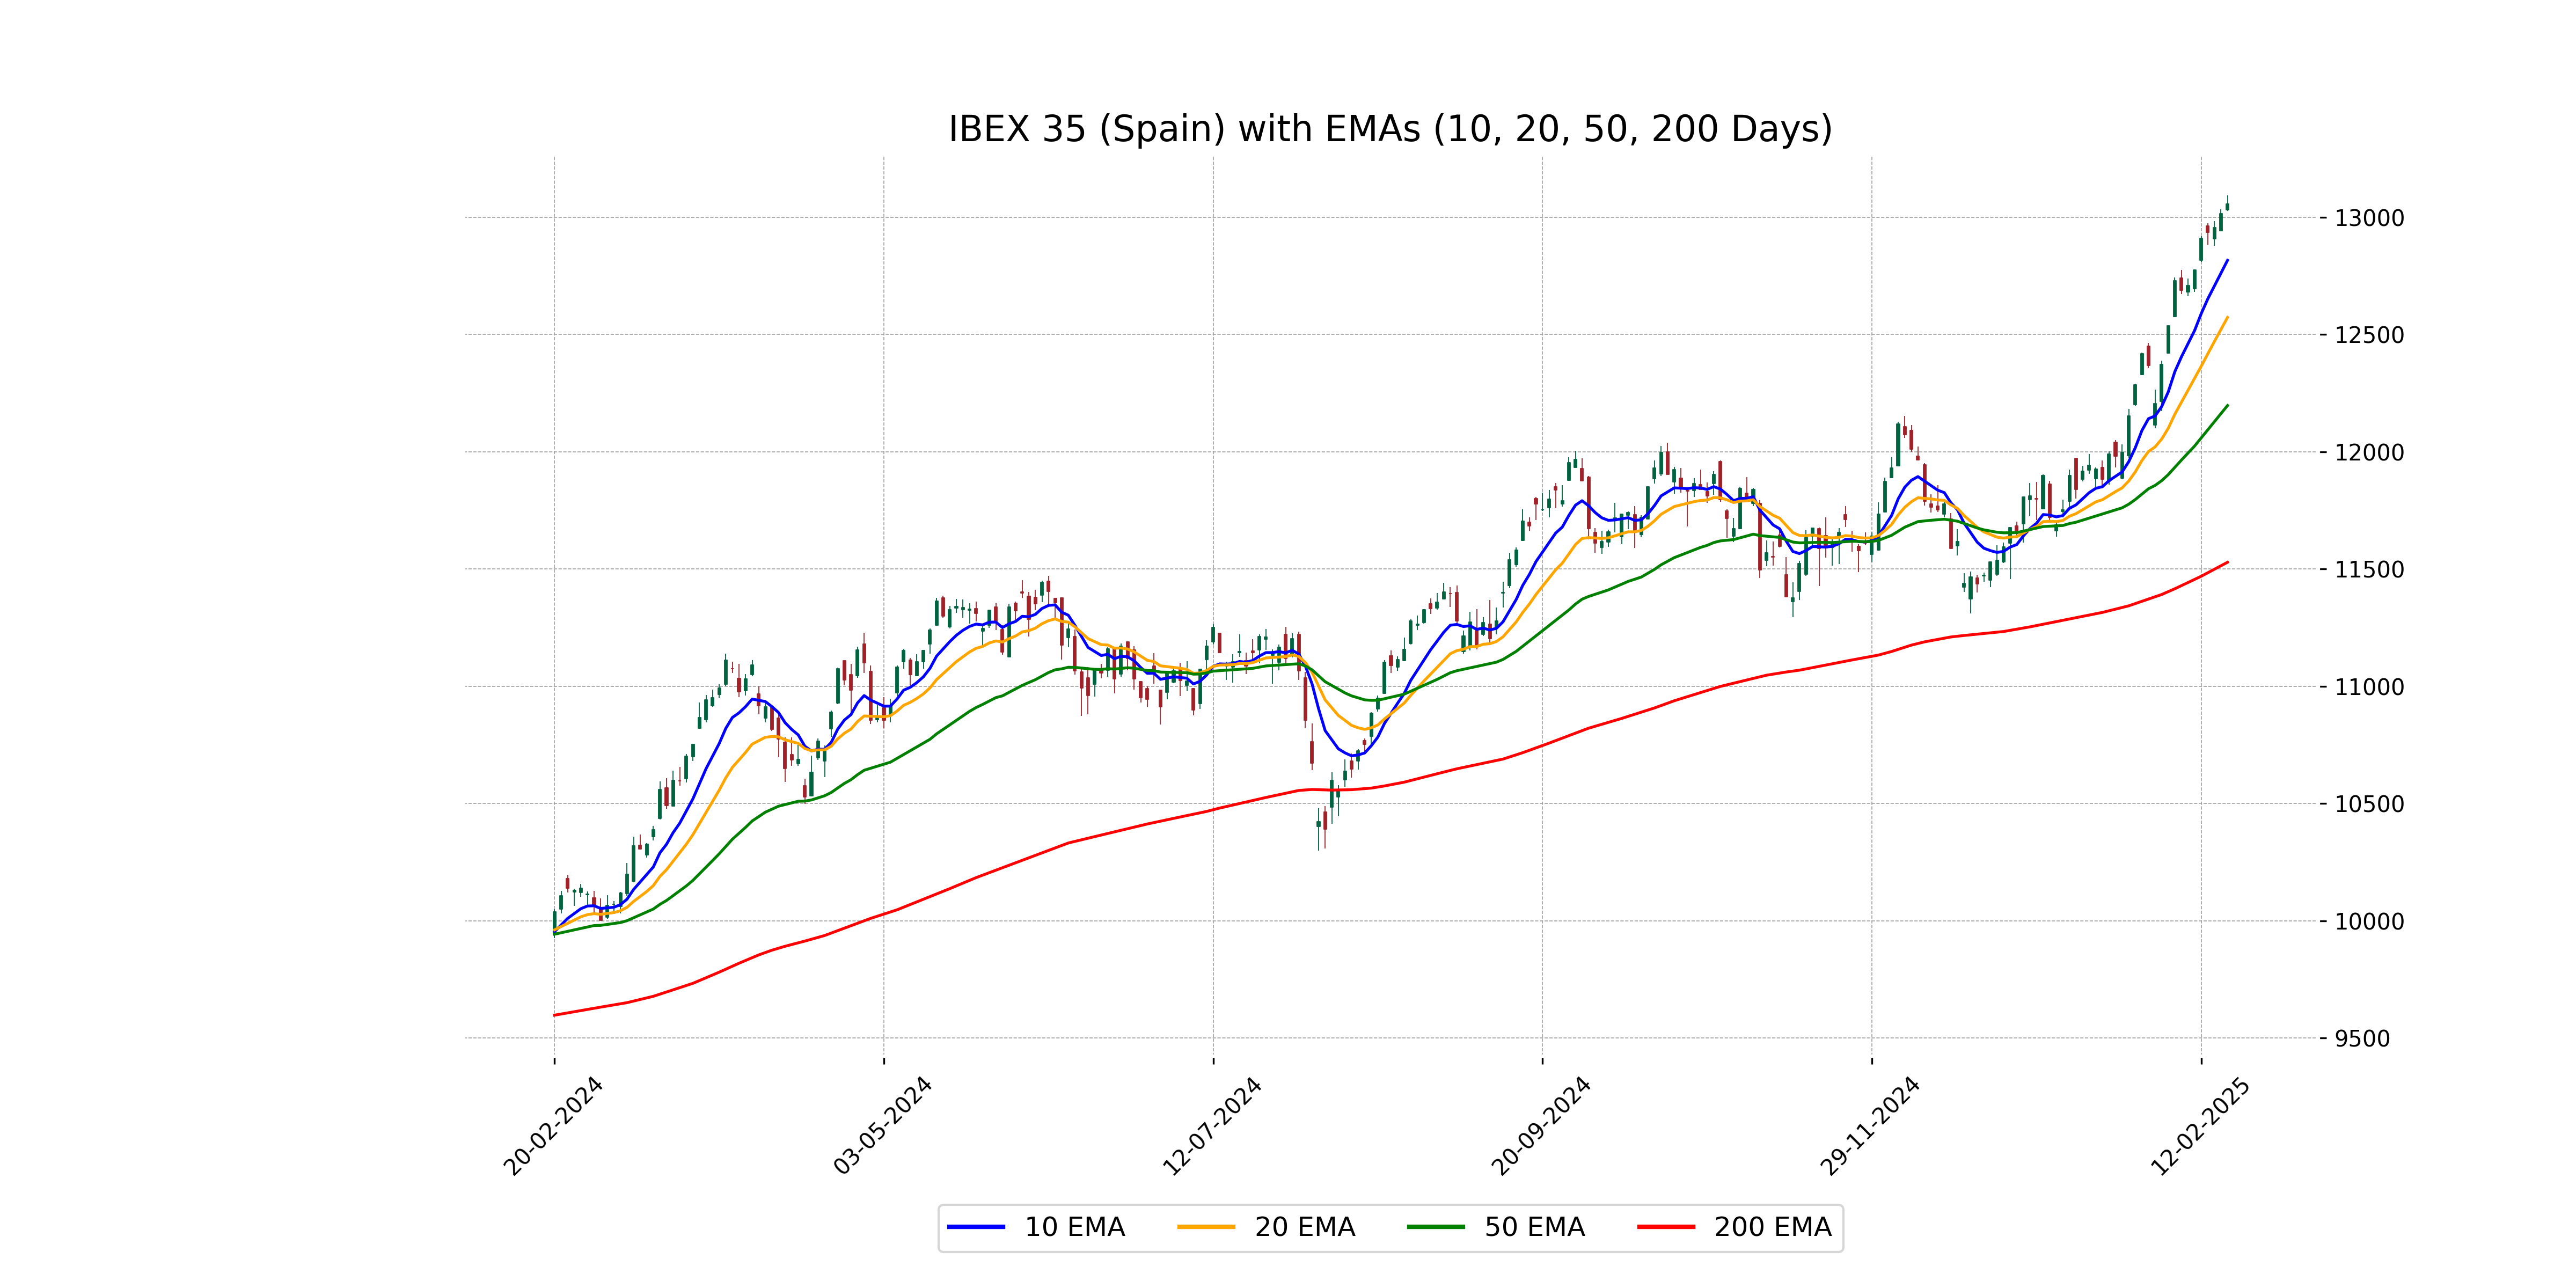
Relationship with Key Moving Averages
The closing price of the IBEX 35 (Spain) at 13056.90 is above its 10-day EMA (12817.03), 20-day EMA (12573.38), 50-day EMA (12197.58), and 200-day EMA (11528.93). This suggests a strong bullish trend as the price is leading all the key moving averages.
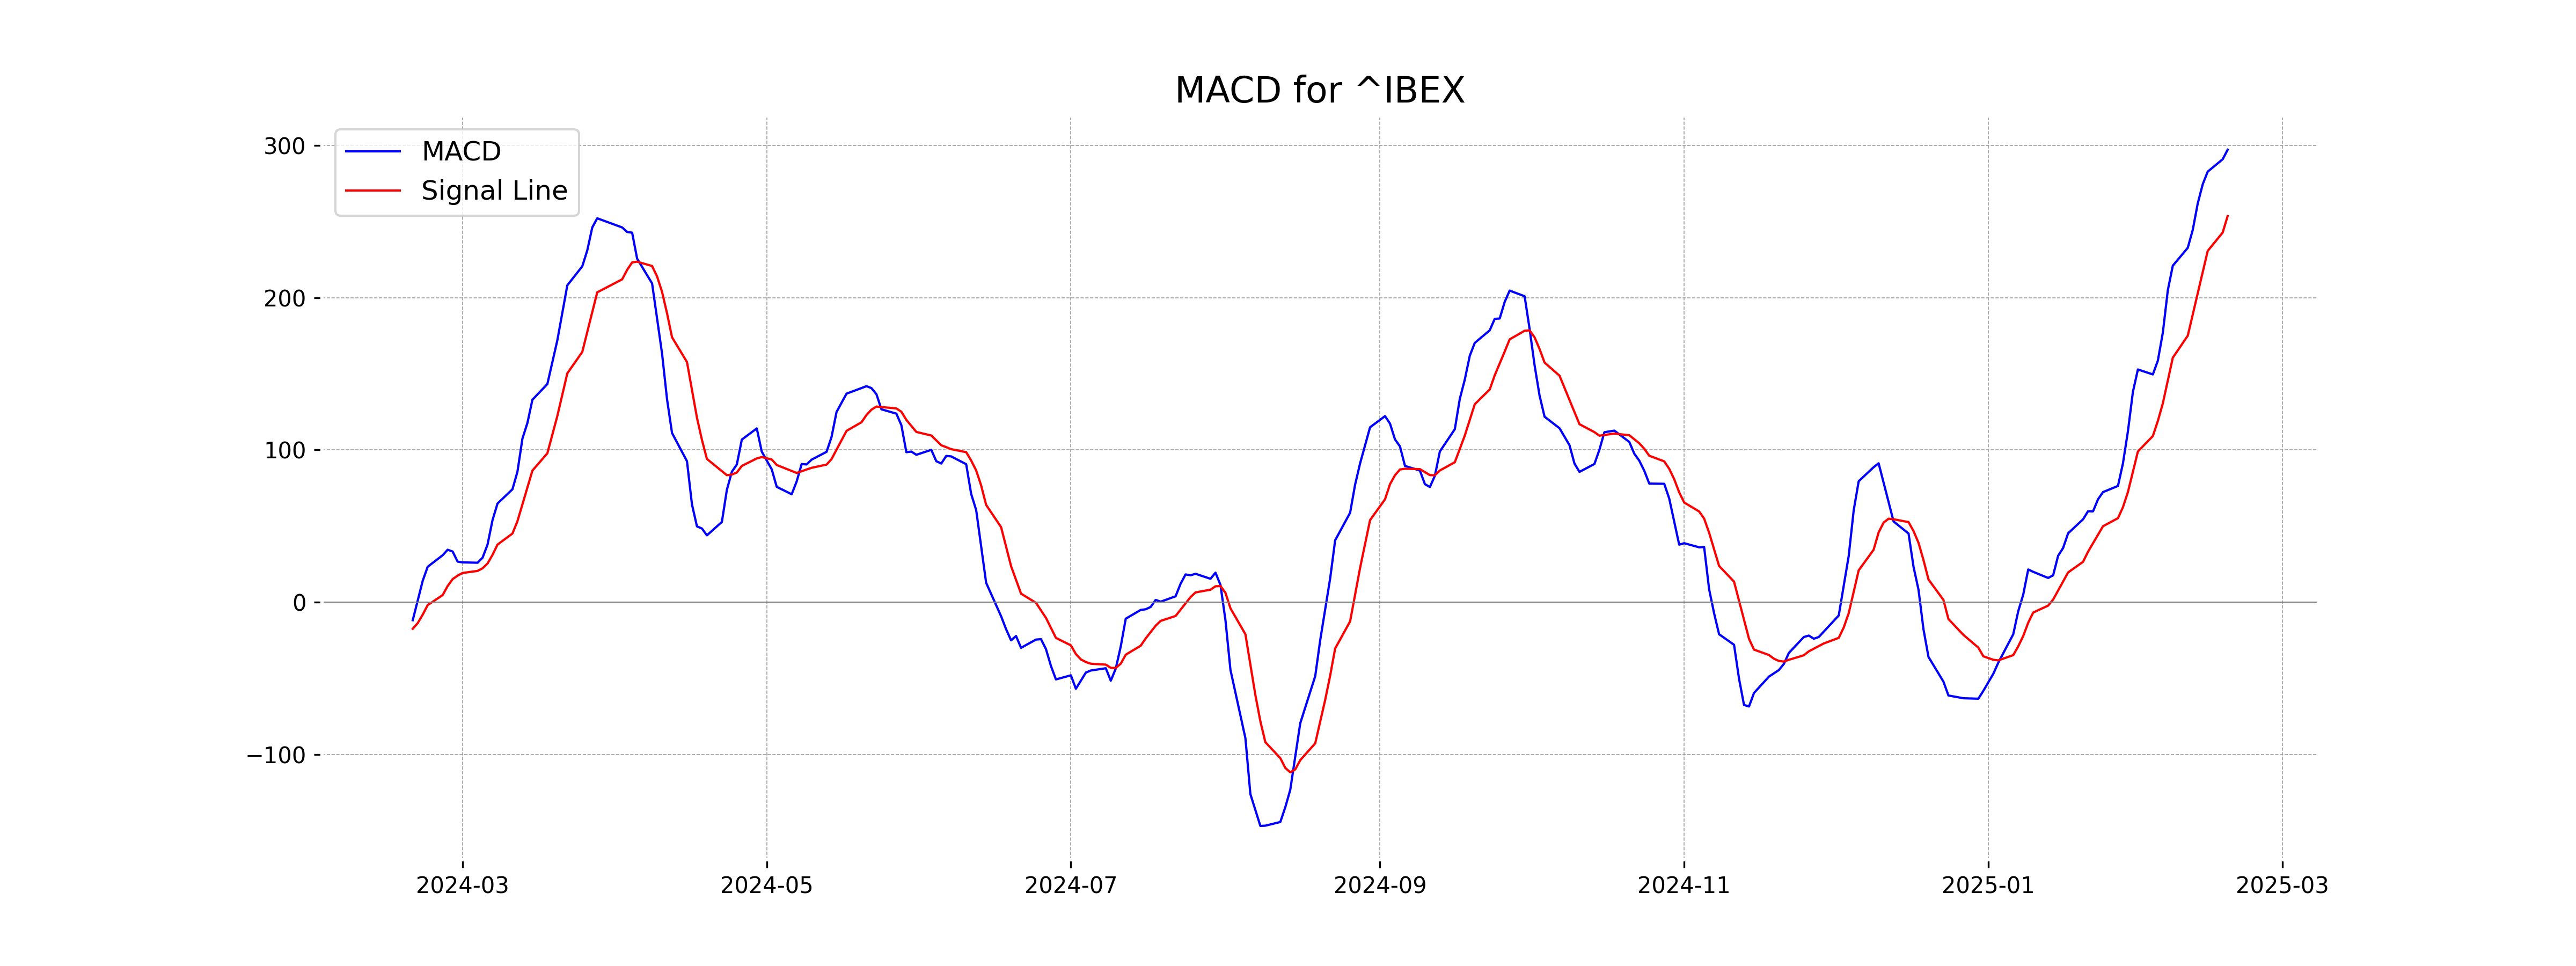
Moving Averages Trend (MACD)
The MACD value for IBEX 35 is 297.20, which is above the MACD Signal line at 253.66. This indicates a positive trend, suggesting bullish momentum. Additionally, the RSI is at 80.01, which may imply that the index is in overbought territory.
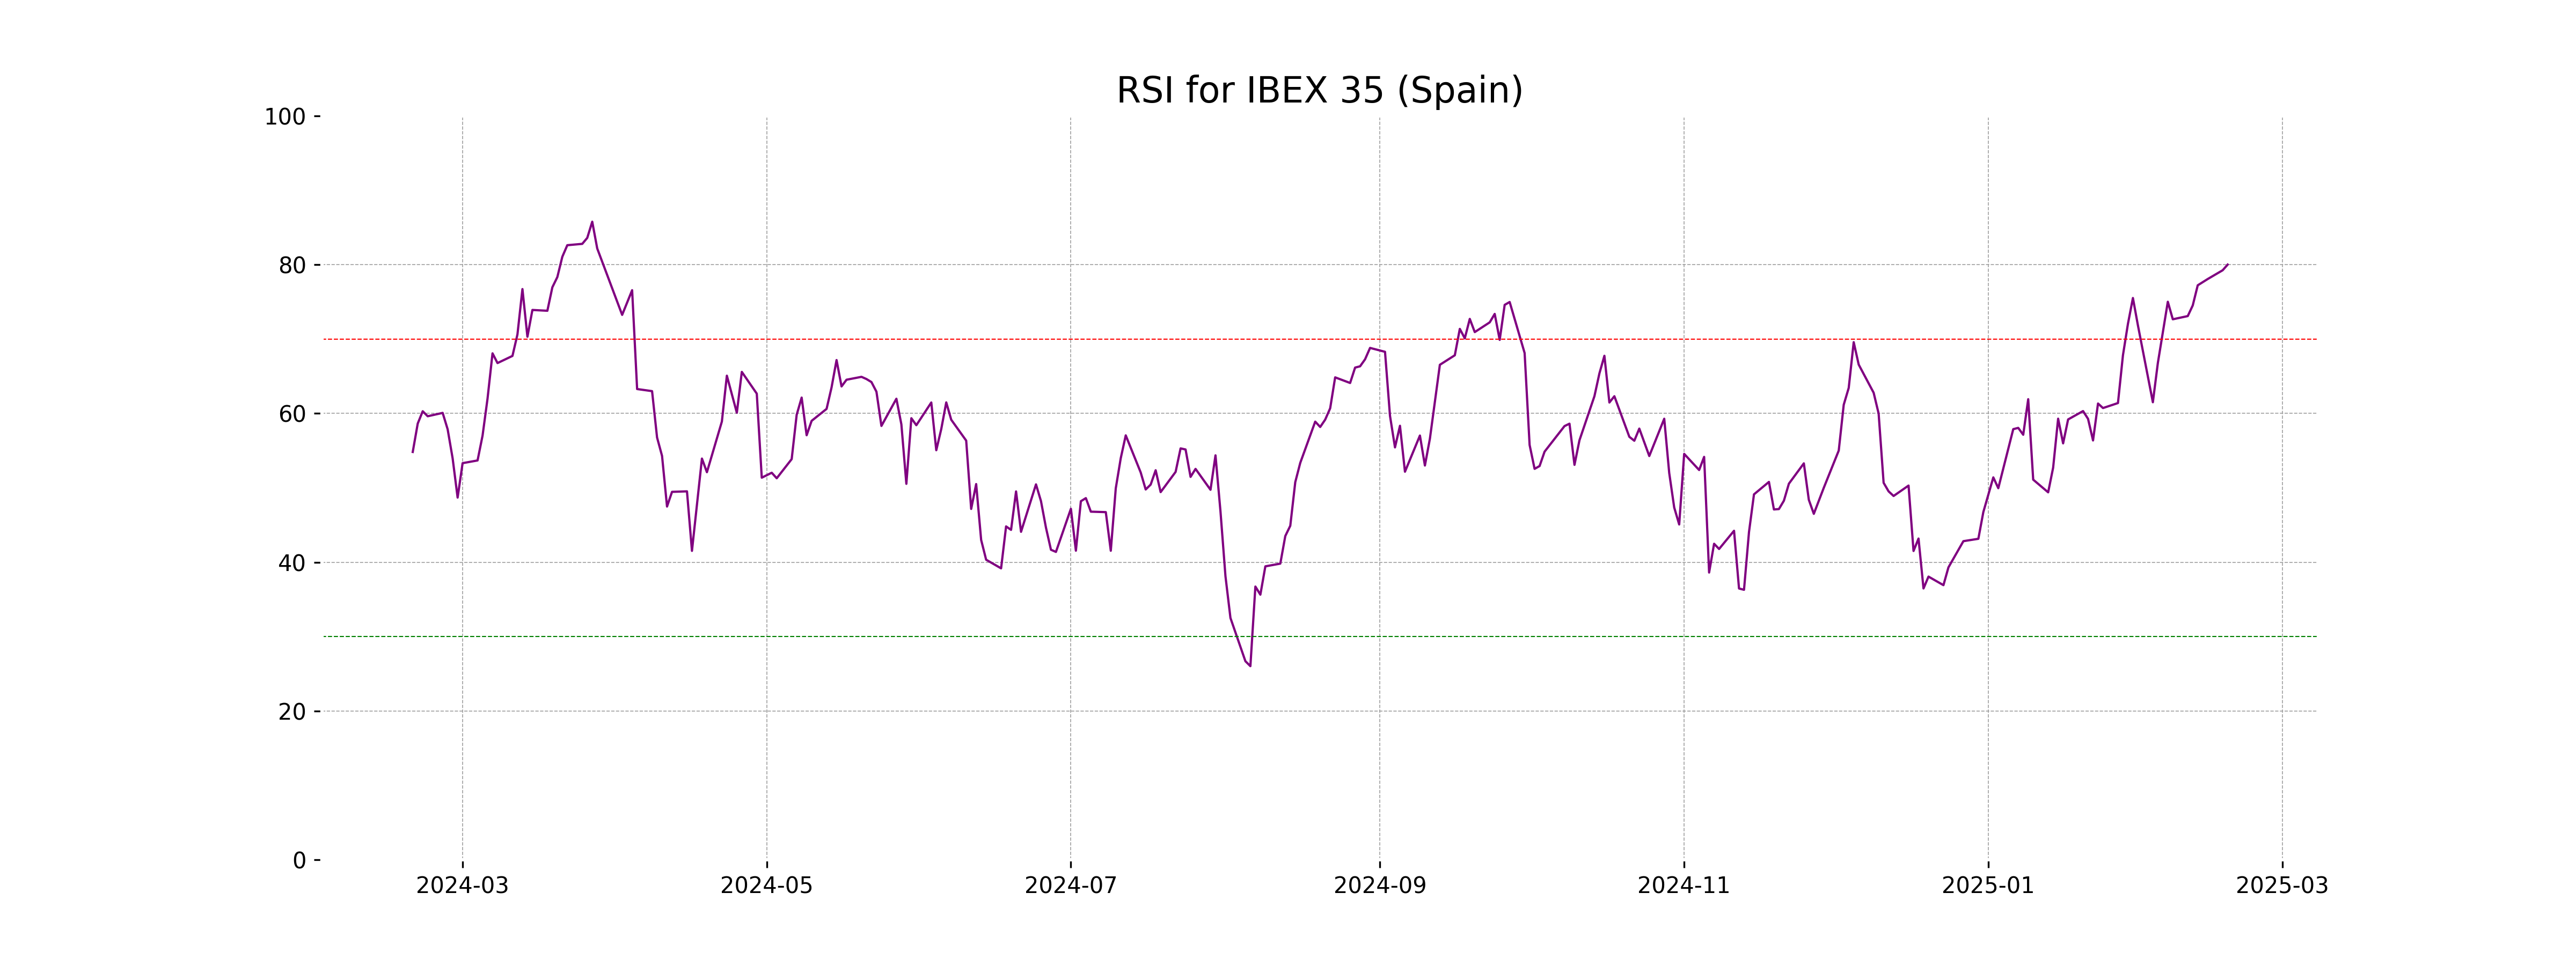
RSI Analysis
The RSI value for IBEX 35 is 80.01, which suggests the index is in overbought territory. Typically, an RSI above 70 indicates overbought conditions, potentially signaling a trend reversal or pullback could occur soon. This elevated RSI should caution investors to evaluate the index carefully.
Analysis for NASDAQ Composite (US) - February 18, 2025
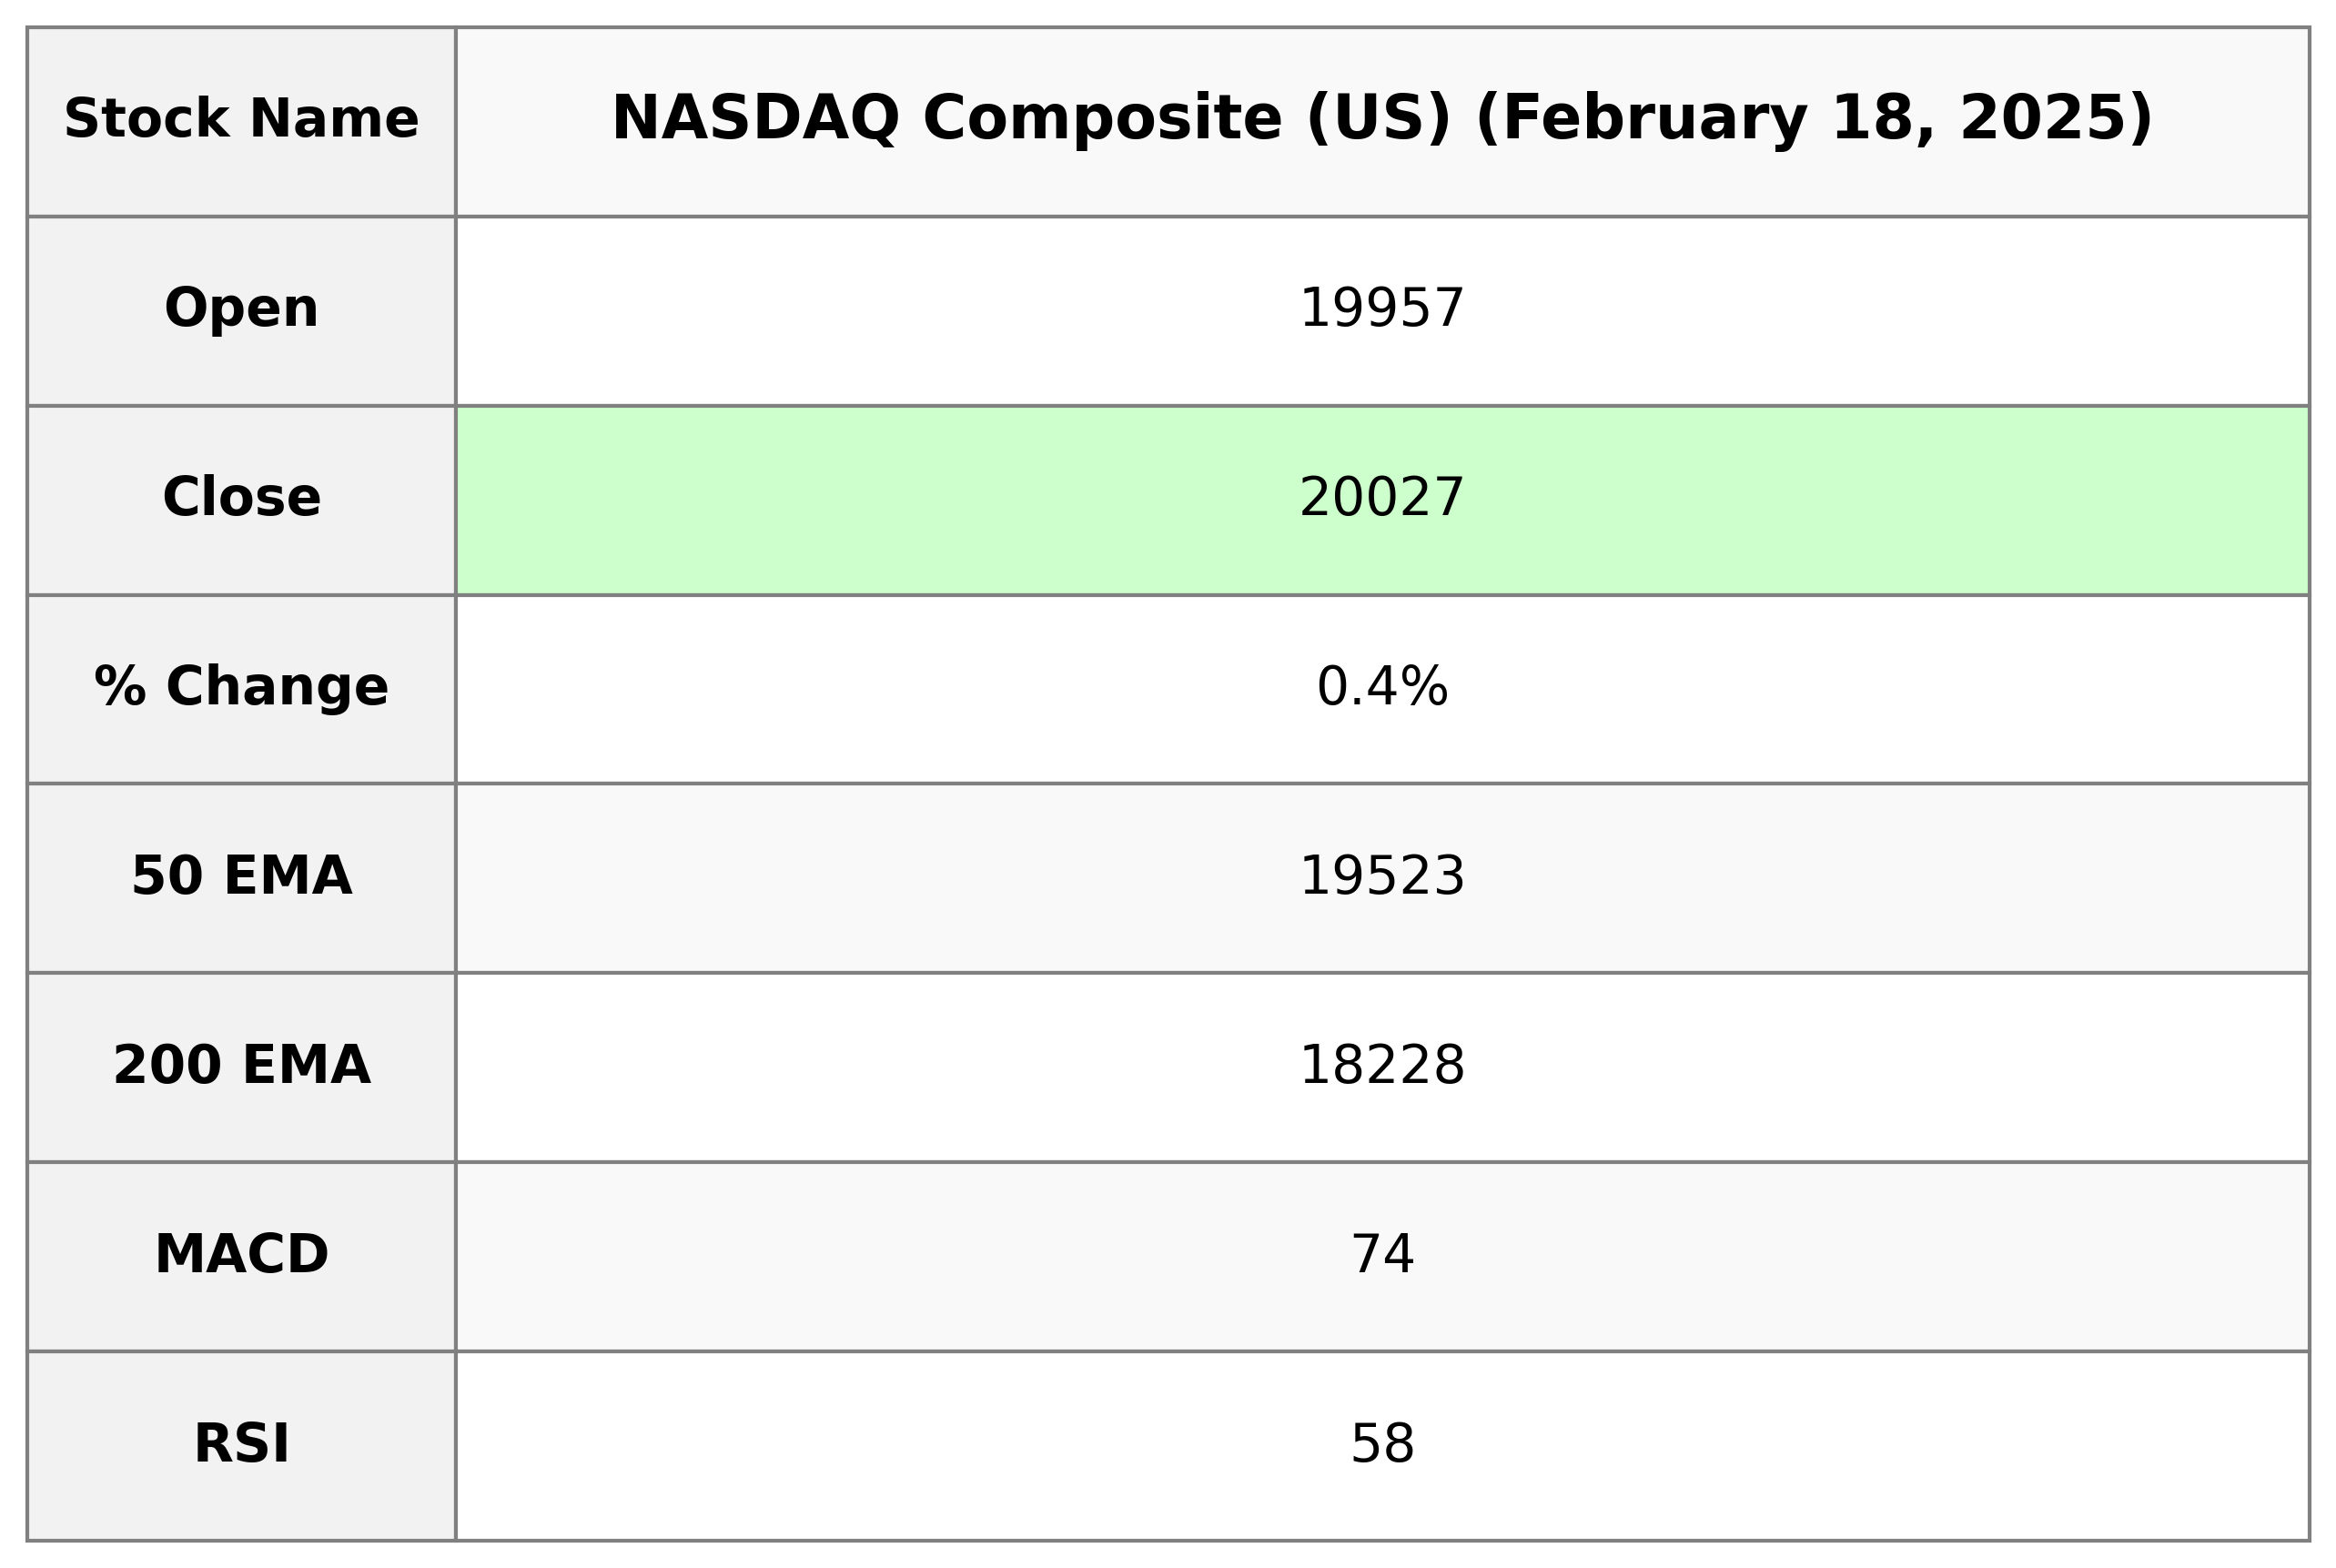
The NASDAQ Composite (US) opened at 19,956.82, reaching a high of 20,045.76 and closing at 20,026.77. It experienced a positive change of 0.41%, with a points increase of 81.13. The volume traded was approximately 7.99 billion, and technical indicators include a 50-day EMA of 19,523.38, RSI at 58.12, and a MACD of 73.79.
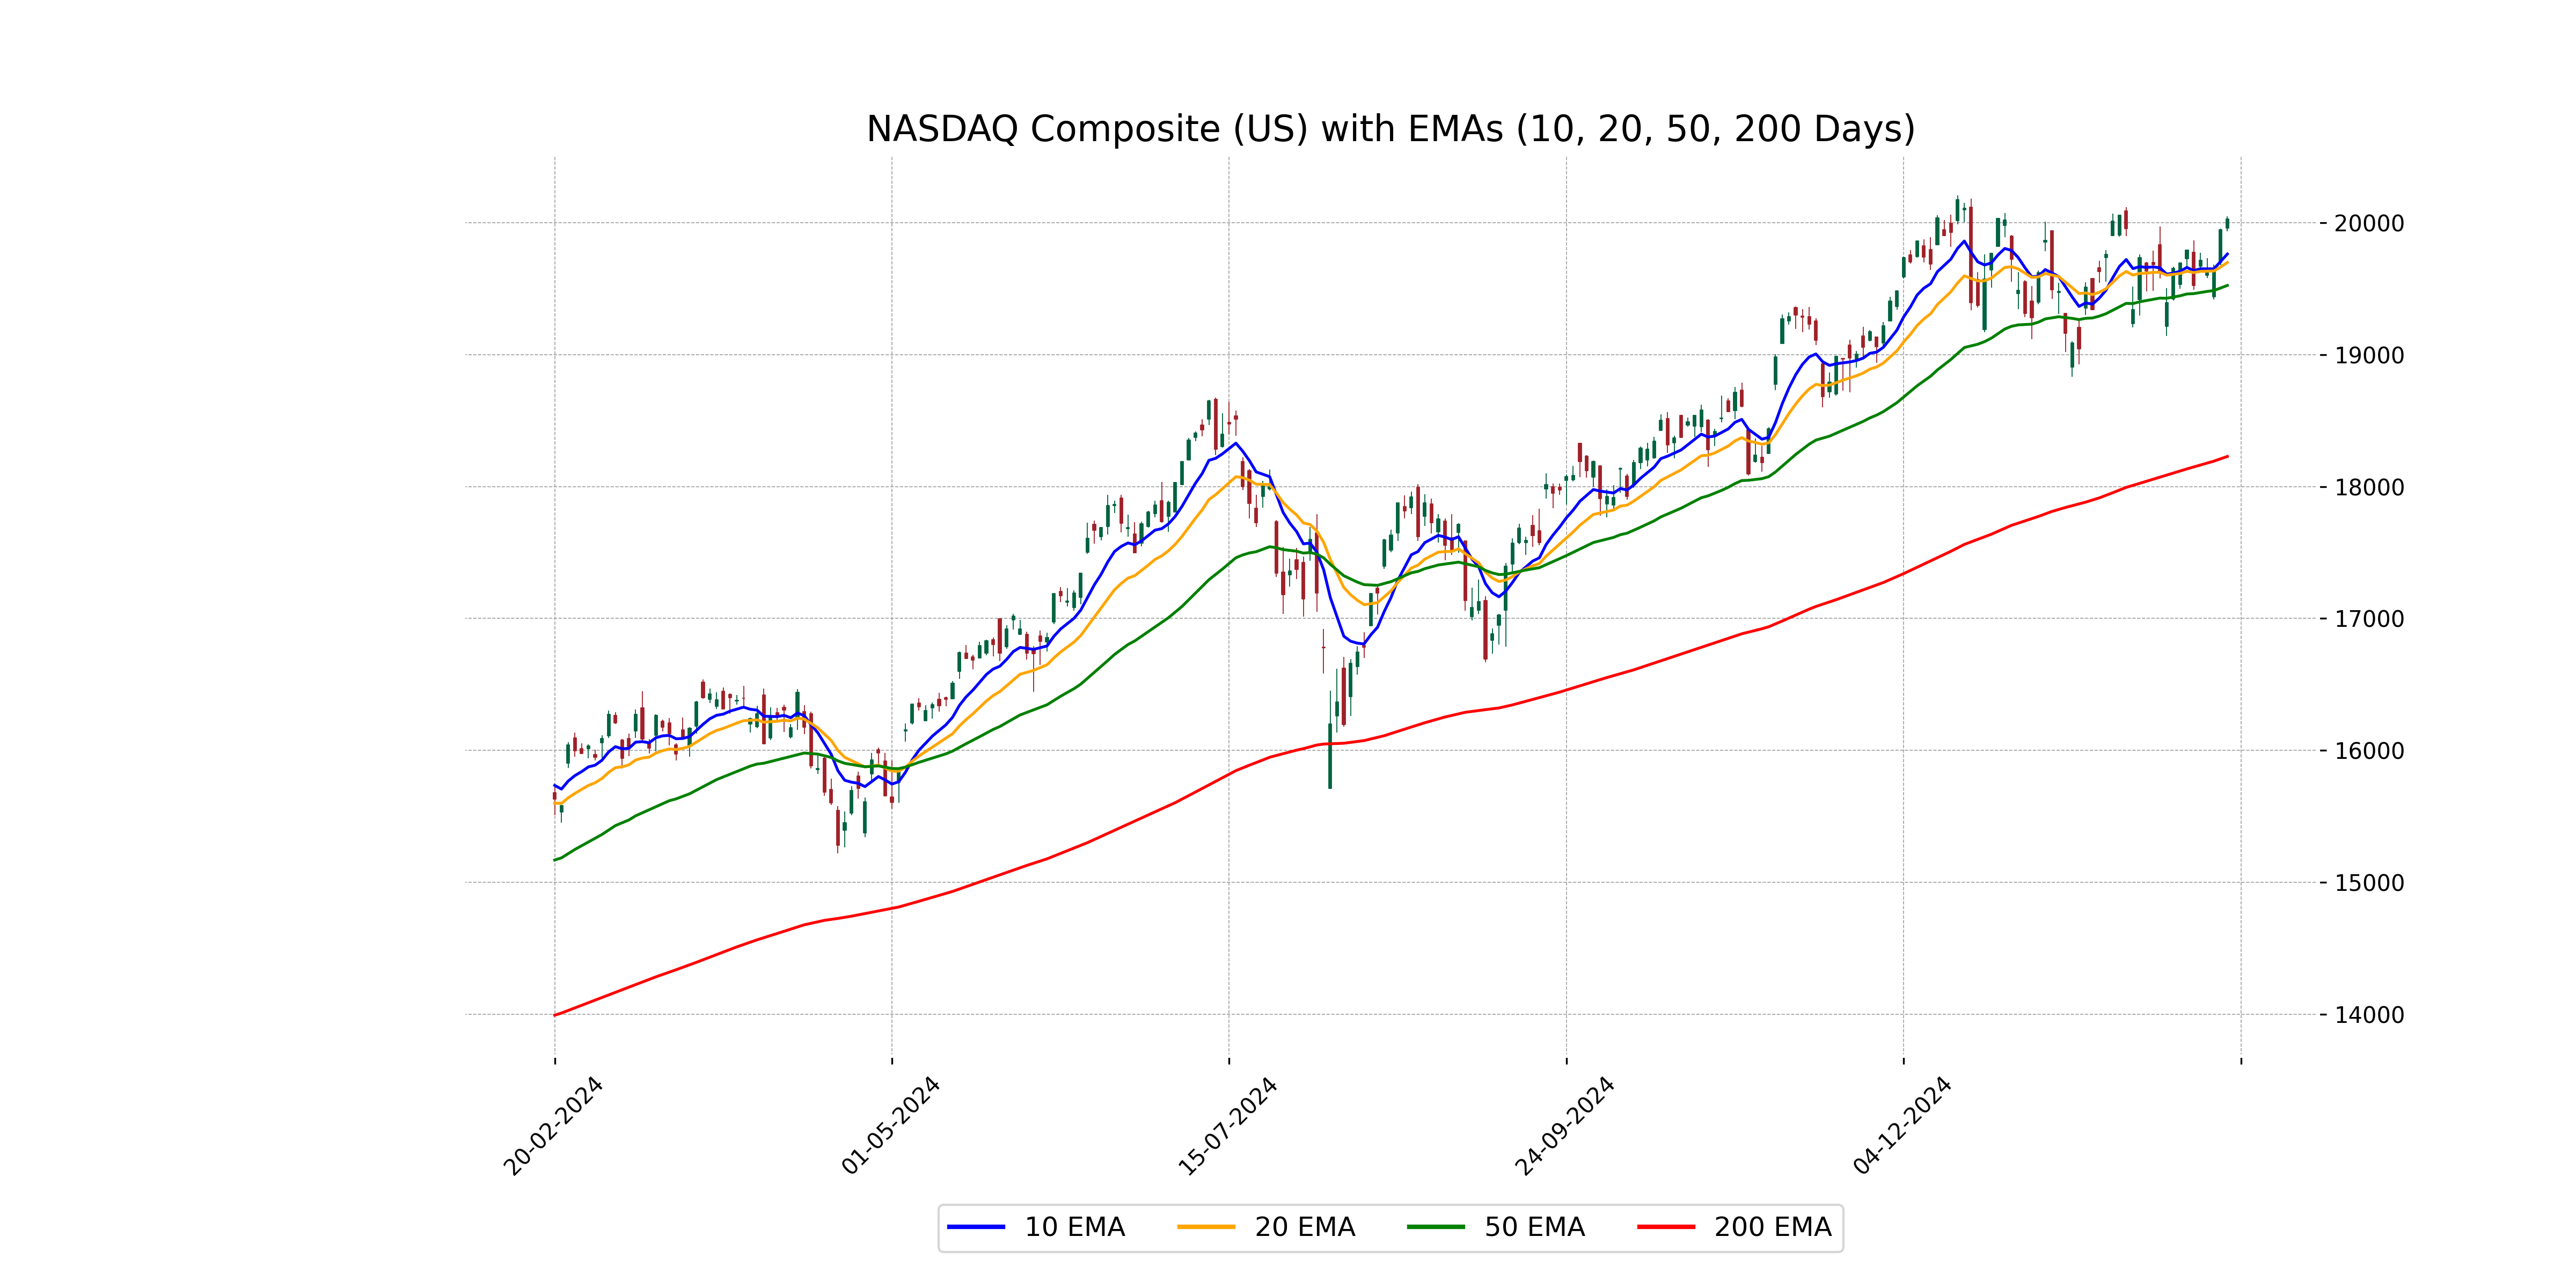
Relationship with Key Moving Averages
NASDAQ Composite (US) is trading at 20,026.77, which is above the 50-day EMA of 19,523.38, the 20-day EMA of 19,697.38, and the 10-day EMA of 19,761.71, indicating a potential uptrend. The index is also significantly higher than the 200-day EMA of 18,227.73, suggesting a strong long-term bullish momentum.
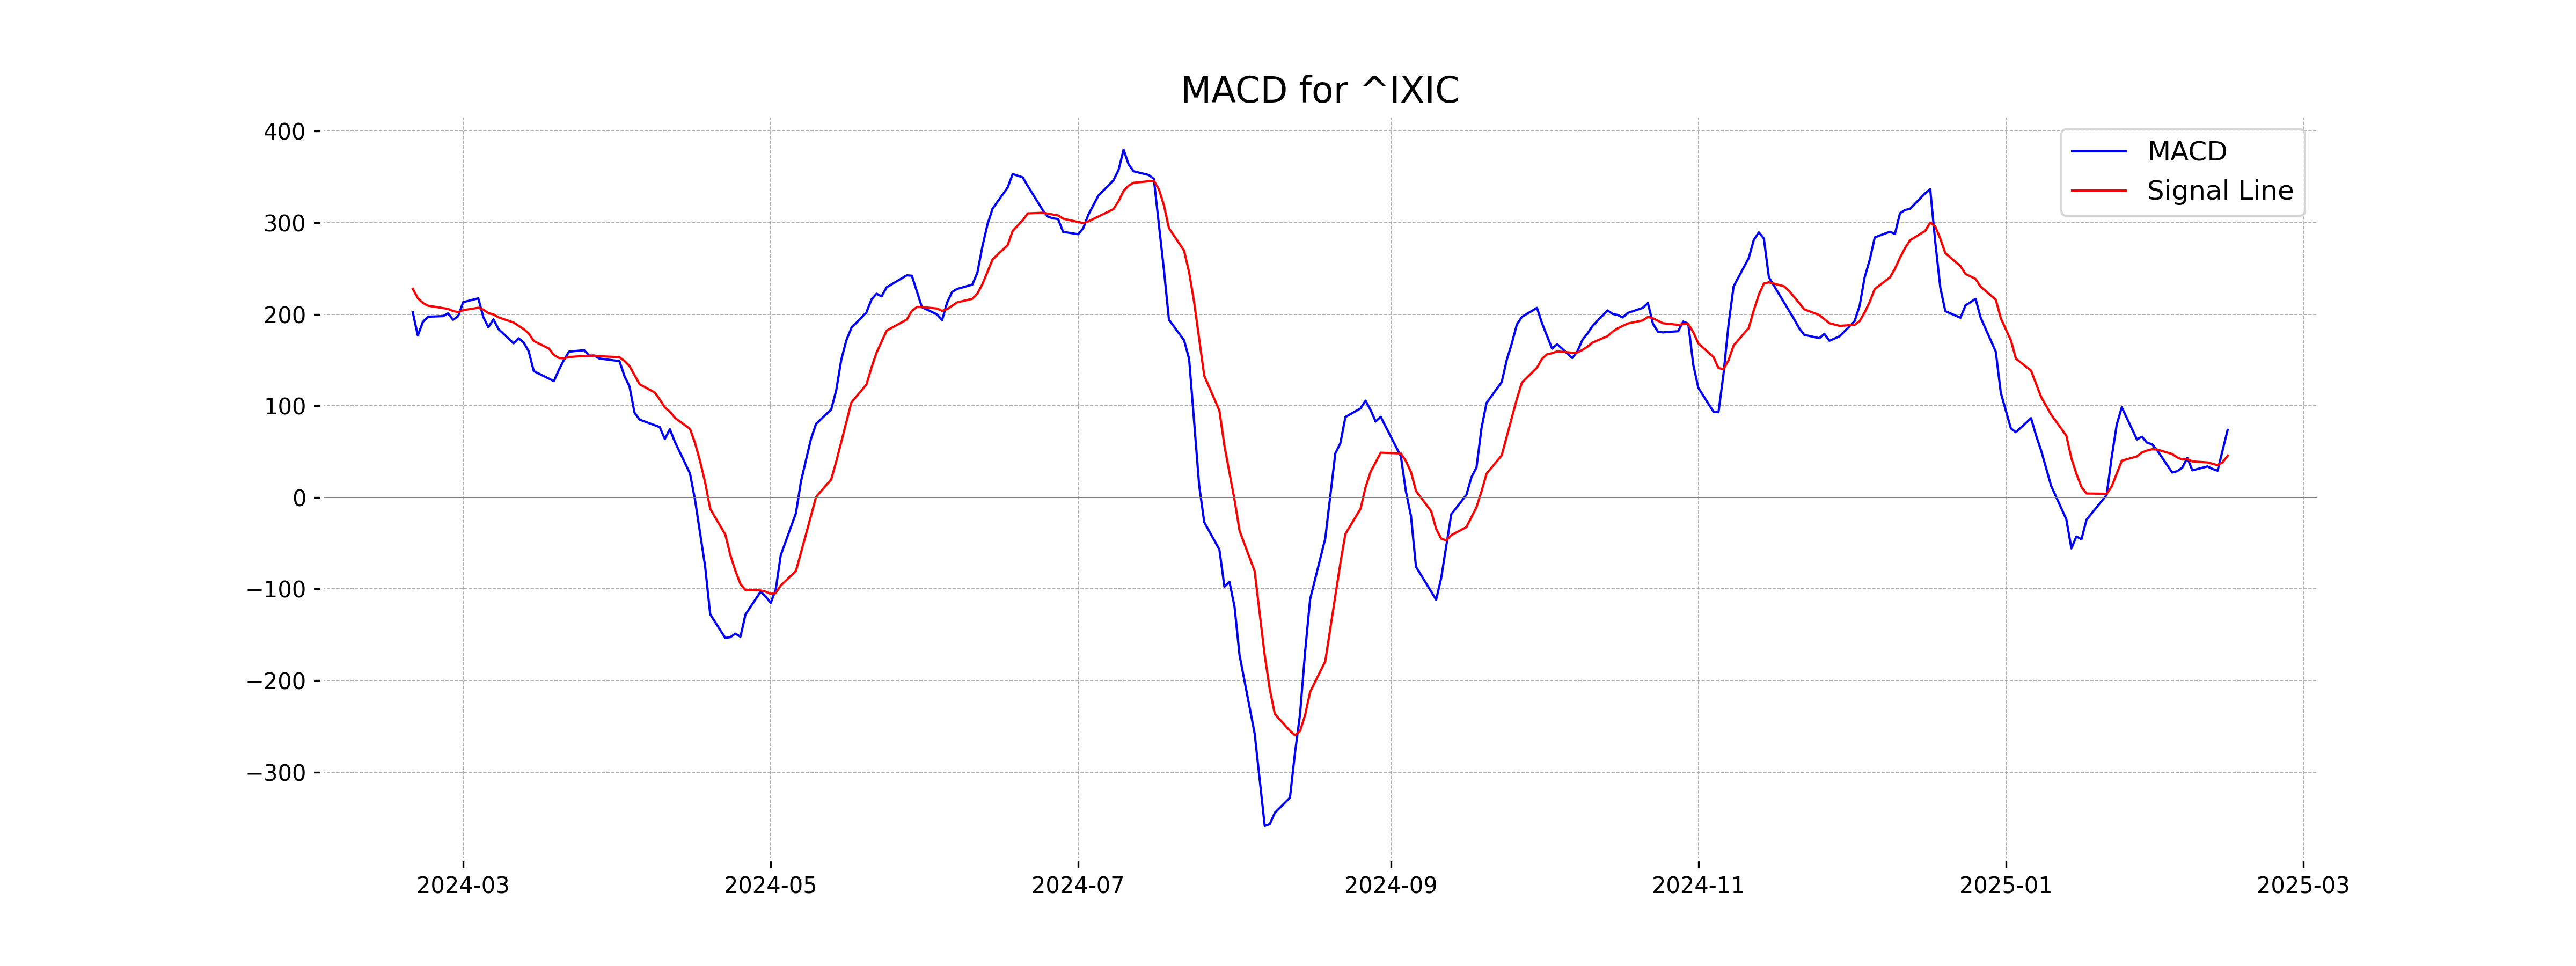
Moving Averages Trend (MACD)
The MACD for the NASDAQ Composite is positive at 73.79, indicating potential bullish momentum as it is above the signal line, which is at 45.48. This suggests increasing buying pressure in the market.
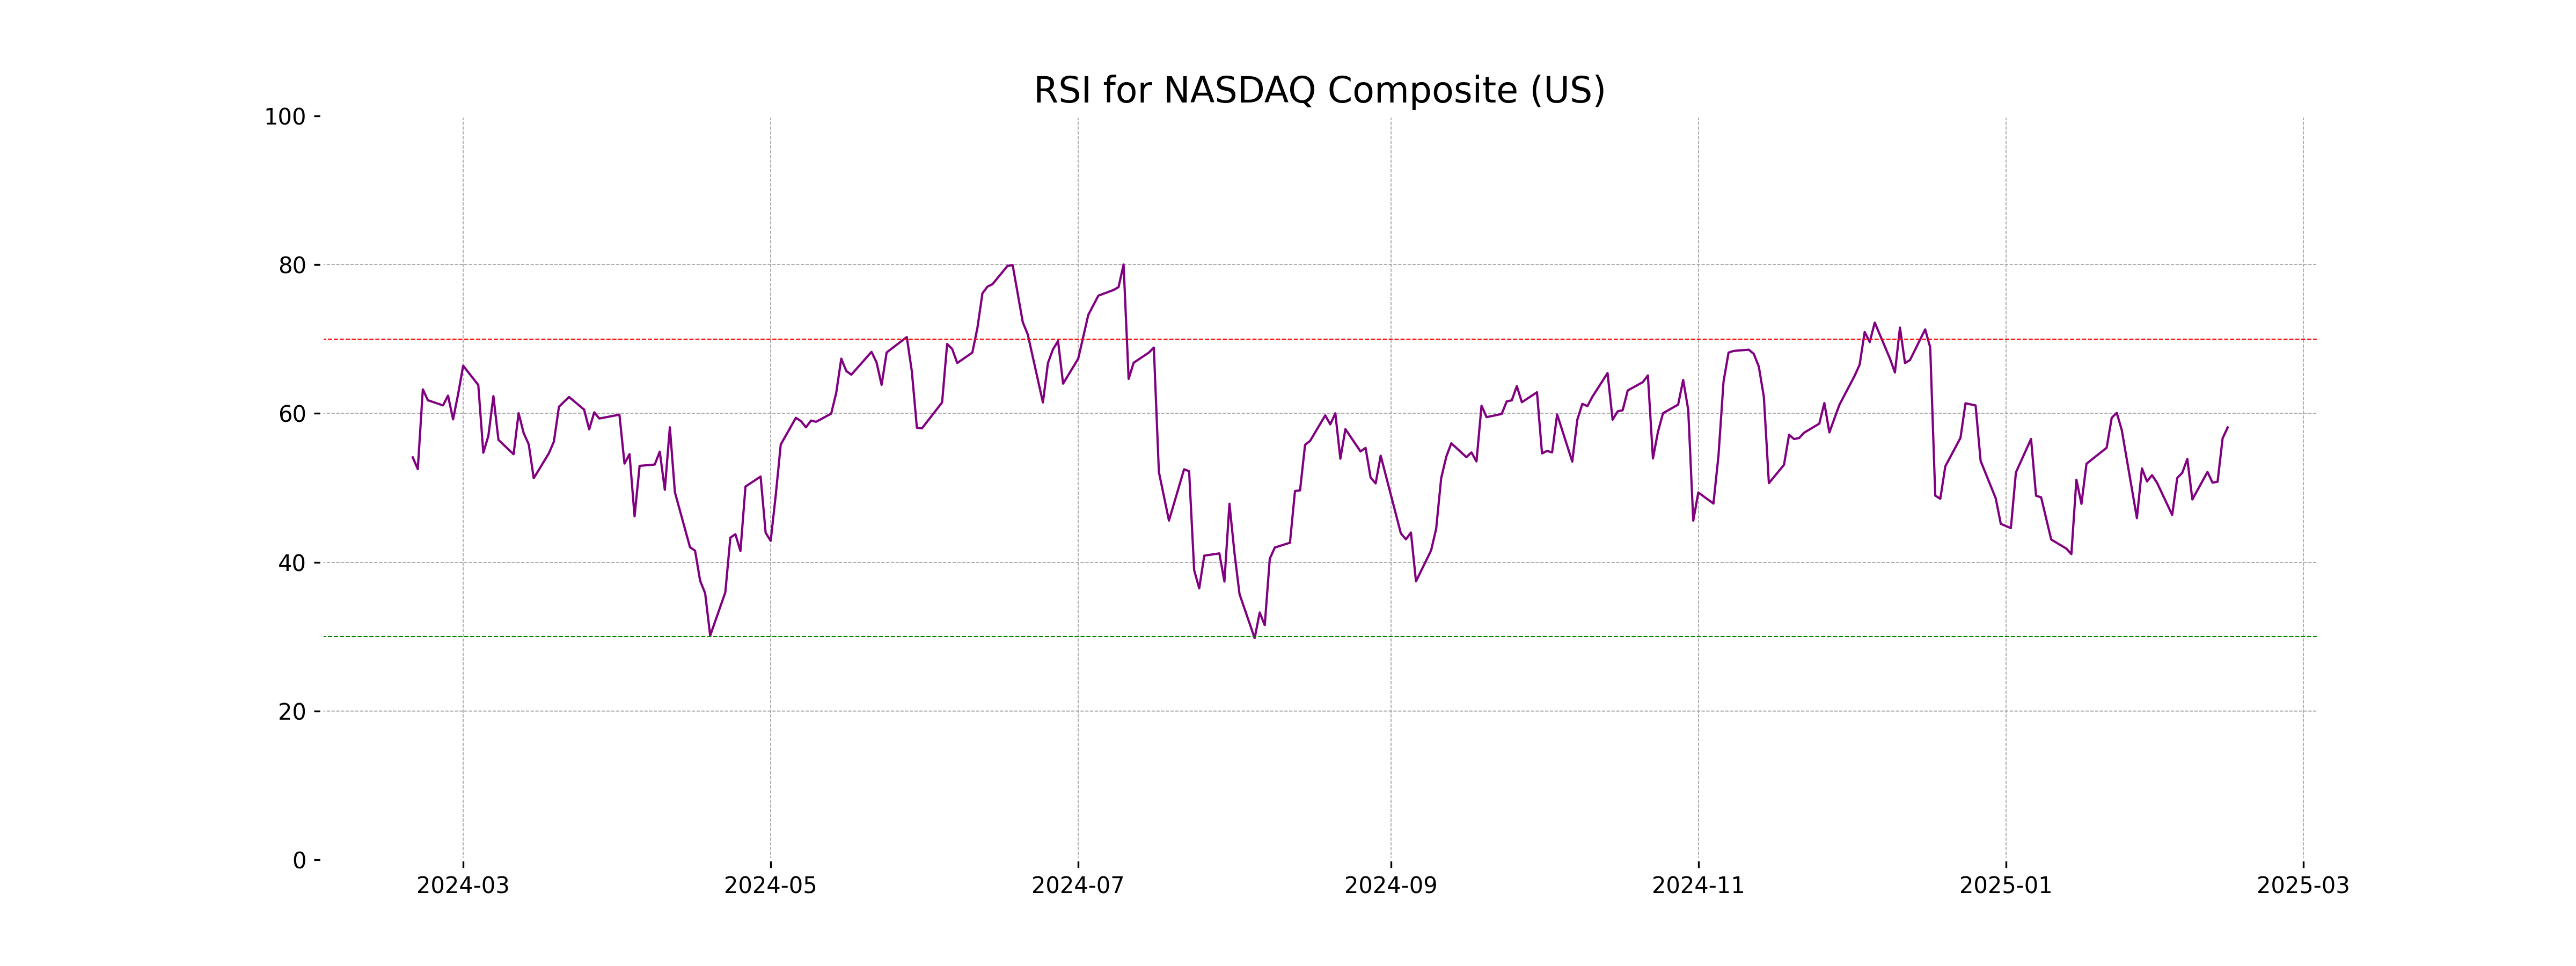
RSI Analysis
The RSI (Relative Strength Index) for the NASDAQ Composite is 58.12, indicating that the index is in a neutral zone, away from the traditional overbought (above 70) or oversold (below 30) levels. This suggests no clear directional momentum either up or down.
Analysis for Nikkei 225 (Japan) - February 18, 2025
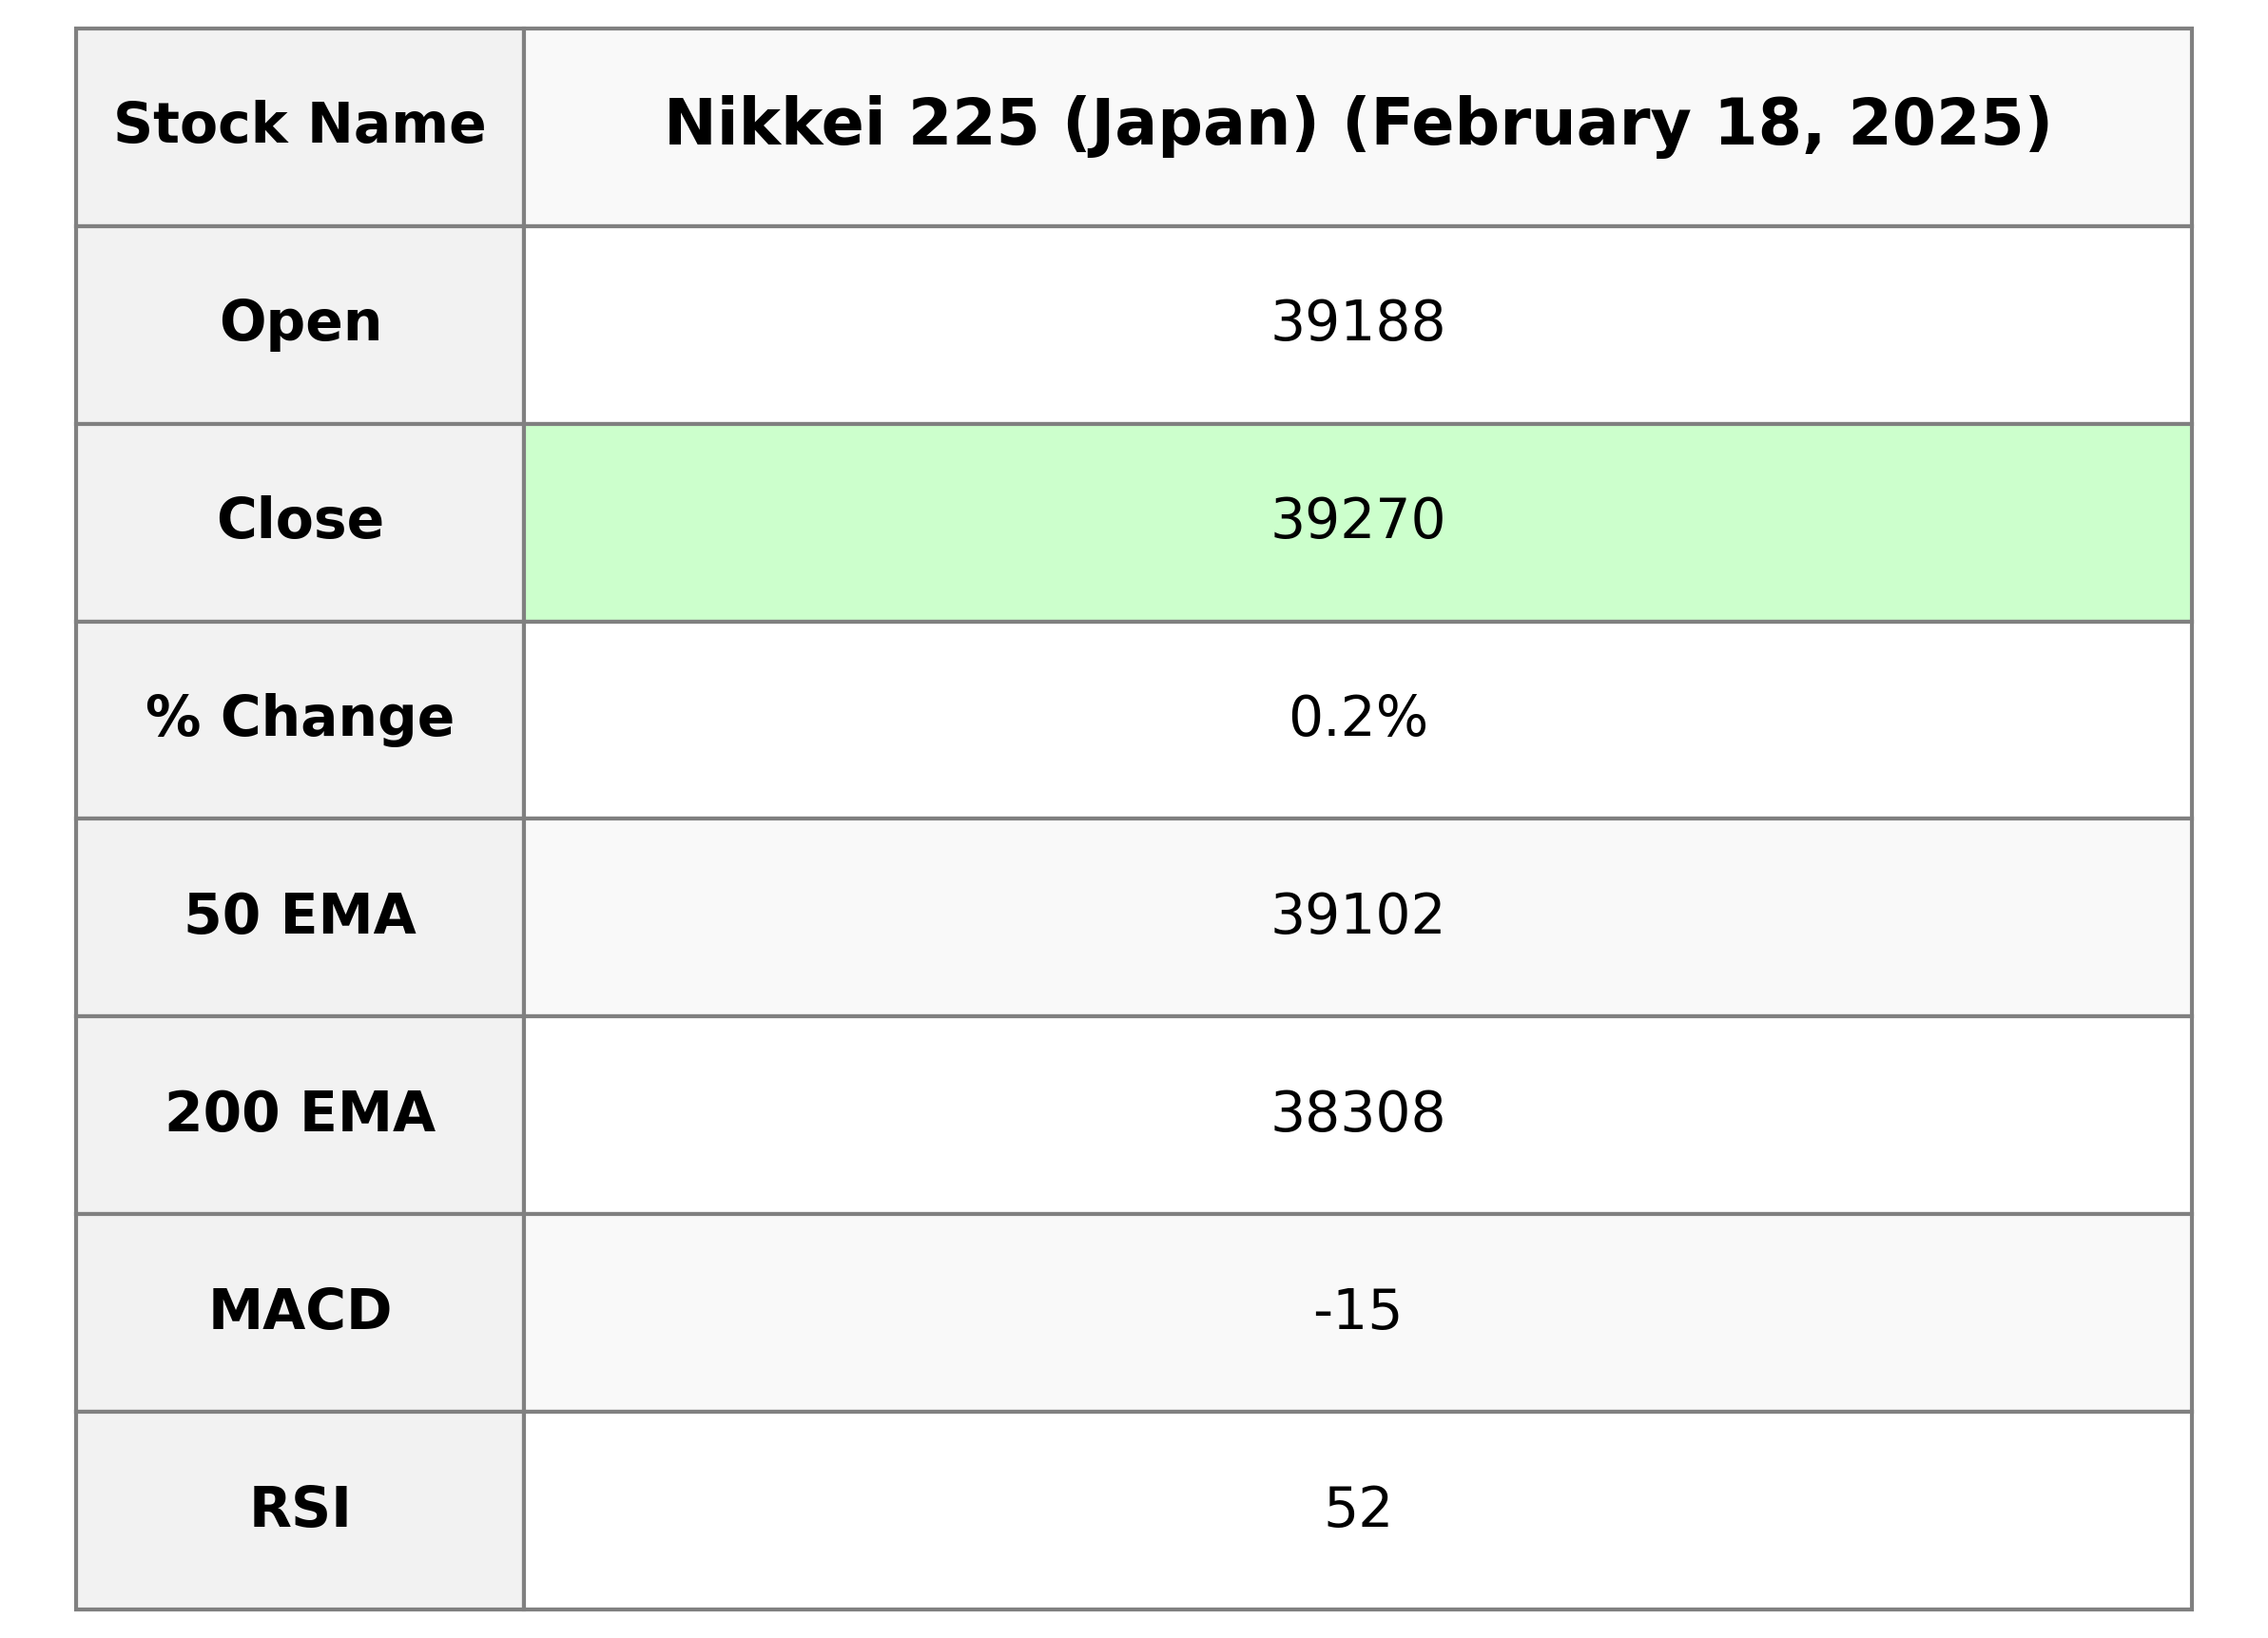
Nikkei 225 (Japan) opened at 39187.99 and closed at 39270.40, with a slight increase represented by a 0.25% change, or a points change of 96.15. The index's RSI stands at 51.74, indicating neutral momentum, while the MACD suggests a potential bullish trend with a value of -15.18, improving from its signal line at -33.53.
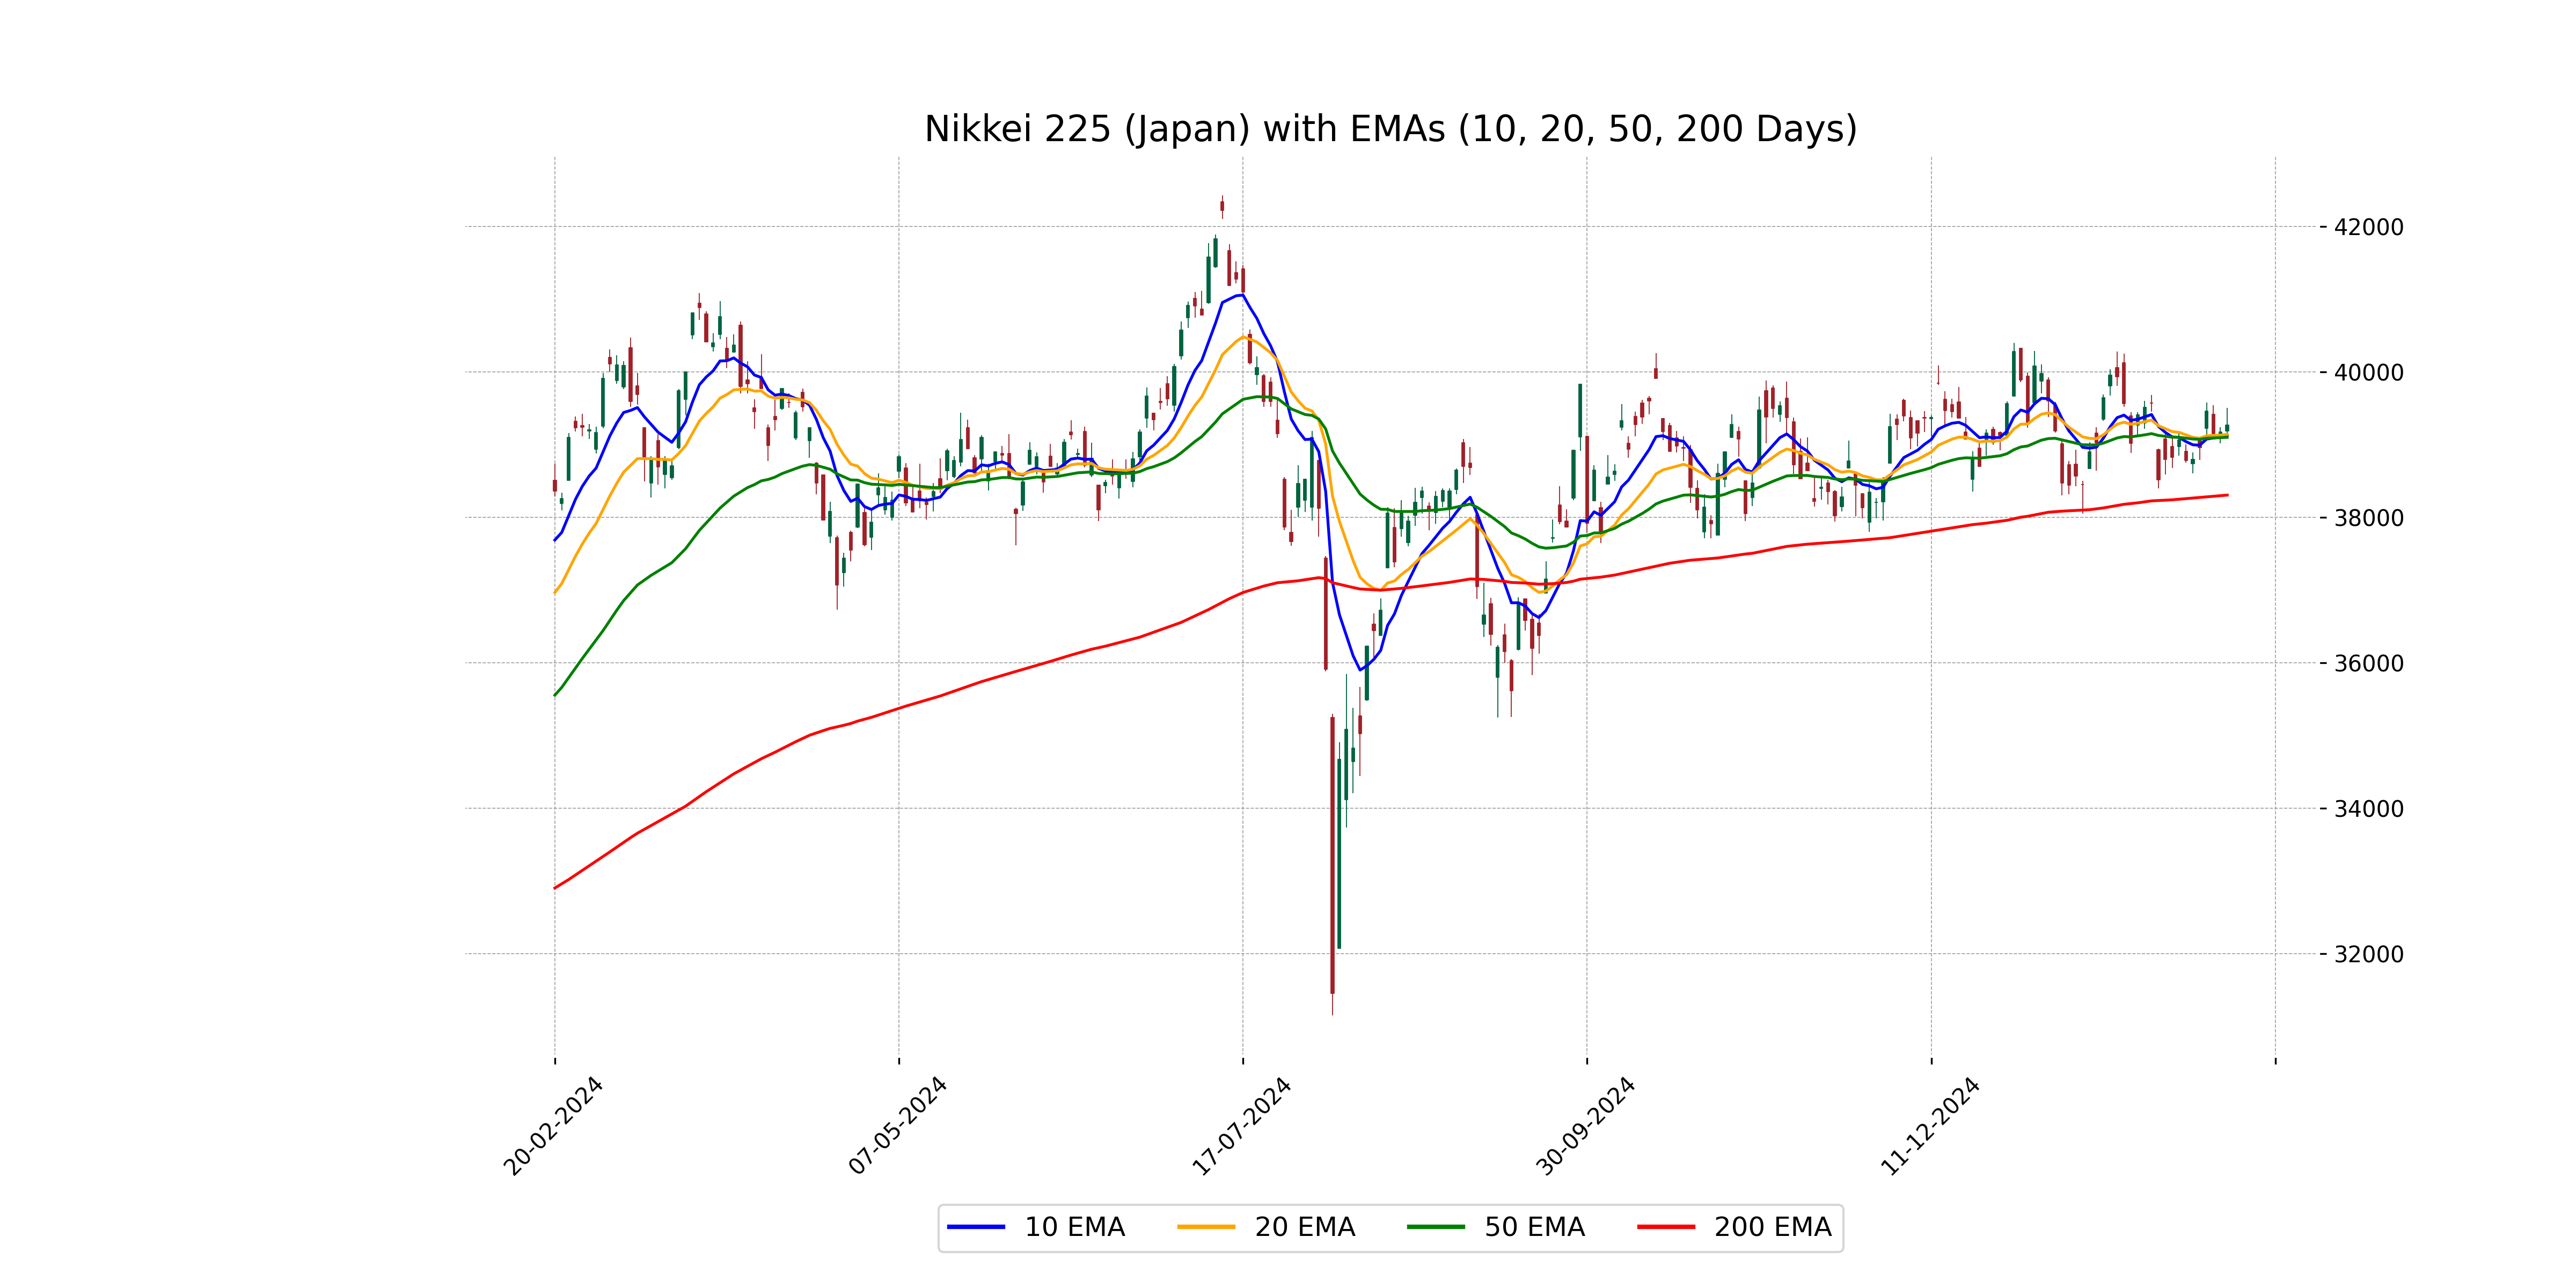
Relationship with Key Moving Averages
The Nikkei 225 closed at 39,270.40, which is above its 50-day EMA of 39,101.96 and its 10-day EMA of 39,136.15, indicating a short-term bullish trend. It is also above the 20-day EMA of 39,144.45, suggesting continued upward momentum, although the 200-day EMA at 38,307.79 remains significantly lower, showing longer-term moving support.
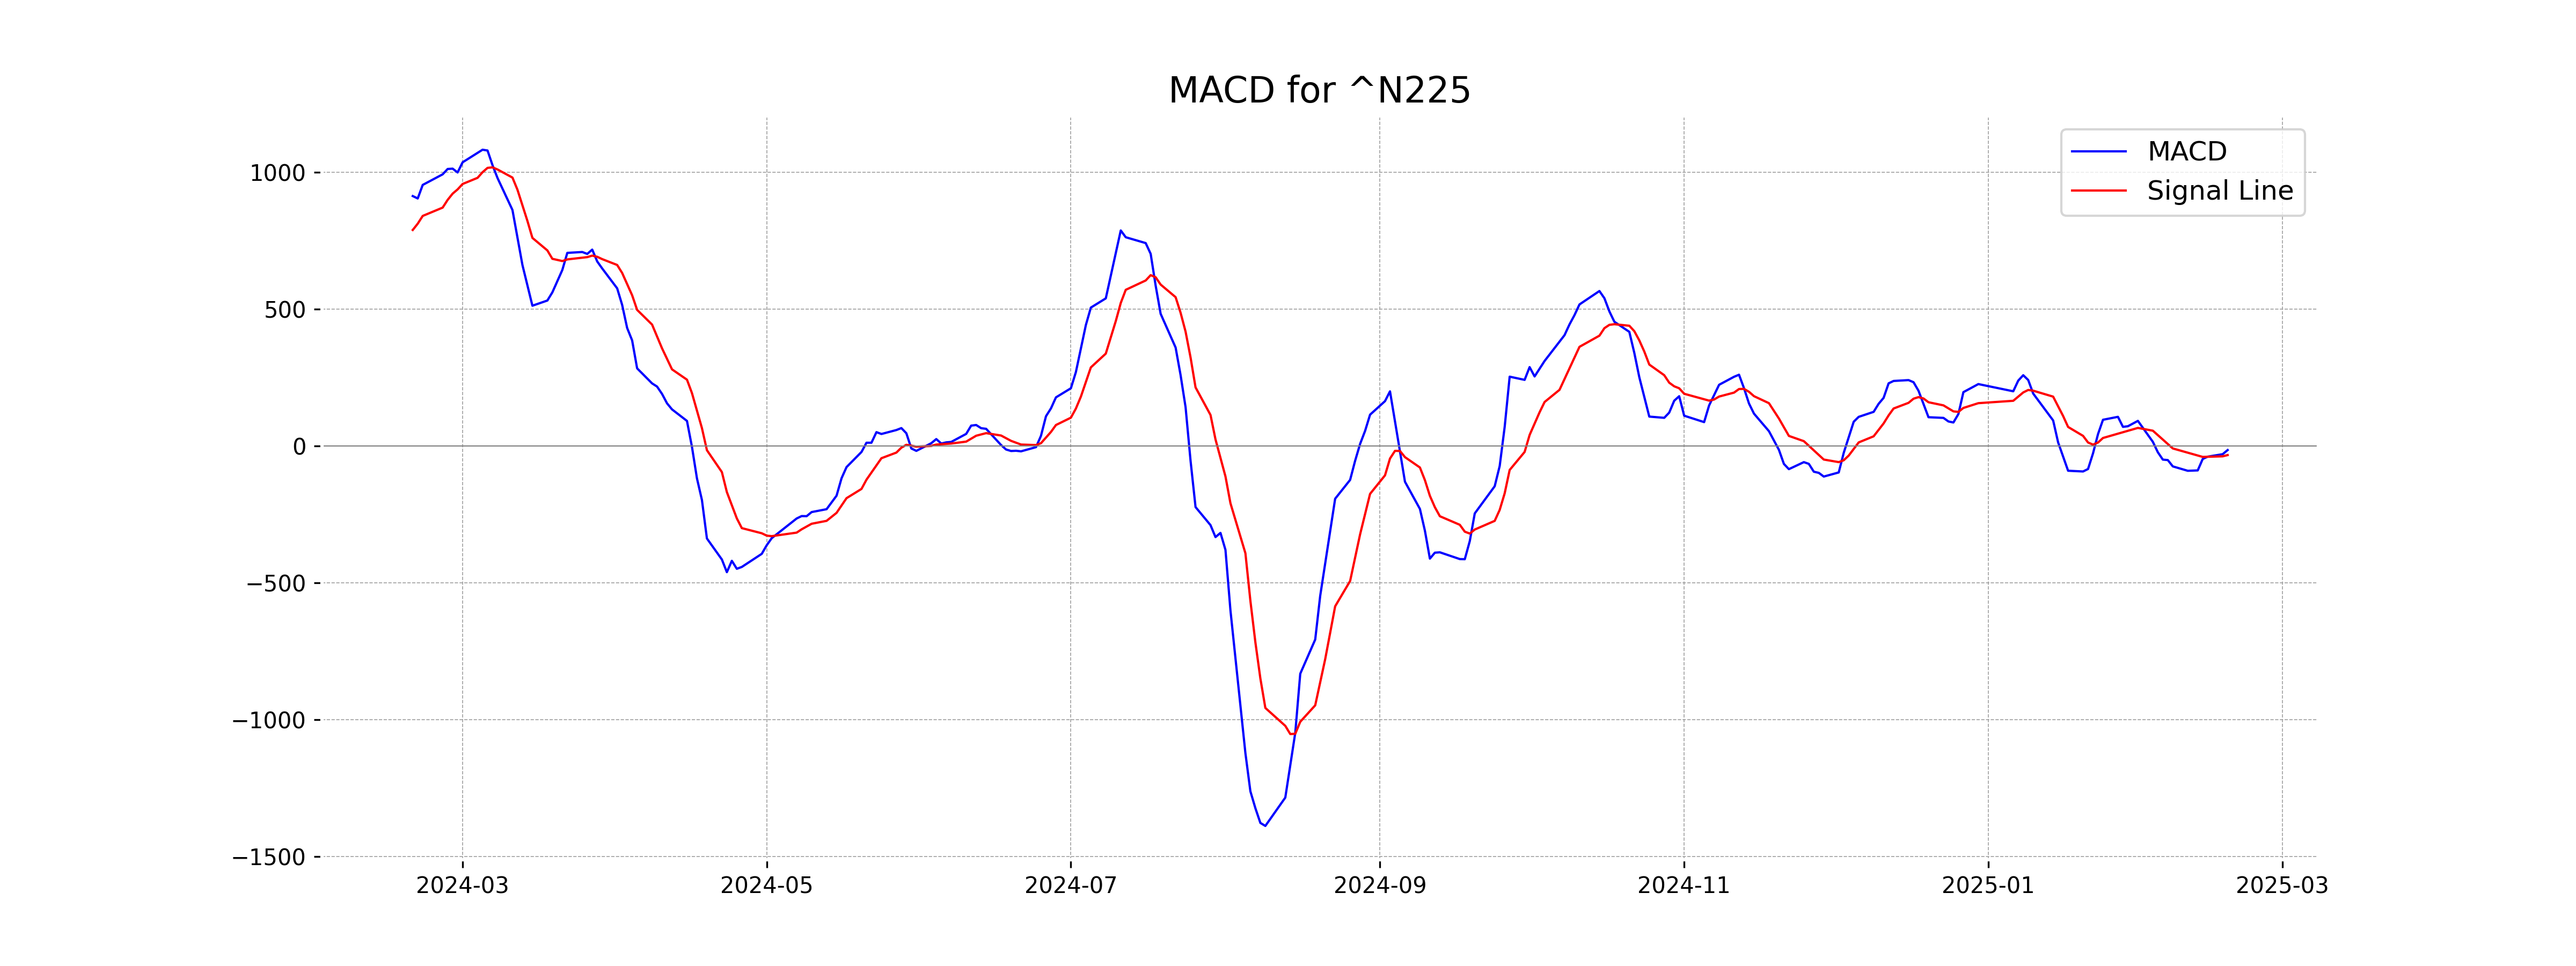
Moving Averages Trend (MACD)
The MACD for the Nikkei 225 indicates a value of -15.18, while the MACD Signal is -33.53. This suggests that the MACD line is above the Signal line, potentially indicating a bullish crossover in progress.
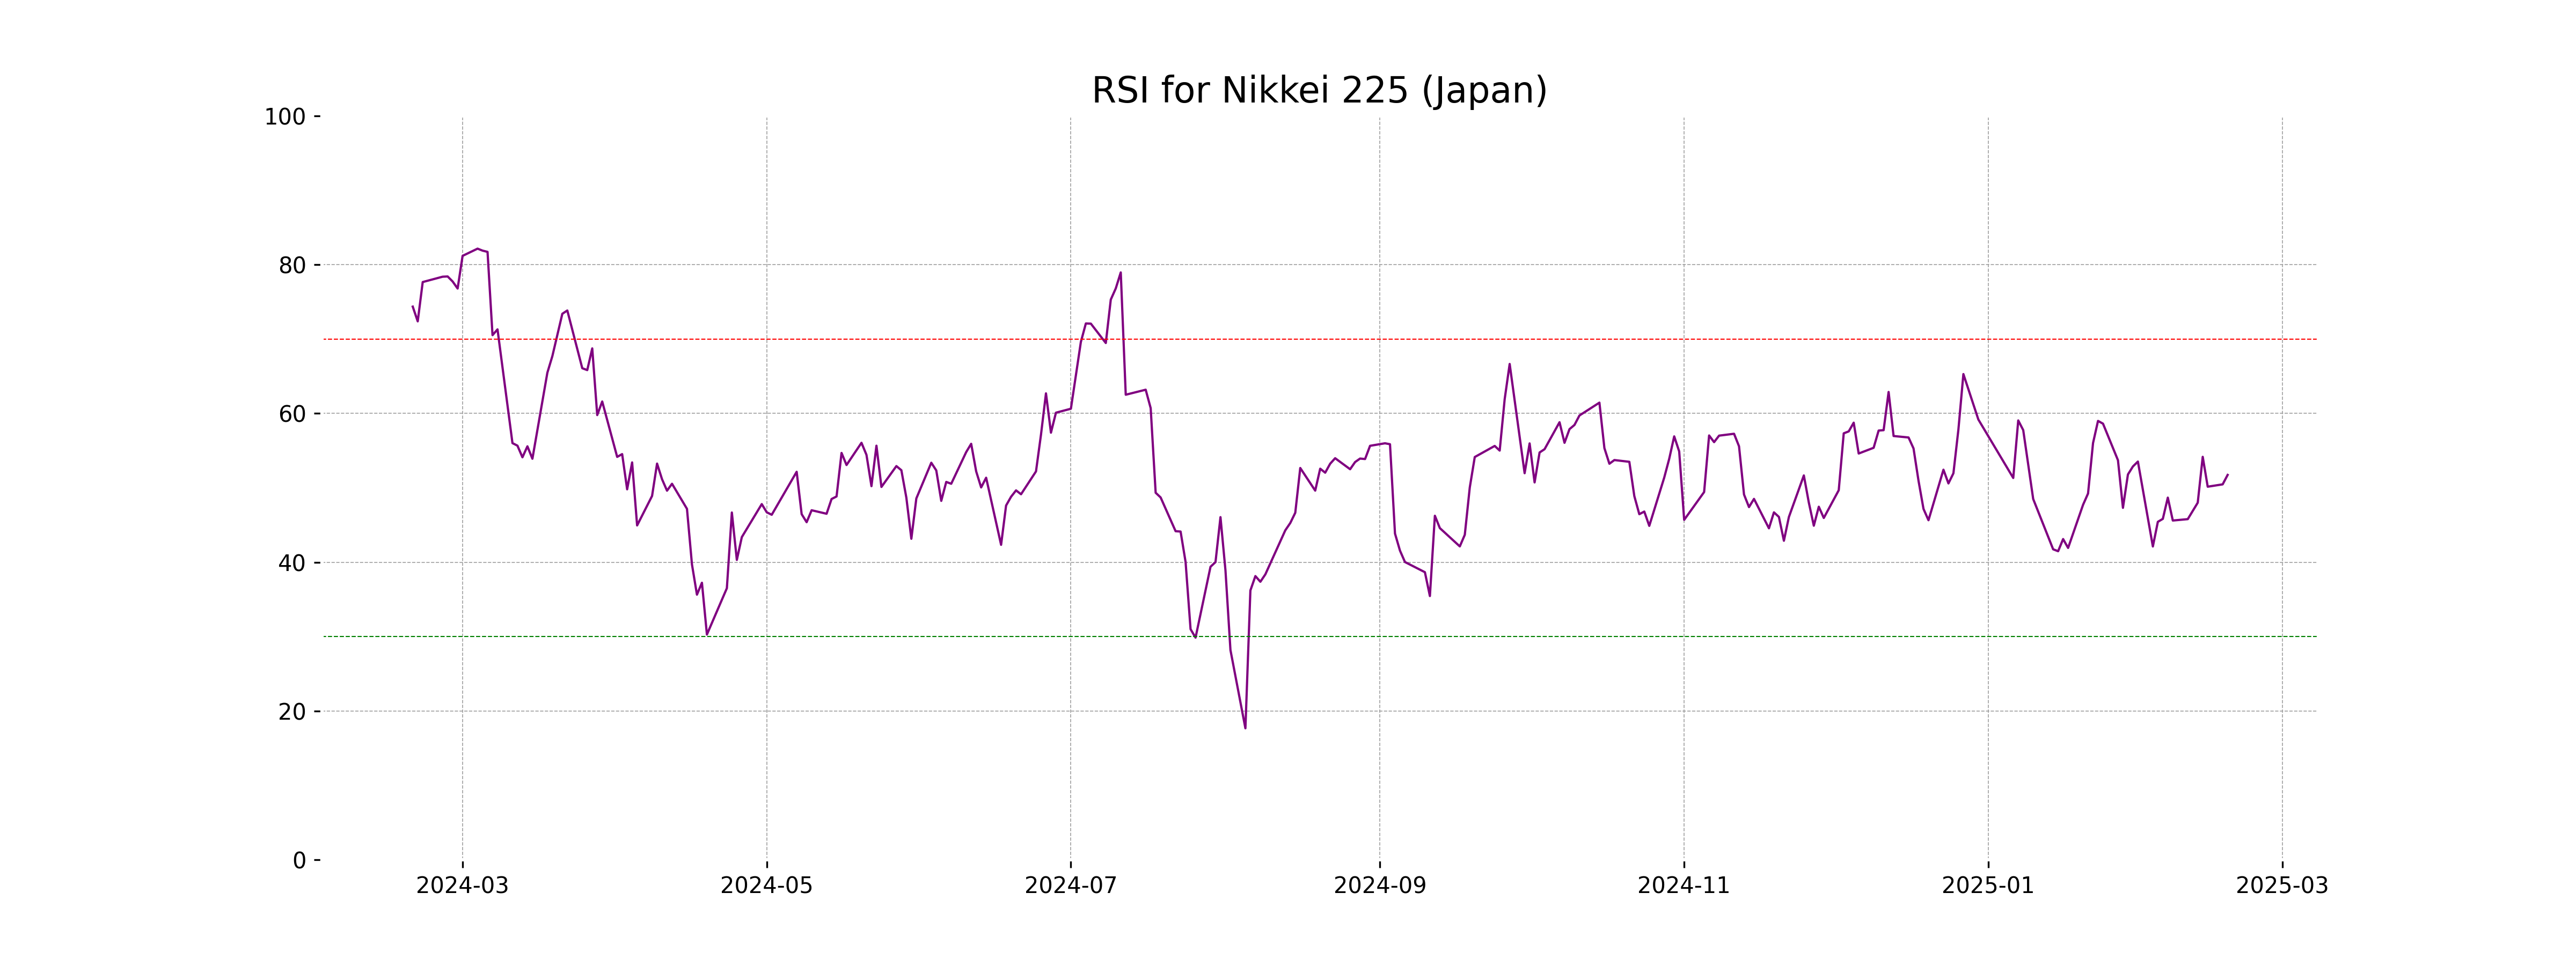
RSI Analysis
For Nikkei 225 (Japan), the RSI is 51.74, indicating that the index is in a neutral zone. This suggests that the market is neither overbought nor oversold, implying a balanced momentum without any strong bias towards purchasing or selling pressures.
Analysis for Nifty Bank - February 18, 2025
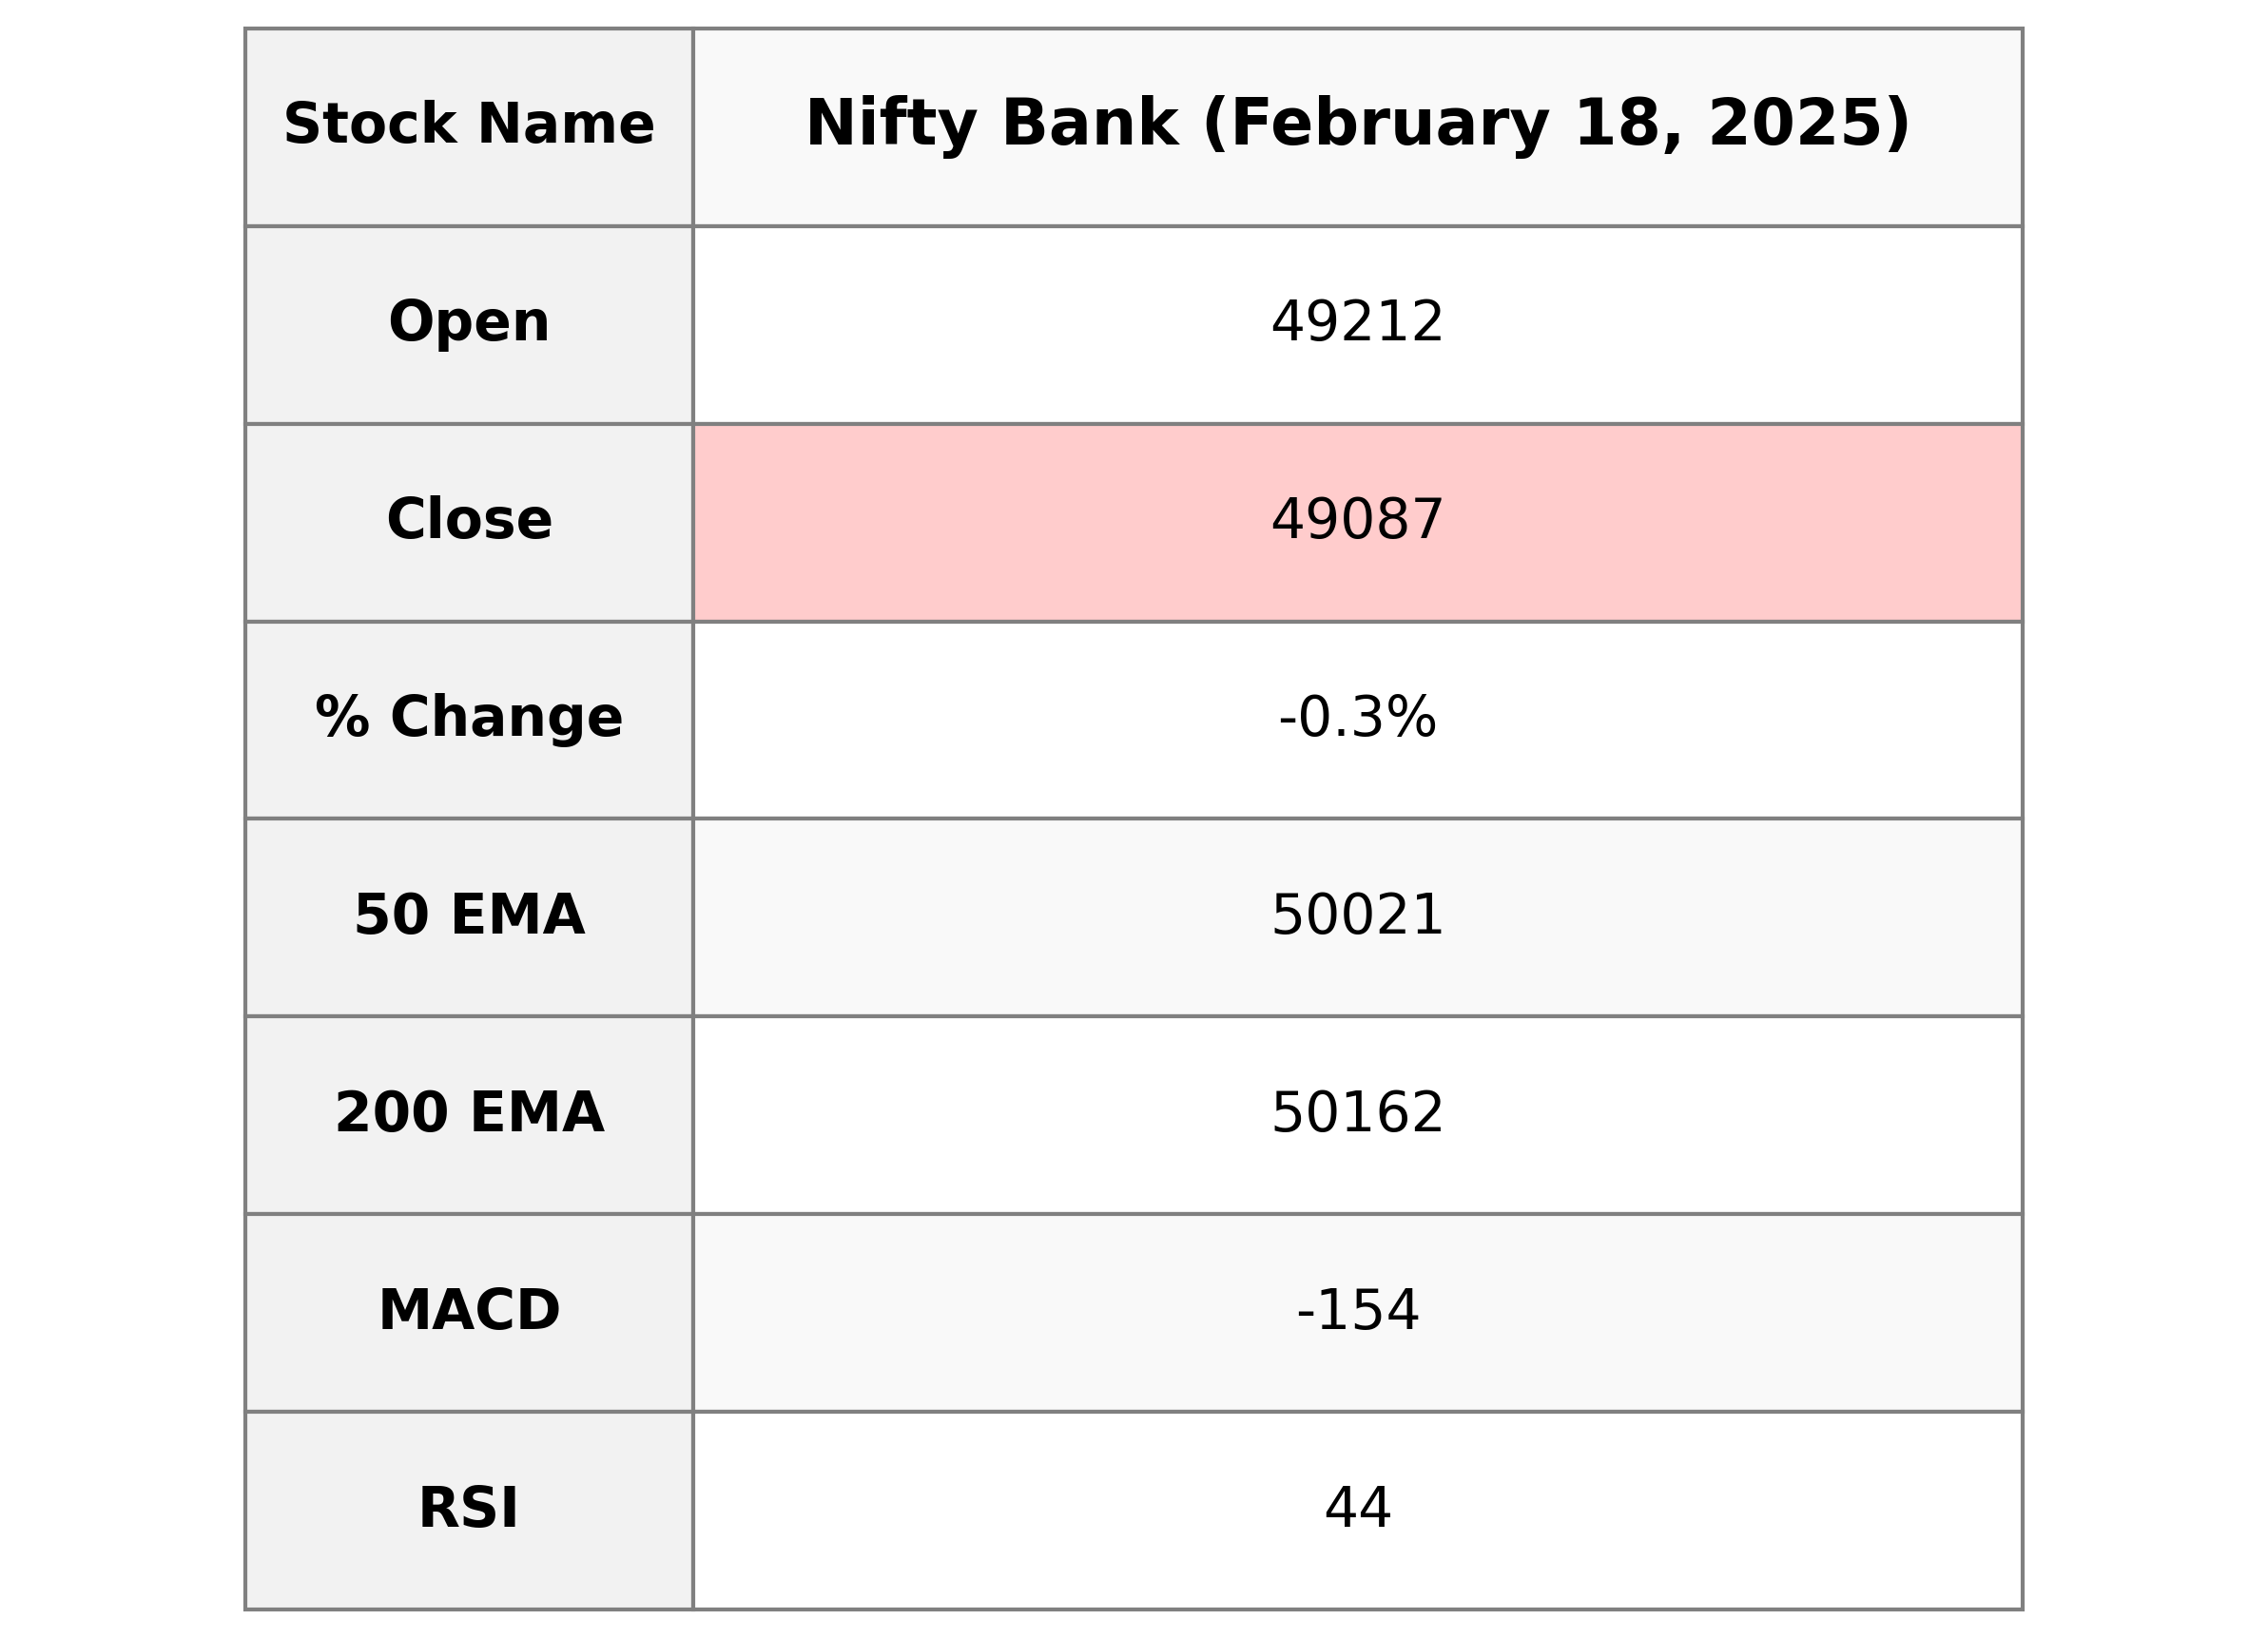
Nifty Bank Performance: The Nifty Bank had an opening of 49,211.85 and closed at 49,087.30, indicating a slight decline of -0.35% or -171.60 points from the previous close of 49,258.90. The relative strength index (RSI) is at 43.97, suggesting a slightly bearish sentiment, while the MACD value is close to the signal line, reflecting a consolidation phase. The volume data is unavailable, and the stock trades below its 10, 20, 50, and 200-day exponential moving averages (EMAs).
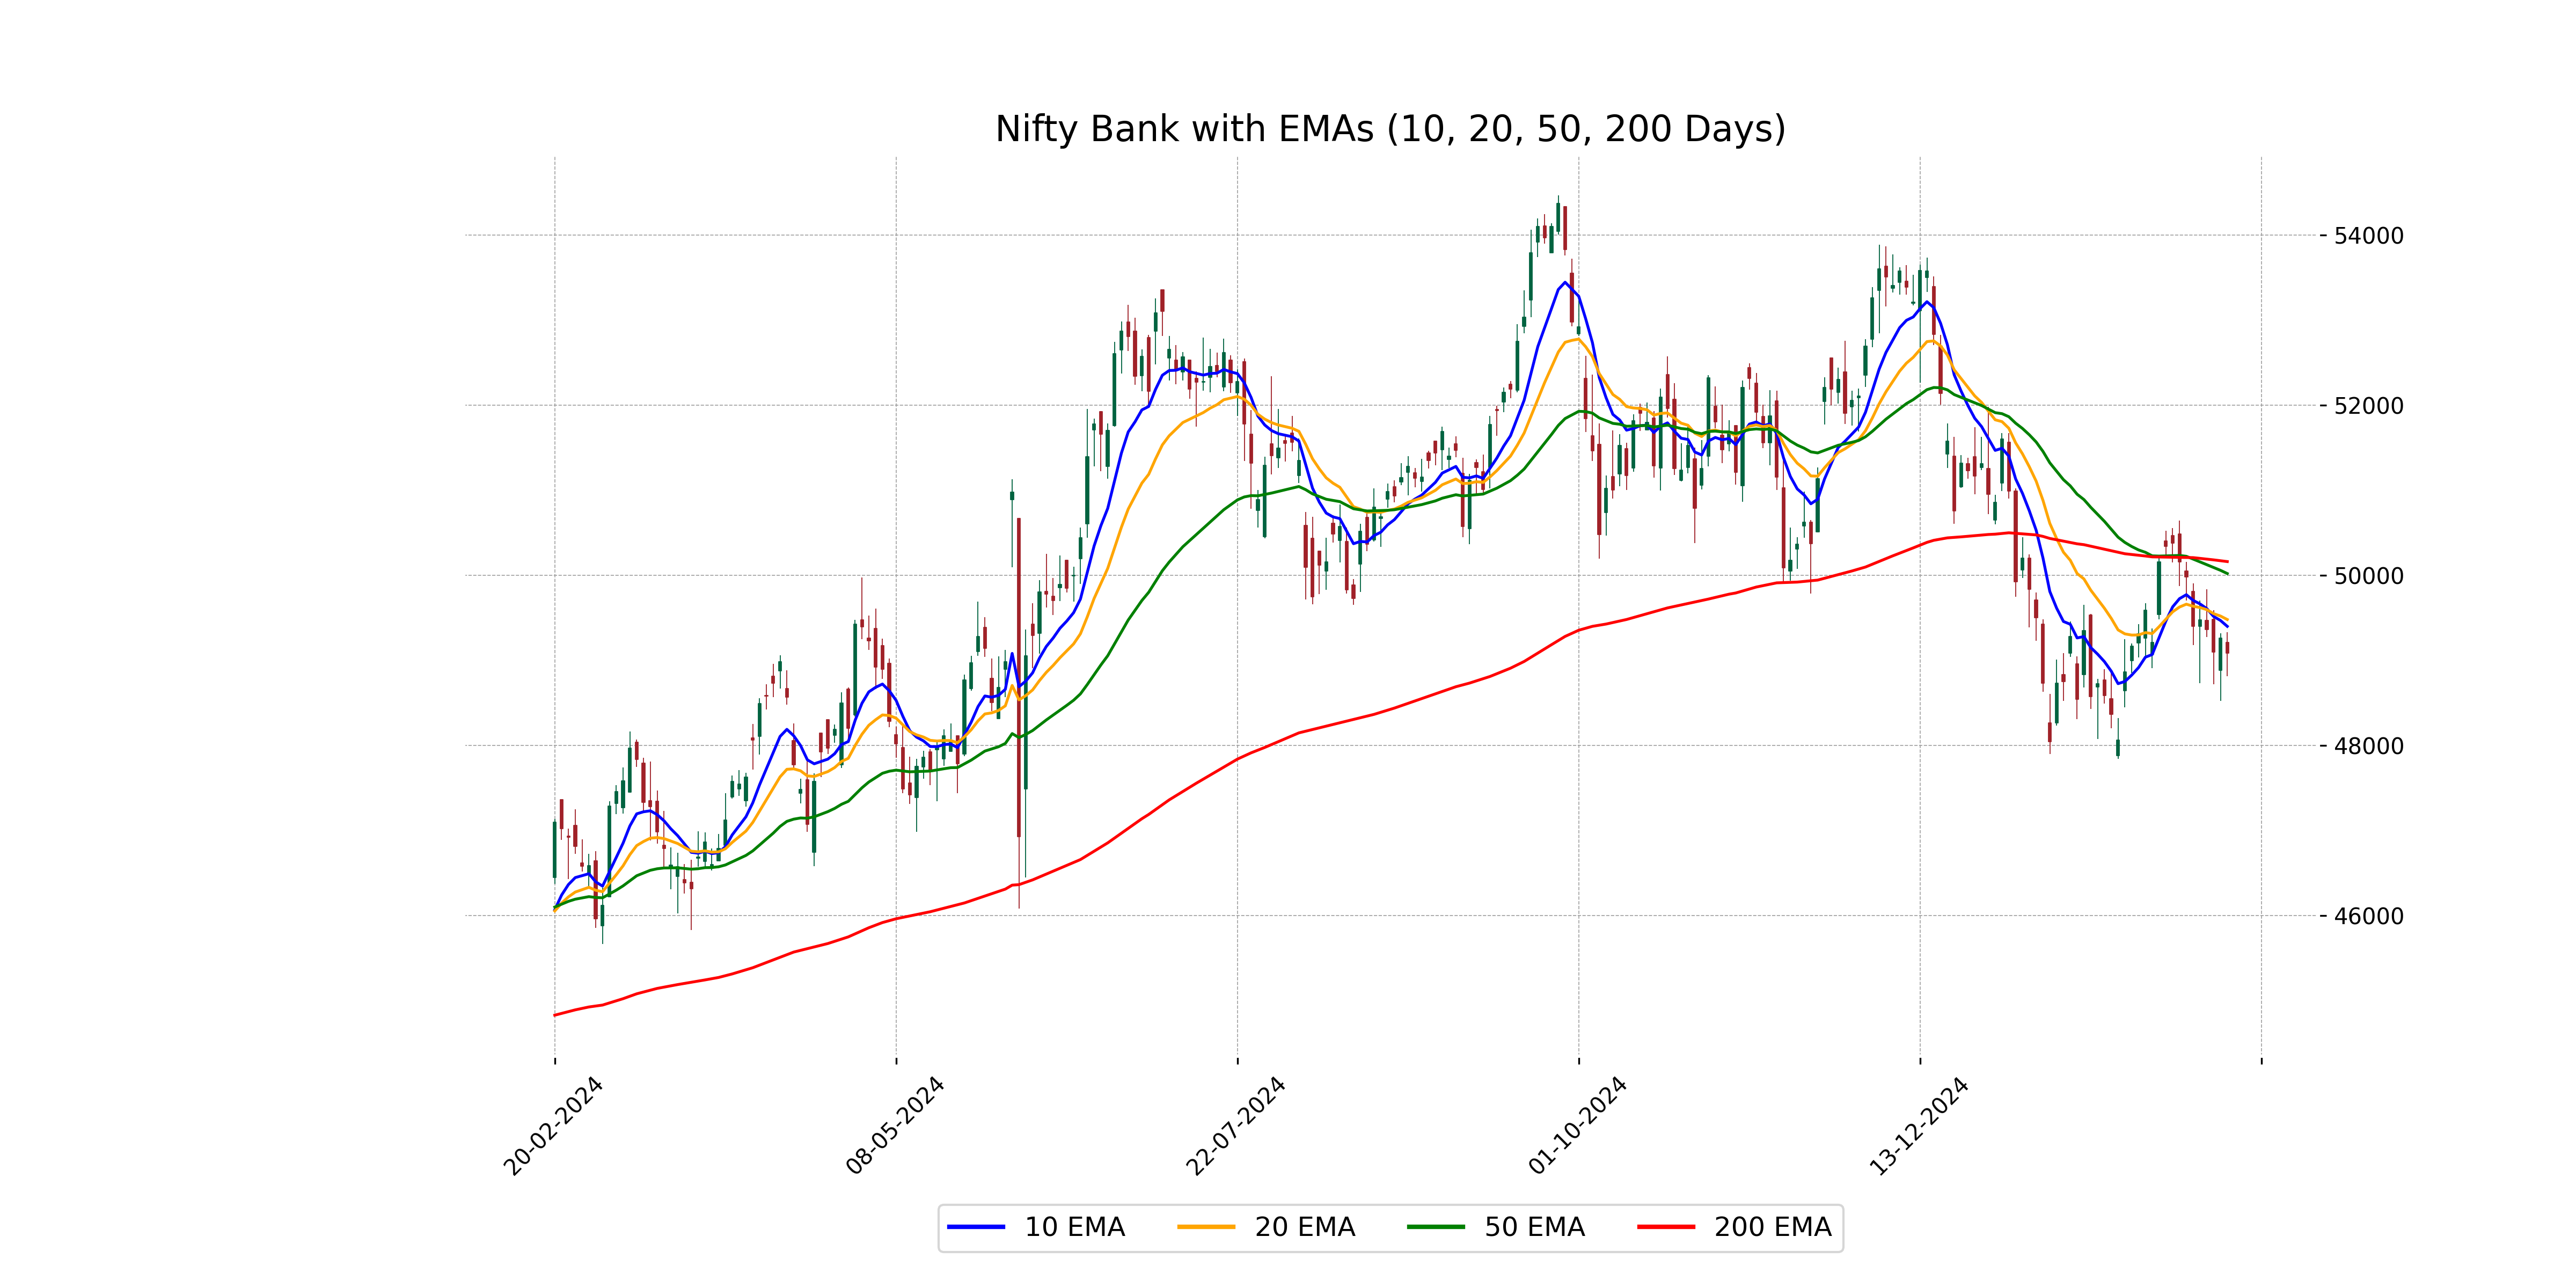
Relationship with Key Moving Averages
The closing price of Nifty Bank at 49,087.30 is below its 50-day EMA of 50,021.13 and 200-day EMA of 50,161.95, indicating a bearish trend. Additionally, it is also below its 10-day EMA of 49,399.96 and 20-day EMA of 49,480.16, suggesting short-term downward momentum.
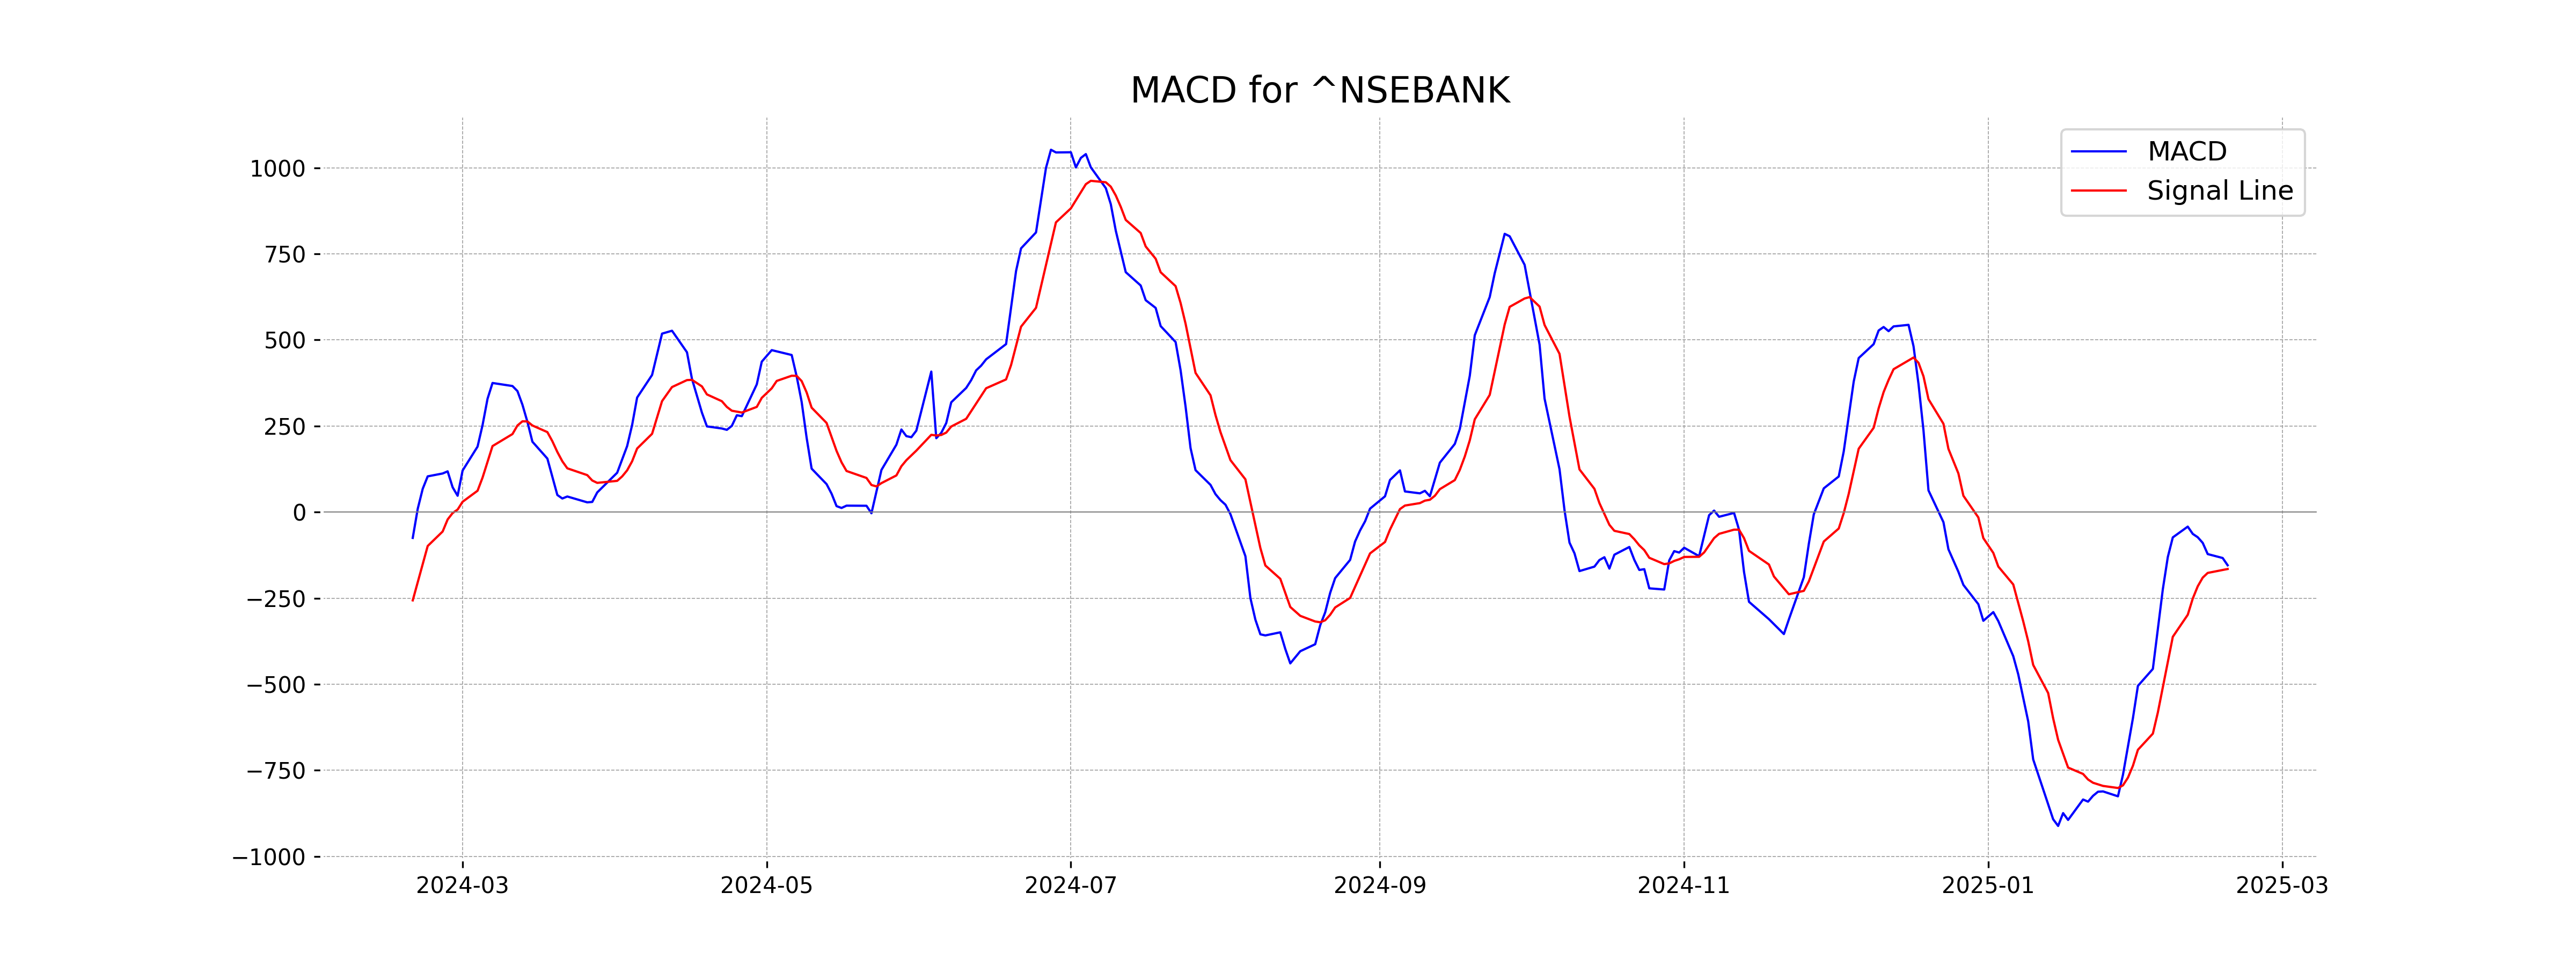
Moving Averages Trend (MACD)
MACD Analysis for Nifty Bank: The MACD for Nifty Bank stands at -154.48 with a Signal Line value of -165.32, indicating a bearish momentum. As the MACD is above the Signal Line, there might be a potential reversal or consolidation in the near term.
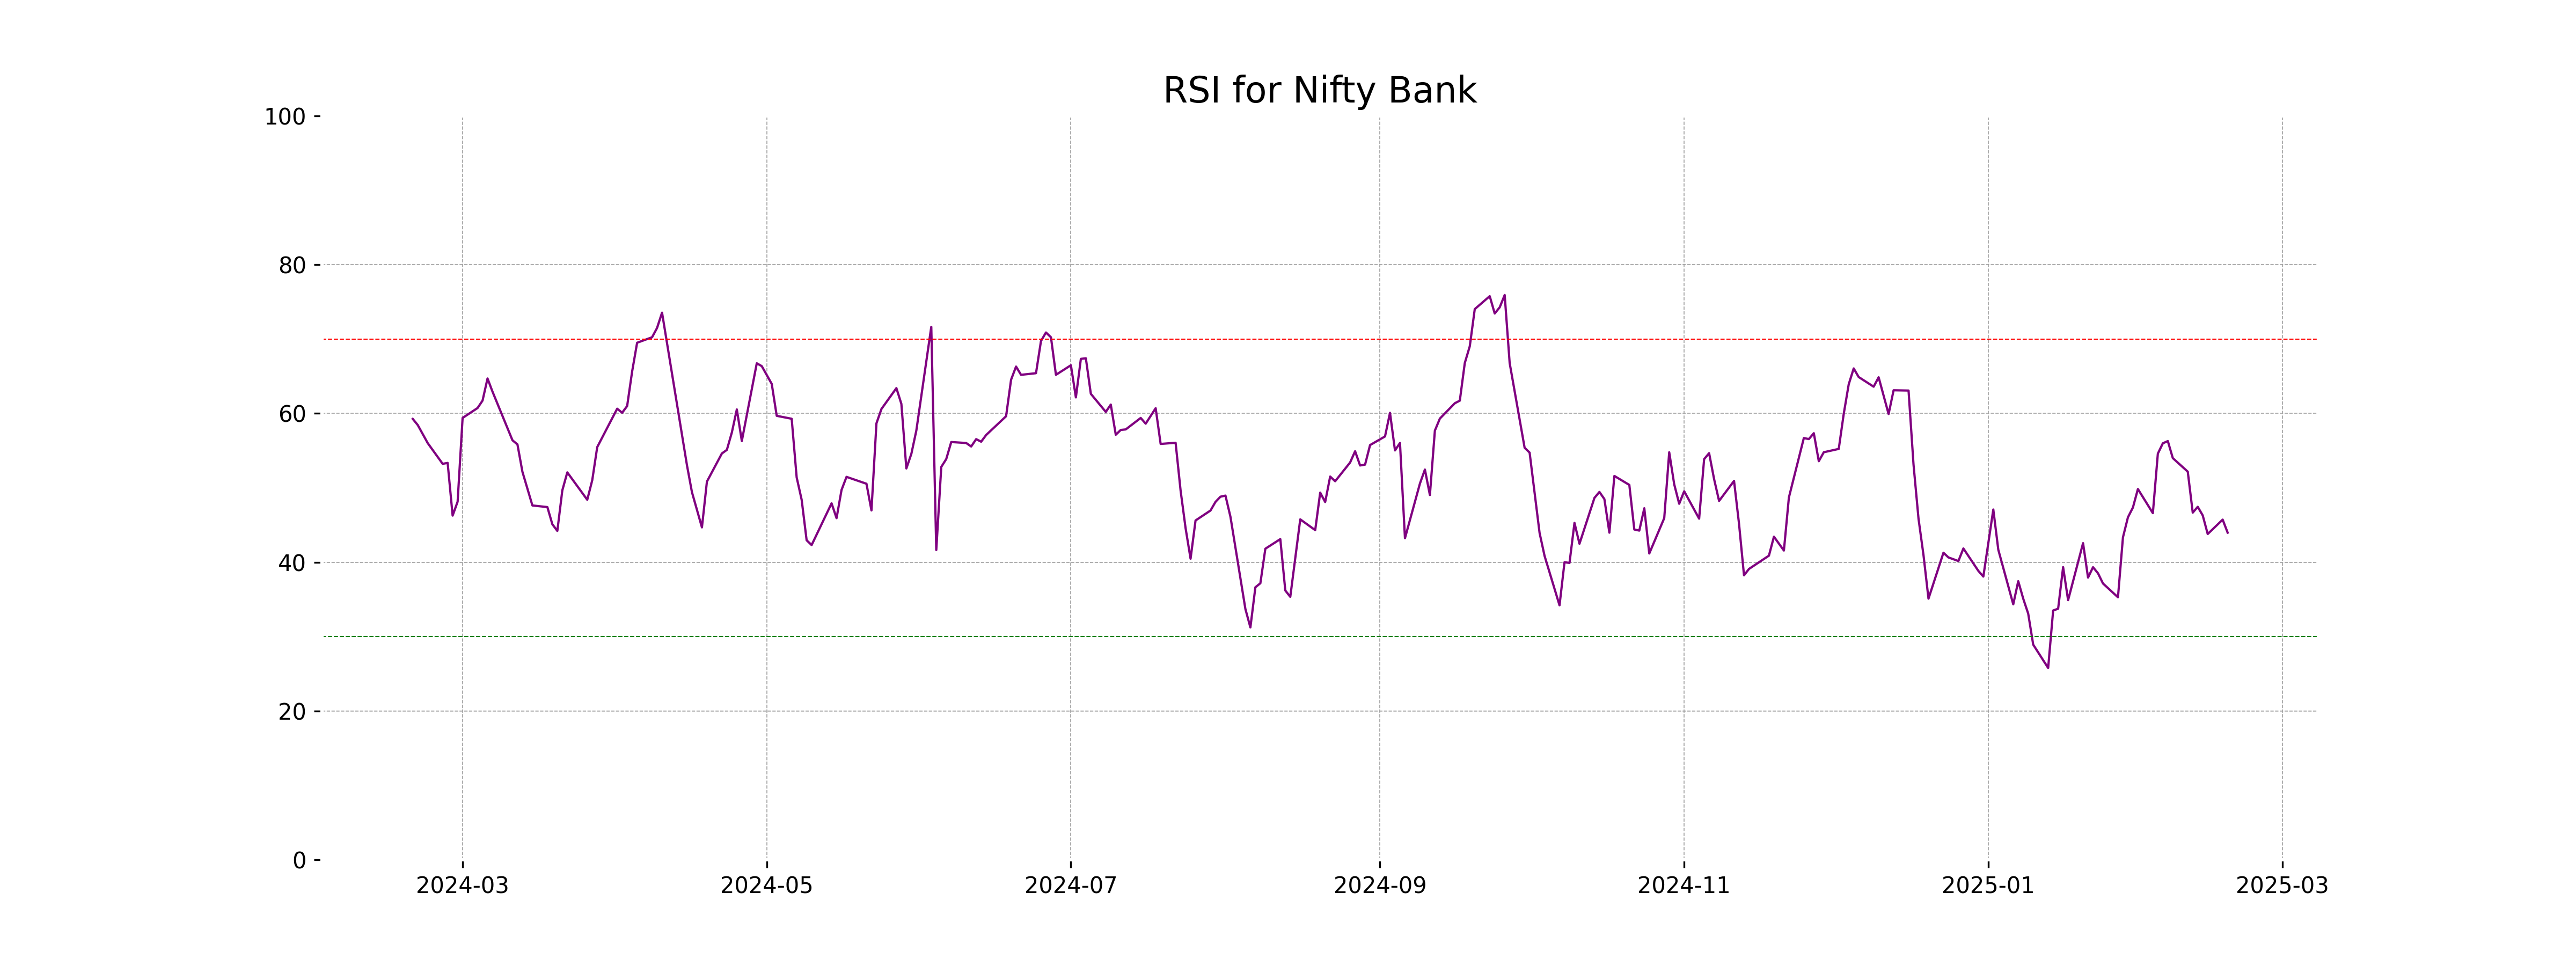
RSI Analysis
Nifty Bank RSI Analysis: The Relative Strength Index (RSI) for Nifty Bank stands at 43.97, which indicates that the stock is approaching the oversold territory but is currently in the neutral zone. This suggests that there might be room for a potential upside if buying pressure increases.
Analysis for Nifty 50 - February 18, 2025
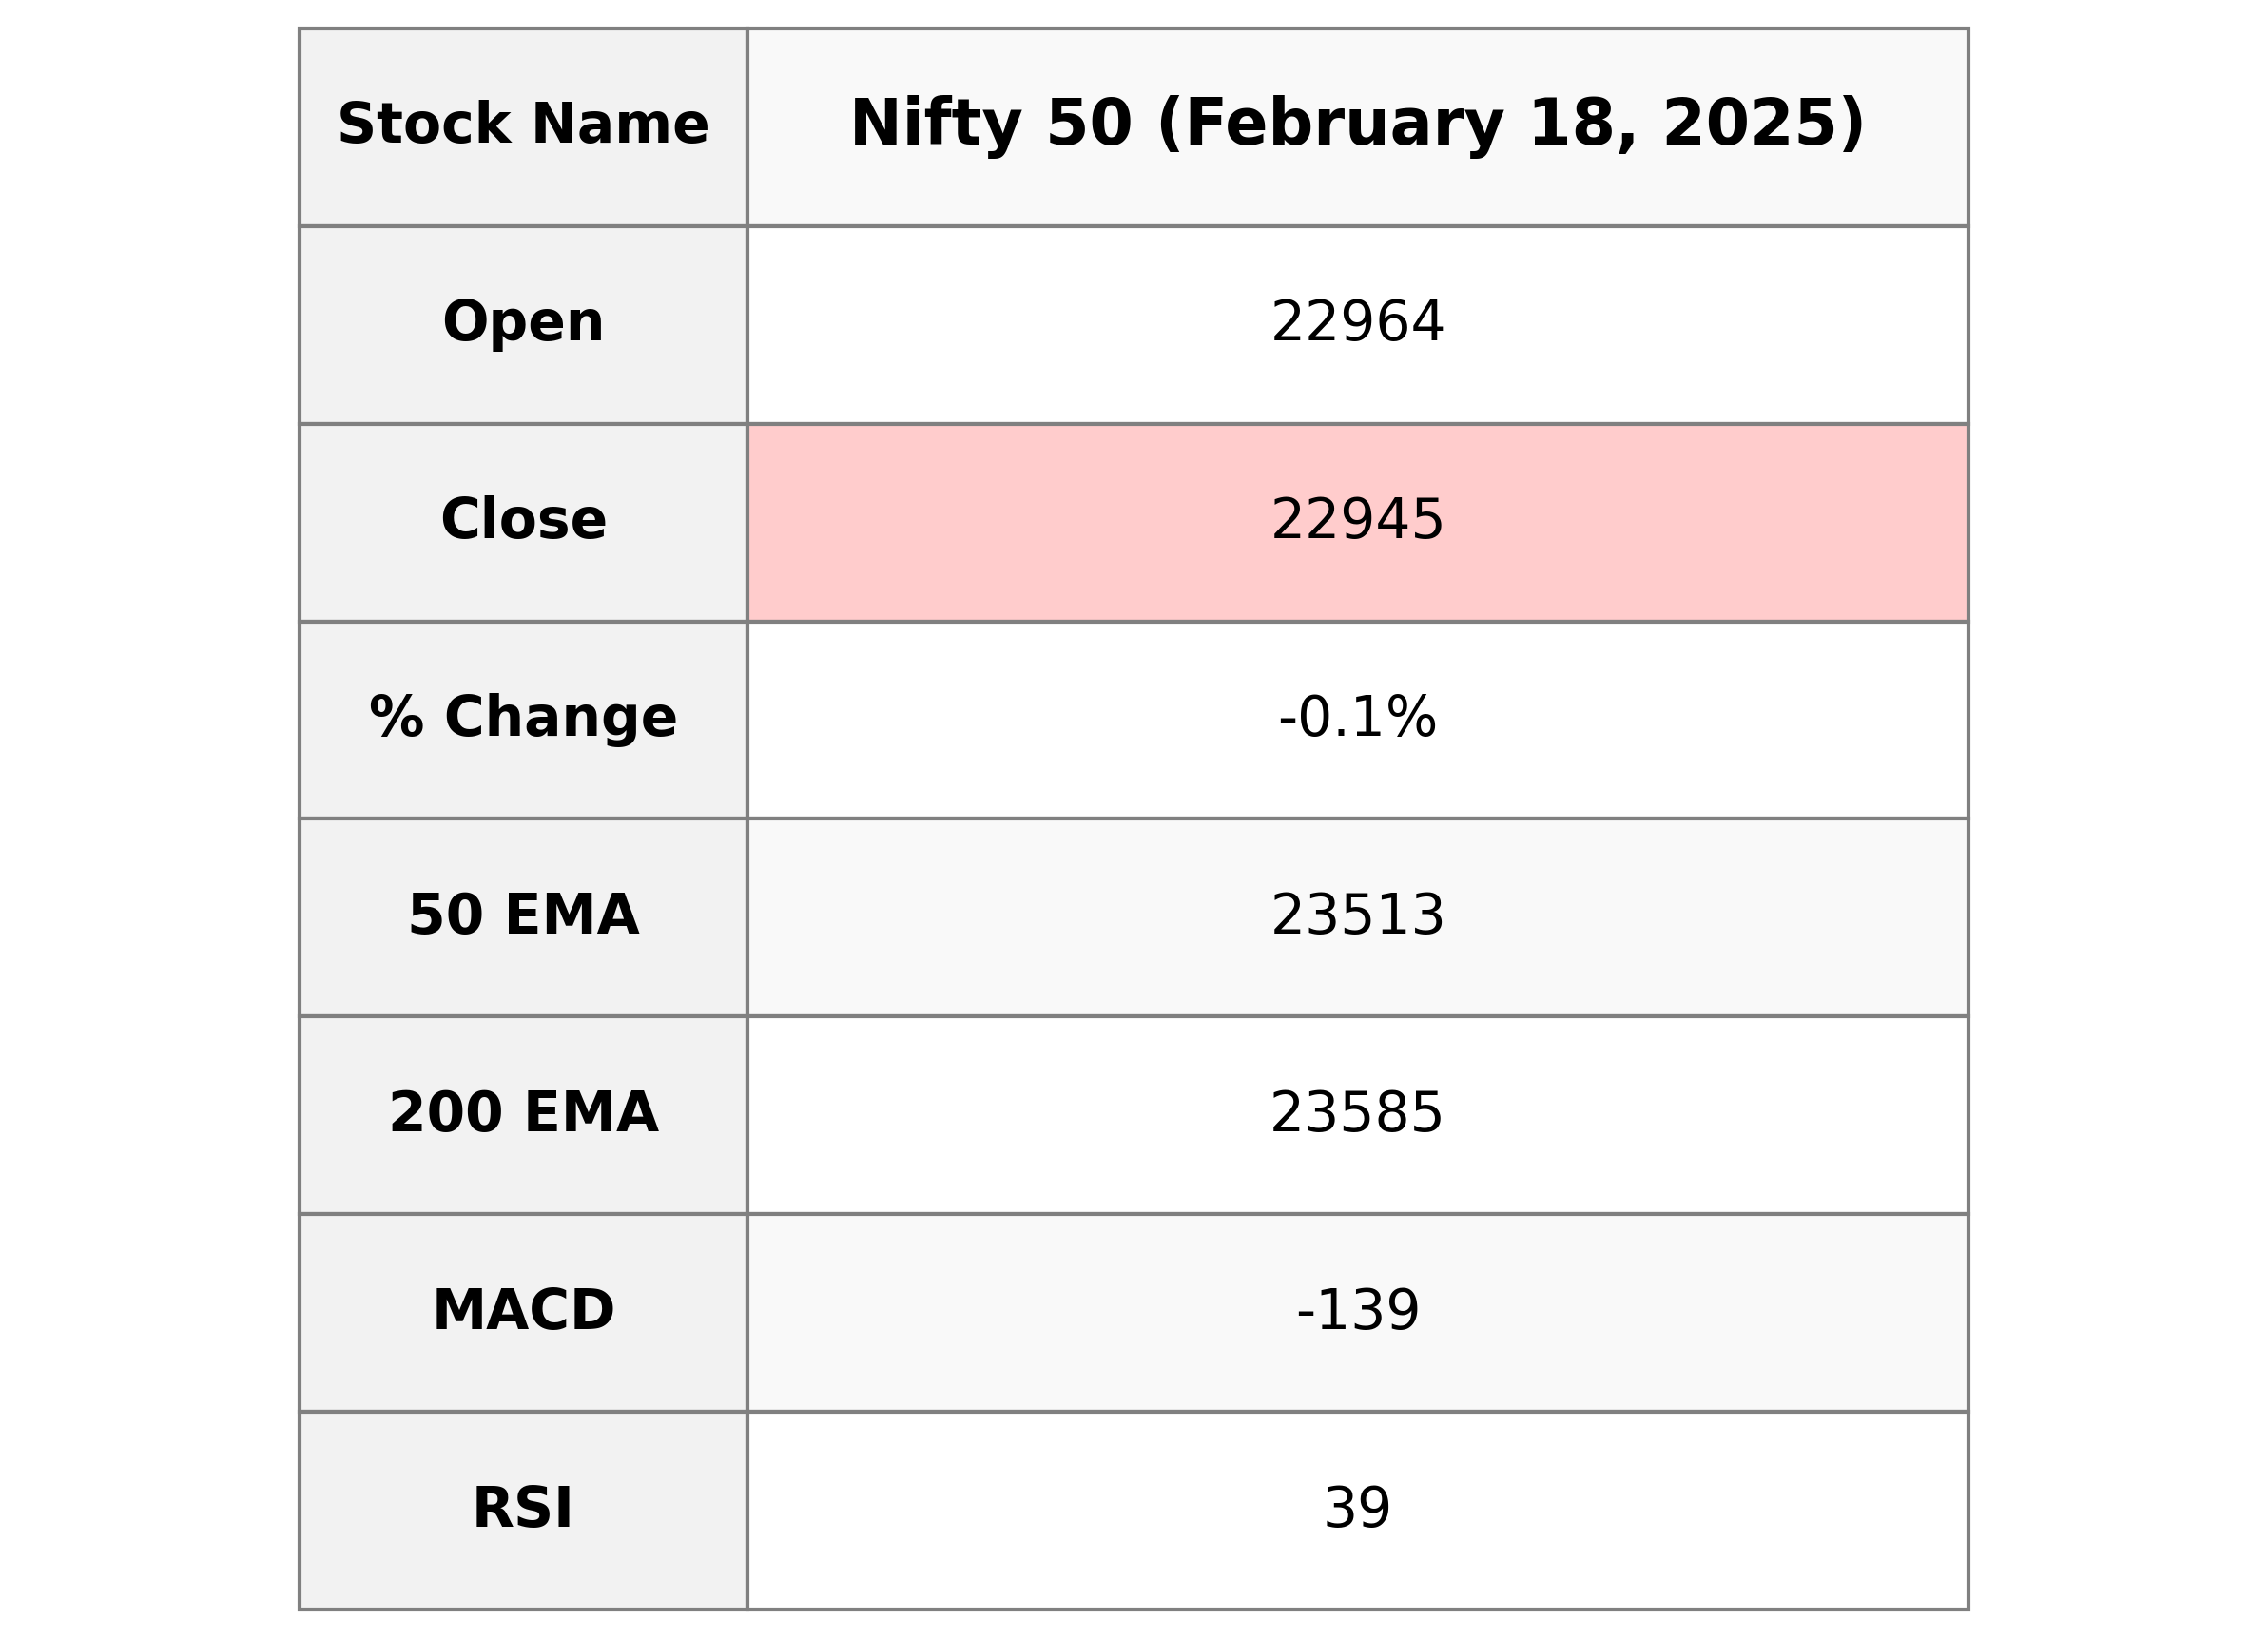
Nifty 50 Performance: On the given trading day, Nifty 50 opened at 22,963.65, experiencing a high of 22,992.5 and a low of 22,801.5 before closing at 22,945.3, marking a slight decline of 0.06% or 14.2 points from the previous close. The Relative Strength Index (RSI) was 39.21, indicating weaker momentum, while the Moving Average Convergence Divergence (MACD) was below the signal line, pointing towards bearish sentiment in the market.
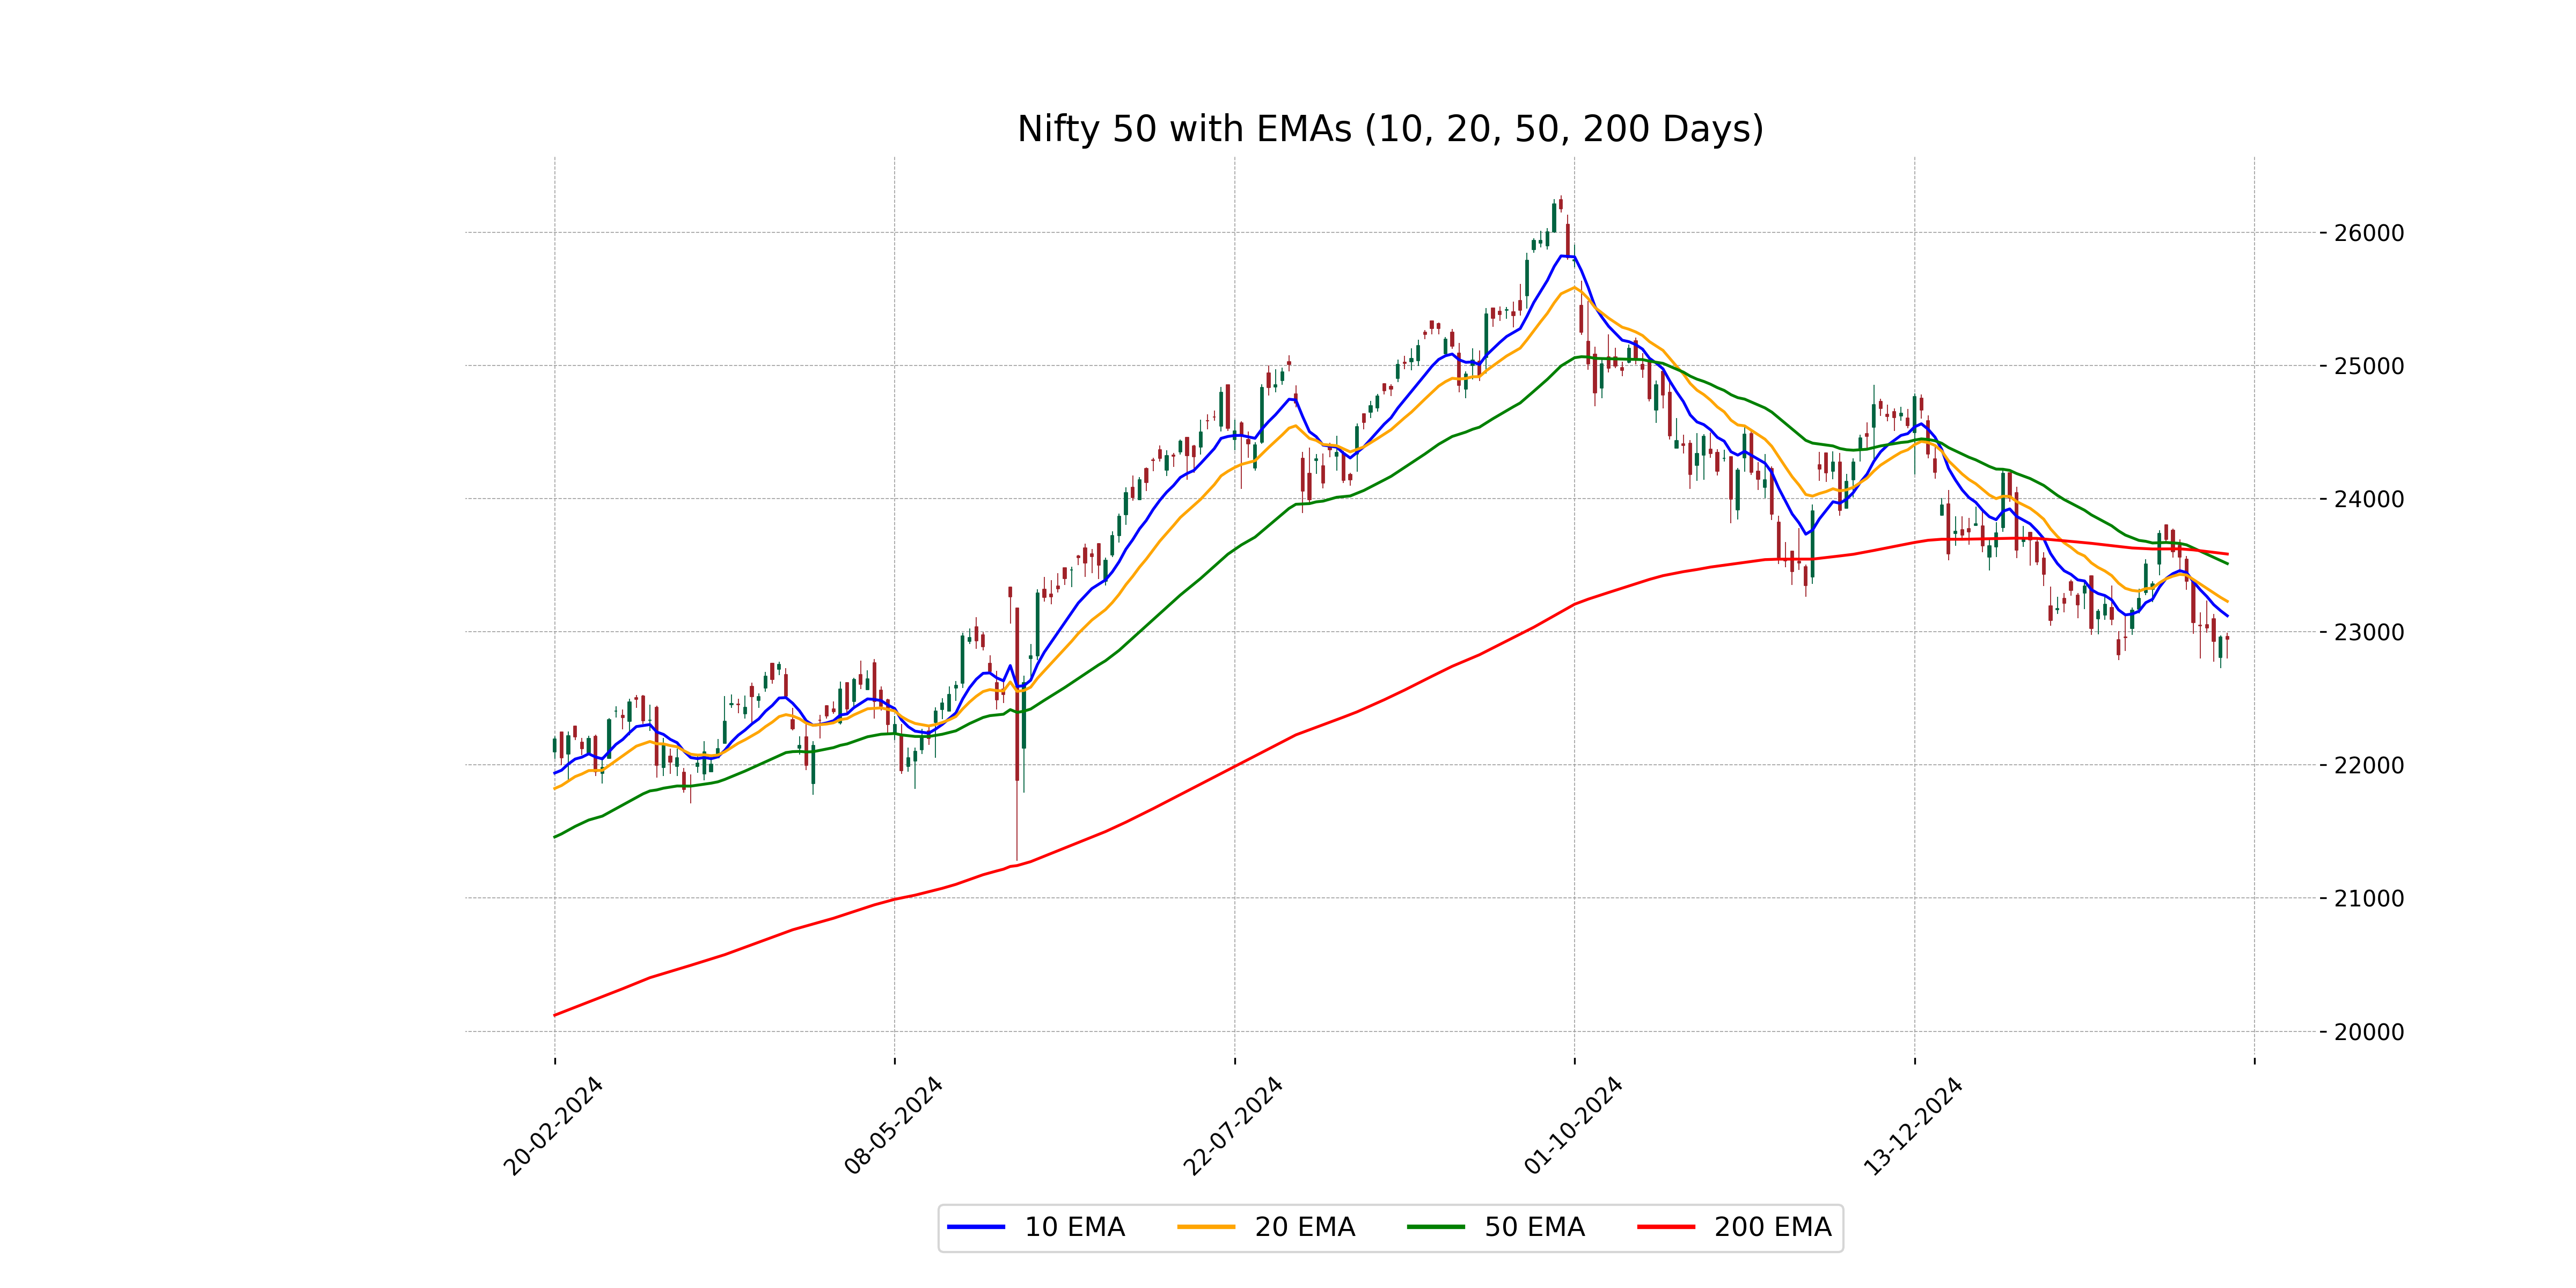
Relationship with Key Moving Averages
The Nifty 50 is currently trading below its critical moving averages, with a closing price of 22945.30, which is below the 50 EMA (23512.60), 200 EMA (23584.64), 10 EMA (23120.67), and 20 EMA (23229.21). This indicates a bearish trend in the short to medium term, as the current price is lower than these moving average thresholds.
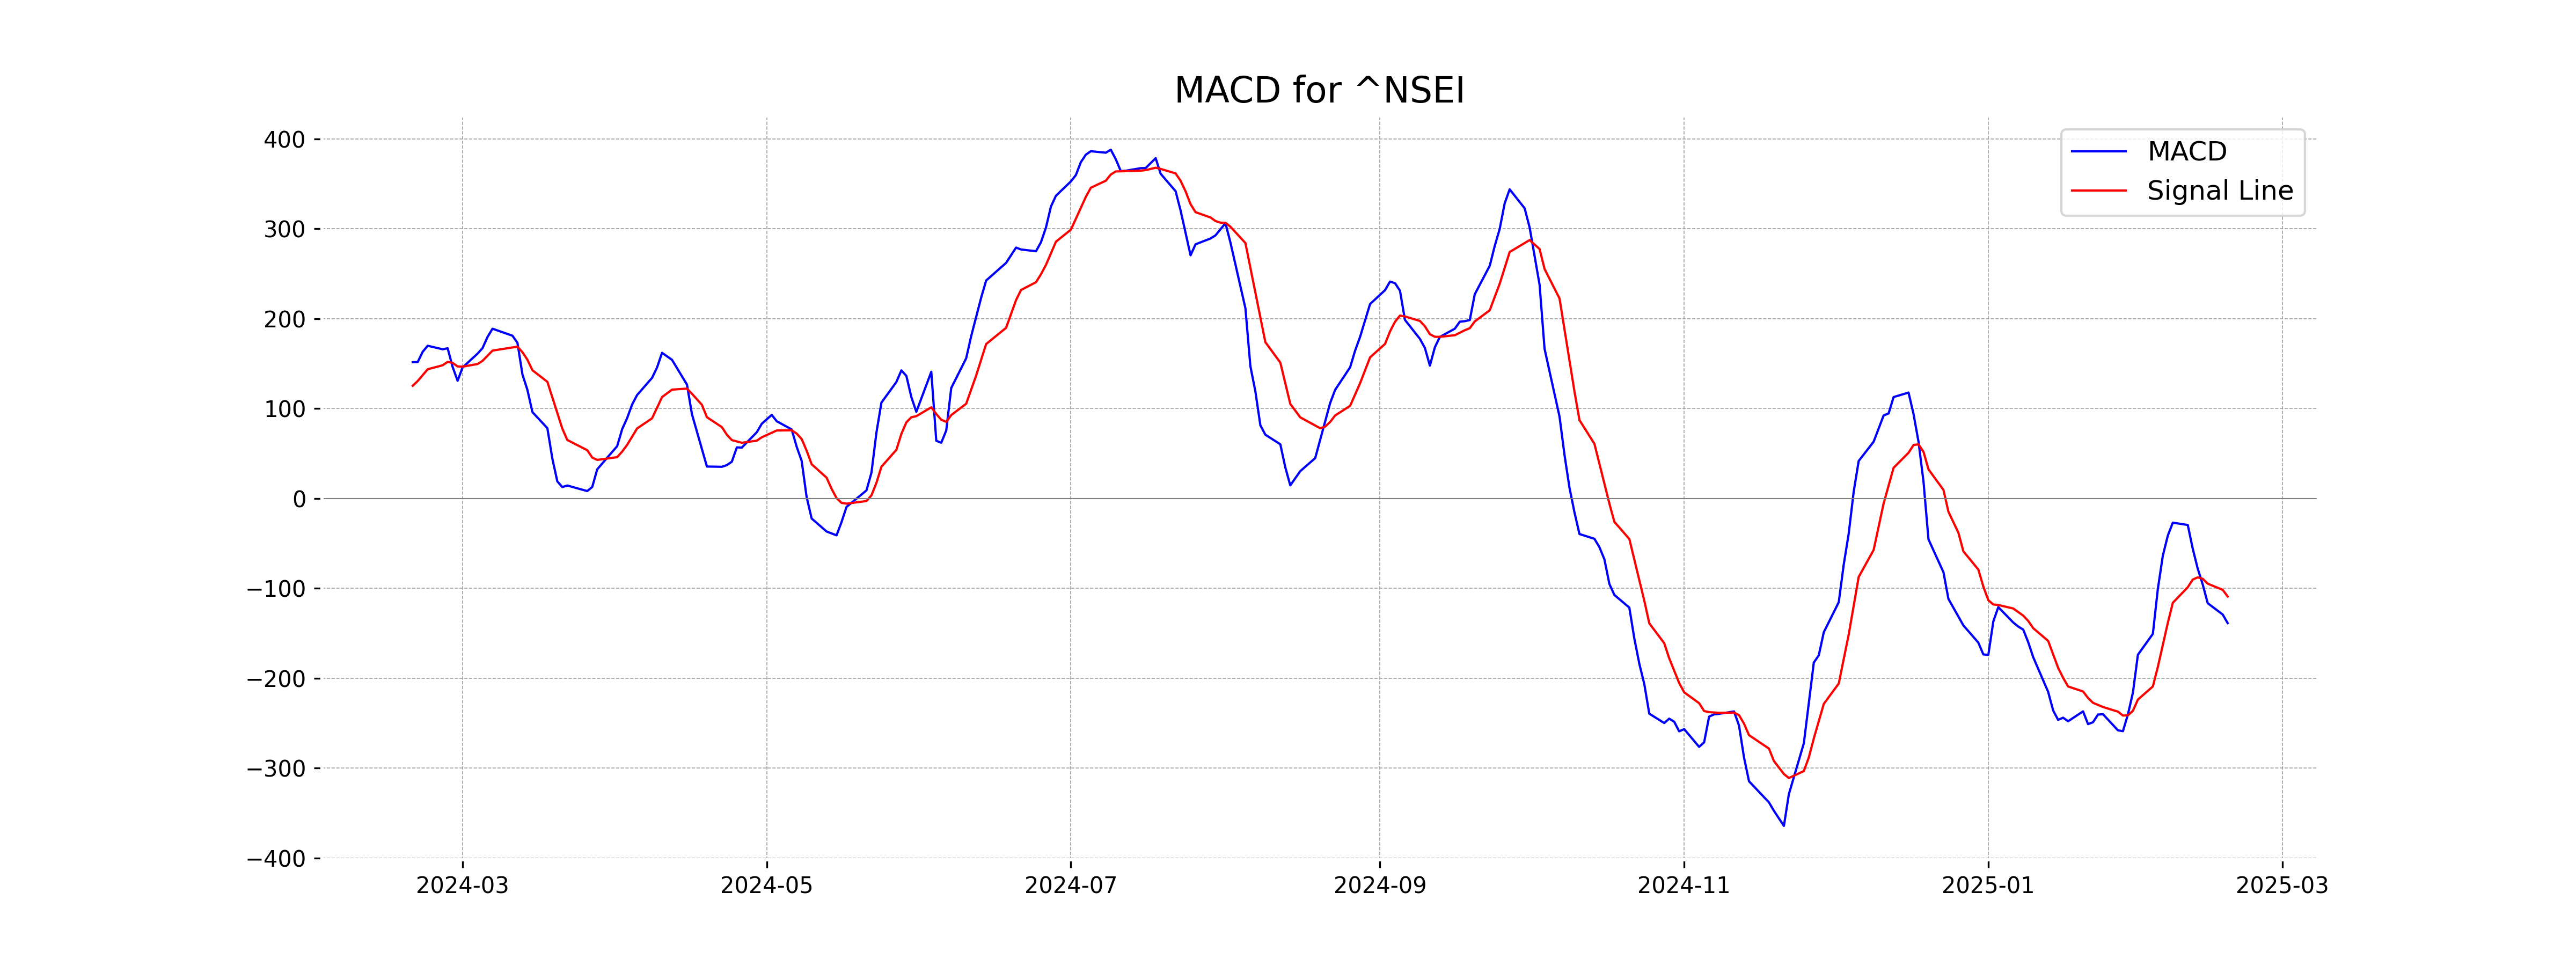
Moving Averages Trend (MACD)
The MACD for Nifty 50 is -138.61, which is below the MACD Signal of -109.04. This suggests a bearish trend, indicating potential selling pressure in the market. Traders might interpret this as a signal to be cautious or consider selling positions.
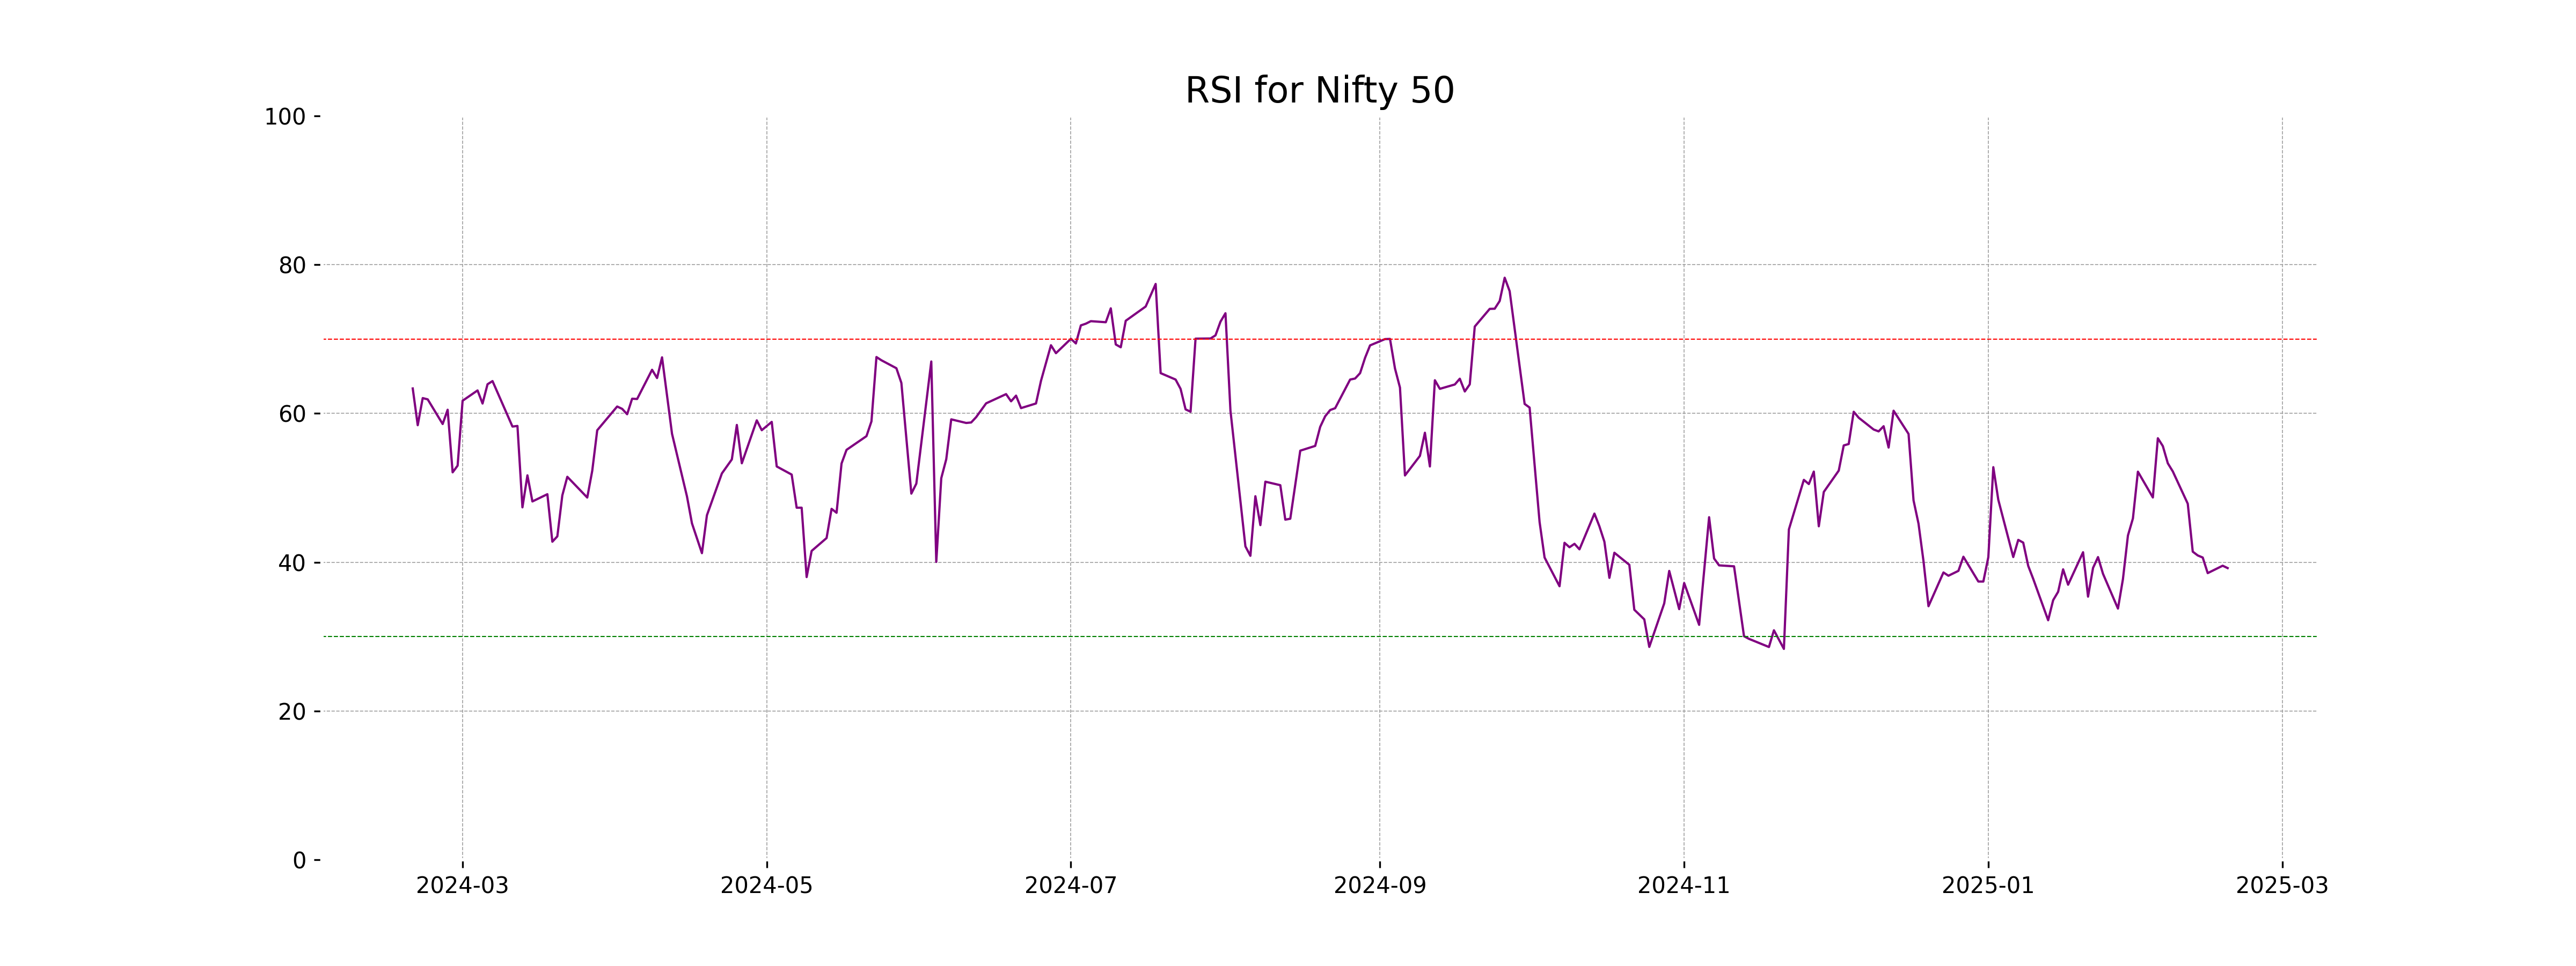
RSI Analysis
Based on the stock data for Nifty 50, the RSI value is 39.21, indicating that the index is close to the oversold territory, which typically signals that it may be undervalued and could potentially see a reversal or upward movement in the near term. Investors may consider this a potential buying opportunity, depending on other market conditions. It is important to analyze additional technical indicators and market factors before making investment decisions.
Up Next
Global stock market indices: How the world markets performed today - 18 February 2025

Step-by-step guide to apply for a mortgage loan online with minimal documentation

Honda Activa 6G: Everything You Need to Know Before Buying

How much does a ULIP plan really cost? A break-down of all charges

Centre plans to borrow Rs 8.20 lakh cr from market in first half of FY27

Reliance denies buying Iranian oil amid US sanctions waiver

More videos

Premium petrol price up Rs 2, industrial diesel up Rs 22; no change in normal petrol, diesel rates

India's GDP expected to register over 8 pc growth in Sep-Dec: Report

Govt announces seven measures to help boost exports

RBI keeps interest rates on hold after US trade deal boosts outlook

RBI proposes to compensate customers up to Rs 25,000 loss due to fraud

RBI raises GDP growth projection of Q1, Q2 of FY27

RBI pauses rate cuts, retains interest rate at 5.25 pc

Rupee jumps 122 paise to close at 90.27 against US dollar on India-US trade deal

Stock markets cheer India-US trade deal: Sensex, Nifty surge 2.5 pc

UPI transactions hit record high of Rs 230 lakh crore in 2025-26 till Dec: Govt