


Highlights
- Analysis indicates a mixed market sentiment
- Sectors like DJ and FCHI showing strong uptrends
- Overall macro trend emphasizes selective bullish optimism
Latest news

Haier Launches HQLED P7 Pro Series TVs With Google Gemini, 50W Audio And AI Picture Enhancements

Nothing's Latest Pokémon Teasers Hint At New Hardware, RCB Collaboration May Also Be In The Works

OnePlus N6 Set To Debut With Massive 8,000mAh Battery And Long-Term Performance Focus

Roblox Introduces Age-Based Accounts for Younger Users, Expands Parental Controls Globally

IIFL Capital Launches Algo Marketplace with Over 100 Ready-Made Strategies

LUMIQ Raises INR 50 Crore Pre-Series B to Become the AI Decision Layer for Financial Services

Tay Keith, producer behind Travis Scott's 'Sicko Mode' dies at 29

GenAI could lift realty sales velocity by up to 50%, speed up launches by 30%: Report
Global stock market indices: How the world markets performed today - 6 February 2025


The international stock market indices showed varied performances on February 06, 2025, reflecting the economic sentiment across different regions.
In this article, we analyze the performance of key global indices including the S&P 500, Dow Jones Industrial Average, NASDAQ Composite, FTSE 100, DAX, CAC 40, IBEX 35, Nikkei 225, Hang Seng, Nifty 50, and BSE Sensex.

Analysis for Sensex - February 06, 2025

The Sensex opened at 78,513.36 and closed lower at 78,058.16, marking a decrease of 213.13 points, equivalent to a -0.27% change. The 50-day EMA stands at 78,137.04, showing a slight decline in momentum, while the RSI is at 54, indicating a relatively neutral investor sentiment. The MACD is -125.00, reflecting bearish momentum but improving towards the MACD Signal of -463.00.

Relationship with Key Moving Averages
The Sensex closed below its 50-day EMA but slightly above its 200-day EMA, indicating potential neutral to slightly bearish momentum. The position of the 10-day and 20-day EMAs below the closing price suggests some short-term upward momentum could exist despite the recent decline.
Moving Averages Trend (MACD)
The MACD for Sensex is -125.00, while the MACD Signal is -463.00. The MACD being higher than the MACD Signal suggests a potential bullish trend might be emerging, but the negative values indicate caution as it is still in bearish territory.

RSI Analysis
The Relative Strength Index (RSI) for Sensex is approximately 54, indicating a neutral market sentiment. An RSI around 50 suggests that the market is neither overbought nor oversold, which may imply a period of consolidation or balanced buying and selling activity.

Analysis for Dow Jones Industrial Average (US) - February 06, 2025

The Dow Jones Industrial Average opened at 44,563.63 and closed higher at 44,873.28, marking a 0.71% increase with a points change of 317.24. The index traded between a low of 44,352.99 and a high of 44,886.88, with a trading volume of 552,040,000. The current RSI of 64.14, alongside positive MACD values, suggests strong bullish momentum.

Relationship with Key Moving Averages
The Dow Jones Industrial Average is trading above its 50-day, 200-day, 10-day, and 20-day EMAs, indicating a strong upward trend. With the current close at 44,873.28, it suggests a bullish sentiment as its position is above all key moving averages, reflecting strong market momentum.
Moving Averages Trend (MACD)
The MACD for the Dow Jones Industrial Average stands at approximately 420.74 with a signal line of around 332.03. This suggests a positive momentum as the MACD is above the signal line, indicating a potential for bullish activity.

RSI Analysis
The Relative Strength Index (RSI) of Dow Jones Industrial Average is currently at 64.14, indicating a moderately strong momentum but below the typical overbought threshold of 70. This suggests that the index is in bullish territory, yet not excessively so, allowing potential for further upward movement without immediate risk of a reversal.

Analysis for CAC 40 (France) - February 06, 2025

The CAC 40 (France) index closed at 7956.84, marking a 0.83% increase from the previous close of 7891.68. The index experienced a high of 7959.62 and a low of 7906.36, with a notable points change of 65.16. The RSI of 68.58 suggests a strong momentum, while the MACD slightly trails the signal line at 128.43 compared to 129.28.

Relationship with Key Moving Averages
The CAC 40 index is trading above its key moving averages, with the current close at 7956.84, which is above the 50 EMA of 7613.19, the 200 EMA of 7545.47, and the 10 EMA of 7882.34. This indicates a strong bullish trend for the index.
Moving Averages Trend (MACD)
The MACD value of 128.43 for the CAC 40 is slightly below the MACD Signal value of 129.28, indicating a potential bearish signal. Traders may view this as a signal to be cautious, as it suggests a possible future decline in momentum.

RSI Analysis
The current RSI for CAC 40 is 68.58, indicating that the index is approaching overbought territory. Typically, RSI values above 70 suggest overbought conditions, while values below 30 indicate oversold conditions. Caution is advised as RSI nears higher levels.

Analysis for FTSE 100 (UK) - February 06, 2025

FTSE 100 (UK) showed a positive performance with a closing value of 8731.71, reflecting a gain of approximately 1.26% from the previous close. The strong price movement is accompanied by a high RSI value of 70.97, indicating potential overbought conditions. Additionally, the MACD of 100.46 suggests bullish momentum above its signal line.

Relationship with Key Moving Averages
FTSE 100 is trading above its key moving averages with the current close at 8731.71, which is higher than the 50 EMA at 8390.99 and the 200 EMA at 8206.23, indicating a strong upward momentum. The 10 EMA at 8598.51 and the 20 EMA at 8517.88 are also below the current close, confirming short-term strength.
Moving Averages Trend (MACD)
The FTSE 100 shows a positive momentum with the MACD value at 100.46, above the signal line at 89.74, indicating a bullish trend. With an RSI of 70.97, the index is in overbought territory, suggesting a possible reversal or consolidation.

RSI Analysis
The FTSE 100 shows an RSI value of 70.97, indicating that the index is approaching overbought conditions. This suggests that the market may be experiencing strong recent gains and could be due for a correction or pullback in the near term.

Analysis for DAX (Germany) - February 06, 2025

The DAX index in Germany opened at 21,718.10 and closed at 21,780.08, marking a positive change from the previous close of 21,585.93 with a 0.90% increase or a 194.15-point gain. The RSI value of 72.57 suggests the index is currently overbought, and the MACD indicates a bullish trend with a value of 383.80 compared to the signal line at 372.79.

Relationship with Key Moving Averages
The DAX, with a closing price of 21,780.08, is trading above its 10-Day EMA (21,499.13), 20-Day EMA (21,208.91), 50-Day EMA (20,594.56), and 200-Day EMA (19,208.81), suggesting a strong bullish trend. The RSI at 72.57 indicates the index may be overbought.
Moving Averages Trend (MACD)
The DAX (Germany) exhibits a positive MACD value of 383.80, with a MACD Signal of 372.79. This suggests a bullish momentum as the MACD line is above the signal line, indicating potential upward movement.

RSI Analysis
The Relative Strength Index (RSI) for DAX (Germany) is 72.57, which suggests that the index is in overbought territory. This may indicate a potential for a price correction or pullback, as the RSI is above the typical overbought threshold of 70.

Analysis for S&P 500 (US) - February 06, 2025

The S&P 500 (US) opened at 6020.45 and closed at 6061.48, showing a percentage change of approximately 0.39% with a points change of 23.60. The index recorded a high of 6062.86 and a low of 6007.06, with a trading volume of 4.76 billion. The RSI stands at 55.25, indicating moderate momentum, and the MACD at 24.69 suggests a positive trend above its signal line of 22.35.

Relationship with Key Moving Averages
The S&P 500 index closed at 6061.48, above its 10-day, 20-day, and 50-day EMAs, indicating a short to medium-term bullish trend. The index is significantly higher than its 200-day EMA of 5649.97, suggesting long-term strength.
Moving Averages Trend (MACD)
The Moving Average Convergence Divergence (MACD) for S&P 500 shows a value of 24.69, which is above the MACD Signal line at 22.35. This suggests a bullish momentum, indicating that the price could continue to rise.

RSI Analysis
For the S&P 500 (US), the RSI value is 55.25, suggesting the index is currently in a neutral zone. It indicates that there is neither an overbought nor an oversold condition in the market, implying potential stability at this stage.

Analysis for Hang Seng Index (Hong Kong) - February 06, 2025

The Hang Seng Index opened at 20,598.98 and closed at 20,891.62, marking a positive change of 1.43% with a points increase of 294.53. The index shows strong momentum with an RSI of 67.07 and a MACD above its signal line. Despite trading volume data being unavailable, the index surpassed its recent 50-day and 10-day EMAs, indicating upward momentum.

Relationship with Key Moving Averages
The Hang Seng Index opened above its previous close and closed at the high of the day, showing strong upward momentum. It traded significantly above its key Moving Averages, with its closing price far above the 10 EMA, 20 EMA, 50 EMA, and 200 EMA, indicating a strong bullish trend. The RSI also suggests it is nearing overbought conditions.
Moving Averages Trend (MACD)
The MACD value for the Hang Seng Index is 248.70, which is above the MACD Signal line at 110.00, indicating a positive momentum. This suggests a potential bullish trend as the MACD line crossing above the signal line often reflects increasing market strength.

RSI Analysis
The Relative Strength Index (RSI) for Hang Seng Index (Hong Kong) is 67.07. This indicates that the index is approaching overbought levels, typically above 70. A rising RSI suggests increasing momentum in the current trend.

Analysis for IBEX 35 (Spain) - February 06, 2025

The IBEX 35 (Spain) opened at 12,574.30 and closed slightly higher at 12,598.10, marking a 0.49% increase with a points change of 61.40. The RSI of 72.39 indicates overbought conditions, while the MACD suggests a strong bullish trend with a value of 194.28.

Relationship with Key Moving Averages
The IBEX 35 index closed at 12,598.10, which is above its 50-day EMA of 11,930.10 and its 200-day EMA of 11,414.40, indicating a strong upward trend. Additionally, it is trading above the 10-day and 20-day EMAs, reinforcing its bullish momentum.
Moving Averages Trend (MACD)
The IBEX 35 shows bullish momentum as the MACD (194.28) is above the MACD Signal line (143.34), indicating potential upward movement. The current price level is above key EMA levels, supporting a bullish view.

RSI Analysis
The RSI (Relative Strength Index) of IBEX 35 is 72.39, indicating that the index is likely in the overbought territory. This suggests that the market may experience a pullback or a period of consolidation soon, as buying pressure could be weakening.

Analysis for NASDAQ Composite (US) - February 06, 2025

The NASDAQ Composite opened at 19,533.05 and closed at 19,692.33, showing a modest increase with a percentage change of 0.19%. The index experienced a high of 19,696.94 and a low of 19,498.90. The Relative Strength Index (RSI) is at 52.02, indicating a neutral momentum, while the Moving Average Convergence Divergence (MACD) is below the signal line, suggesting potential consolidation.

Relationship with Key Moving Averages
The NASDAQ Composite is currently trading above its 50-day EMA of 19445.20, indicating potential bullish momentum. It is also above its 10-day EMA of 19630.85 and its 20-day EMA of 19614.24, which further supports the short-term upward trend. However, with the MACD below the signal line, there could be caution for potential volatility.
Moving Averages Trend (MACD)
The NASDAQ Composite shows a MACD value of 32.56, which is below the MACD Signal of 41.41. This indicates a potential bearish trend as the MACD line is below the signal line, suggesting the recent momentum might be weakening.

RSI Analysis
For the NASDAQ Composite (US), the RSI (Relative Strength Index) is currently at 52.02. This indicates that the index is approaching a neutral territory, suggesting neither an overbought nor oversold condition. Traders often interpret RSI values between 30 and 70 as a sign to monitor market trends rather than expecting immediate reversals.

Analysis for Nikkei 225 (Japan) - February 06, 2025

The Nikkei 225 (Japan) opened at 38,977.58 and closed at 39,066.53, marking a 0.61% increase with a point change of 235.05. This performance is slightly above its 50-day EMA and close to the 10-day EMA, with an RSI of 48.68 indicating a neutral market condition. The MACD is negative, suggesting a potential downward momentum.

Relationship with Key Moving Averages
The Nikkei 225 is trading above both its 50-day and 200-day EMAs, suggesting a short-term bullish momentum. However, with the close below the 10-day and 20-day EMAs, there might be some immediate consolidation or pullback expected.
Moving Averages Trend (MACD)
The MACD for Nikkei 225 is negative at -51.80, which is below the MACD Signal of 7.07. This suggests a bearish trend as the MACD line is below the signal line, indicating downward momentum.

RSI Analysis
The RSI for Nikkei 225 is 48.68, which is close to the midpoint of the RSI scale. This suggests that the market is currently neither overbought nor oversold, indicating a neutral trend without strong bullish or bearish momentum.

Analysis for Nifty Bank - February 06, 2025

Nifty Bank opened at 50,468.35, reached a high of 50,553.35, and closed slightly higher than the previous close at 50,382.10, reflecting a marginal percentage change of 0.08%. The index's performance shows a positive but minor movement with a points change of 39.05. The Relative Strength Index (RSI) stands at 56.29, indicating a neutral momentum, while MACD values suggest a continued negative trend but with potential for improvement.

Relationship with Key Moving Averages
Nifty Bank closed at 50382.10, slightly above its 50 EMA of 50237.06 and 200 EMA of 50217.97, suggesting a potential bullish sentiment in the short to medium term. However, the current price is significantly above the 10 EMA of 49629.72 and 20 EMA of 49571.20, indicating recent upward momentum.
Moving Averages Trend (MACD)
The MACD for Nifty Bank is -130.47, while the MACD Signal is -434.38. Since the MACD line is above the Signal line, this suggests a bullish crossover, indicating potential upward momentum. However, both values are negative, which requires cautious interpretation amid broader market conditions.

RSI Analysis
**RSI Analysis for Nifty Bank:** The Relative Strength Index (RSI) for Nifty Bank is 56.29, which suggests that the stock is currently in a neutral zone. It is not indicating overbought or oversold conditions, but it is closer to the higher end, suggesting some potential upward momentum.

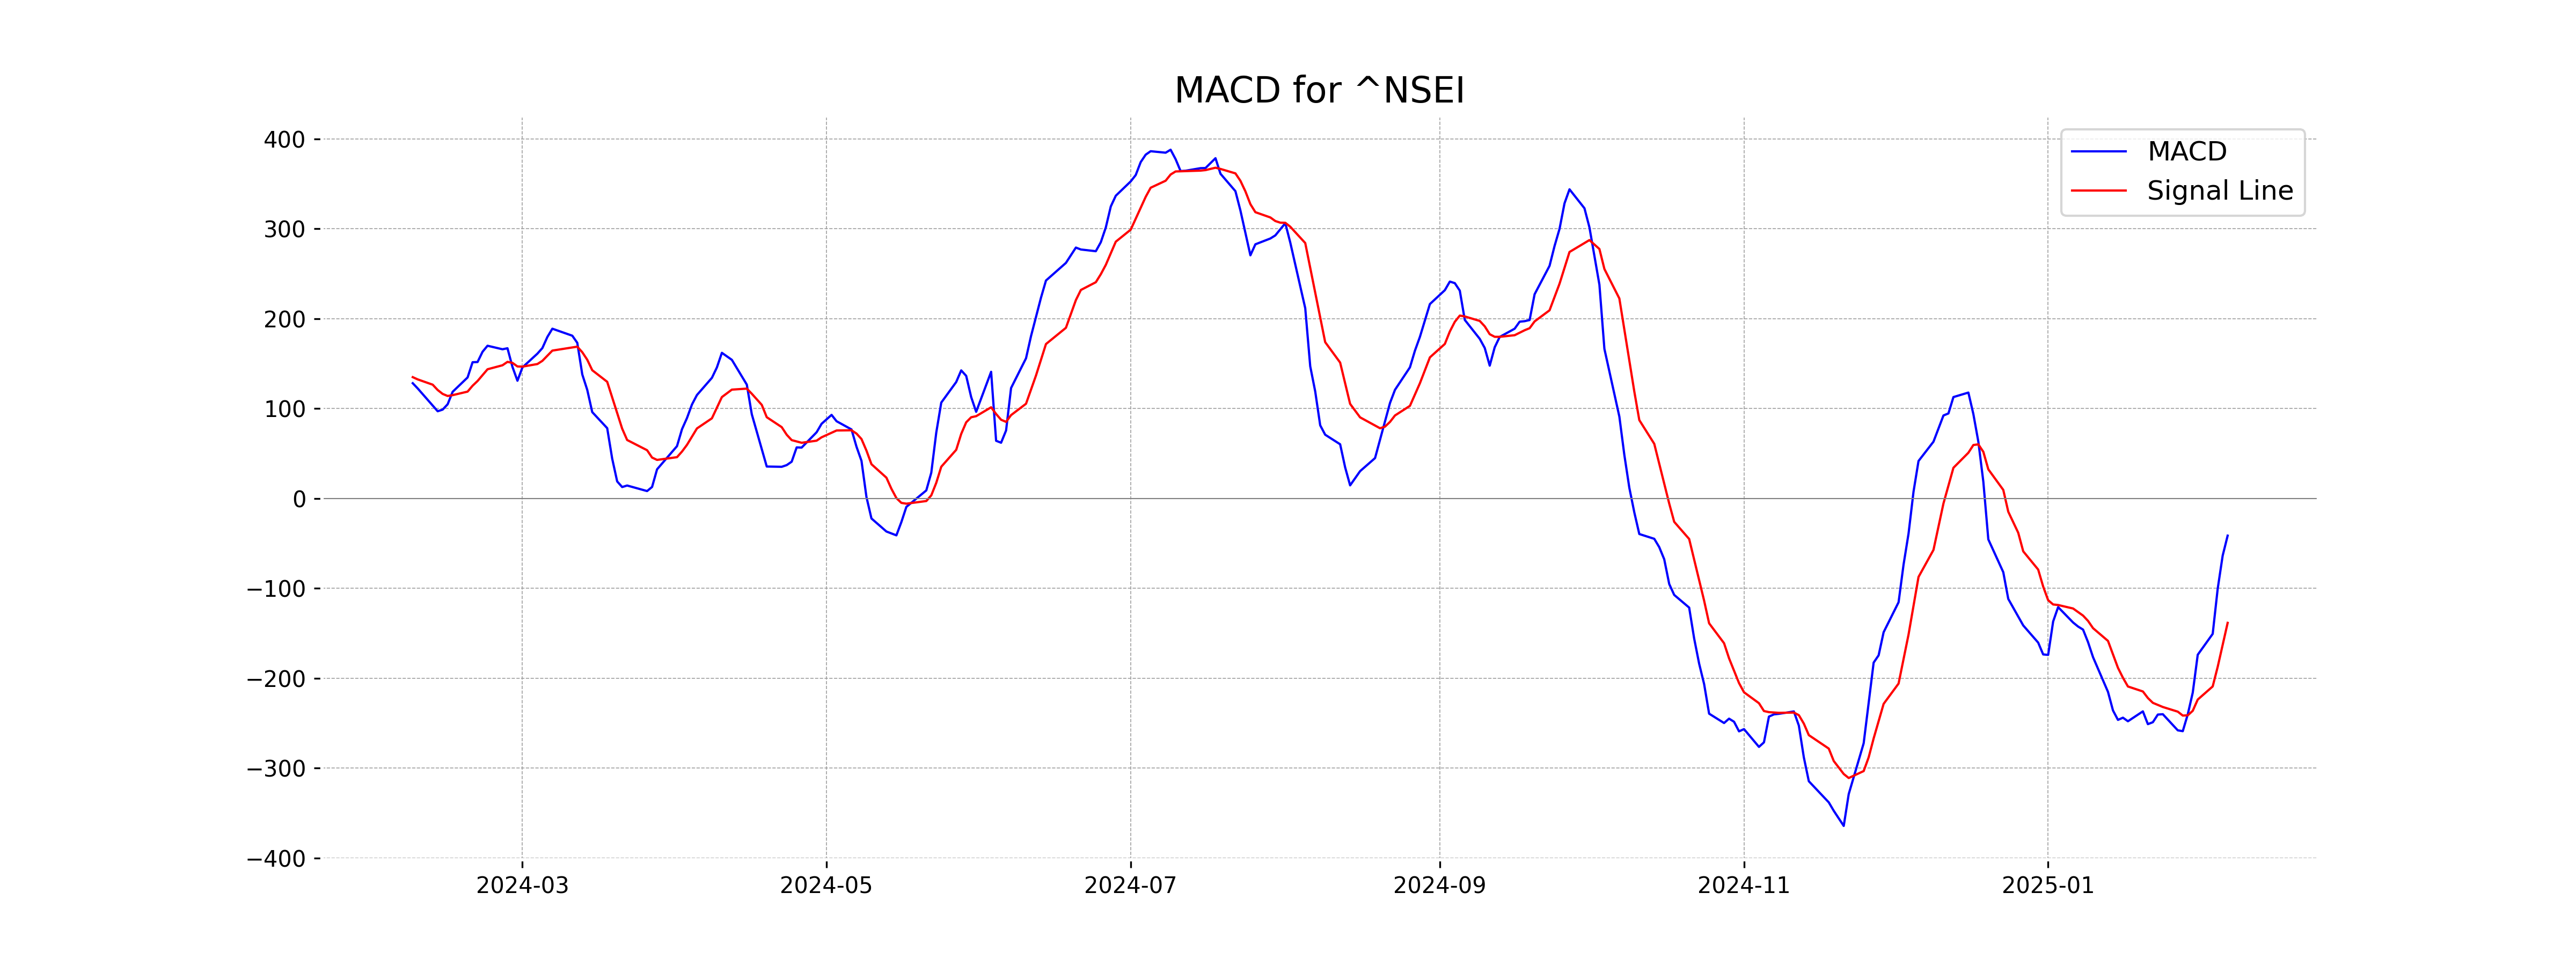
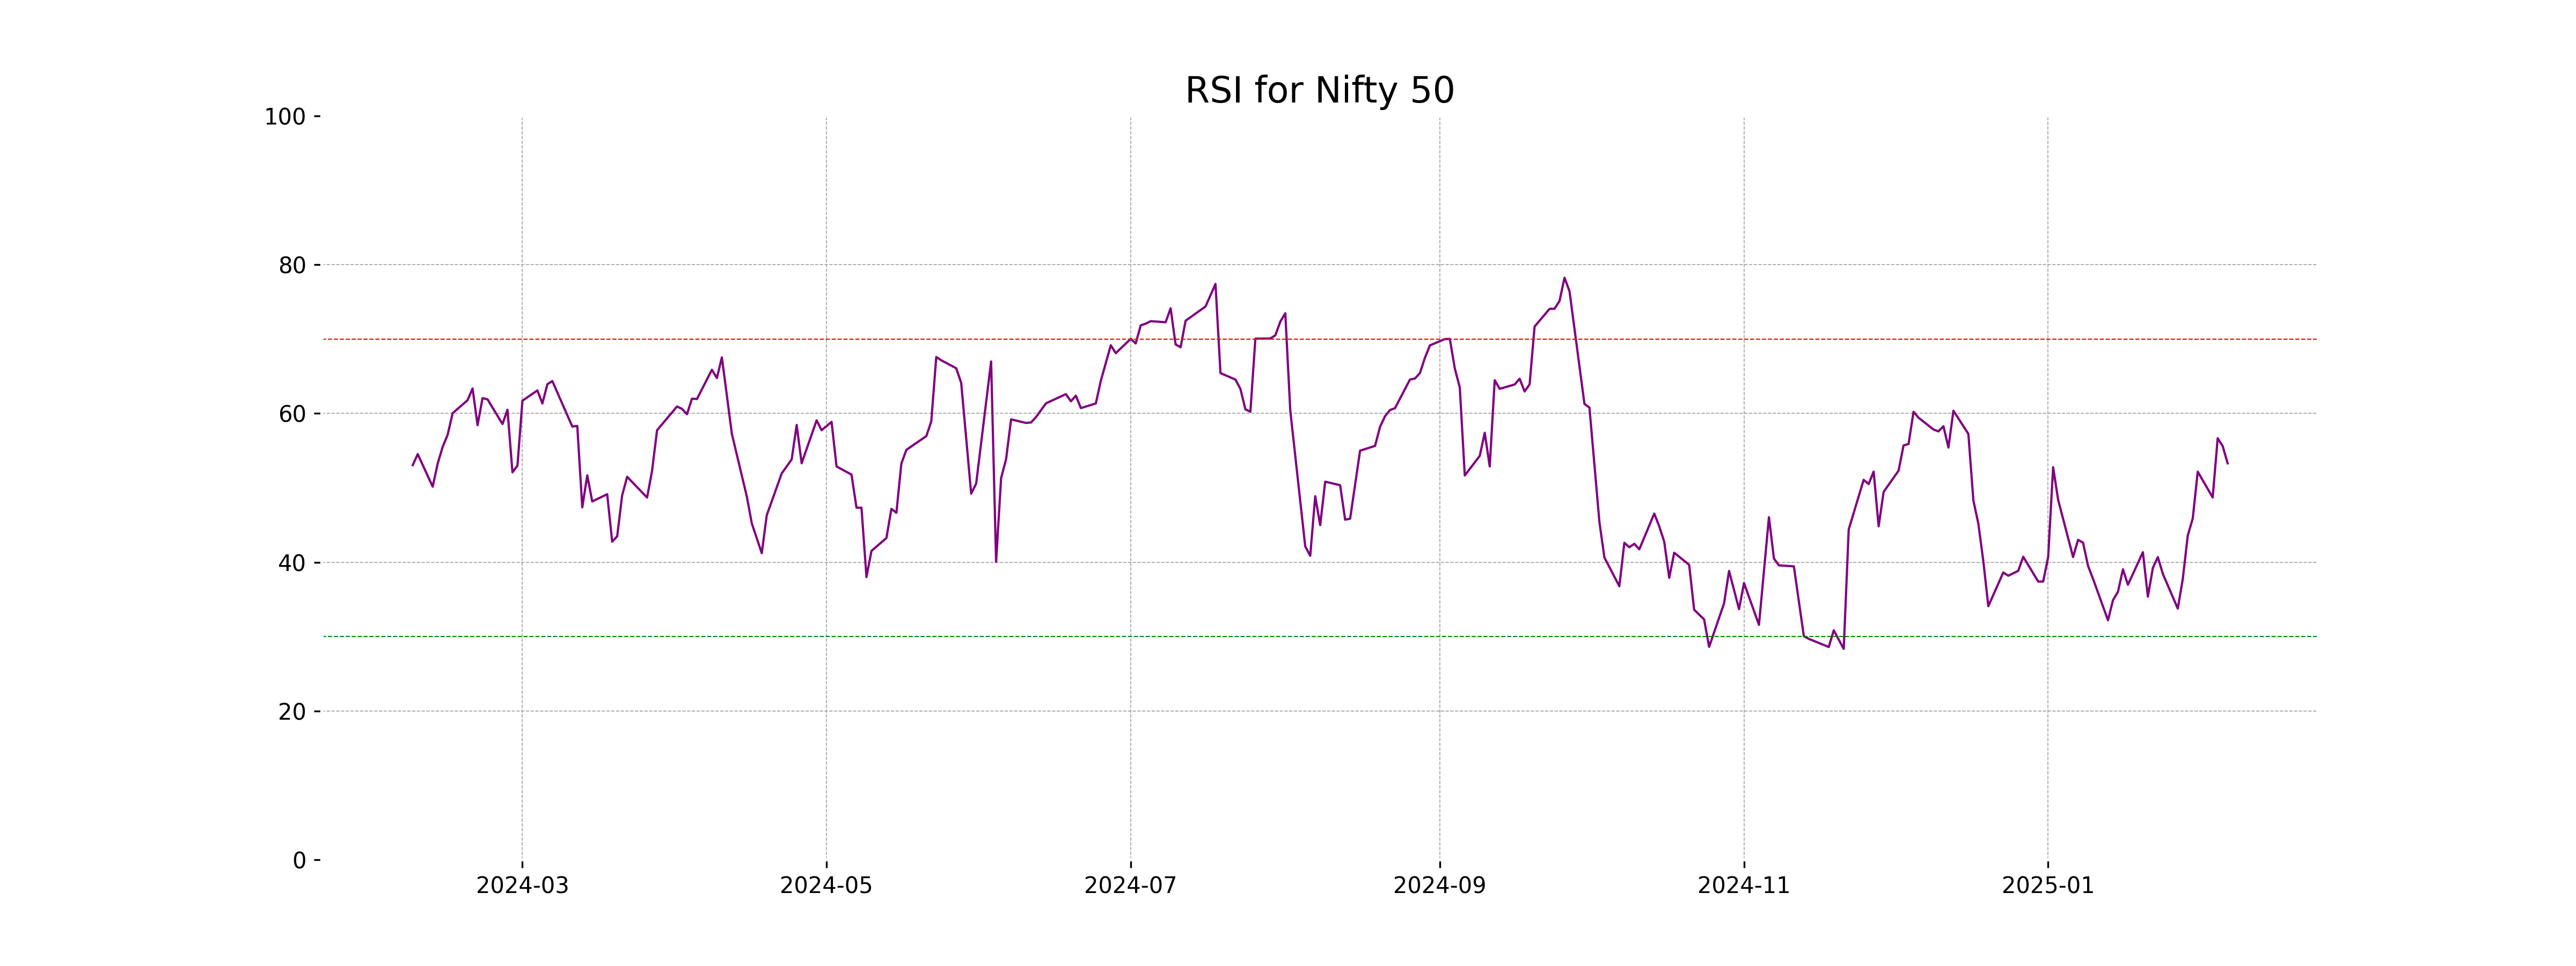
Analysis for Nifty 50 - February 06, 2025

The Nifty 50 index opened at 23,761.95 and experienced a high of 23,773.55 and a low of 23,556.25, closing at 23,603.35. It showed a decline with a percentage change of -0.39% and a points change of -92.95 from the previous close of 23,696.30. The volume recorded was 0. The index's MACD is -41.35, indicating a bearish sentiment, though the RSI at 53.30 suggests a neutral trend.

Relationship with Key Moving Averages
The Nifty 50 closed below the 50-day EMA of 23668.71 and the 200-day EMA of 23623.40, indicating a potential bearish sentiment. However, it is trading above the 10-day EMA of 23437.44 and the 20-day EMA of 23418.18, which may suggest short-term support.
Moving Averages Trend (MACD)
The MACD analysis for Nifty 50 shows a MACD value of -41.35 compared to a MACD Signal of -138.41. This suggests that the MACD is above the signal line, indicating potential upward momentum, but both values are negative, implying a bearish underlying trend.
RSI Analysis
The RSI for Nifty 50 is 53.30, which indicates a neutral position, as it is close to the midpoint of 50. This suggests that the index is neither in overbought nor oversold territory, and may not yet show a strong directional trend.
Up Next
Global stock market indices: How the world markets performed today - 6 February 2025

Honda Activa 6G: Everything You Need to Know Before Buying

How much does a ULIP plan really cost? A break-down of all charges

Centre plans to borrow Rs 8.20 lakh cr from market in first half of FY27

Reliance denies buying Iranian oil amid US sanctions waiver

Premium petrol price up Rs 2, industrial diesel up Rs 22; no change in normal petrol, diesel rates

More videos

India's GDP expected to register over 8 pc growth in Sep-Dec: Report

Govt announces seven measures to help boost exports

RBI keeps interest rates on hold after US trade deal boosts outlook

RBI proposes to compensate customers up to Rs 25,000 loss due to fraud

RBI raises GDP growth projection of Q1, Q2 of FY27

RBI pauses rate cuts, retains interest rate at 5.25 pc

Rupee jumps 122 paise to close at 90.27 against US dollar on India-US trade deal

Stock markets cheer India-US trade deal: Sensex, Nifty surge 2.5 pc

UPI transactions hit record high of Rs 230 lakh crore in 2025-26 till Dec: Govt

Explained: India-US trade deal, tariffs and trade benefits