


Highlights
- RSI values range from neutral to slightly bullish
- MACD signals predominantly point towards bearish or consolidating market
- Some indices hold strength, a definitive upward thrust unsupported by technical indicators
Latest news

Dell Launches New Pro Precision AI Workstations In India, Introduces Deskside Agentic AI Platform

Oppo Enco Air5 Review: Incredible Value at ₹3,099

Samsung Galaxy A27 5G Goes On Sale In India With Cashback Offers, Zero Down Payment Schemes
 First Impressions: A Strong Debut For The New 'b' Series")
Nothing Phone (4b) First Impressions: A Strong Debut For The New 'b' Series

Samsung Galaxy A27 Review: A Dependable Mid-Ranger With Few Surprises

Union Finance Minister Nirmala Sitharaman Inaugurates Muzhiyan Kulam, Restored by Lumina Datamatics and Community Stakeholders in Puducherry

"Don't think anyone will be able to break his track record": Annu Kapoor hails Big B's unmatched legacy

Rewriting the Rules of Business Education: Stride School of Business Unveils Its AI-First Campus Infrastructure
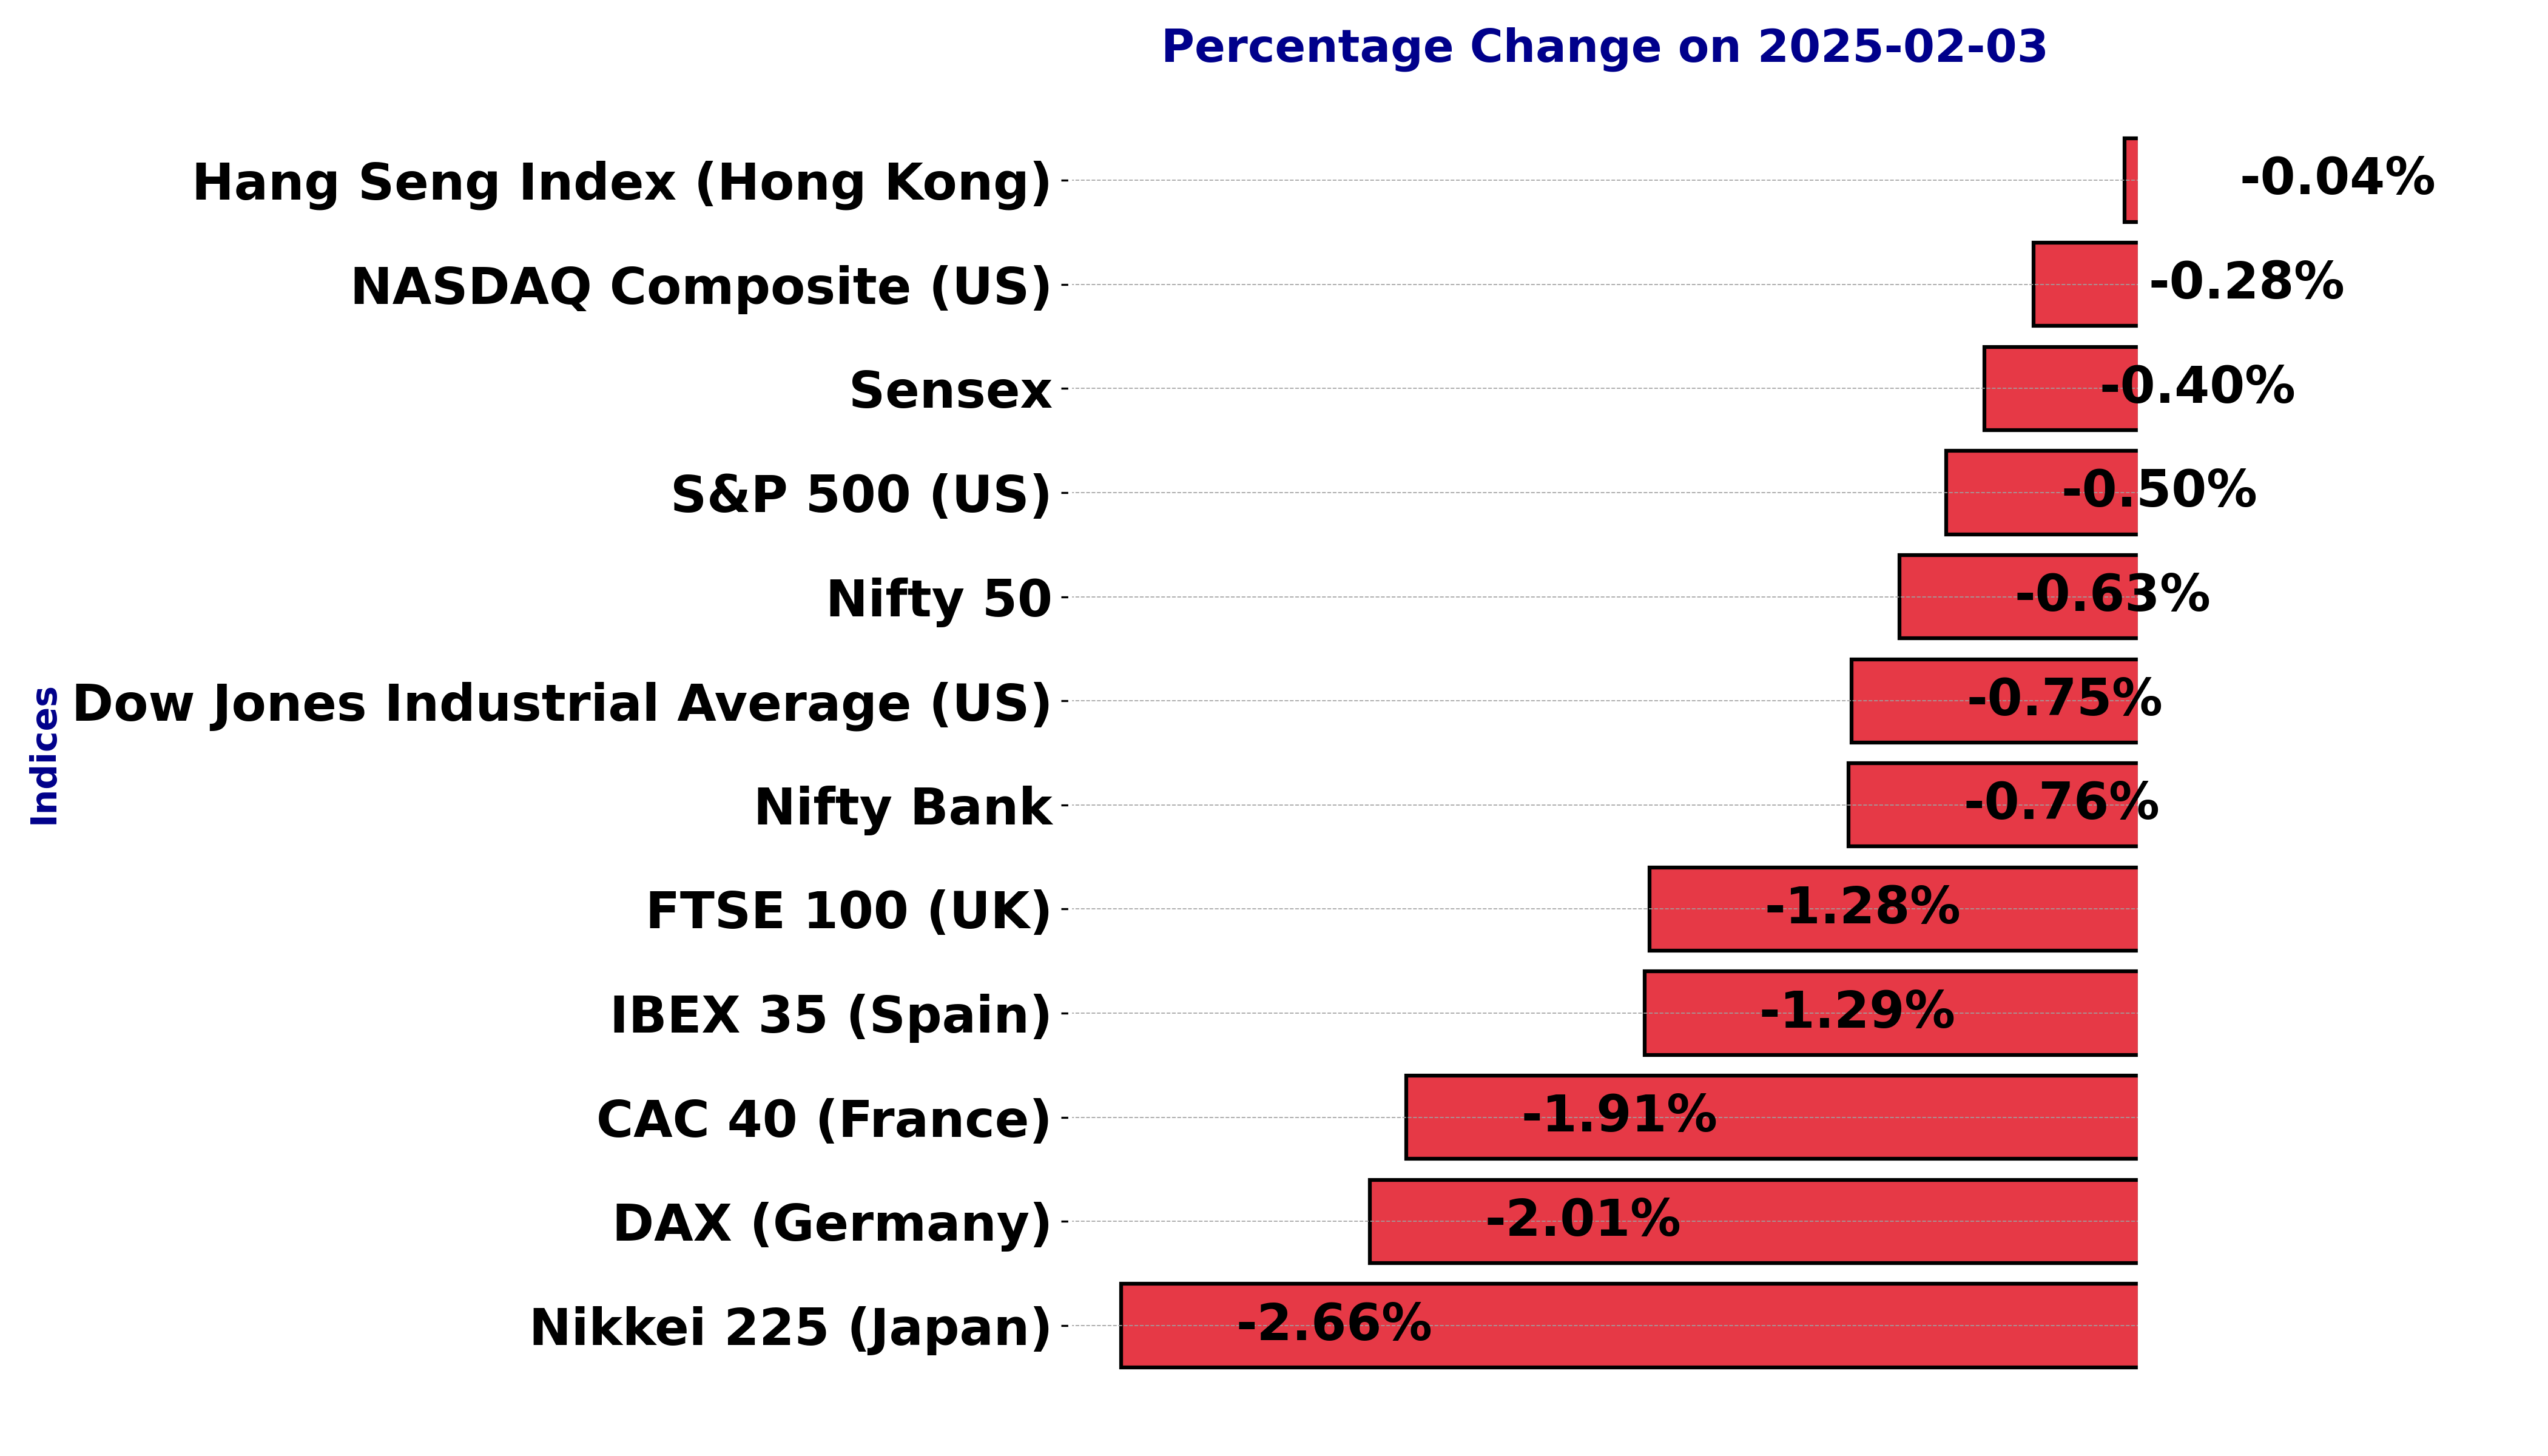
Global stock market indices: How the world markets performed today - 3 February 2025


The international stock market indices showed varied performances on February 03, 2025, reflecting the economic sentiment across different regions.
In this article, we analyze the performance of key global indices including the S&P 500, Dow Jones Industrial Average, NASDAQ Composite, FTSE 100, DAX, CAC 40, IBEX 35, Nikkei 225, Hang Seng, Nifty 50, and BSE Sensex.
Analysis for Sensex - February 03, 2025
Indices Performance

The Sensex (^BSESN) experienced a decline of 313.83 points, closing at 77,186.74, marking a -0.40% change compared to the previous close of 77,500.57. Technical indicators show the index is below its 50-day and 200-day EMAs, with an RSI near the neutral level at 49, suggesting mixed momentum and potential caution in the market.

Relationship with Key Moving Averages
Based on the given data, the Sensex's closing price of 77,186.74 is below both its 50-day and 200-day EMAs (78,116.59 and 77,825.81, respectively), suggesting a potential bearish trend. However, it is slightly above the 10-day and 20-day EMAs (76,742.90 and 77,027.83, respectively), indicating possible short-term bullish momentum.
Moving Averages Trend (MACD)
The Sensex's MACD is currently at -511.22, which is below the MACD Signal of -709.01. This indicates a potential bullish signal, as the MACD is moving closer to the signal line, suggesting a possible reversal or weakening of the downward trend.

RSI Analysis
The RSI (Relative Strength Index) for Sensex is approximately 49.01, which indicates that the market is neither overbought nor oversold, hovering around the midpoint of the typical 30-70 range. This suggests a neutral trend with potential for either upward or downward movement in the near term.

Analysis for Dow Jones Industrial Average (US) - February 03, 2025
Indices Performance

The Dow Jones Industrial Average (^DJI) opened at 45,054.36 and closed lower at 44,544.66, experiencing a decrease of 337.47 points or -0.75% from the previous close. The 50-day EMA of 43,520.01 is above the 200-day EMA of 41,535.09, indicating a positive trend, while the RSI of 61.07 suggests that the index is not yet in overbought territory.

Relationship with Key Moving Averages
For the Dow Jones Industrial Average (^DJI), the closing price of 44,544.66 is above its 10-day EMA (44,344.40) and 20-day EMA (43,927.37), suggesting a short-term bullish trend. Additionally, it is well above the 50-day EMA (43,520.01) and 200-day EMA (41,535.09), indicating a strong longer-term upward trend.
Moving Averages Trend (MACD)
The MACD value for the Dow Jones Industrial Average (DJI) is 429.42, which is above the MACD Signal line at 254.22. This indicates a bullish momentum, suggesting potential upward movement in the short term.

RSI Analysis
The RSI value for the Dow Jones Industrial Average (DJI) is 61.07, which suggests that the index is in a neutral to slightly bullish zone, as it is above 50 but below the typical overbought threshold of 70. This indicates a moderate momentum without being overbought.

Analysis for CAC 40 (France) - February 03, 2025
Indices Performance

The CAC 40 index (^FCHI) opened at 7786.32 and closed at 7797.93, marking a decrease of approximately 1.91% from the previous close of 7950.17. The index exhibited a bearish trend with a decline of 152.24 points. Despite this, the index remains above its 50-day and 200-day EMA, suggesting an overall positive longer-term trend, with an RSI of 58.97 indicating neutral strength.

Relationship with Key Moving Averages
The CAC 40 index's closing price of 7797.93 is above both the 50-day EMA (7571.96) and the 200-day EMA (7533.49), indicating a short to medium-term bullish trend. However, it is below the 10-day EMA (7839.36), suggesting potential short-term weakness.
Moving Averages Trend (MACD)
The MACD for the CAC 40 (France) indicates a positive momentum as the MACD value (134.35) is above the MACD Signal value (127.29), suggesting a potential bullish trend. However, the negative percentage change in the close price should be considered, implying mixed signals that warrant cautious observation.

RSI Analysis
The RSI (Relative Strength Index) for the CAC 40 stands at 58.97, which indicates a relatively neutral position, as it is between the typical overbought threshold of 70 and the oversold threshold of 30. This suggests that the index is neither overvalued nor undervalued at present, based on recent price movements.

Analysis for FTSE 100 (UK) - February 03, 2025
Indices Performance

The FTSE 100 Index (^FTSE) opened at 8673.96 and closed at 8563.03, marking a decline of approximately 1.28% with a points change of -110.97. The 50-day EMA is at 8357.91, slightly above the long-term 200-day EMA of 8192.70, indicating a generally bullish trend, although the recent RSI of 61.22 suggests moderate strength in the current market movement.

Relationship with Key Moving Averages
The FTSE 100's current closing price of 8563.03 is below its 50-day EMA of 8357.91 and above the 10-day EMA of 8549.98. This indicates a short-term bearish momentum given the decline from the previous close, but the price remains above the 200-day EMA of 8192.70, suggesting a longer-term bullish trend.
Moving Averages Trend (MACD)
MACD Analysis for FTSE 100 (UK): The MACD value of 96.29 indicates a bullish momentum when compared to the MACD Signal of 83.22. This suggests that the market could be experiencing a positive trend, but given other market factors, it's important to consider additional indicators before making any investment decisions.

RSI Analysis
The RSI (Relative Strength Index) for the FTSE 100 is currently at 61.22, indicating that the market is neither overbought nor oversold. Generally, an RSI above 70 suggests overbought conditions, while below 30 suggests oversold conditions. In this case, the RSI suggests a relatively balanced market, potentially signaling less momentum for strong directional moves in the immediate term.

Analysis for DAX (Germany) - February 03, 2025
Indices Performance

The DAX (Germany) index experienced a decline, with a closing price of 21,295.16, down by 436.89 points or approximately 2.01% compared to the previous close of 21,732.05. Technical indicators show a slight downtrend with the current price sitting between the 10-day EMA of 21,356.64 and the 50-day EMA of 20,457.62. The RSI value of 61.67 suggests the index is not in overbought territory.

Relationship with Key Moving Averages
The DAX (^GDAXI) is currently trading below the 10-day EMA of 21356.64 but above both the 50-day EMA of 20457.62 and the 200-day EMA of 19133.69. This suggests a short-term downward pressure, as the recent closing price is below the short-term average, but it remains in a longer-term uptrend.
Moving Averages Trend (MACD)
The MACD value for the DAX (Germany) stock index is 392.88, while the MACD Signal is 360.06. Since the MACD is above the MACD Signal, this suggests a bullish momentum in the short term. However, investors should consider other indicators and market conditions for a comprehensive analysis.

RSI Analysis
The RSI (Relative Strength Index) for the DAX is 61.67, indicating that the index is in a neutral to slightly overbought position. An RSI value above 70 typically signals overbought conditions, while an RSI below 30 indicates oversold conditions. With the current RSI, the DAX may be exhibiting some upward momentum, but it's not in an extreme zone that suggests a correction is immediately likely.

Analysis for S&P 500 (US) - February 03, 2025
Indices Performance

The S&P 500 index (^GSPC) opened at 6096.79, with a high of 6120.91 and a low of 6030.93, eventually closing at 6040.53. This represented a decrease of 0.50% from the previous close of 6071.17, with a points change of -30.64. The index had a trading volume of 4.84 billion, with its RSI at 53.82, indicating neutral momentum.

Relationship with Key Moving Averages
The S&P 500 (^GSPC) closed at 6040.53, slightly above its 10-day EMA of 6037.00, indicating short-term bullish momentum. It is also above its 50-day EMA of 5965.29, suggesting a medium-term uptrend, but remains significantly above the 200-day EMA of 5638.29, underscoring a strong long-term upward trend.
Moving Averages Trend (MACD)
The MACD for the S&P 500 is 29.45, which is above the MACD Signal of 20.51, indicating a bullish momentum. This suggests that the recent trend may continue upward, as the MACD line crossing above the signal line is typically seen as a positive sign.

RSI Analysis
The RSI for the S&P 500 is 53.82, indicating a neutral stance as it is close to the midpoint of the 0-100 scale. This suggests that the index neither shows overbought nor oversold conditions, implying balanced market momentum.

Analysis for Hang Seng Index (Hong Kong) - February 03, 2025
Indices Performance

The Hang Seng Index (^HSI) opened at 20,048.87 and closed slightly lower at 20,217.26 with a minimal points change of -7.85, reflecting a slight decrease of -0.04%. The index showed volatility within the day, with a high of 20,222.00 and a low of 19,764.67, while key indicators like the 50 EMA (19,764.77) and 200 EMA (18,991.84) suggest a positive short-term trend, supported by an RSI of 59.65 indicating moderate momentum.

Relationship with Key Moving Averages
The Hang Seng Index (^HSI) closed at 20217.26, above its 50 EMA of 19764.77 and 200 EMA of 18991.84, indicating a potential upward trend. It also closed above the 10 EMA of 19949.71 and the 20 EMA of 19820.22, suggesting short-term positive momentum.
Moving Averages Trend (MACD)
The MACD for the Hang Seng Index (^HSI) is at 109.04, well above the MACD Signal line of 11.43. This suggests a bullish trend, indicating potential upward momentum in the short term.

RSI Analysis
The RSI (Relative Strength Index) for the Hang Seng Index is 59.65, which indicates a neutral to slightly bullish sentiment. An RSI above 50 typically suggests that the index may be experiencing upward momentum, but it is not yet in the overbought territory, which starts around 70.

Analysis for IBEX 35 (Spain) - February 03, 2025
Indices Performance

The IBEX 35 index opened at 12,123.20 and closed at 12,209.00, experiencing a decline of 1.29% from its previous close, with a points change of -159.90. The day's trading saw a volume of 44,534,207, and the index remains above its 50-day and 200-day EMAs, indicating a generally positive trend, with a current RSI of 61.68 and a MACD of 149.84.

Relationship with Key Moving Averages
The IBEX 35 closed at 12,209, which is above its 50-day EMA of 11,856.85 and the 200-day EMA of 11,381.16, indicating a bullish trend over the medium to long term. However, it is closely aligned with its 10-day EMA of 12,153.66 and 20-day EMA of 12,021.19, suggesting short-term consolidation.
Moving Averages Trend (MACD)
The MACD value for the IBEX 35 is 149.84, with a MACD Signal line at 109.14. This indicates a bullish trend, as the MACD line is above the signal line. The positive difference (40.70) suggests potential upward momentum in the short term.

RSI Analysis
The RSI for the IBEX 35 is 61.68, indicating that the index is currently in a neutral position but is leaning towards being overbought. Typically, RSI values above 70 suggest overbought conditions, while values below 30 suggest oversold conditions. Therefore, investors might monitor it closely for any potential changes in the trend.

Analysis for NASDAQ Composite (US) - February 03, 2025
Indices Performance

The NASDAQ Composite (^IXIC) opened at 19,832.33, experienced a high of 19,969.17, and closed slightly lower at 19,627.44, marking a % change of -0.28% with a points change of -54.31. The RSI stands at 50.67, indicating a neutral position, while the MACD is slightly below its signal line, suggesting a potential bearish momentum.

Relationship with Key Moving Averages
The NASDAQ Composite (^IXIC) closed at 19627.44, which is above its 50-day EMA of 19427.57 but below the 10-day EMA of 19657.24. It is roughly aligned with its 20-day EMA of 19622.97, indicating a stable short-term trend, while being significantly above its 200-day EMA of 18071.15, suggesting a strong long-term uptrend.
Moving Averages Trend (MACD)
The MACD for the NASDAQ Composite shows a slightly bearish signal, as the MACD value of 51.61 is below the MACD Signal line of 52.39. This suggests a potential decrease in momentum, indicating caution for investors.

RSI Analysis
The RSI (Relative Strength Index) for the NASDAQ Composite is 50.67, indicating a neutral market sentiment. An RSI near 50 suggests that the index is neither overbought nor oversold, reflecting a balance between buying and selling pressures. This level may suggest caution as the market could move in either direction.

Analysis for Nikkei 225 (Japan) - February 03, 2025
Indices Performance

The Nikkei 225 index (^N225) experienced a decline, closing at 38,520.09, which is a 2.66% drop from the previous close of 39,572.49, representing a decrease of 1,052.40 points. The index's RSI is at 42.12, indicating a neutral momentum, while its MACD is below the signal line, suggesting bearish sentiment.

Relationship with Key Moving Averages
The Nikkei 225 closed at 38520.09, which is below its key moving averages: the 50-day EMA of 39128.07, the 20-day EMA of 39261.90, and the 10-day EMA of 39252.60. This positioning indicates a bearish trend as the index trades beneath these moving averages.
Moving Averages Trend (MACD)
The MACD value for Nikkei 225 is 14.78, which is below the MACD Signal line of 55.49. This indicates a bearish momentum, suggesting that the market could potentially continue to experience downward pressure in the short term.

RSI Analysis
The RSI (Relative Strength Index) for the Nikkei 225 (Japan) is 42.12, which indicates that the index is currently in the neutral range, slightly closer to being oversold. An RSI below 30 typically signals that the index might be oversold, while an RSI above 70 suggests it might be overbought.

Analysis for Nifty Bank - February 03, 2025
Indices Performance

The Nifty Bank index showed a negative performance, closing at 49,210.55, which marks a decline of approximately 0.76% or 376.65 points from the previous close of 49,587.20. The RSI stands at 46.60, indicating a neutral momentum, while the MACD shows a negative trend with a reading of -455.50, below the signal of -643.41. Both the 50 and 200 EMAs are above the current close, suggesting potential bearish sentiment.

Relationship with Key Moving Averages
The Nifty Bank index closed at 49,210.55, positioned below its 10 EMA (49,068.84), 20 EMA (49,315.37), and significantly under its 50 EMA (50,229.37) and 200 EMA (50,215.04). This indicates potential bearish momentum in the short term, as the current price is below several key moving averages.
Moving Averages Trend (MACD)
The MACD for Nifty Bank is currently at -455.50, with the MACD Signal at -643.41. This indicates that the MACD line is above the signal line, suggesting a potential bullish crossover, which may hint at a possible upward momentum. However, with both values in the negative, caution is advised as it could still be in bearish territory.

RSI Analysis
The RSI (Relative Strength Index) for Nifty Bank is 46.60, which suggests that the stock is neither overbought nor oversold, indicating a neutral to slightly weak momentum. It is vital to monitor for any further declines towards the 30 level or increases towards 70, which could signal potential buying or selling opportunities, respectively.

Analysis for Nifty 50 - February 03, 2025
Indices Performance

The Nifty 50 index (^NSEI) opened at 23,319.35 and closed slightly lower at 23,361.05, marking a decrease of 0.63% from the previous close of 23,508.40. It experienced a trading range with a high of 23,381.60 and a low of 23,222.00. Technical indicators show the index is trading below its 50 EMA and 200 EMA, with an RSI of 48.70 suggesting neither overbought nor oversold conditions.

Relationship with Key Moving Averages
The Nifty 50 (^NSEI) closed at 23,361.05, which is below both its 50-day EMA (23,667.54) and its 200-day EMA (23,621.44), indicating a bearish trend in the market. However, it is above the 10-day and 20-day EMAs, suggesting some short-term bullish momentum.
Moving Averages Trend (MACD)
The MACD for Nifty 50 is -150.66, while the MACD Signal is -209.15, indicating that the MACD line is above the signal line. This suggests a possible bullish momentum, but the fact that both values are negative indicates the overall trend might still be bearish. Investors should watch for further changes in the MACD to confirm a trend reversal.

RSI Analysis
The RSI (Relative Strength Index) for Nifty 50 is 48.70, which is below the neutral level of 50, indicating a slight bearish trend. This suggests that the market is not currently overbought or oversold, showing a more balanced momentum with a tendency towards bearish sentiment.

Up Next
Global stock market indices: How the world markets performed today - 3 February 2025

Step-by-step guide to apply for a mortgage loan online with minimal documentation

Honda Activa 6G: Everything You Need to Know Before Buying

How much does a ULIP plan really cost? A break-down of all charges

Centre plans to borrow Rs 8.20 lakh cr from market in first half of FY27

Reliance denies buying Iranian oil amid US sanctions waiver

More videos

Premium petrol price up Rs 2, industrial diesel up Rs 22; no change in normal petrol, diesel rates

India's GDP expected to register over 8 pc growth in Sep-Dec: Report

Govt announces seven measures to help boost exports

RBI keeps interest rates on hold after US trade deal boosts outlook

RBI proposes to compensate customers up to Rs 25,000 loss due to fraud

RBI raises GDP growth projection of Q1, Q2 of FY27

RBI pauses rate cuts, retains interest rate at 5.25 pc

Rupee jumps 122 paise to close at 90.27 against US dollar on India-US trade deal

Stock markets cheer India-US trade deal: Sensex, Nifty surge 2.5 pc

UPI transactions hit record high of Rs 230 lakh crore in 2025-26 till Dec: Govt