


Highlights
- Dow, S&P show gains; global sentiment mixed
- European indices trend down amid weak momentum
- Asian markets display neutral-to-bearish indicators
Latest news

Haier Launches HQLED P7 Pro Series TVs With Google Gemini, 50W Audio And AI Picture Enhancements

Nothing's Latest Pokémon Teasers Hint At New Hardware, RCB Collaboration May Also Be In The Works

OnePlus N6 Set To Debut With Massive 8,000mAh Battery And Long-Term Performance Focus

Roblox Introduces Age-Based Accounts for Younger Users, Expands Parental Controls Globally

IIFL Capital Launches Algo Marketplace with Over 100 Ready-Made Strategies

LUMIQ Raises INR 50 Crore Pre-Series B to Become the AI Decision Layer for Financial Services

Tay Keith, producer behind Travis Scott's 'Sicko Mode' dies at 29

GenAI could lift realty sales velocity by up to 50%, speed up launches by 30%: Report
Global stock market indices: How the world markets performed today - 24 April 2025


The international stock market indices showed varied performances on April 24, 2025, reflecting the economic sentiment across different regions.
In this article, we analyze the performance of key global indices including the S&P 500, Dow Jones Industrial Average, NASDAQ Composite, FTSE 100, DAX, CAC 40, IBEX 35, Nikkei 225, Hang Seng, Nifty 50, and BSE Sensex.

Analysis for Sensex - April 24, 2025

The Sensex closed at 79,801.43, dropping 315.06 points or -0.39% from the previous close of 80,116.49. The market exhibited a trading range between a high of 80,173.92 and a low of 79,734.78. Despite this decline, the Relative Strength Index (RSI) remains high at 65.90, suggesting the market is still relatively strong.

Relationship with Key Moving Averages
The Sensex closed at 79,801.43, which is above its 50-day EMA of 76,637.60 and 200-day EMA of 77,136.96, indicating a potential upward trend. However, the close is below the 10-day EMA of 78,196.19, suggesting short-term weakness.
Moving Averages Trend (MACD)
The MACD for Sensex is 988.83, which is above the MACD Signal of 497.28, suggesting a bullish signal. This indicates upward momentum, as the MACD line is significantly higher, which may imply potential buy signals. However, it's essential to consider other technical indicators and market conditions before making investment decisions.

RSI Analysis
The Relative Strength Index (RSI) for Sensex is at 65.90, which suggests that the stock index is nearing overbought territory, typically considered above 70. This indicates a potentially strong buying momentum, but caution is advised as it approaches levels where a reversal or pullback could occur.

Analysis for Dow Jones Industrial Average (US) - April 24, 2025

Dow Jones Industrial Average (US) opened at 39815.01 and closed at 39606.57 after reaching a high of 40376.11. The index experienced a 1.07% increase from the previous close with a points change of 419.58. The Relative Strength Index (RSI) stands at 44.98, indicating slightly weak momentum, while the MACD shows a negative divergence, suggesting a bearish trend.

Relationship with Key Moving Averages
The Dow Jones Industrial Average opened higher than its 10 EMA but closed below it, indicating some intraday weakness. It is trading below both its 50 EMA and 200 EMA, suggesting a bearish trend. The RSI is below 50, aligning with this negative sentiment.
Moving Averages Trend (MACD)
The Dow Jones Industrial Average currently shows a MACD of -767.56 with a MACD Signal of -776.18. This suggests that the index is experiencing bearish momentum, as the MACD line is above the signal line but remains in negative territory.

RSI Analysis
The Relative Strength Index (RSI) for Dow Jones Industrial Average (US) is 44.98, which suggests that the index is currently in a neutral state. An RSI below 30 typically indicates an oversold condition, while above 70 indicates overbought; hence, the current value does not suggest strong sell or buy signals.

Analysis for CAC 40 (France) - April 24, 2025

CAC 40 (France) Performance The CAC 40 index opened at 7448.46 and closed slightly lower at 7456.58, reflecting a minor decrease with a -0.34% change from the previous close of 7482.36. The index saw a drop of 25.78 points, with key moving averages indicating that it is trading below both the 50-day EMA (7654.17) and 200-day EMA (7651.68), while staying above the 10-day EMA (7362.76).

Relationship with Key Moving Averages
For CAC 40 (France), the current close is below the 50 EMA and 200 EMA values, suggesting a bearish trend in relation to these longer-term moving averages. The 20 EMA is slightly higher than the close, while the 10 EMA is lower, indicating mixed short-term momentum.
Moving Averages Trend (MACD)
The MACD for the CAC 40 indicates a potential upward momentum reversal, as the MACD line at -147.04 is above the Signal line at -184.53. This suggests that the recent downward trend might be losing strength. However, further confirmation from additional indicators would strengthen the analysis.

RSI Analysis
The Relative Strength Index (RSI) for the CAC 40 is 47.25, which suggests the index is in a neutral zone, as RSI values typically range between 30 and 70 for neutral market conditions. This indicates neither overbought nor oversold conditions for the index.

Analysis for FTSE 100 (UK) - April 24, 2025

FTSE 100 (UK) experienced a slight decline with the index closing at 8392.57, down by approximately 0.13% compared to the previous close. The market showed moderate volatility with a range between 8371.82 and 8410.96, while the RSI indicates a relatively neutral momentum at around 52.24.

Relationship with Key Moving Averages
The closing price of FTSE 100 (UK) is below the 50-day EMA and above the 200-day EMA, indicating potential short-term weakness but long-term support. The 10-day and 20-day EMAs are also below the 50-day EMA, suggesting a bearish short-term trend.
Moving Averages Trend (MACD)
FTSE 100 (UK) MACD Analysis: The MACD for FTSE 100 is -68.01, which is above the MACD Signal line of -115.64. This suggests a potential bullish trend as the MACD line is rising towards the signal line, indicating increasing momentum.

RSI Analysis
The FTSE 100's RSI is 52.24, indicating a neutral position, as it is in the middle of the typical 30-70 range. This suggests that the index is neither overbought nor oversold at its current price level.

Analysis for DAX (Germany) - April 24, 2025

DAX (Germany) Performance: On the trading day, the DAX opened at 21,890.10, reached a high of 21,905.94, and closed at 21,869.74, marking a decrease of 92.23 points or -0.42%. The index's 50-day EMA stood at 21,716.84, while RSI indicated a moderately strong position at 52.83.

Relationship with Key Moving Averages
For the DAX (Germany), the current close at 21869.74 is above the 50-day EMA of 21716.84 and substantially above the 200-day EMA of 20409.73, indicating a generally bullish trend over the medium and long term. However, the price is slightly below the short-term 10-day EMA of 21373.27, suggesting minor recent weakness.
Moving Averages Trend (MACD)
The MACD value for DAX (Germany) is -226.11, which is above the MACD Signal line at -368.79. This indicates a bullish crossover, suggesting potential upward momentum. However, given the negative MACD, the longer trend might still be bearish.

RSI Analysis
Based on the stock data for DAX (Germany), the RSI is at 52.83, indicating a neutral momentum, neither overbought nor oversold. This suggests a balanced position in the market, with potential for either upward or downward movement.

Analysis for S&P 500 (US) - April 24, 2025

The S&P 500 opened at 5395.92, reaching a high of 5469.69 and a low of 5356.17 before closing at 5375.86. The index saw a price increase of 1.67% or 88.10 points from the previous close of 5287.76. The Relative Strength Index (RSI) is at 47.44, indicating a neutral momentum, while the Moving Average Convergence Divergence (MACD) is below its signal line, suggesting bearish trends.

Relationship with Key Moving Averages
The S&P 500's close price of 5375.86 is below its 50-day and 200-day EMAs, indicating a bearish sentiment in the medium to long term. However, it is above the 10-day EMA, suggesting a short-term upward momentum.
Moving Averages Trend (MACD)
The MACD value for the S&P 500 is -105.94, which is higher than the Signal Line value of -120.23. This suggests that there may be a potential for a bullish crossover as the MACD is moving closer to the Signal Line. However, both values being negative indicates that the broader trend may still be bearish.

RSI Analysis
The current RSI of the S&P 500 is 47.44, which indicates that the index is in a neutral zone, neither overbought nor oversold. This suggests potential stability with no immediate buy or sell signals based on RSI alone.

Analysis for Hang Seng Index (Hong Kong) - April 24, 2025
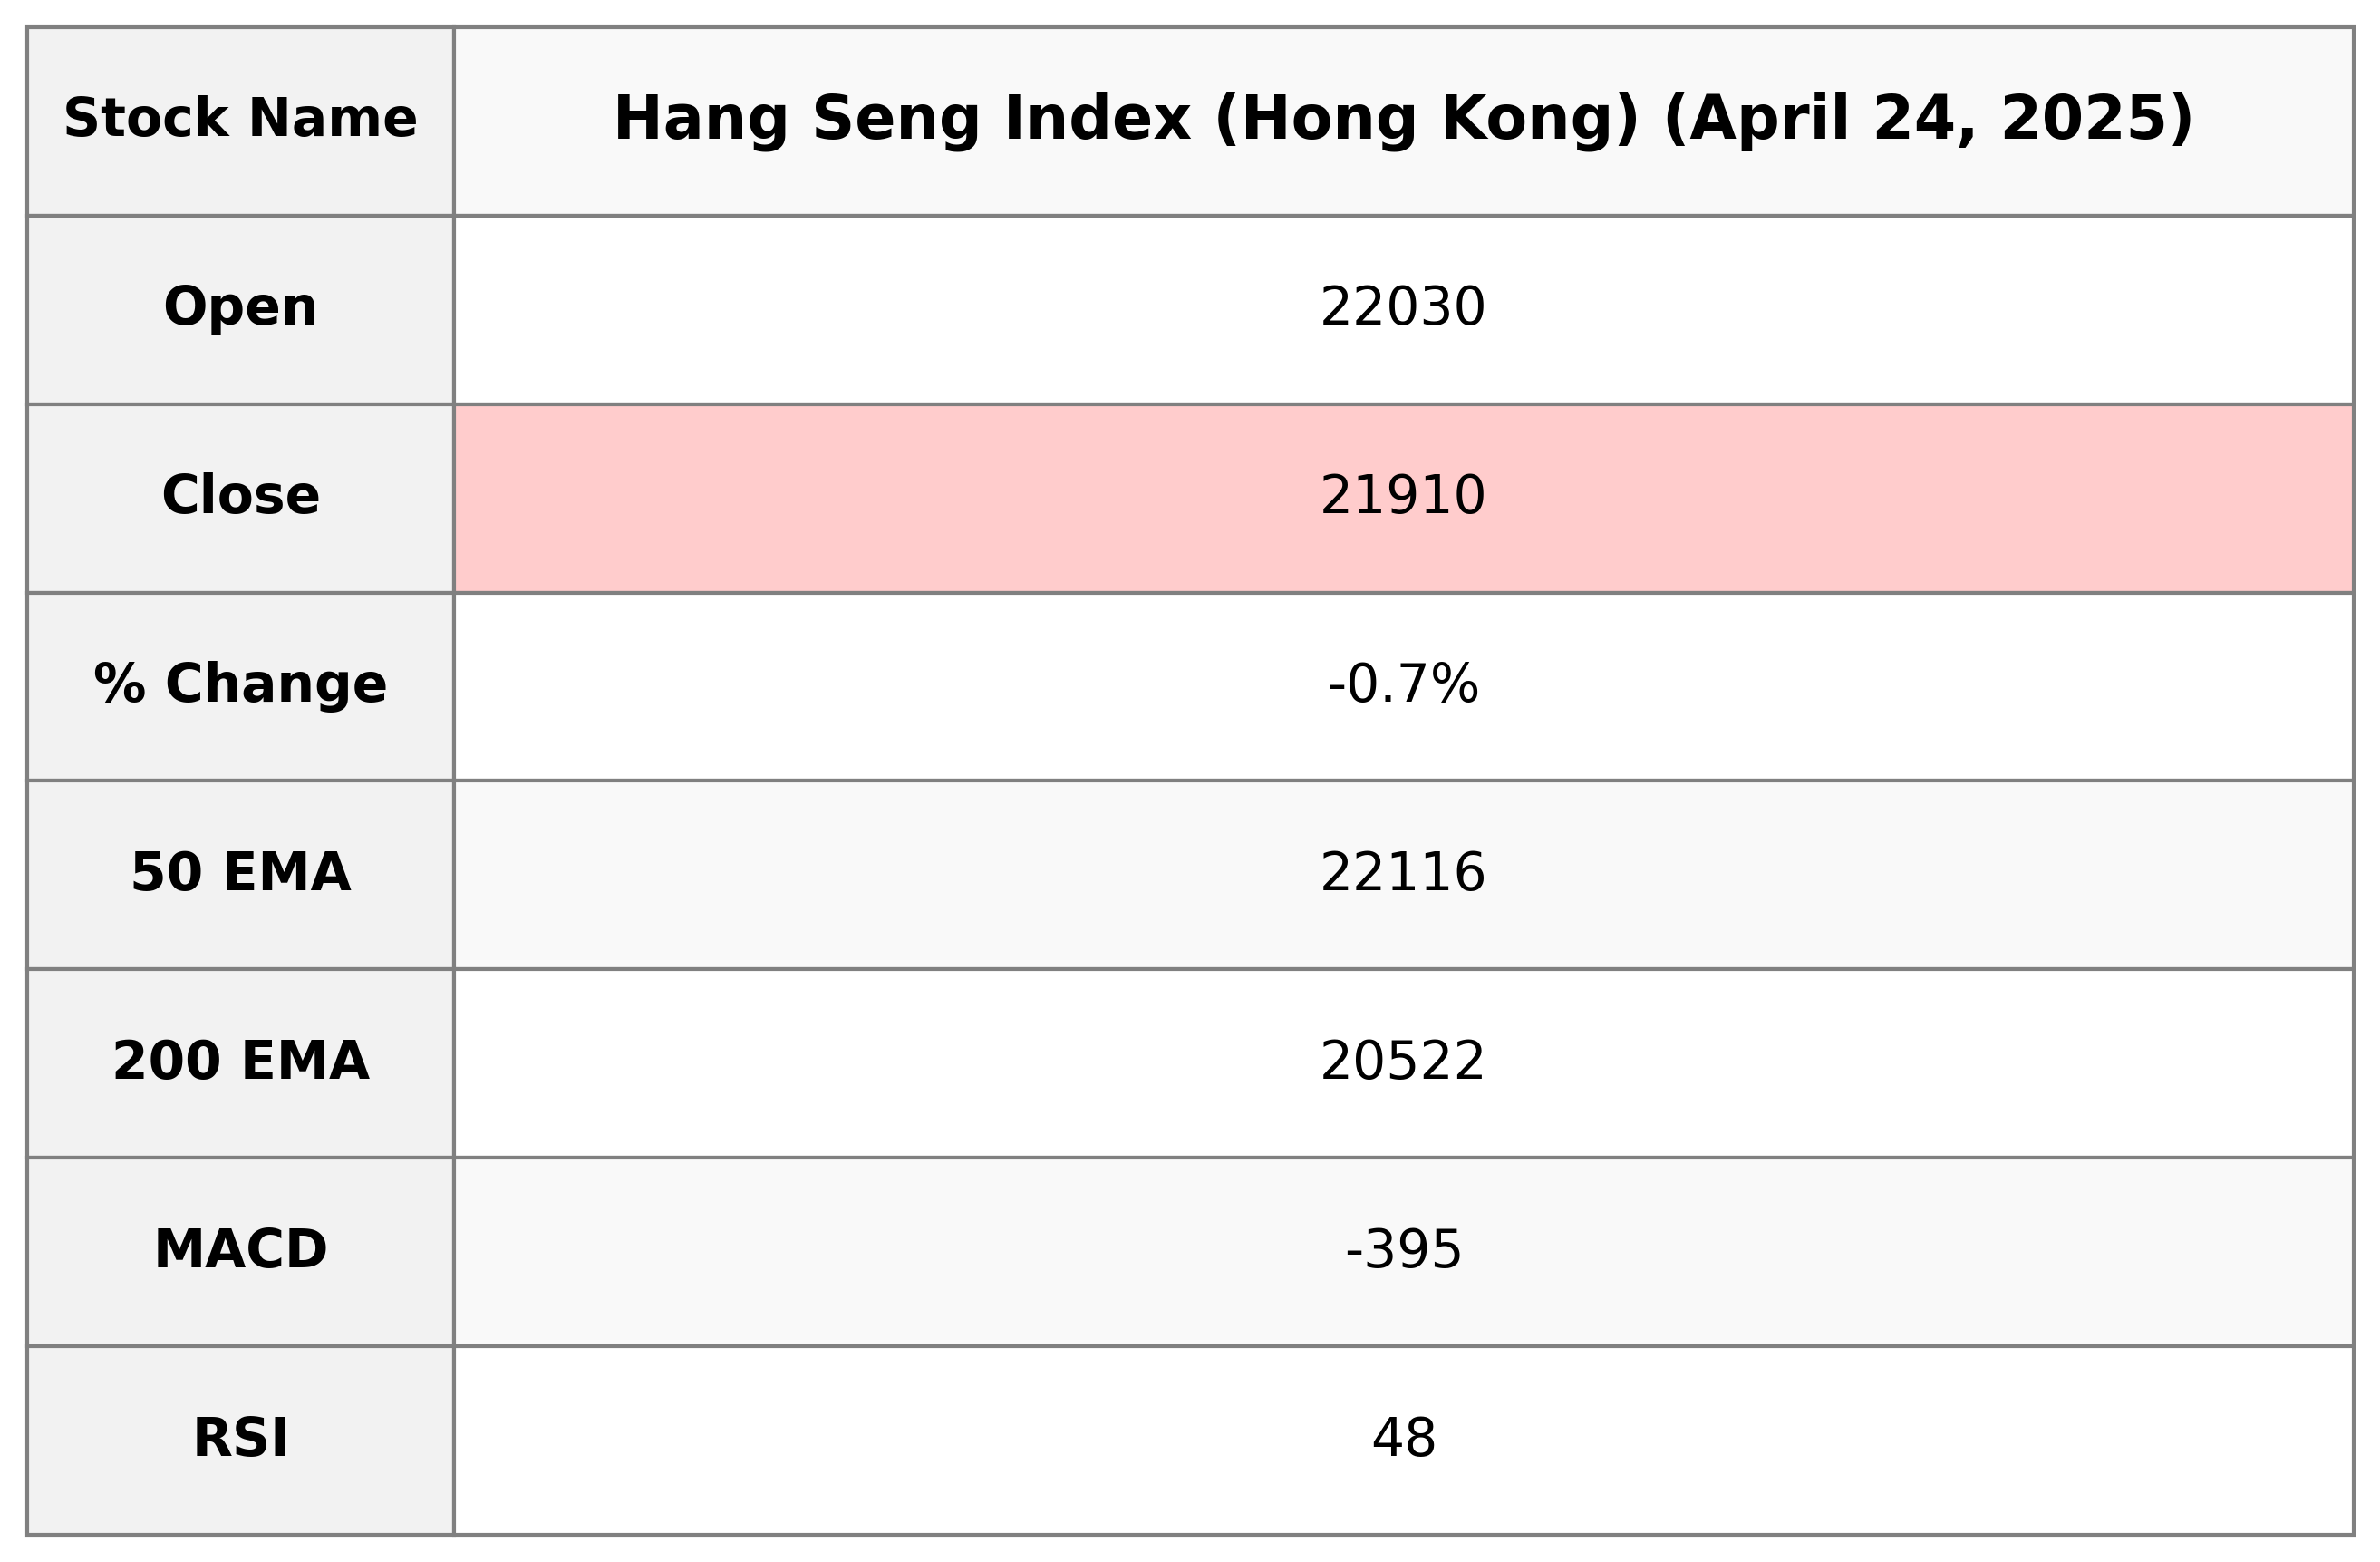
Hang Seng Index (Hong Kong) Performance: The Hang Seng Index opened at 22,030.15 and closed at 21,909.76, reflecting a decrease of approximately 0.74% or a 162.86-point drop from the previous day's close of 22,072.62. The index's performance indicates a slight bearish trend with the RSI reading at 48.27, suggesting the market is in a neutral-to-slightly bearish phase.

Relationship with Key Moving Averages
The Hang Seng Index is trading below its 50-day EMA of 22,116.08, indicating potential short-term weakness. However, it remains above the 200-day EMA of 20,521.98, suggesting a longer-term bullish trend. The close price of 21,909.76 is close to the 20-day EMA of 21,918.98, showing neutrality in the short-term trend.
Moving Averages Trend (MACD)
The MACD for Hang Seng Index is currently -394.74, with a signal line of -459.36, indicating a potential bullish signal as the MACD line is above the signal line. However, both values are negative, suggesting a bearish market trend, but the crossover may indicate a possible upward momentum.

RSI Analysis
The Relative Strength Index (RSI) for Hang Seng Index (Hong Kong) is 48.27, which suggests that the index is in a neutral zone. This indicates that there is no immediate overbought or oversold condition, and the market may not experience any major directional movement based solely on RSI at this time.

Analysis for IBEX 35 (Spain) - April 24, 2025

The IBEX 35 opened at 13,167.80, with a high of 13,241.20 and closed at 13,187.20, marking a slight decrease of -0.16% from the previous close. With a trading volume of 29,887,010, the index's technical indicators show a supportive trend with a 50 EMA above the 200 EMA and a moderate RSI of 56.84, signaling neutral momentum.

Relationship with Key Moving Averages
The closing value of IBEX 35 is 13,187.20, which is above its 50-day EMA of 12,815.37, 10-day EMA of 12,895.18, and 20-day EMA of 12,865.06, indicating a short-term upward trend. However, it is significantly above the 200-day EMA of 12,061.83, suggesting sustained longer-term bullish momentum.
Moving Averages Trend (MACD)
The MACD for IBEX 35 (Spain) shows a bullish indication with a MACD value of 2.04, which is above the signal line of -79.51. This divergence suggests potential upward momentum.

RSI Analysis
The RSI for IBEX 35 is 56.84, indicating that the index is currently in a neutral zone. An RSI in this range suggests that the index is neither overbought nor oversold, with potential for price stability or consolidation.

Analysis for NASDAQ Composite (US) - April 24, 2025

The NASDAQ Composite opened at 16,880.29 and closed at 16,708.05, marking a 2.50% increase from the previous close with a points change of 407.63. The index experienced a high of 17,029.86 and a low of 16,642.66, while trading volume reached 8.56 billion shares. Key technical indicators show an RSI of 47.51 and a MACD of -411.92, signaling a potential change in momentum.

Relationship with Key Moving Averages
The NASDAQ Composite is currently trading below its 50-day and 200-day exponential moving averages, which are 17535.83 and 17969.76 respectively, indicating a bearish trend in the longer term. However, it is slightly above the 10-day EMA and near the 20-day EMA, suggesting potential short-term strength or consolidation.
Moving Averages Trend (MACD)
MACD Analysis for NASDAQ Composite (US): The MACD is currently at -411.92, which is above the MACD Signal line at -473.39, suggesting a potential bullish signal. However, both values being negative indicates that the market may still be experiencing downward pressure overall.

RSI Analysis
The RSI for NASDAQ Composite is 47.51, which indicates that the market is in a neutral zone, neither overbought nor oversold. This suggests no strong momentum in either direction at the moment.

Analysis for Nikkei 225 (Japan) - April 24, 2025

Nikkei 225 opened at 35194.71 and closed at 35039.15, reflecting a positive change of 0.49% from the previous close of 34868.63, with an increase of 170.52 points. The RSI is close to neutral at 49.68, indicating a balanced market sentiment.
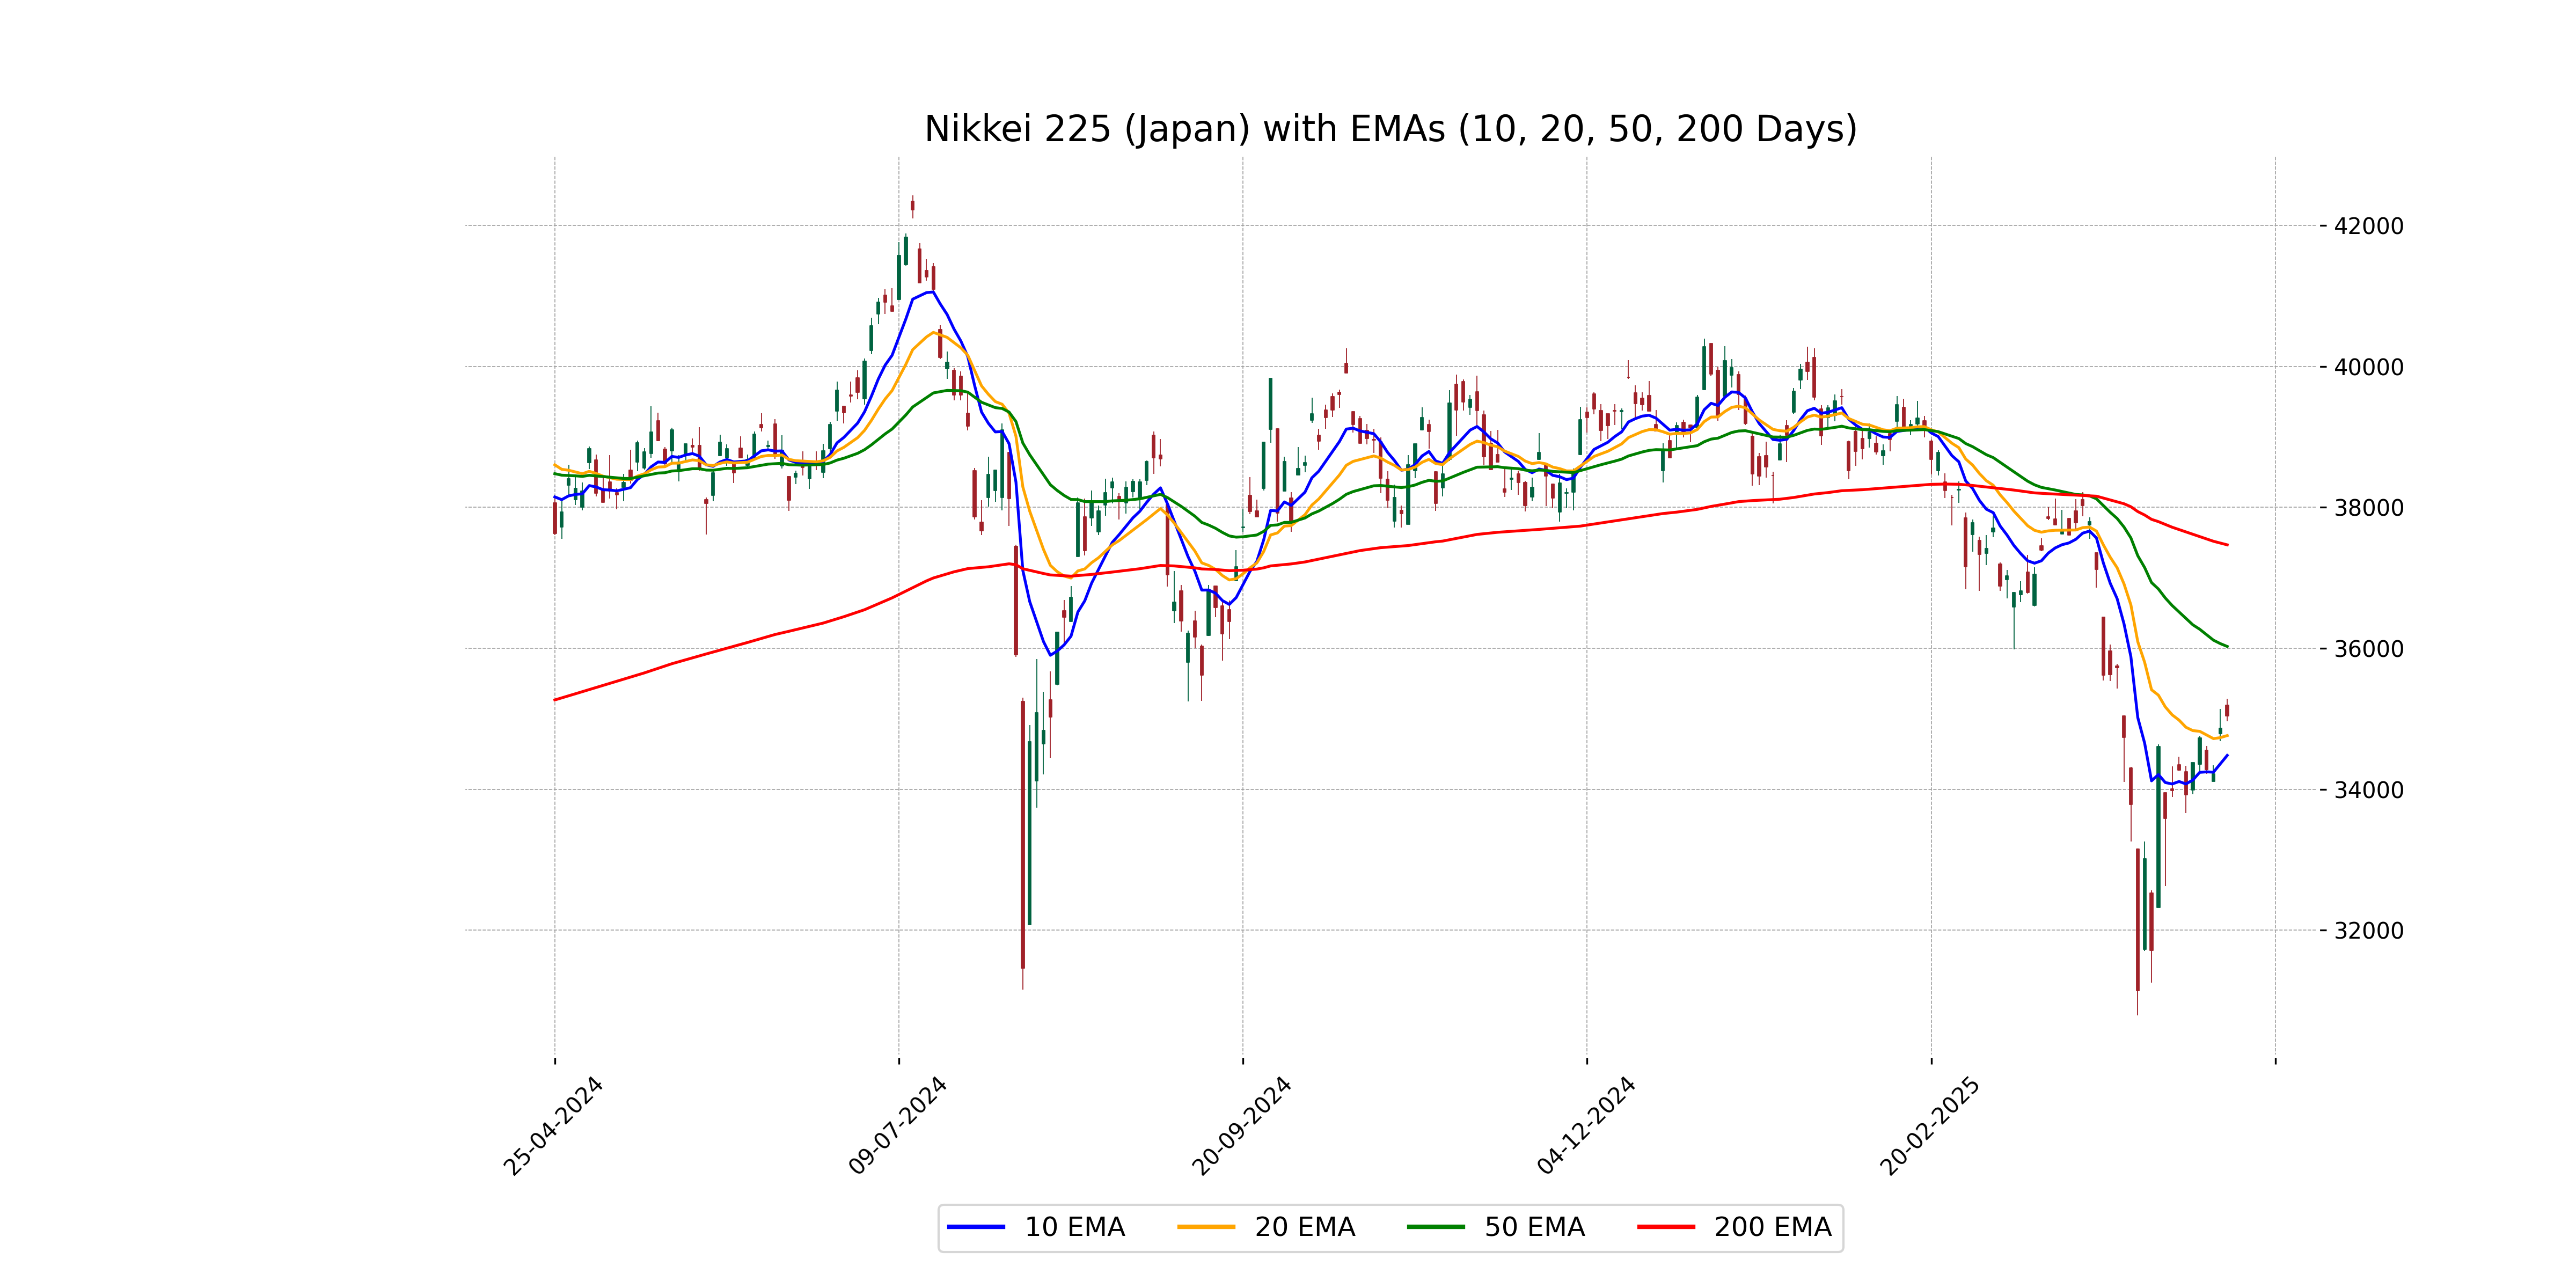
Relationship with Key Moving Averages
The Nikkei 225 is currently trading below its 50-day EMA of 36026.27 and its 200-day EMA of 37468.58, indicating a potential bearish trend. However, it remains above its 10-day EMA of 34480.10 and 20-day EMA of 34761.63, suggesting short-term positive momentum.
Moving Averages Trend (MACD)
Nikkei 225 (Japan) MACD Analysis: The MACD value is -552.70, which is above the MACD Signal value of -810.20, indicating a potential bullish trend reversal. However, it's important to consider other indicators for a comprehensive analysis as the MACD is still in the negative region.

RSI Analysis
Nikkei 225 RSI Analysis: The RSI for Nikkei 225 is currently at 49.68, which indicates a neutral trend as it is close to the midpoint of the RSI scale. This suggests that the market is neither in an overbought nor oversold condition, hinting at a period of consolidation or balance between buying and selling pressures.

Analysis for Nifty Bank - April 24, 2025
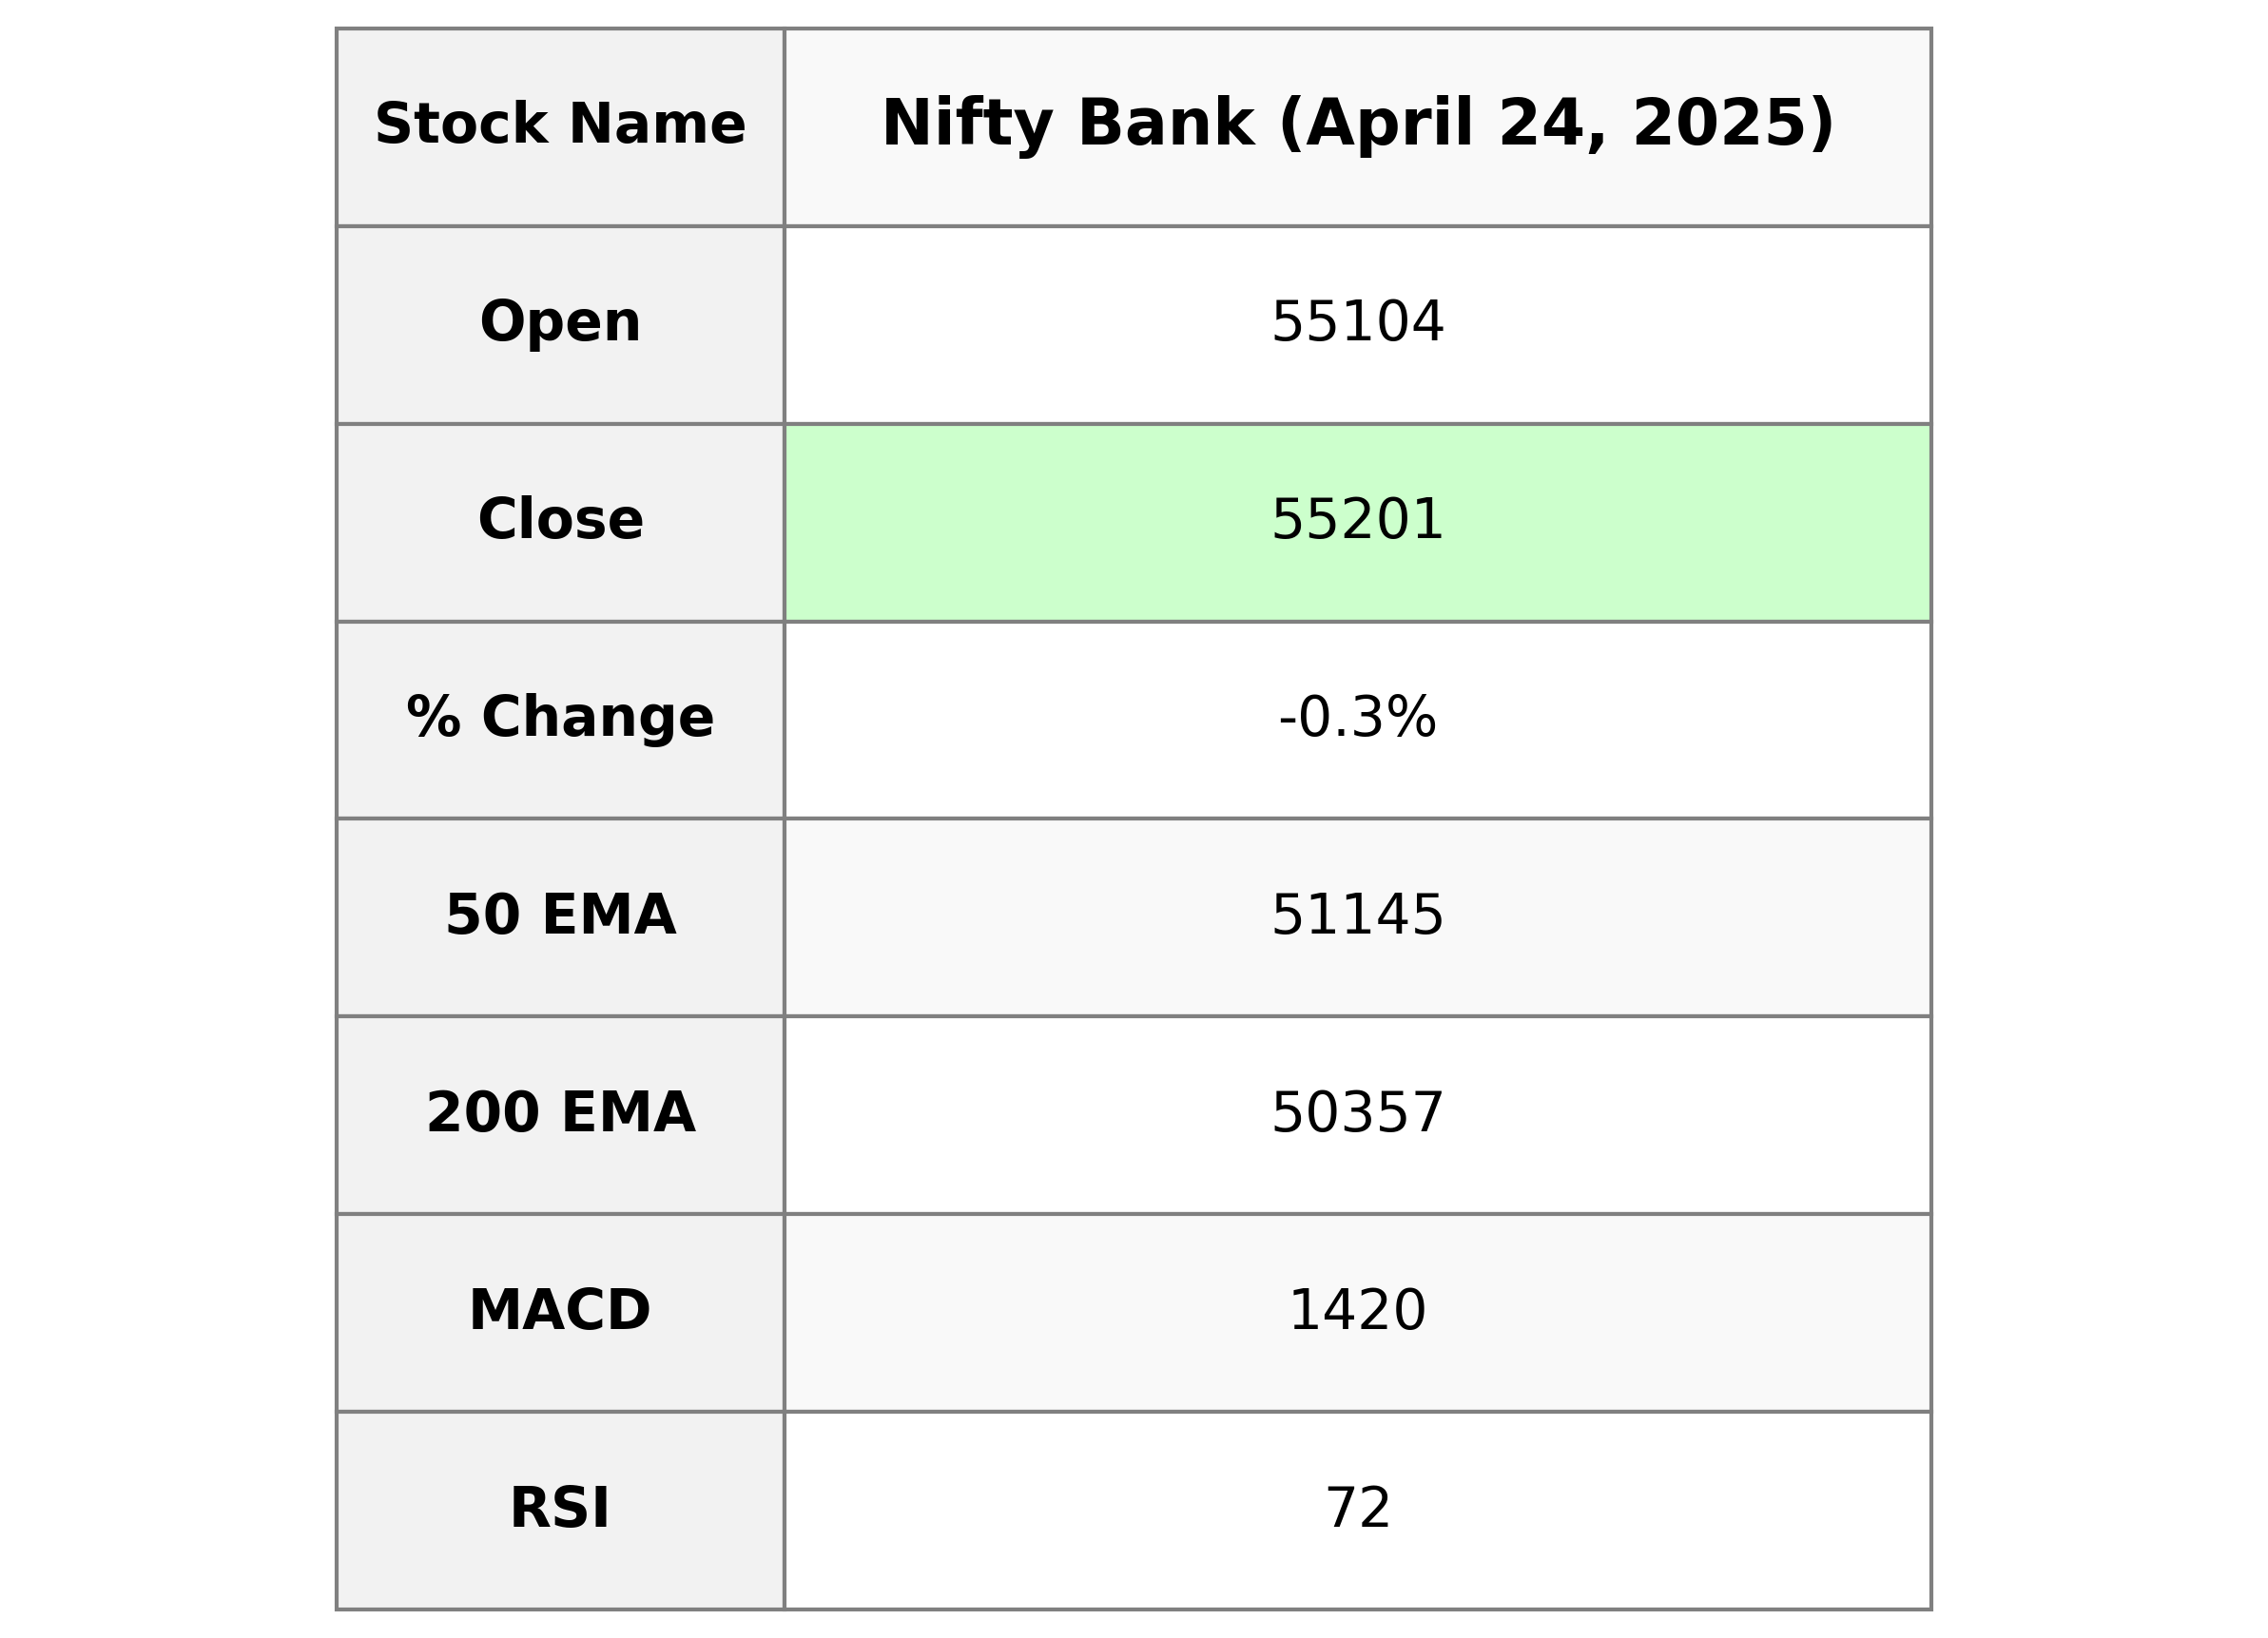
Nifty Bank opened at 55,103.90 and closed at 55,201.40, experiencing a slight decline with a -0.30% change and a points change of -168.65 from the previous close of 55,370.05. The index shows strong momentum with an RSI of 72.24 and a positive MACD discrepancy of 409.30, indicating a bullish trend.

Relationship with Key Moving Averages
For Nifty Bank, the close price of 55,201.40 is above the 50 EMA (51,144.83) and 200 EMA (50,357.17), indicating a strong uptrend. Additionally, it is above the 10 EMA (53,830.05) and 20 EMA (52,573.95), suggesting short-term bullish momentum.
Moving Averages Trend (MACD)
Given the stock data for Nifty Bank, the MACD (Moving Average Convergence Divergence) value is 1420.32, indicating a potential bullish trend as it is higher than the MACD Signal line, which is 1011.01. This suggests that the stock might be experiencing upward momentum.

RSI Analysis
Nifty Bank RSI Analysis: The Relative Strength Index (RSI) for Nifty Bank stands at 72.24, indicating an overbought condition. Typically, an RSI above 70 suggests that the stock might be overvalued and could be due for a price correction. However, further analysis is recommended as part of a comprehensive trading strategy.

Analysis for Nifty 50 - April 24, 2025

The Nifty 50 index opened at 24,277.90, with a high of 24,347.85 and a low of 24,216.15, before closing at 24,246.70, marking a decrease of 0.34% or 82.25 points from the previous close of 24,328.95. Despite the decline, the relative strength index (RSI) is at a healthy 65.85, indicating positive momentum, supported by a significant MACD value of 309.20 compared to its signal line at 164.17.

Relationship with Key Moving Averages
Nifty 50's current close of 24,246.70 is above its 50 EMA of 23,254.81 and 200 EMA of 23,405.03, indicating a bullish trend. However, it is below its 10 EMA of 23,754.23 and 20 EMA of 23,454.63, suggesting short-term bearish pressure. With an RSI of 65.85, Nifty 50 is near overbought territory.
Moving Averages Trend (MACD)
The Nifty 50 demonstrates a bullish trend as indicated by a positive MACD value of 309.20, which is above its signal line at 164.17. This suggests potential upward momentum, although investors should consider the RSI of 65.85, which is approaching overbought territory.

RSI Analysis
The RSI for Nifty 50 is 65.85, which suggests that the index is approaching the overbought territory but is not quite there yet. A reading above 70 is generally considered overbought, indicating potential for a price pullback, while the current RSI indicates moderate momentum.

Up Next
Global stock market indices: How the world markets performed today - 24 April 2025

Honda Activa 6G: Everything You Need to Know Before Buying

How much does a ULIP plan really cost? A break-down of all charges

Centre plans to borrow Rs 8.20 lakh cr from market in first half of FY27

Reliance denies buying Iranian oil amid US sanctions waiver

Premium petrol price up Rs 2, industrial diesel up Rs 22; no change in normal petrol, diesel rates

More videos

India's GDP expected to register over 8 pc growth in Sep-Dec: Report

Govt announces seven measures to help boost exports

RBI keeps interest rates on hold after US trade deal boosts outlook

RBI proposes to compensate customers up to Rs 25,000 loss due to fraud

RBI raises GDP growth projection of Q1, Q2 of FY27

RBI pauses rate cuts, retains interest rate at 5.25 pc

Rupee jumps 122 paise to close at 90.27 against US dollar on India-US trade deal

Stock markets cheer India-US trade deal: Sensex, Nifty surge 2.5 pc

UPI transactions hit record high of Rs 230 lakh crore in 2025-26 till Dec: Govt

Explained: India-US trade deal, tariffs and trade benefits