


Highlights
Latest news

Indian cricket prodigy Vaibhav Suryavanshi honoured with 'Pradhan Mantri Rashtriya Bal Puraskar'

AAP Gujarat chief Isudan Gadhvi calls BJP allegations against MLA Chaitar Vasava as politically driven

Aditya Dhar's 'Dhurandhar' earns over Rs 1000 crore at box office

Australia lead England by 46 after 20 wickets fall on crazy day at MCG

Delhi HC asks Centre to respond on plea seeking GST cut on air purifiers amid worsening air quality

Congress pays tribute to former PM Manmohan Singh on first death anniversary

Ruled out of last two Ashes Tests, Cummins sets sights on T20 World Cup in Feb

CEO among three held for gangrape of woman IT firm manager in Udaipur
Global Stock Market Indices: How the World Markets performed today - (April 18, 2025)?


?")
The international stock market indices showed varied performances on April 18, 2025, reflecting the economic sentiment across different regions.
In this article, we analyze the performance of key global indices including the S&P 500, Dow Jones Industrial Average, NASDAQ Composite, FTSE 100, DAX, CAC 40, IBEX 35, Nikkei 225, Hang Seng, Nifty 50, and BSE Sensex.

Analysis for Sensex - April 18, 2025

The Sensex opened at 76,968.02 and closed at 78,553.20, marking a percentage change of 1.96% with a points change of 1,508.91. The high for the day was 78,616.77, while the low was 76,665.77. The Relative Strength Index (RSI) is at 62.90, indicating a slightly overbought condition. Additionally, the Moving Average Convergence Divergence (MACD) shows a strong bullish sentiment with a value of 251.77, well above the signal line of 50.84.
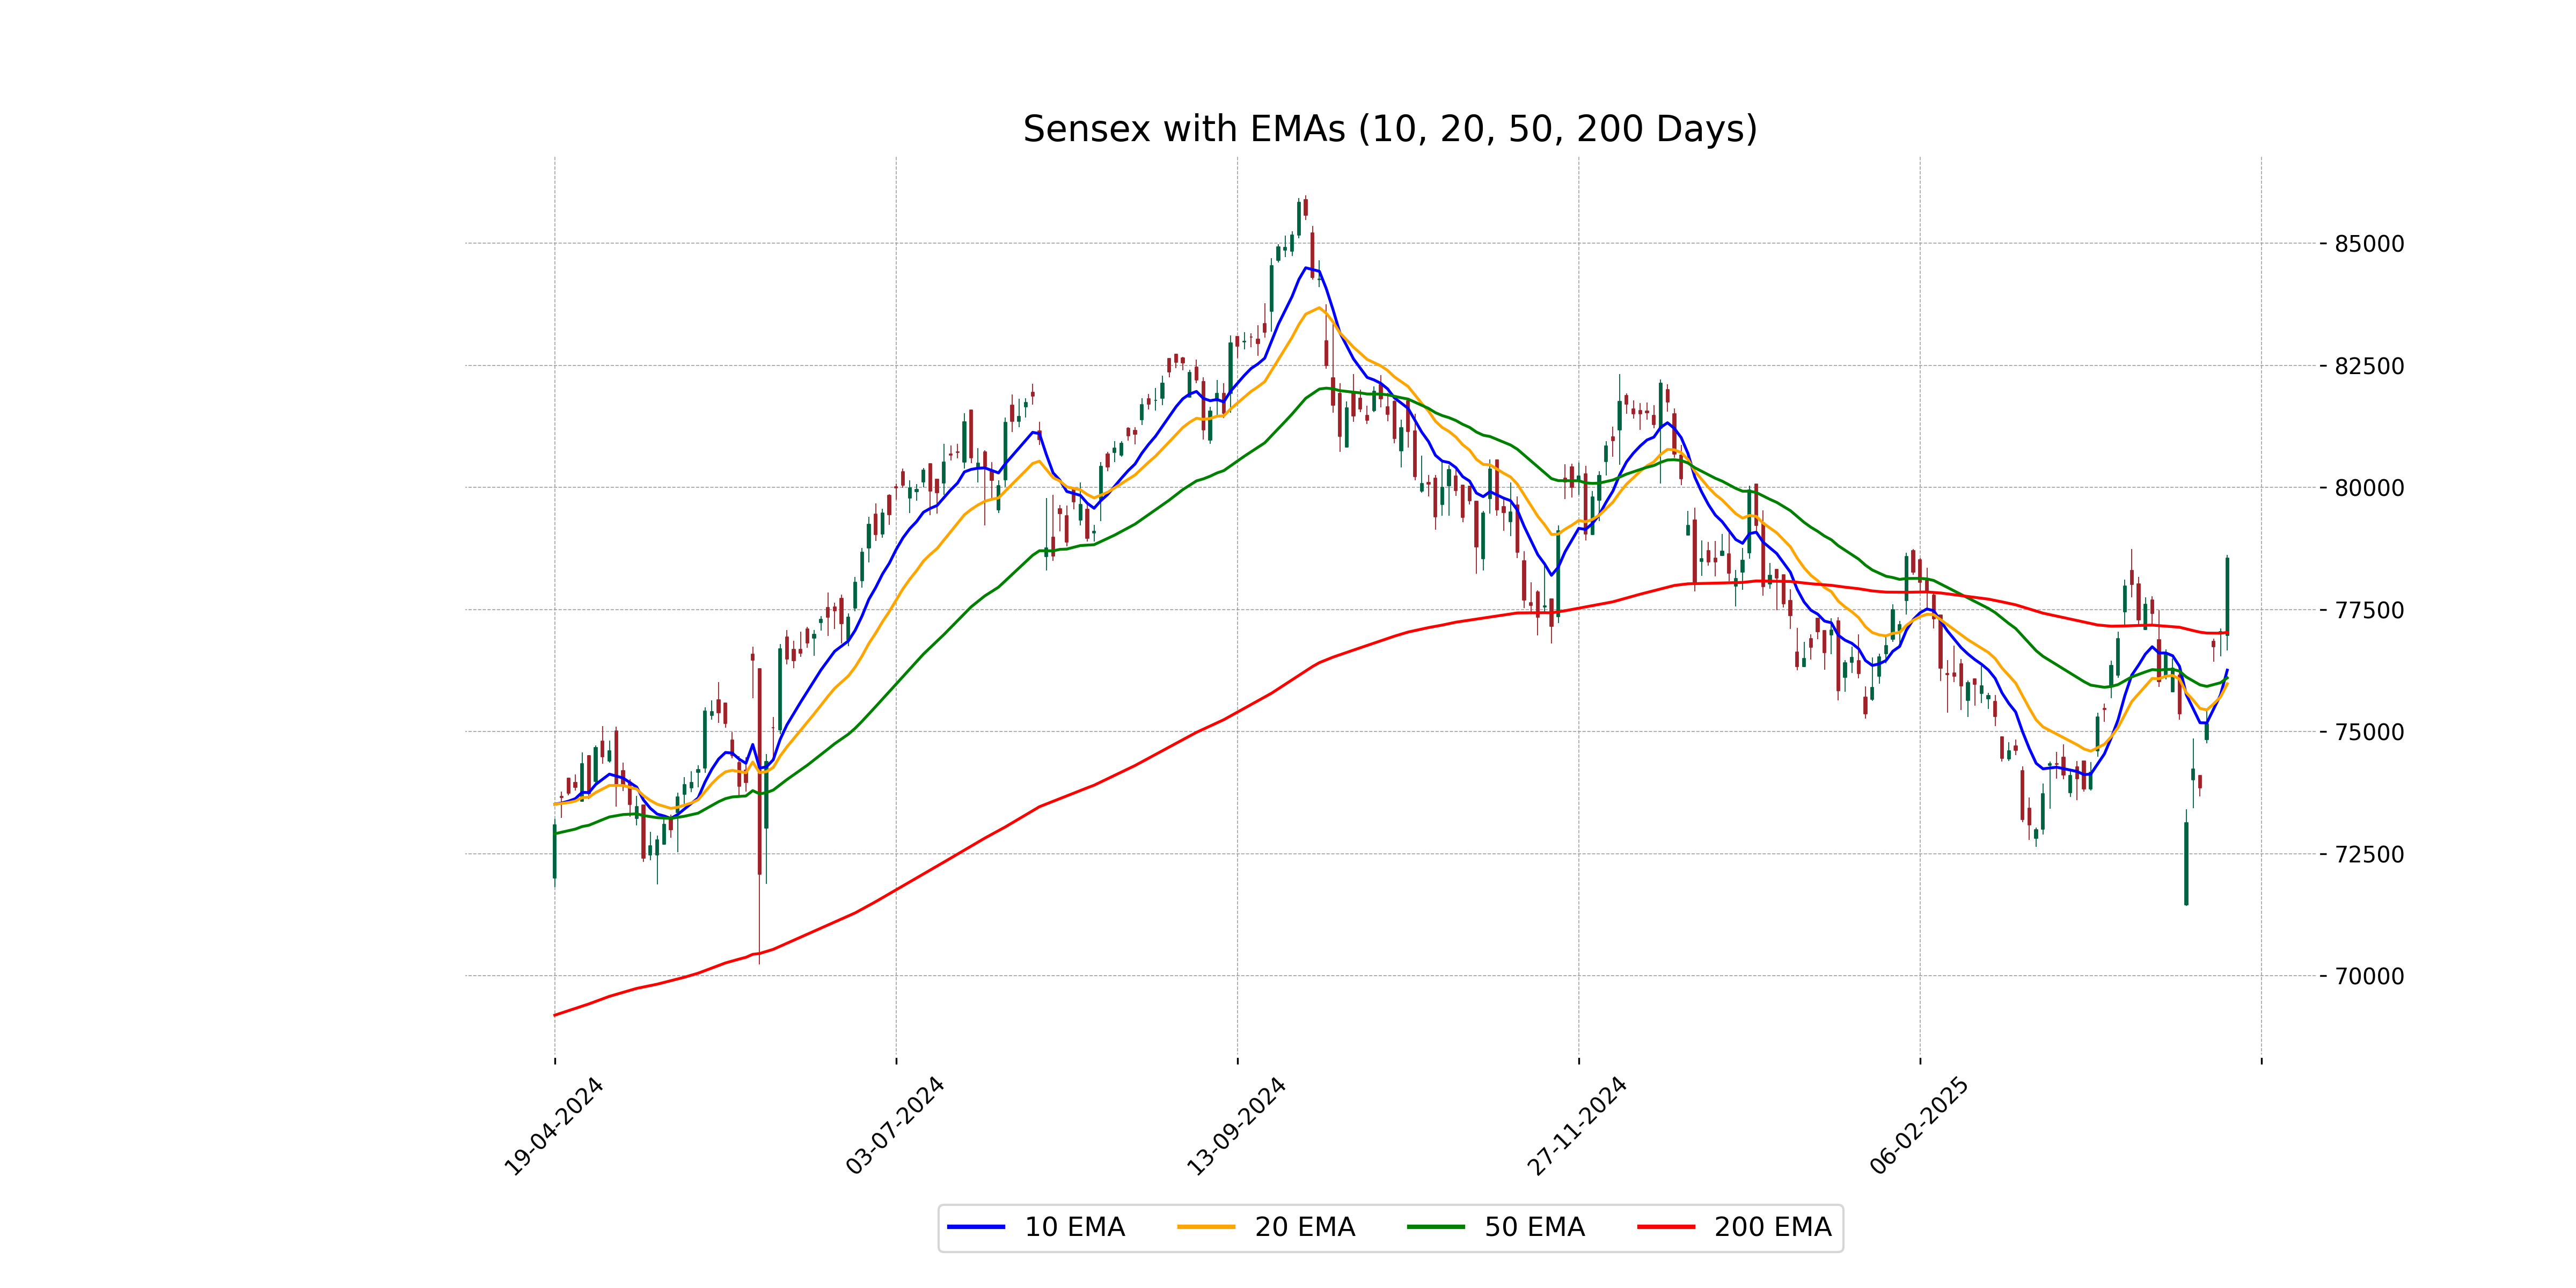
Relationship with Key Moving Averages
The Sensex closed at 78,553.20, which is above its 50-day EMA of 76,099.42, 200-day EMA of 77,029.84, 10-day EMA of 76,257.95, and 20-day EMA of 75,978.29. This suggests a bullish trend as the current close is higher than all key moving averages, indicating potential upward momentum.
Moving Averages Trend (MACD)
The MACD for Sensex is significantly above the MACD Signal at 251.77 versus 50.83, indicating a strong bullish momentum. This suggests that the recent price trend is likely positive, possibly attracting more buying interest.

RSI Analysis
The RSI for Sensex is currently at 62.90, which suggests that the index is in a neutral to slightly bullish territory. An RSI above 70 typically indicates overbought conditions, while below 30 indicates oversold conditions. Since the RSI is below the overbought level, the Sensex is not yet considered overbought and could potentially have room for upward momentum.

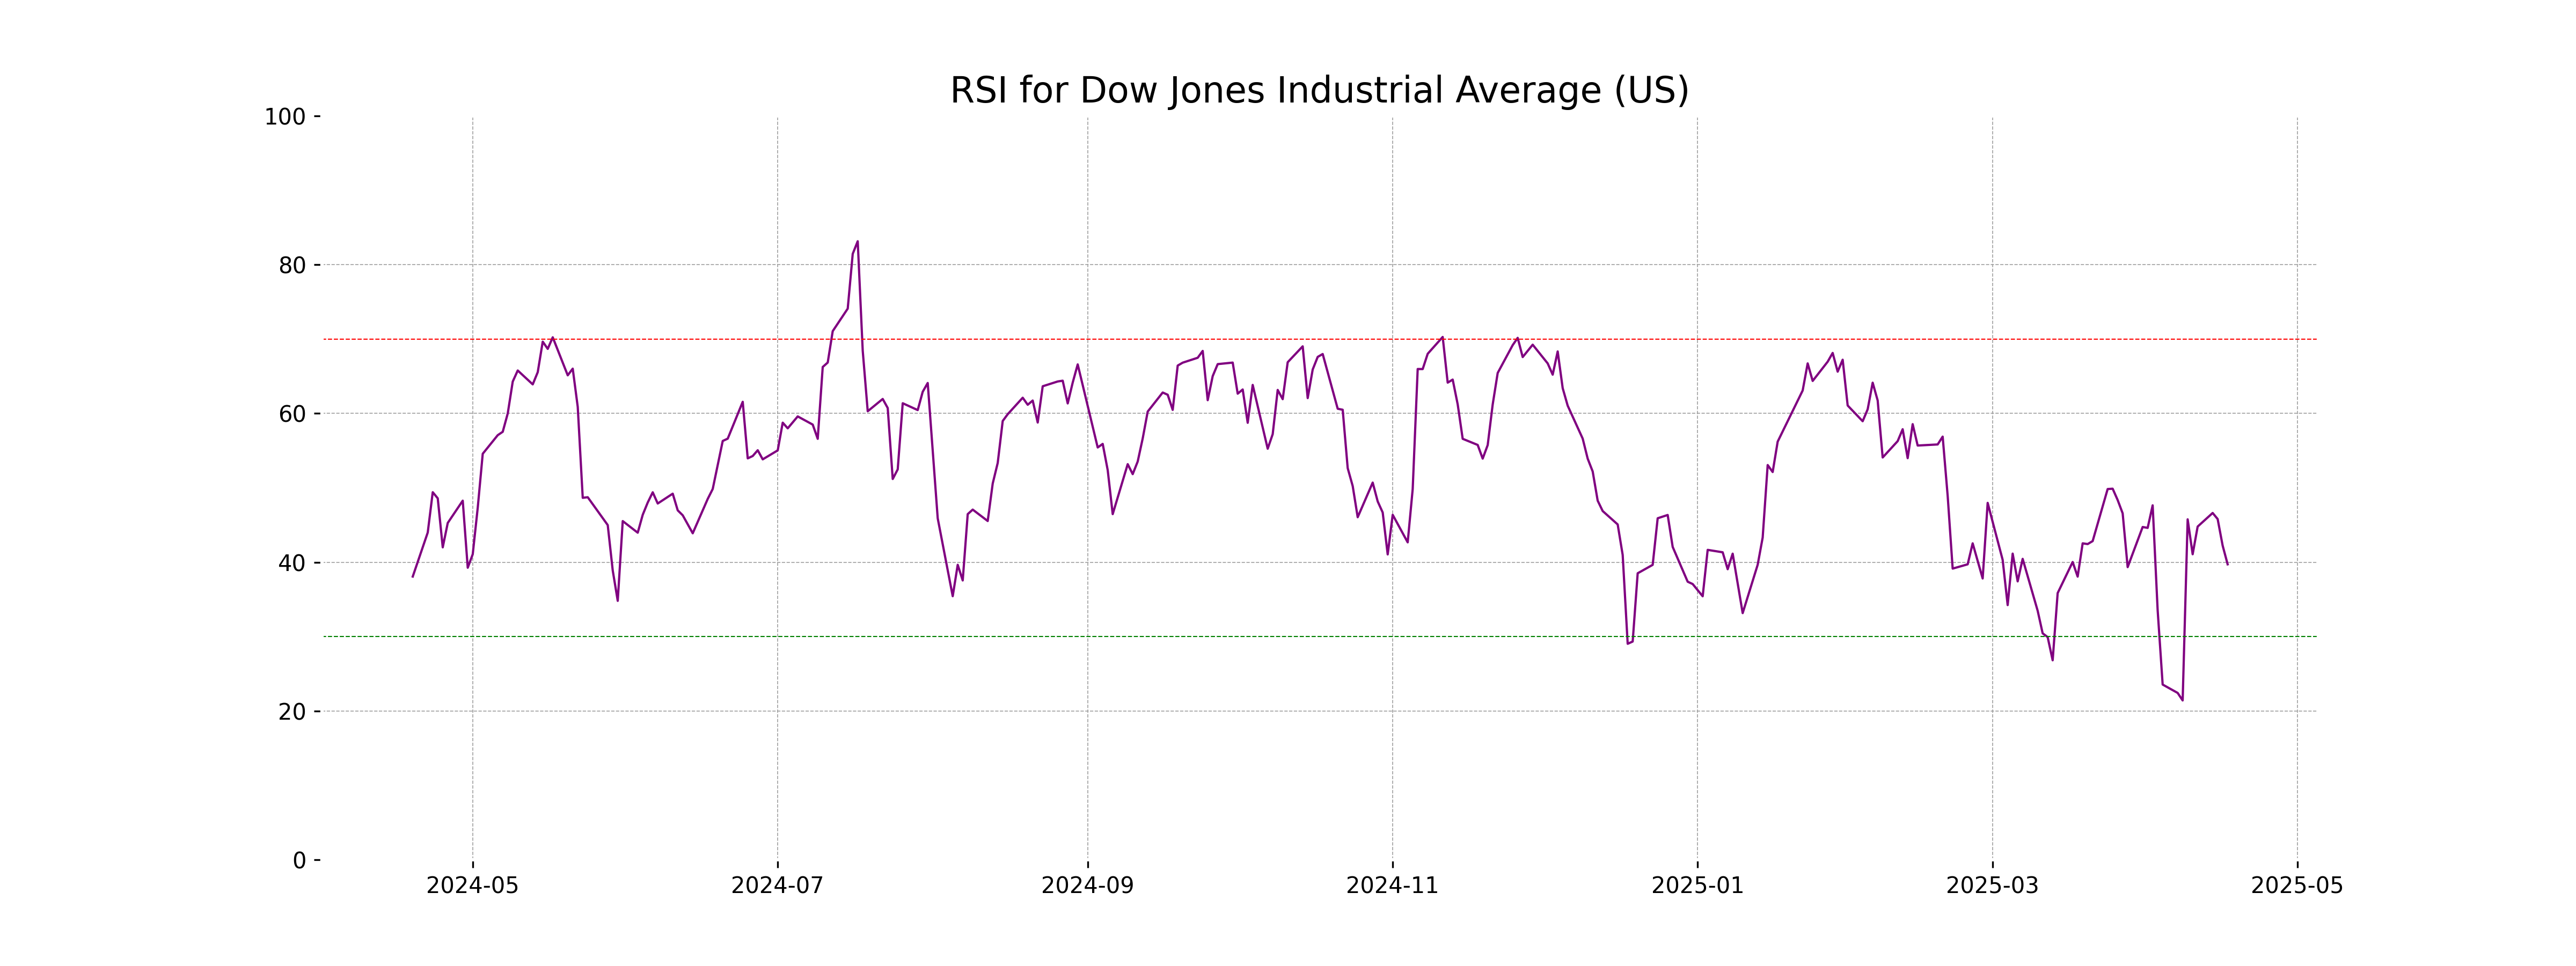
Analysis for Dow Jones Industrial Average (US) - April 18, 2025

The Dow Jones Industrial Average (US) opened and reached its high at 39,745.58, while the low was 38,950.31 before closing at 39,142.23. The index experienced a decrease of -1.33% from the previous close, with a points change of -527.16. Notable technical indicators include a lower 10-day EMA at 39,929.92, while RSI is at a bearish 39.72, suggesting negative momentum.

Relationship with Key Moving Averages
The Dow Jones Industrial Average is currently below its key moving averages, with its close at 39,142.23, under the 50-day EMA of 41,626.41 and the 200-day EMA of 41,757.47. This indicates a bearish trend in the short to medium term.
Moving Averages Trend (MACD)
The MACD value for the Dow Jones Industrial Average (US) is -747.67, which, compared to the MACD Signal of -748.33, indicates a slightly bullish crossover, as the MACD line is marginally above the Signal line. However, since both values are negative, it suggests that the index is experiencing a bearish momentum overall.

RSI Analysis
RSI Analysis for Dow Jones Industrial Average: The RSI value of 39.72 indicates that the Dow Jones Industrial Average is approaching the oversold territory, suggesting potential buying opportunities if the RSI continues to decline below 30. Traders should monitor for any changes in trend or momentum to anticipate possible reversals.
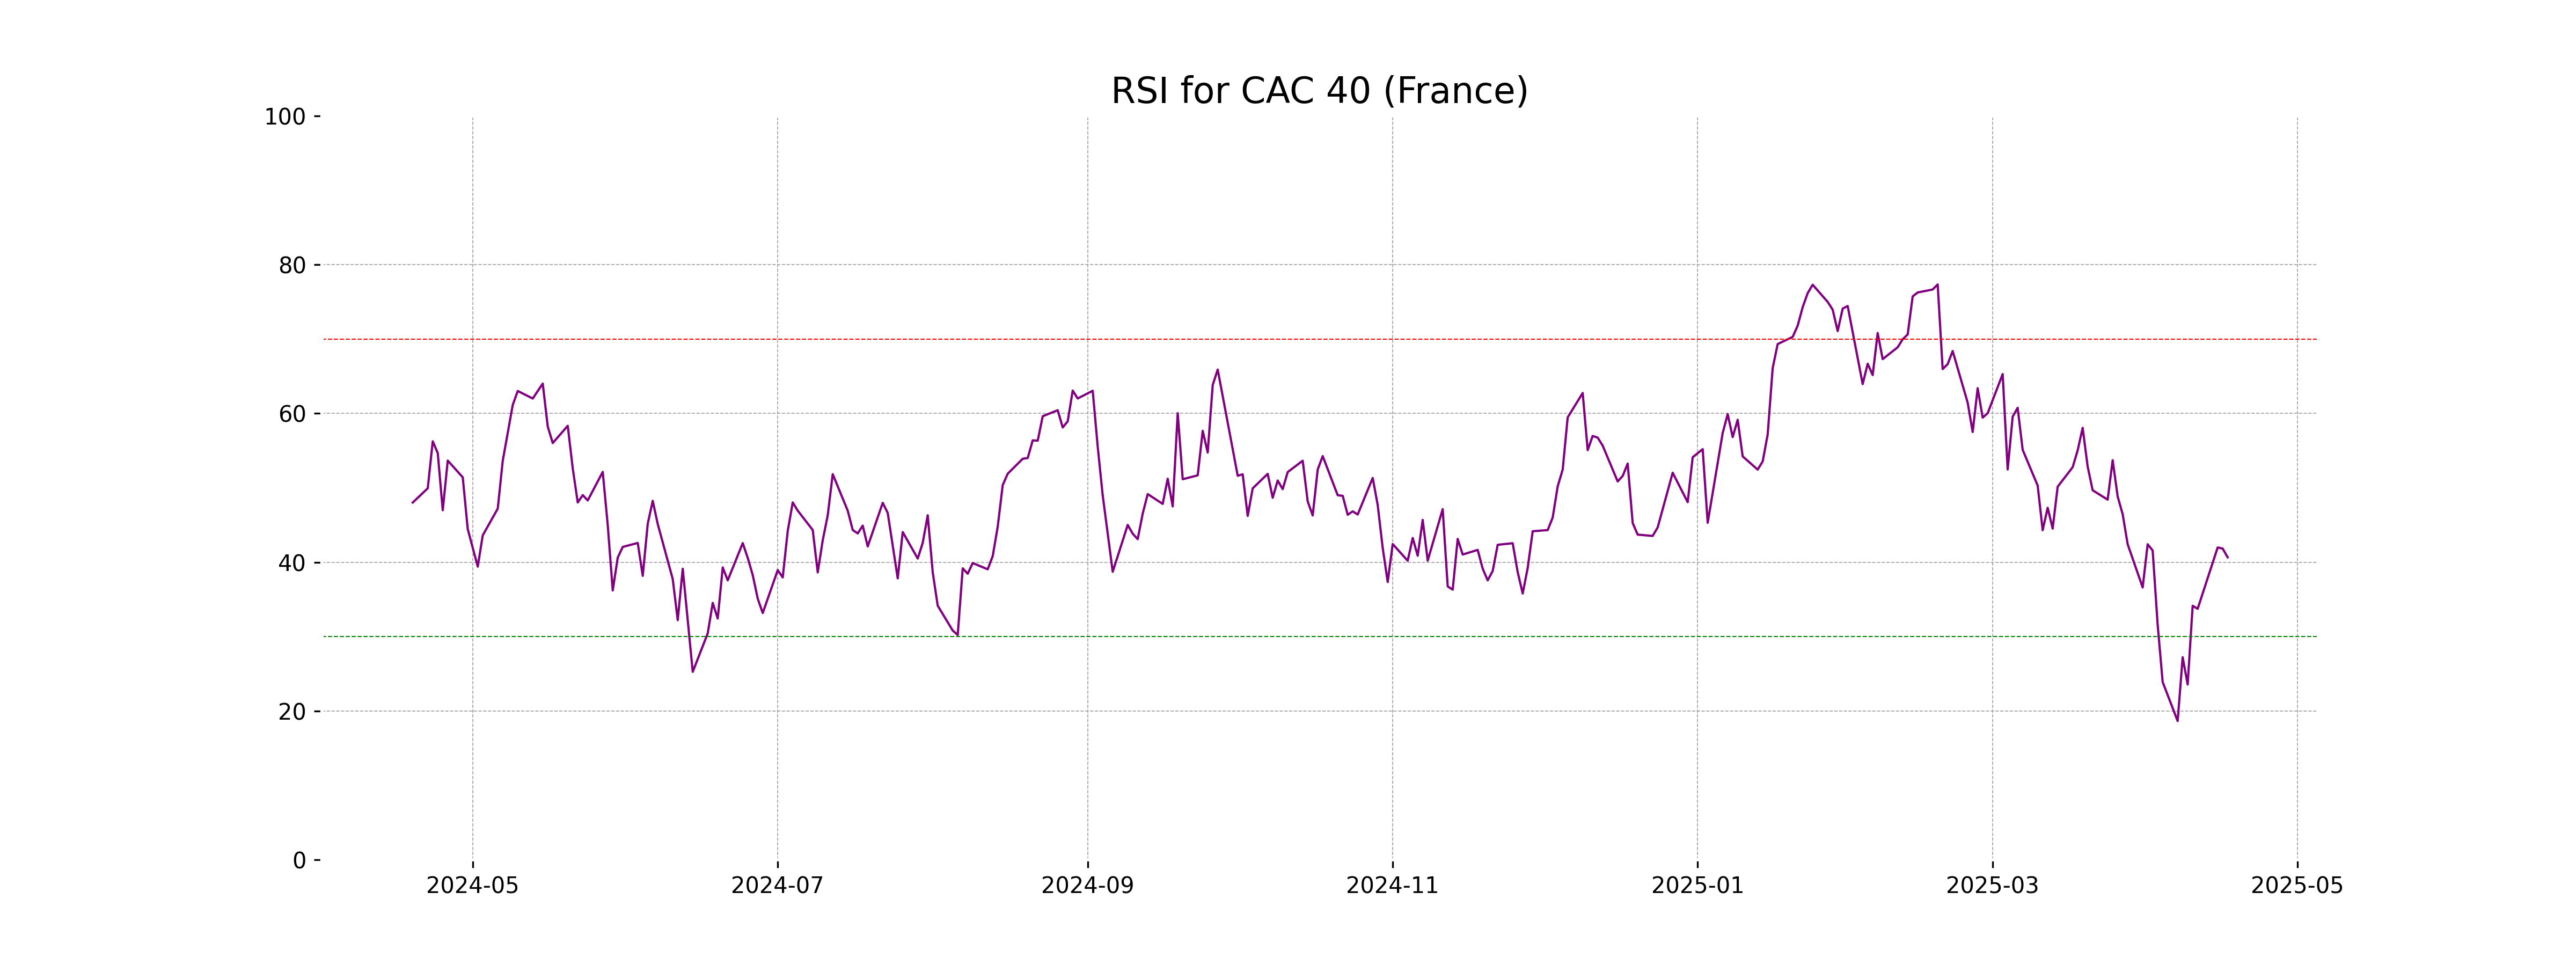
Analysis for CAC 40 (France) - April 18, 2025

The CAC 40 index in France opened at 7311.91 and closed slightly lower at 7285.86, with a points drop of 44.11 and a percentage change of -0.60%. The index experienced a day's high of 7331.64 and a low of 7257.77, while technical indicators show a bearish trend with an RSI of 40.66, a MACD of -207.28, and a MACD Signal of -202.50. The 10 EMA (7307.20) is below the 50 EMA (7683.58) and 200 EMA (7658.62), indicating a short-term downtrend.
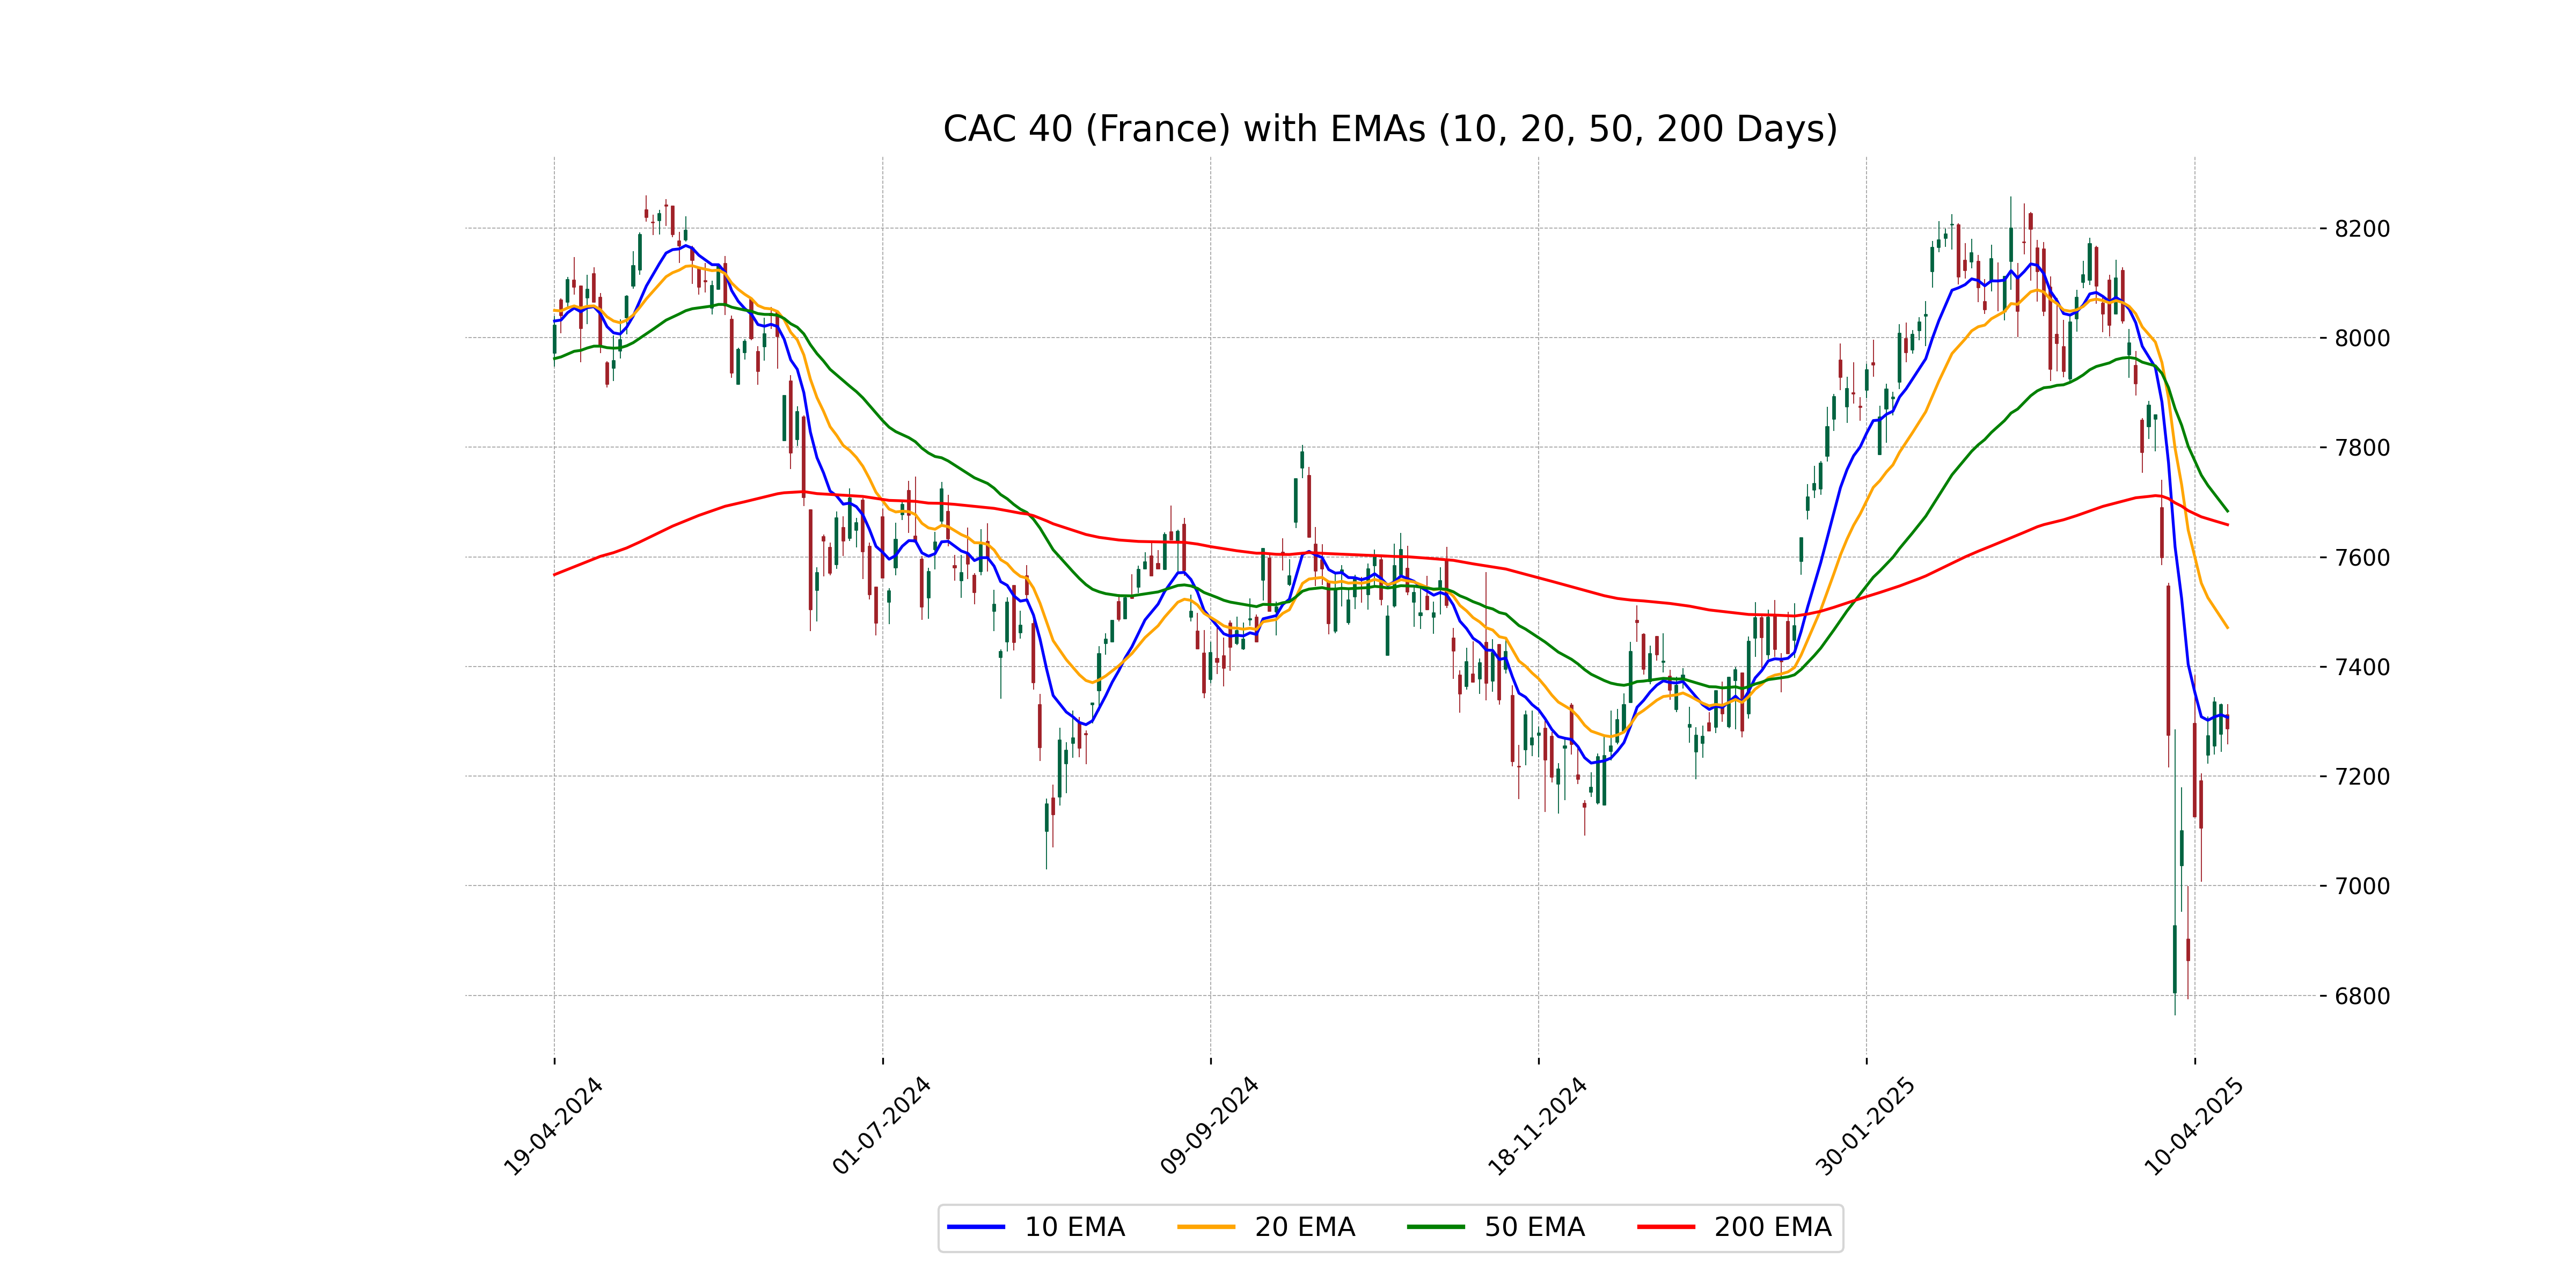
Relationship with Key Moving Averages
The CAC 40 index is currently trading below its key moving averages, with a close of 7285.86 compared to the 10 EMA of 7307.20, the 50 EMA of 7683.58, and the 200 EMA of 7658.62. This positioning suggests a bearish trend in the short to medium term.
Moving Averages Trend (MACD)
The MACD for CAC 40 (France) is currently at -207.28, which is slightly below the MACD Signal line at -202.50. This suggests a bearish momentum as the MACD line is below the signal line, indicating potential for a continued decrease in price.

RSI Analysis
The RSI for CAC 40 (France) is 40.66, which indicates it is in the lower range of the RSI scale. This suggests that the index is not currently overbought and may be closer to oversold levels, typically signaling potential undervaluation or weakness in the recent price movements.
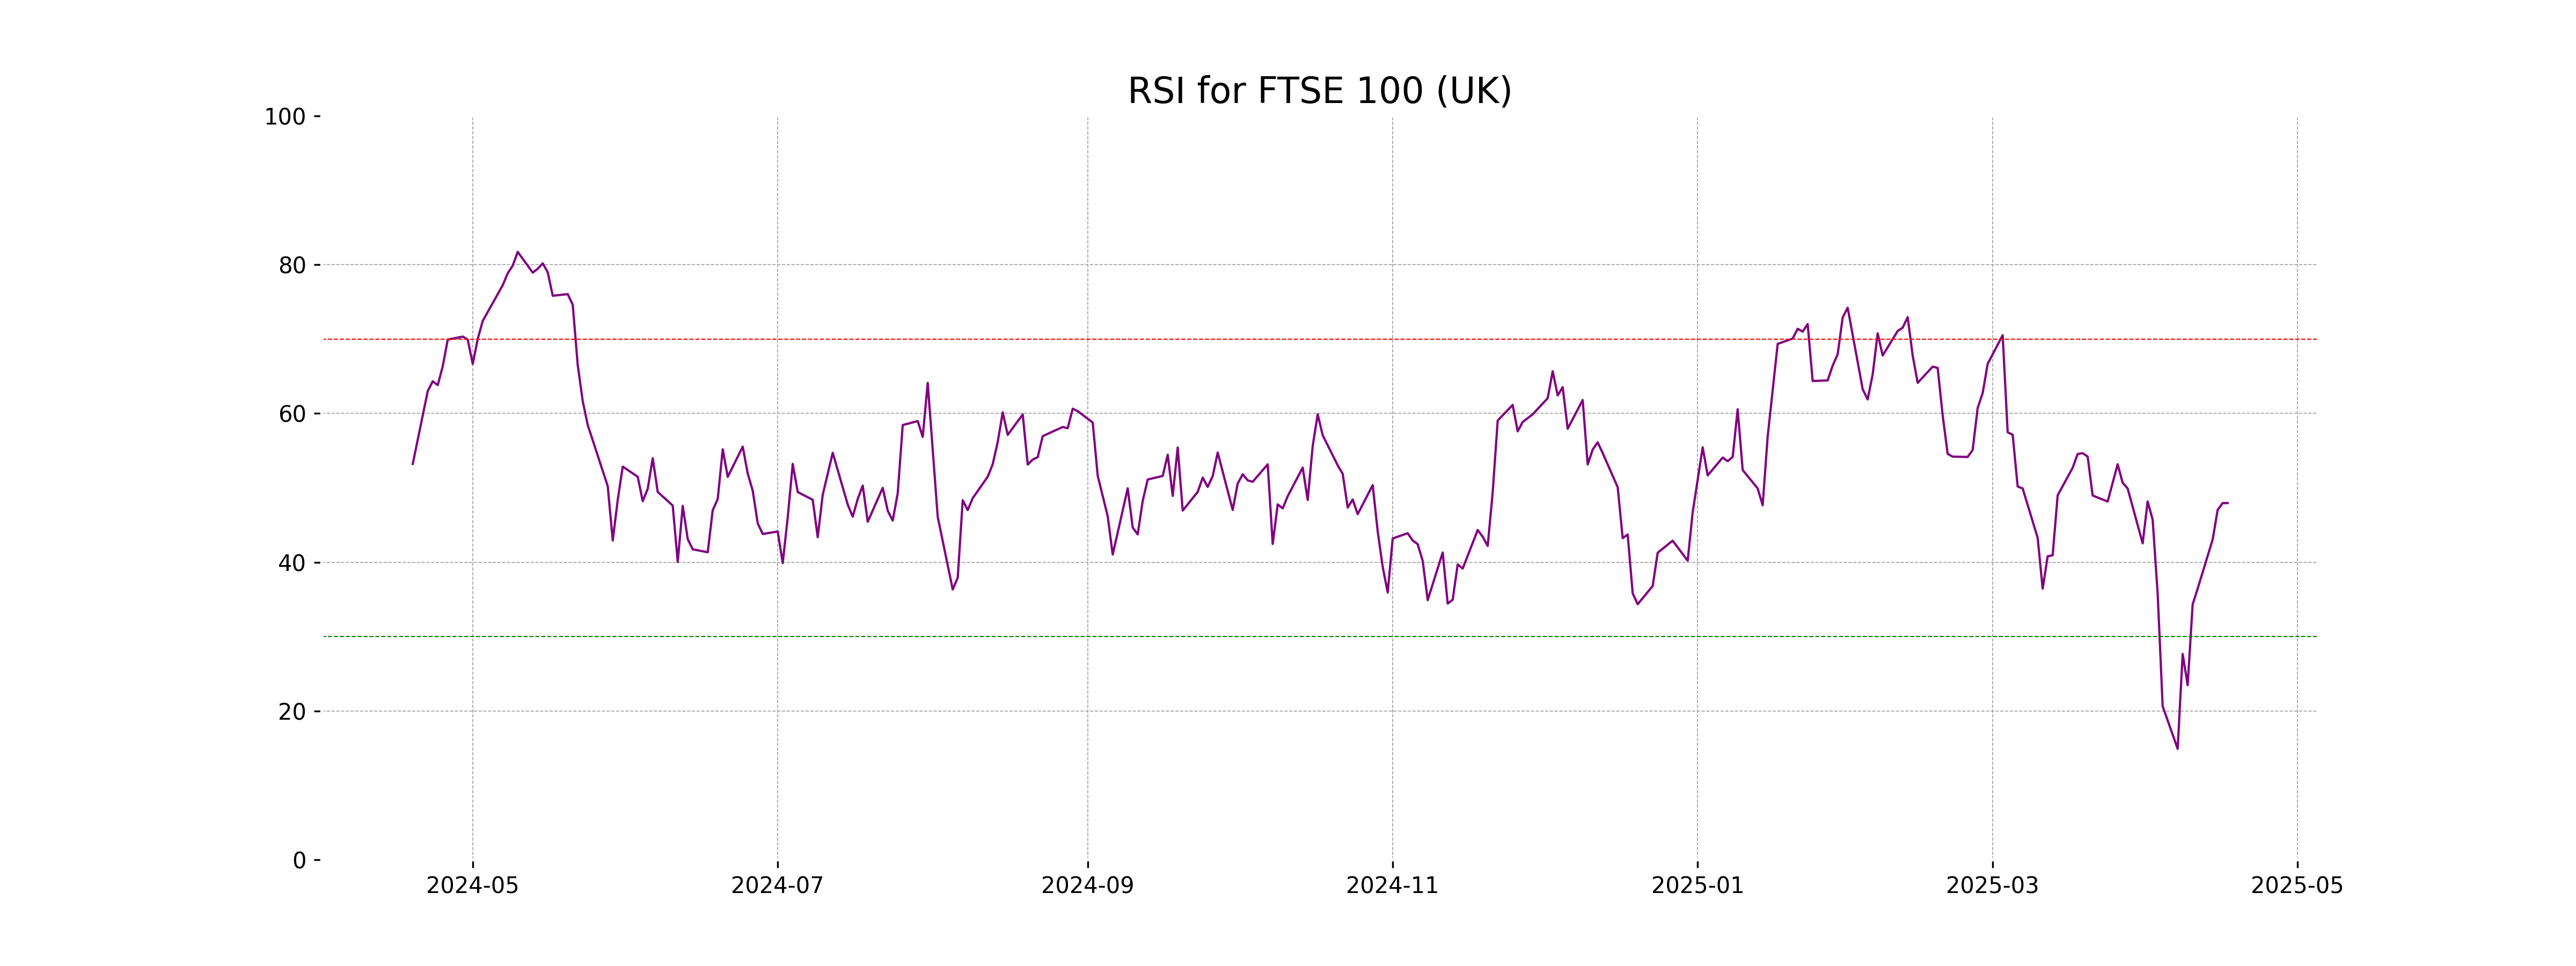
Analysis for FTSE 100 (UK) - April 18, 2025

FTSE 100 (UK) opened at 8275.60 and closed slightly higher at 8275.70, showing a minimal percentage change of 0.0012%, with a points change of 0.10. The index experienced a high of 8295.10 and a low of 8195.70, trading with a volume of 735,769,800. The Relative Strength Index (RSI) is at 47.95, indicating neutral momentum, while the MACD is slightly negative at -129.95, suggesting mild bearish sentiment.
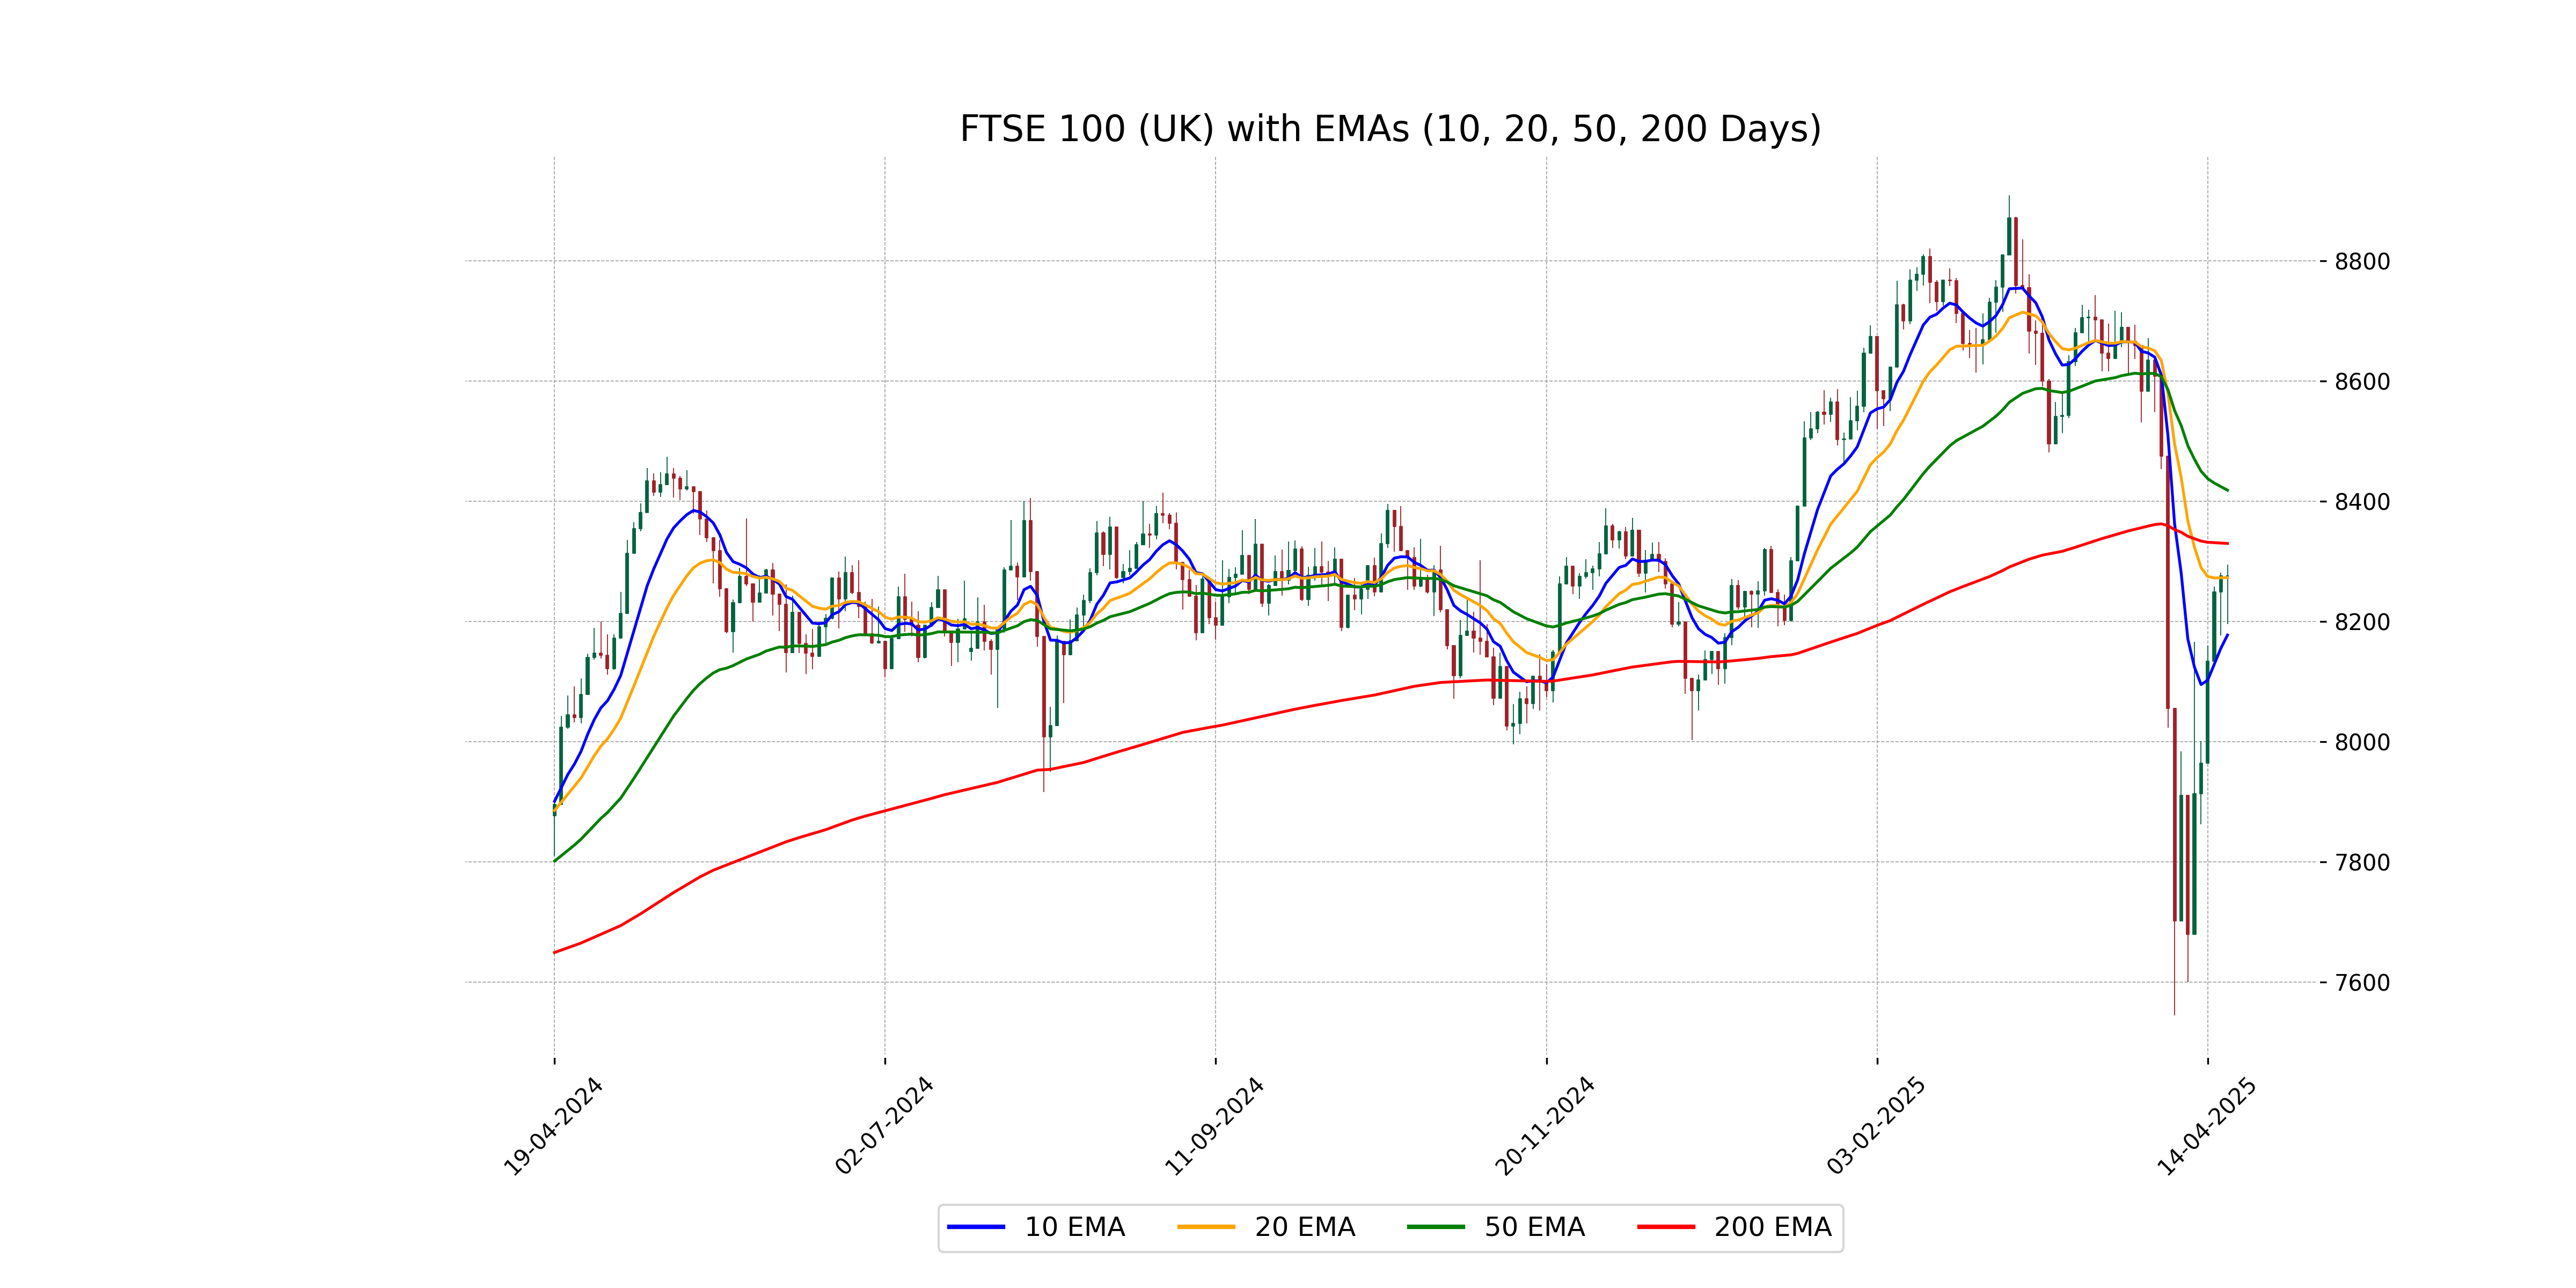
Relationship with Key Moving Averages
The FTSE 100 is trading above its 10 and 20-day EMAs, suggesting short-term bullishness, while it's below the 50 and 200-day EMAs, indicating potential long-term bearish trends. The RSI is near the neutral 50 mark, and the MACD is negative, but the MACD signal is even lower, which could imply weakening downward momentum.
Moving Averages Trend (MACD)
The MACD for FTSE 100 shows a value of -129.95, which is negative but above the MACD Signal line of -144.93. This suggests a possible upward momentum, indicating that the recent trend may be a move towards bullish behavior, albeit with the MACD still indicating bearishness overall.

RSI Analysis
The RSI (Relative Strength Index) for FTSE 100 is currently 47.95, which suggests that the index is in a neutral zone. Values between 30 and 70 indicate neither an overbought nor oversold condition, implying no strong directional momentum.
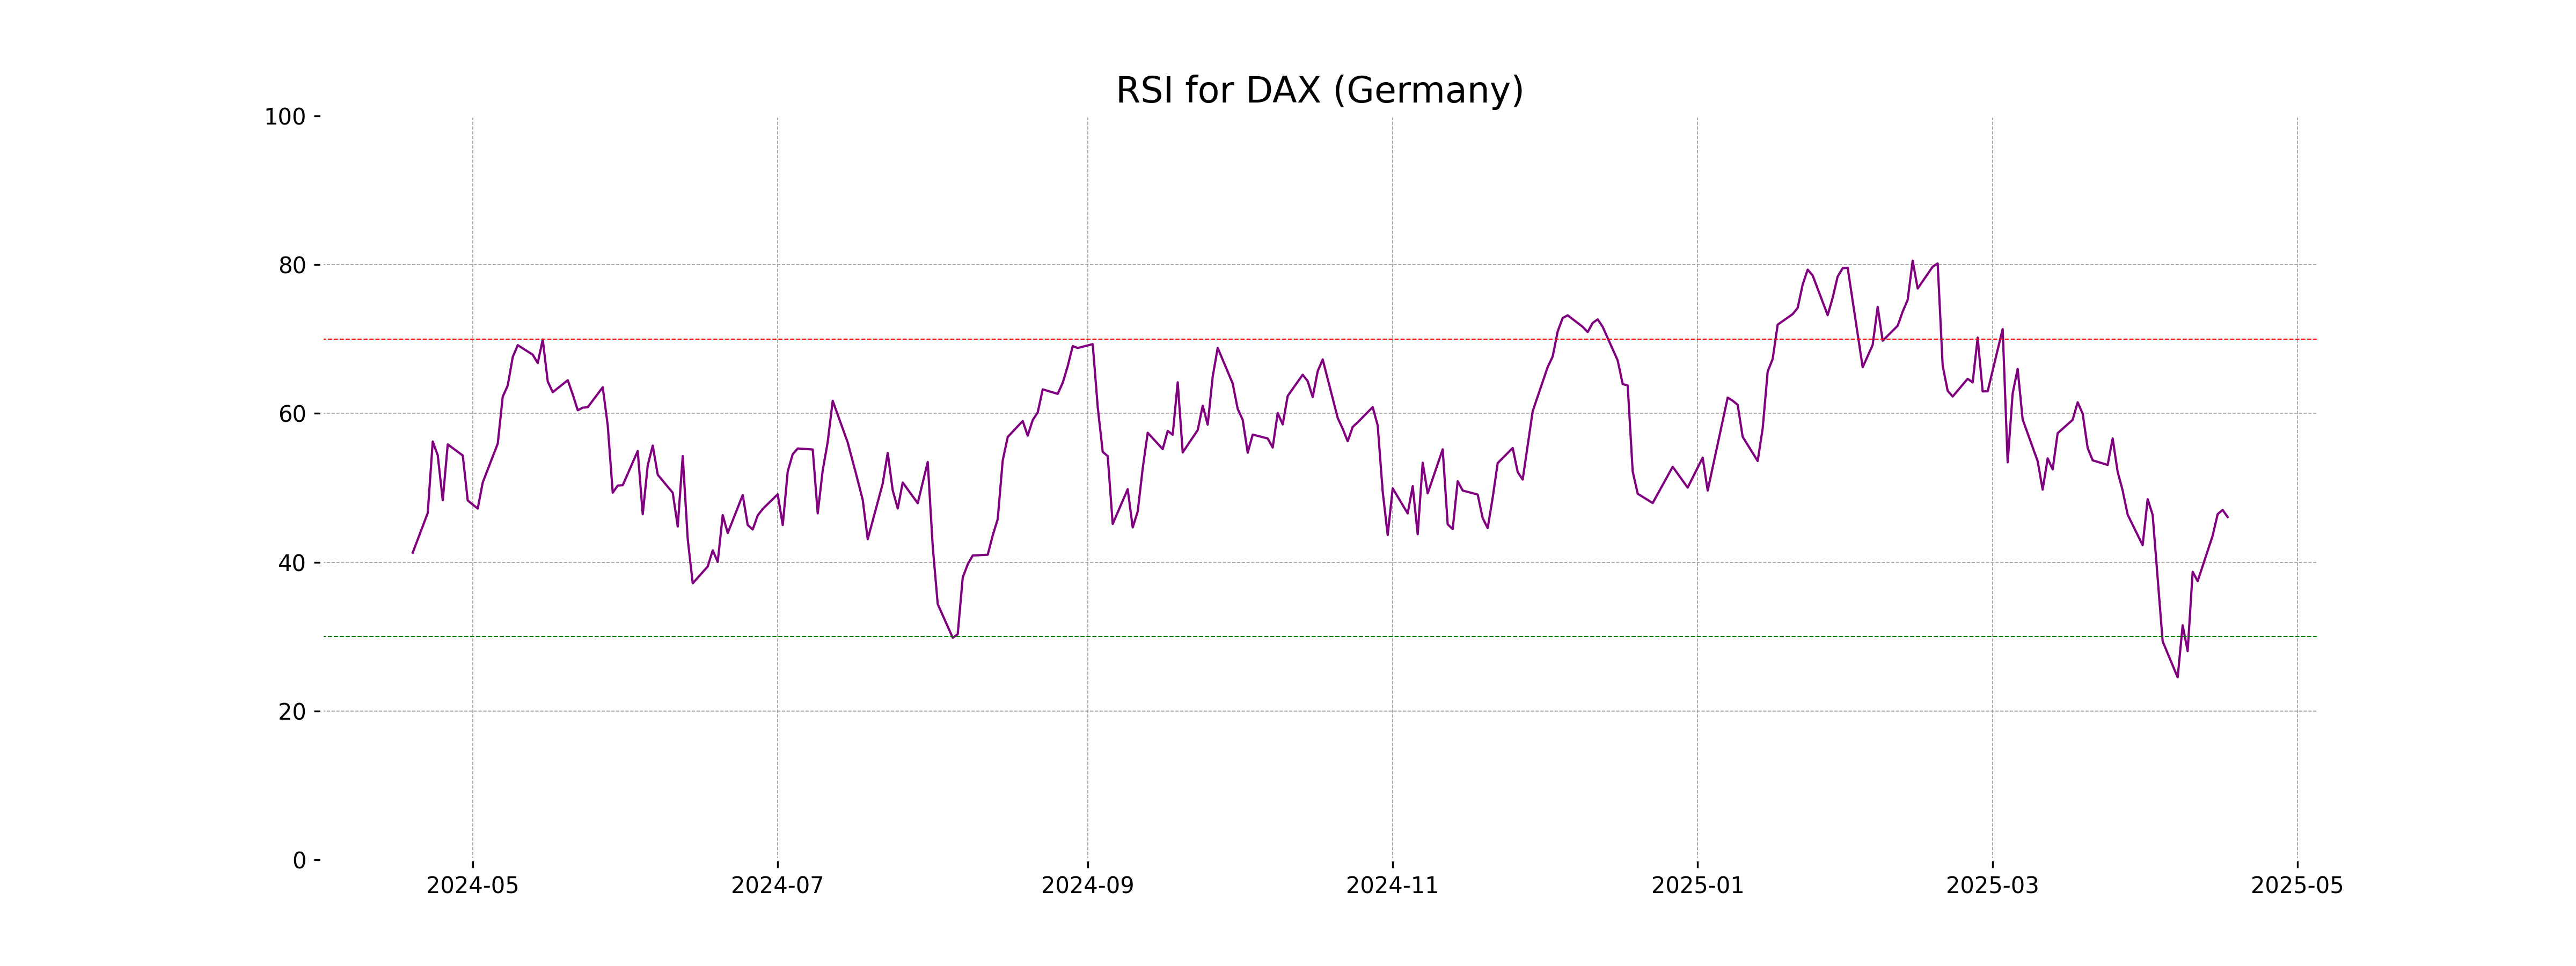
Analysis for DAX (Germany) - April 18, 2025

DAX (Germany) Performance Summary: The DAX index opened at 21,433.55, reaching a high of 21,436.66 and a low of 21,142.26 before closing at 21,205.86. The index experienced a decrease with a percentage change of -0.49% and a points drop of -105.16 from the previous close. The RSI indicator at 46.07 suggests mild bearish momentum, while the MACD score of -433.26 compared to the signal value of -442.73 indicates a potential weakening of bearish trends.
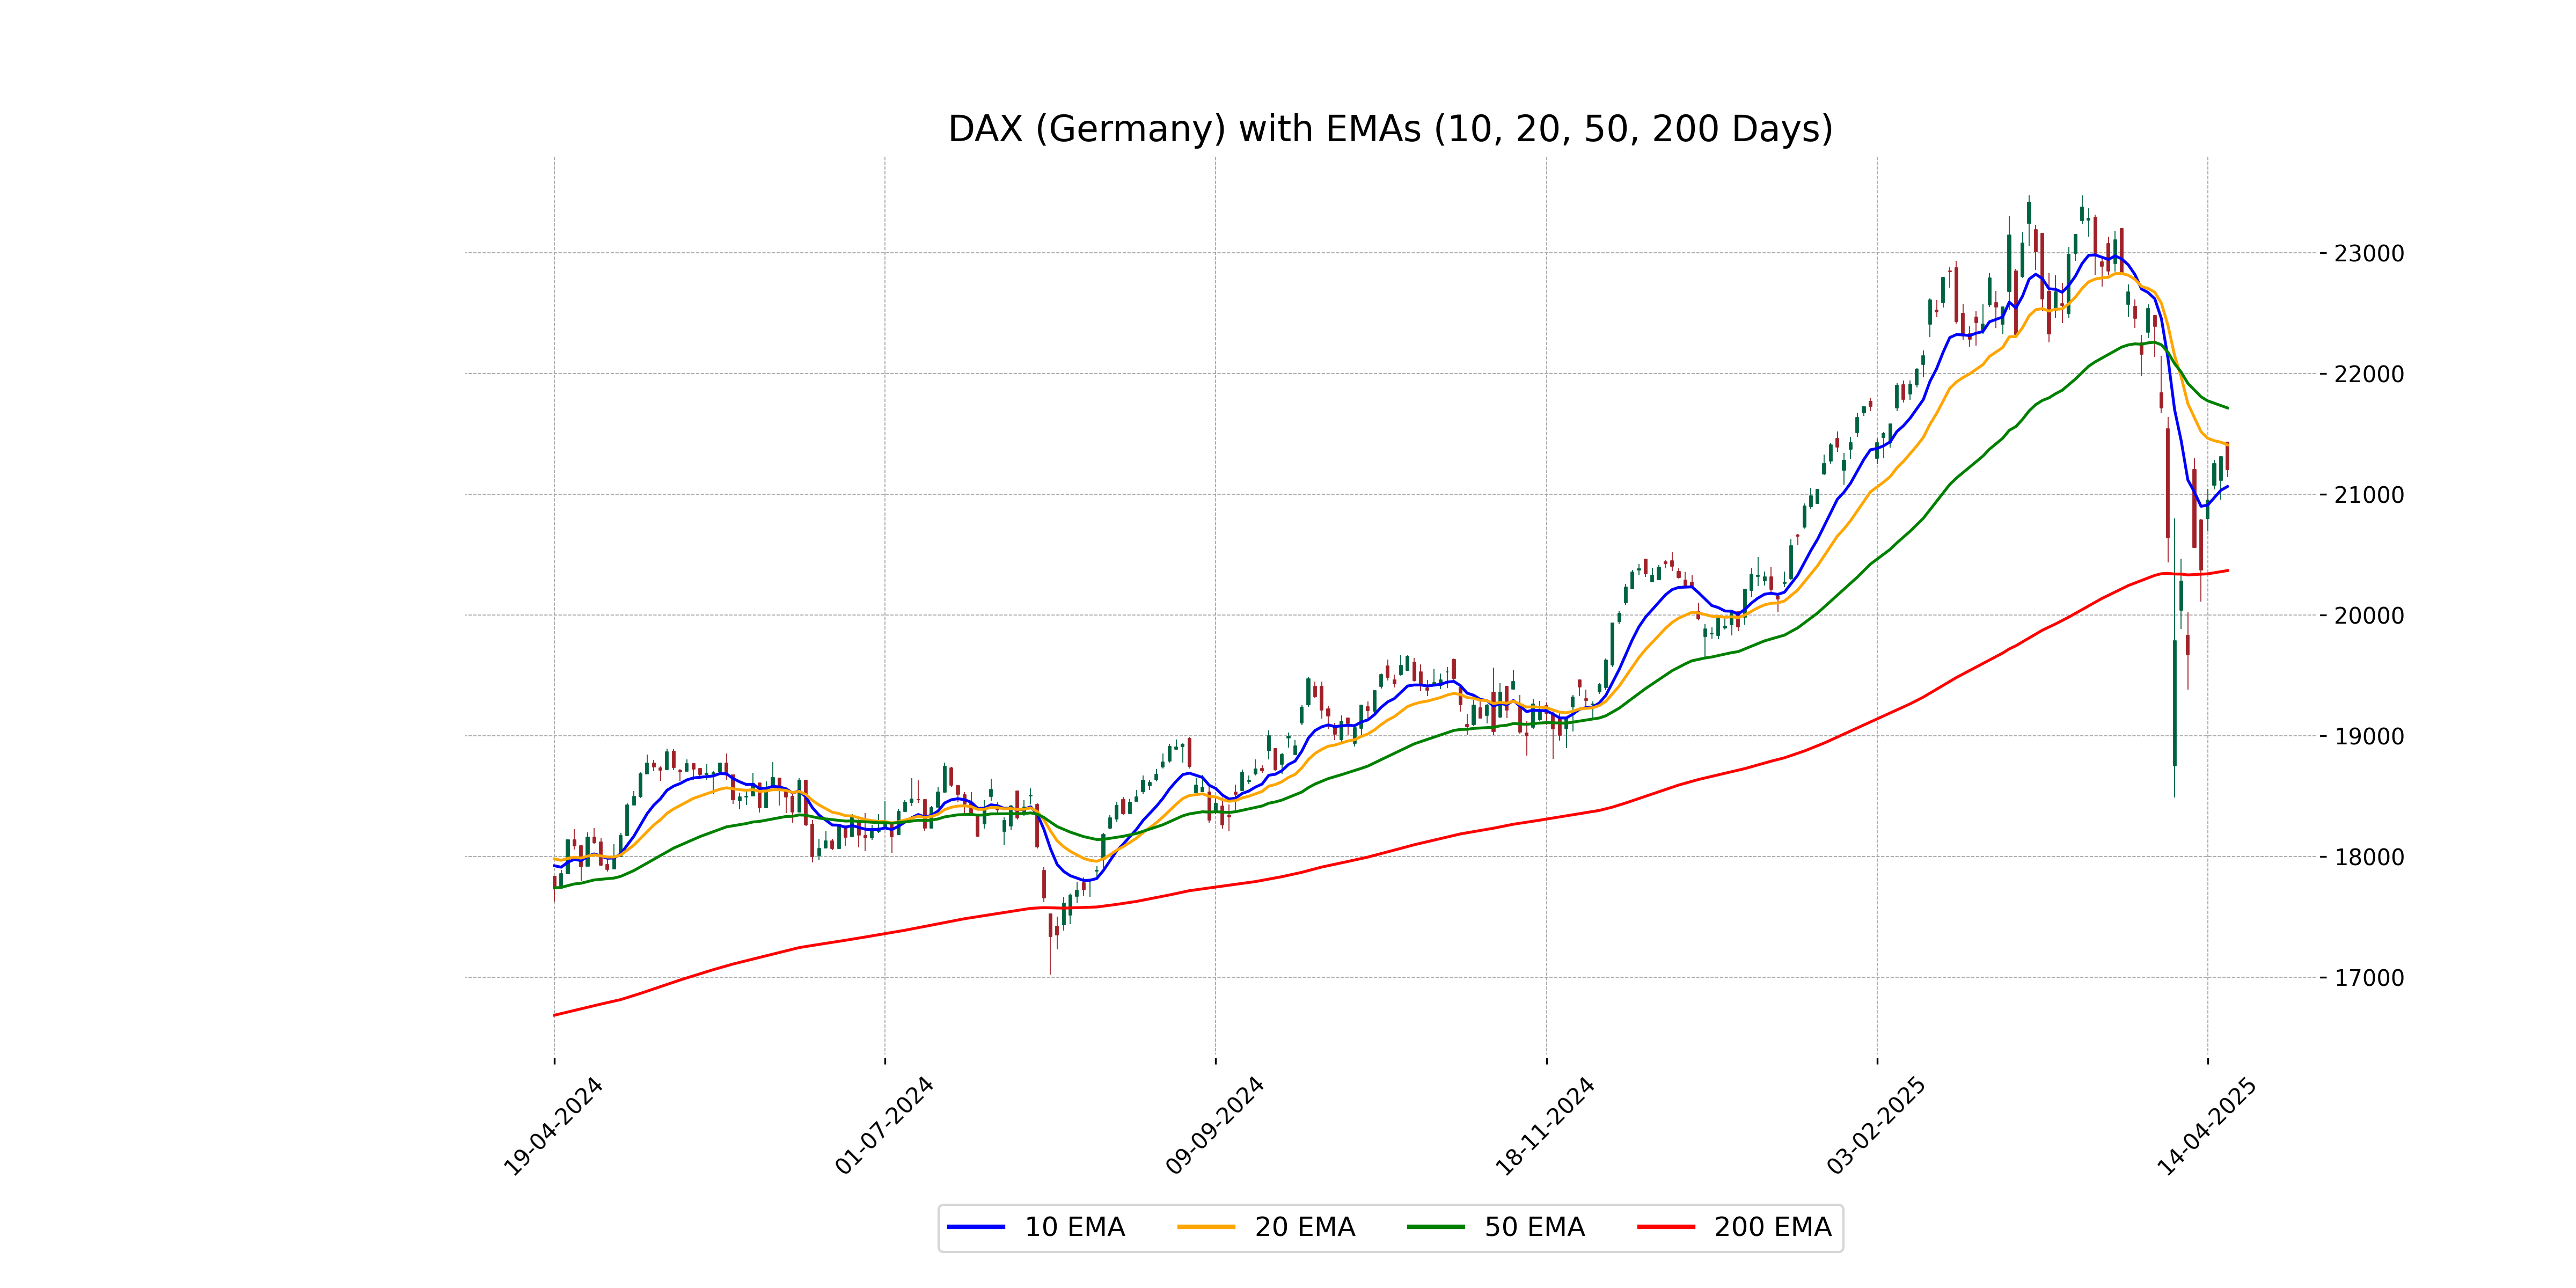
Relationship with Key Moving Averages
The current close of the DAX is 21,205.86, which is below the 50-day EMA of 21,716.95, indicating a bearish short-to-medium term trend. It is slightly above the 10-day EMA of 21,066.28 but below the 20-day EMA of 21,411.13, suggesting potential near-term weakness or consolidation.
Moving Averages Trend (MACD)
The MACD analysis for DAX indicates a bearish sentiment as the MACD value of -433.26 is below the MACD Signal of -442.73. This typically suggests that the stock may be experiencing downward momentum.

RSI Analysis
RSI Analysis for DAX (Germany): The Relative Strength Index (RSI) for DAX is 46.07, indicating that the market is currently in a neutral zone. The RSI close to 50 suggests that there is no significant momentum towards overbought or oversold conditions, as values below 30 are typically considered oversold and above 70 as overbought.
Analysis for S&P 500 (US) - April 18, 2025

The S&P 500 (US) opened at 5305.45, reaching a high of 5328.31 and a low of 5255.58, closing at 5282.70. There was a slight positive change of 0.13%, with a points increase of 7.0. The trading volume was 4.71 billion. It is currently below its 50-day and 200-day EMAs, reflecting a bearish sentiment with an RSI at 41.93 and a MACD indicating a negative trend.

Relationship with Key Moving Averages
The S&P 500 closed at 5282.70, which is below its 50-day EMA of 5616.37 and the 200-day EMA of 5657.44, indicating a bearish trend. Additionally, it is trading below its 10-day EMA of 5339.94 and 20-day EMA of 5424.89, suggesting a short-term weakness.
Moving Averages Trend (MACD)
The MACD value for the S&P 500 is -118.63, which is below the MACD Signal of -124.78, indicating a bearish trend. This suggests that the index may continue experiencing downward momentum in the near term.

RSI Analysis
The RSI for S&P 500 is 41.93, indicating that the index is potentially nearing oversold conditions but is not there yet, as it is below the neutral level of 50. This suggests a potential buying opportunity, though further analysis is required as RSI alone is not a definitive indicator.

Analysis for Hang Seng Index (Hong Kong) - April 18, 2025
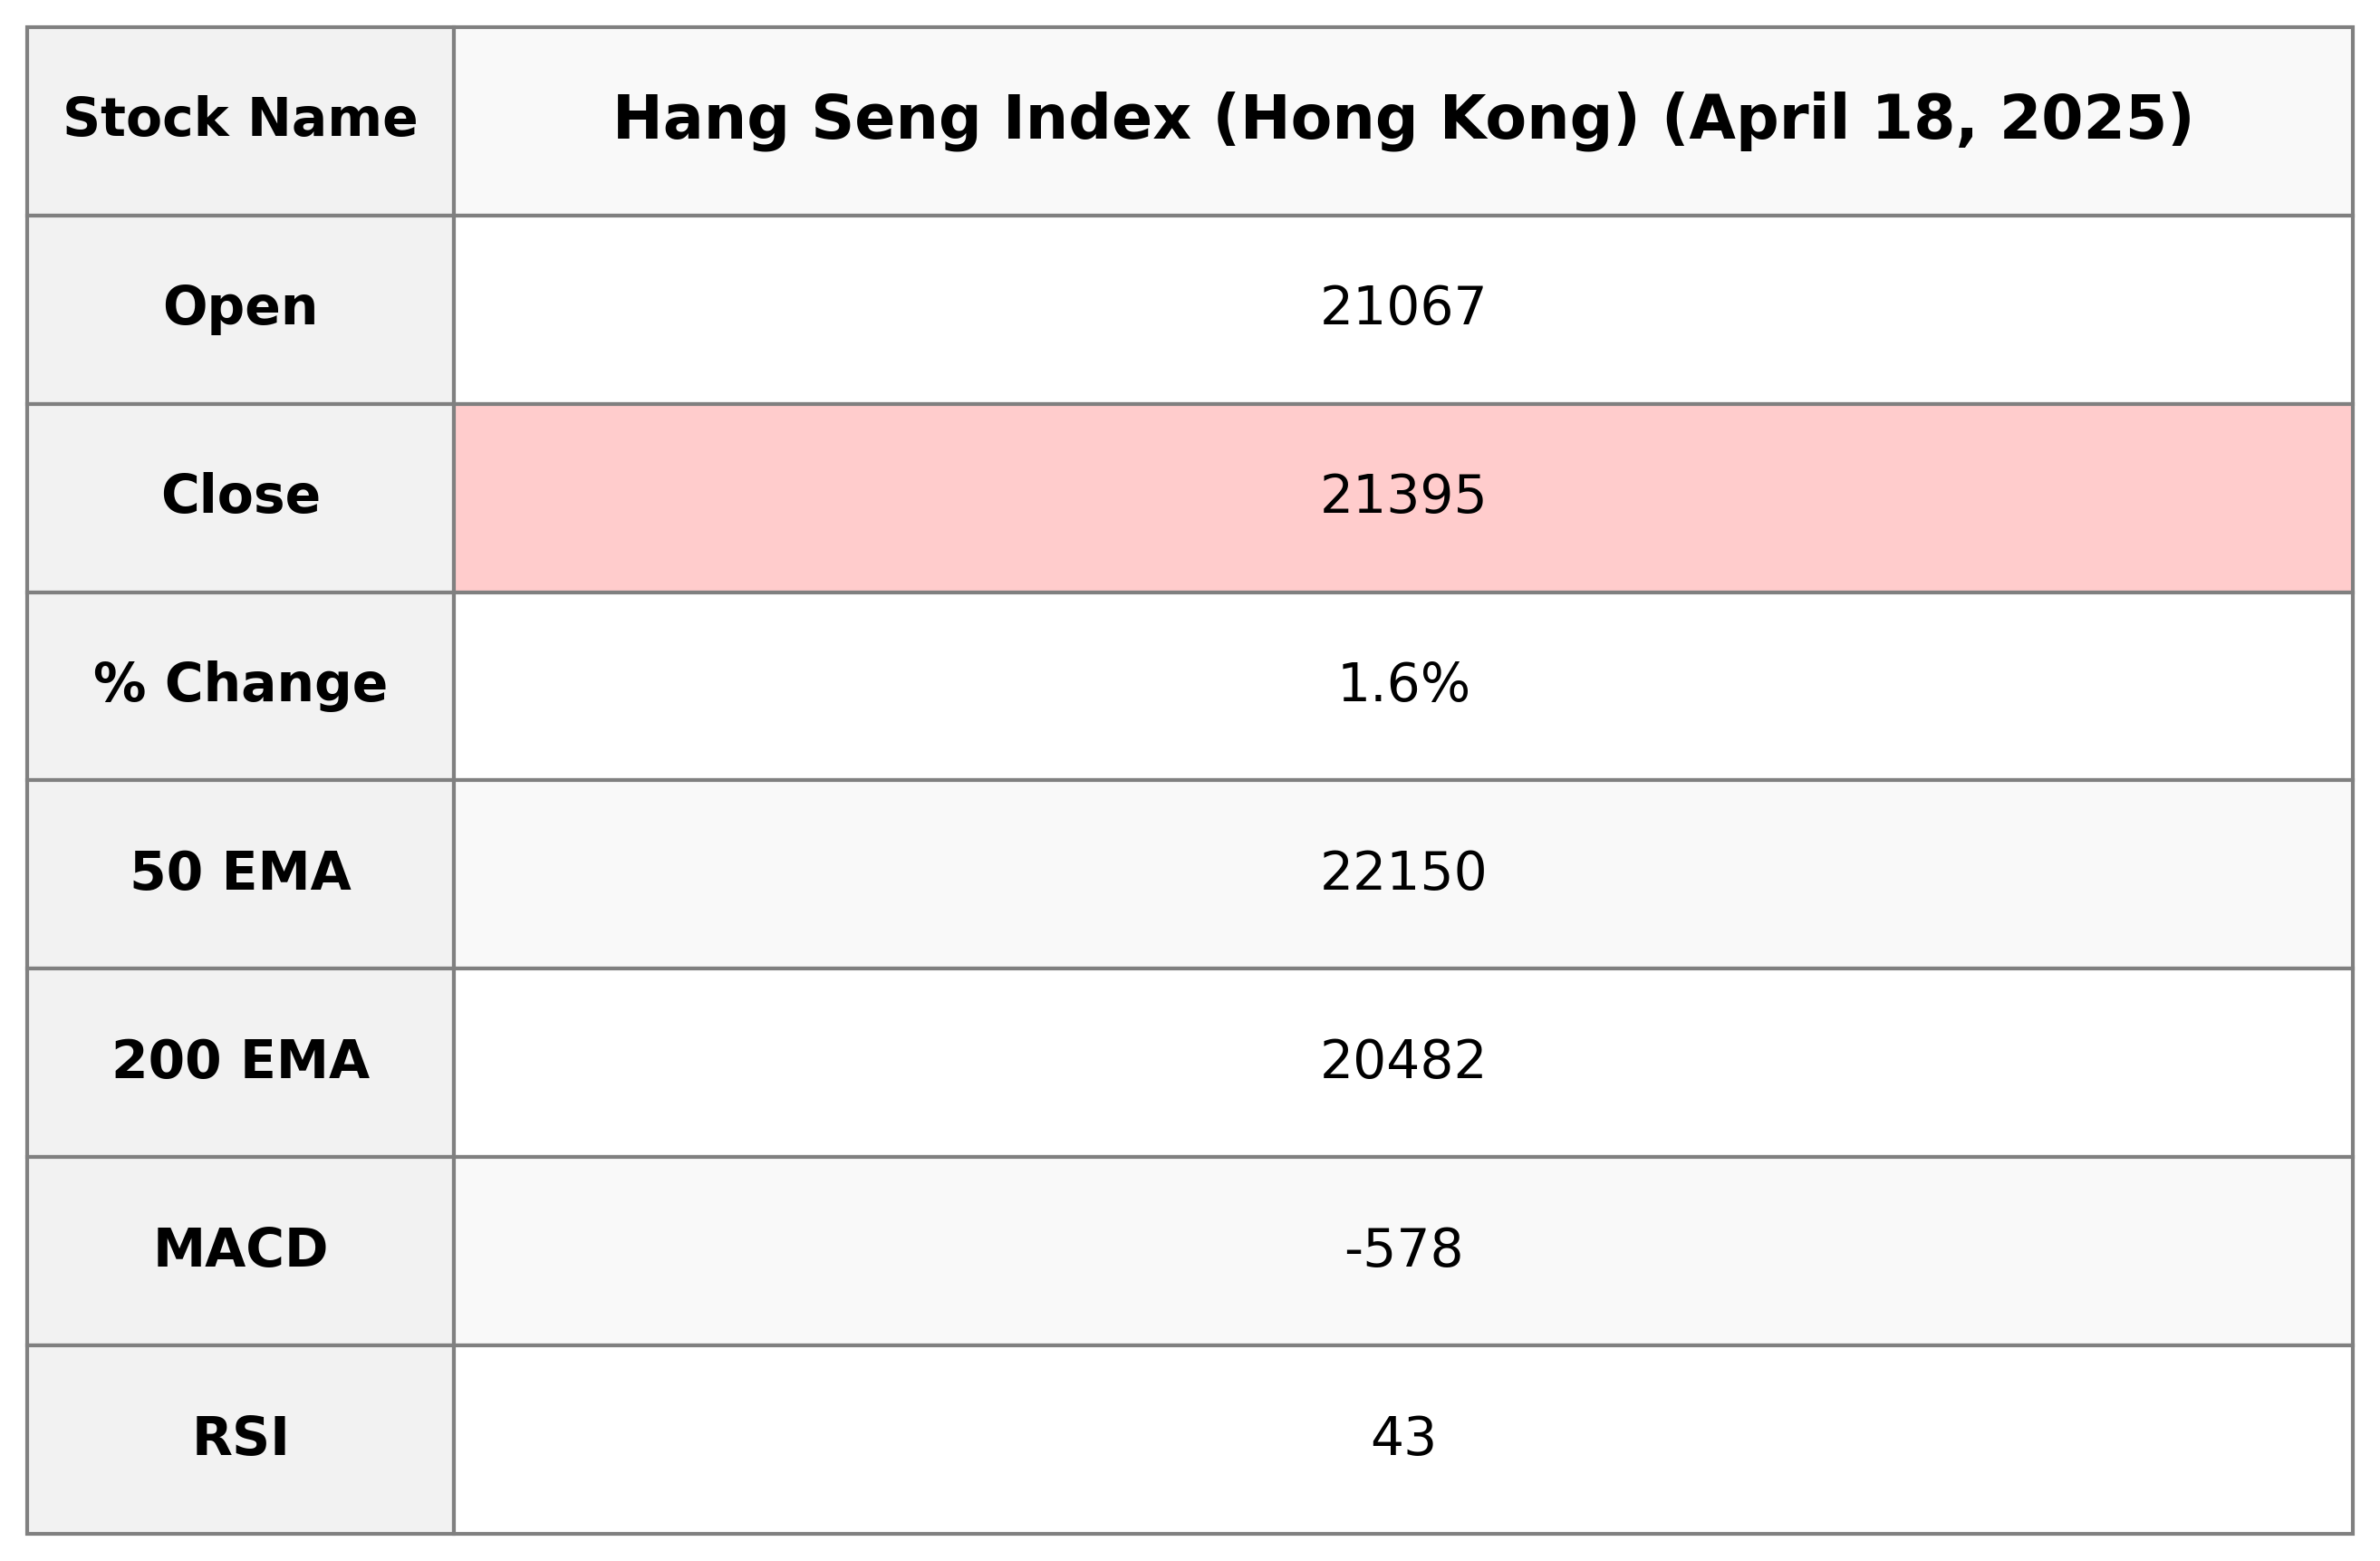
The Hang Seng Index (Hong Kong) opened at 21,066.81 and closed at 21,395.14, showing a daily gain of 1.61% with a point increase of 338.16. The index's RSI indicates a moderate level at 42.82, while the MACD of -578.41 reflects a bearish sentiment compared to the signal line. The current price is below its 50-day EMA, suggesting some downward pressure in the short term.
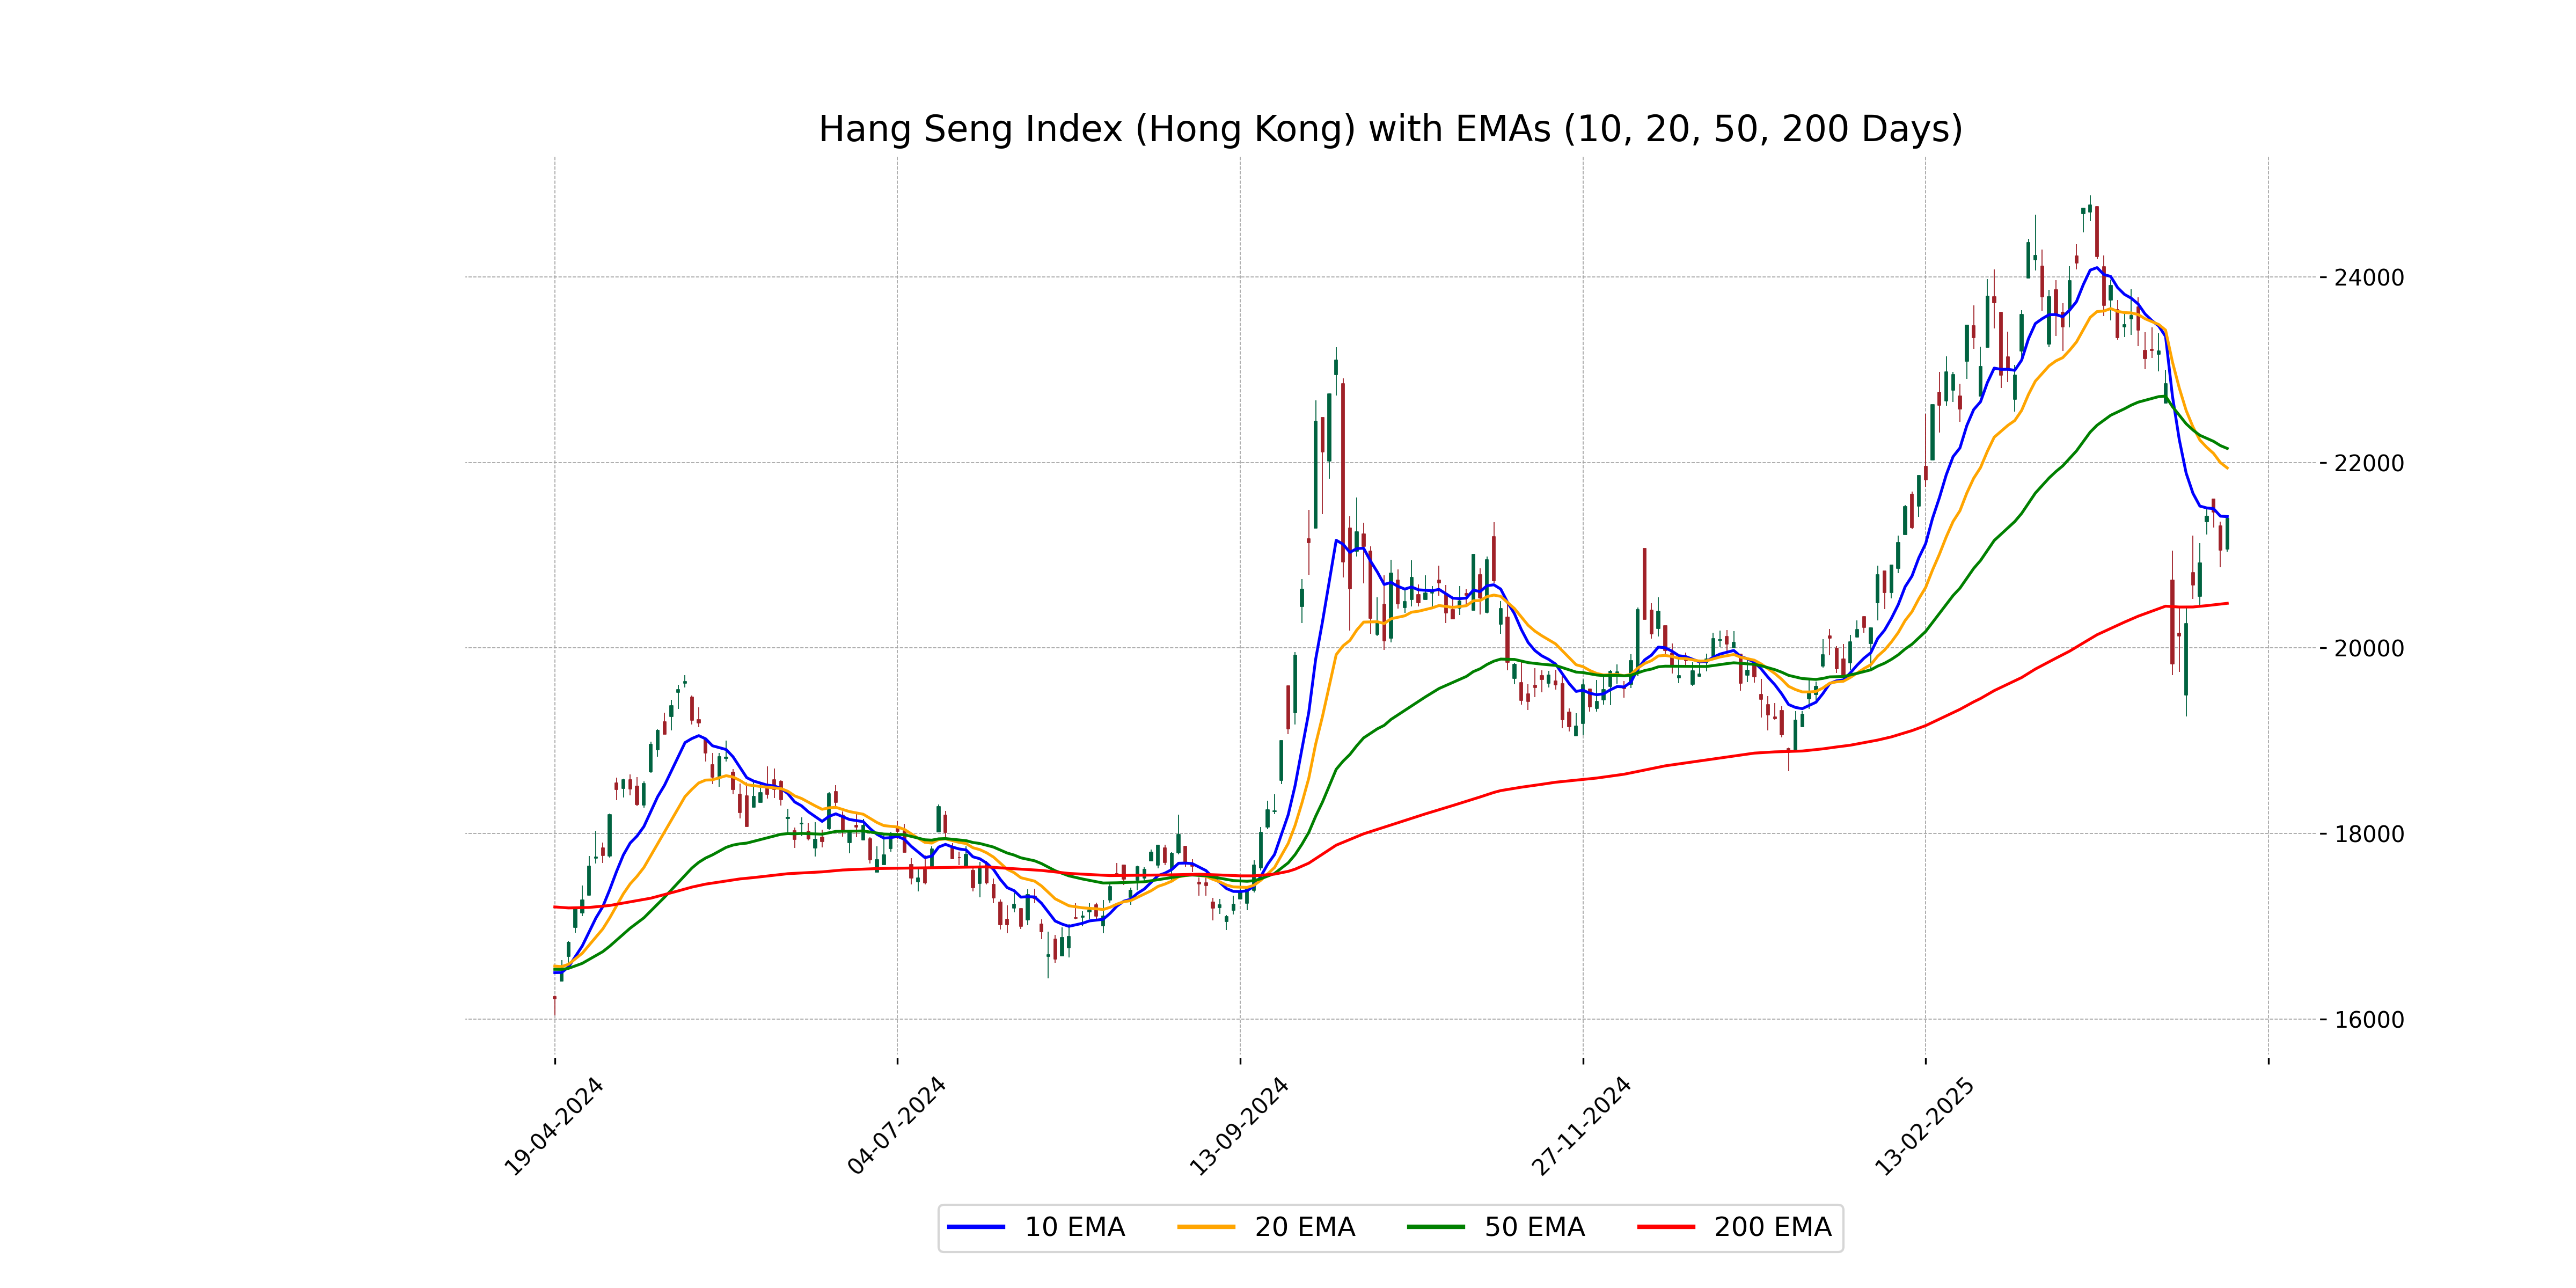
Relationship with Key Moving Averages
The Hang Seng Index closed at 21,395.14, which is below its 50-day EMA of 22,149.65, indicating a potential downtrend in the medium term. However, it remains above the 200-day EMA of 20,481.52, suggesting a longer-term uptrend may still be intact.
Moving Averages Trend (MACD)
The MACD for the Hang Seng Index shows a bearish signal with a value of -578.41, which is currently below its signal line at -468.66. This indicates potential downward momentum, suggesting the index may face continued bearish pressure.

RSI Analysis
The RSI for Hang Seng Index (Hong Kong) is 42.82, indicating a market that is neither overbought nor oversold. An RSI value below 30 typically suggests an oversold condition, while above 70 indicates overbought. Currently, the index appears to be in a neutral stance.

Analysis for IBEX 35 (Spain) - April 18, 2025

The IBEX 35, Spain's main stock exchange index, opened at 12,934 and closed slightly lower at 12,918, reflecting a points change of -24.09 and a percentage change of -0.19%. The RSI of 52.20 suggests a neutral market momentum. The MACD value of -104.49 indicates a bearish trend, with the MACD signal being slightly more negative at -128.87.

Relationship with Key Moving Averages
For IBEX 35 (Spain), the current closing price of 12918.0 is above the 50-day EMA of 12774.27, indicating short-term bullish momentum. Additionally, it is significantly above the 200-day EMA of 12028.95, suggesting a positive long-term trend.
Moving Averages Trend (MACD)
The MACD for IBEX 35 is -104.49 with a signal line of -128.87, indicating a potential bullish crossover as the MACD line is above the signal line. This suggests a potential upward momentum in the stock price.

RSI Analysis
RSI for IBEX 35 is 52.20, indicating a neutral market sentiment. It is not in the overbought or oversold territory, suggesting a balanced position where either buy or sell pressure could prevail.

Analysis for NASDAQ Composite (US) - April 18, 2025

NASDAQ Composite (US) Performance The NASDAQ Composite closed at 16,286.45, a slight decline from the previous close, marking a -0.13% change and a drop of 20.71 points. The market witnessed a considerable trading volume of approximately 7.05 billion, with the 50-day, 200-day, 10-day, and 20-day EMA values reflecting market trends. The RSI indicates a moderate position at 41.33, with the MACD suggesting bearish momentum.

Relationship with Key Moving Averages
The NASDAQ Composite is currently trading below its 10 EMA, 20 EMA, 50 EMA, and 200 EMA, with a close price of 16,286.45. This may suggest a bearish trend as the price is below these key moving averages, indicating potential downward momentum. The RSI is at 41.33, suggesting it is approaching the oversold territory.
Moving Averages Trend (MACD)
The MACD for NASDAQ Composite (US) is -459.19, which is below the MACD Signal line of -497.11, indicating a potential bullish crossover is imminent as the MACD is moving closer to its Signal line. This suggests that the current negative momentum might be weakening.

RSI Analysis
RSI Analysis for NASDAQ Composite (US): The RSI of NASDAQ Composite is currently at 41.33, indicating that it is in the neutral zone, neither overbought nor oversold. This suggests a potential for movement in either direction, depending on future market conditions.

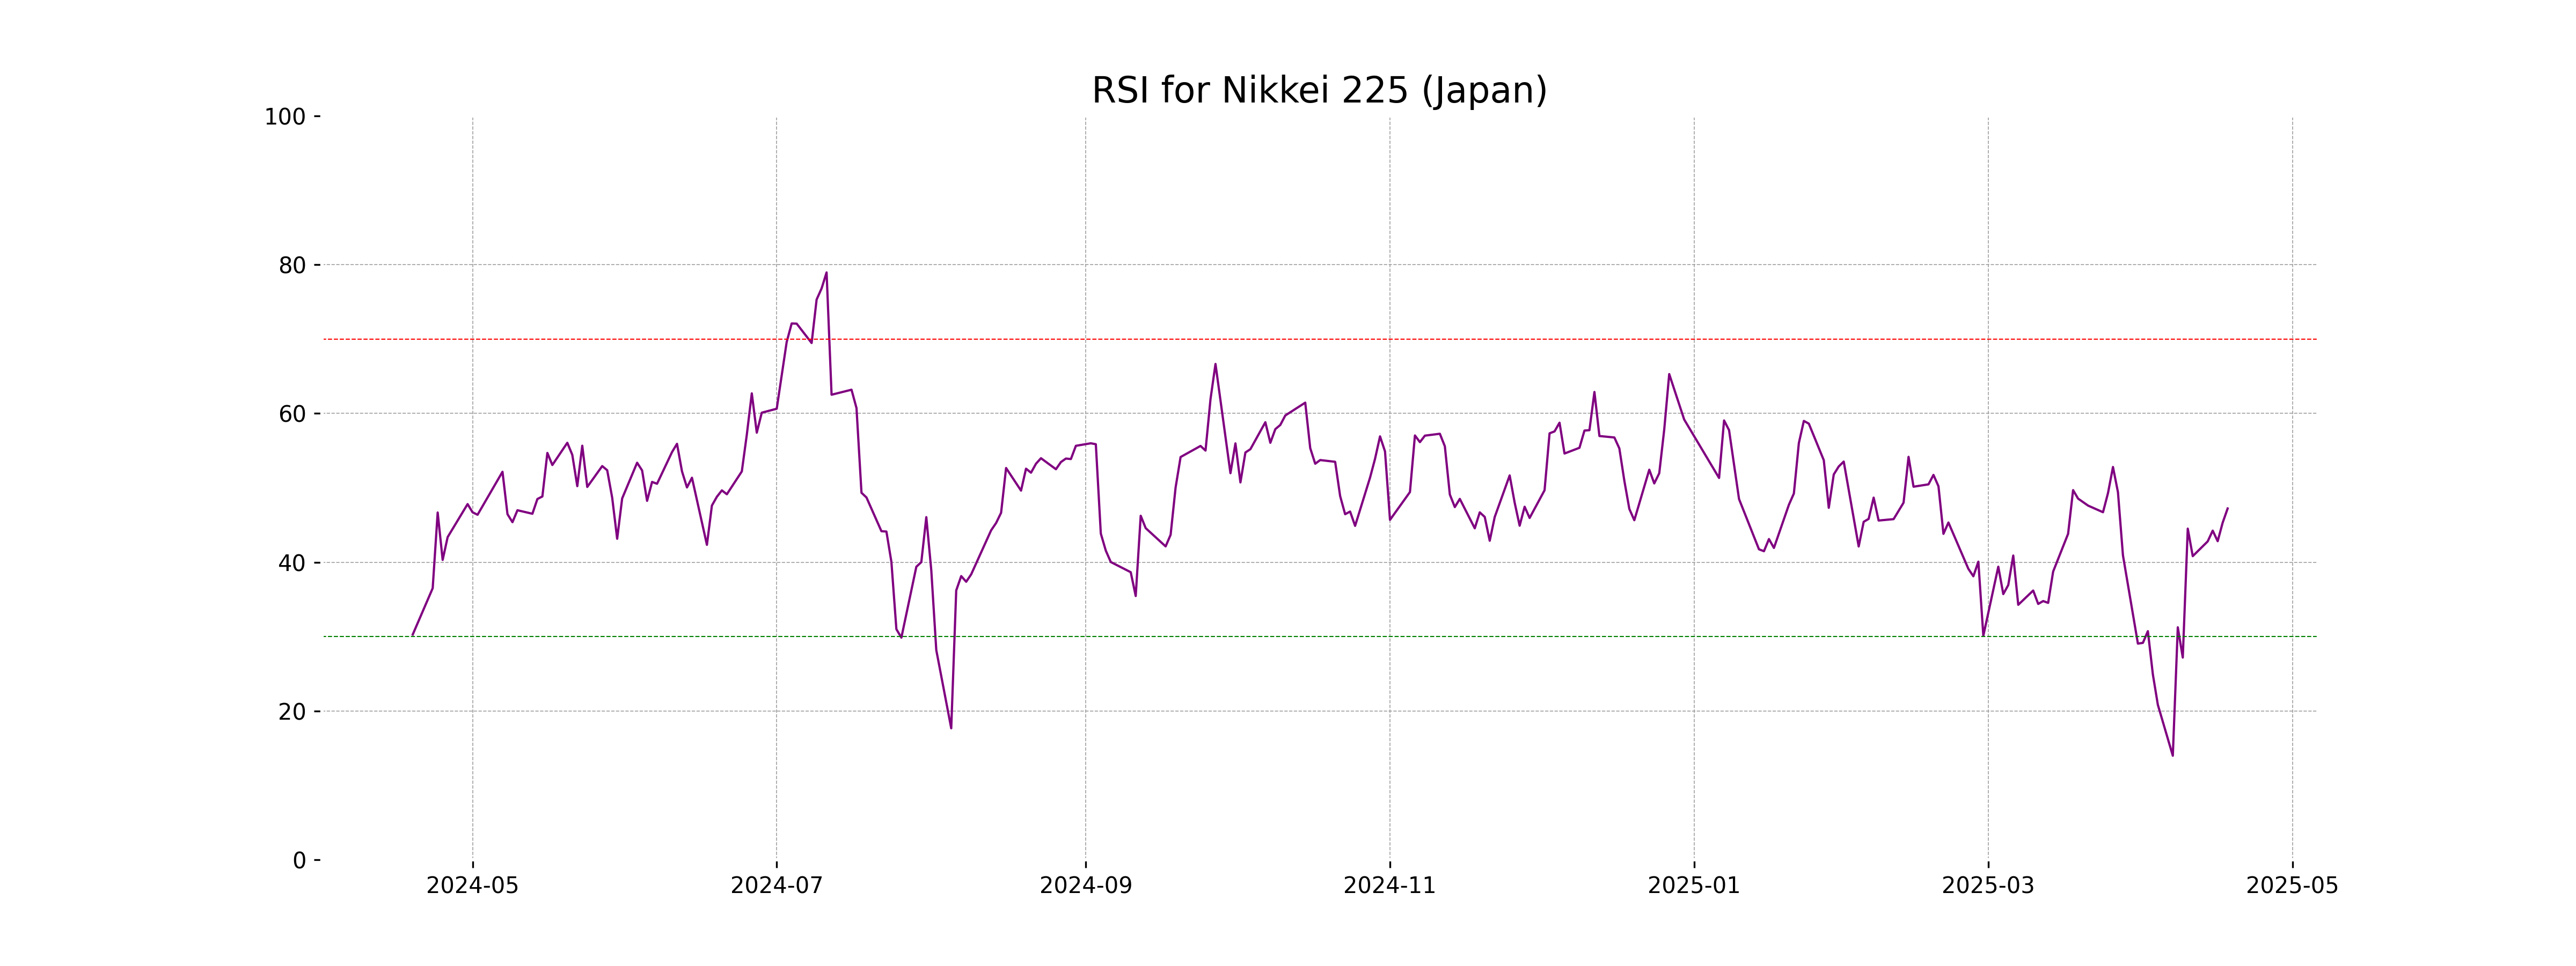
Analysis for Nikkei 225 (Japan) - April 18, 2025

Nikkei 225 (Japan) opened at 34,353.88 and closed at 34,730.28, marking a 1.03% increase with a 352.68 point gain from the previous close of 34,377.60. The index showed a trading range with a high of 34,758.97 and a low of 34,224.57, while exhibiting an RSI of 47.23, indicating neutral market momentum. The MACD value of -865.61, below the signal line of -1016.38, suggests a bearish trend continuation.

Relationship with Key Moving Averages
The Nikkei 225 closed above its 10 EMA and 20 EMA, indicating short-term positive momentum, but remains below its 50 EMA and 200 EMA, suggesting longer-term bearish trends. The positive % _Change and Points_Change also highlight recent upward price movement.
Moving Averages Trend (MACD)
The Nikkei 225 has a MACD value of -865.61 and a MACD Signal of -1016.38, indicating a bullish crossover as the MACD is approaching closer to the signal line from below. This suggests a potential upward momentum in the current trend.

RSI Analysis
The relative strength index (RSI) for Nikkei 225 stands at approximately 47.23. This suggests that the index is neither overbought nor oversold, but is closer to the midpoint, which may indicate a neutral market sentiment currently.
Analysis for Nifty Bank - April 18, 2025

Bank Nifty opened at 53,153.75 and closed at 54,290.20, showing a significant upward movement with a percentage change of 2.21% and a points change of 1,172.45. The index's Relative Strength Index (RSI) of 72.24 indicates a strong bullish trend, and its close above the 10, 20, 50, and 200 EMA suggests continued momentum.

Relationship with Key Moving Averages
The closing price of Nifty Bank at 54290.20 is above all key moving averages (10 EMA: 51941.23, 20 EMA: 51195.99, 50 EMA: 50410.27, 200 EMA: 50151.23), indicating a strong bullish trend. The high RSI of 72.24 further supports this positive momentum.
Moving Averages Trend (MACD)
The MACD for Nifty Bank is 841.54, which is above its signal line of 586.14, indicating a bullish trend. With an RSI of 72.24, the stock appears overbought, suggesting potential for consolidation or a pullback.

RSI Analysis
The RSI for Nifty Bank is 72.24, indicating that the stock is in the overbought territory, which may suggest a potential reversal or pullback. However, RSI alone is not fully reliable, and it is advisable to consider other indicators and market conditions for a comprehensive analysis.

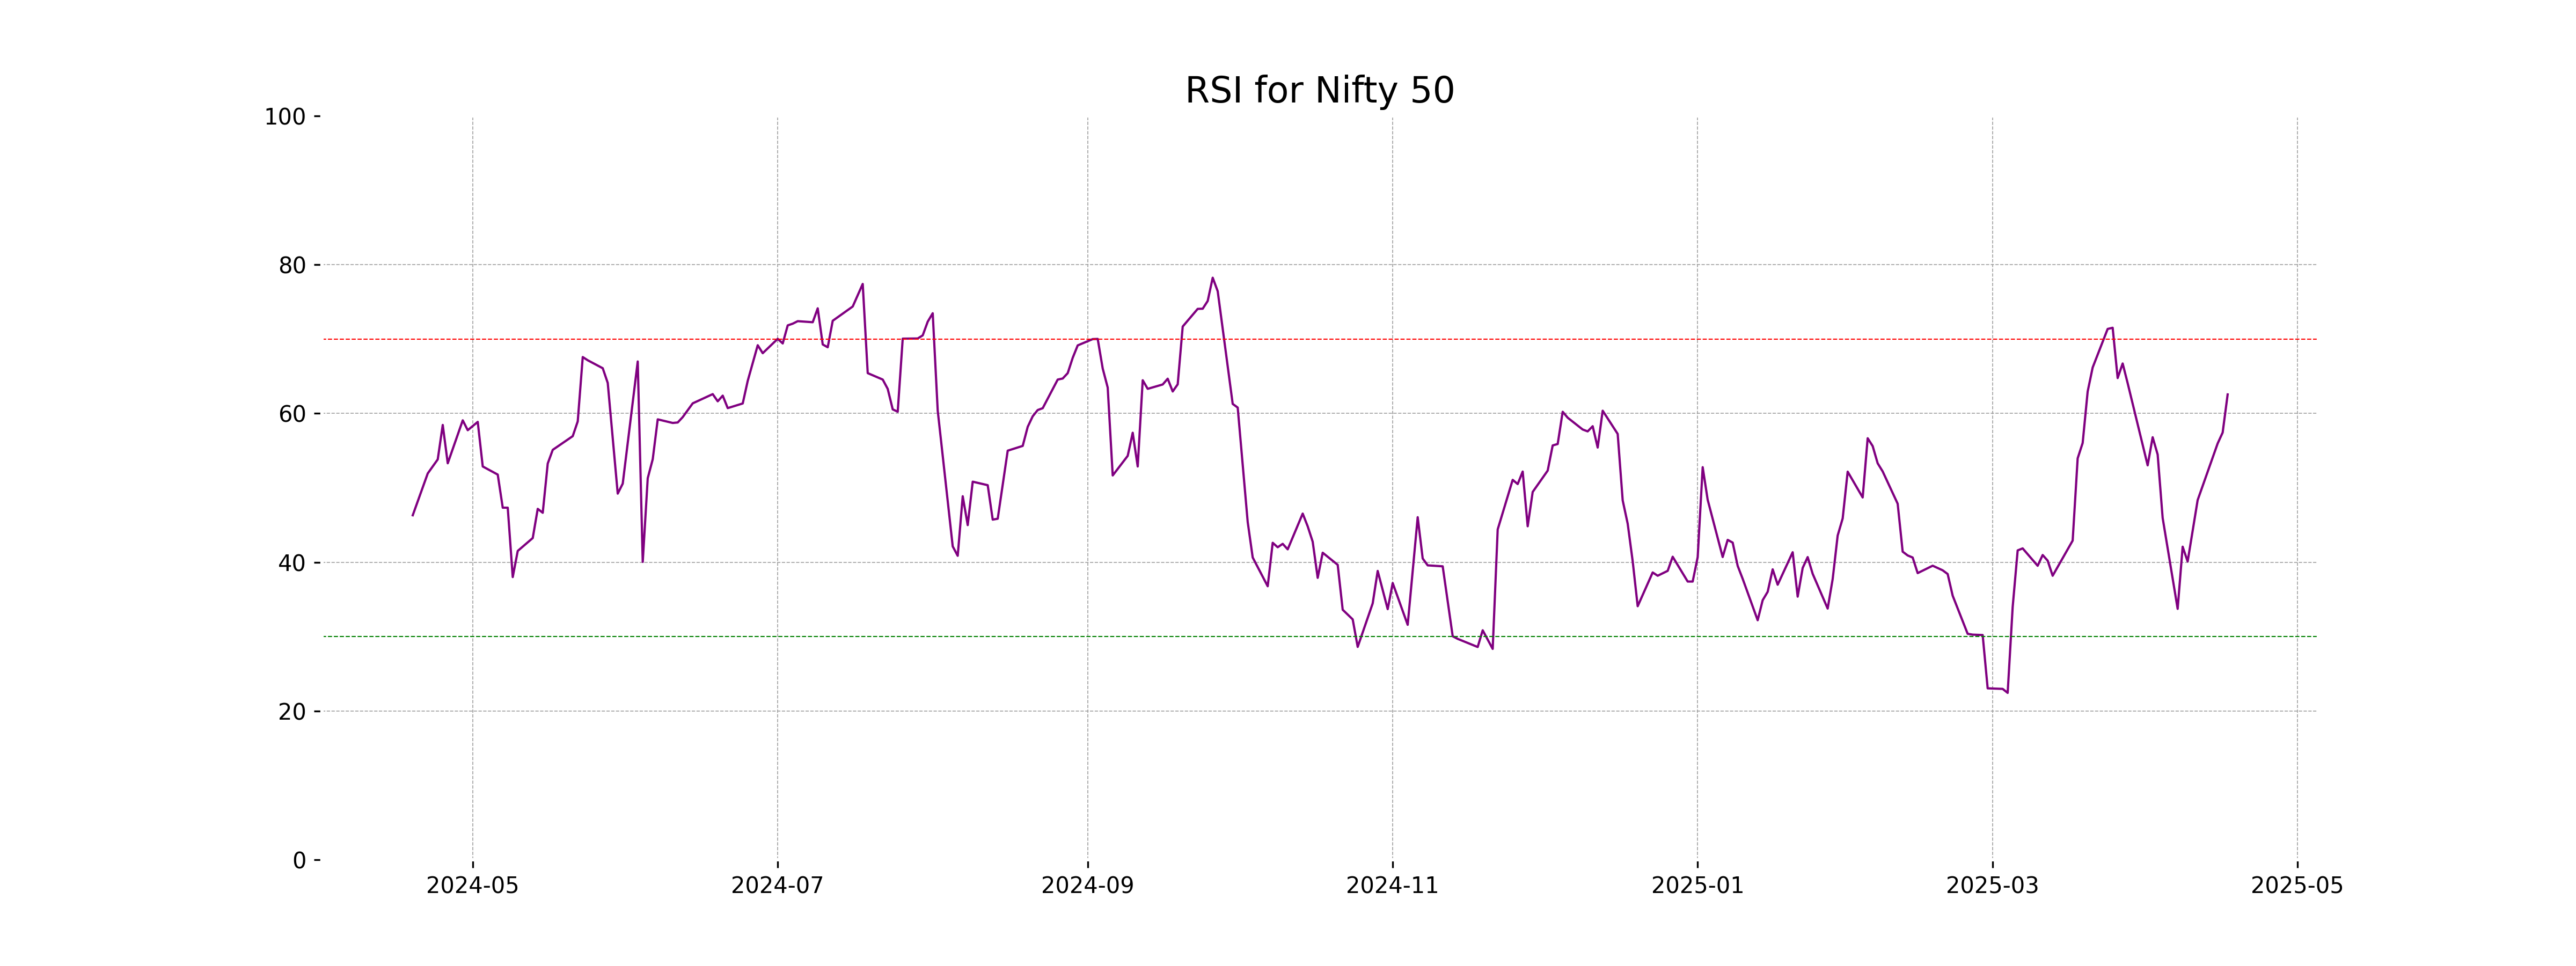
Analysis for Nifty 50 - April 18, 2025

Nifty 50 showed a positive performance with a close at 23851.65, marking a percentage change of 1.77% and a point increase of 414.45 from the previous close. It achieved a high of 23872.35 and a low of 23298.55 during the period. The Relative Strength Index (RSI) stands at 62.56, suggesting a moderately strong performance, while the MACD indicates bullish momentum.

Relationship with Key Moving Averages
The Nifty 50 has closed at 23,851.65, which is above its 50-day EMA of 23,087.37, its 20-day EMA of 23,076.10, its 10-day EMA of 23,168.94, and its 200-day EMA of 23,371.48. This indicates a strong upward momentum in the short to medium term as it is trading above all key moving averages.
Moving Averages Trend (MACD)
The MACD for Nifty 50 is 90.10, with a signal line at 33.15, indicating a bullish trend as the MACD is above the signal line. The positive MACD value suggests potential upward momentum in the market.

RSI Analysis
Nifty 50 RSI Analysis: The RSI value for Nifty 50 stands at 62.56, indicating a relatively neutral to slightly overbought condition. Typically, an RSI above 70 suggests overbought conditions, while below 30 indicates oversold levels. With the current RSI, the market does not show extreme conditions and may suggest some bullish momentum.
Up Next
?")
Global Stock Market Indices: How the World Markets performed today - (April 18, 2025)?

India revamps tax regime in 2025, new I-T Act to take effect from April 1

New Zealand commits USD 20 bn investment in India under FTA in 15 yrs; on lines of EFTA pact

India, New Zealand conclude FTA talks; pact to offer duty-free access, USD 20 bn FDI

FTA with New Zealand to significantly deepen bilateral economic engagement: Govt

Rupee breaches 91-mark against US dollar for first time in intra-day trade

More videos

Microsoft commits USD 17.5 billion investment in India: CEO Satya Nadella

CBI books Anil Ambani's son, Reliance Home Finance Ltd. in Rs 228 crore bank fraud case

RBI raises FY26 GDP growth projection to 7.3 pc

RBI trims policy interest rate by 25bps to 5.25pc, loans to get cheaper

Rupee slumps to all-time low of 90.25 against US dollar in intra-day trade

Reliance completes merger of Star Television Productions with Jiostar

India to lead emerging market growth with 7pc GDP rise in 2025: Moody’s

Nifty hits record high after 14 months; Sensex nears all-time peak

Reliance stops Russian oil use at its only-for-export refinery to comply with EU sanctions

ED attaches fresh assets worth over Rs 1,400 cr in case against Anil Ambani's Reliance Group