


Highlights
Latest news

Vijay Hazare trophy: Rohit Sharma smashes 155, enthralls 20,000 fans in Jaipur

India to get three new airlines as Shankh Air, Al Hind Air, FlyExpress receive NOC from government

Delhi HC directs GST Council to meet at earliest, consider lowering GST on air purifiers

Cabinet clears Delhi Metro Phase 5A project worth Rs 12,015 crore

Got apology from Bumrah & Pant; Conrad should've chosen better words: Bavuma reflects on India tour

Virat Kohli goes past Tendulkar to become fastest to 16000 List A runs

Delhi HC expresses displeasure over no tax exemption on air purifiers in 'emergency situation'
-MNS alliance, compares hype to Russia-Ukraine peace talks")
Fadnavis mocks Sena (UBT)-MNS alliance, compares hype to Russia-Ukraine peace talks
Global Stock Market Indices: How the World Markets performed today - (April 16, 2025)?


?")
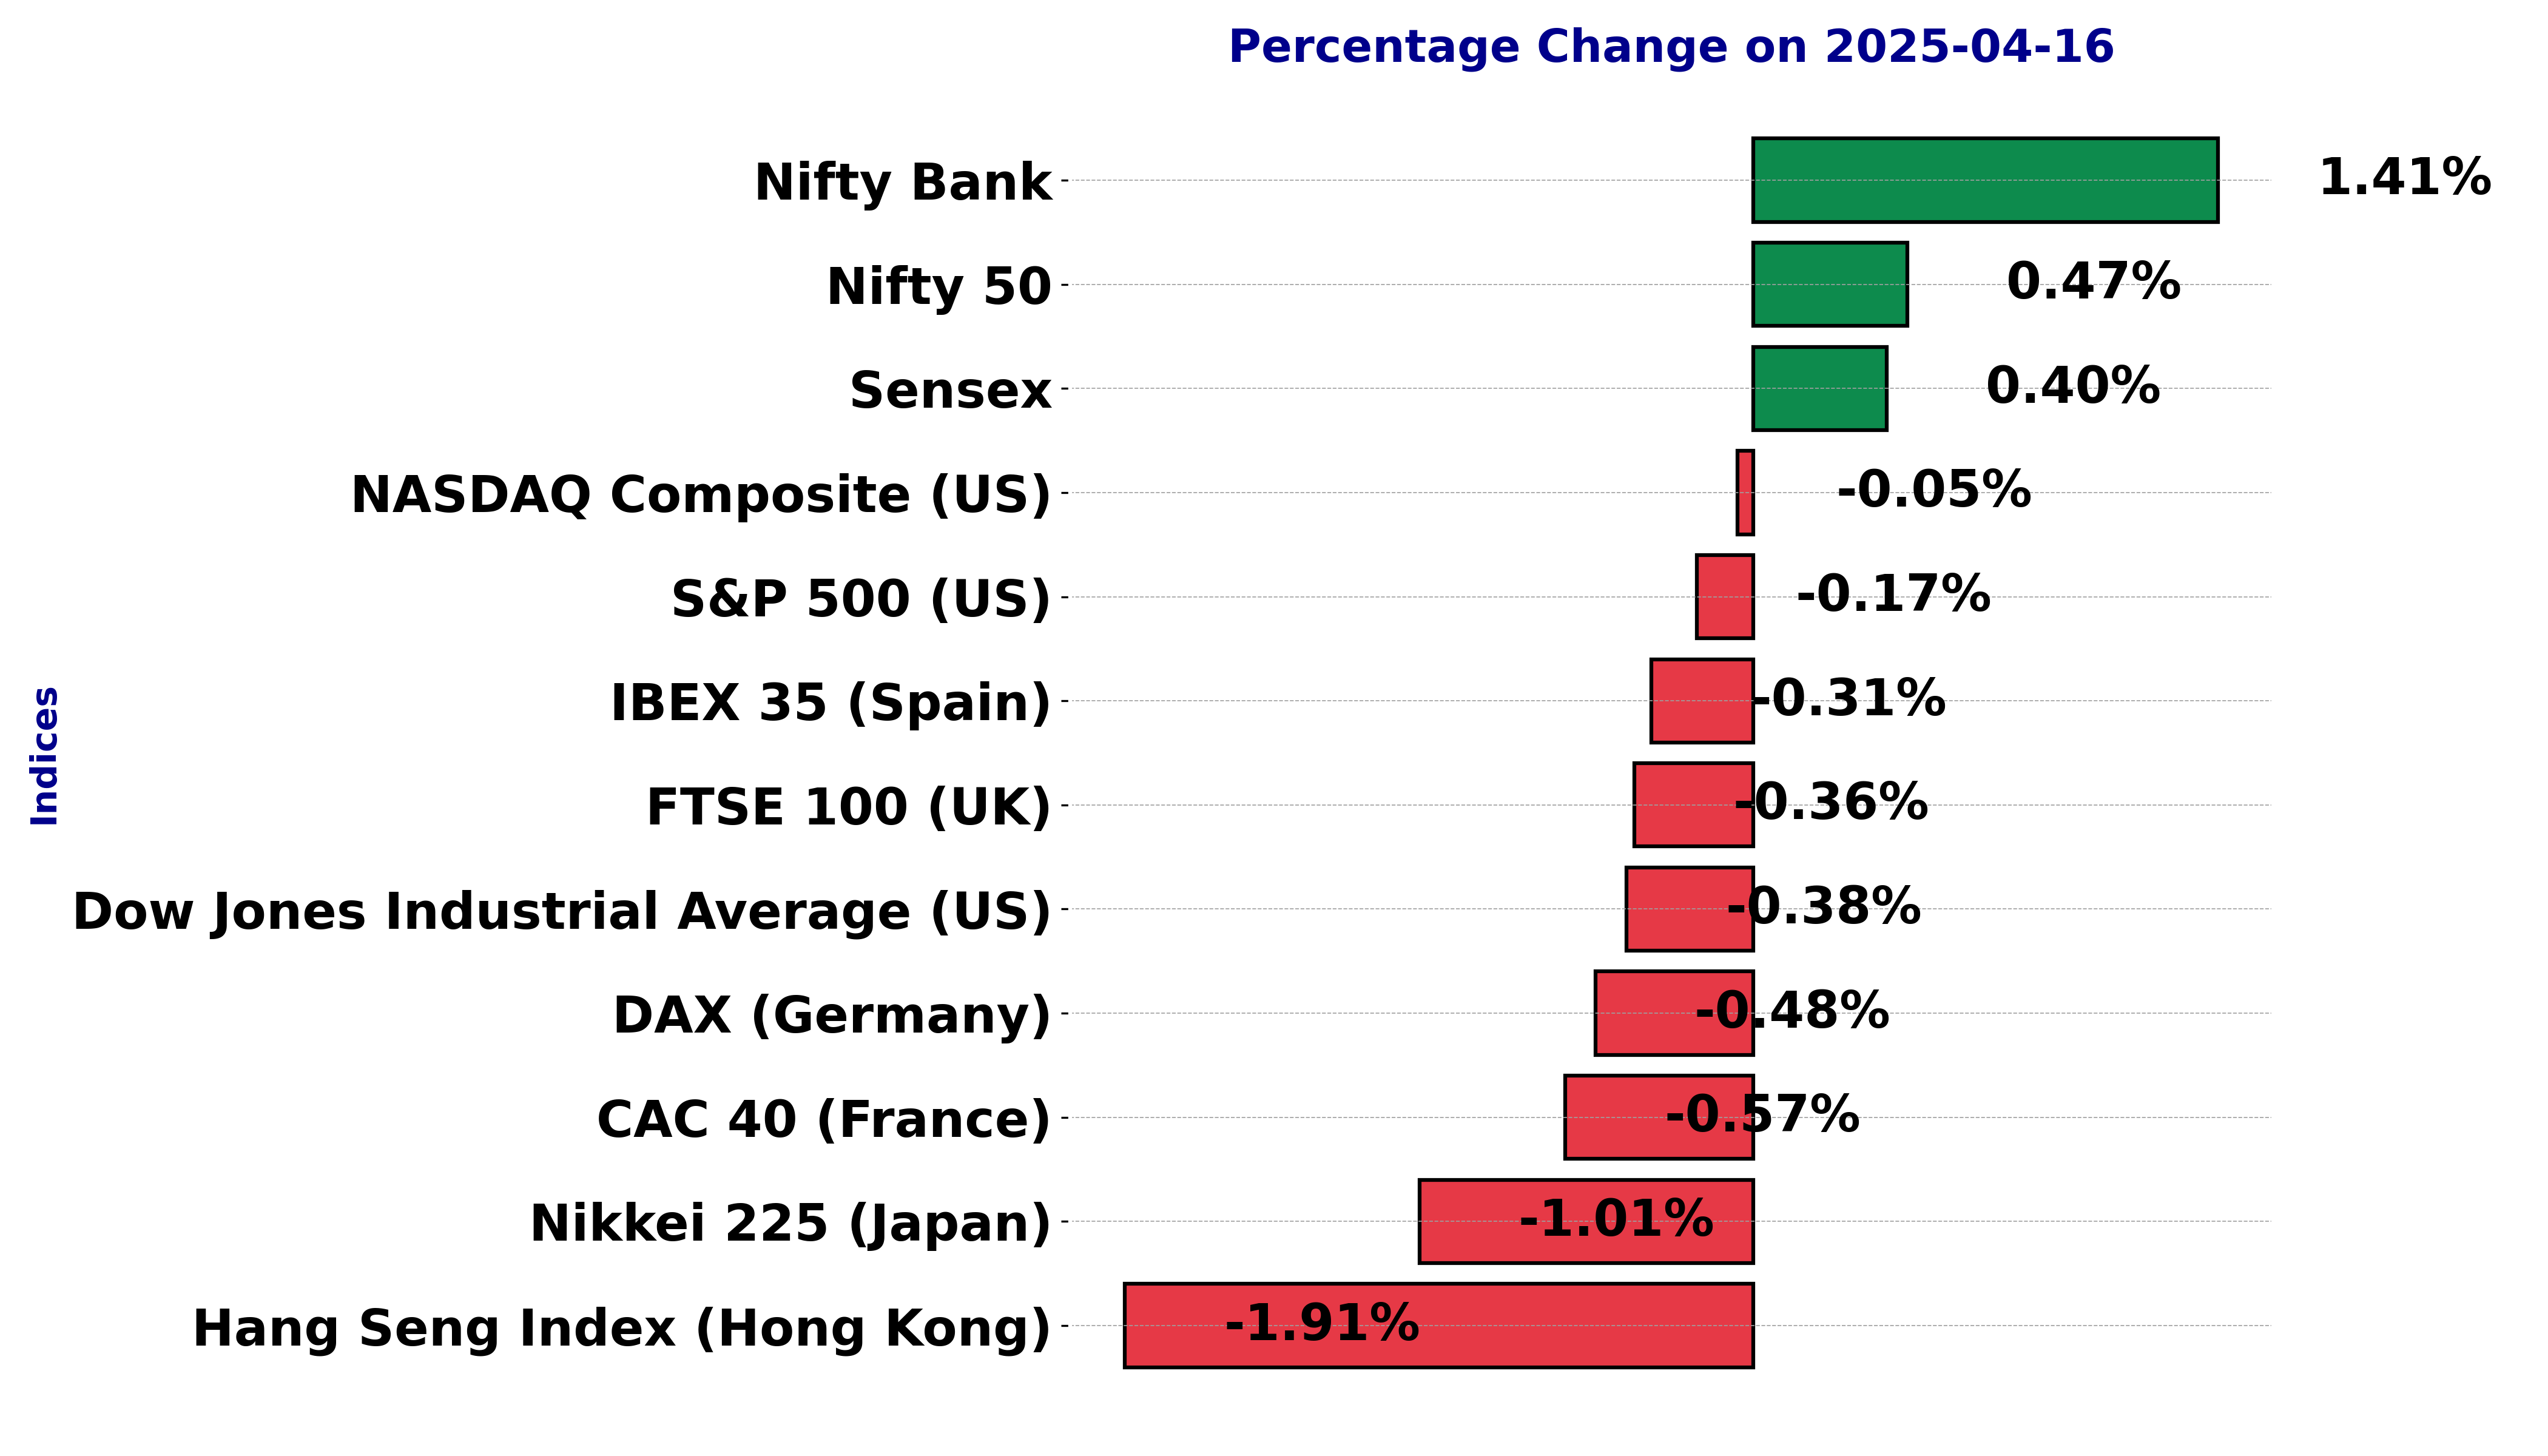
The international stock market indices showed varied performances on April 16, 2025, reflecting the economic sentiment across different regions.
In this article, we analyze the performance of key global indices including the S&P 500, Dow Jones Industrial Average, NASDAQ Composite, FTSE 100, DAX, CAC 40, IBEX 35, Nikkei 225, Hang Seng, Nifty 50, and BSE Sensex.
Analysis for Sensex - April 16, 2025

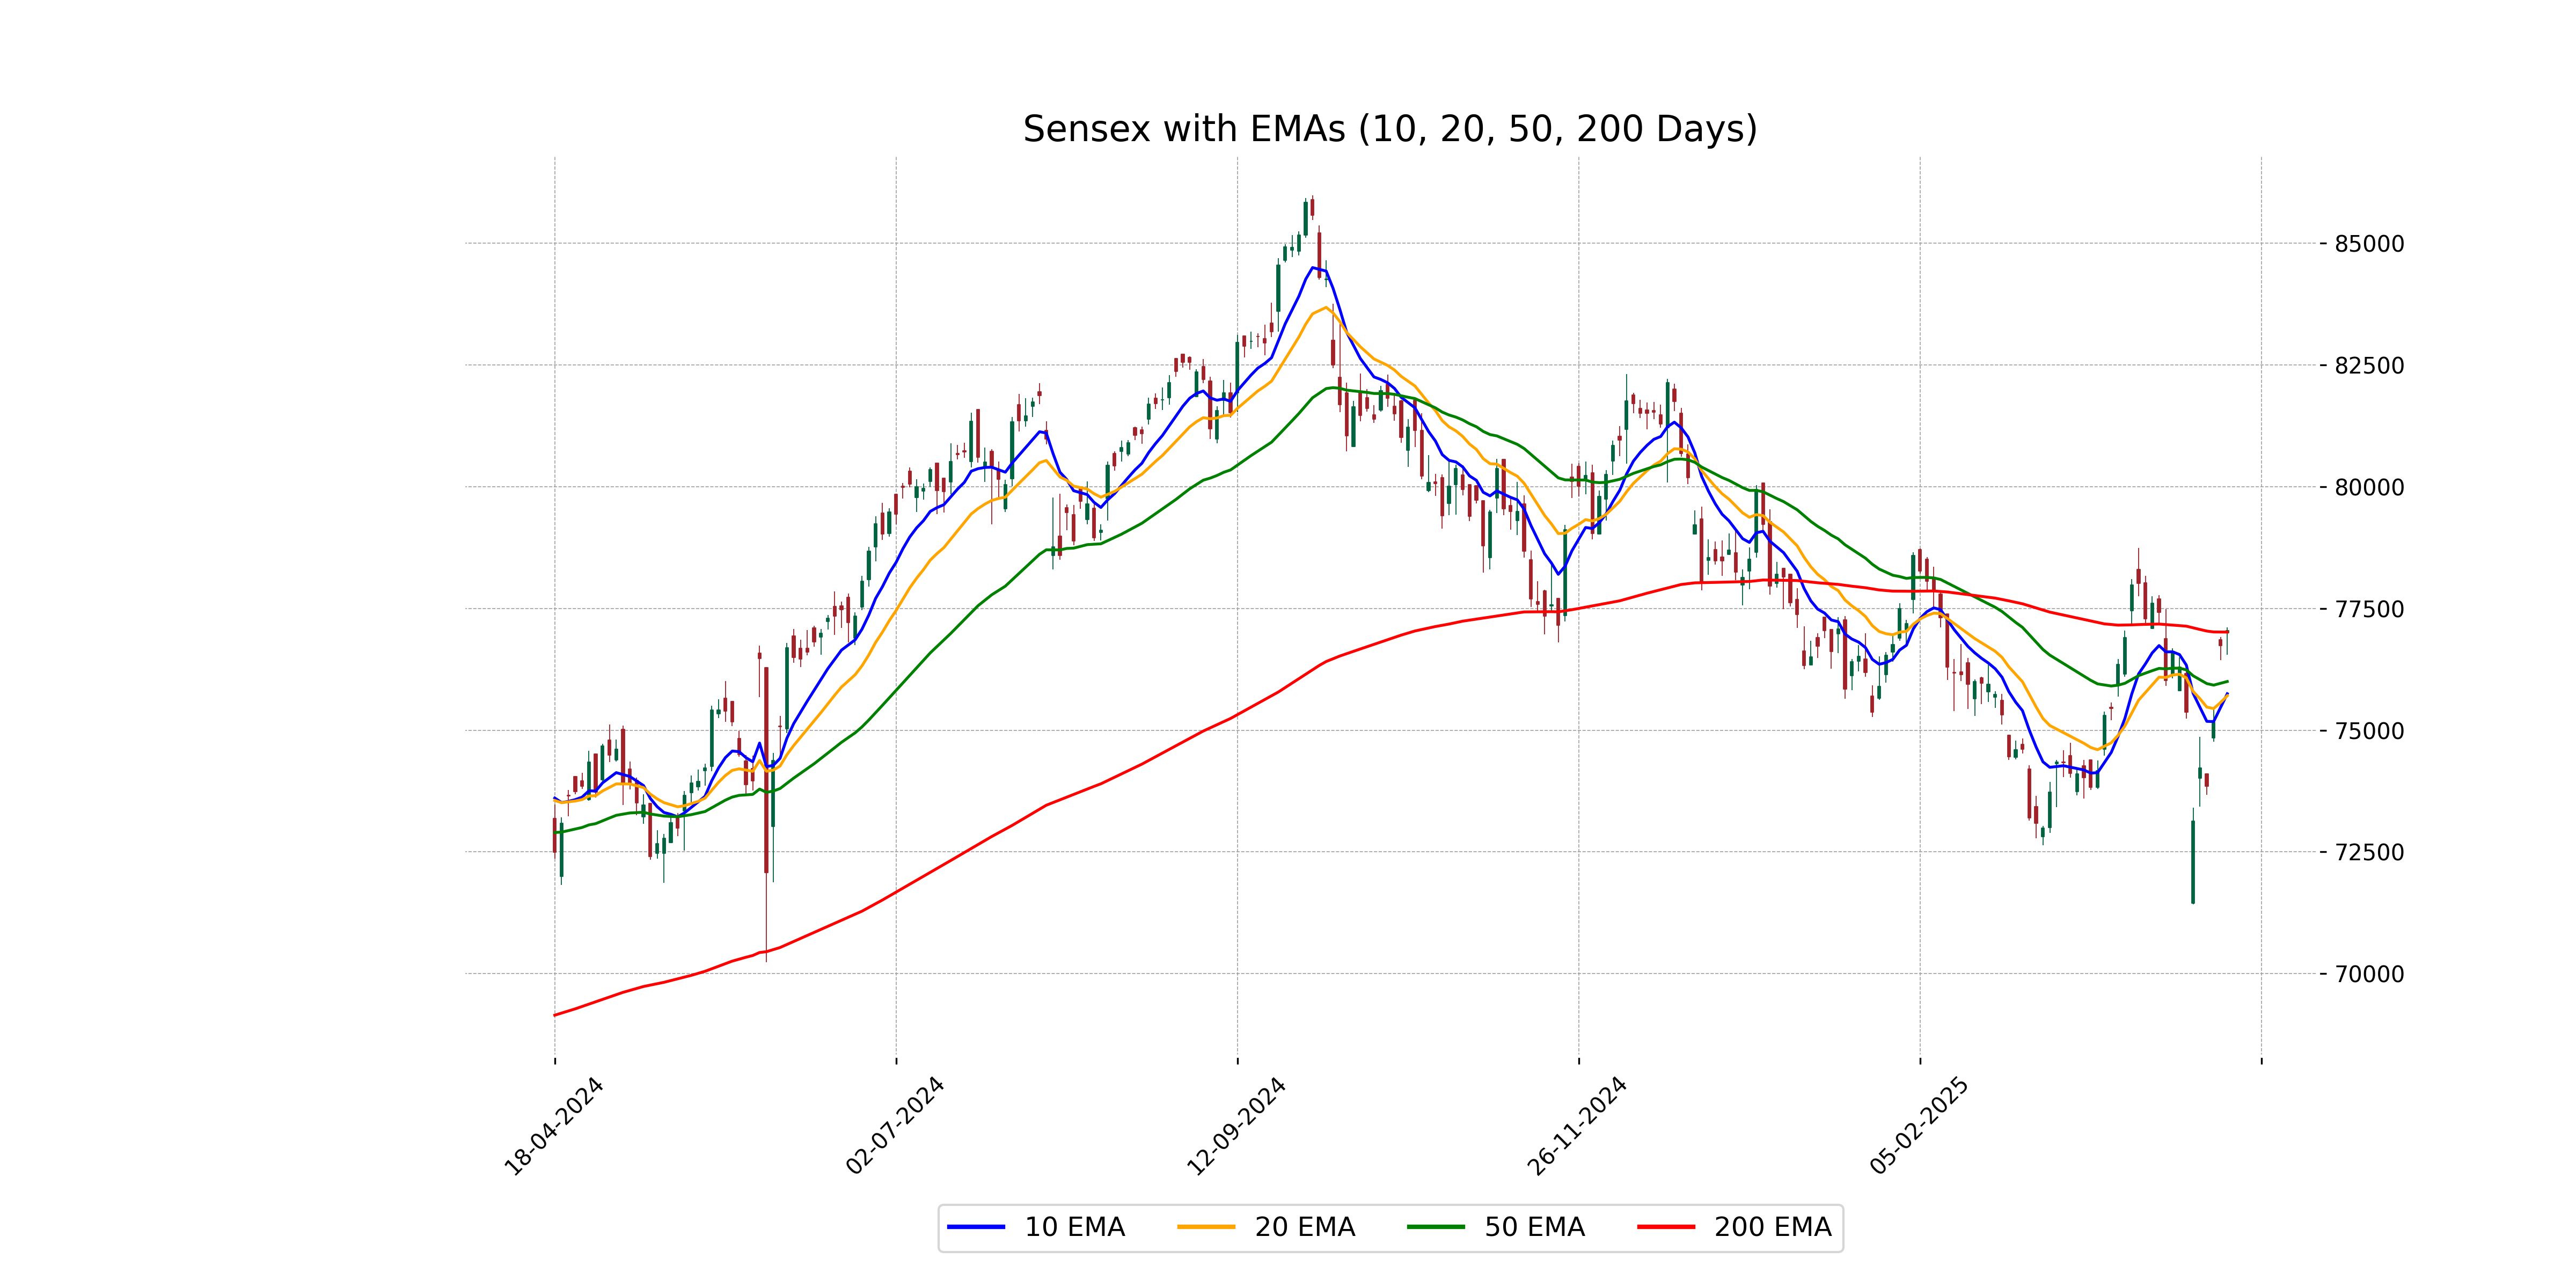
Sensex opened at 76,996.78 and closed at 77,044.29, reflecting a positive change of 0.40%, with a points increase of 309.40. The index saw a high of 77,110.23 and a low of 76,543.77. Technical indicators show that the current price is above the 50-day and 10-day EMAs, and the RSI stands at 57.01, indicating a moderately bullish sentiment.
Relationship with Key Moving Averages
The Sensex closed at 77044.29, slightly above its 200-day EMA (77013.99), indicating a potential bullish sentiment. It is also above the 50-day EMA (75999.26) and significantly above the 10-day EMA (75747.89) and 20-day EMA (75707.25), further confirming a short-term upward momentum.
Moving Averages Trend (MACD)
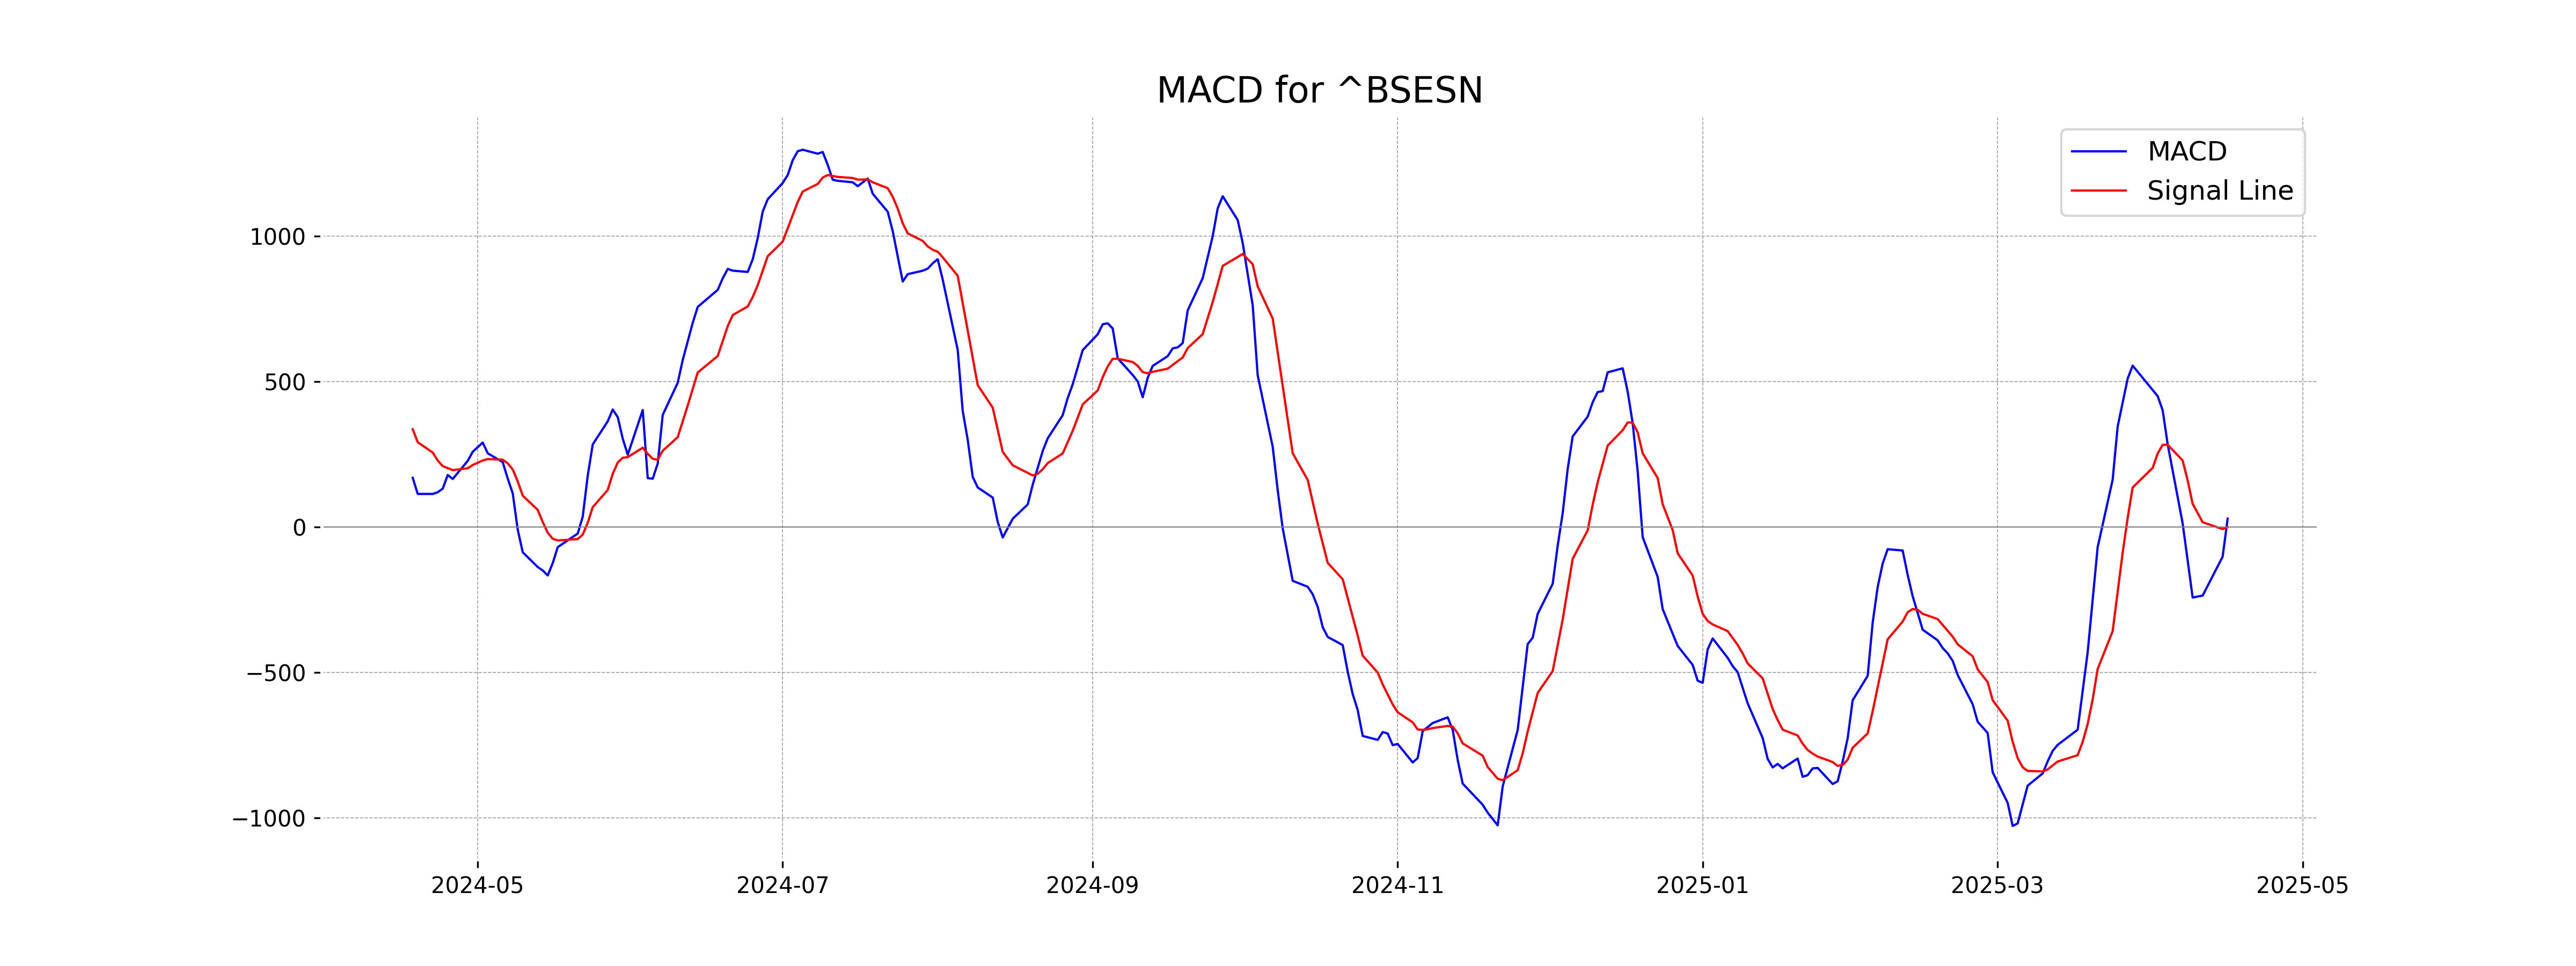
MACD Analysis for Sensex: The MACD value of 29.34, which is significantly above the MACD Signal line value of 0.60, suggests a bullish momentum in the market. This indicates that the Sensex may continue to experience upward price movements.
RSI Analysis
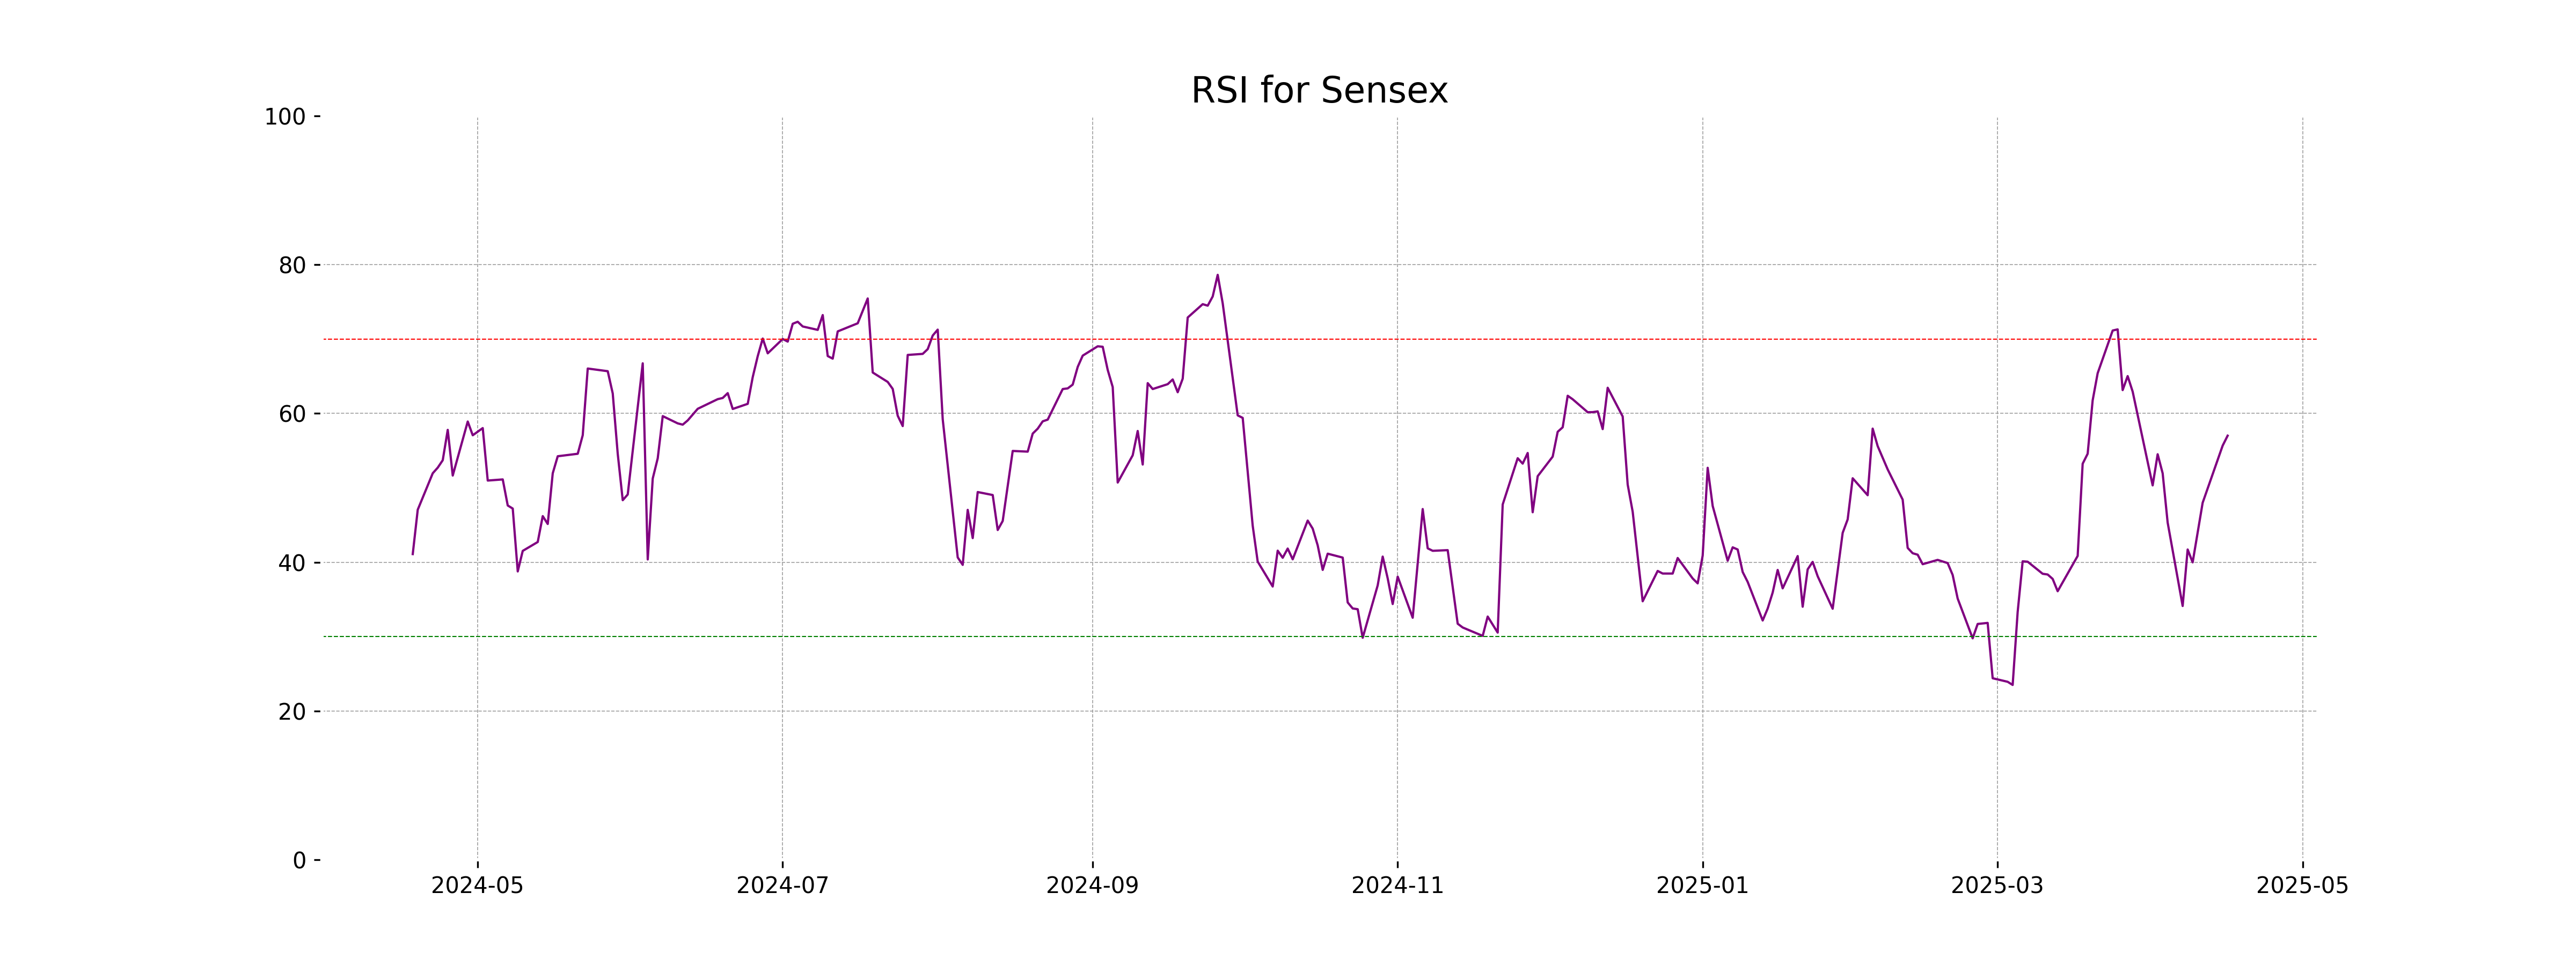
The RSI value of 57.01 for Sensex indicates that the index is in the neutral range, suggesting neither overbought nor oversold conditions. This might imply a balanced market sentiment, with no immediate indications of potential entry or exit points based purely on RSI.
Analysis for Dow Jones Industrial Average (US) - April 16, 2025

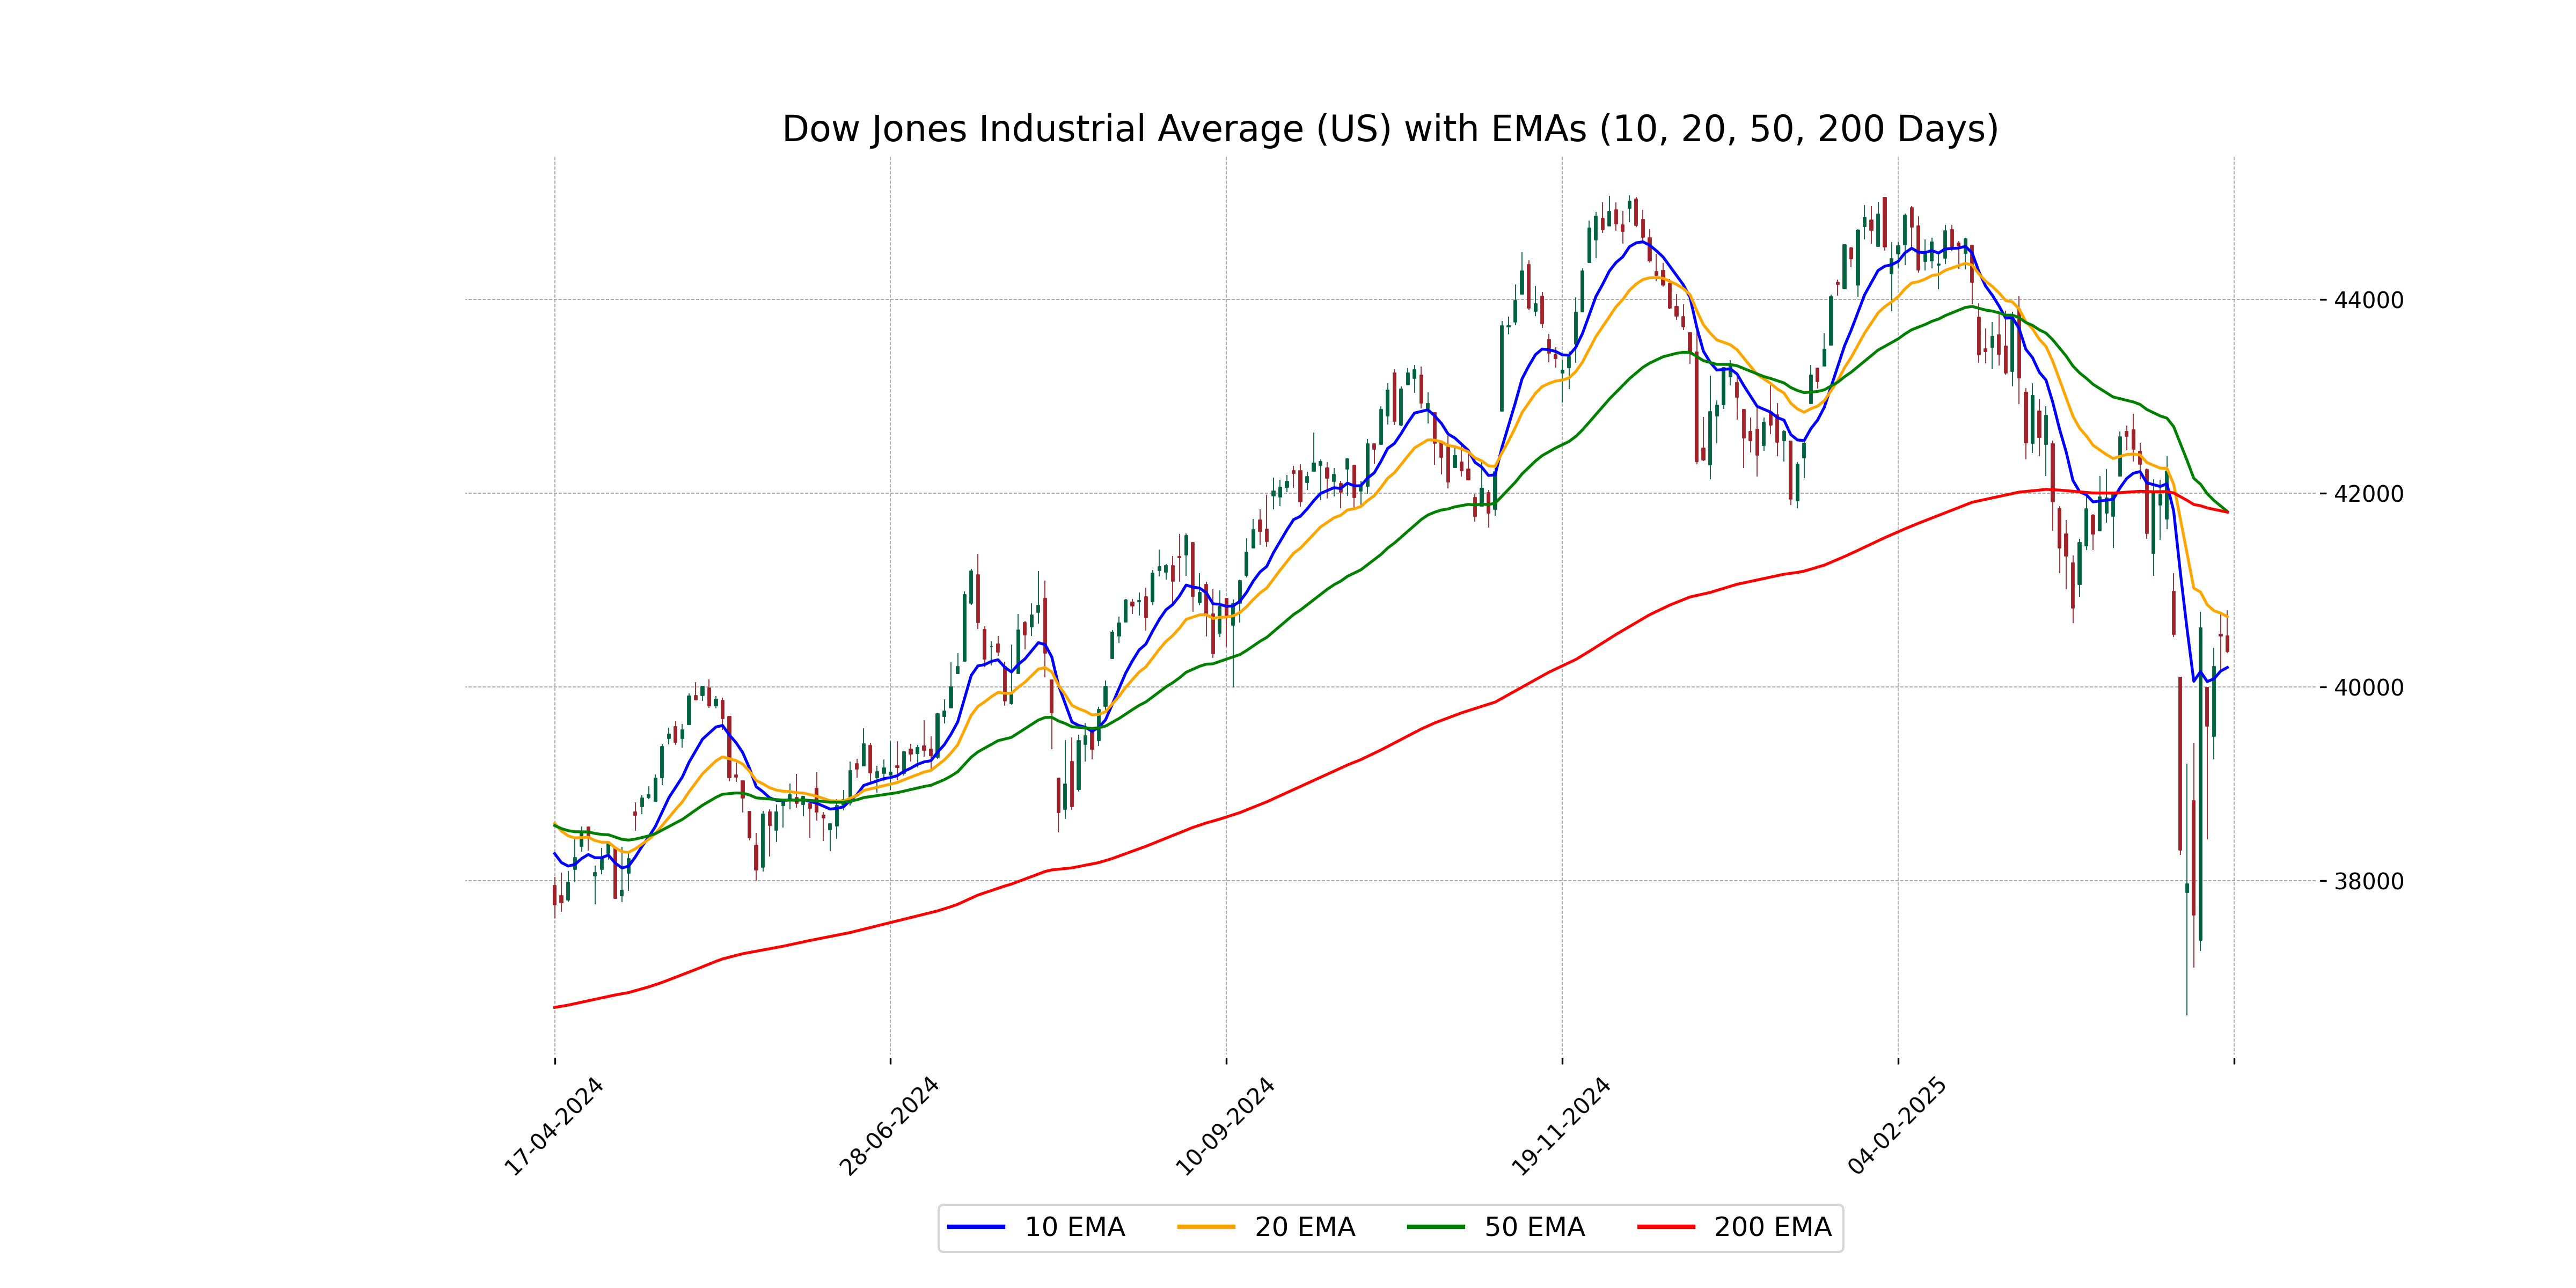
The Dow Jones Industrial Average opened at 40,527.82, reached a high of 40,791.18, and closed at 40,368.96, marking a decrease of 0.38% from its previous close. The index showed a substantial points drop of 155.83, indicating bearish sentiment with a relatively low RSI at 45.80, suggesting potential overselling.
Relationship with Key Moving Averages
The Dow Jones Industrial Average's close (40,368.96) is below its 50 EMA (41,811.82) and 200 EMA (41,804.85), suggesting a bearish trend in the longer-term averages. However, it is above the 10 EMA (40,201.76), which might indicate some short-term bullish momentum.
Moving Averages Trend (MACD)
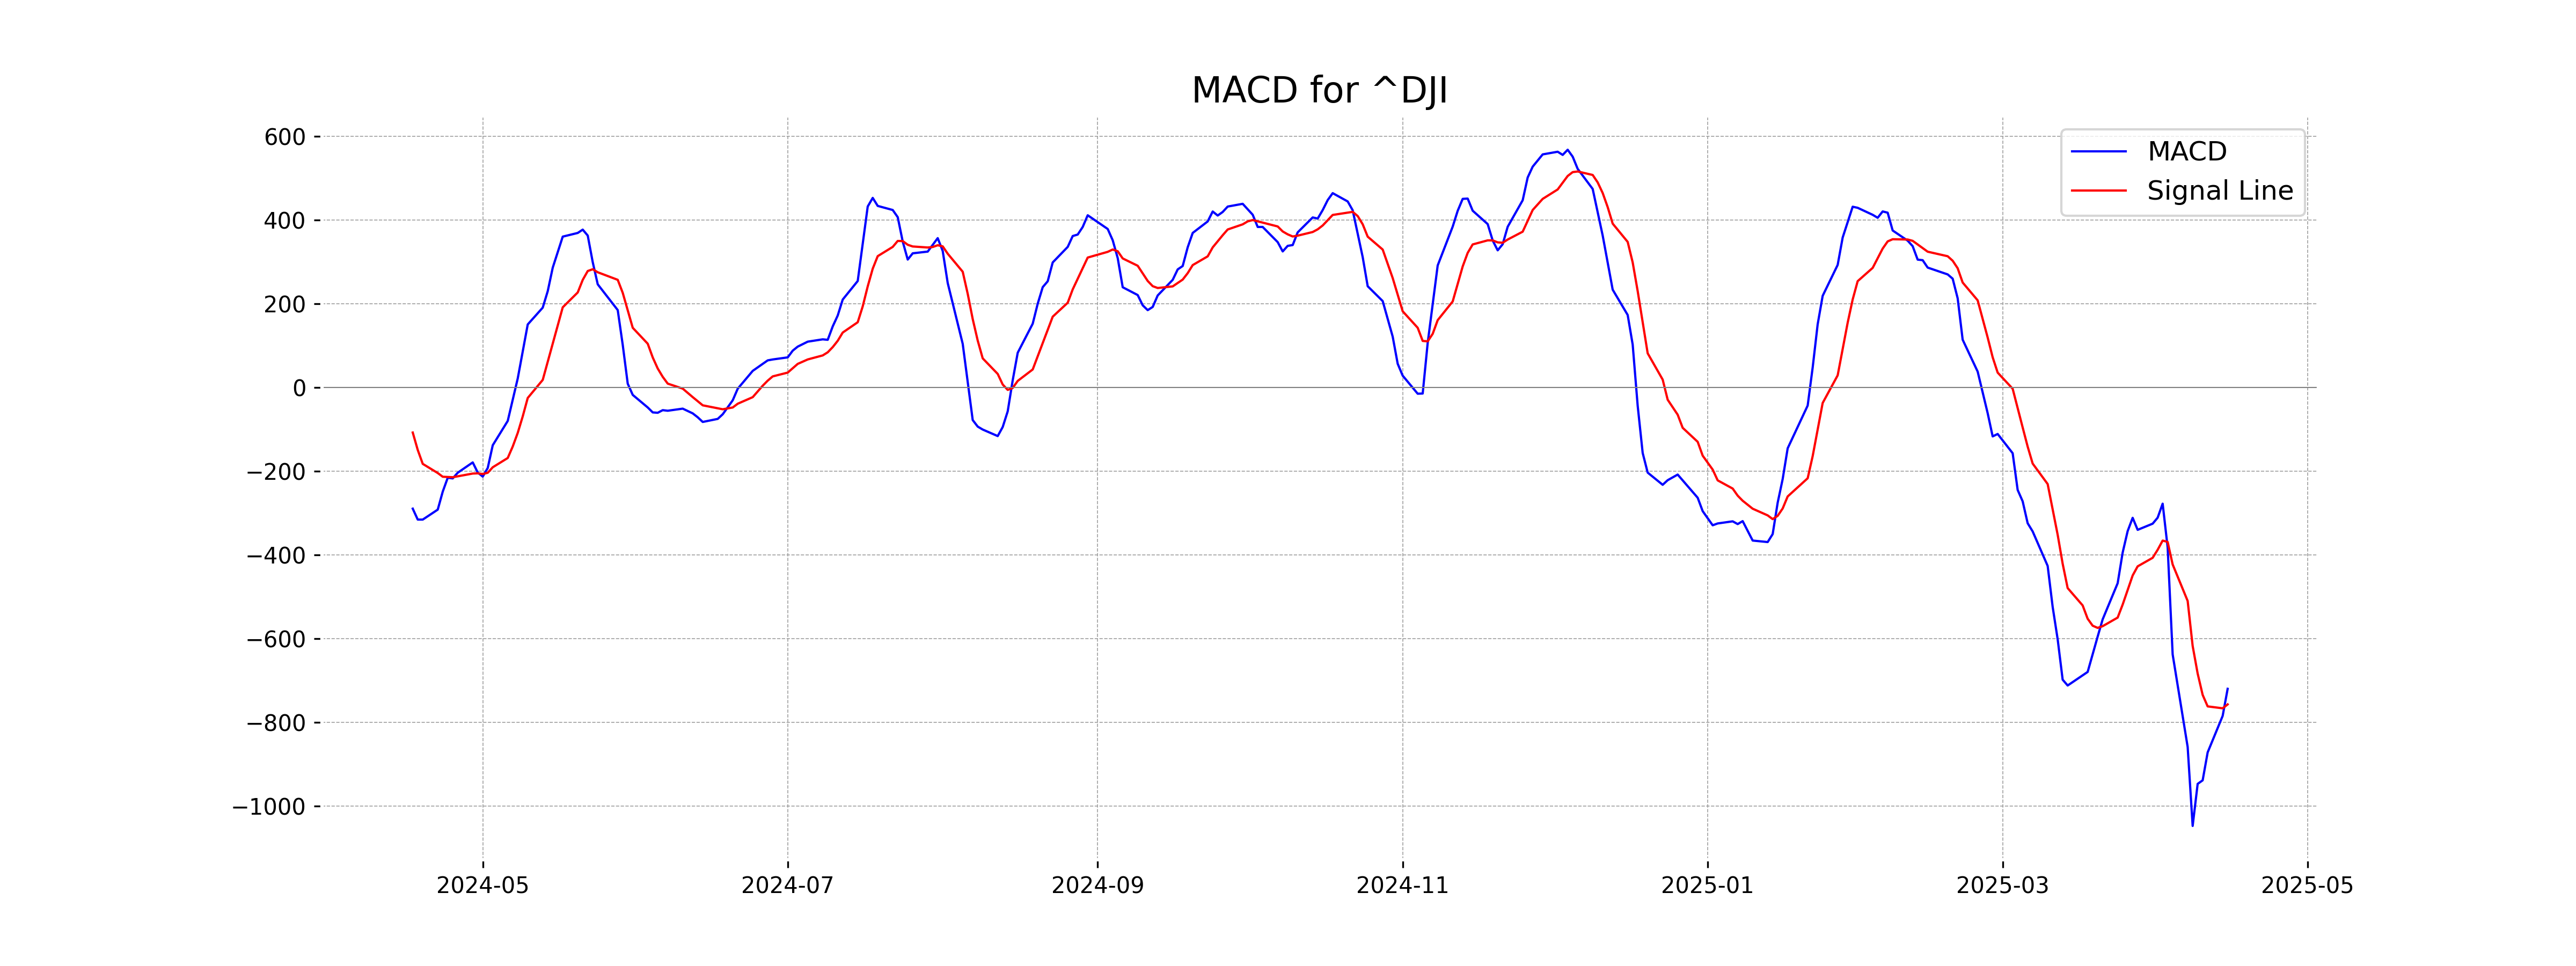
MACD Analysis for Dow Jones Industrial Average (US): The MACD value of -719.34 compared to the MACD Signal of -756.56 indicates a potential bullish signal, as the MACD is moving upwards towards crossing the signal line. This suggests a possibility of upward momentum change in the near term.
RSI Analysis
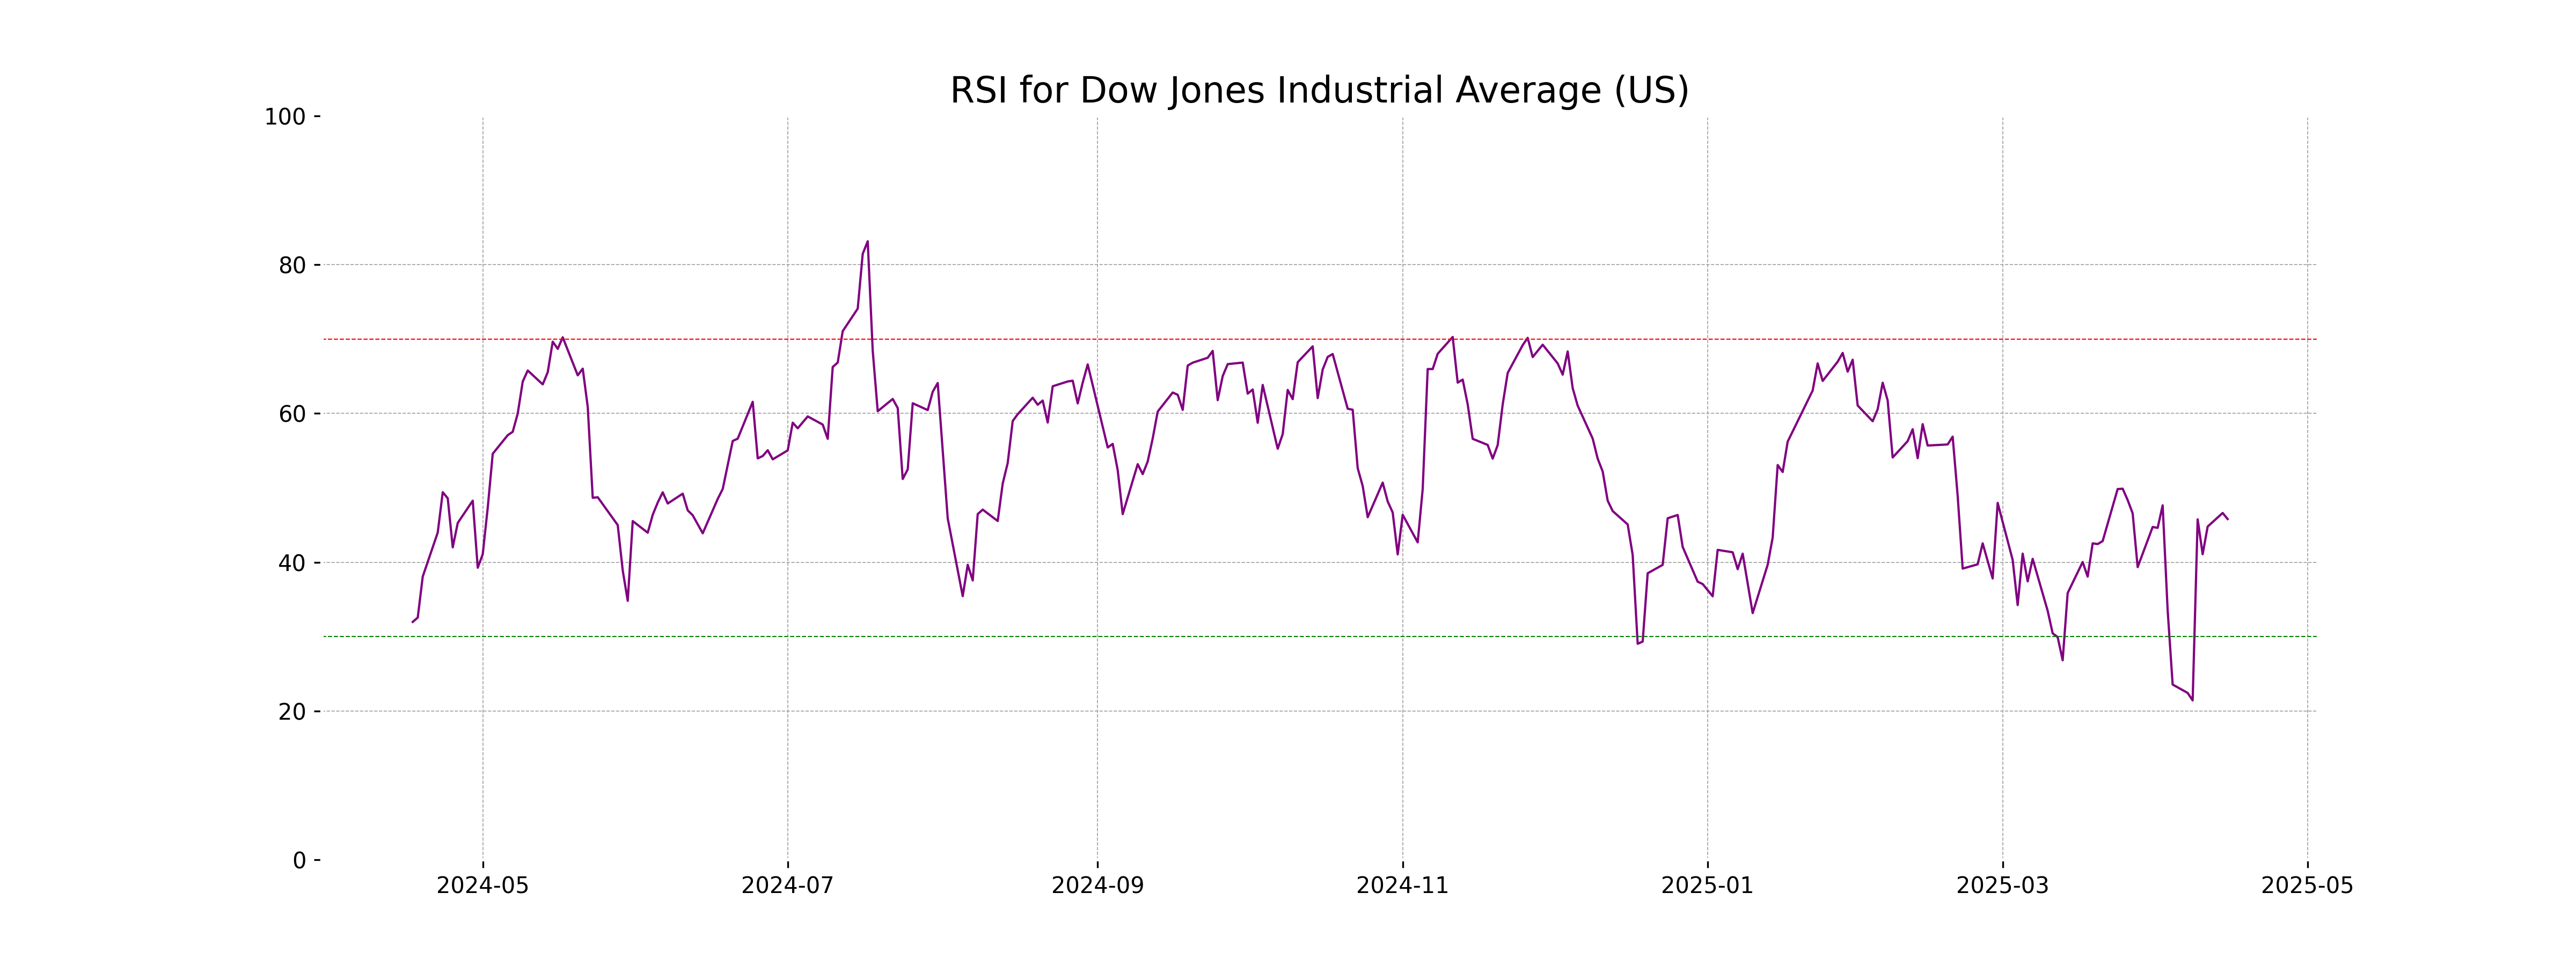
The RSI for Dow Jones Industrial Average is currently 45.80, which indicates a neutral market sentiment. RSI values between 30 and 70 suggest that the index is neither overbought nor oversold, pointing towards consolidation or a balanced trading environment.
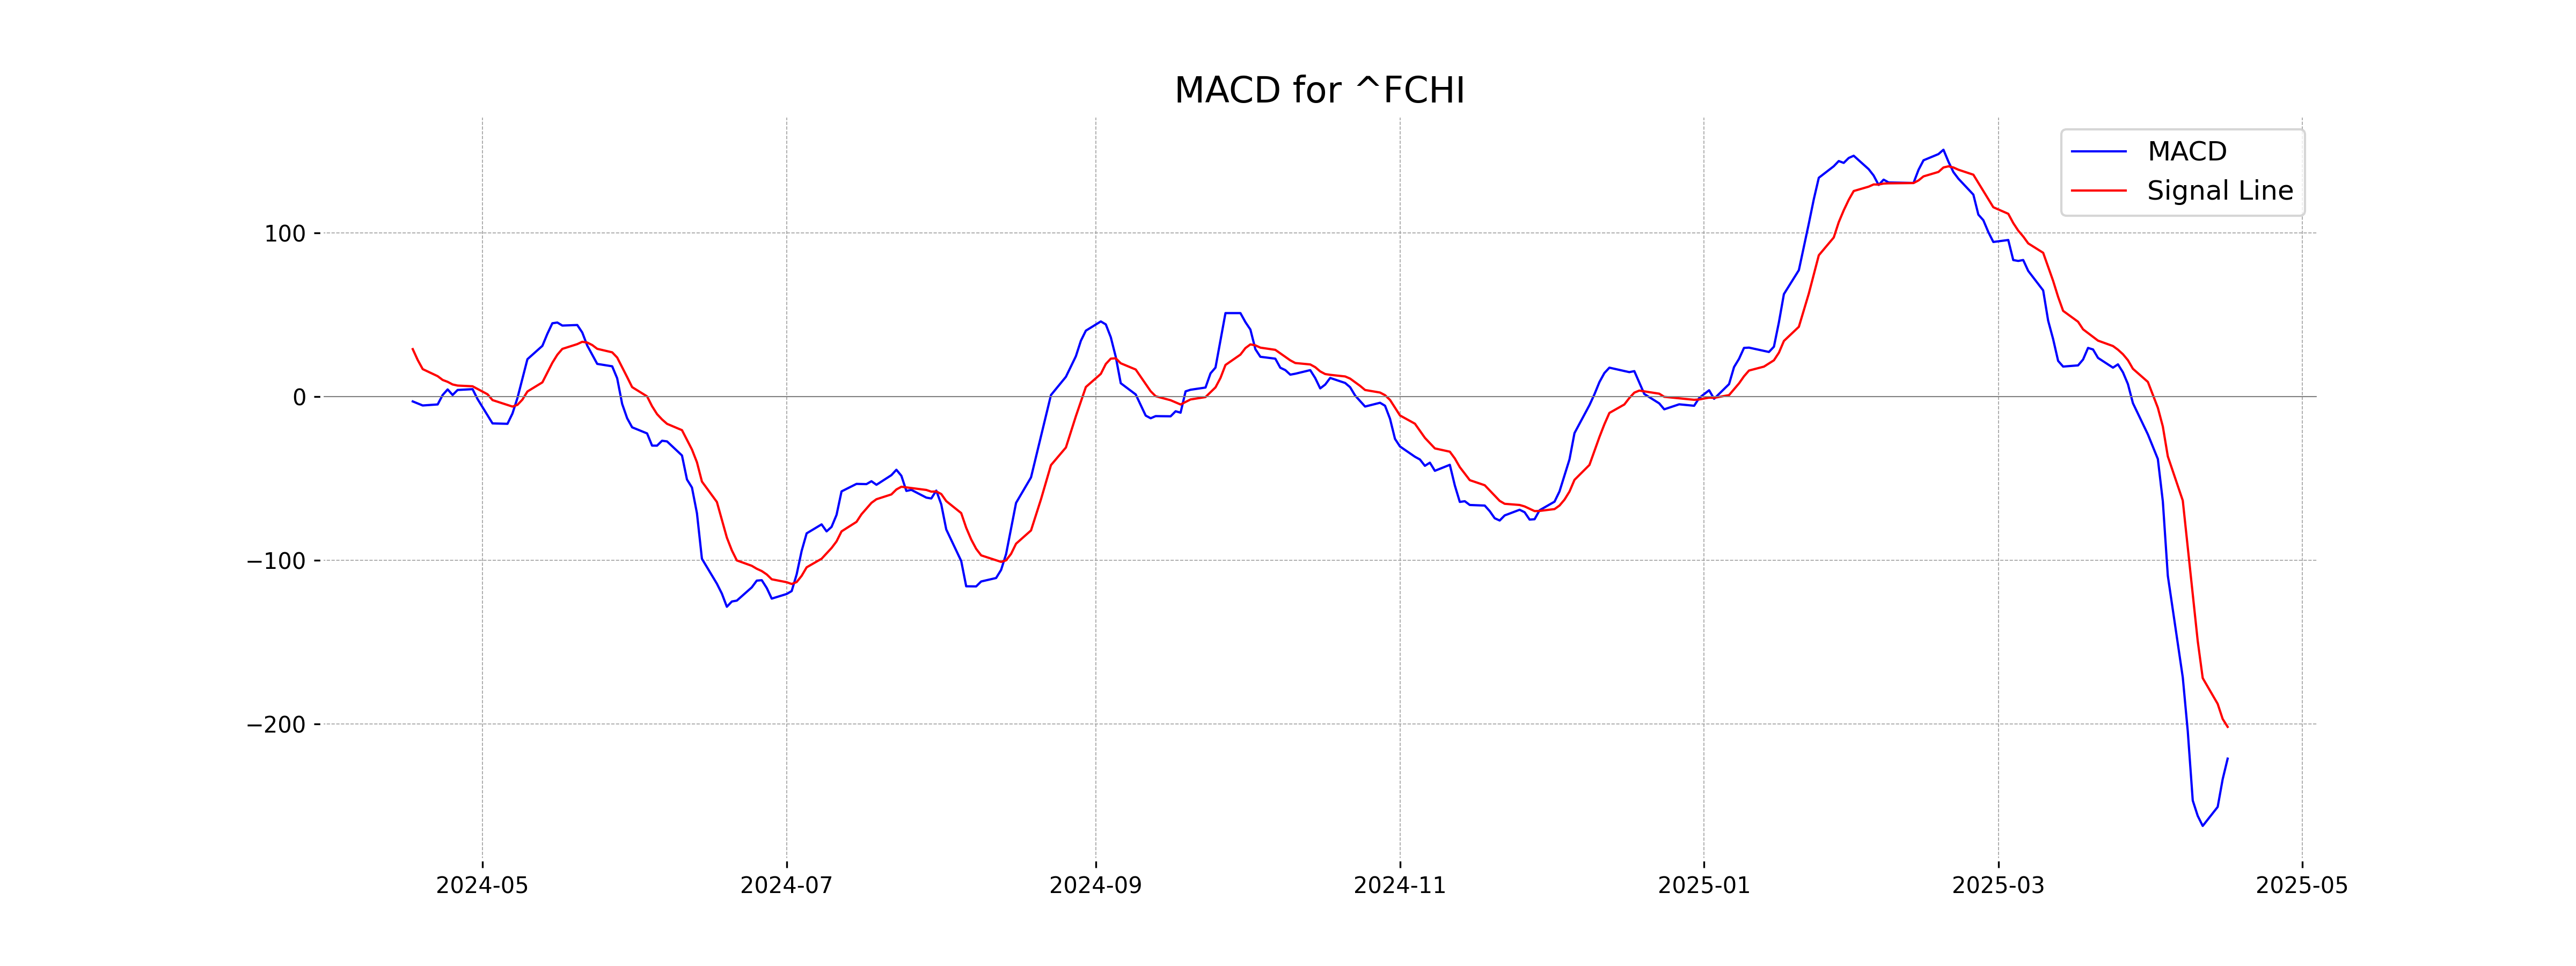
Analysis for CAC 40 (France) - April 16, 2025

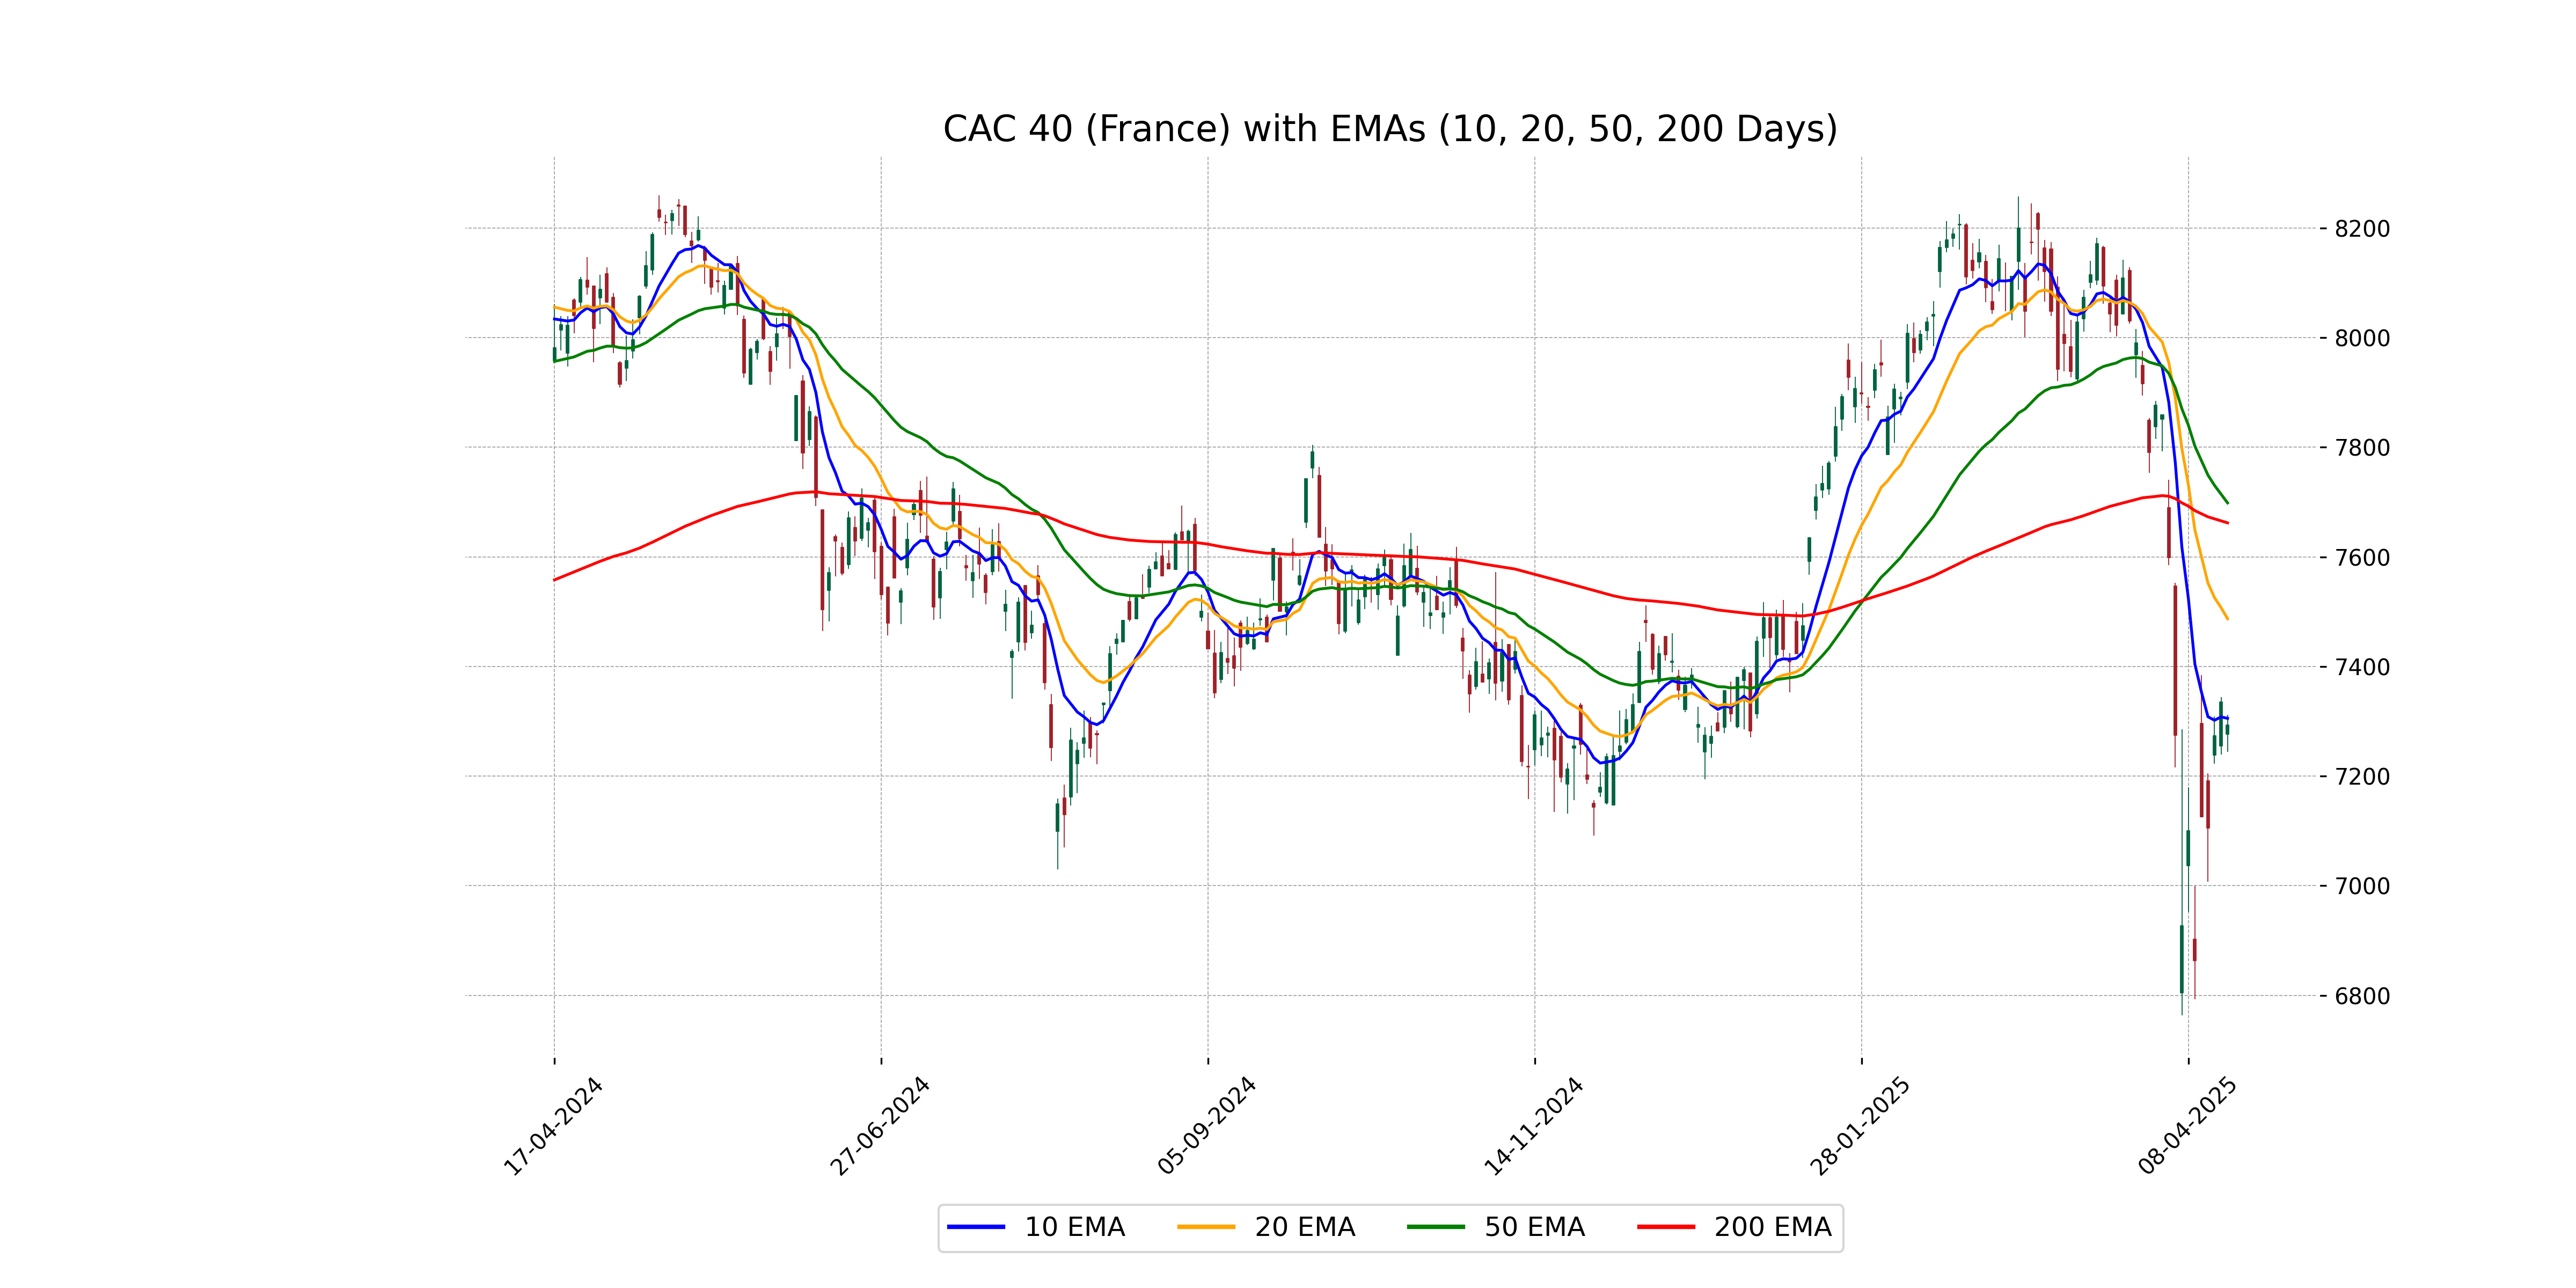
CAC 40 (France) Performance: The CAC 40 index opened at 7276.39 and closed at 7293.57, with a weekly decrease of approximately -0.57%, reflecting a points change of -41.83. It experienced volatility within a high of 7311.24 and a low of 7243.77. The RSI of 40.93 suggests a bearish momentum, with the MACD indicating a downtrend.
Relationship with Key Moving Averages
The CAC 40 (France) closed below its 10 EMA, 50 EMA, and 200 EMA, indicating a bearish trend in the short to long term. The RSI is at 40.93, suggesting a bearish momentum, while the MACD is negative and below the signal line, supporting a further bearish outlook.
Moving Averages Trend (MACD)
The MACD for CAC 40 (France) is -221.29, which is below the MACD Signal line at -201.89, indicating a bearish trend. This suggests potential downward momentum as the MACD line is moving lower compared to its signal.
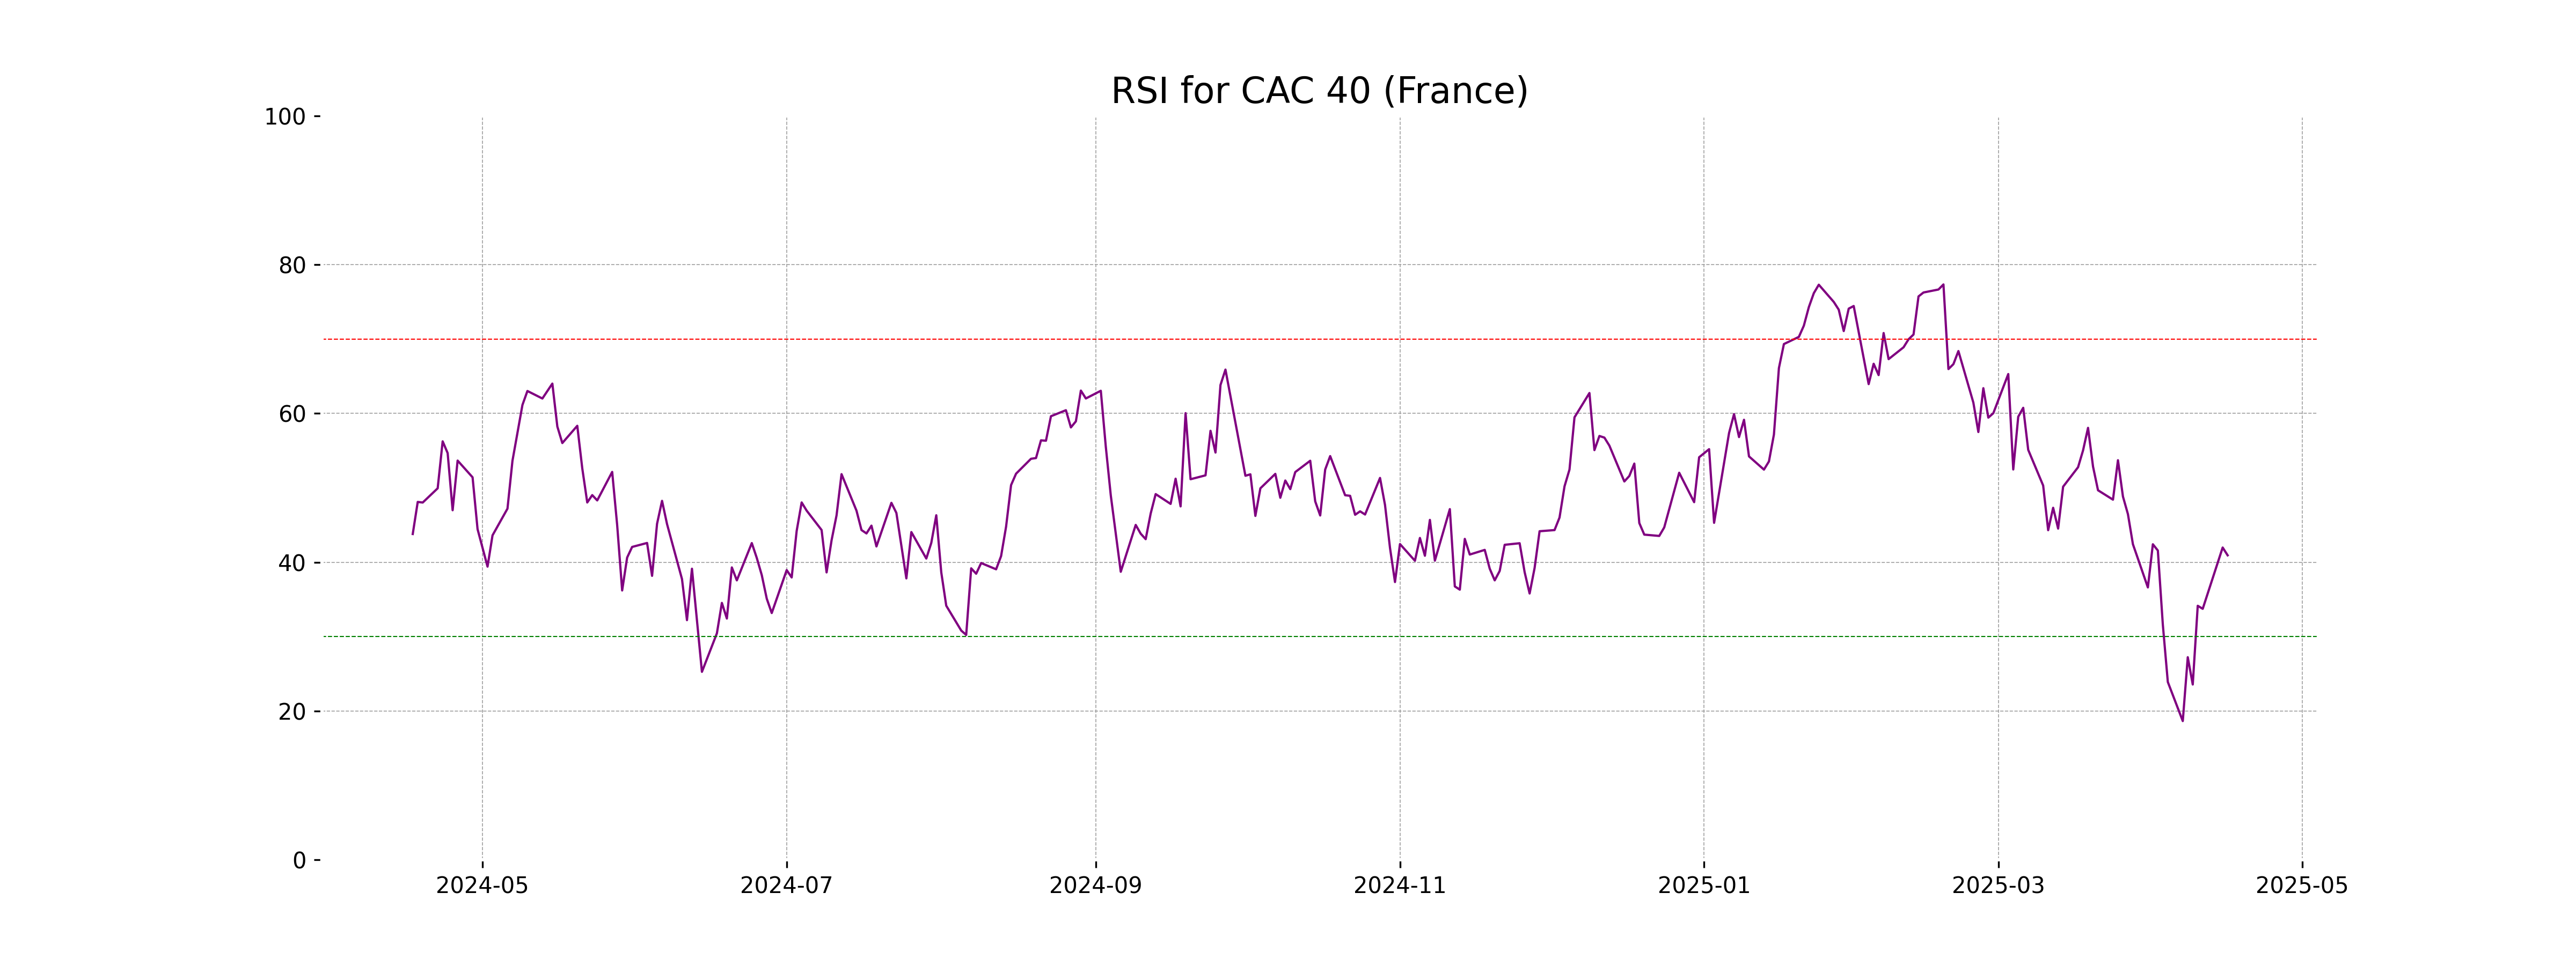
RSI Analysis
The RSI for CAC 40 (France) is 40.93, which can be considered as approaching the oversold territory, suggesting potential bearish sentiment, as it is below the neutral level of 50. This indicates a possibility for a reversal if the market sentiment changes.
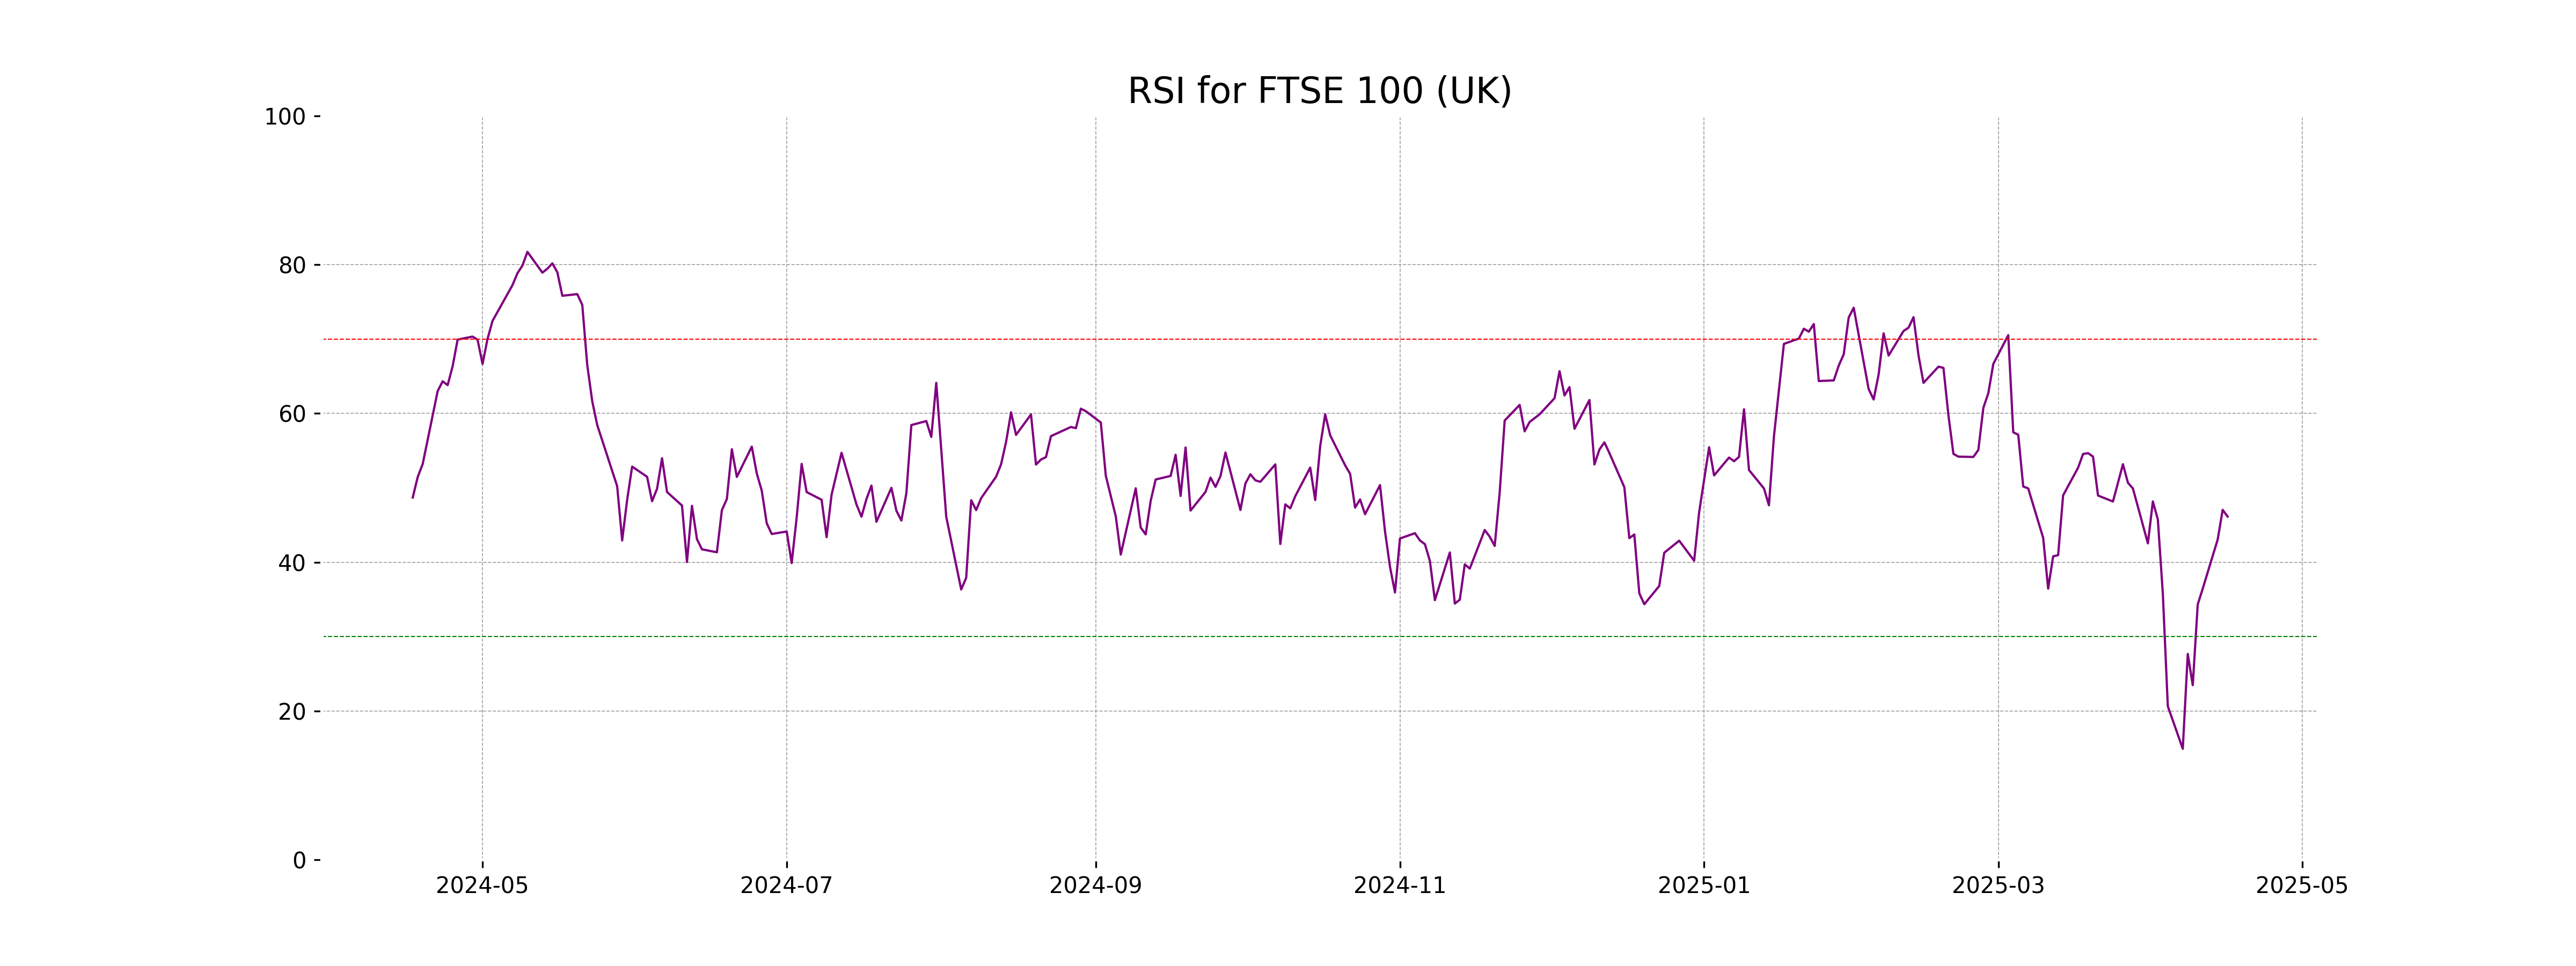
Analysis for FTSE 100 (UK) - April 16, 2025

FTSE 100 (UK) opened at 8249.12, experienced a decline with a closing of 8219.23, indicating a decrease of 0.36%. The index's technical indicators show a MACD value of -153.25 with an RSI of 46.13, suggesting a bearish trend.
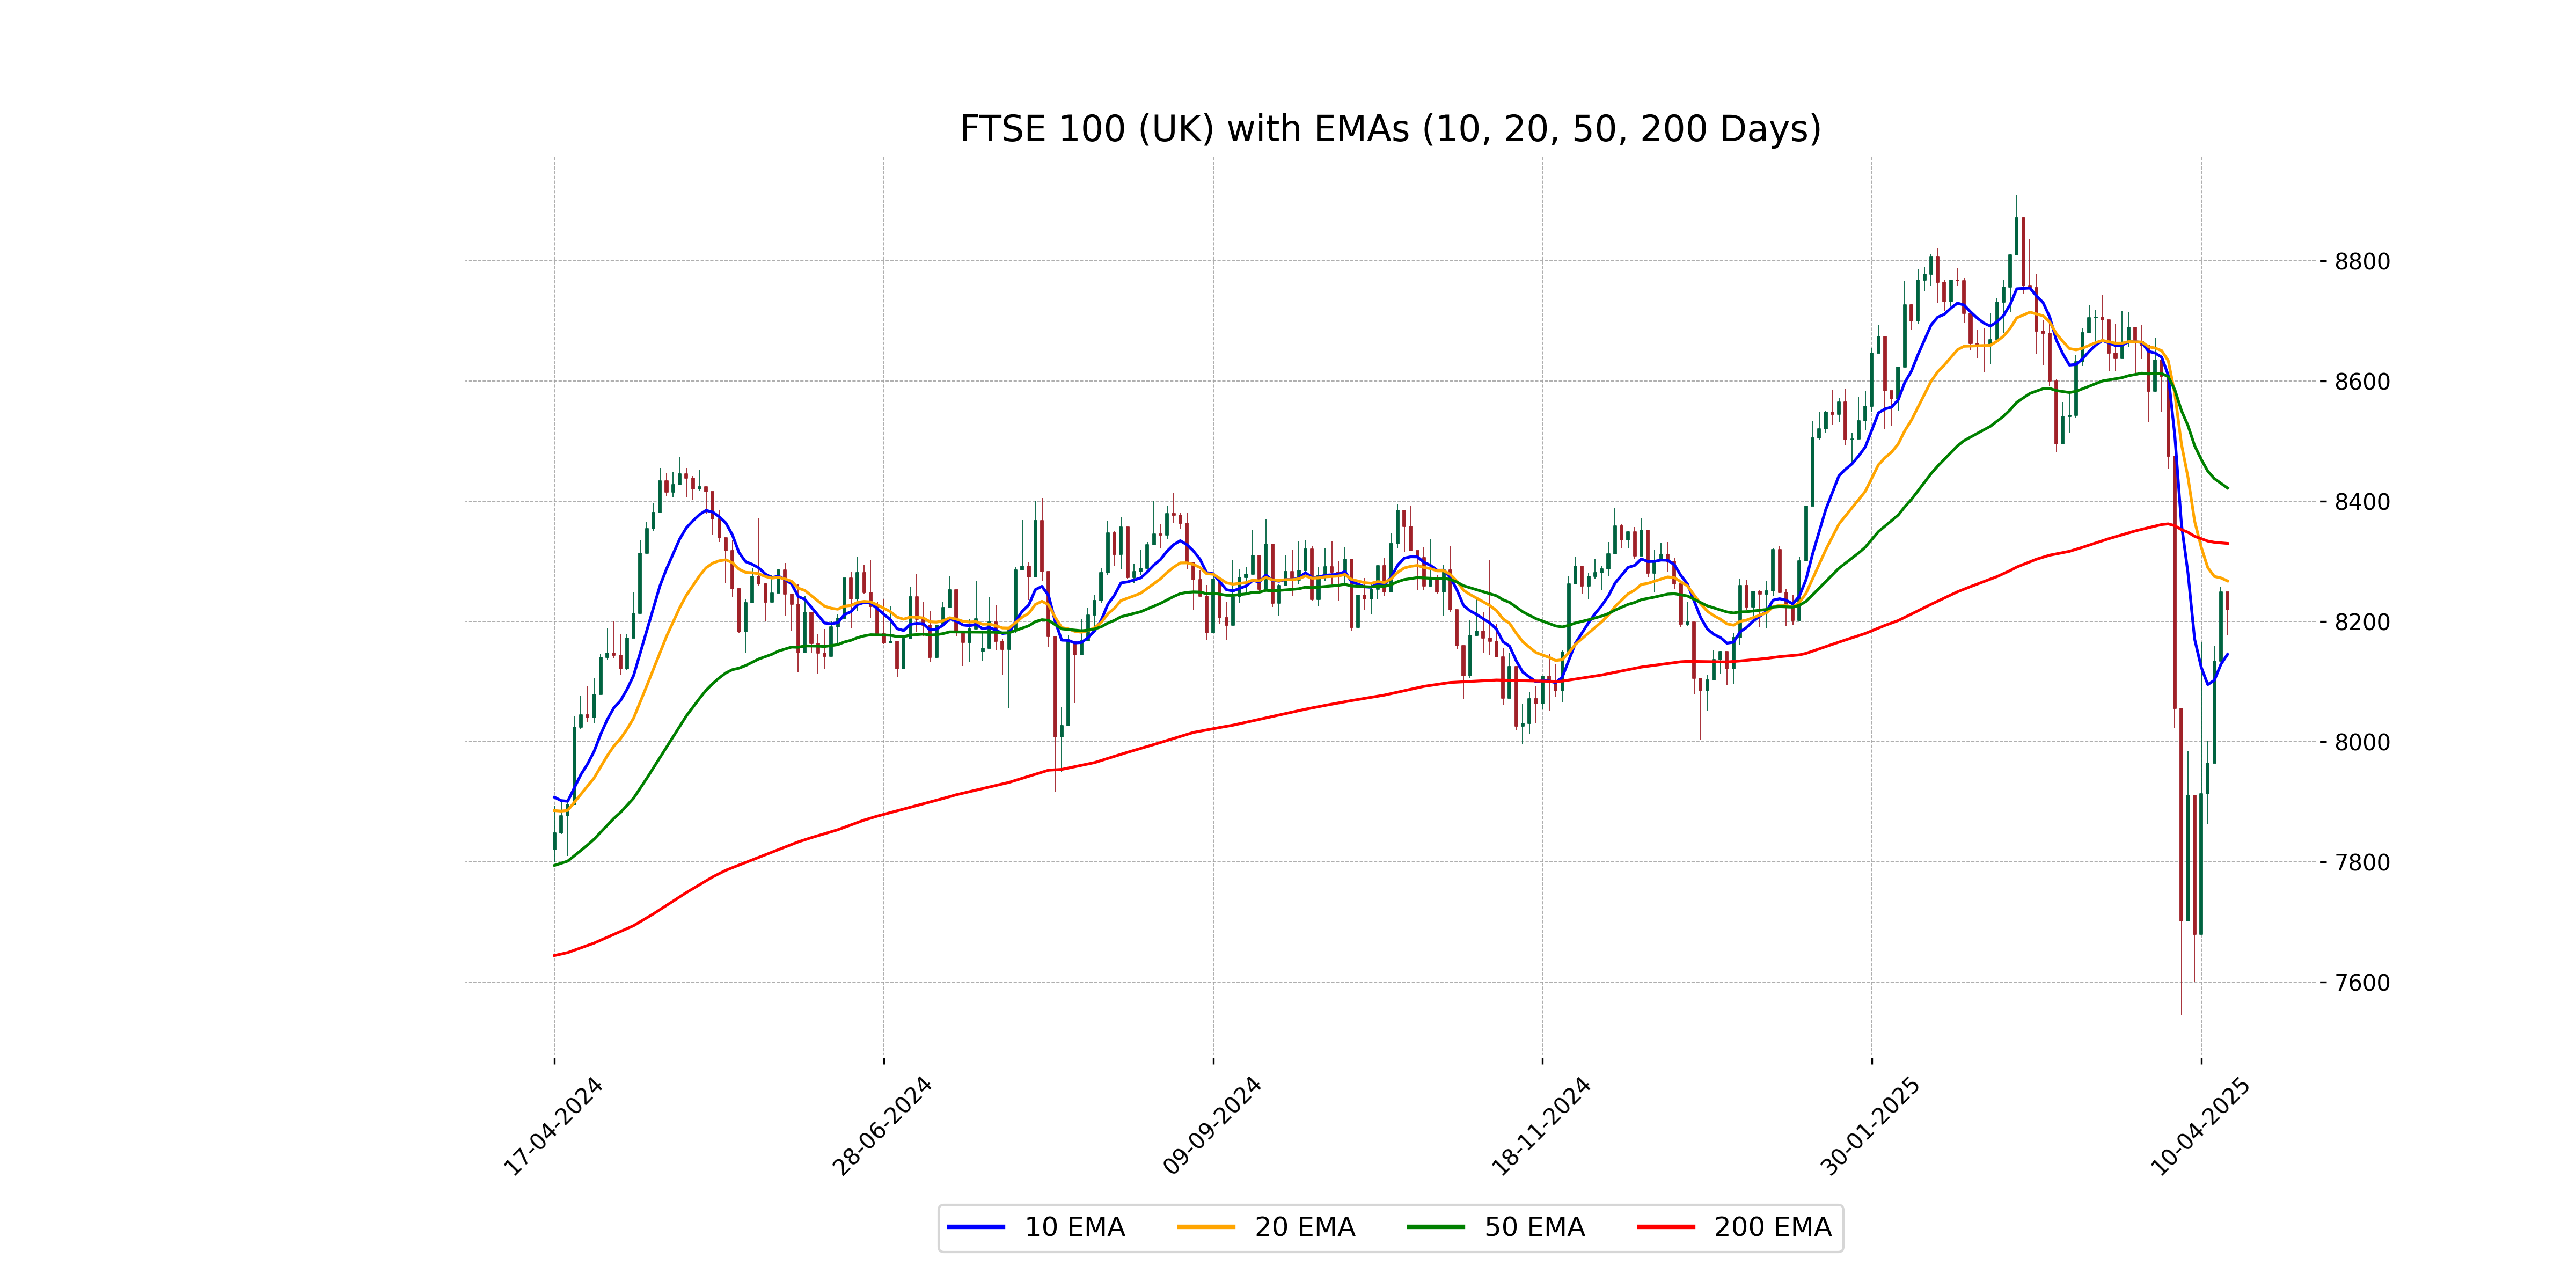
Relationship with Key Moving Averages
The close price of FTSE 100 is 8219.23, which is below the 50-EMA of 8422.05 and the 200-EMA of 8329.83, indicating a potential bearish trend. However, it is above the 10-EMA of 8145.30, suggesting some short-term upward momentum.
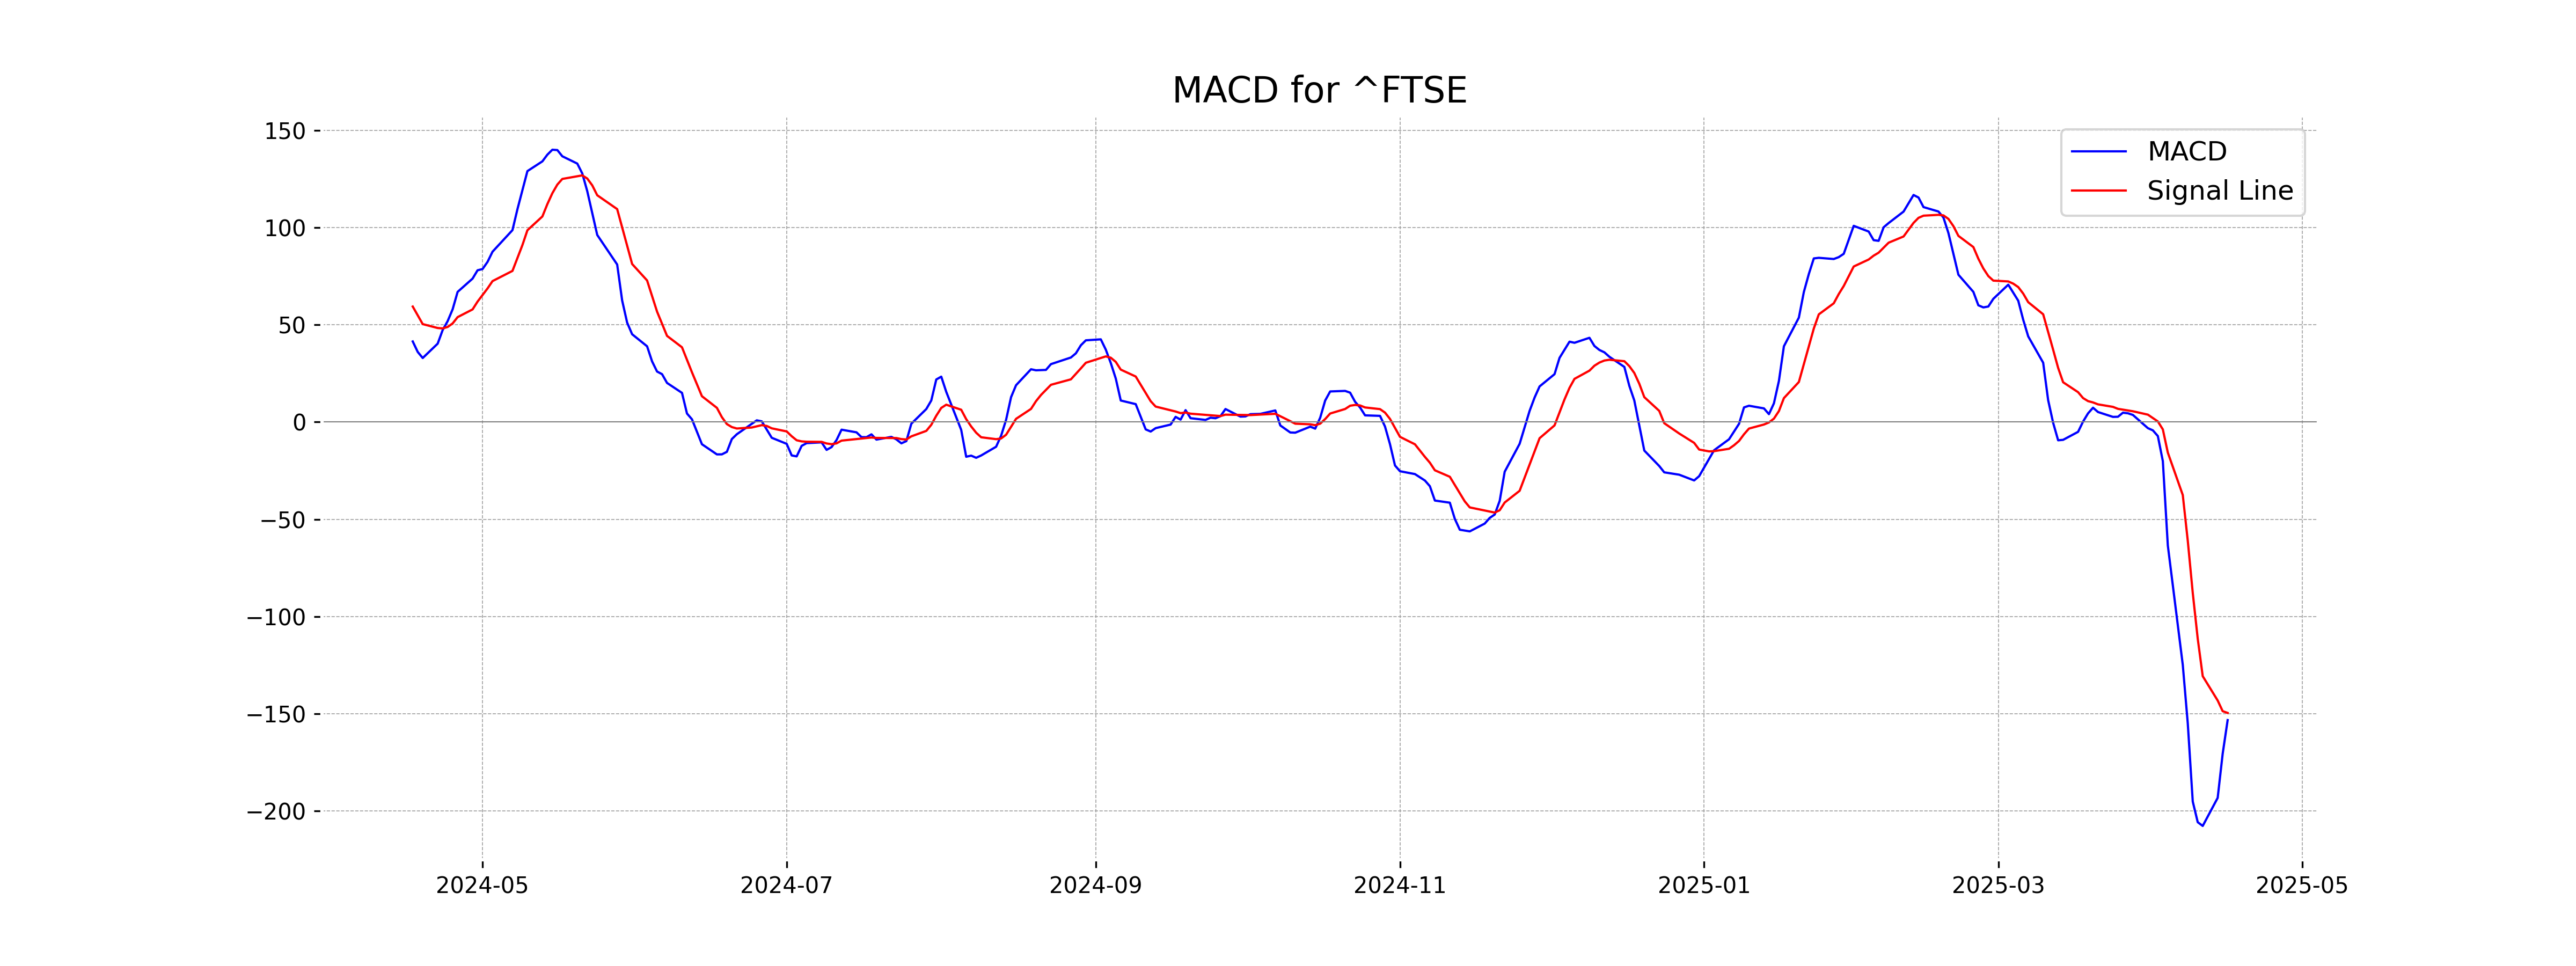
Moving Averages Trend (MACD)
The MACD analysis for FTSE 100 indicates a bearish trend as the MACD value of -153.25 is below the MACD Signal line of -149.57. This suggests potential downward momentum for the index.
RSI Analysis
The FTSE 100 has an RSI value of 46.13, indicating that it is currently in a neutral zone. This suggests neither overbought nor oversold conditions, but it could be worth watching for any emerging trends.
Analysis for DAX (Germany) - April 16, 2025

DAX Performance: The DAX index opened at 21,117.78 and closed slightly higher at 21,151.81, recording a decline from the previous close with a percentage change of -0.48% and a drop of 101.89 points. The RSI indicates a neutral position at 45.61, while the MACD suggests a bearish momentum. The index remains below both the 50 EMA and the 200 EMA, suggesting a downward trend.
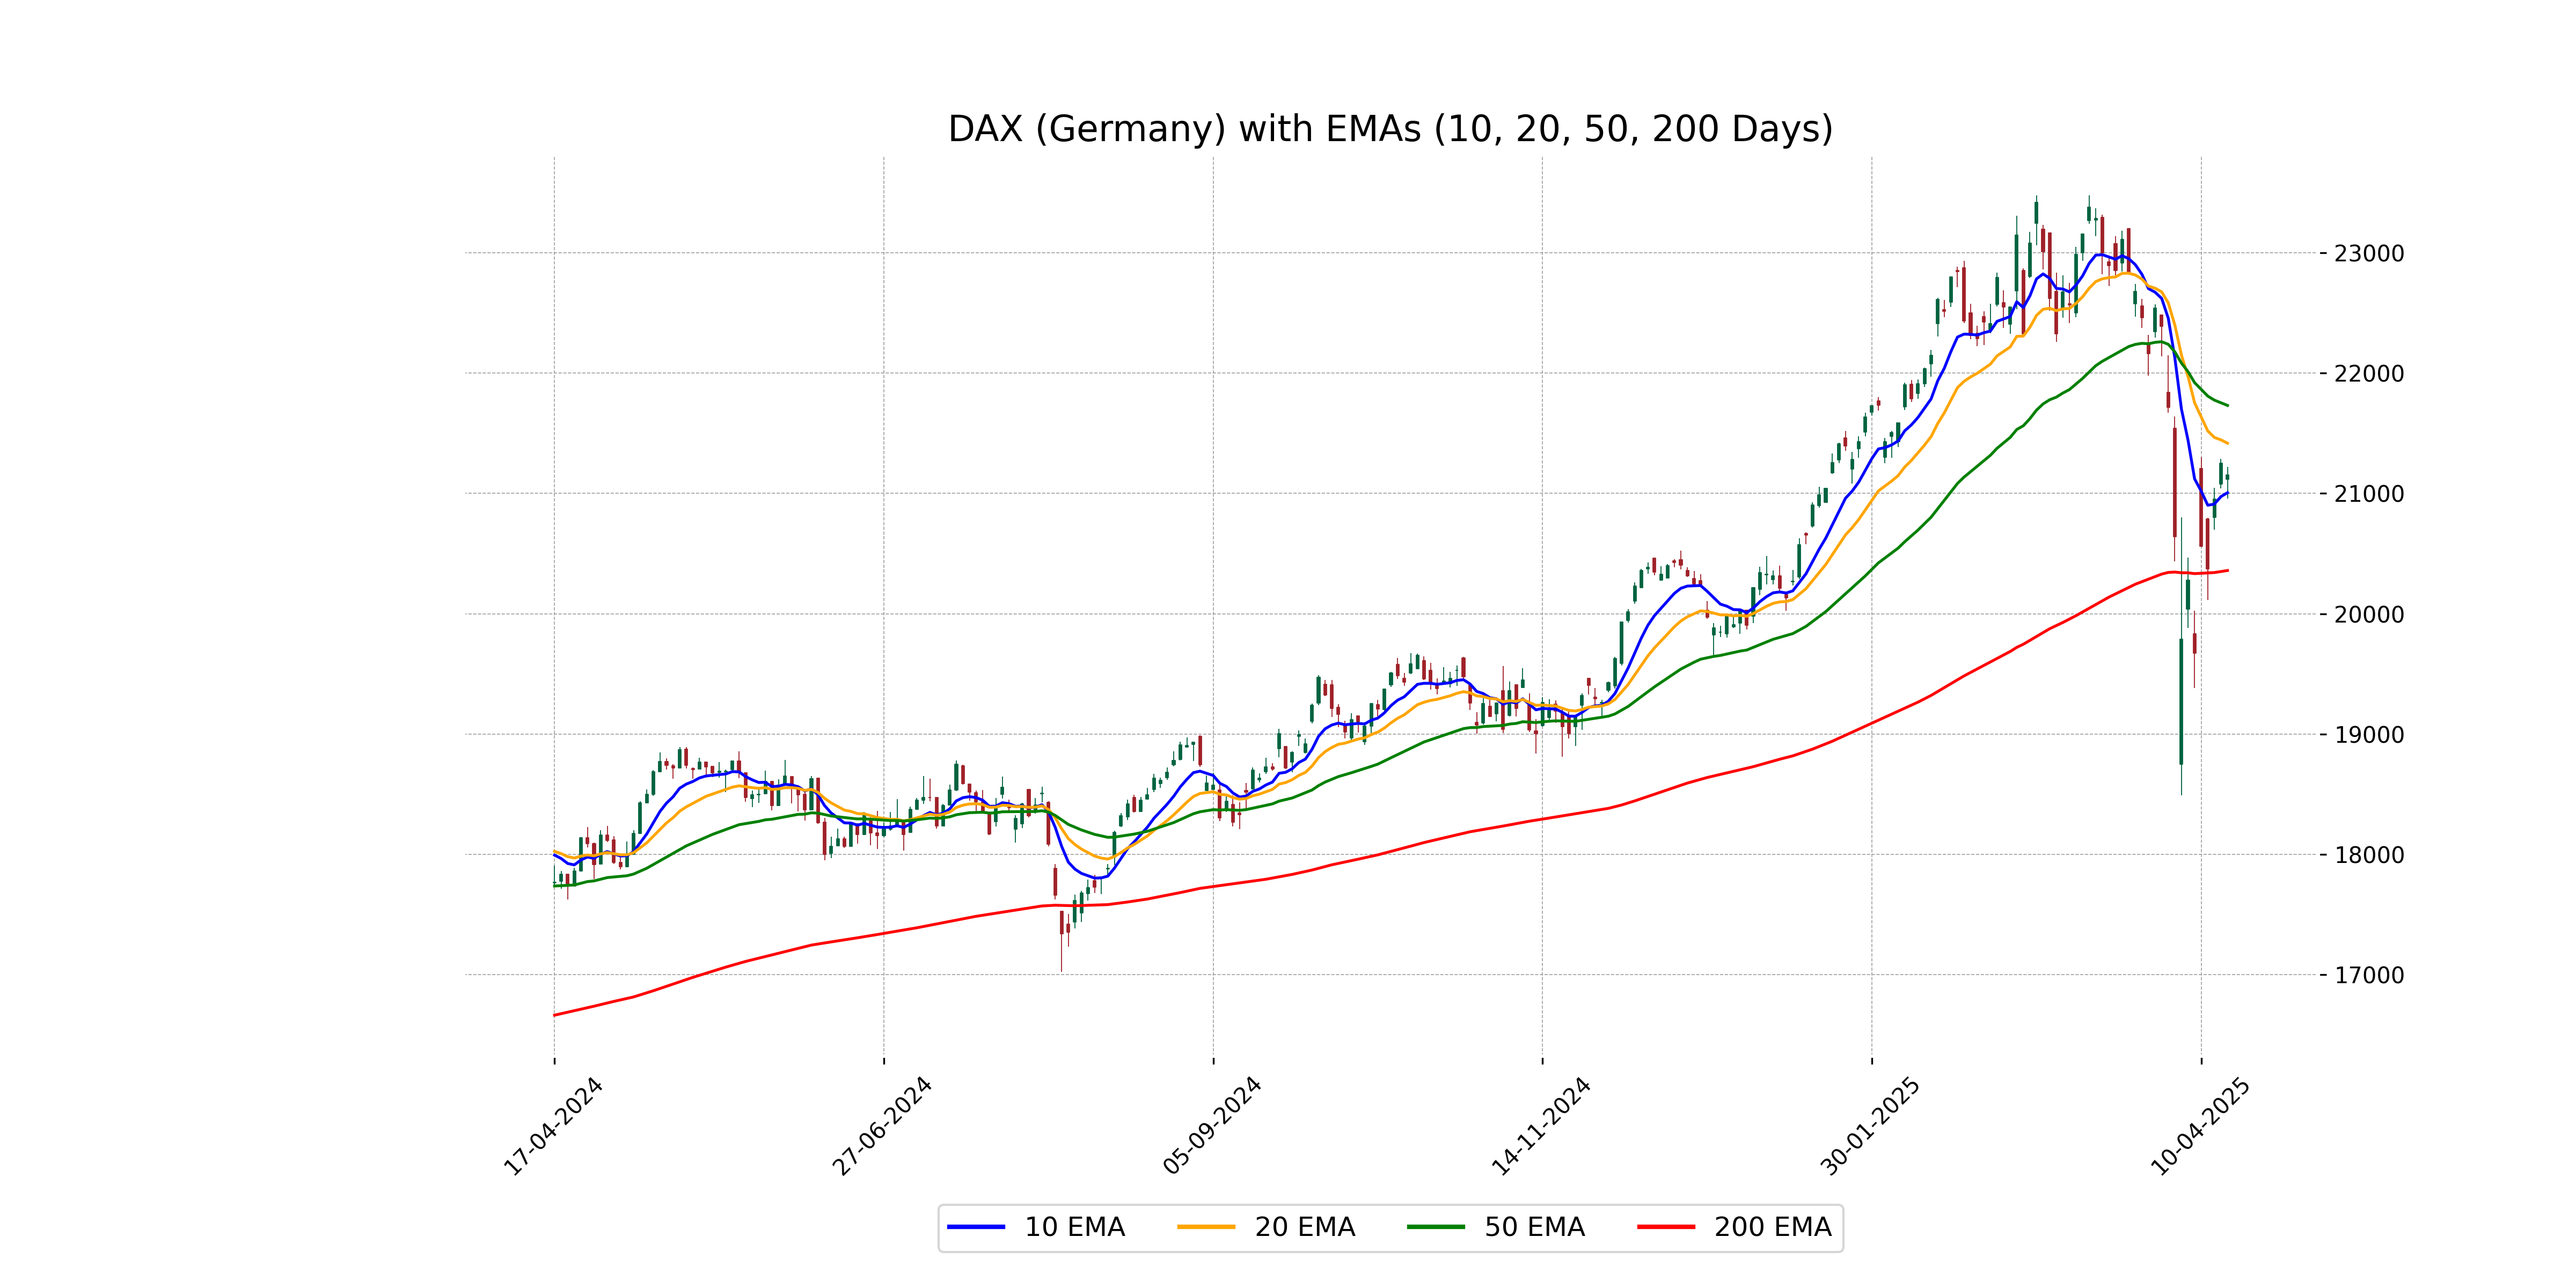
Relationship with Key Moving Averages
The DAX is currently trading below its 50-day EMA of 21731.57 and 20-day EMA of 21417.58, indicating bearish momentum in the short term. However, it remains above the 200-day EMA of 20359.69, suggesting longer-term support. The close is nearly aligned with the 10-day EMA of 21006.32, reflecting potential short-term equilibrium.
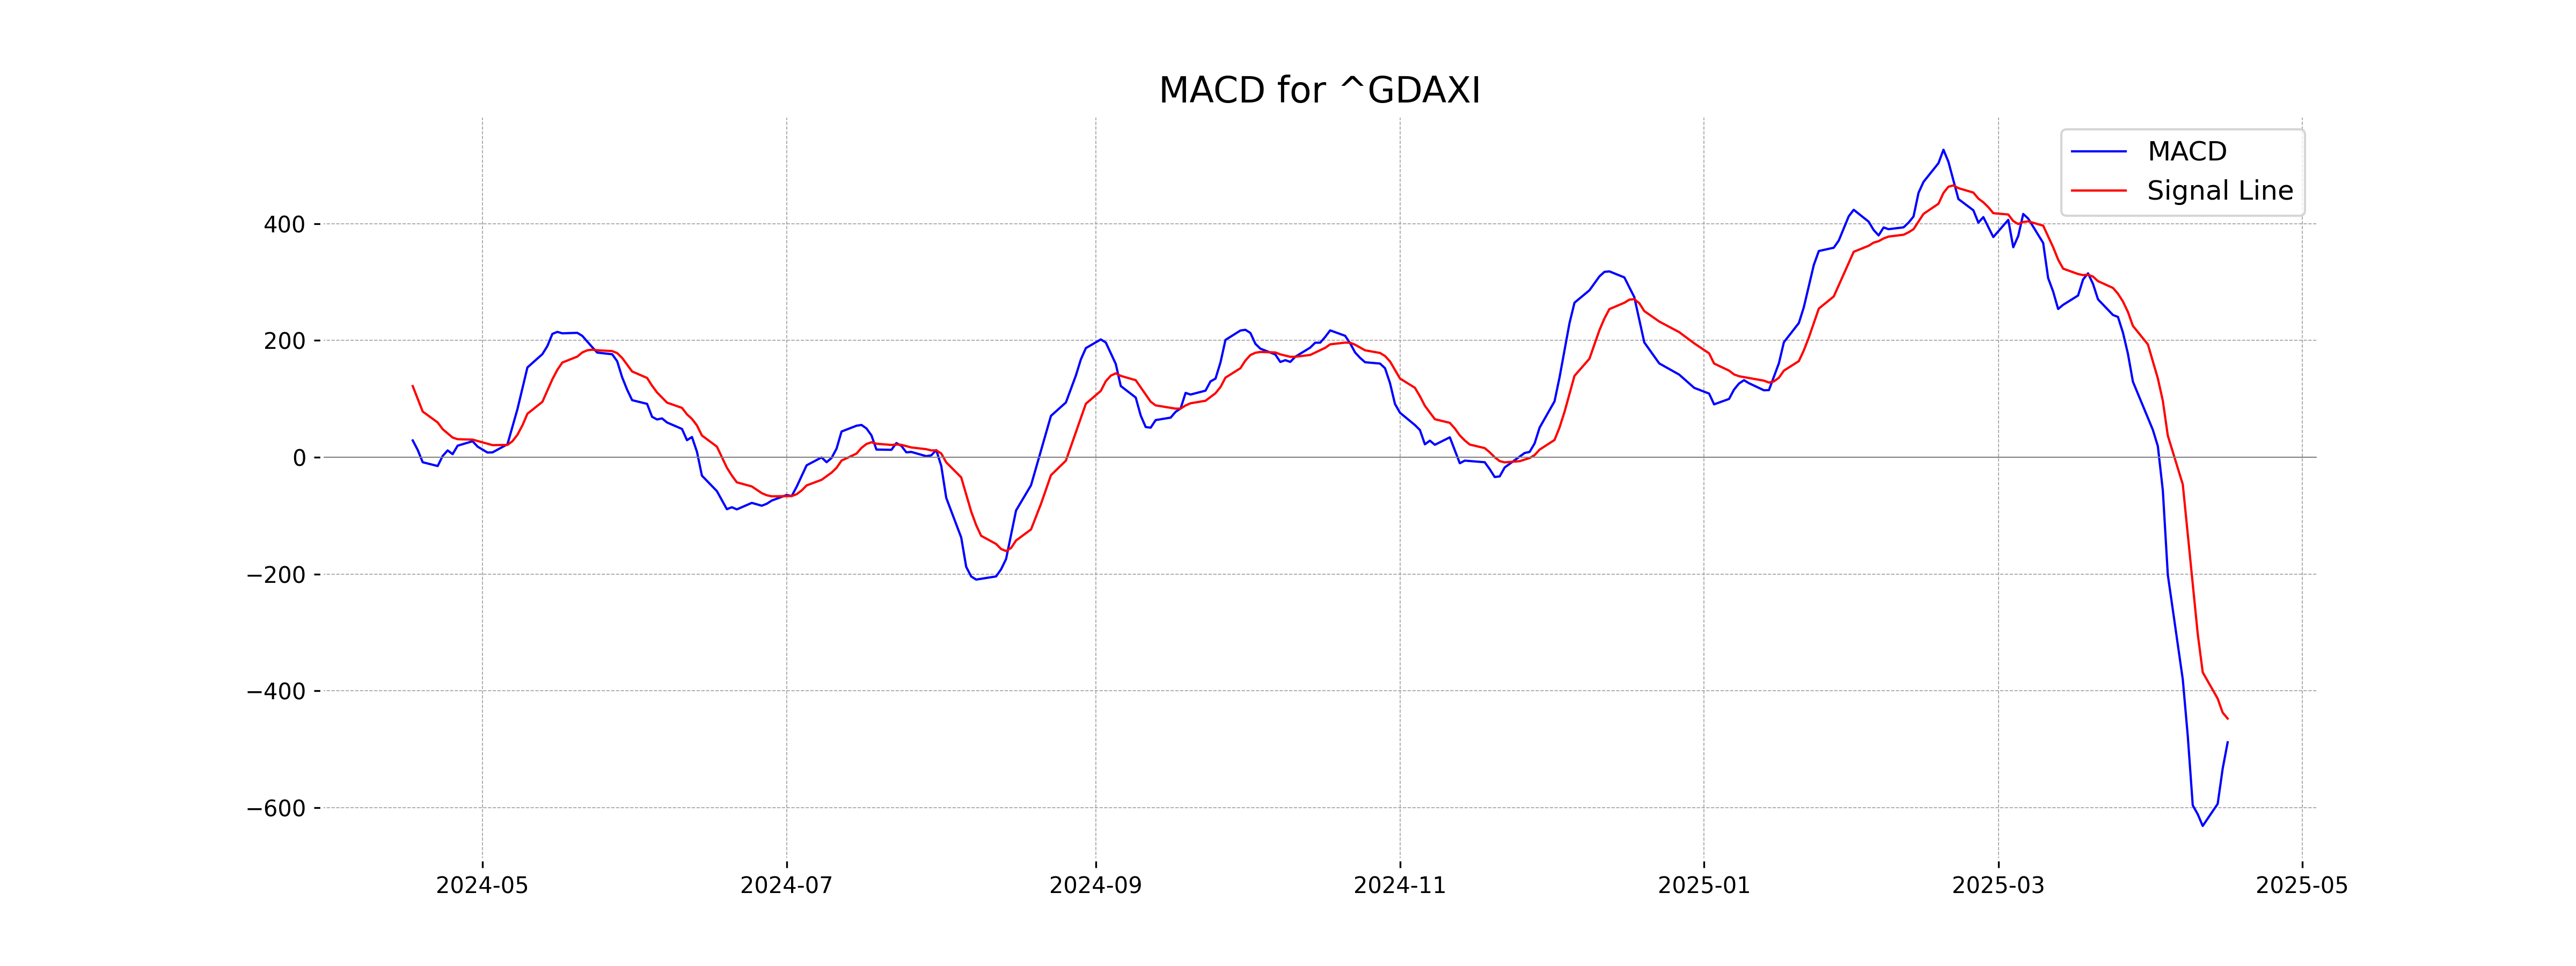
Moving Averages Trend (MACD)
MACD Analysis for DAX (Germany): The MACD for DAX is currently -488.32, which is lower than the MACD signal line at -447.64. This indicates a bearish trend, suggesting that the momentum might be heading downwards as the MACD is below the signal line.
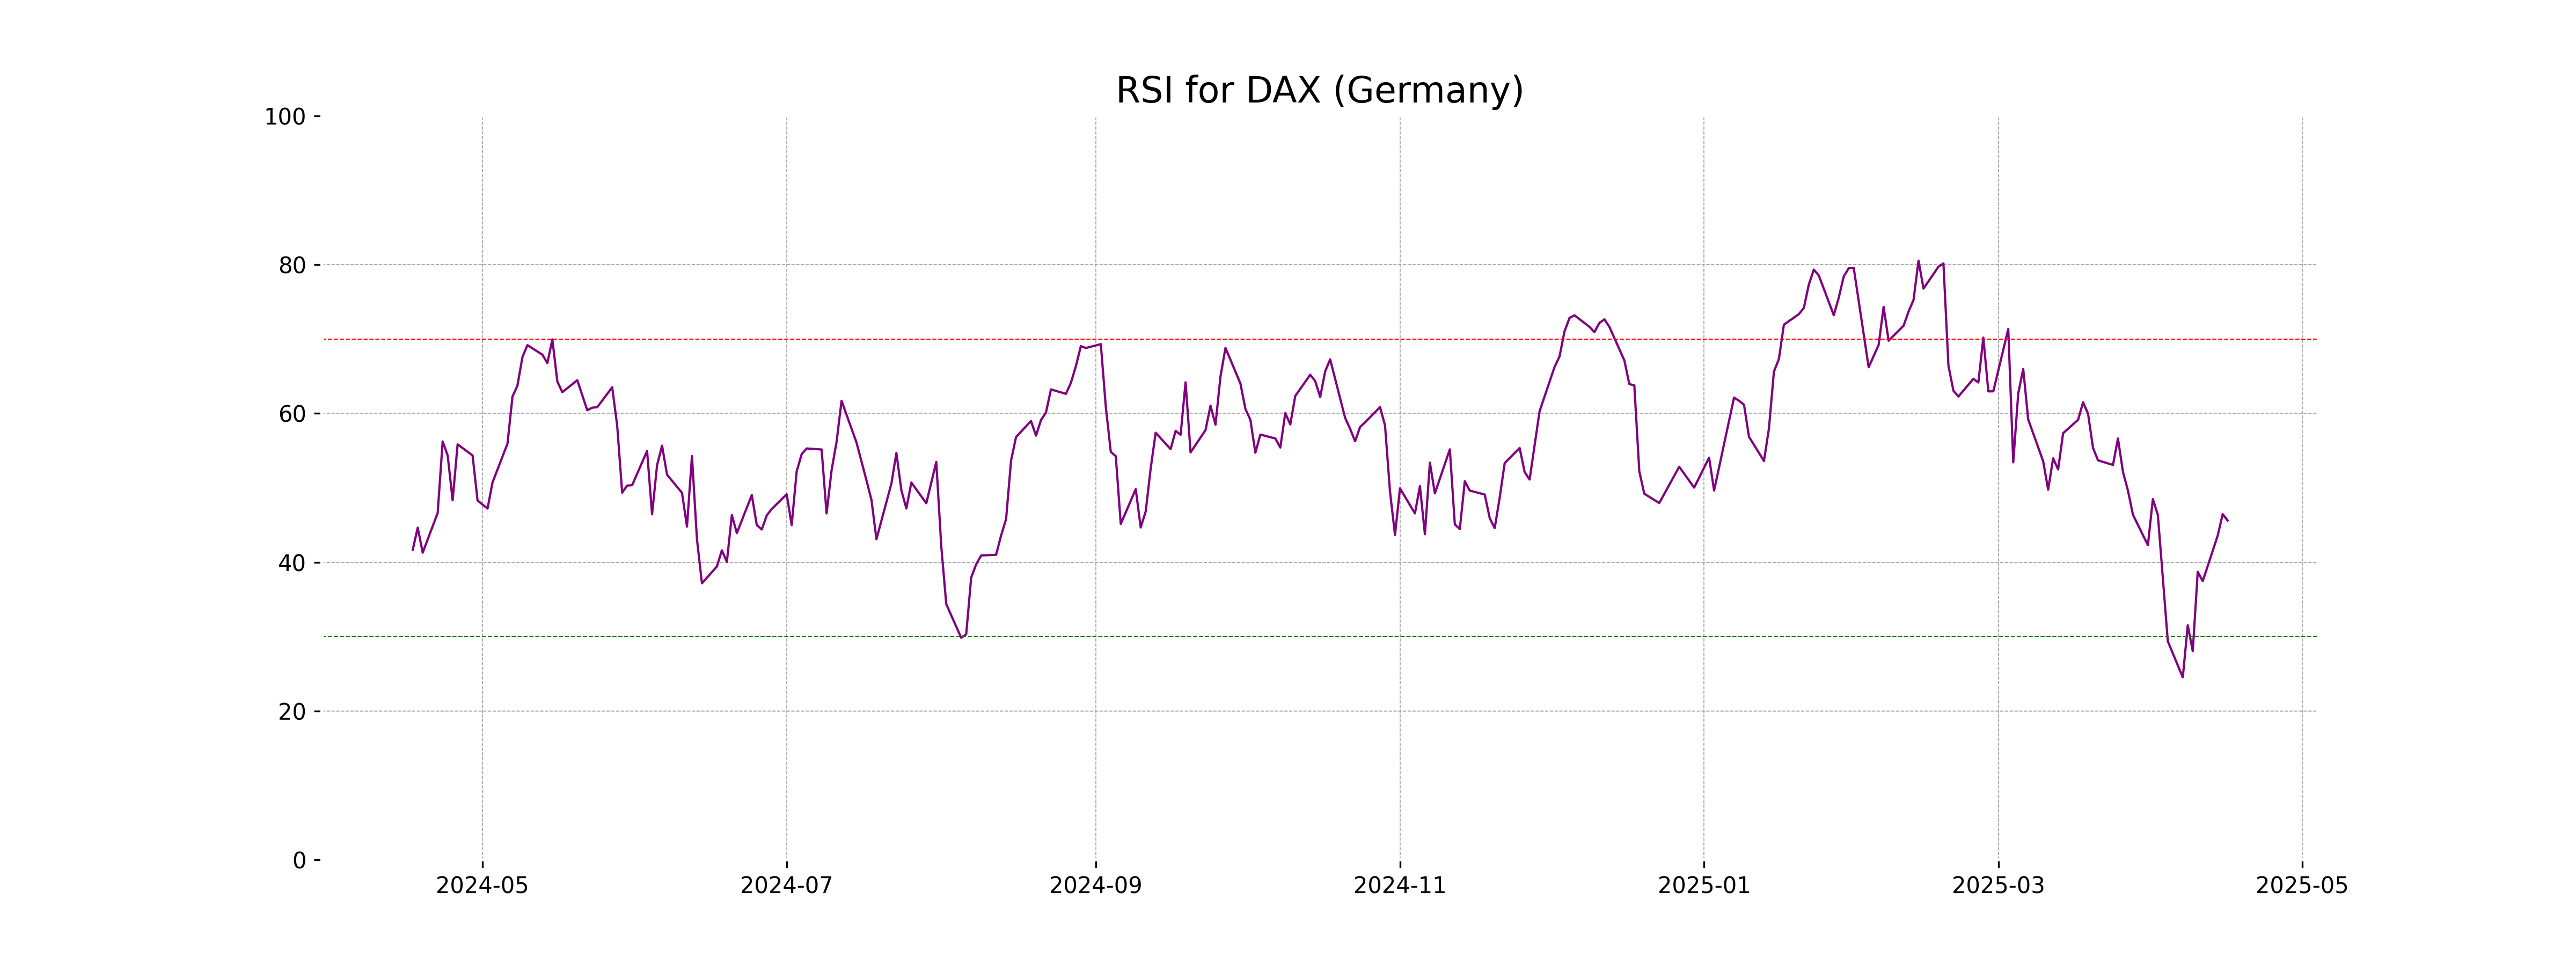
RSI Analysis
The Relative Strength Index (RSI) for the DAX is 45.61, indicating that the index is neither overbought nor oversold. This RSI value suggests that the DAX may be in a neutral position, with no clear momentum towards a bullish or bearish trend.
Analysis for S&P 500 (US) - April 16, 2025
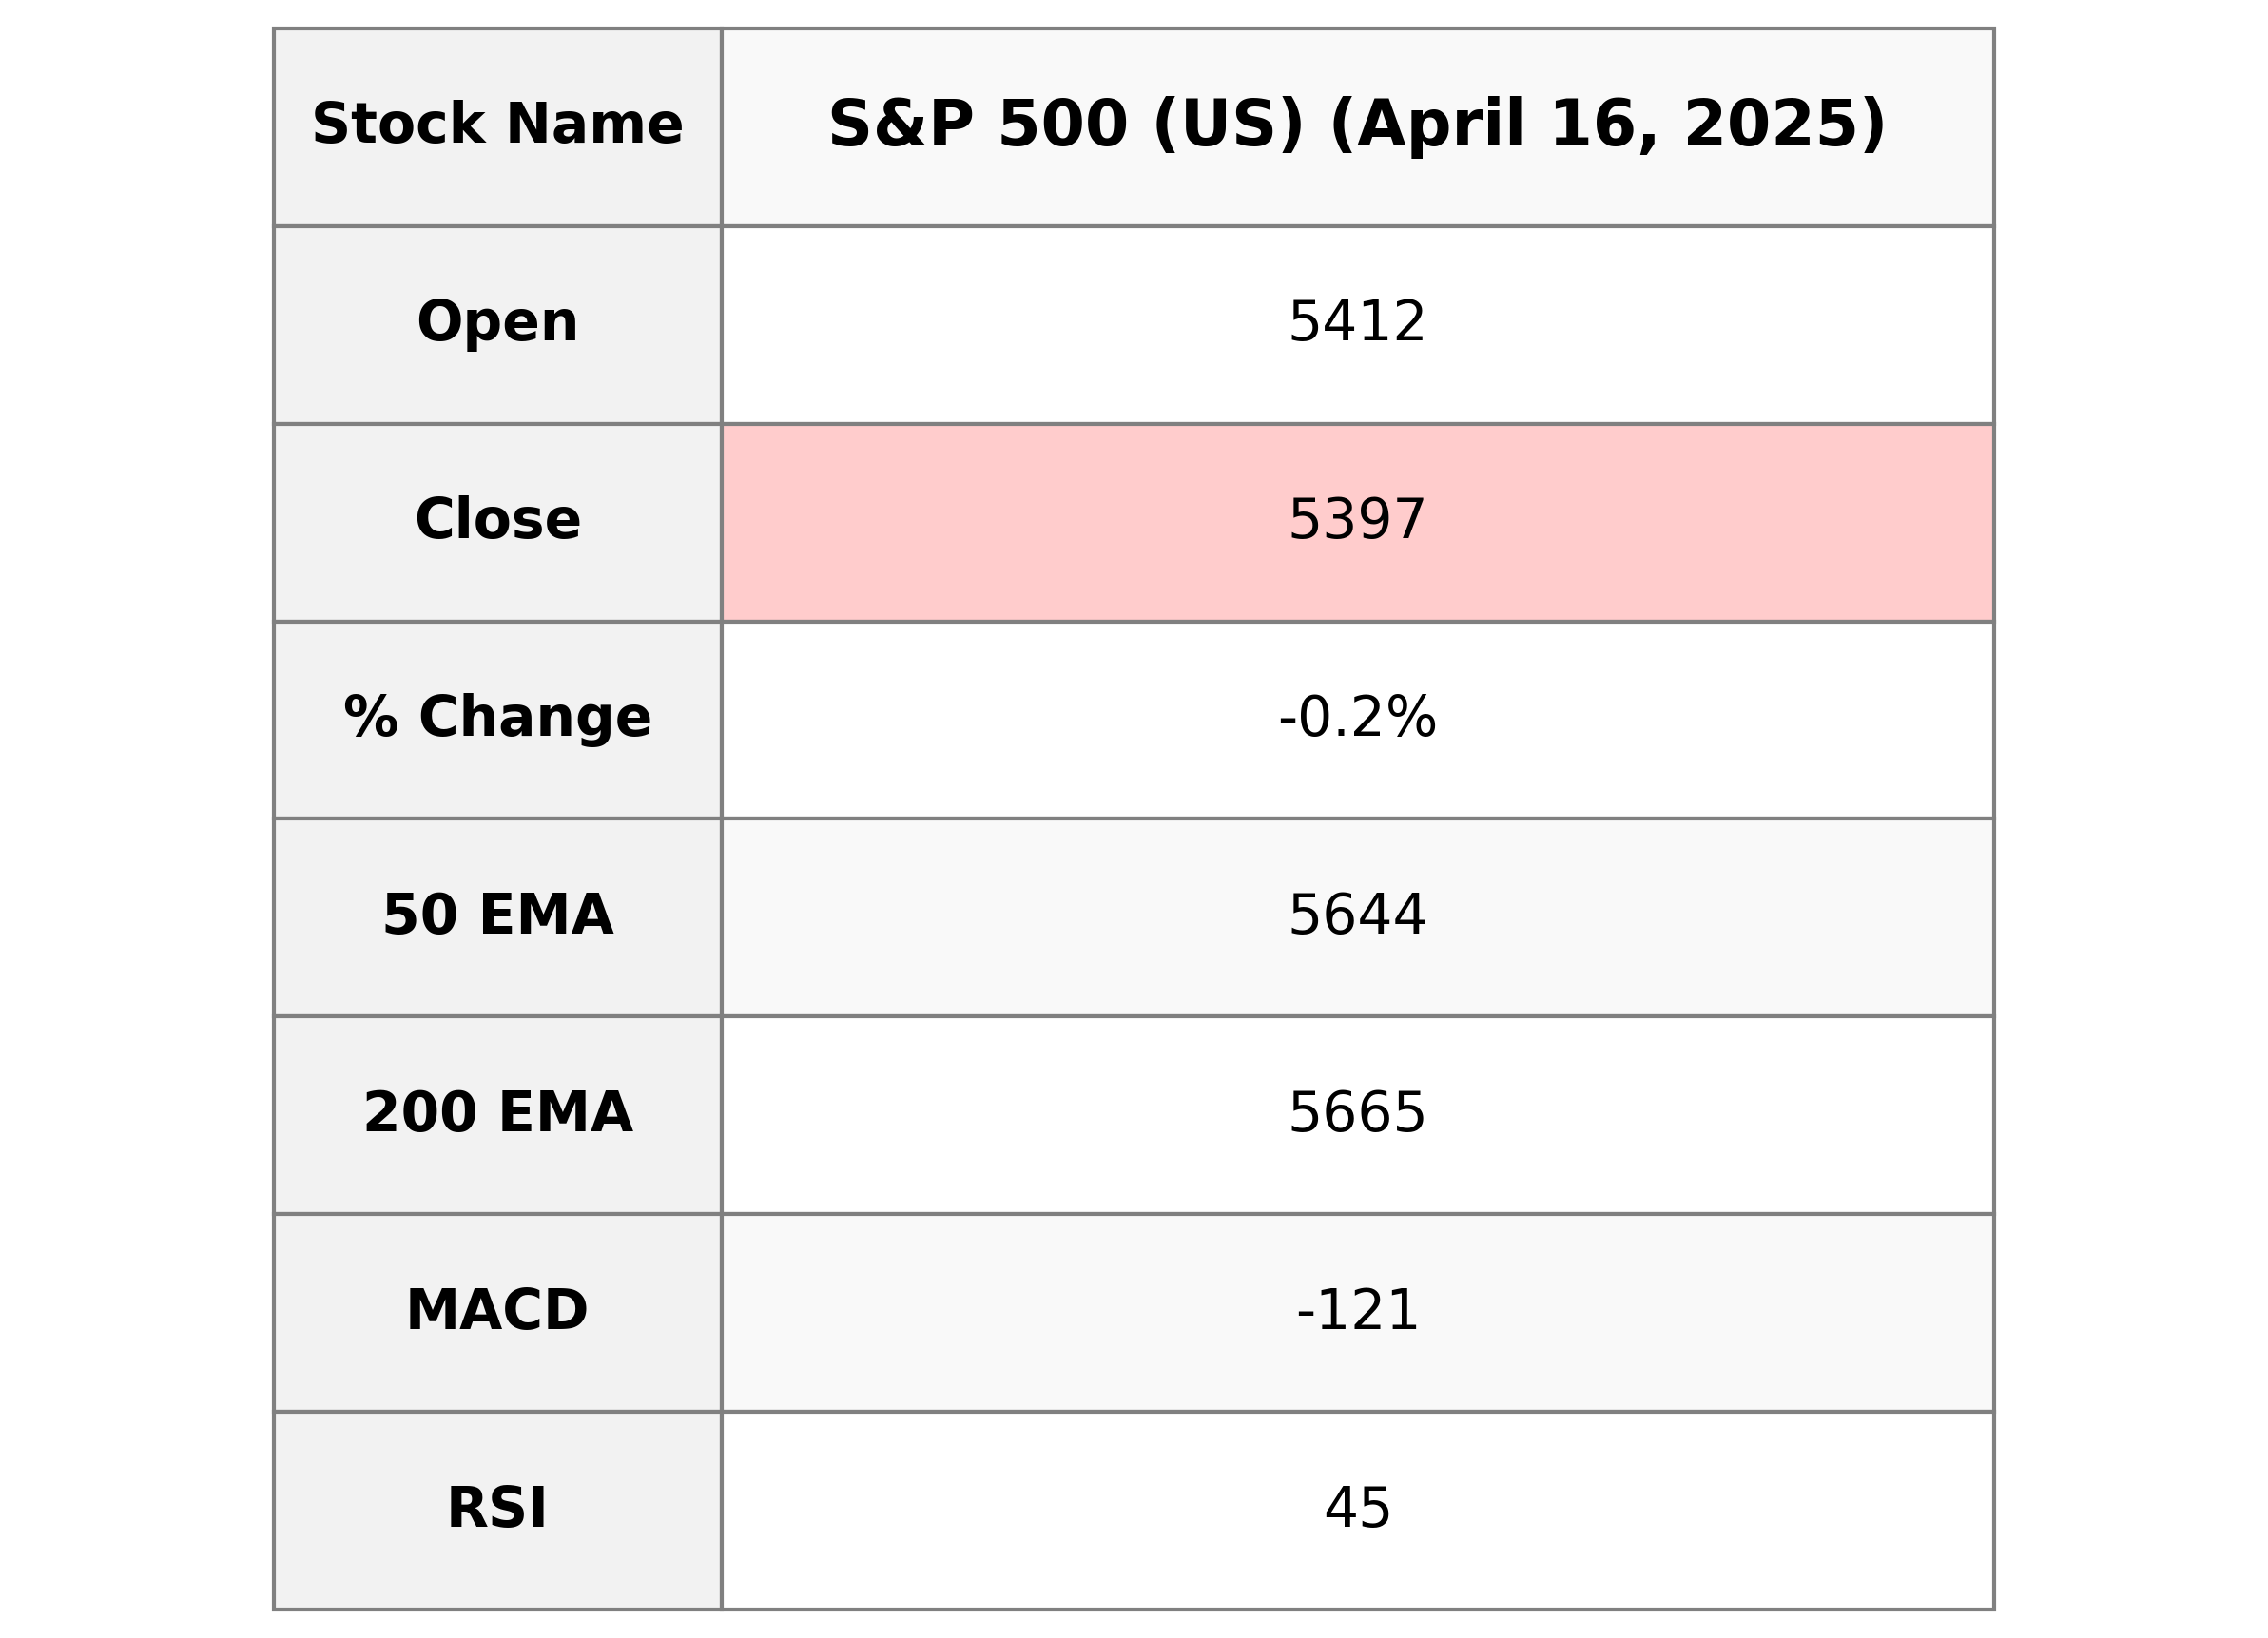
S&P 500 (US) opened at 5411.99 and closed slightly lower at 5396.63, reflecting a minor decrease of -0.17%. The volume of shares traded was significant at 4.32 billion. With an RSI of 45.49, the index is approaching the oversold territory, indicating possible bearish momentum. The MACD value stands at -120.87, signaling continued downward pressure.
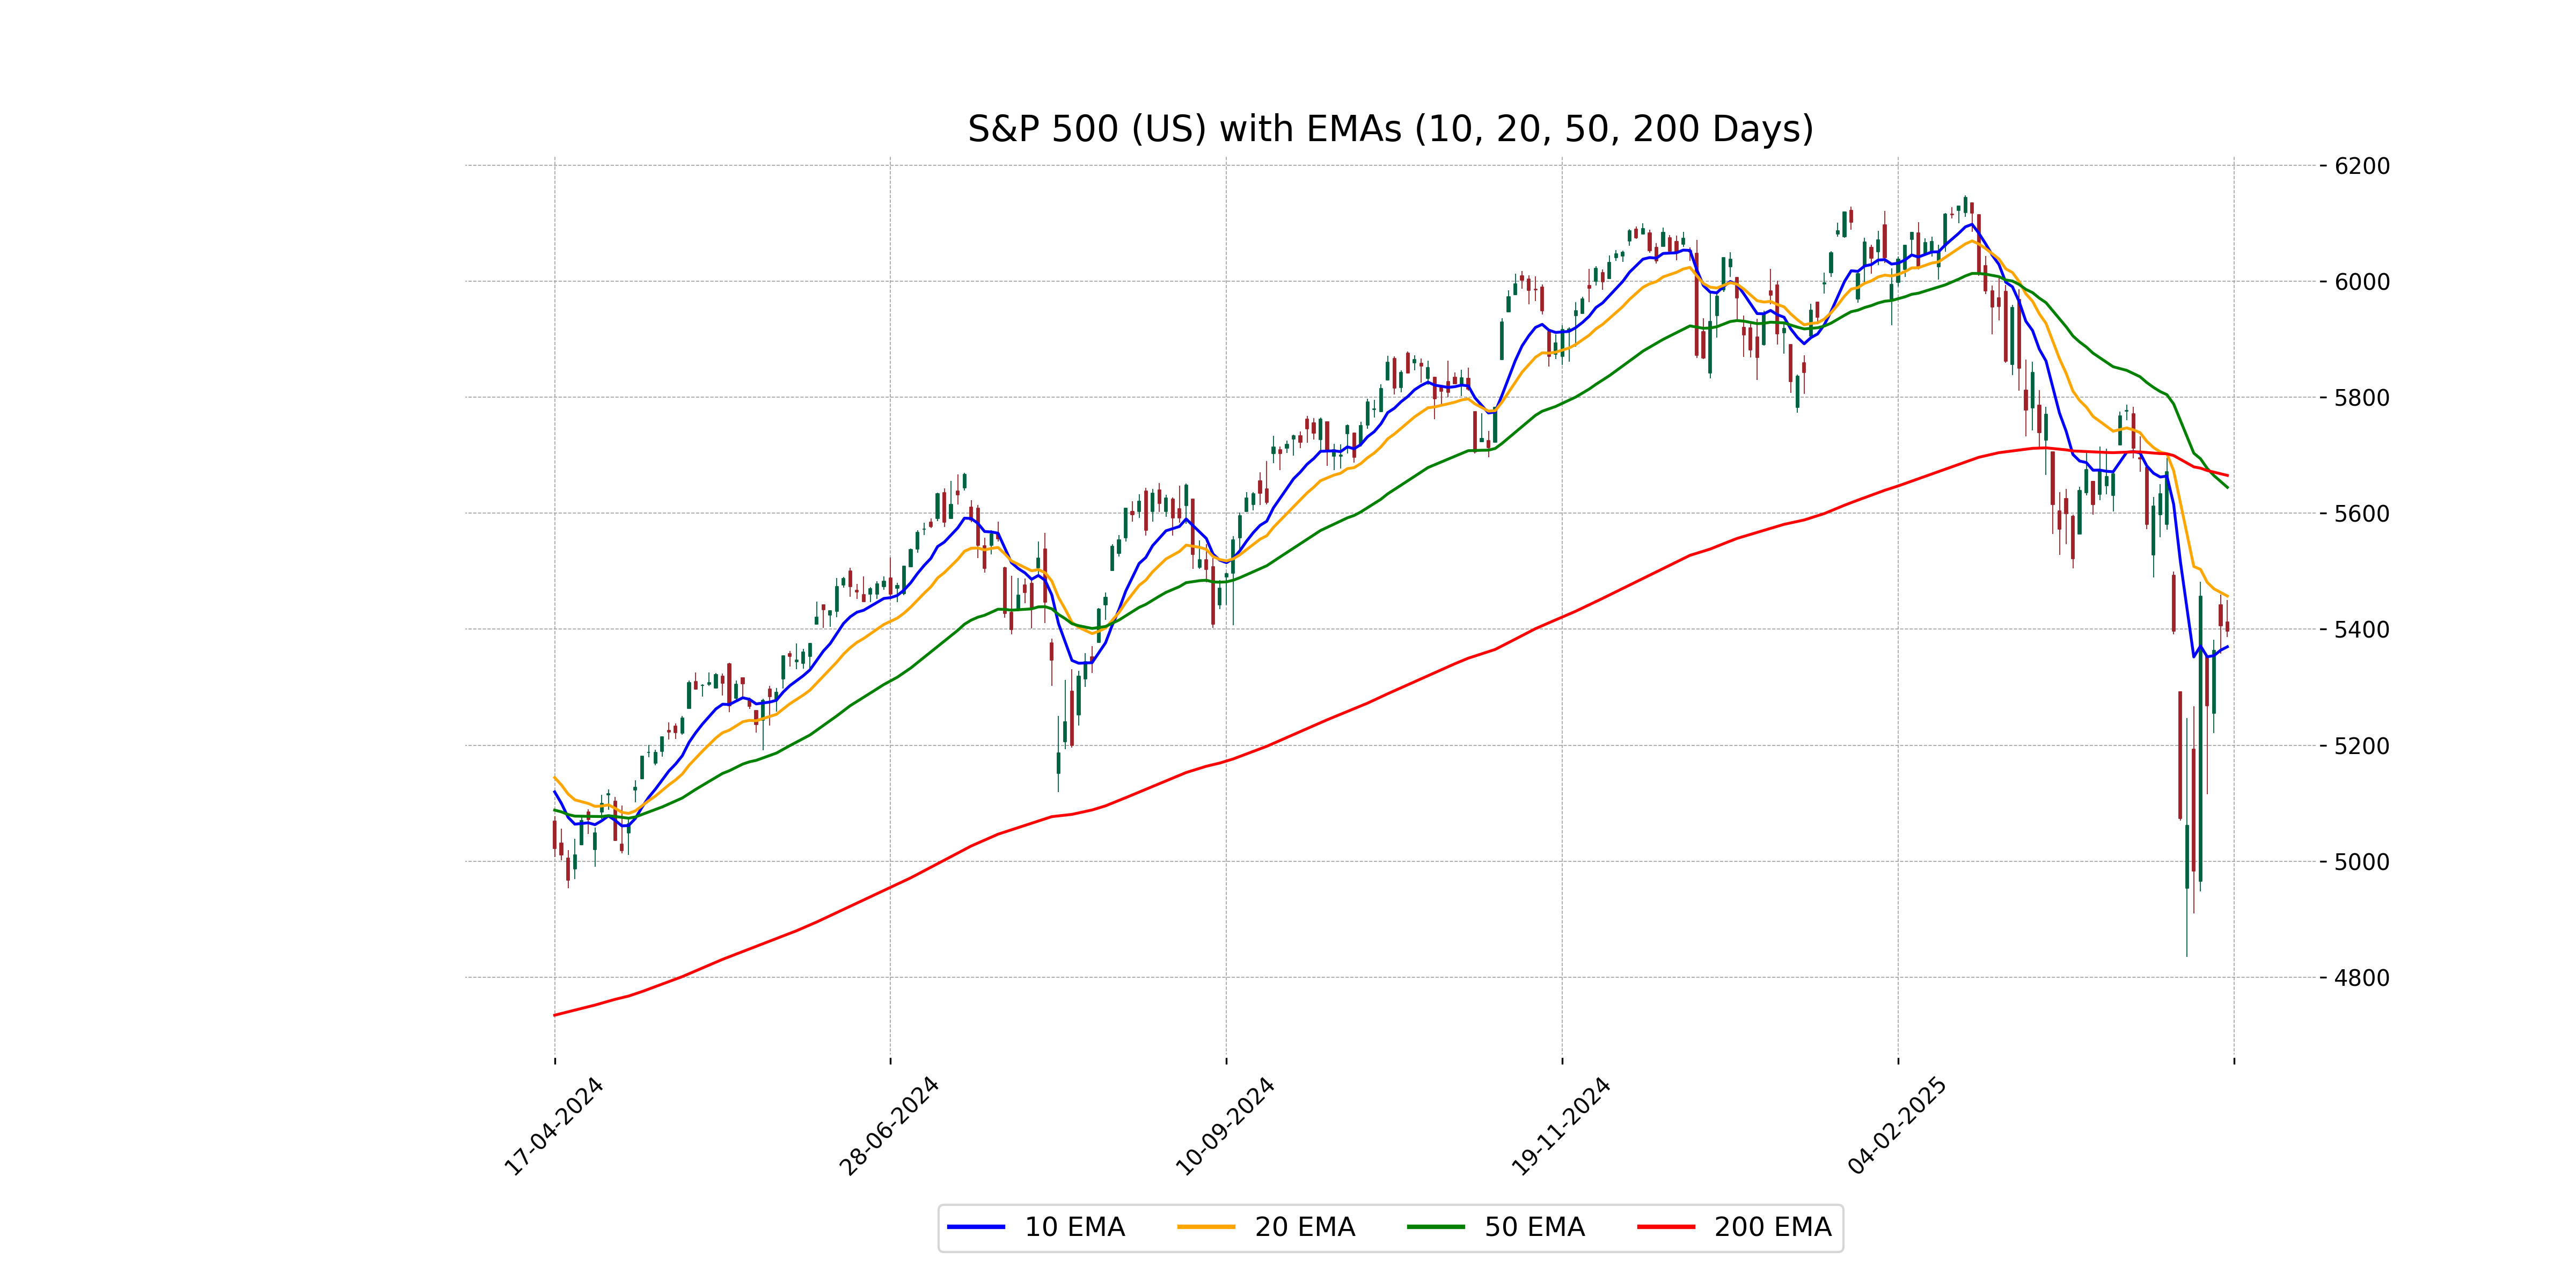
Relationship with Key Moving Averages
The S&P 500 is currently trading below its 50 EMA and 200 EMA, indicating a bearish trend or downward pressure. However, it is above the 10 EMA while remaining below the 20 EMA, suggesting slight recovery within a broader decline.
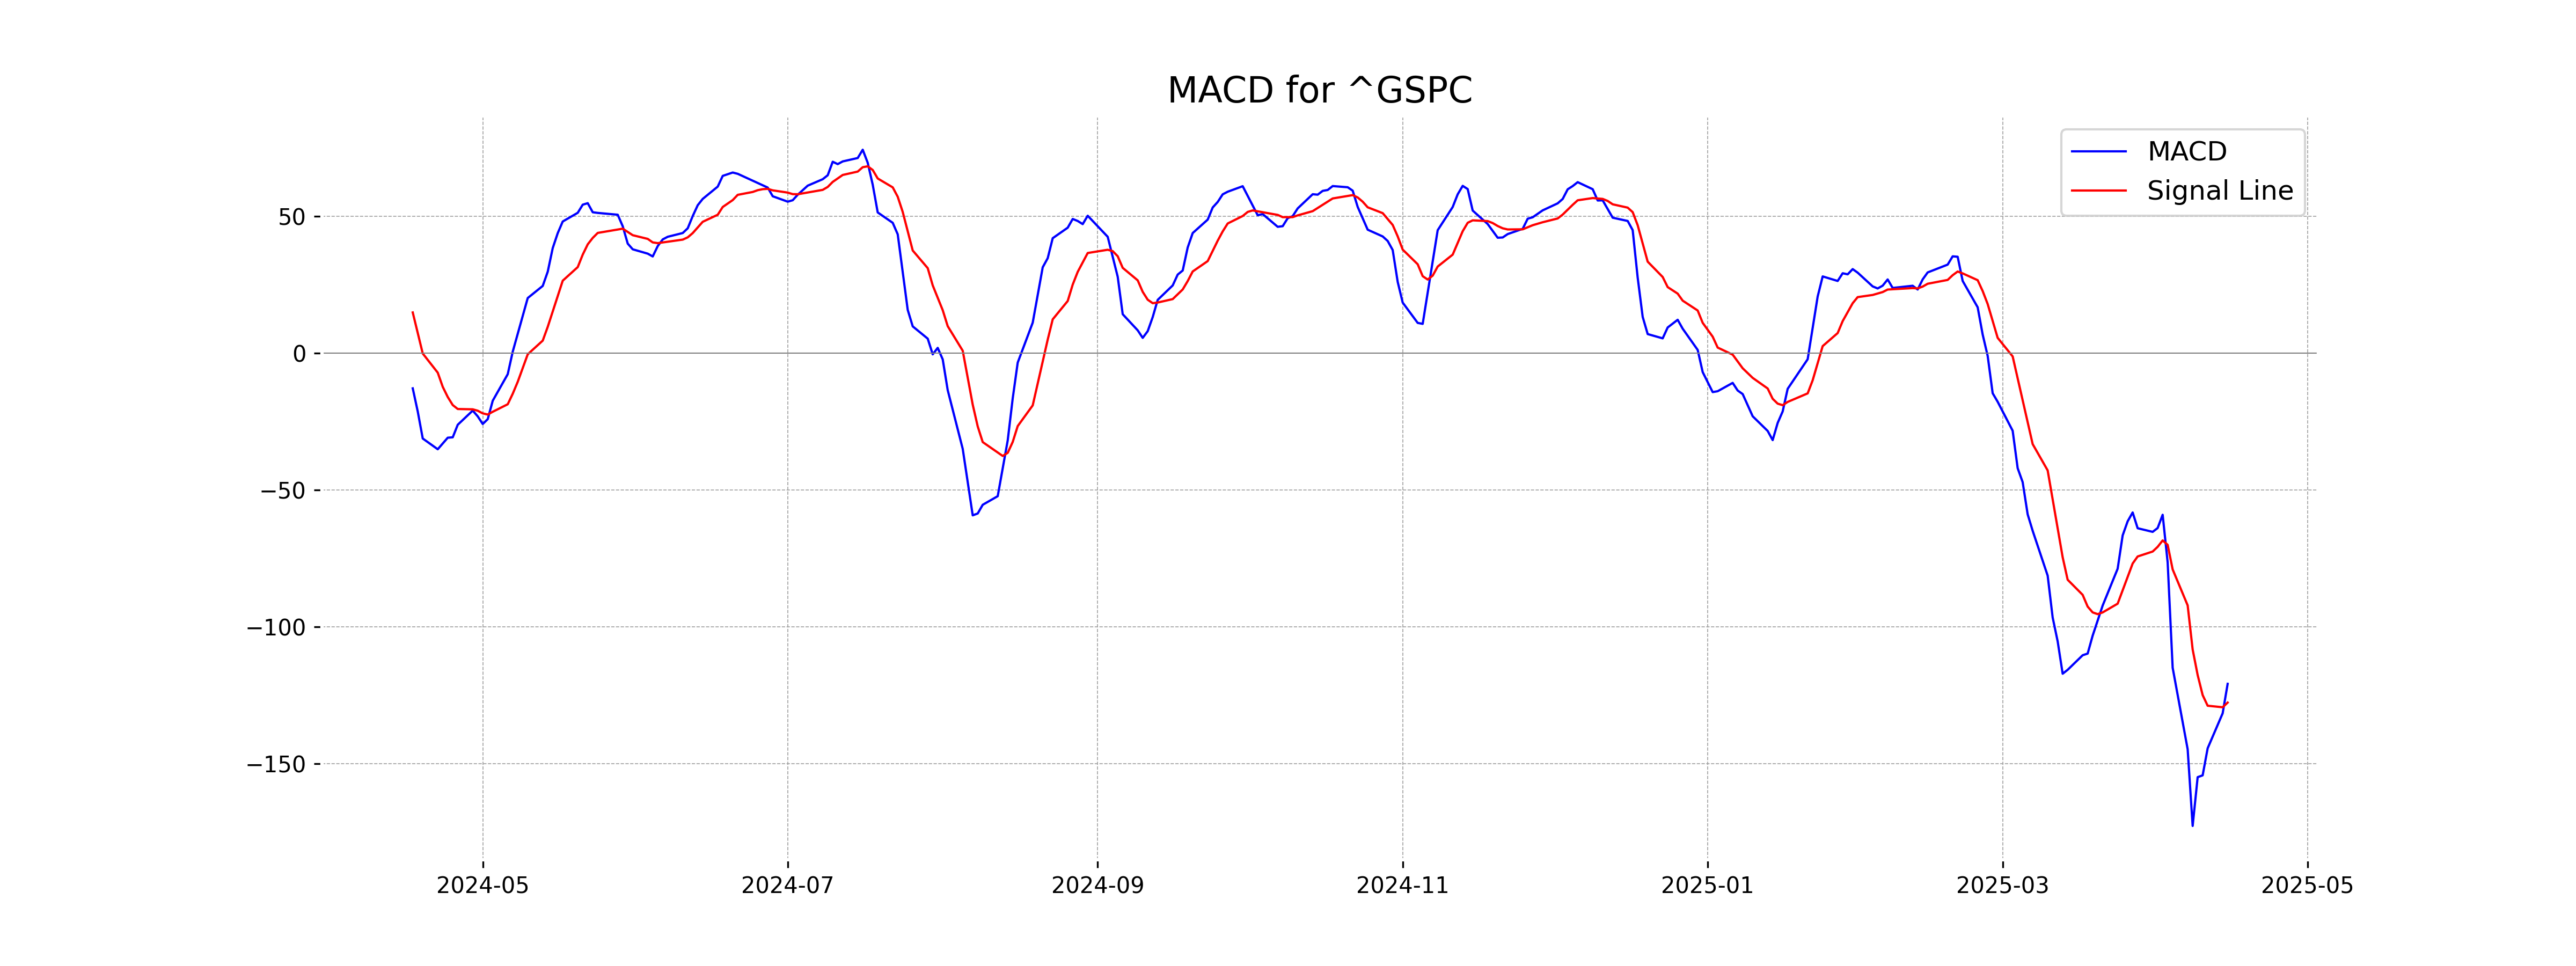
Moving Averages Trend (MACD)
MACD Analysis for S&P 500 (US): The MACD value for the S&P 500 is -120.87, with the signal line at -127.72, indicating a bearish momentum as the MACD is above the signal line. With an RSI of 45.49, the index is in the neutral zone but could trend downwards if the MACD values persist.
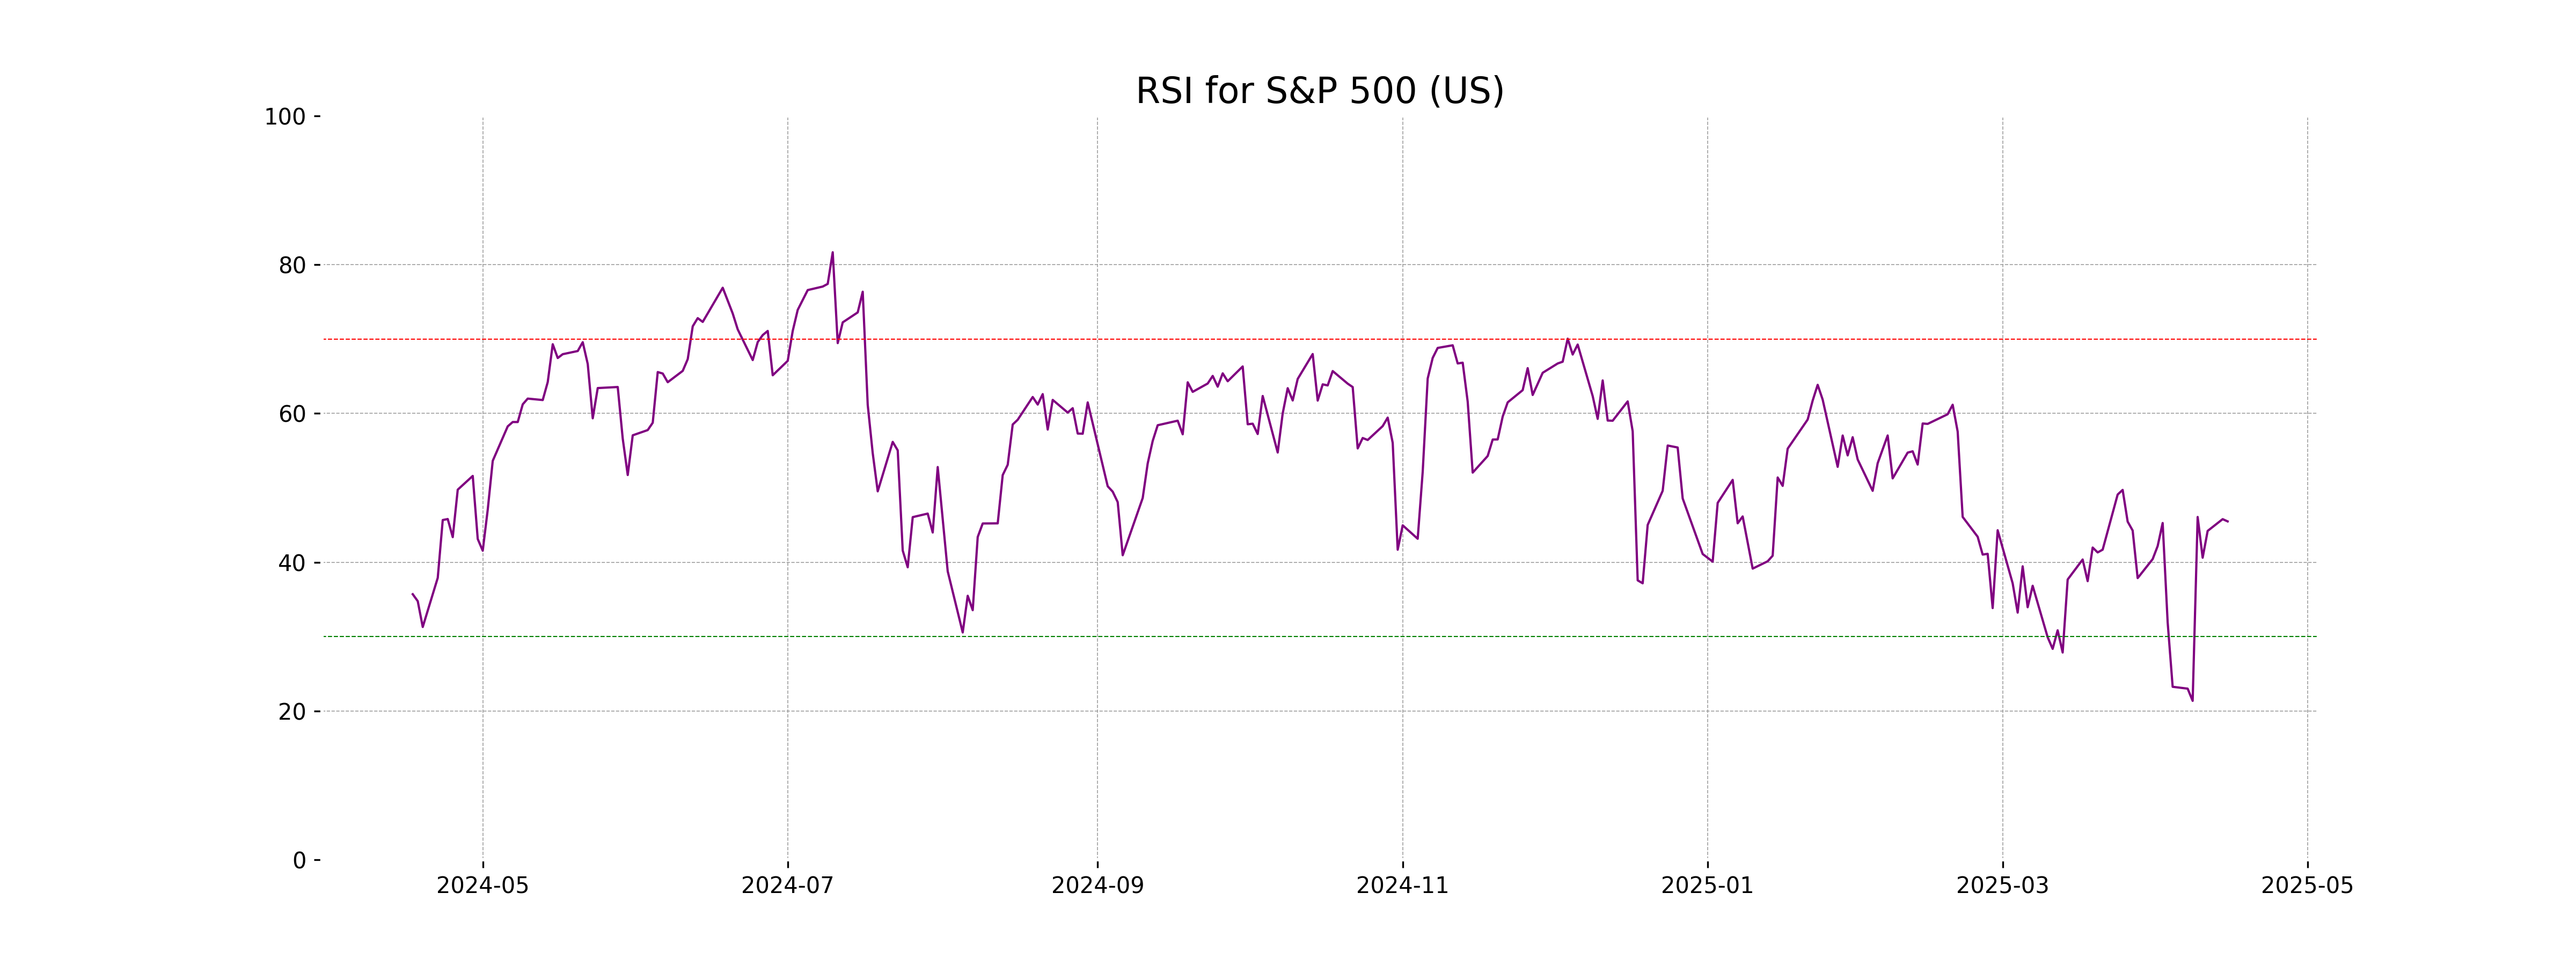
RSI Analysis
The relative strength index (RSI) for the S&P 500 currently stands at 45.49, indicating that the index is in neutral territory. With an RSI below 50, the index is neither overbought nor oversold, suggesting no strong momentum in either direction at this time.
Analysis for Hang Seng Index (Hong Kong) - April 16, 2025
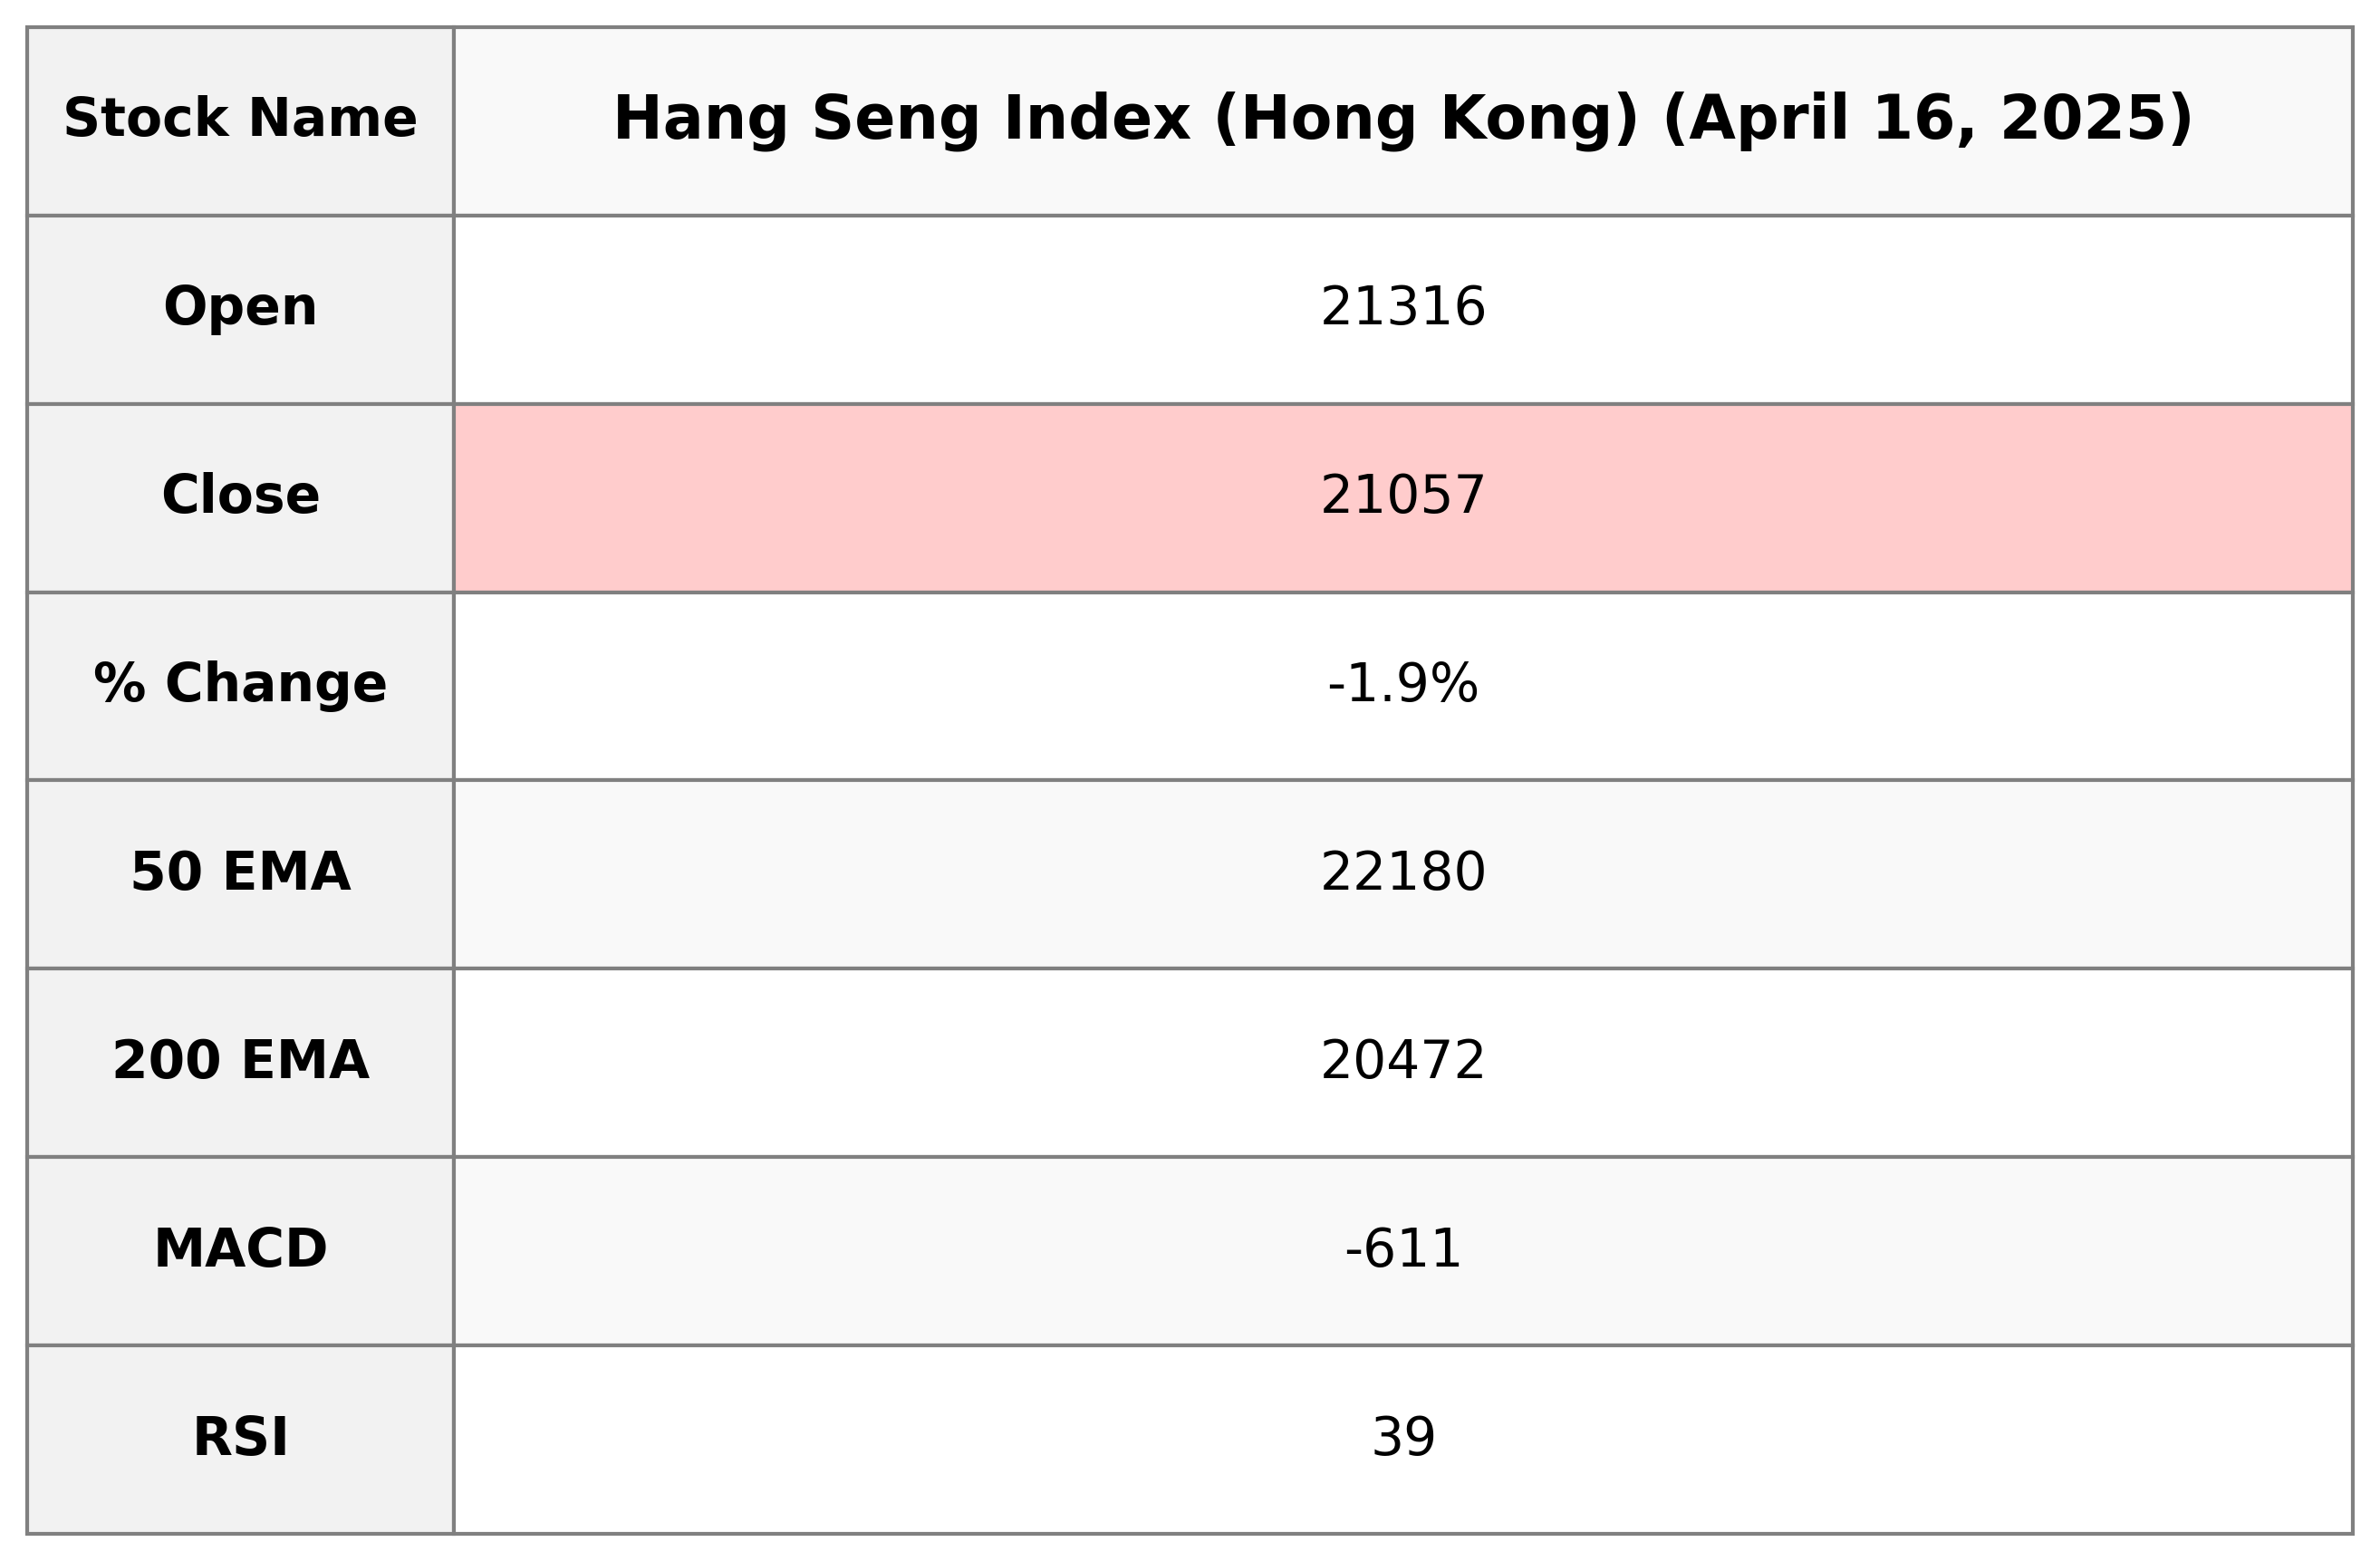
The Hang Seng Index (Hong Kong) opened at 21,316.47 and closed at 21,056.98, marking a decrease of approximately 1.91% or a drop of 409.29 points. The market breadth indicates bearish sentiment with the RSI at 39.09, while the MACD suggests downward momentum as it is below the signal line. The moving averages show that the current price is below the 50-day EMA but above the 200-day EMA.
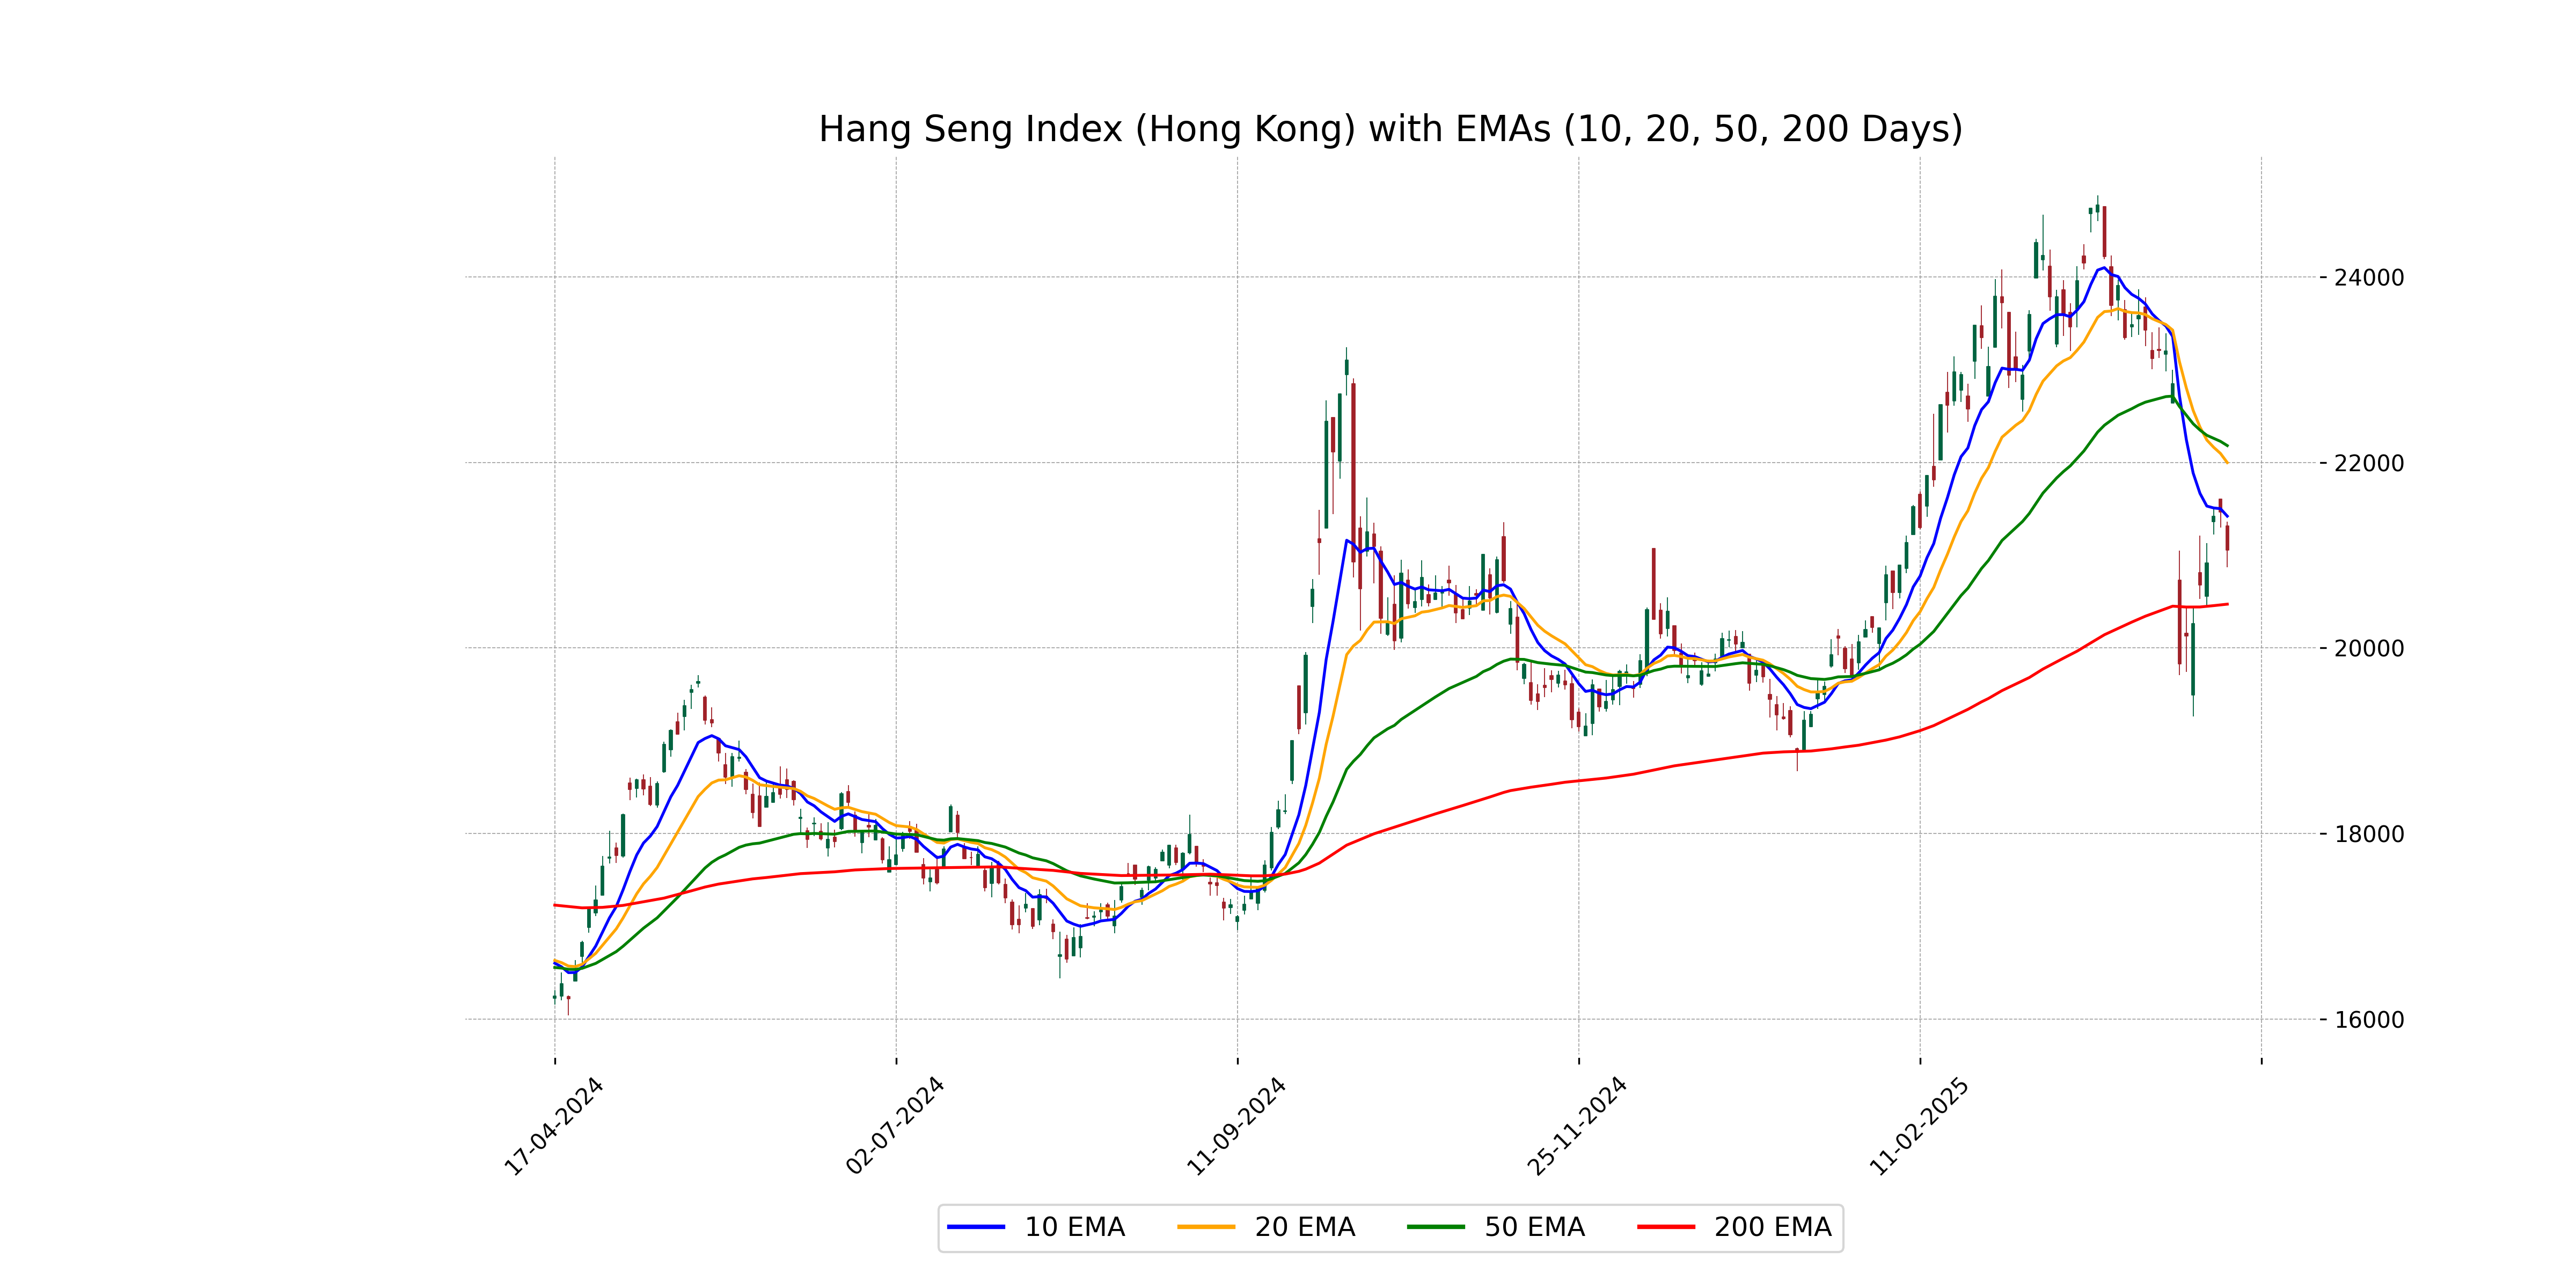
Relationship with Key Moving Averages
The closing price of Hang Seng Index at 21,056.98 is below its 10 EMA (21,420.37), 20 EMA (21,997.18), and 50 EMA (22,180.45), indicating a bearish trend in the short to medium term. However, it remains above its 200 EMA (20,472.33), suggesting potential long-term support.
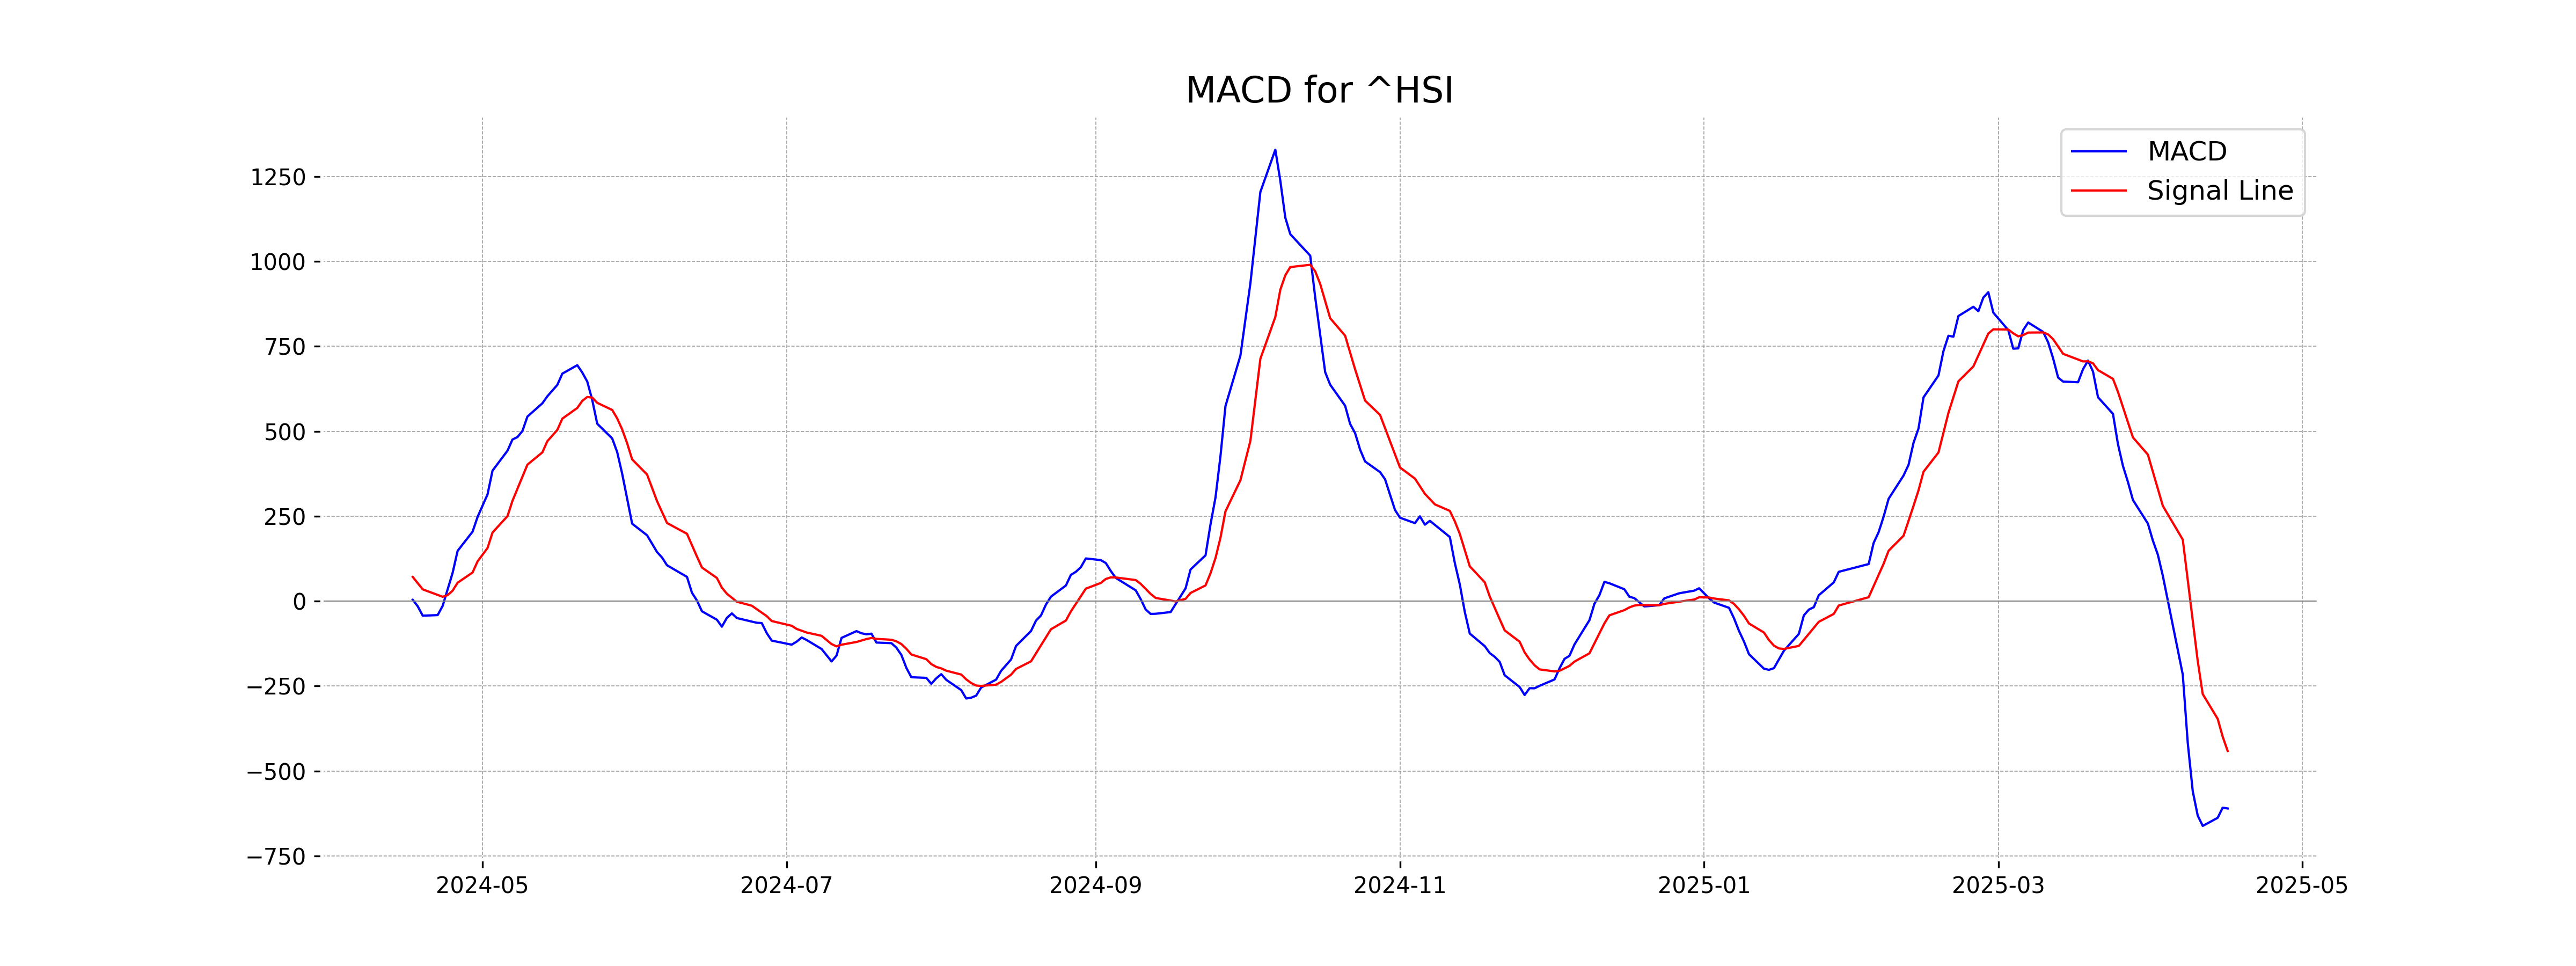
Moving Averages Trend (MACD)
Analysis for Hang Seng Index (Hong Kong): The MACD value of -610.52, which is below the MACD Signal of -441.23, indicates a bearish trend, suggesting that momentum is currently on the decline. This crossover situation often signals potential further downward movement or consolidation.
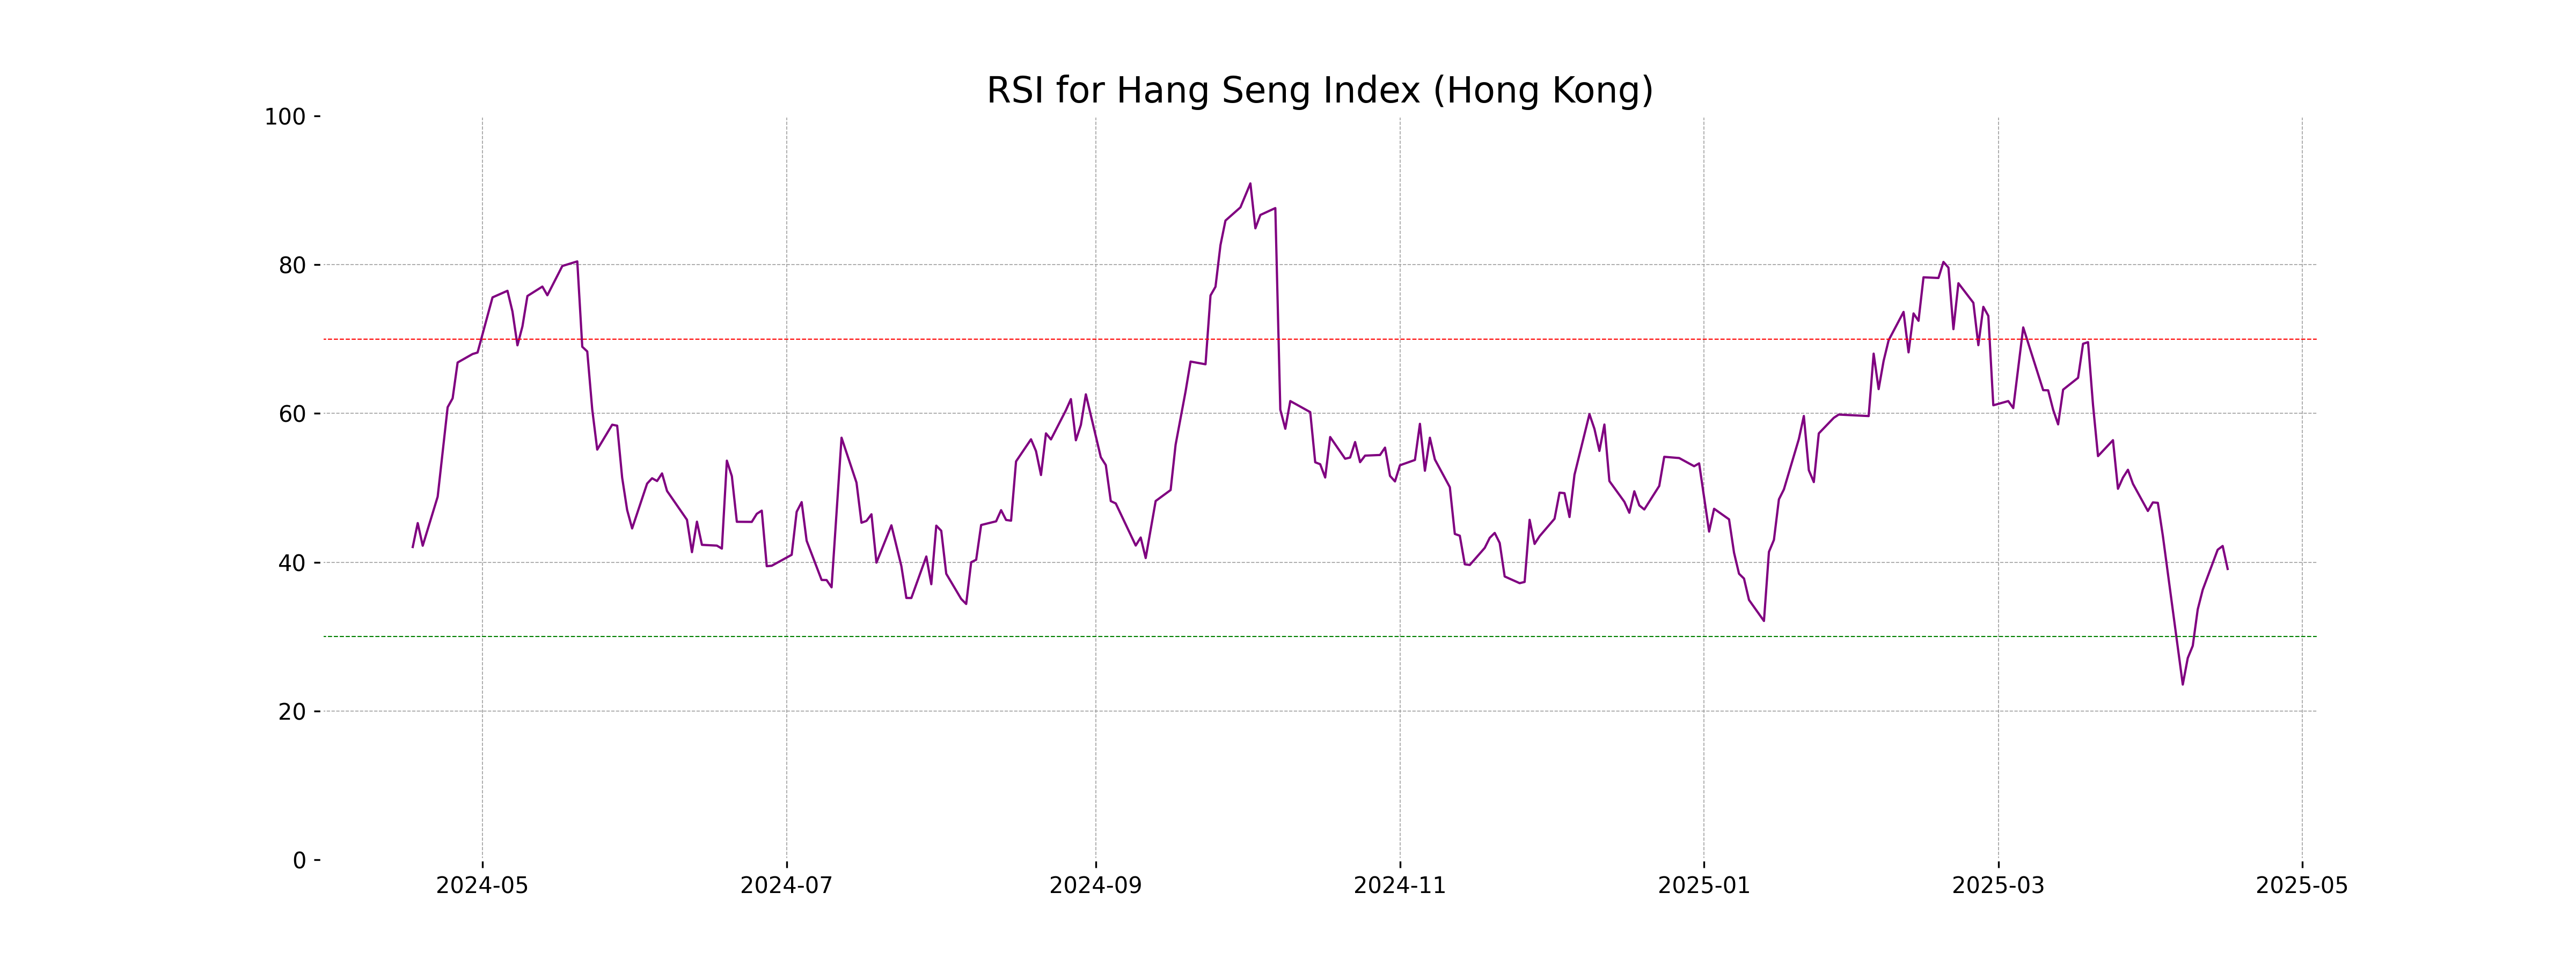
RSI Analysis
RSI Analysis for Hang Seng Index (Hong Kong): The RSI (Relative Strength Index) of 39.09 indicates that the Hang Seng Index is nearing the oversold territory, suggesting potential for a price reversal or stabilization. It may imply decreased selling pressure and possible buying opportunities if the trend begins to shift.
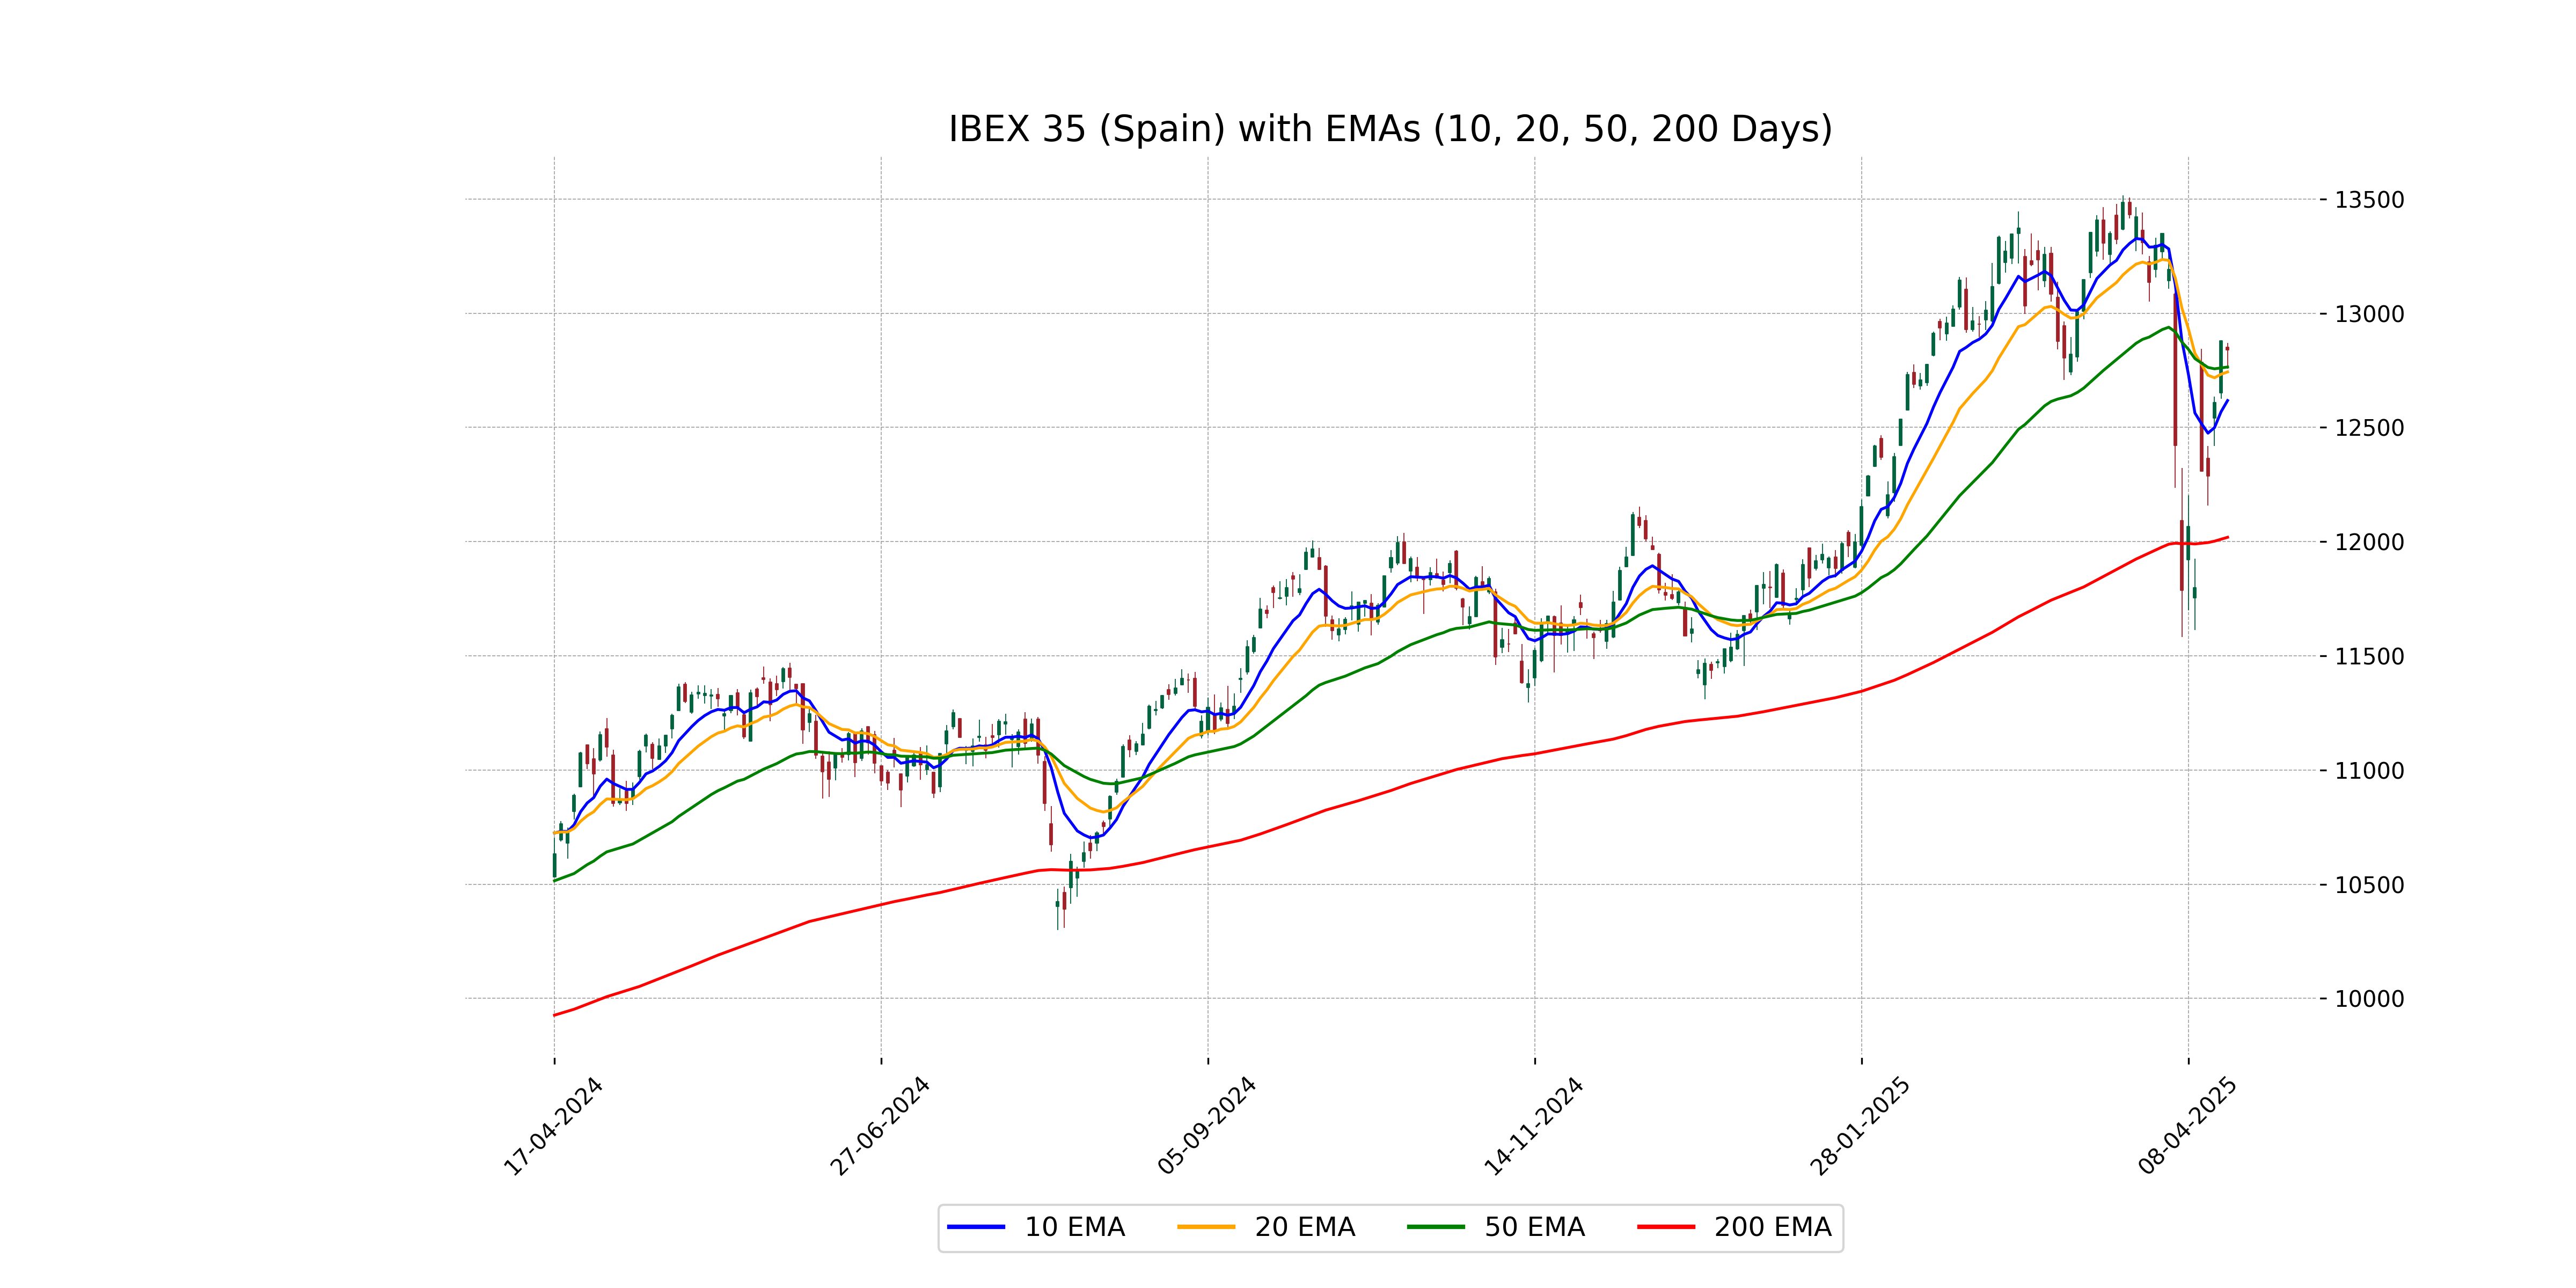
Analysis for IBEX 35 (Spain) - April 16, 2025

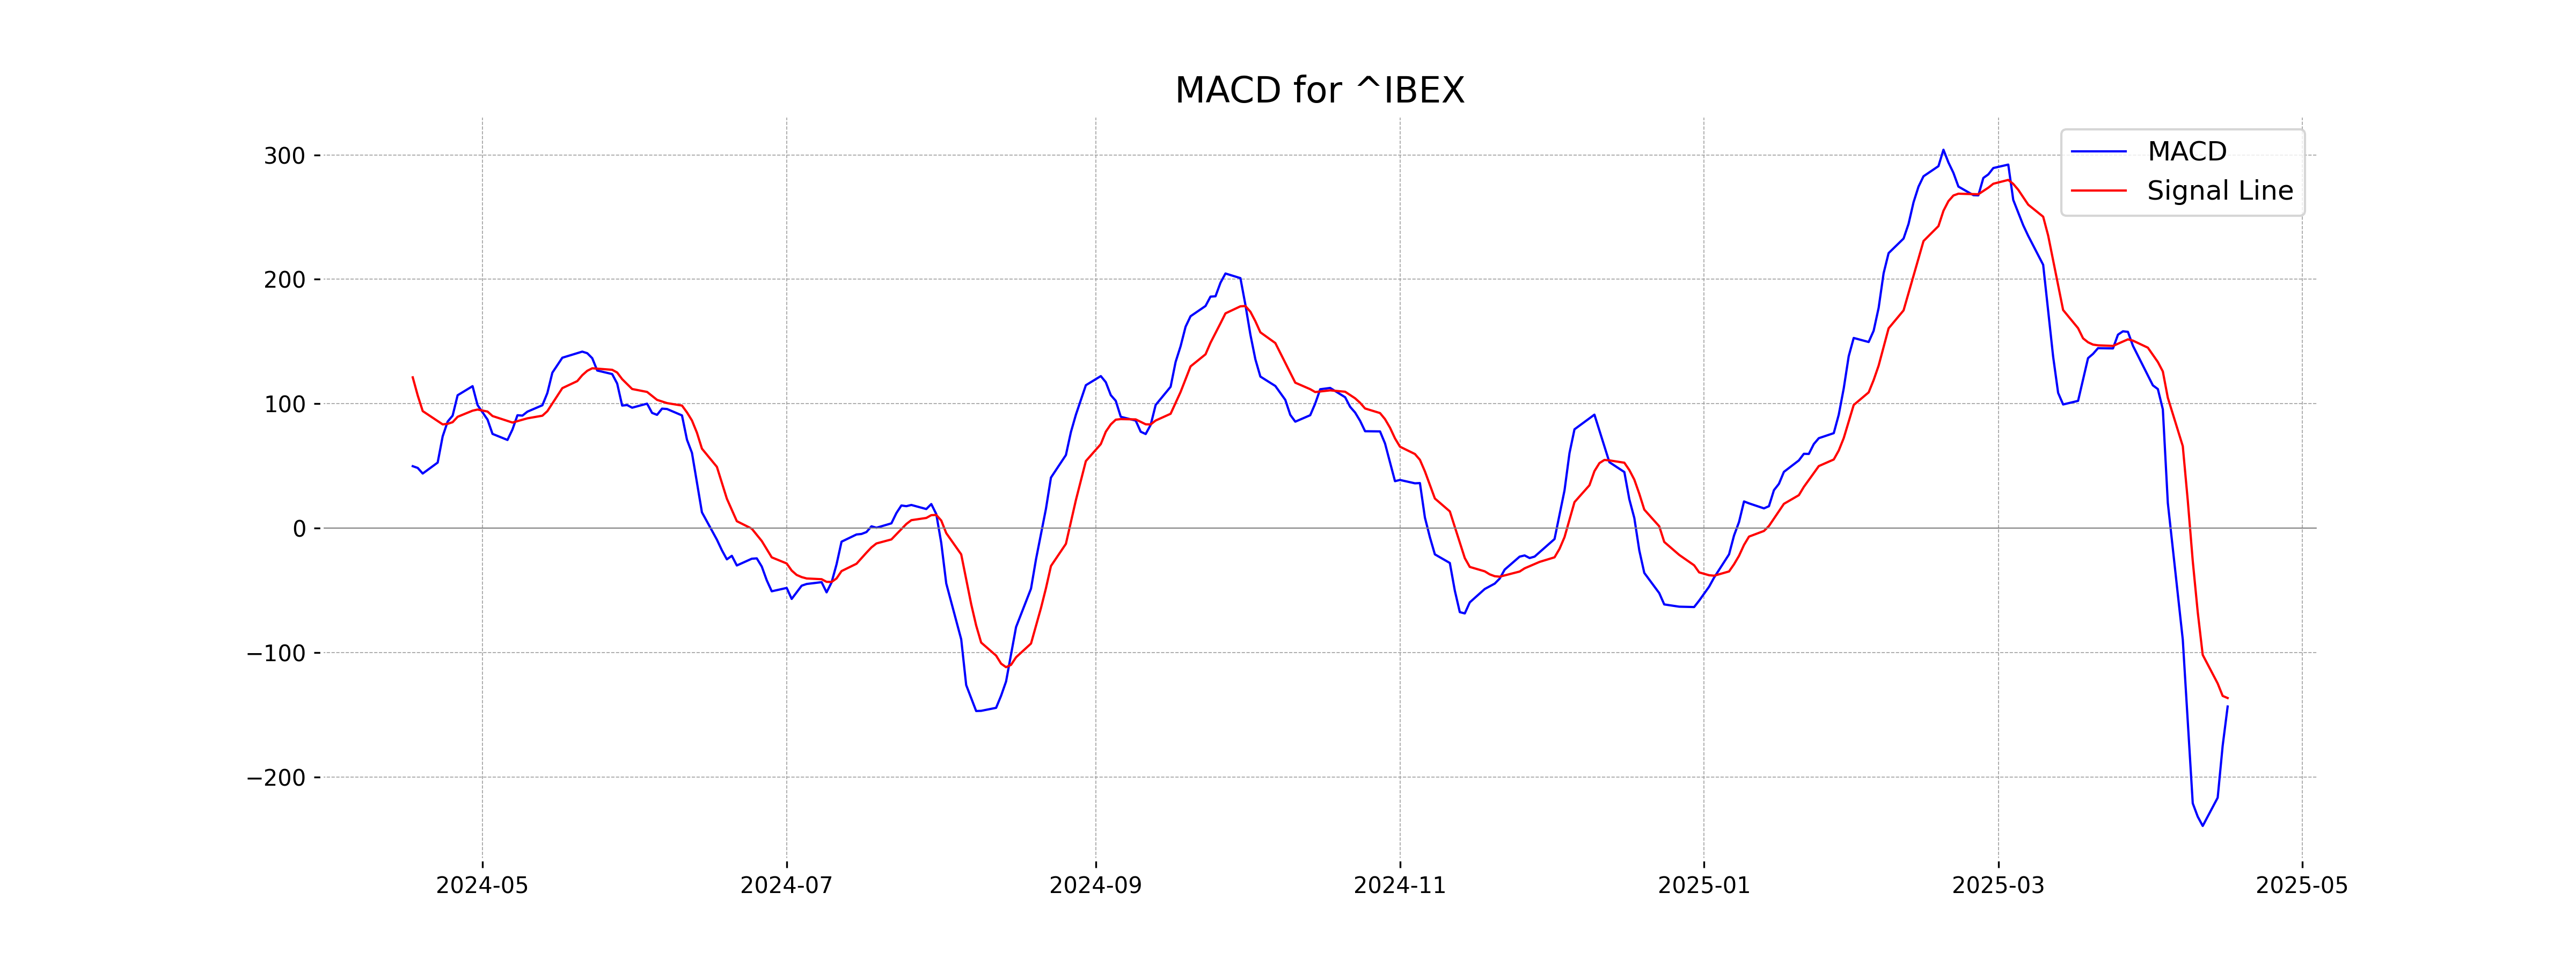
IBEX 35 (Spain) performance shows a slight decline with a closing figure of 12,839.40, marking a decrease of 0.31% or 39.90 points from the previous close. The trading volume was 34,630,943, while the RSI stood at 50.91, indicating a neutral trend. The MACD value of -143.42 suggests a bearish momentum when compared to the MACD Signal of -136.60.
Relationship with Key Moving Averages
The closing price of IBEX 35 (Spain) is 12,839.40, positioned above its 10 EMA (12,617.67), indicating recent momentum, and also above the 50 EMA (12,764.38), suggesting a short-term bullish trend. However, it's important to note that the current price is still significantly higher than the 200 EMA (12,018.91), reflecting an overall long-term bullish market sentiment despite a slight daily negative change.
Moving Averages Trend (MACD)
The MACD for IBEX 35 is -143.42, with a signal line of -136.60, indicating a bearish momentum as the MACD is below the signal line. This suggests potential continued downward pressure on the index.
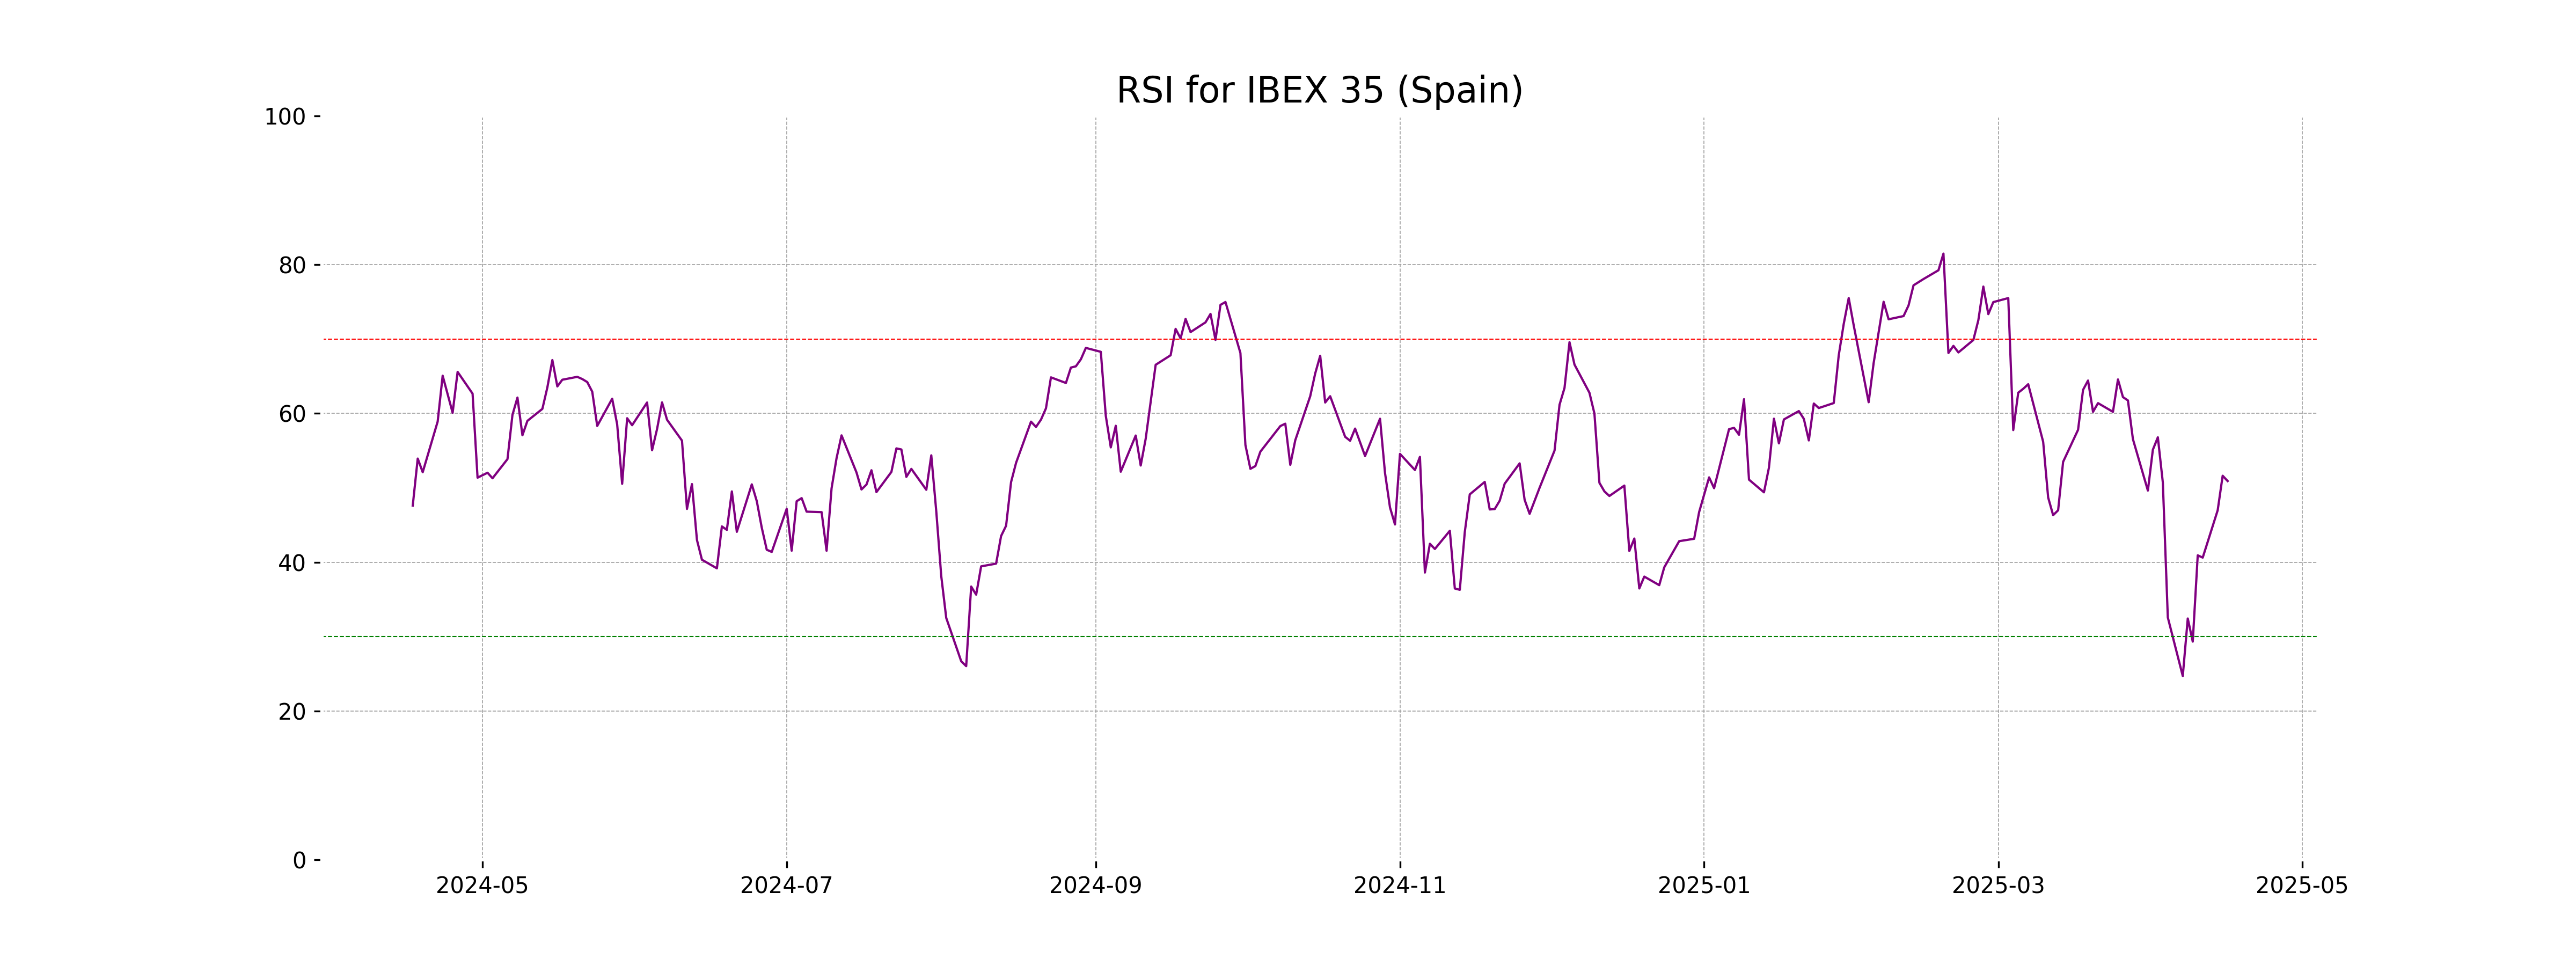
RSI Analysis
The RSI for IBEX 35 (Spain) is 50.91, indicating a neutral position that suggests neither overbought nor oversold conditions in the market. Typically, RSI values above 70 represent overbought conditions, whereas values below 30 indicate oversold conditions. As the RSI is around the midpoint, it suggests a balance between buying and selling pressures.
Analysis for NASDAQ Composite (US) - April 16, 2025
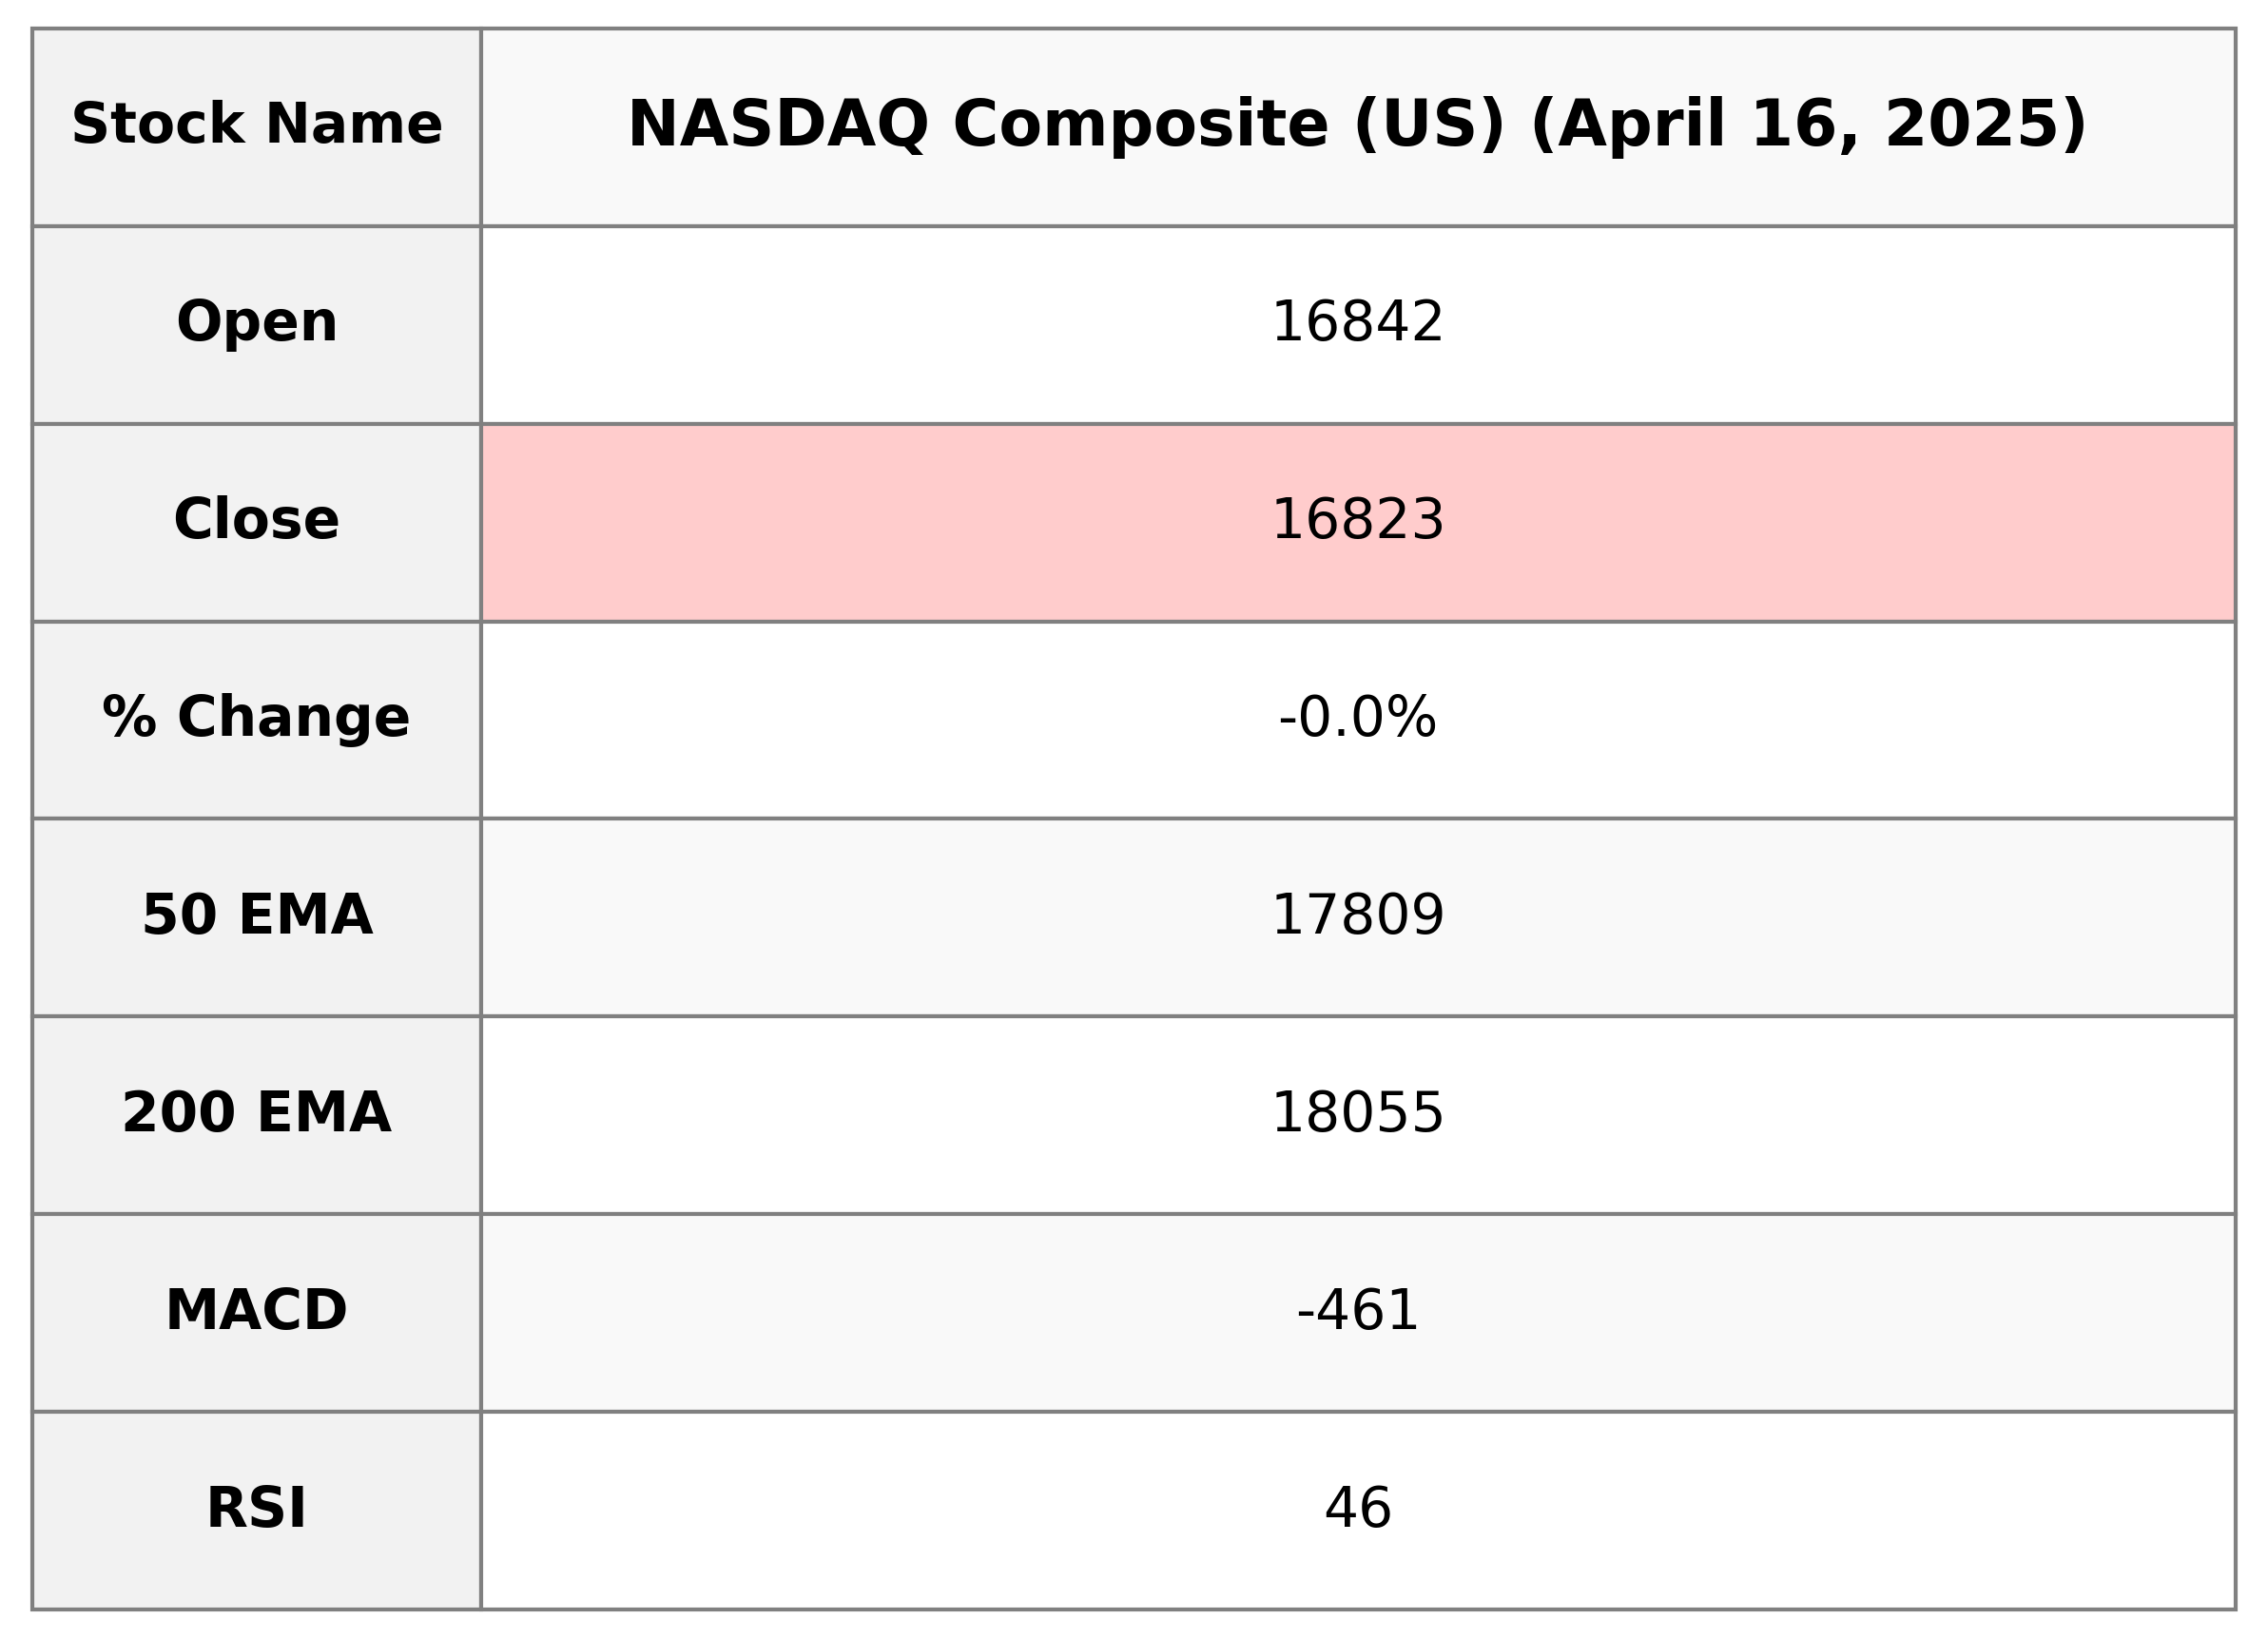
The NASDAQ Composite Index has seen a slight decline in its performance with a % change of -0.049%, closing at 16,823.17. It opened at 16,842.39 and faced high selling pressure, with the high reaching 16,979.96 and a low at 16,753.22. The RSI indicates a somewhat neutral market sentiment at 45.81, with MACD suggesting a bearish momentum currently.
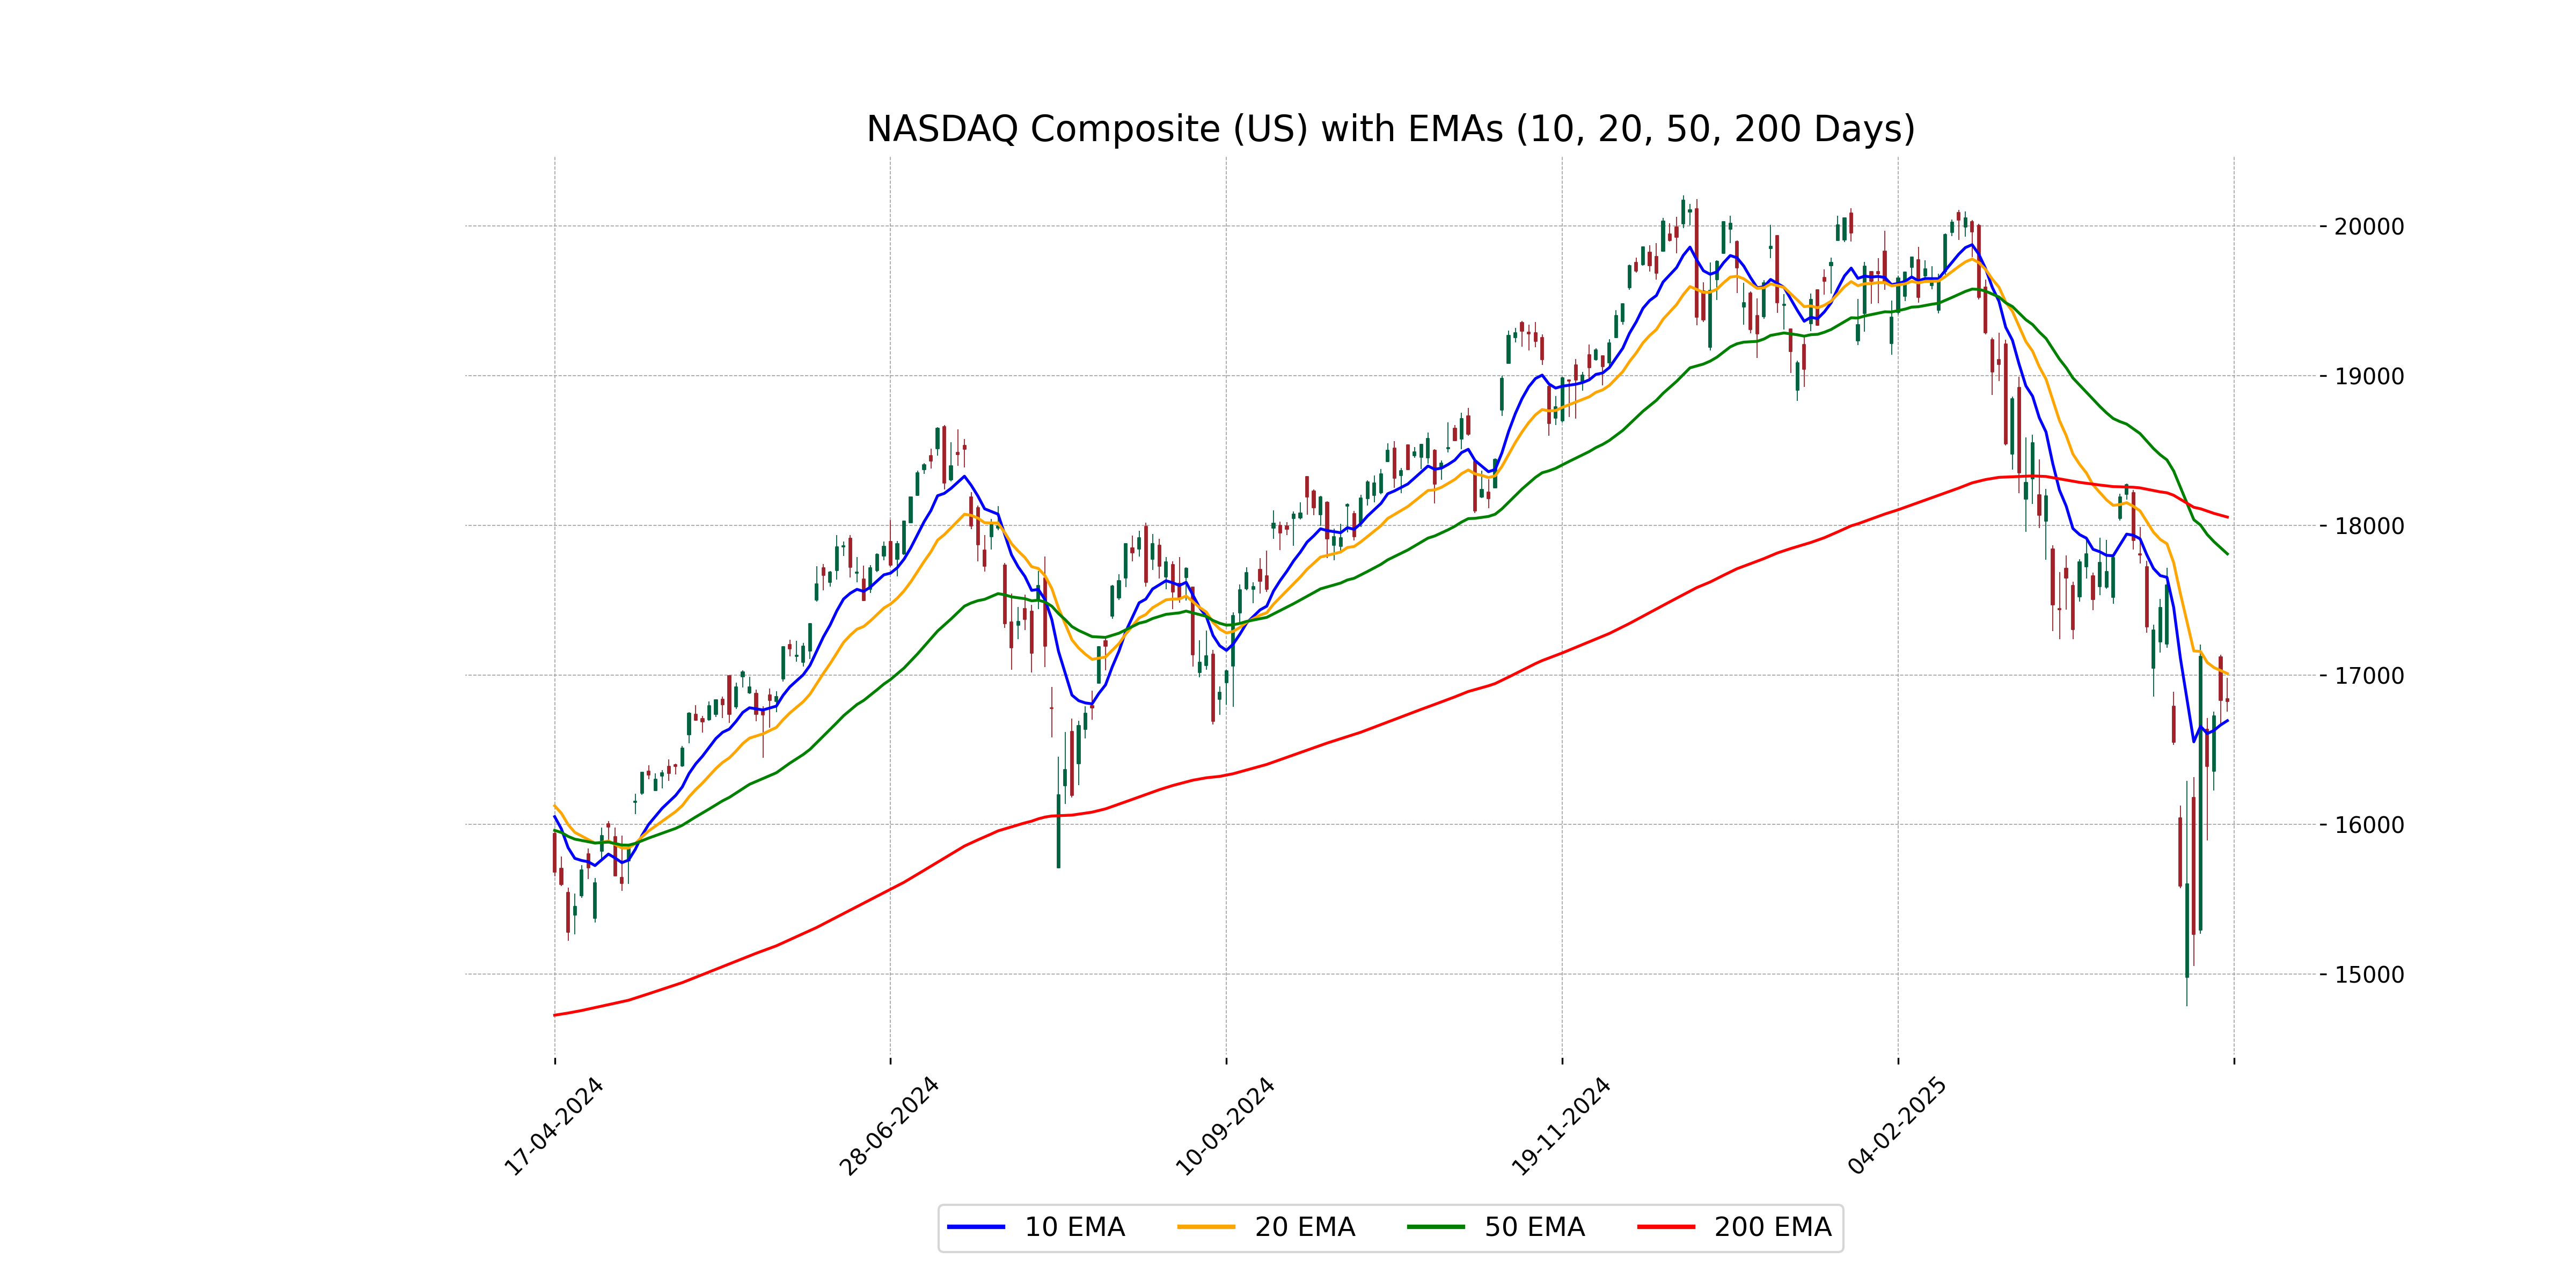
Relationship with Key Moving Averages
The NASDAQ Composite closed at 16,823.17, which is below the 50-day and 200-day EMAs at 17,809.17 and 18,055.26 respectively, indicating a bearish trend. However, it is currently trading above the 10-day EMA of 16,694.57 but below the 20-day EMA of 17,009.26.
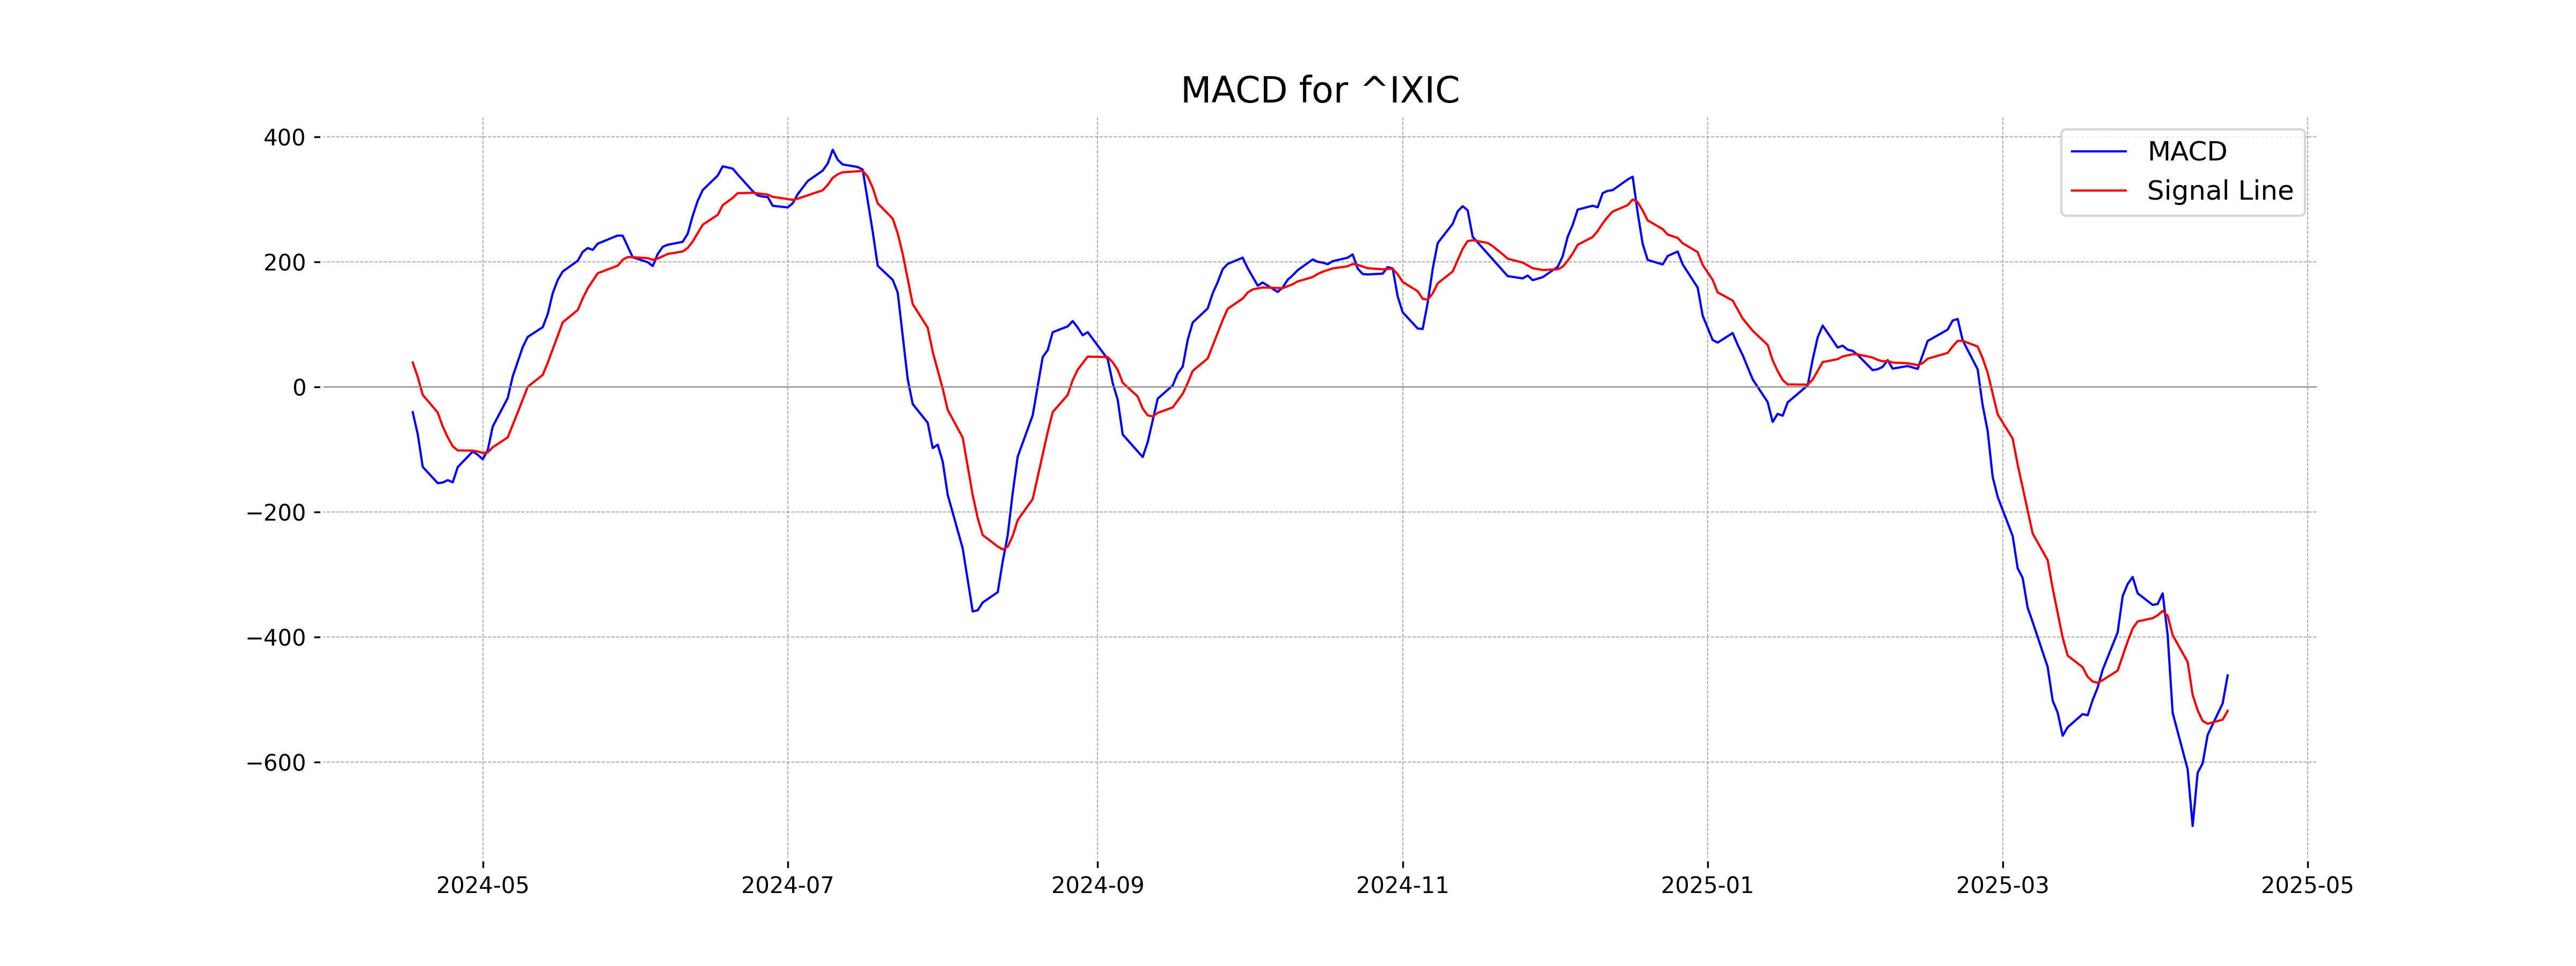
Moving Averages Trend (MACD)
NASDAQ Composite (US) MACD Analysis: The MACD for NASDAQ Composite is currently at -461.15, while the MACD Signal line is at -517.71. With the MACD above the signal line, there might be a potential bullish crossover indicating a possible upcoming bullish momentum in the market.
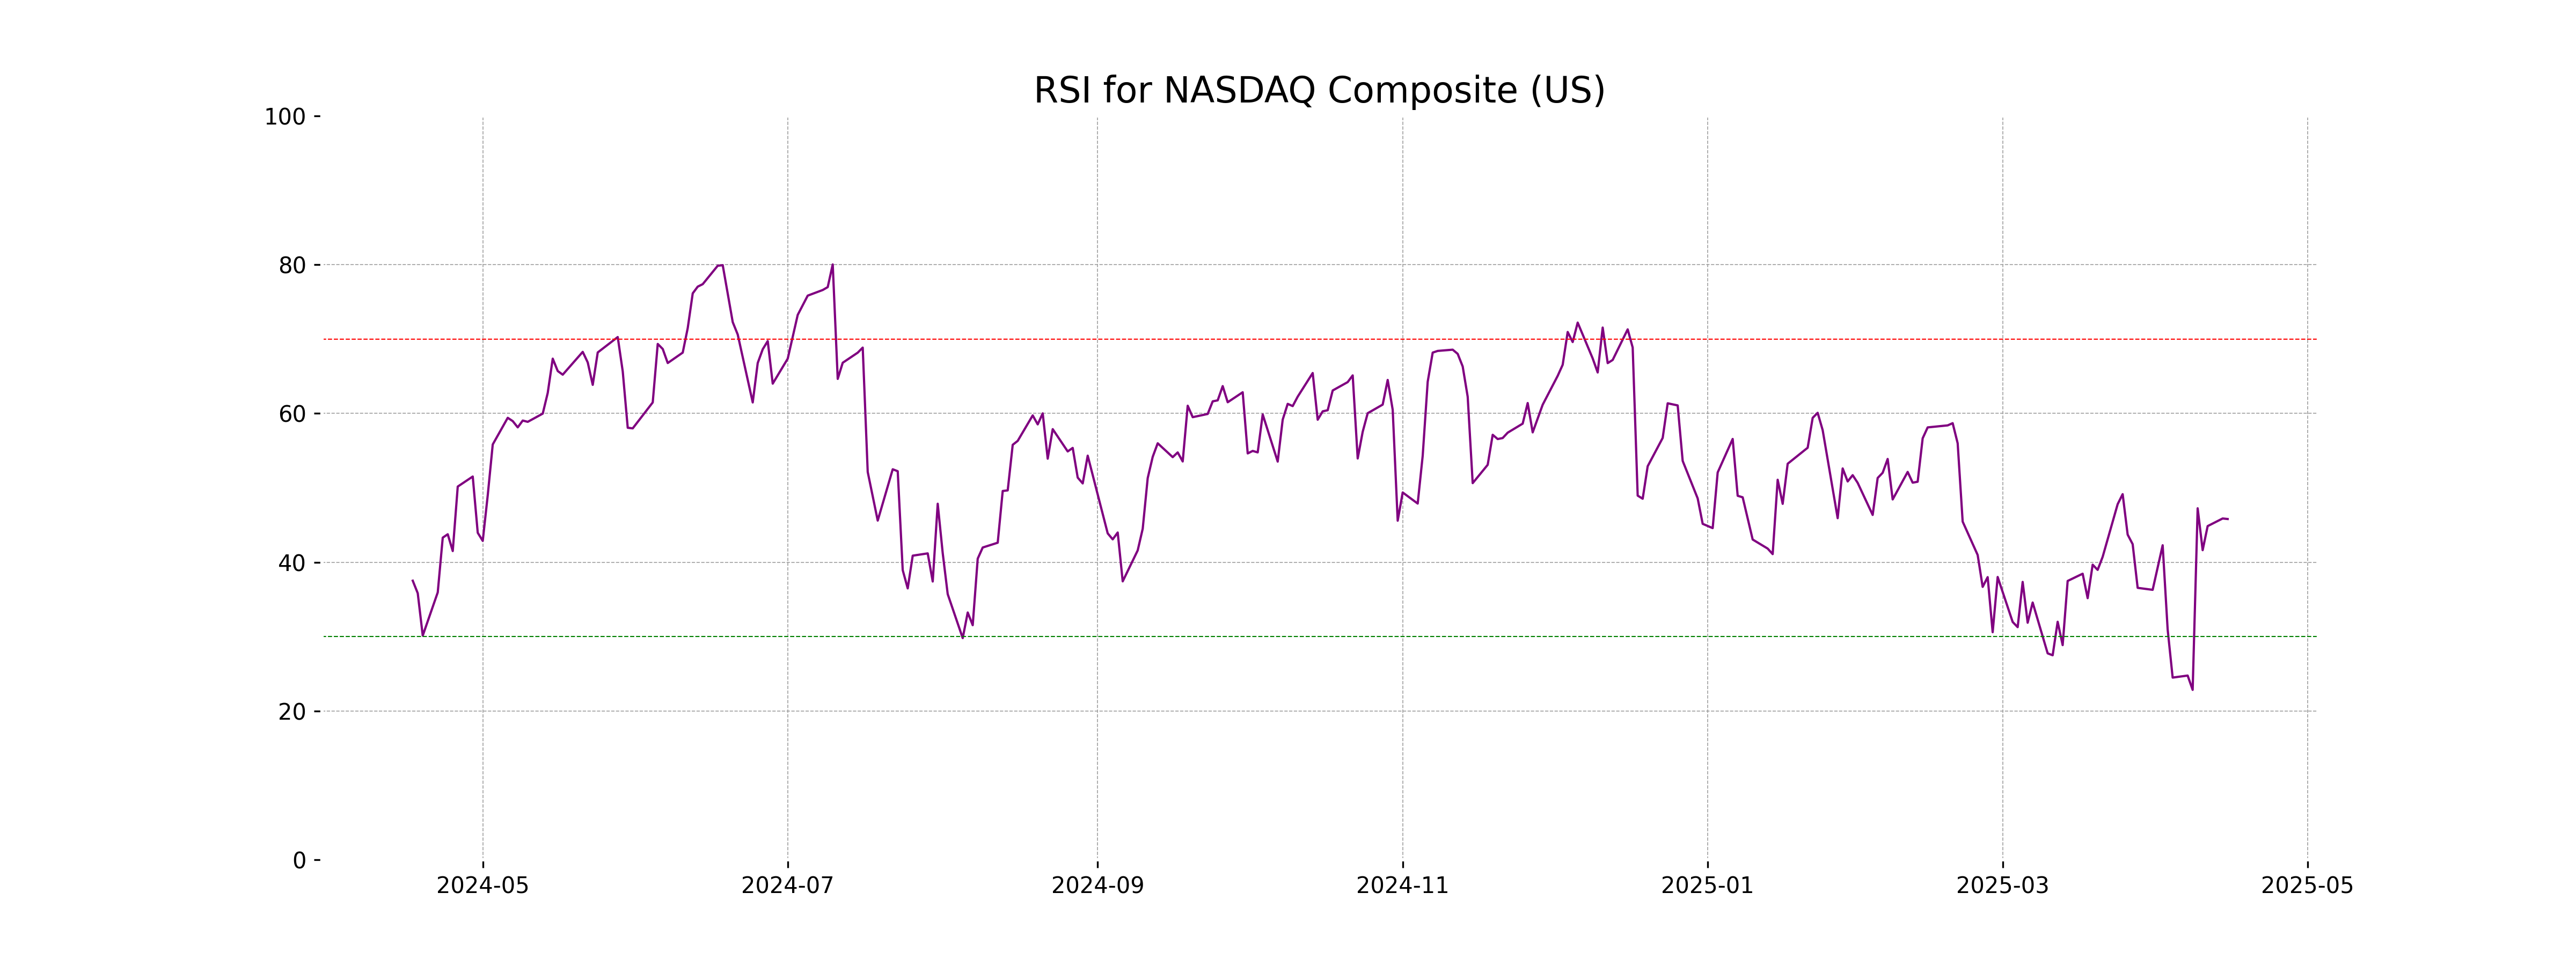
RSI Analysis
RSI Analysis for NASDAQ Composite (US): The RSI is currently at 45.81, which indicates that the stock is in a neutral zone, neither overbought nor oversold. This suggests a lack of directional momentum and potential for either moves as conditions develop.
Analysis for Nikkei 225 (Japan) - April 16, 2025
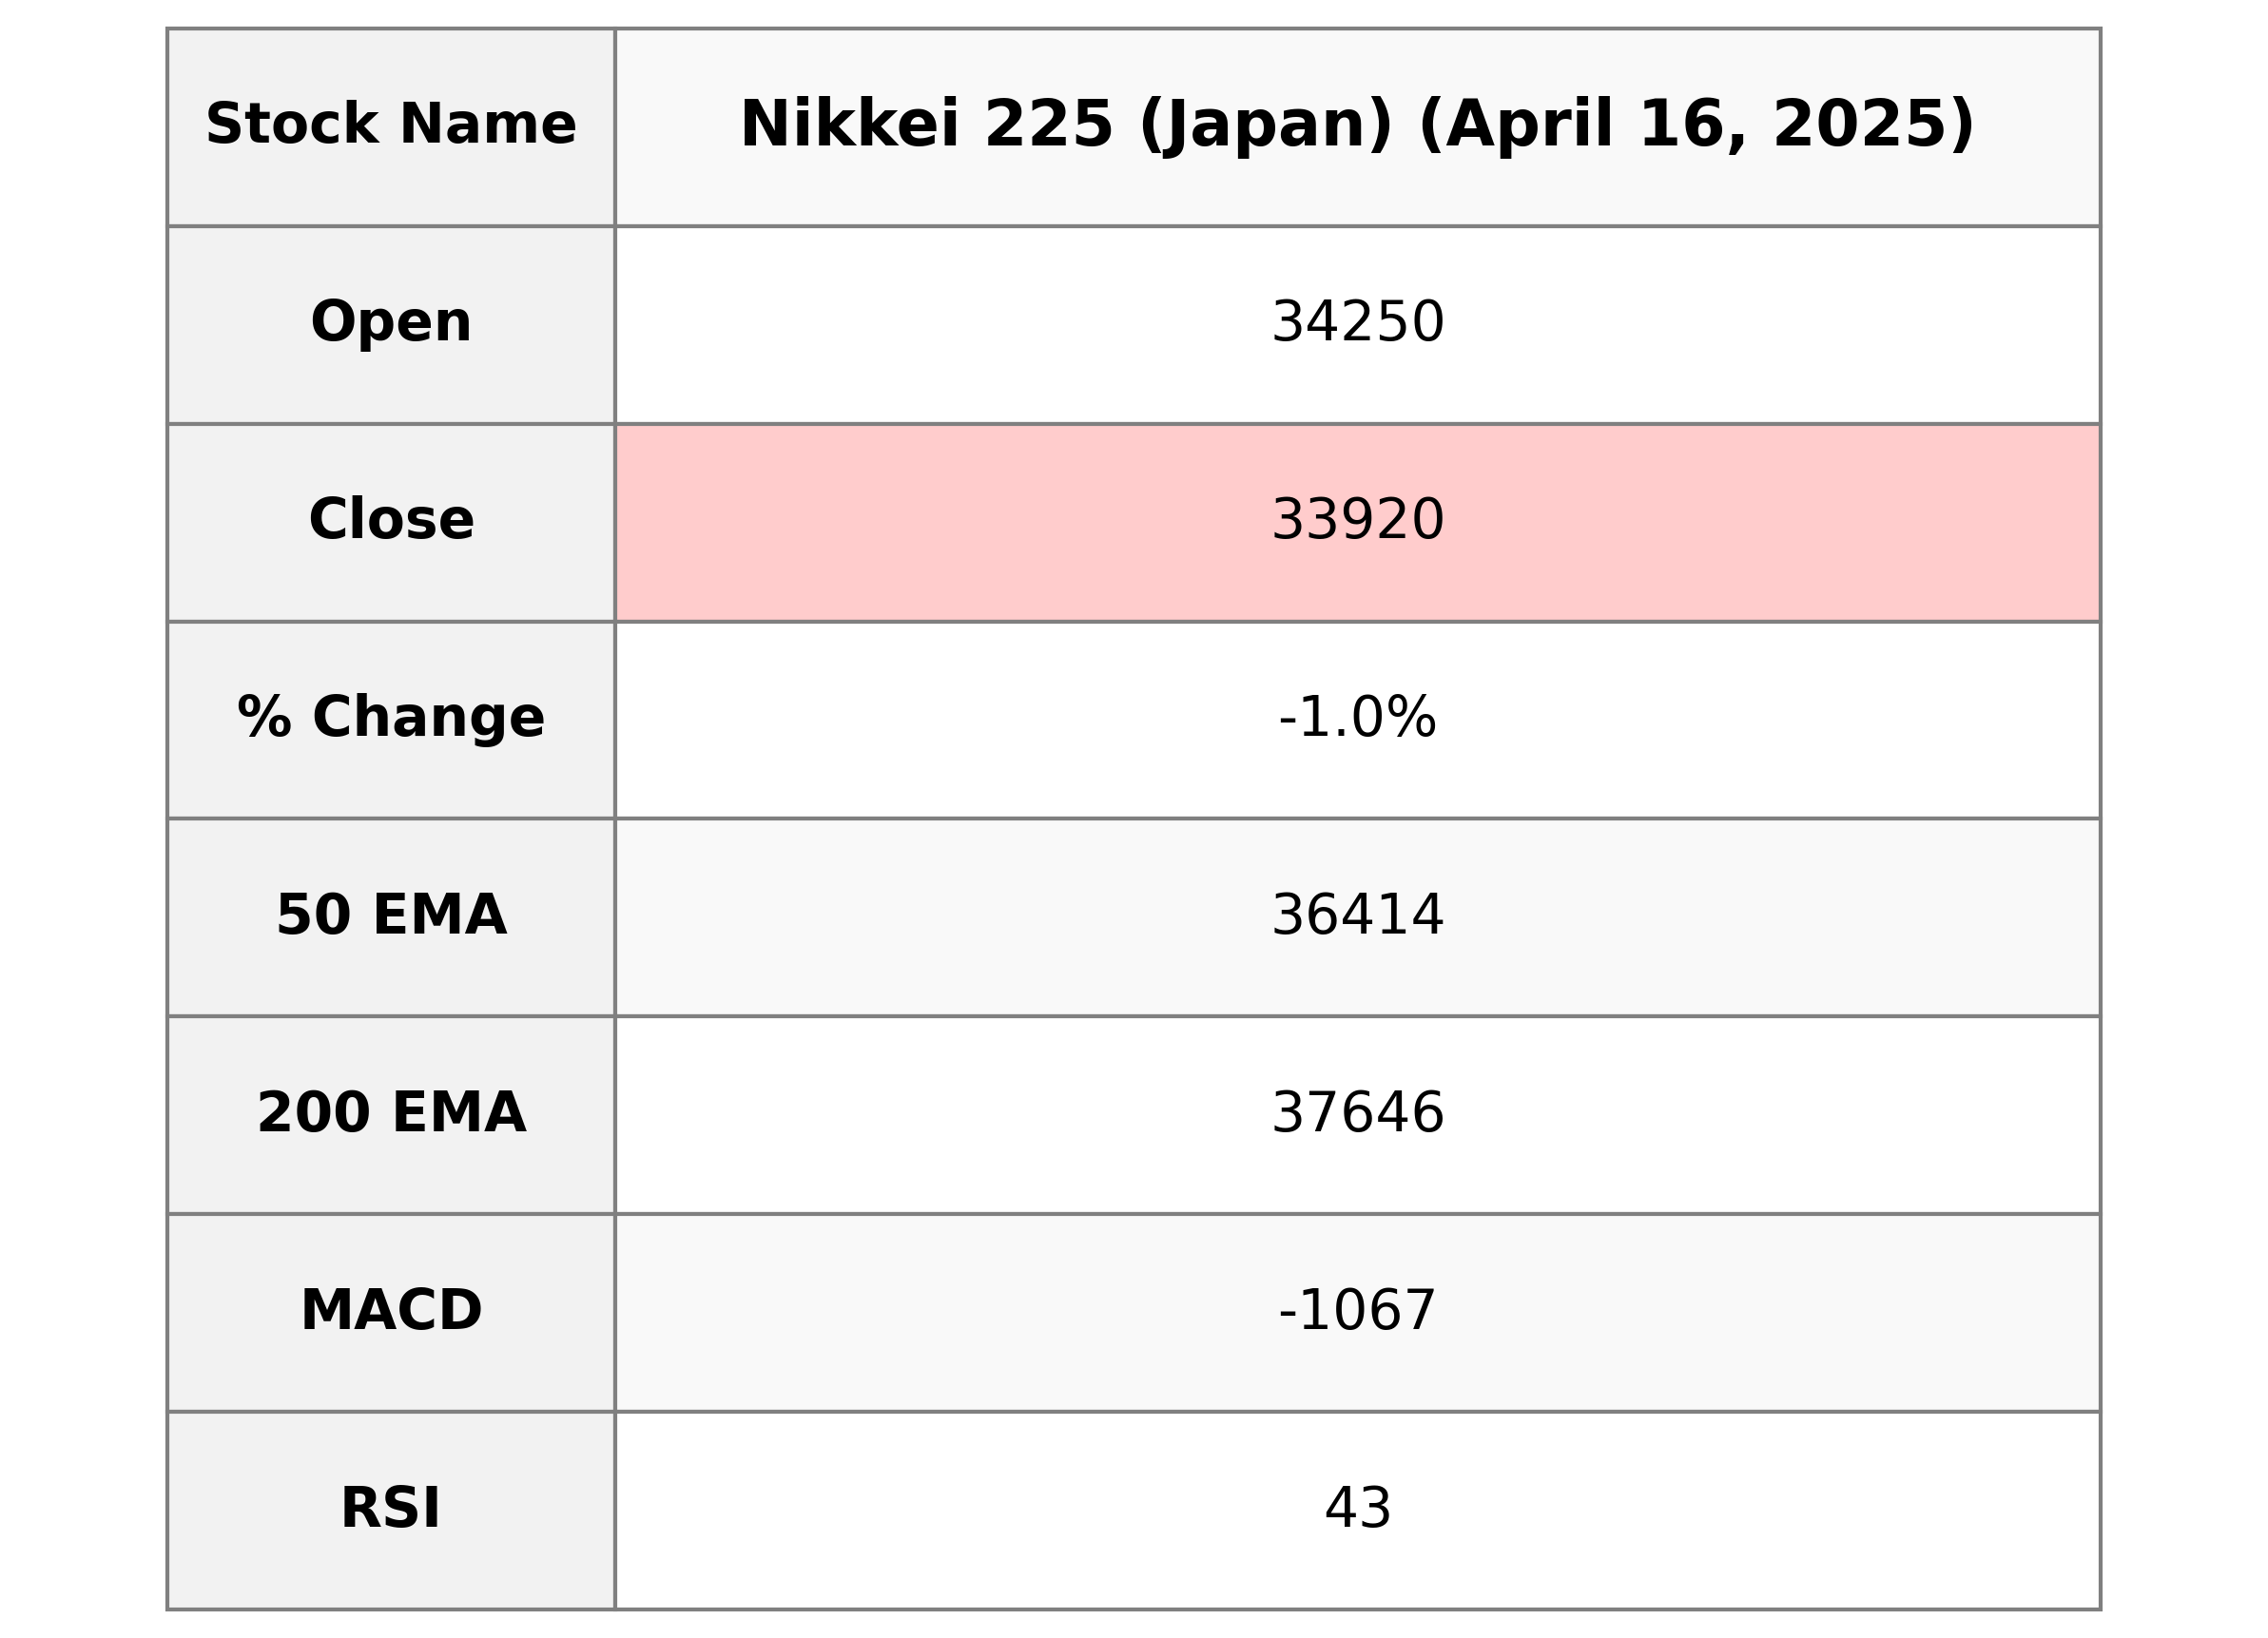
Nikkei 225 (Japan) Performance: The Nikkei 225 opened at 34,249.82 and closed at 33,920.40, showing a decrease of -1.01% or -347.14 points from the previous close of 34,267.54. The index exhibits a bearish sentiment with an RSI of 42.83 and a negative MACD, indicating potential downward pressure in the short term.
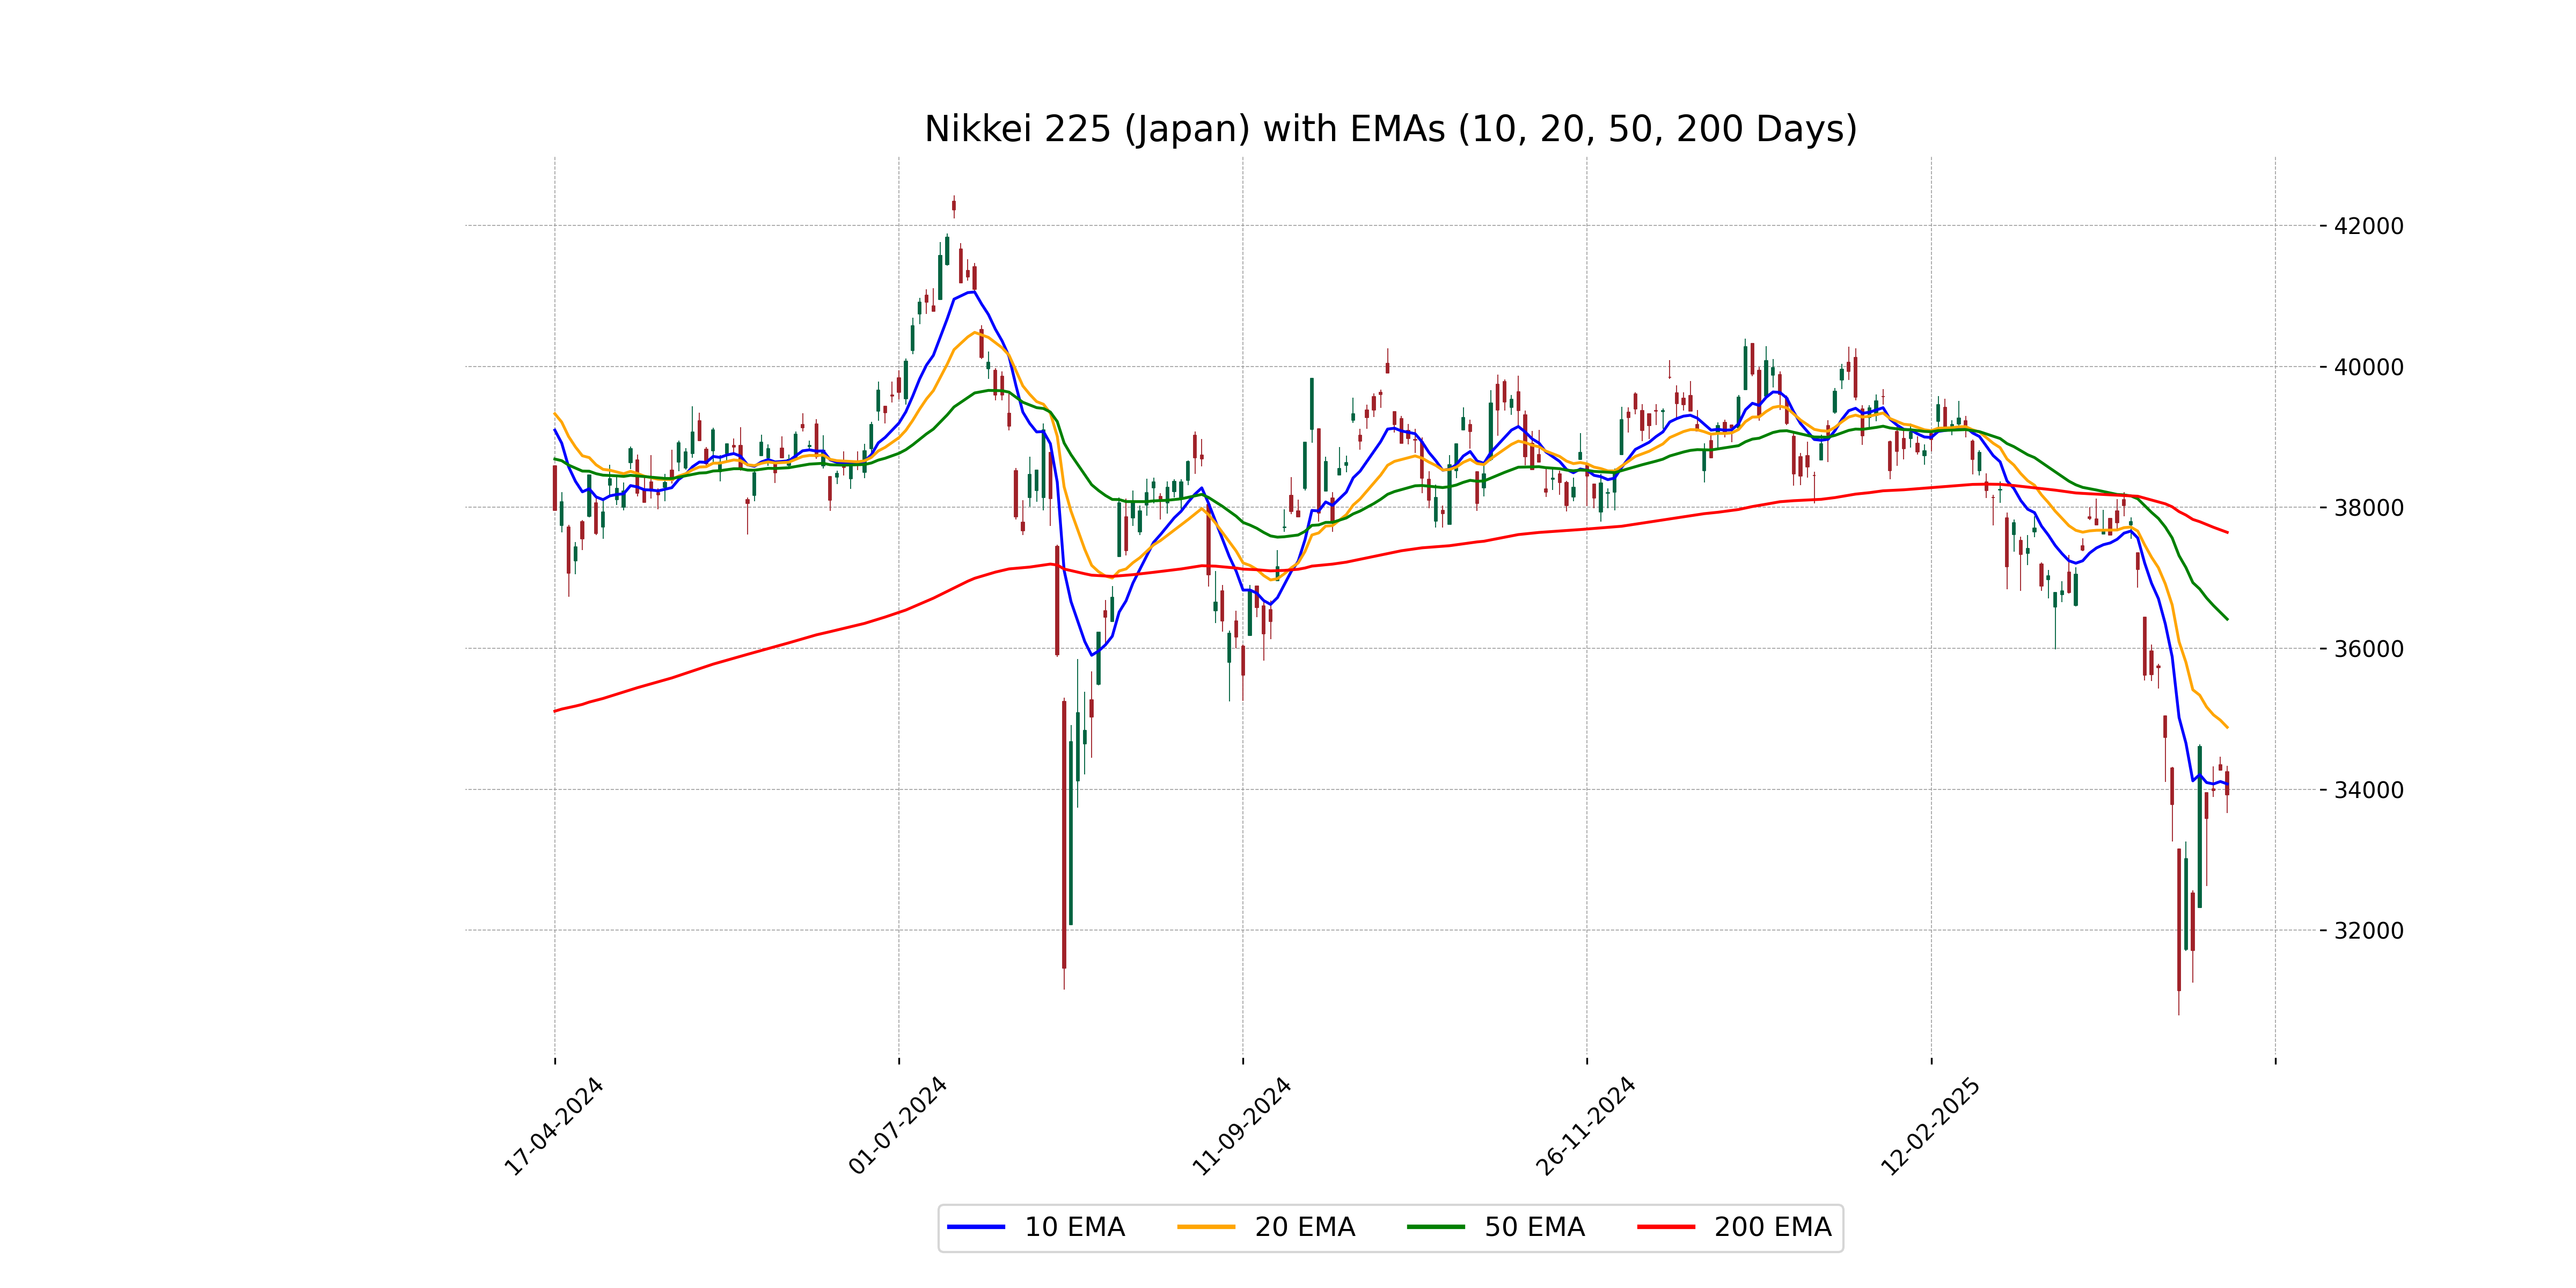
Relationship with Key Moving Averages
Nikkei 225 is currently trading below its key moving averages. The close price of 33,920.40 is below the 50-day EMA of 36,413.60 and the 200-day EMA of 37,646.12, indicating a potential bearish trend. Additionally, it's slightly below the 10-day EMA of 34,075.15 and the 20-day EMA of 34,879.55.
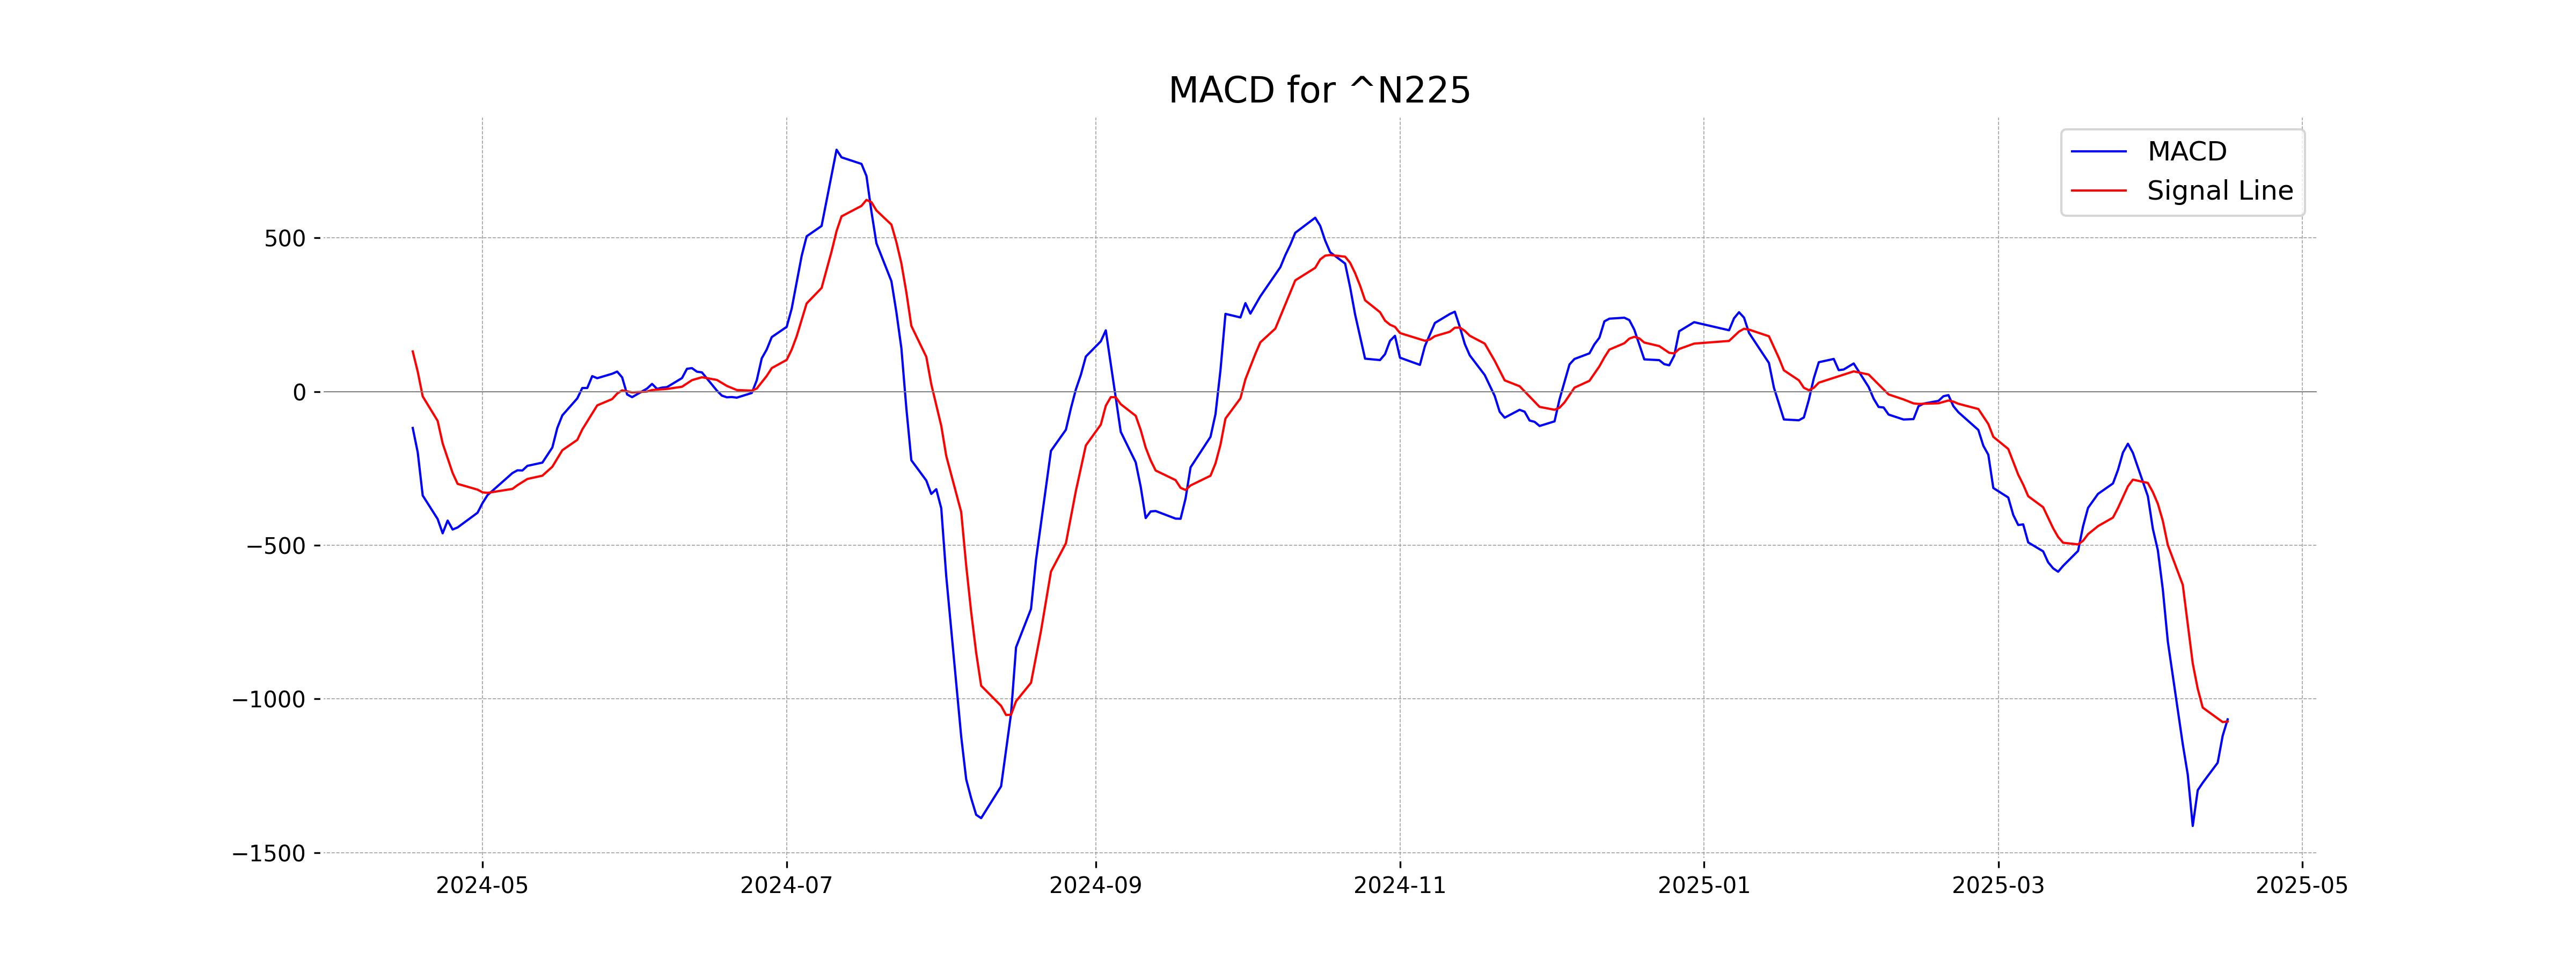
Moving Averages Trend (MACD)
Based on the stock data for Nikkei 225, the MACD value of -1066.56 is slightly higher than the MACD Signal of -1073.61, indicating a potential trend shift. However, both values are negative, suggesting the index is currently in a bearish phase.
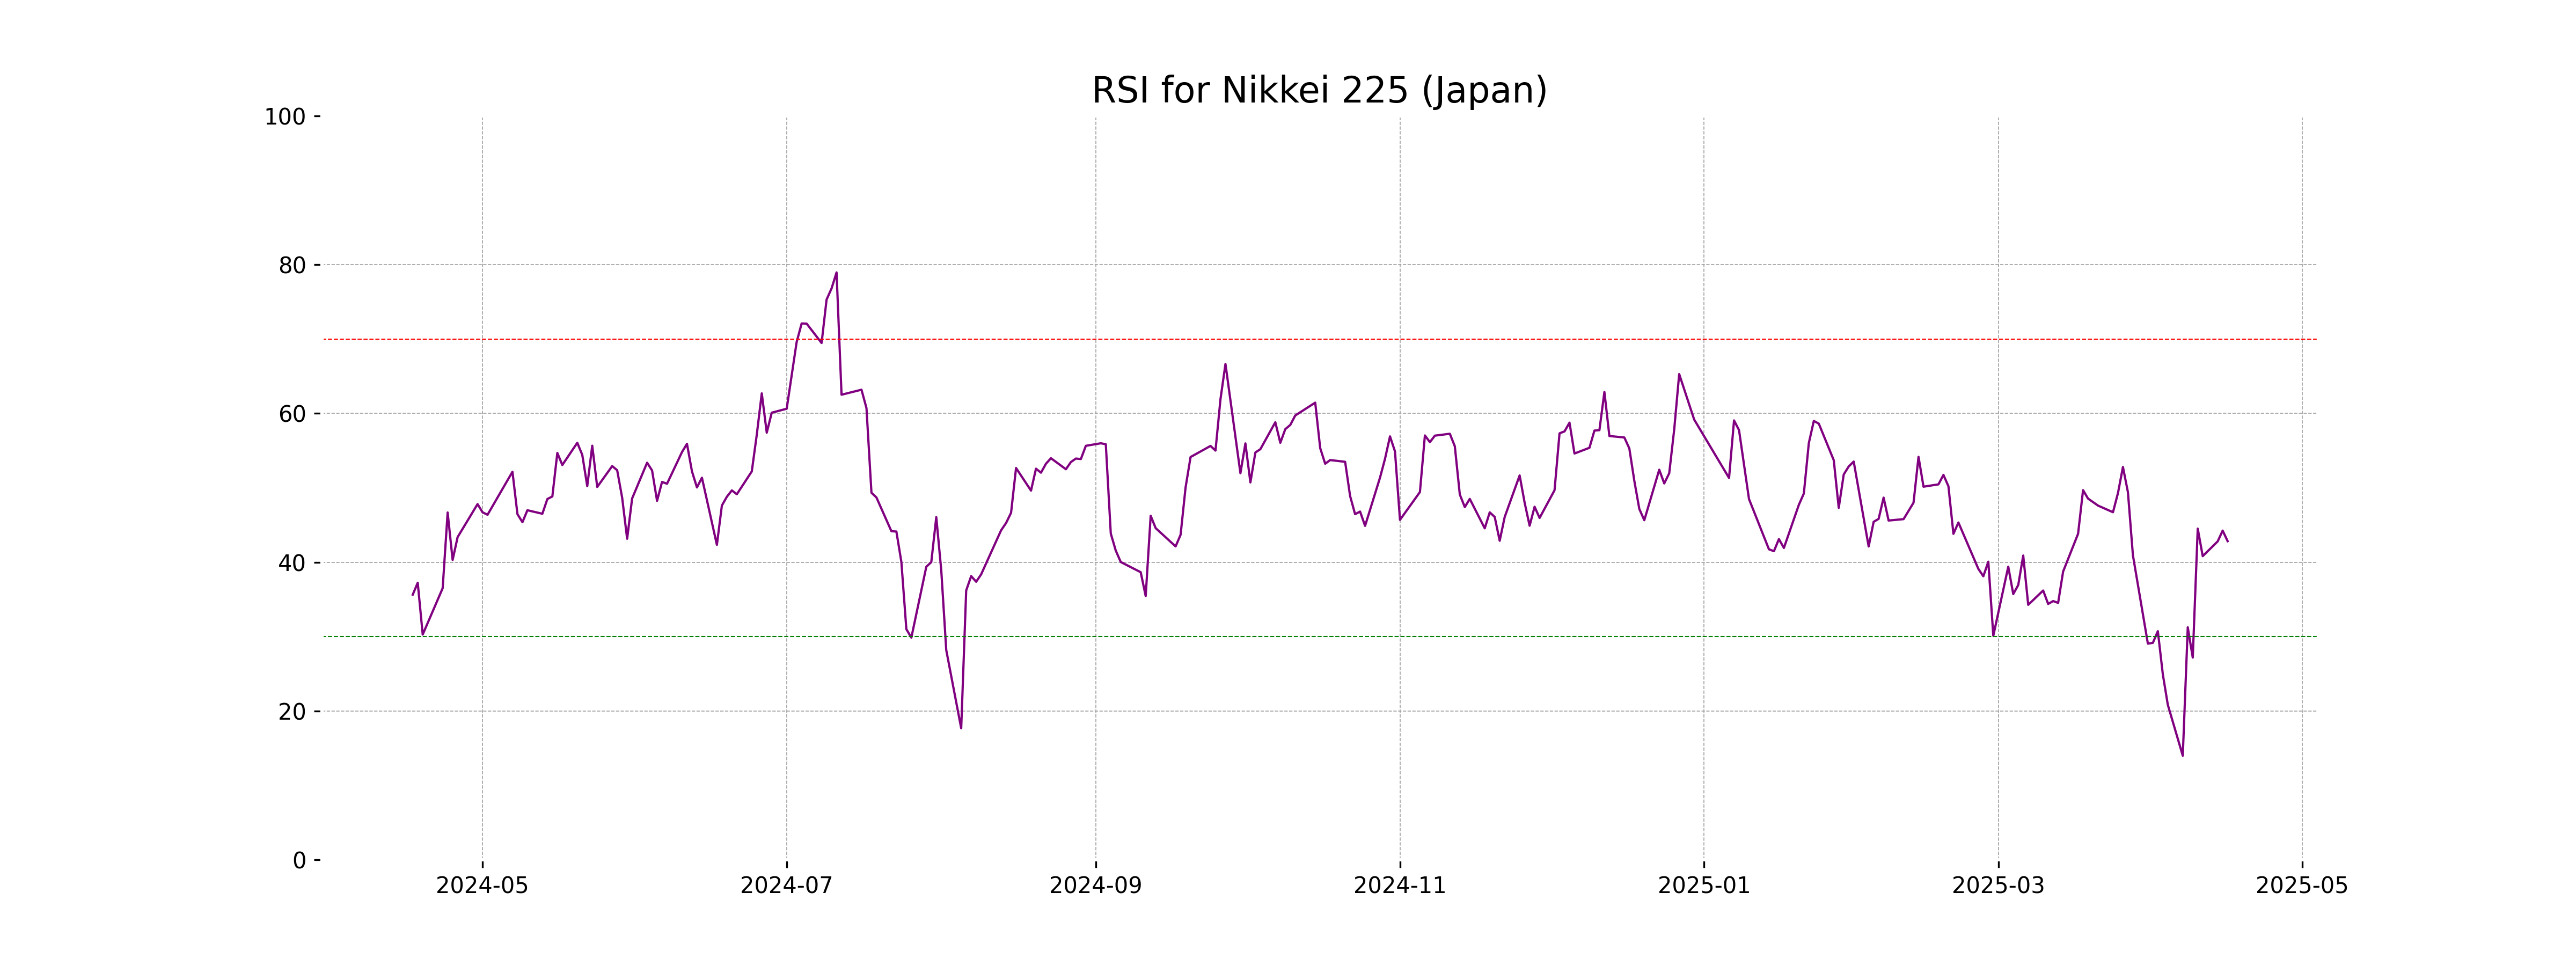
RSI Analysis
The RSI value for Nikkei 225 is 42.83, indicating that the index is in a neutral zone, neither overbought nor oversold. Investors might monitor for potential buying opportunities if the RSI approaches the oversold threshold of 30.
Analysis for Nifty Bank - April 16, 2025
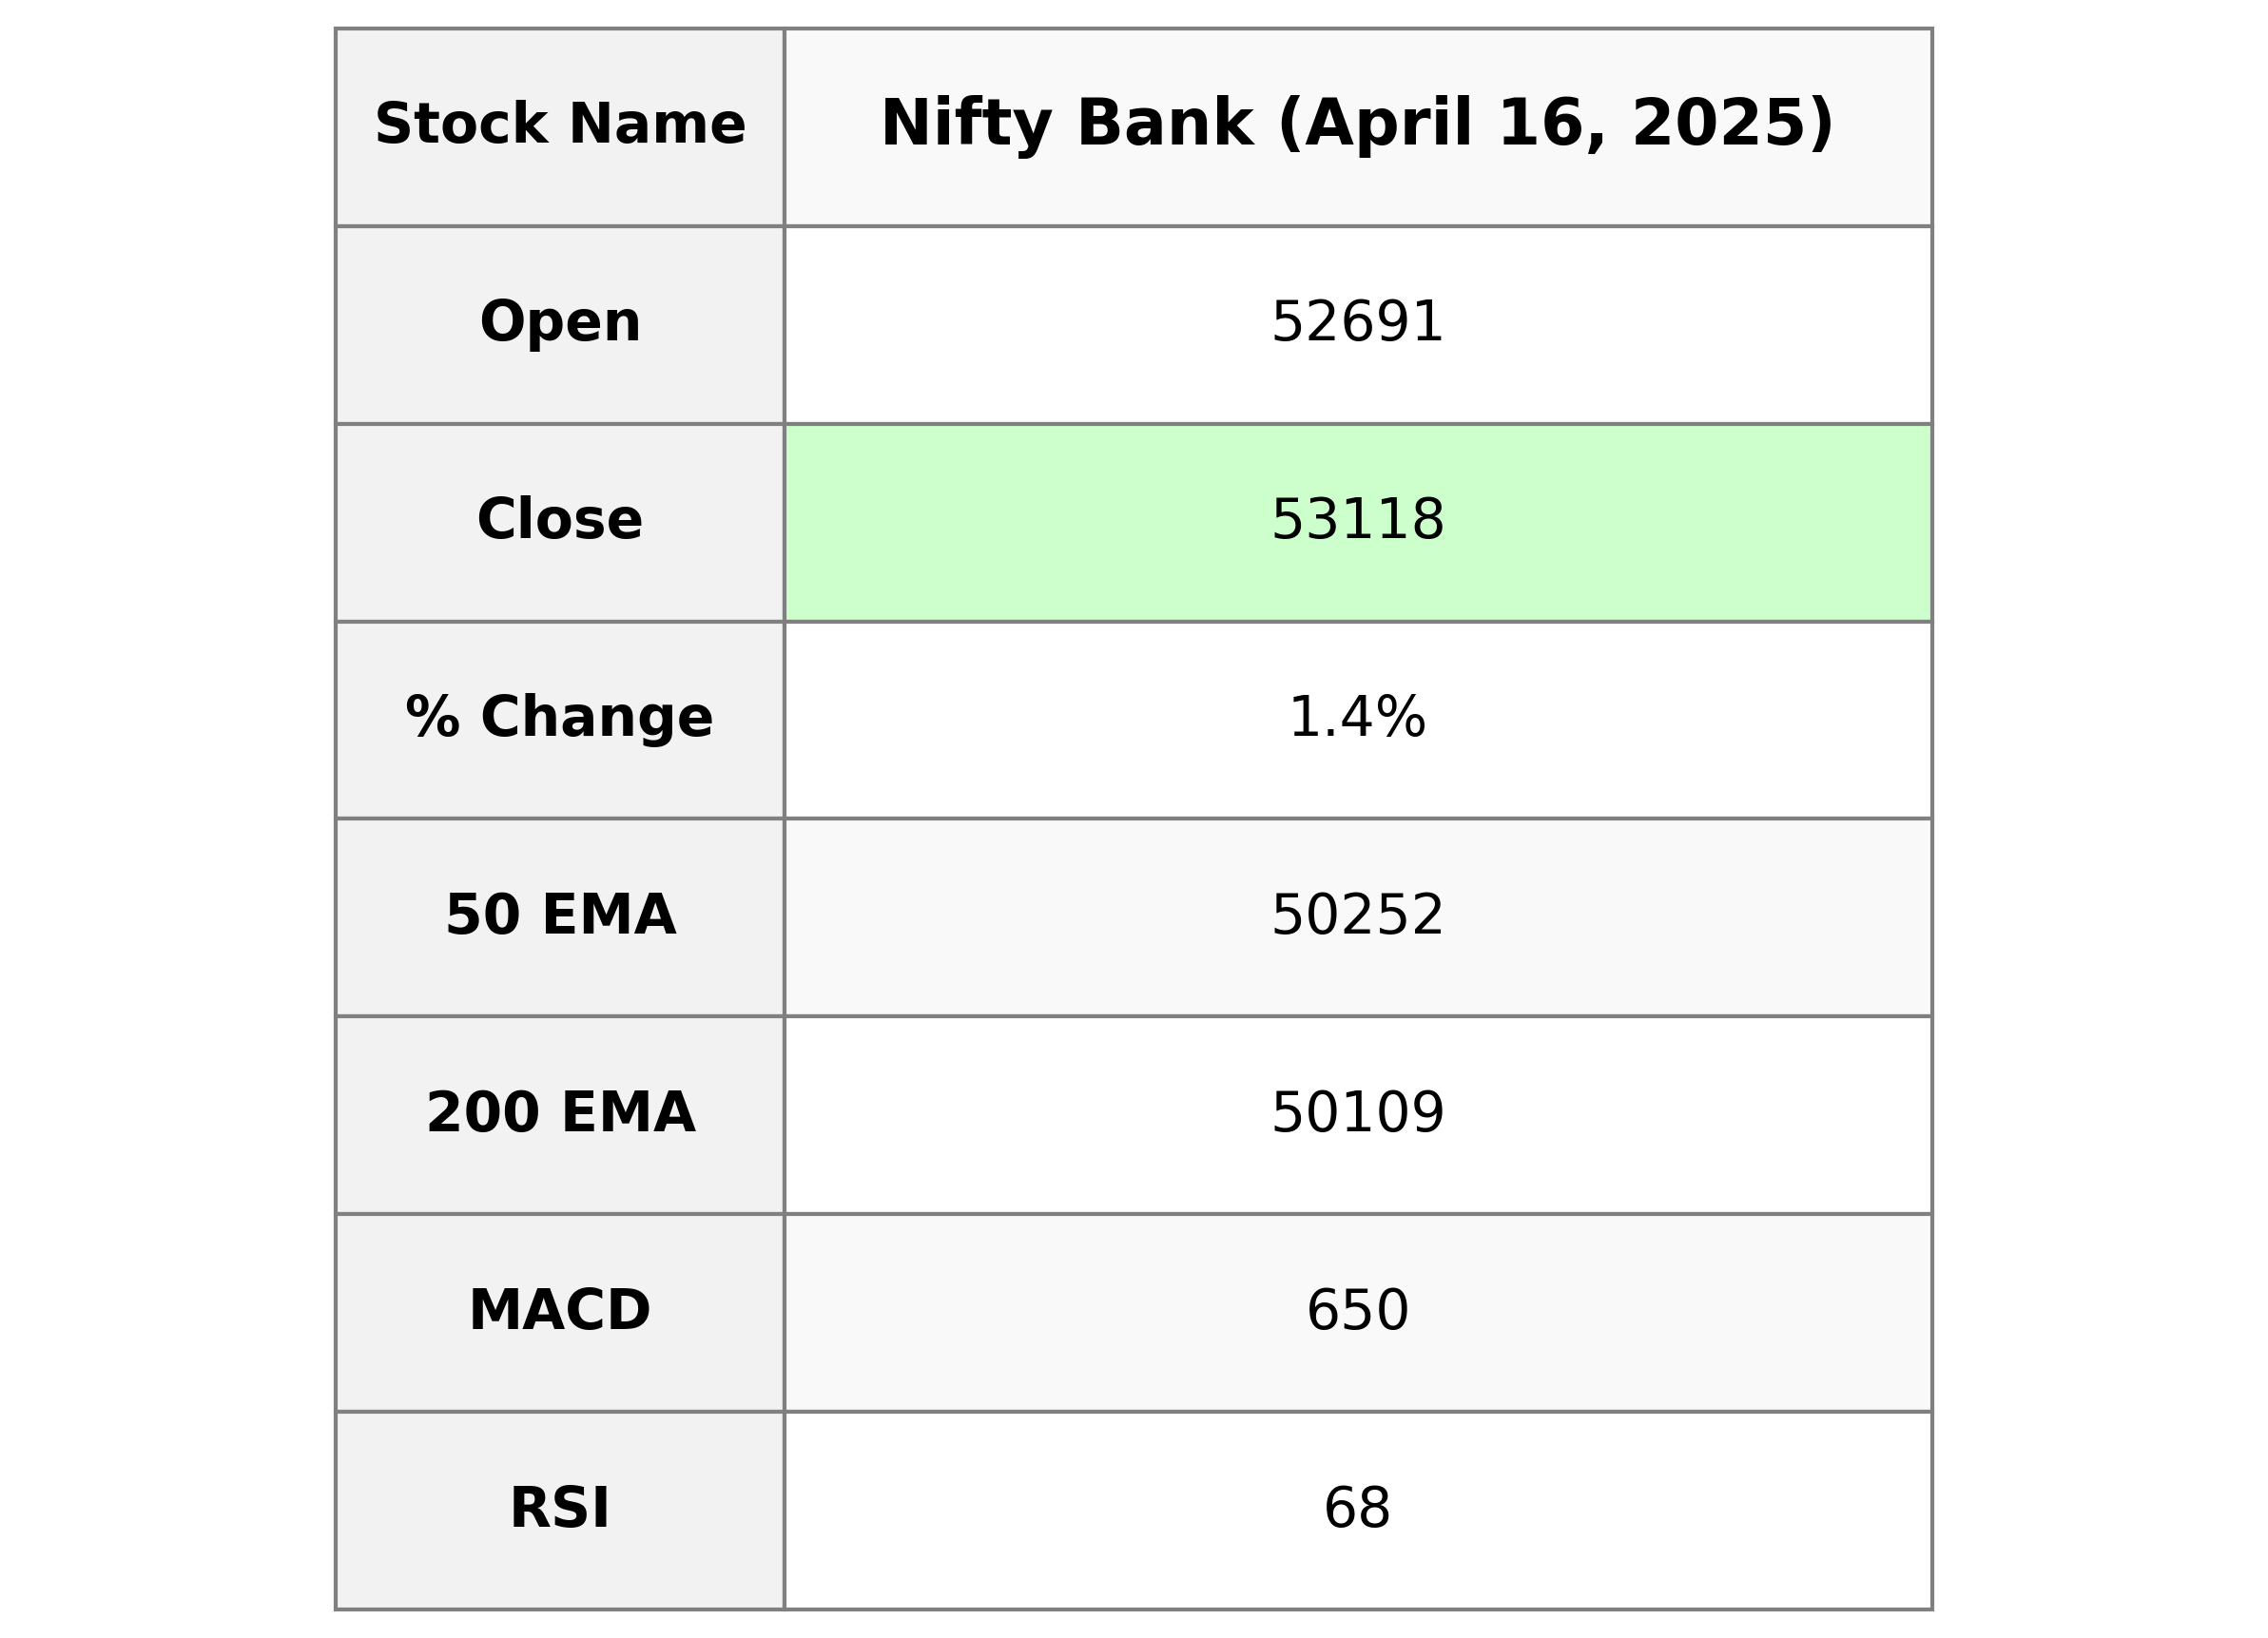
Nifty Bank opened at 52,690.90, reaching a high of 53,164.45 and closing at 53,117.75. This represents a 1.41% increase from the previous close of 52,379.50, marking a points change of 738.25. With an RSI of 67.66, it indicates momentum in the upward direction while the MACD shows bullish alignment with a value of 650.49.
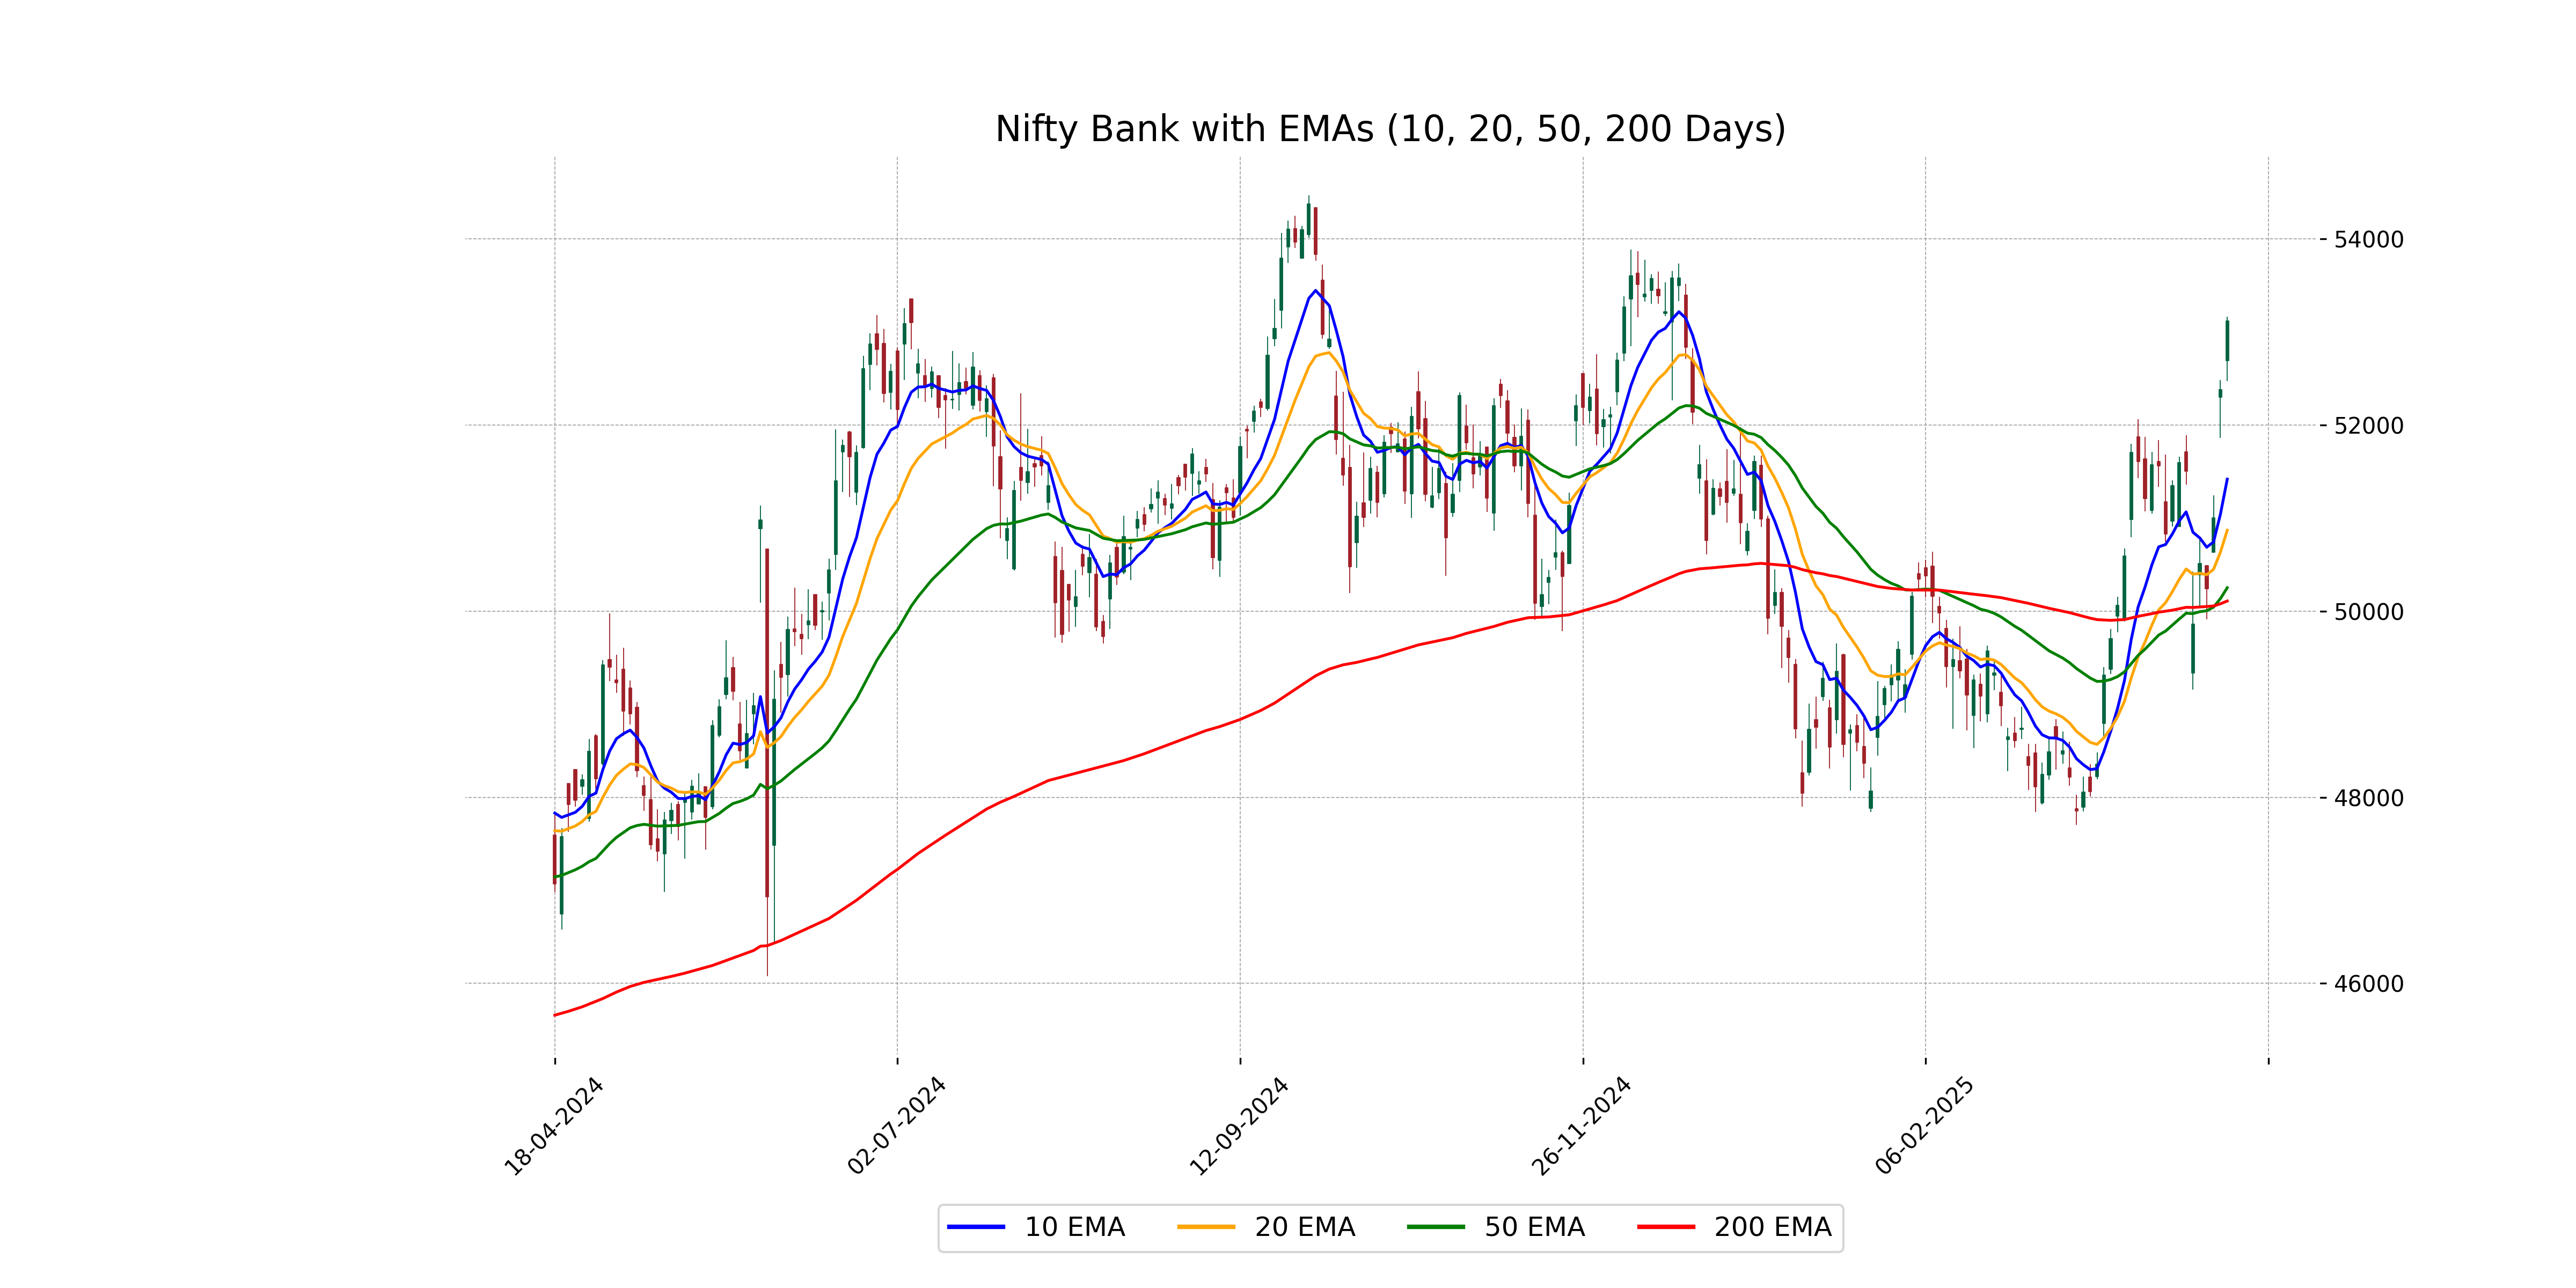
Relationship with Key Moving Averages
Nifty Bank is trading above its key moving averages, with its current close at 53,117.75, surpassing the 10 EMA (51,419.24), 20 EMA (50,870.29), 50 EMA (50,251.91), and 200 EMA (50,109.23). This indicates a bullish trend as it is trading significantly higher than these averages.
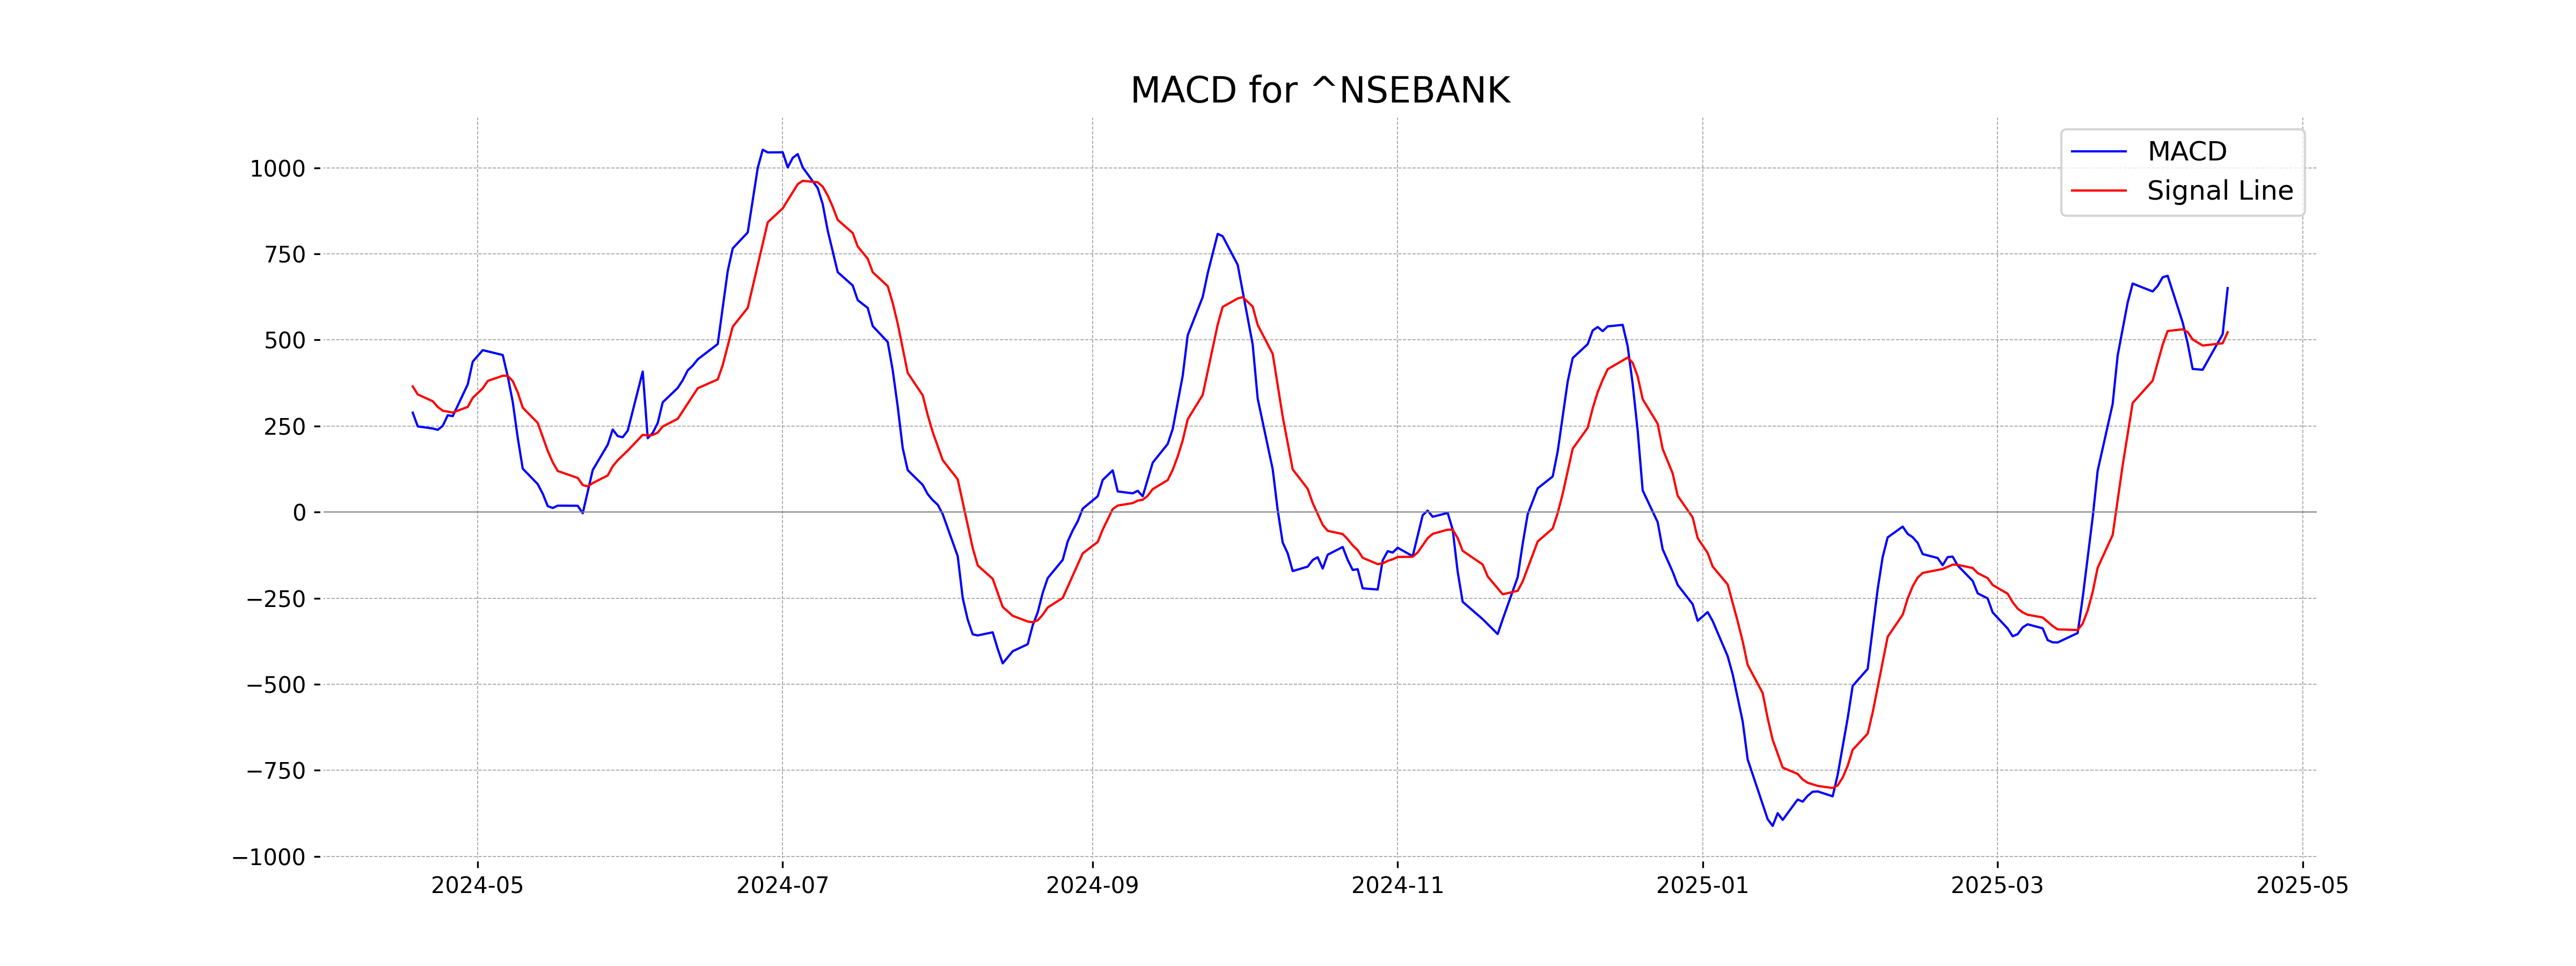
Moving Averages Trend (MACD)
Nifty Bank's MACD is 650.49, which is above its MACD Signal of 522.29, indicating a bullish momentum as the MACD line is crossing above the signal line. The positive difference suggests potential for upward movement in Nifty Bank's price.
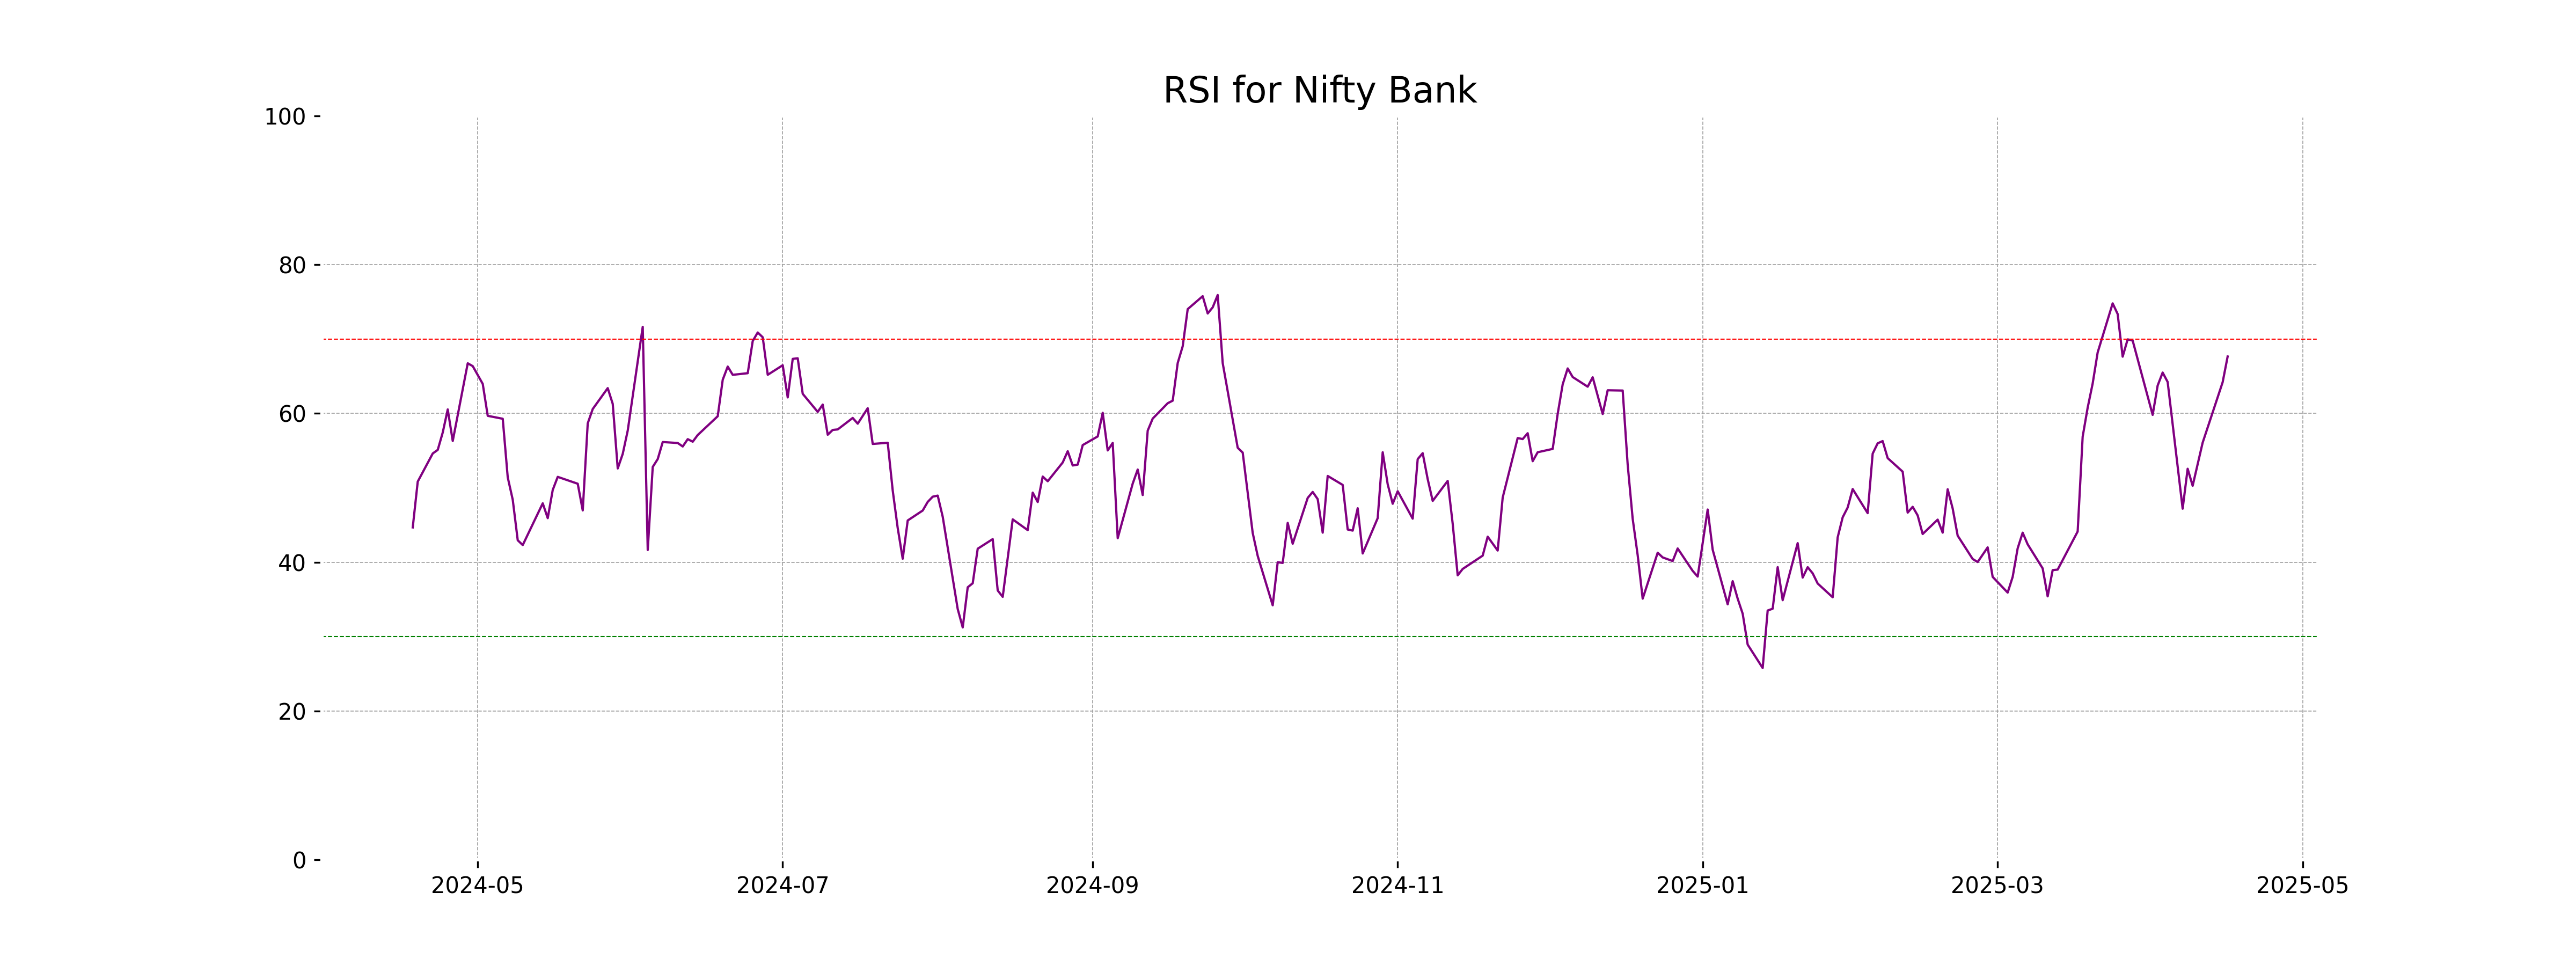
RSI Analysis
The RSI for Nifty Bank is 67.66, suggesting that the index is approaching overbought territory. An RSI above 70 typically indicates that the asset may be overvalued, but it is not yet in the overbought range, signaling potential for further upward movement or a possible correction if it continues to rise.
Analysis for Nifty 50 - April 16, 2025
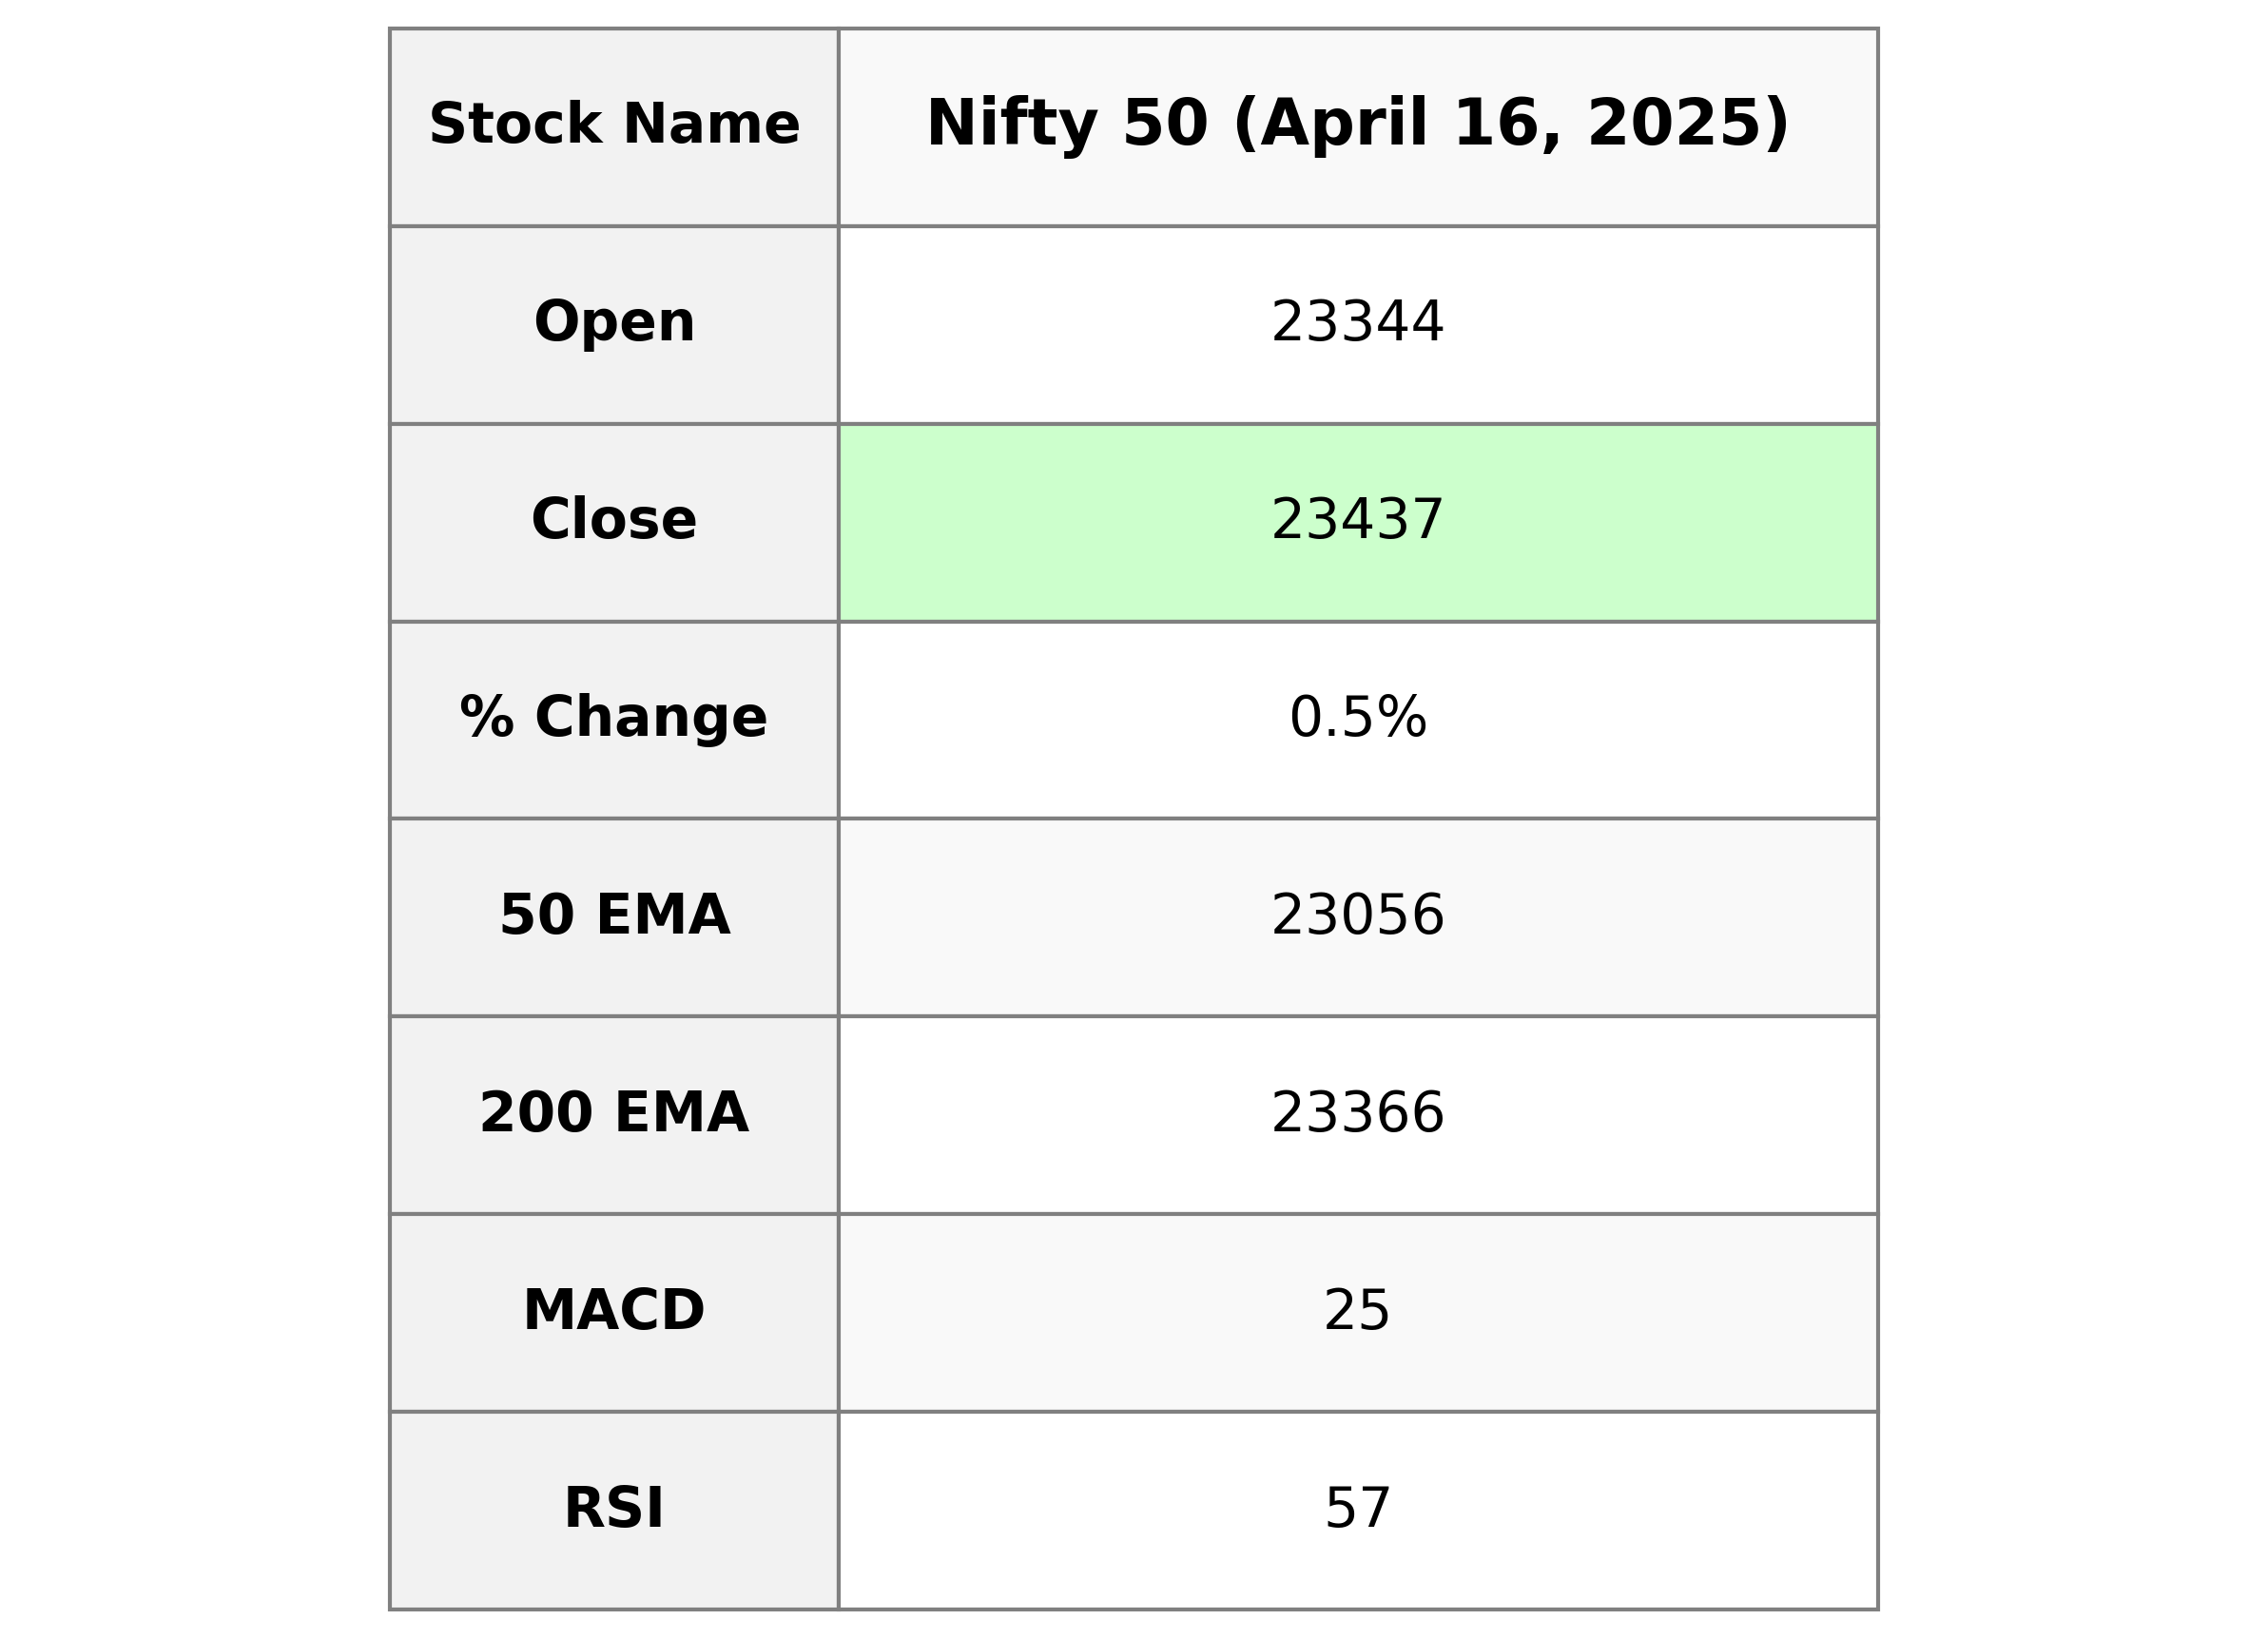
The Nifty 50 opened at 23,344 and closed at 23,437, showing a positive change of 108.65 points or 0.47%. The Relative Strength Index (RSI) stands at 57.43, indicating moderately strong momentum, while the Moving Average Convergence Divergence (MACD) shows a signal above the MACD line, implying a bullish trend.
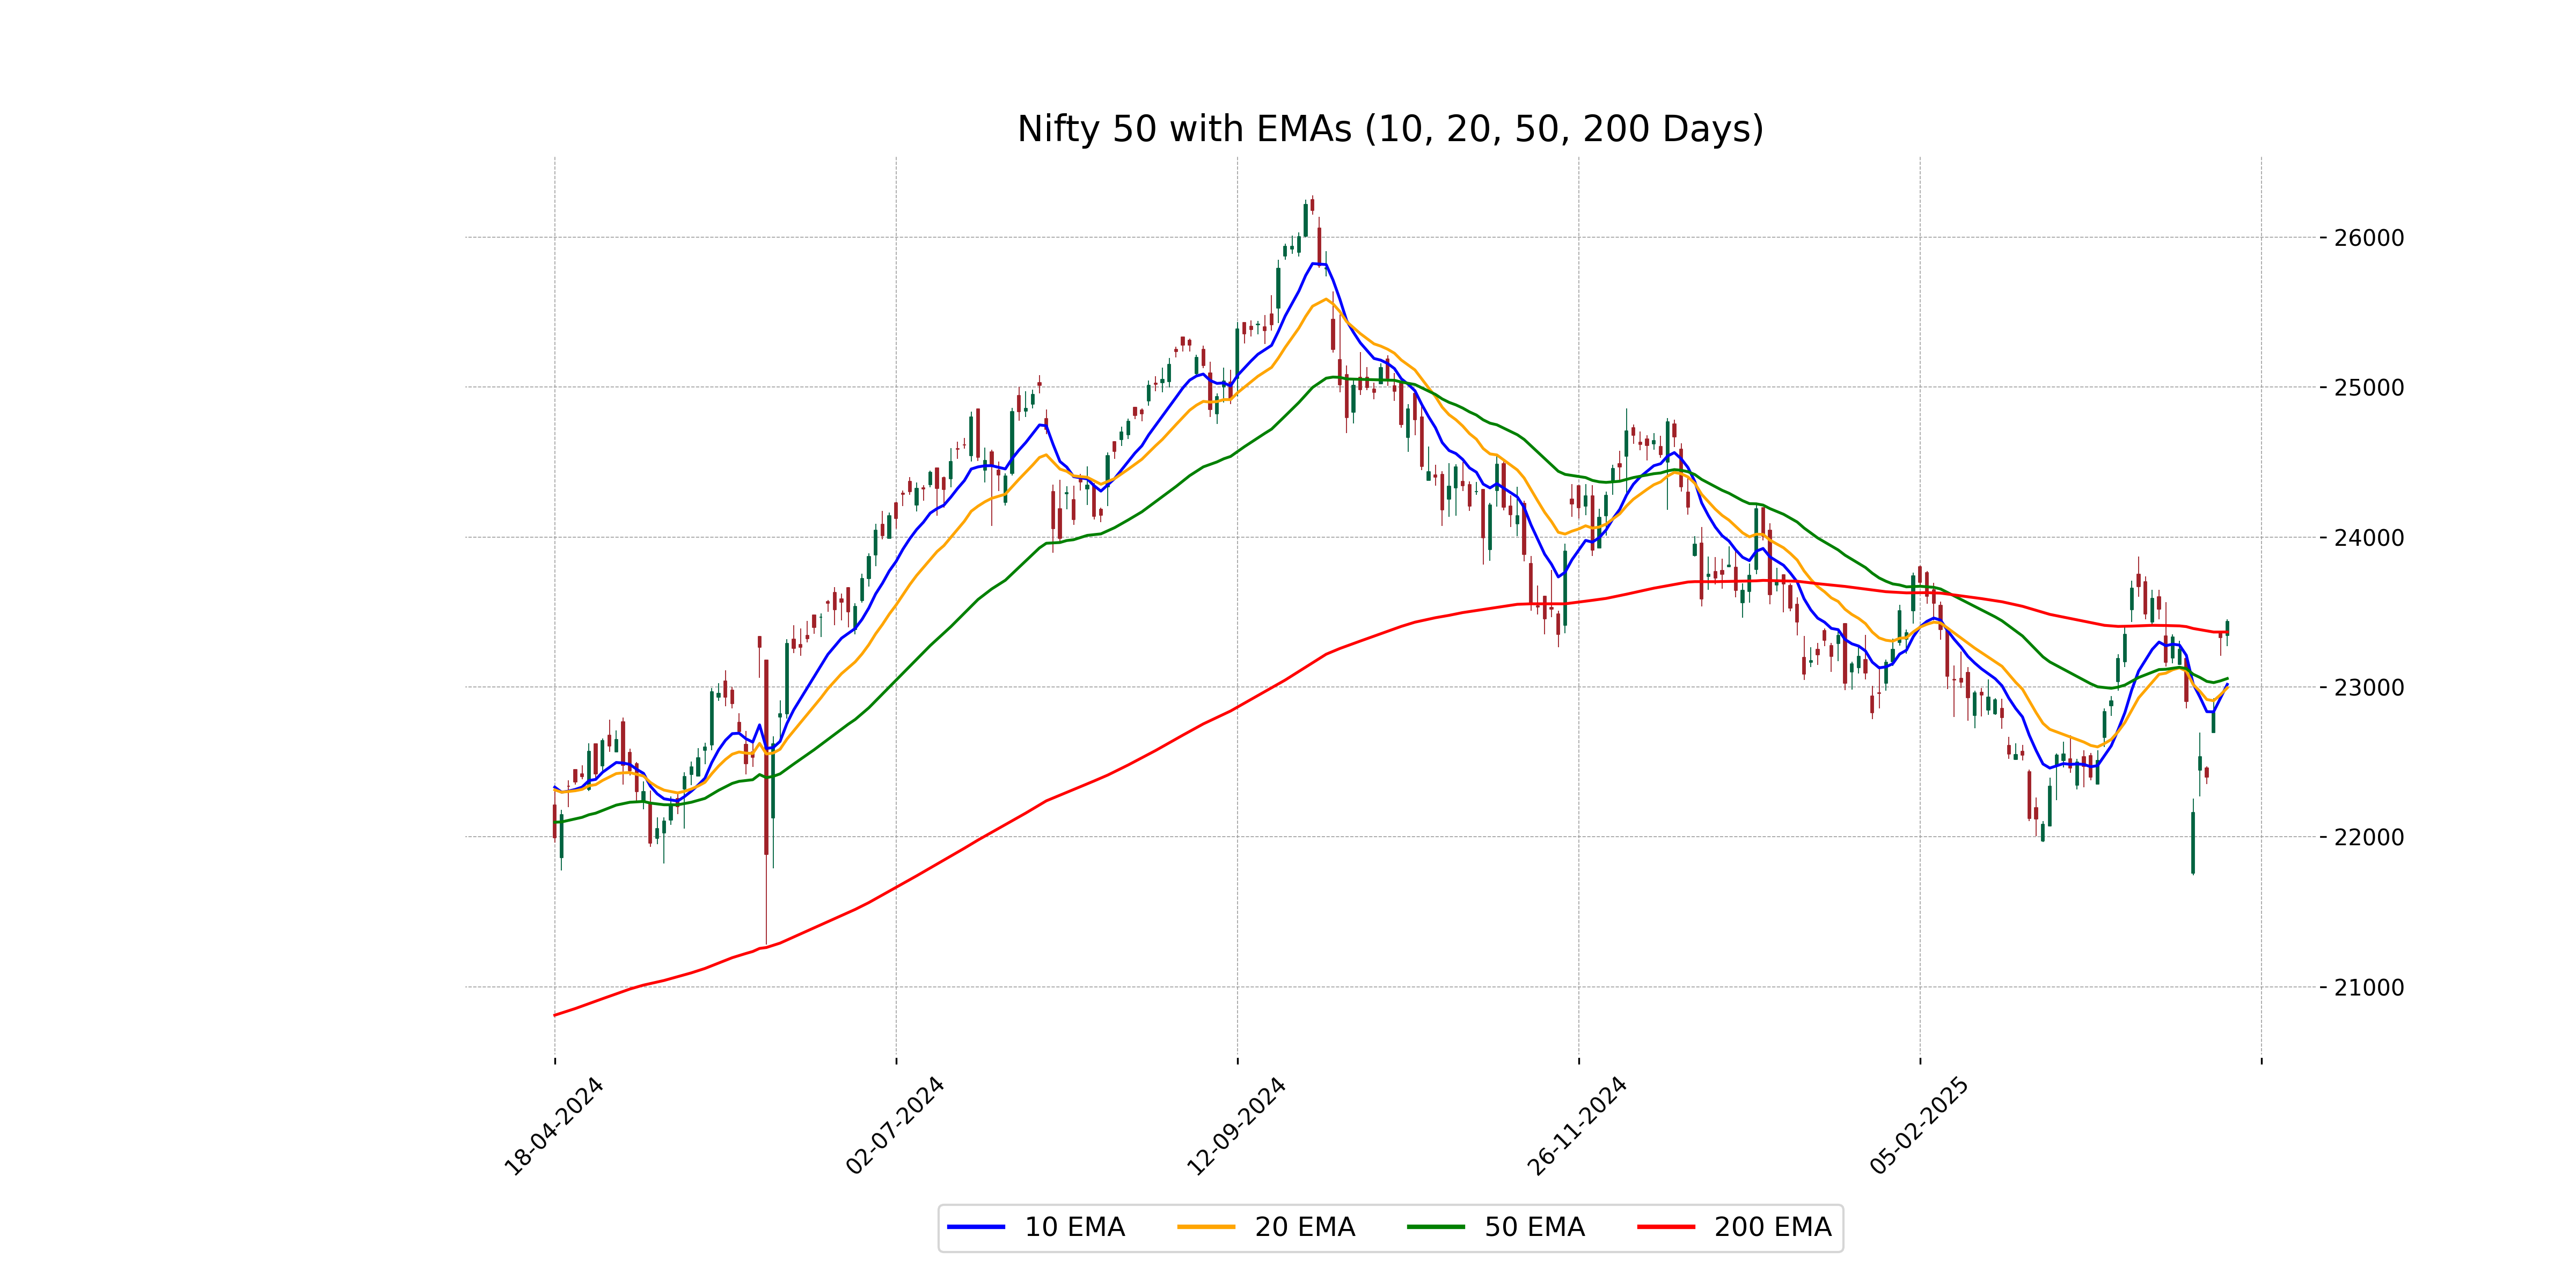
Relationship with Key Moving Averages
The Nifty 50 closed at 23,437.20, which is above its 50 EMA of 23,056.17, indicating potential bullish momentum. It is also slightly above the 200 EMA of 23,366.49, suggesting a possible long-term uptrend. The 10 and 20 EMAs are below the current close, further supporting the short-term bullish outlook.
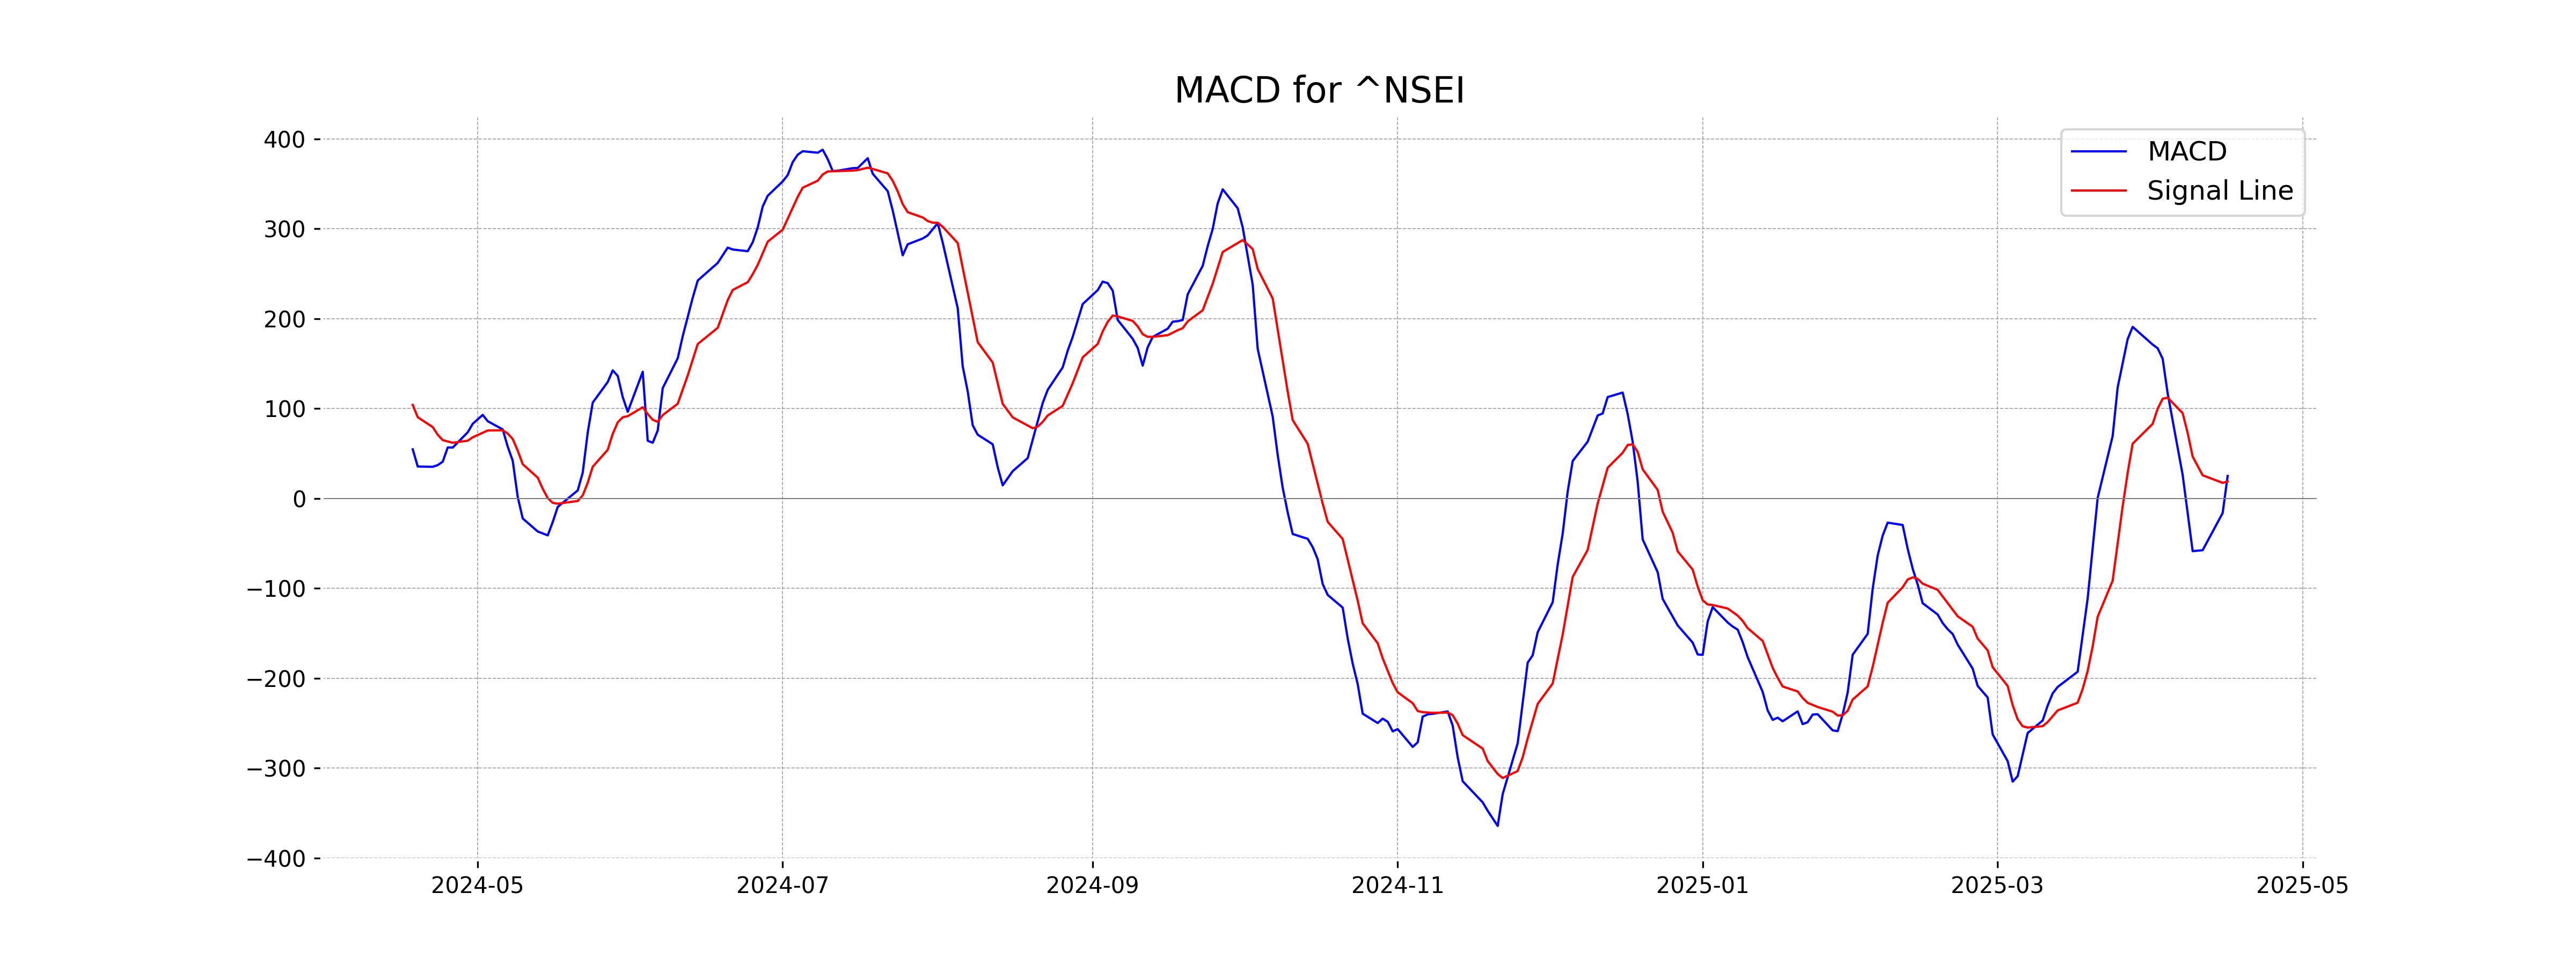
Moving Averages Trend (MACD)
The MACD value for Nifty 50 is 25.02, while the MACD Signal is 18.92. Since the MACD is greater than the MACD Signal, this indicates a potential bullish trend. This suggests upward momentum is building in the stock.
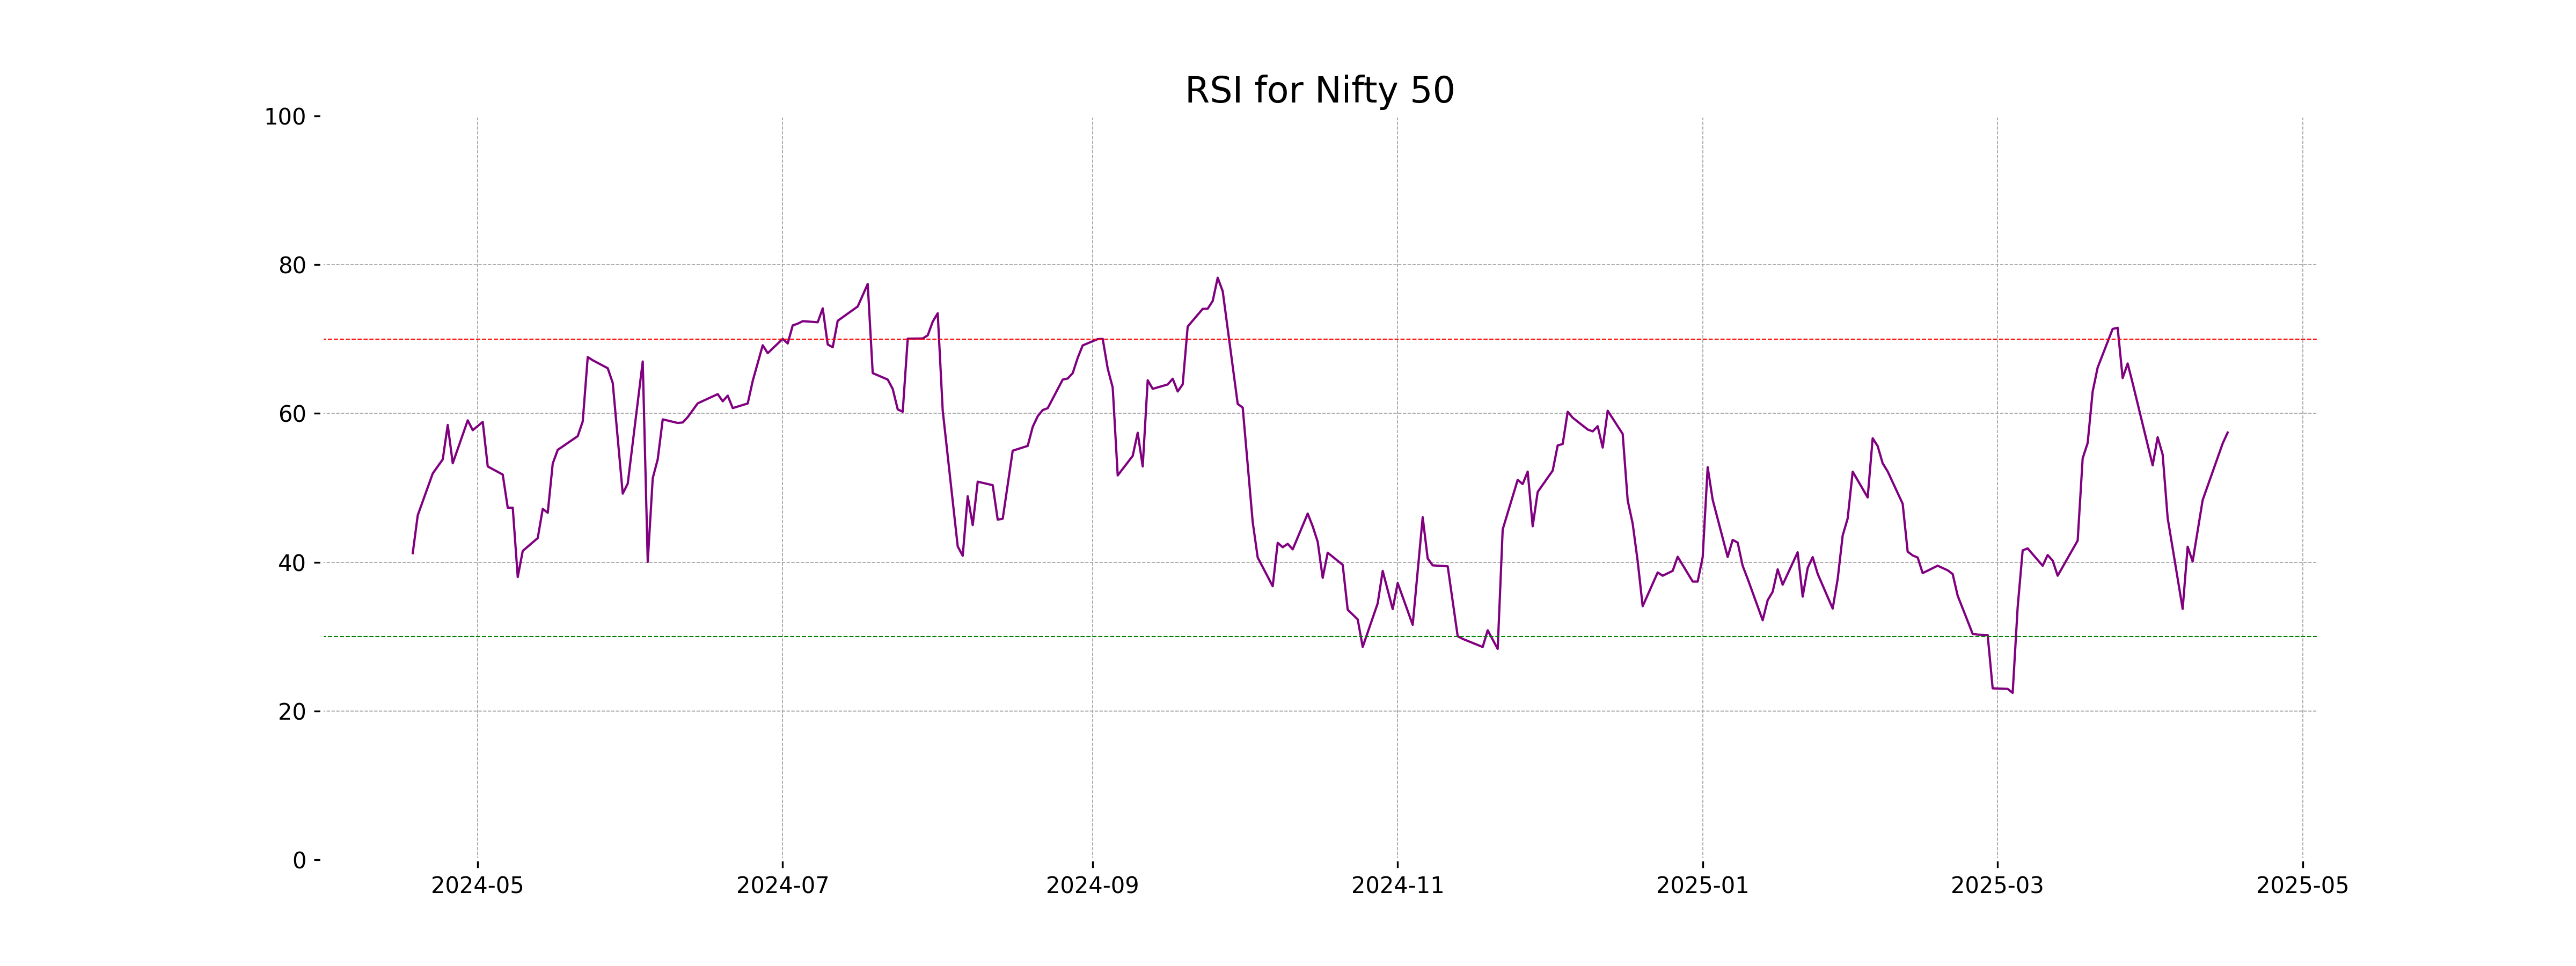
RSI Analysis
The Relative Strength Index (RSI) for the Nifty 50 is currently at 57.43, which indicates a moderately strong upward momentum as it is above the midpoint of 50. This suggests that the Nifty 50 is neither overbought nor oversold, and is in a potentially stable phase with room for either sideways or upward movement.
Up Next
?")
Global Stock Market Indices: How the World Markets performed today - (April 16, 2025)?

New Zealand commits USD 20 bn investment in India under FTA in 15 yrs; on lines of EFTA pact

India, New Zealand conclude FTA talks; pact to offer duty-free access, USD 20 bn FDI

FTA with New Zealand to significantly deepen bilateral economic engagement: Govt

Rupee breaches 91-mark against US dollar for first time in intra-day trade

Microsoft commits USD 17.5 billion investment in India: CEO Satya Nadella

More videos

CBI books Anil Ambani's son, Reliance Home Finance Ltd. in Rs 228 crore bank fraud case

RBI raises FY26 GDP growth projection to 7.3 pc

RBI trims policy interest rate by 25bps to 5.25pc, loans to get cheaper

Rupee slumps to all-time low of 90.25 against US dollar in intra-day trade

Reliance completes merger of Star Television Productions with Jiostar

India to lead emerging market growth with 7pc GDP rise in 2025: Moody’s

Nifty hits record high after 14 months; Sensex nears all-time peak

Reliance stops Russian oil use at its only-for-export refinery to comply with EU sanctions

ED attaches fresh assets worth over Rs 1,400 cr in case against Anil Ambani's Reliance Group

India signs one-year deal to import 2.2 million tonnes of LPG from US