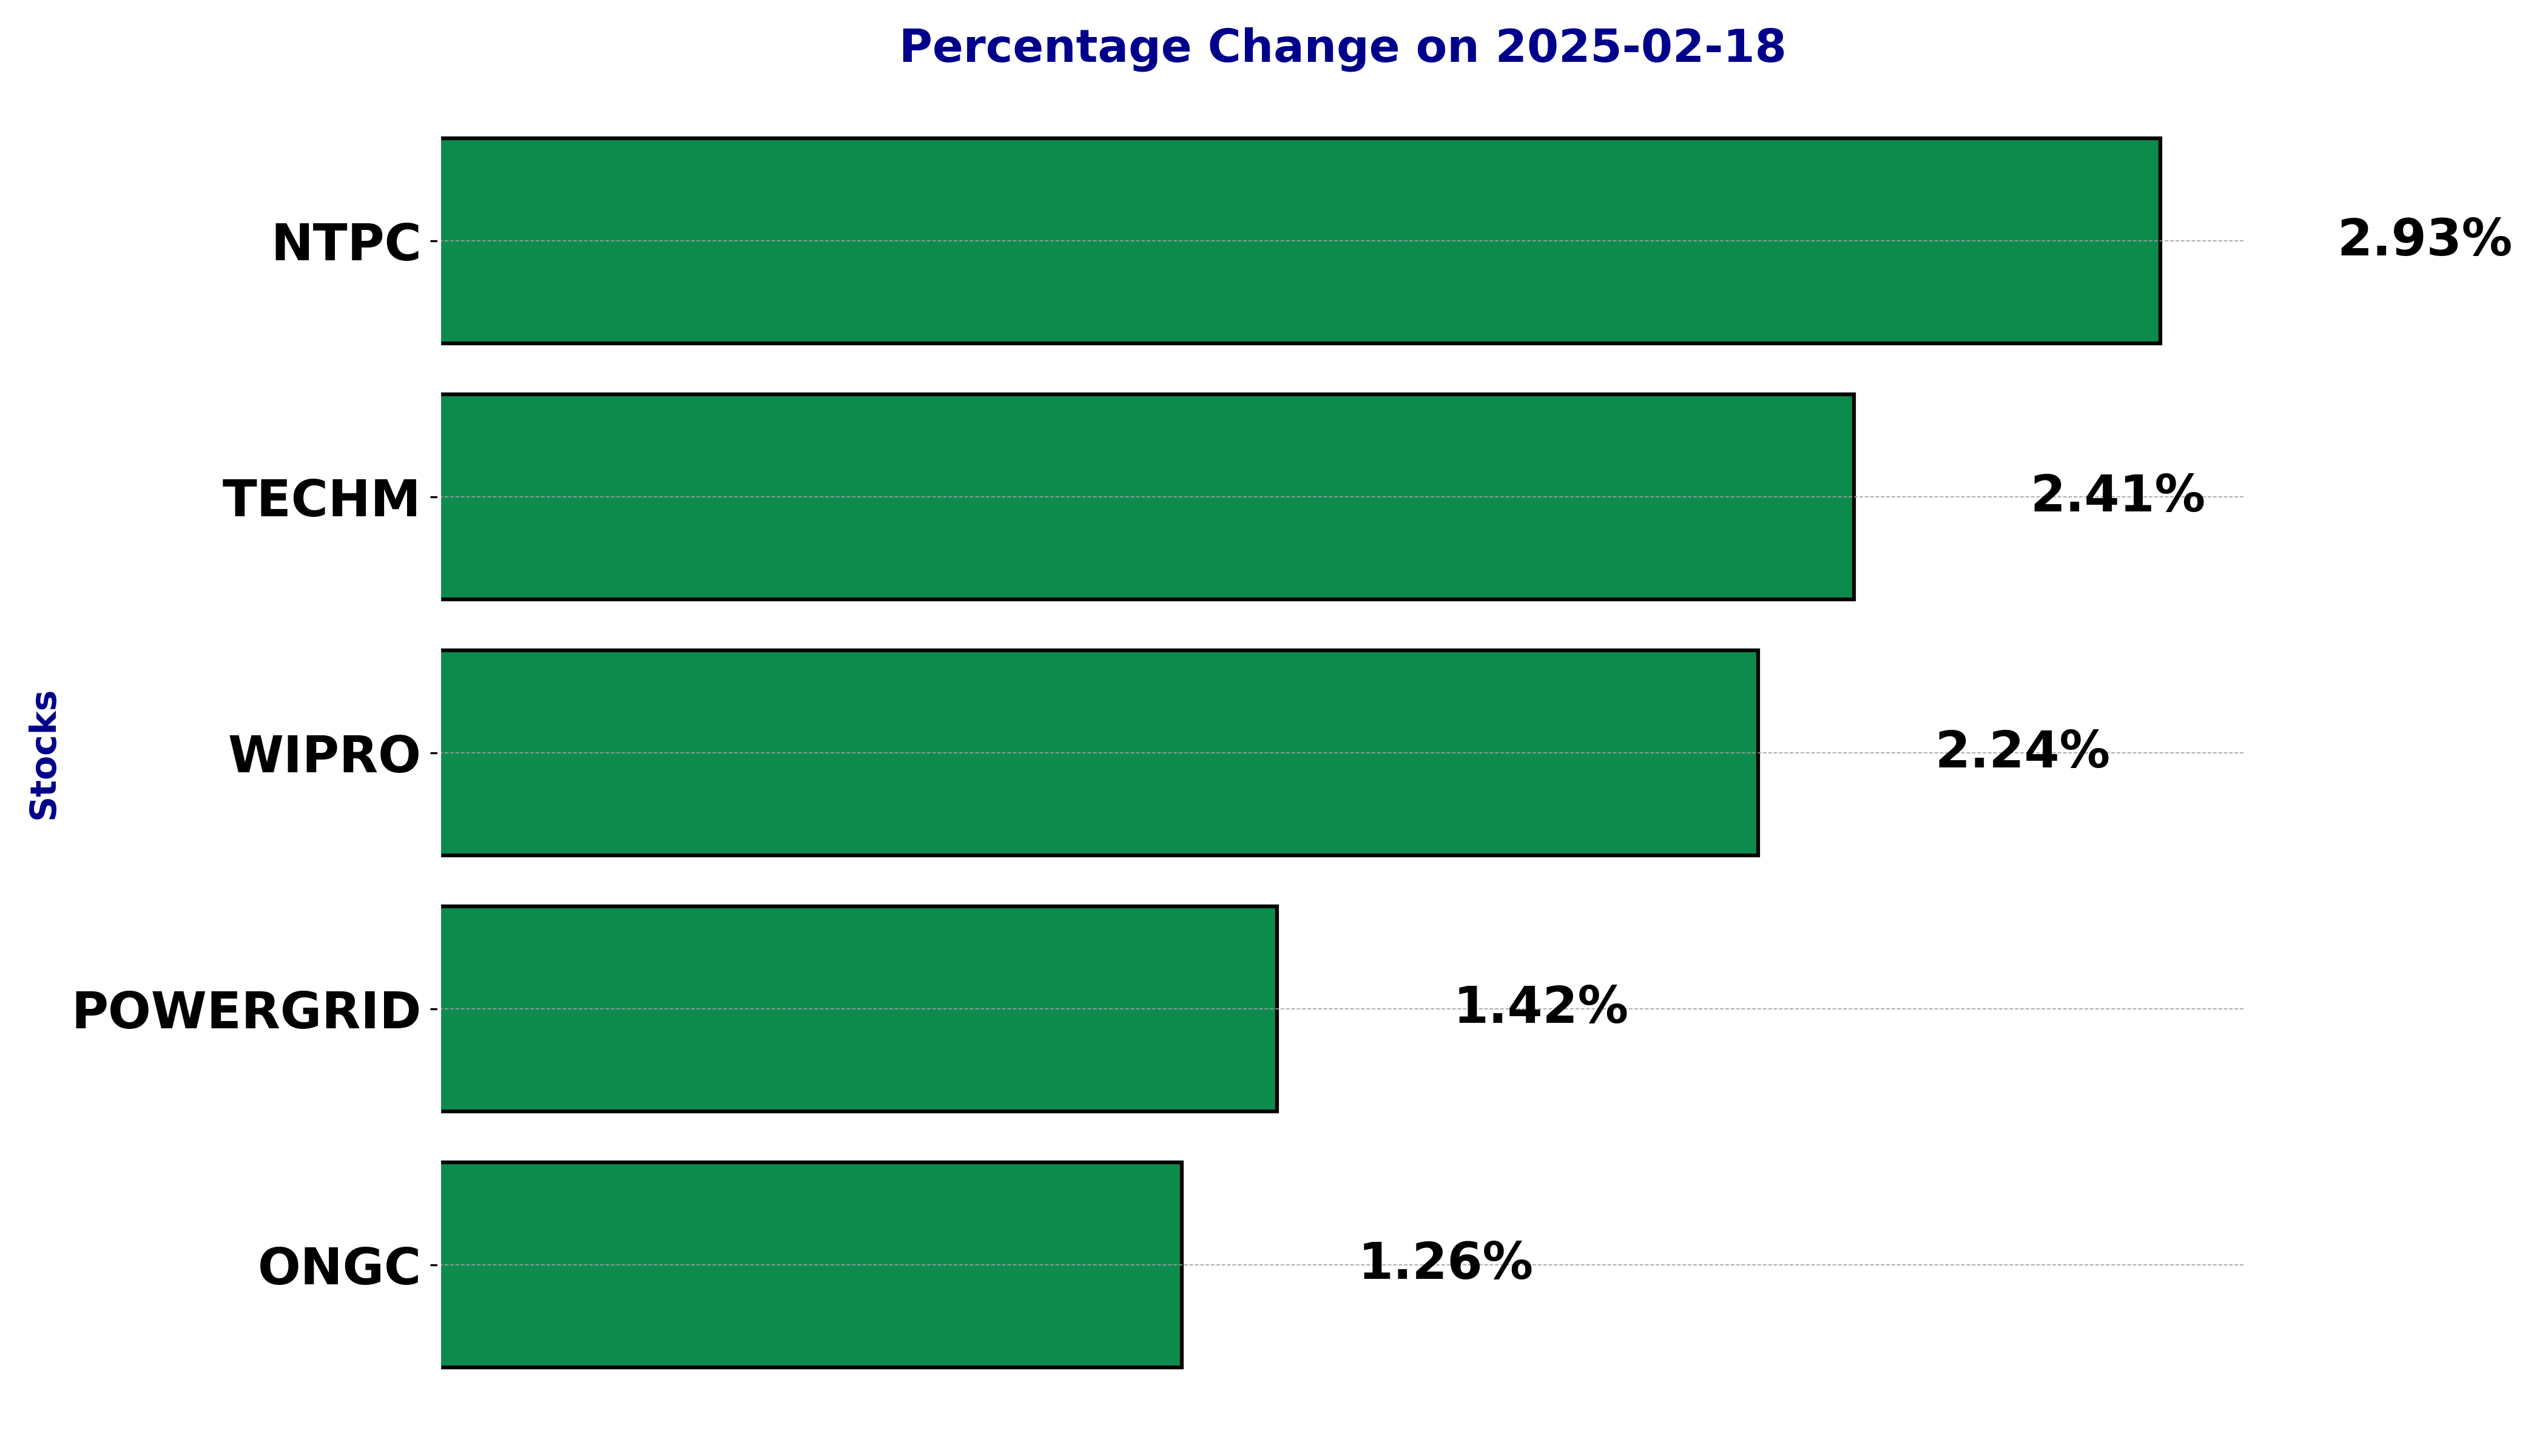
Top 5 Nifty 50 gainers today – February 18, 2025: Biggest stock moves
In this article, we will explore the technical indicators of some of the high-performing stocks on the Indian stock market, including NTPC, ONGC, POWERGRID, TECHM, and WIPRO.
By looking at these stocks through the lens of key technical factors, we aim to better understand their price movements, trends, and potential future performance.
Analysis for NTPC - February 18, 2025
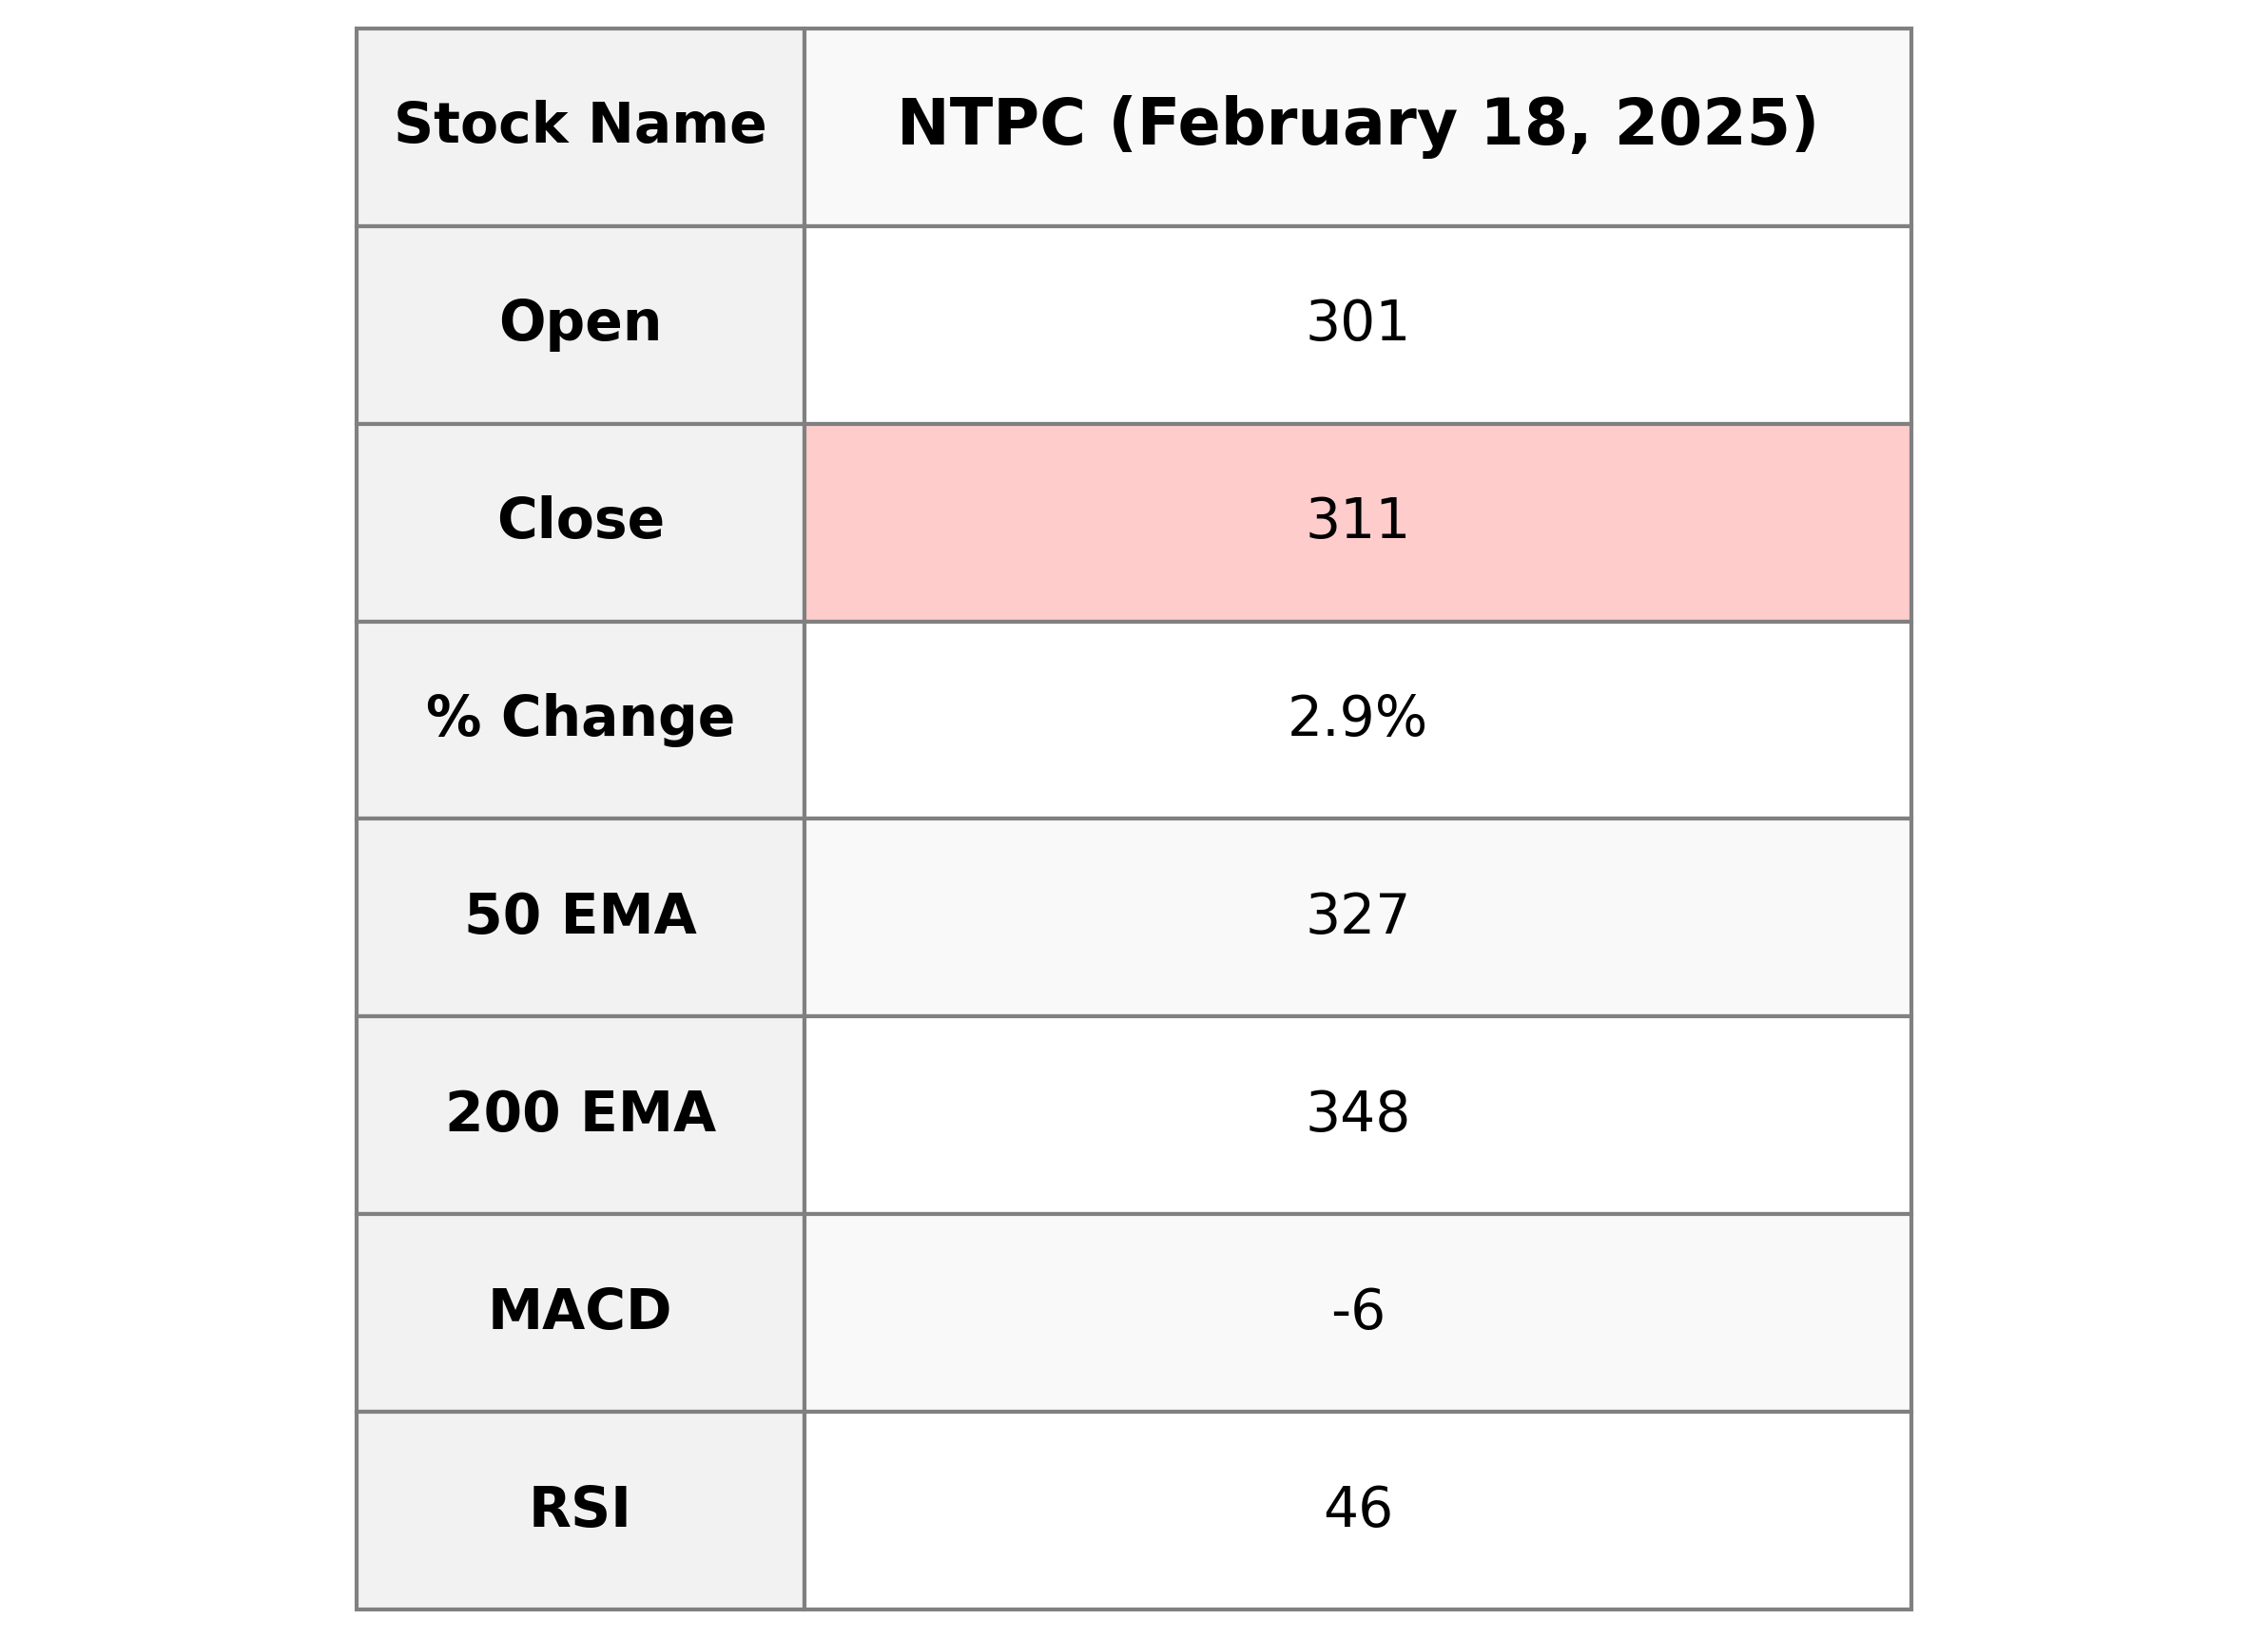
NTPC Performance Overview NTPC opened at 301.15 and closed at 311.20, marking a percentage change of approximately 2.93% with a points change of 8.85. The trading volume was 15,792,612. Despite ending the day higher, NTPC's current position is below its 50-day EMA of 326.74 and 200-day EMA of 347.78, with an RSI of 46.05 indicating a neutral market. The MACD is slightly negative, suggesting a potential bearish trend. The company operates in the Utilities sector, specializing in regulated electric utilities in India, with a market cap of approximately 3 trillion INR and a PE ratio of 14.51.
Relationship with Key Moving Averages
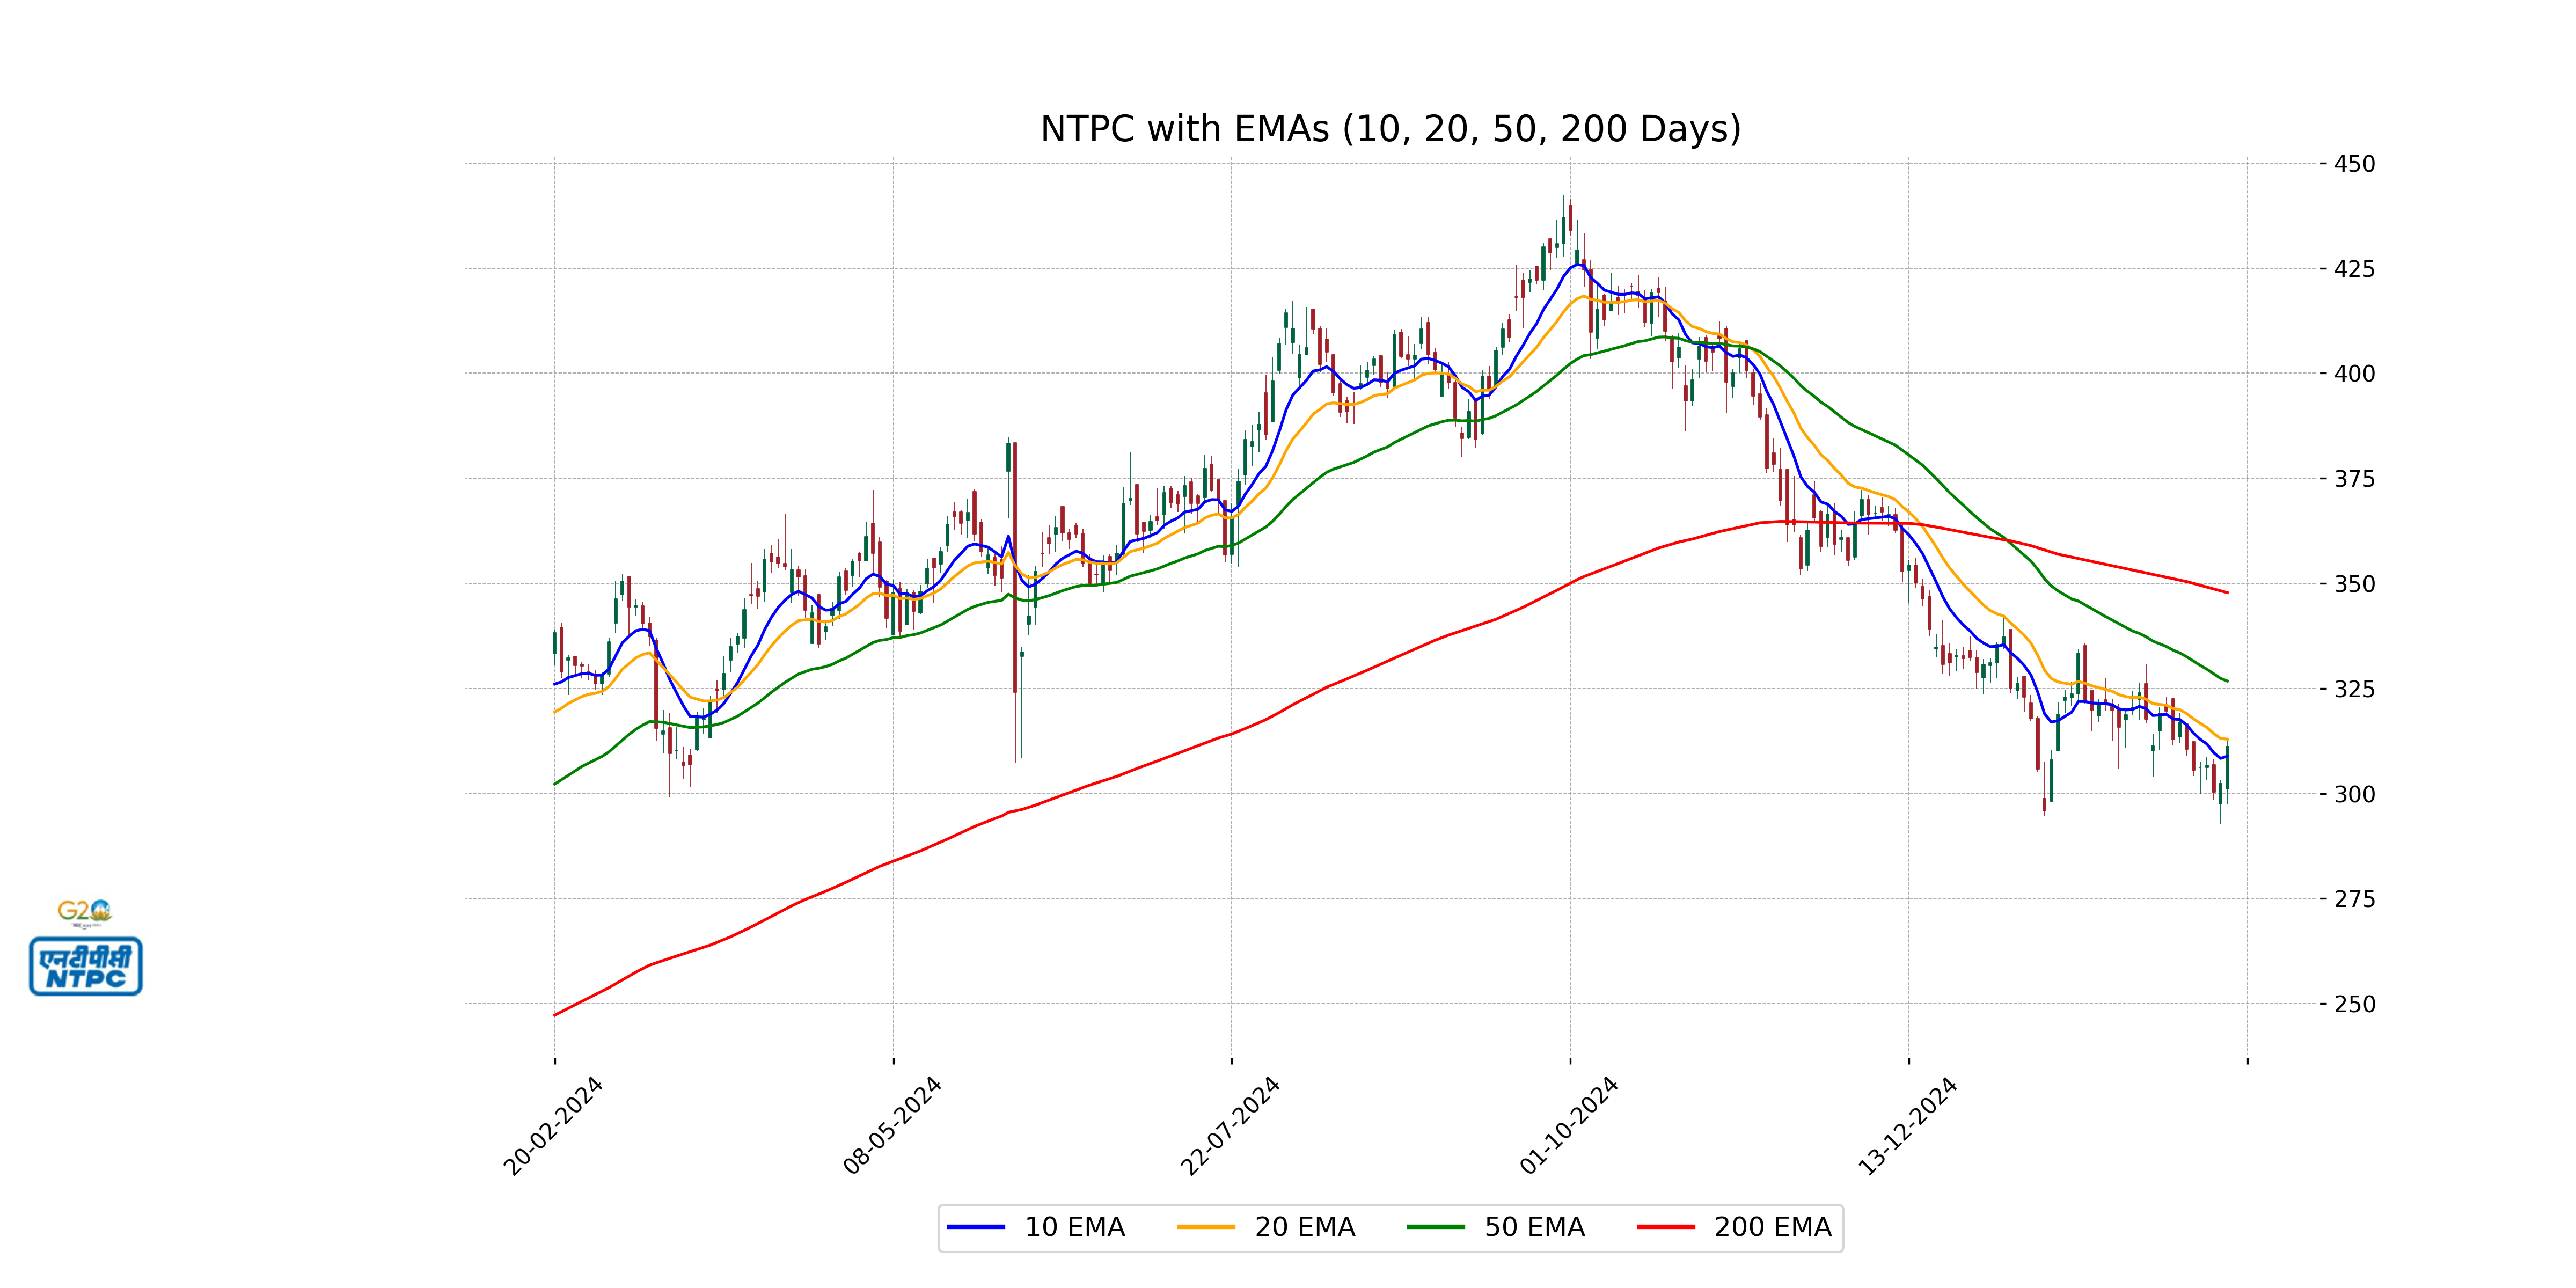
The current close price of NTPC, at 311.20, is below both its 50-day EMA of 326.74 and its 200-day EMA of 347.78, indicating a potential bearish trend. However, it's slightly above the 10-day EMA of 308.87, suggesting some recent positive movement compared to short-term trends.
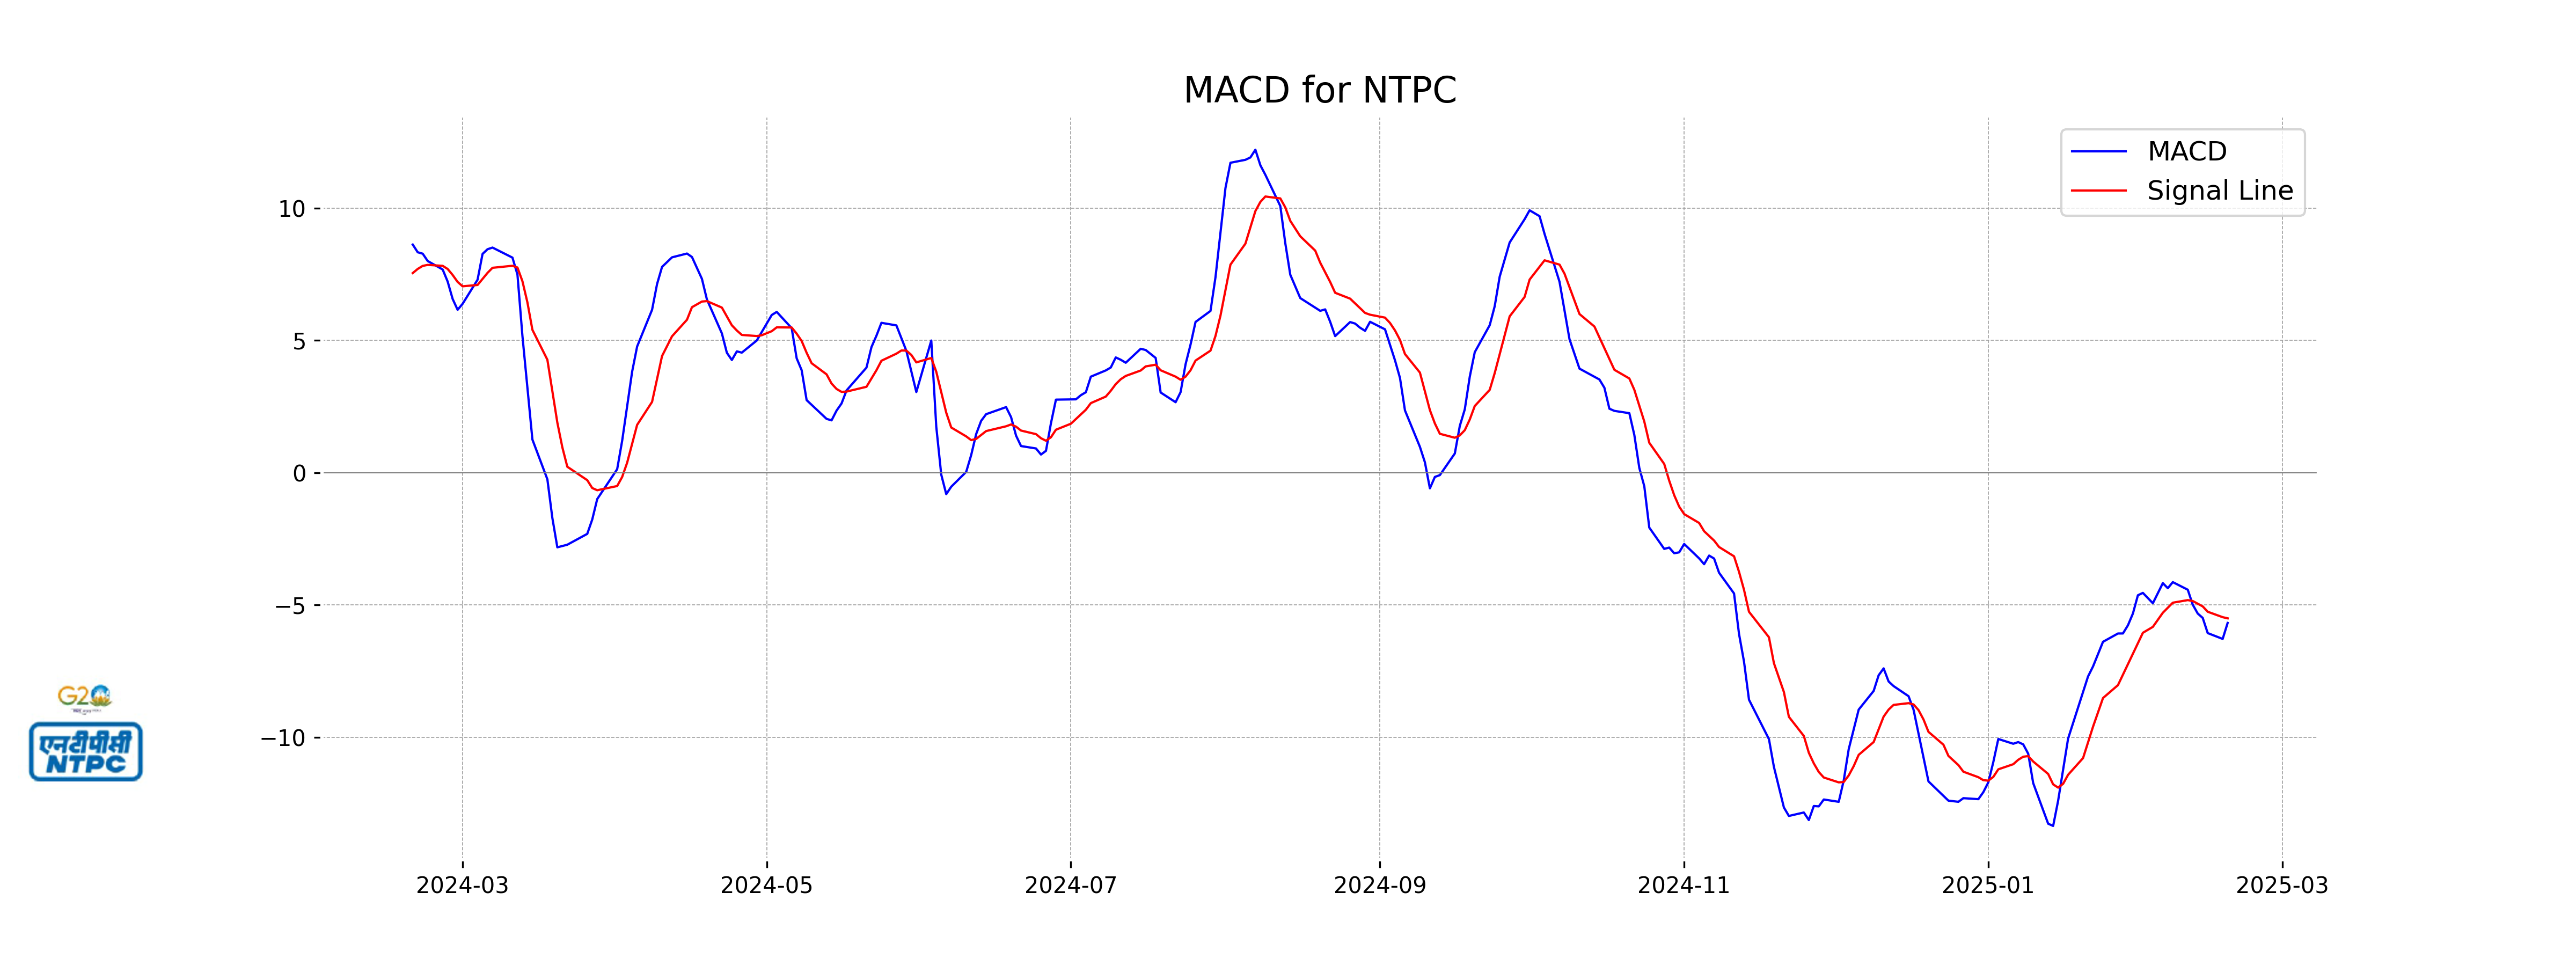
Moving Averages Trend (MACD)
The MACD for NTPC is -5.68, while the MACD Signal is -5.51. This indicates a bearish momentum as the MACD is below the Signal line. Caution is advised for potential investors.
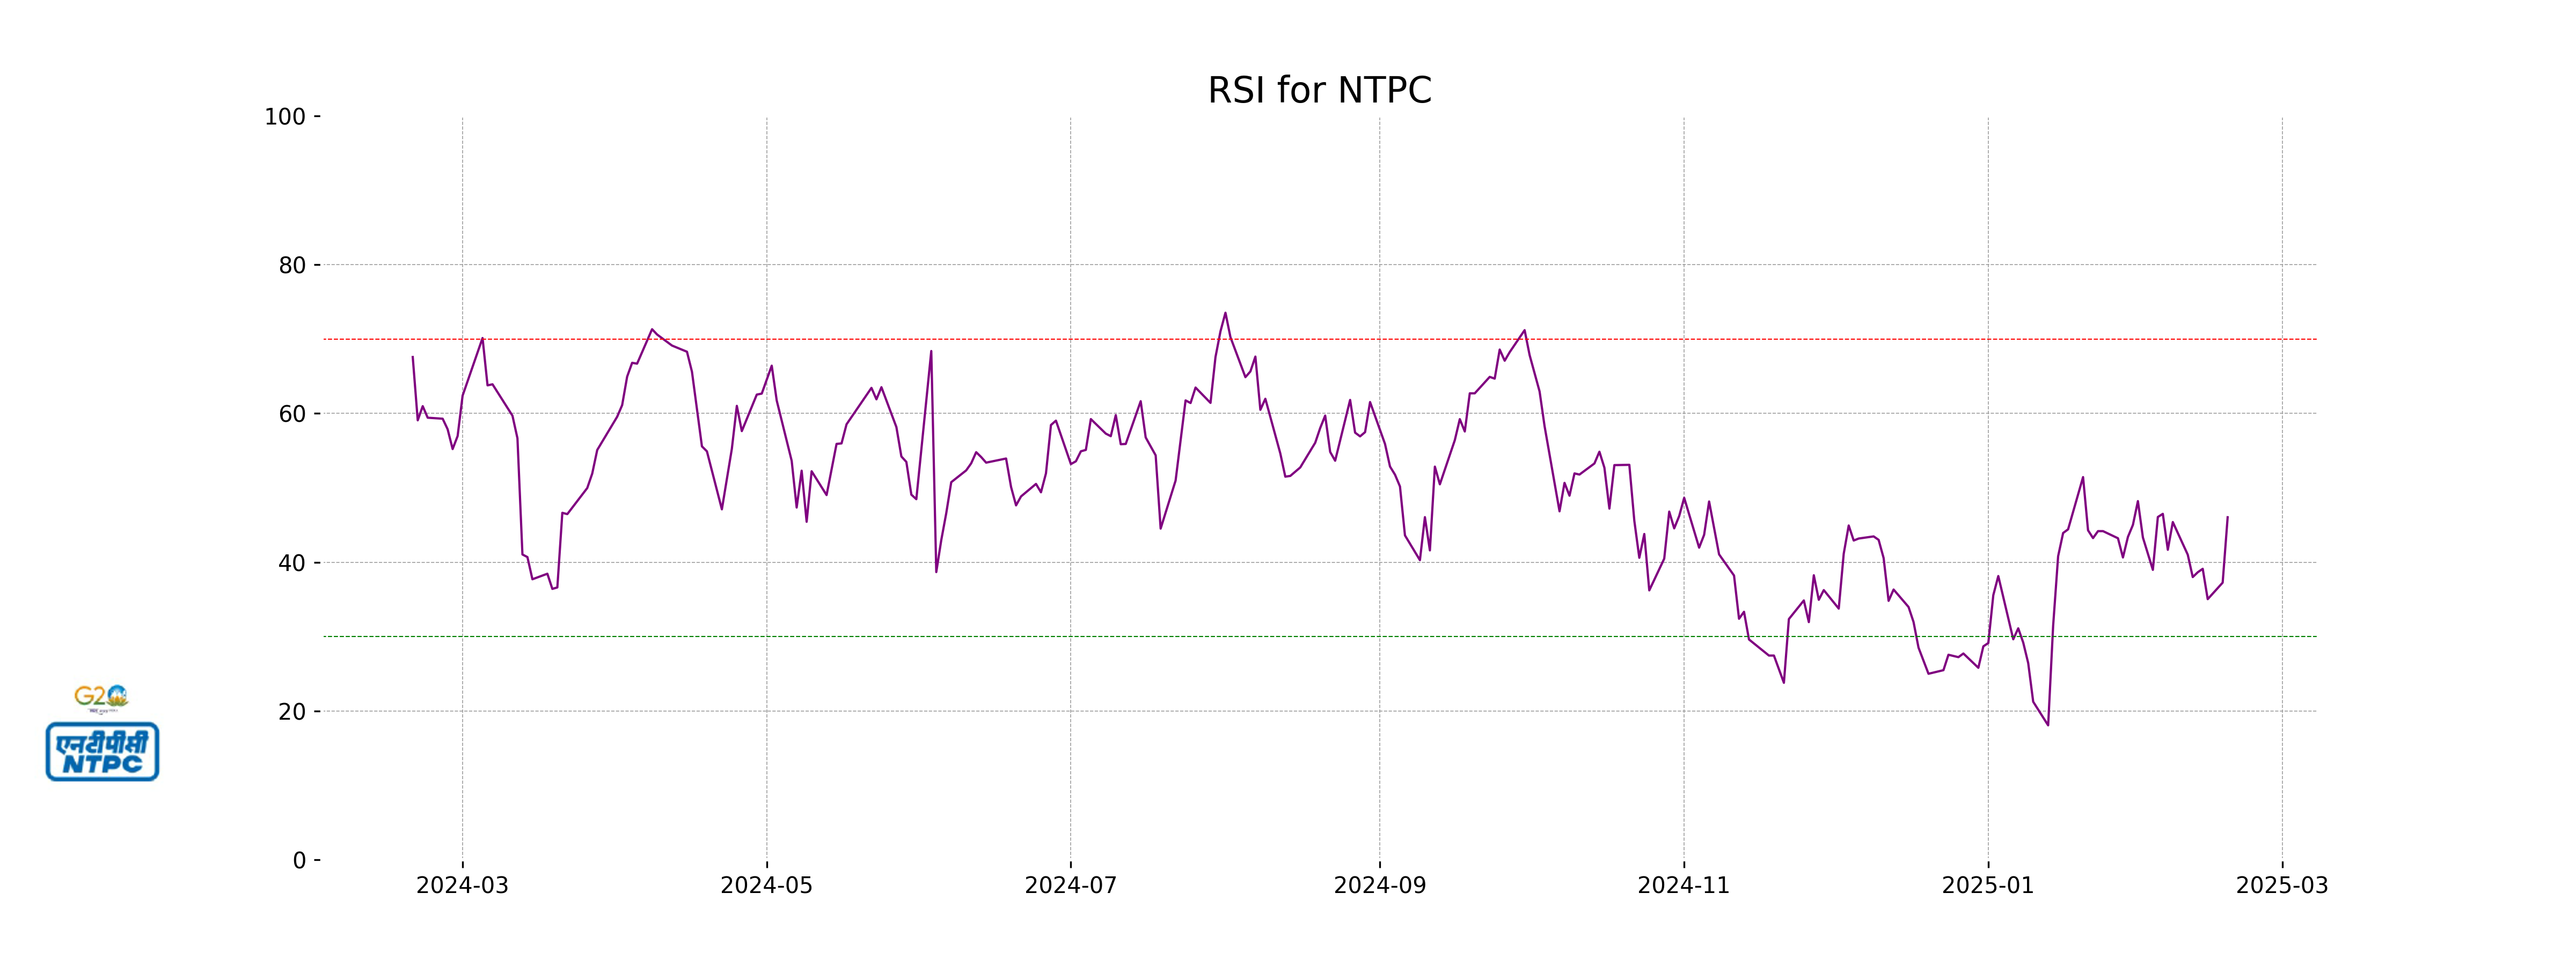
RSI Analysis
The RSI of NTPC is 46.05, indicating that the stock is in a neutral range, not currently overbought or oversold. This suggests that there may not be significant momentum driving the price in either direction at this time.
Analysis for ONGC - February 18, 2025
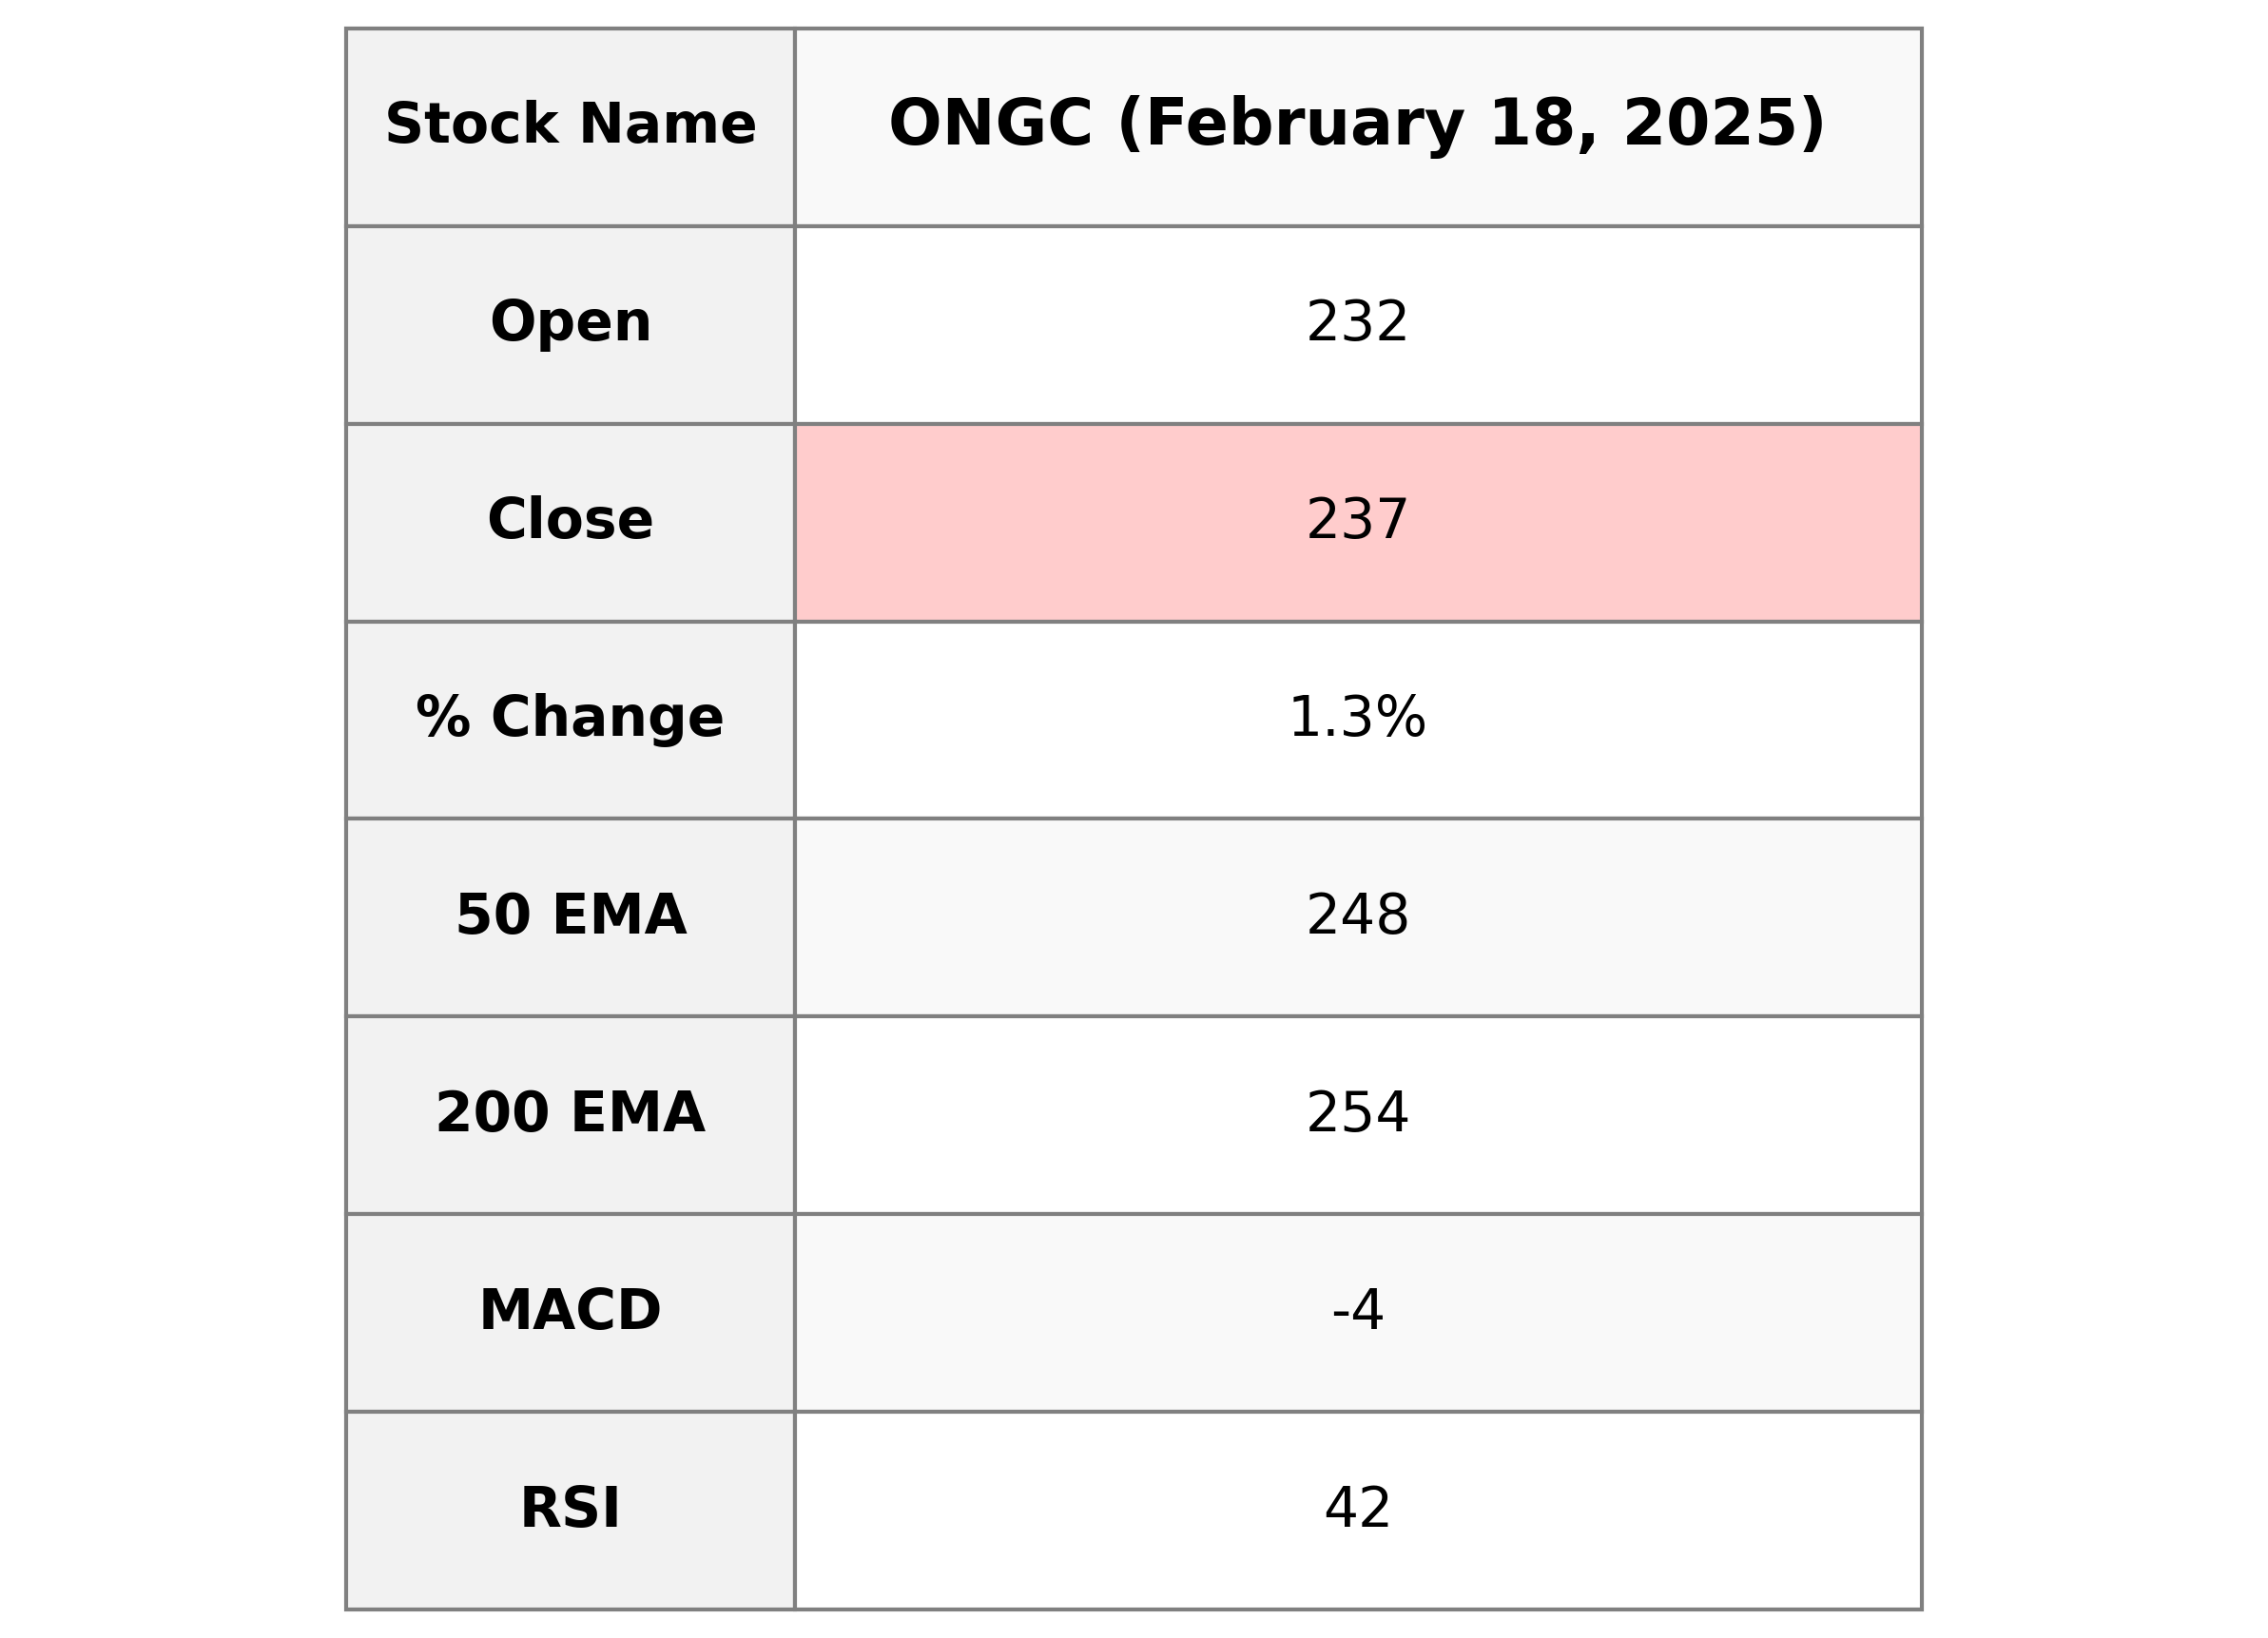
### ONGC Performance The stock opened at 232.20 and closed at 236.60, marking a percentage change of 1.26% with a points change of 2.95. The current trend indicates the stock is trading below its 50-day and 200-day EMAs, suggesting potential bearish momentum. The RSI is at 42.07, indicating the stock is neither overbought nor oversold, while the MACD reveals a bearish sentiment. The company's market cap is approximately 2.98 trillion INR, with a PE Ratio of 7.63, indicating potential undervaluation compared to the industry average.
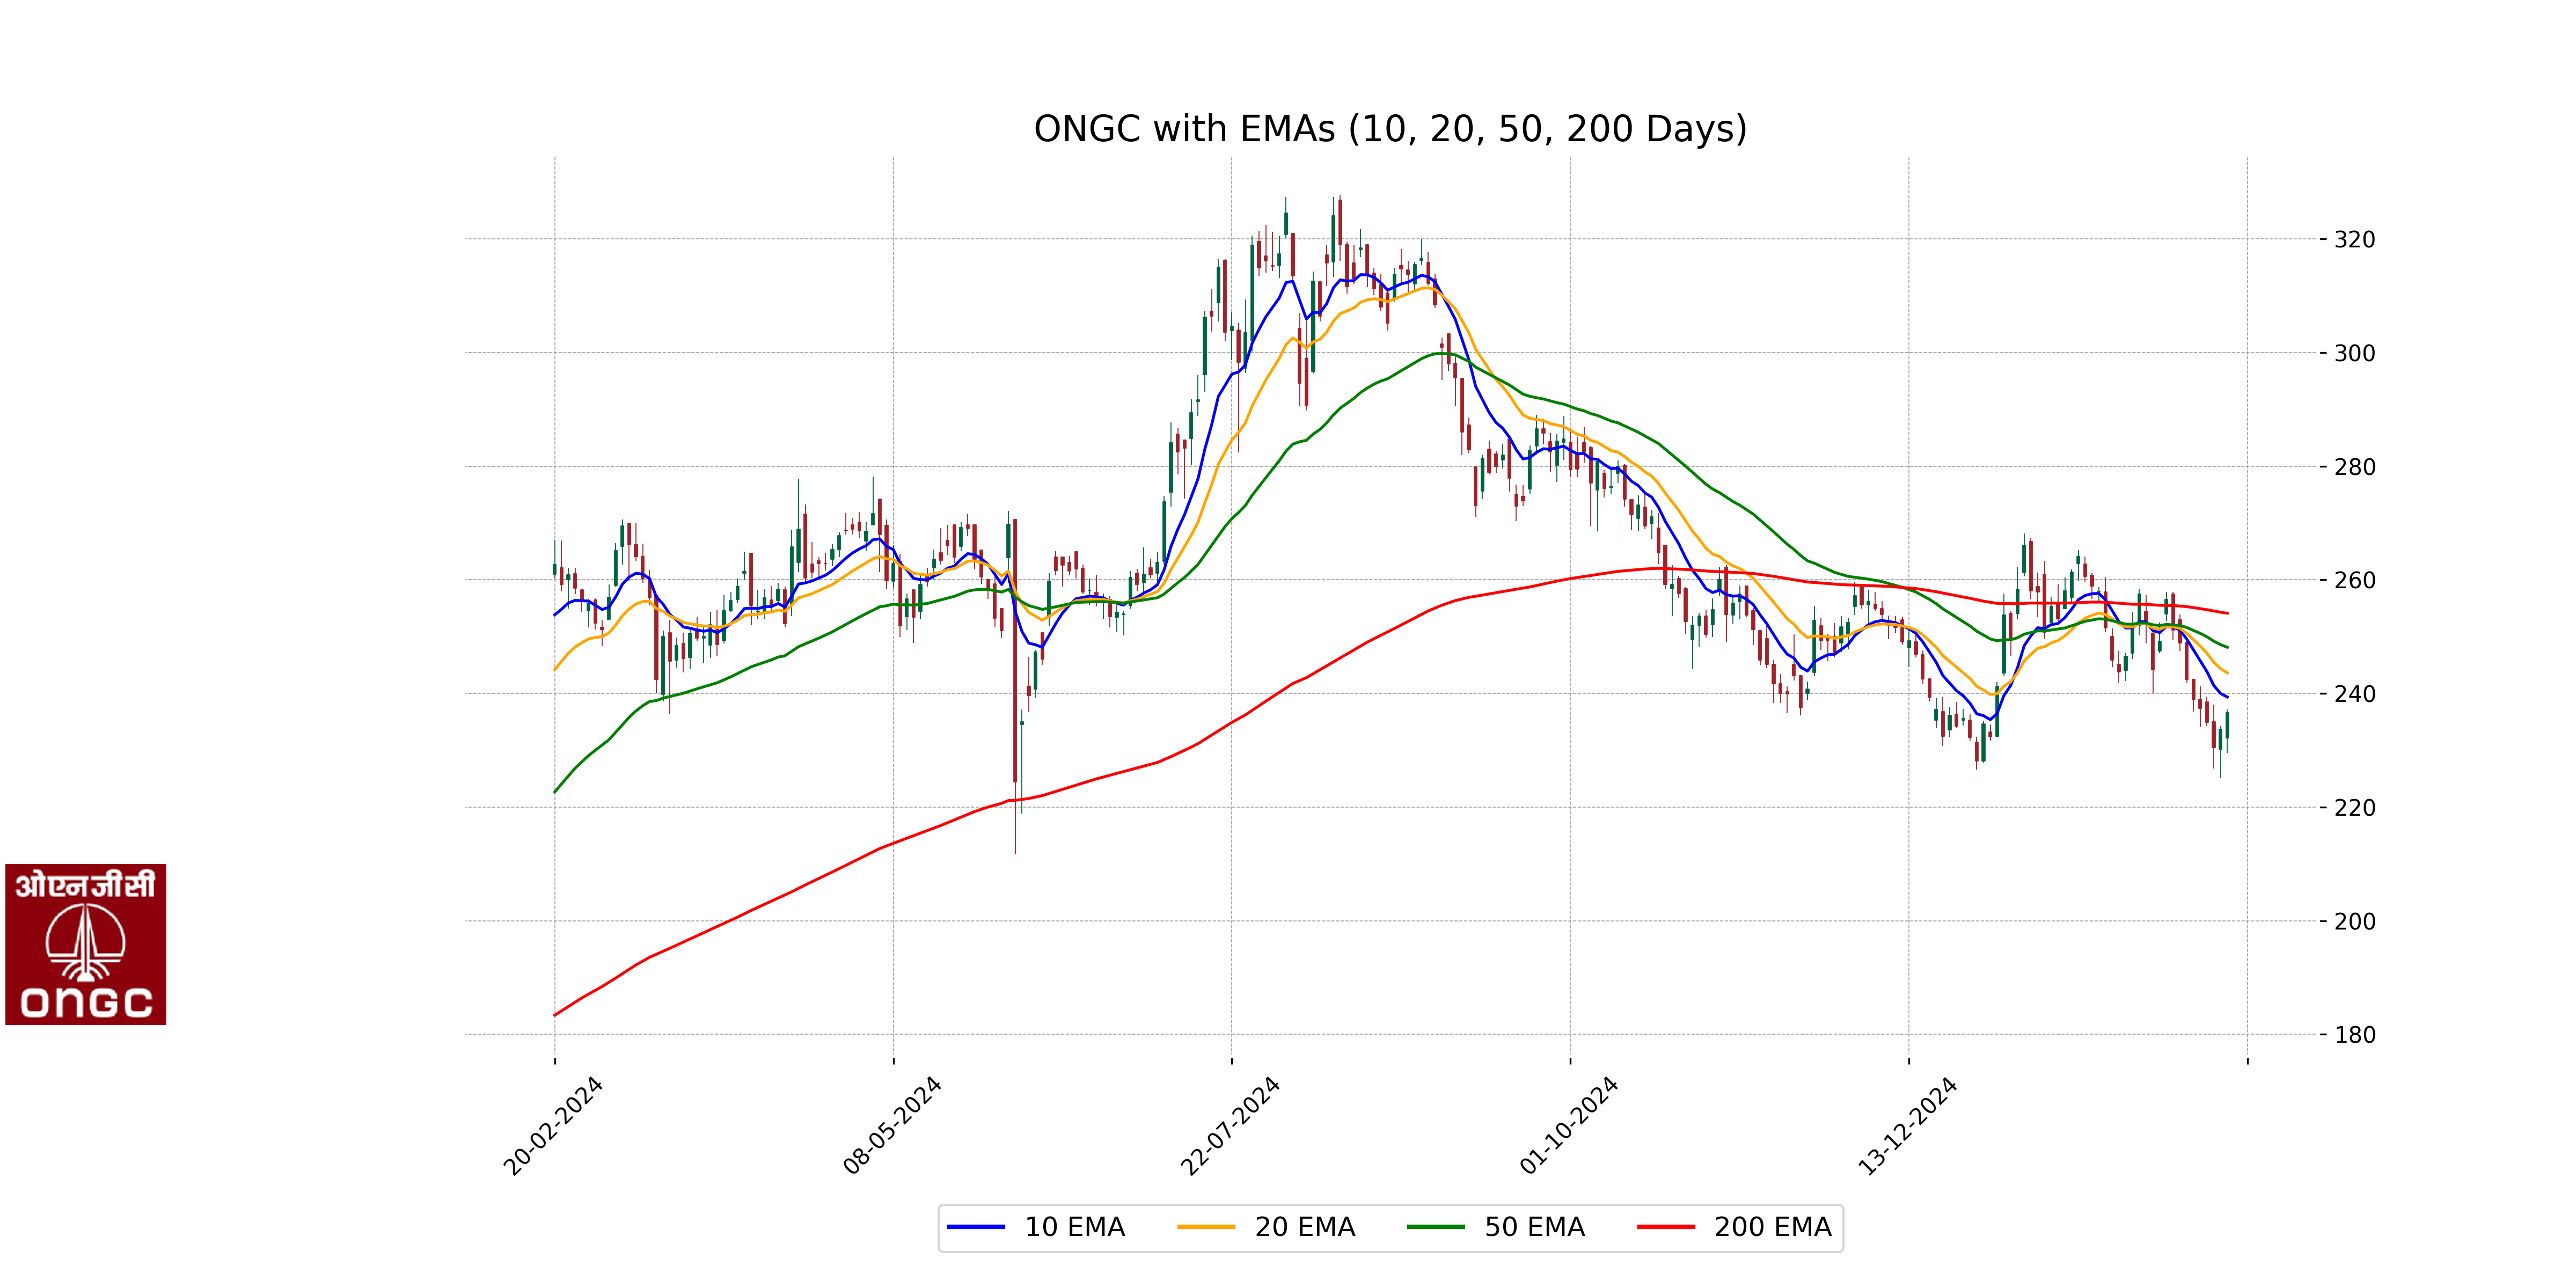
Relationship with Key Moving Averages
The closing price of ONGC at 236.60 is below the key moving averages of 50 EMA (248.11), 200 EMA (254.11), and 10 EMA (239.37). This indicates a potentially bearish trend, as the price is below all these significant averages.
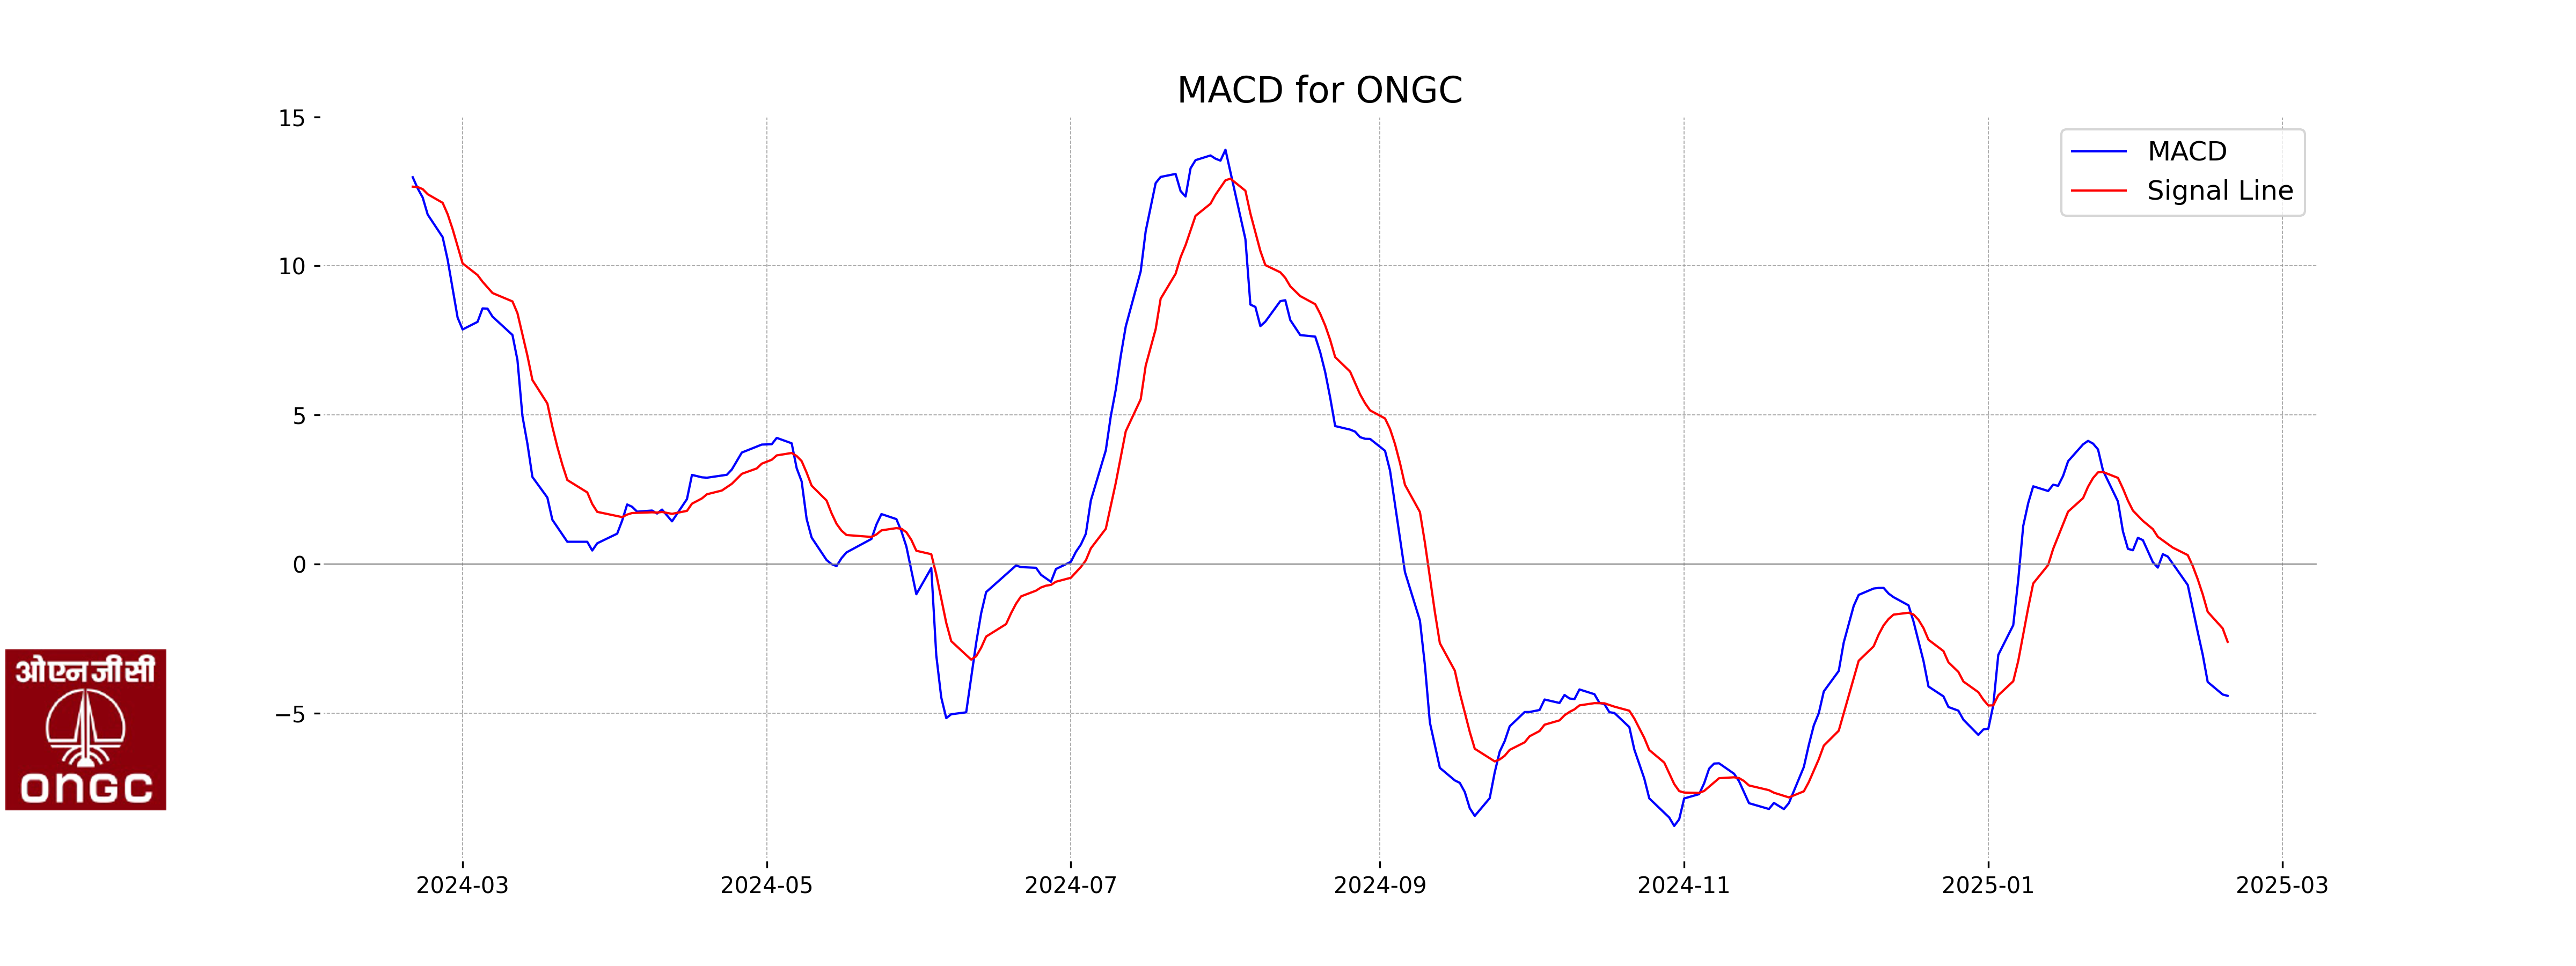
Moving Averages Trend (MACD)
MACD Analysis for ONGC: The MACD is currently at -4.42, which indicates bearish momentum as it is below the signal line at -2.61. This suggests that the stock might be experiencing a downward trend, and traders should watch for potential changes in momentum.
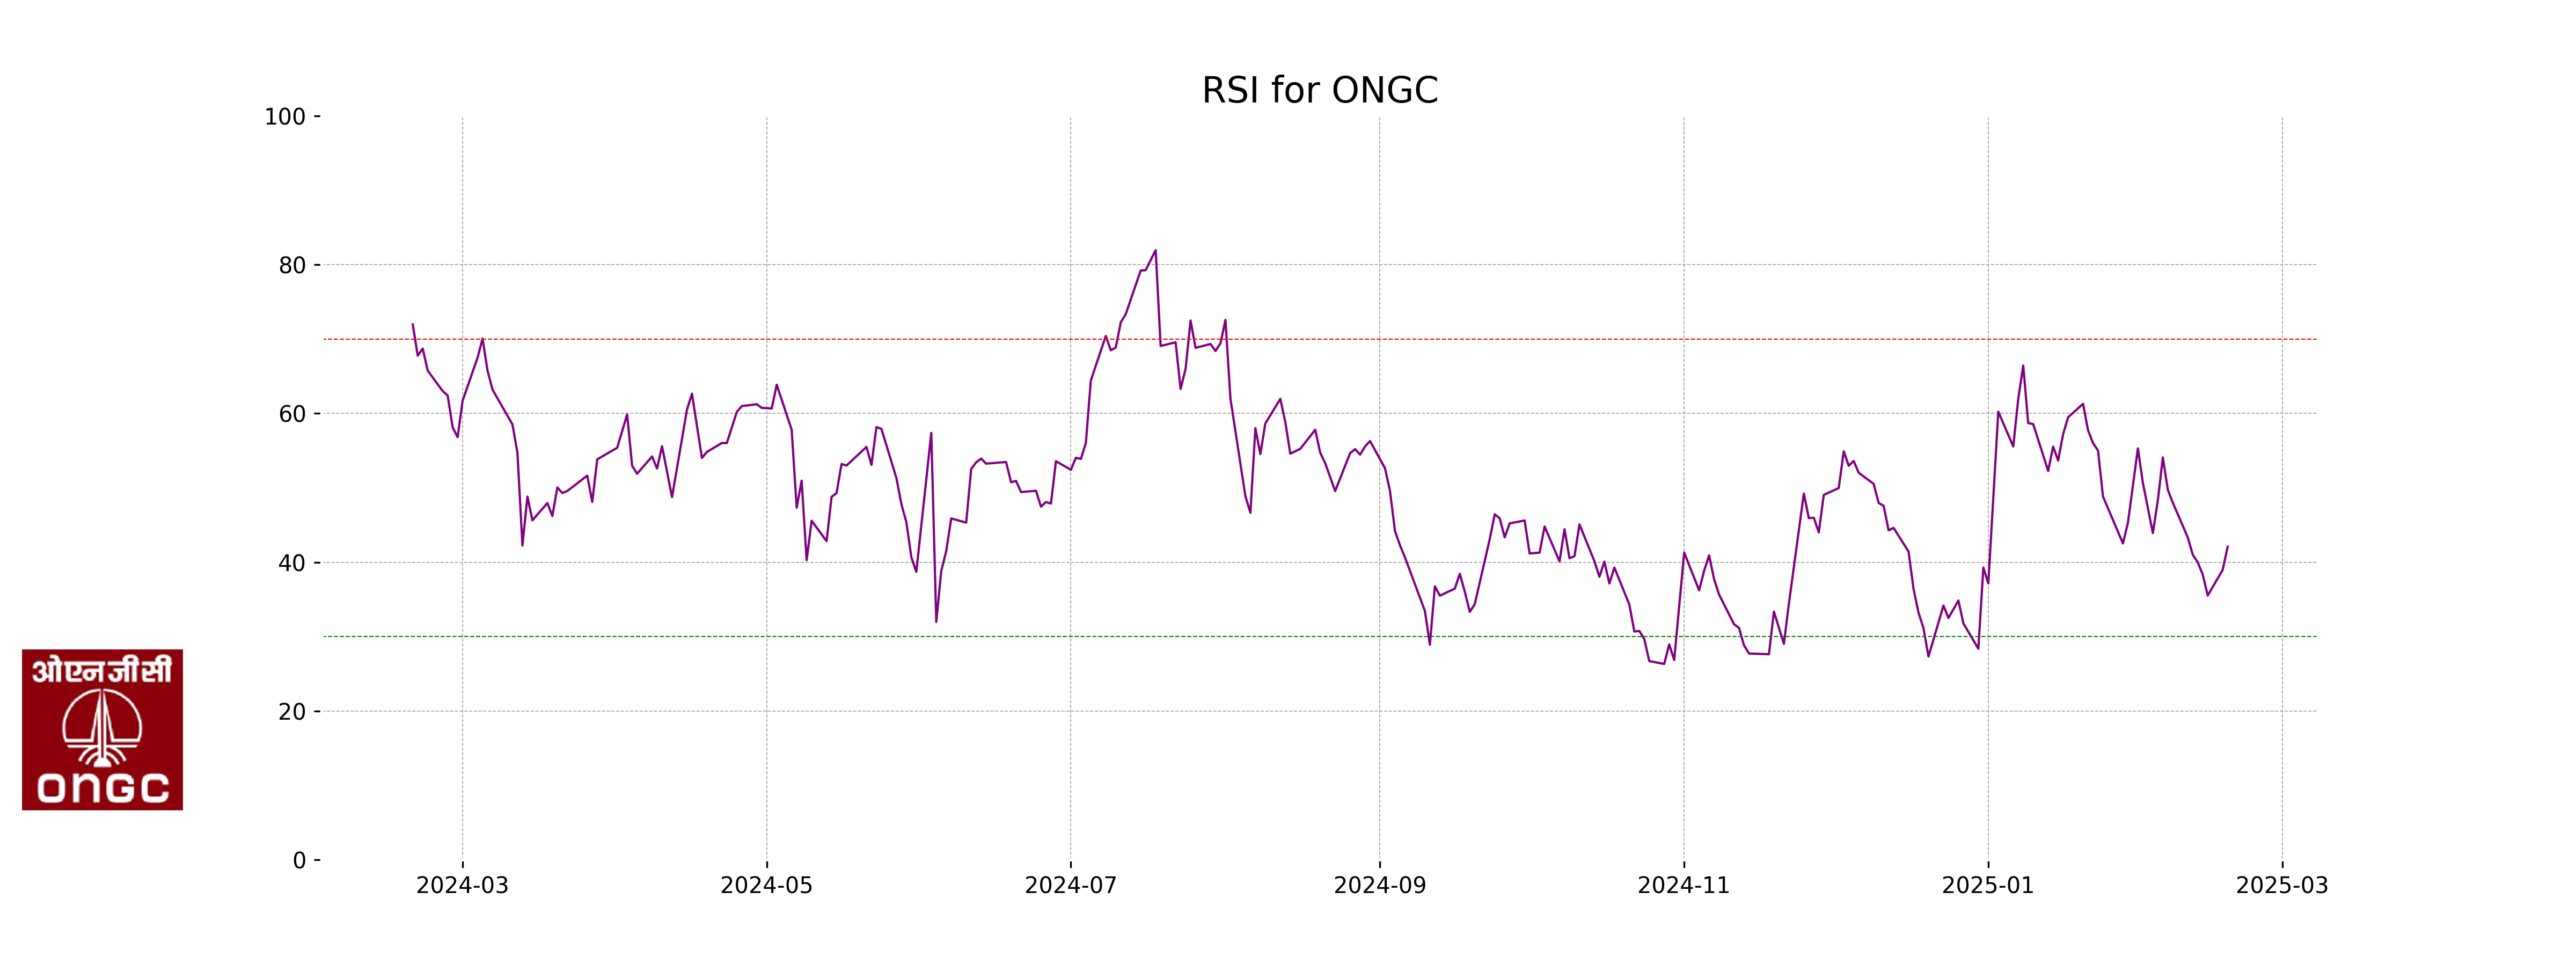
RSI Analysis
The RSI for ONGC is 42.08, which suggests that the stock is currently in a neutral zone, leaning slightly towards being oversold. This indicates that while the stock isn't strongly trending down, it has potential for price recovery if buying pressure increases.
Analysis for Power Grid - February 18, 2025
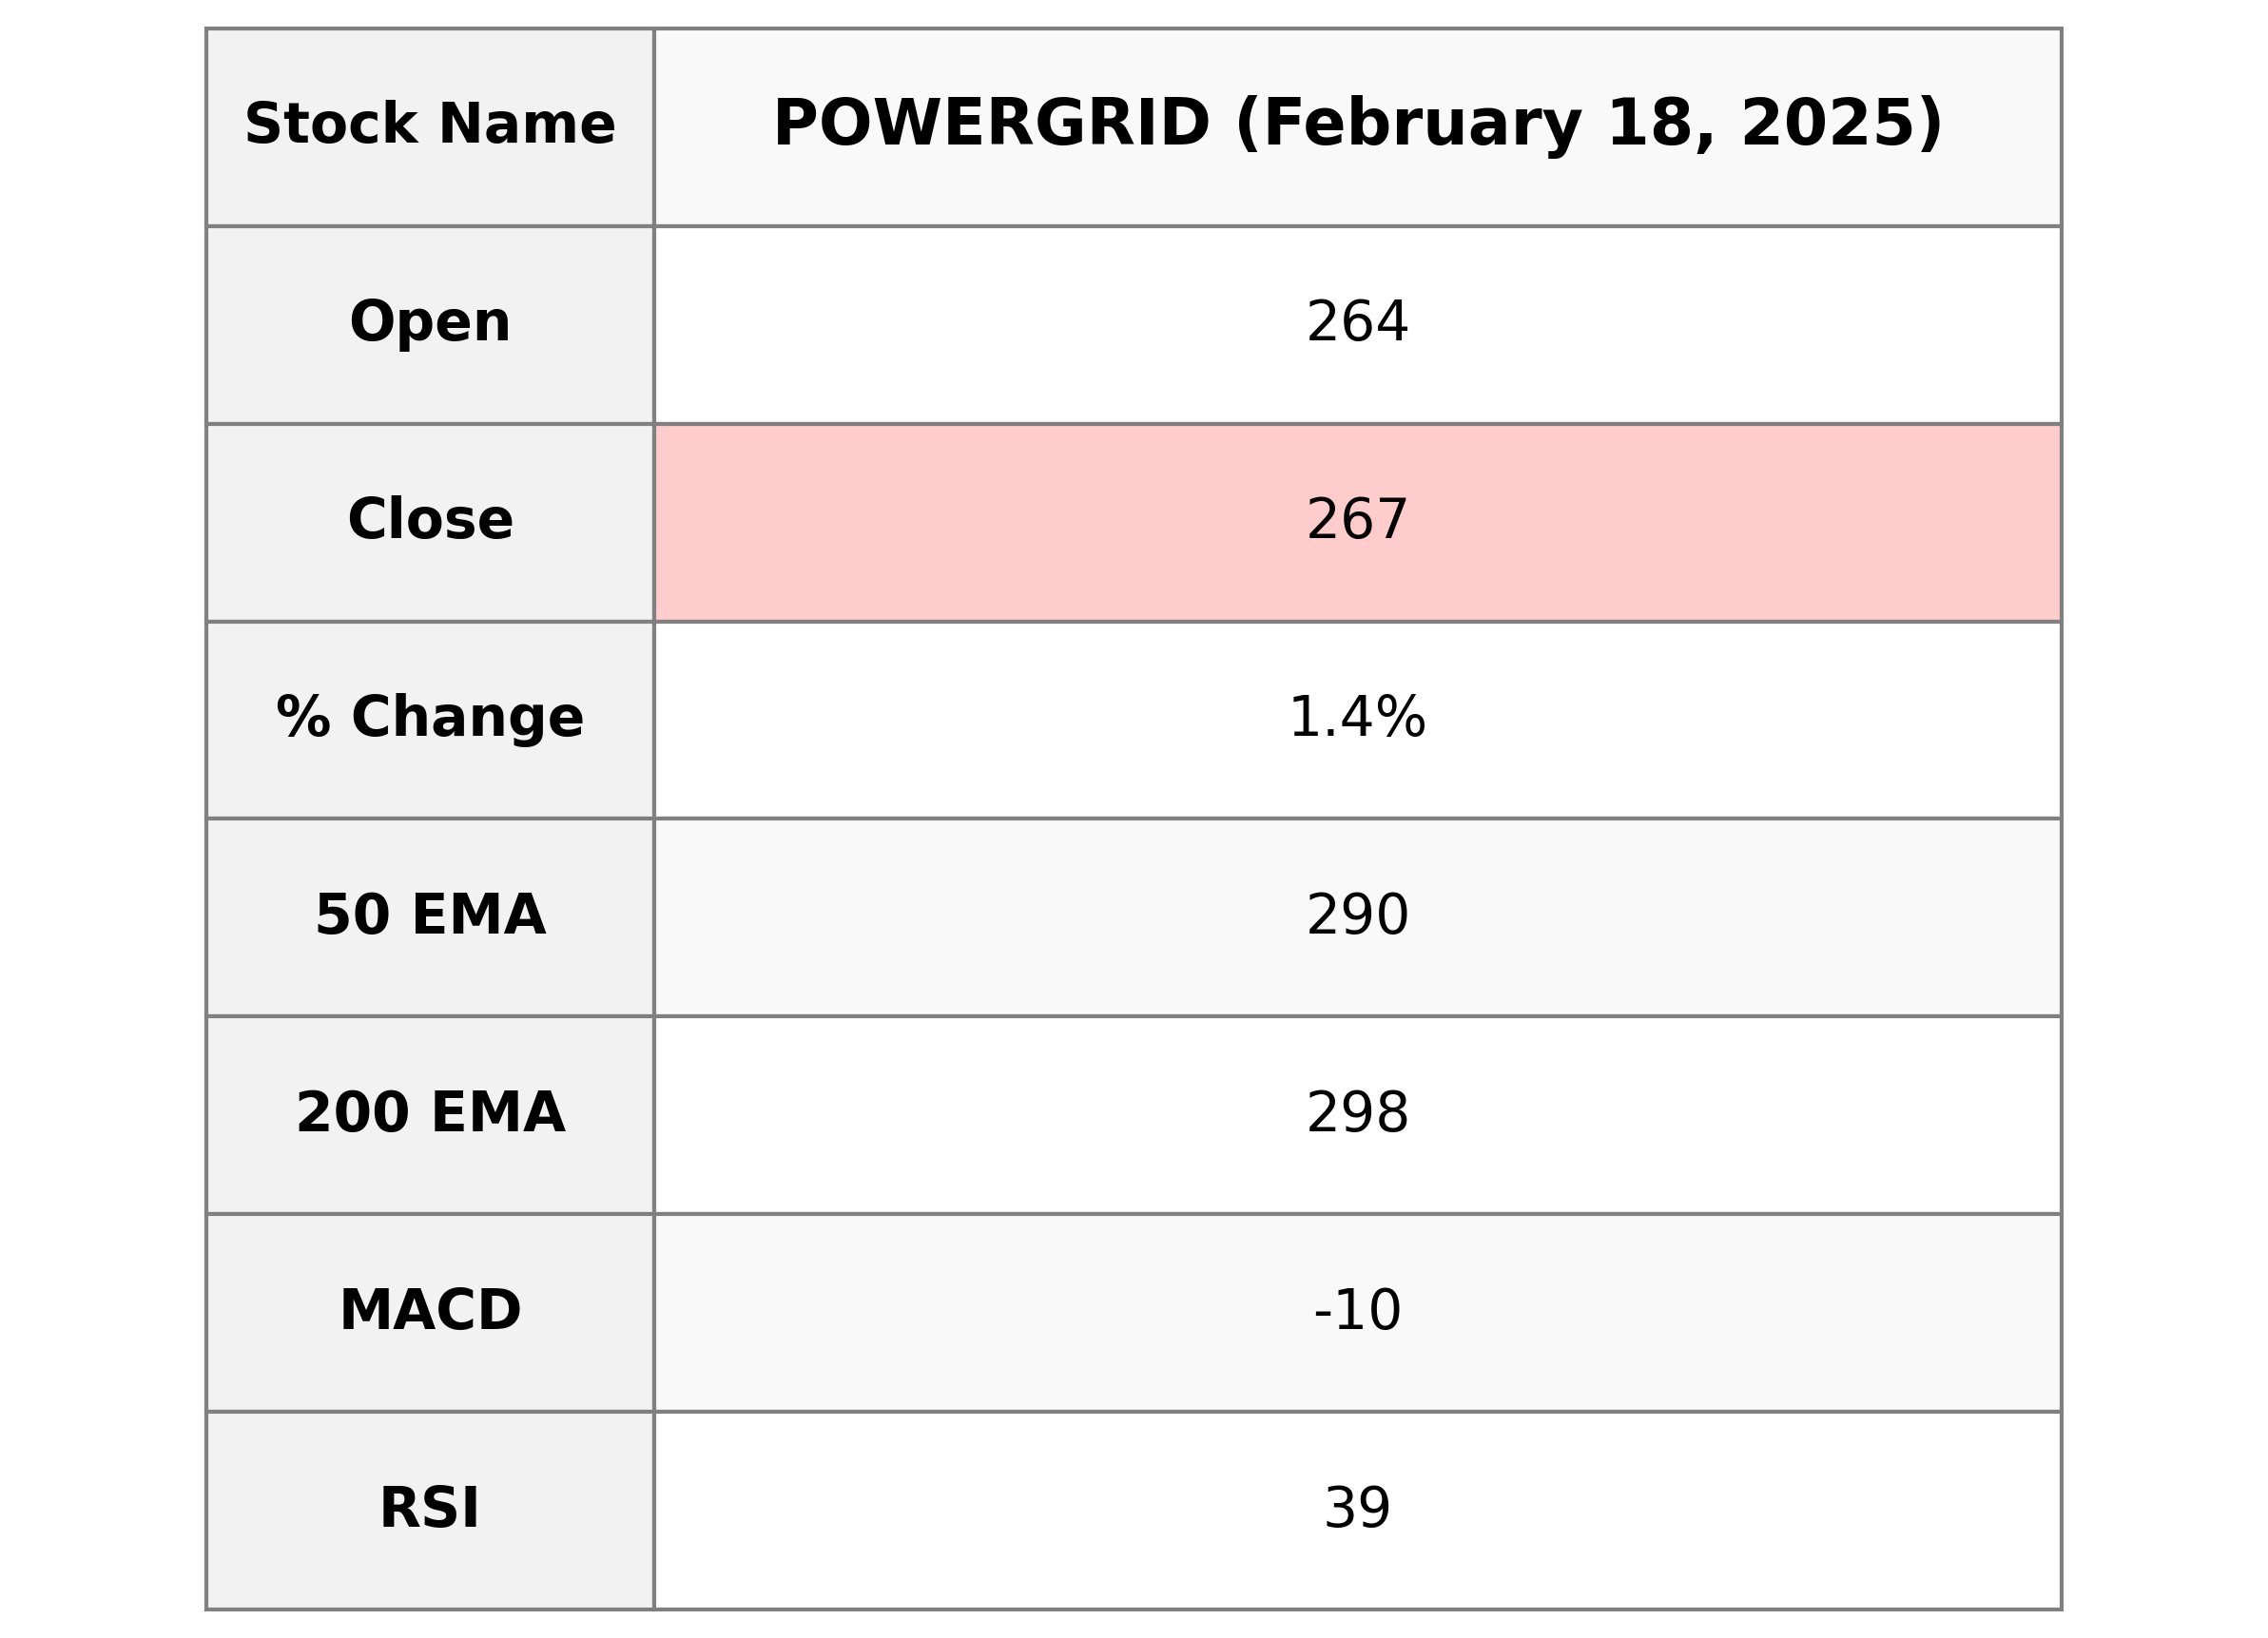
Stock Name: Power Grid Corporation of India Ltd Performance: Power Grid's stock witnessed a 1.42% increase, closing at 266.95, with a trading volume of 10,482,682. Despite the rise, the stock is trading below its 50-day and 200-day EMAs, indicating recent downward trends, and the RSI is at 38.67, suggesting it's approaching oversold territories.
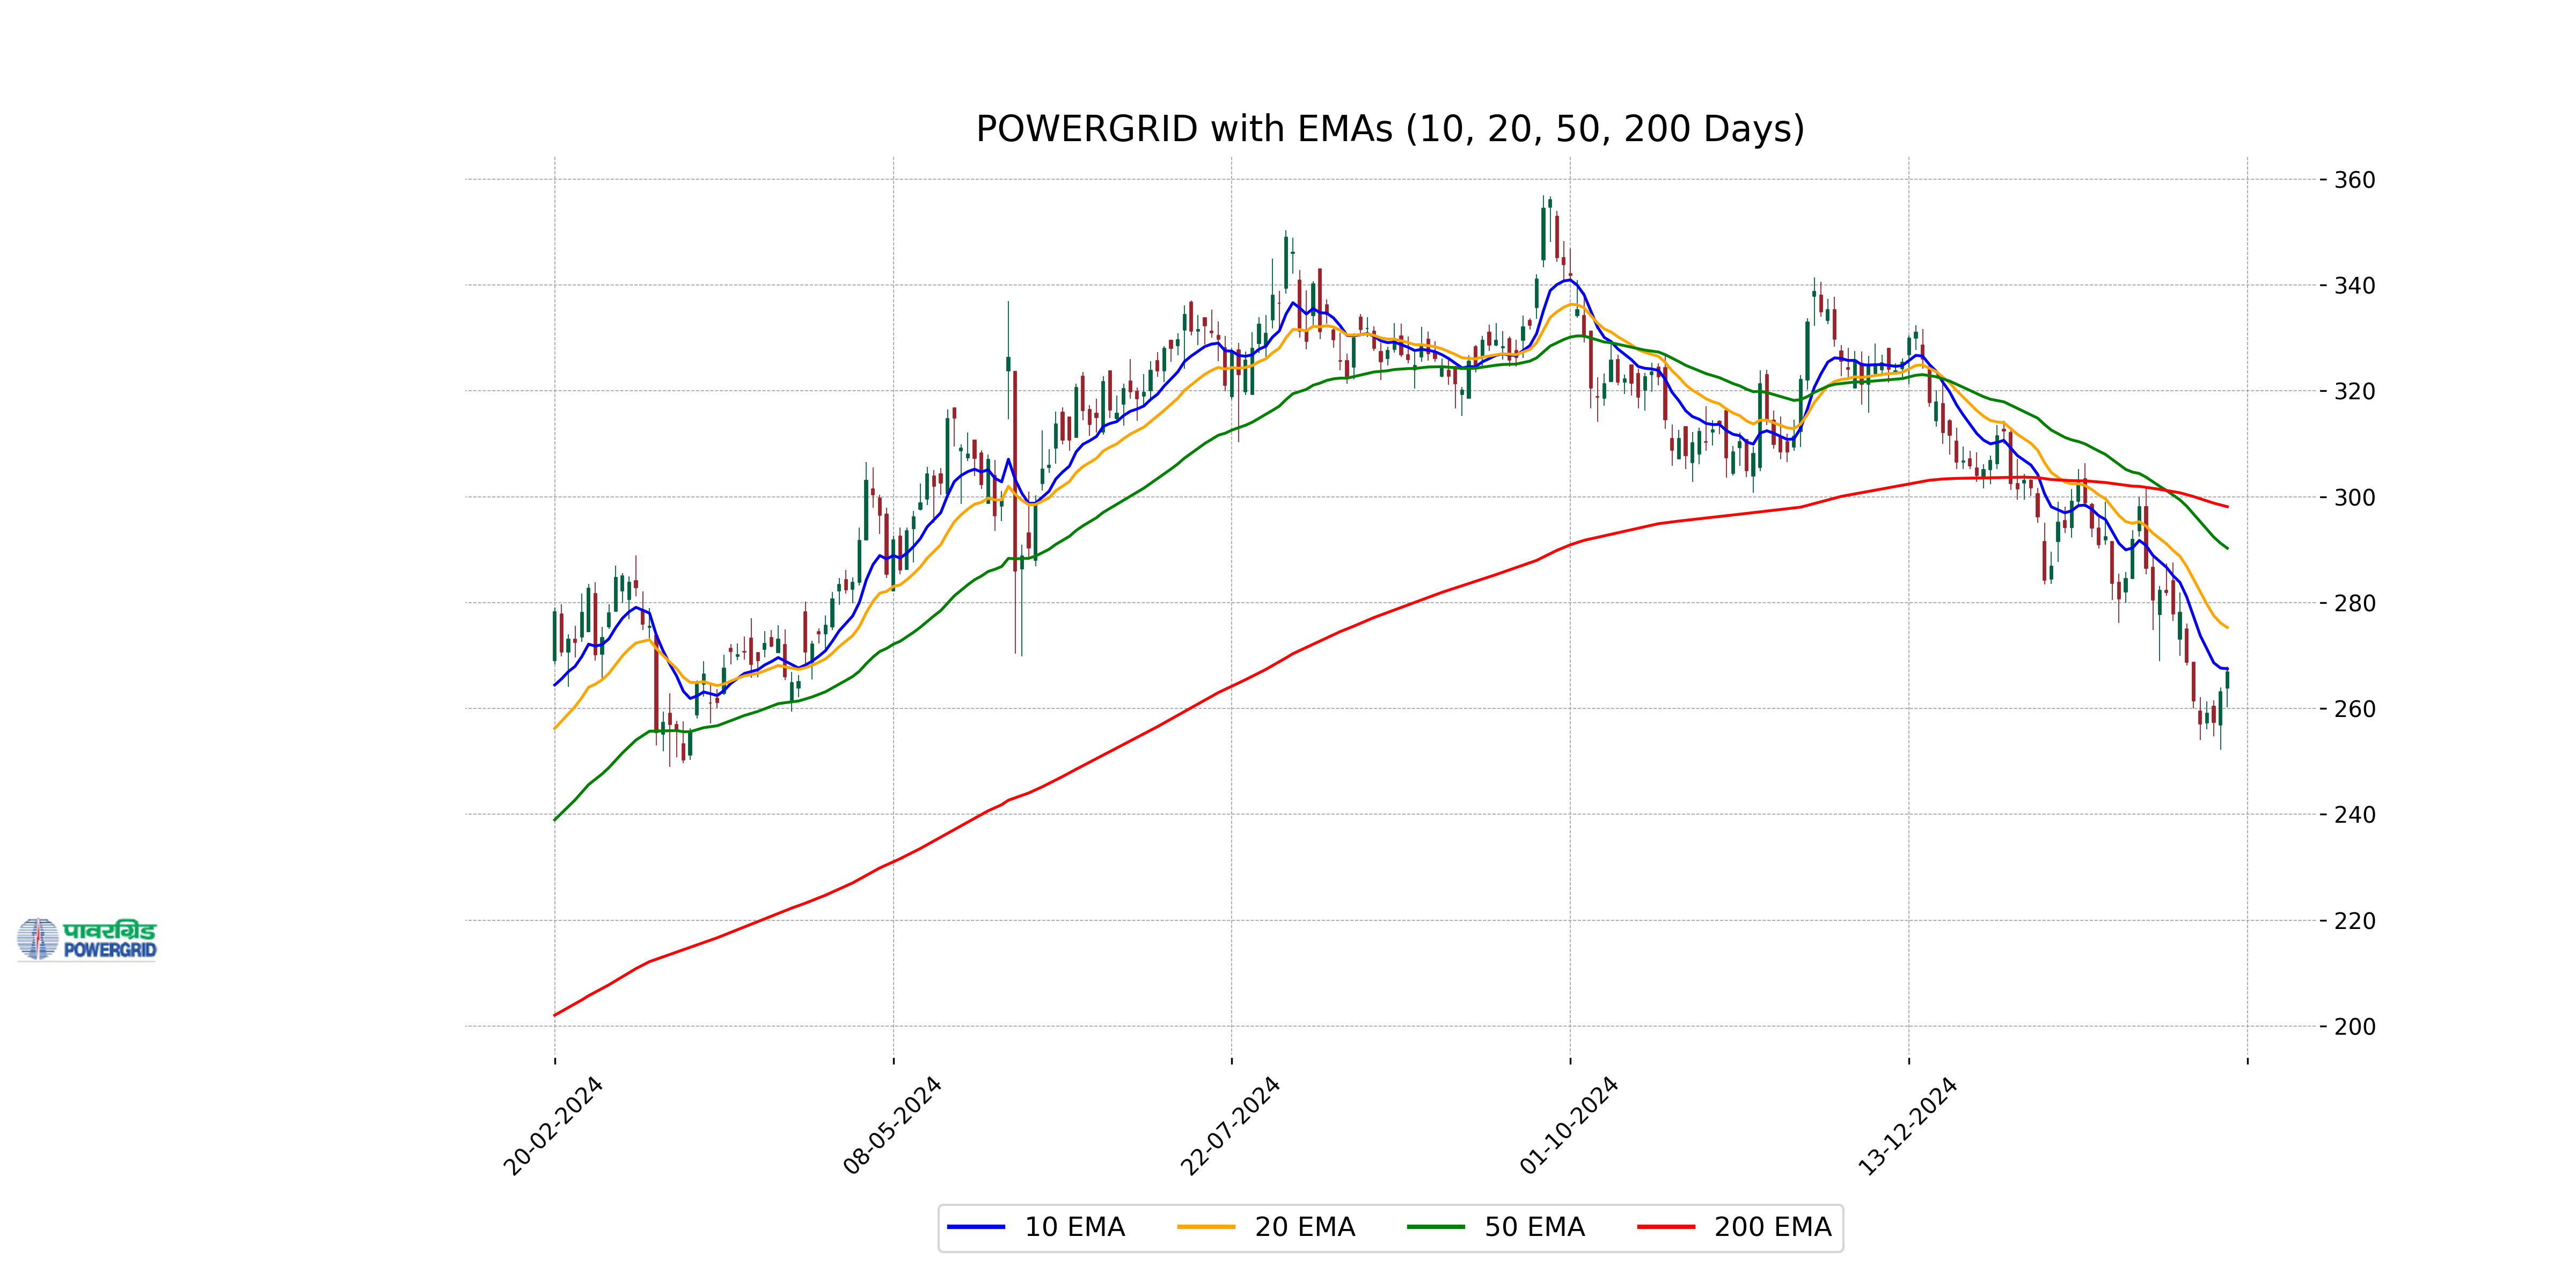
Relationship with Key Moving Averages
Power Grid closed at 266.95, which is below its 10-day EMA of 267.51, 50-day EMA of 290.27, and 200-day EMA of 298.12, suggesting a short-term bearish trend. The stock's RSI of 38.67 indicates it is approaching oversold territory.
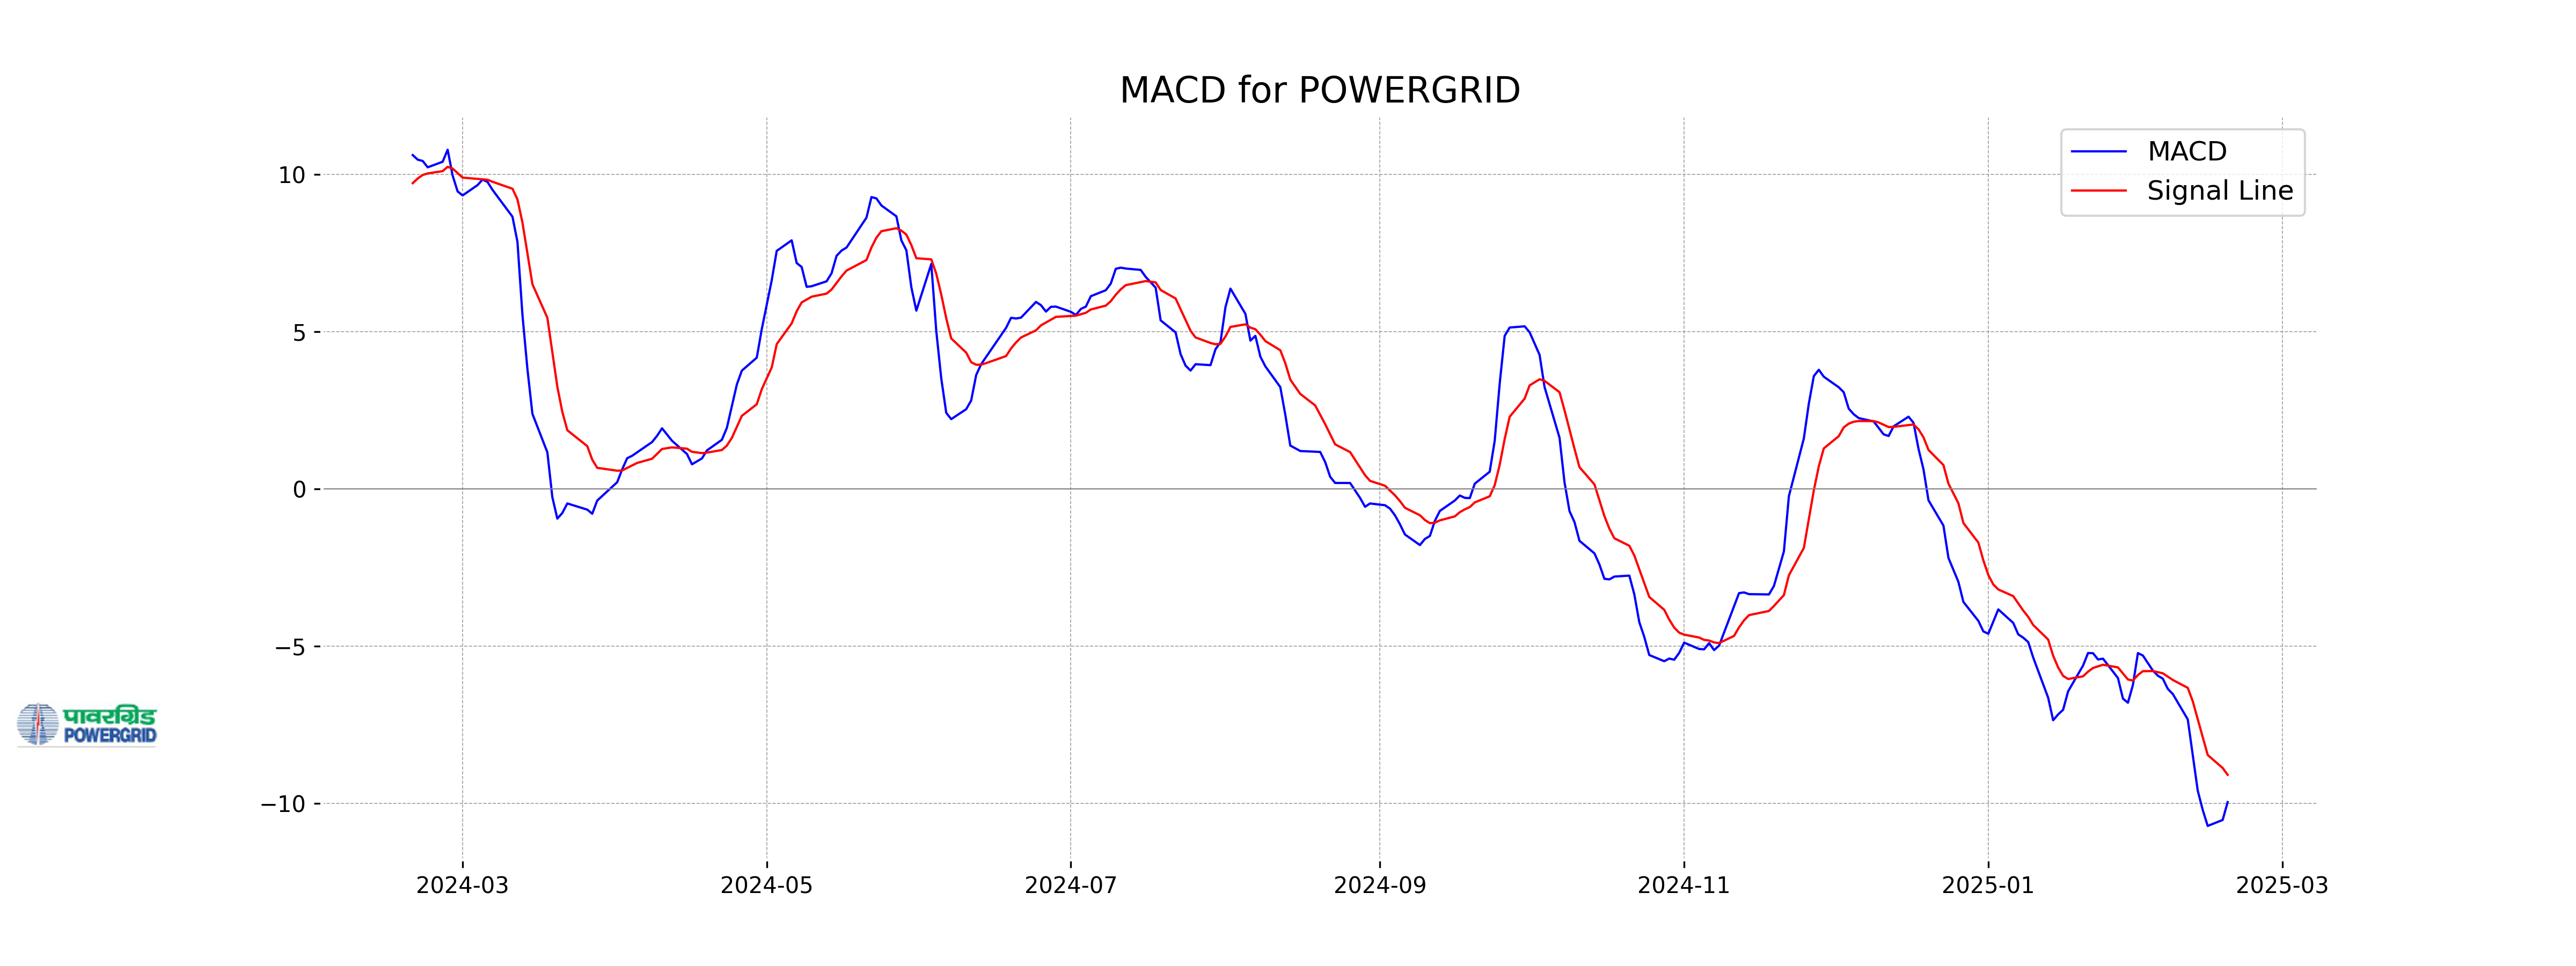
Moving Averages Trend (MACD)
```plaintext The MACD analysis for Power Grid indicates a bearish outlook, as the MACD value of -9.96 is below the MACD Signal of -9.09, suggesting potential downward momentum. This is further supported by the RSI of 38.67, which is below 50, indicating weaker market strength. ```
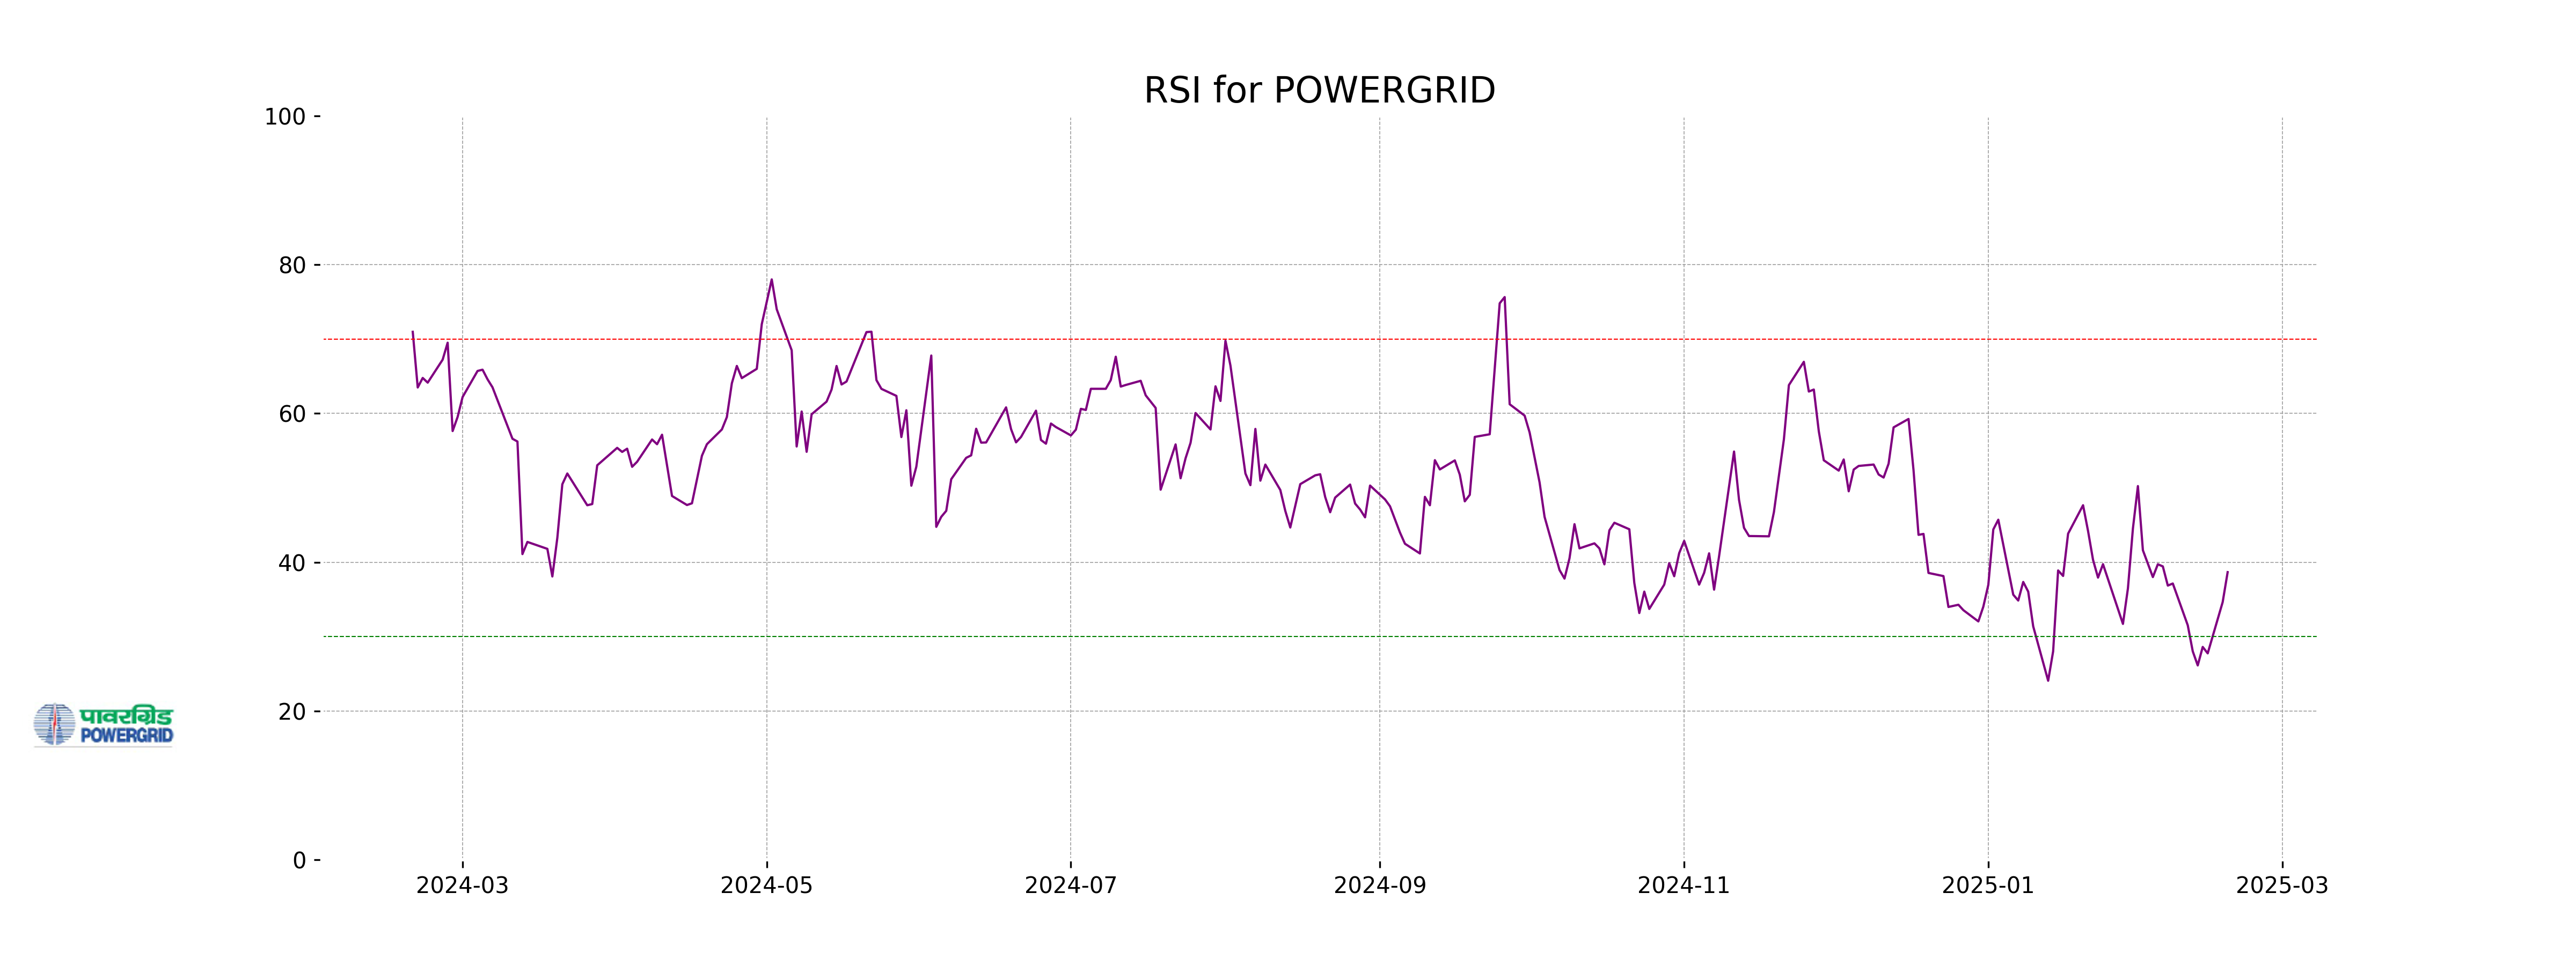
RSI Analysis
The RSI (Relative Strength Index) for Power Grid is 38.67, indicating that the stock is nearing oversold territory. This suggests a potential buying opportunity if the trend shows signs of reversal.
Analysis for Tech Mahindra - February 18, 2025
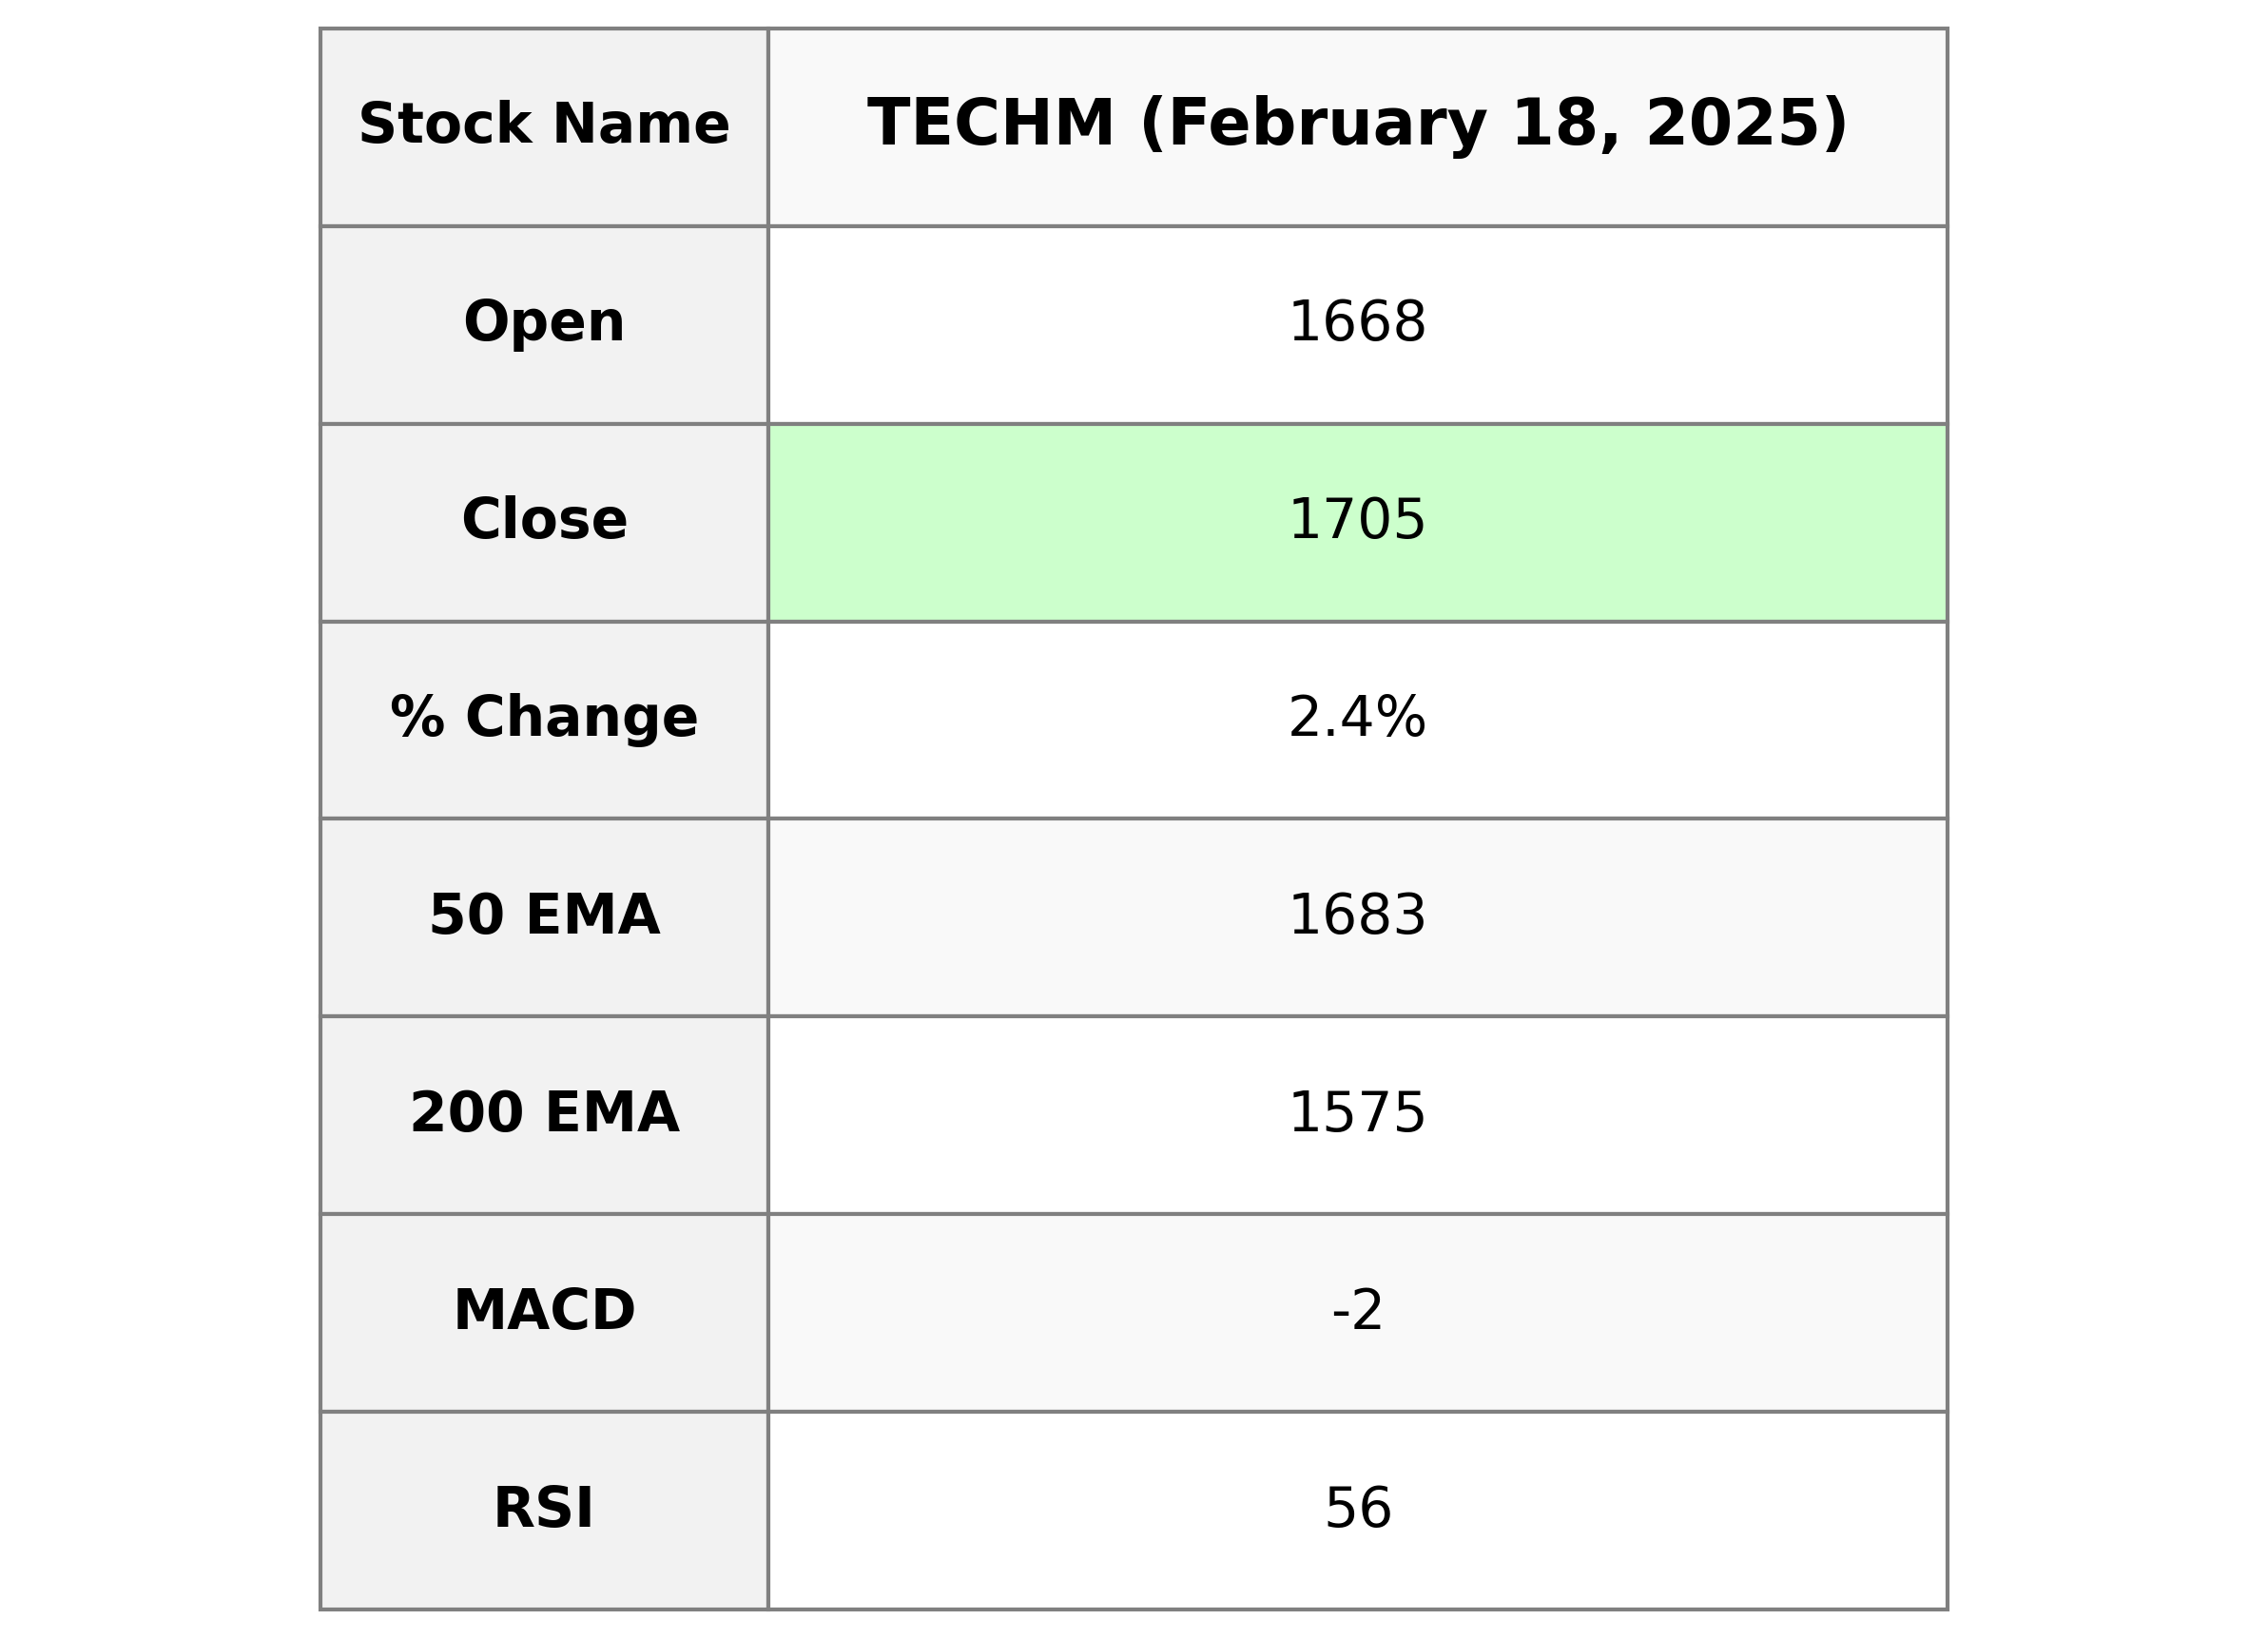
Tech Mahindra Performance Summary: Tech Mahindra's stock opened at 1668.0 and closed at 1705.0, reflecting a 2.41% increase with a points change of 40.05. The stock's high for the day was 1708.95. It demonstrates a positive trend above its 50, 20, and 10-day EMAs, with an RSI of 55.51 suggesting neutral market momentum. The company operates in the Information Technology Services sector in India, with a market cap of approximately 1.51 trillion INR and a PE ratio of 40.32.
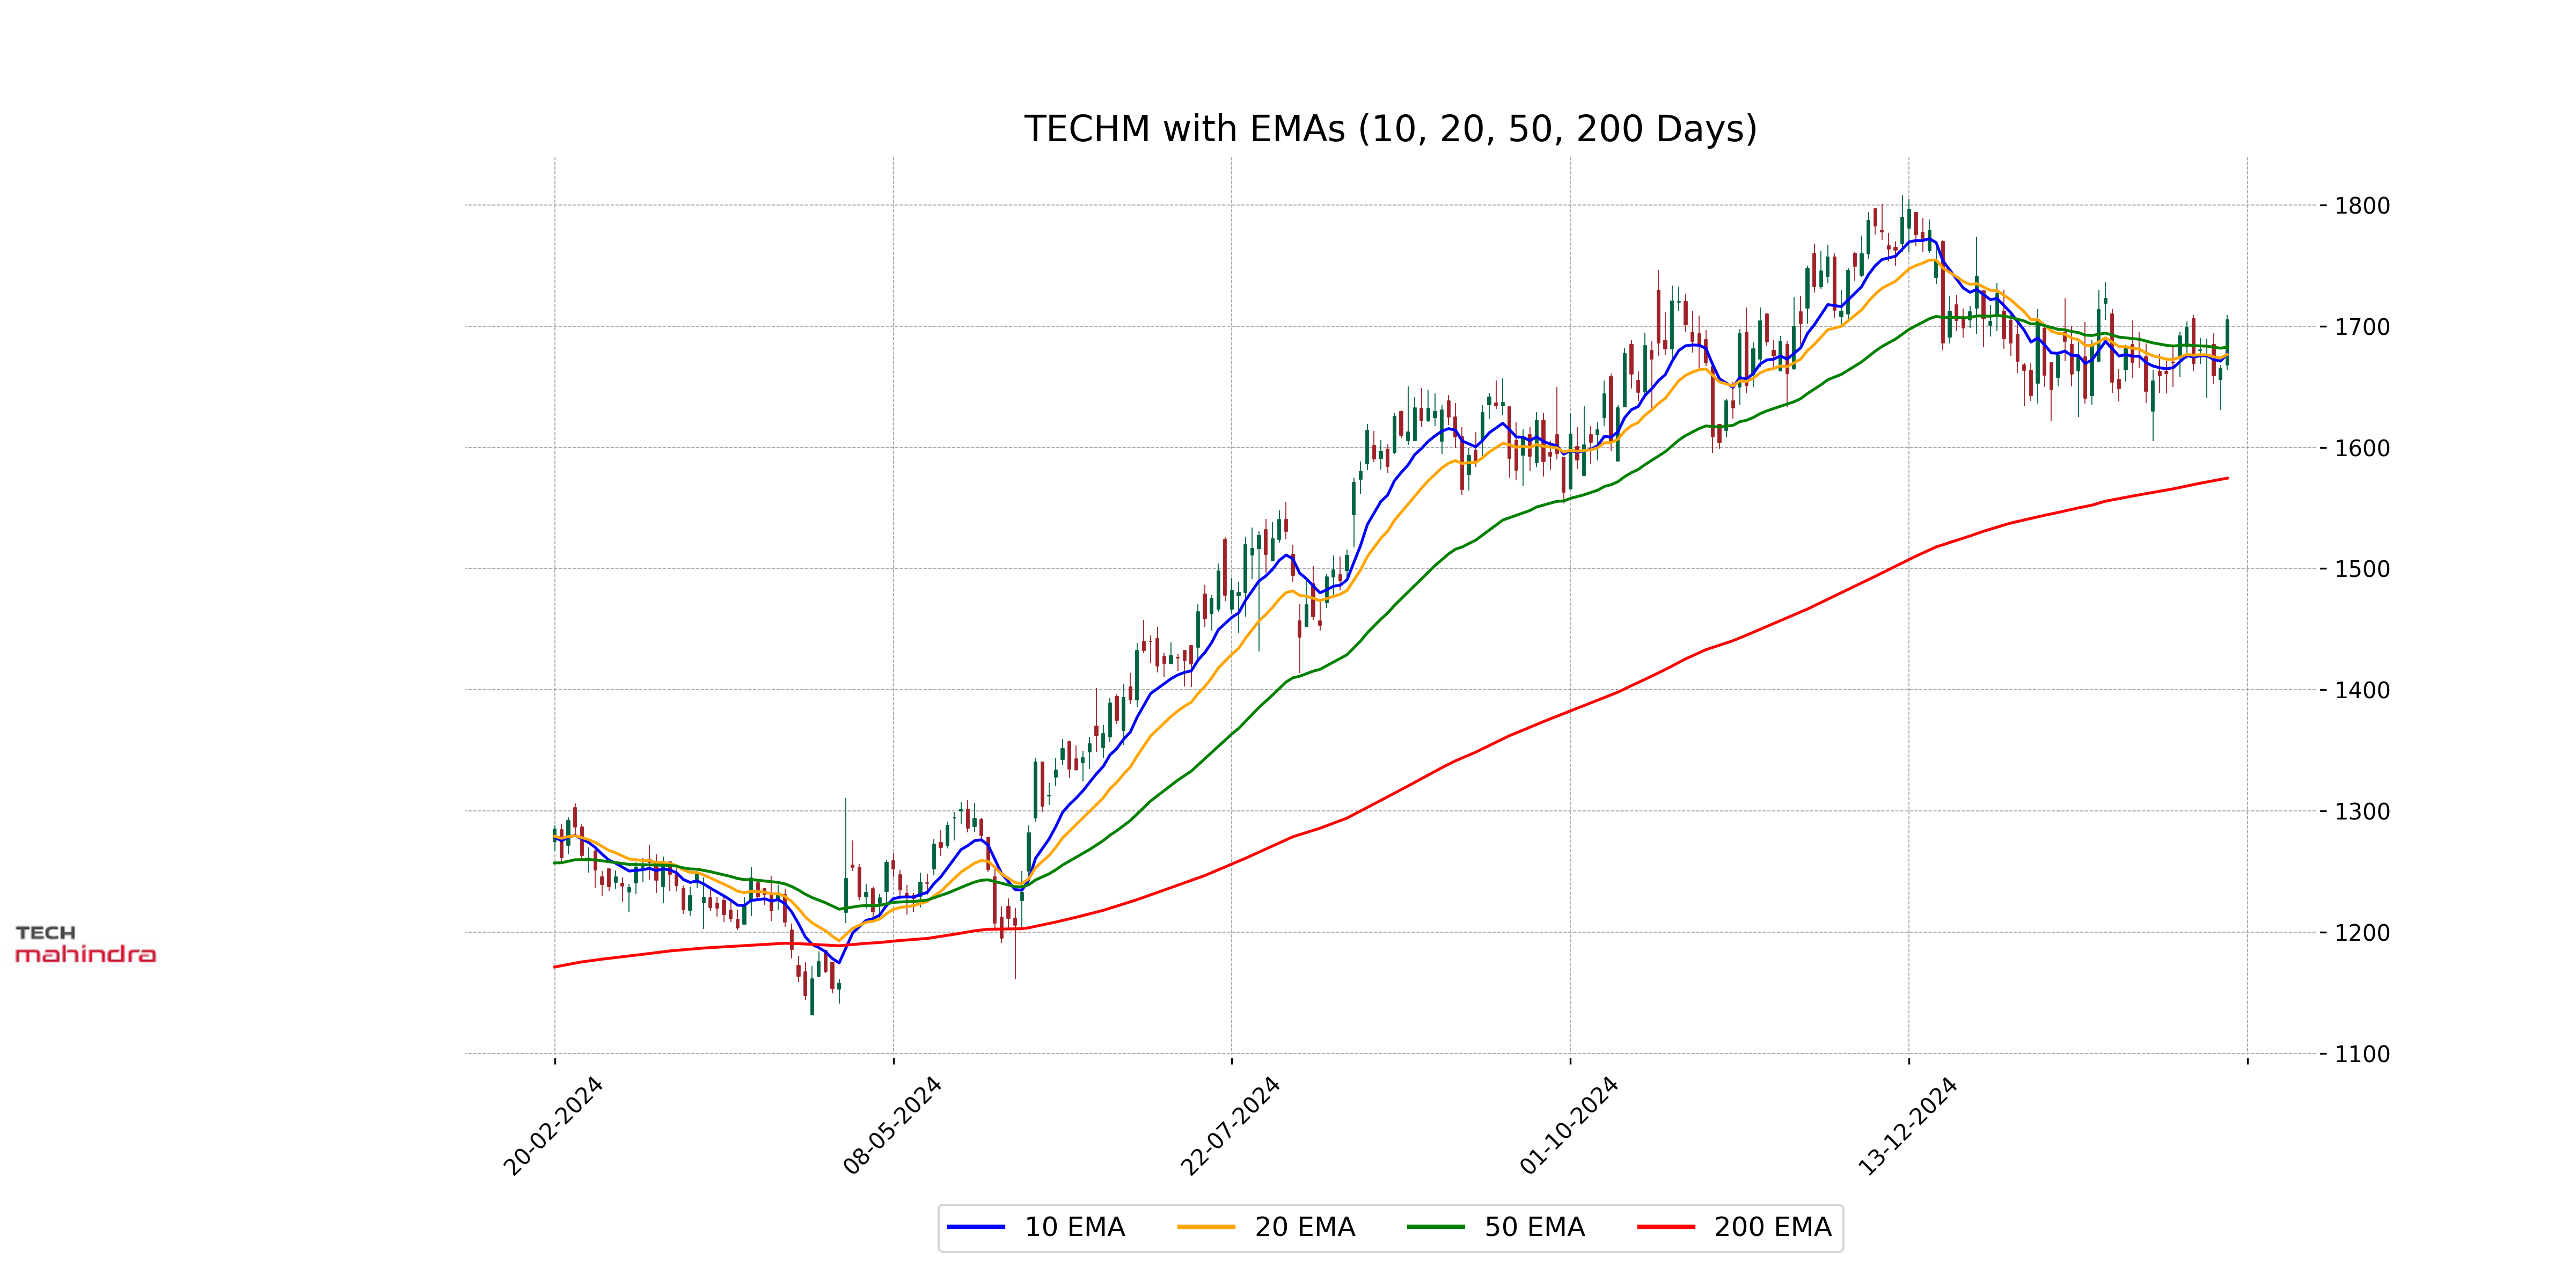
Relationship with Key Moving Averages
Tech Mahindra's current closing price of 1705 is above both the 50-day EMA of 1682.71 and the 10-day EMA of 1677.29, indicating a potential bullish trend in the short term. However, the close is below the high of the day, suggesting some intraday resistance.
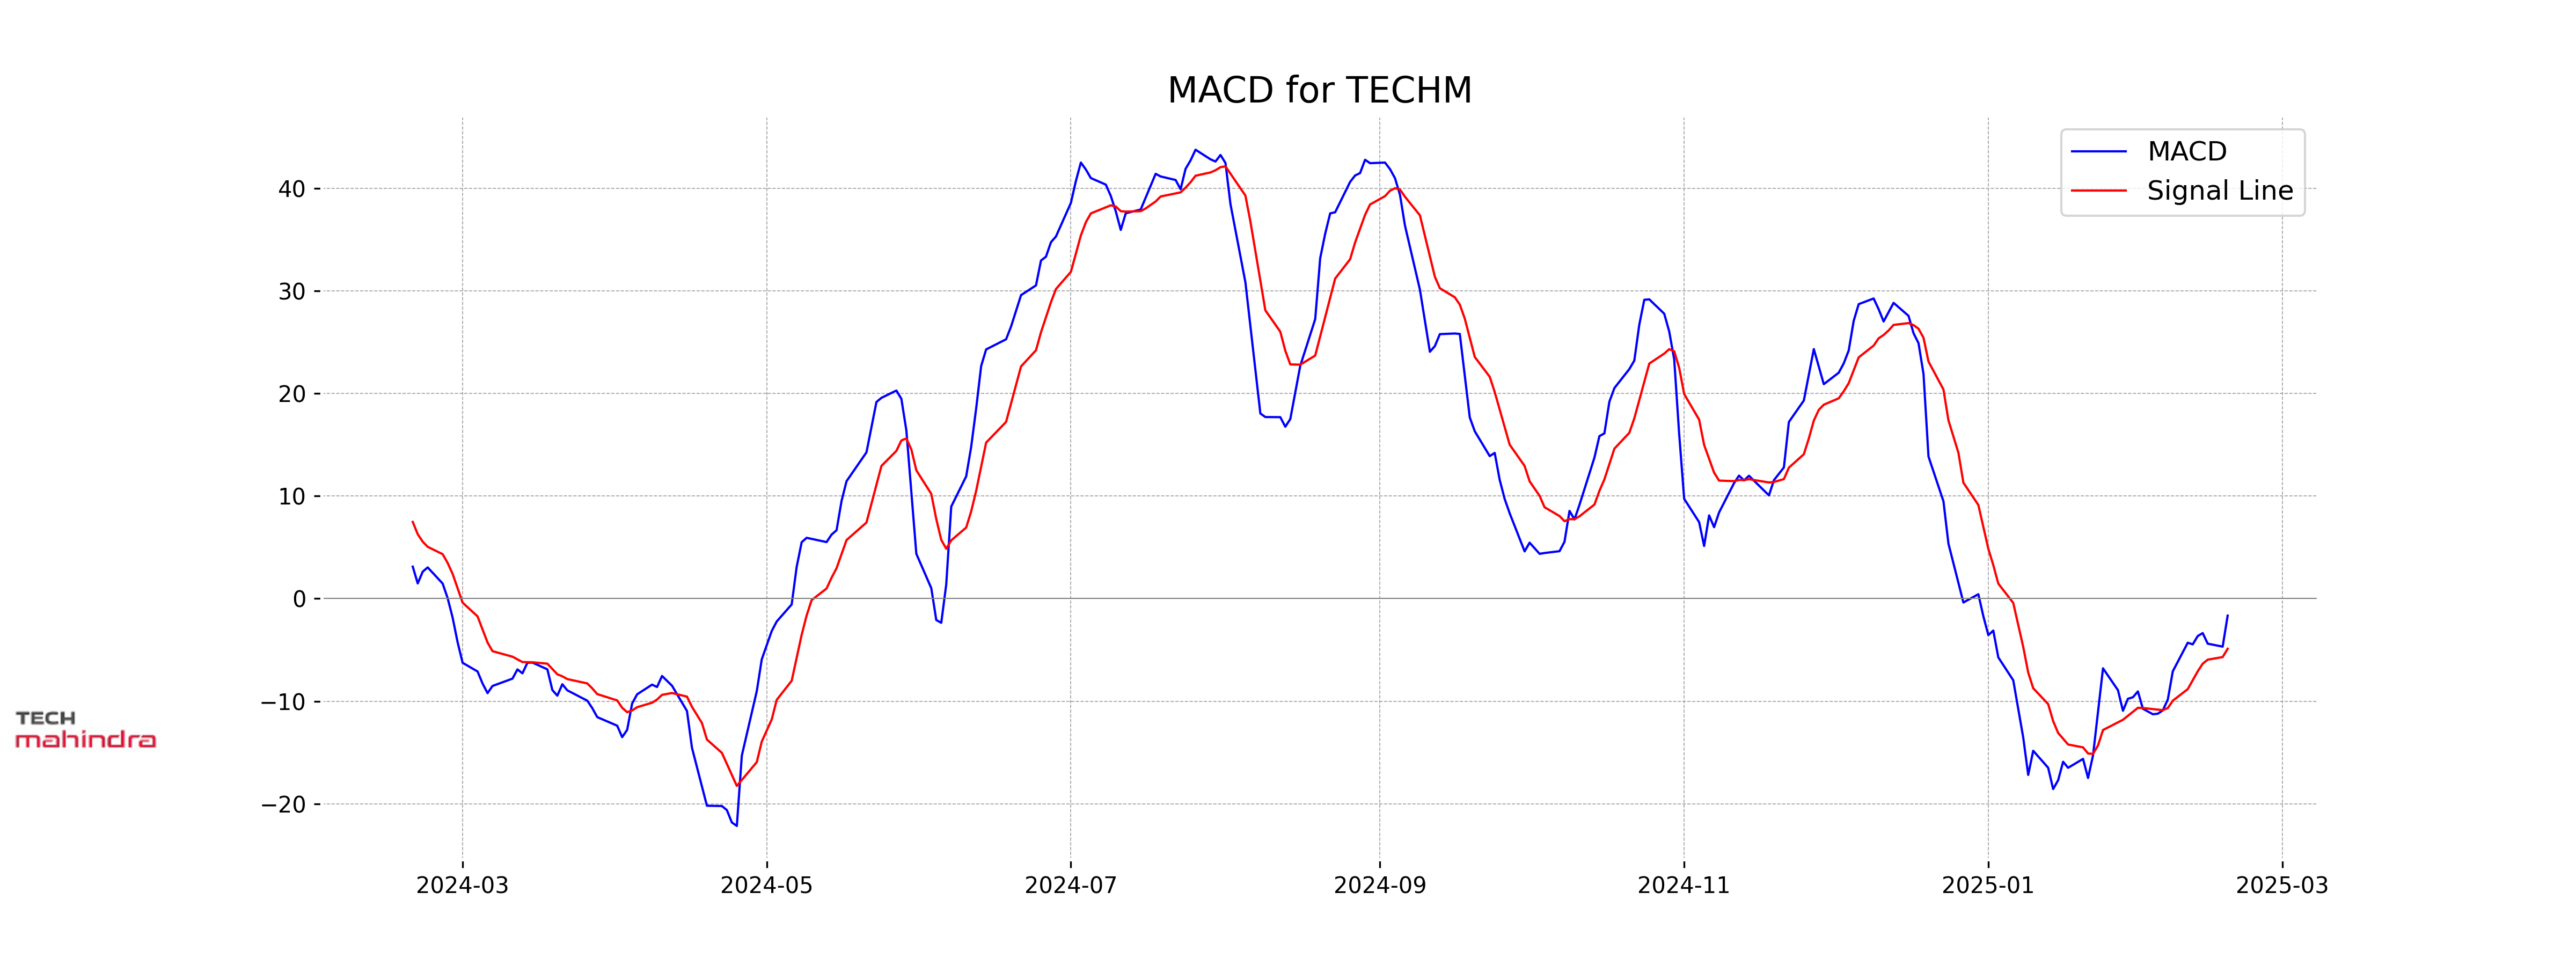
Moving Averages Trend (MACD)
MACD Analysis for Tech Mahindra The MACD value for Tech Mahindra is -1.66, which is above the MACD Signal line at -4.89. This suggests that the bearish momentum may be weakening, and there could be a potential reversal toward a bullish trend. However, investors should look for additional confirmation signals before making decisions.
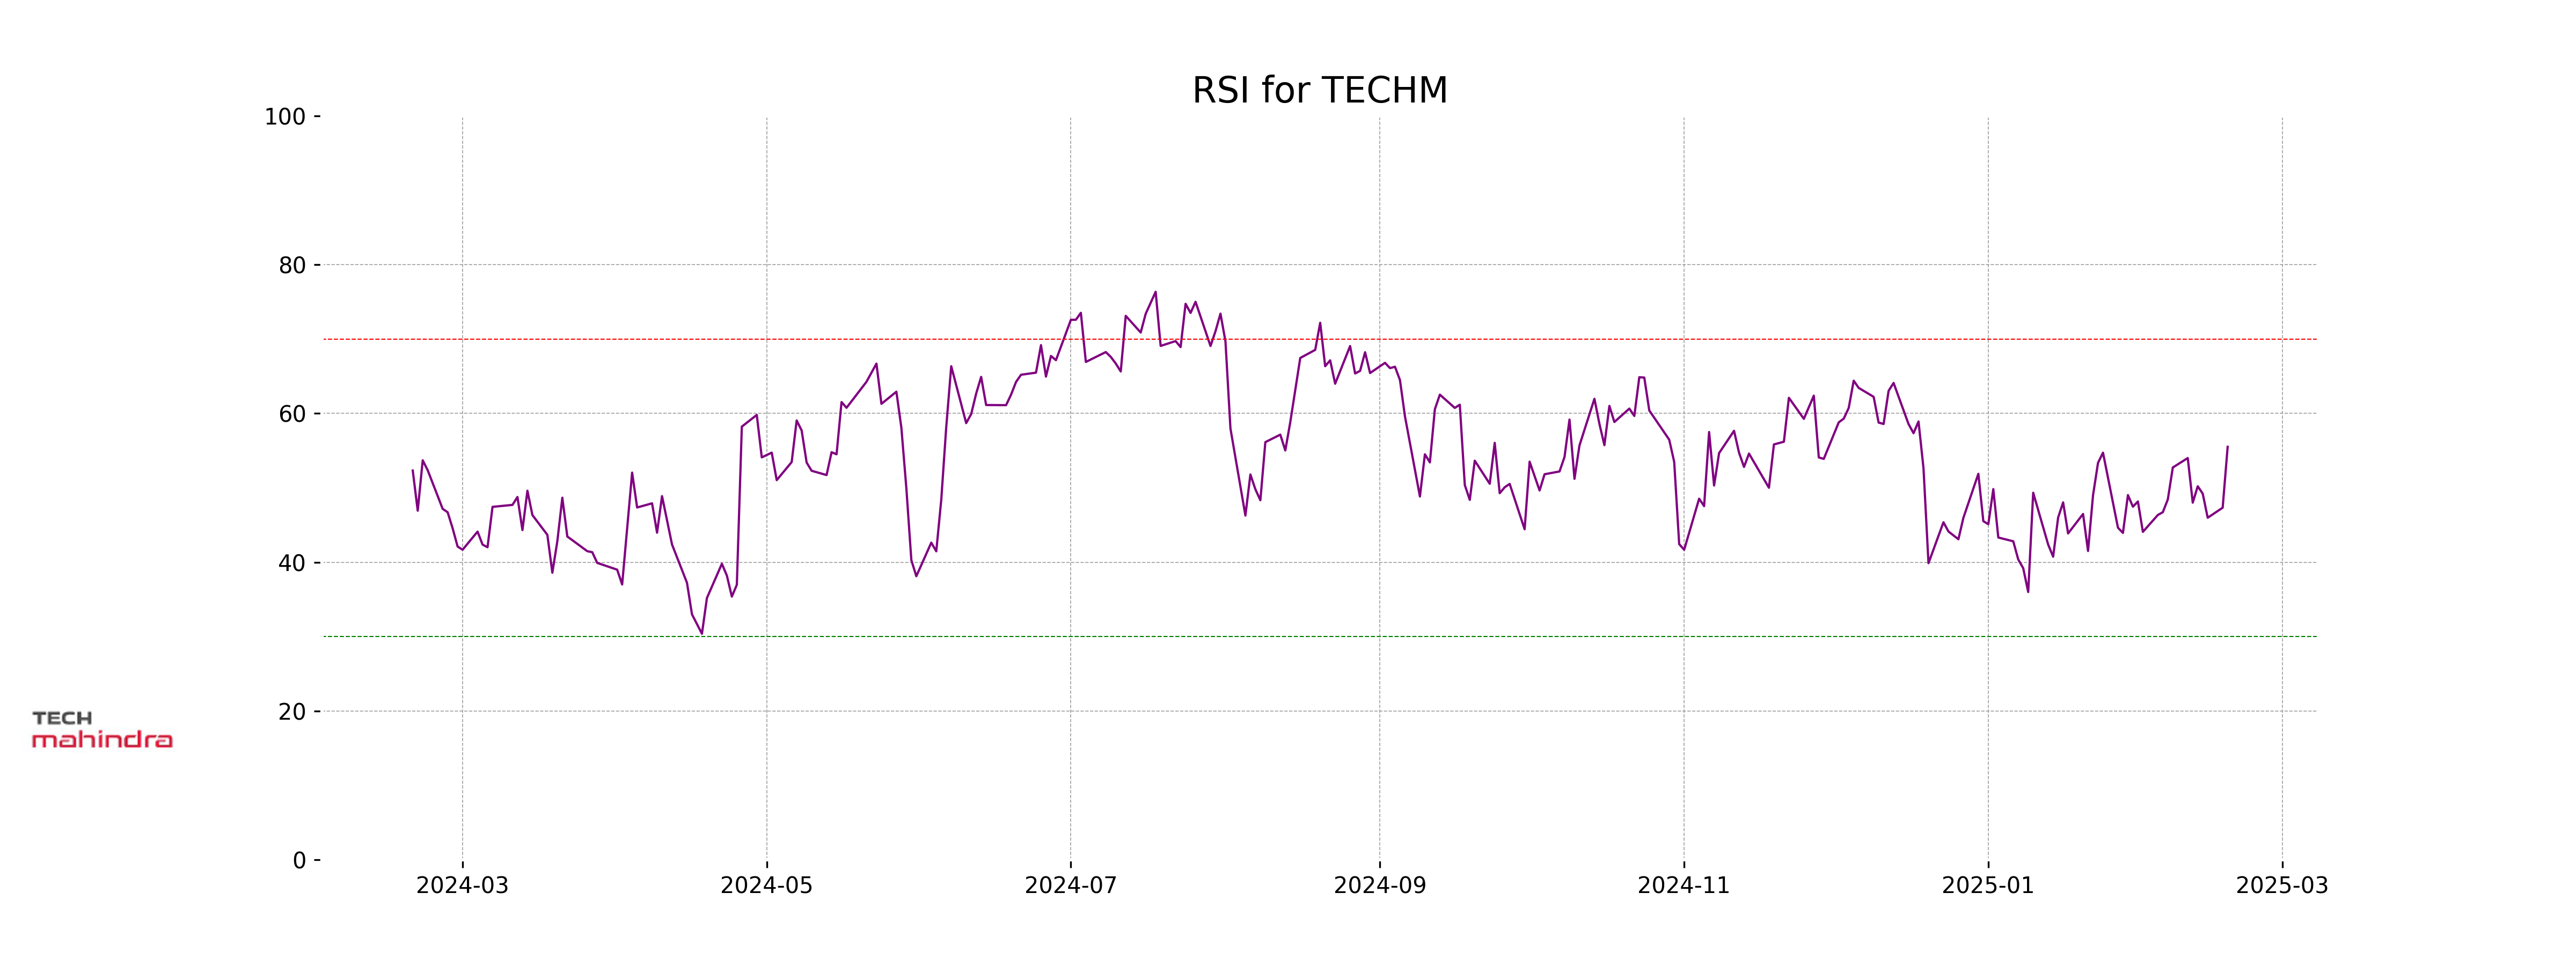
RSI Analysis
Tech Mahindra's RSI is at 55.51, which indicates a neutral position. This suggests that the stock is neither overbought nor oversold, reflecting a balanced level of buying and selling momentum.
Analysis for Wipro - February 18, 2025
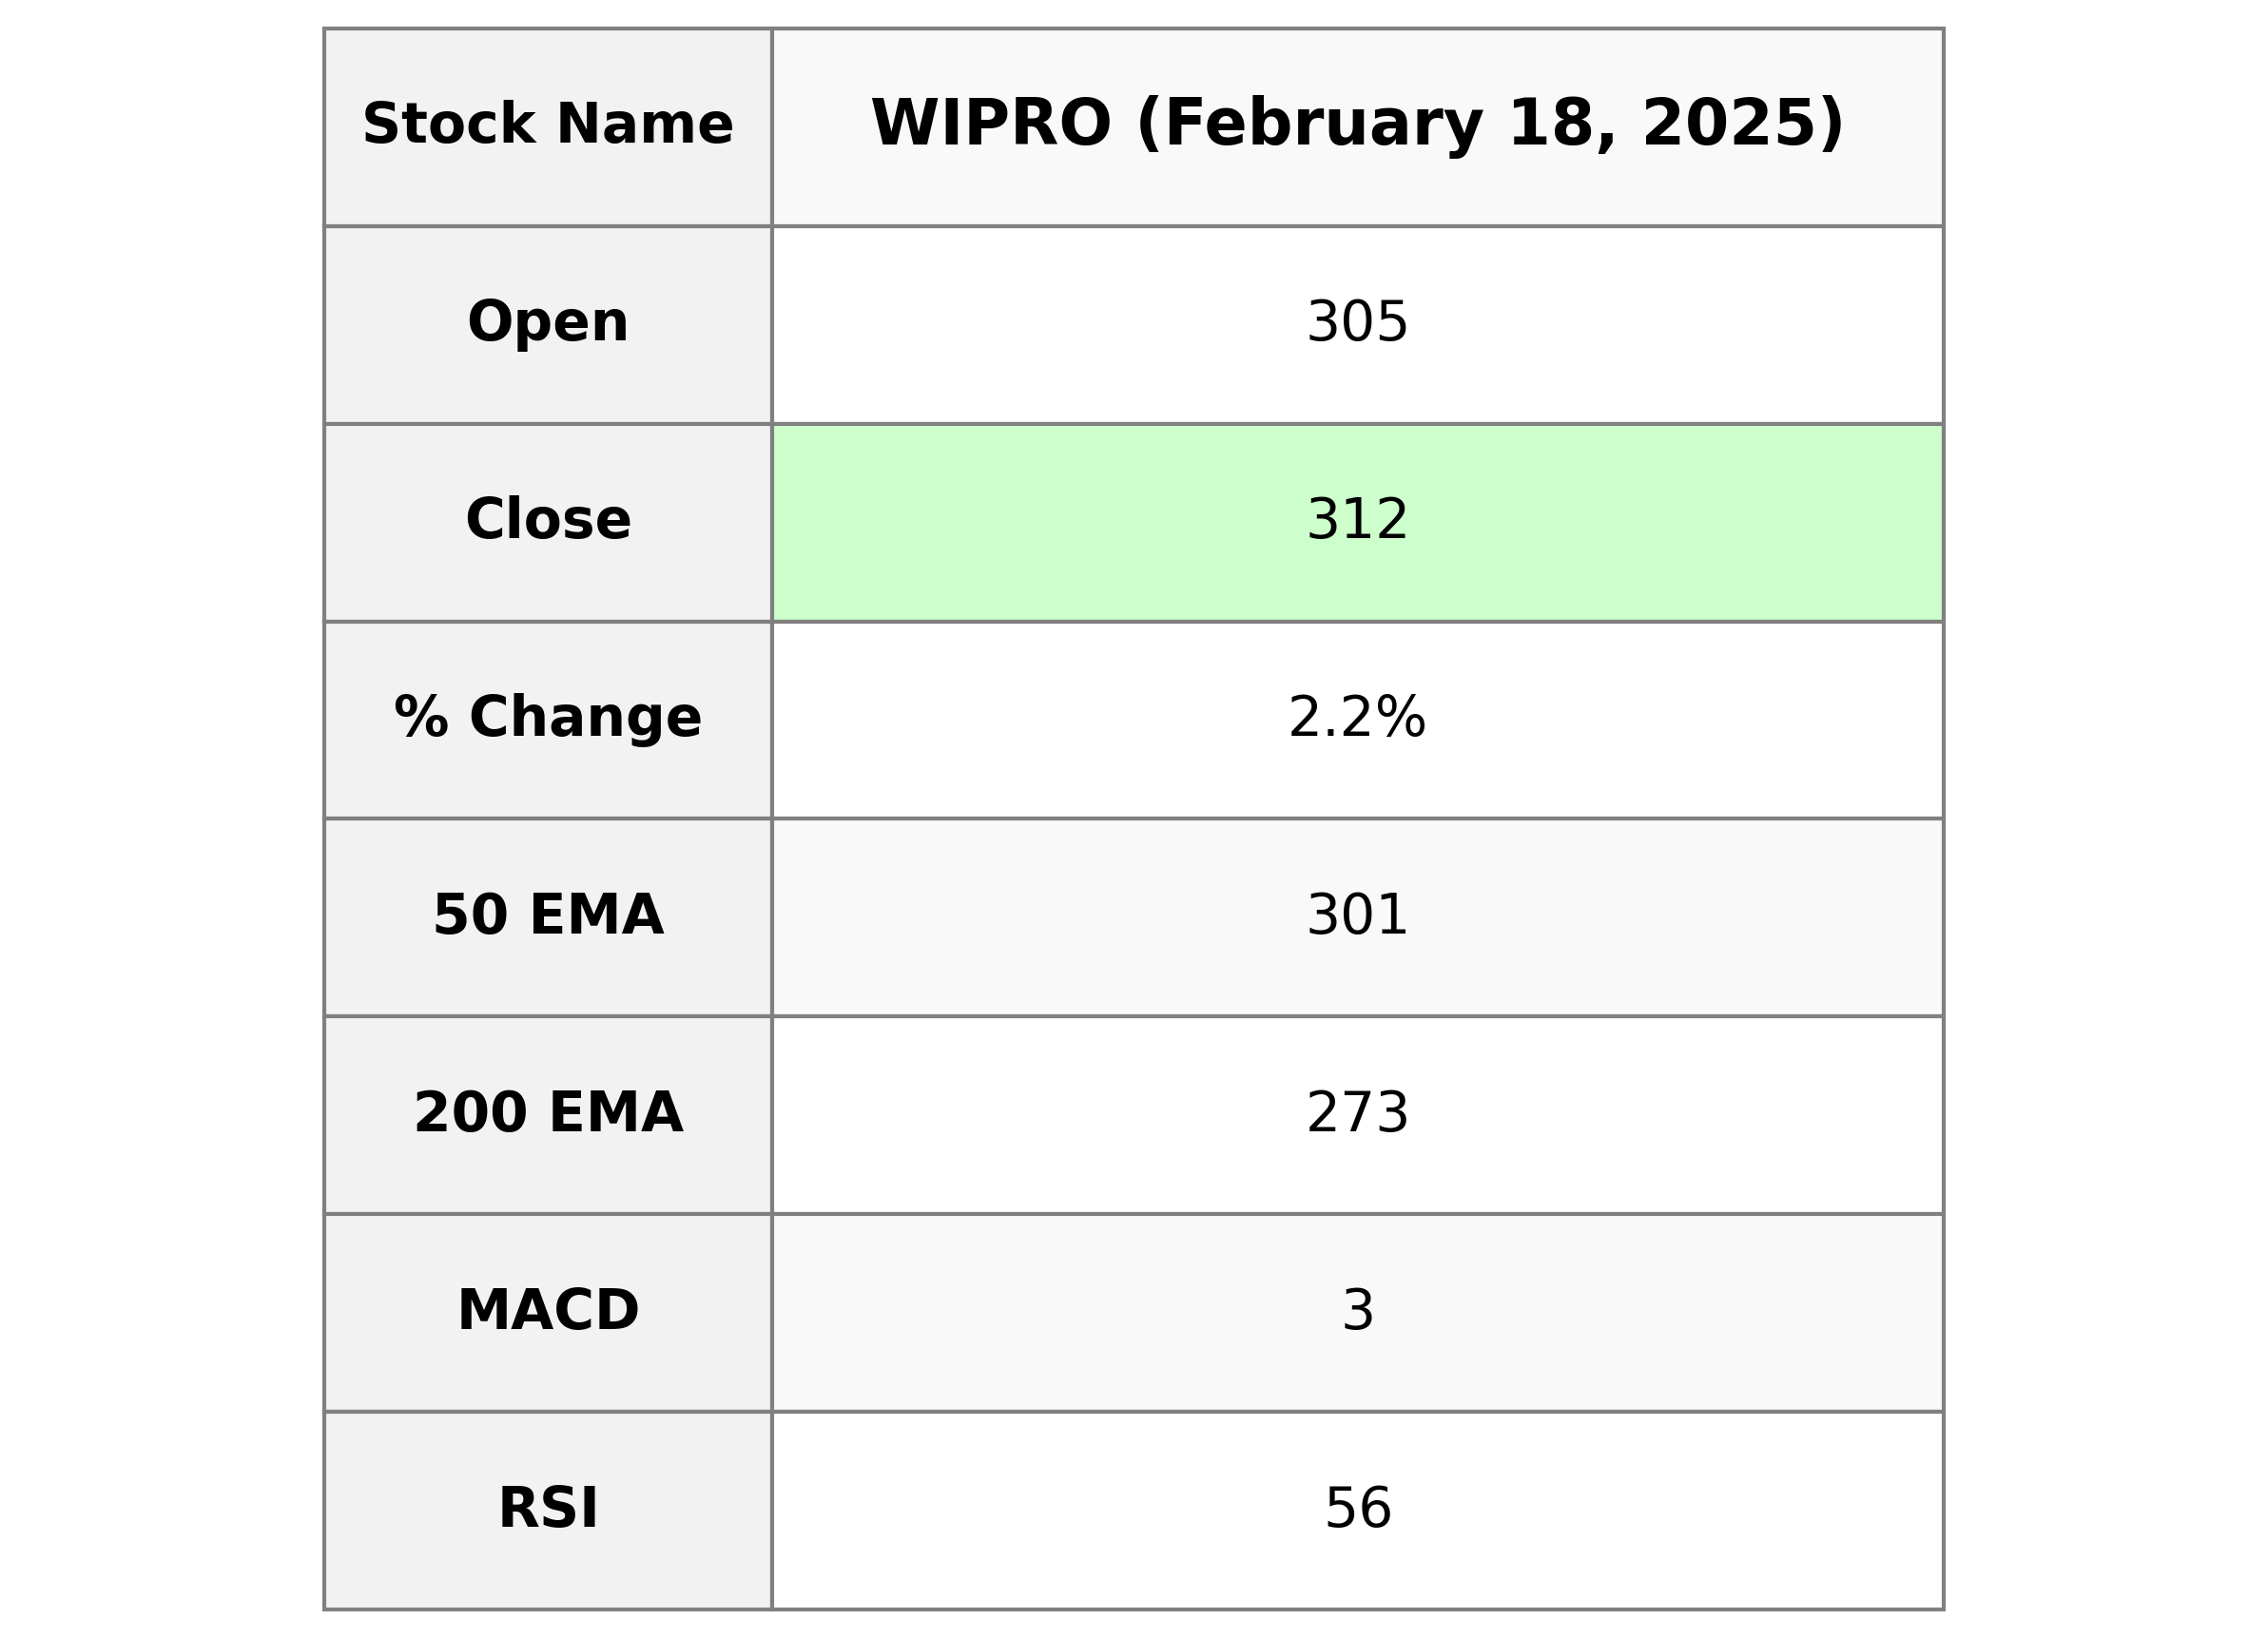
Wipro Performance Description: Wipro experienced a positive trading session, with its stock closing at 312.20, reflecting a 2.24% rise from the previous close of 305.35. The trading volume reached over 10.3 million shares. Notably, Wipro's market cap is impressively 3.27 trillion INR, indicating its notable presence in the Technology sector in India.
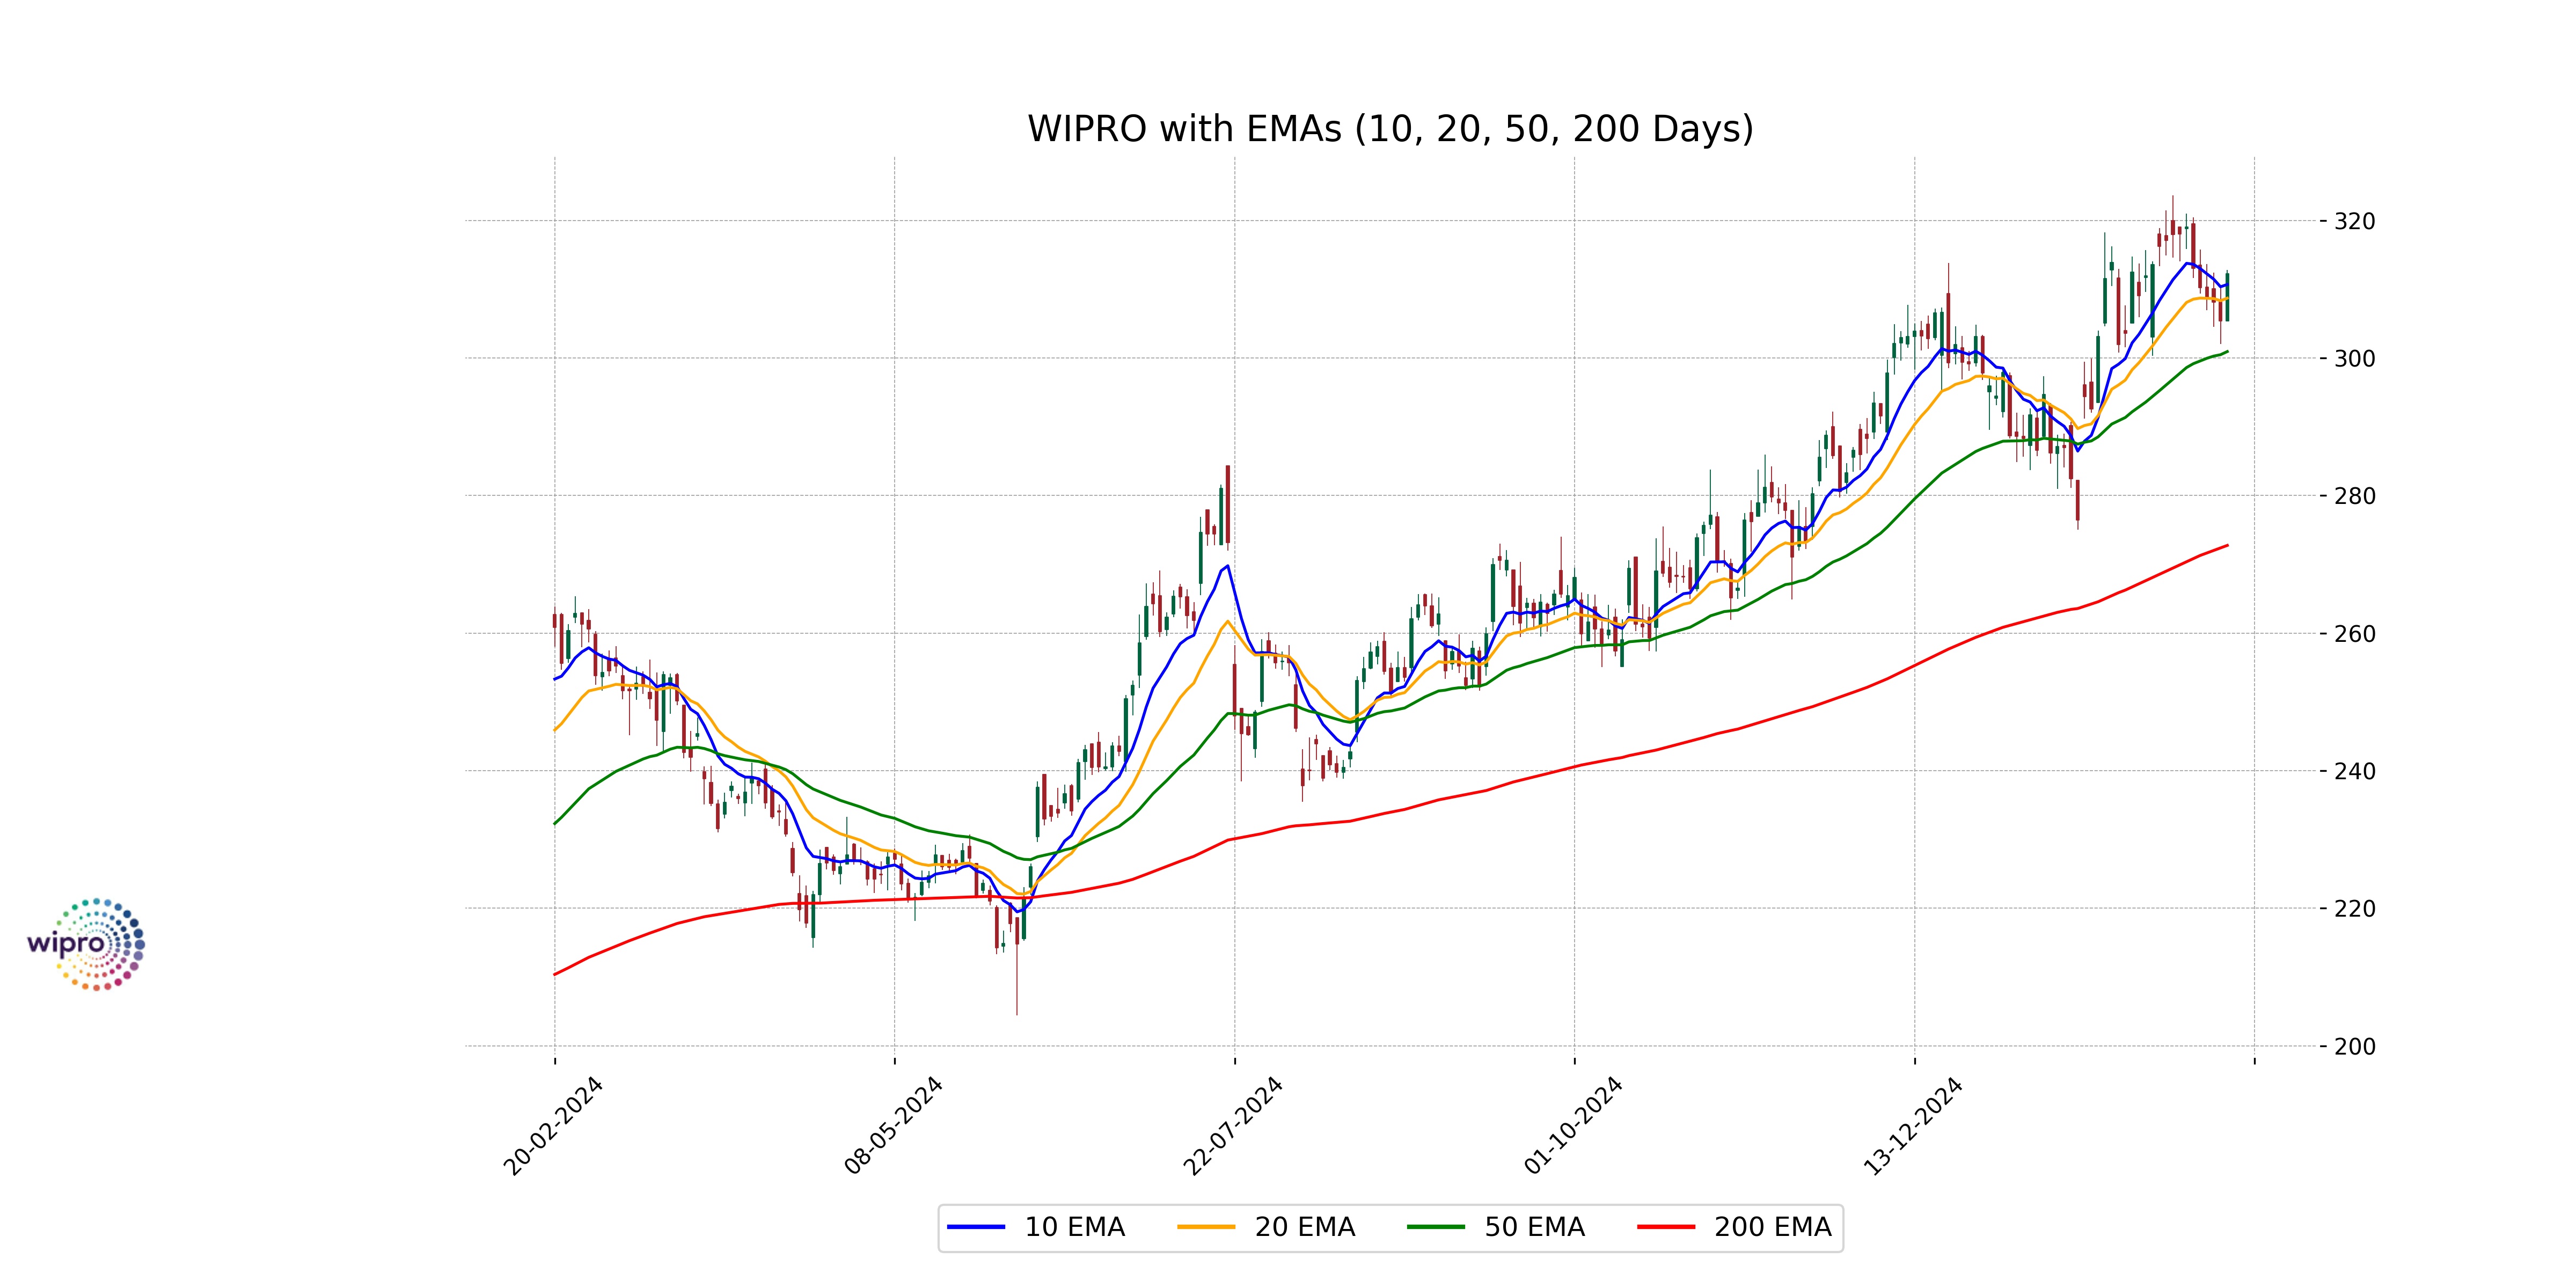
Relationship with Key Moving Averages
Wipro's current close price of 312.20 is above its 50-day EMA of 300.92 and significantly above the 200-day EMA of 272.74, indicating a bullish trend. Additionally, it is slightly above the 10-day EMA of 310.67 and the 20-day EMA of 308.68, further supporting a short-term upward momentum.
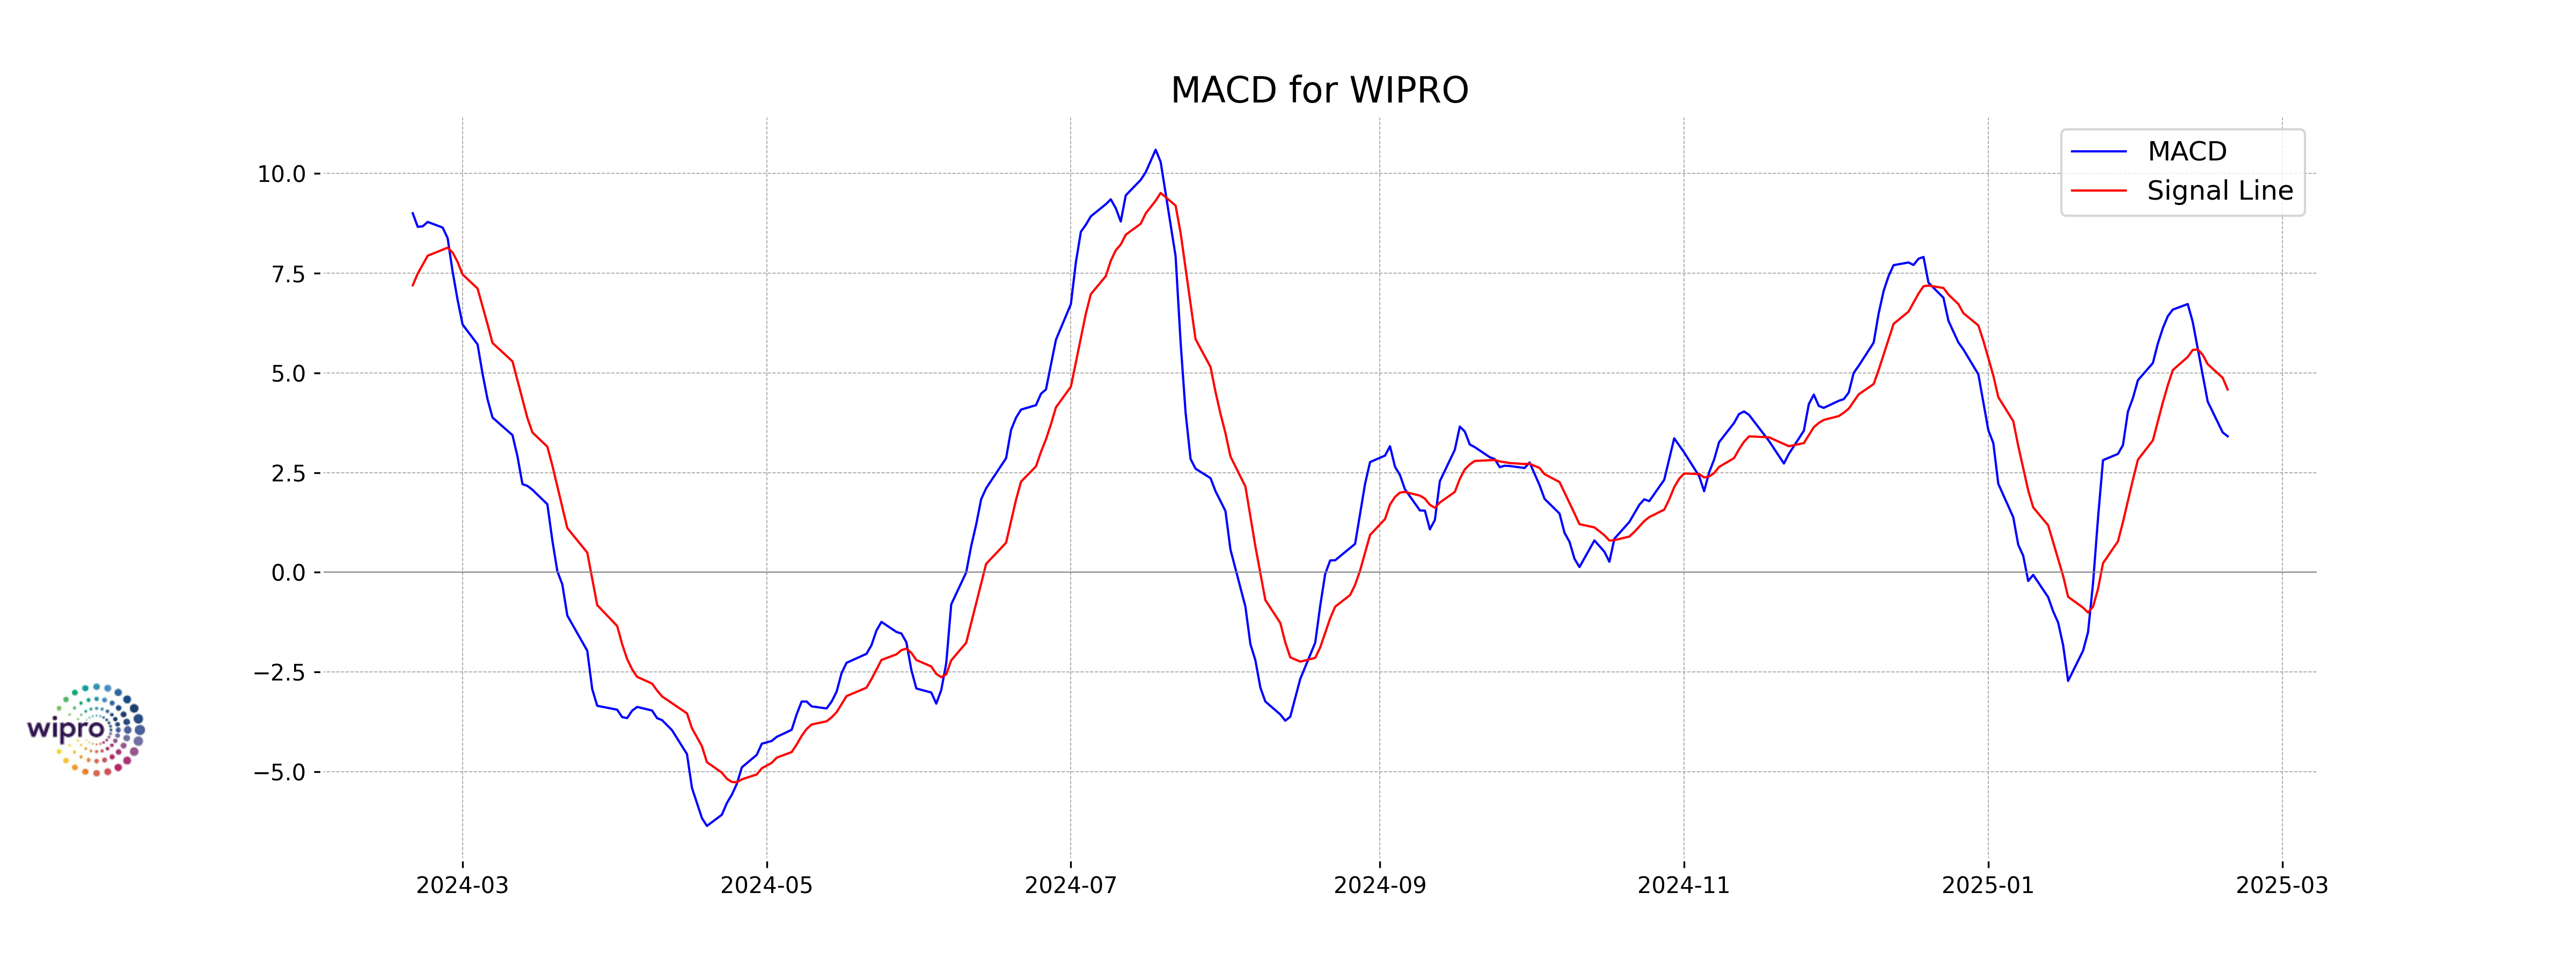
Moving Averages Trend (MACD)
Wipro's MACD value is 3.41 while the MACD Signal is 4.58. A MACD lower than the signal line suggests a potential bearish trend, indicating that recent trading momentum may start to decline. However, other indicators should also be considered for a comprehensive analysis.
RSI Analysis
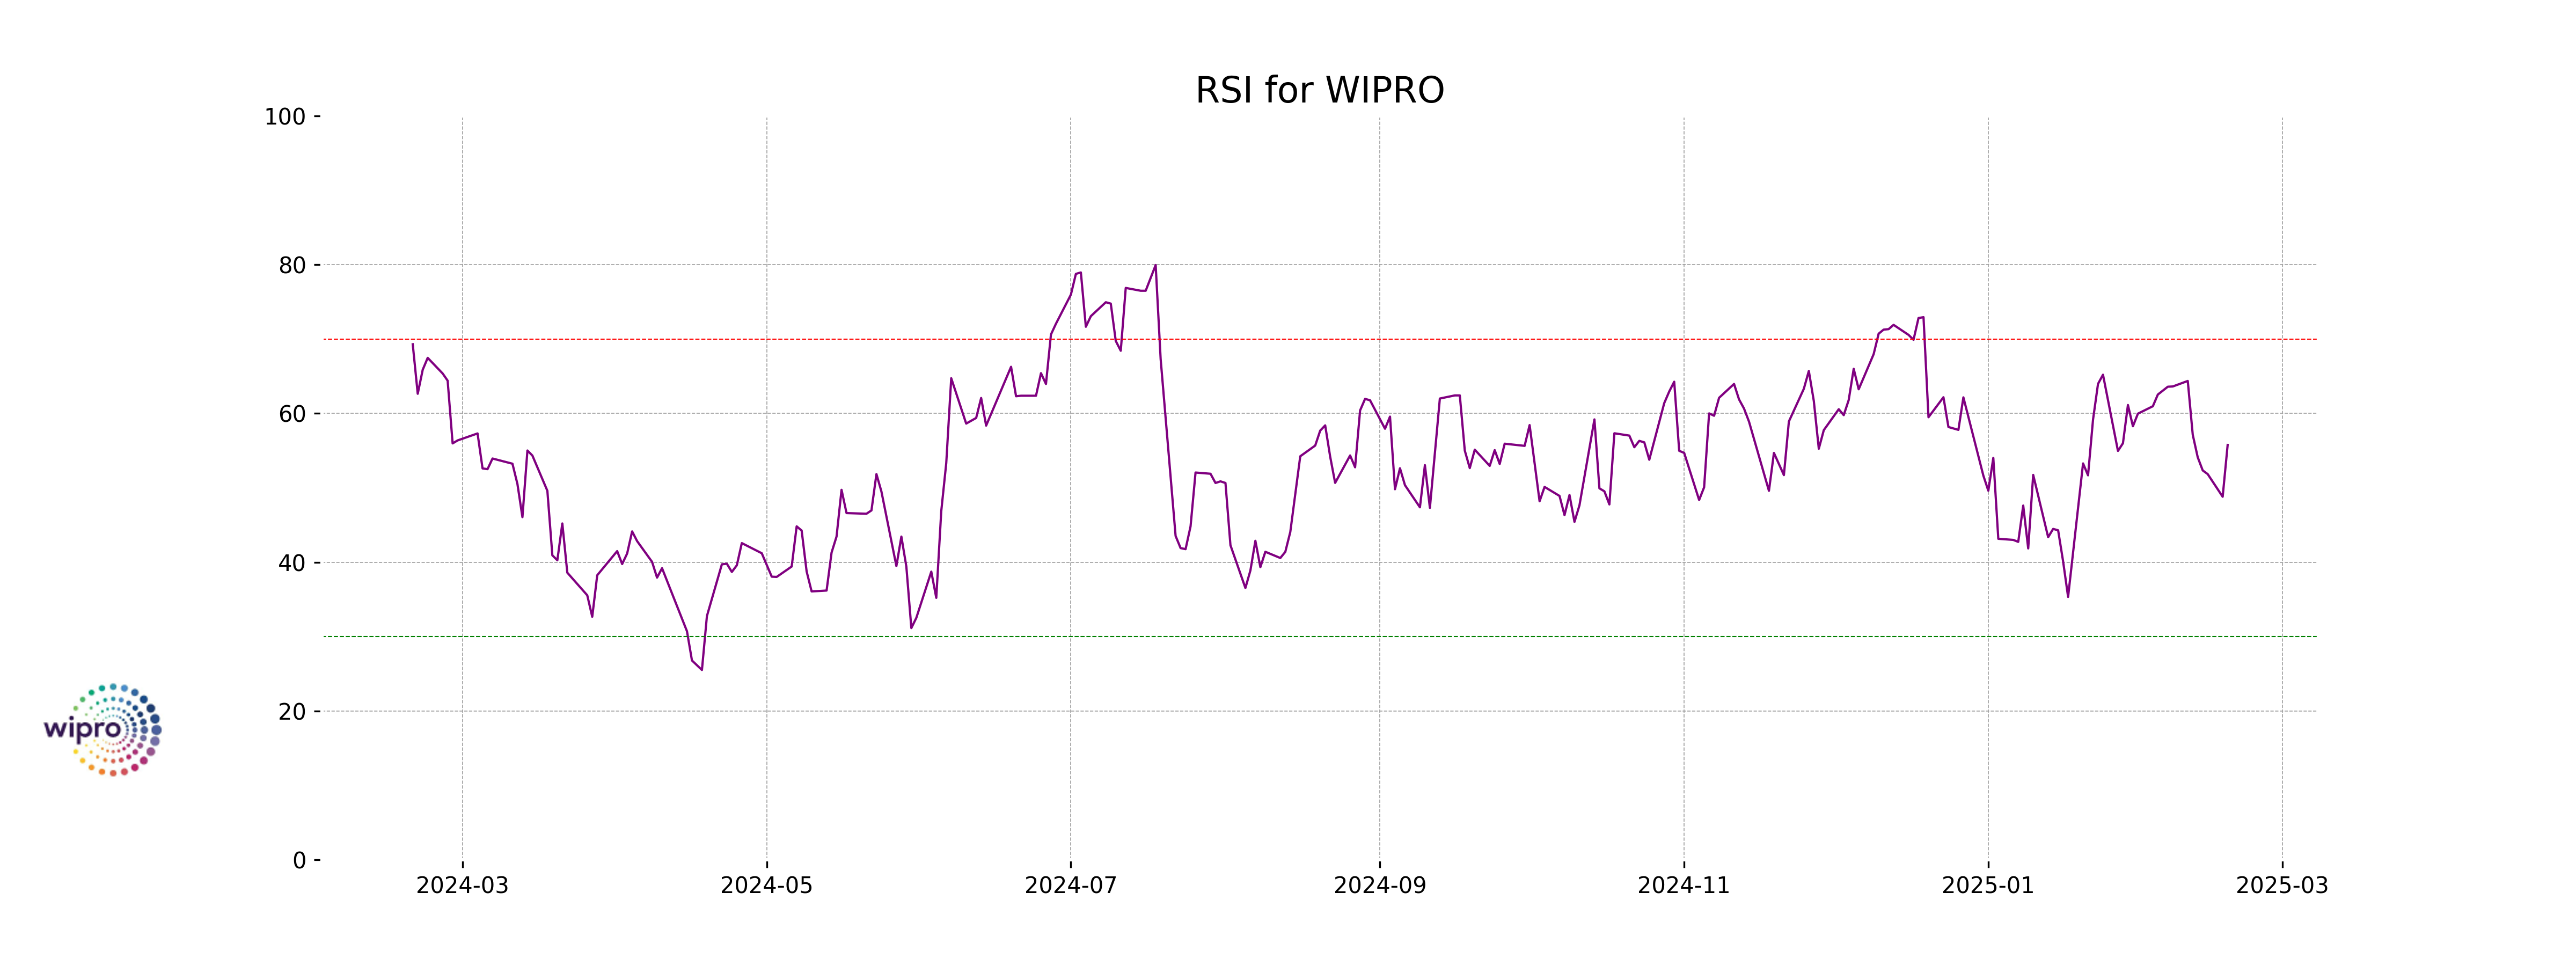
Wipro's RSI of 55.77 suggests that the stock is neither overbought nor oversold, indicating a relatively balanced market condition. The RSI is a momentum indicator that ranges from 0 to 100, and a value near 55 points to neutral momentum. Traders may interpret this RSI level to suggest potential for continued steady price movement.