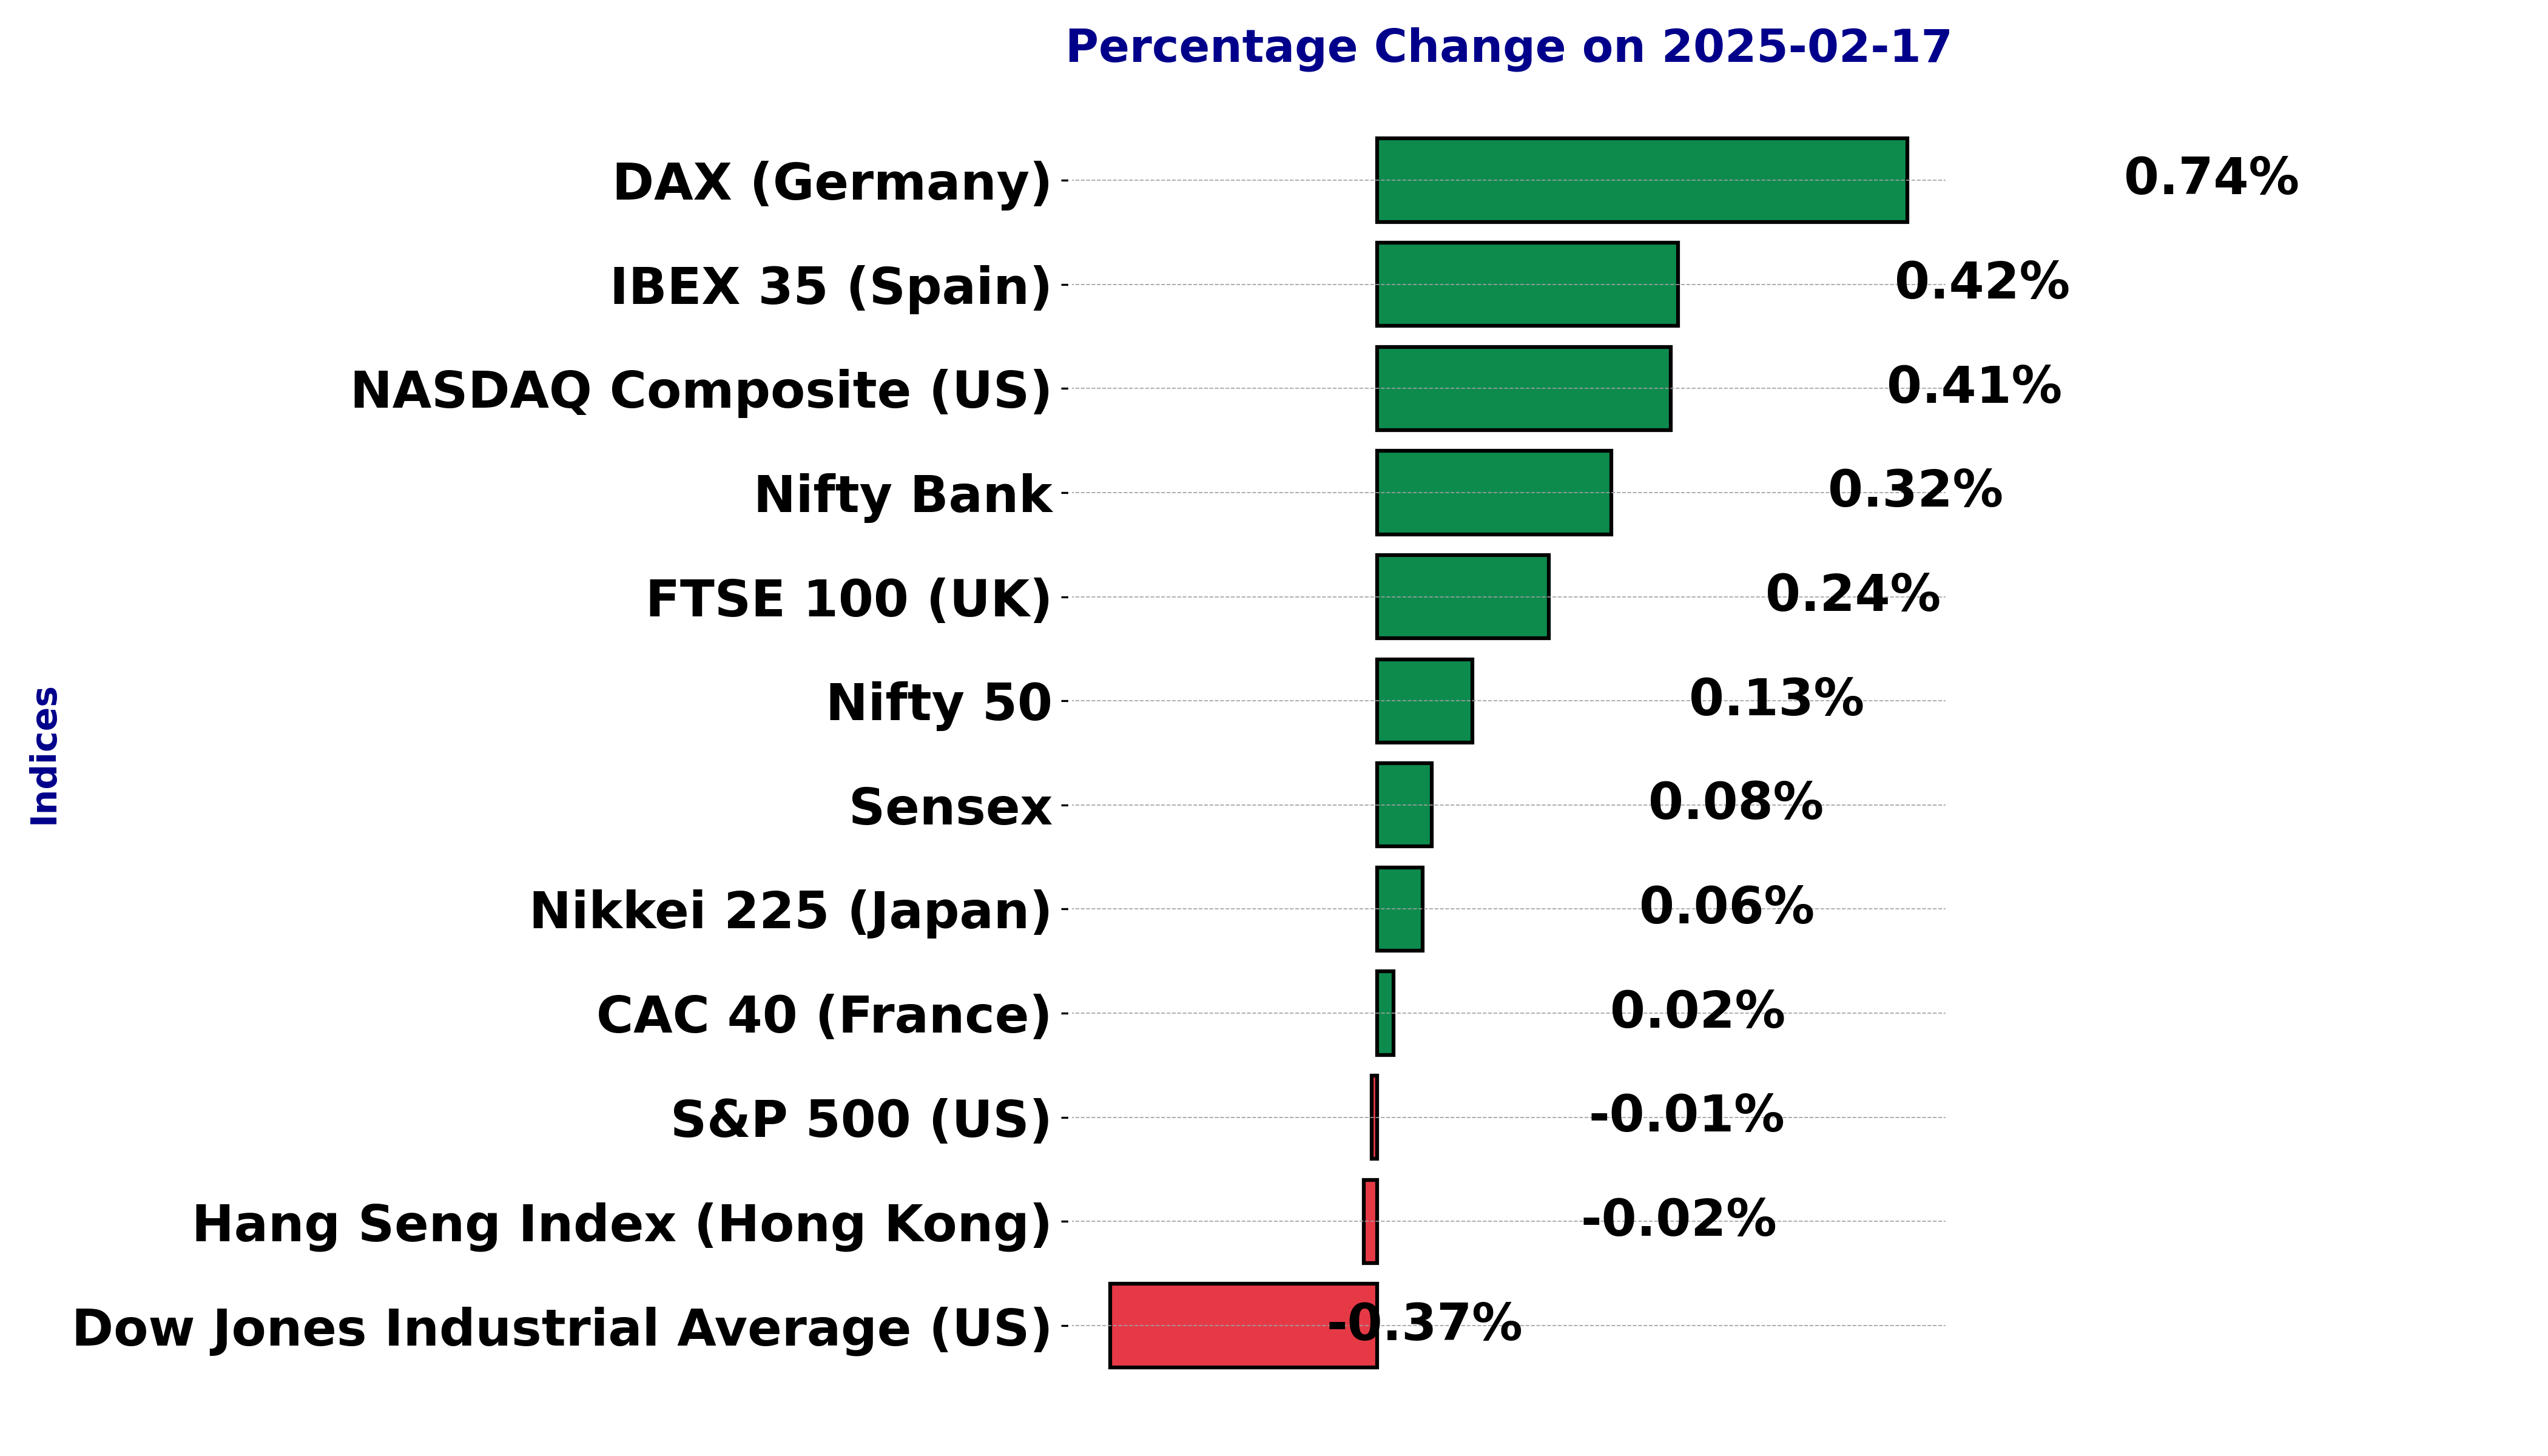
Global stock market indices: How the world markets performed today - 17 February 2025
The international stock market indices showed varied performances on February 17, 2025, reflecting the economic sentiment across different regions.
In this article, we analyze the performance of key global indices including the S&P 500, Dow Jones Industrial Average, NASDAQ Composite, FTSE 100, DAX, CAC 40, IBEX 35, Nikkei 225, Hang Seng, Nifty 50, and BSE Sensex.
Analysis for Sensex - February 17, 2025
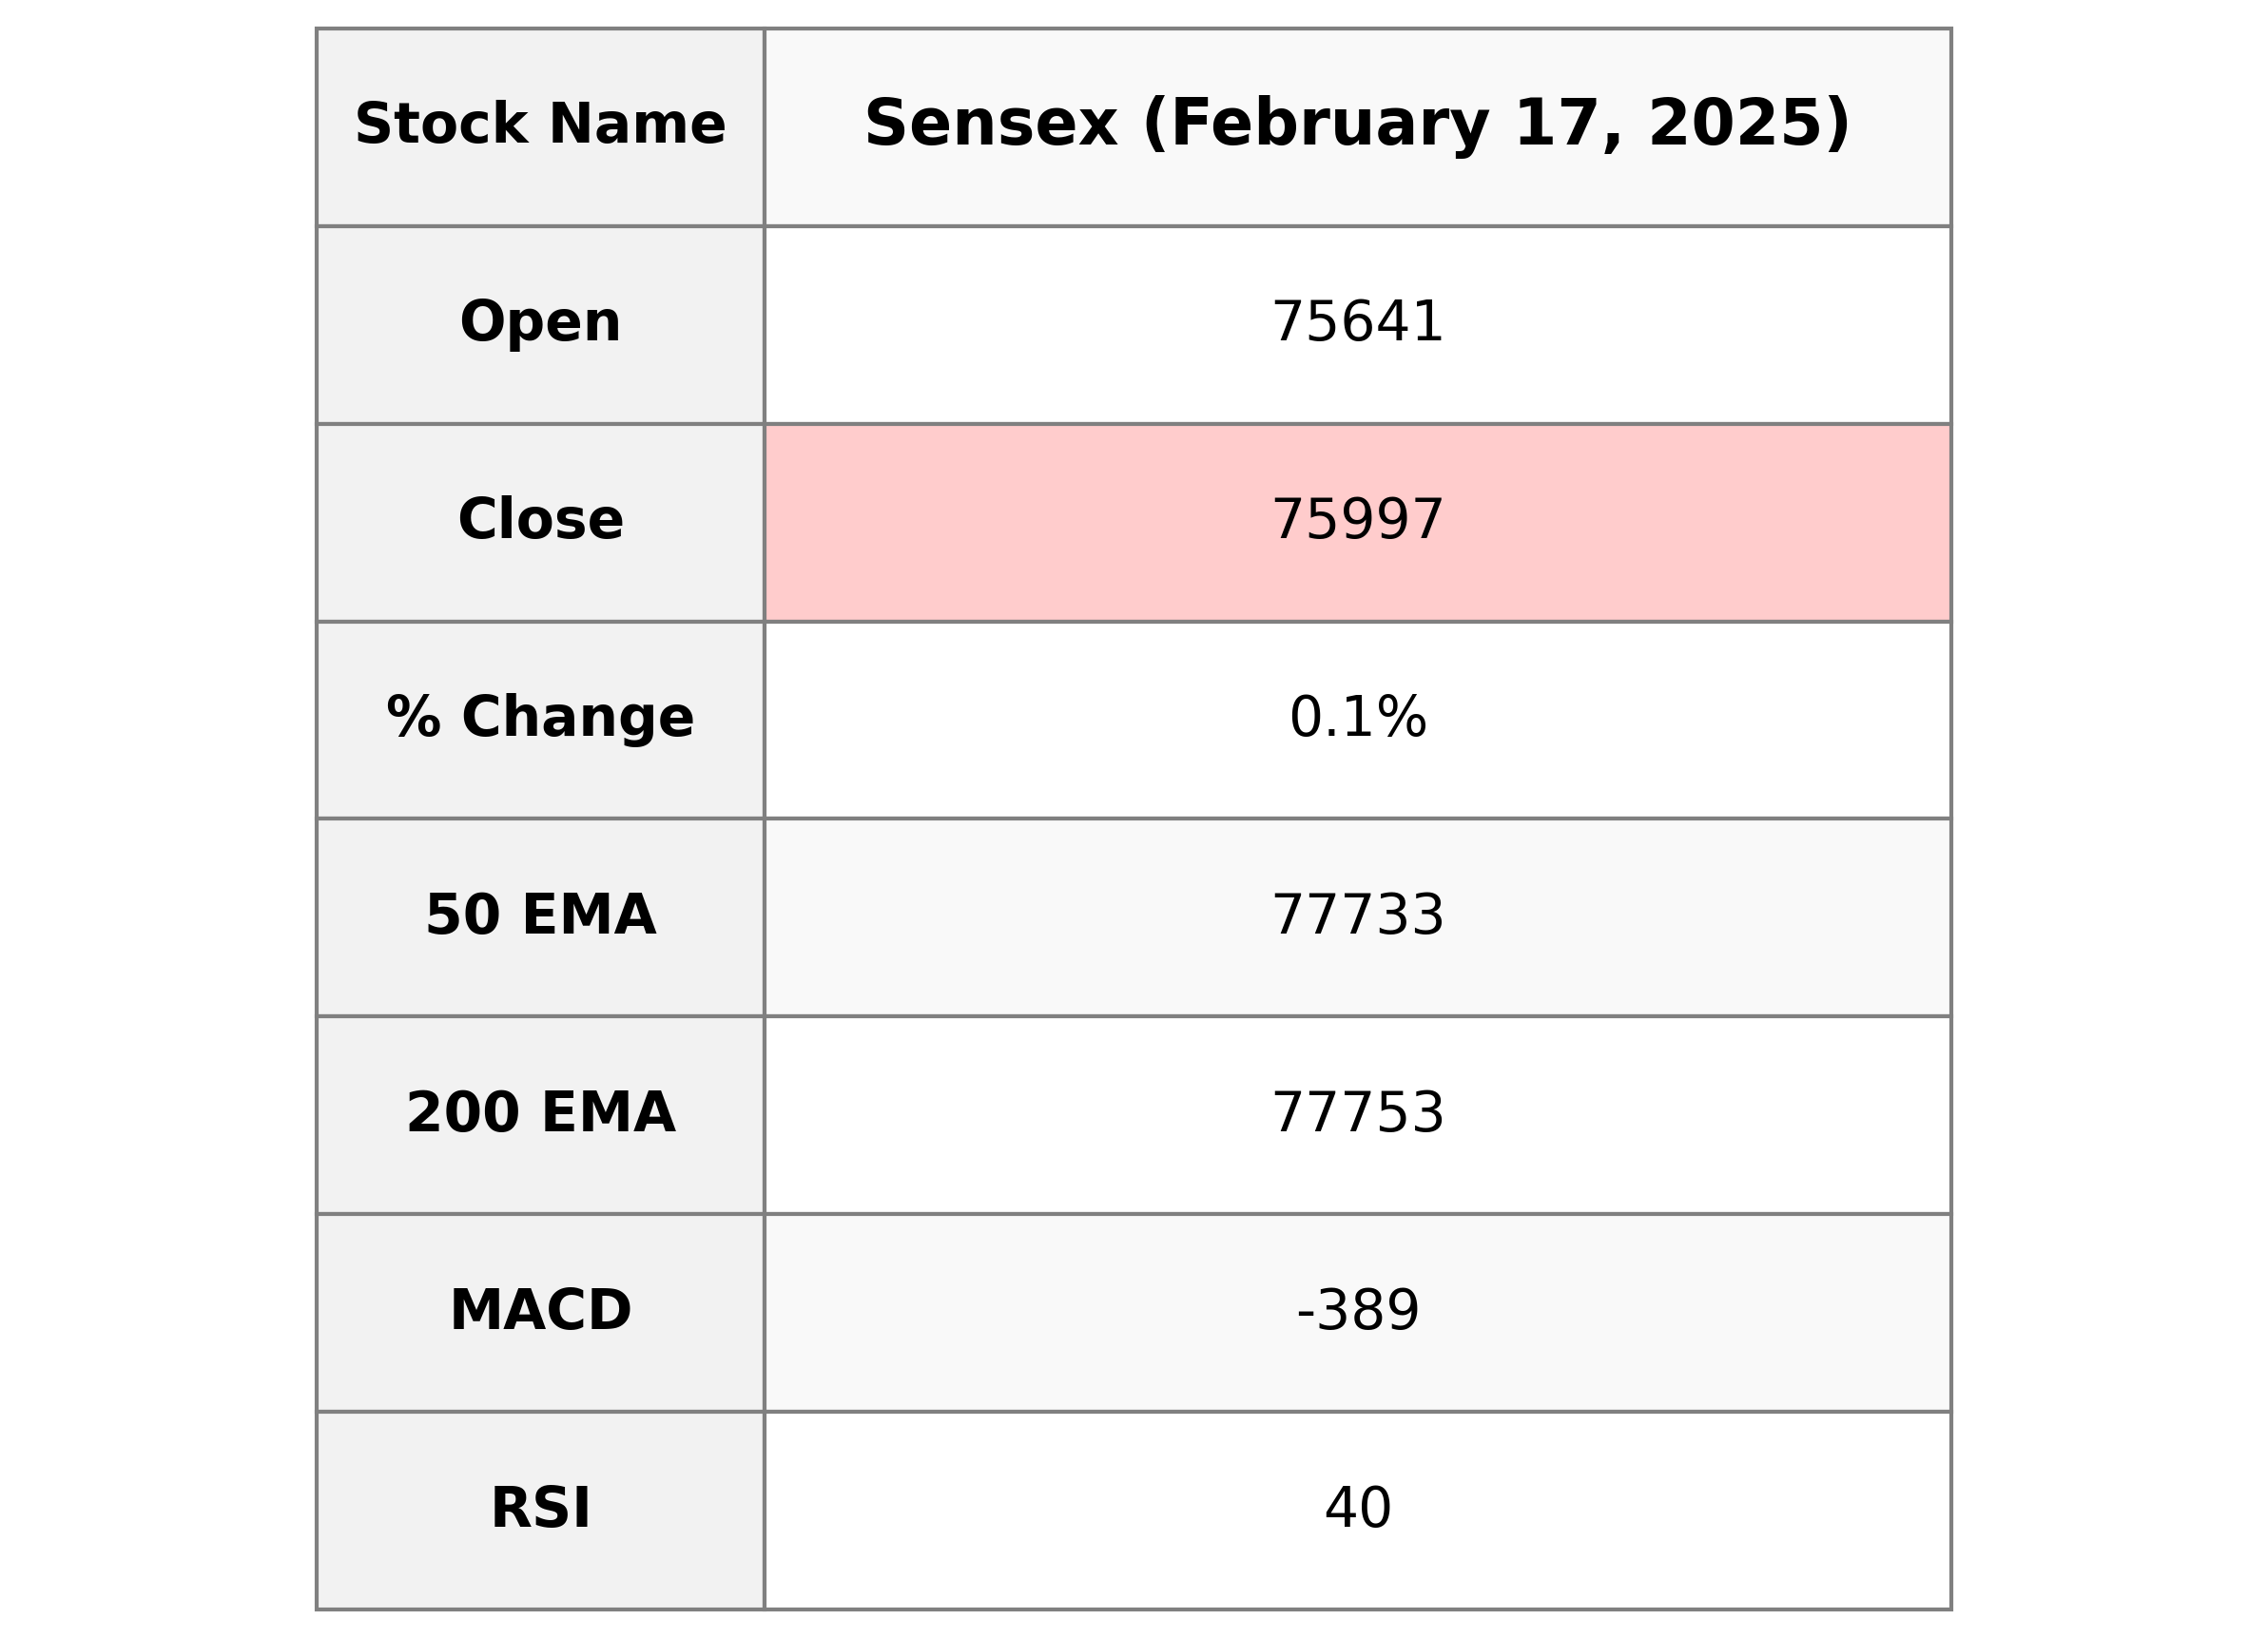
The Sensex opened at 75,641.41, reached a high of 76,041.96, and dipped to a low of 75,294.76 before closing at 75,996.86. The index saw a slight increase from the previous close with a percentage change of approximately 0.076% or 57.65 points. The RSI stands at 40.31, indicating that the market is in the lower side of the neutral range, while the MACD indicates bearish momentum.
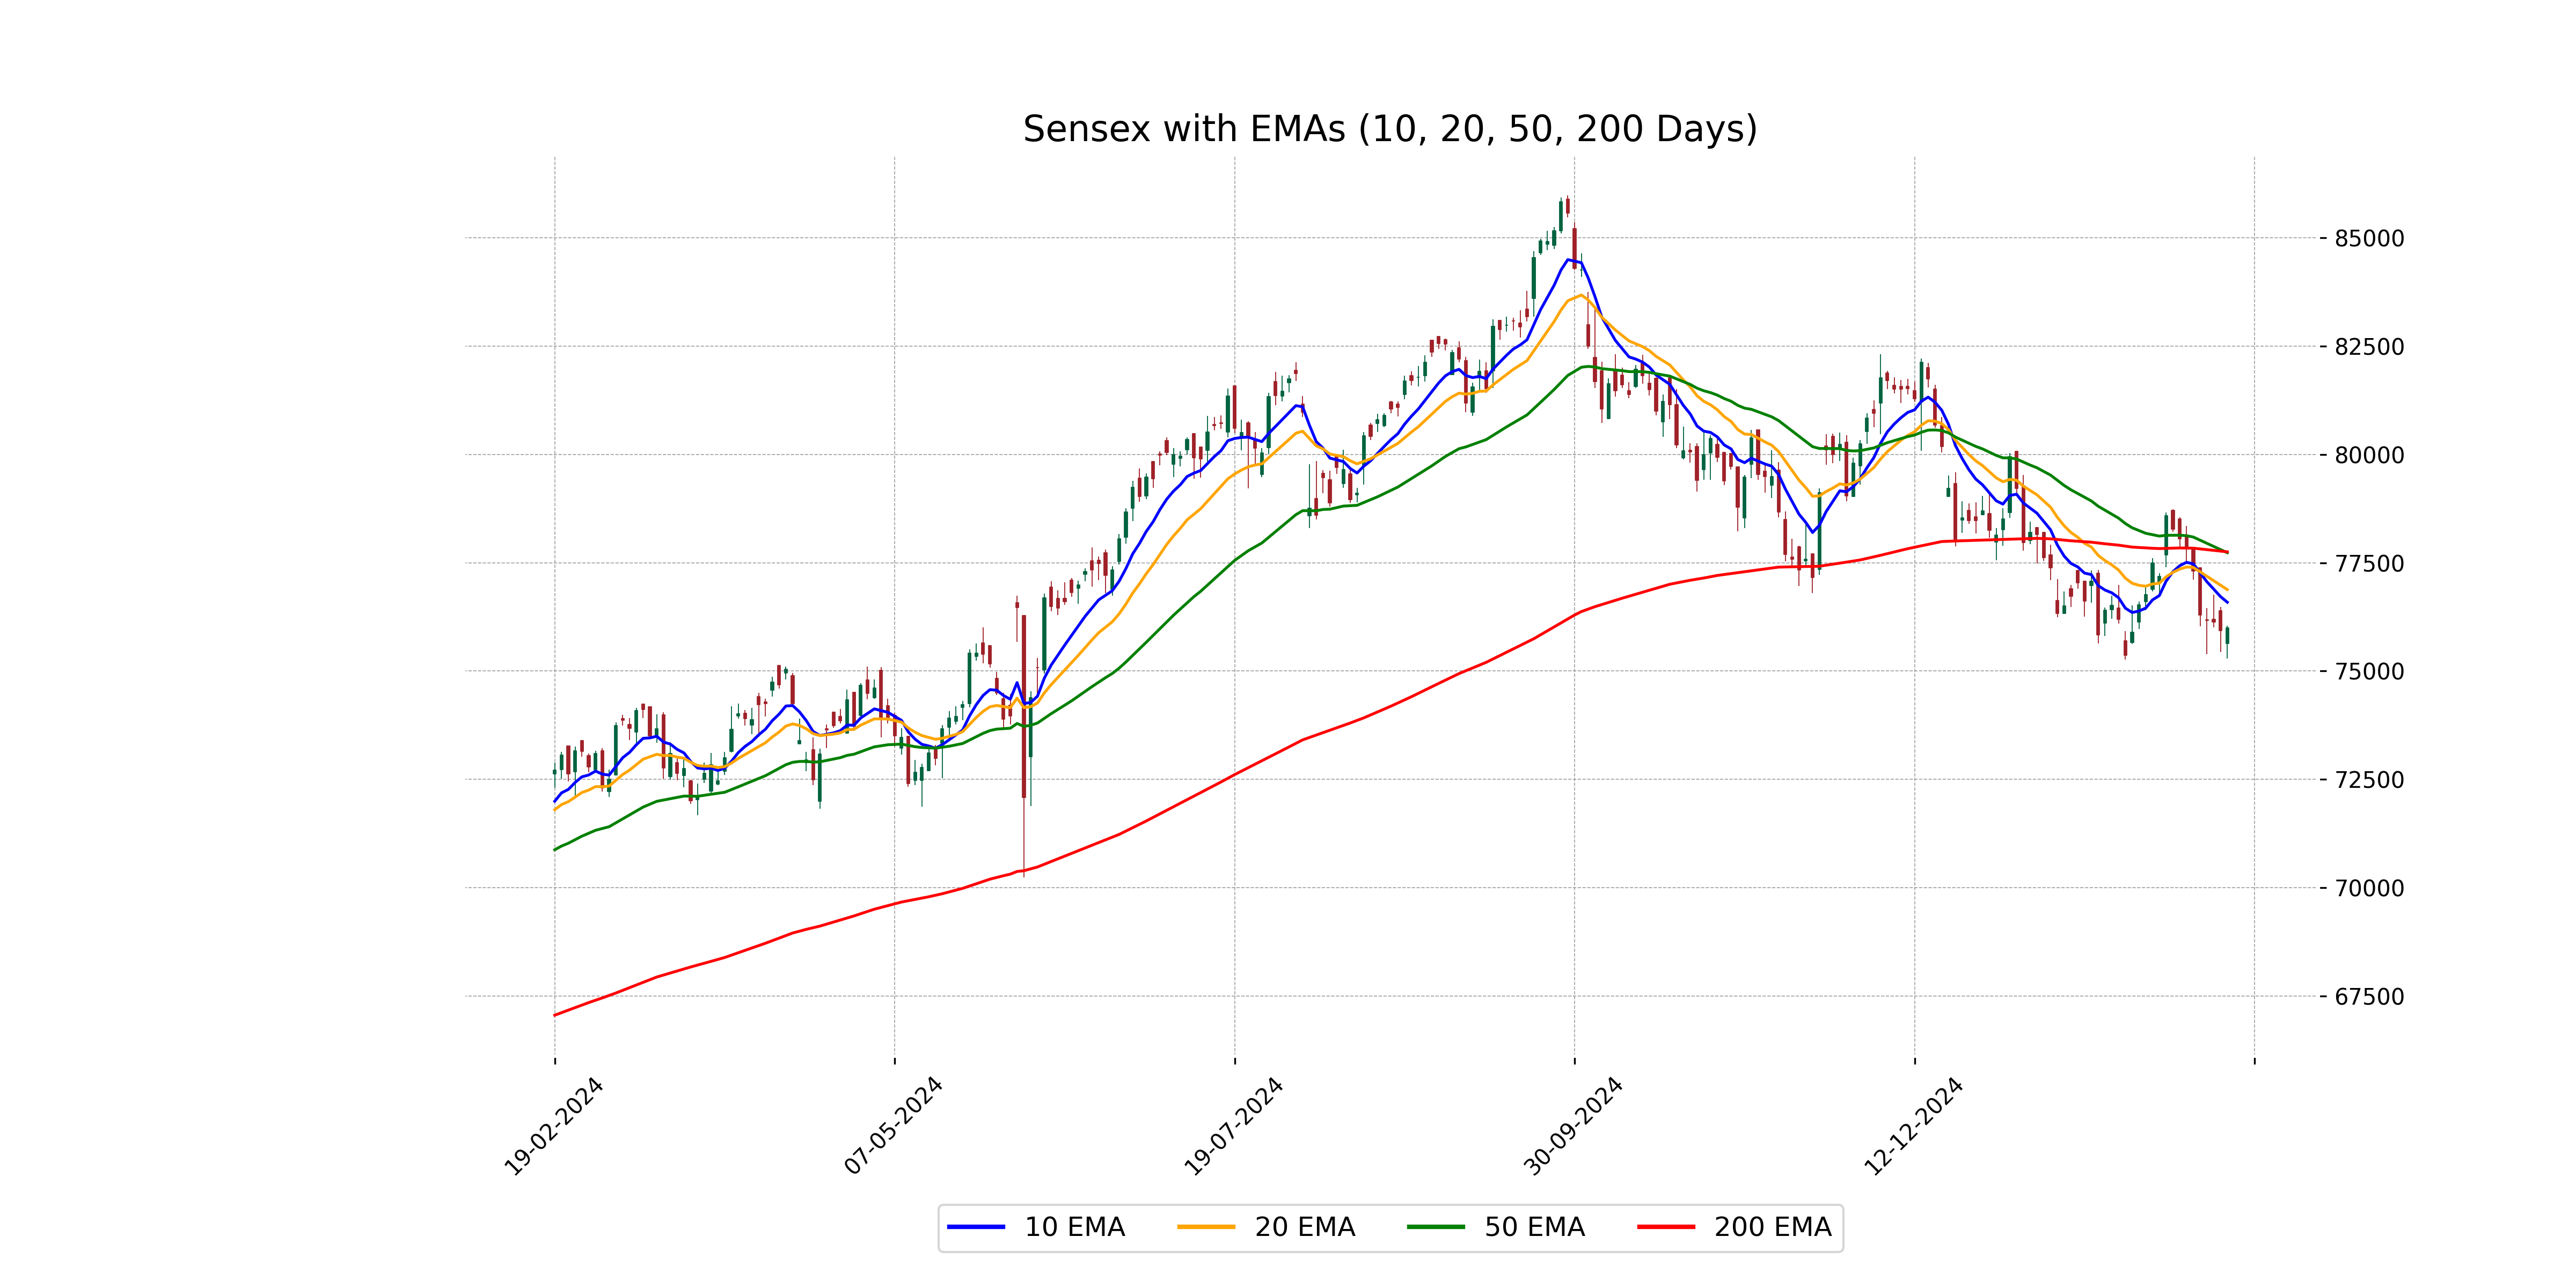
Relationship with Key Moving Averages
Sensex closed at 75,996.86, which is below its 50-day EMA of 77,732.96 and 200-day EMA of 77,753.09, indicating potential bearish momentum. The close is also below the 10-day EMA of 76,588.99 and 20-day EMA of 76,881.21, further suggesting short-term weakness.
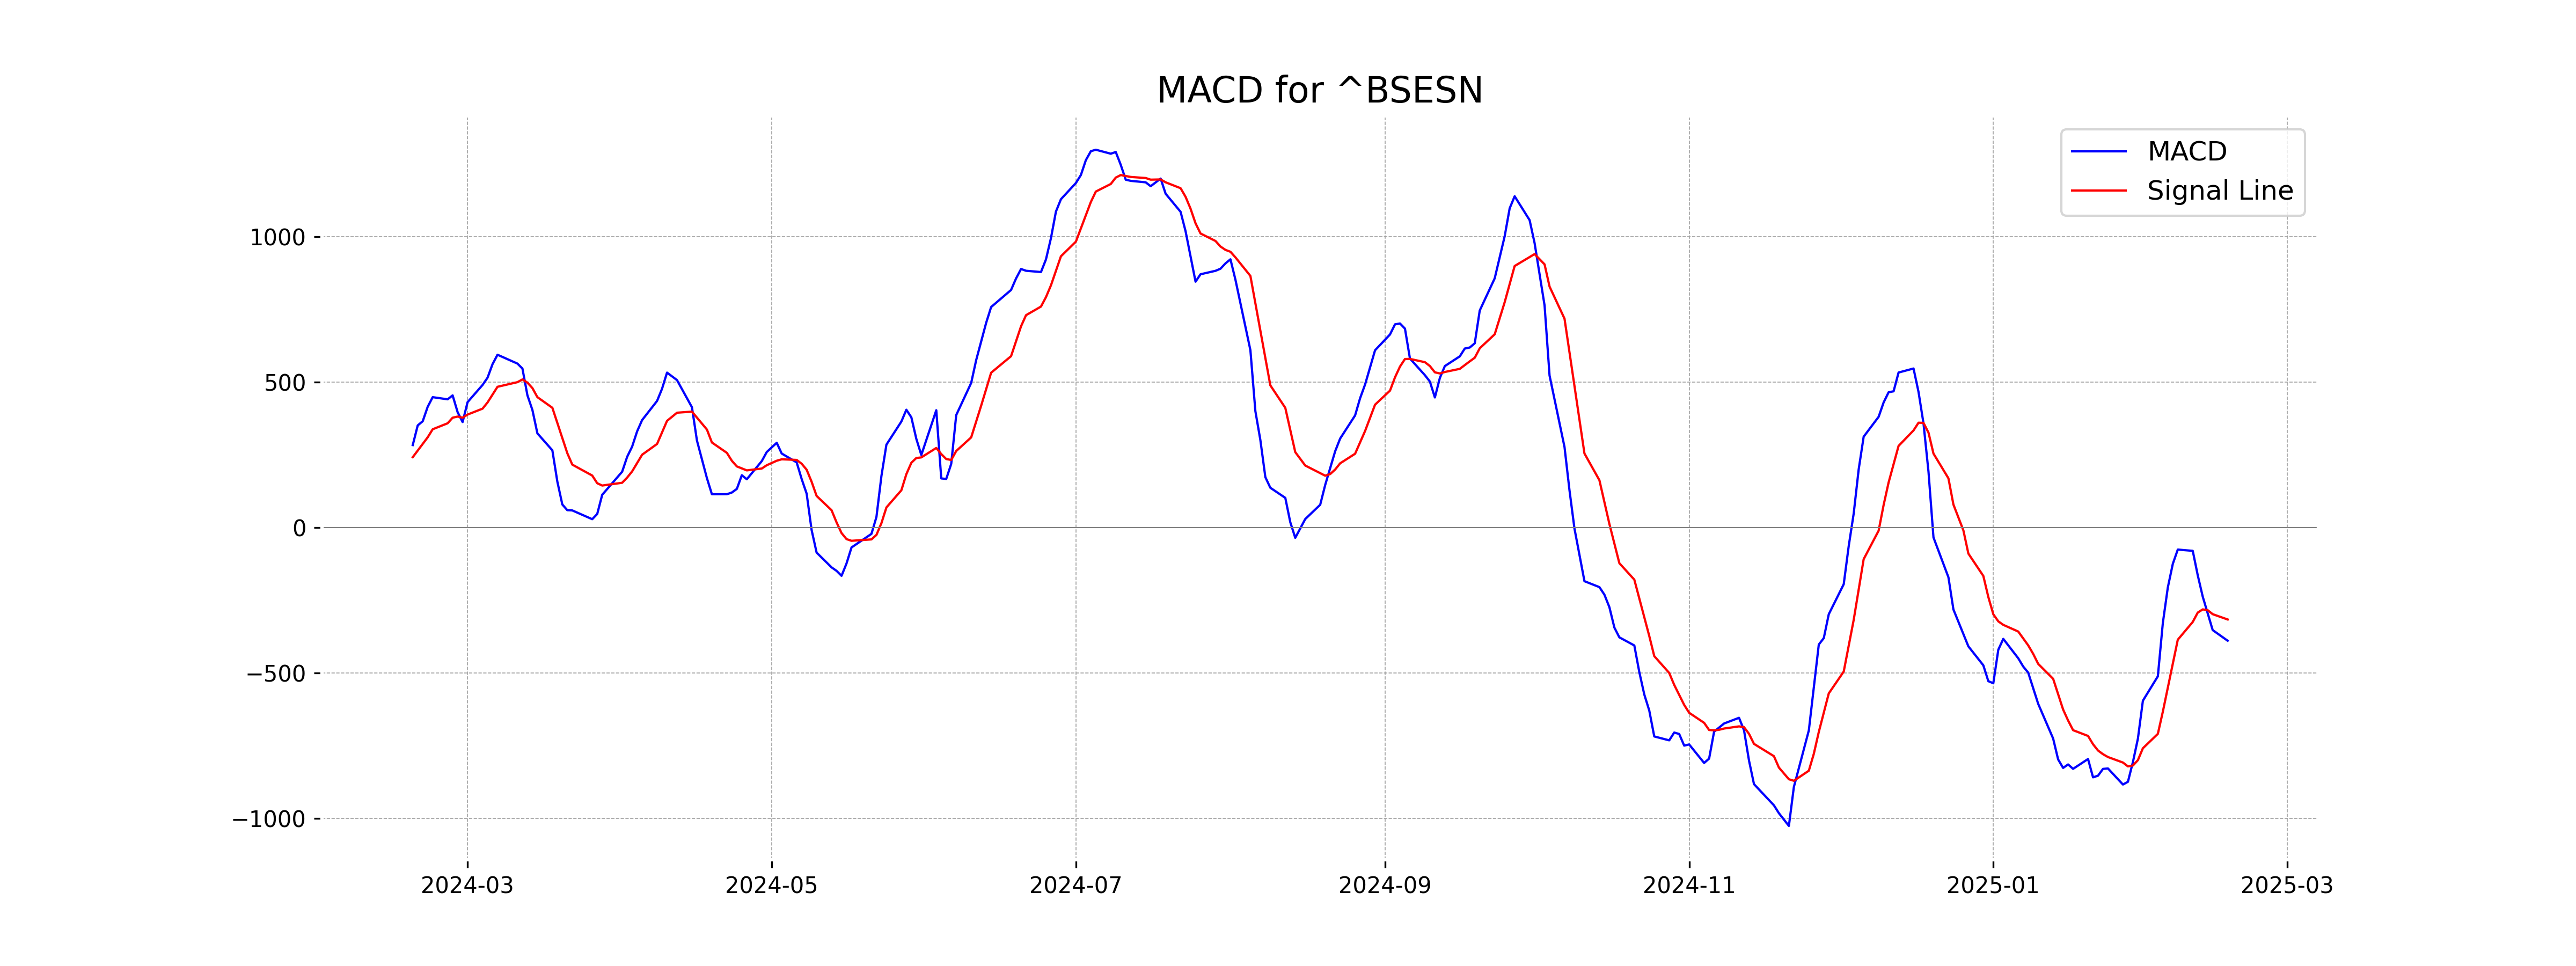
Moving Averages Trend (MACD)
The MACD value for Sensex is -389.03, which is below the MACD Signal line at -316.05. This indicates a bearish momentum in the market, suggesting that the downtrend may continue unless there is a significant change in market conditions.
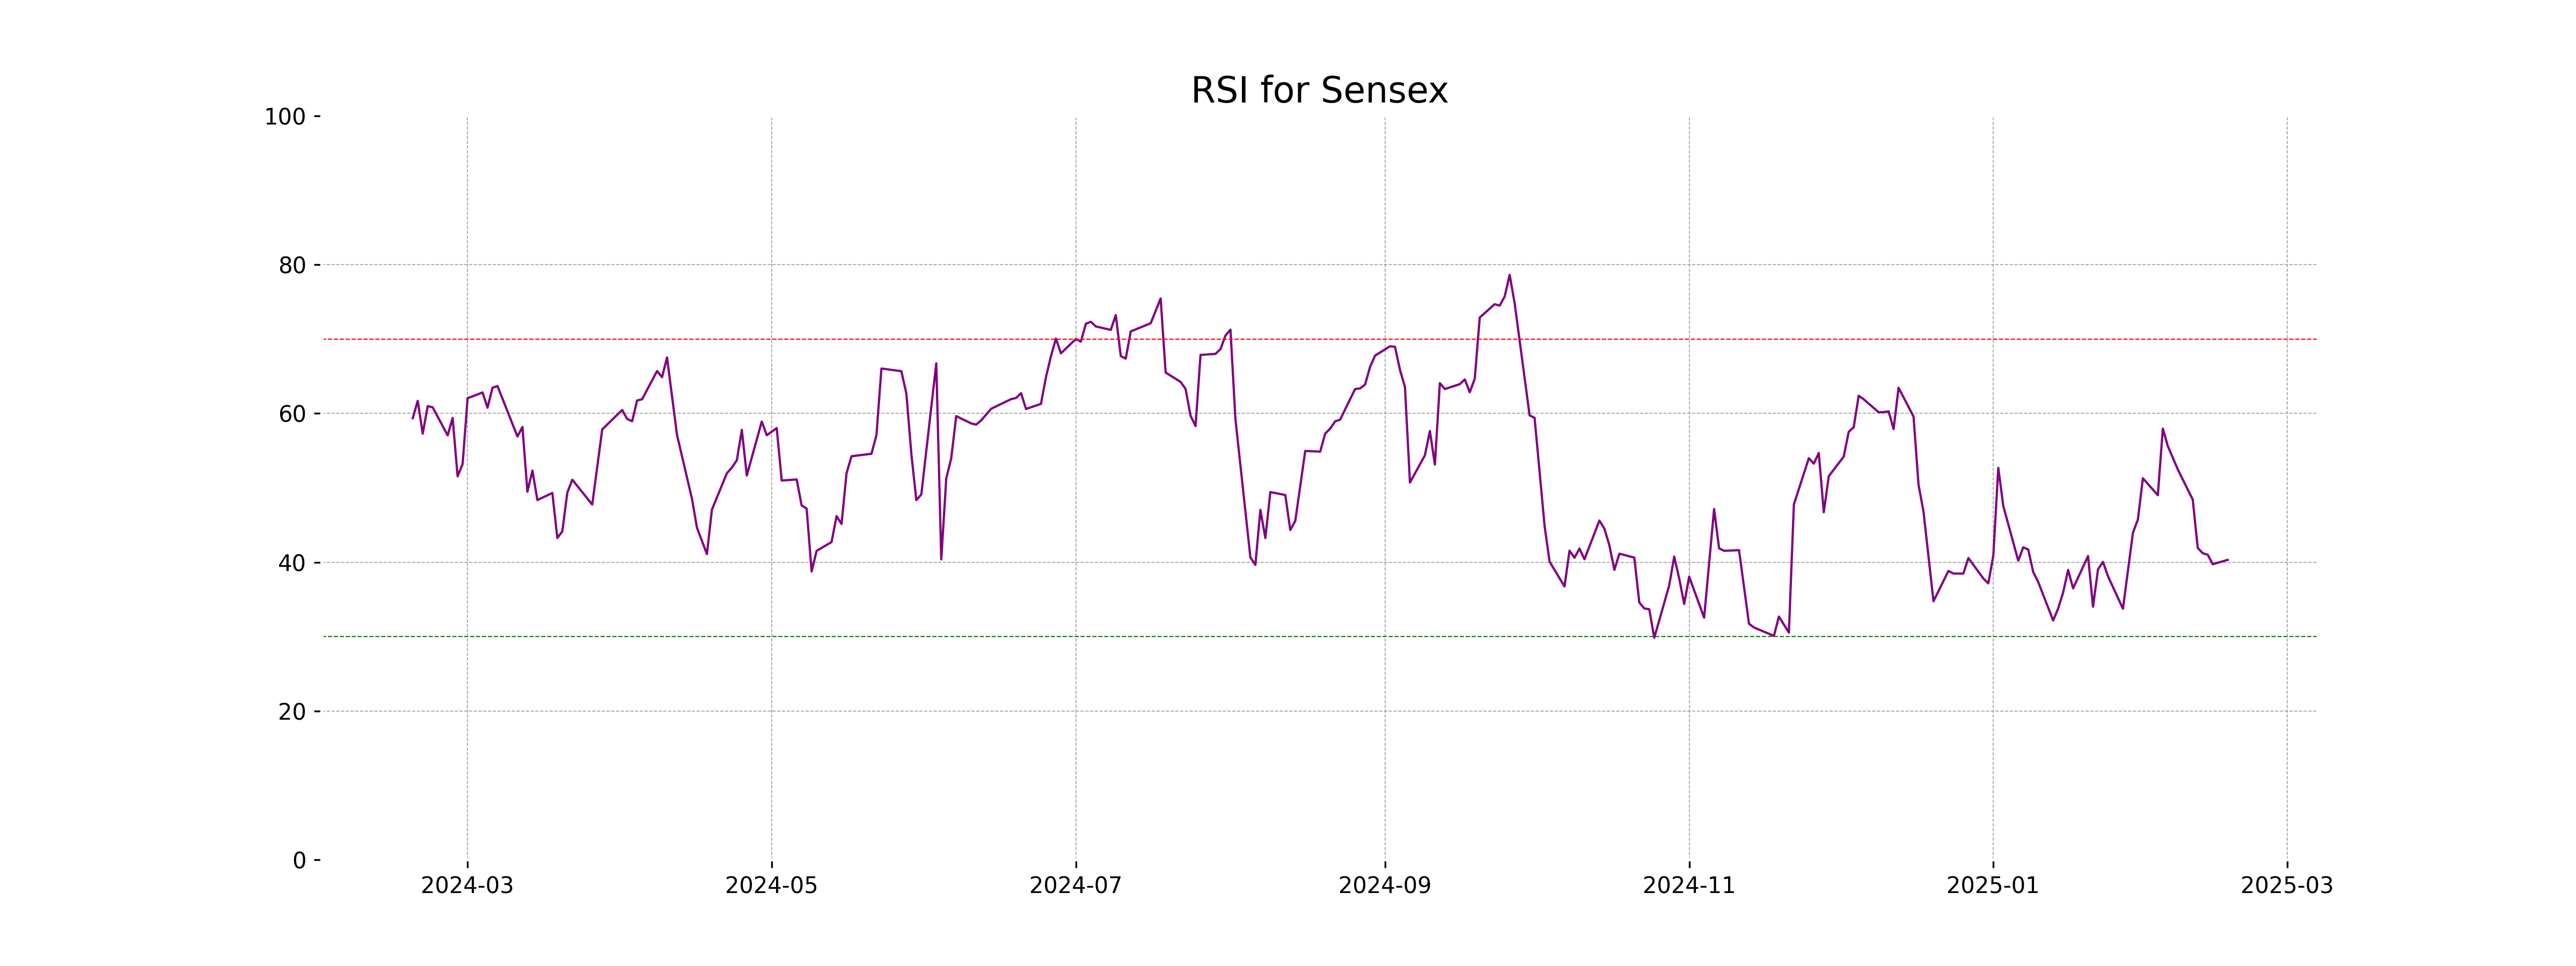
RSI Analysis
The RSI (Relative Strength Index) for Sensex is 40.31, which suggests that the index is nearing an oversold condition, as a value below 30 typically indicates an oversold level. While it's not currently in the oversold range, it is relatively low, which could suggest potential buying interest if the trend persists.
Analysis for Dow Jones Industrial Average (US) - February 17, 2025
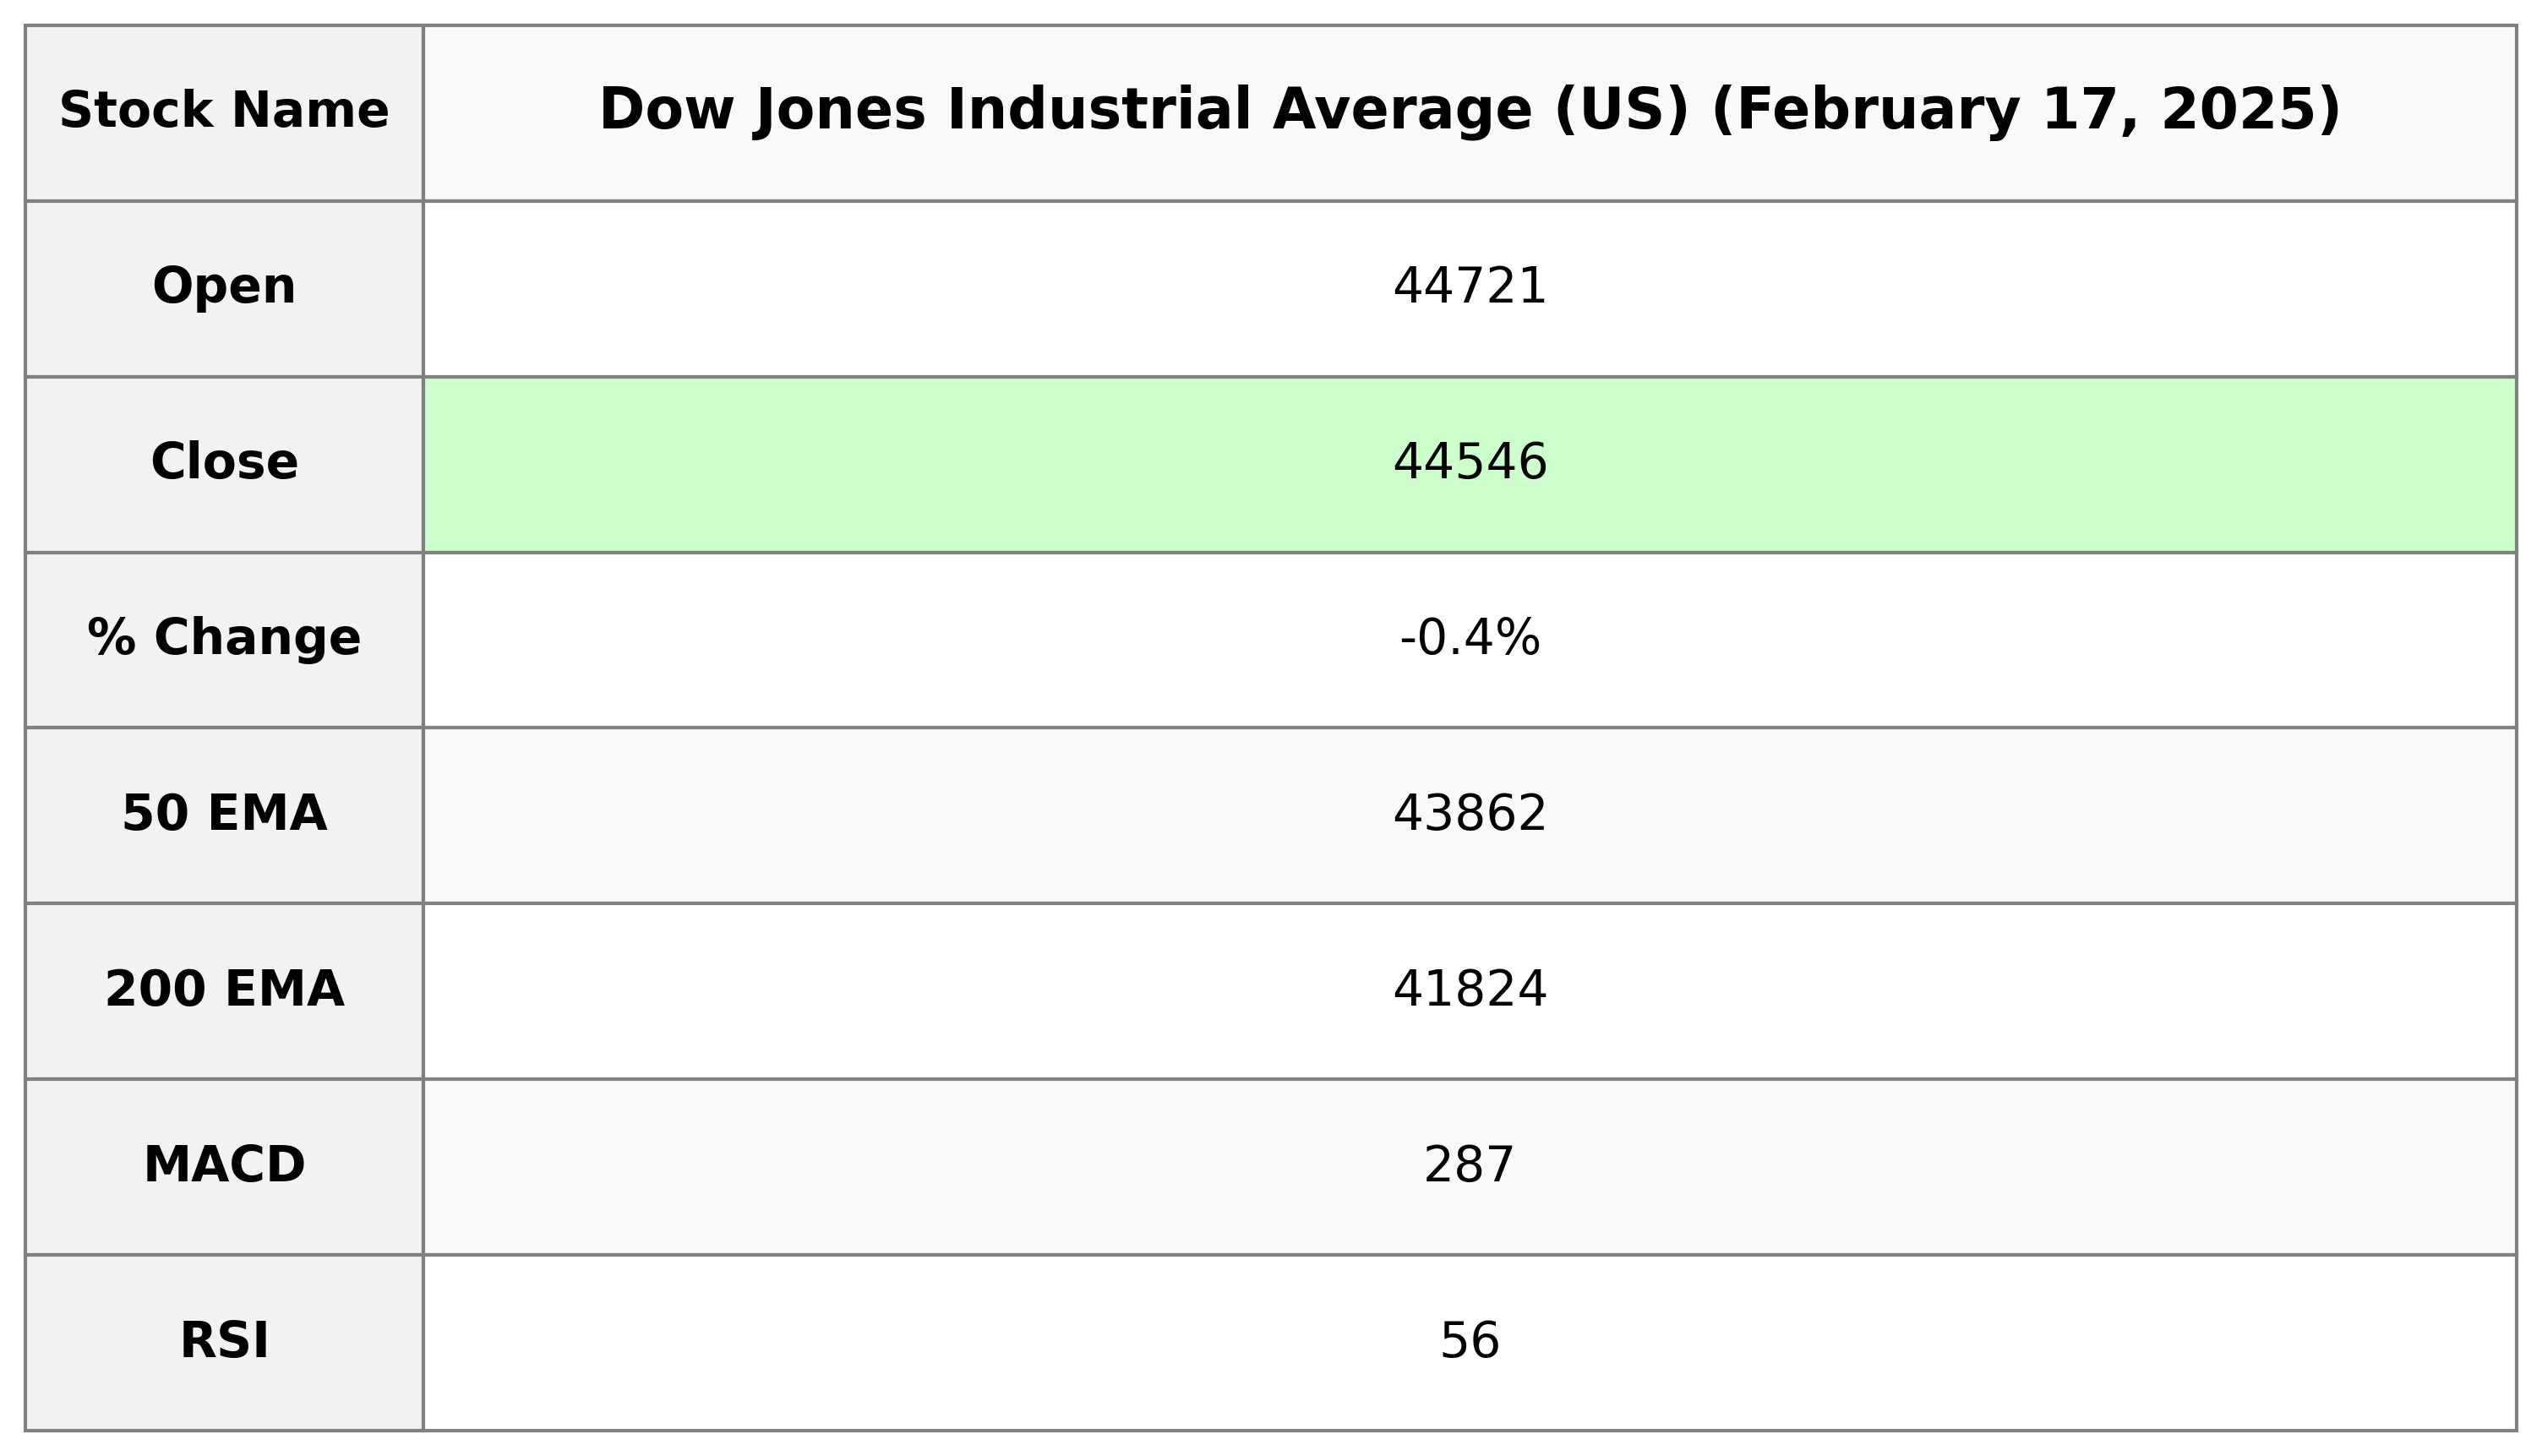
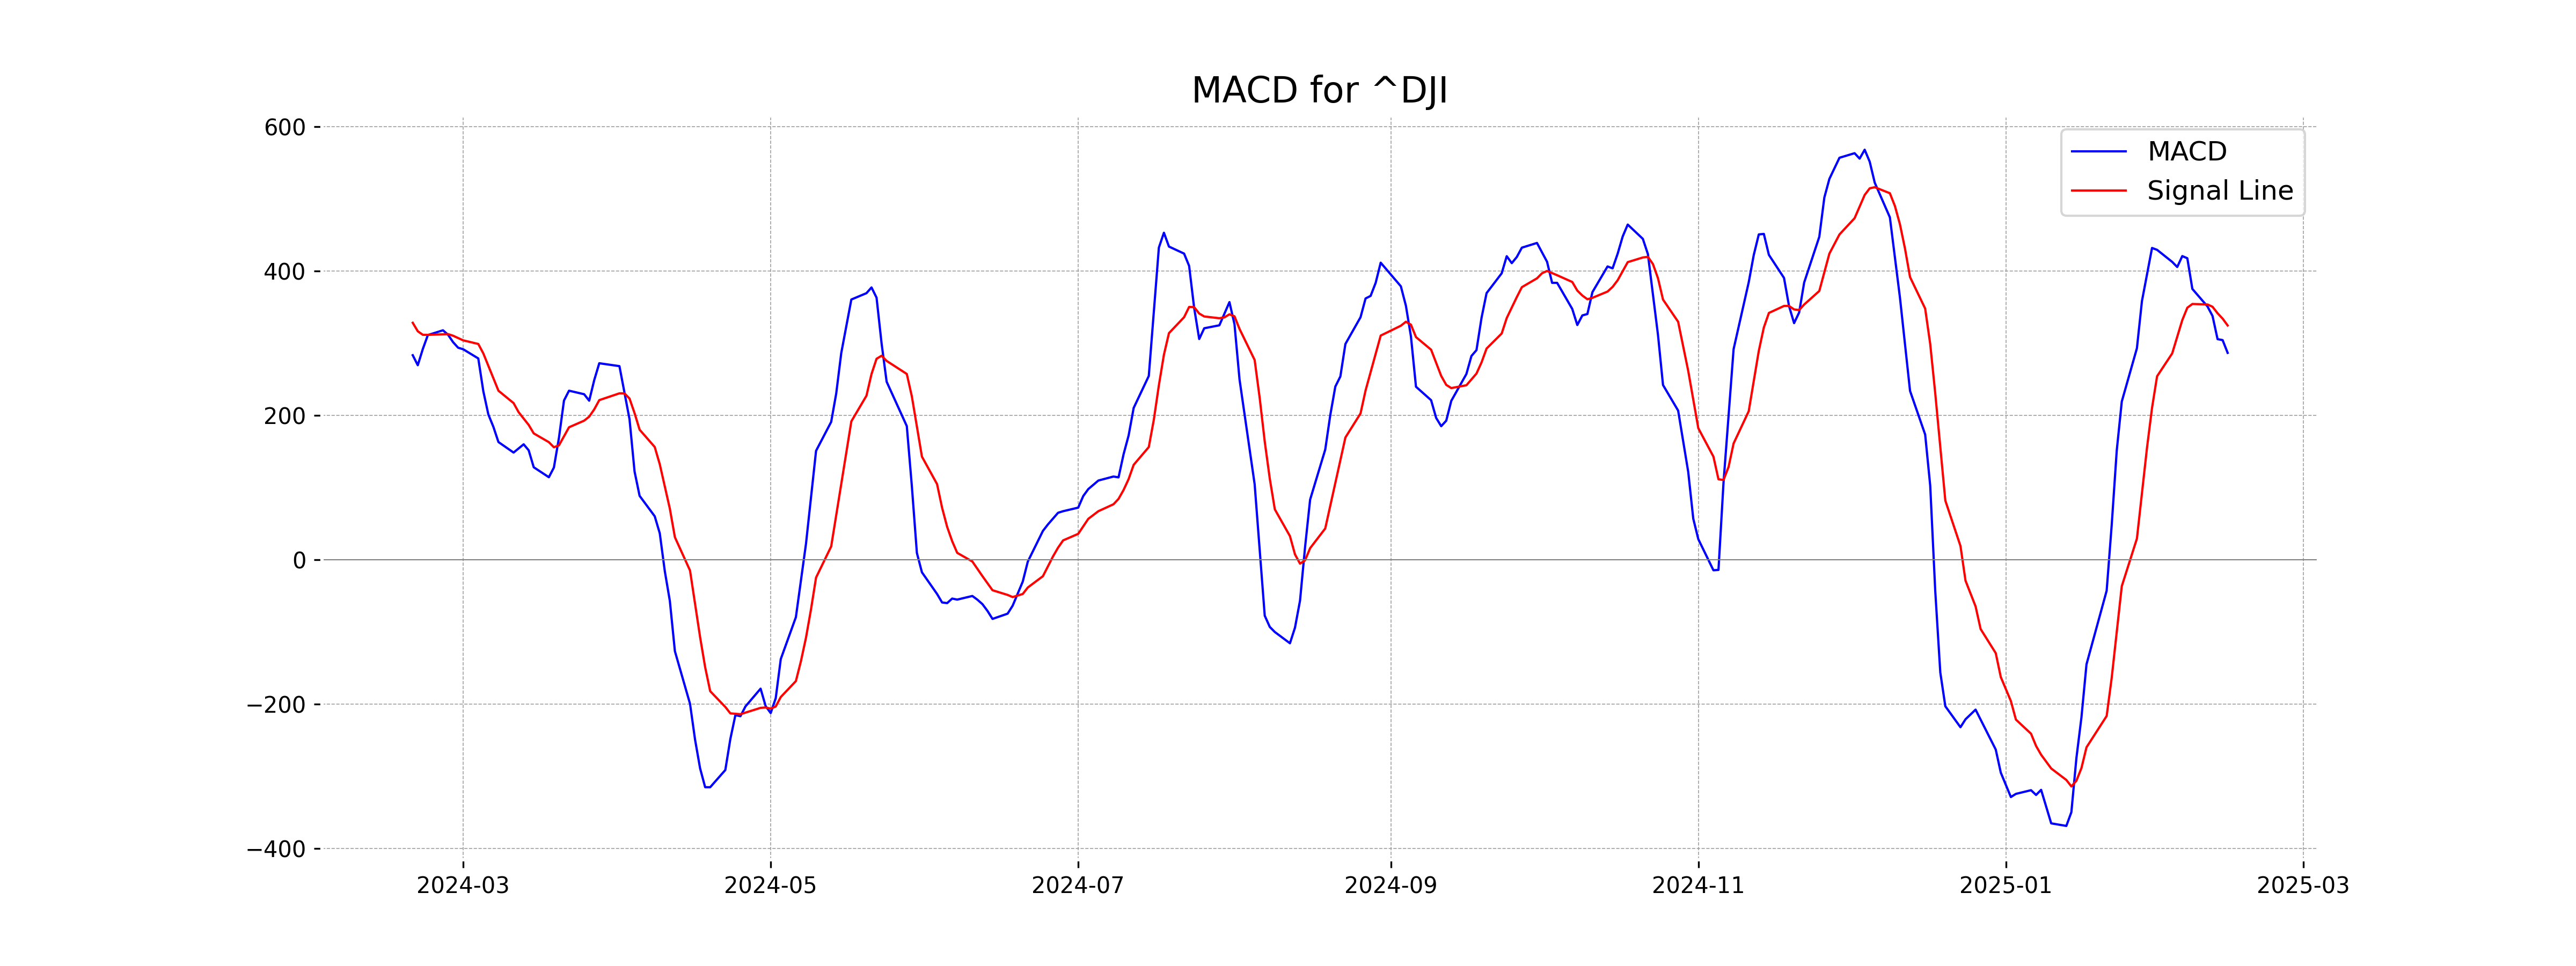
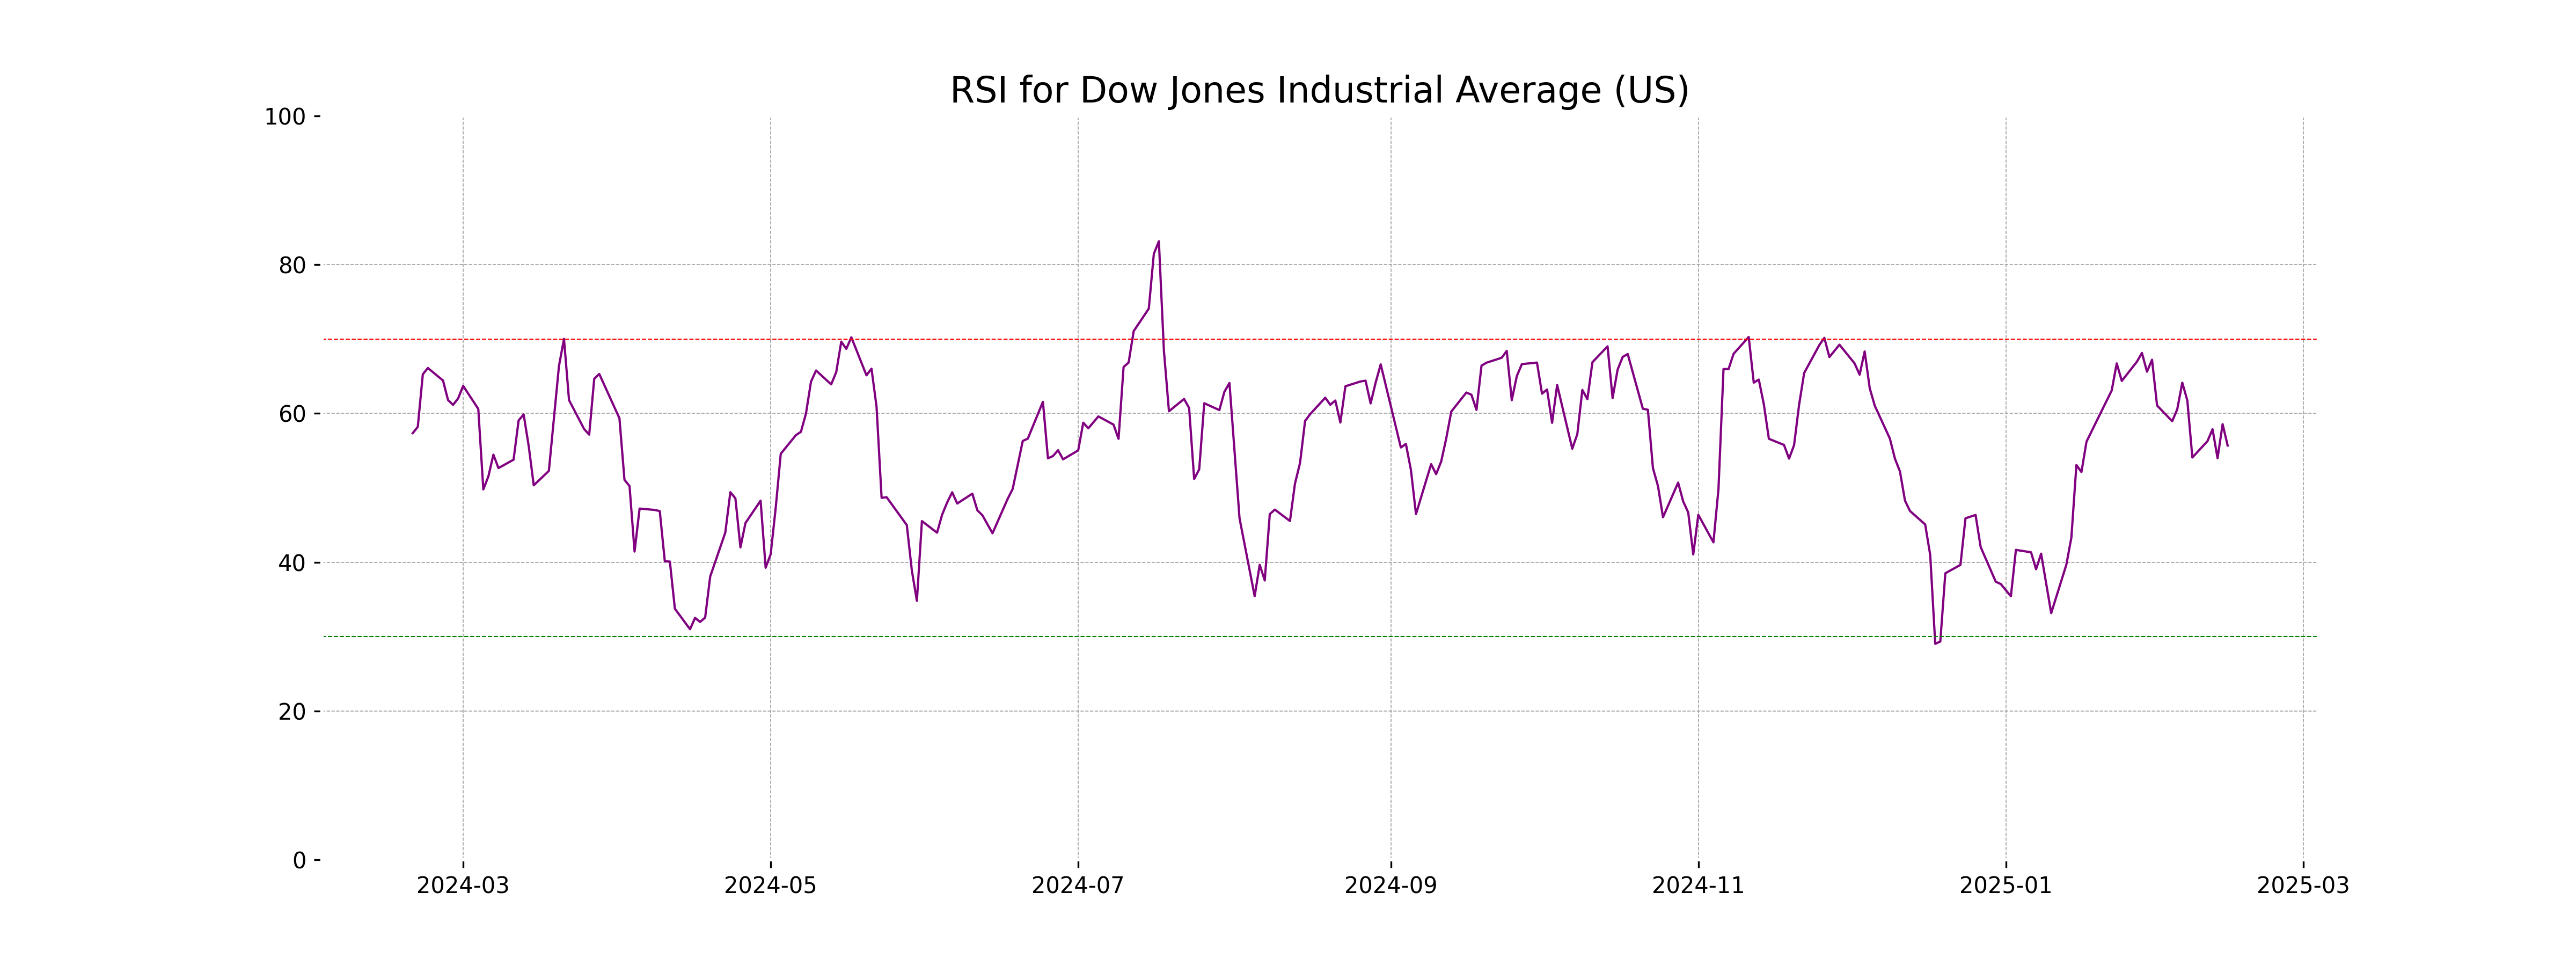
The Dow Jones Industrial Average (US) opened at 44,720.99 and closed at 44,546.08, experiencing a decline of -165.35 points or -0.37% from the previous close of 44,711.43. The index saw a trading range between a high of 44,769.05 and a low of 44,498.96 with a volume of 474.57 million. The relative strength index (RSI) stands at 55.69, indicating neutral momentum.
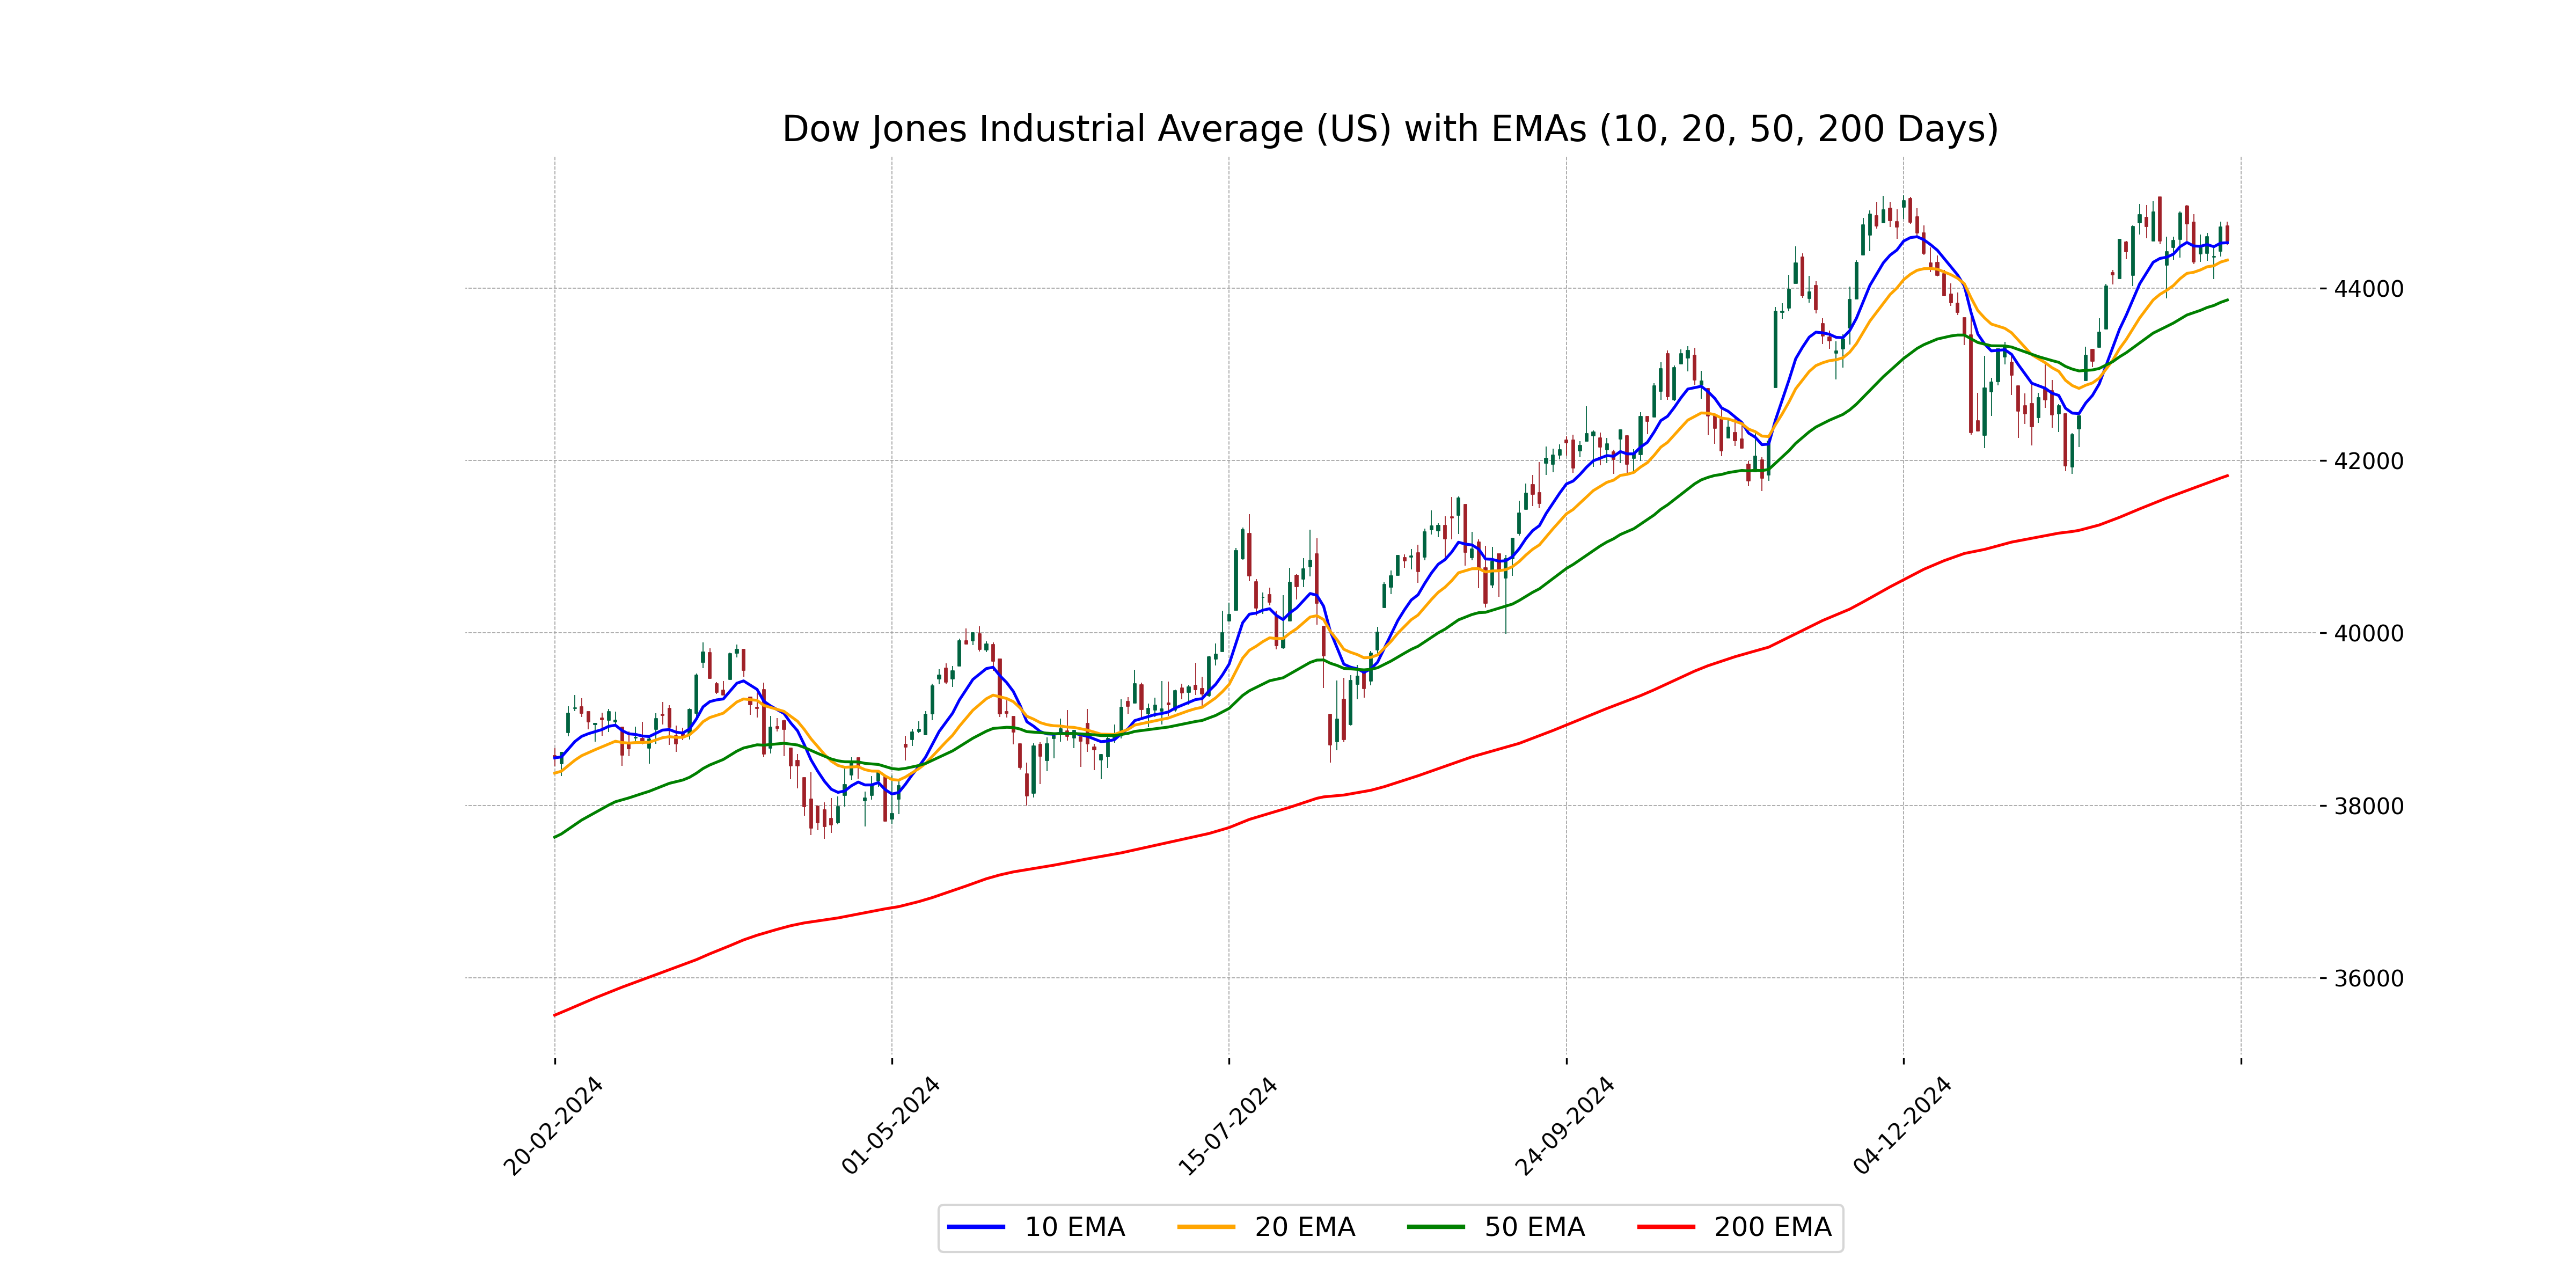
Relationship with Key Moving Averages
The Dow Jones Industrial Average opened at 44,720.99 and closed at 44,546.08, which is marginally above its 10-day EMA of 44,526.60 and significantly above its 50-day EMA of 43,862.26 and 200-day EMA of 41,824.13. This suggests a short-term bullish sentiment despite the day's negative close.
Moving Averages Trend (MACD)
The Dow Jones Industrial Average shows a MACD value of approximately 286.67, which is below its MACD Signal of around 324.63. This indicates a bearish momentum, suggesting potential for a continuation of the current downtrend unless there's a positive shift.
RSI Analysis
The RSI (Relative Strength Index) for the Dow Jones Industrial Average is at 55.69, which indicates a neutral position. While it is slightly above the midpoint of 50, it doesn't show overbought (above 70) or oversold (below 30) conditions, suggesting the market is relatively stable.
Analysis for CAC 40 (France) - February 17, 2025
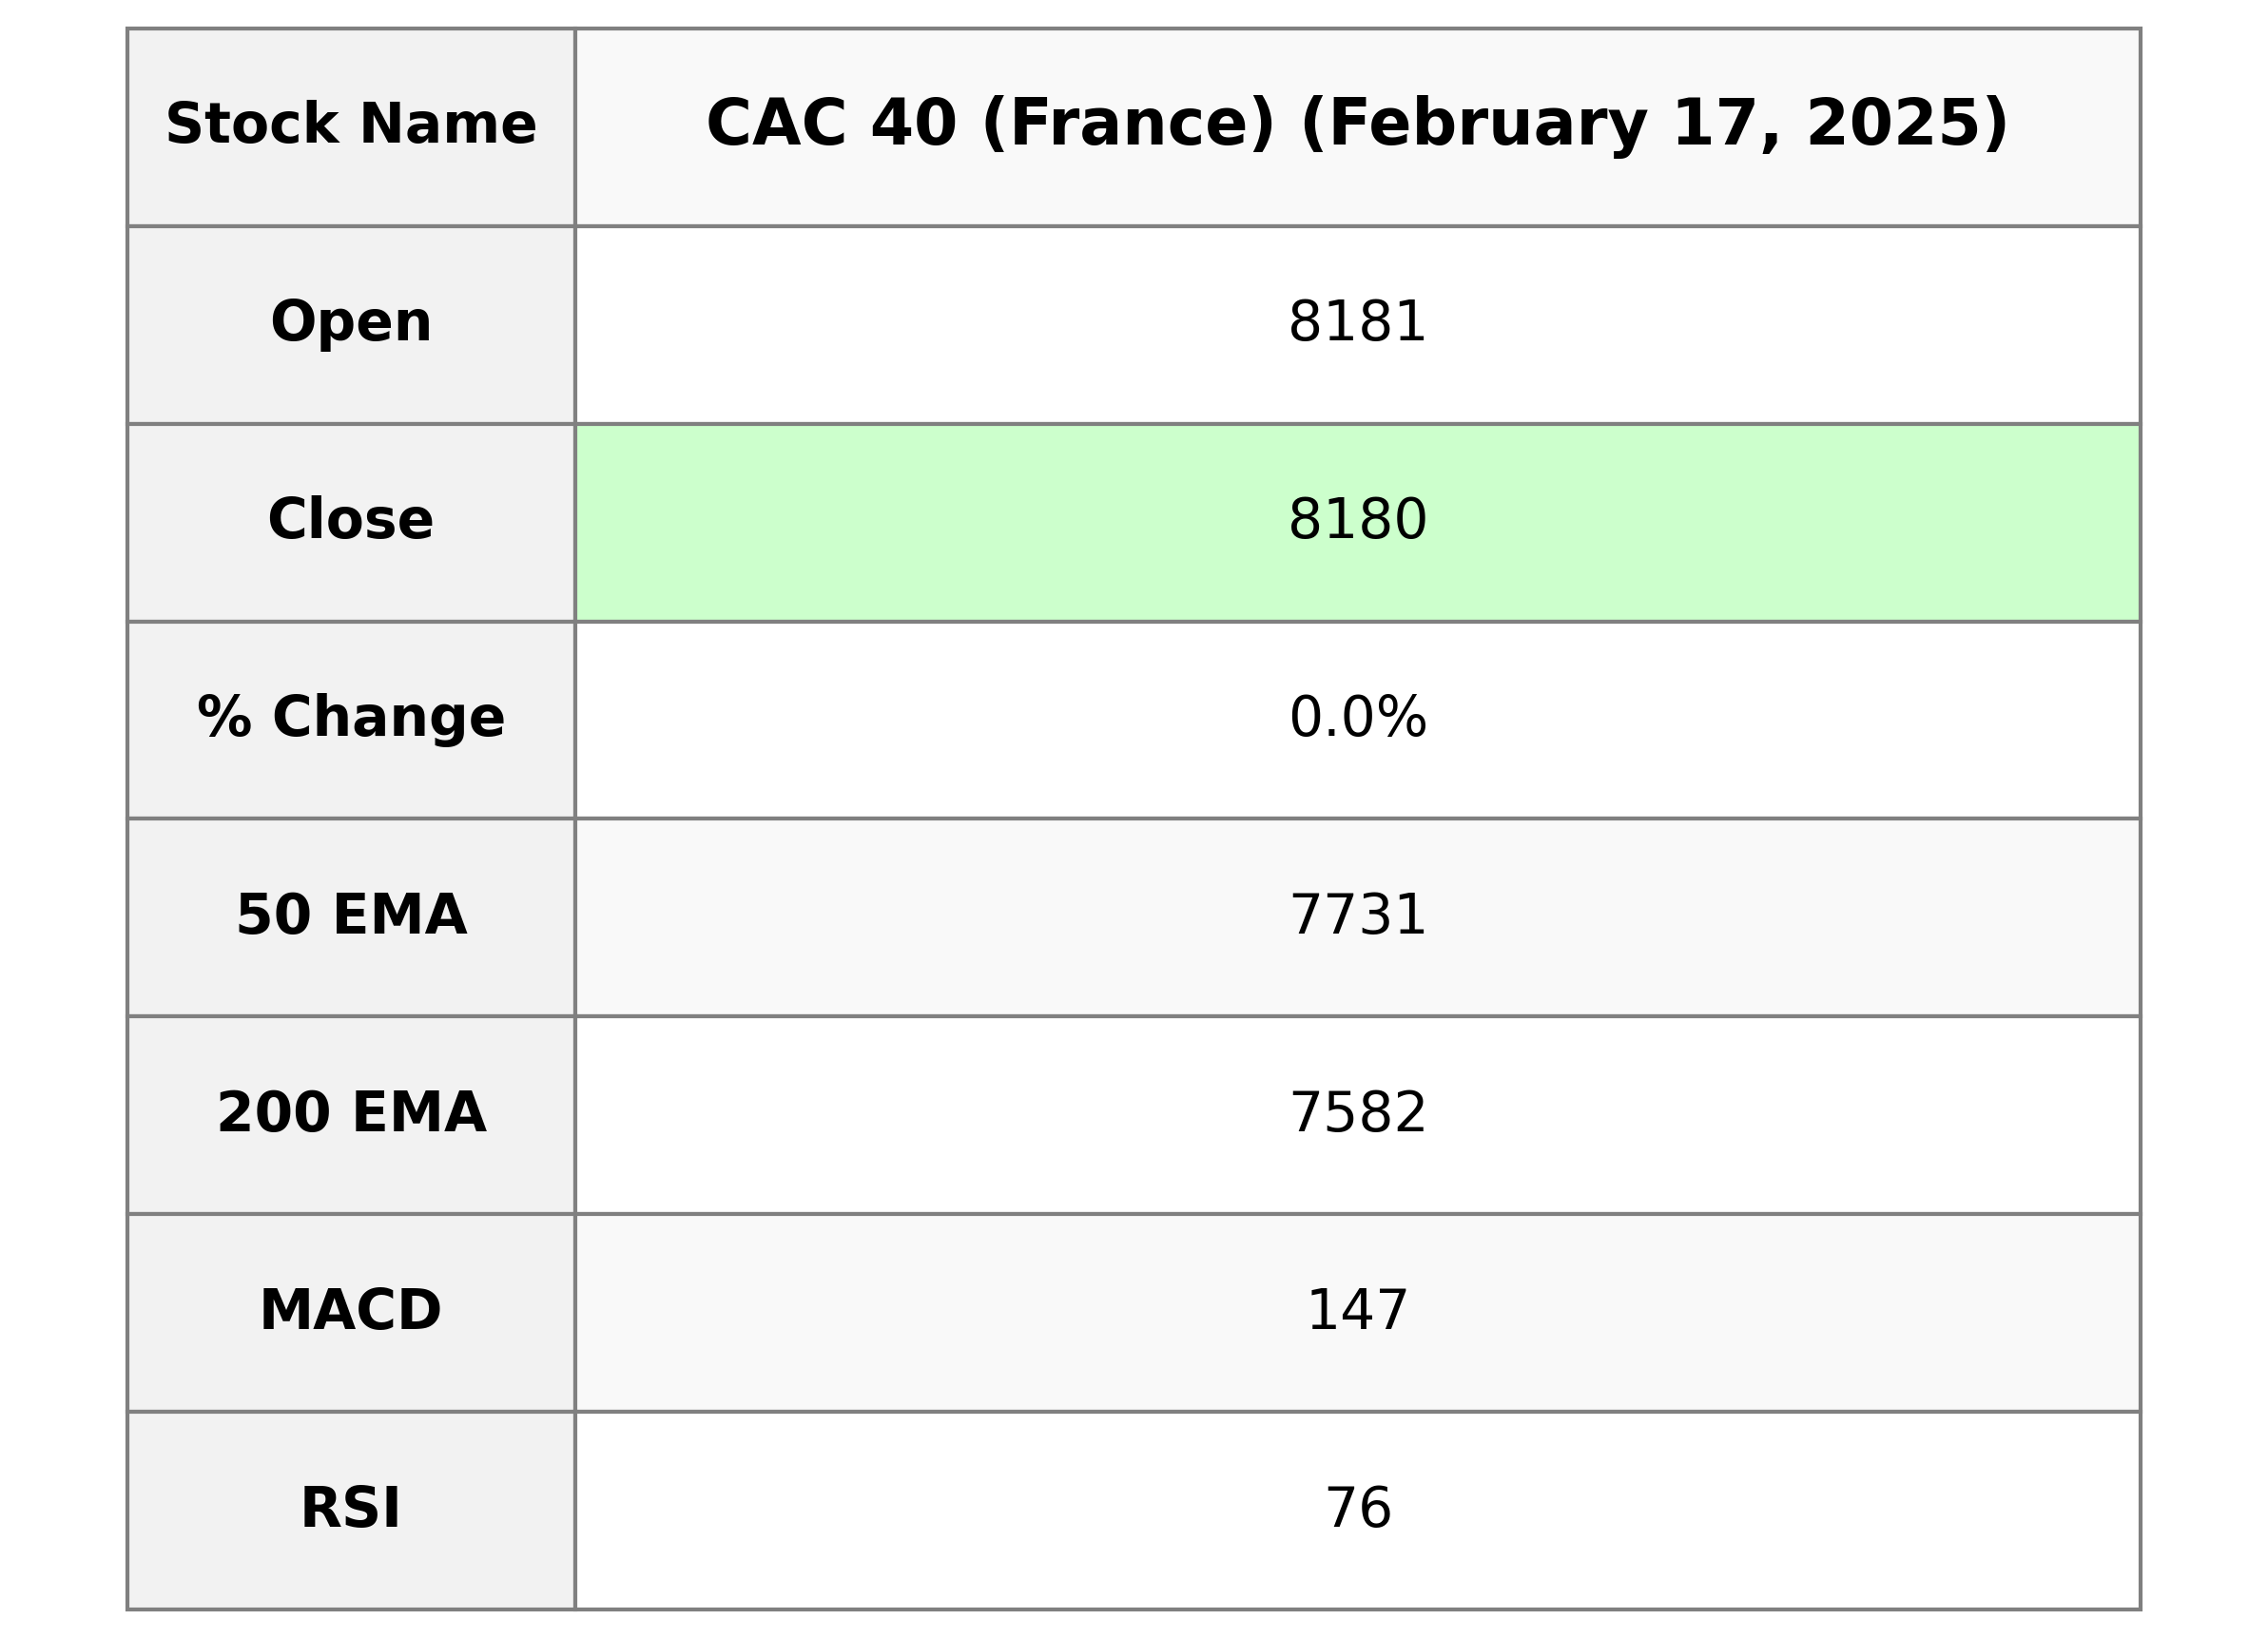
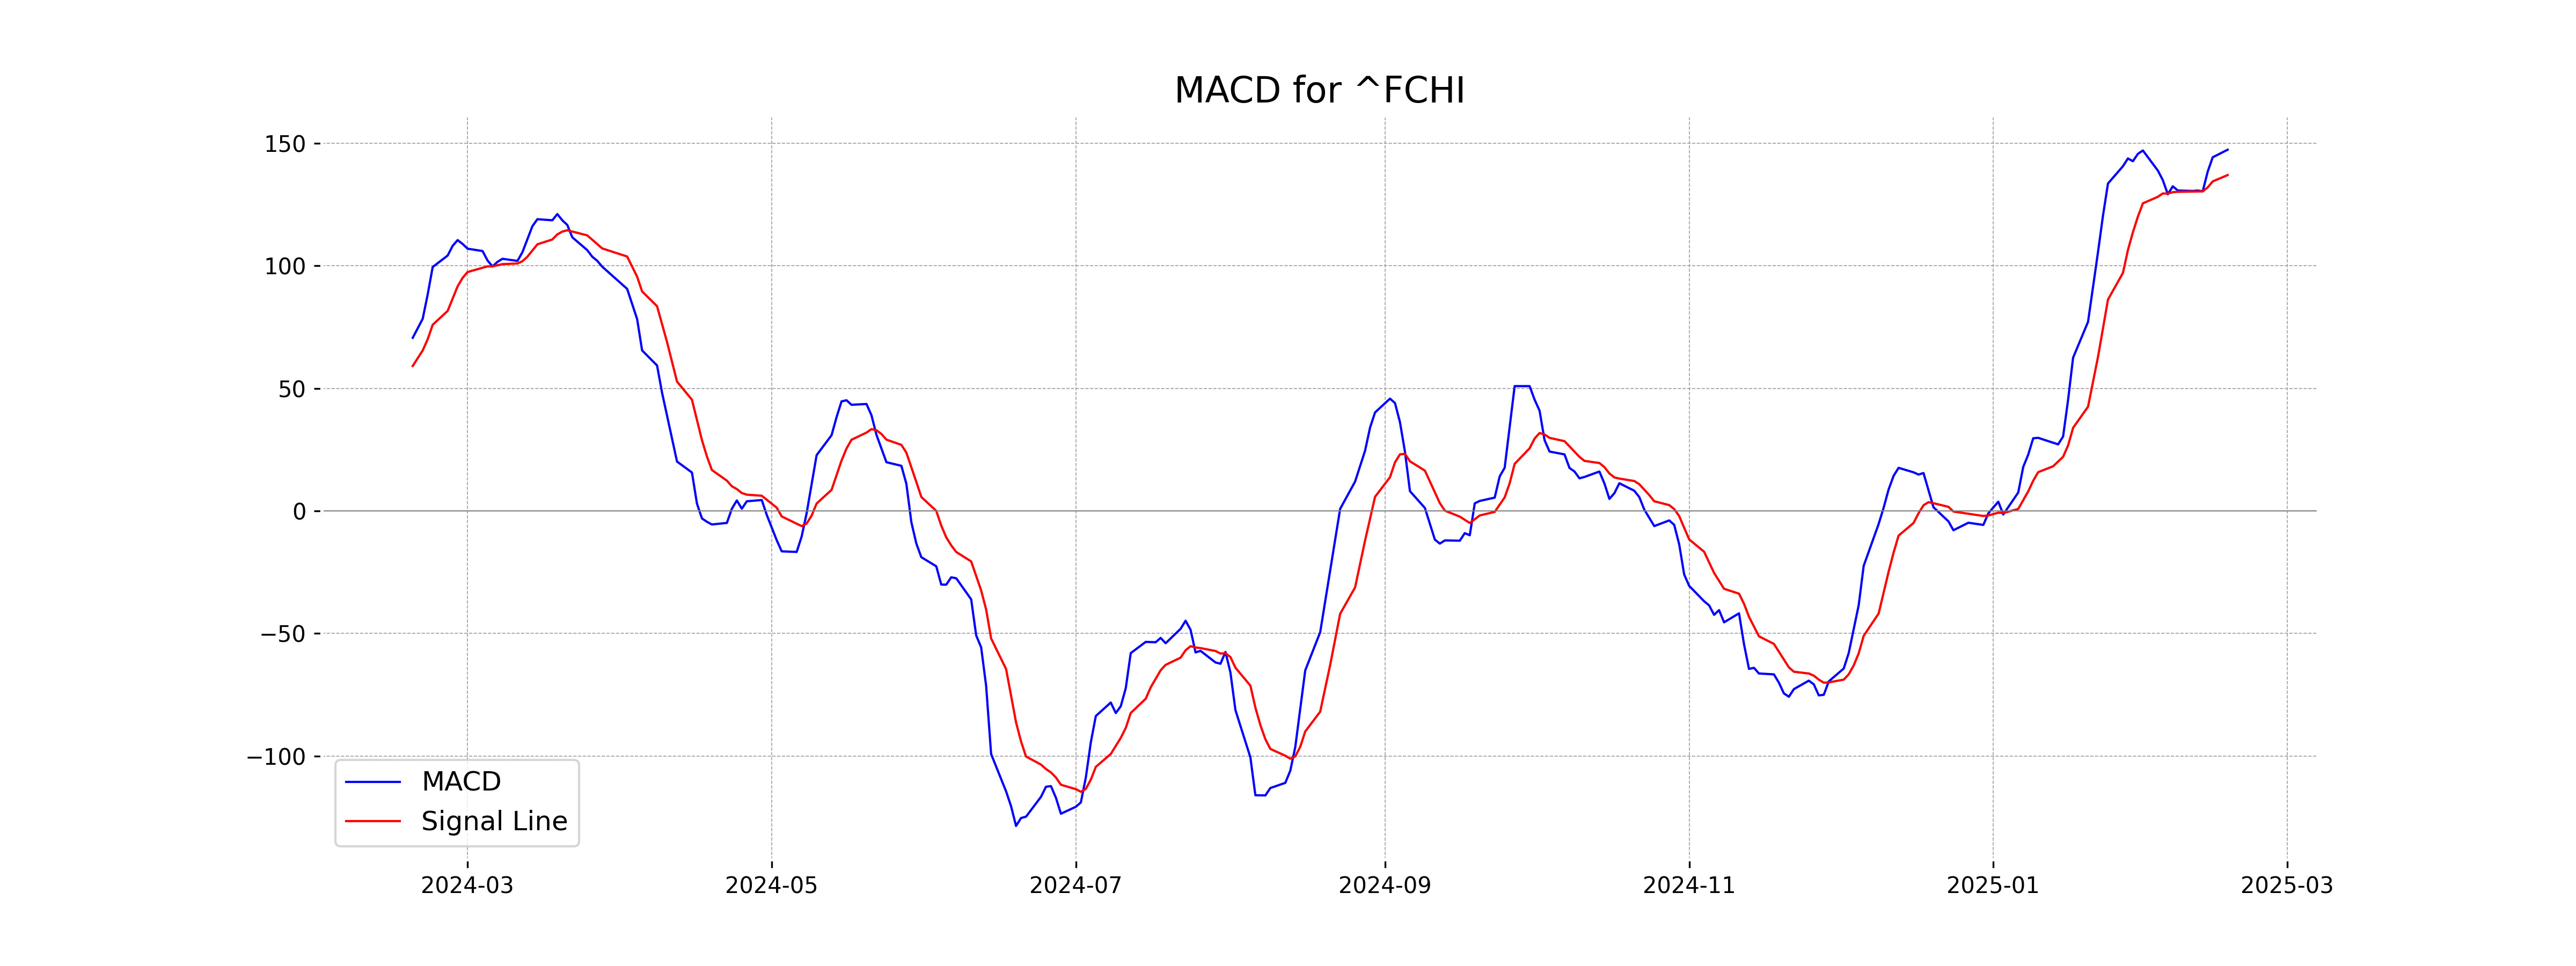
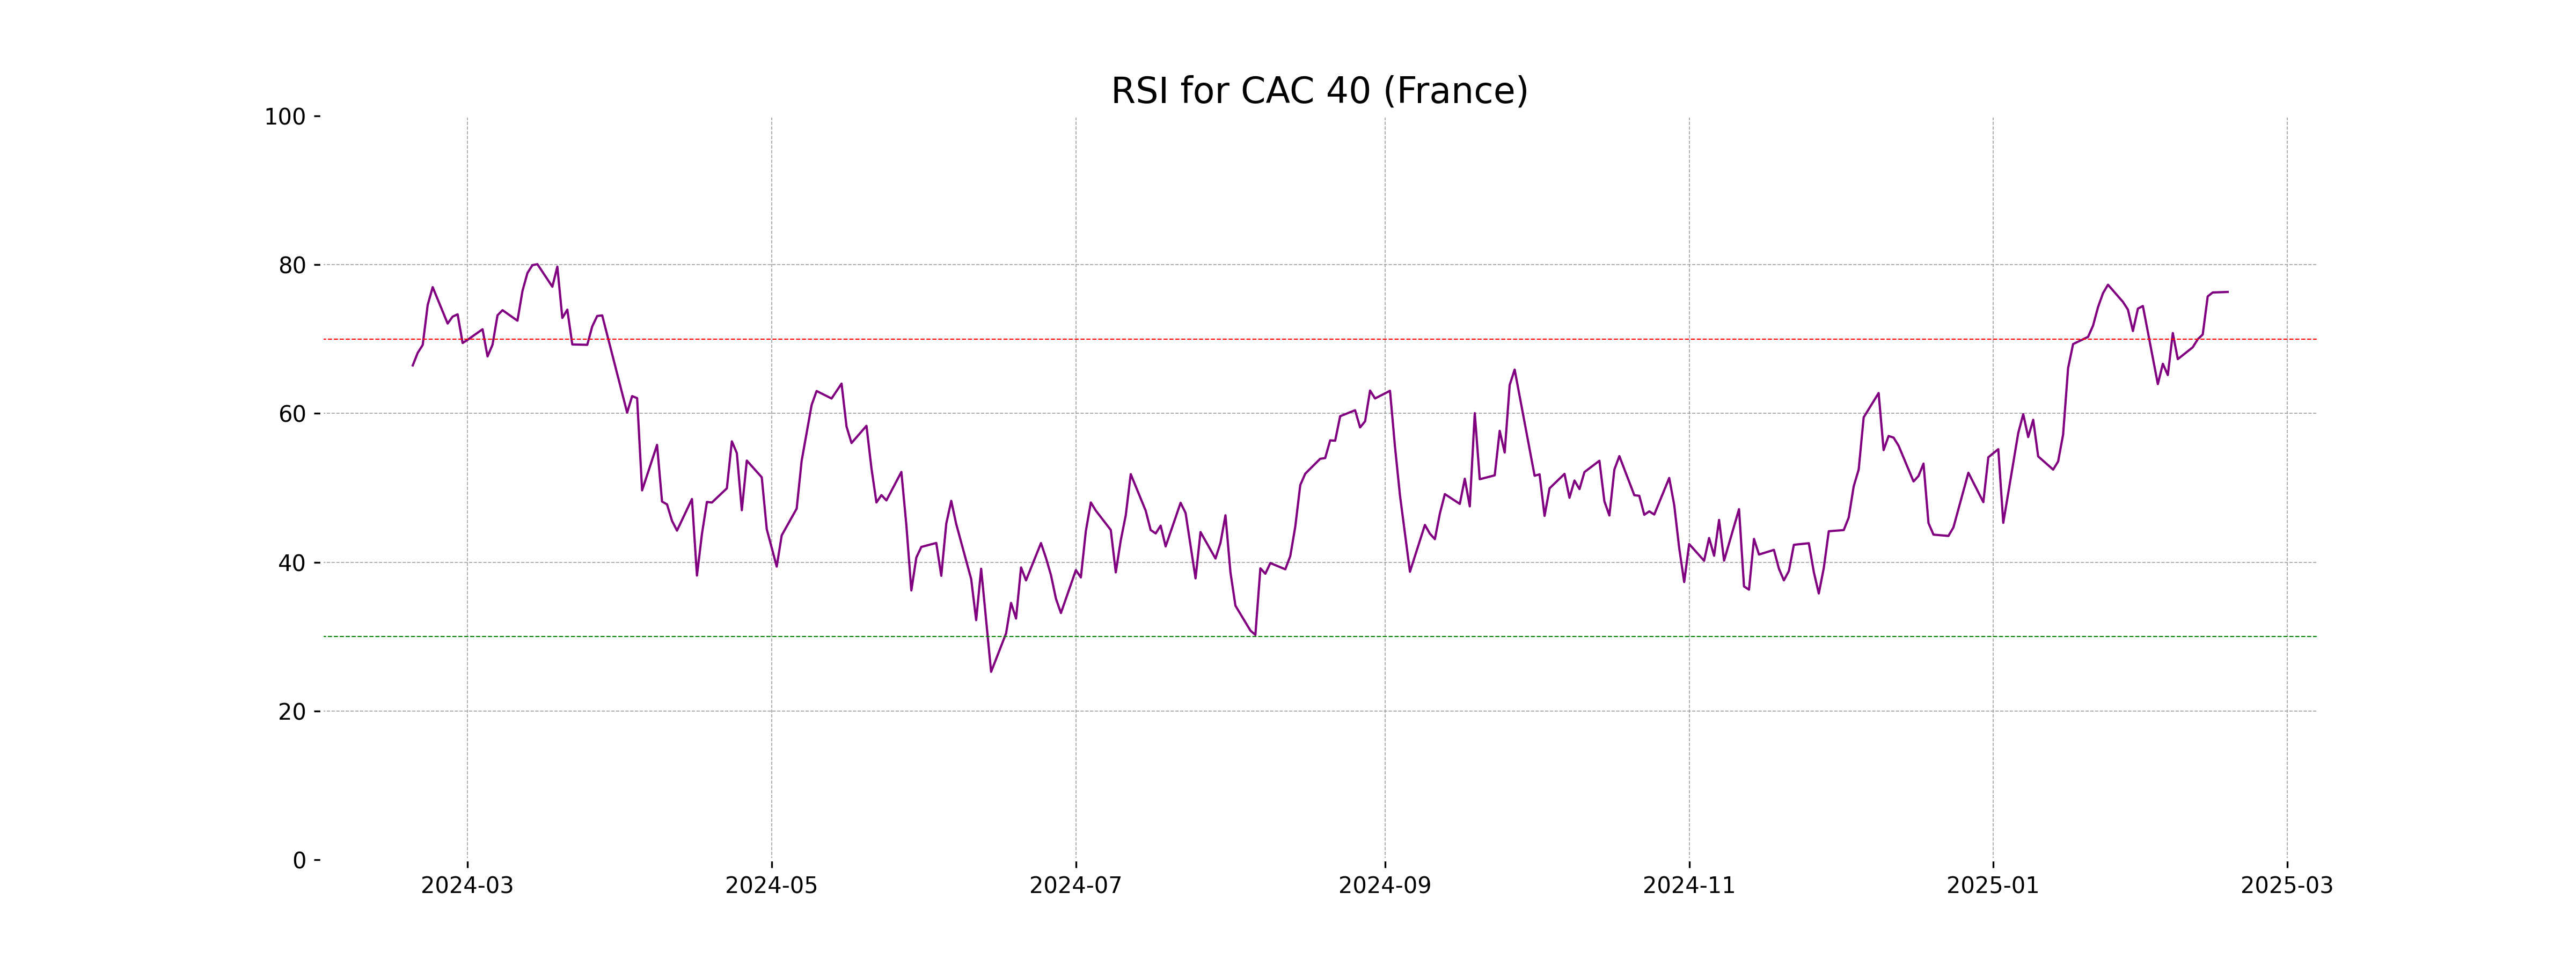
**CAC 40 (France) Performance:** During the last trading session, the CAC 40 opened at 8181.40 and closed slightly lower at 8180.40, marking a marginal gain with a 0.02% change from its previous close of 8178.54. The RSI of 76.33 suggests that the index is currently in overbought territory, while the MACD of 147.40 indicates a strong bullish momentum compared to the MACD Signal of 137.06.
Relationship with Key Moving Averages
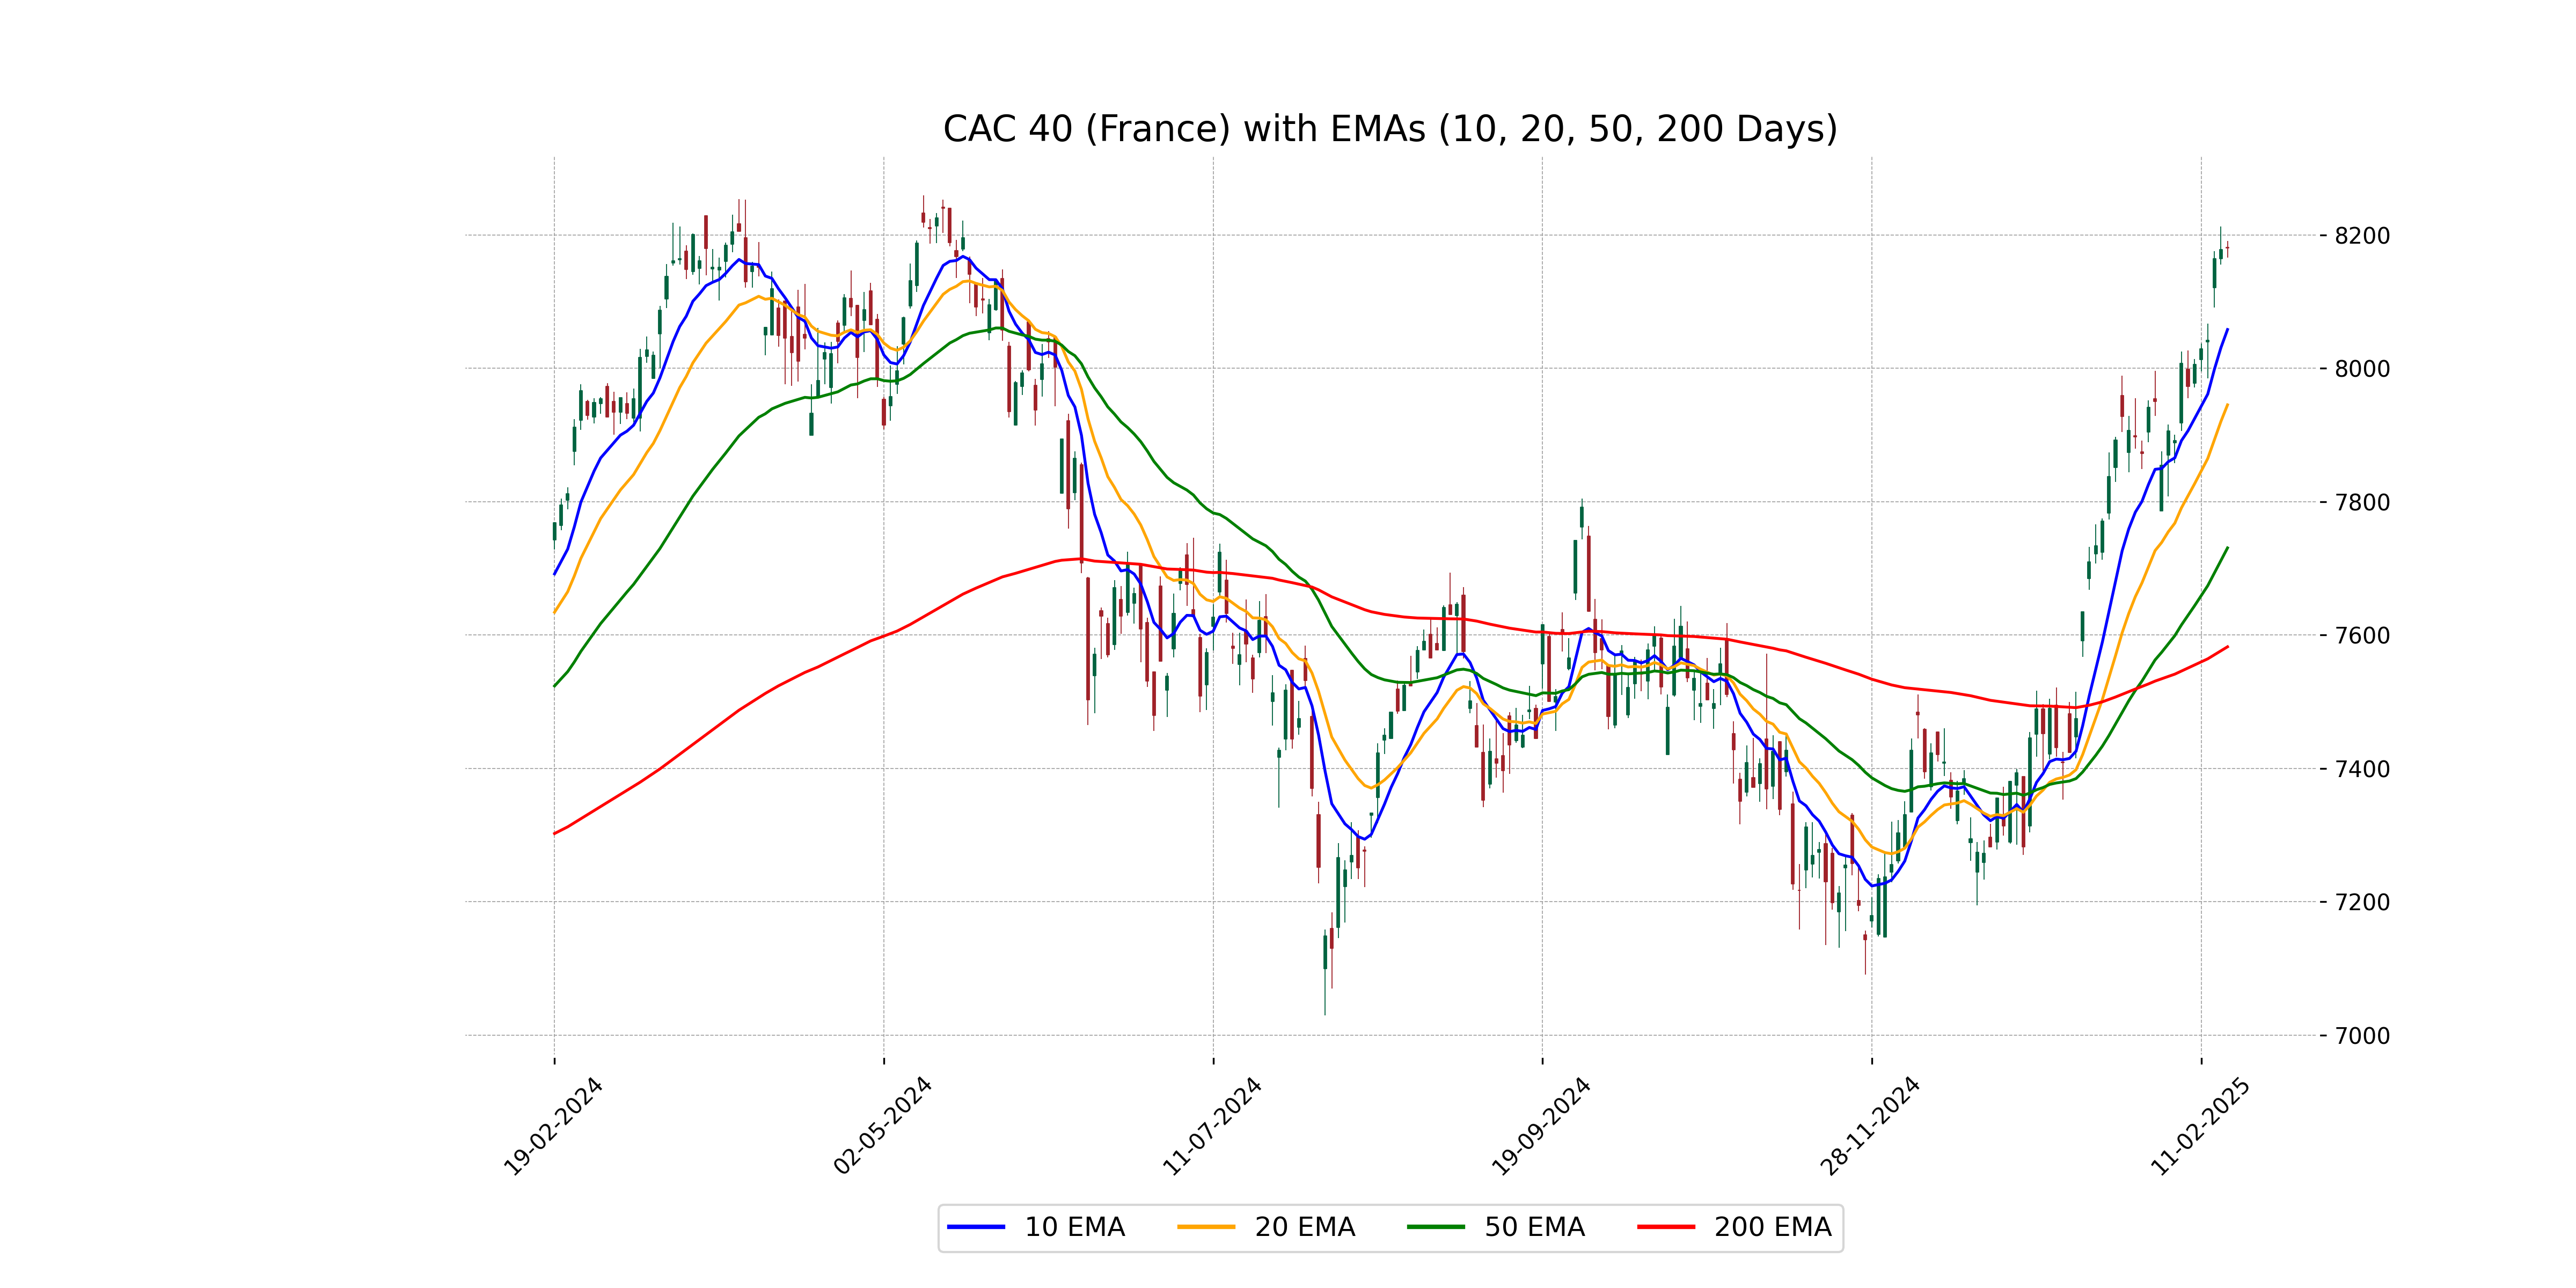
CAC 40 is trading above its key moving averages, including the 50 EMA at 7730.71, 200 EMA at 7582.42, 10 EMA at 8058.22, and 20 EMA at 7945.26, indicating a strong bullish trend. The Relative Strength Index (RSI) is high at 76.33, suggesting the index is in overbought territory.
Moving Averages Trend (MACD)
The MACD for CAC 40 (France) is currently at 147.40, which is above its signal line of 137.06. This indicates a bullish momentum as the MACD line is higher, suggesting potential continued upward movement in the short term.
RSI Analysis
The RSI (Relative Strength Index) for CAC 40 (France) is 76.33, which suggests that the stock is in an overbought condition. An RSI above 70 typically indicates that the stock might be overvalued, potentially signaling a price reversal or pullback in the near future.
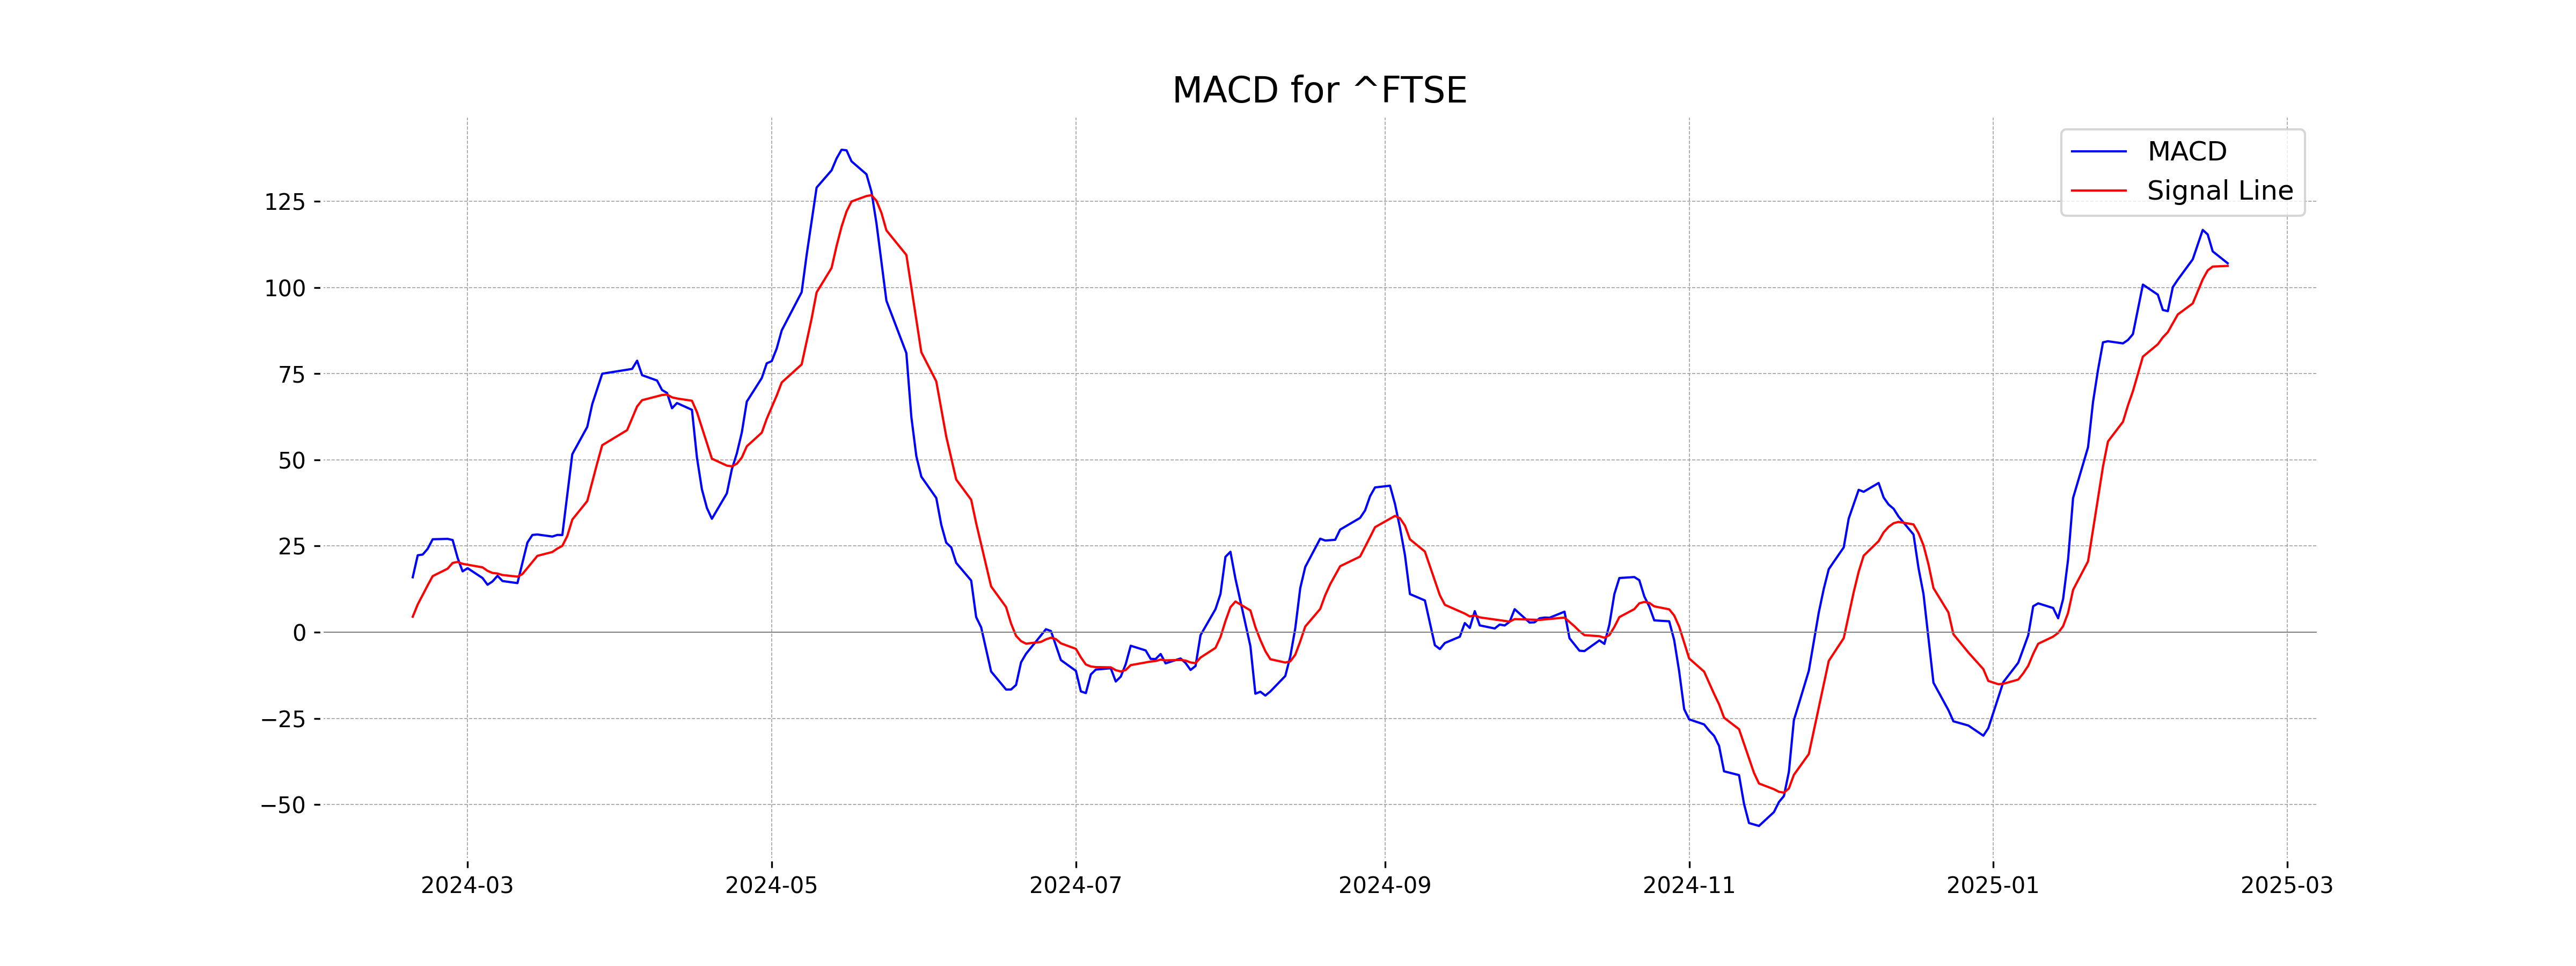
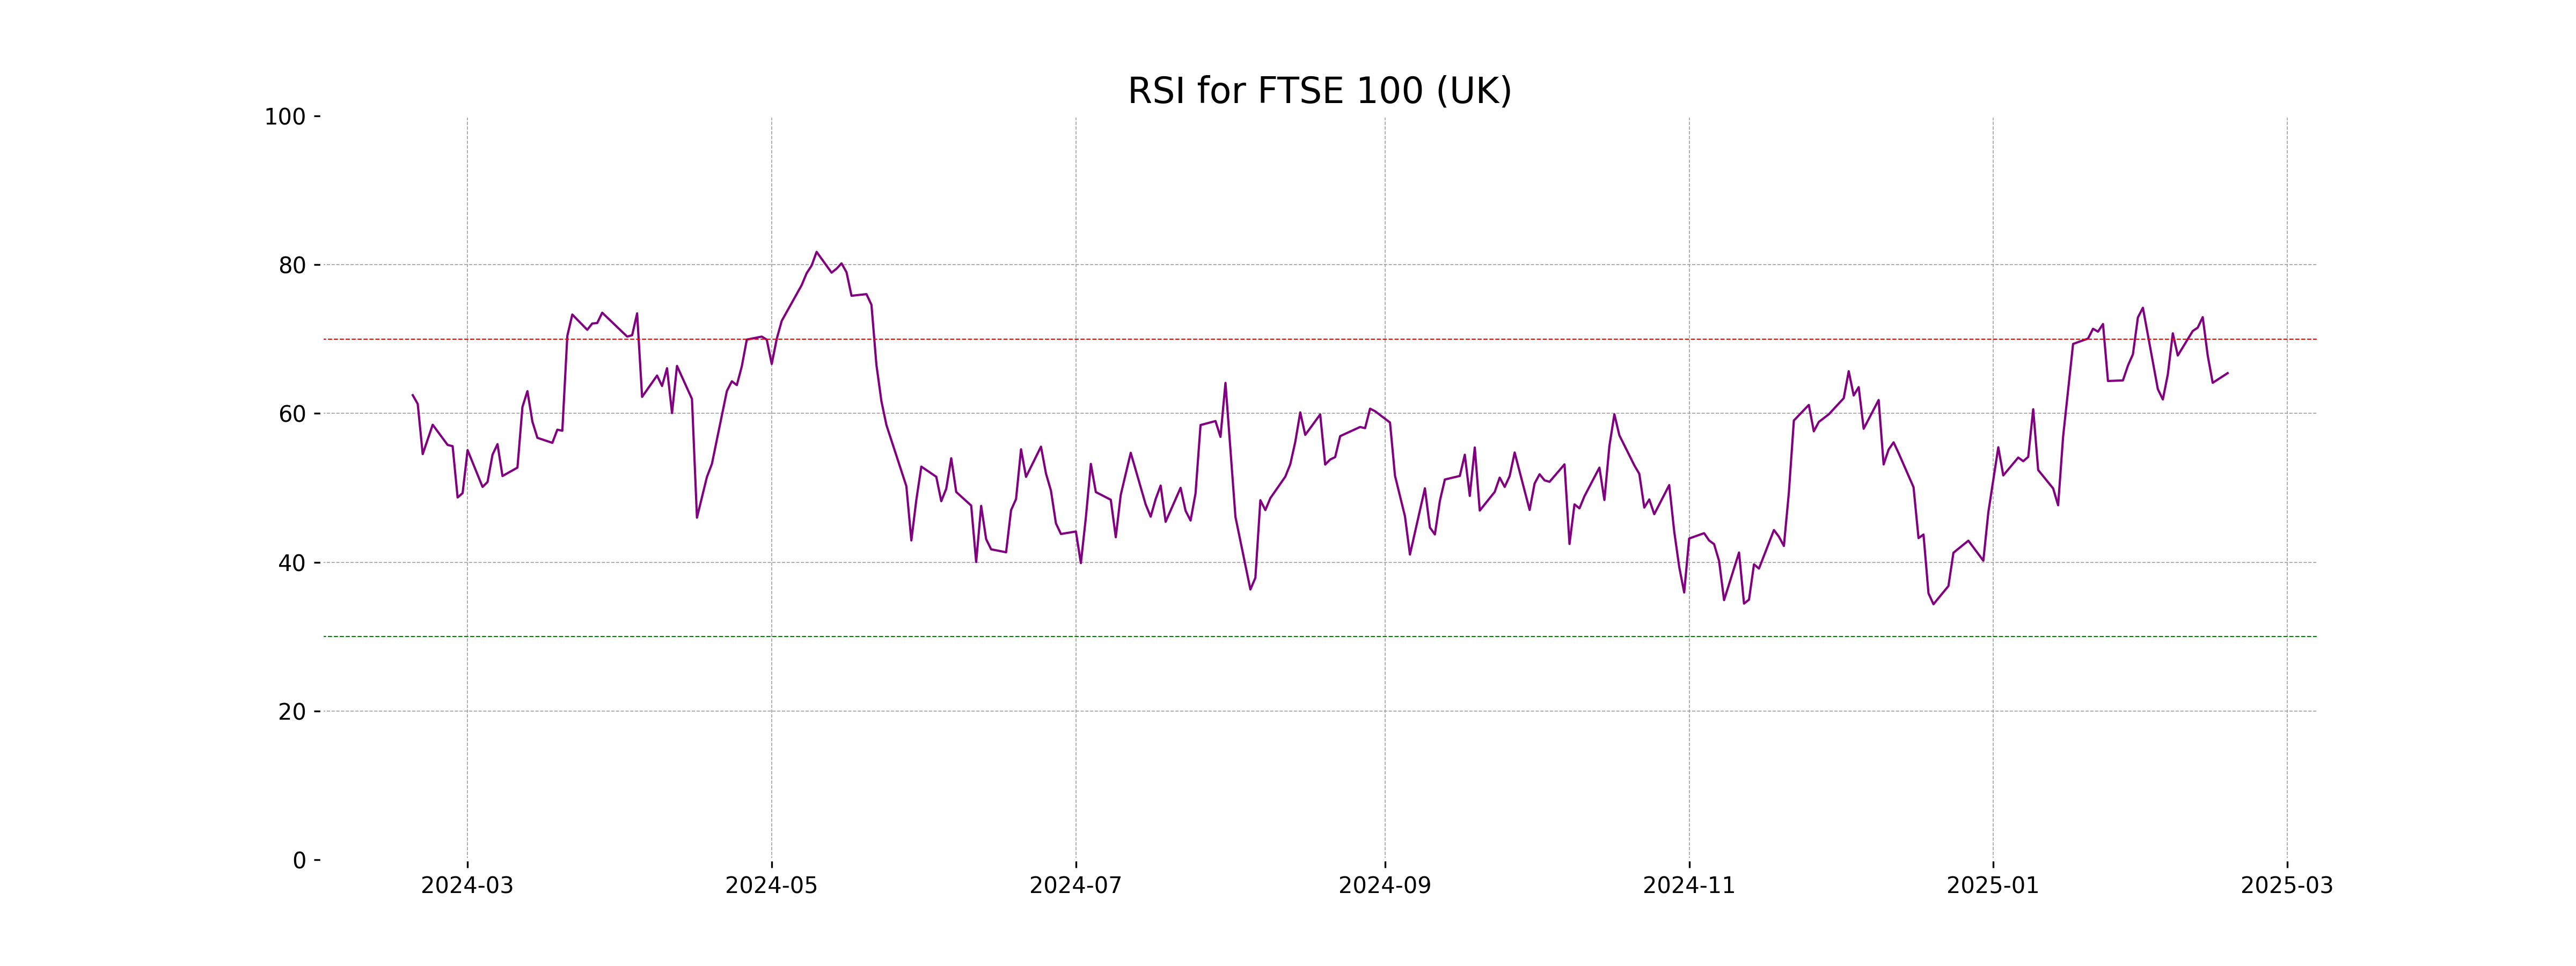
Analysis for FTSE 100 (UK) - February 17, 2025
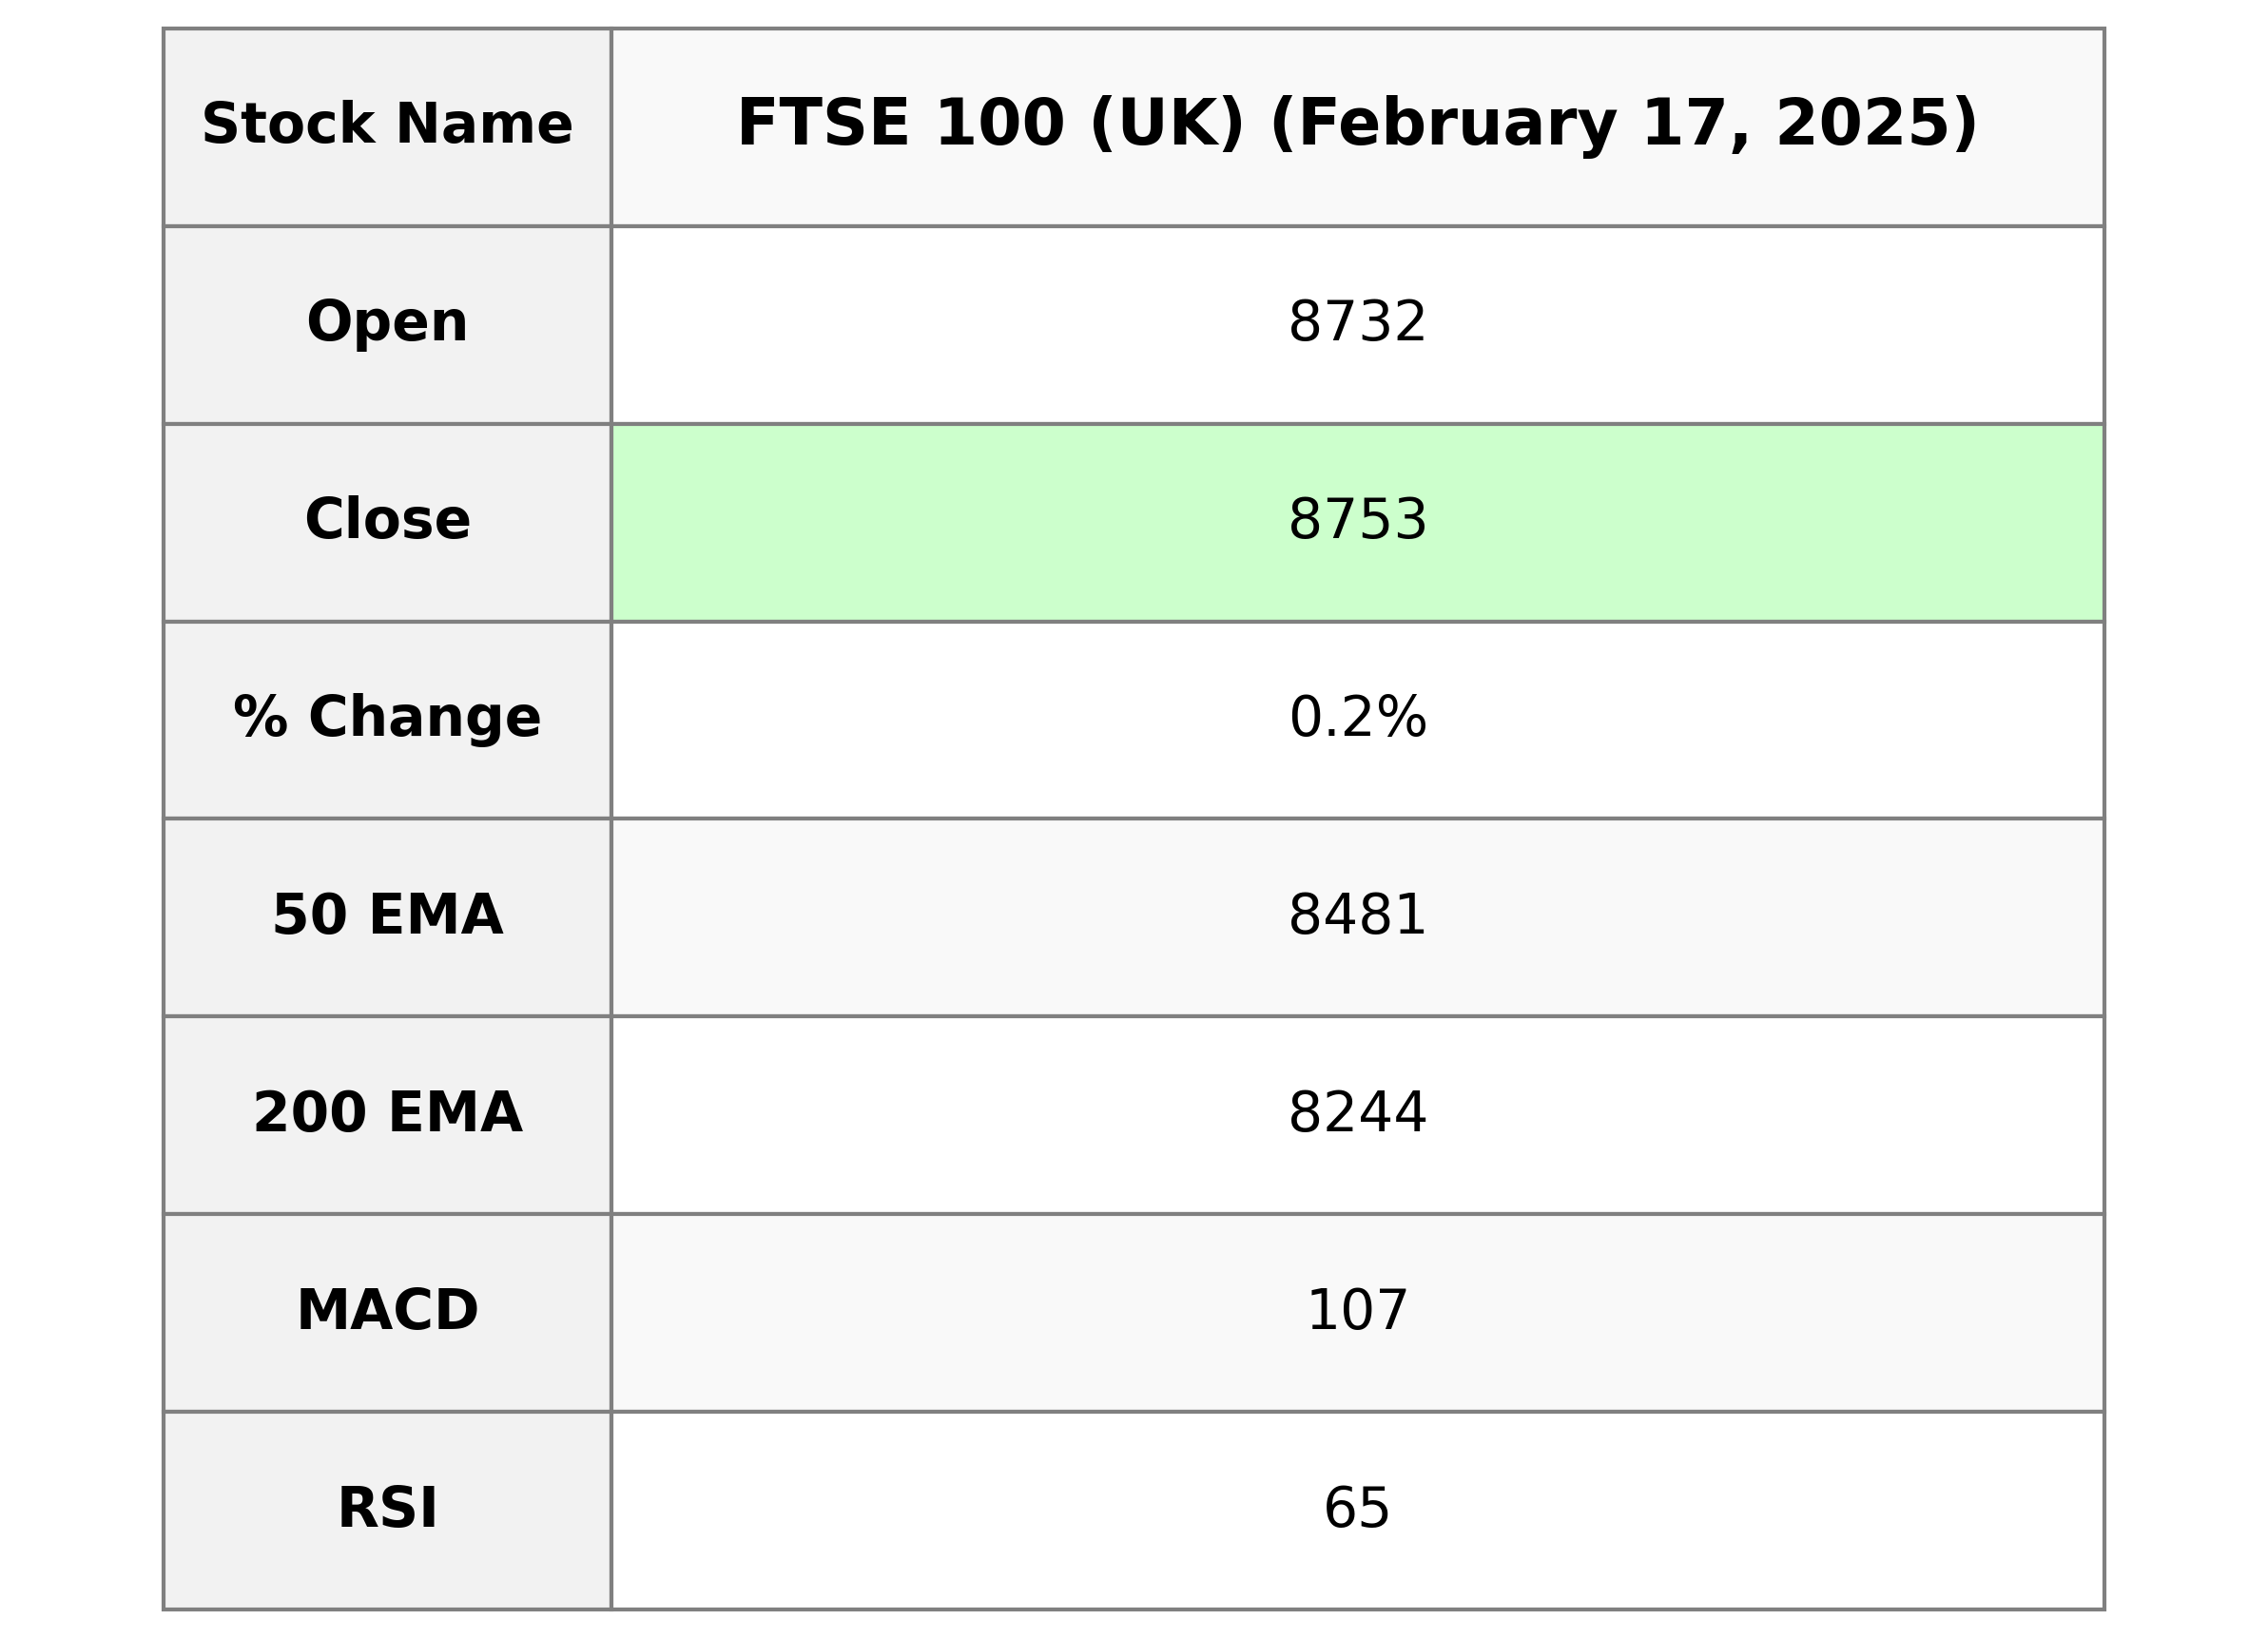
FTSE 100 (UK) opened at 8732.46 and closed at 8753.30, showing a modest increase with a percentage change of 0.24% (20.80 points). The market indicators reveal strong momentum, as seen in the RSI of 65.42 and a positive MACD of 107.05. There is no available data for Market Cap, PE Ratio, EPS, Sector, Industry, or Country.
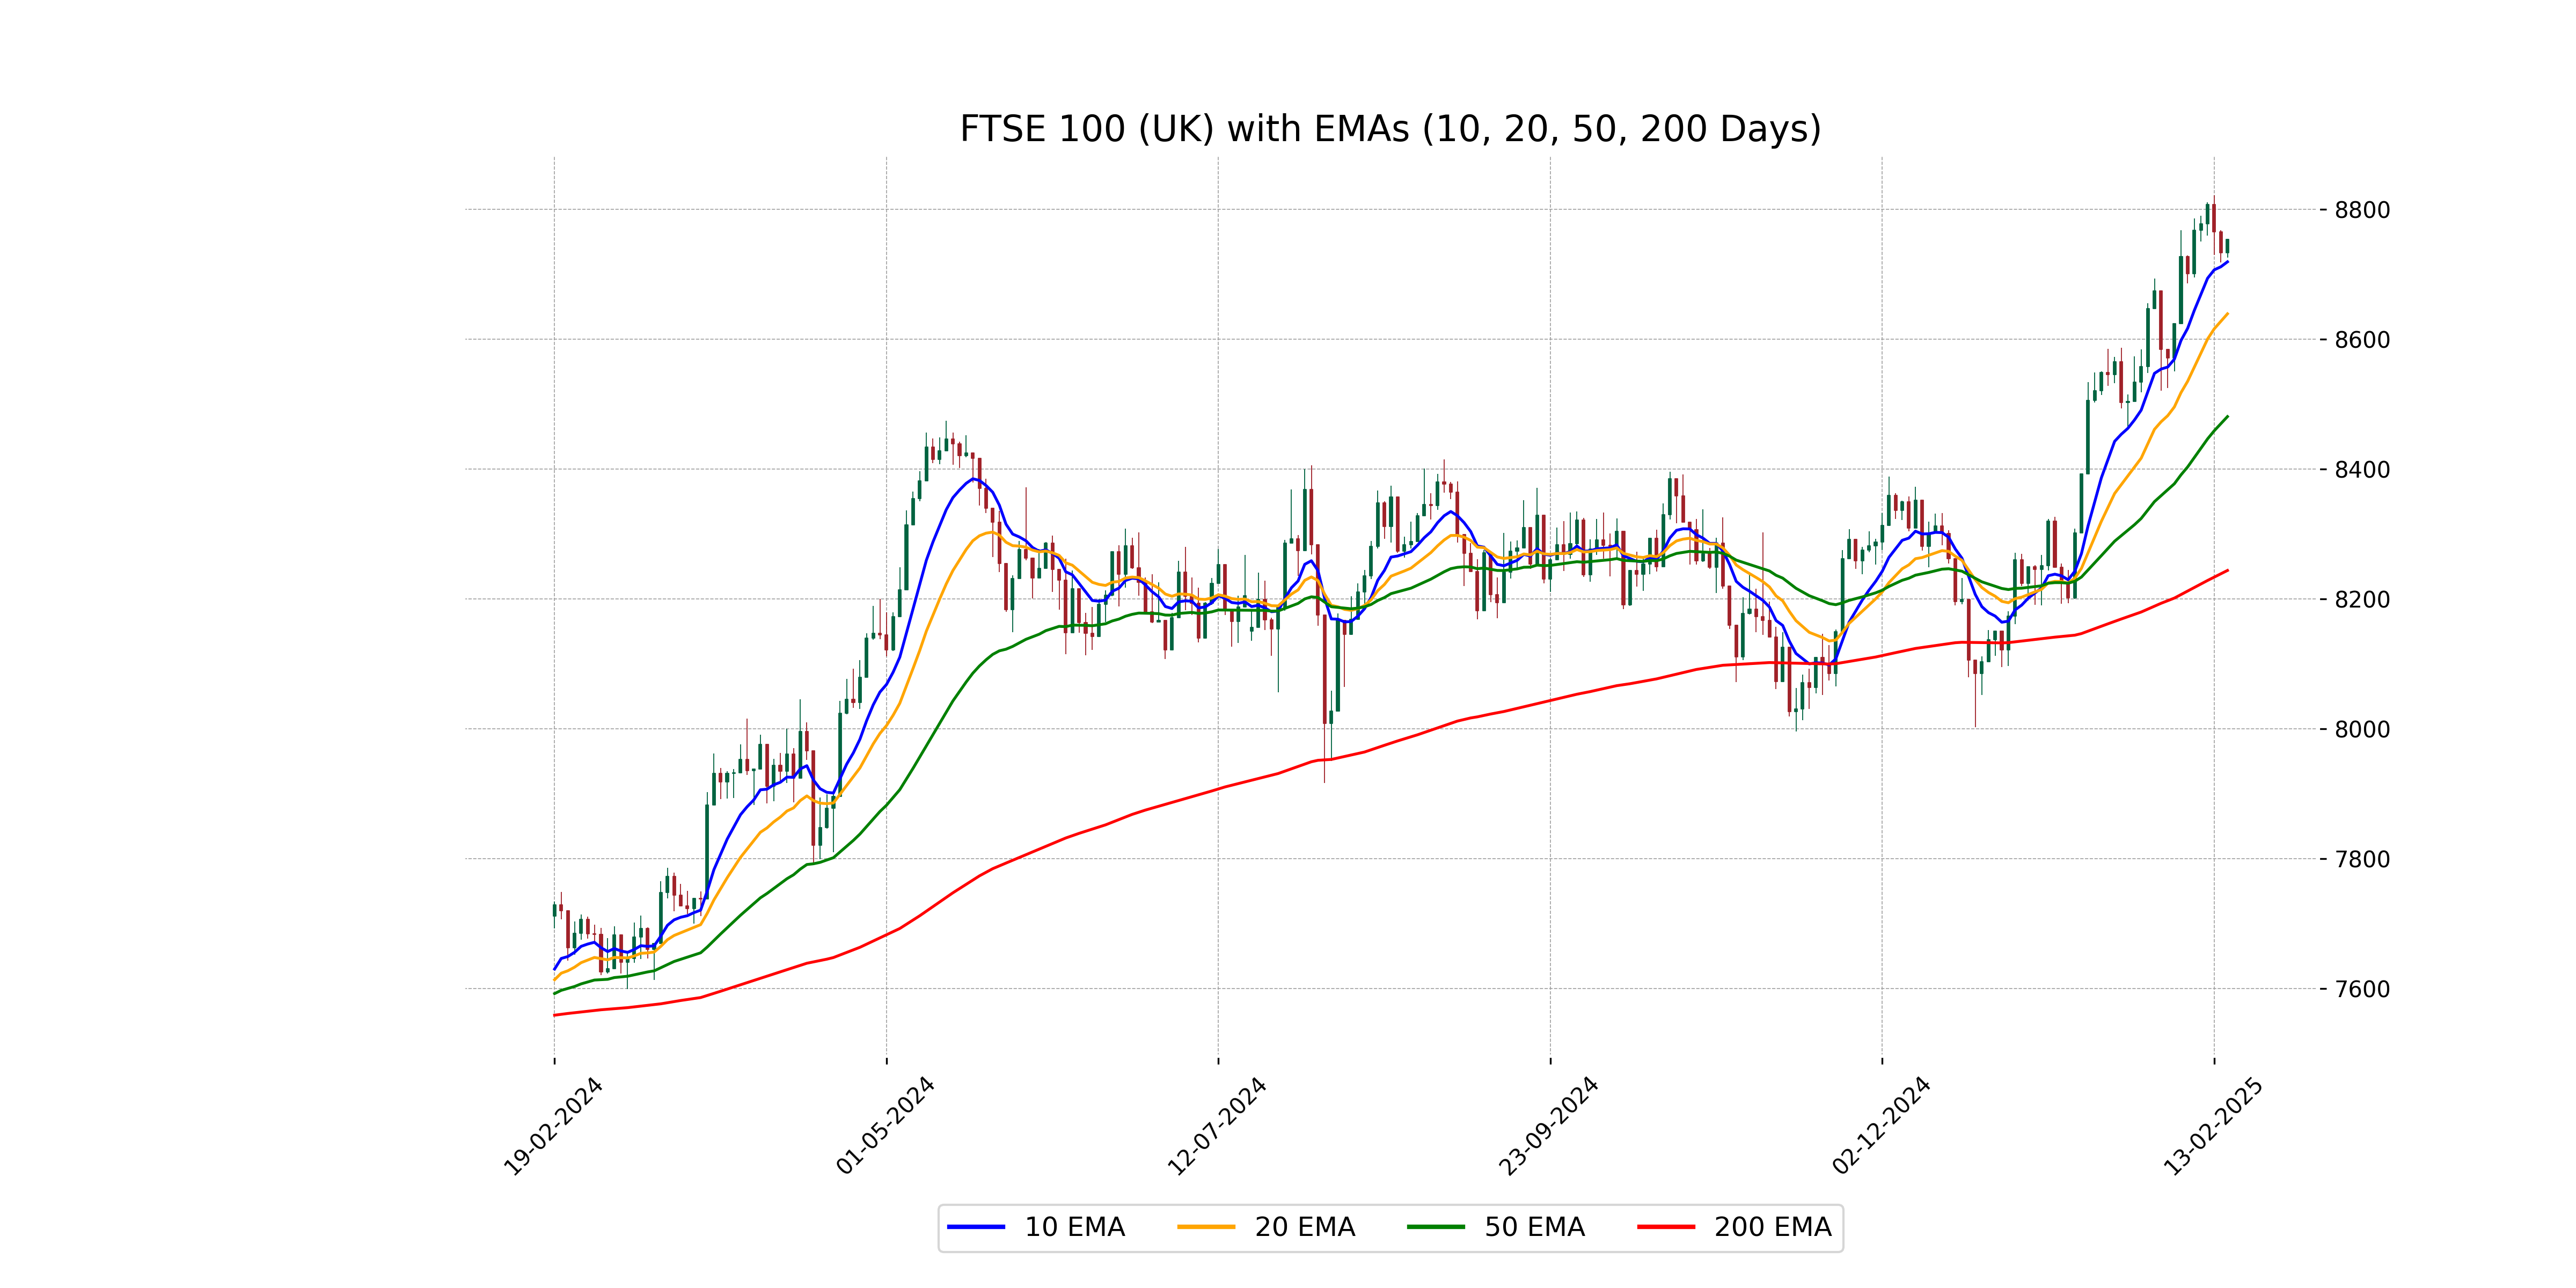
Relationship with Key Moving Averages
The FTSE 100 (UK) is currently trading above its key moving averages, with its close price of 8753.30 surpassing the 10 EMA (8718.84), 20 EMA (8638.78), 50 EMA (8480.51), and 200 EMA (8243.57). This indicates a bullish trend as the index remains above these significant moving average levels.
Moving Averages Trend (MACD)
**FTSE 100 (UK) MACD Analysis:** The MACD value of 107.05 is slightly above the MACD Signal line at 106.28, indicating a potential bullish momentum. This suggests a possible continuation of the upward trend for FTSE 100 in the near term.
RSI Analysis
The FTSE 100's RSI is currently 65.42, placing it in the neutral to slightly overbought territory, typically indicating that while the stock isn't overbought yet, it's approaching such levels. Continued upward price movement could push it closer to the 70 threshold, which is generally considered overbought.
Analysis for DAX (Germany) - February 17, 2025
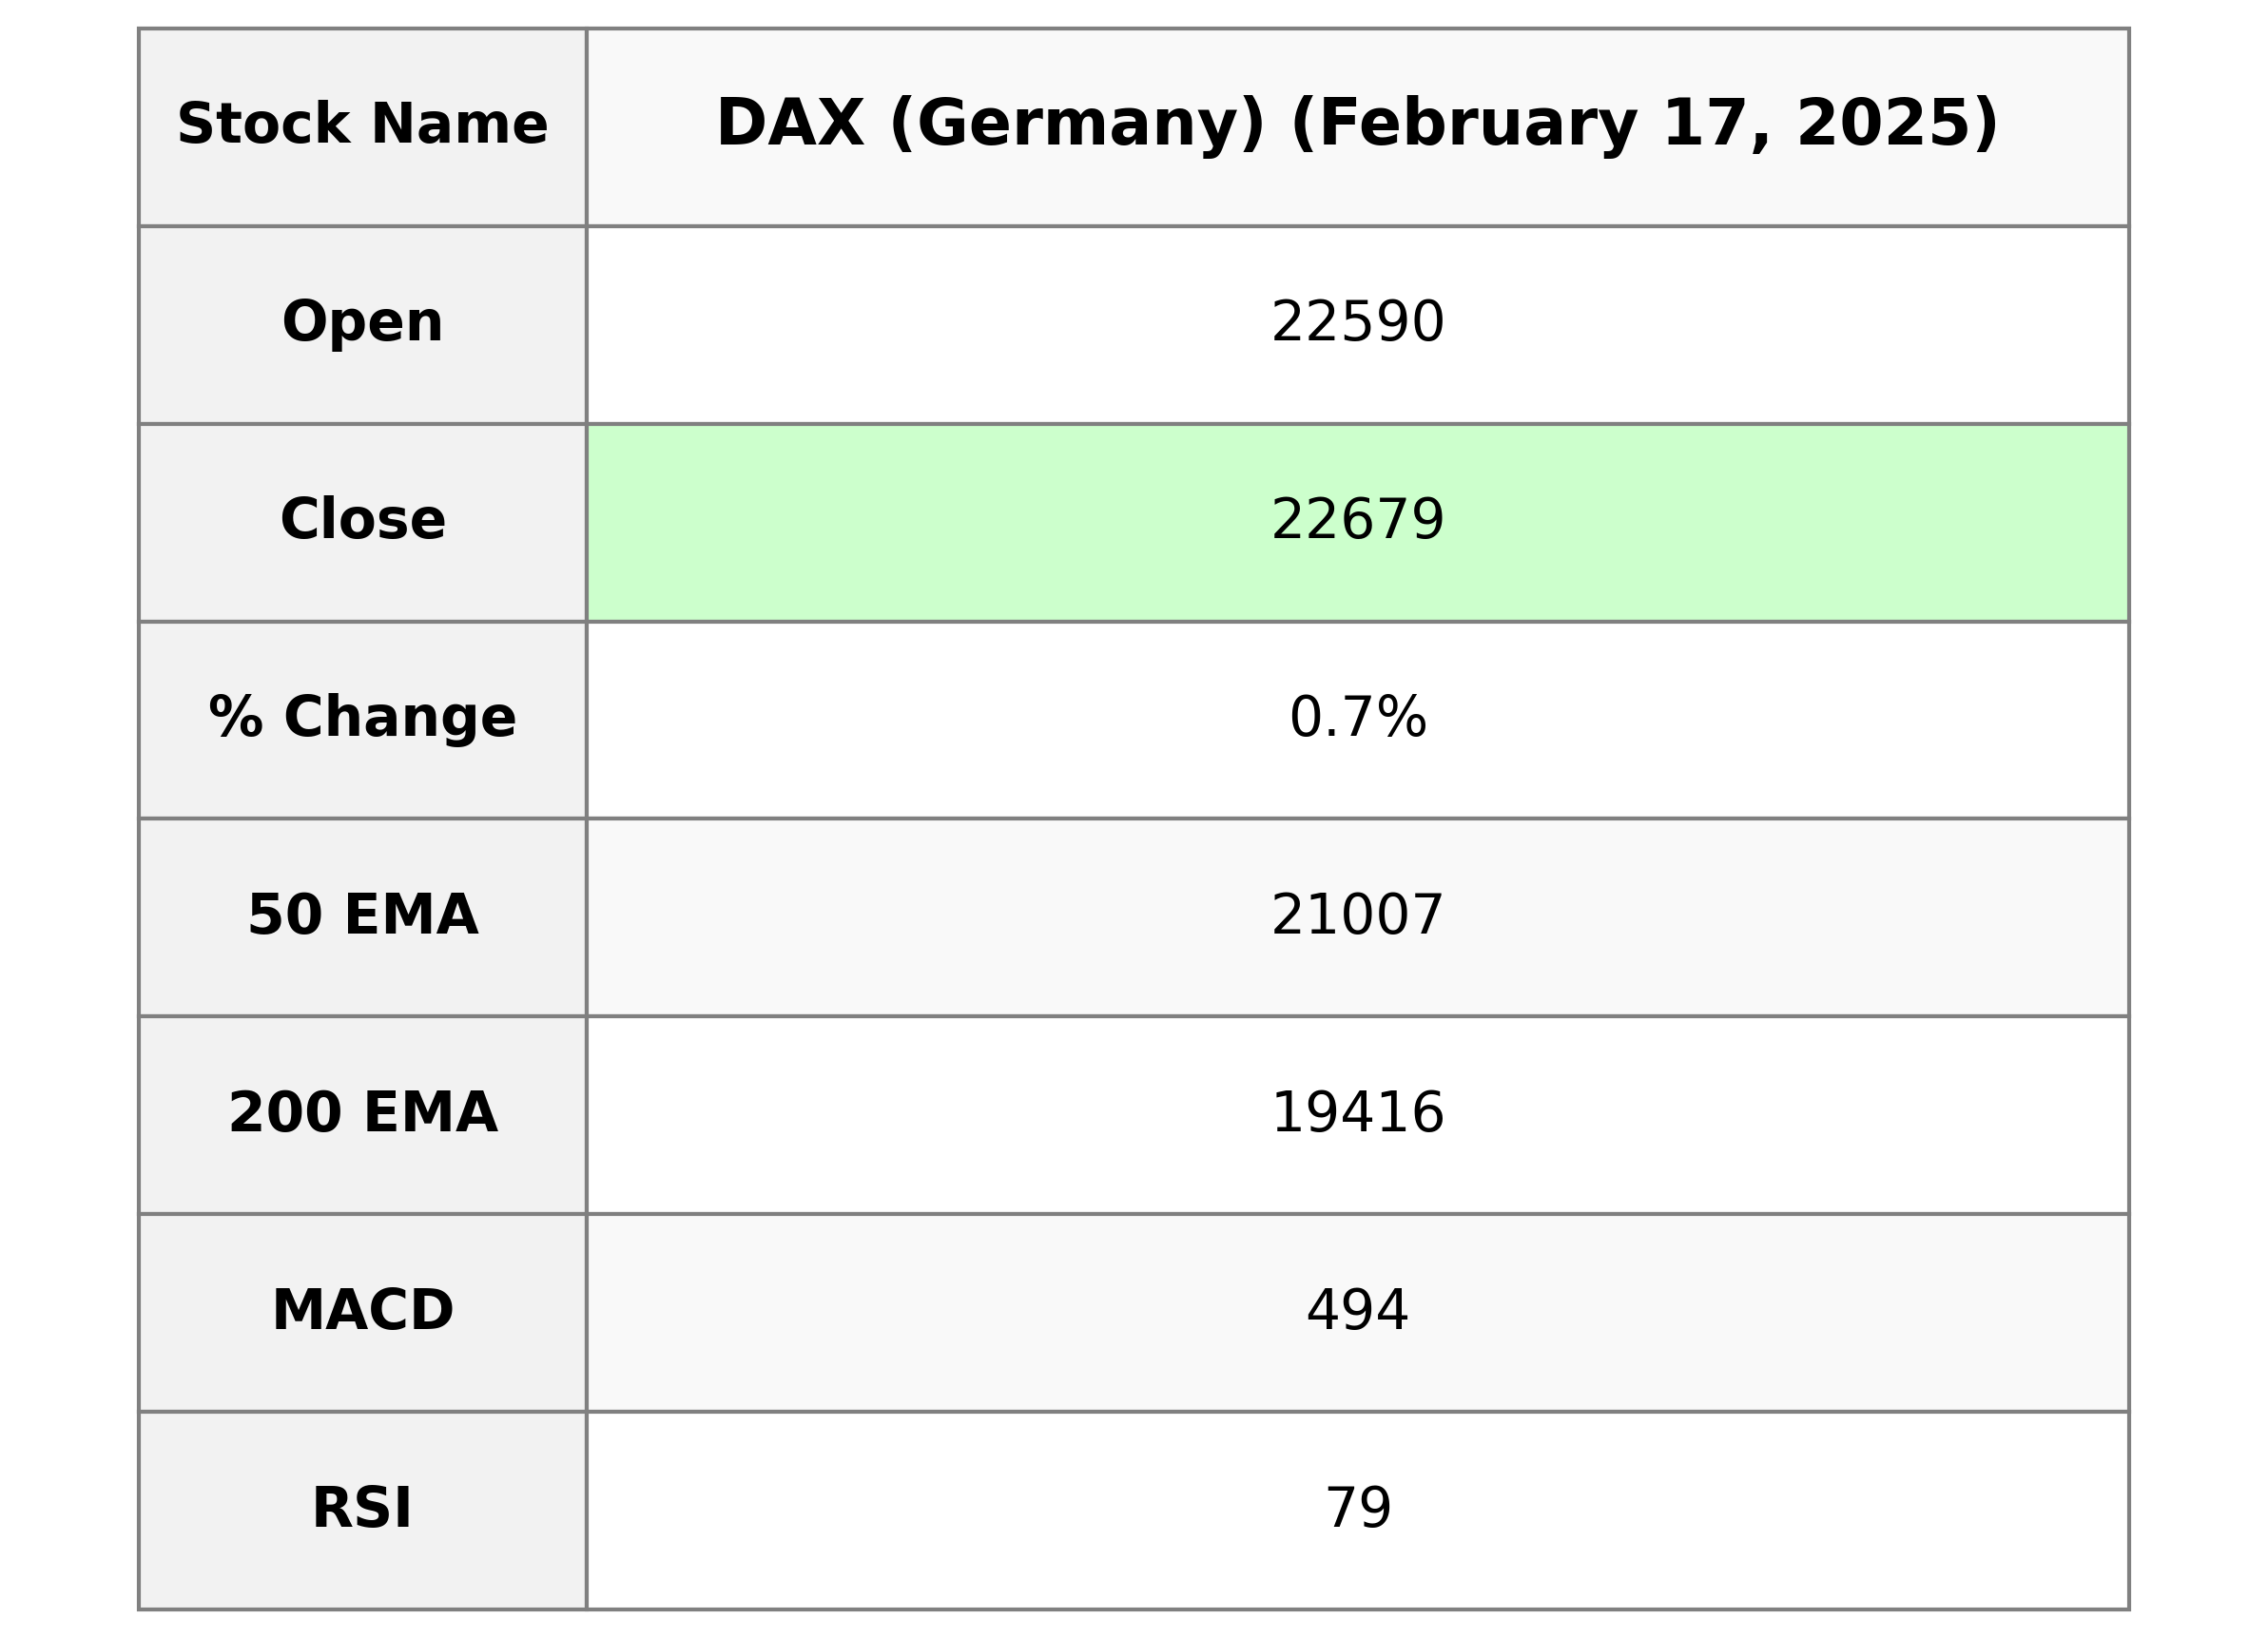
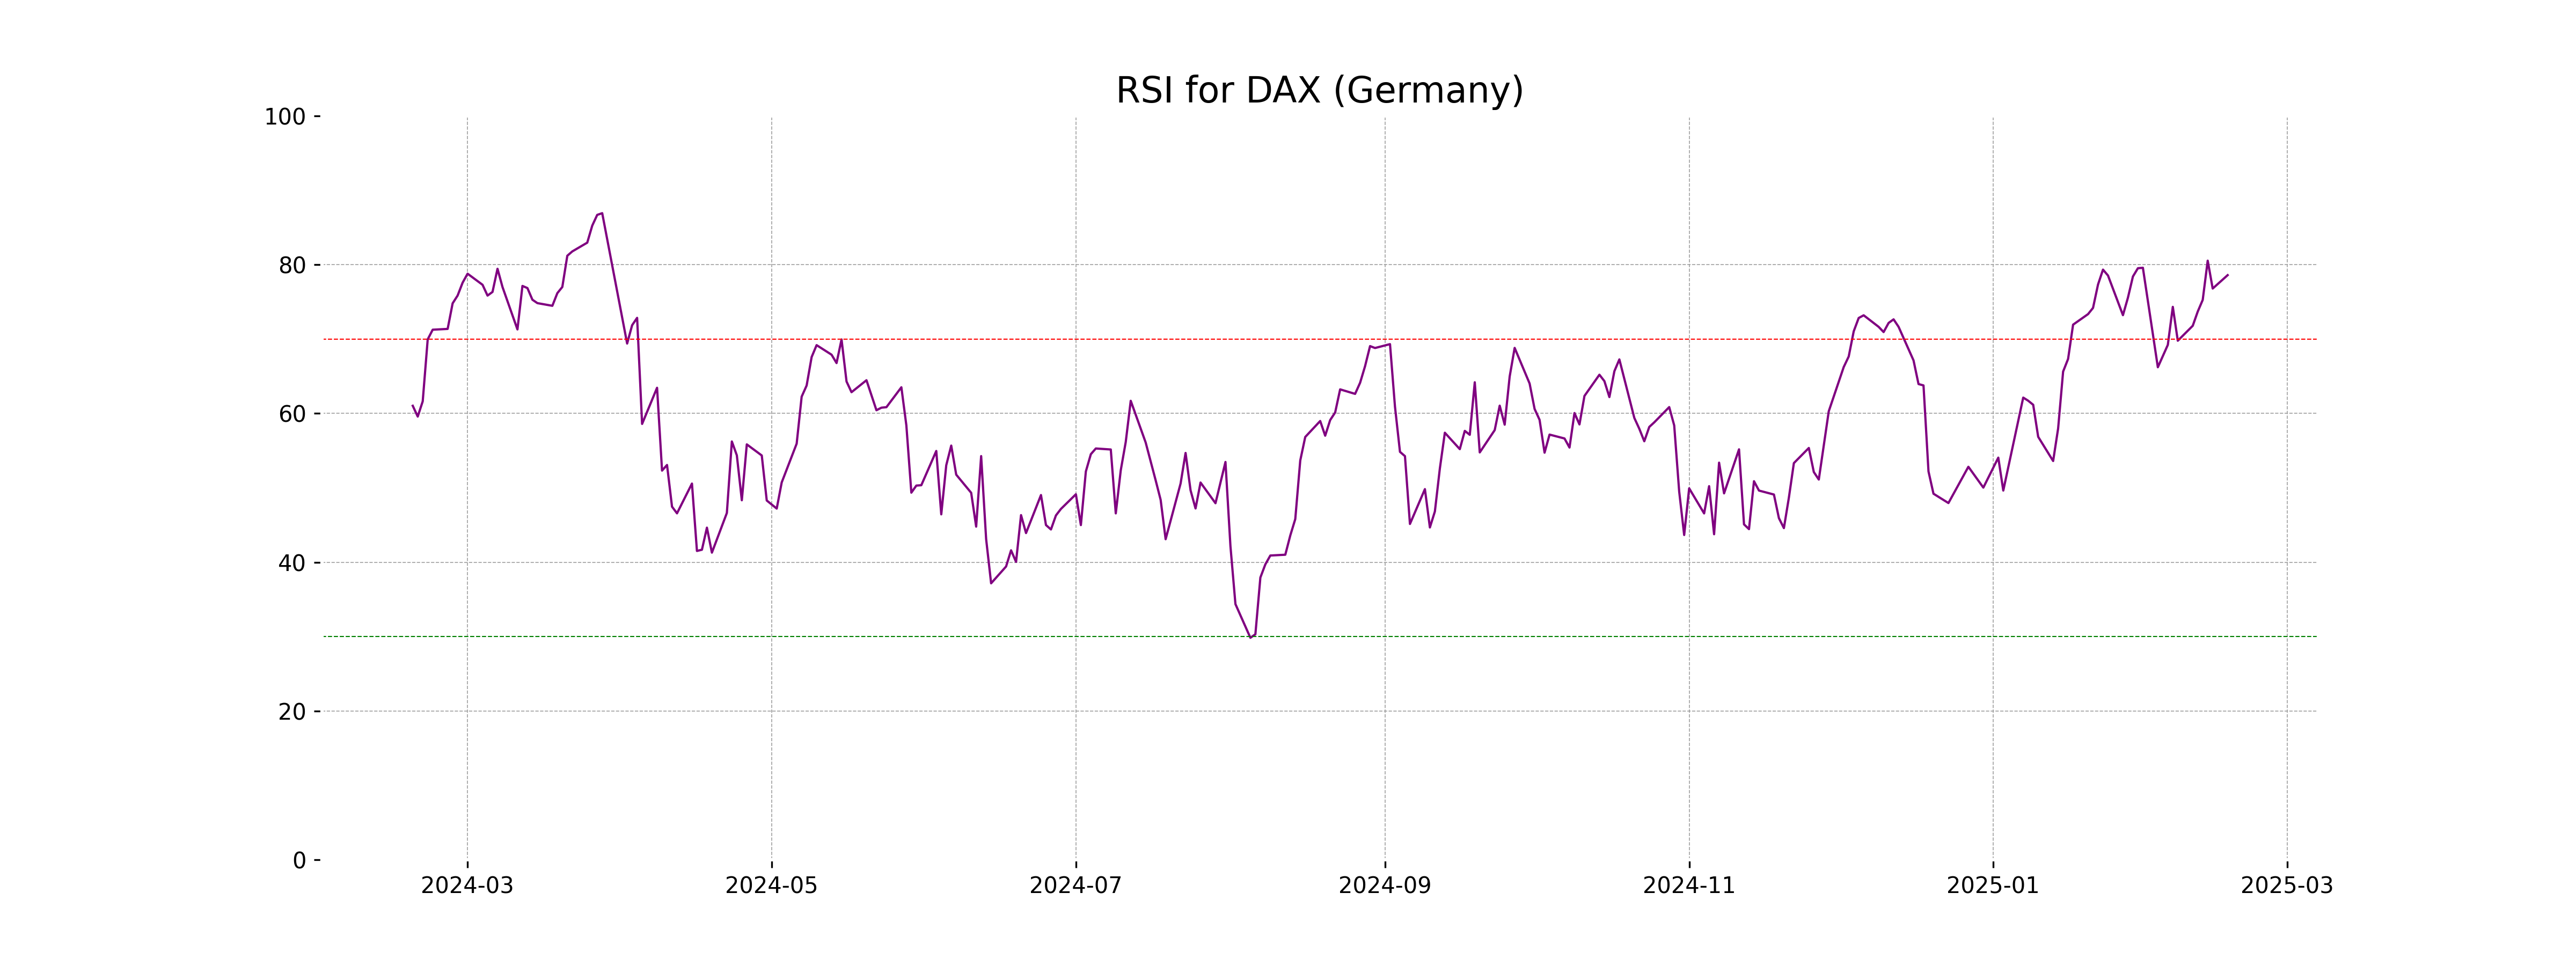
**DAX (Germany) Performance**: The DAX index opened at 22,589.91 and closed at 22,678.98, marking a modest gain with a percentage change of 0.74% and a points increase of 165.56. The RSI value of 78.59 suggests overbought conditions, while the MACD indicates a strong upward momentum above its signal line. Despite the gains, volume data is unavailable, making it challenging to assess the trade intensity.
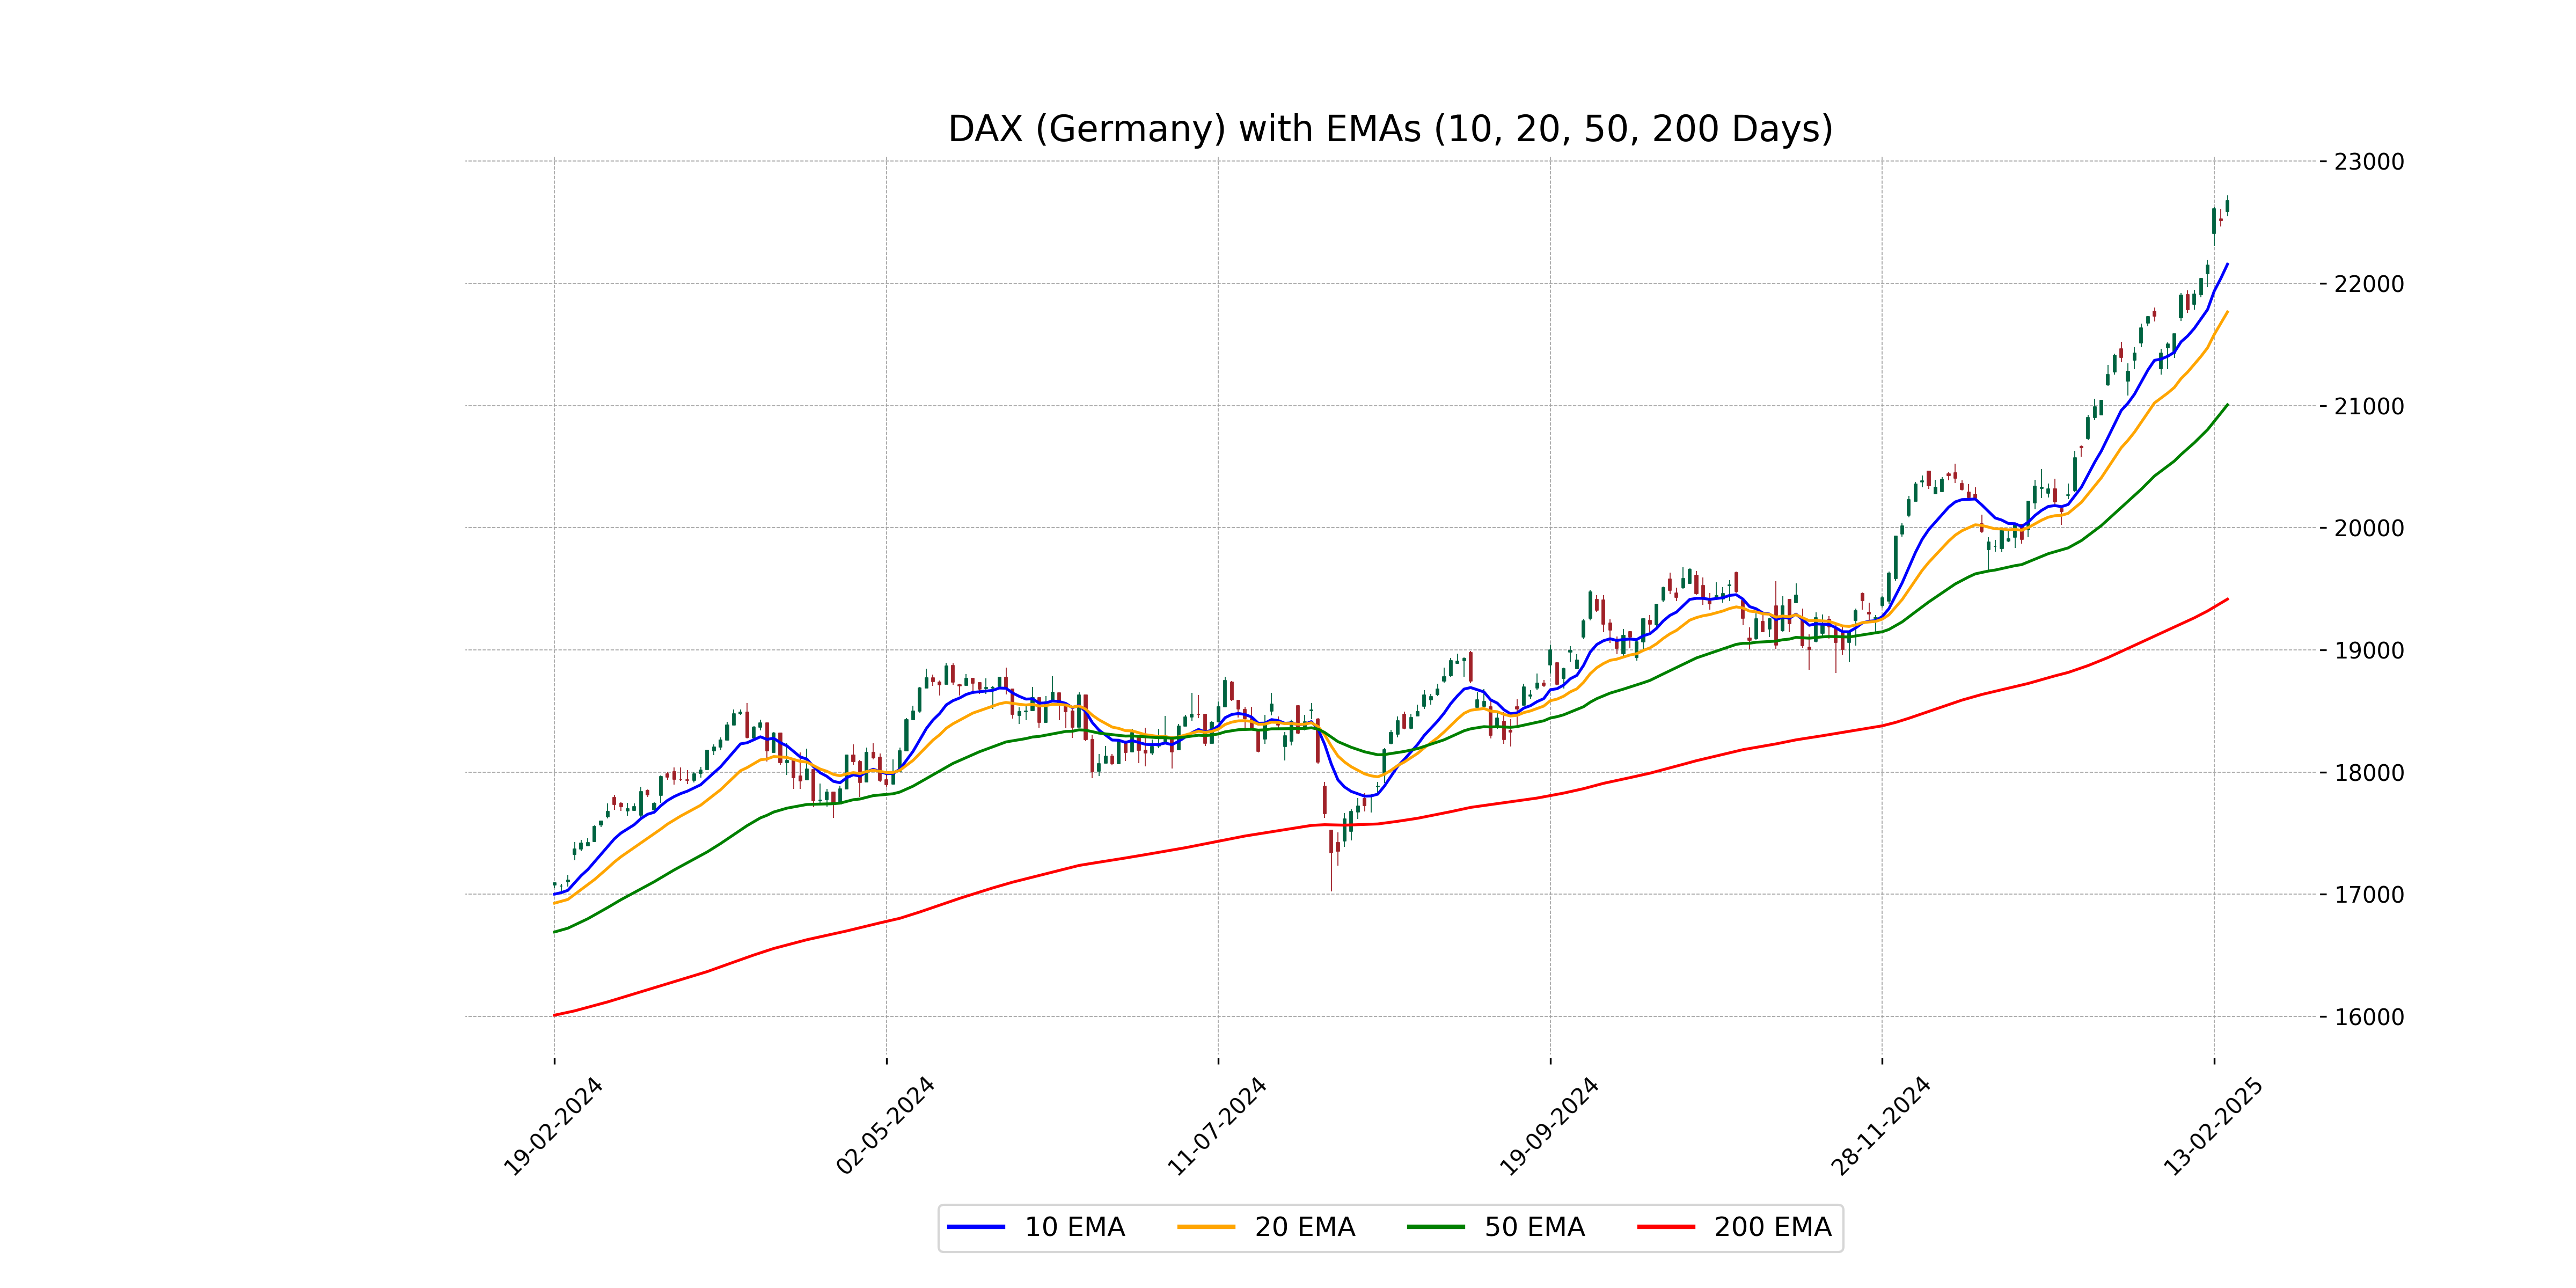
Relationship with Key Moving Averages
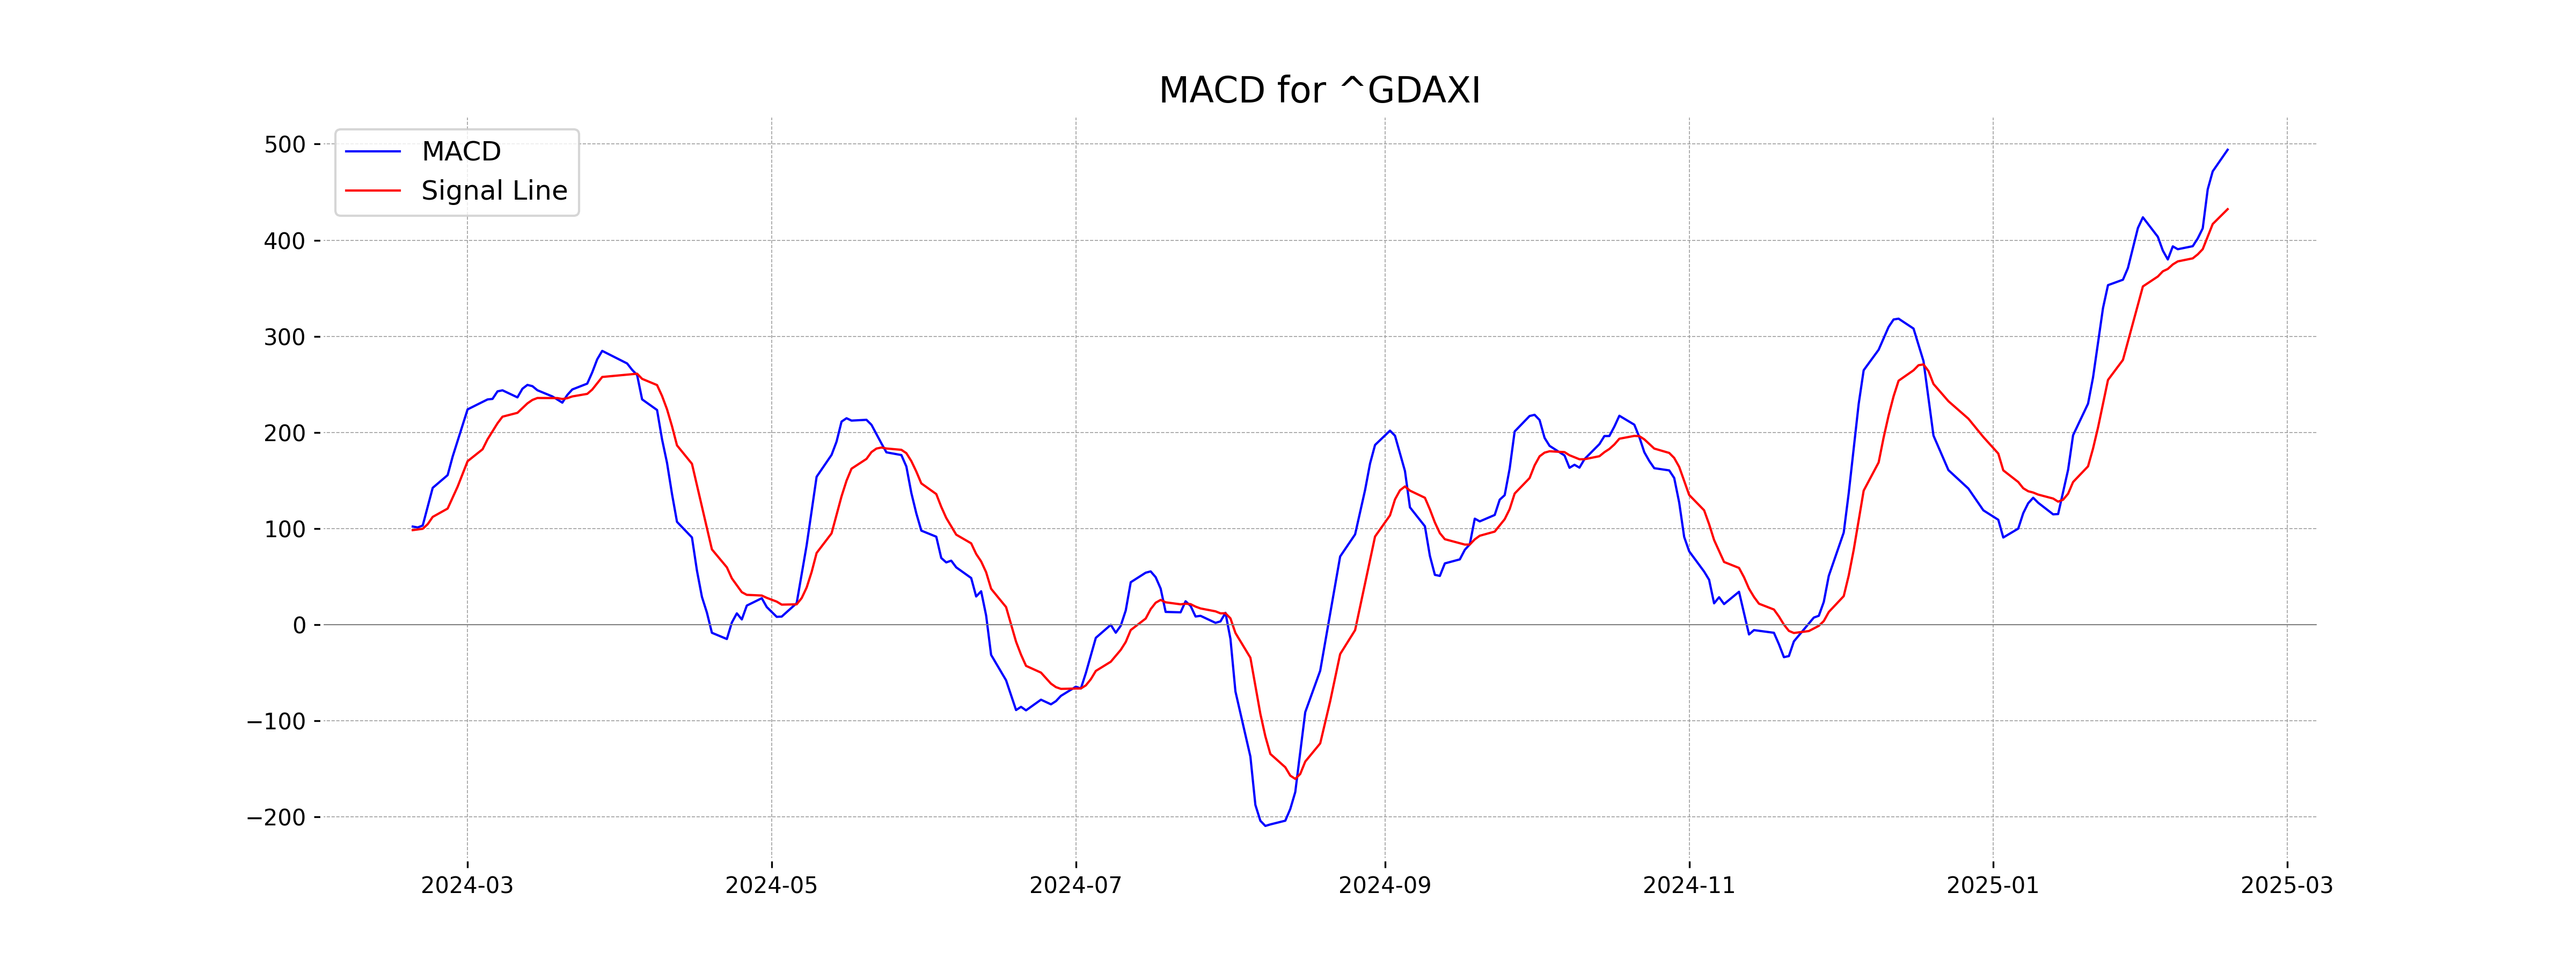
The DAX (Germany) has a closing price of 22,678.98, which is above all its key moving averages (10 EMA: 22,157.17, 20 EMA: 21,766.42, 50 EMA: 21,006.59, 200 EMA: 19,415.90), suggesting a strong upward trend. The RSI of 78.59 indicates it might be overbought, and the MACD of 494.11 being above the Signal line of 432.25 also supports the bullish momentum.
Moving Averages Trend (MACD)
The MACD for DAX is 494.11 while the MACD Signal is 432.25, indicating a bullish crossover as the MACD line is above the signal line. This could suggest upward momentum in the price action.
RSI Analysis
The RSI for DAX (Germany) is 78.59, which indicates that the index is in an overbought condition. Typically, an RSI above 70 suggests that the stock or index might be overvalued and due for a correction.
Analysis for S&P 500 (US) - February 17, 2025
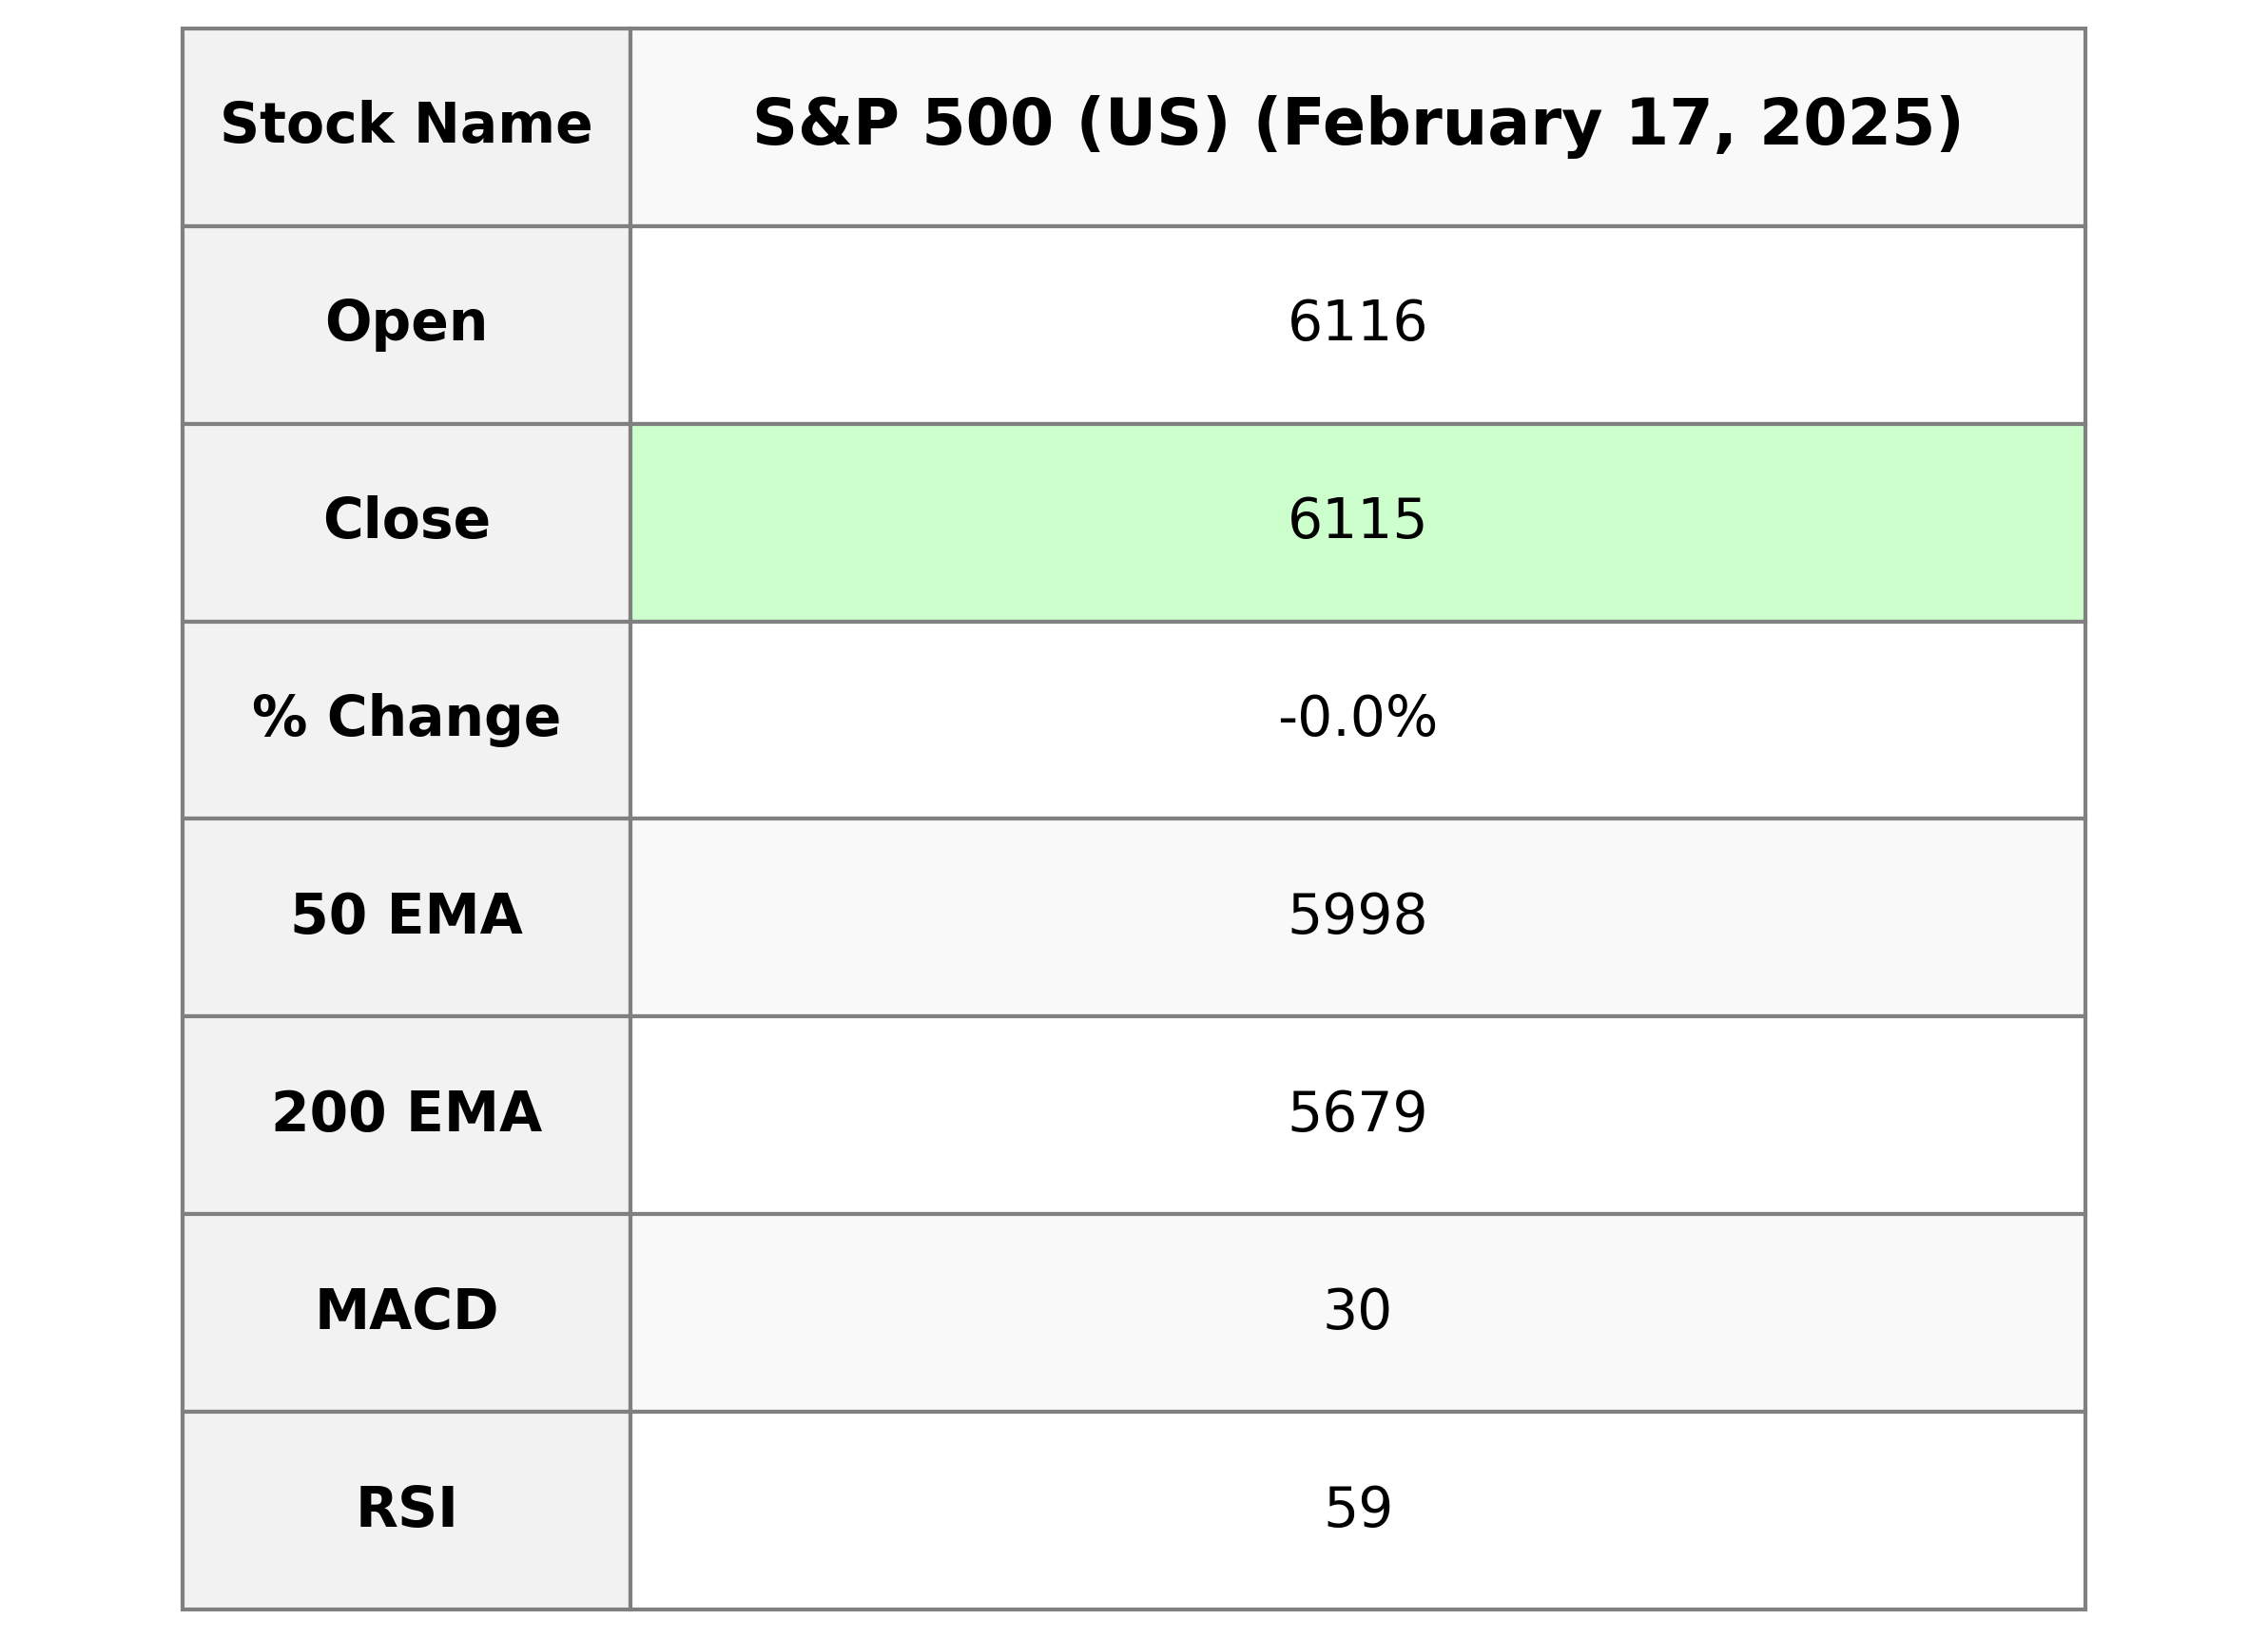
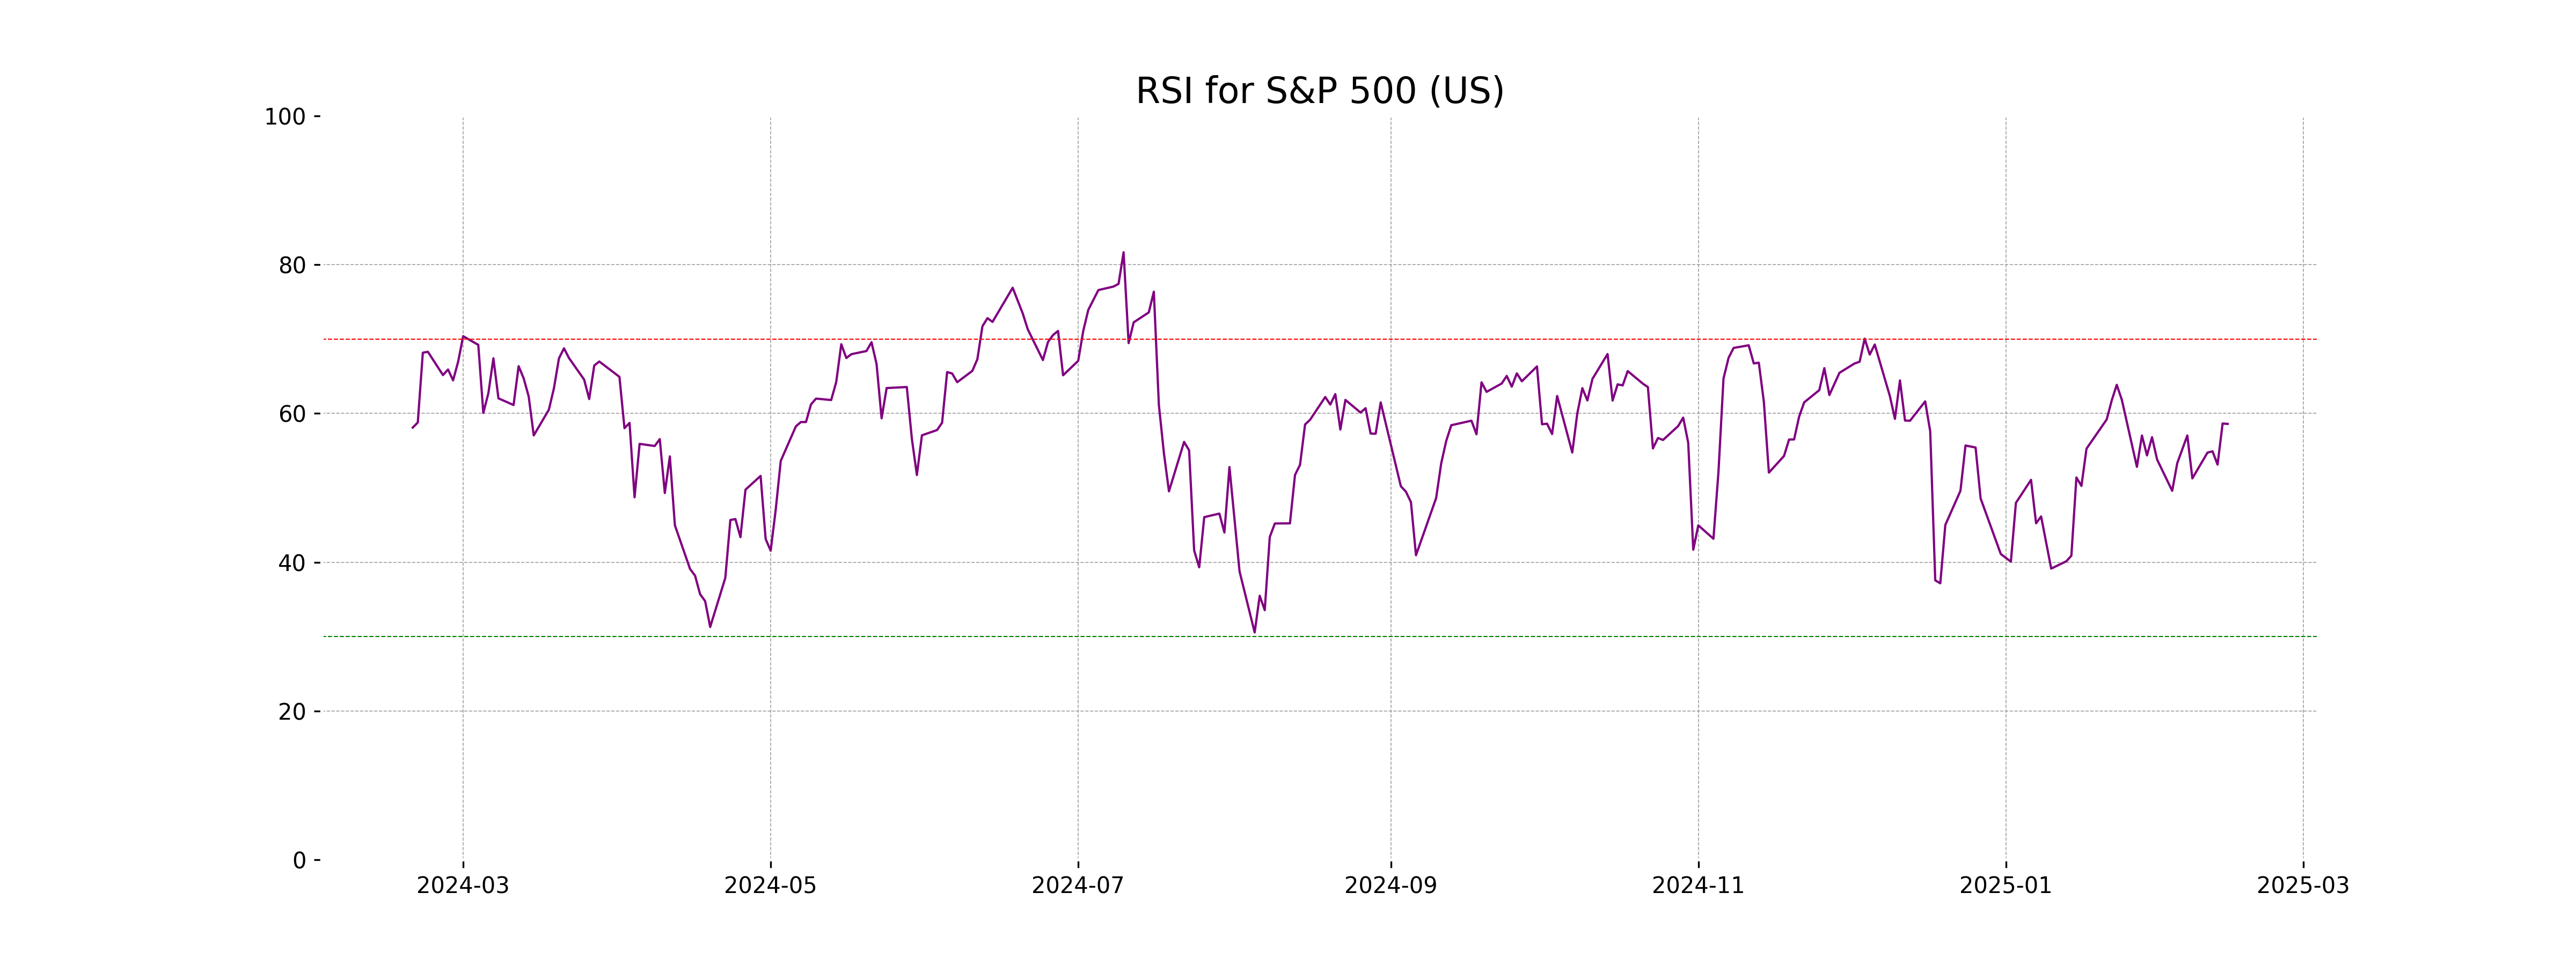
The S&P 500 (US) opened at 6115.52 and closed slightly lower at 6114.63, indicating a minimal decrease of -0.0072% in performance. The index experienced a daily high of 6127.47 and a low of 6107.62, with a substantial trading volume of 4.33 billion. The Relative Strength Index (RSI) stands at 58.60, suggesting a moderately positive momentum in the market.
Relationship with Key Moving Averages
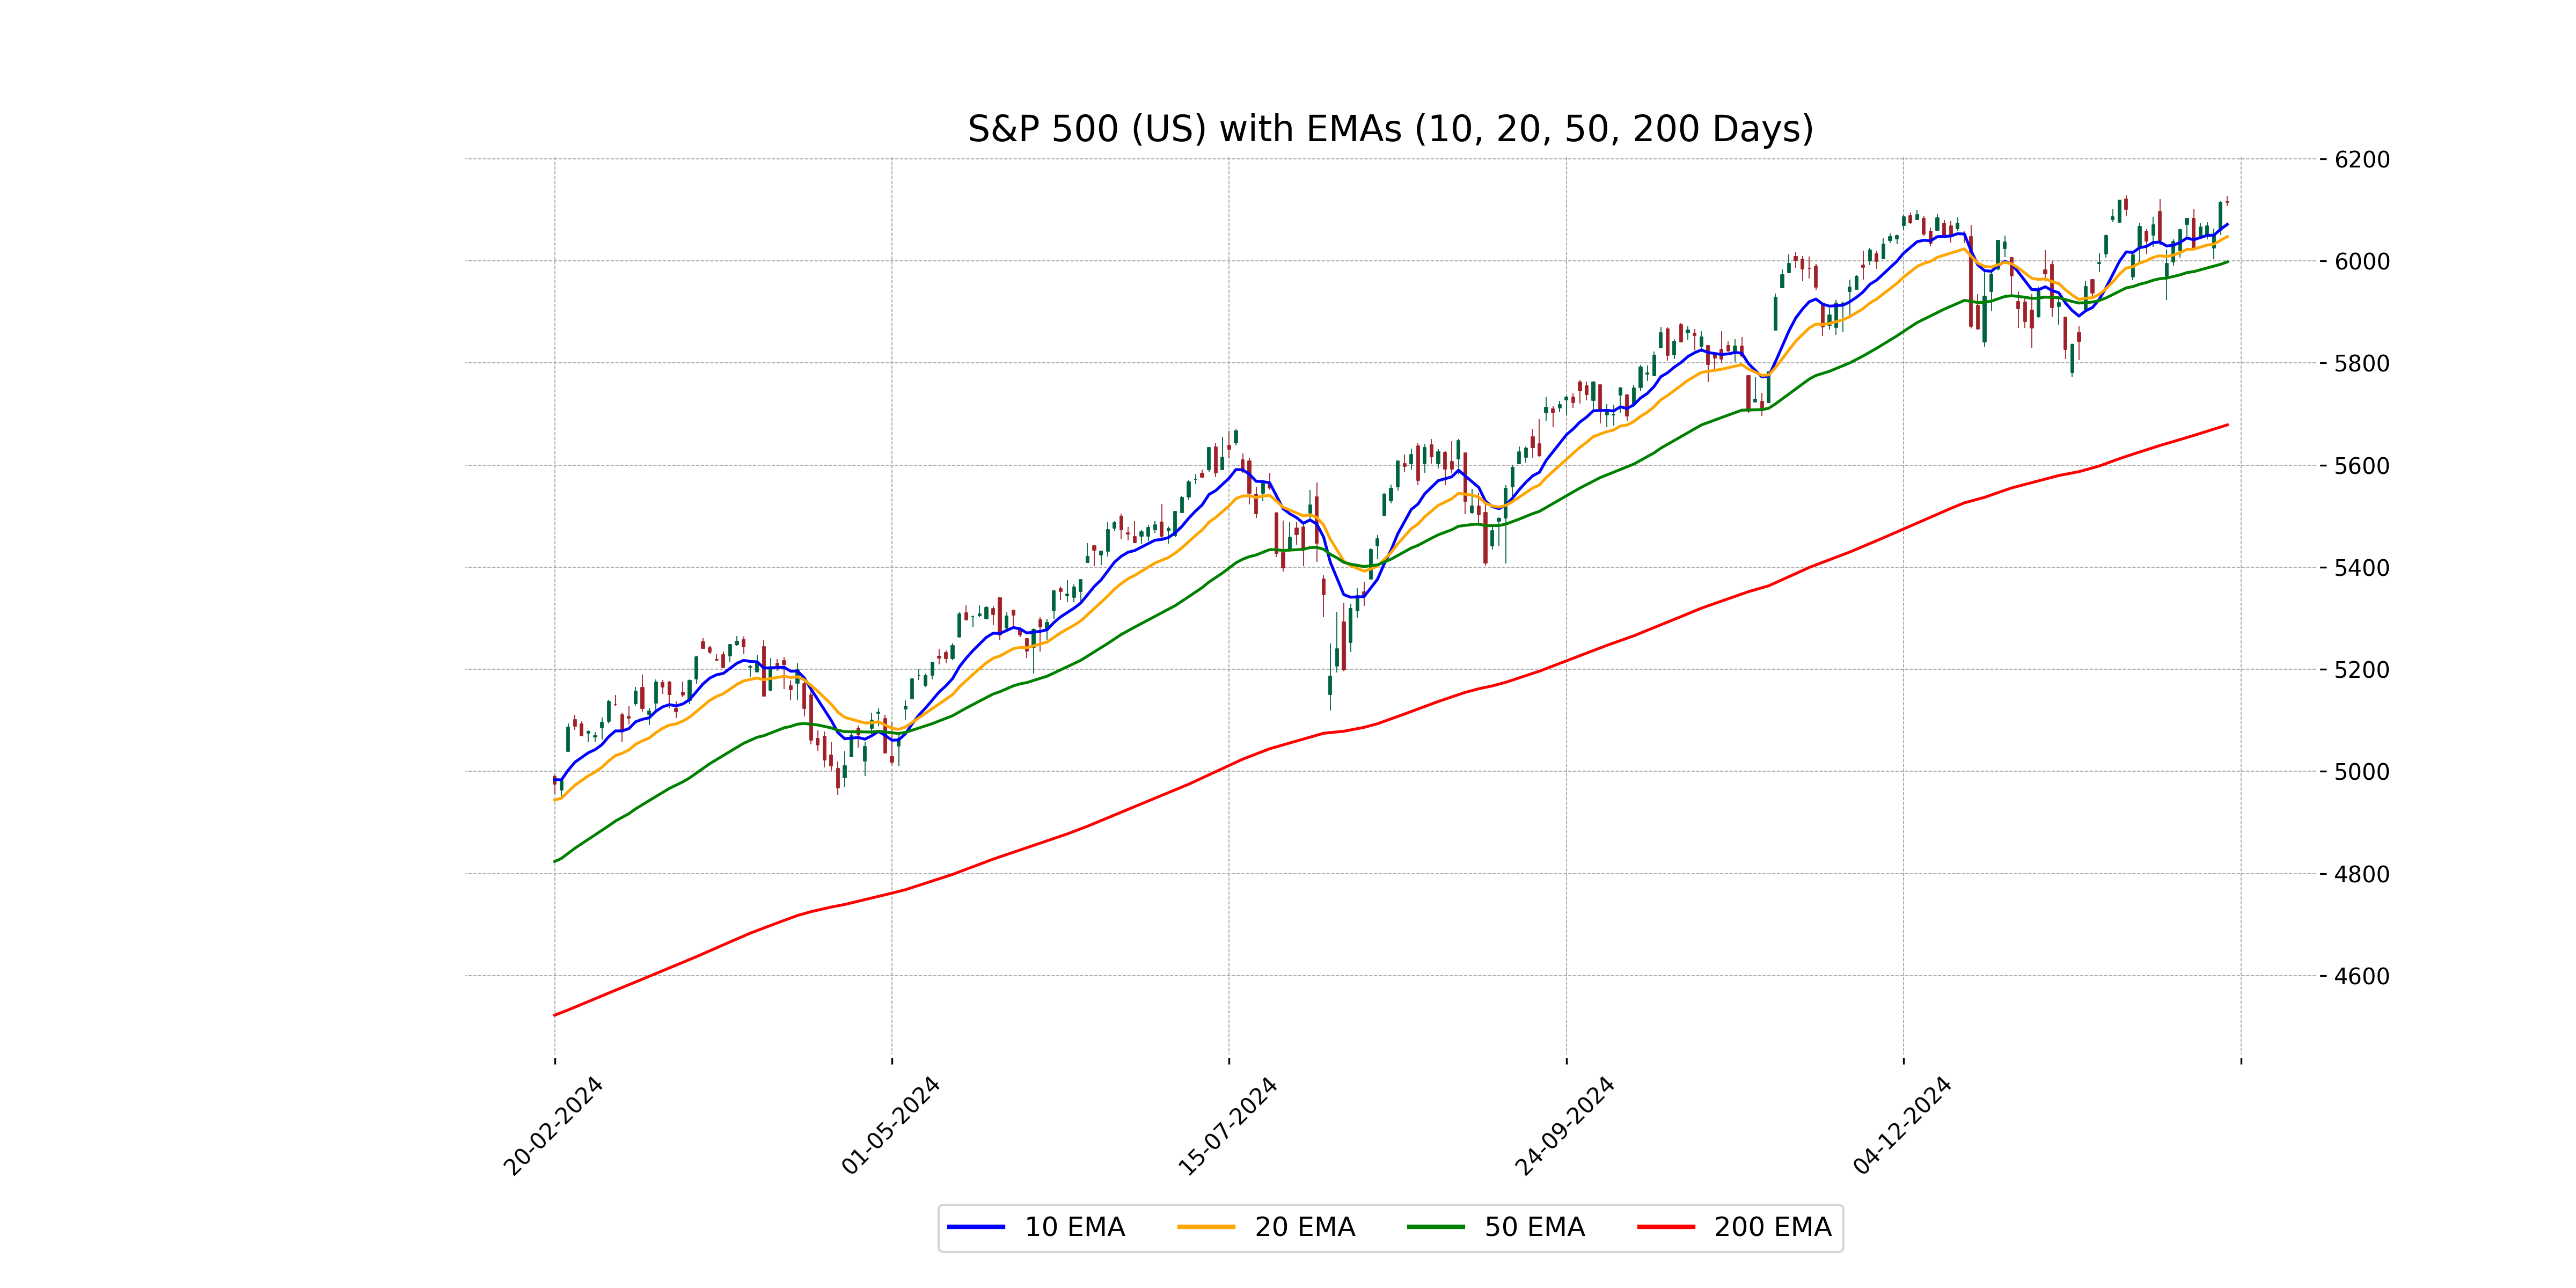
The closing price for the S&P 500 is 6114.63, which is above the 50-day EMA of 5998.22 and significantly above the 200-day EMA of 5678.90, indicating a bullish trend in the short to medium term. It is also above the 10-day EMA of 6071.75 and the 20-day EMA of 6047.91, suggesting recent momentum is positive.
Moving Averages Trend (MACD)
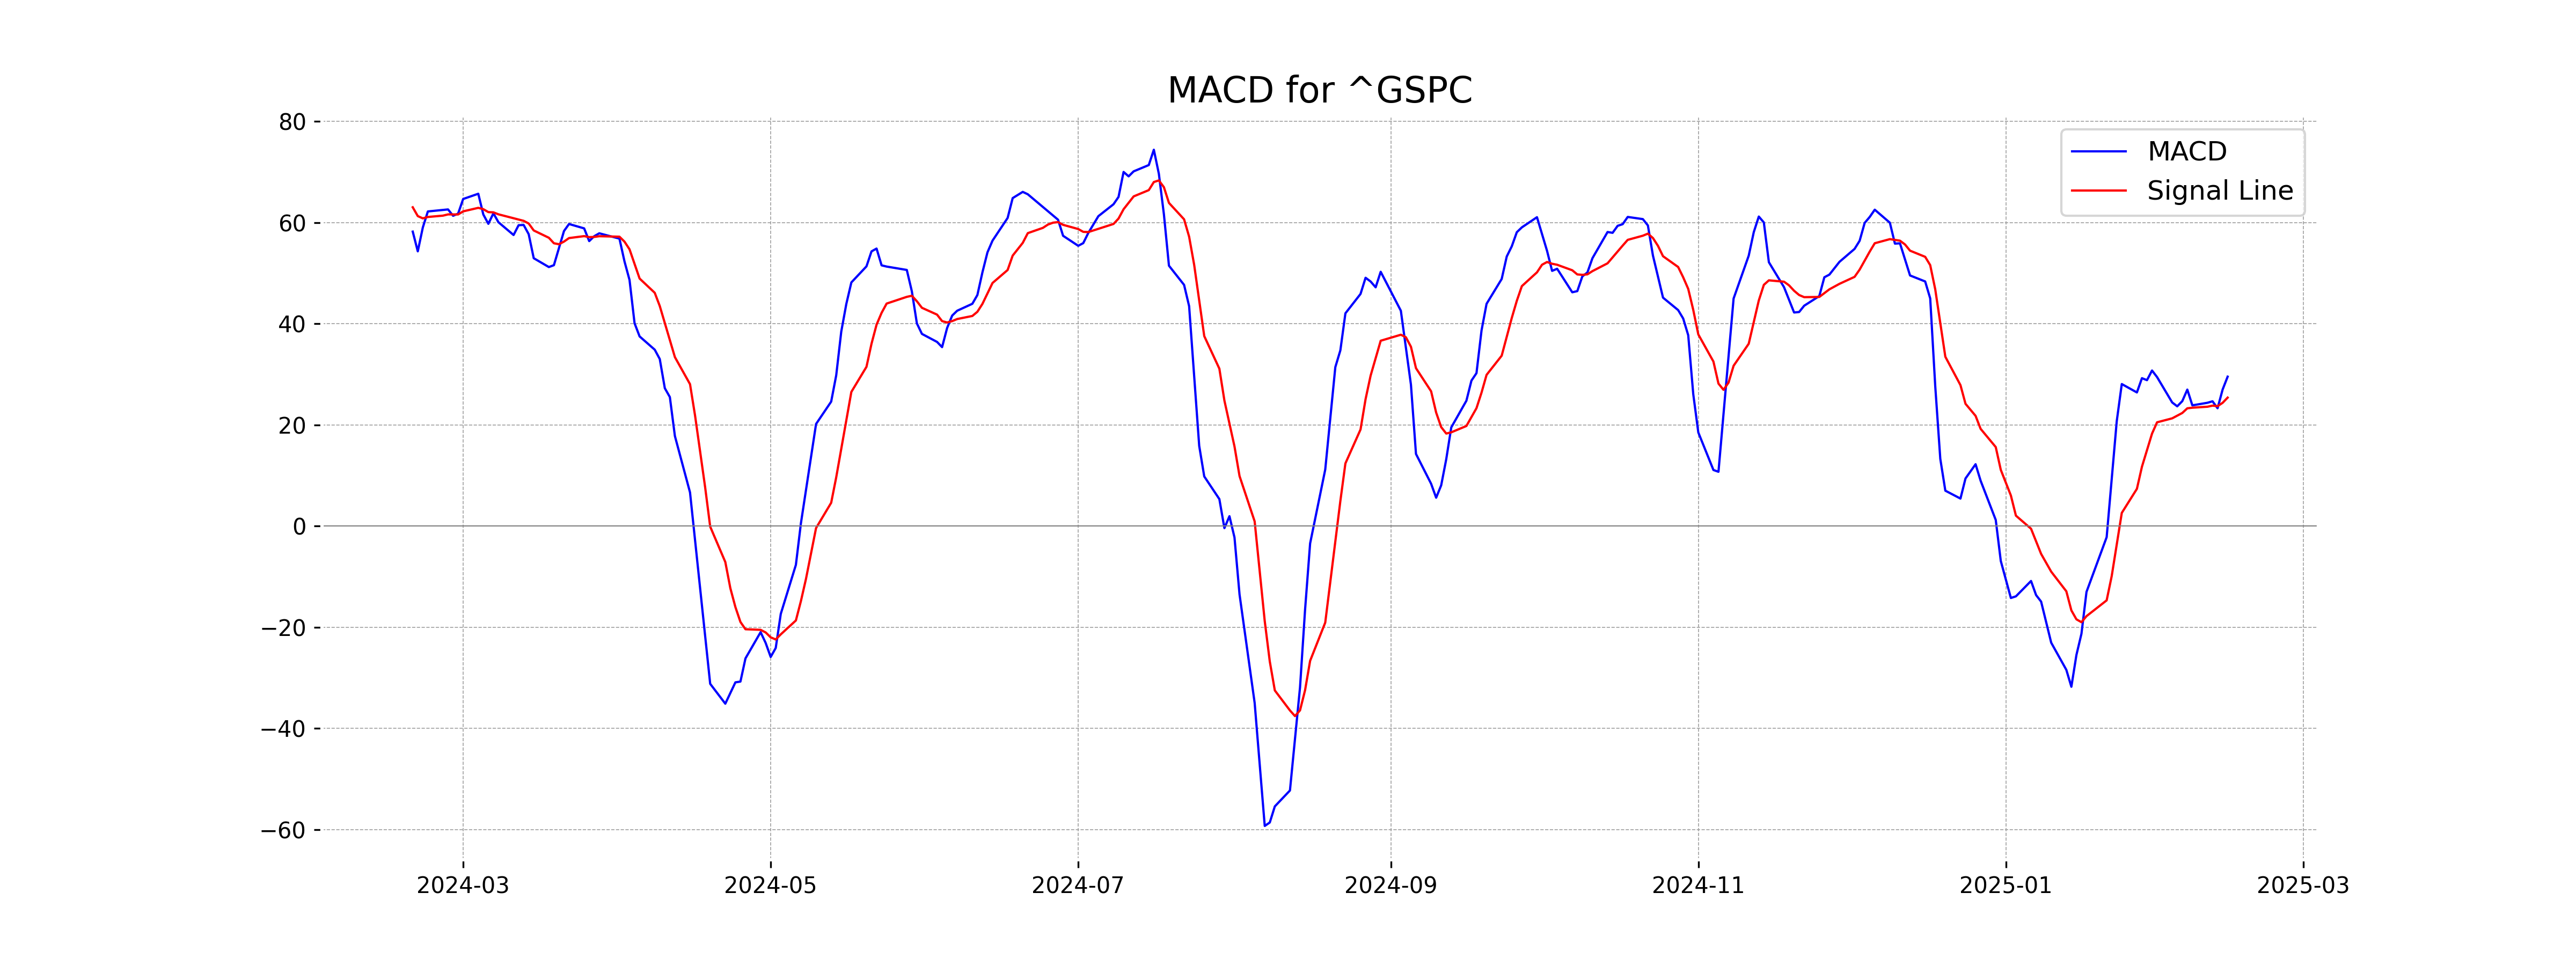
The MACD value of 29.53 suggests a potential bullish momentum for the S&P 500 compared to its signal line at 25.39. This indicates that the trend may continue to rise if the MACD remains above the signal line.
RSI Analysis
Based on the given stock data, the Relative Strength Index (RSI) for S&P 500 (US) is at 58.60. This indicates a neutral to slightly bullish momentum, as RSI values between 50 and 70 typically suggest that the stock is neither overbought nor oversold and may have room to move higher.
Analysis for Hang Seng Index (Hong Kong) - February 17, 2025
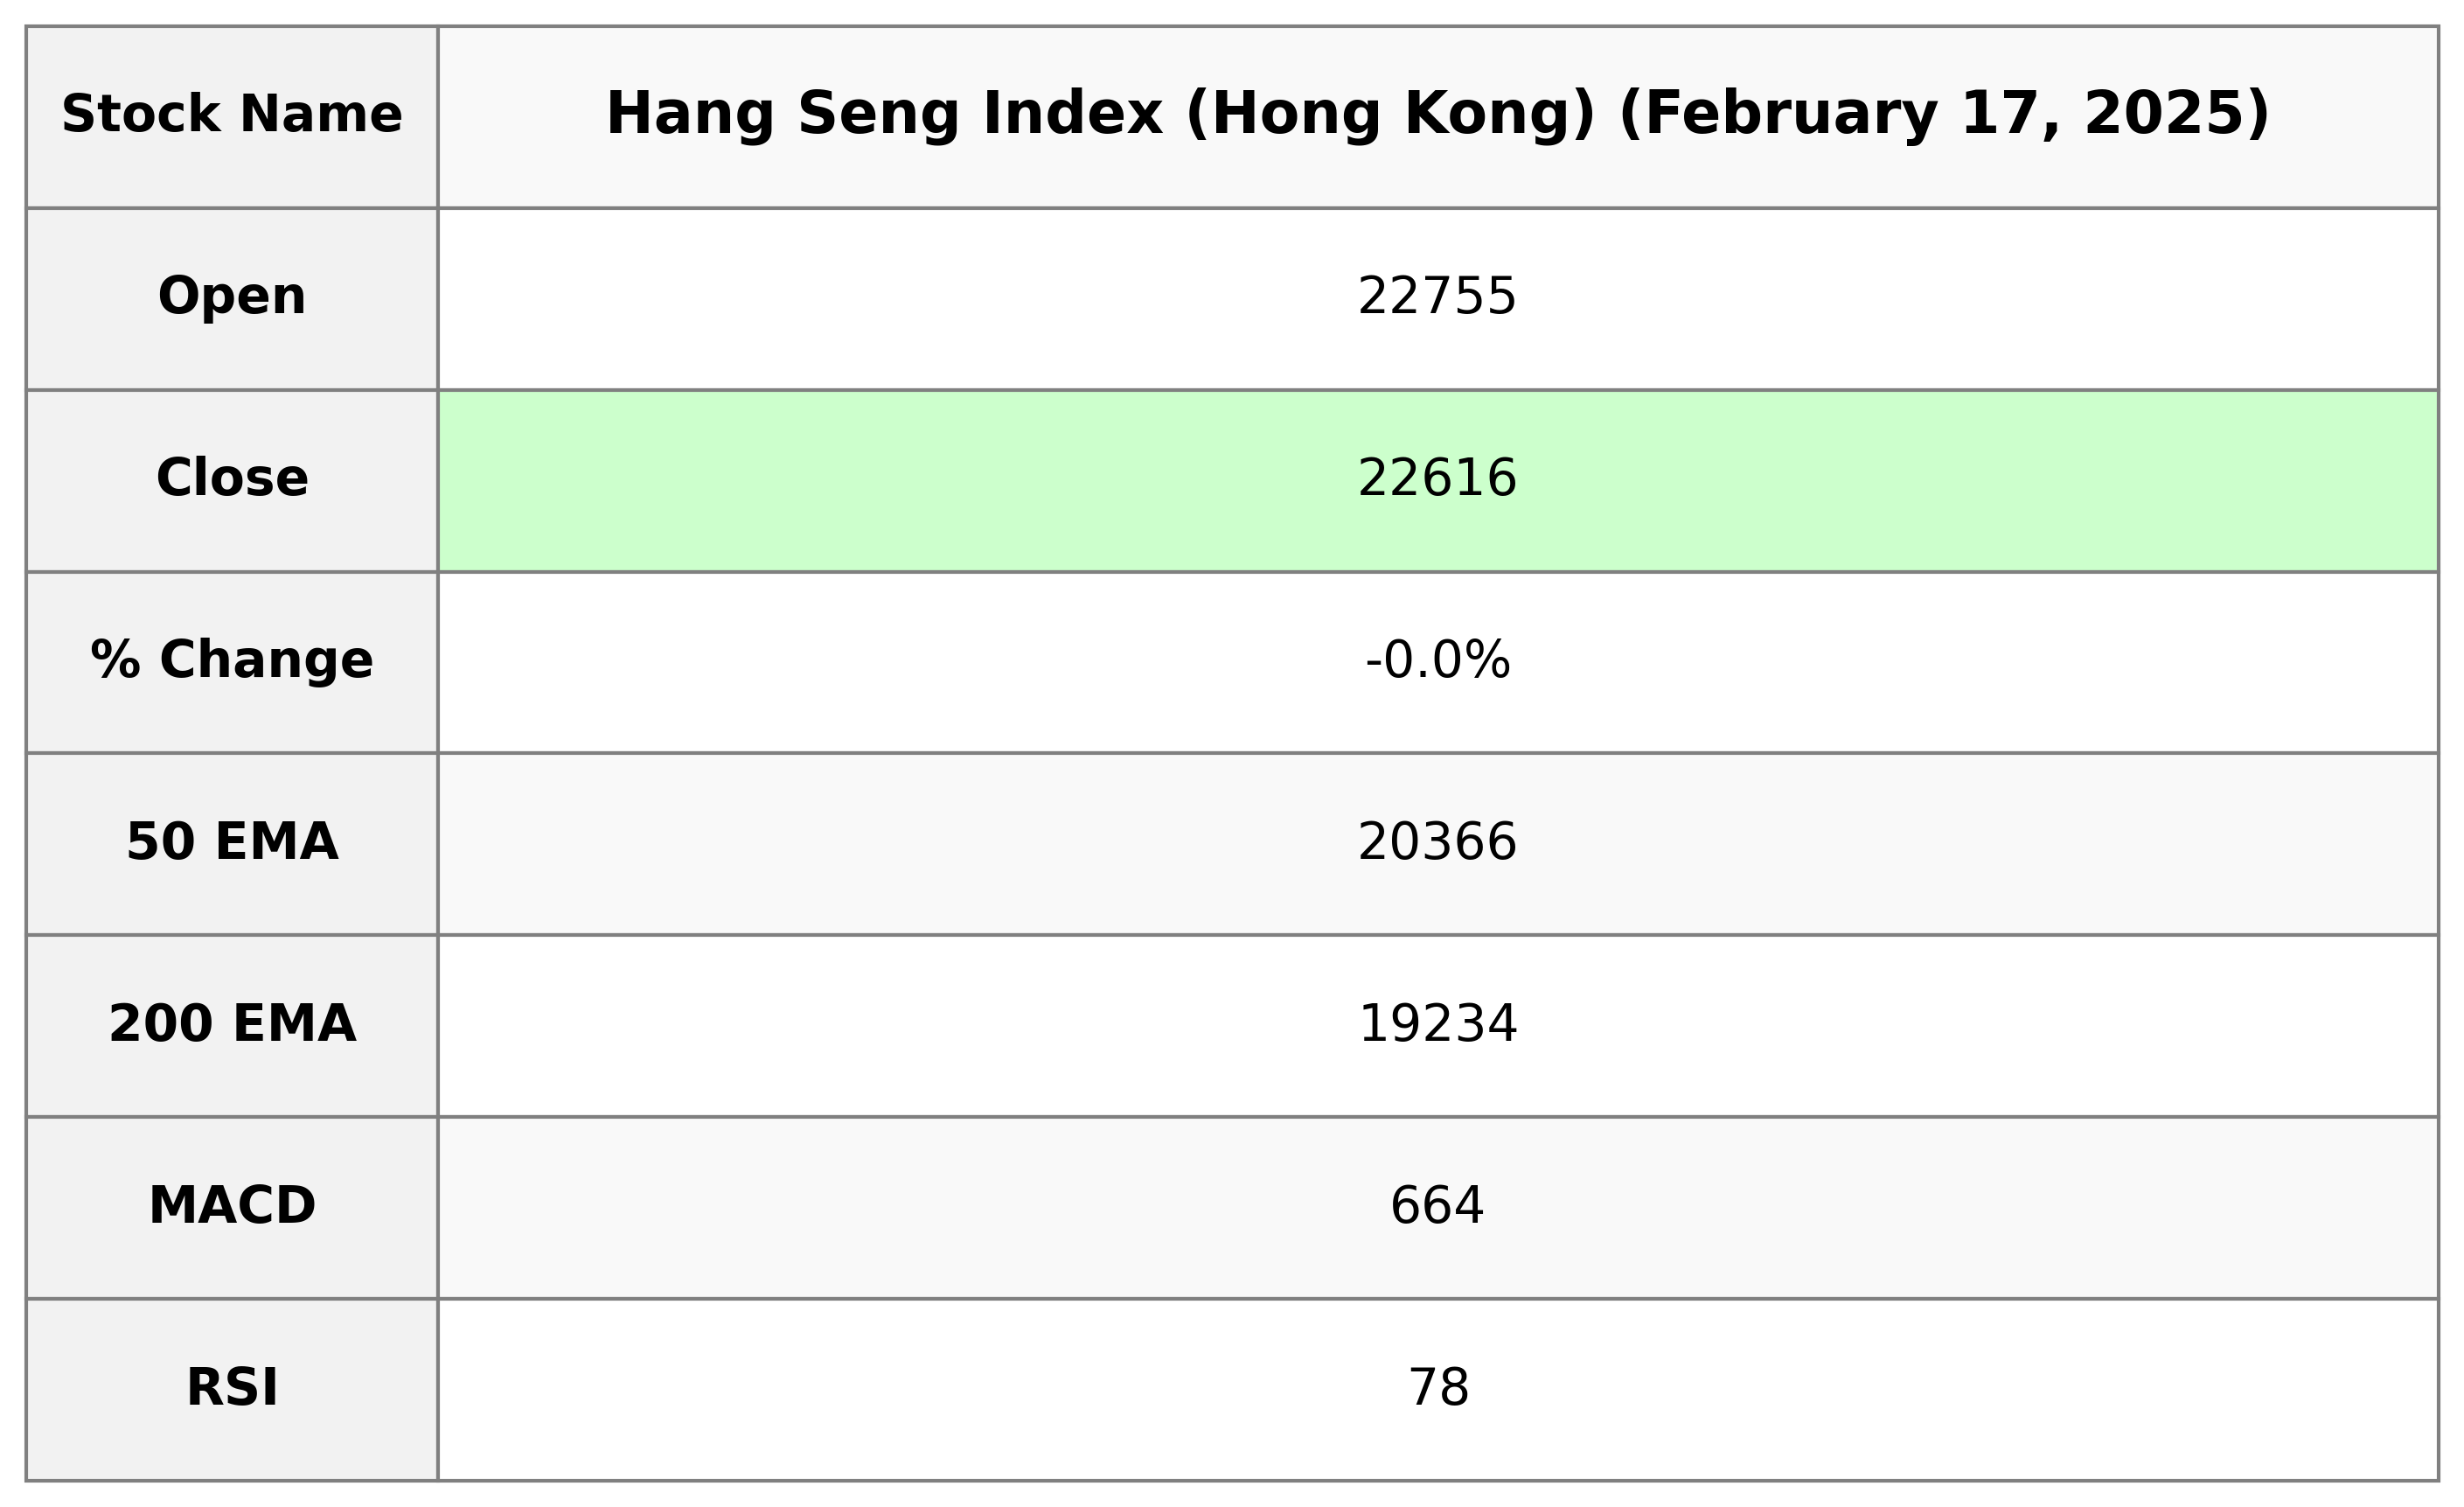
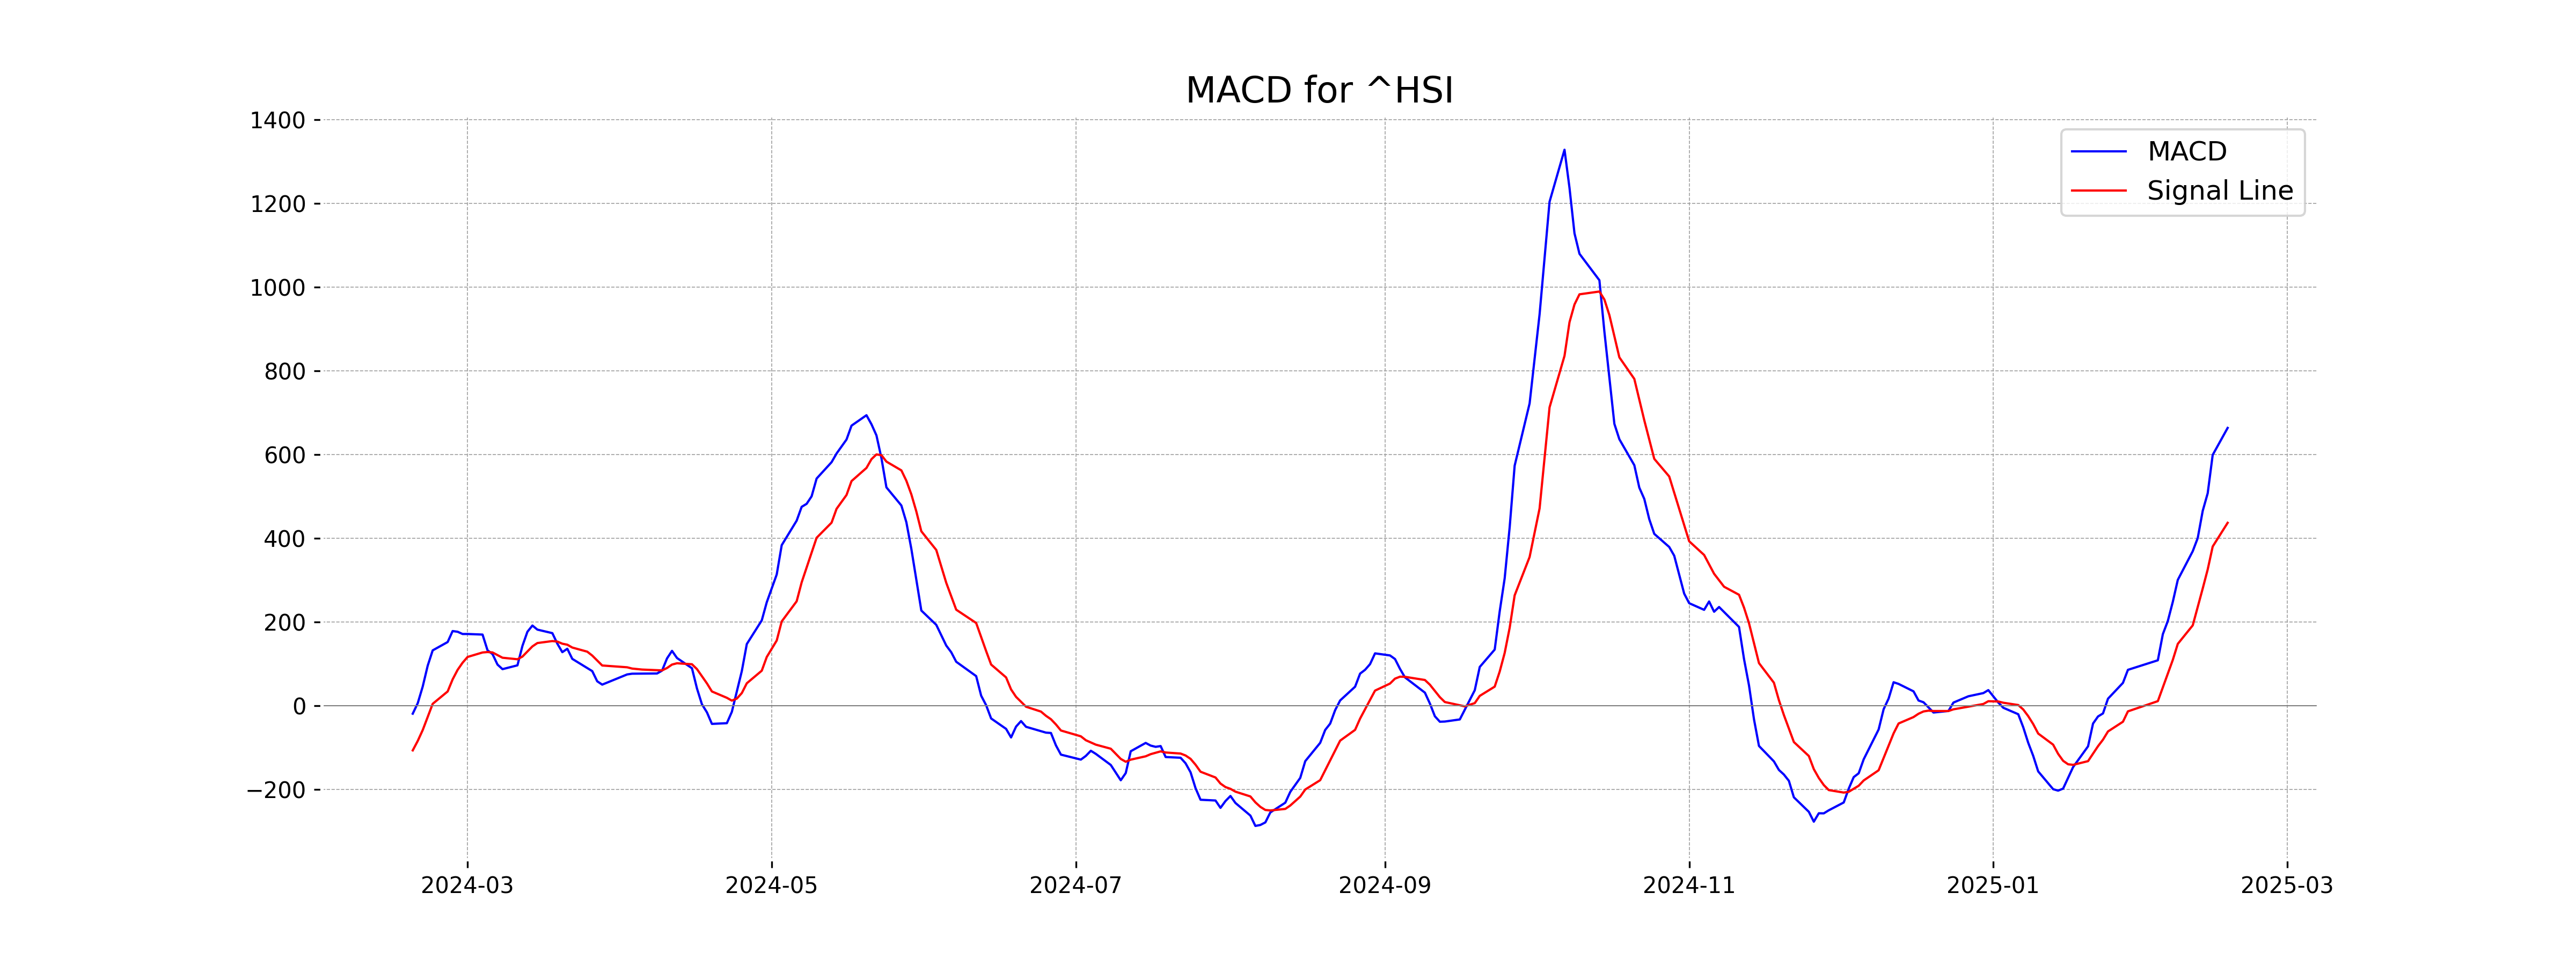
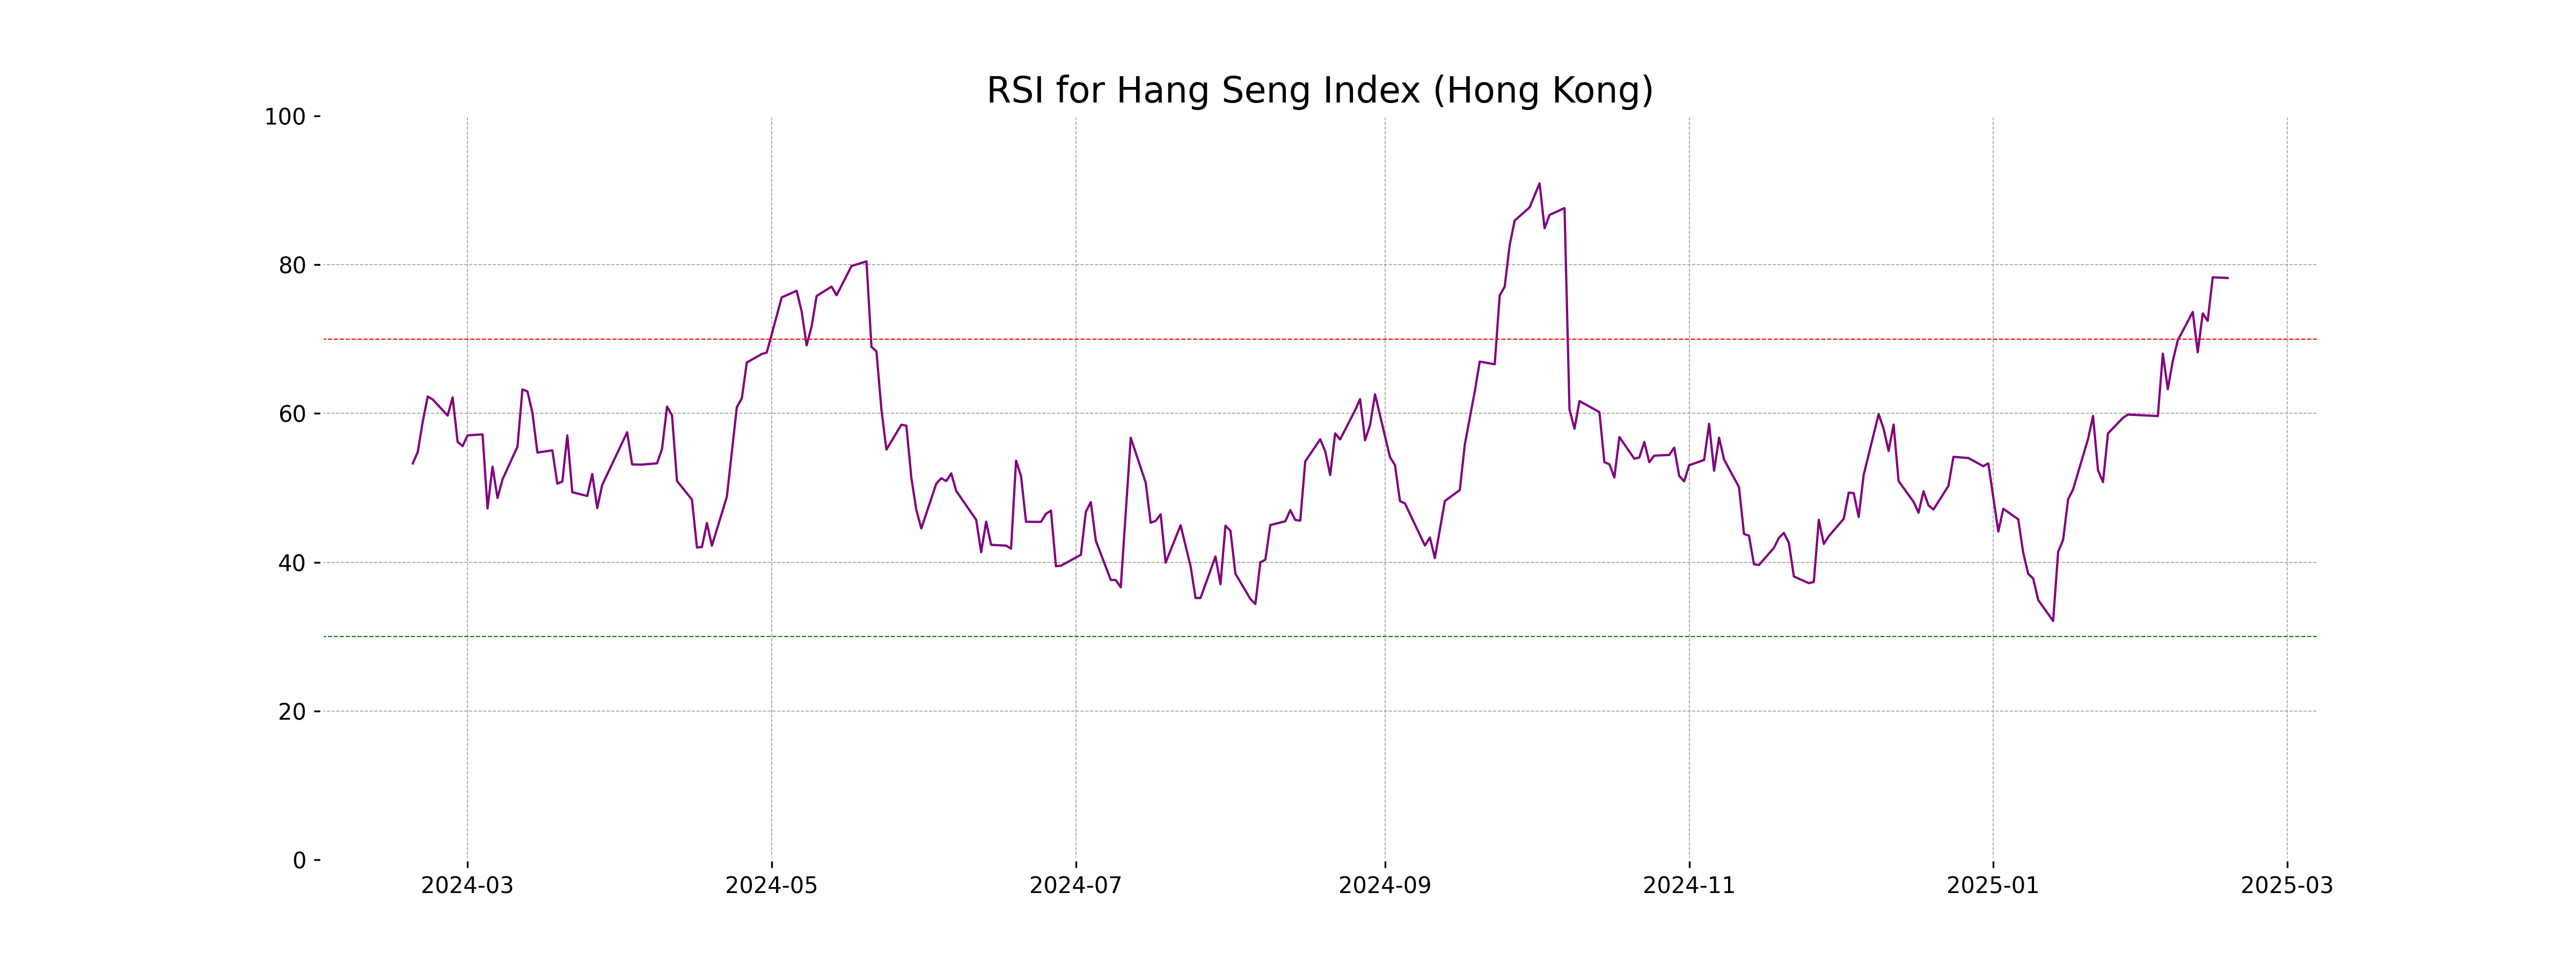
The Hang Seng Index opened at 22,755.06, reaching a high of 22,977.25 and a low of 22,319.32 before closing at 22,616.23. The index experienced a slight decrease of 0.02%, or -4.10 points, from the previous close. With strong technical indicators, including an RSI of 78.21 and a MACD above the signal line, the trend suggests bullish momentum despite the minor daily loss.
Relationship with Key Moving Averages
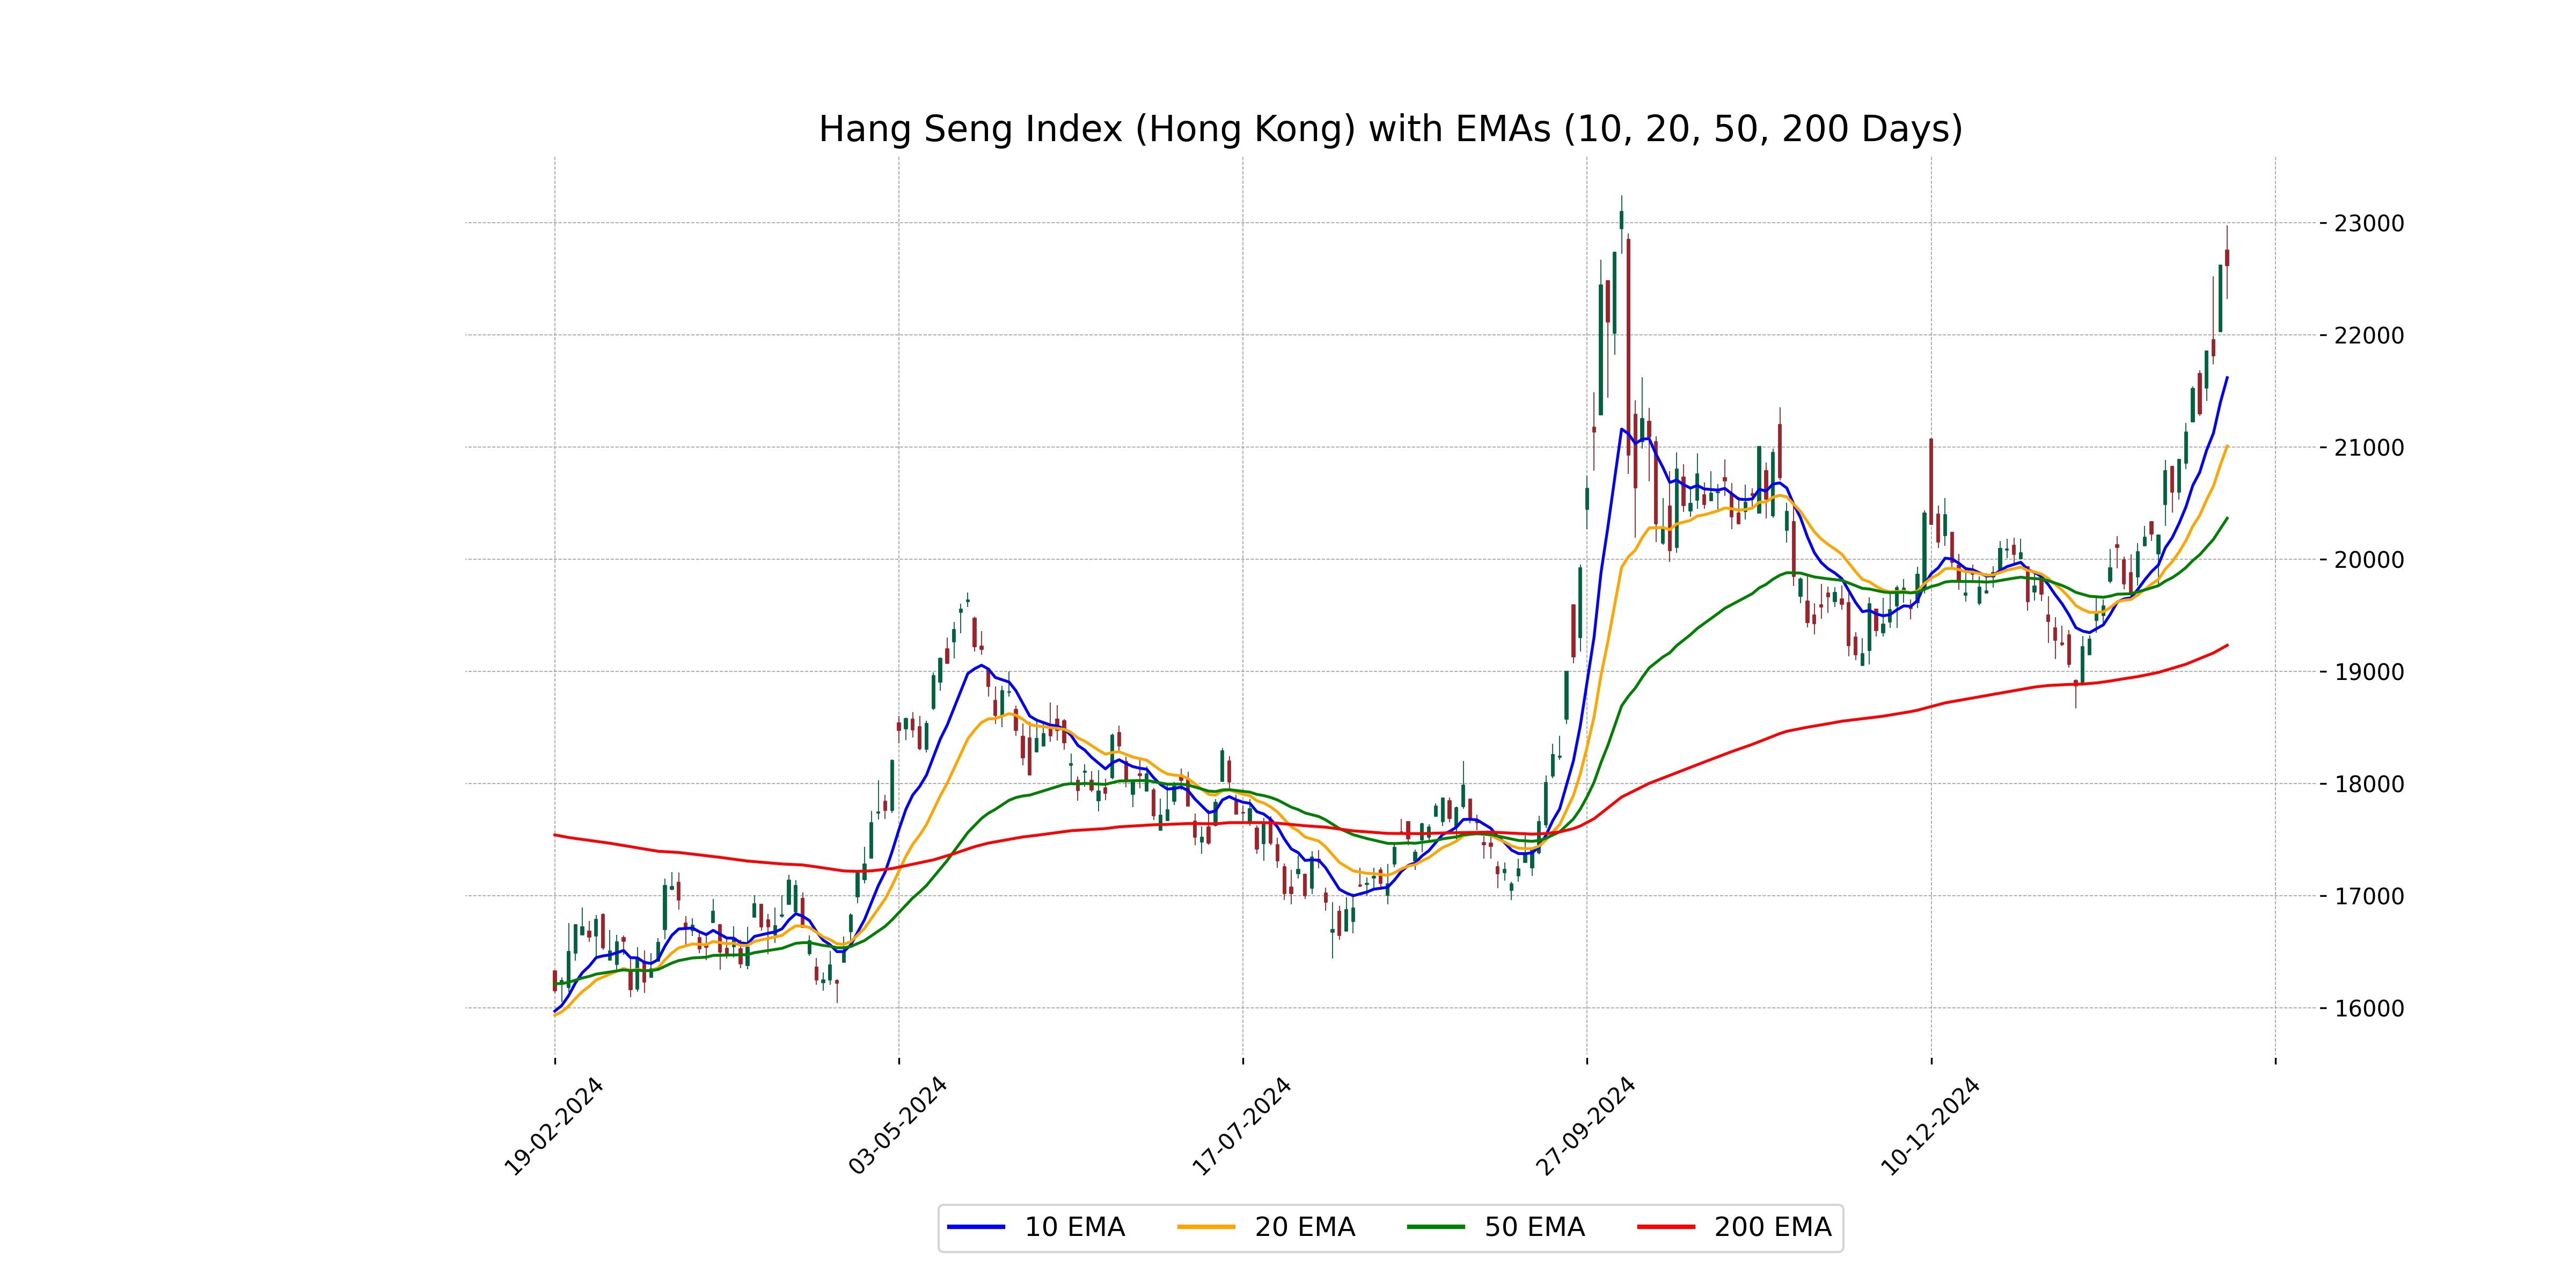
The Hang Seng Index is trading above its key moving averages, with the current close of 22,616.23 higher than the 50-day EMA of 20,366.10, the 200-day EMA of 19,233.77, and the 10-day EMA of 21,618.55, indicating strong bullish momentum. Additionally, the MACD value above the signal line supports this positive trend.
Moving Averages Trend (MACD)
The Hang Seng Index (Hong Kong) displays a MACD of 664.19 compared to the MACD Signal of 437.49, indicating a bullish trend as the MACD line is above the signal line. This suggests positive momentum in the index's recent price action.
RSI Analysis
The Relative Strength Index (RSI) for the Hang Seng Index is 78.21, which indicates that the index is in overbought territory. Typically, an RSI above 70 suggests overbought conditions, which might imply a potential price correction or reversal in the near future.
Analysis for IBEX 35 (Spain) - February 17, 2025
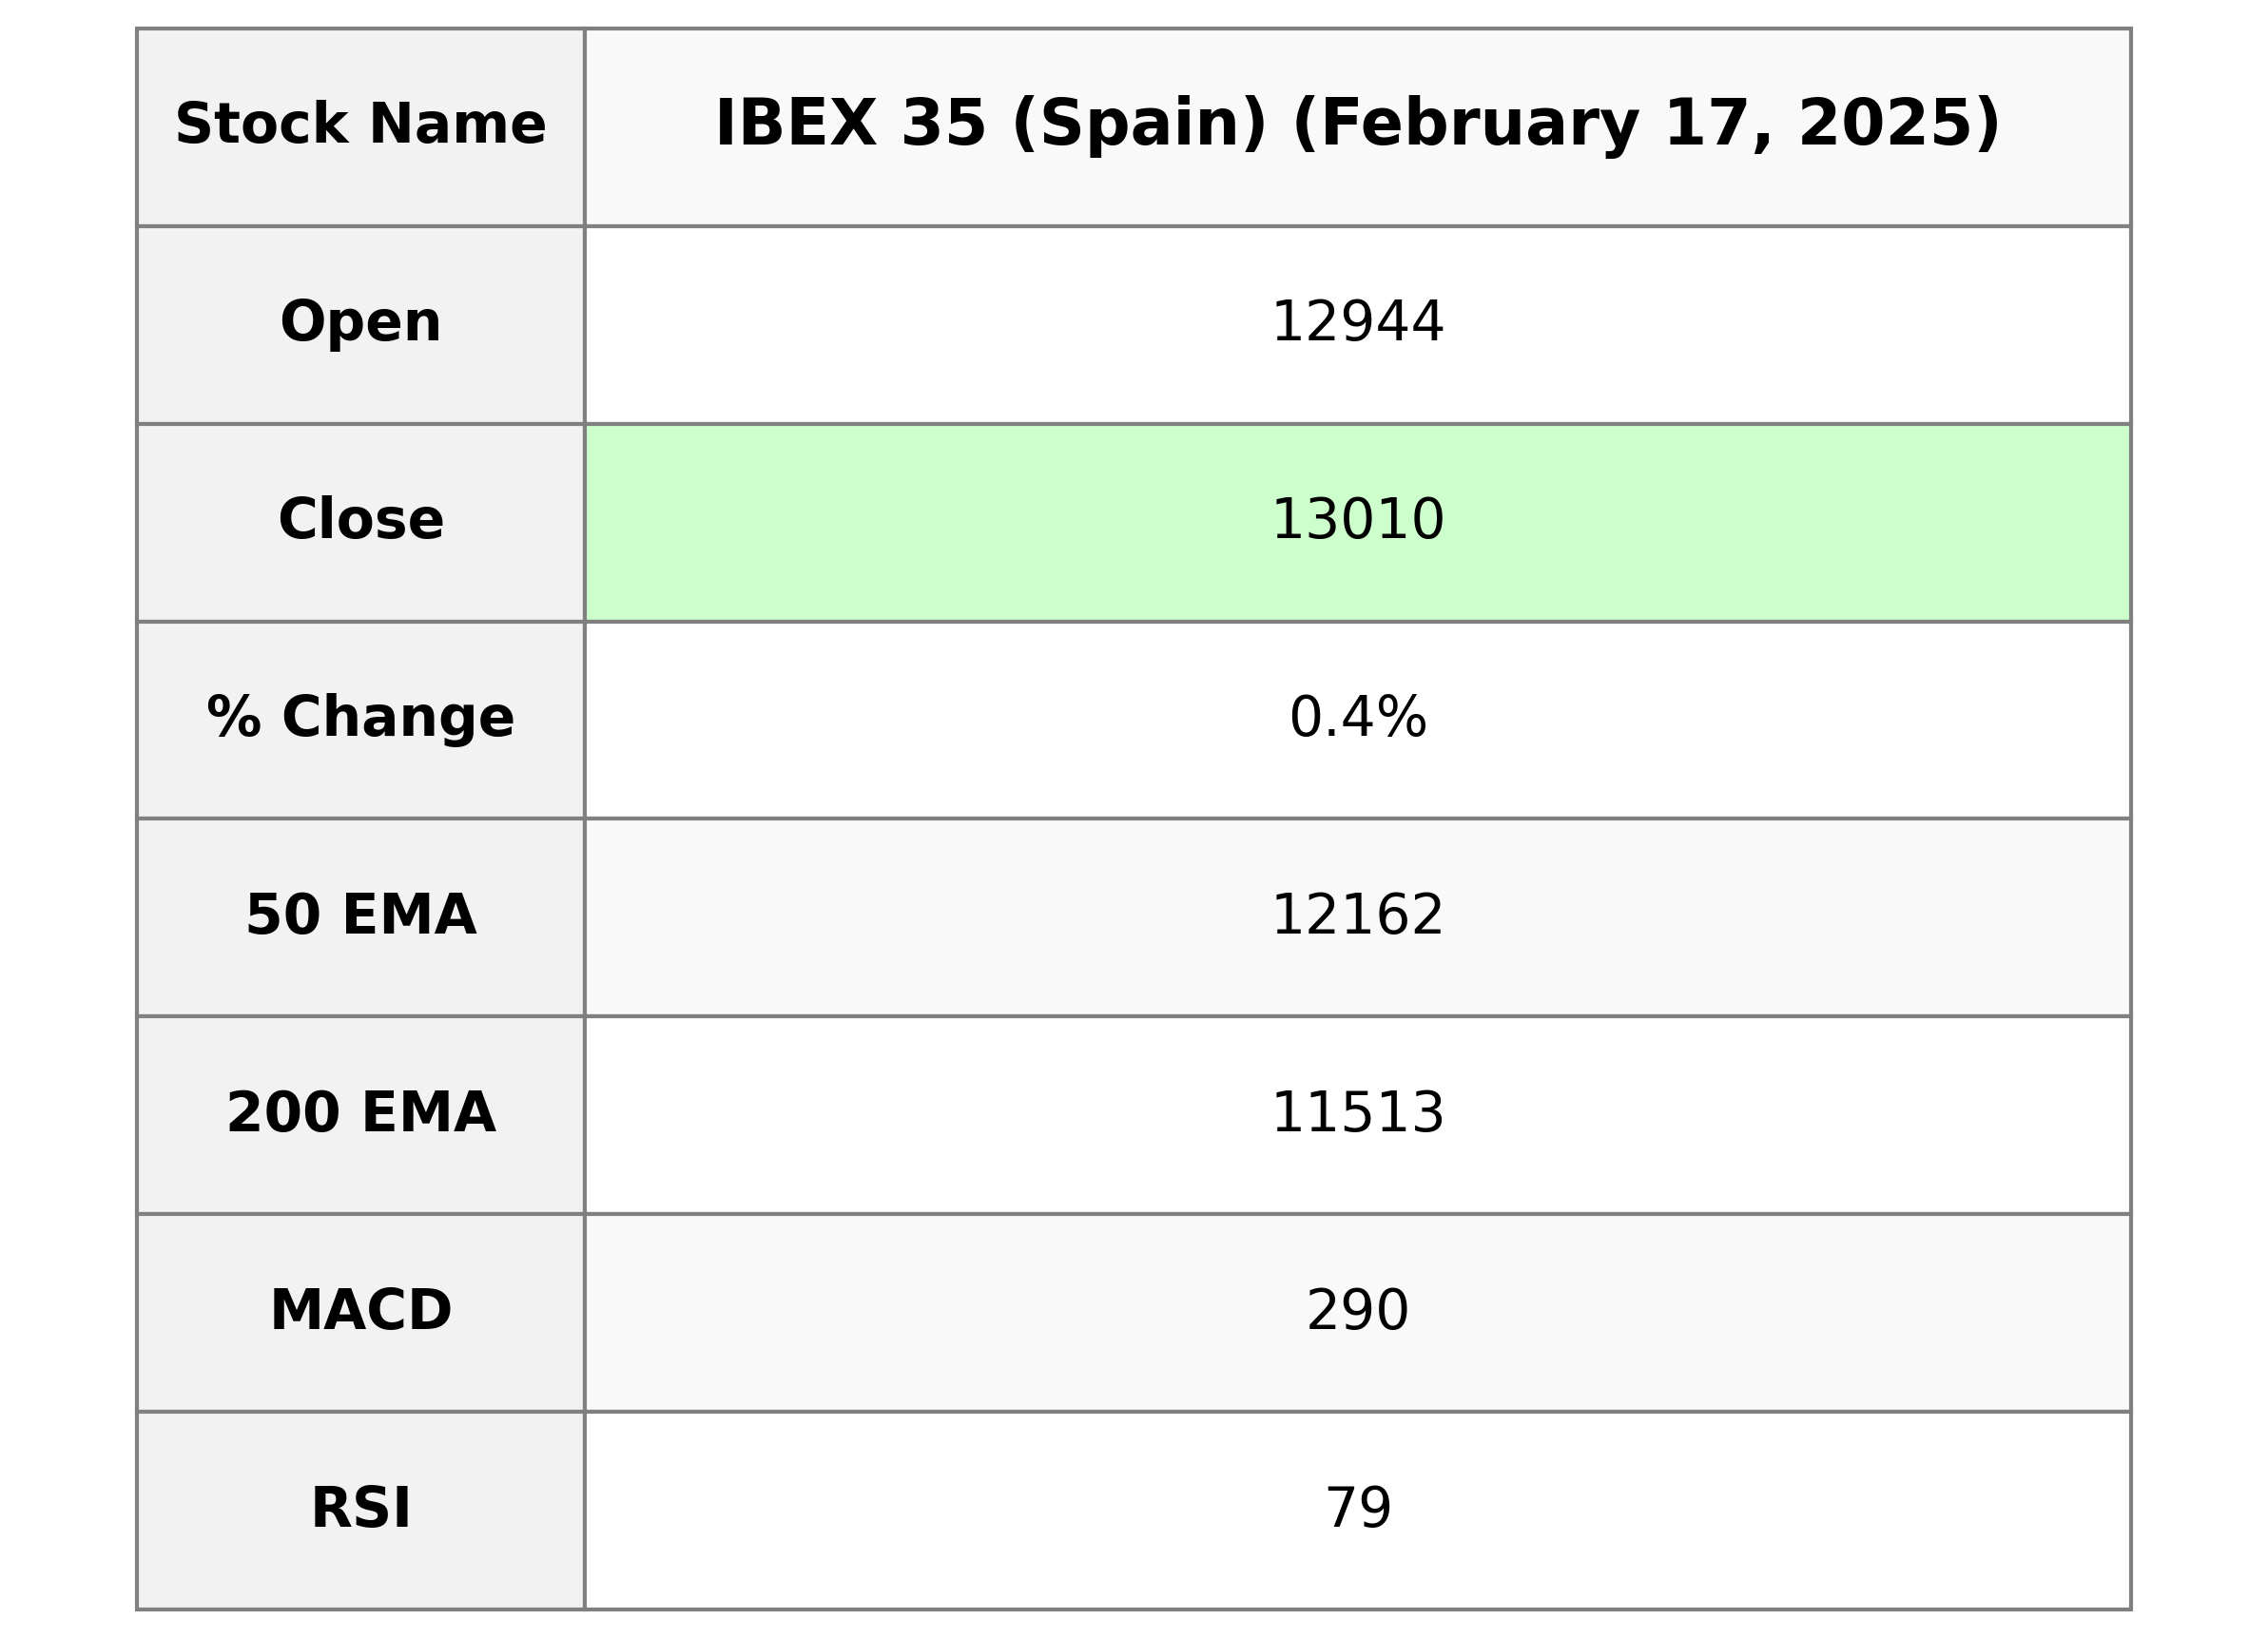
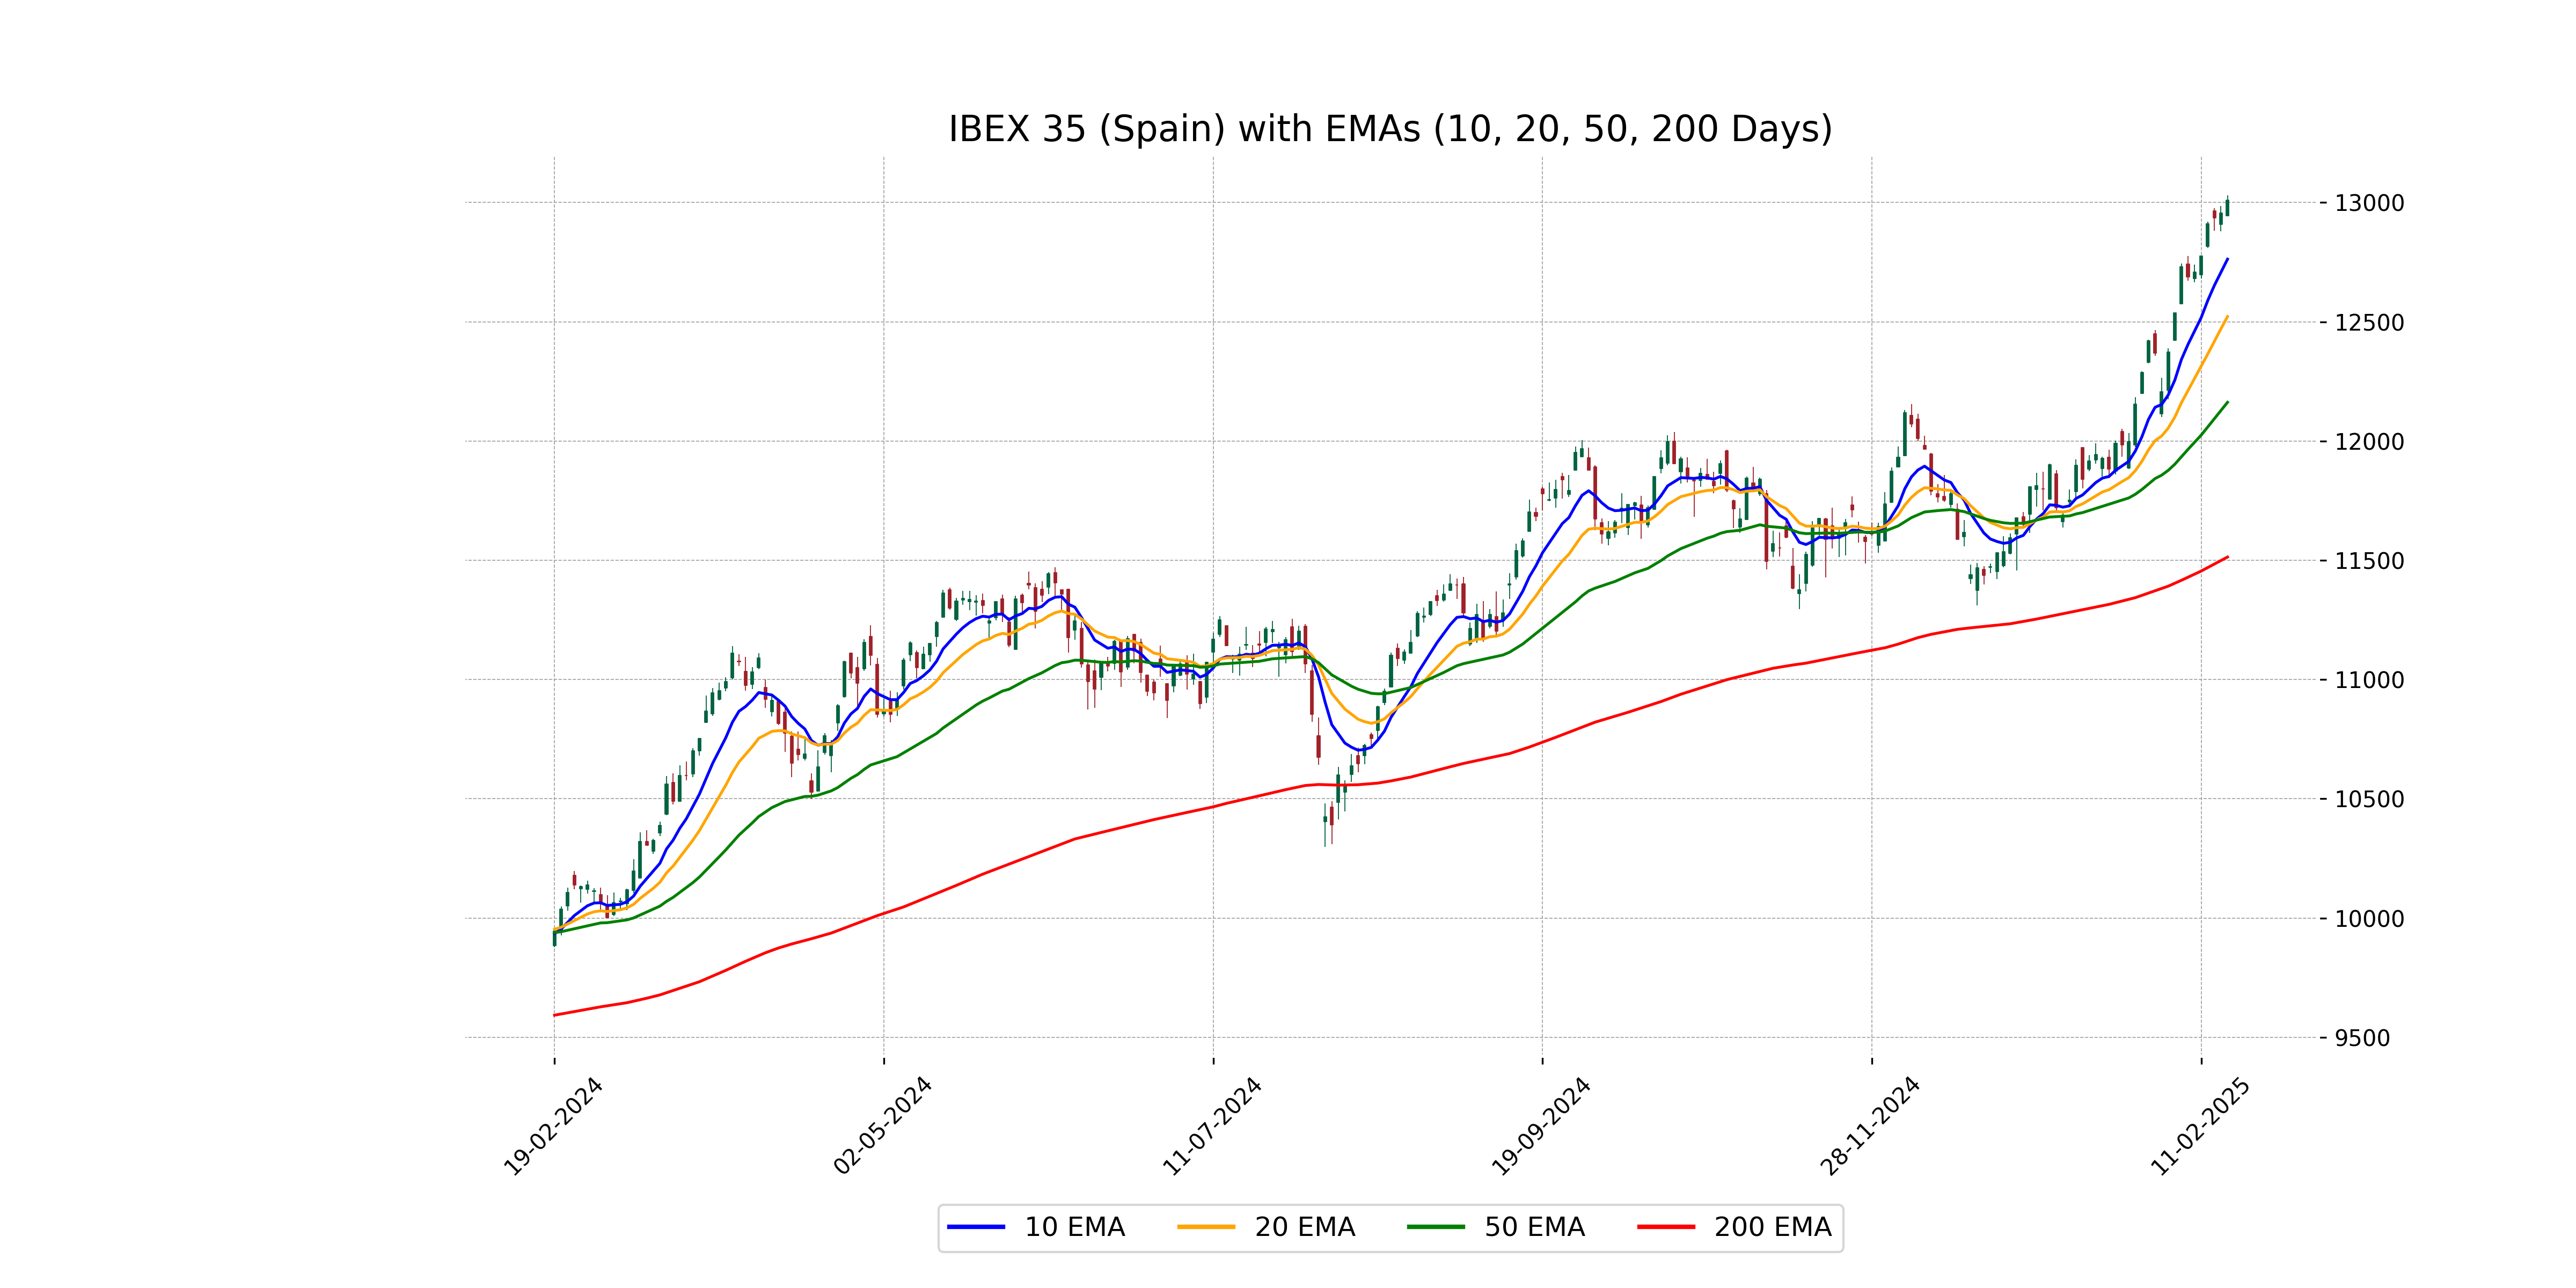
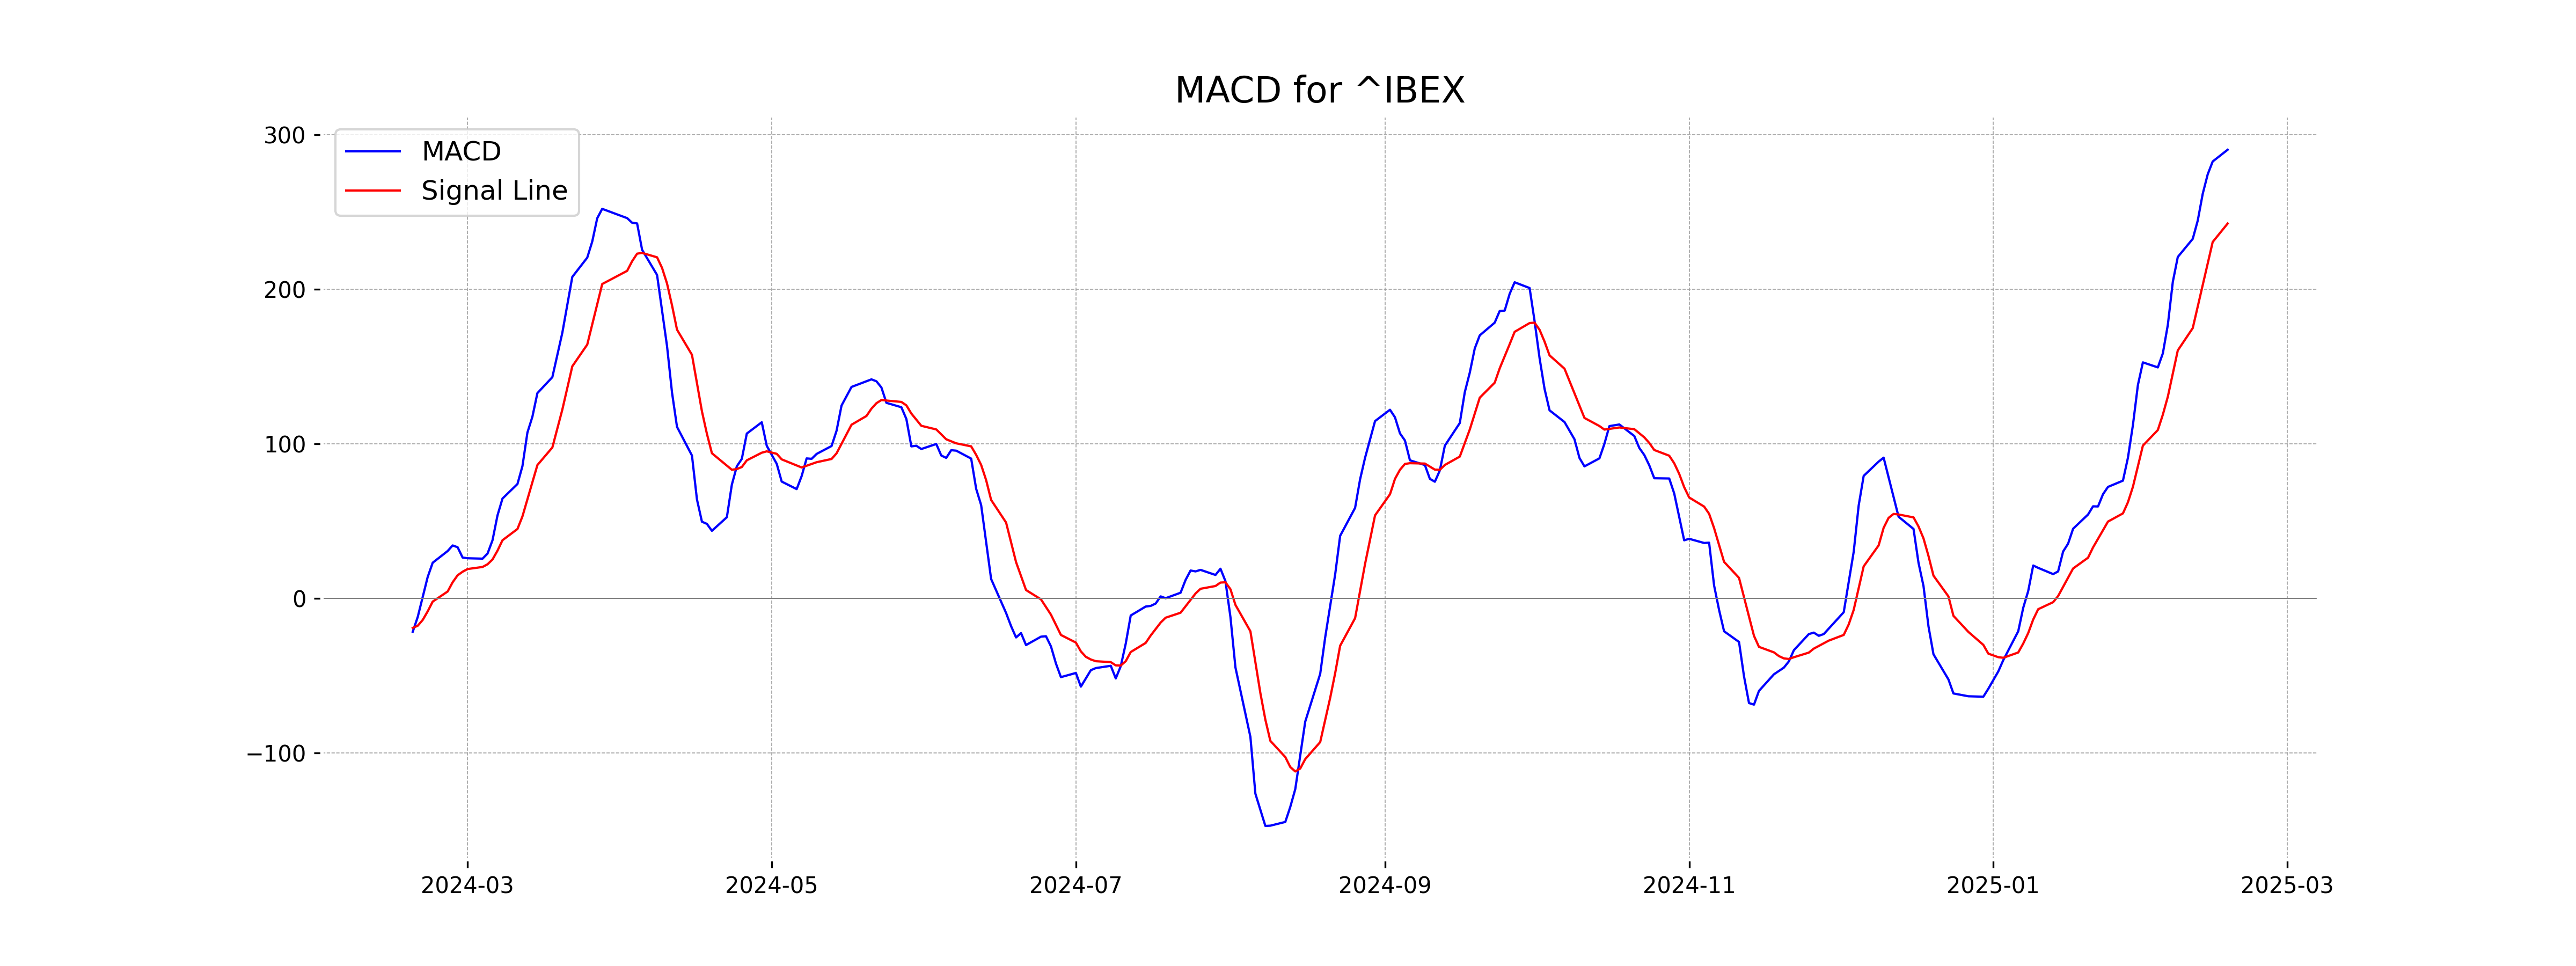
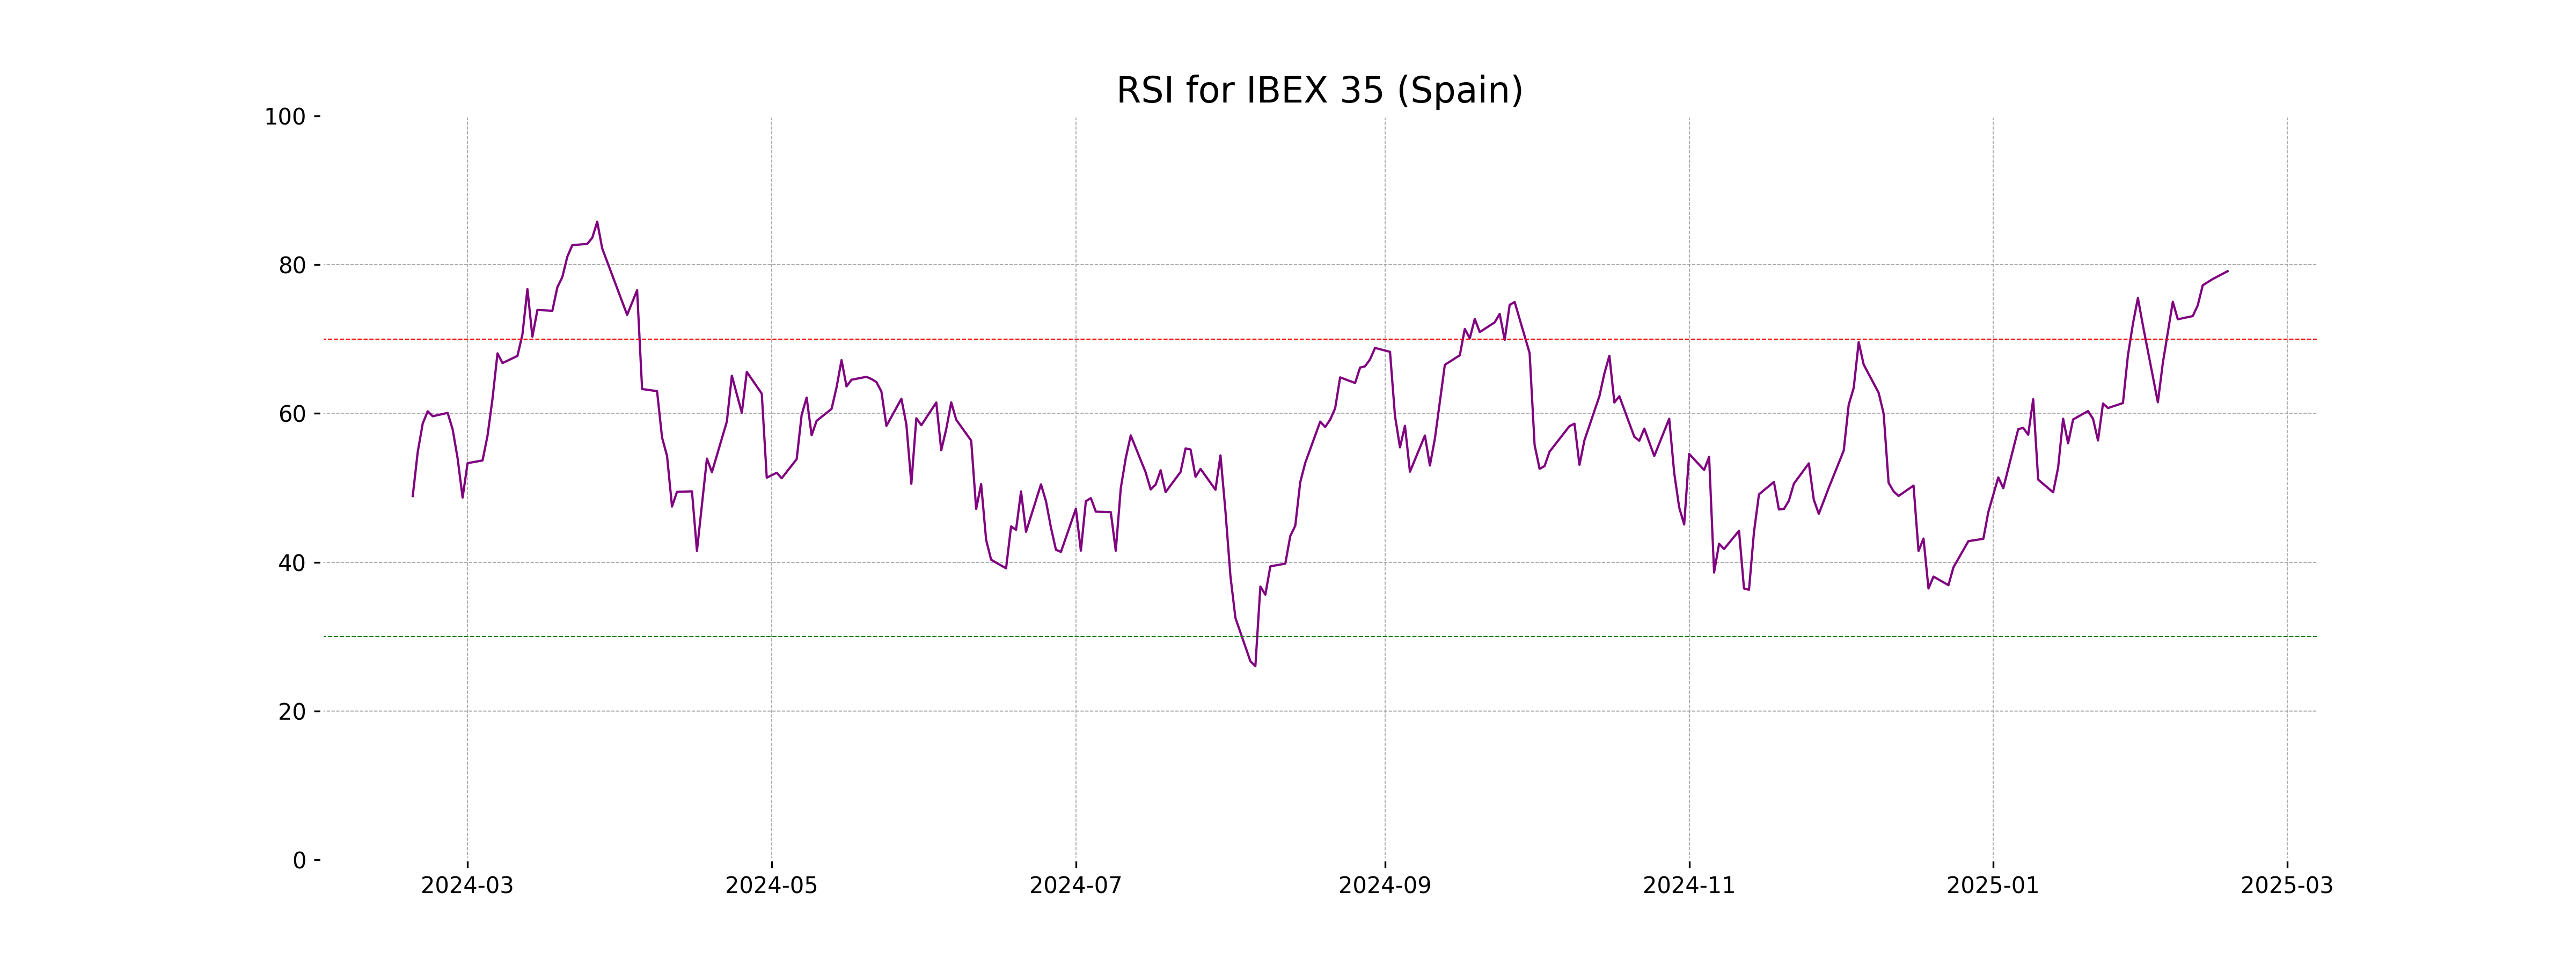
The IBEX 35 opened at 12,943.70 and closed at 13,010.10, marking a 0.42% increase from the previous close. The index experienced a high of 13,029.20 and a low of 12,942.20, with a notable RSI of 79.13, indicating potential overbought conditions. The MACD of 290.40 also suggests a strong upward momentum compared to the signal line at 242.66.
Relationship with Key Moving Averages
The IBEX 35 closed at 13010.10, which is above its 10 EMA of 12762.49, 20 EMA of 12521.83, 50 EMA of 12162.24, and 200 EMA of 11513.47, indicating a strong upward trend in comparison to these averages. The high RSI of 79.13 suggests overbought conditions, while the MACD of 290.40 is above its signal line at 242.66, confirming the bullish momentum.
Moving Averages Trend (MACD)
**IBEX 35 (Spain) MACD Analysis:** The MACD value of 290.40 is above the signal line at 242.66, suggesting a bullish trend for IBEX 35. The positive divergence indicates upward momentum in the market.
RSI Analysis
The RSI for IBEX 35 is at 79.13, indicating overbought conditions as it is above 70. This suggests that the index may be experiencing upward momentum, potentially signaling a price correction or pullback in the near future.
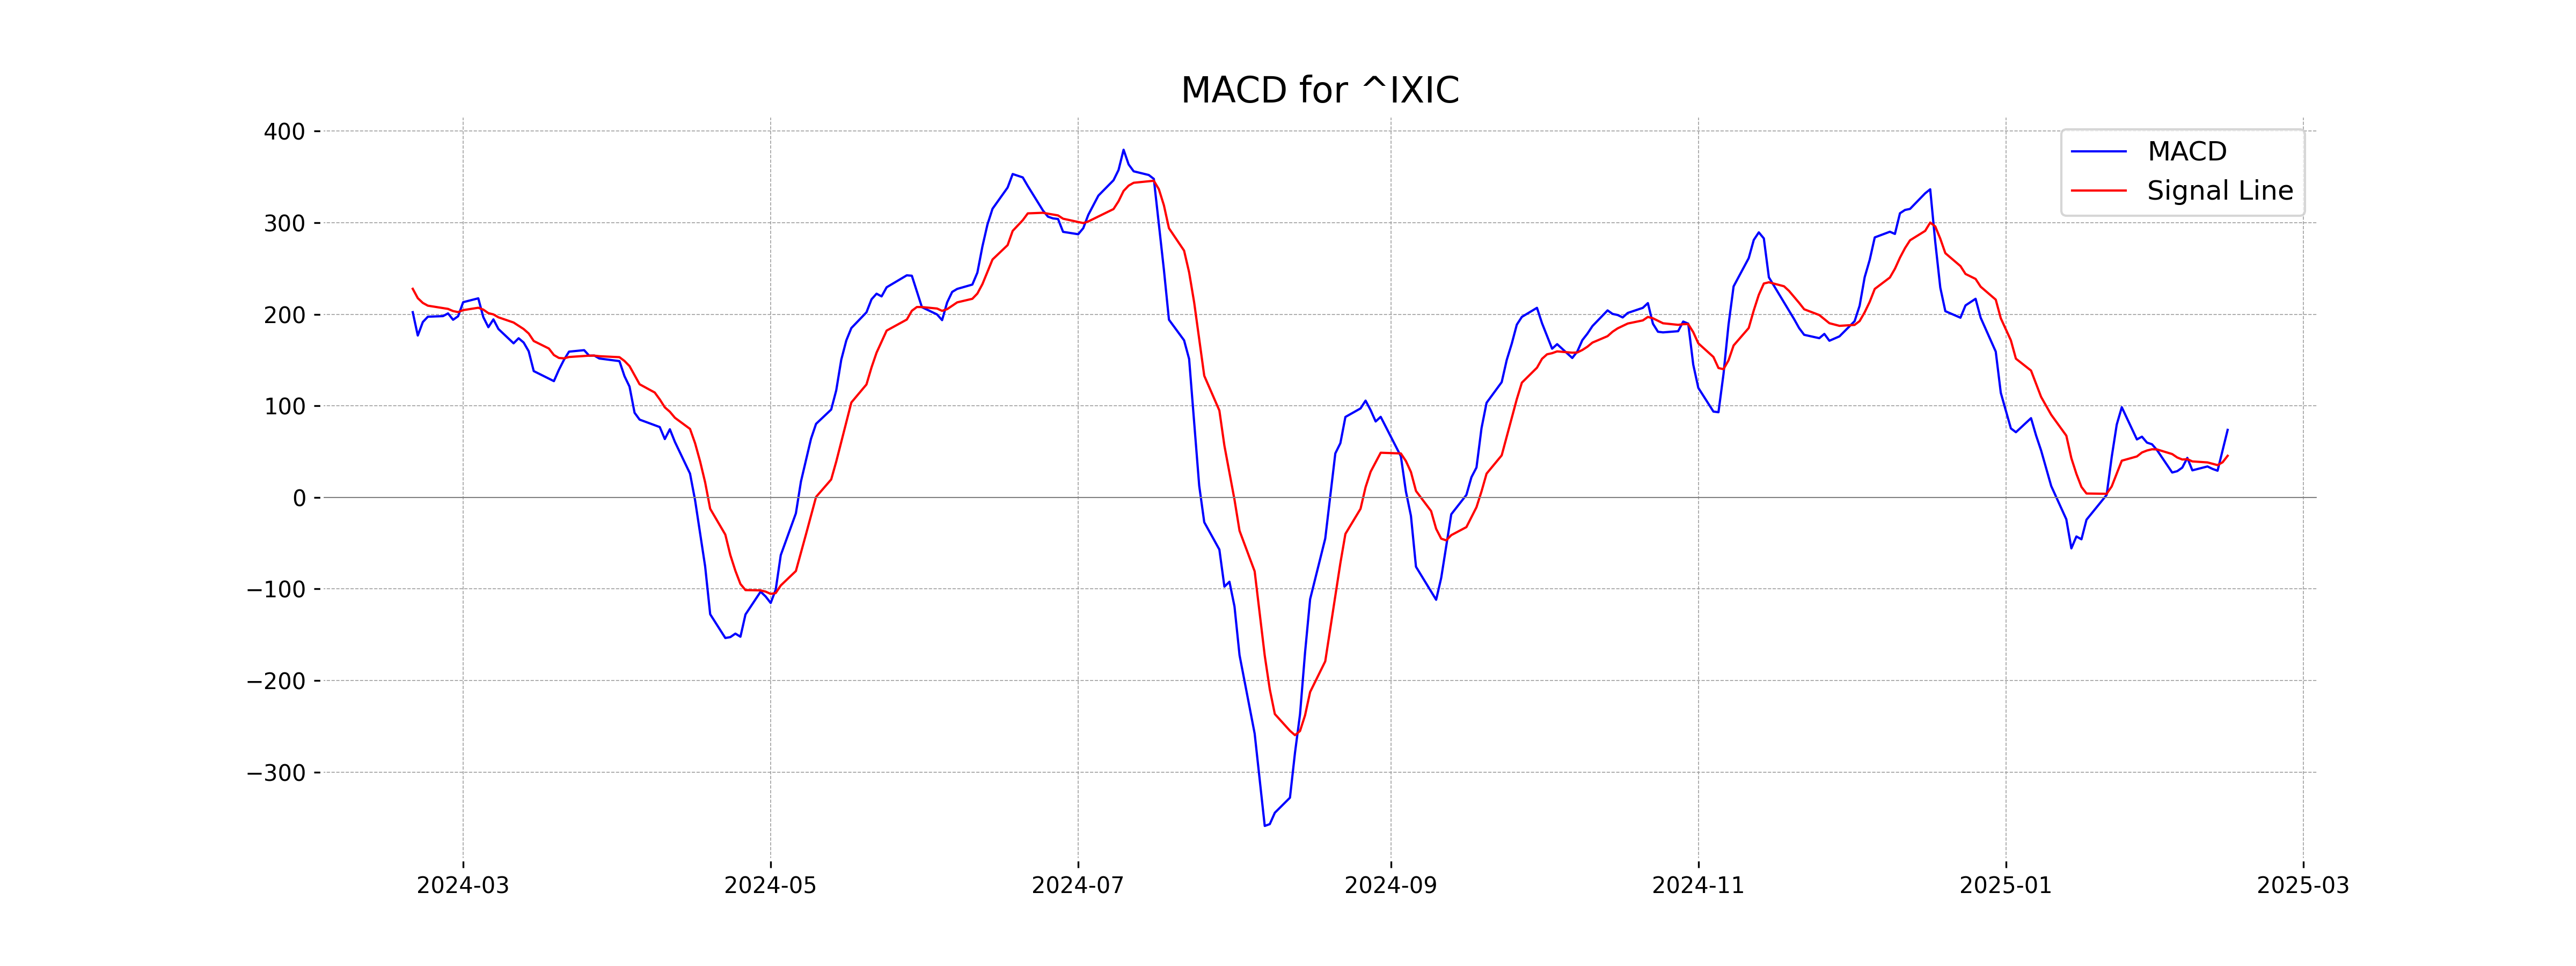
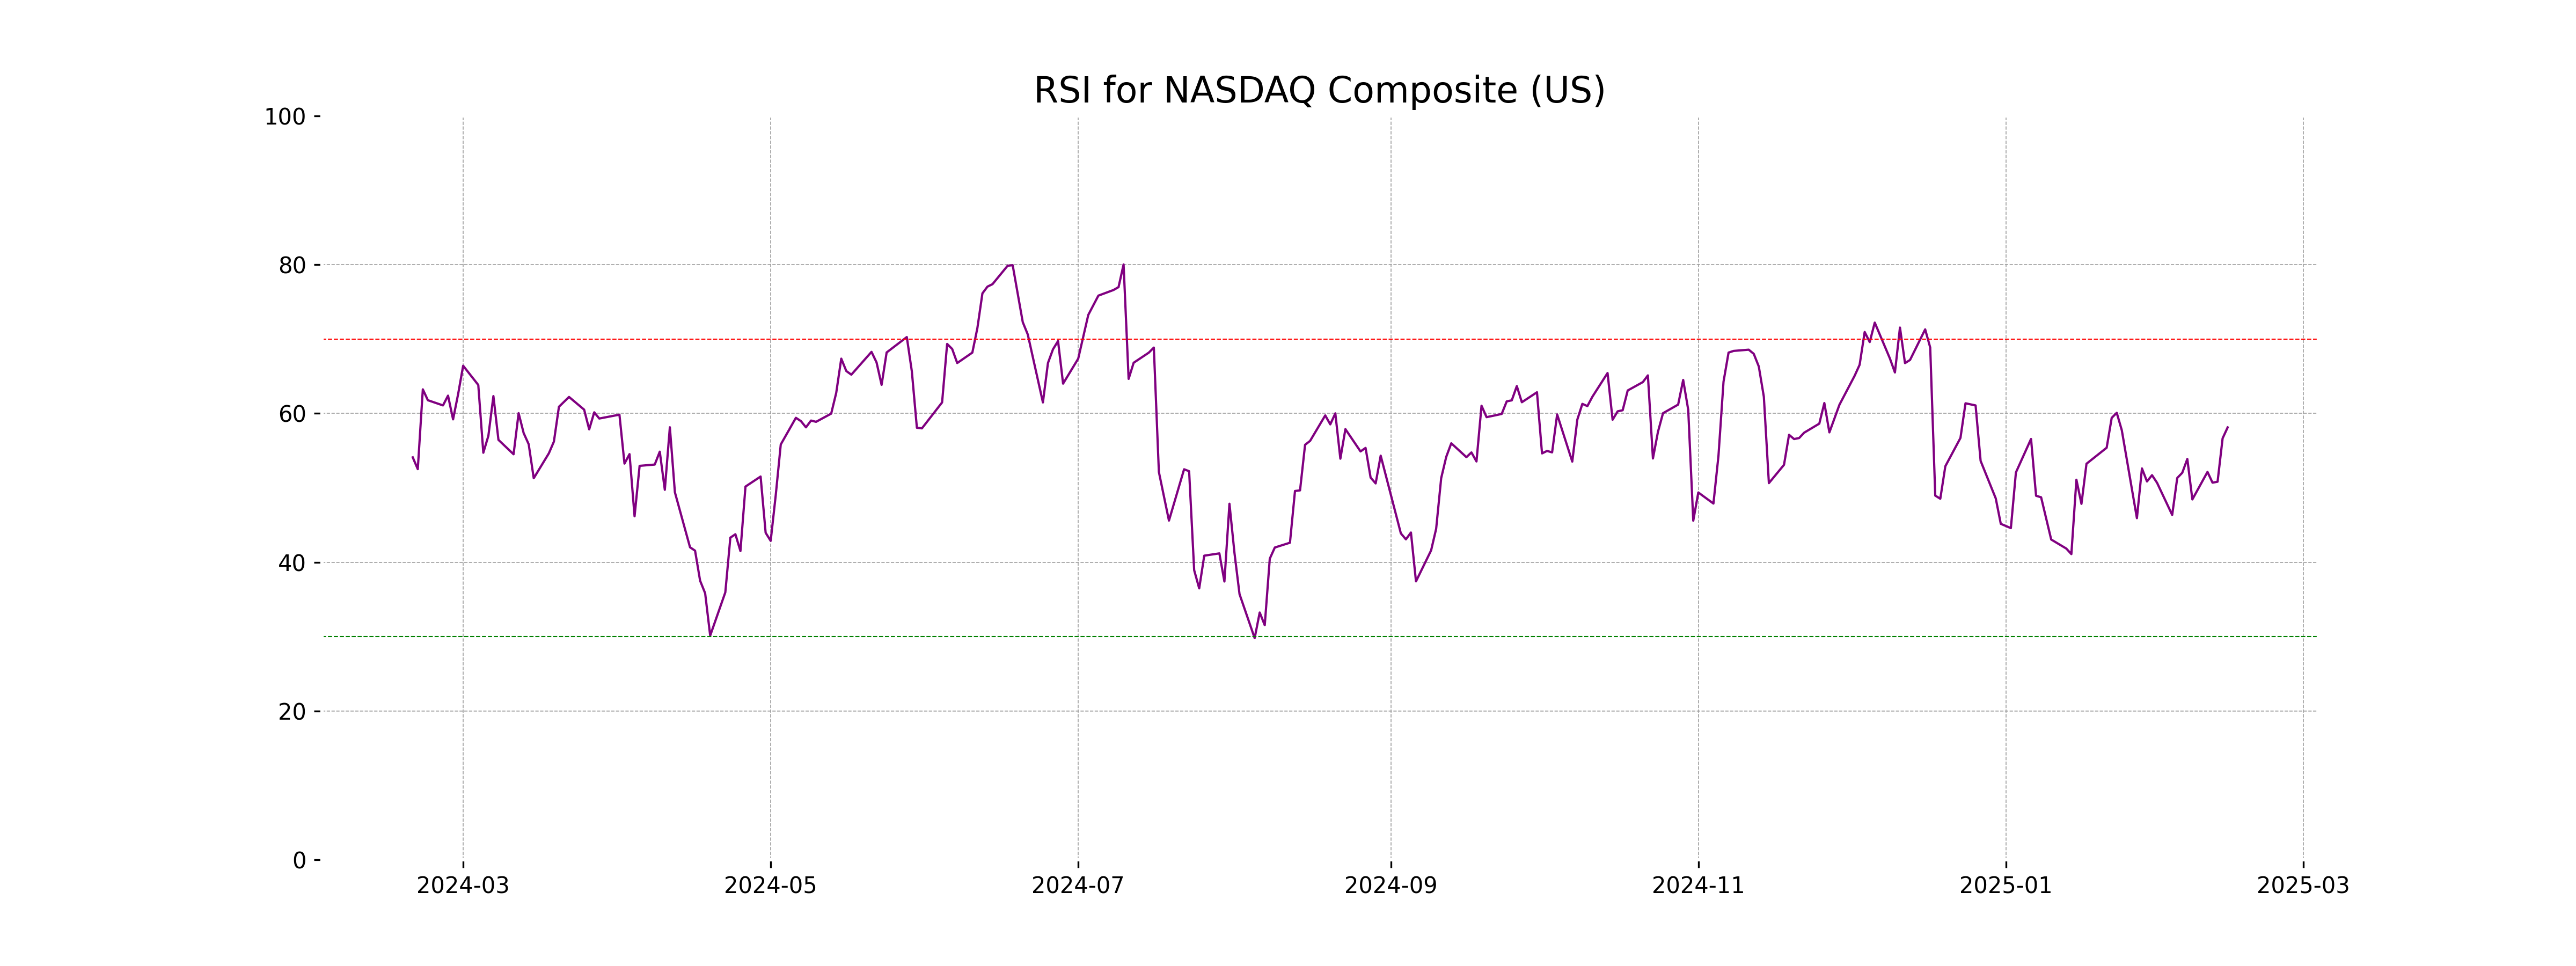
Analysis for NASDAQ Composite (US) - February 17, 2025
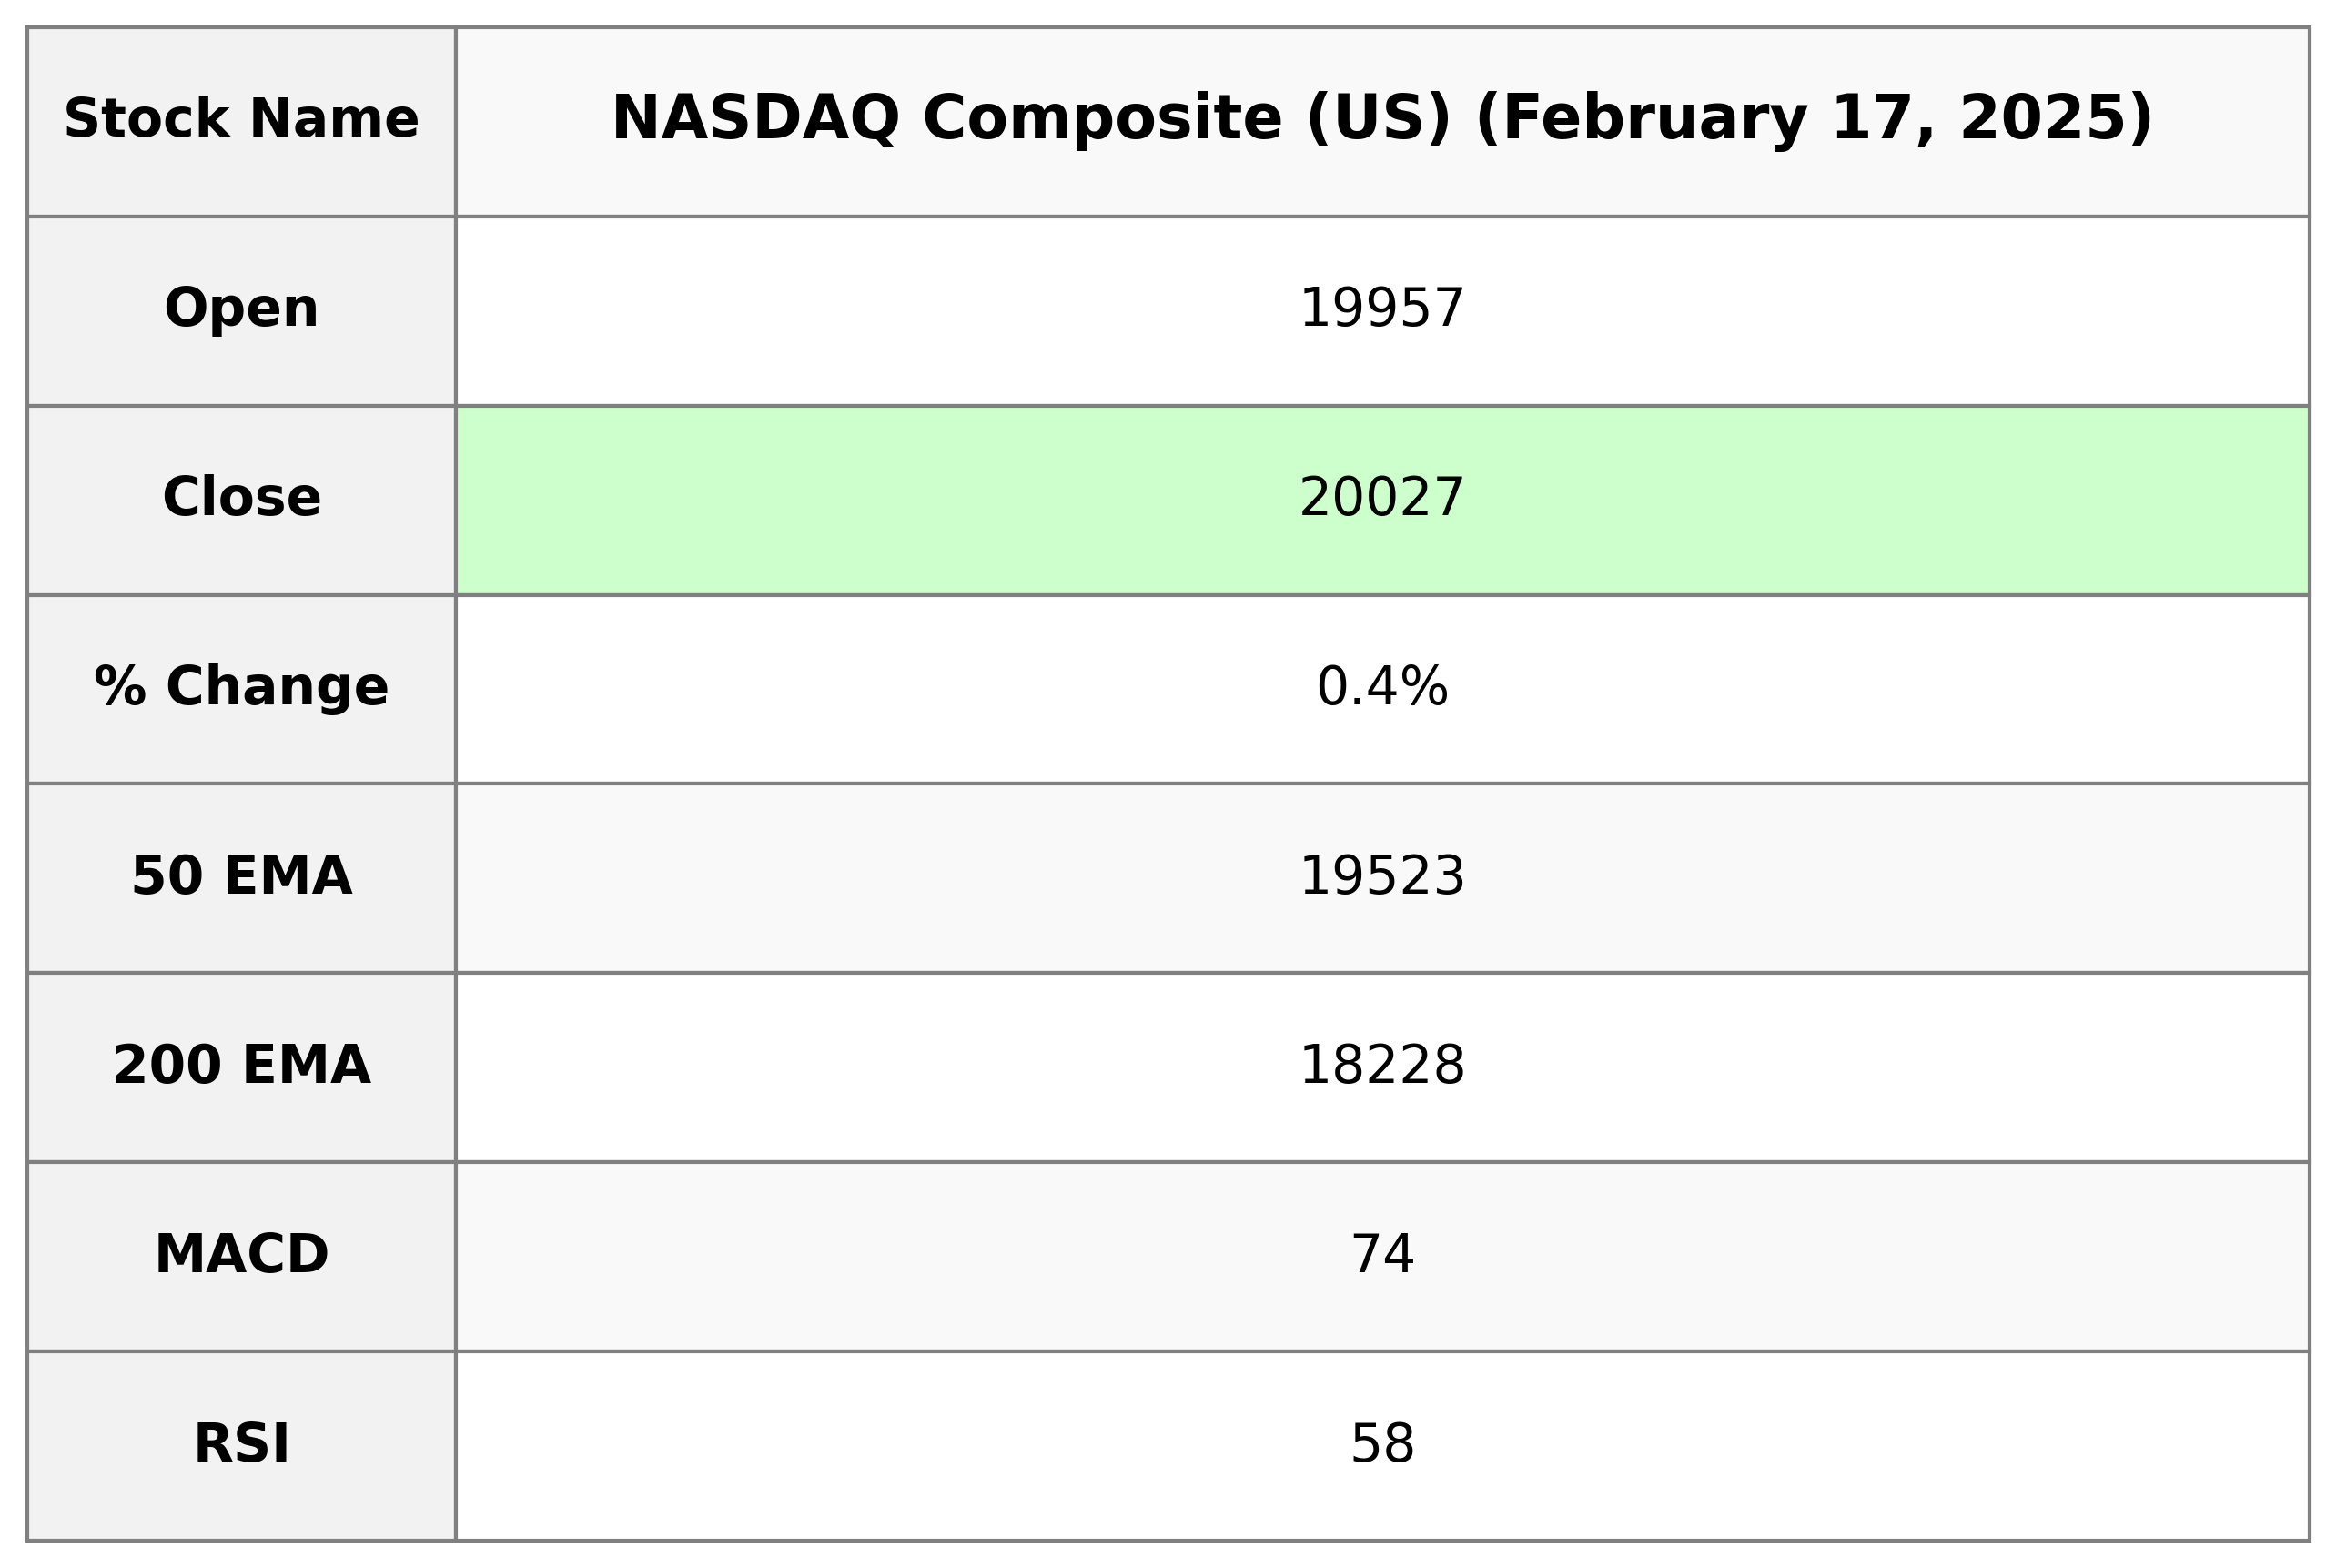
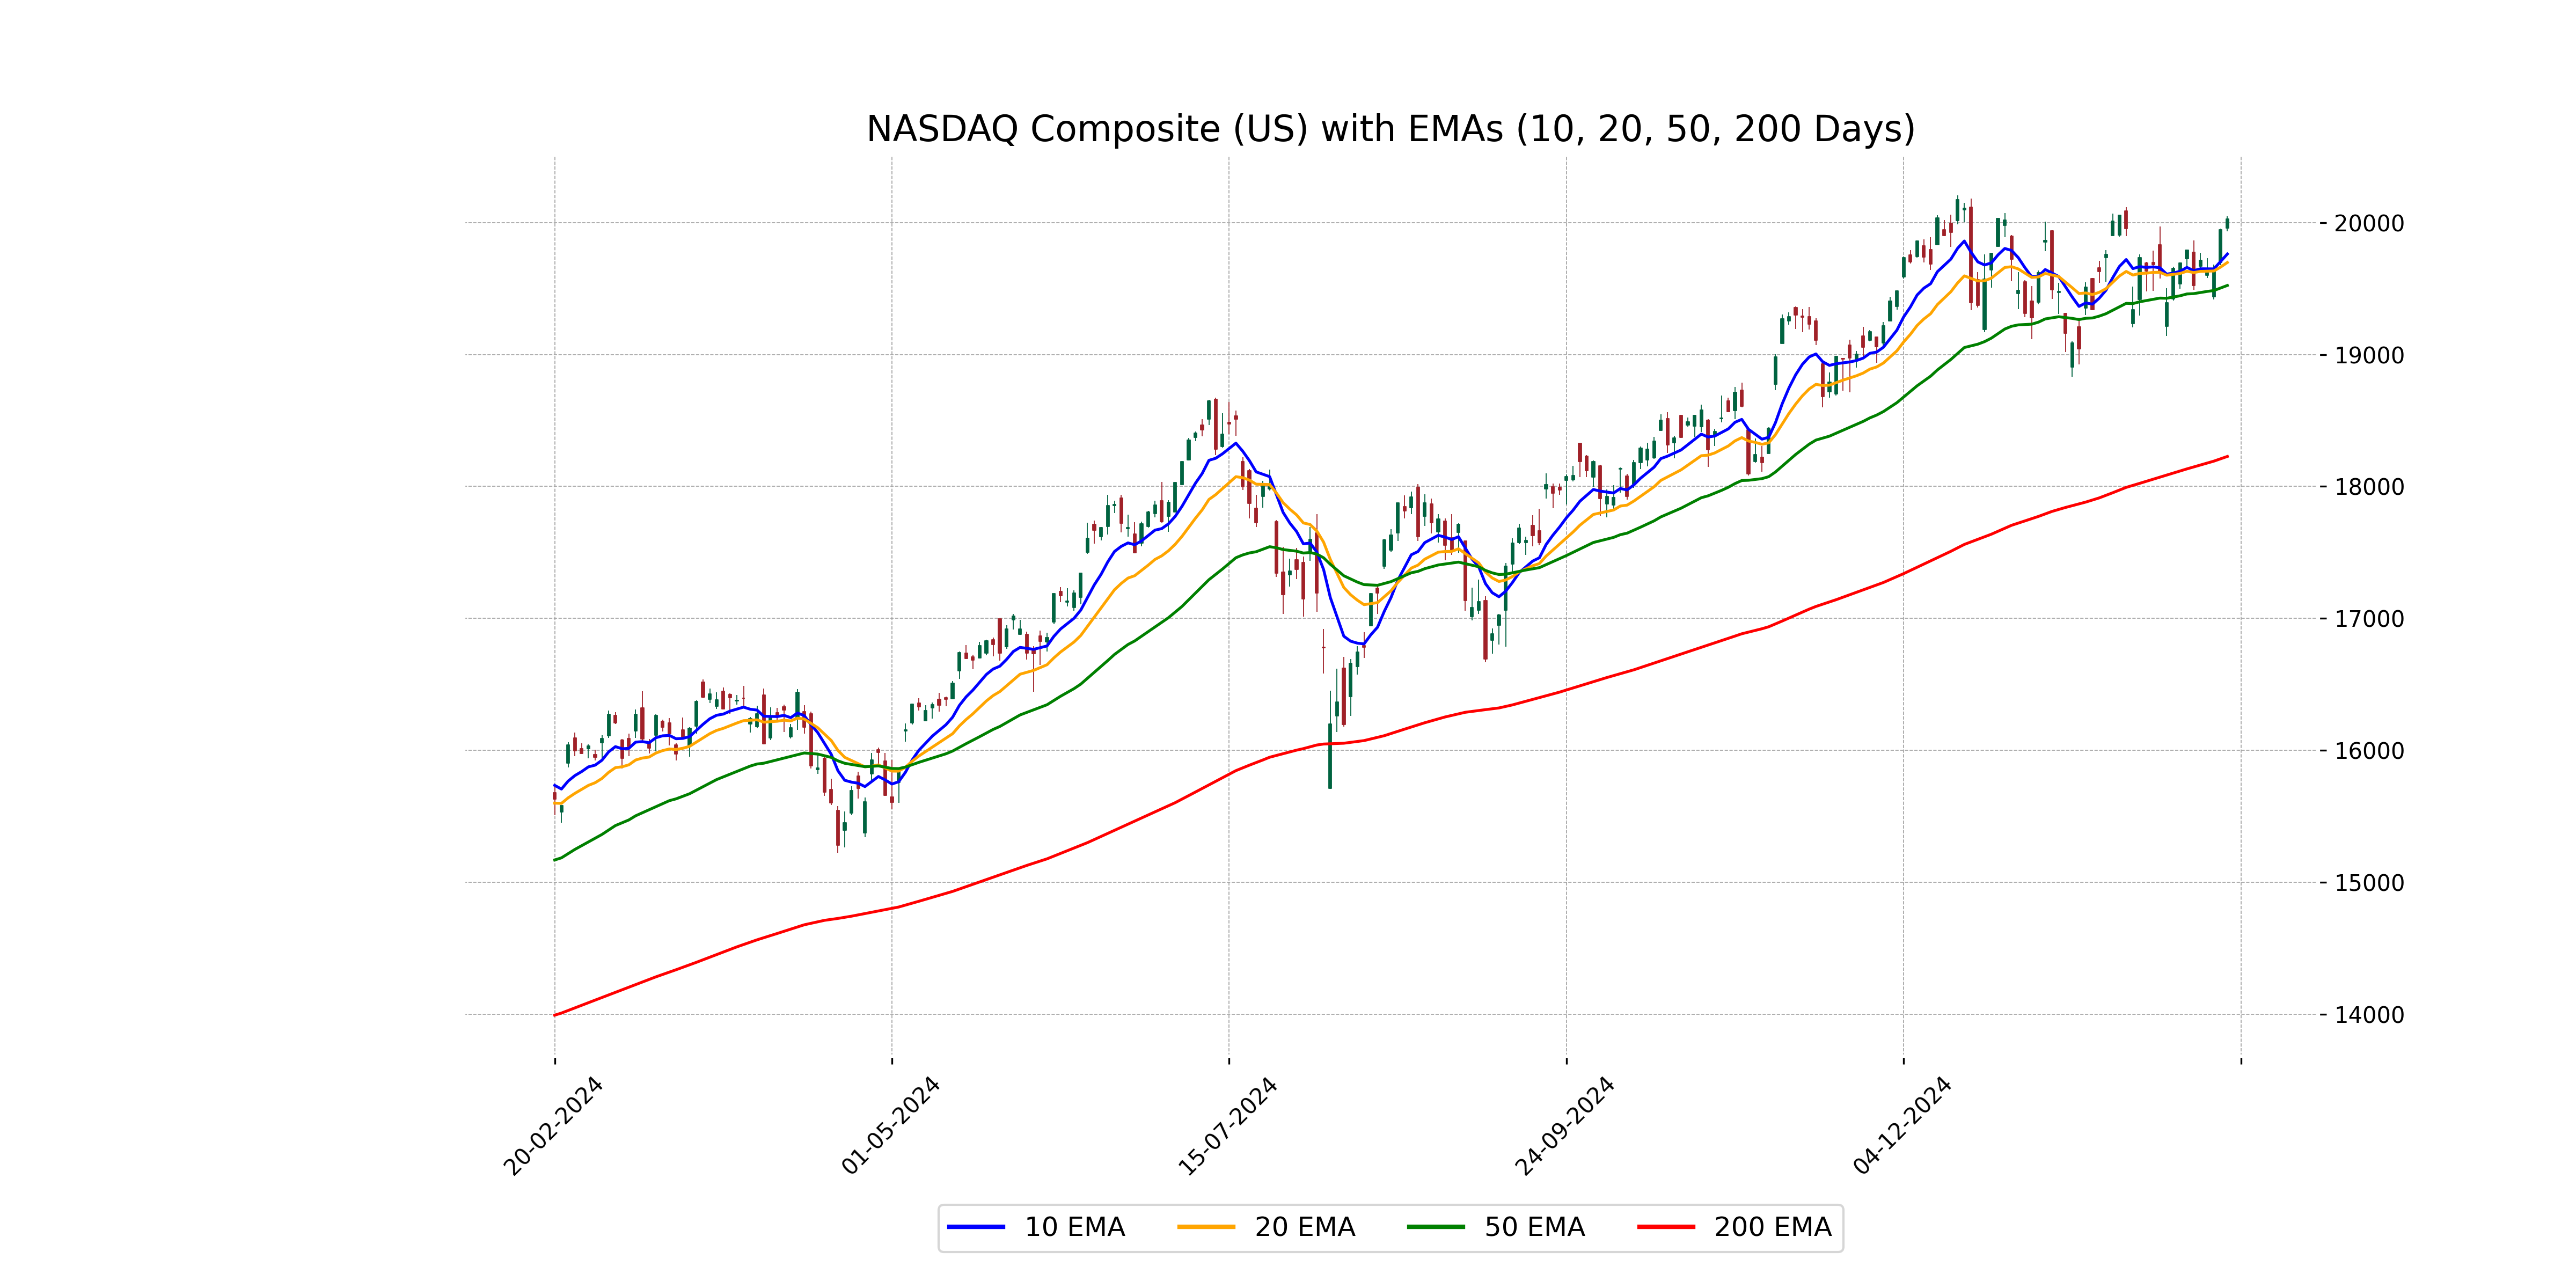
**NASDAQ Composite (US) Performance:** On the trading day, NASDAQ Composite opened at 19956.82 and closed at 20026.77, marking a positive points change of 81.13, or a percentage change of 0.41% from the previous close. The trading volume was robust at 7.99 billion. Key indicators such as the RSI stood at 58.12, suggestive of a stable momentum, while the MACD was positive at 73.79, indicating a bullish trend.
Relationship with Key Moving Averages
The NASDAQ Composite closed at 20026.77, which is above the 50 EMA of 19523.38 and the 200 EMA of 18227.65, indicating a positive trend. The close is also above the 10 EMA of 19761.71 and the 20 EMA of 19697.38, suggesting short-term bullish momentum.
Moving Averages Trend (MACD)
The MACD value for the NASDAQ Composite is 73.78, which is above the MACD Signal line at 45.48. This suggests a bullish trend, indicating increasing momentum in the market.
RSI Analysis
The RSI for NASDAQ Composite is 58.12, which indicates a neutral position as it is between the typical overbought (above 70) and oversold (below 30) levels. This suggests a balanced sentiment with no immediate extremes in buying or selling pressures.
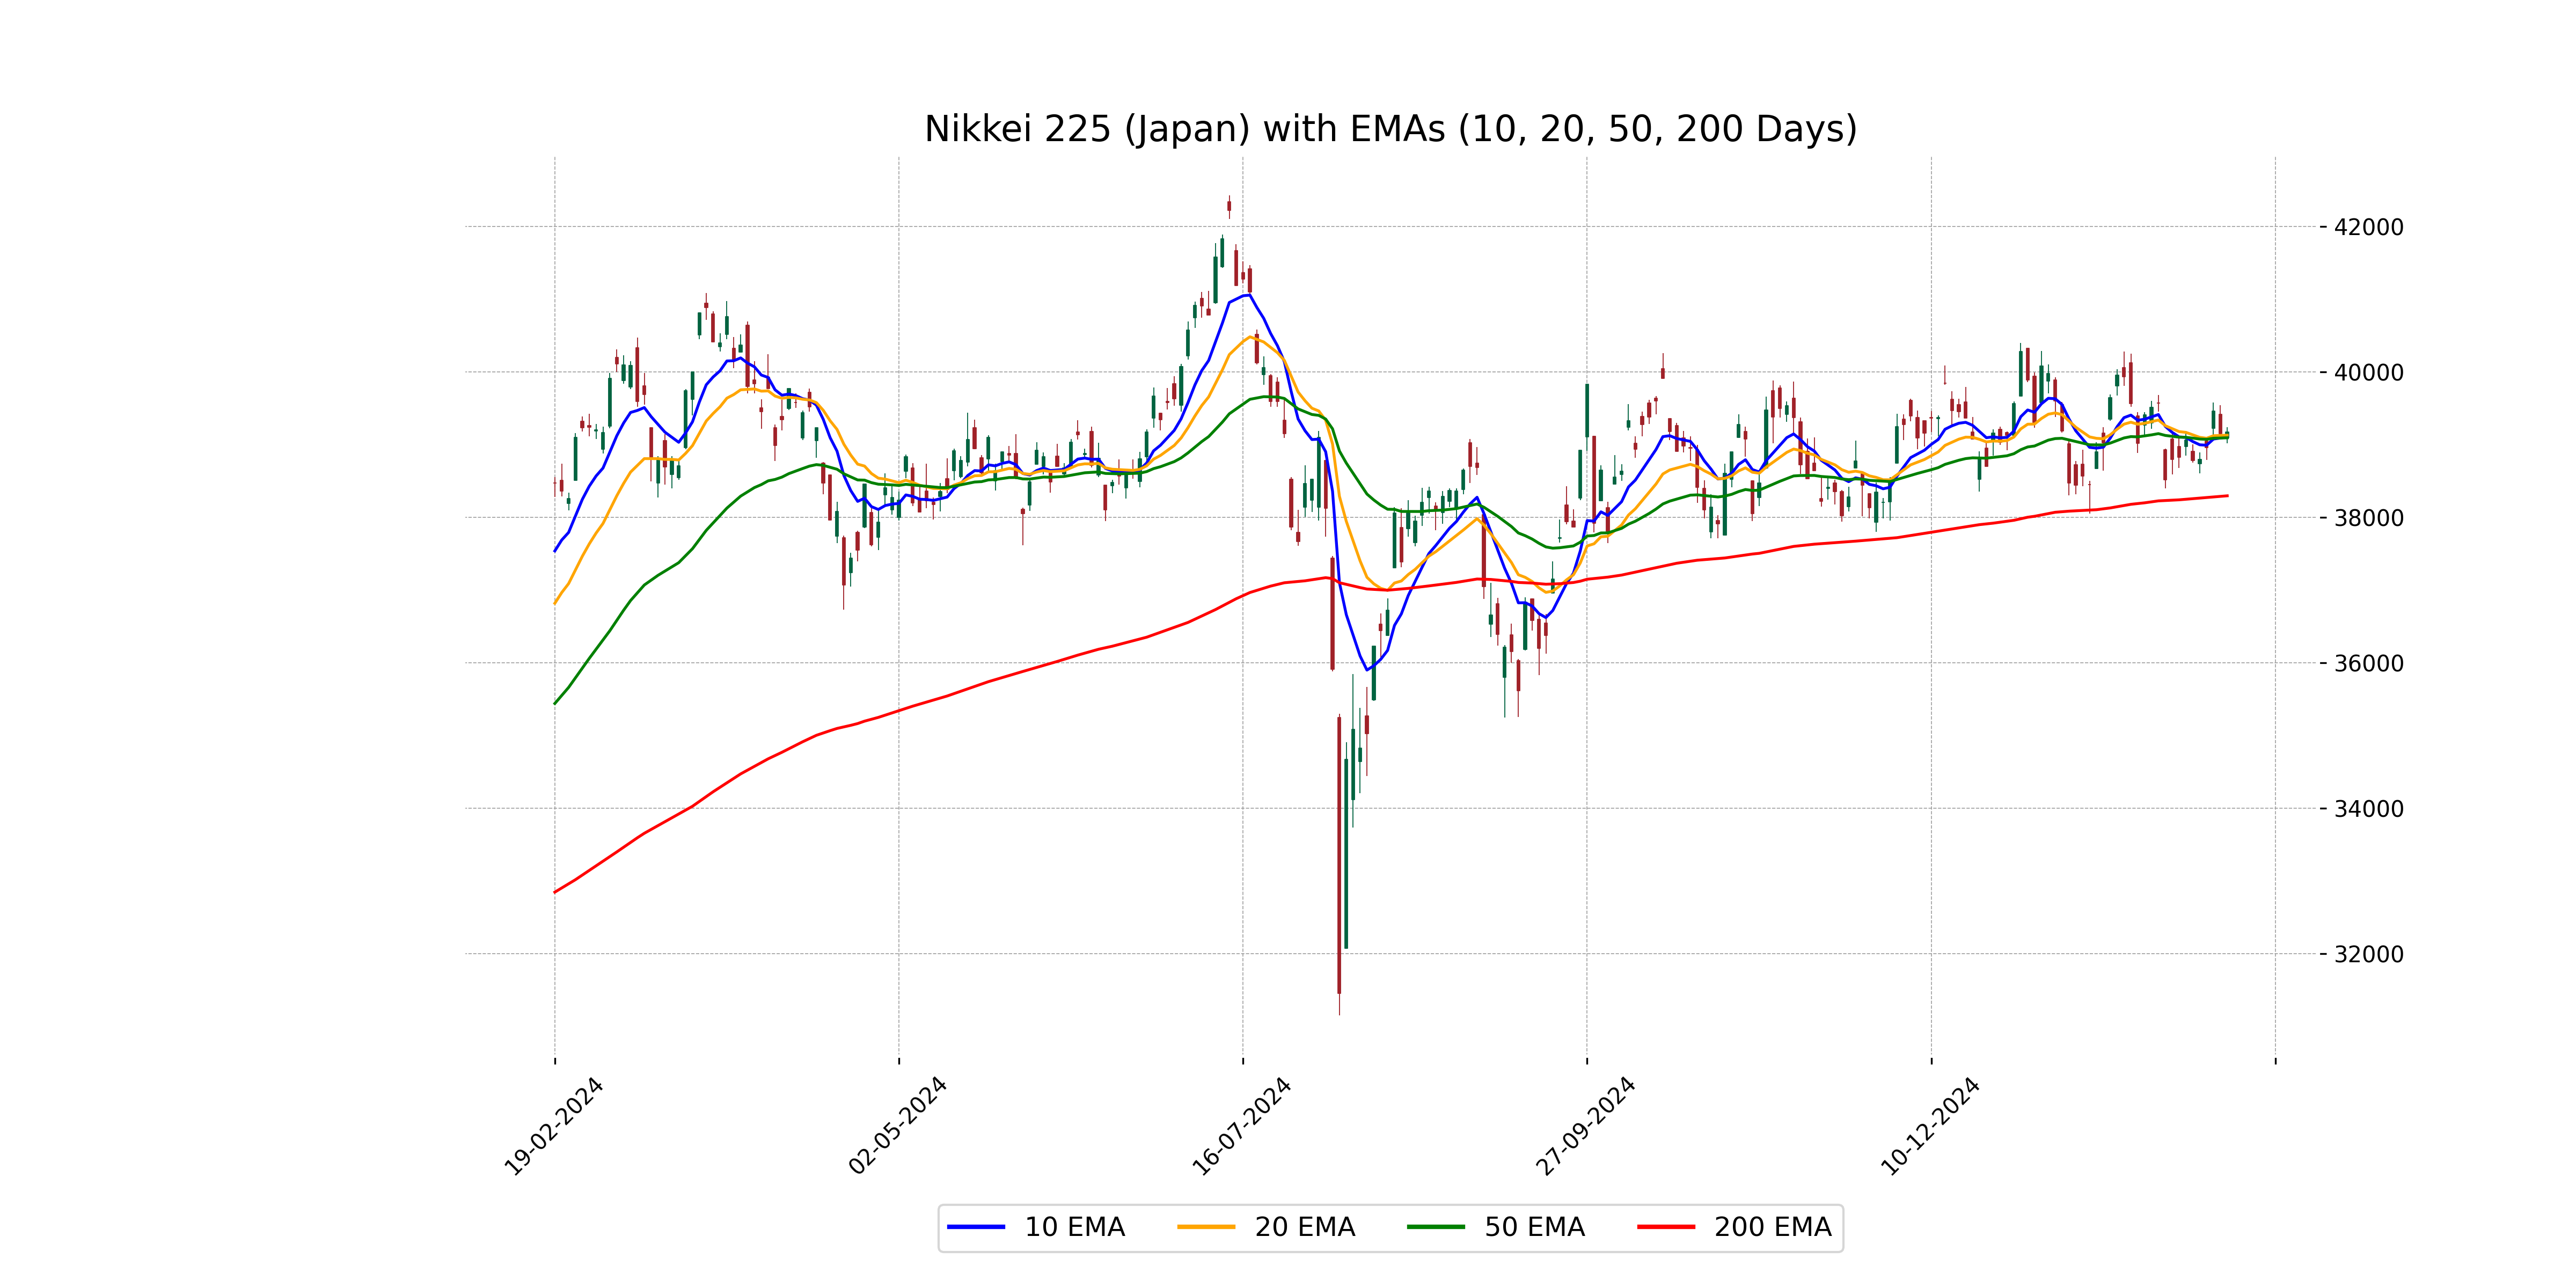
Analysis for Nikkei 225 (Japan) - February 17, 2025
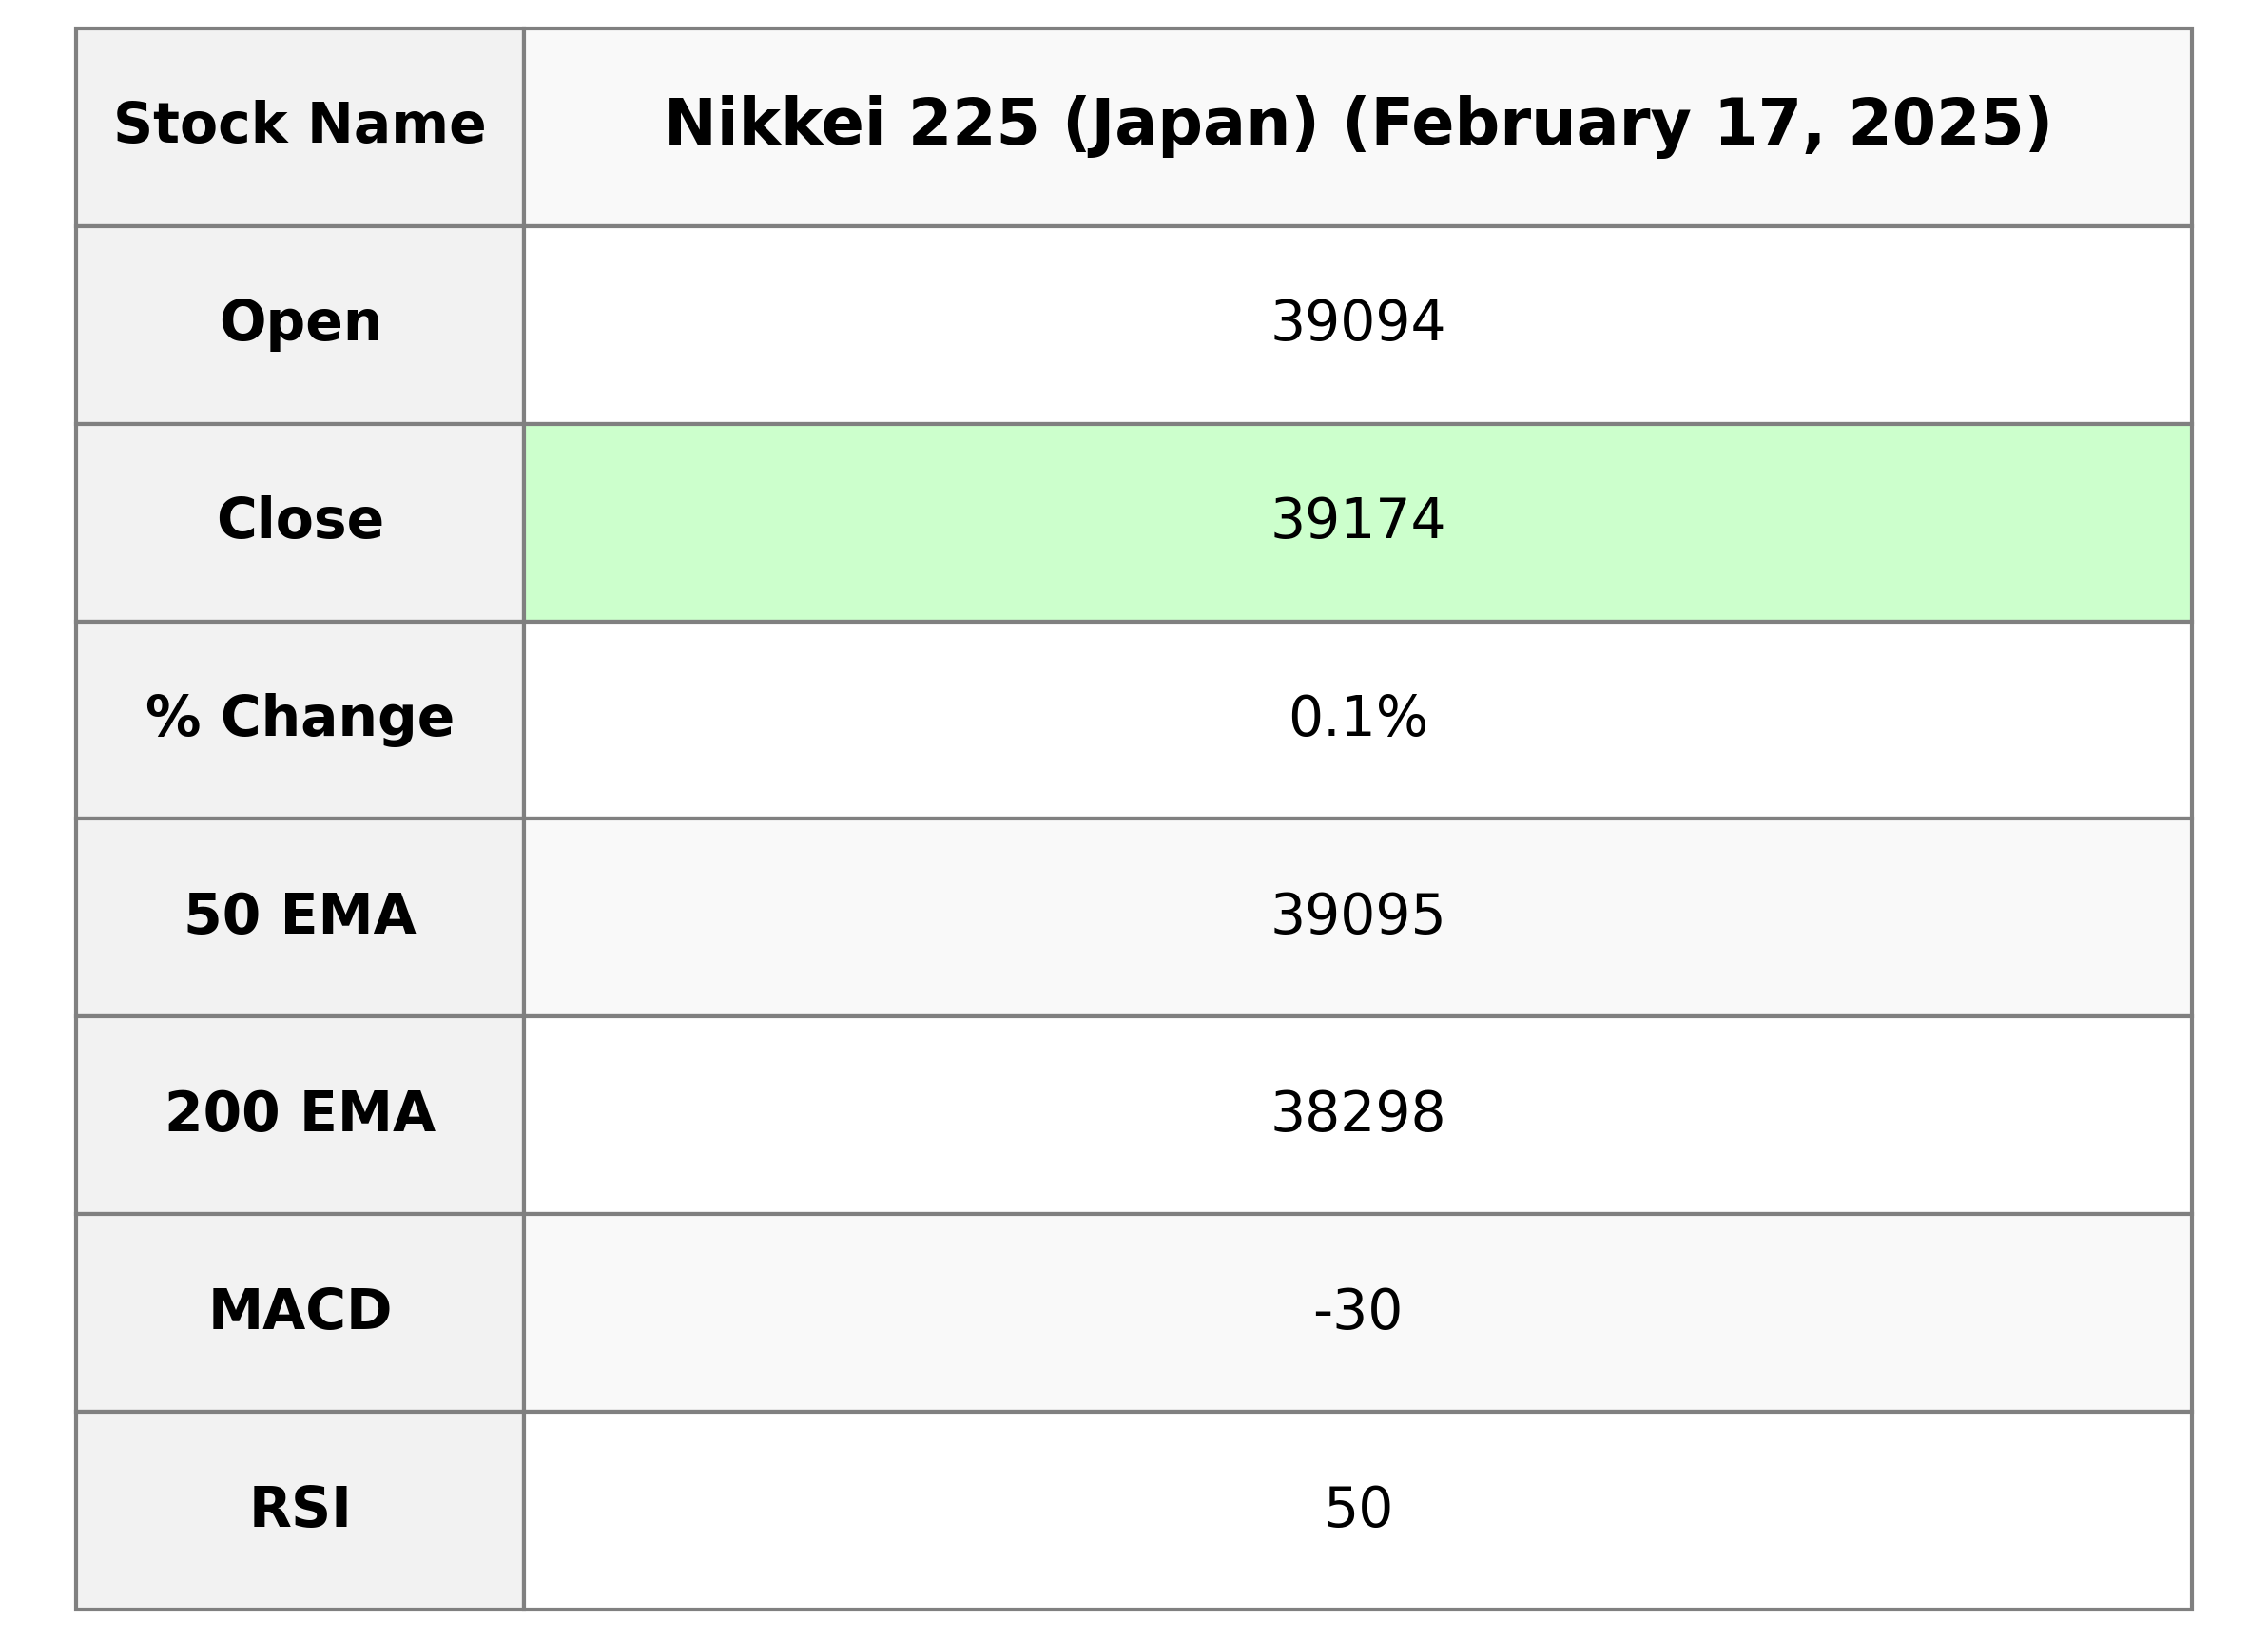
Nikkei 225 (Japan) opened at 39,094.09, reached a high of 39,238.75, and closed at 39,174.25 with a slight gain of 0.06%, which translated to a points change of 24.82. The Relative Strength Index (RSI) is at 50.47, indicating neutral momentum, while the MACD suggests a potentially weakening trend with a value of -30.27. The market showed no recorded volume and EMA analyses depicted short-term indicators hovering around the current value, signifying relative stability in the market.
Relationship with Key Moving Averages
The closing price of Nikkei 225 at 39174.25 is above the 50-day EMA of 39095.09 and the 10-day EMA of 39106.31, indicating short-term bullish momentum. However, it remains close to the 20-day EMA of 39131.19, suggesting a potential consolidation phase.
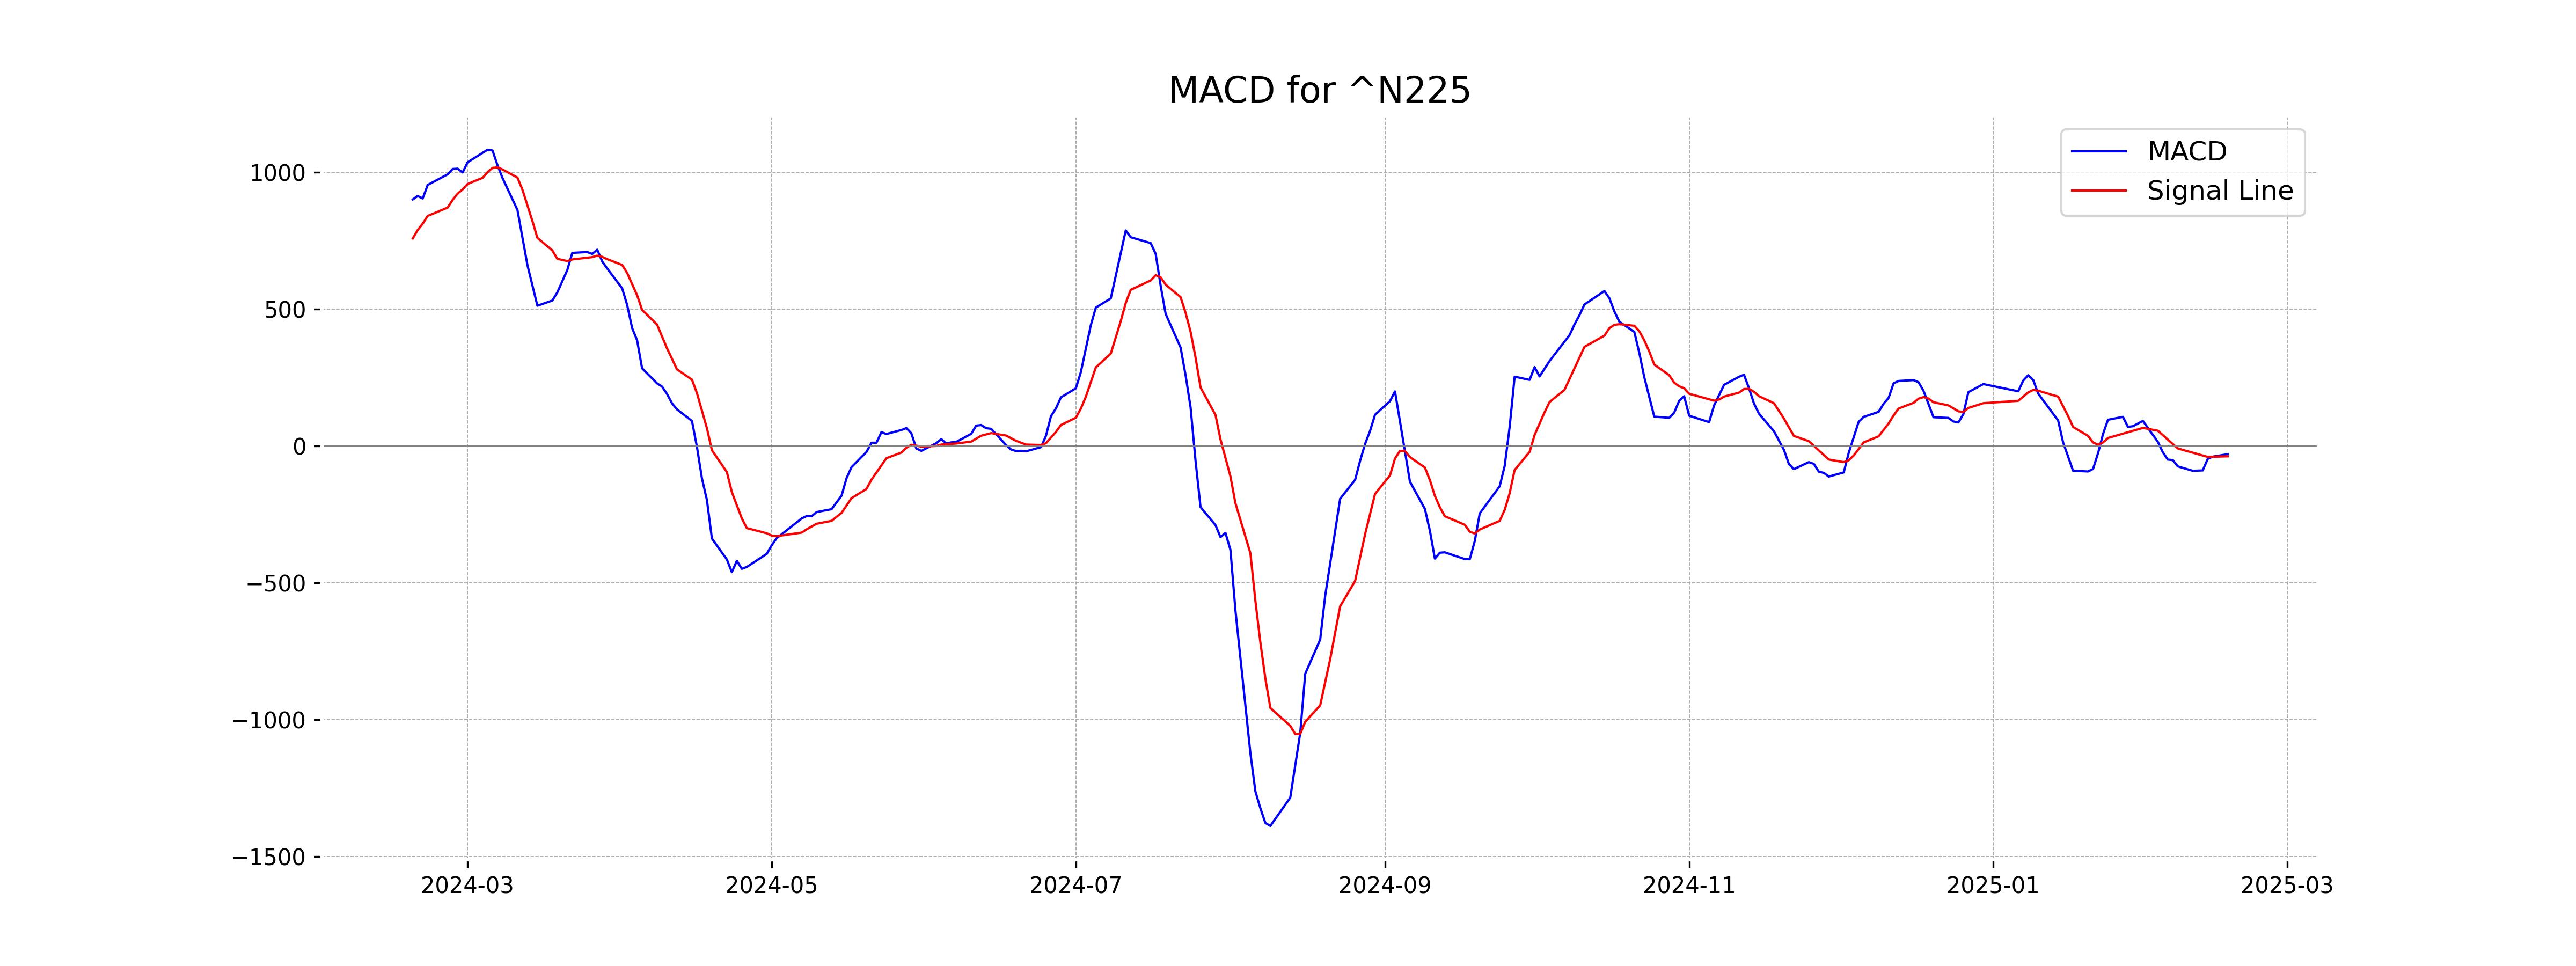
Moving Averages Trend (MACD)
The MACD for Nikkei 225 is -30.27, which is higher than the MACD Signal of -38.12, suggesting a potential bullish crossover. This indicates that the trend might be shifting upwards, although further confirmation would be prudent as the MACD is still in negative territory.
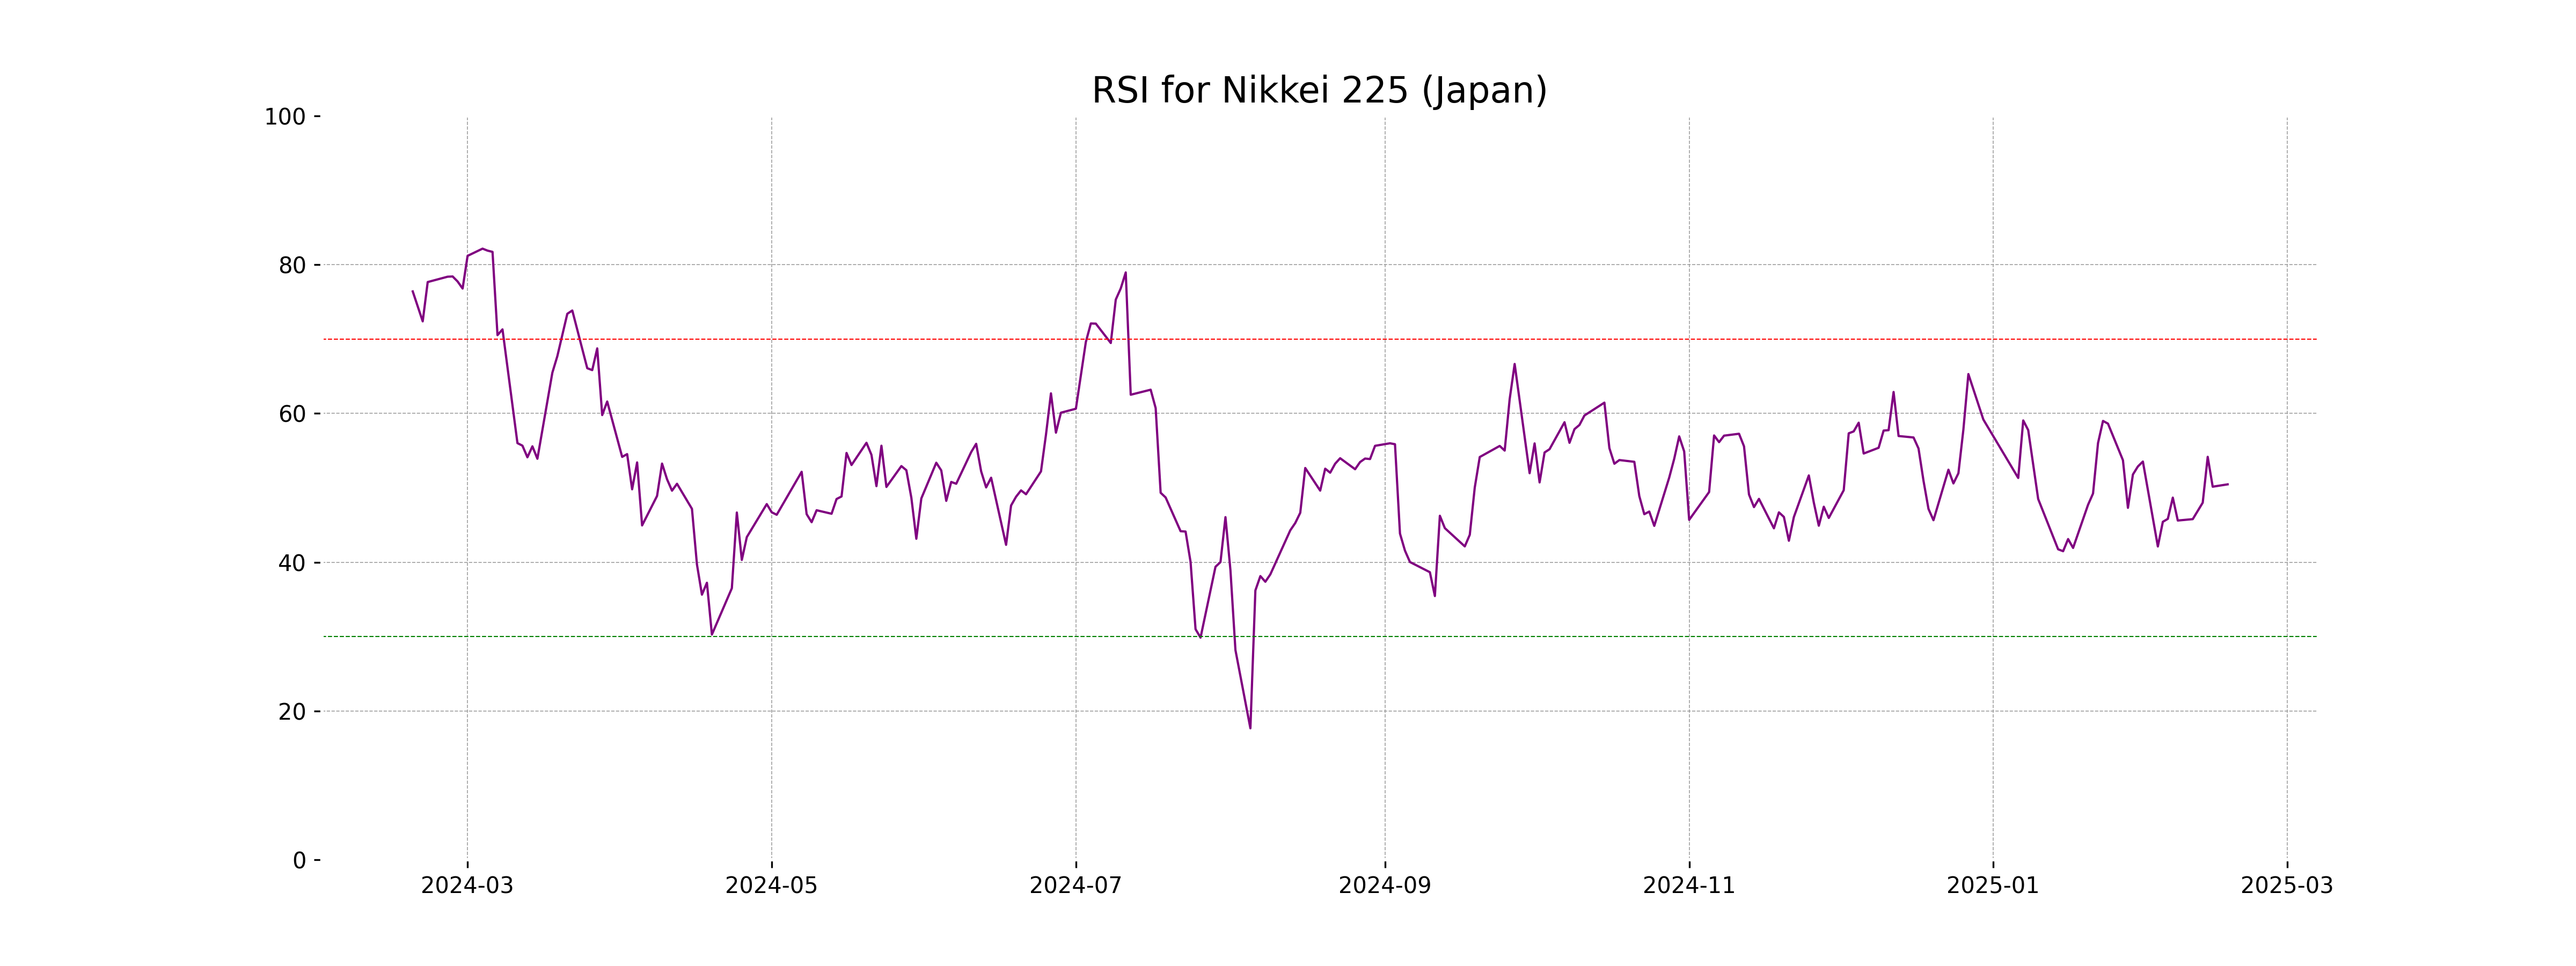
RSI Analysis
The Relative Strength Index (RSI) for Nikkei 225 is 50.47, which suggests a neutral market condition. An RSI around 50 typically indicates a balance between bullish and bearish forces, implying no significant momentum in either direction.
Analysis for Nifty Bank - February 17, 2025
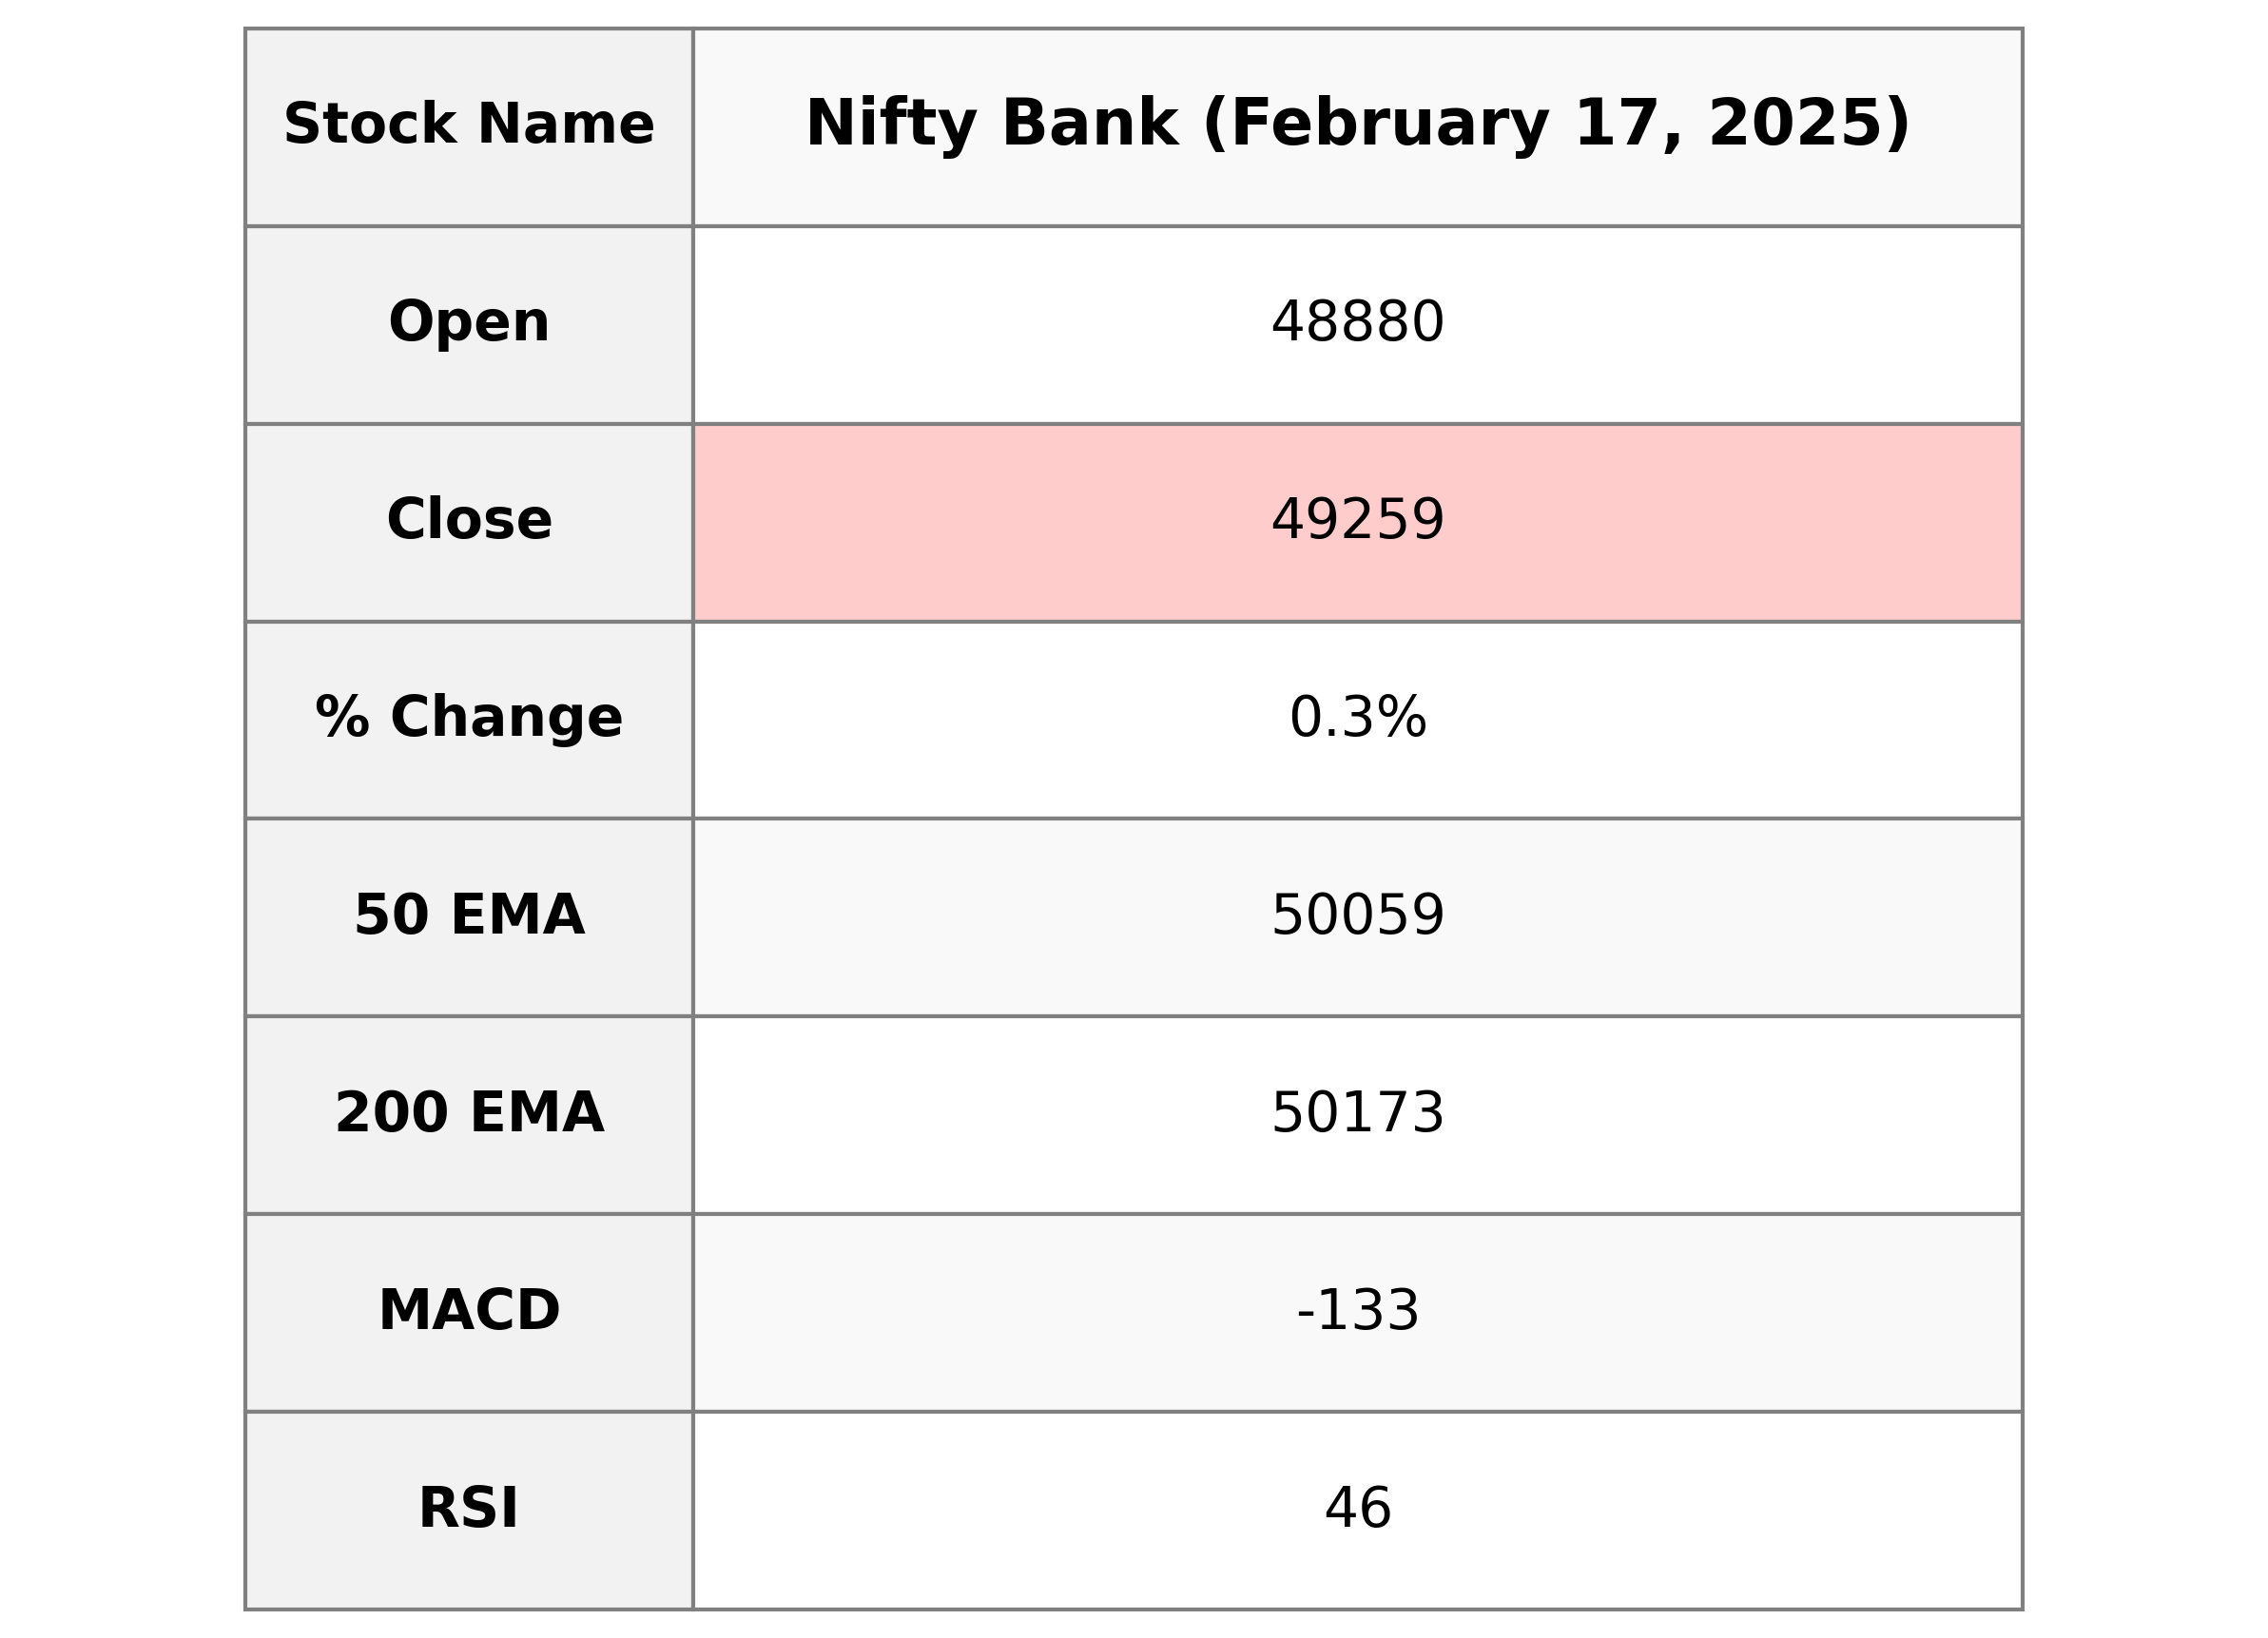
Nifty Bank opened at 48880.40 and closed at 49258.90, marking a slight gain of 0.32% with a points increase of 159.45. The RSI is 45.73, indicating neutrality, while the MACD suggests a slight bearish trend with a value of -133.38. The current close is below its 50, 200, 10, and 20-day EMAs, showing potential resistance at those levels.
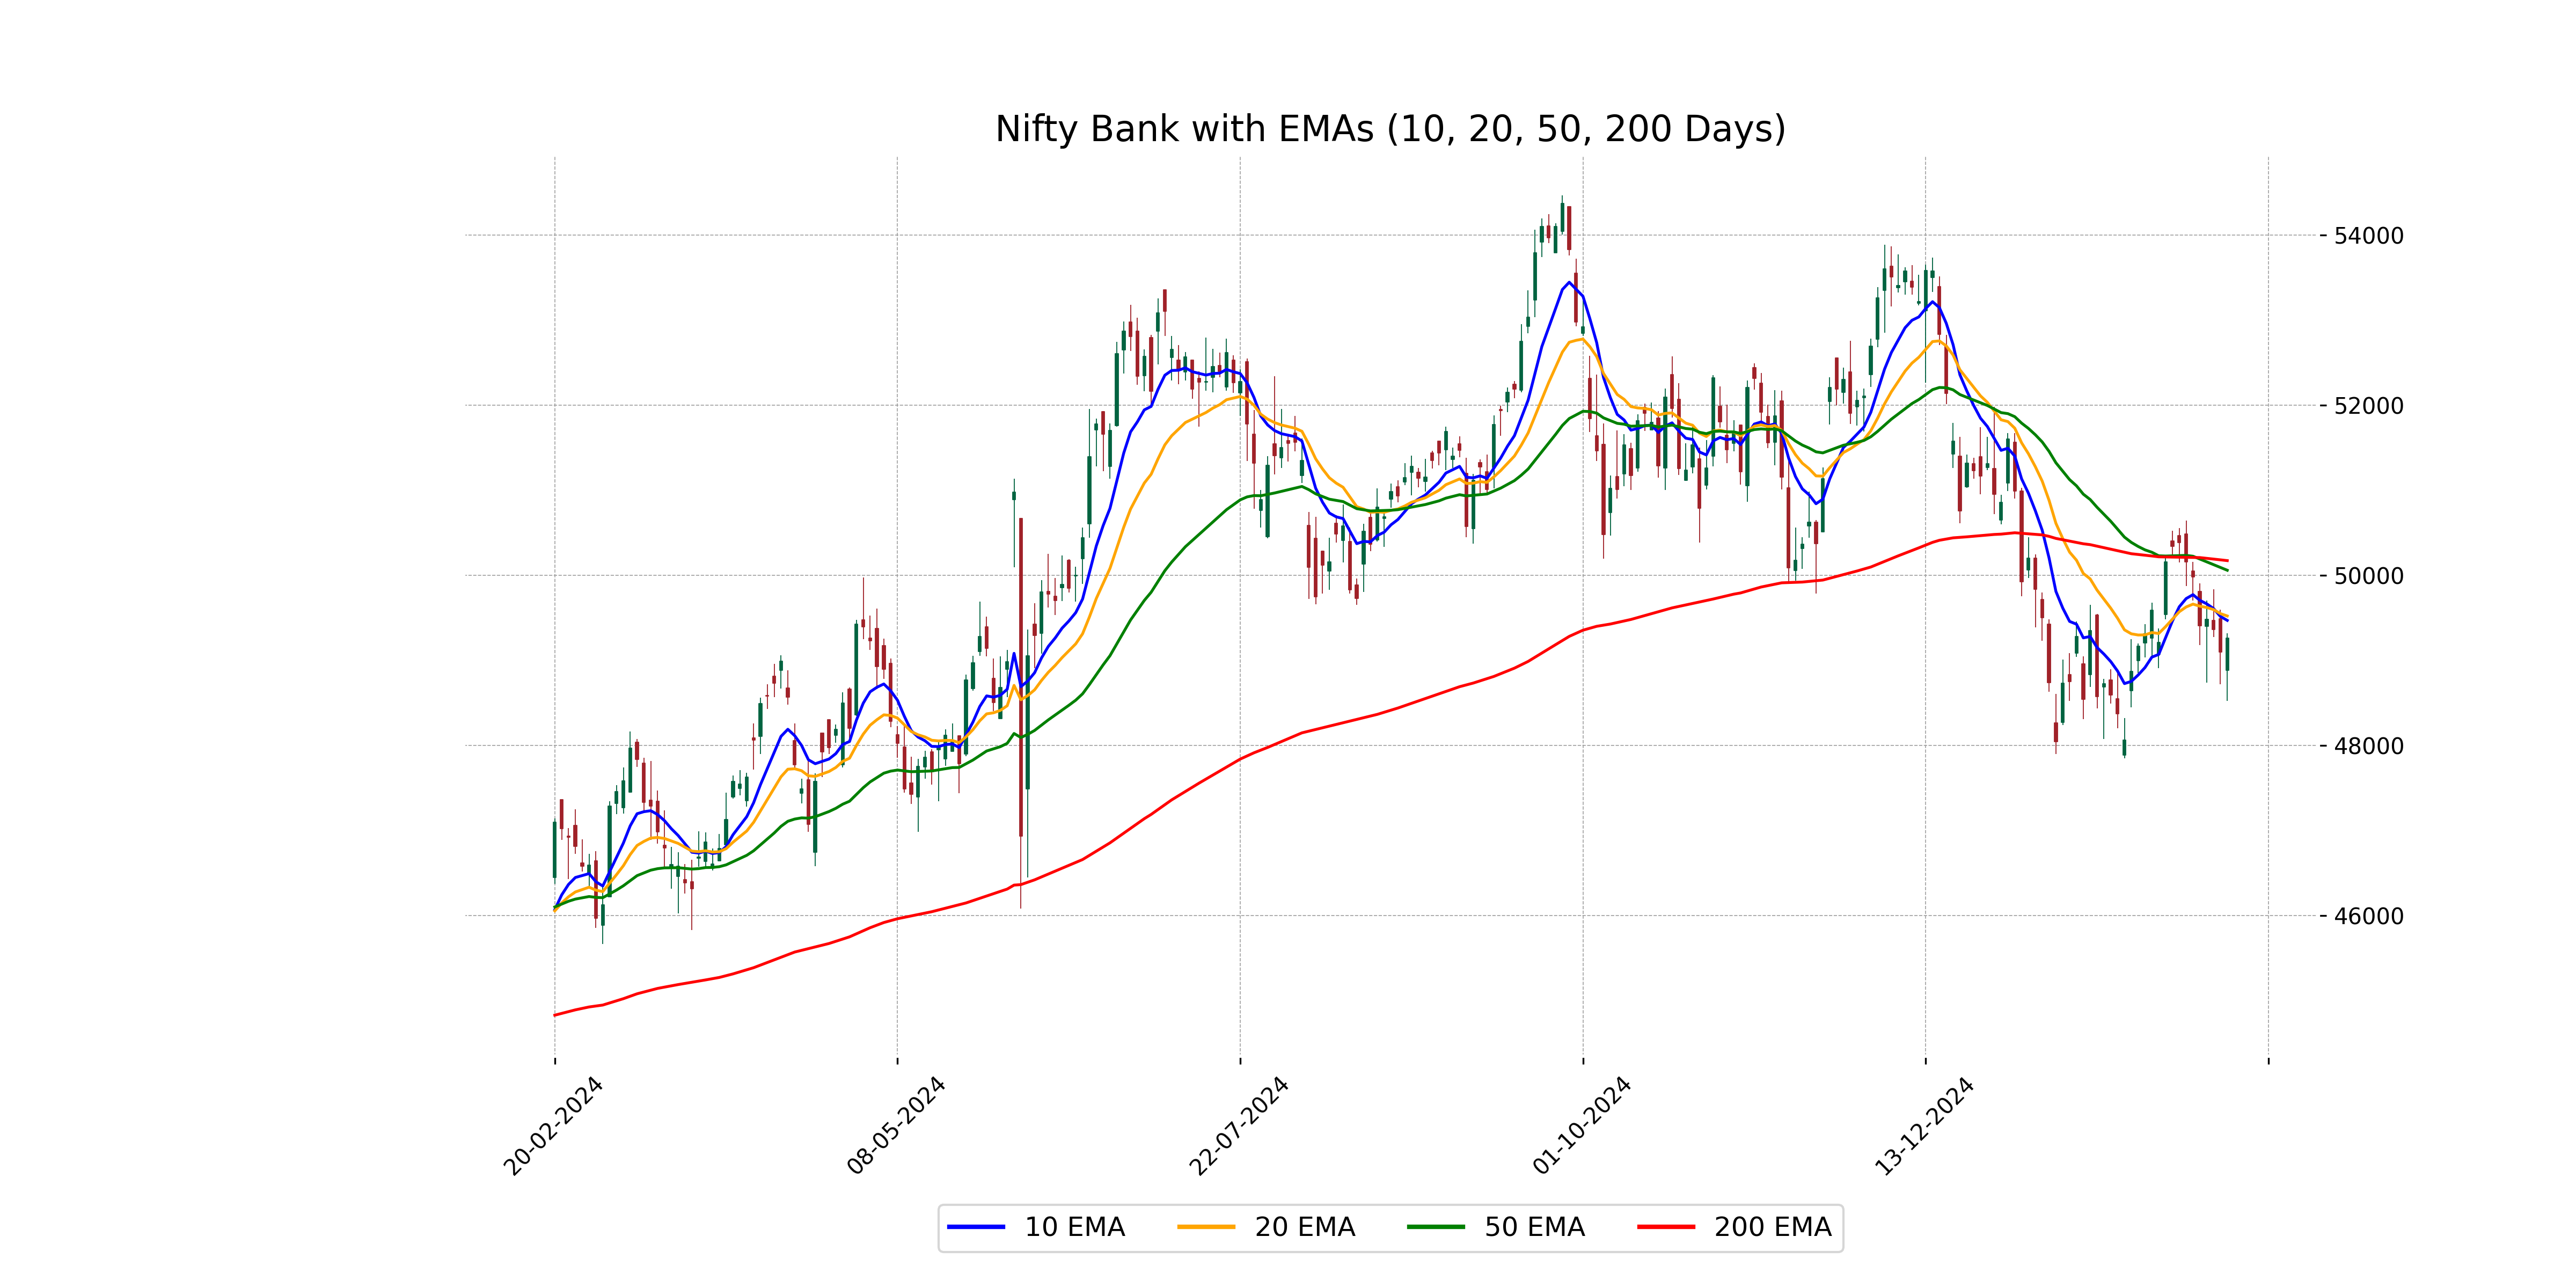
Relationship with Key Moving Averages
The Nifty Bank closed at 49,258.90, which is below its 50 EMA of 50,059.24 and 200 EMA of 50,172.58, indicating a potential bearish trend as the current price is also below these key moving averages. However, it is above the 10 EMA and 20 EMA, suggesting a short-term positive momentum.
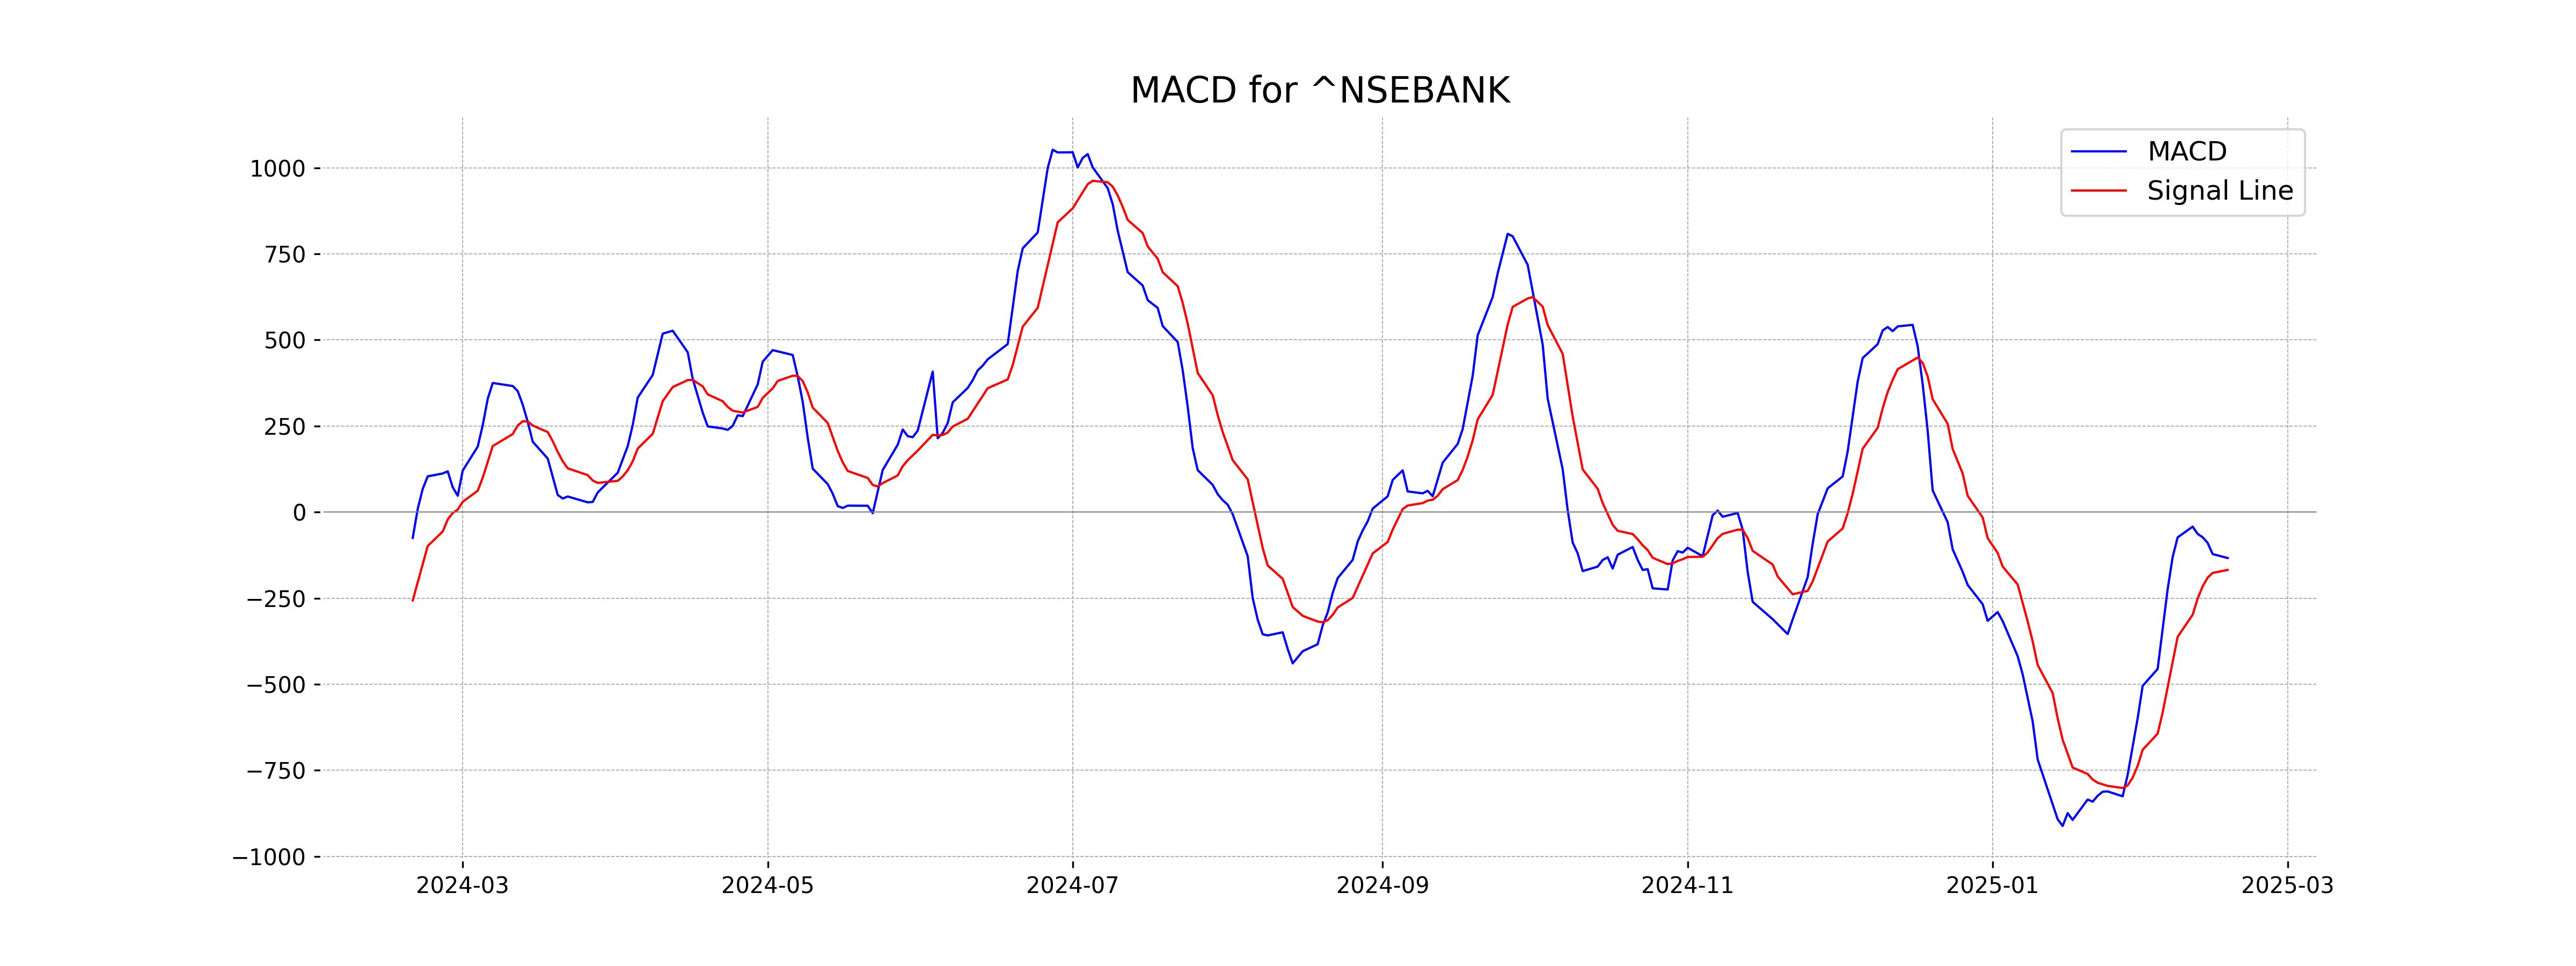
Moving Averages Trend (MACD)
Based on the stock data for Nifty Bank, the MACD value of -133.38 indicates a bearish sentiment, as it is below the MACD Signal line at -168.04. This suggests that the current trend may continue downwards unless there is a shift in momentum.
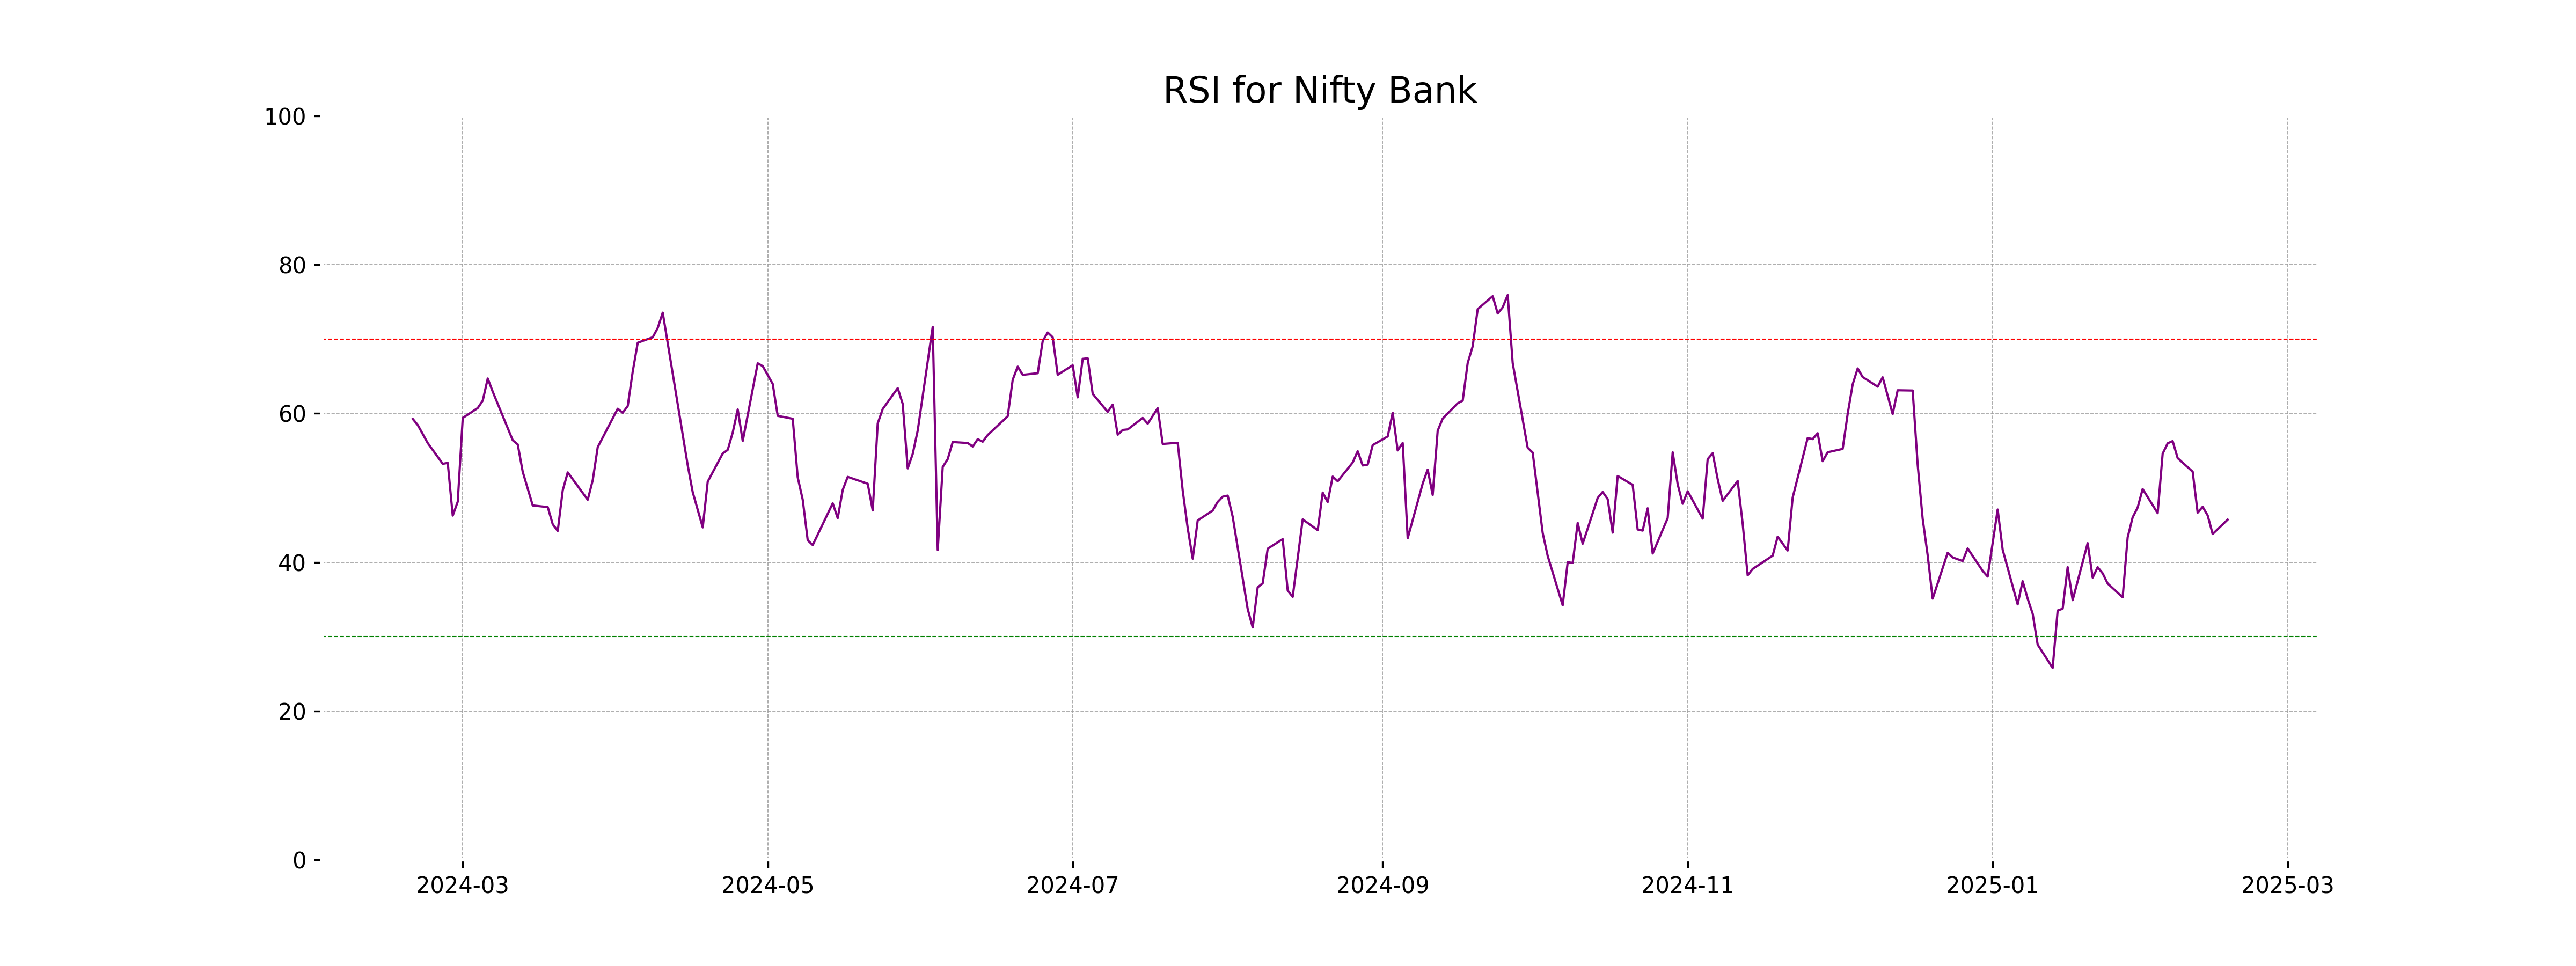
RSI Analysis
**Relative Strength Index (RSI) Analysis for Nifty Bank:** The RSI for Nifty Bank is at 45.73, which suggests it is nearing the lower end of the neutral range of 30-70. This indicates that the stock is neither overbought nor oversold, hovering around a neutral momentum.
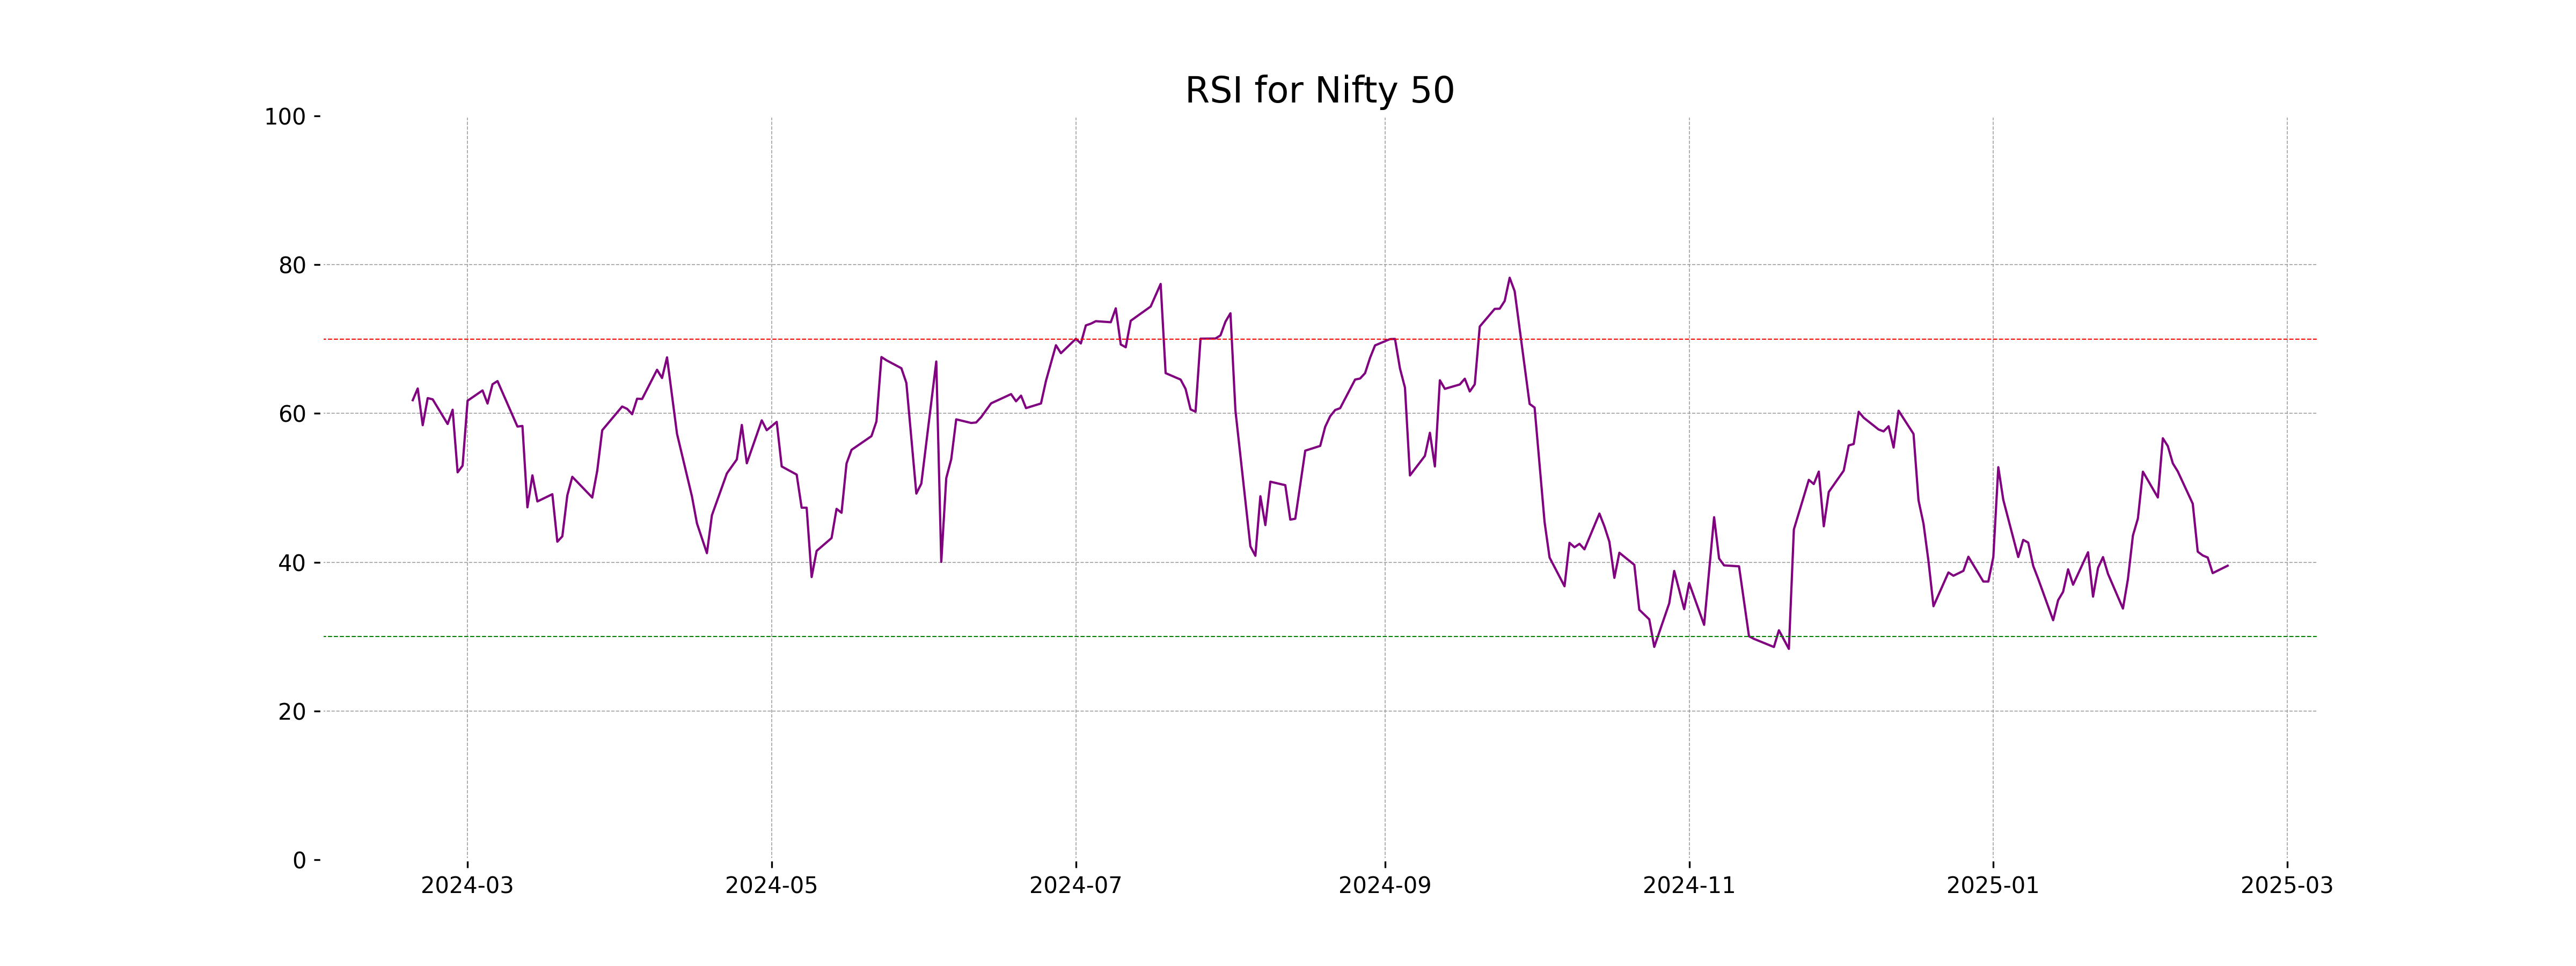
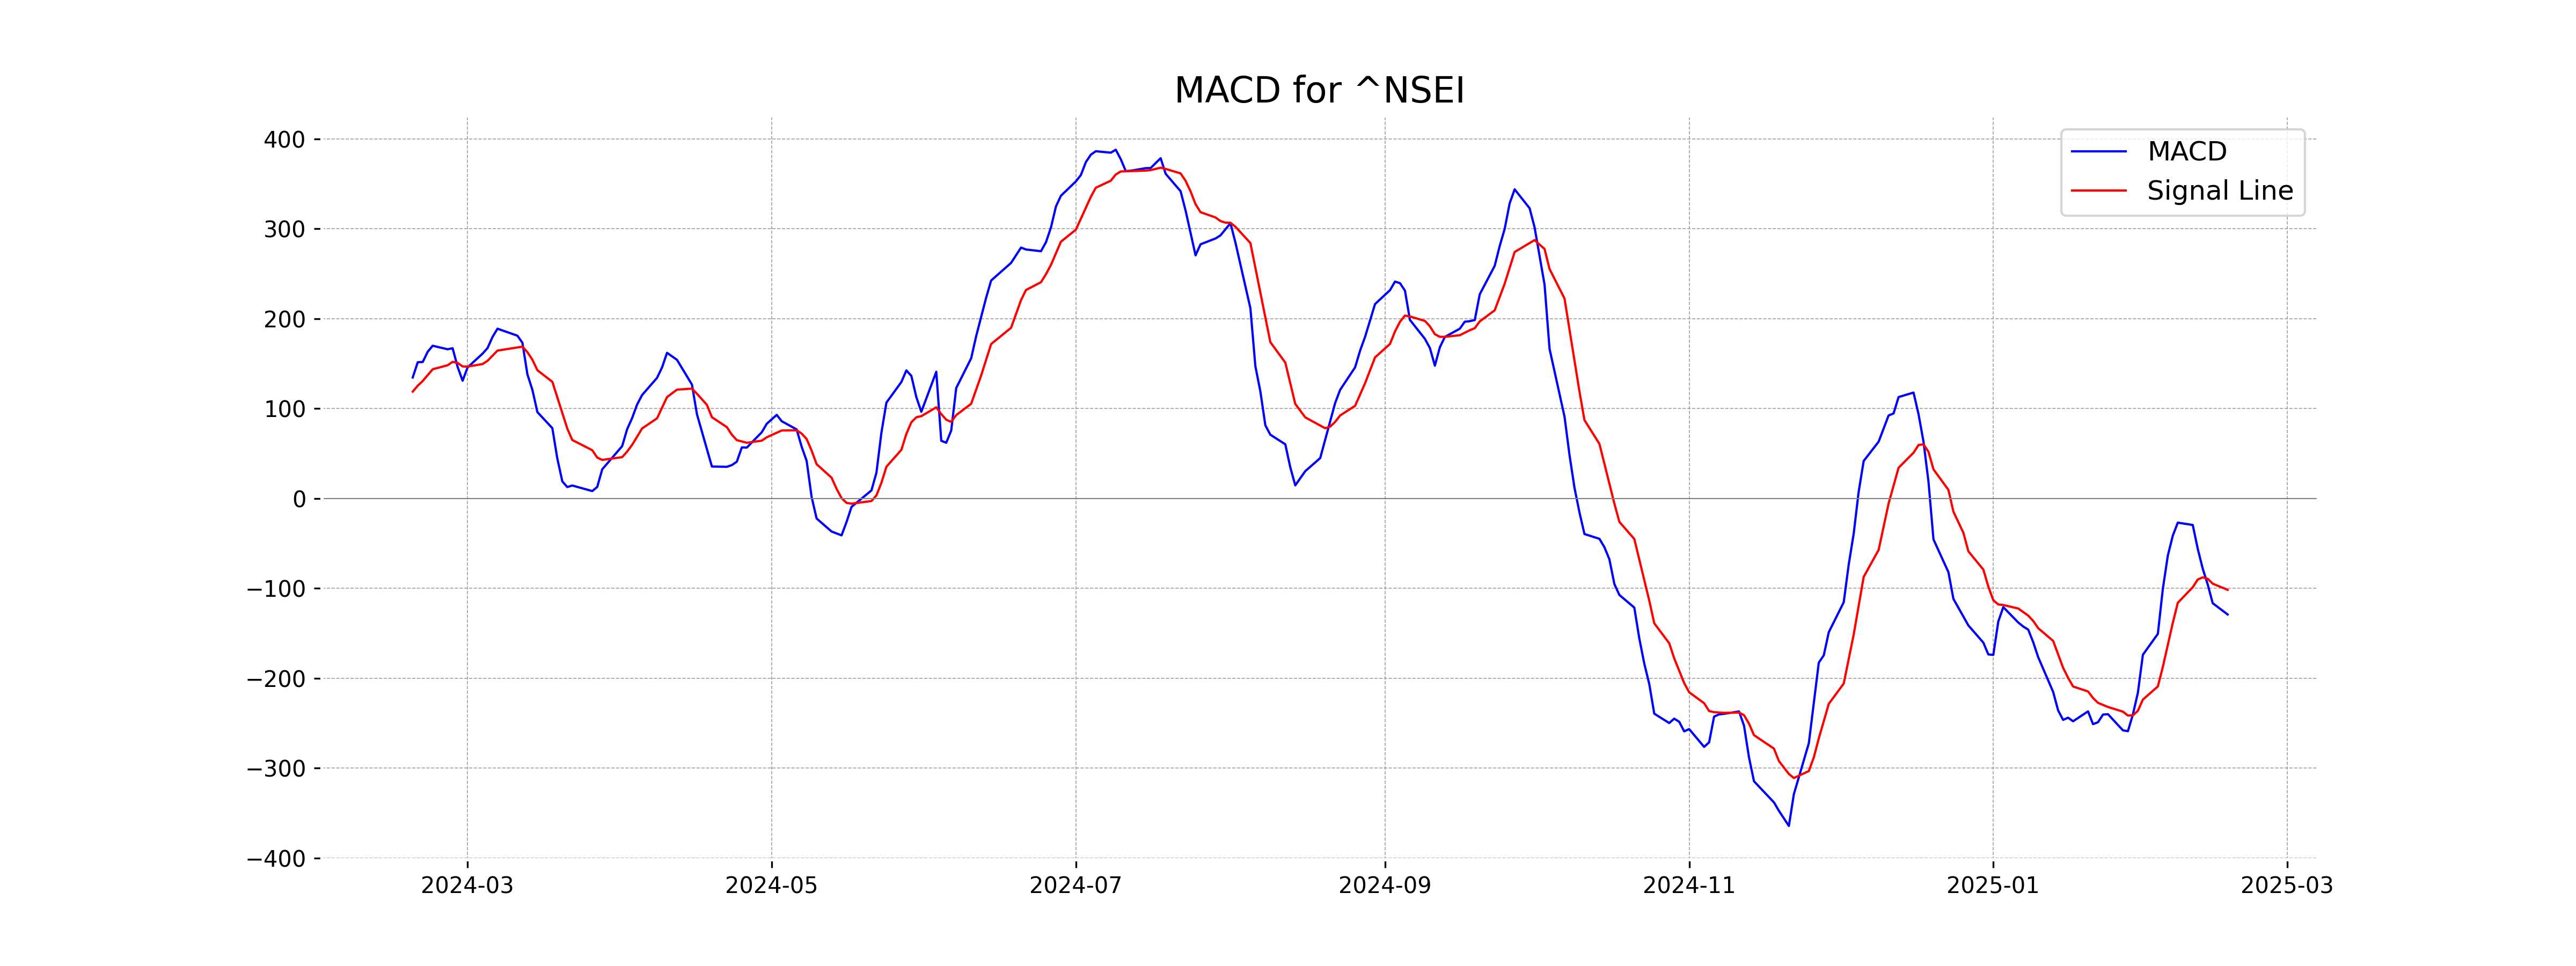
Analysis for Nifty 50 - February 17, 2025
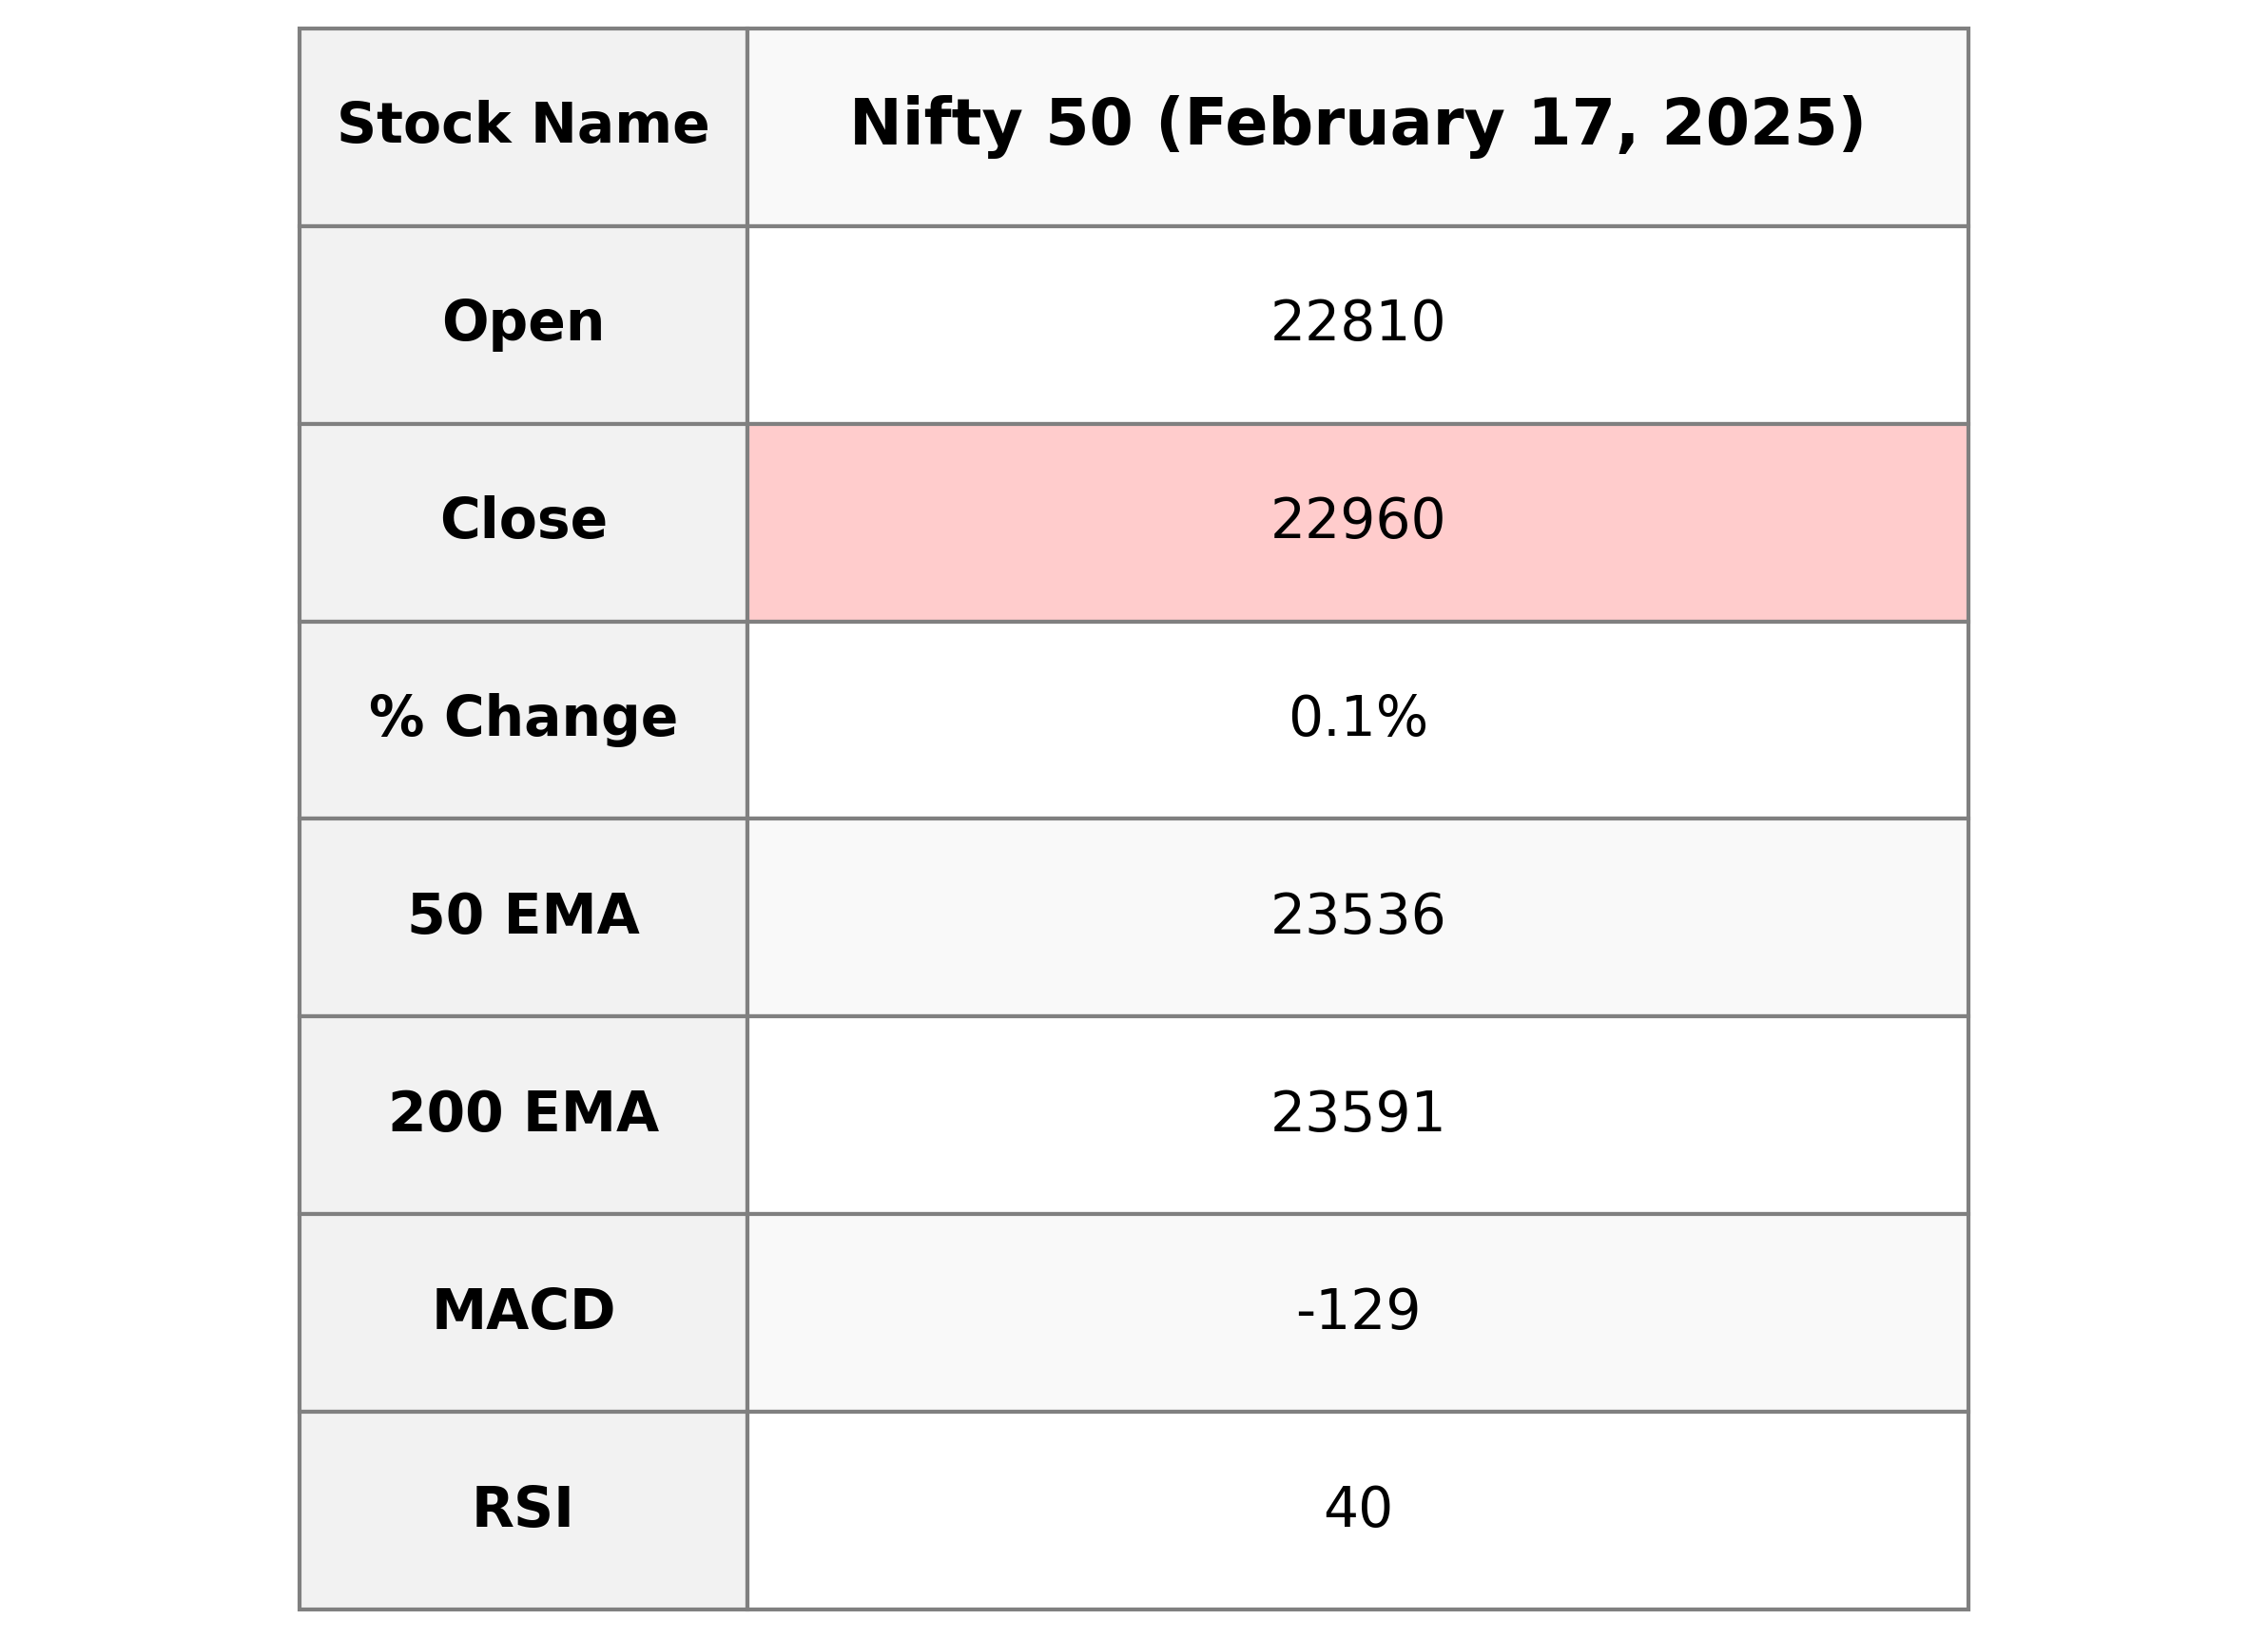
Nifty 50 opened at 22809.90 and closed at 22959.5, marking a minor increase of 0.13% or 30.25 points. Despite the small positive change, the RSI of 39.53 suggests it is nearing the oversold territory. The MACD of -129.09 indicates a potential bearish trend as it is below the MACD signal line of -101.65.
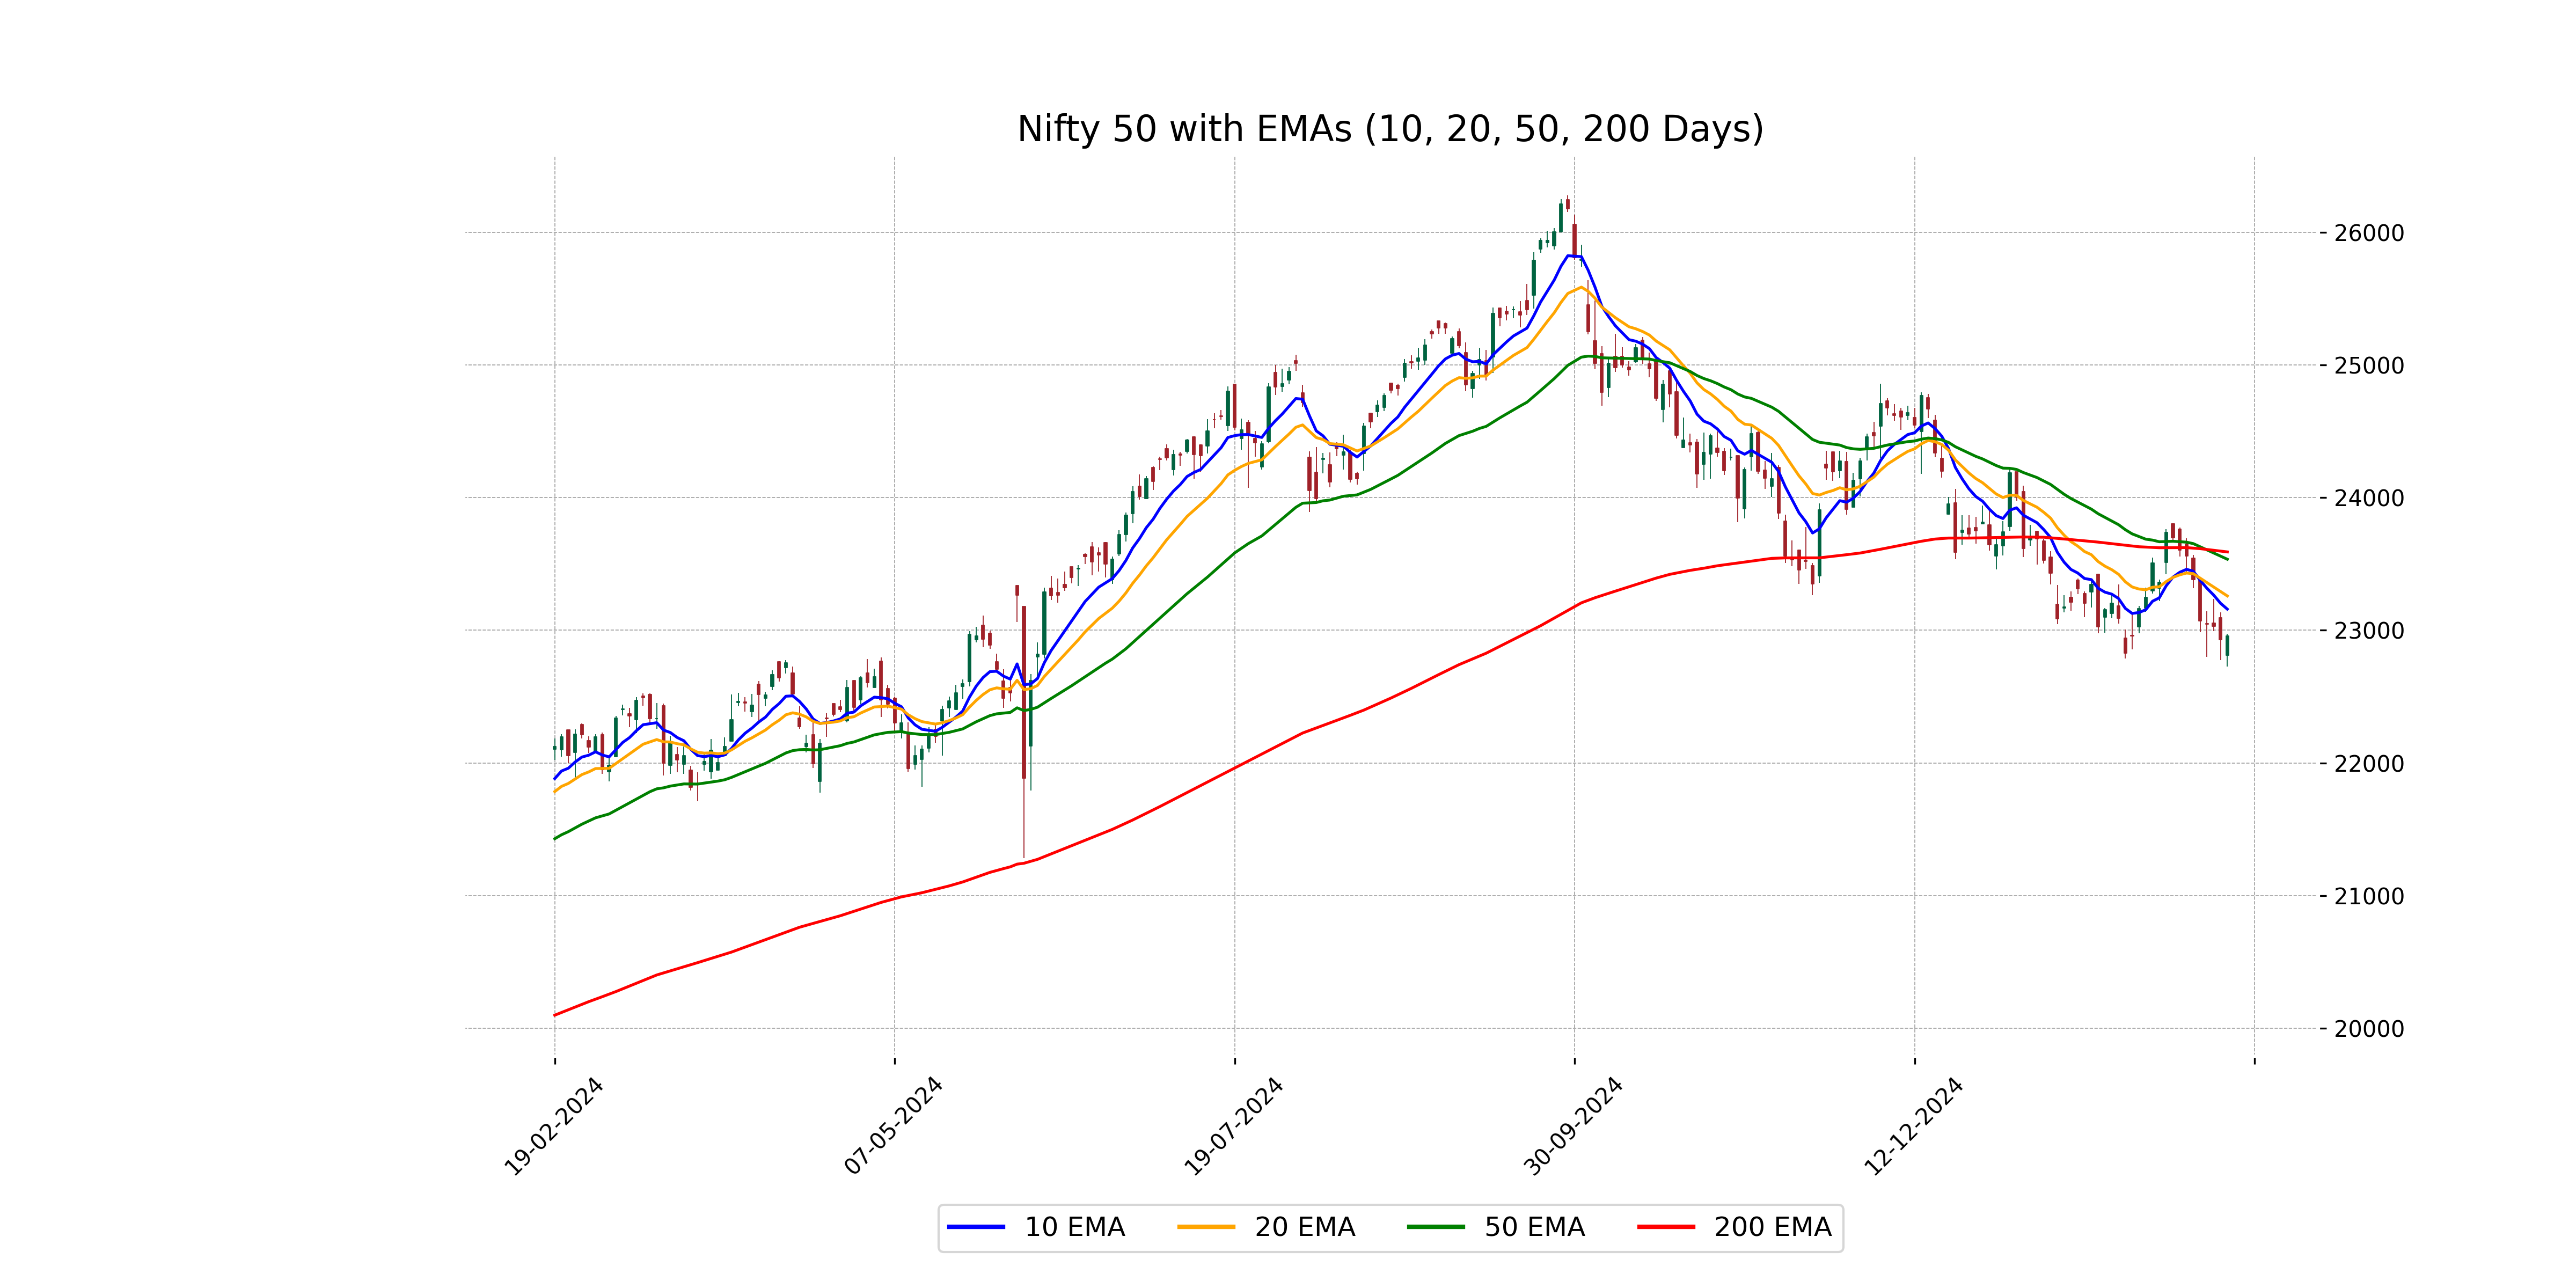
Relationship with Key Moving Averages
The Nifty 50's closing price of 22,959.5 is below all key moving averages, including the 50 EMA (23,535.76), 200 EMA (23,590.99), 20 EMA (23,259.09), and 10 EMA (23,159.64). This suggests a bearish momentum in the market given the current levels are below short-term and long-term trends.
Moving Averages Trend (MACD)
Nifty 50's MACD is negative at -129.09, which is below its signal line of -101.65. This suggests a bearish sentiment in the market, indicating potential downward momentum. Investors might be cautious due to this bearish crossover in the MACD indicator.
RSI Analysis
The Relative Strength Index (RSI) for Nifty 50 is currently at 39.53, indicating that the index is nearing the oversold territory, as an RSI below 30 is typically seen as oversold. This suggests potential weakness and could be a signal for traders to watch for a reversal or continued downward trend.