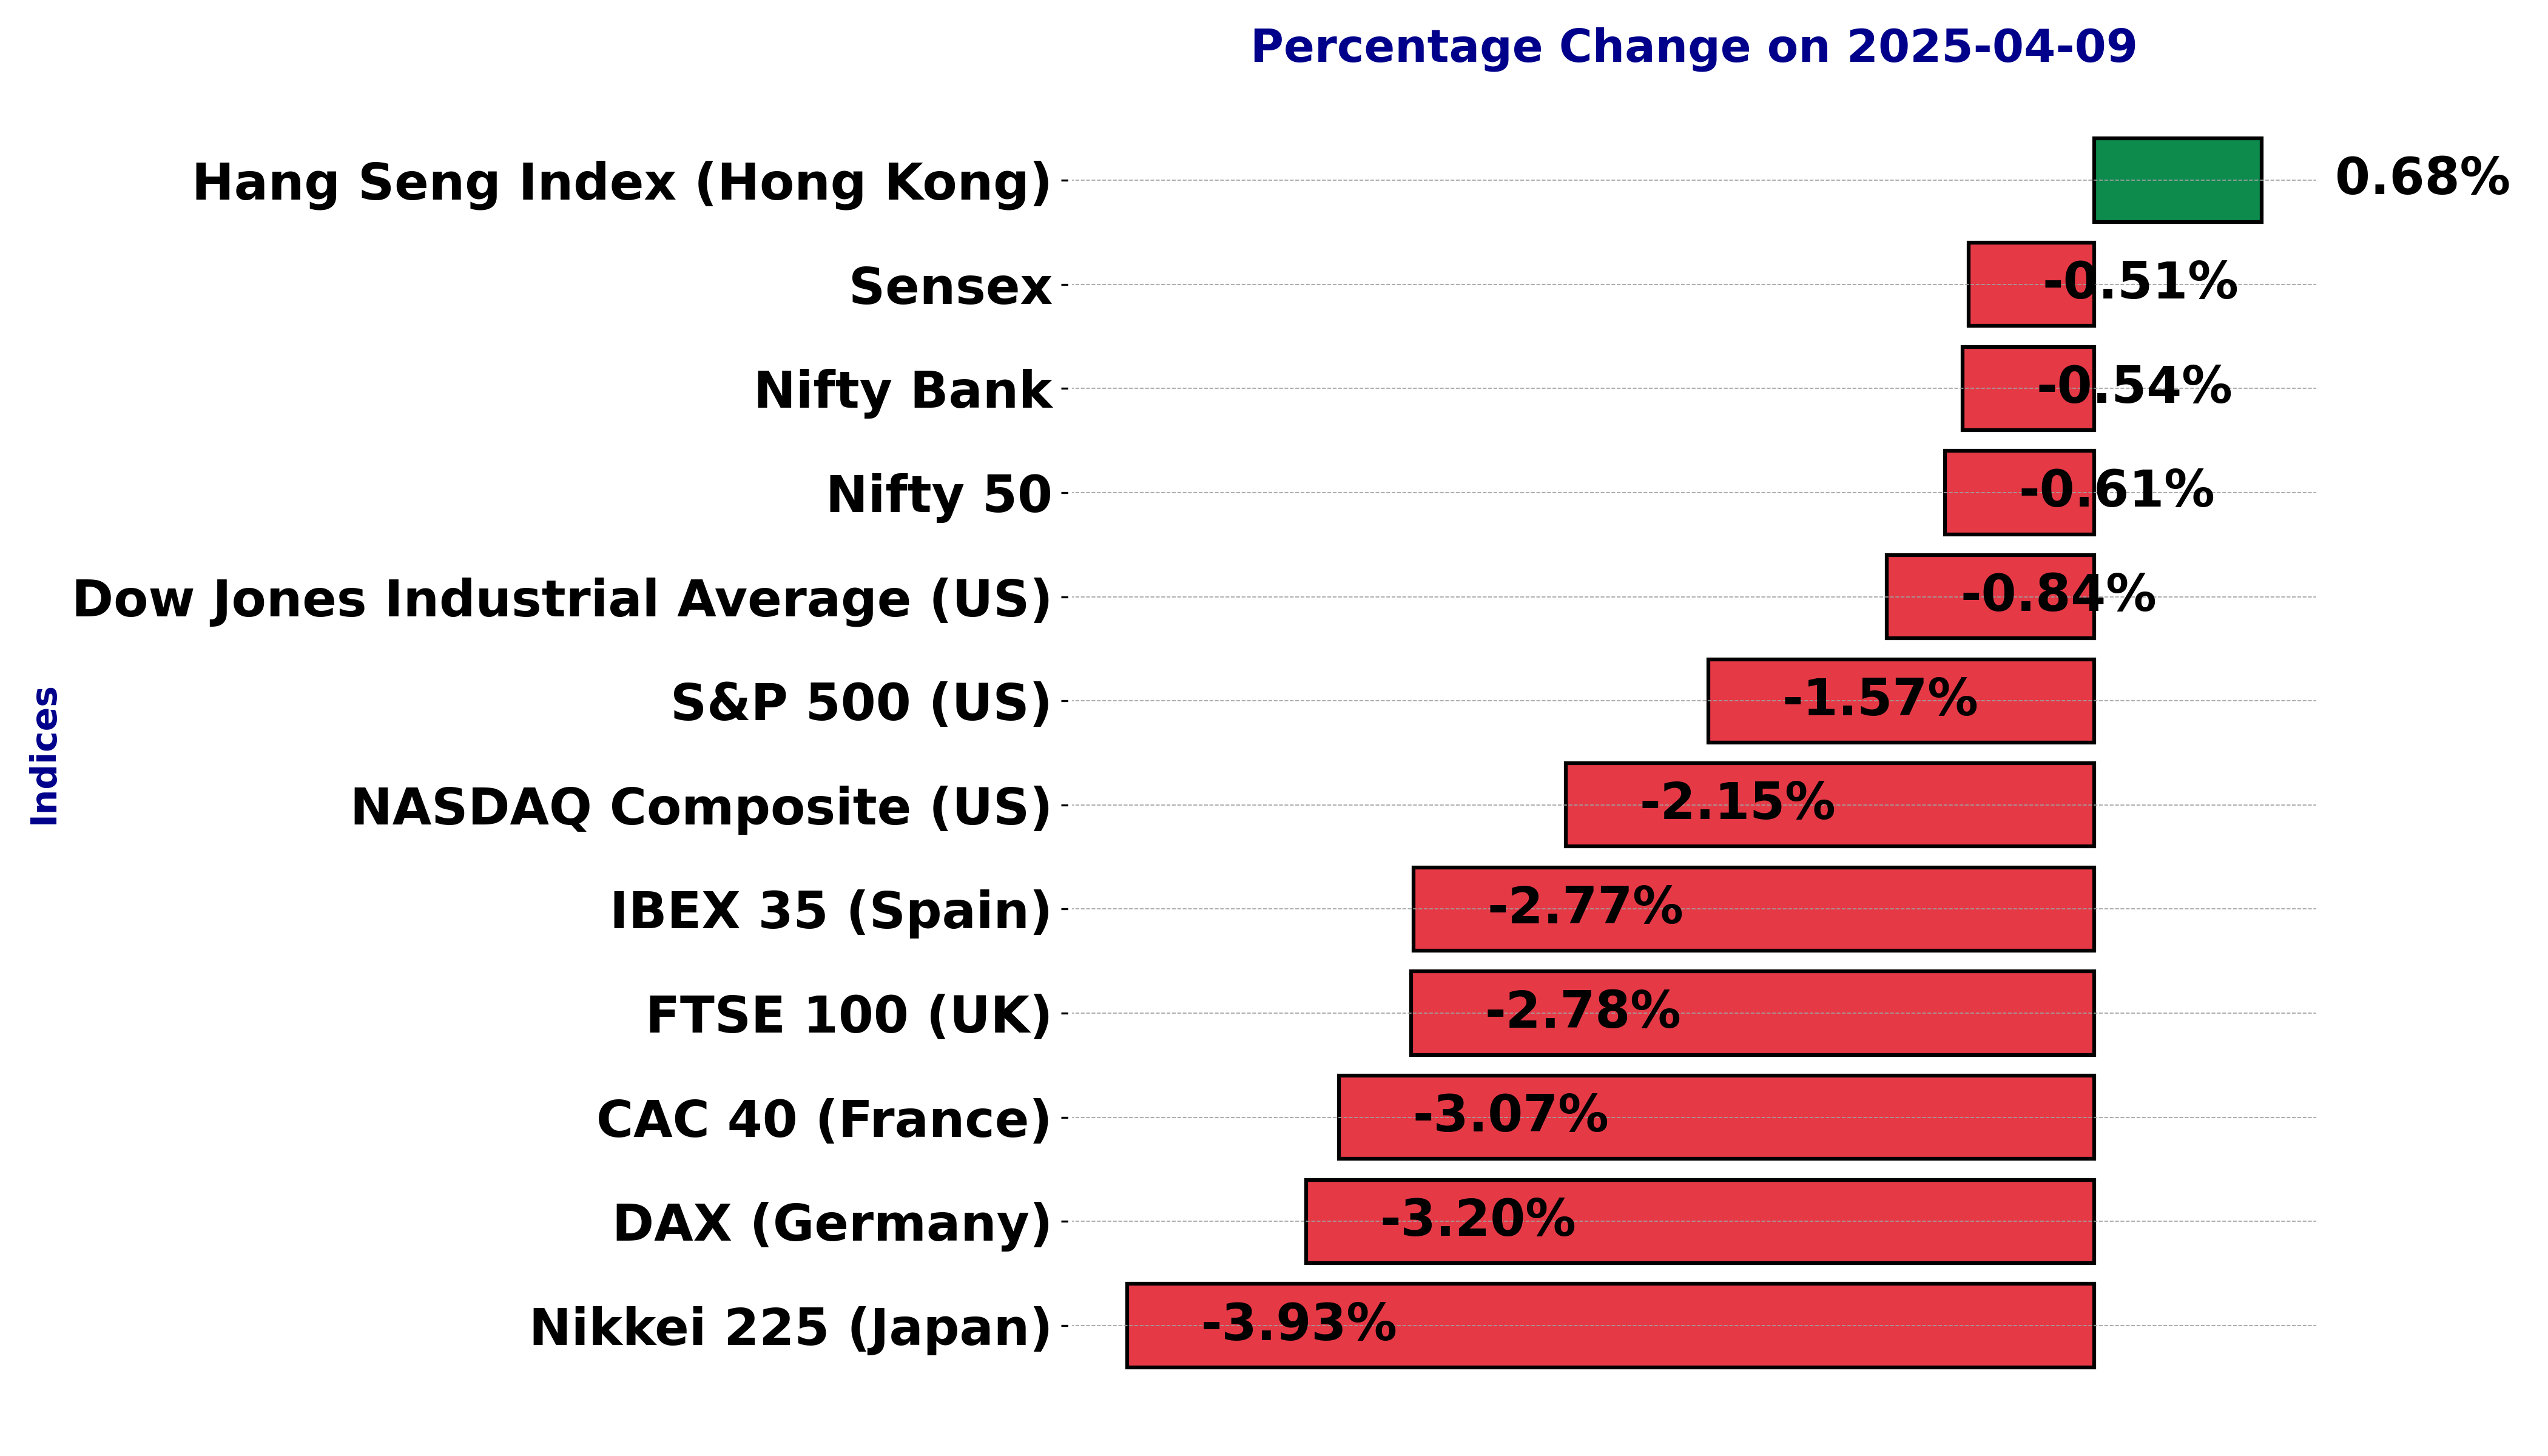
Global stock market indices: How the world markets performed today - 9 April 2025
The international stock market indices showed varied performances on April 09, 2025, reflecting the economic sentiment across different regions.
In this article, we analyze the performance of key global indices including the S&P 500, Dow Jones Industrial Average, NASDAQ Composite, FTSE 100, DAX, CAC 40, IBEX 35, Nikkei 225, Hang Seng, Nifty 50, and BSE Sensex.
Analysis for Sensex - April 09, 2025
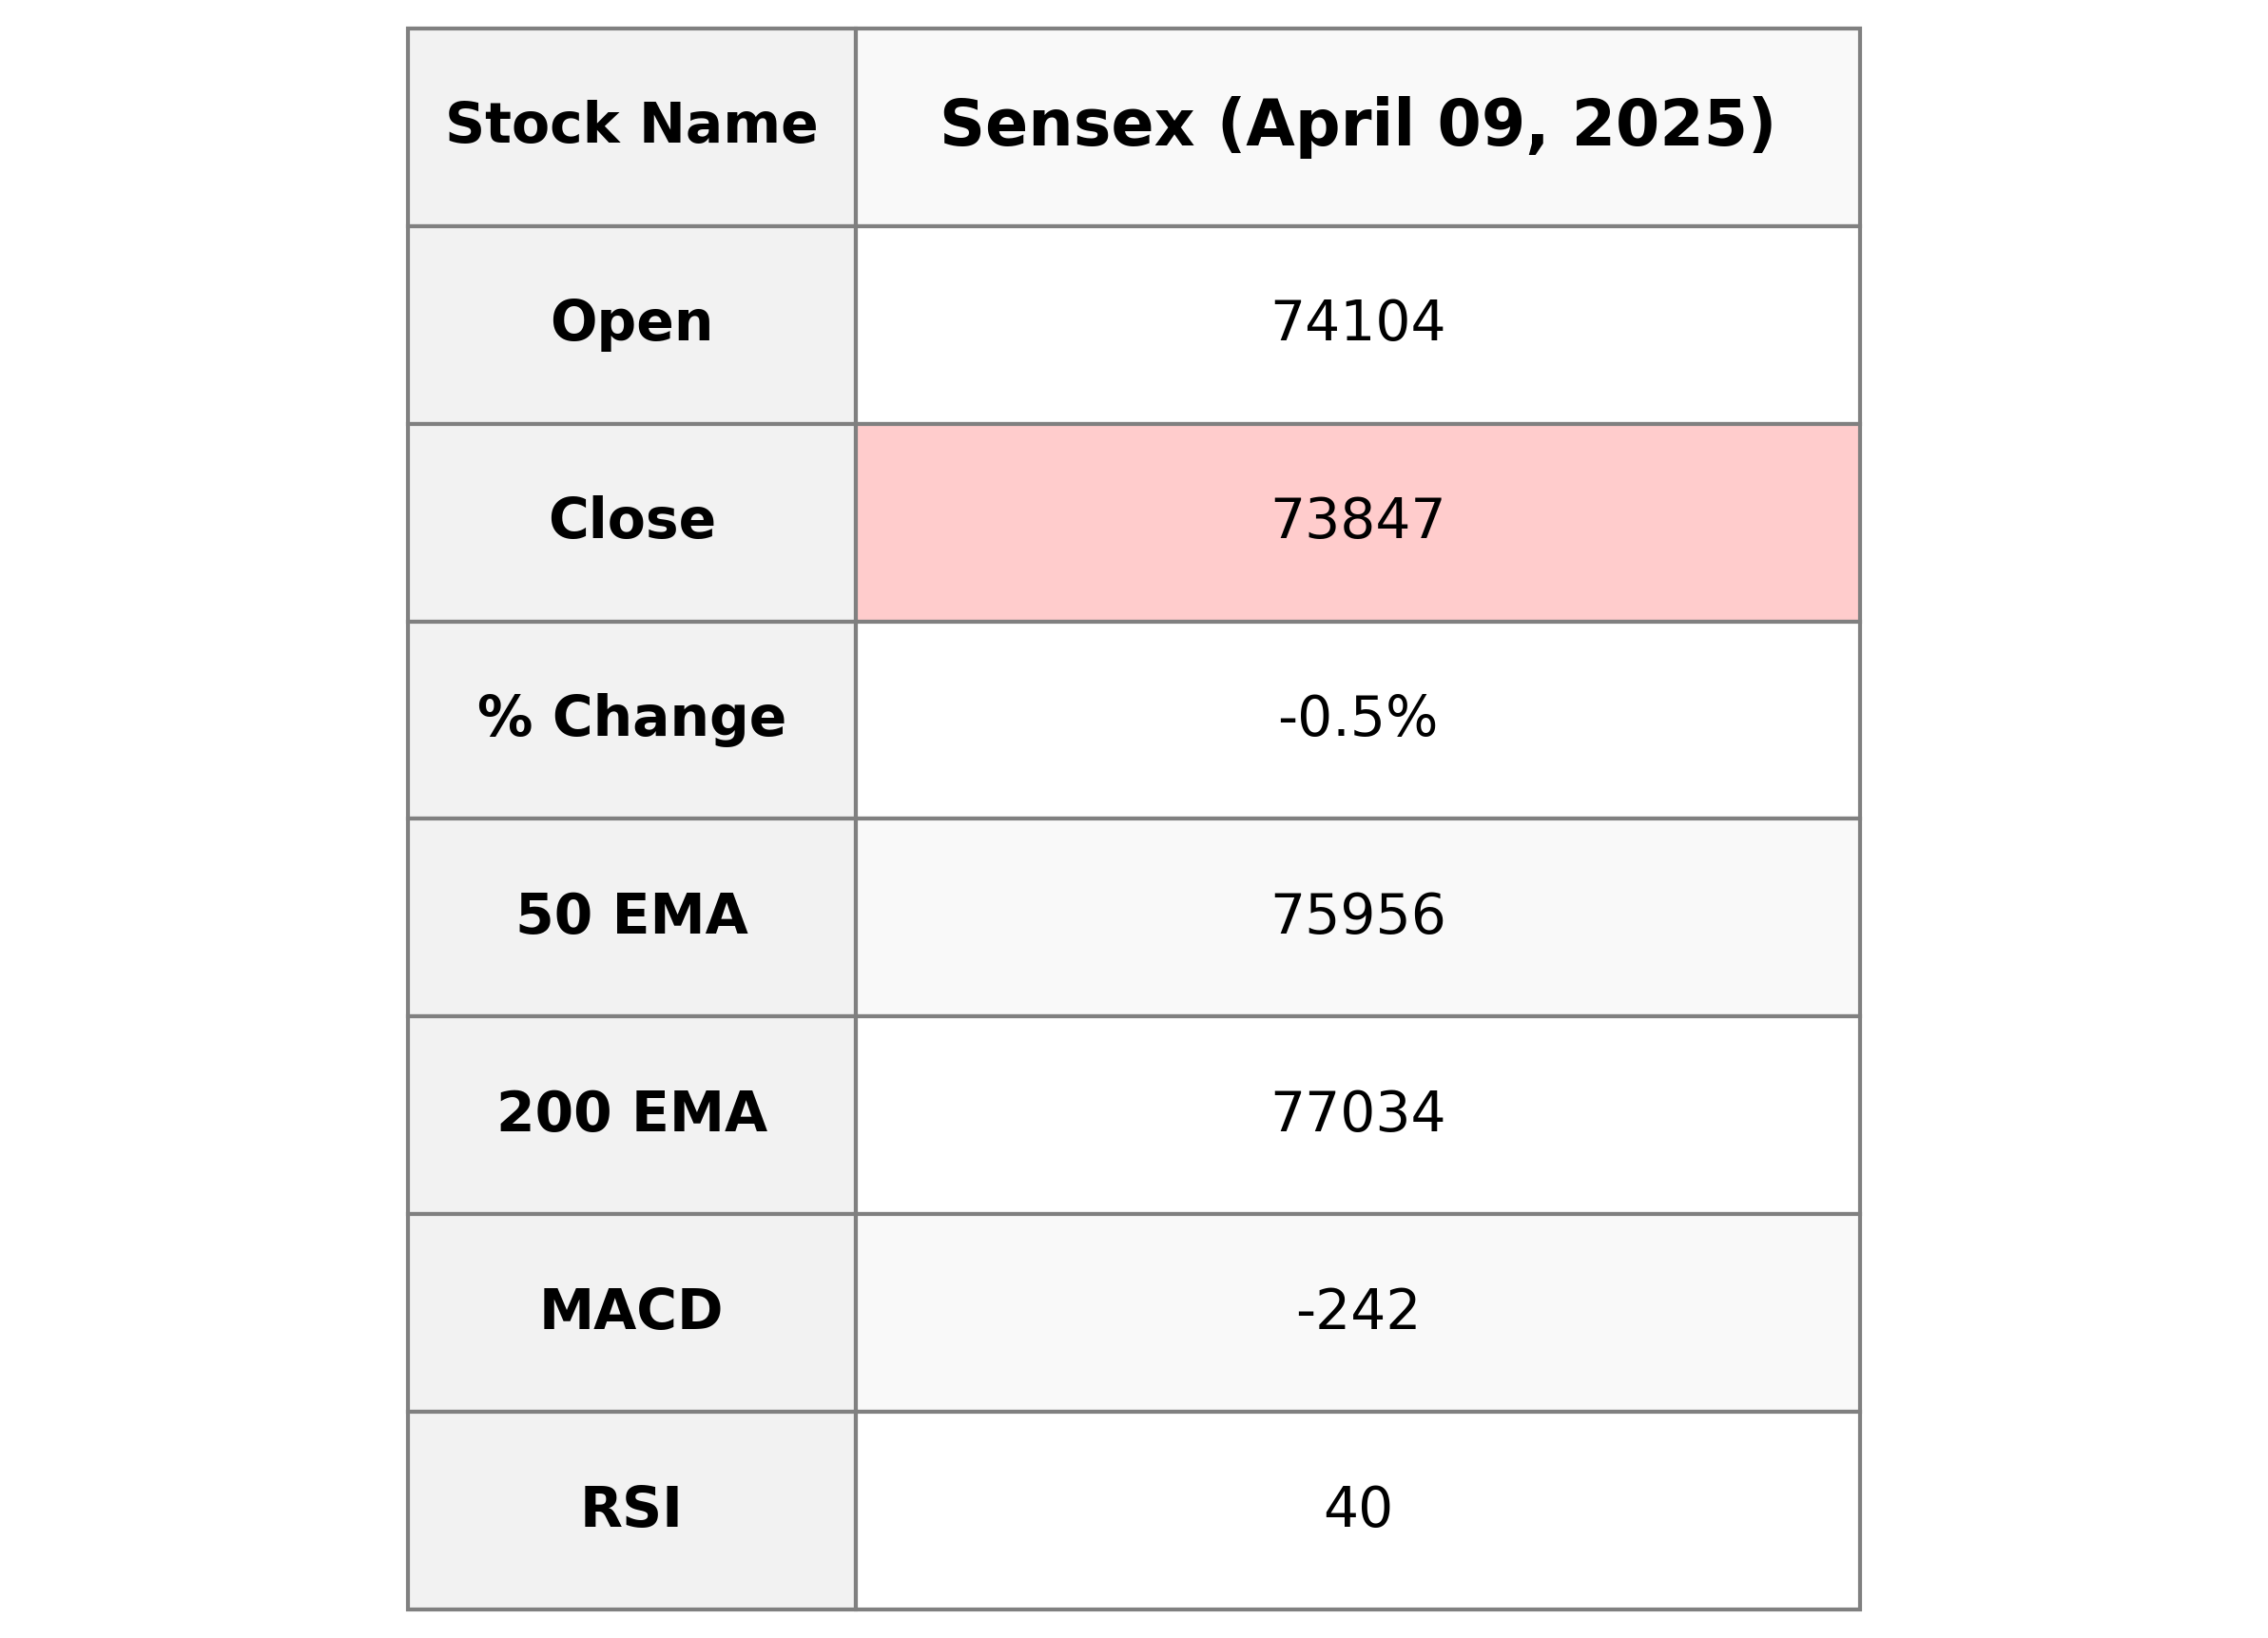
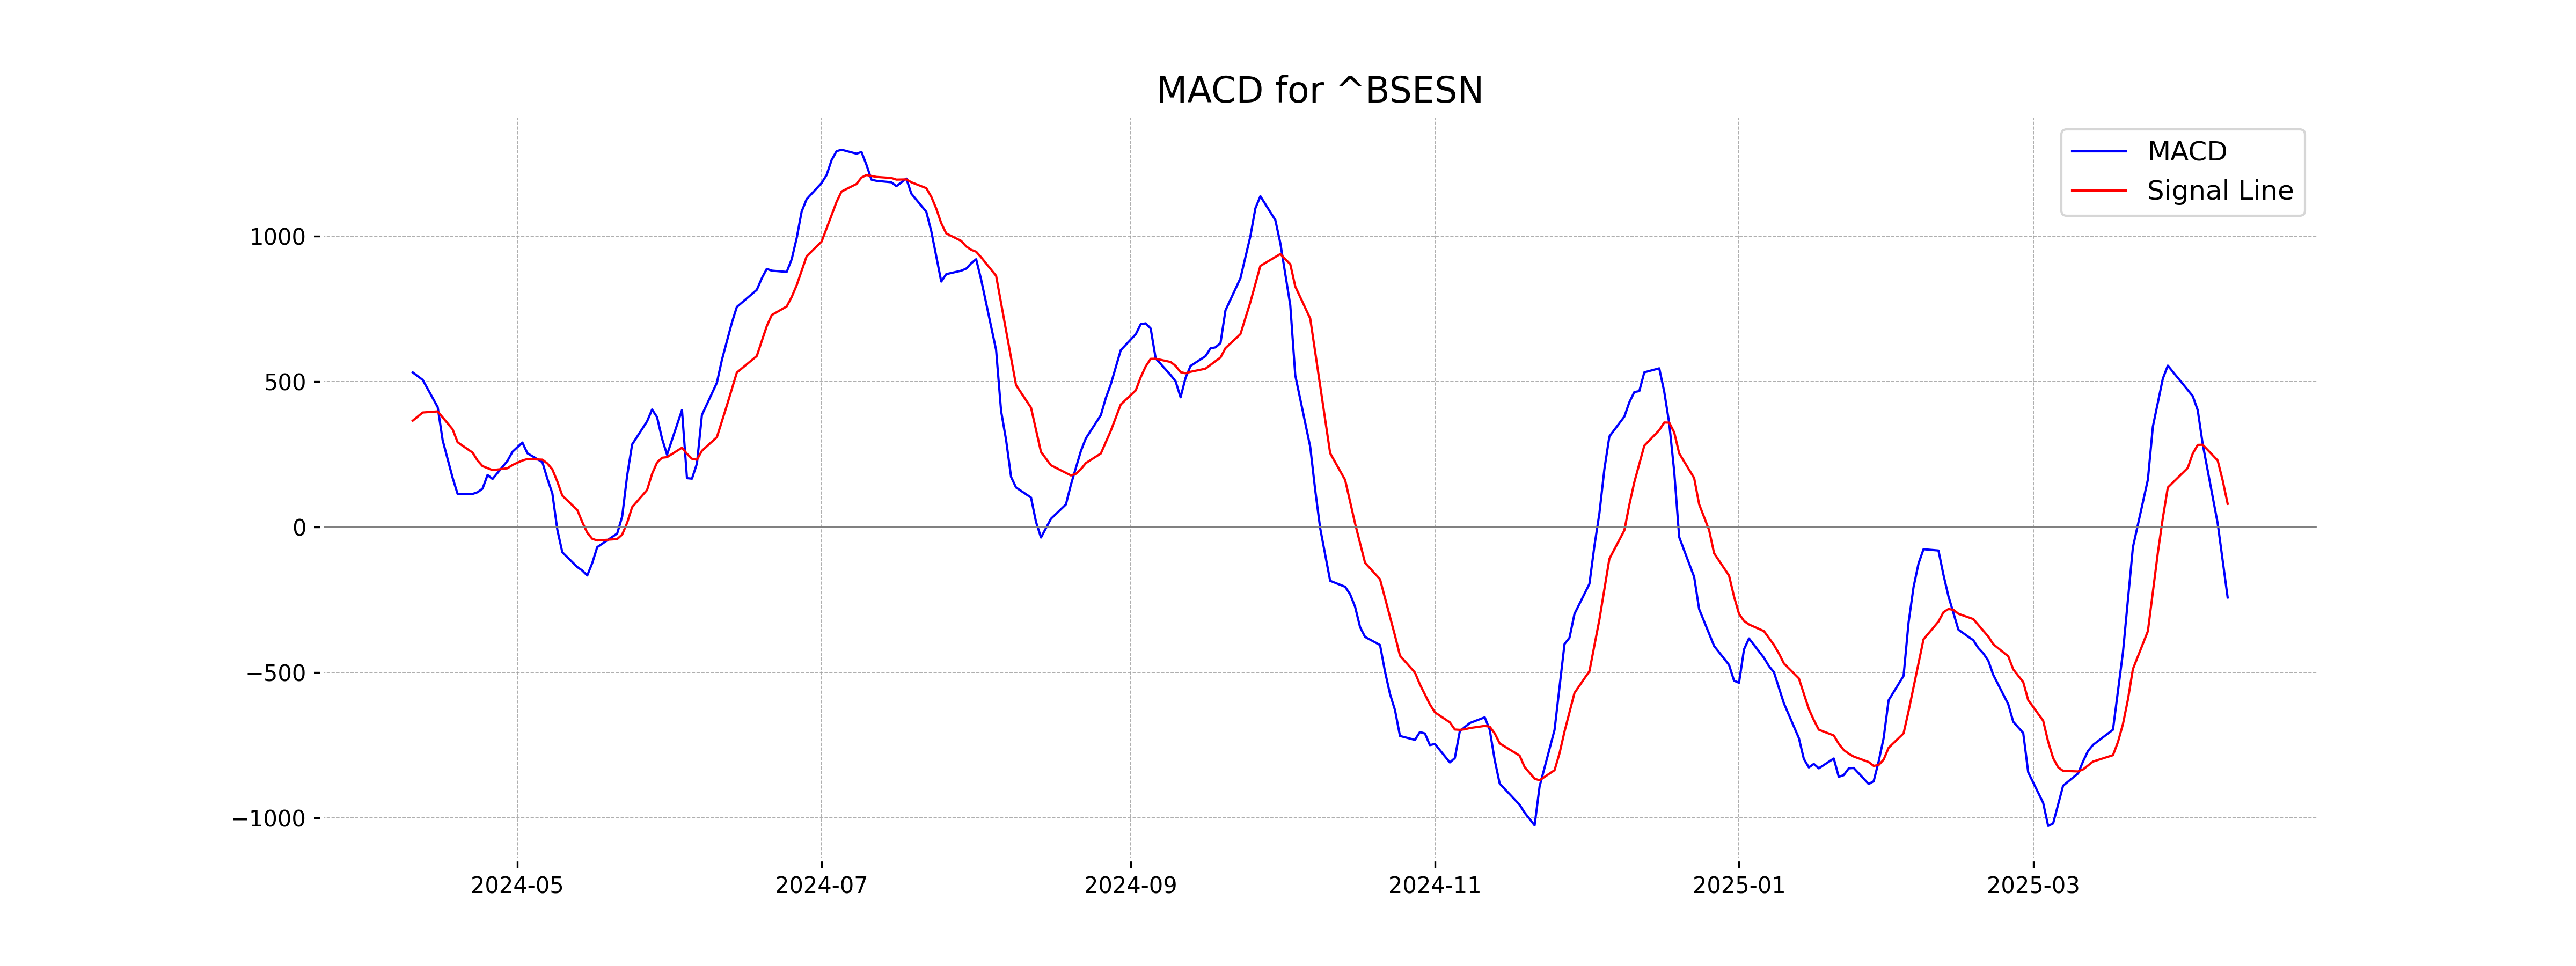
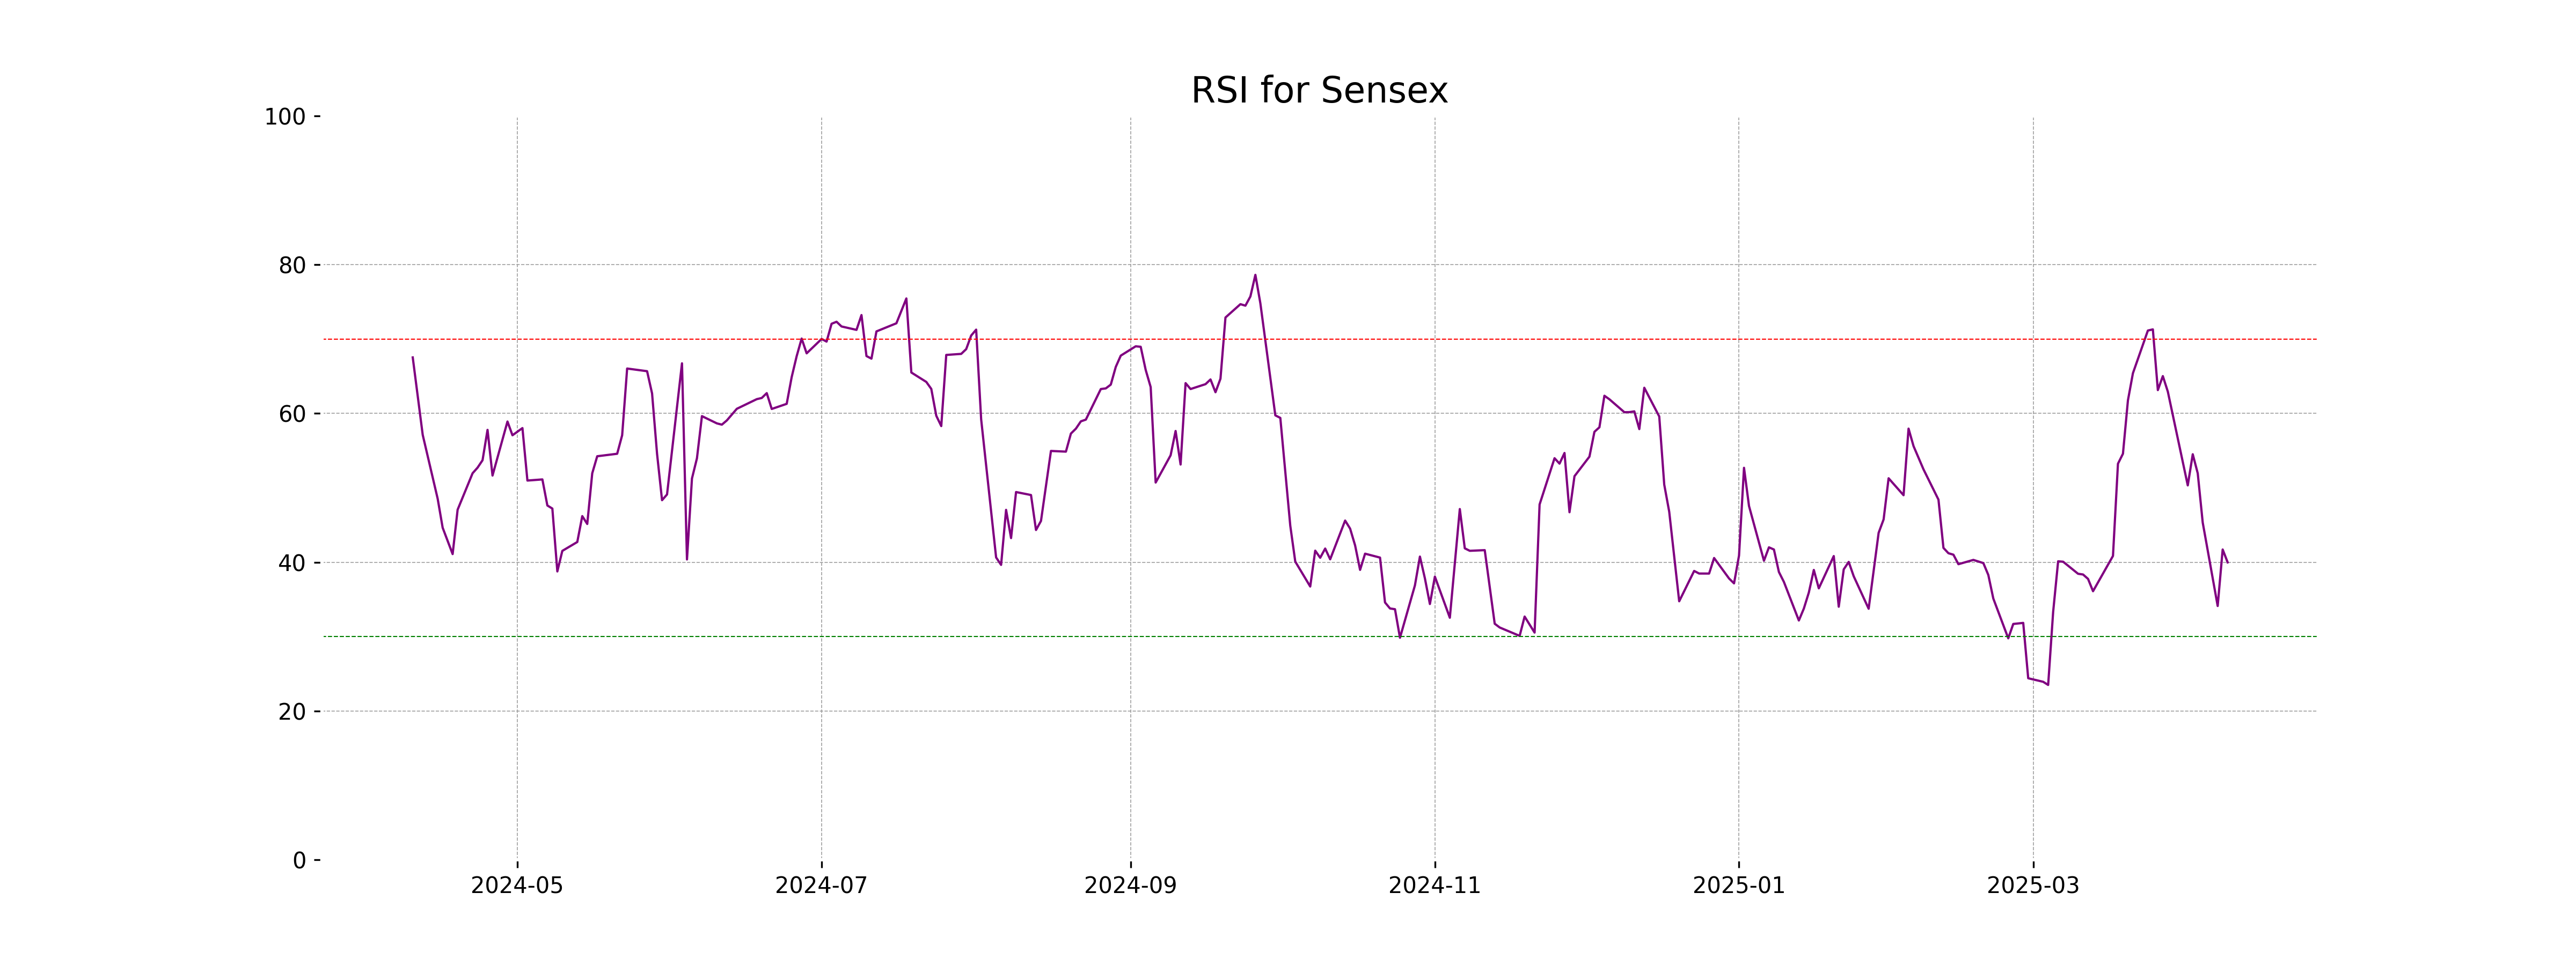
Sensex Performance: The Sensex opened at 74,103.83, faced a high of the same, and closed at 73,847.15, reflecting a decrease of 0.51% from the previous close of 74,227.08. The technical indicators suggest a bearish sentiment with a MACD of -241.97 and an RSI of 39.98, indicating potential overselling.
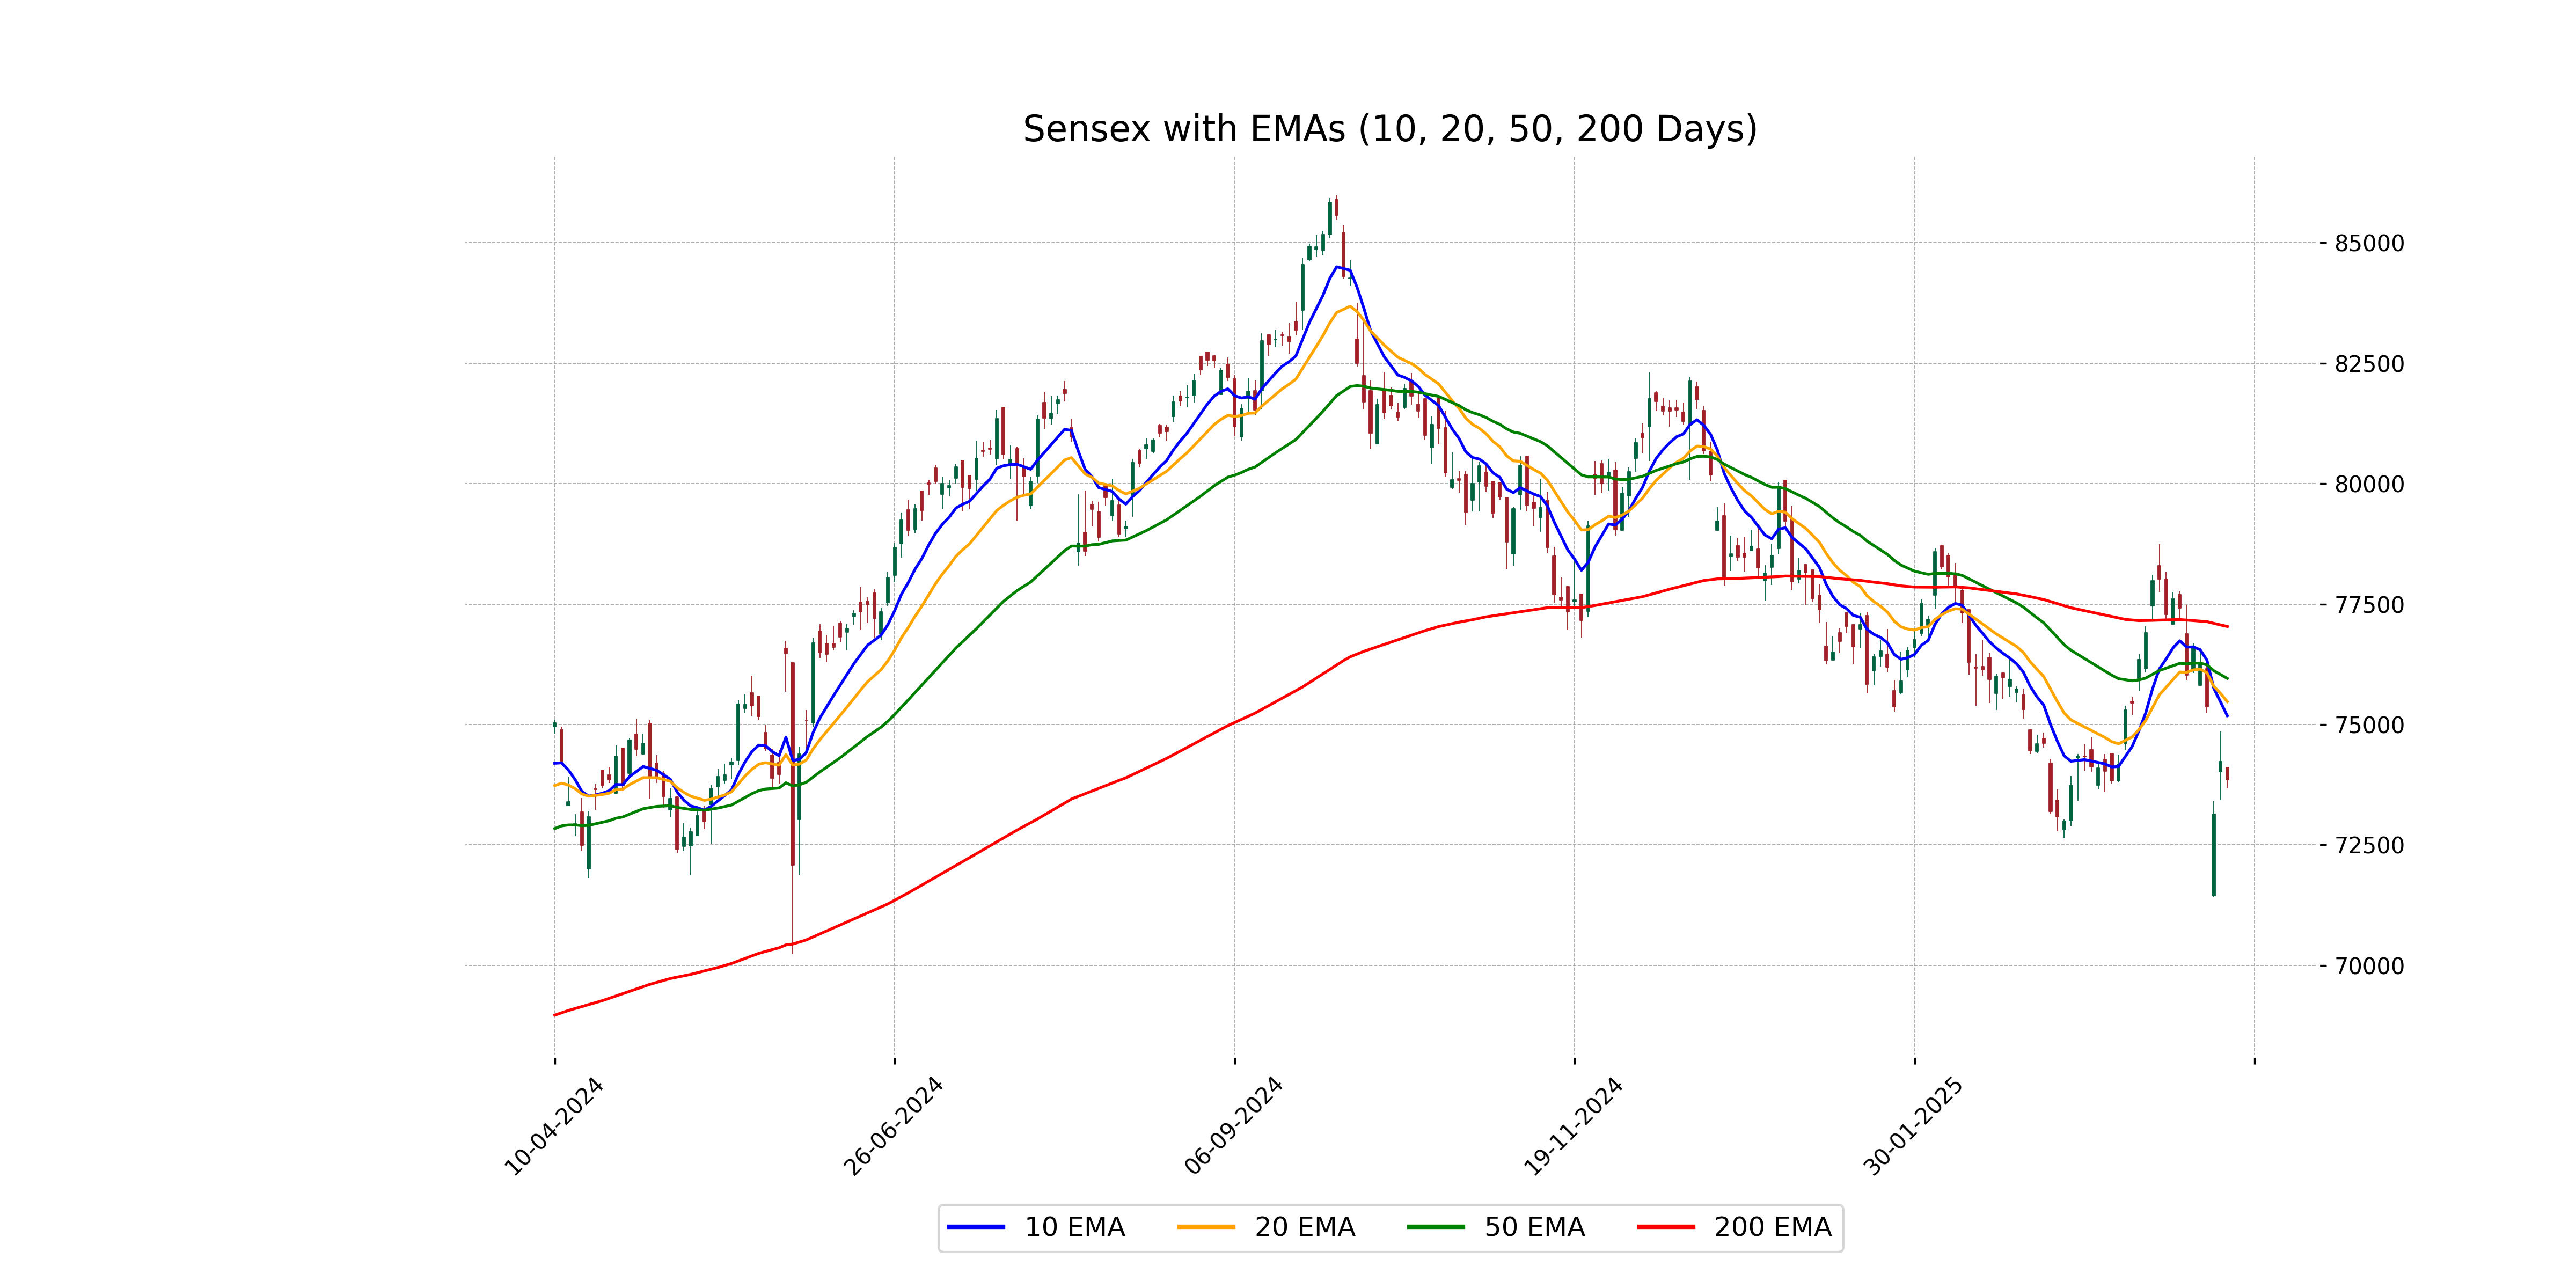
Relationship with Key Moving Averages
Sensex closed below its 50-day and 200-day EMAs, indicating potential bearish sentiment in the short to medium term. It is also below the 10-day and 20-day EMAs, which may suggest a continued downtrend in the near term. The RSI is below 40, reflecting possible oversold conditions.
Moving Averages Trend (MACD)
The MACD for Sensex is -241.97, which is below the MACD Signal of 80.19, indicating bearish momentum. This suggests a potential downtrend, as the MACD line is below the signal line.
RSI Analysis
The RSI for Sensex is 39.98, which suggests that the market may be approaching oversold territory. In general, an RSI below 30 is considered oversold, which can indicate potential buying opportunities, whereas current levels near 40 show moderate downward pressure.
Analysis for Dow Jones Industrial Average (US) - April 09, 2025
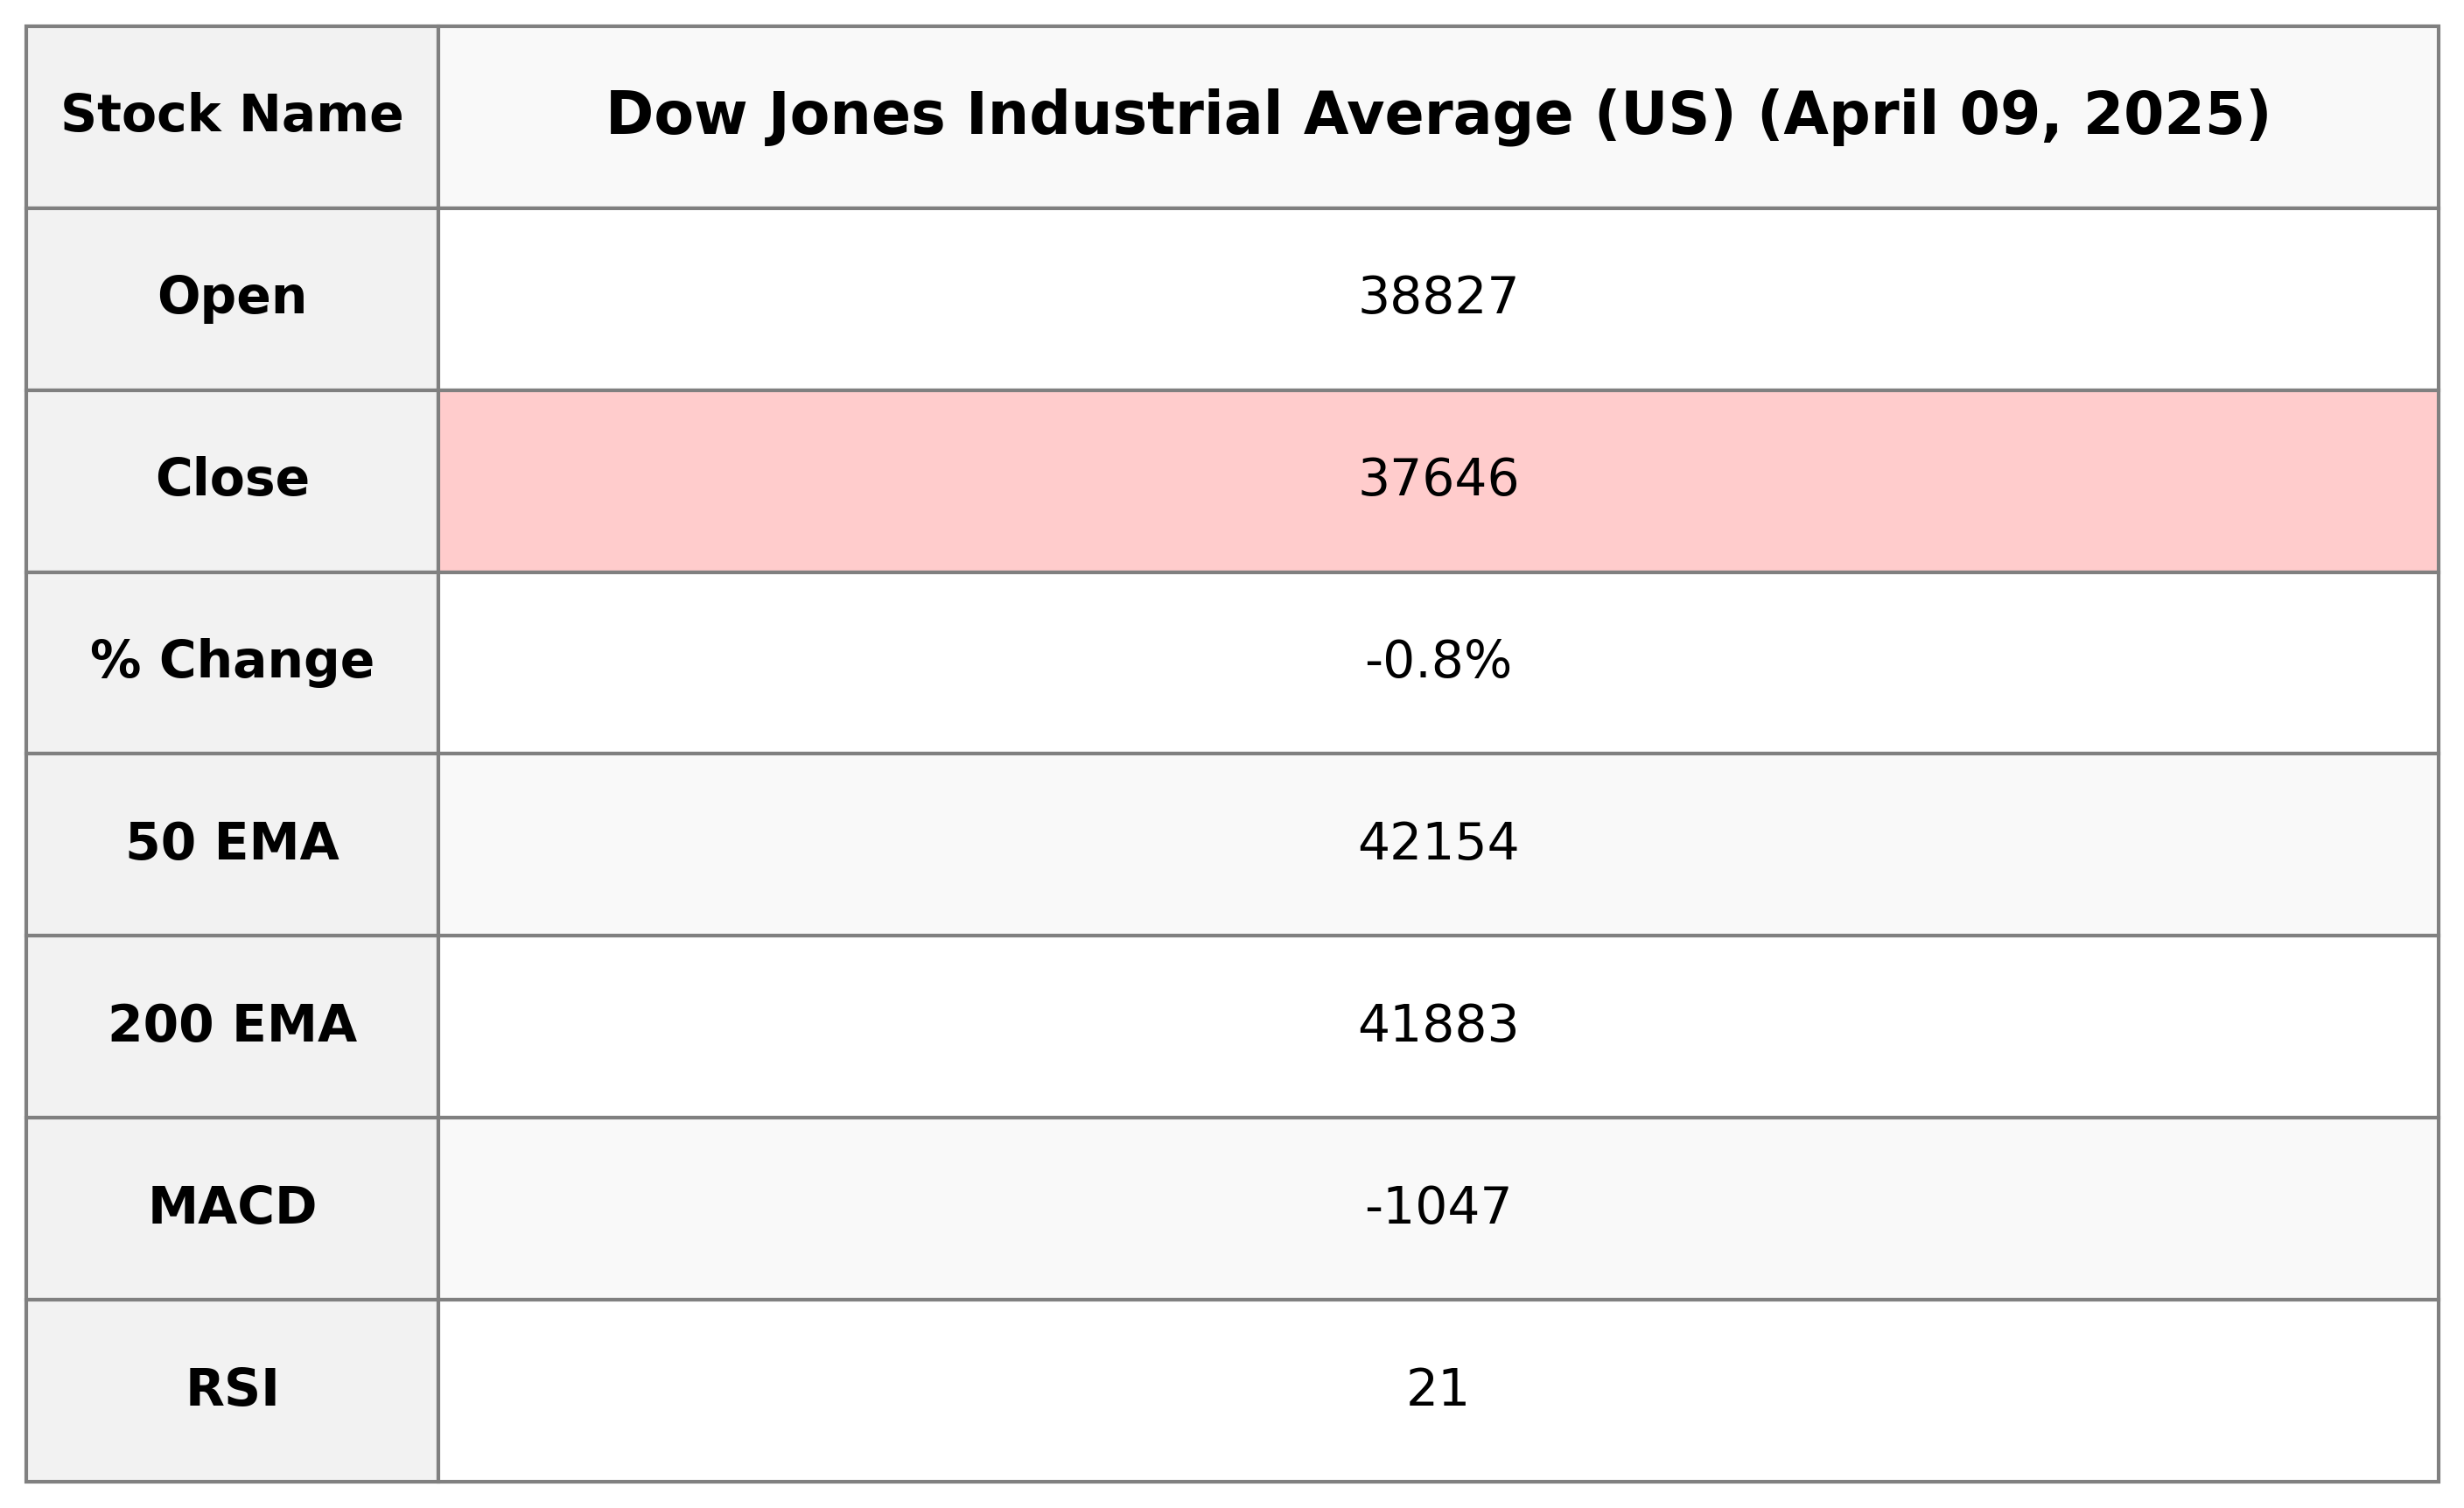
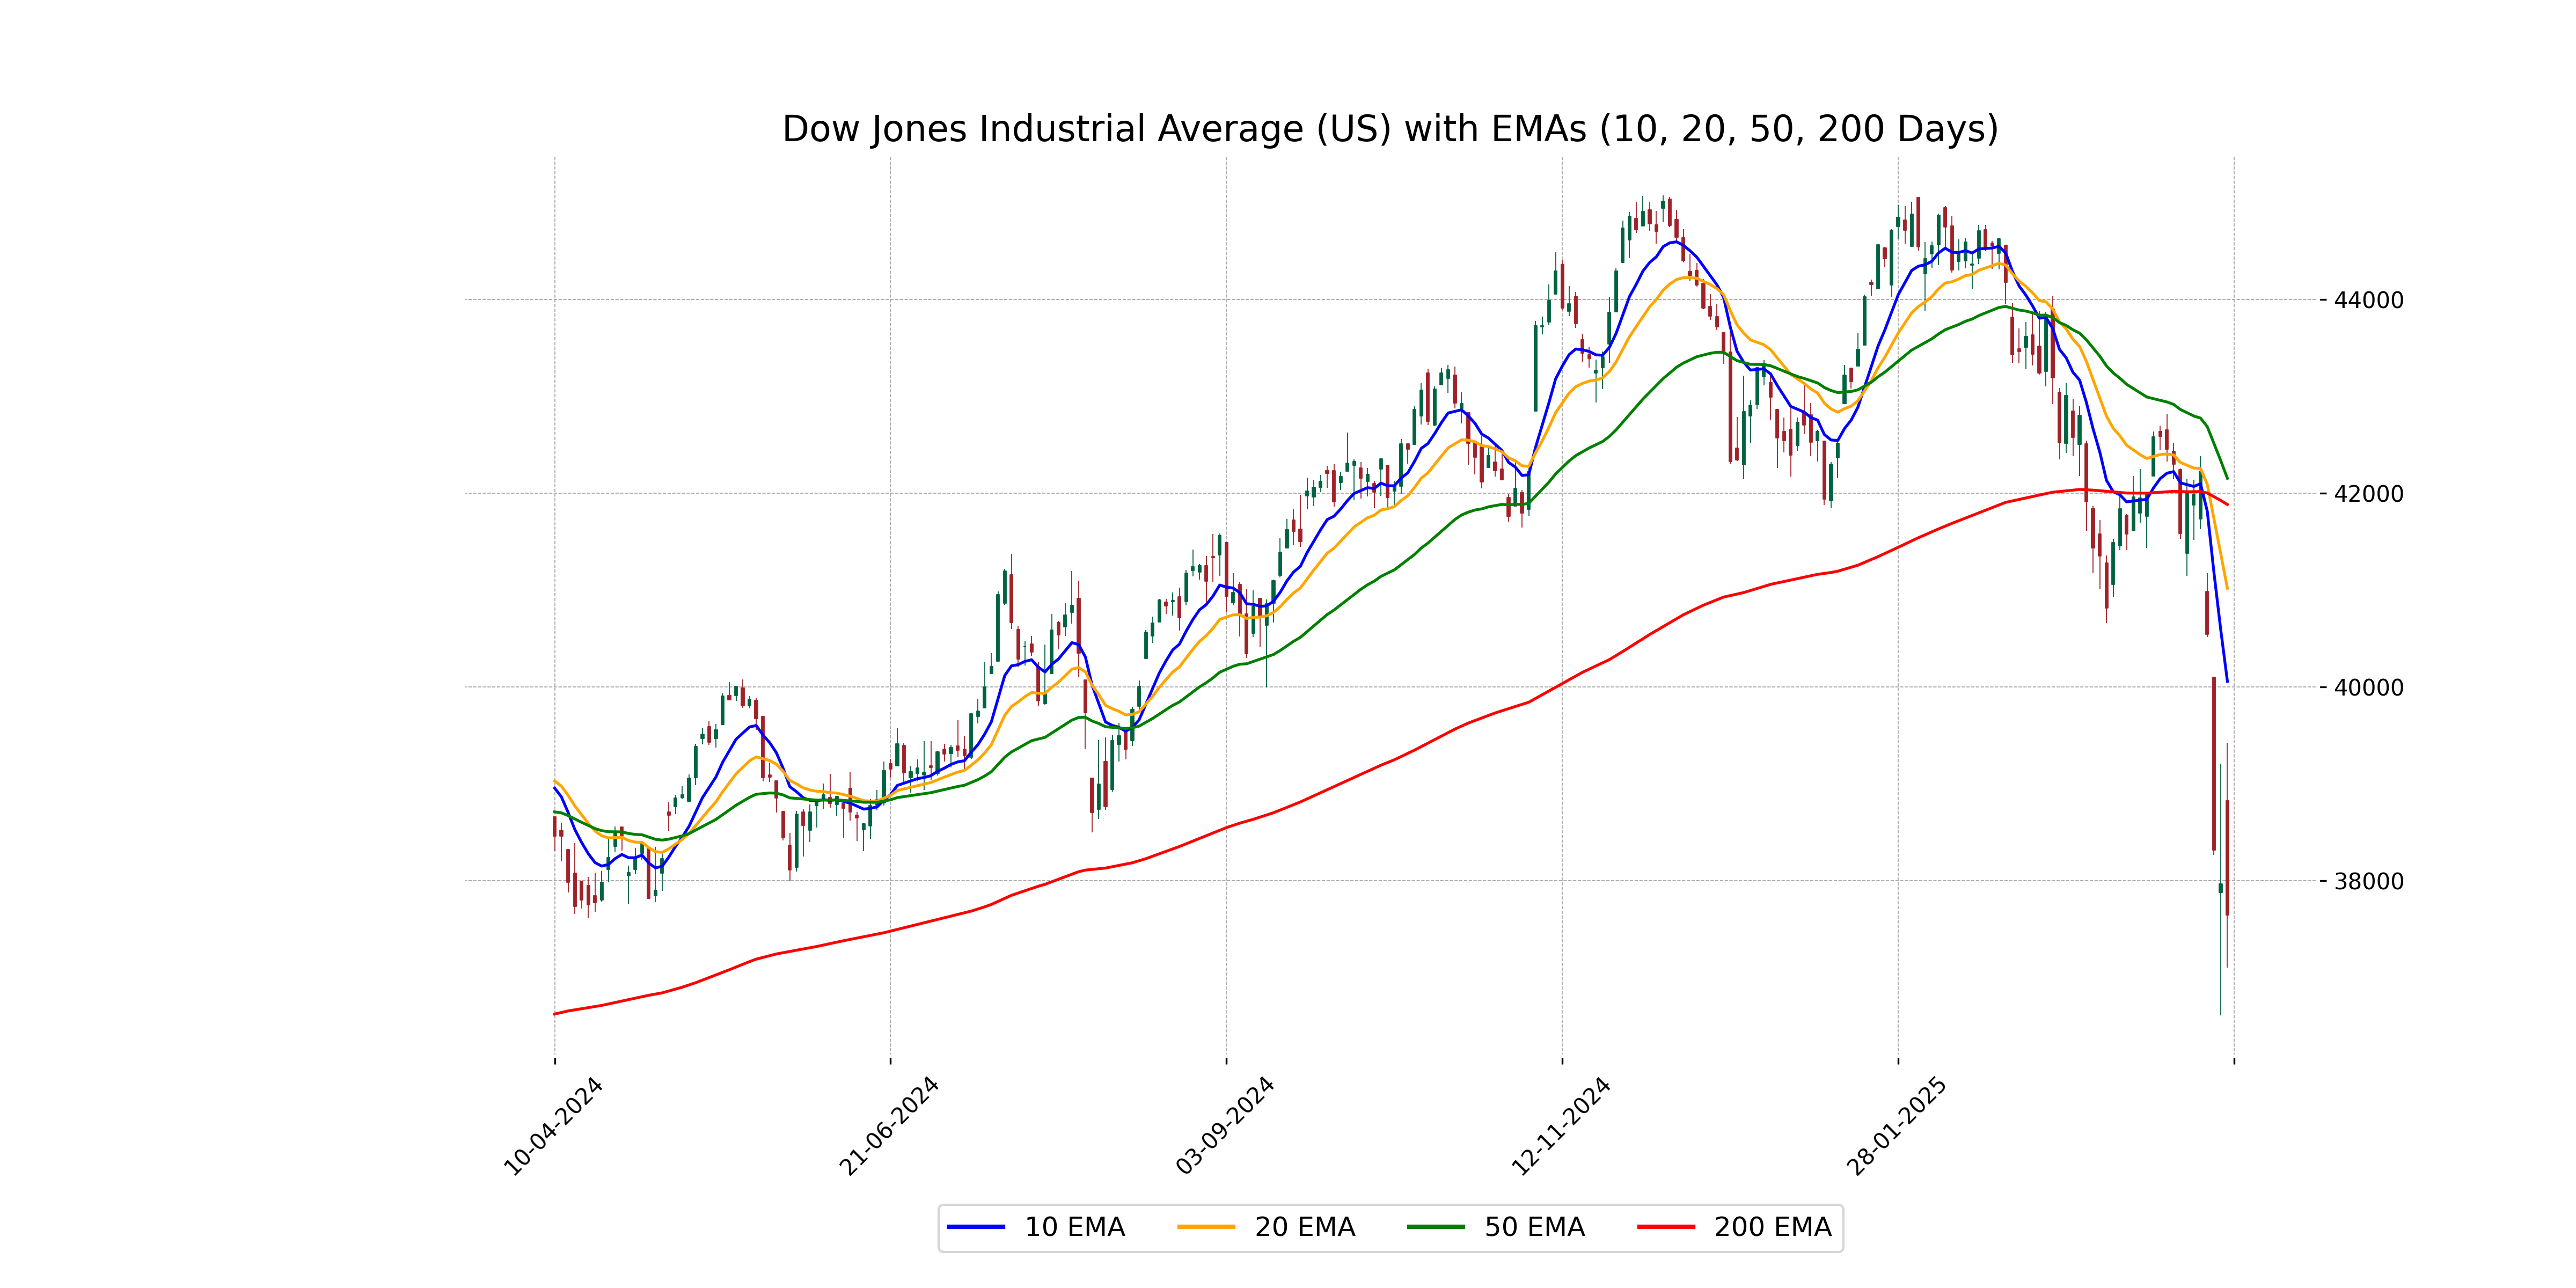
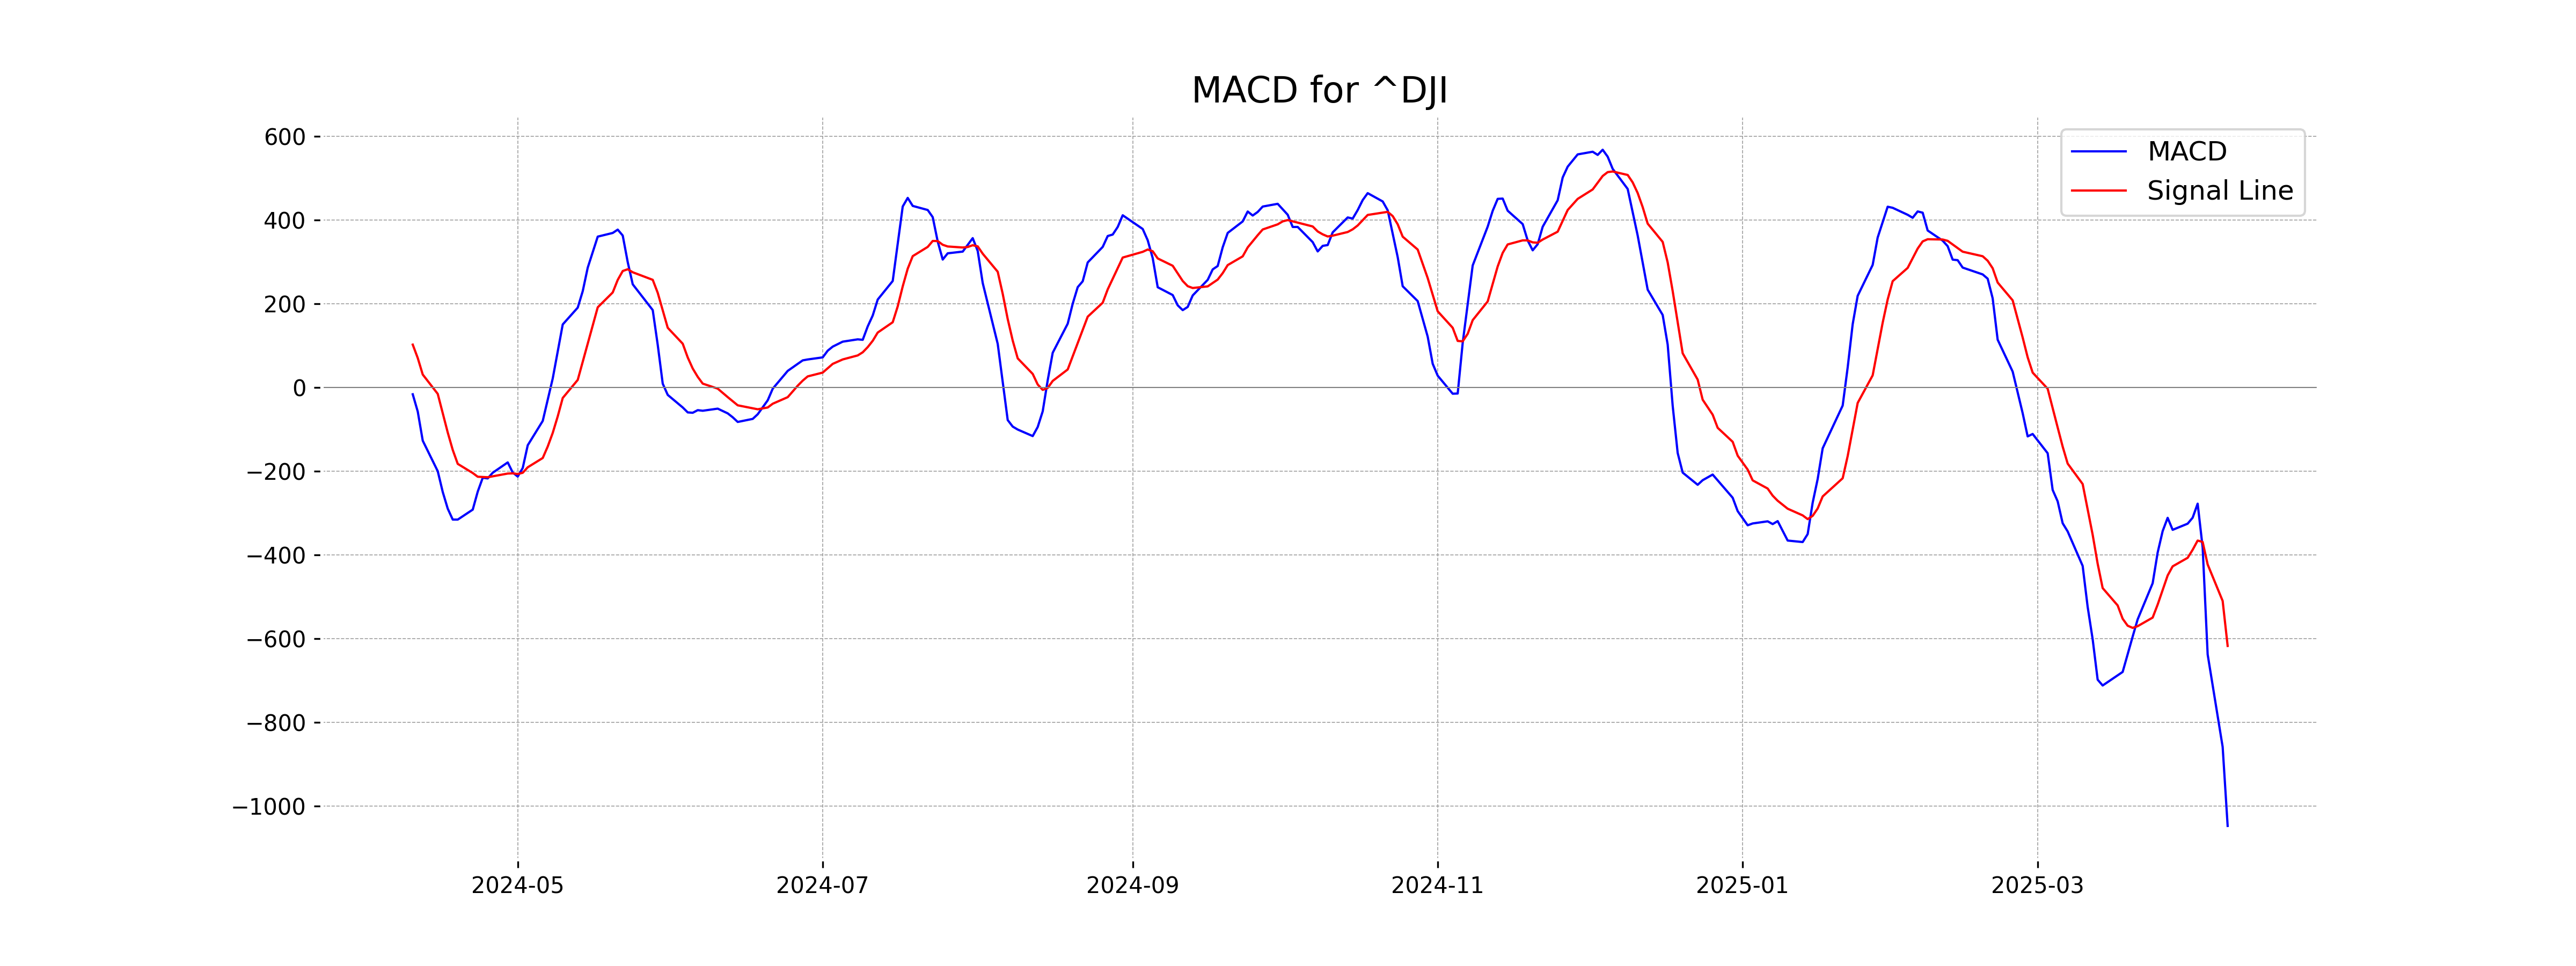
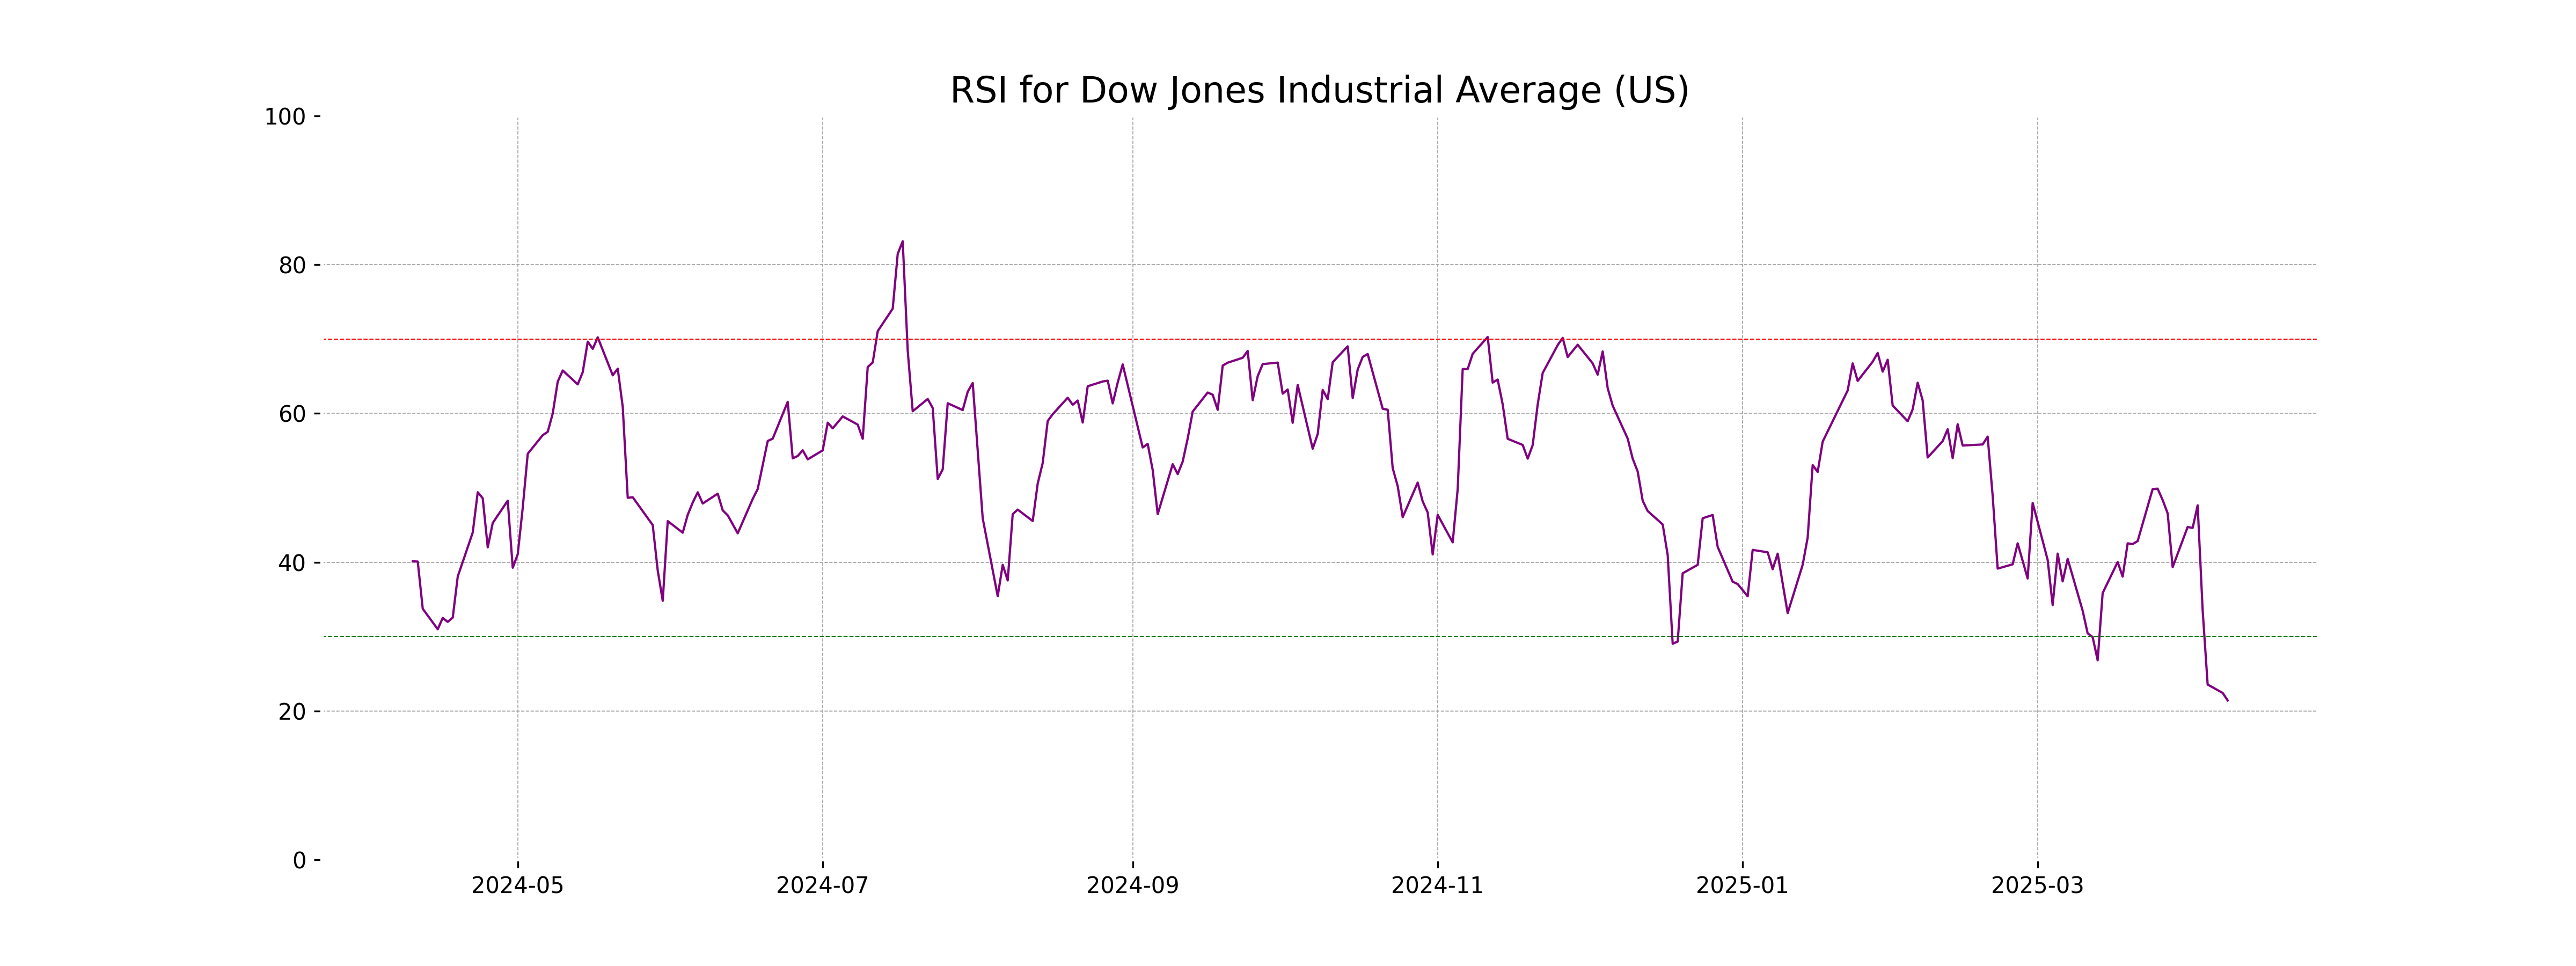
The Dow Jones Industrial Average (US) opened at 38,827.10 and closed at 37,645.59, a decrease of 0.84%, equivalent to a drop of 320.01 points. The index showed bearish signals with an RSI of 21.42, indicating it is in an oversold condition. MACD indicators suggest a downward momentum.
Relationship with Key Moving Averages
The Dow Jones Industrial Average is currently trading below its 10, 20, 50, and 200-period Exponential Moving Averages, indicating a downtrend. The price is significantly lower than these key moving averages, and the low RSI value suggests oversold conditions.
Moving Averages Trend (MACD)
MACD Analysis for Dow Jones Industrial Average (US): The MACD value is -1046.82, which is below the MACD Signal line of -616.93, indicating a bearish trend. The negative MACD suggests that the momentum is currently bearish, and the index might continue to face downward pressure.
RSI Analysis
The RSI (Relative Strength Index) of the Dow Jones Industrial Average is 21.42, indicating that the market is currently in the oversold territory. An RSI below 30 suggests that the index might be undervalued and could experience a potential price bounce or reversal soon.
Analysis for CAC 40 (France) - April 09, 2025
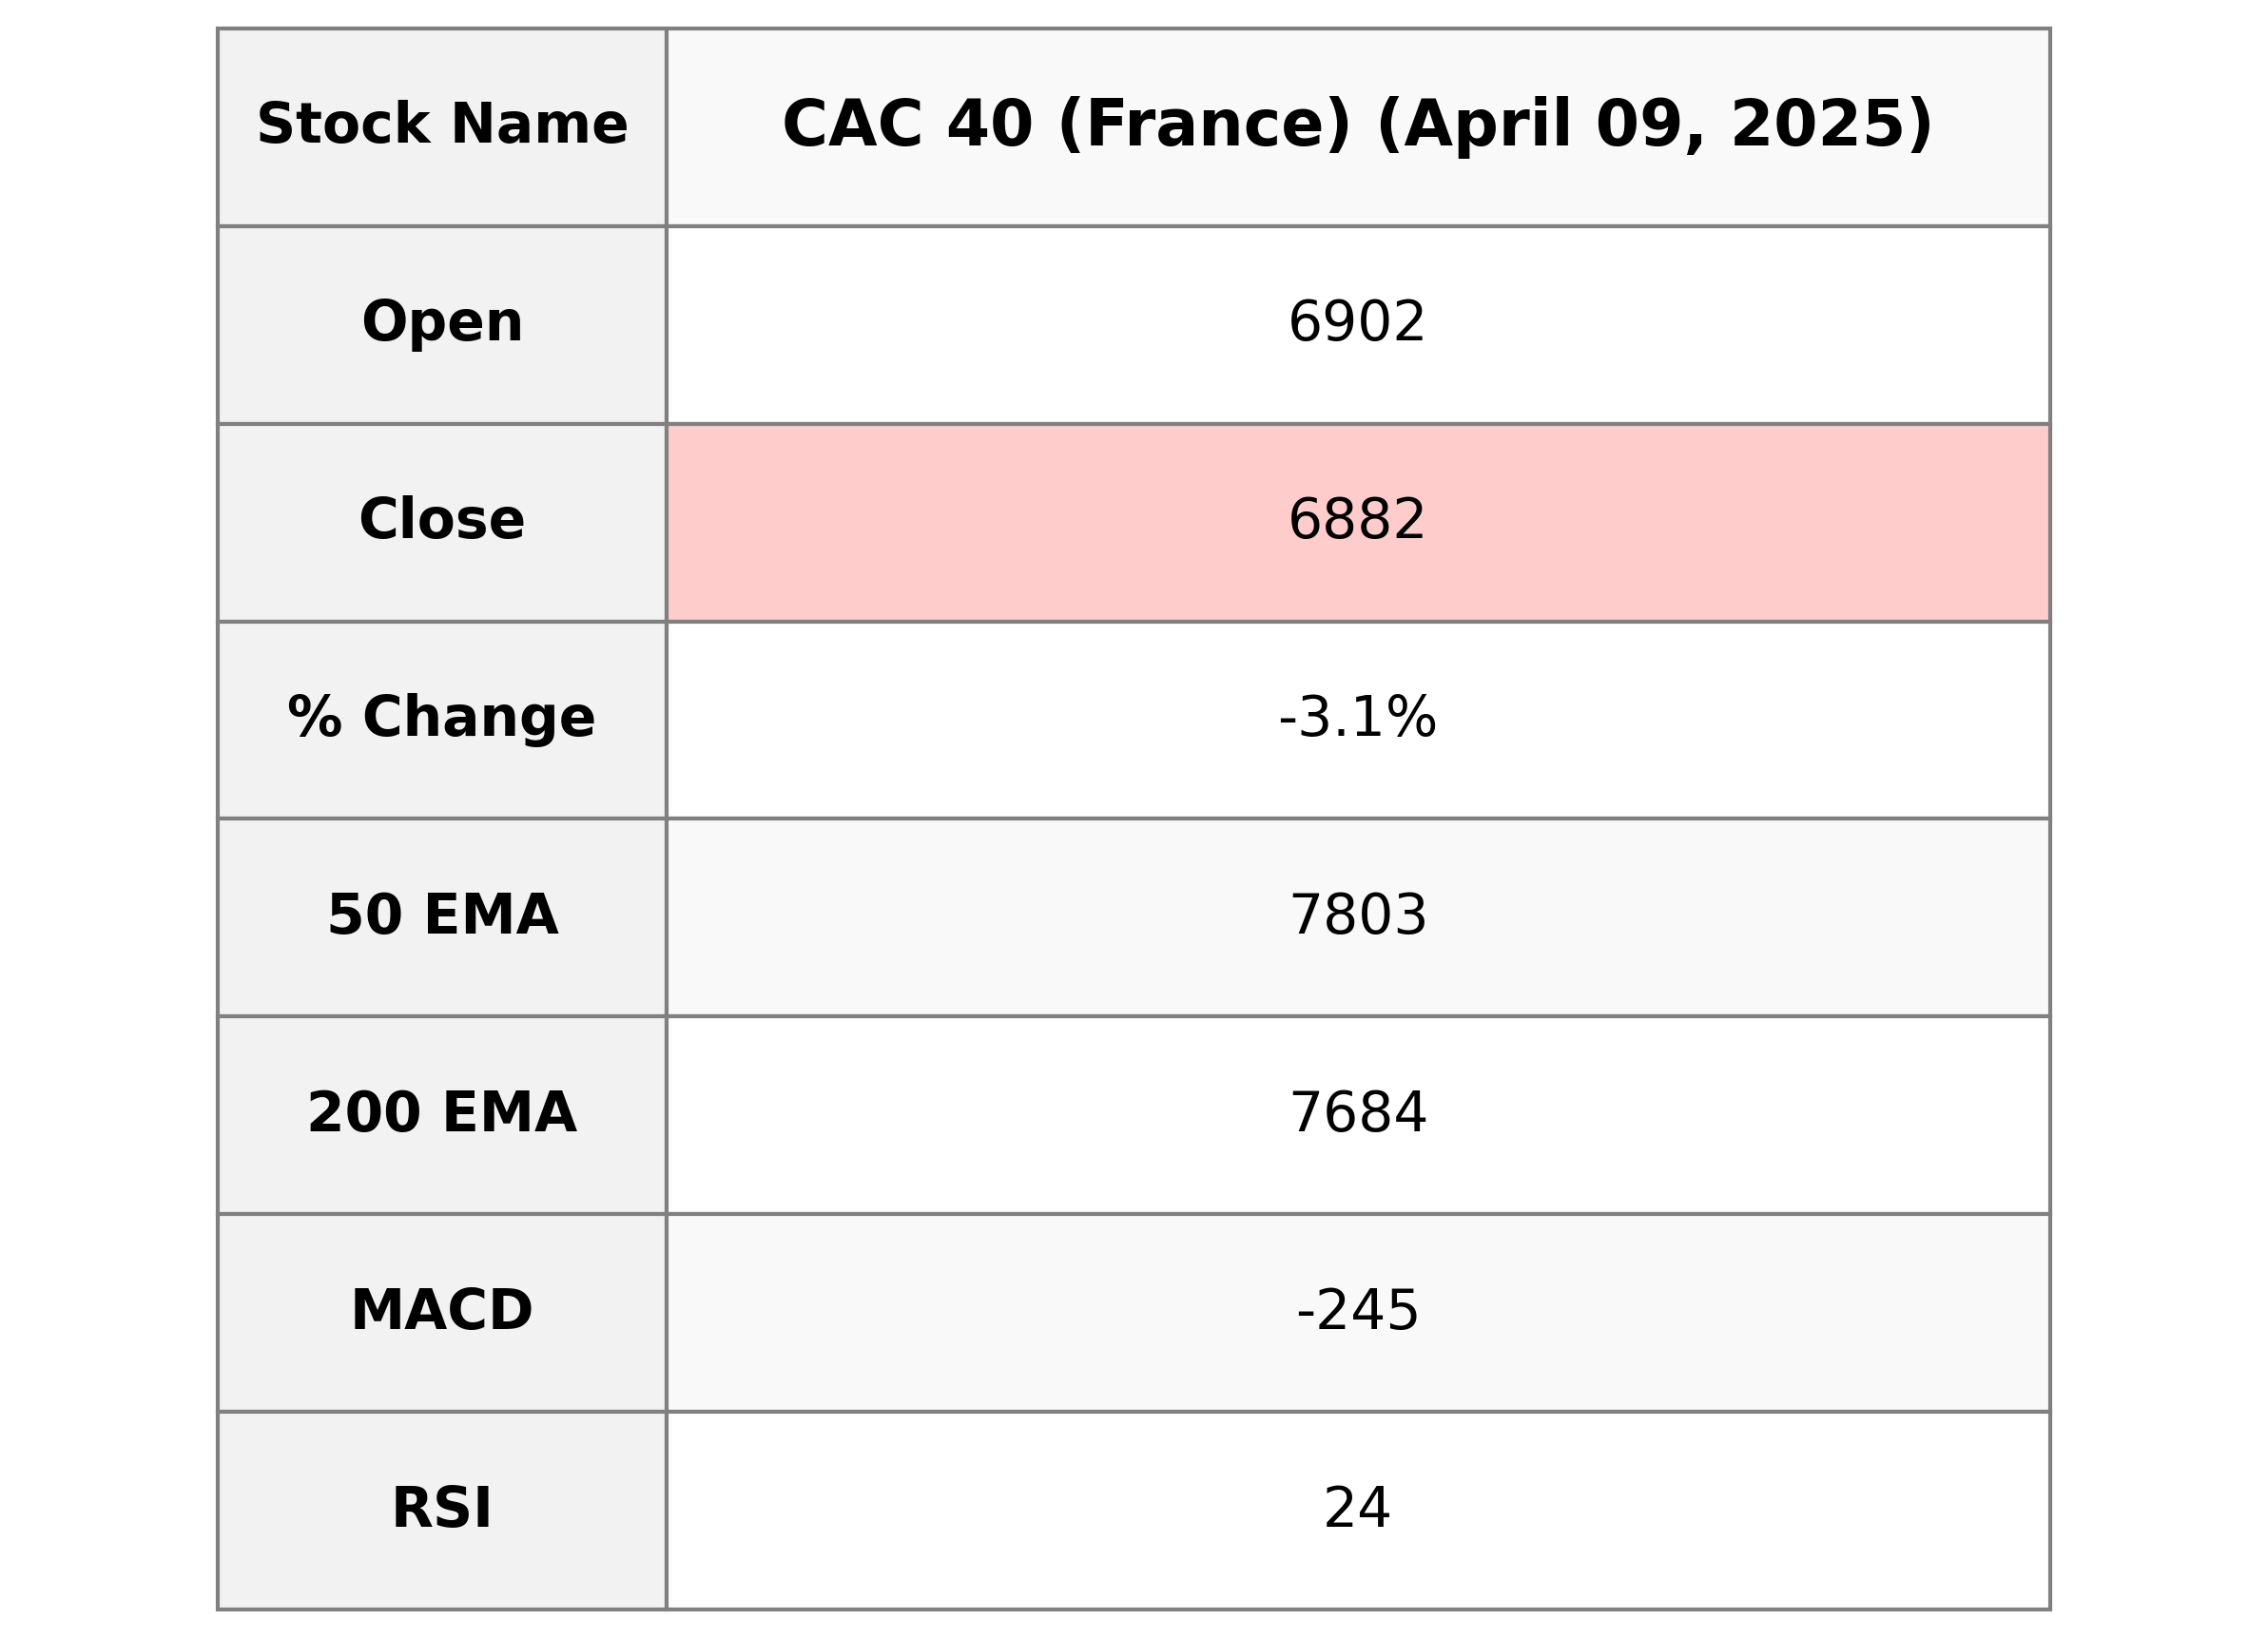
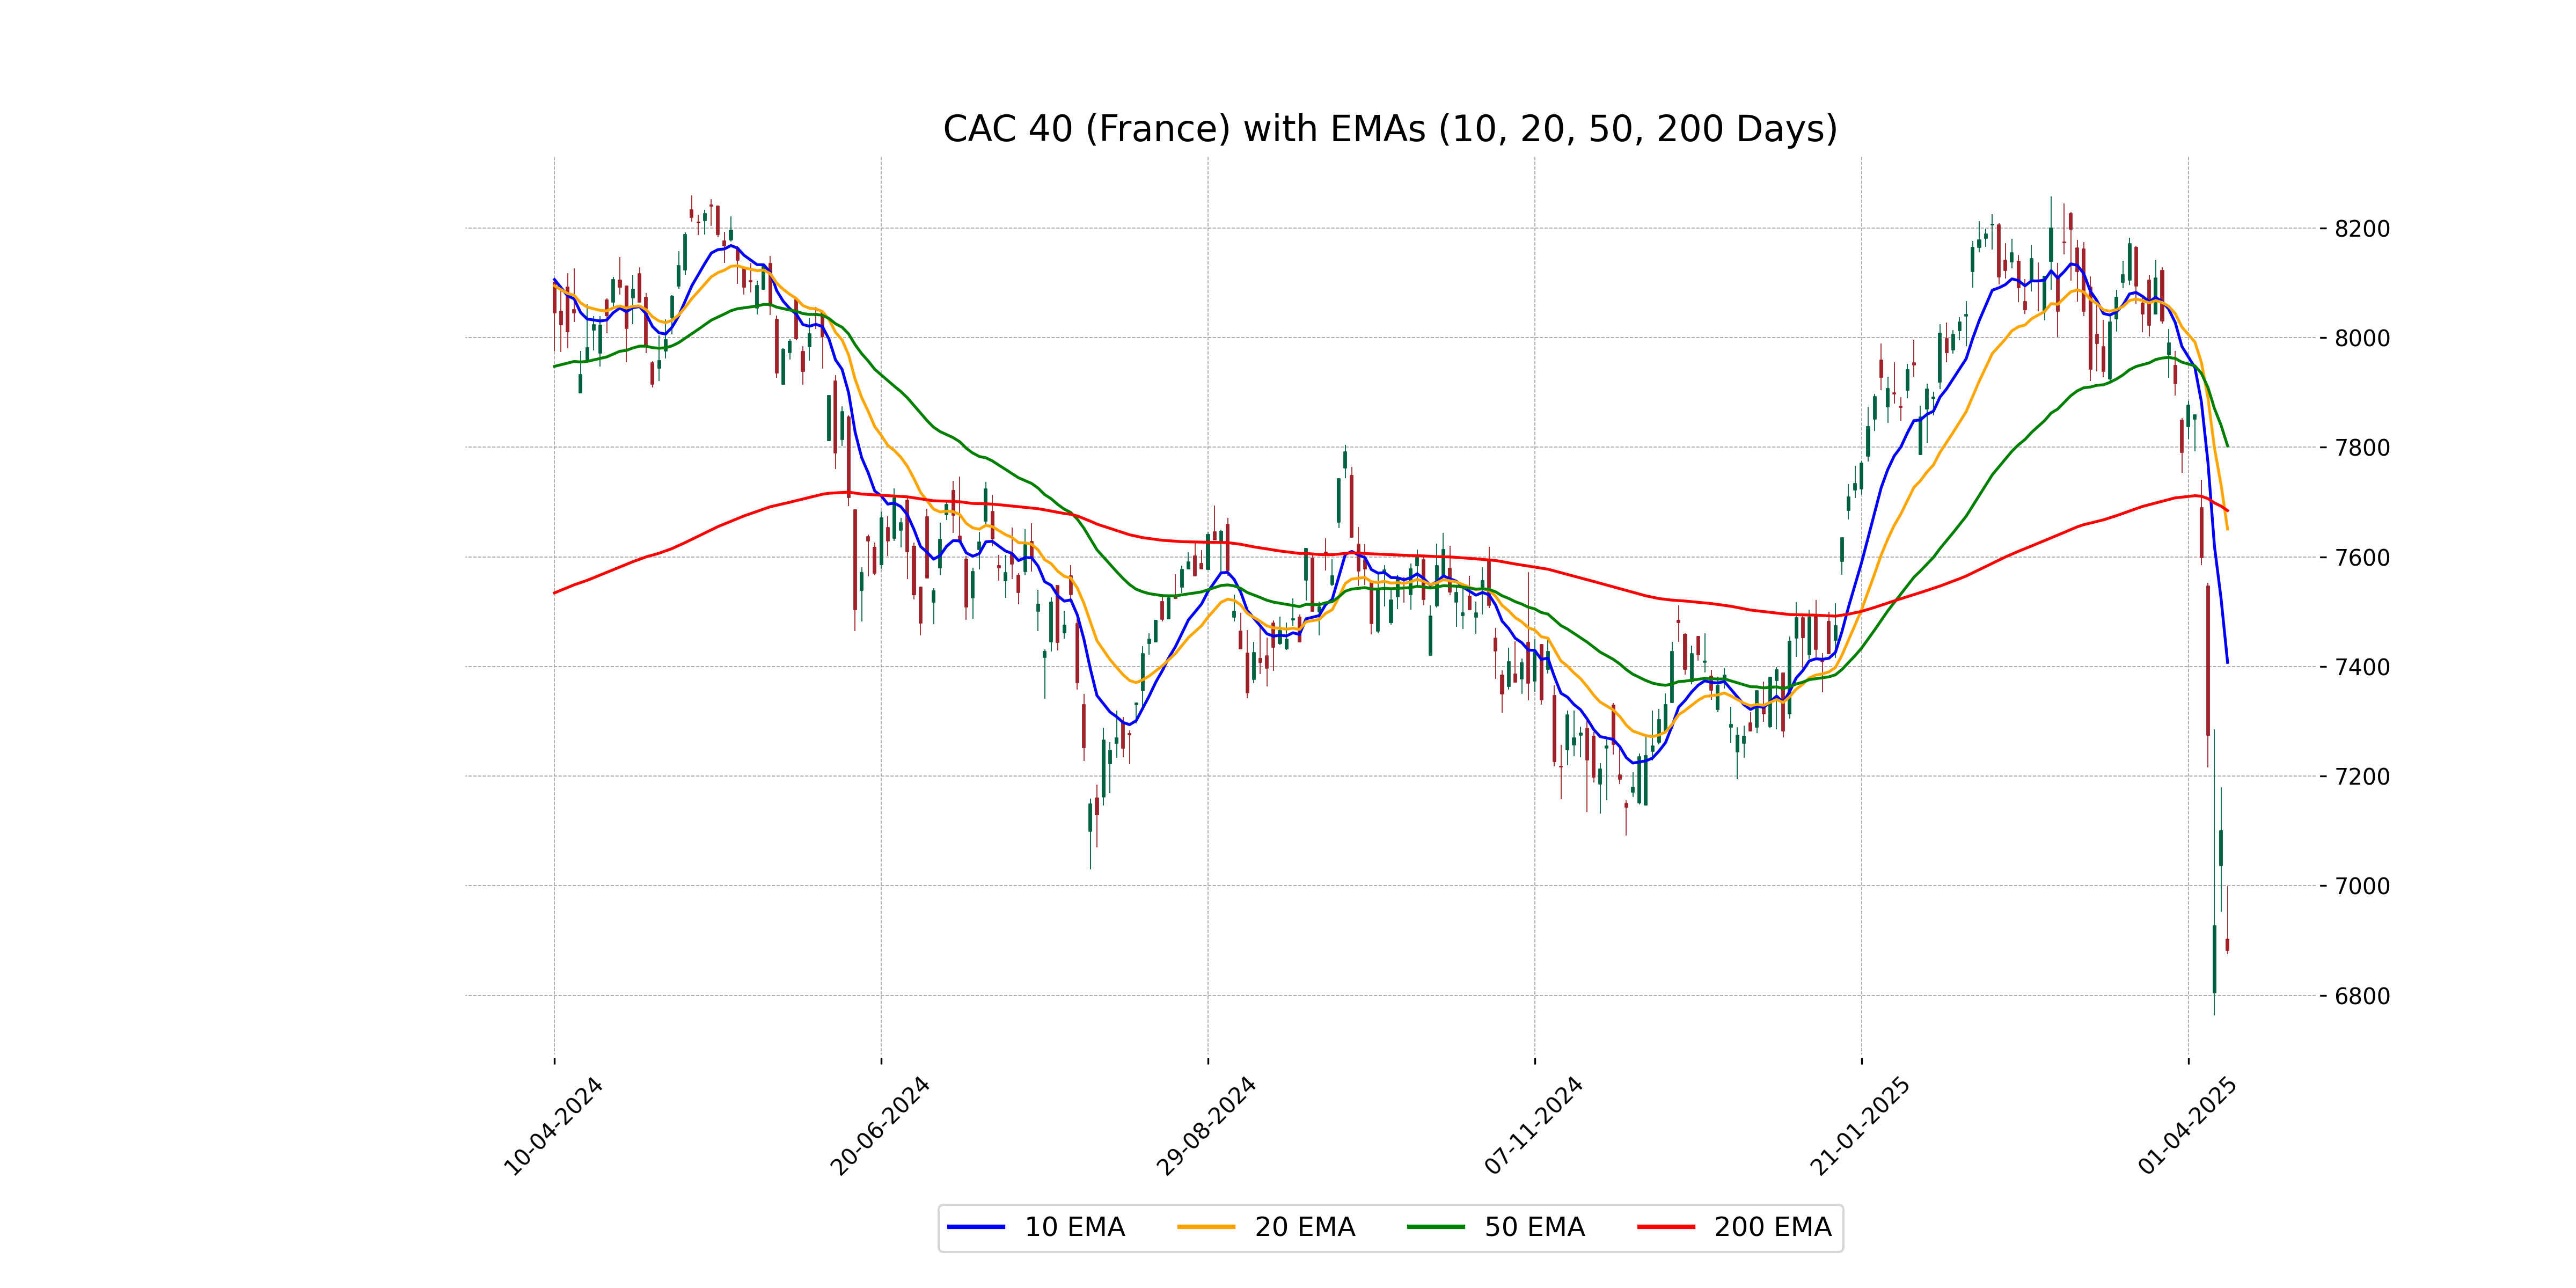
CAC 40 (France) Performance: The CAC 40 index opened at 6902.42 but closed lower at 6882.37, showing a decline of 3.07% with a points drop of 218.05. The market is experiencing bearish momentum, highlighted by a low RSI of 23.82, indicating strong selling pressure. The MACD is significantly negative, reinforcing the downtrend, as the index trades below its 50, 200, 10, and 20-day EMAs.
Relationship with Key Moving Averages
The CAC 40 index is currently trading below its 10-day EMA (7407.48), 20-day EMA (7650.75), 50-day EMA (7802.62), and 200-day EMA (7684.39), indicating a potential bearish trend. Additionally, the RSI at 23.82 suggests oversold conditions.
Moving Averages Trend (MACD)
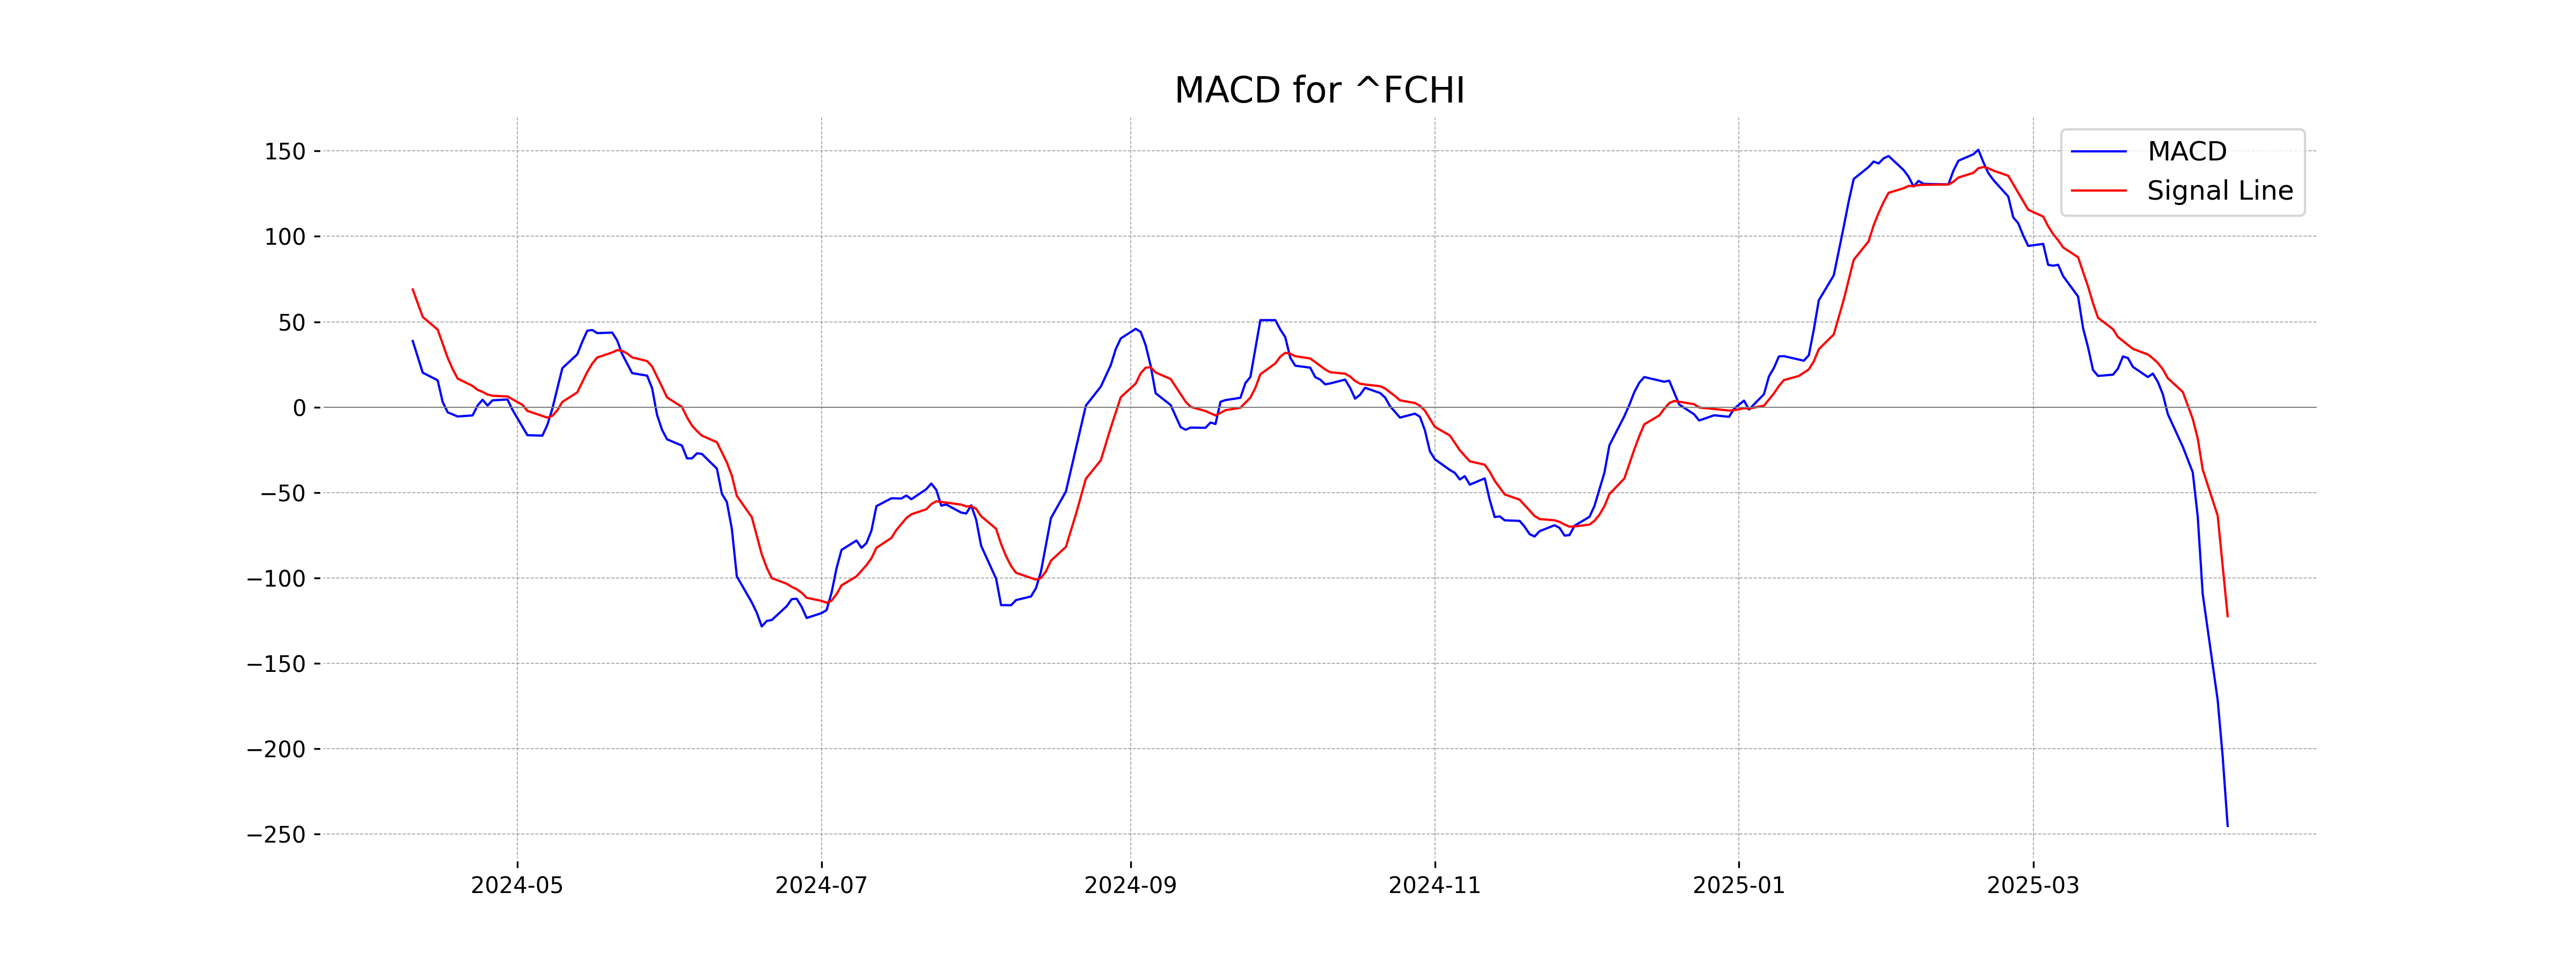
The CAC 40 (France) is exhibiting bearish momentum as indicated by the MACD, which is significantly below the signal line at -245.35 compared to -122.51. This suggests a continued downtrend and potential selling pressure.
RSI Analysis
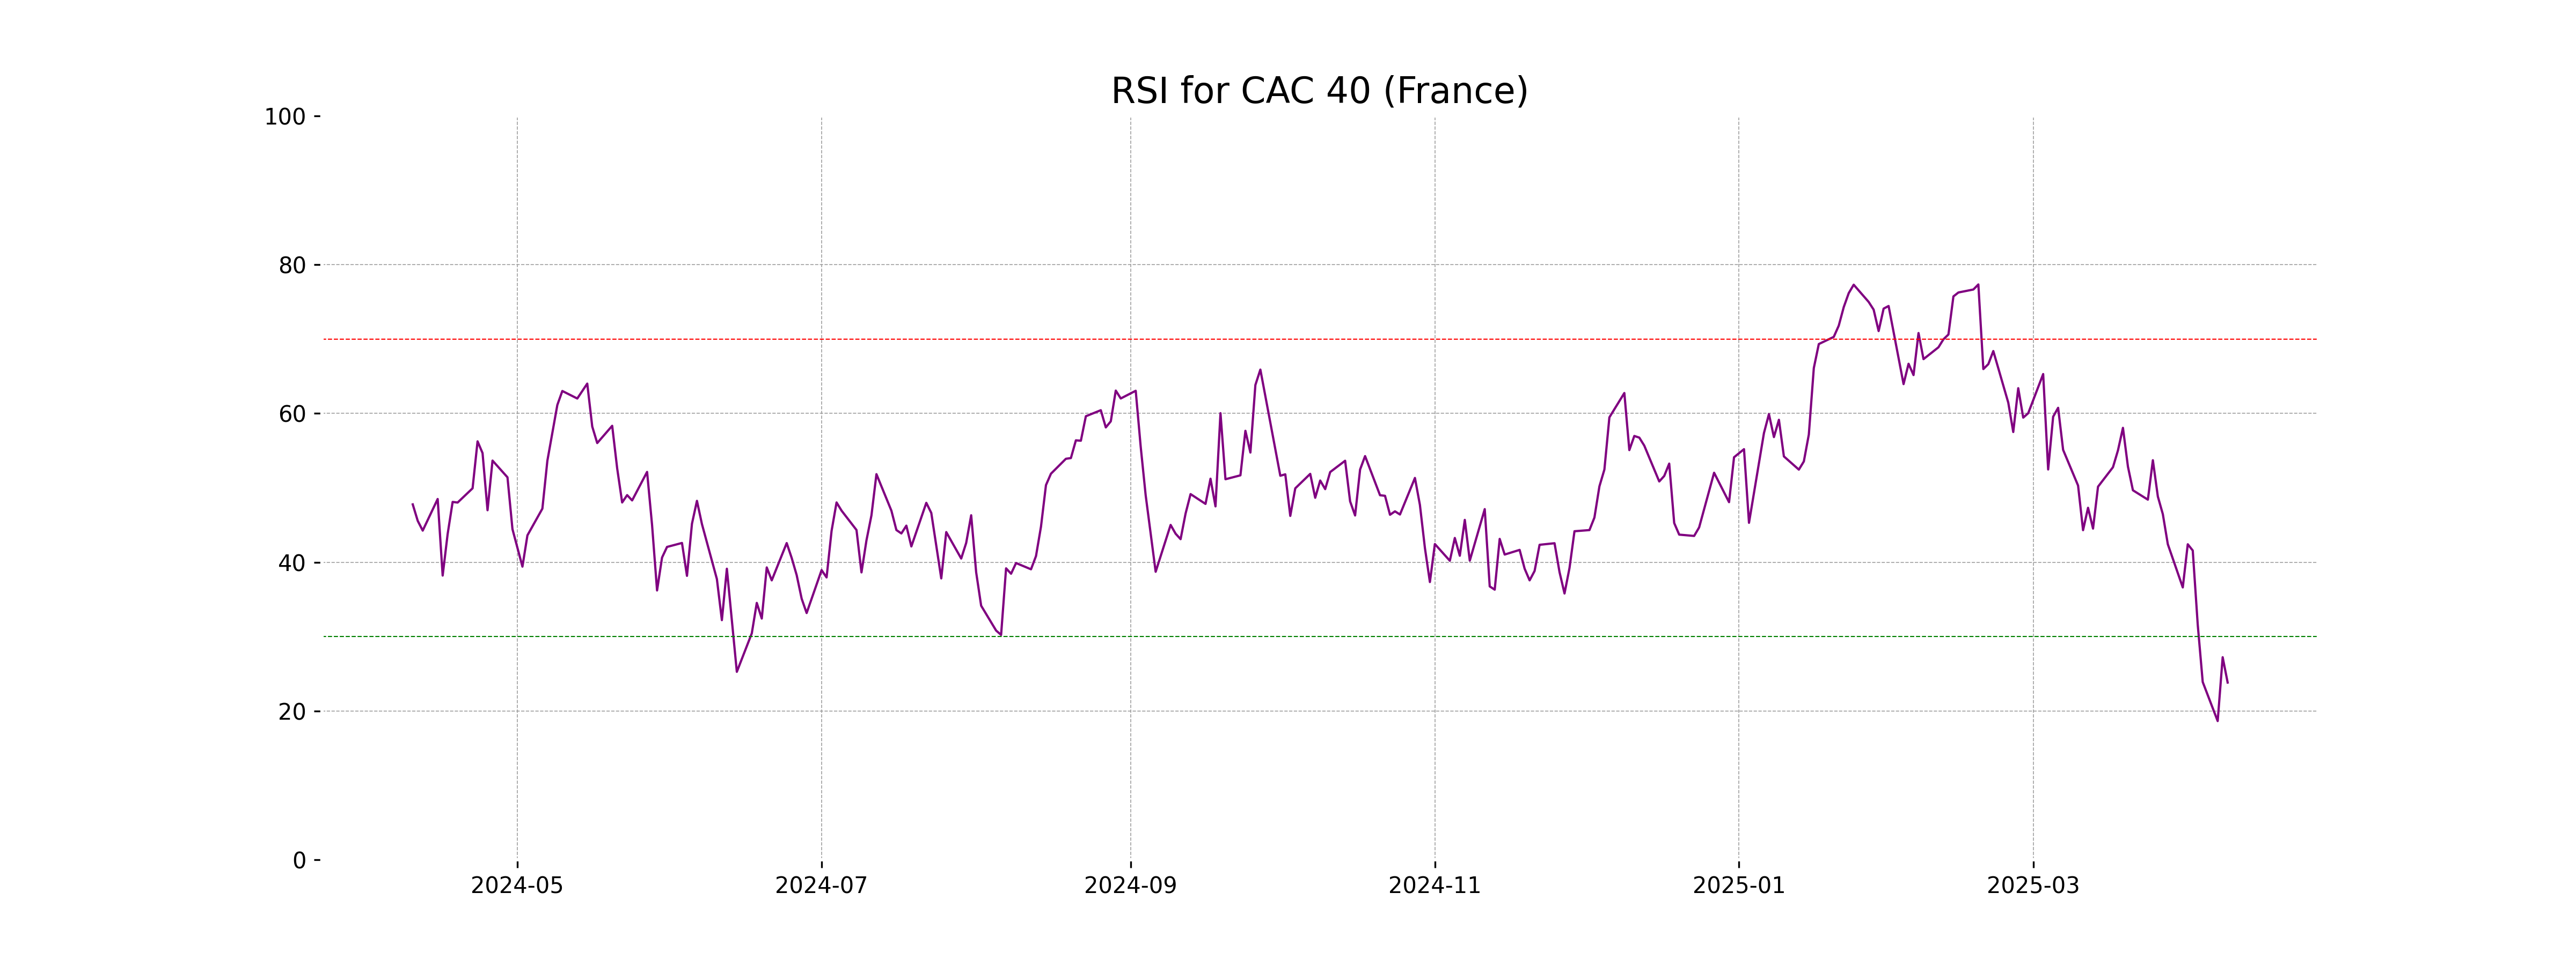
The RSI for the CAC 40 index is 23.82, which indicates that the index is in oversold territory. This suggests that the index has experienced significant selling pressure and may be due for a potential rebound or stabilization.
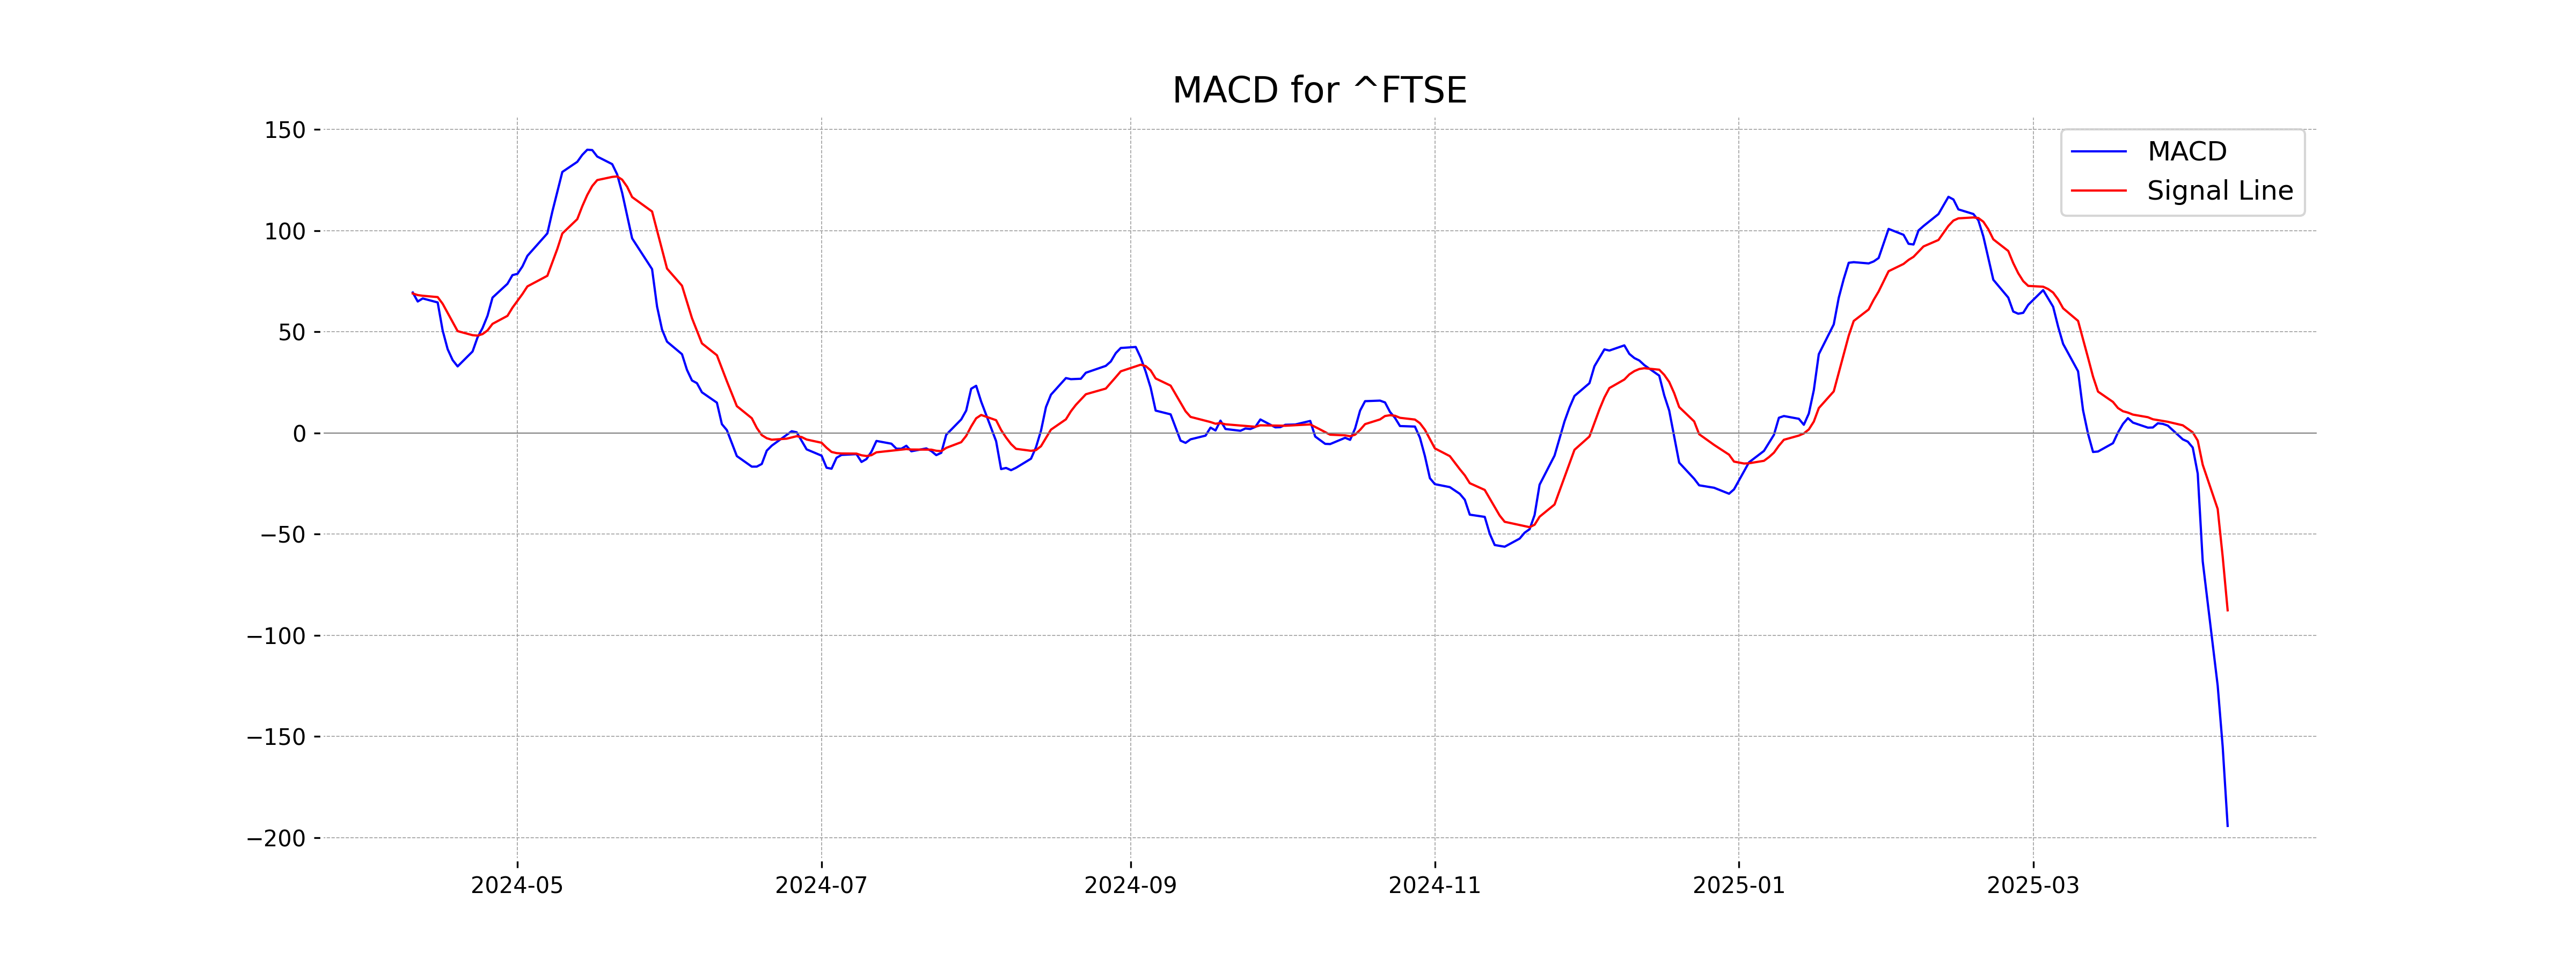
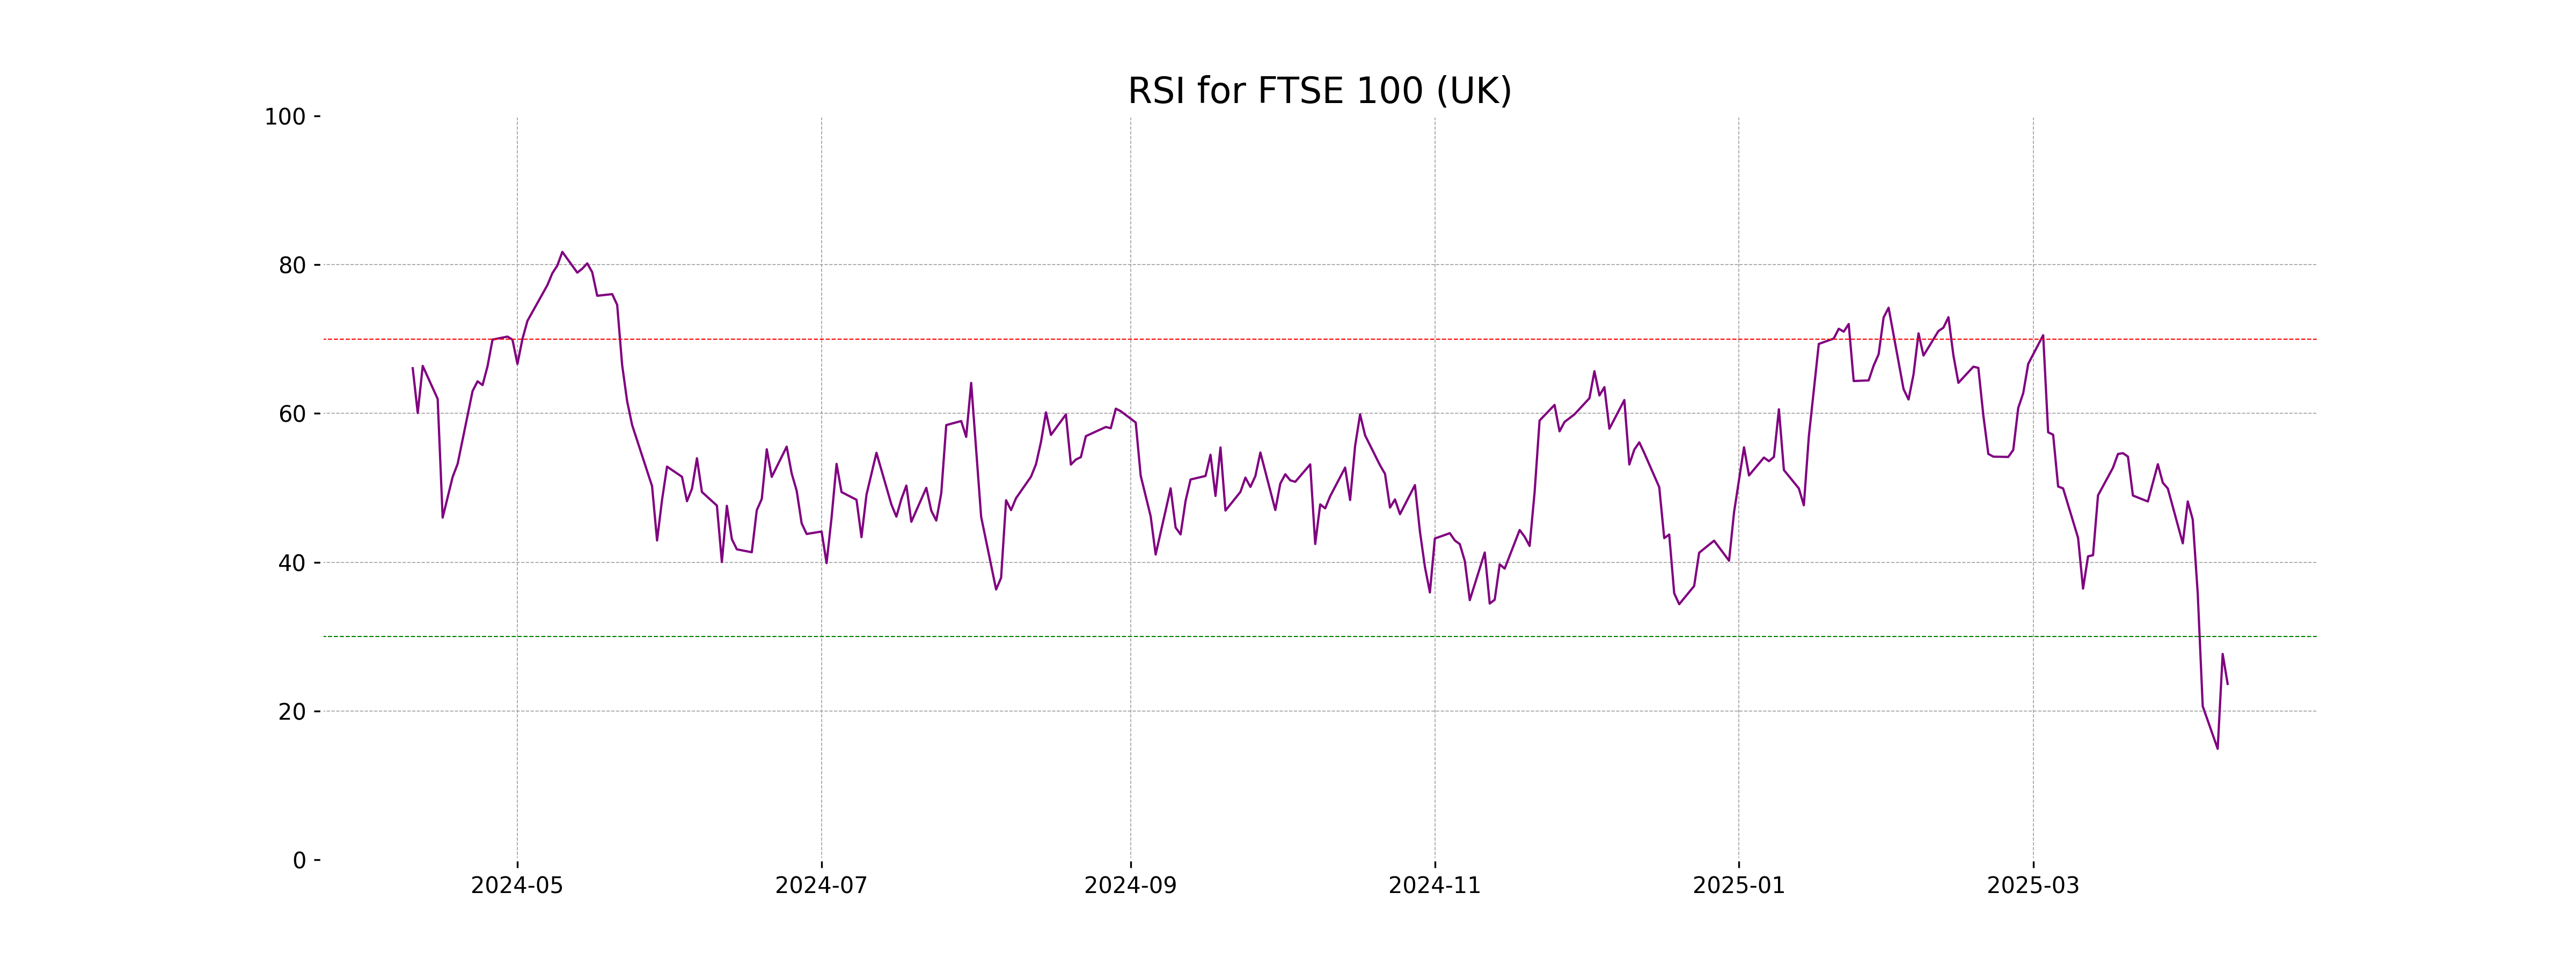
Analysis for FTSE 100 (UK) - April 09, 2025
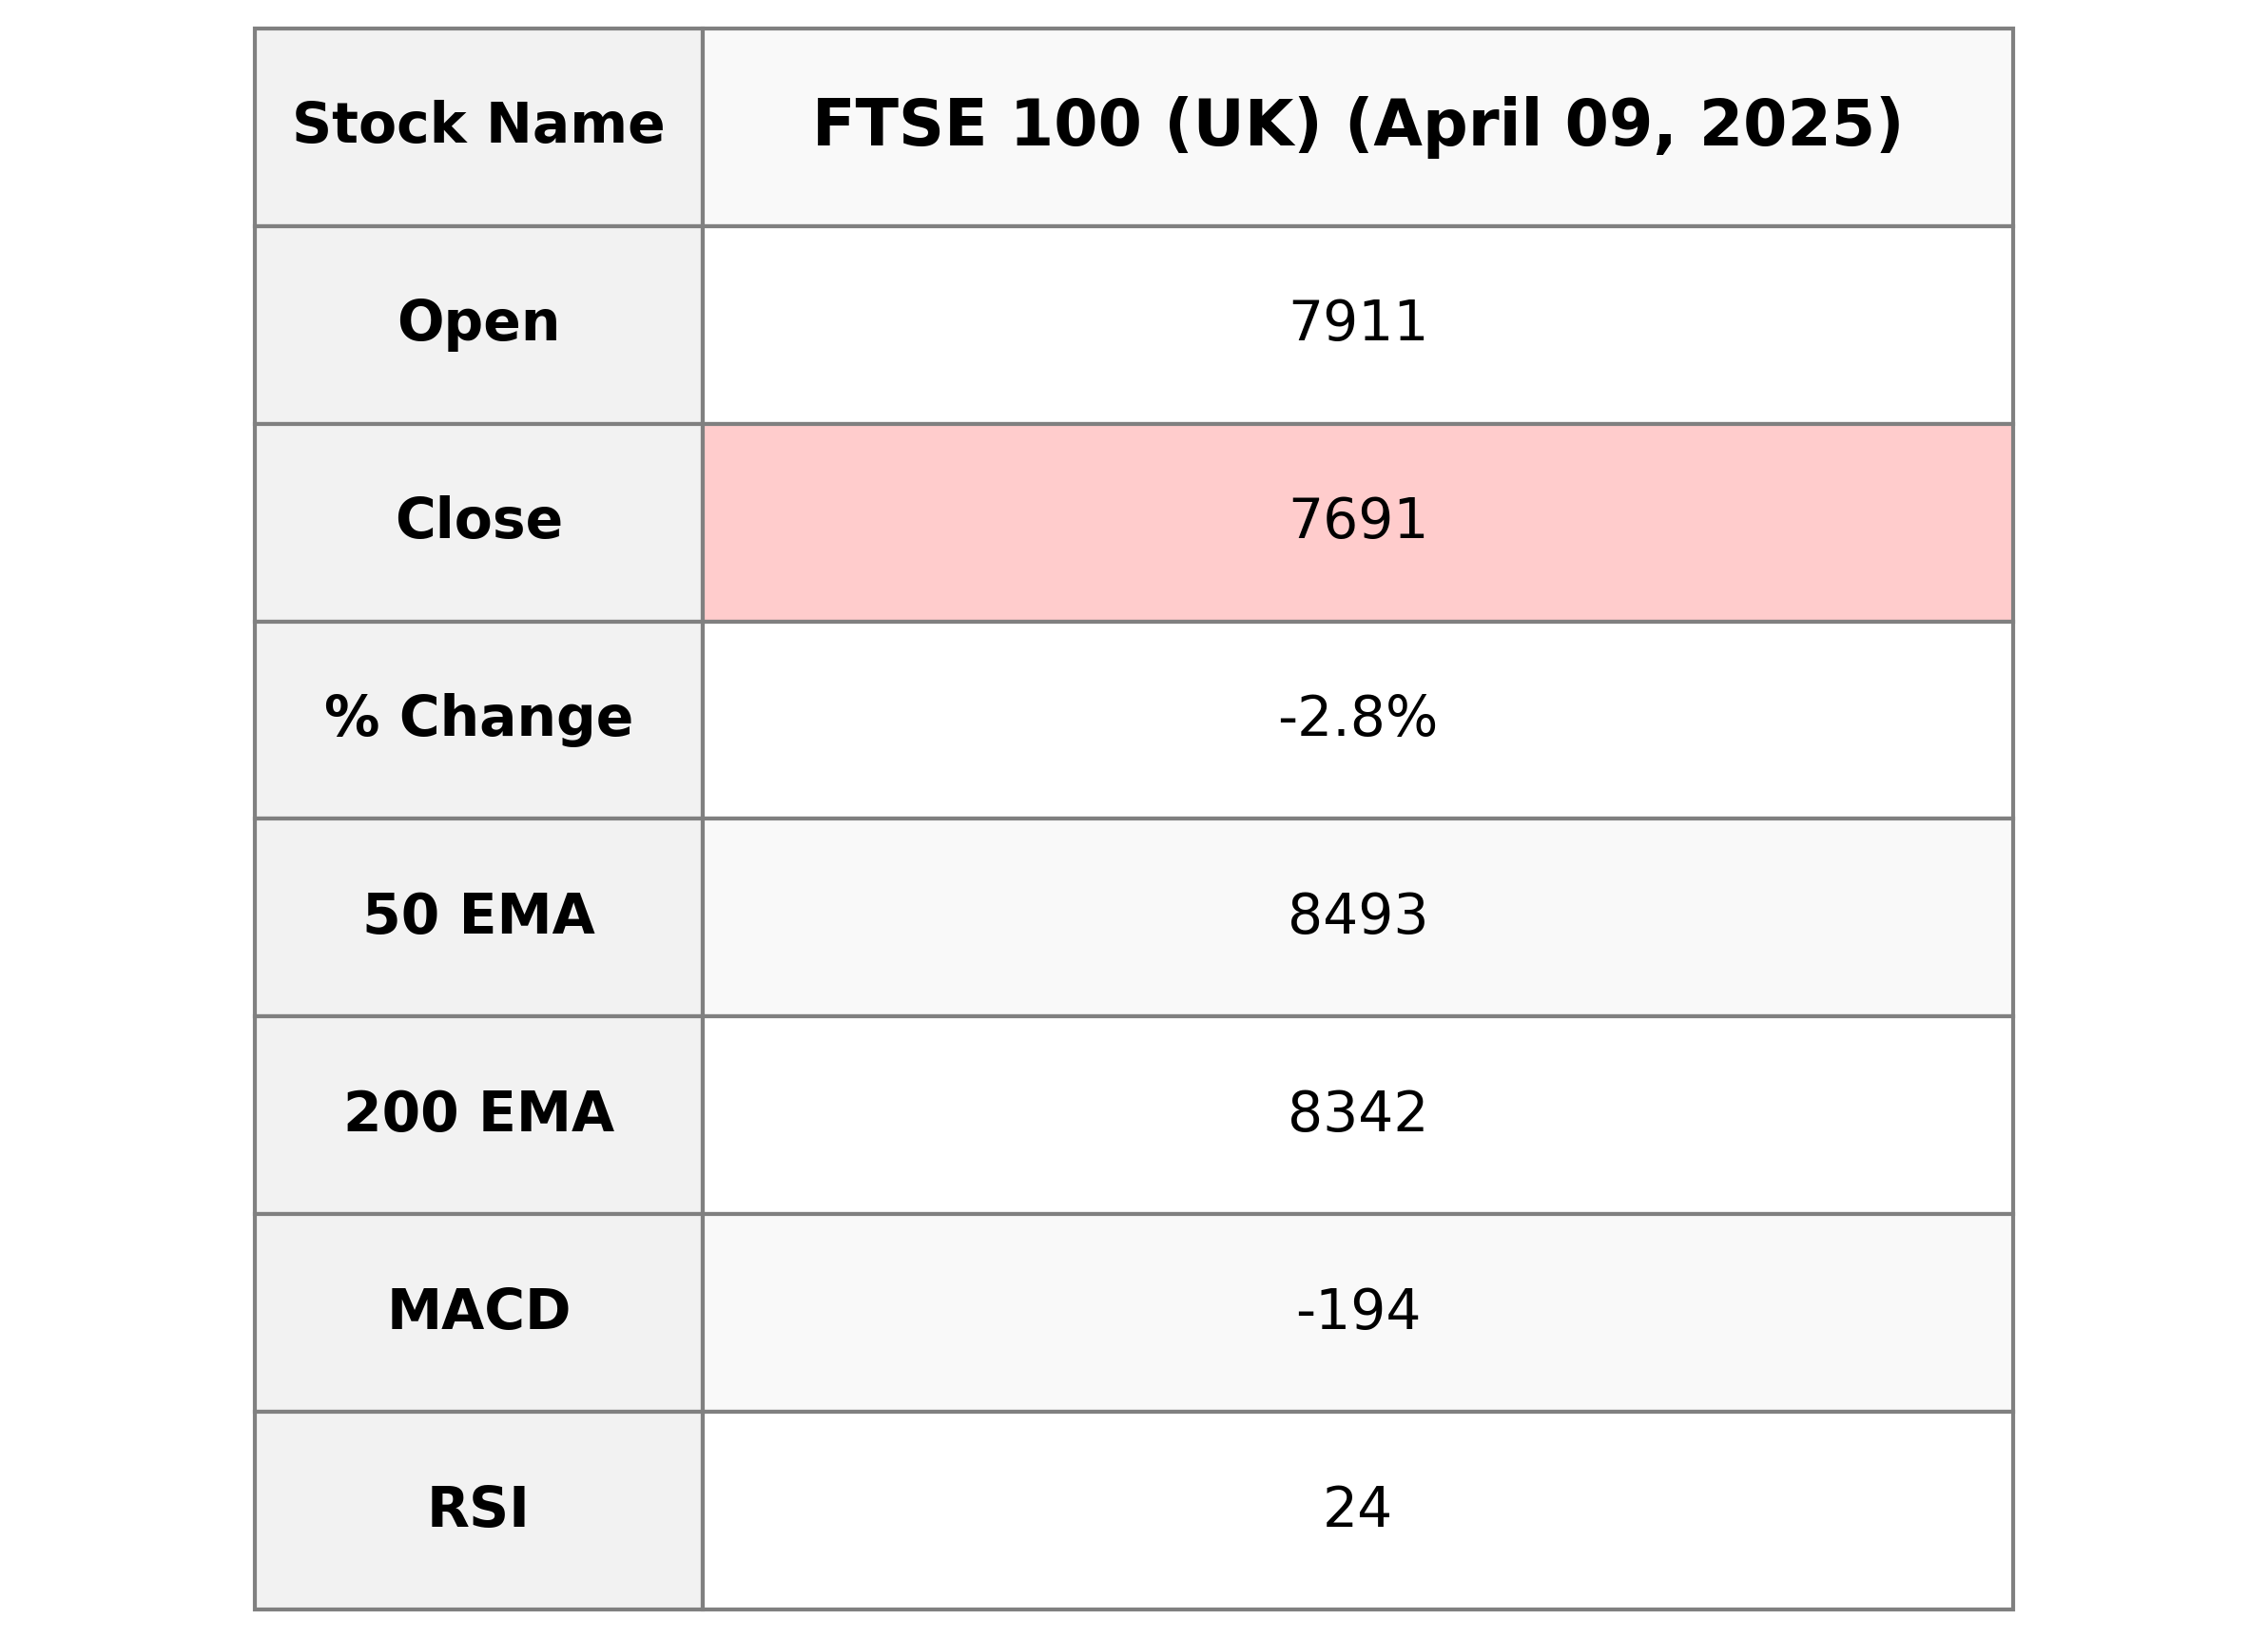
FTSE 100 (UK) saw a decline in performance with a closing value of 7690.70, which represents a decrease of approximately 2.78% compared to the previous close. The index experienced a drop of 219.80 points. Technical indicators such as RSI indicate oversold conditions at 23.64, while MACD is in a bearish state with a negative value of -194.22.
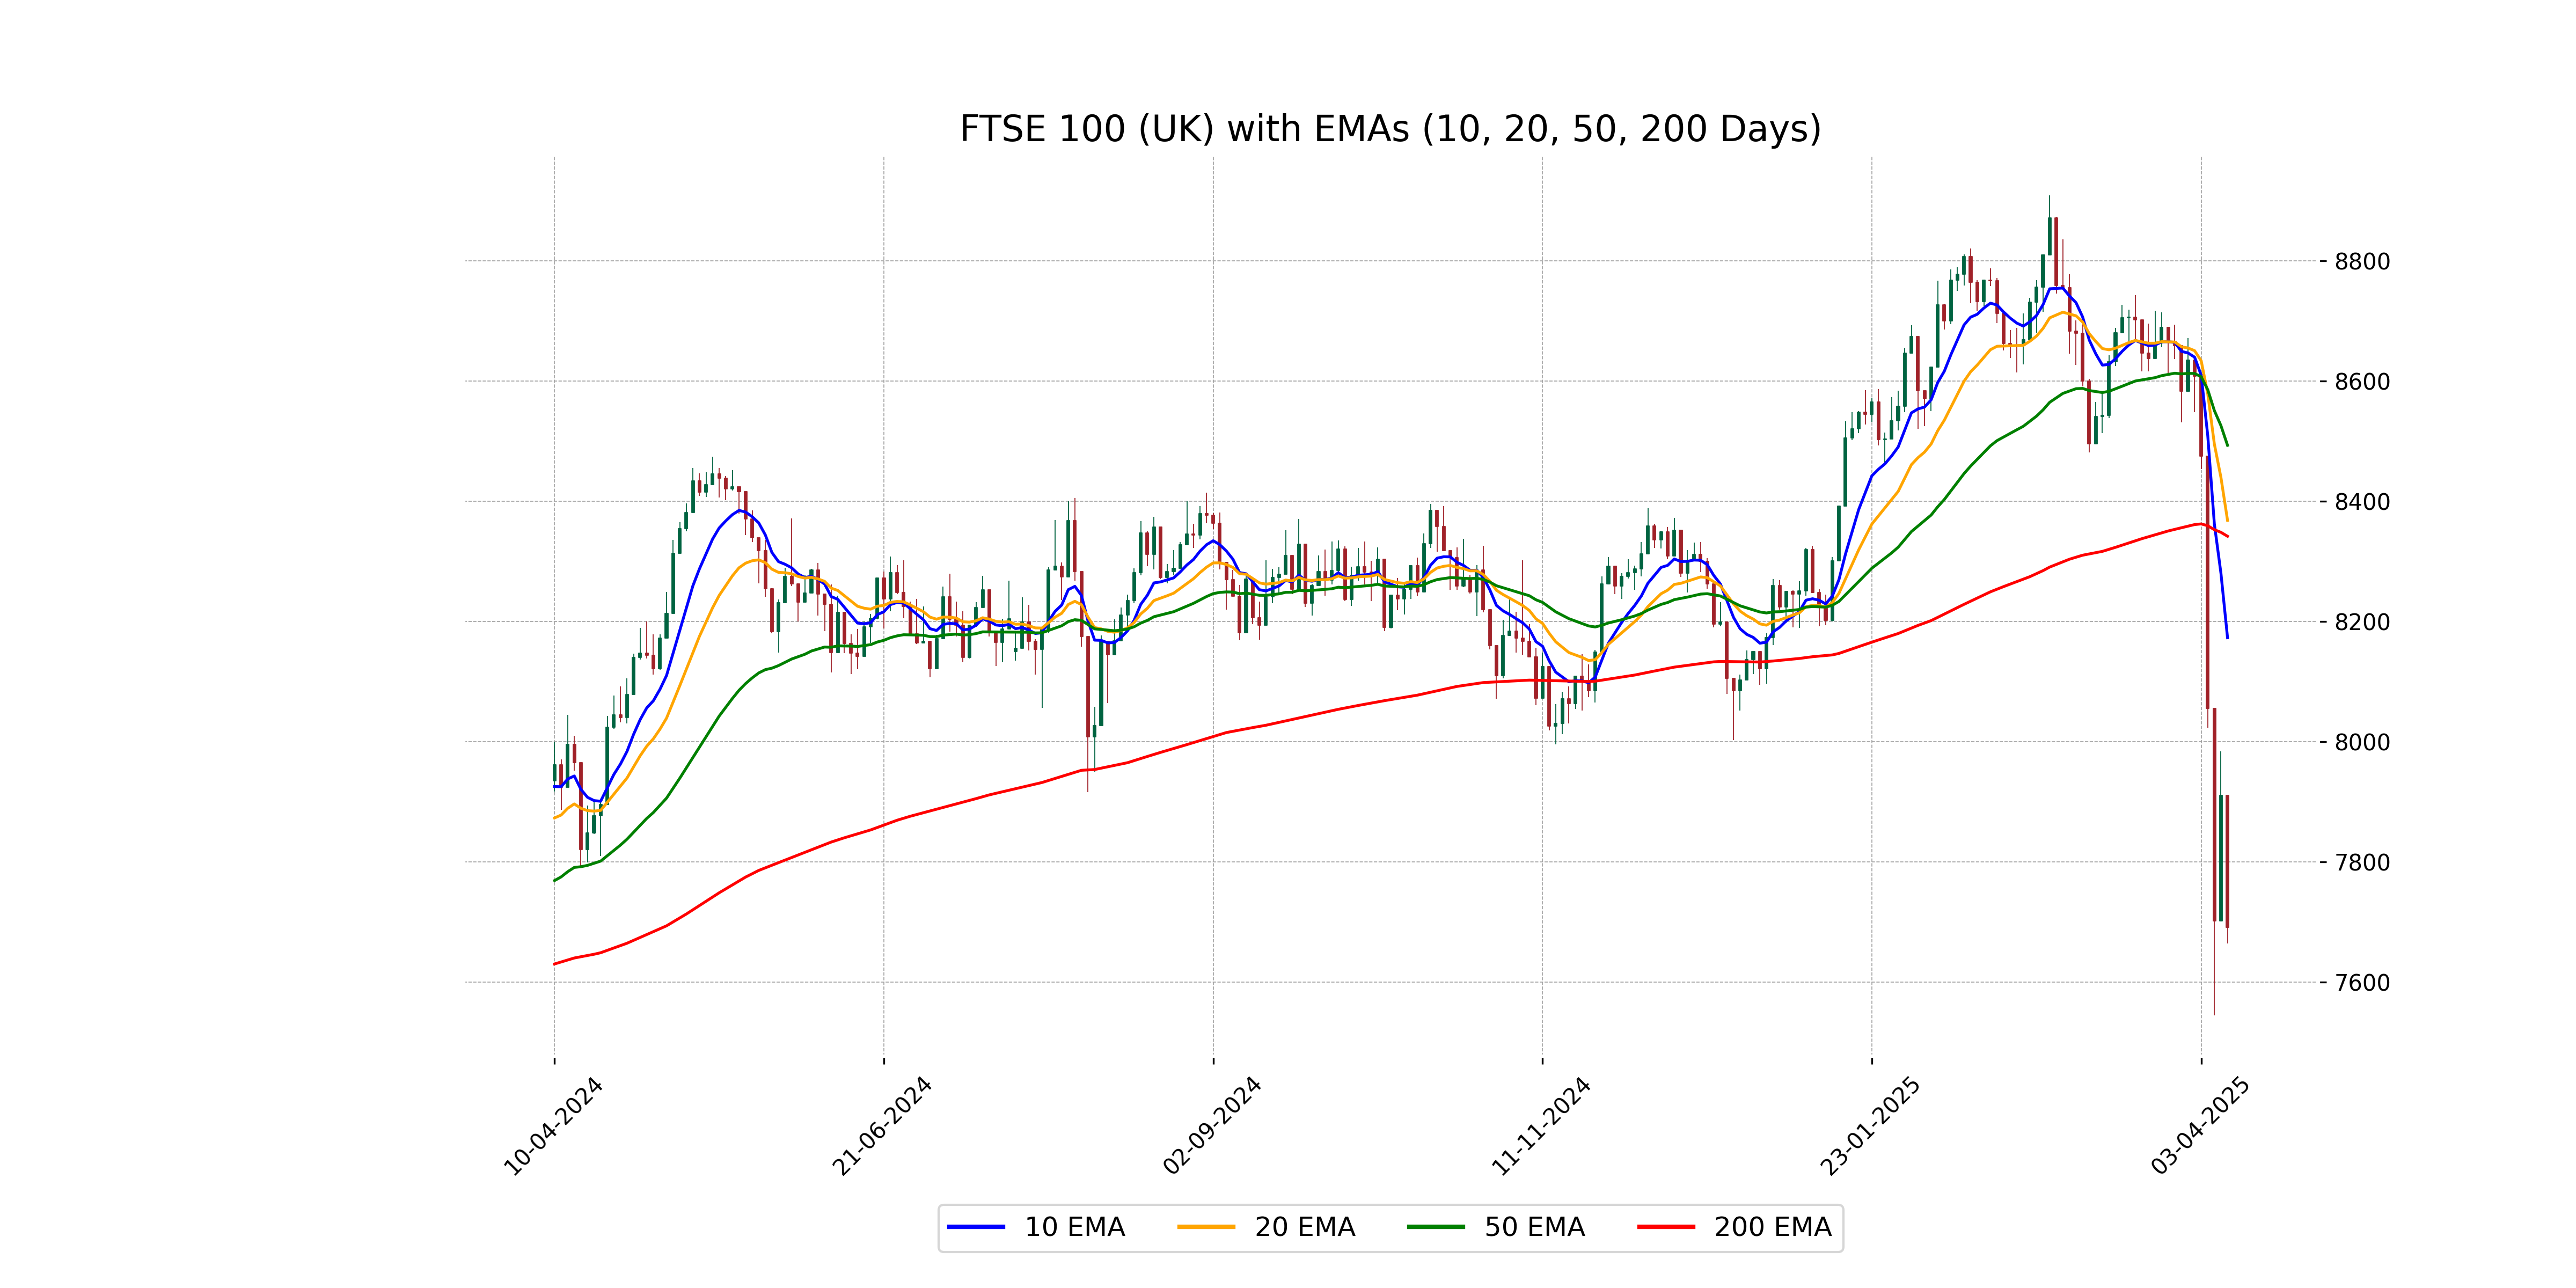
Relationship with Key Moving Averages
FTSE 100 is trading below its key moving averages, indicating a bearish trend. The current close is significantly below the 50 EMA (8493.10), 200 EMA (8341.79), 10 EMA (8172.94), and 20 EMA (8368.25), suggesting downward pressure on the price.
Moving Averages Trend (MACD)
The MACD of FTSE 100 (UK) is -194.22, which is below its signal line of -87.66. This suggests a bearish sentiment as the MACD is significantly negative, indicating potential downward price momentum.
RSI Analysis
The relative strength index (RSI) for FTSE 100 is 23.64, indicating that the index is currently in an oversold condition. This suggests that the index may be undervalued and could potentially experience a price reversal or rally in the near term.
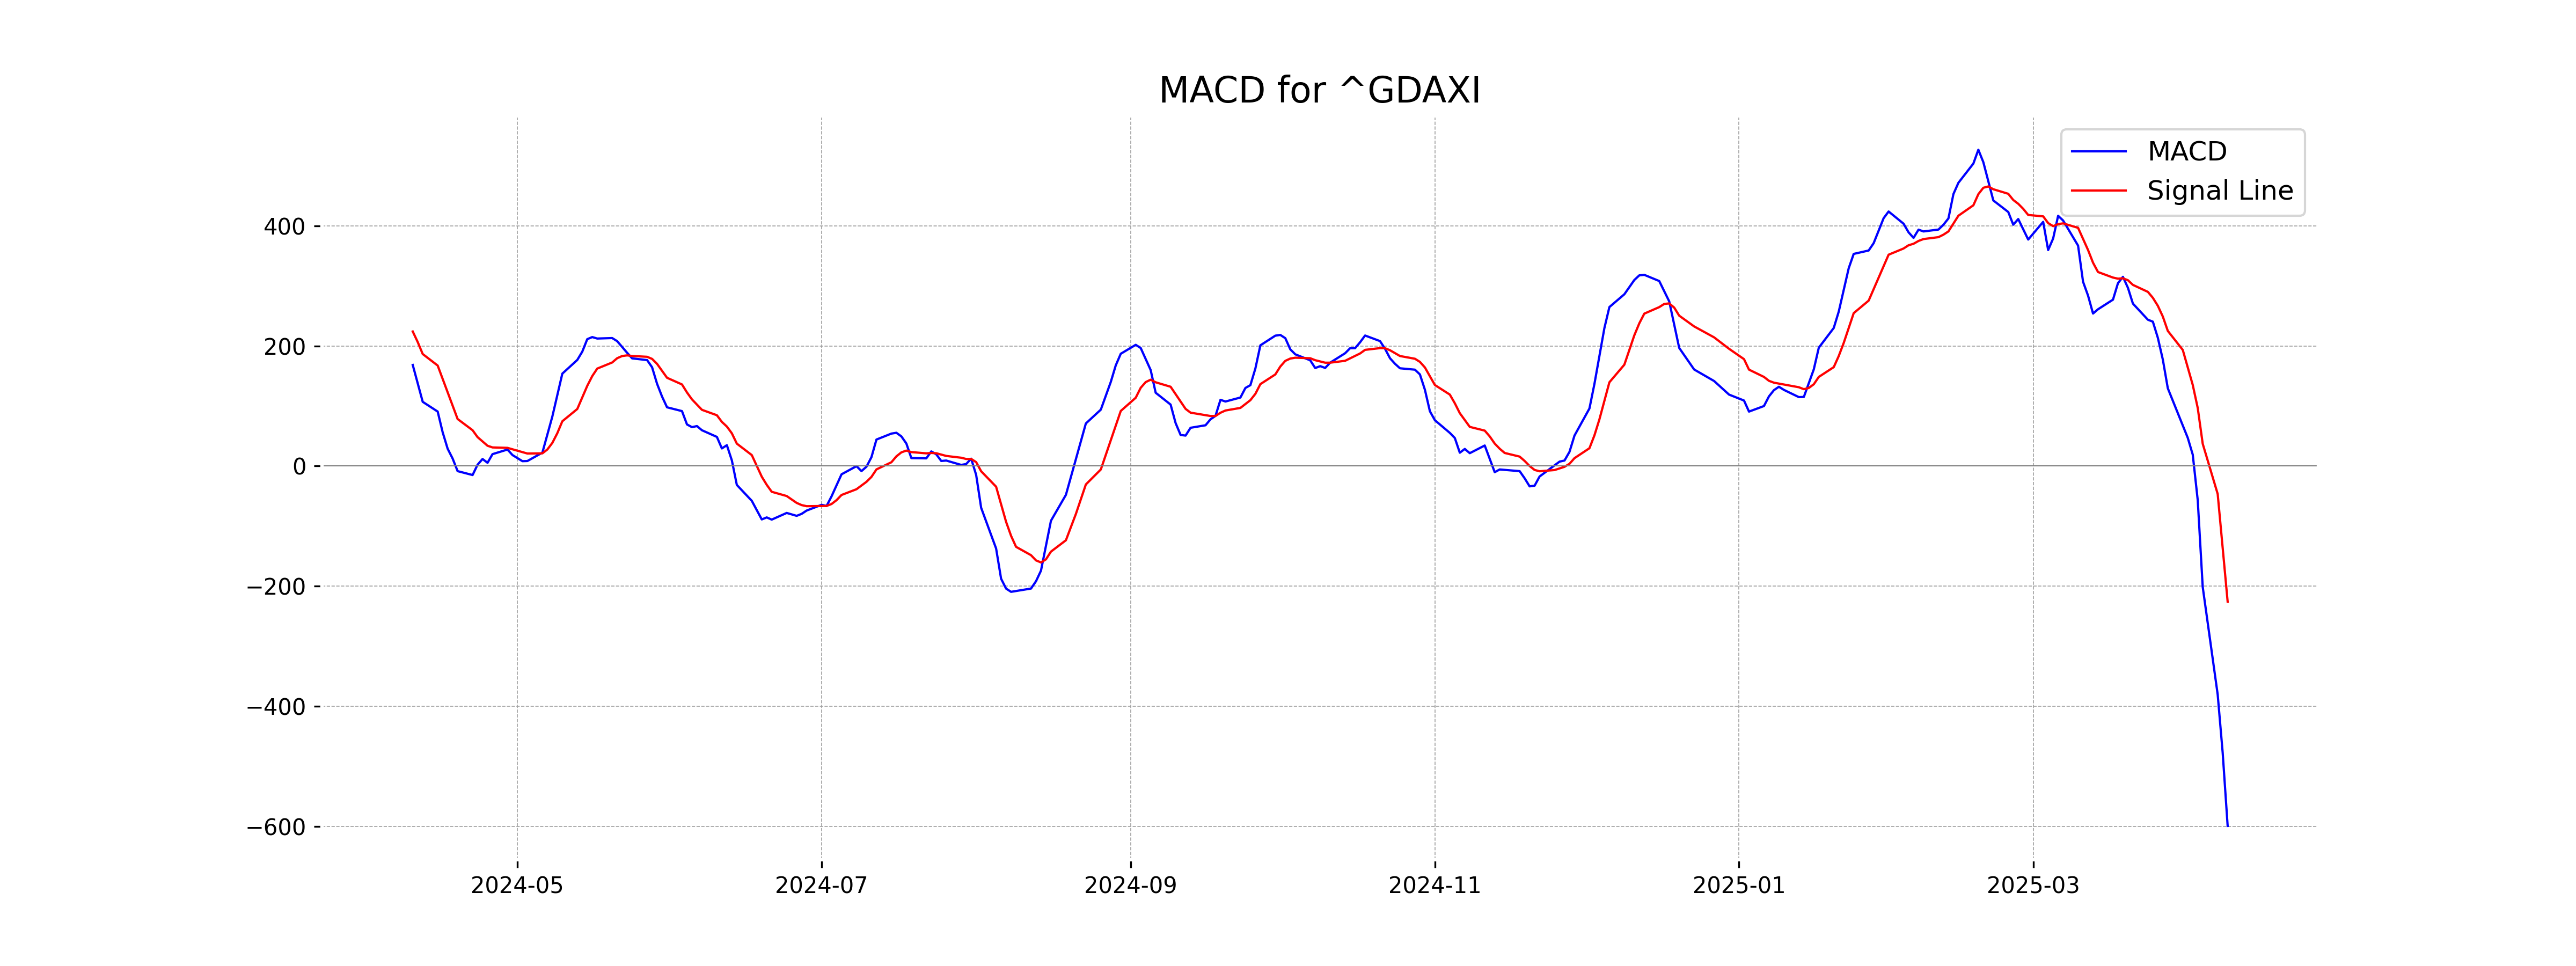
Analysis for DAX (Germany) - April 09, 2025
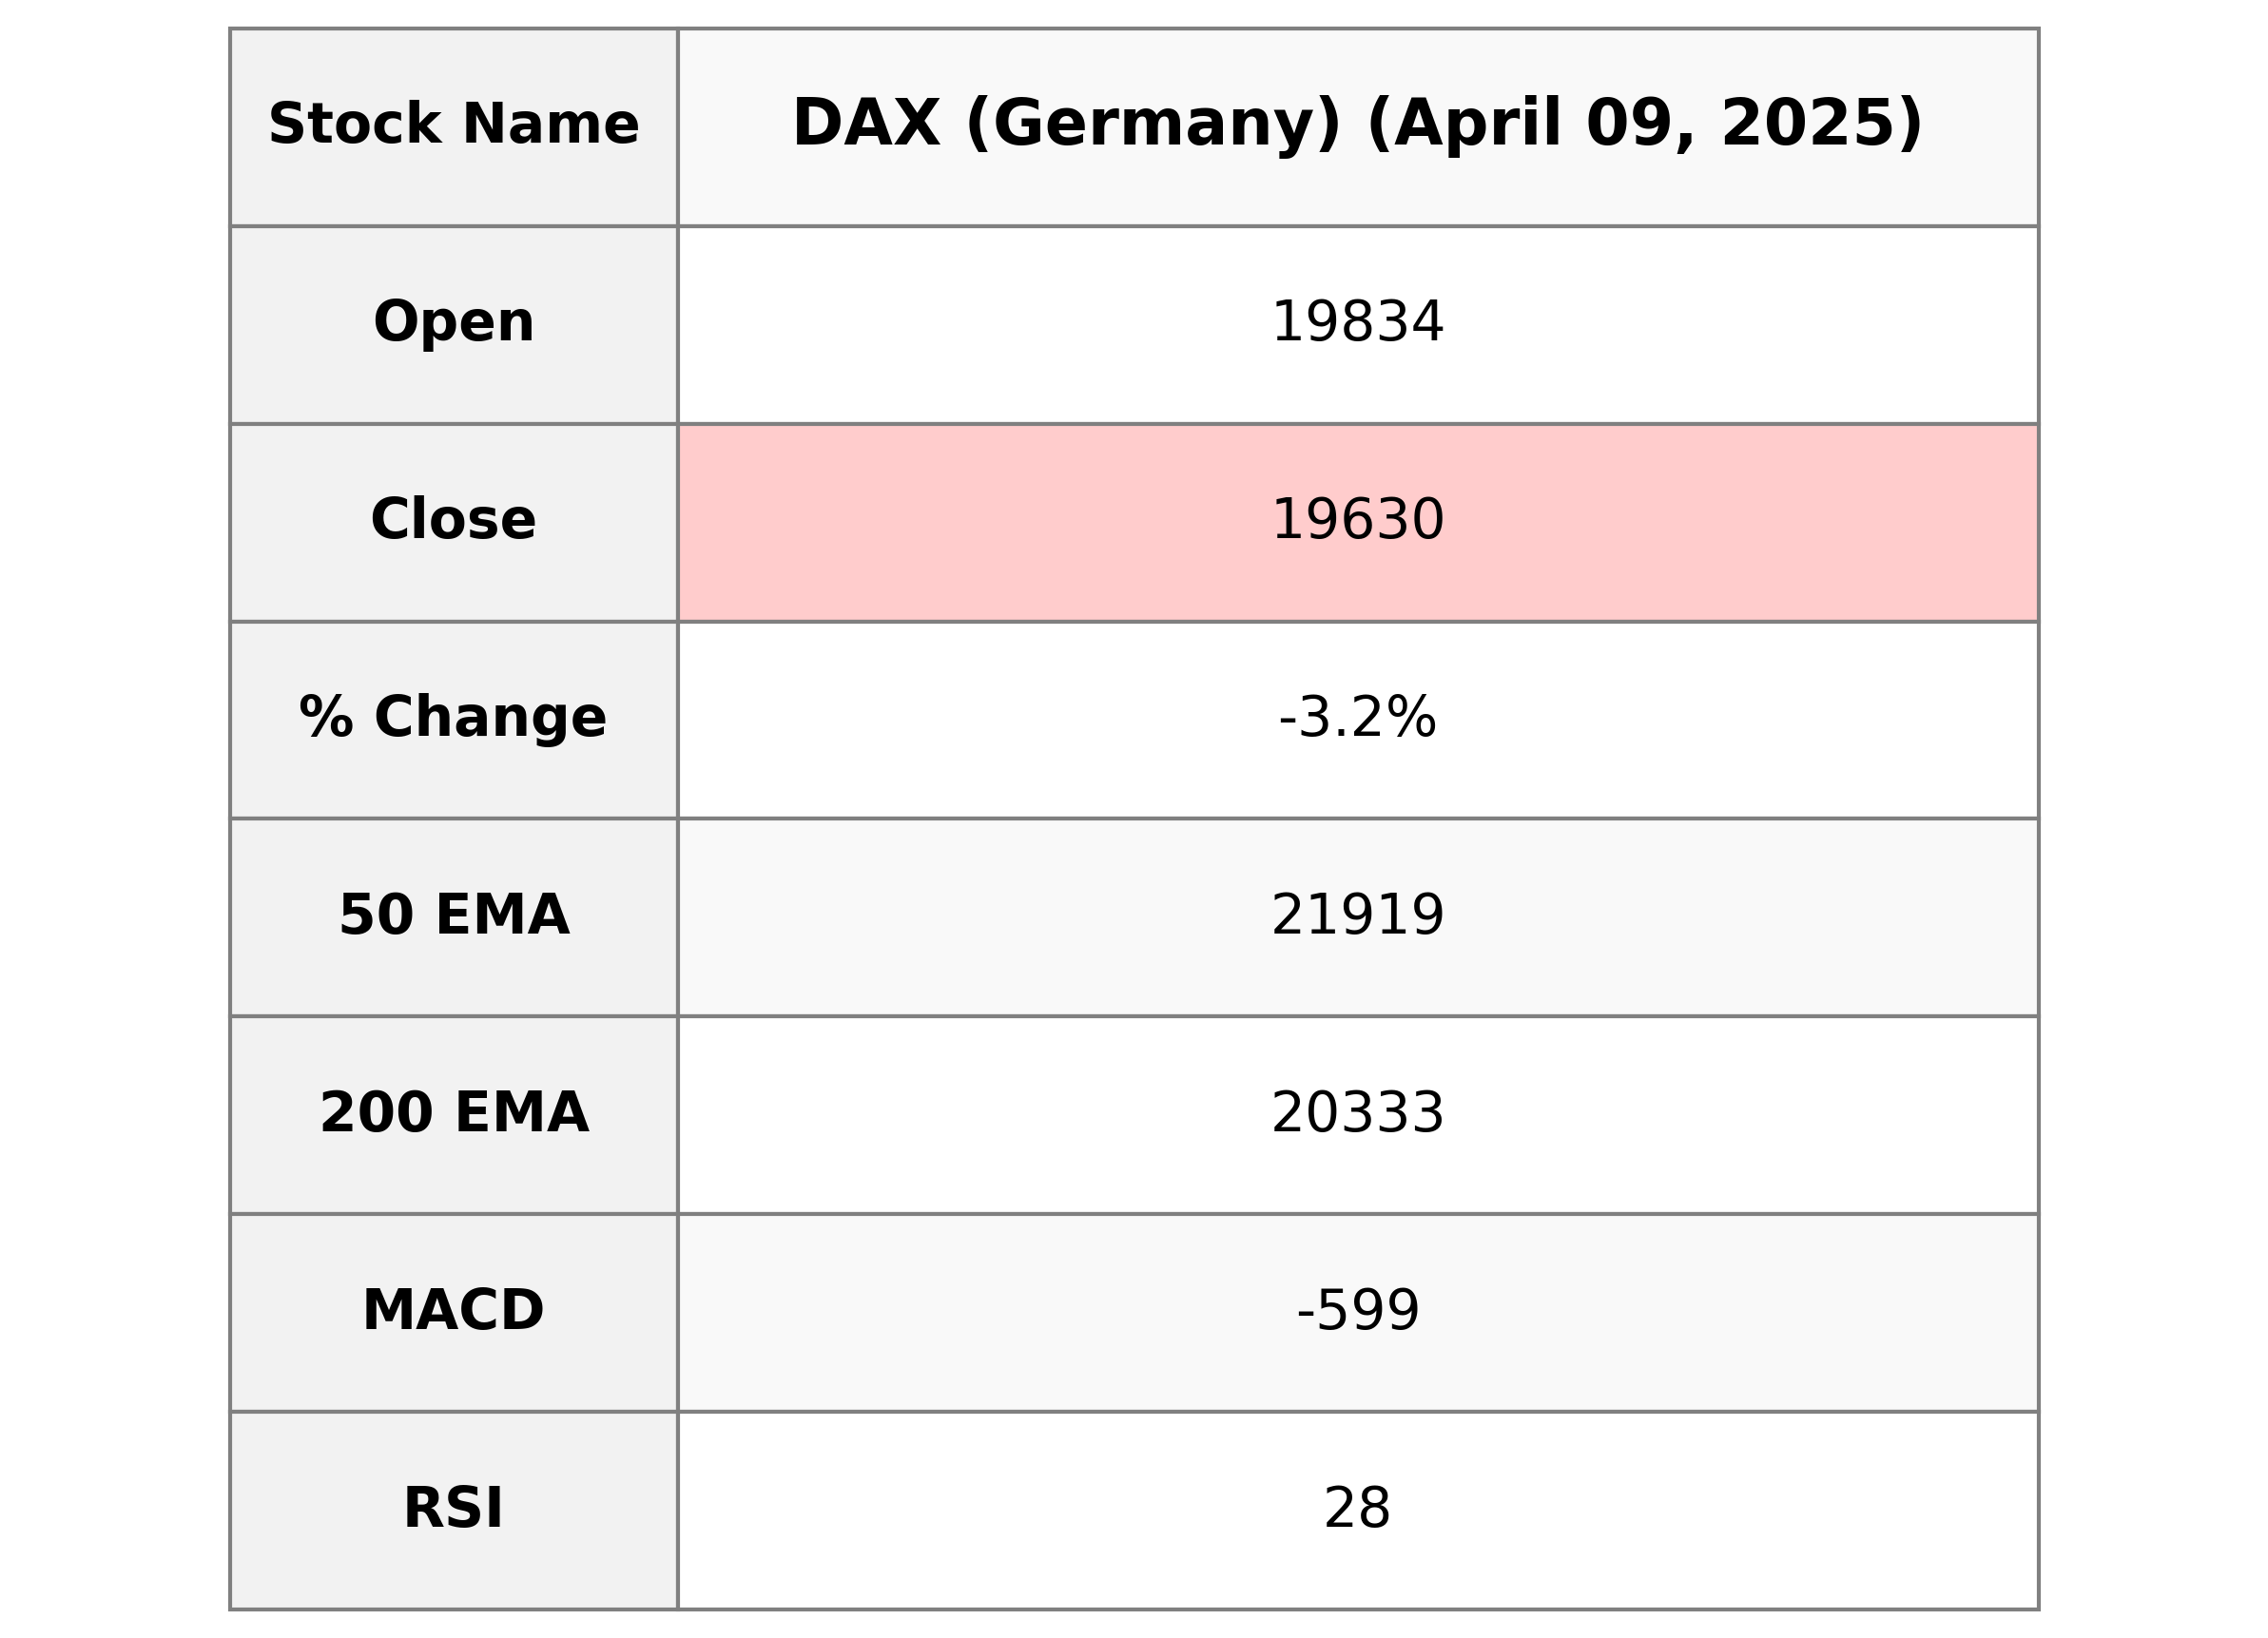
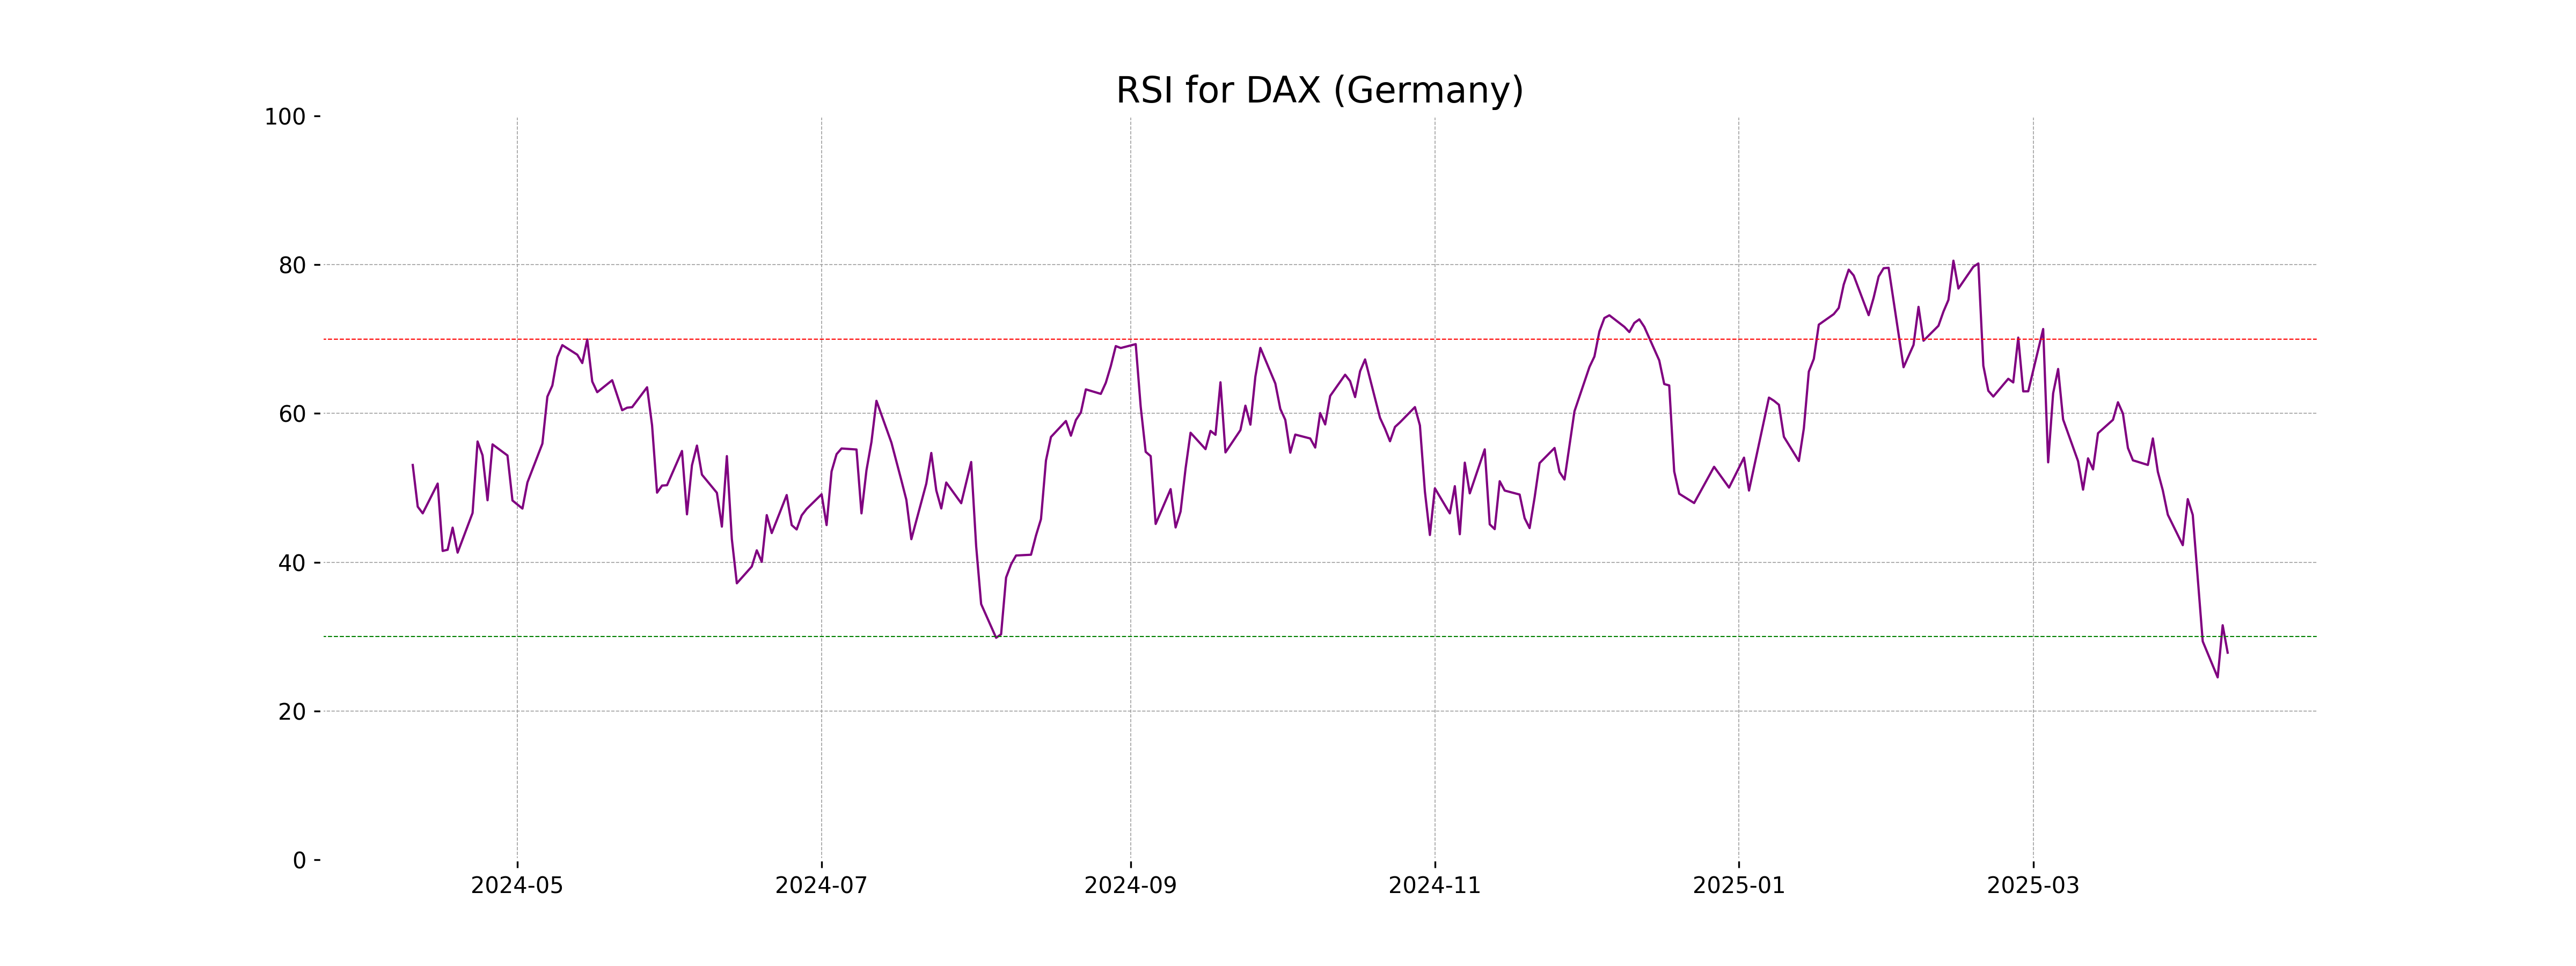
DAX (Germany) Performance: The DAX index experienced a significant decline, closing at 19,630.41, down by 3.20% from the previous close of 20,280.26. The Relative Strength Index (RSI) indicates that the market is in oversold territory at 27.84. Despite a lack of volume data, the overall technical indicators suggest bearish momentum, with the MACD well below the signal line.
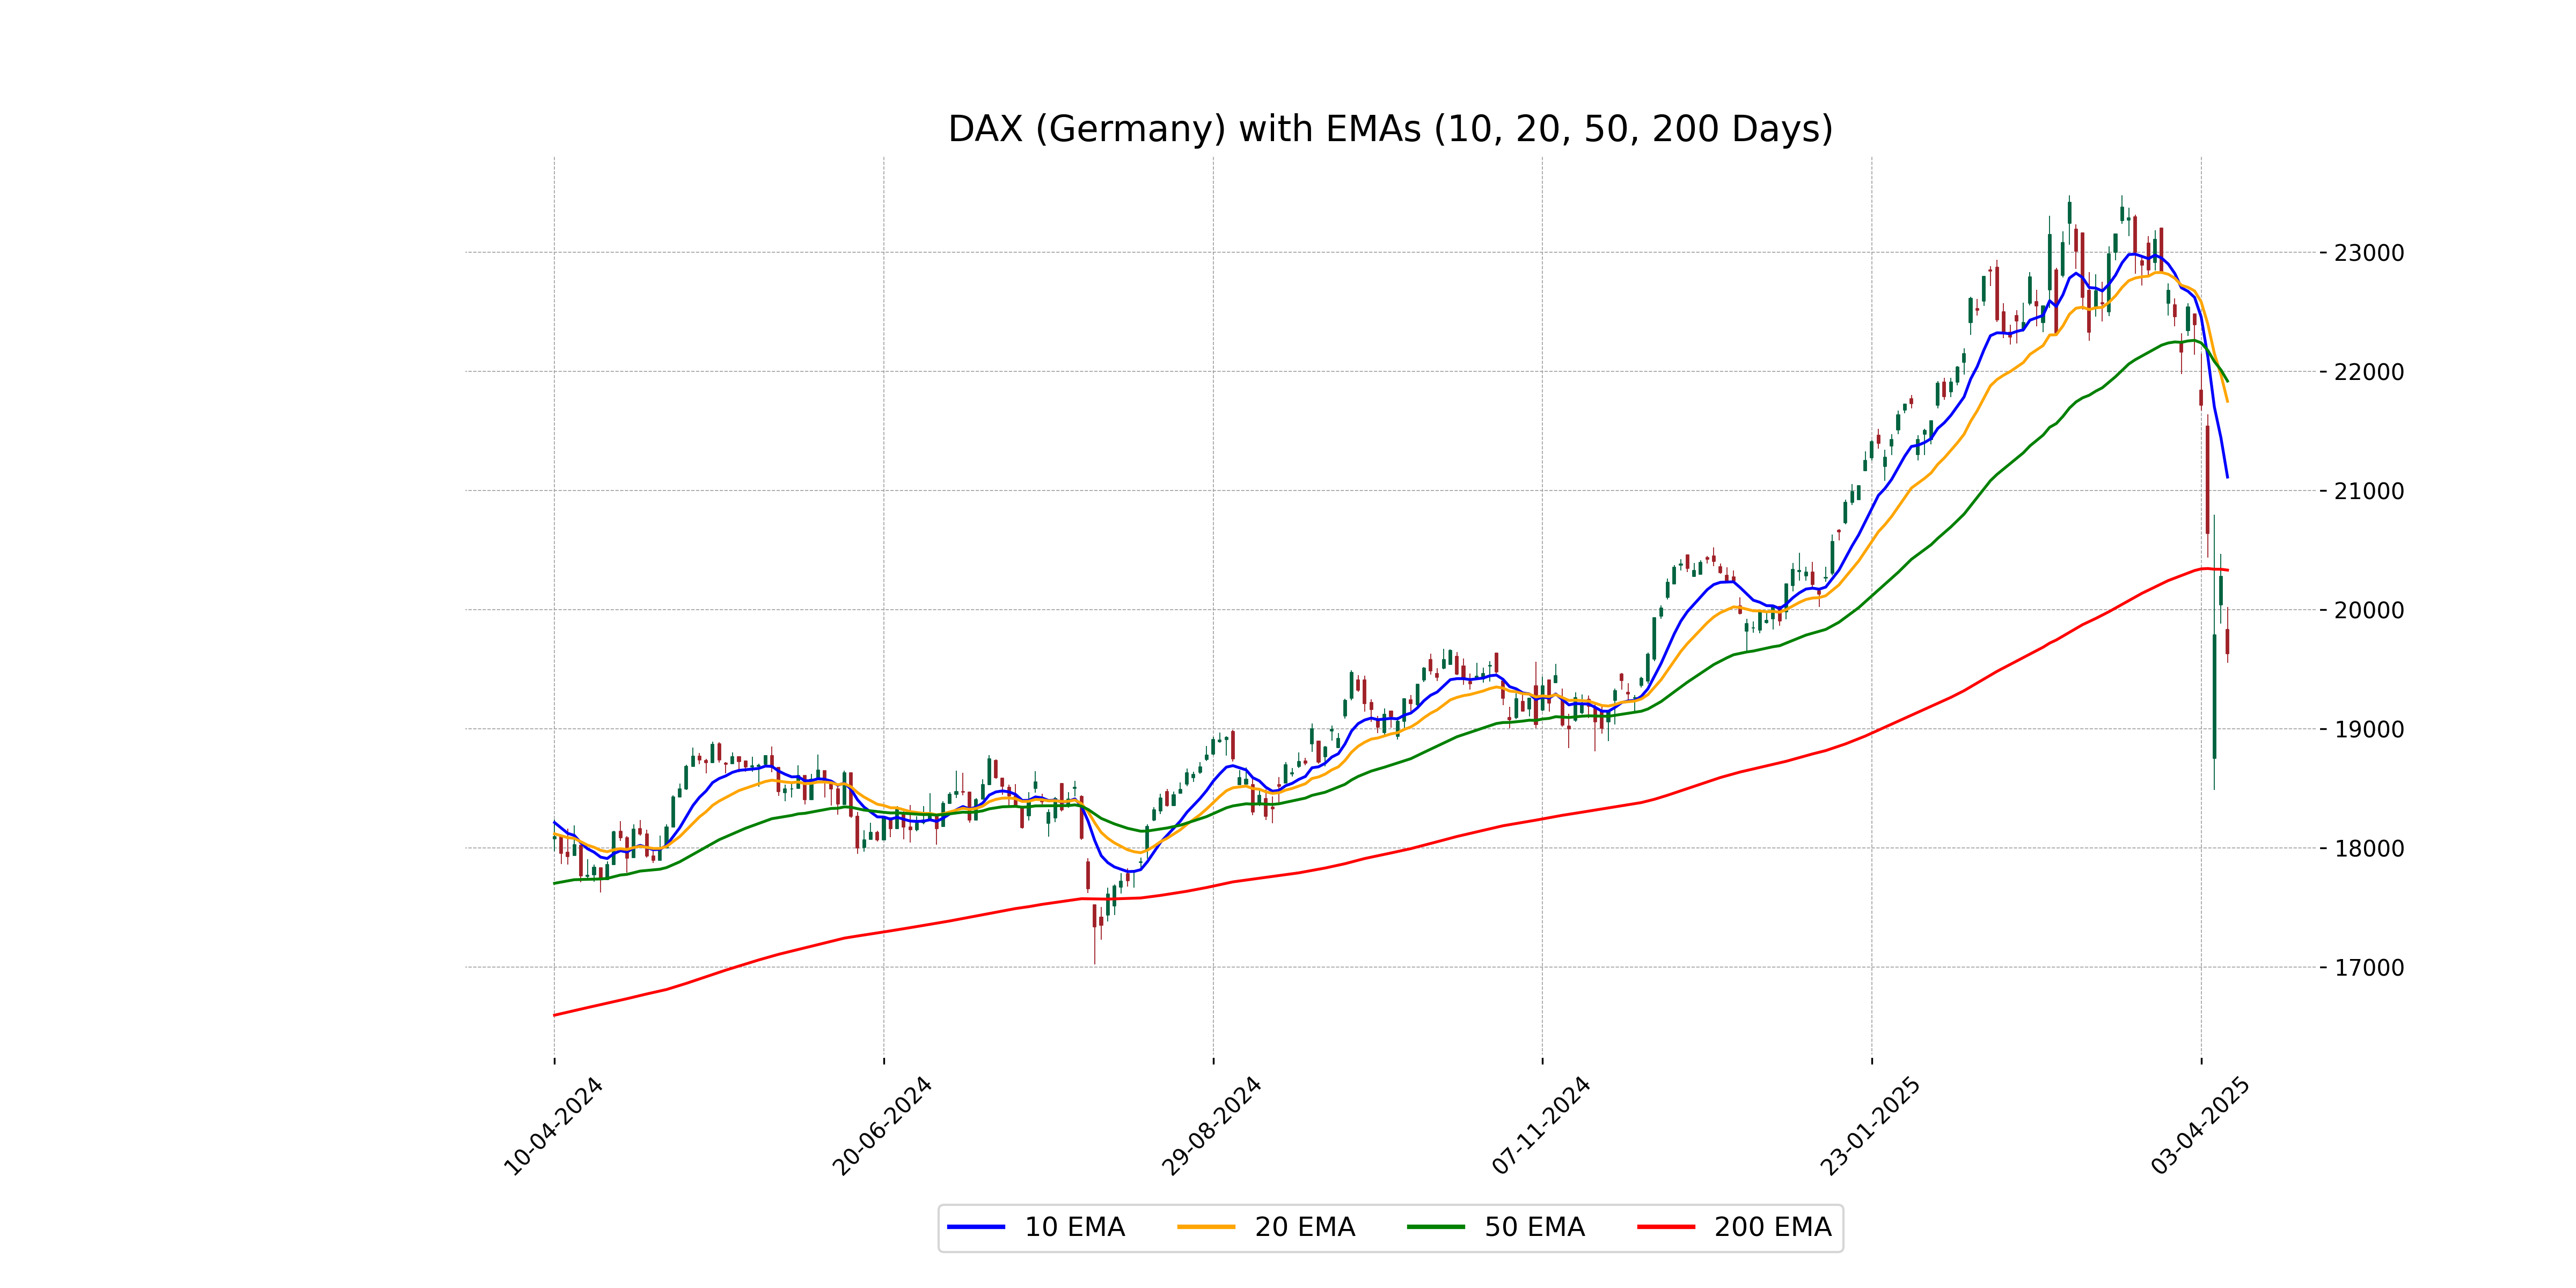
Relationship with Key Moving Averages
The DAX is trading below several key moving averages, with its current close of 19,630.41 significantly below the 50-day EMA of 21,919.46, 200-day EMA of 20,333.08, 10-day EMA of 21,113.83, and 20-day EMA of 21,749.65. This indicates a bearish momentum in its market trend.
Moving Averages Trend (MACD)
The MACD for DAX (Germany) indicates bearish momentum as the MACD line is at -599.46, significantly below the MACD signal line at -226.05. This suggests a strong downward trend in the stock price currently.
RSI Analysis
The RSI for DAX (Germany) stands at 27.84, indicating that the stock is currently in the oversold territory. This suggests that a potential reversal or upward correction could be considered by market participants due to the high selling pressure.
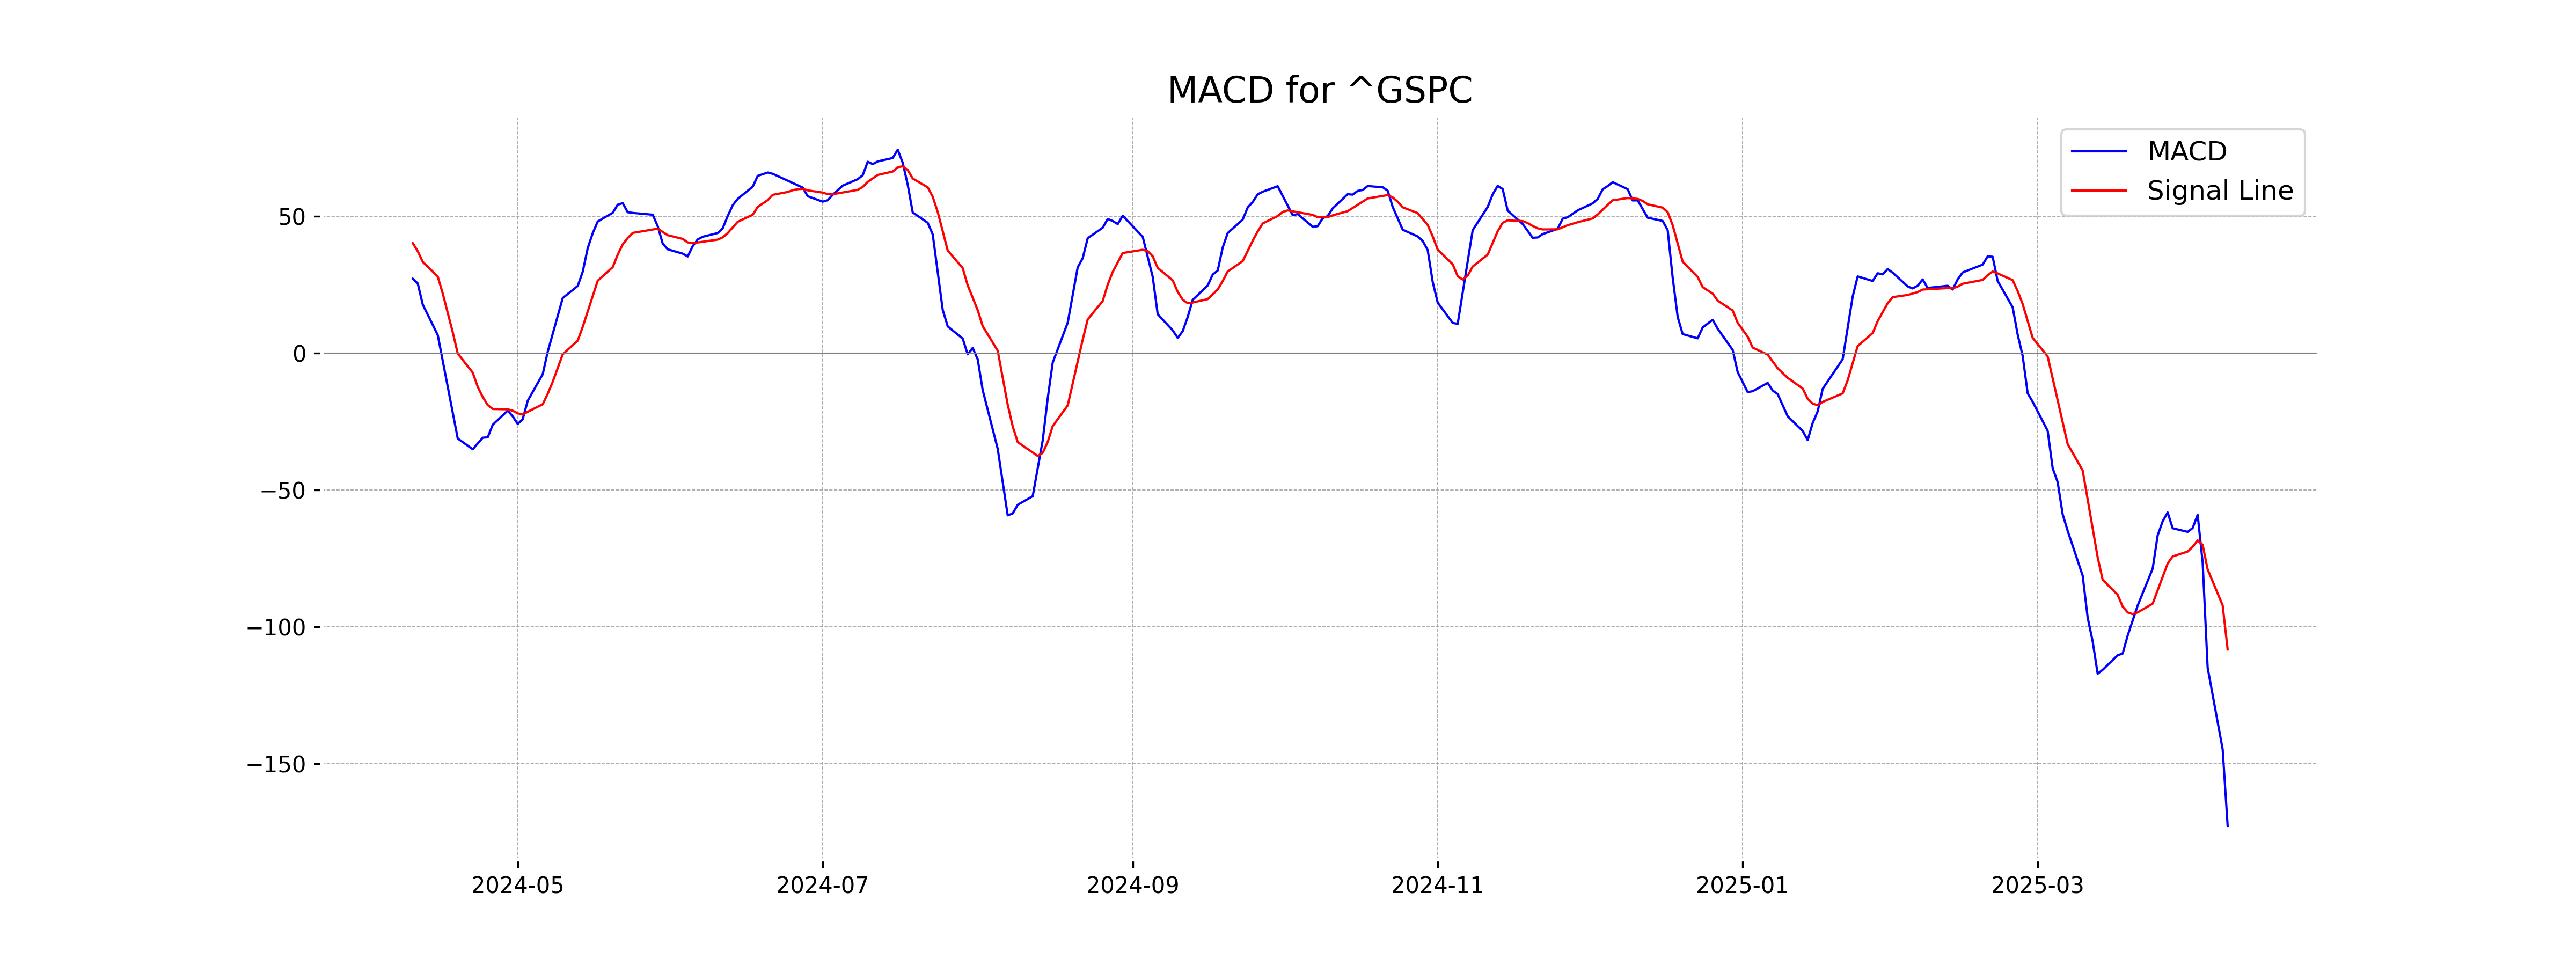
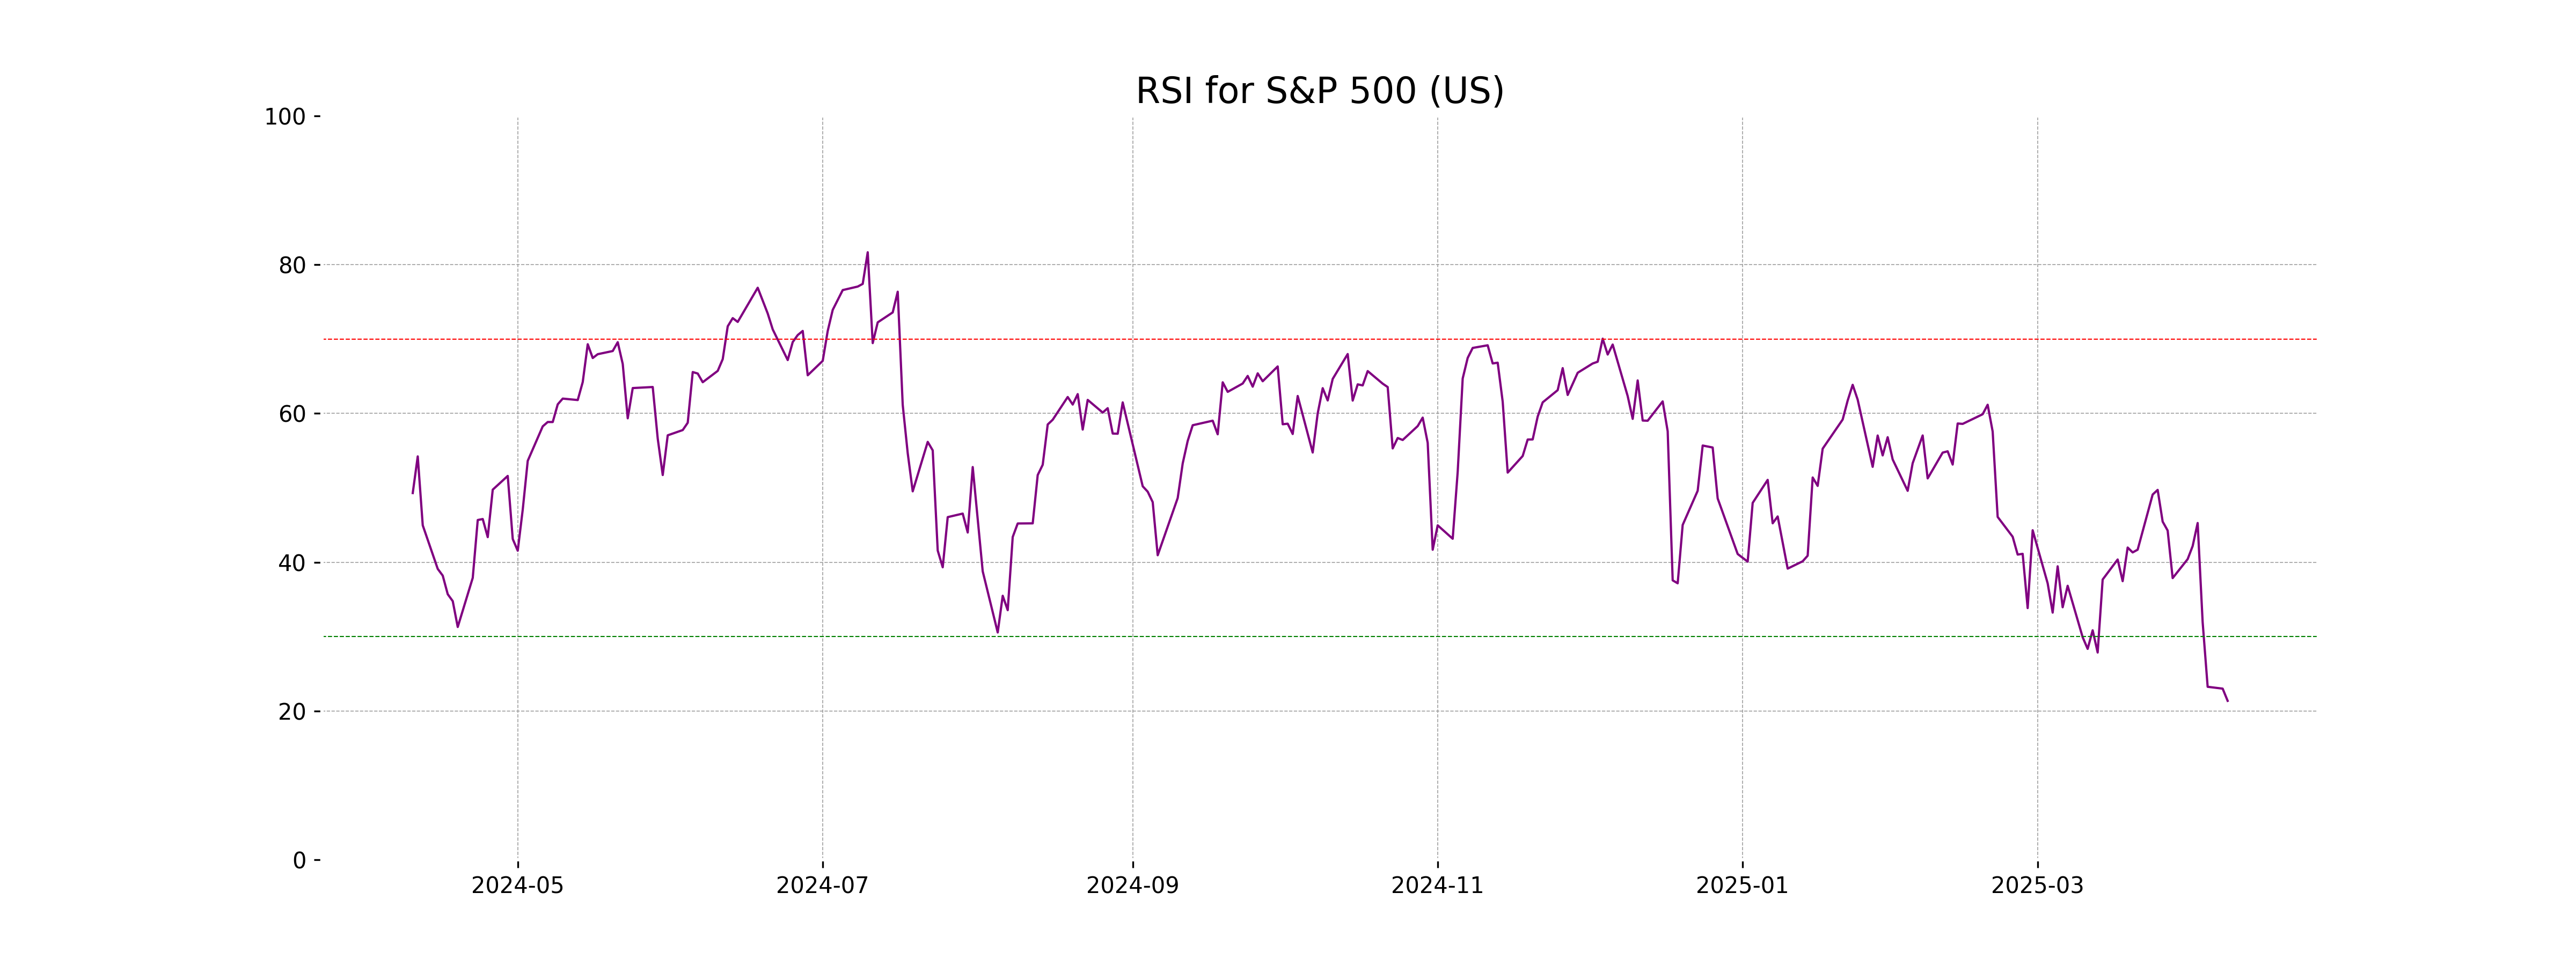
Analysis for S&P 500 (US) - April 09, 2025

S&P 500 (US) Performance Description: The S&P 500 opened at 5193.57, reaching a high of 5267.47 and a low of 4910.42, ultimately closing at 4982.77. This represents a decrease of approximately 1.57% or 79.48 points from the previous close of 5062.25. The RSI stands at a low level of 21.36, indicating potential oversold conditions, accompanied by a negative MACD of -172.82, which suggests bearish momentum.
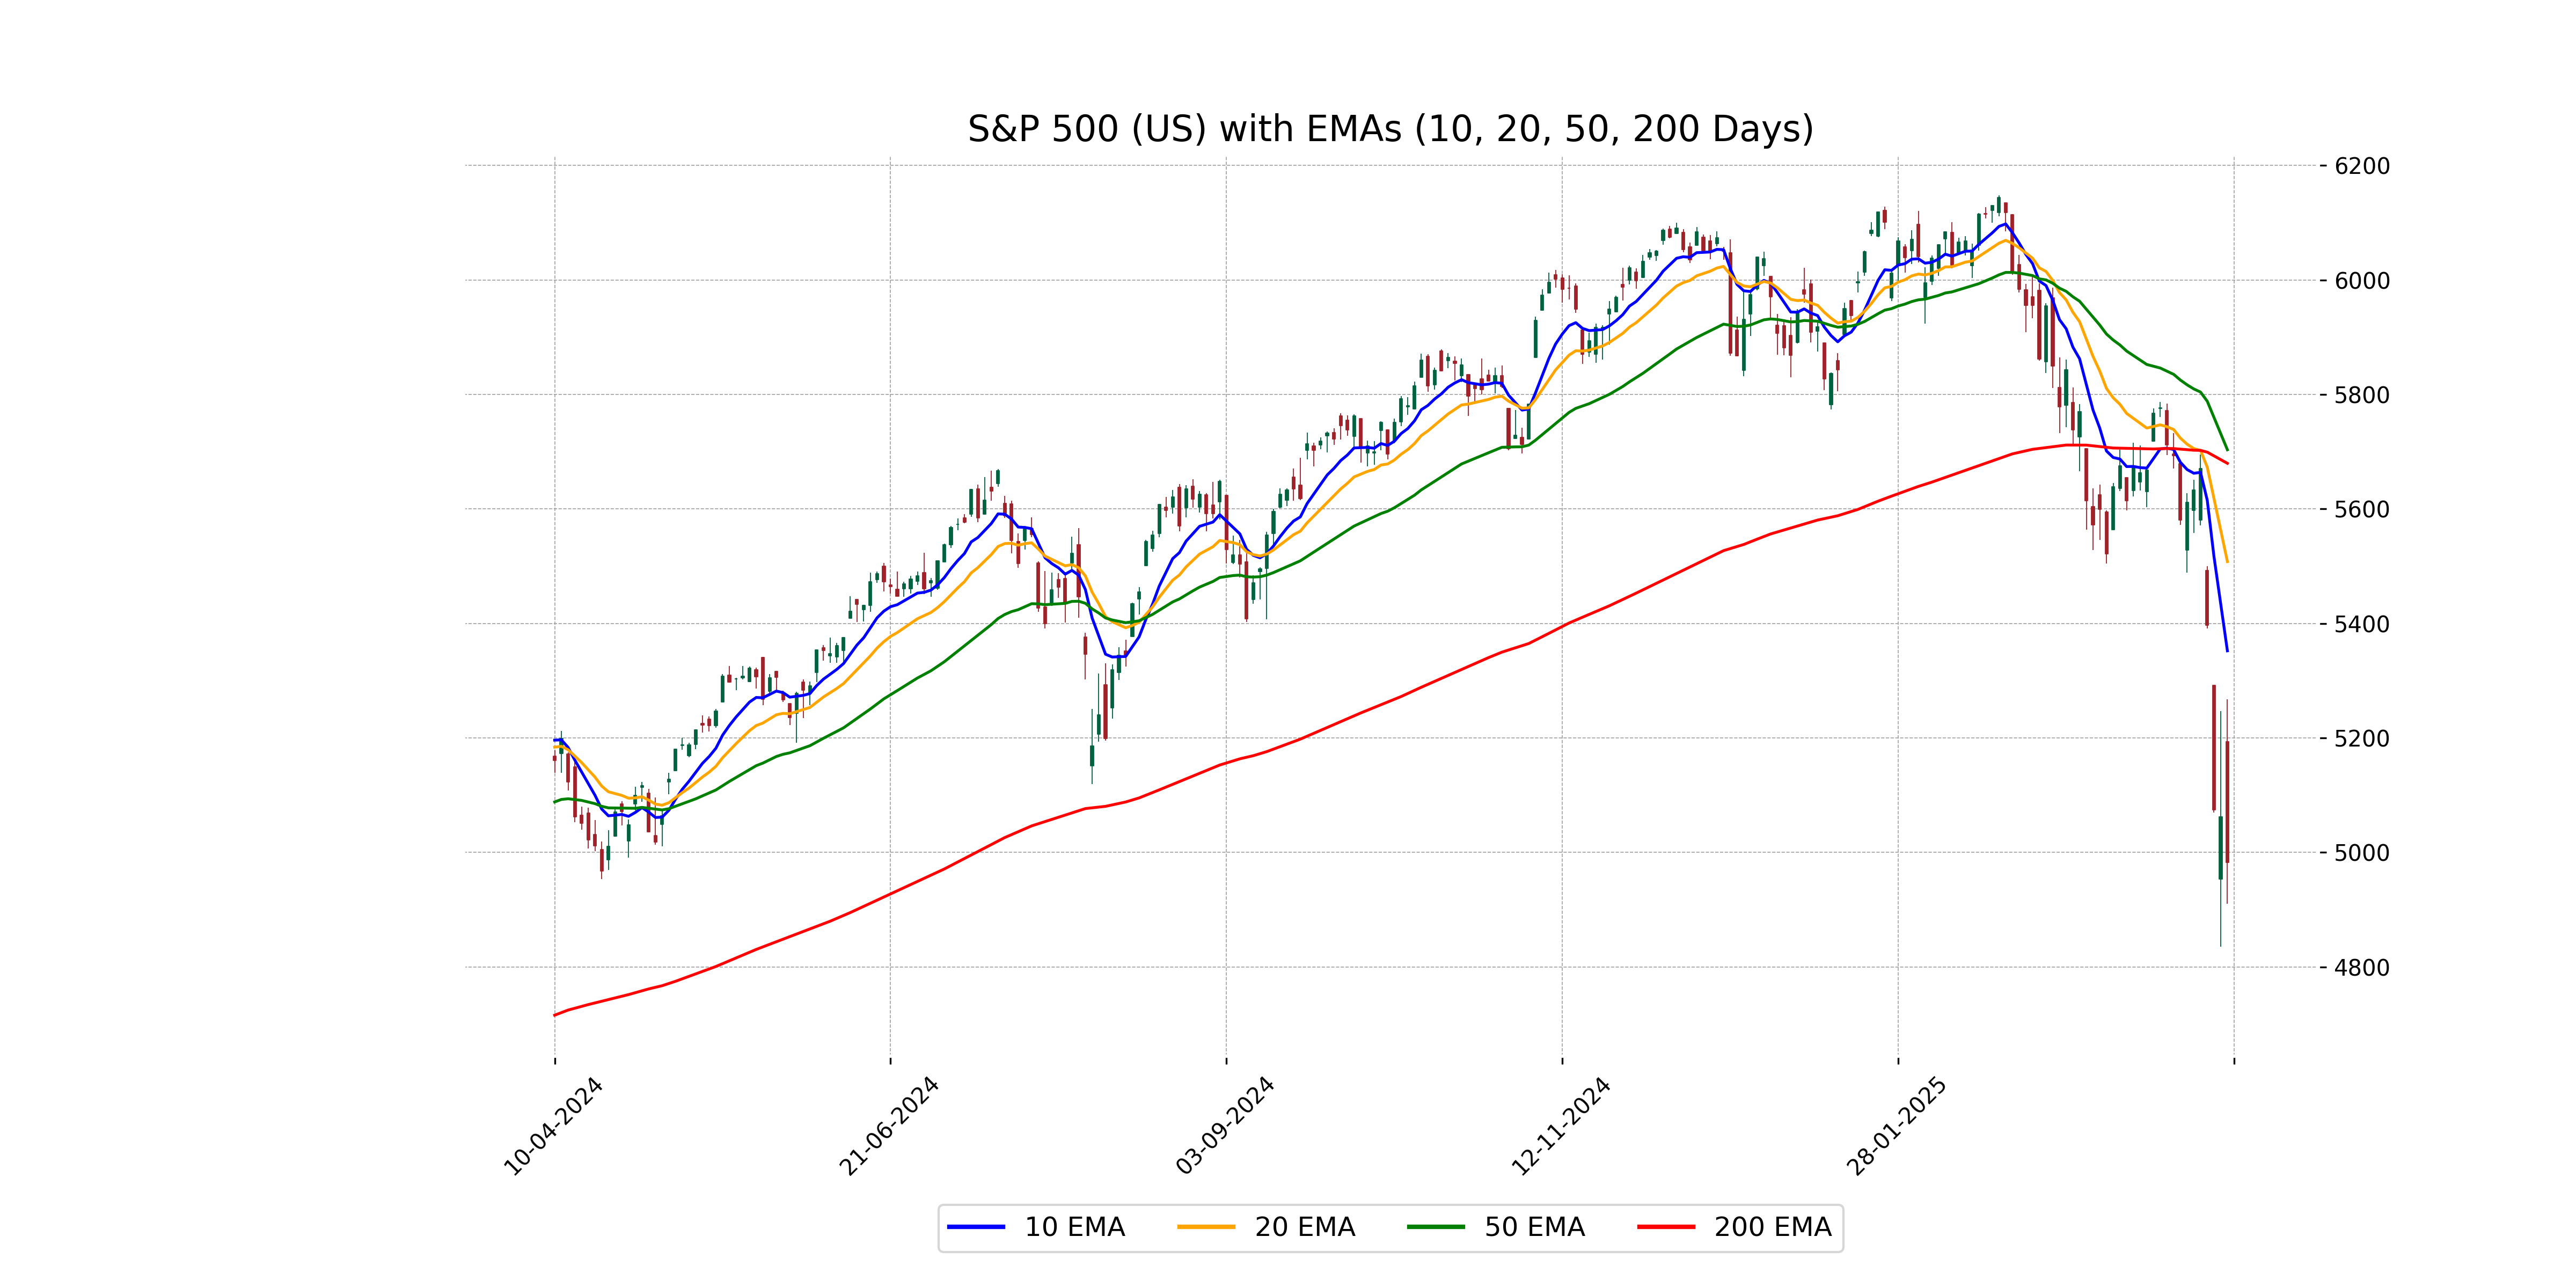
Relationship with Key Moving Averages
The S&P 500 (US) has closed at 4982.77, which is significantly below its 50-day EMA (5703.38), 200-day EMA (5679.68), 20-day EMA (5508.01), and 10-day EMA (5352.14), indicating a bearish trend. Additionally, the RSI of 21.36 signifies that the index is in an oversold condition.
Moving Averages Trend (MACD)
MACD Analysis for S&P 500 (US): The MACD value is negative at -172.82, indicating a potential bearish trend. The MACD is also below its Signal line (-108.32), which may suggest continued downward momentum.
RSI Analysis
The Relative Strength Index (RSI) for S&P 500 (US) is 21.36, which indicates that the index is in oversold territory. This suggests that the stock may be experiencing significant selling pressure and could potentially be undervalued at this point, reflecting a possible buying opportunity.
Analysis for Hang Seng Index (Hong Kong) - April 09, 2025

Hang Seng Index (Hong Kong) opened at 19,494.92 and closed at 20,264.49, showing a positive change of 0.68% with an increase of 136.81 points. The index recorded a high of 20,441.14 and low of 19,260.21. The RSI indicator at 28.76 suggests it might be oversold, while the negative MACD of -559.83 indicates a bearish trend.
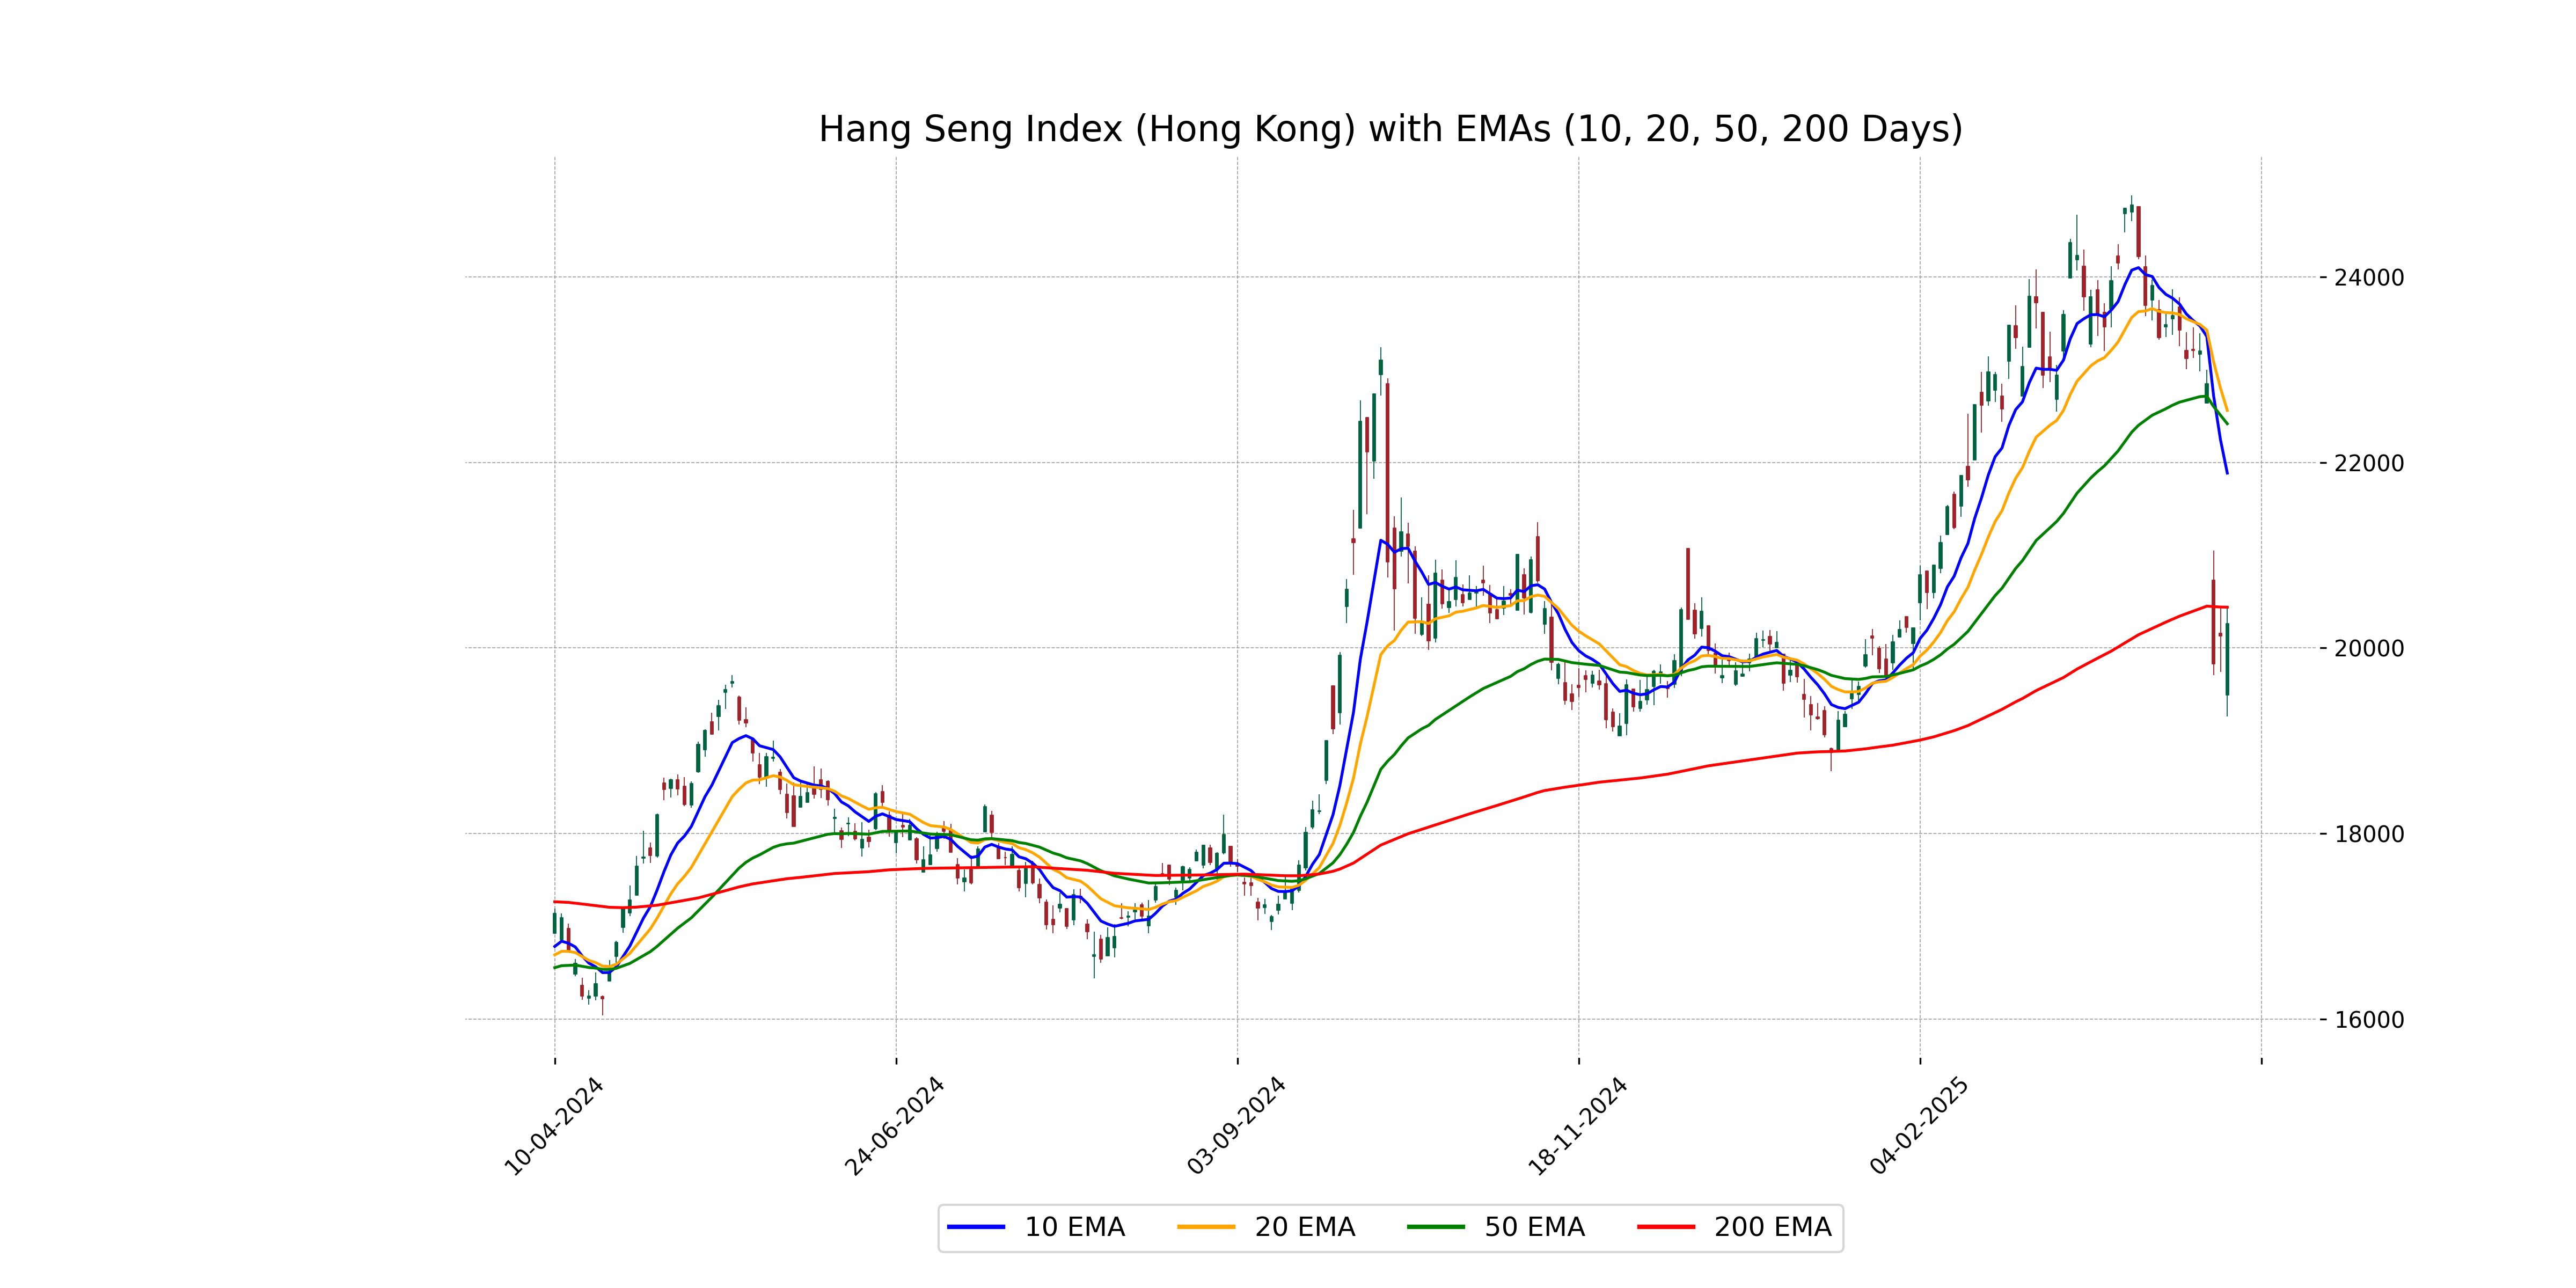
Relationship with Key Moving Averages
The Hang Seng Index's current closing price of 20,264.49 is below all key moving averages, namely the 50-day EMA (22,415.81), 200-day EMA (20,439.61), 10-day EMA (21,884.42), and 20-day EMA (22,559.28). This suggests a bearish trend, potentially indicating downward momentum.
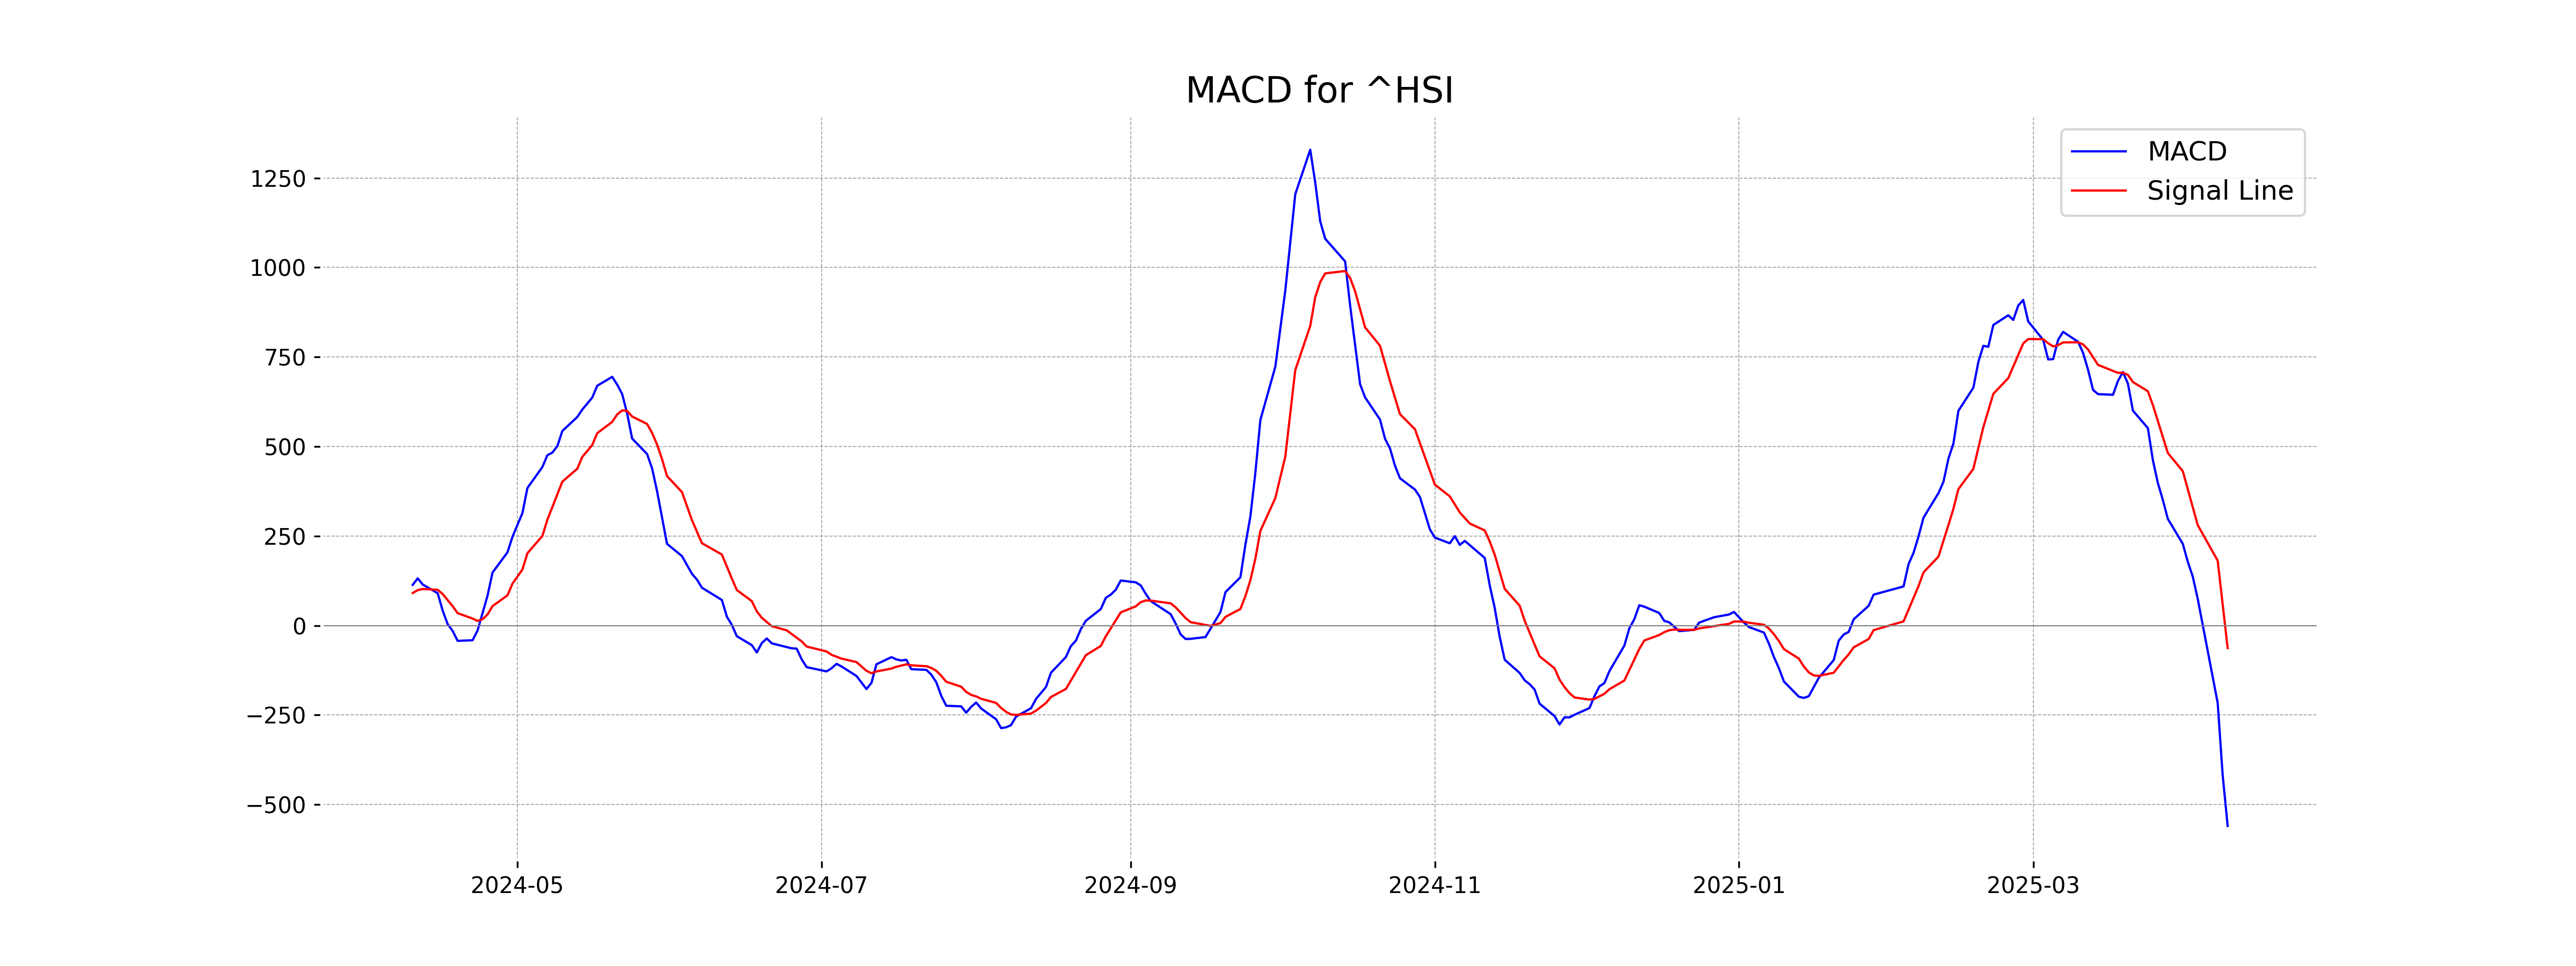
Moving Averages Trend (MACD)
The MACD for the Hang Seng Index (Hong Kong) is significantly negative at -559.83, with a much lower signal line at -62.98. This indicates a strong bearish momentum, suggesting that the market is under selling pressure.
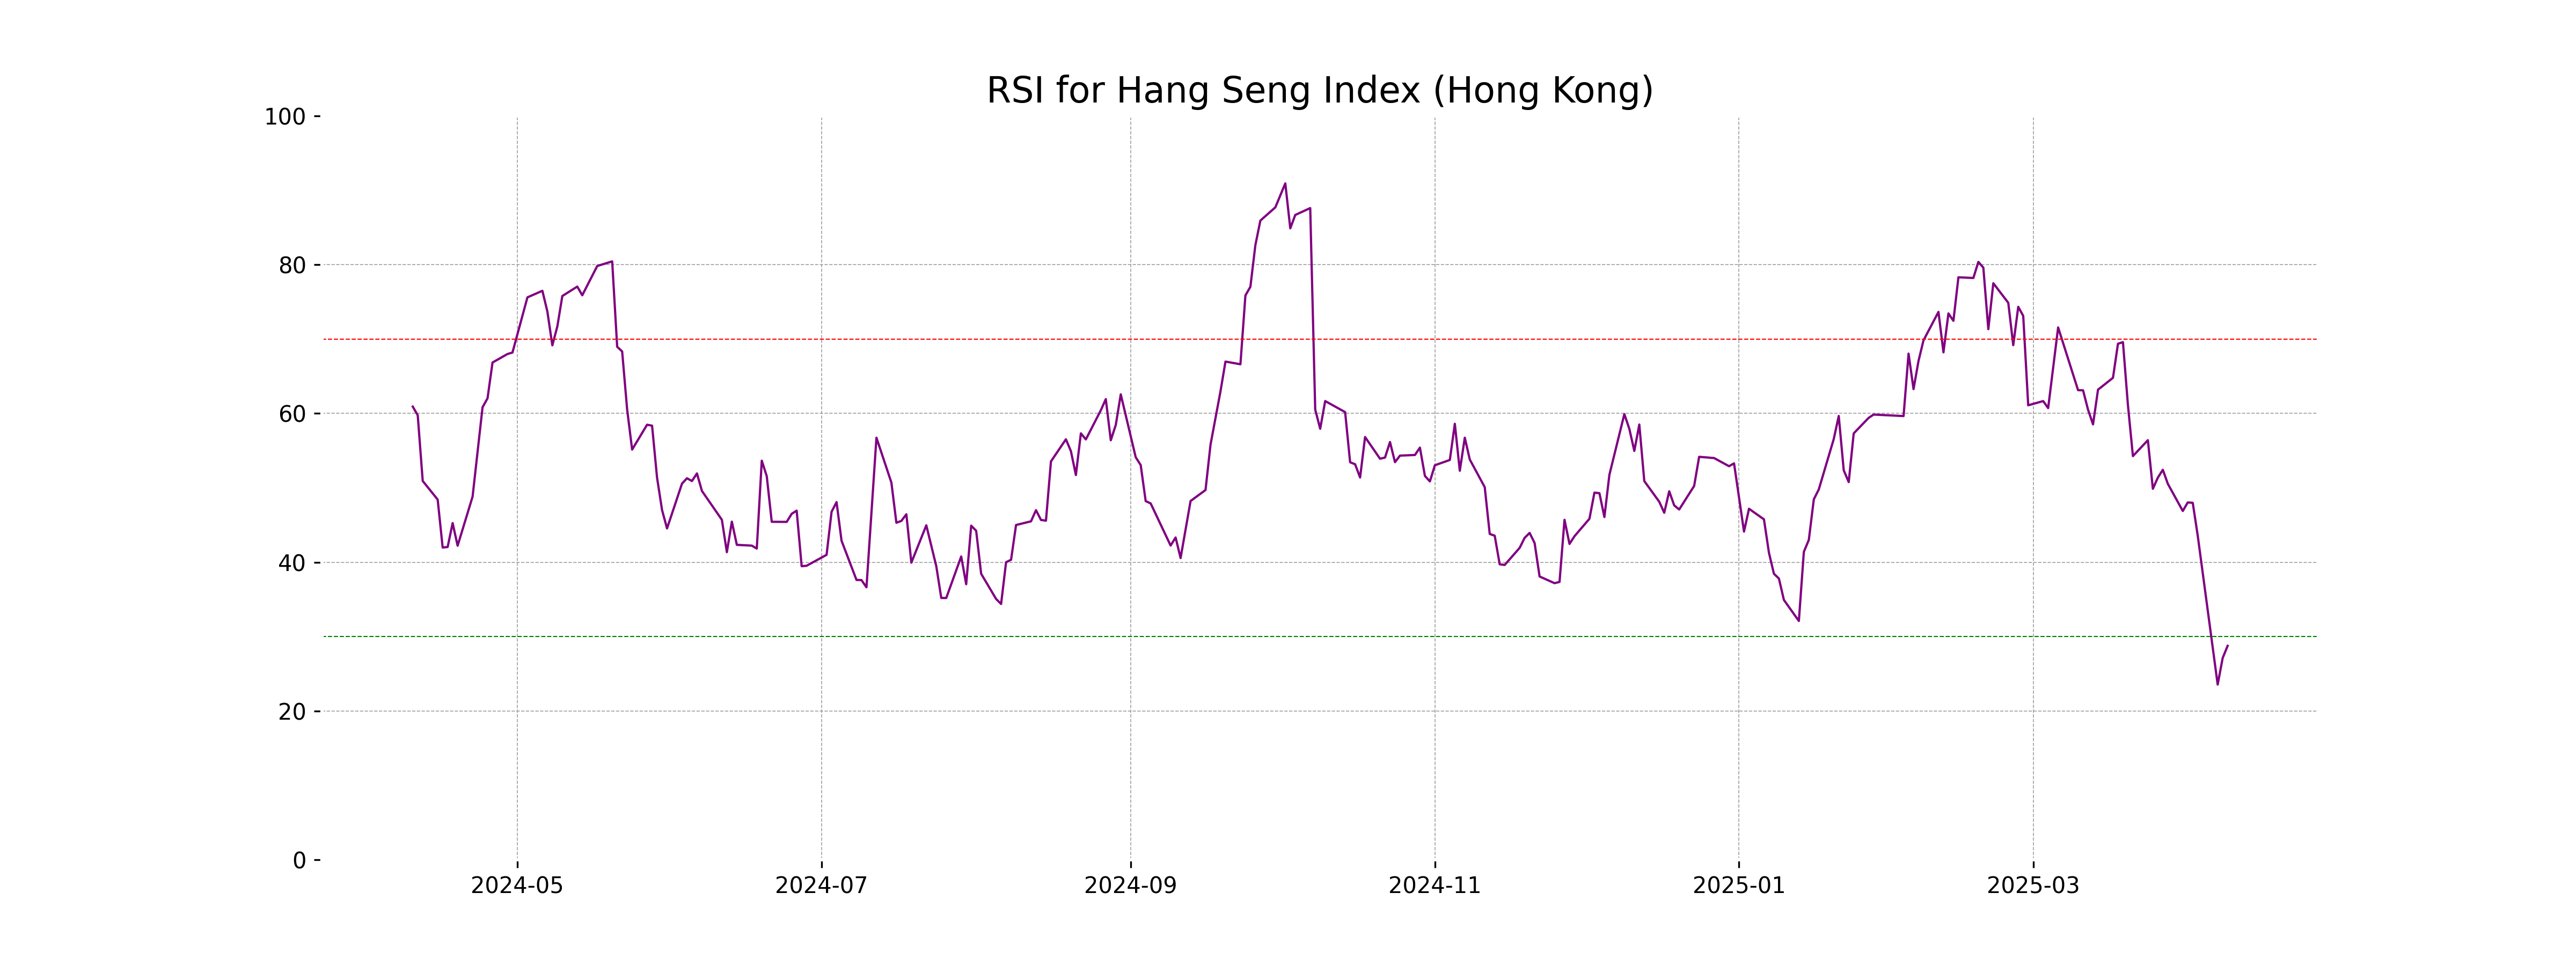
RSI Analysis
The RSI for the Hang Seng Index is 28.76, indicating that it is currently in the oversold territory. This suggests a potential buying opportunity, as the Index's recent sell-off might be overextended.
Analysis for IBEX 35 (Spain) - April 09, 2025

The IBEX 35 index opened at 11,760.90, experienced a high of 11,910.80, and closed at 11,731.70, reflecting a negative change of -2.77% or a points drop of -333.90 from the previous close of 12,065.60. The RSI stands at 28.65, indicating an oversold condition, and the MACD is at -226.48, suggesting bearish momentum.
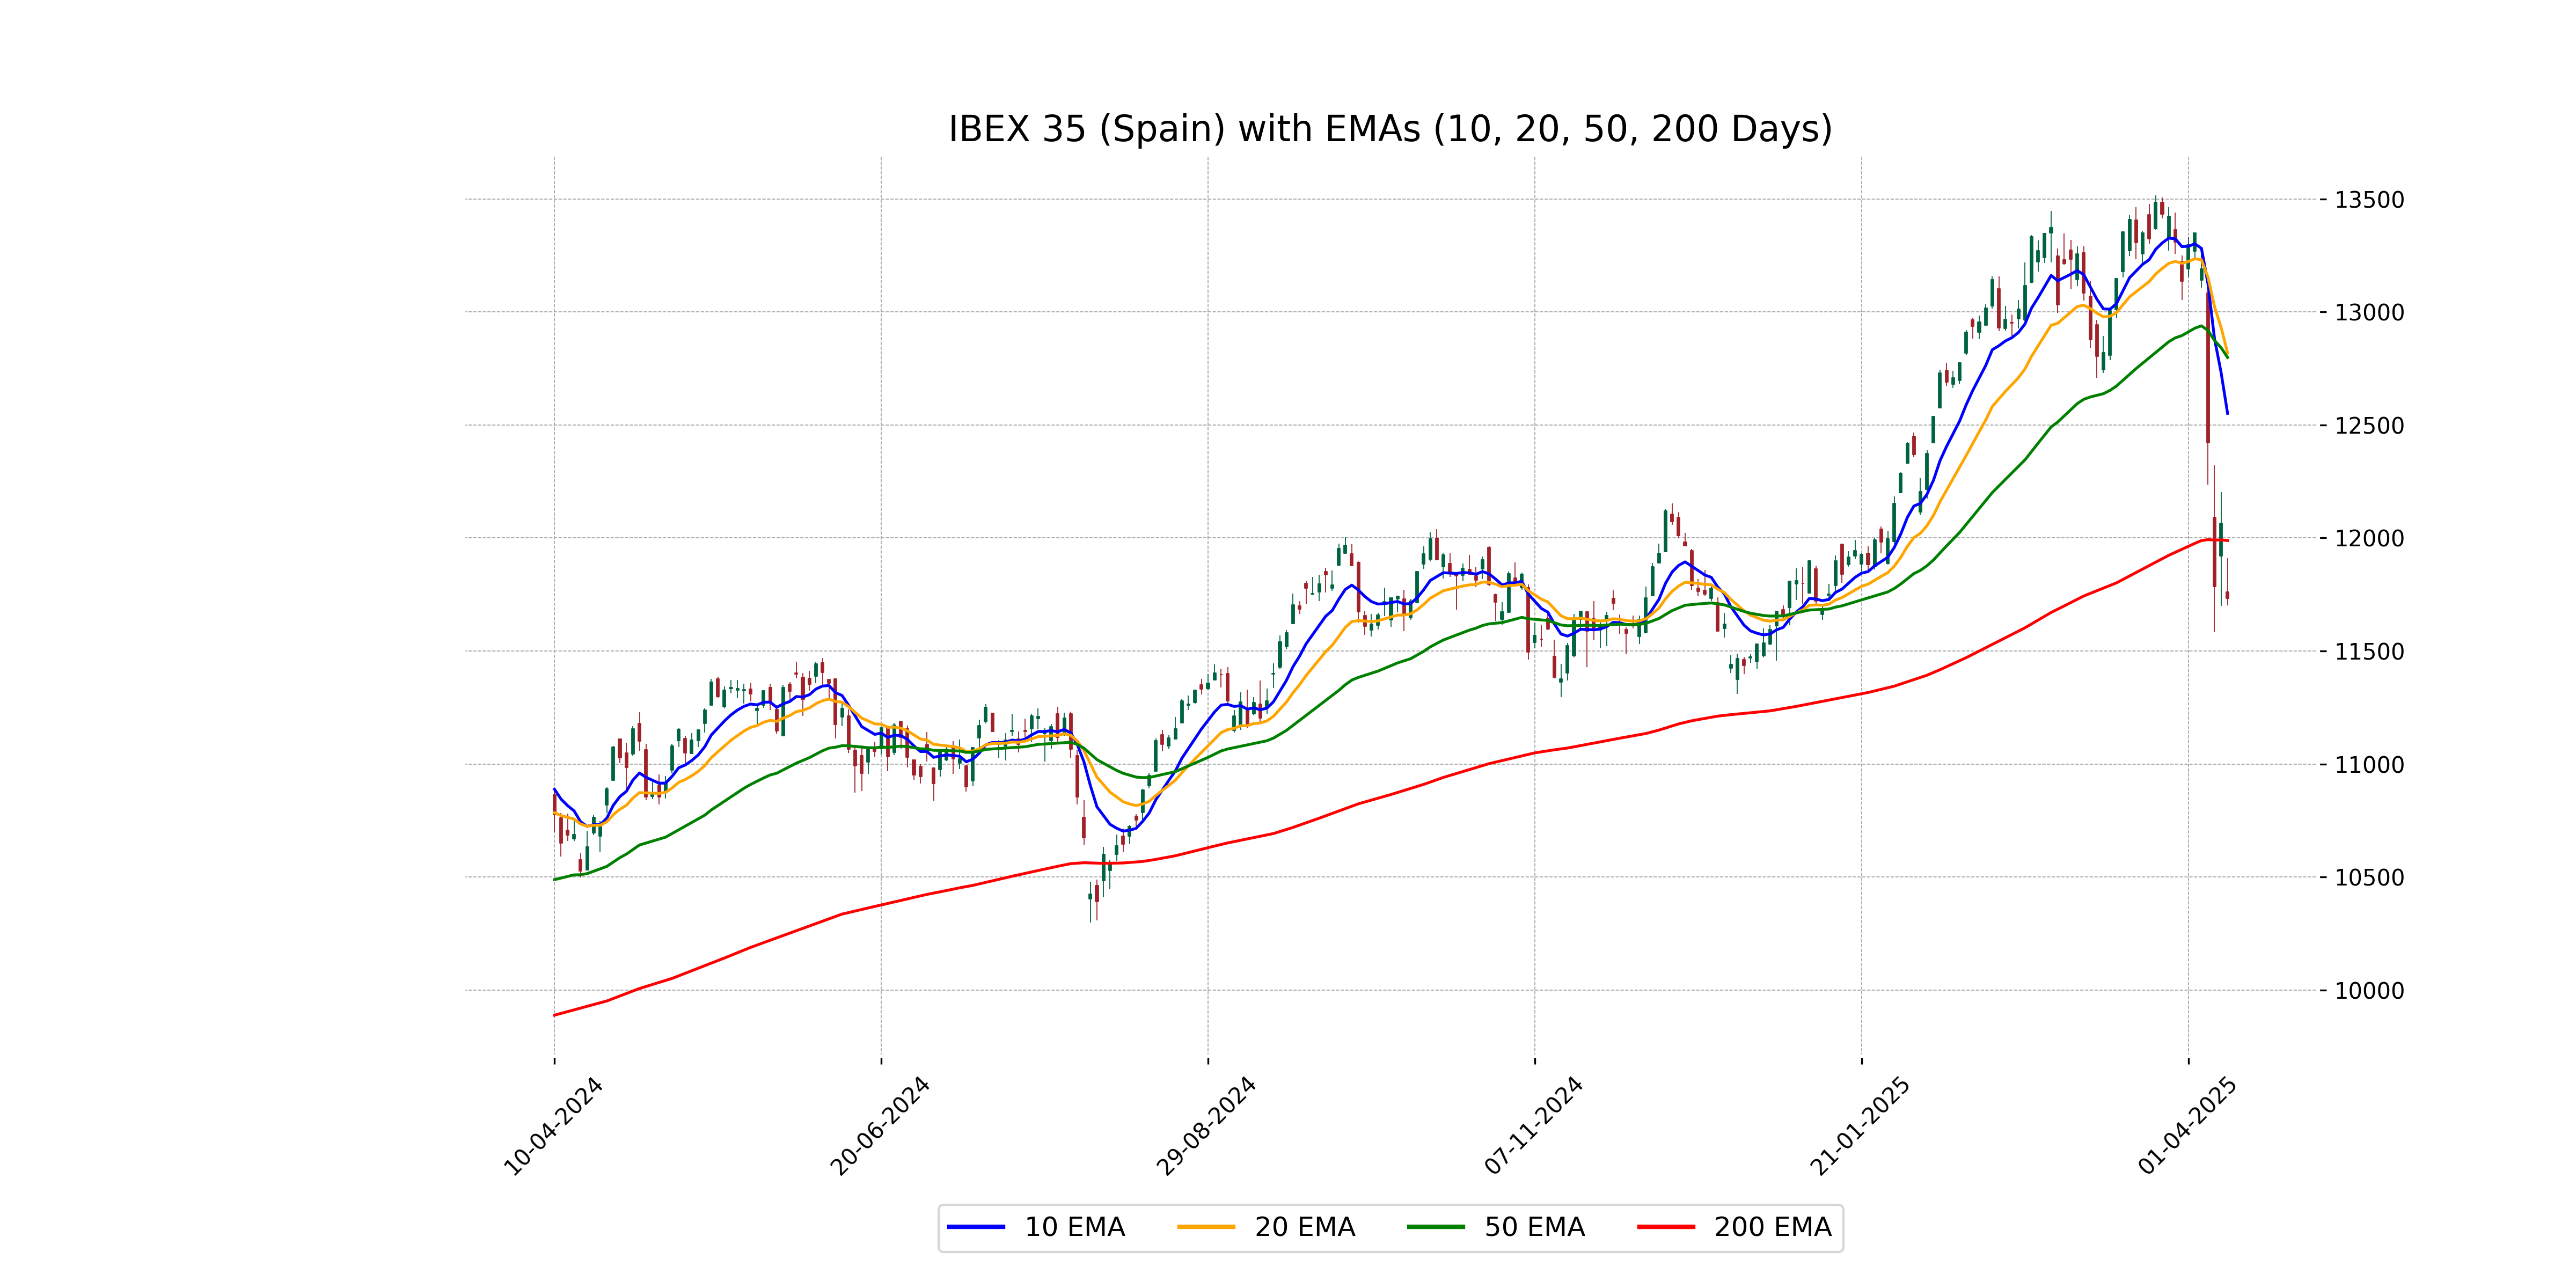
Relationship with Key Moving Averages
The closing price of IBEX 35 at 11,731.70 is below its 50-day EMA of 12,798.71, 200-day EMA of 11,988.87, 10-day EMA of 12,551.19, and 20-day EMA of 12,818.09, indicating a bearish trend as the price is positioned well below these key moving averages.
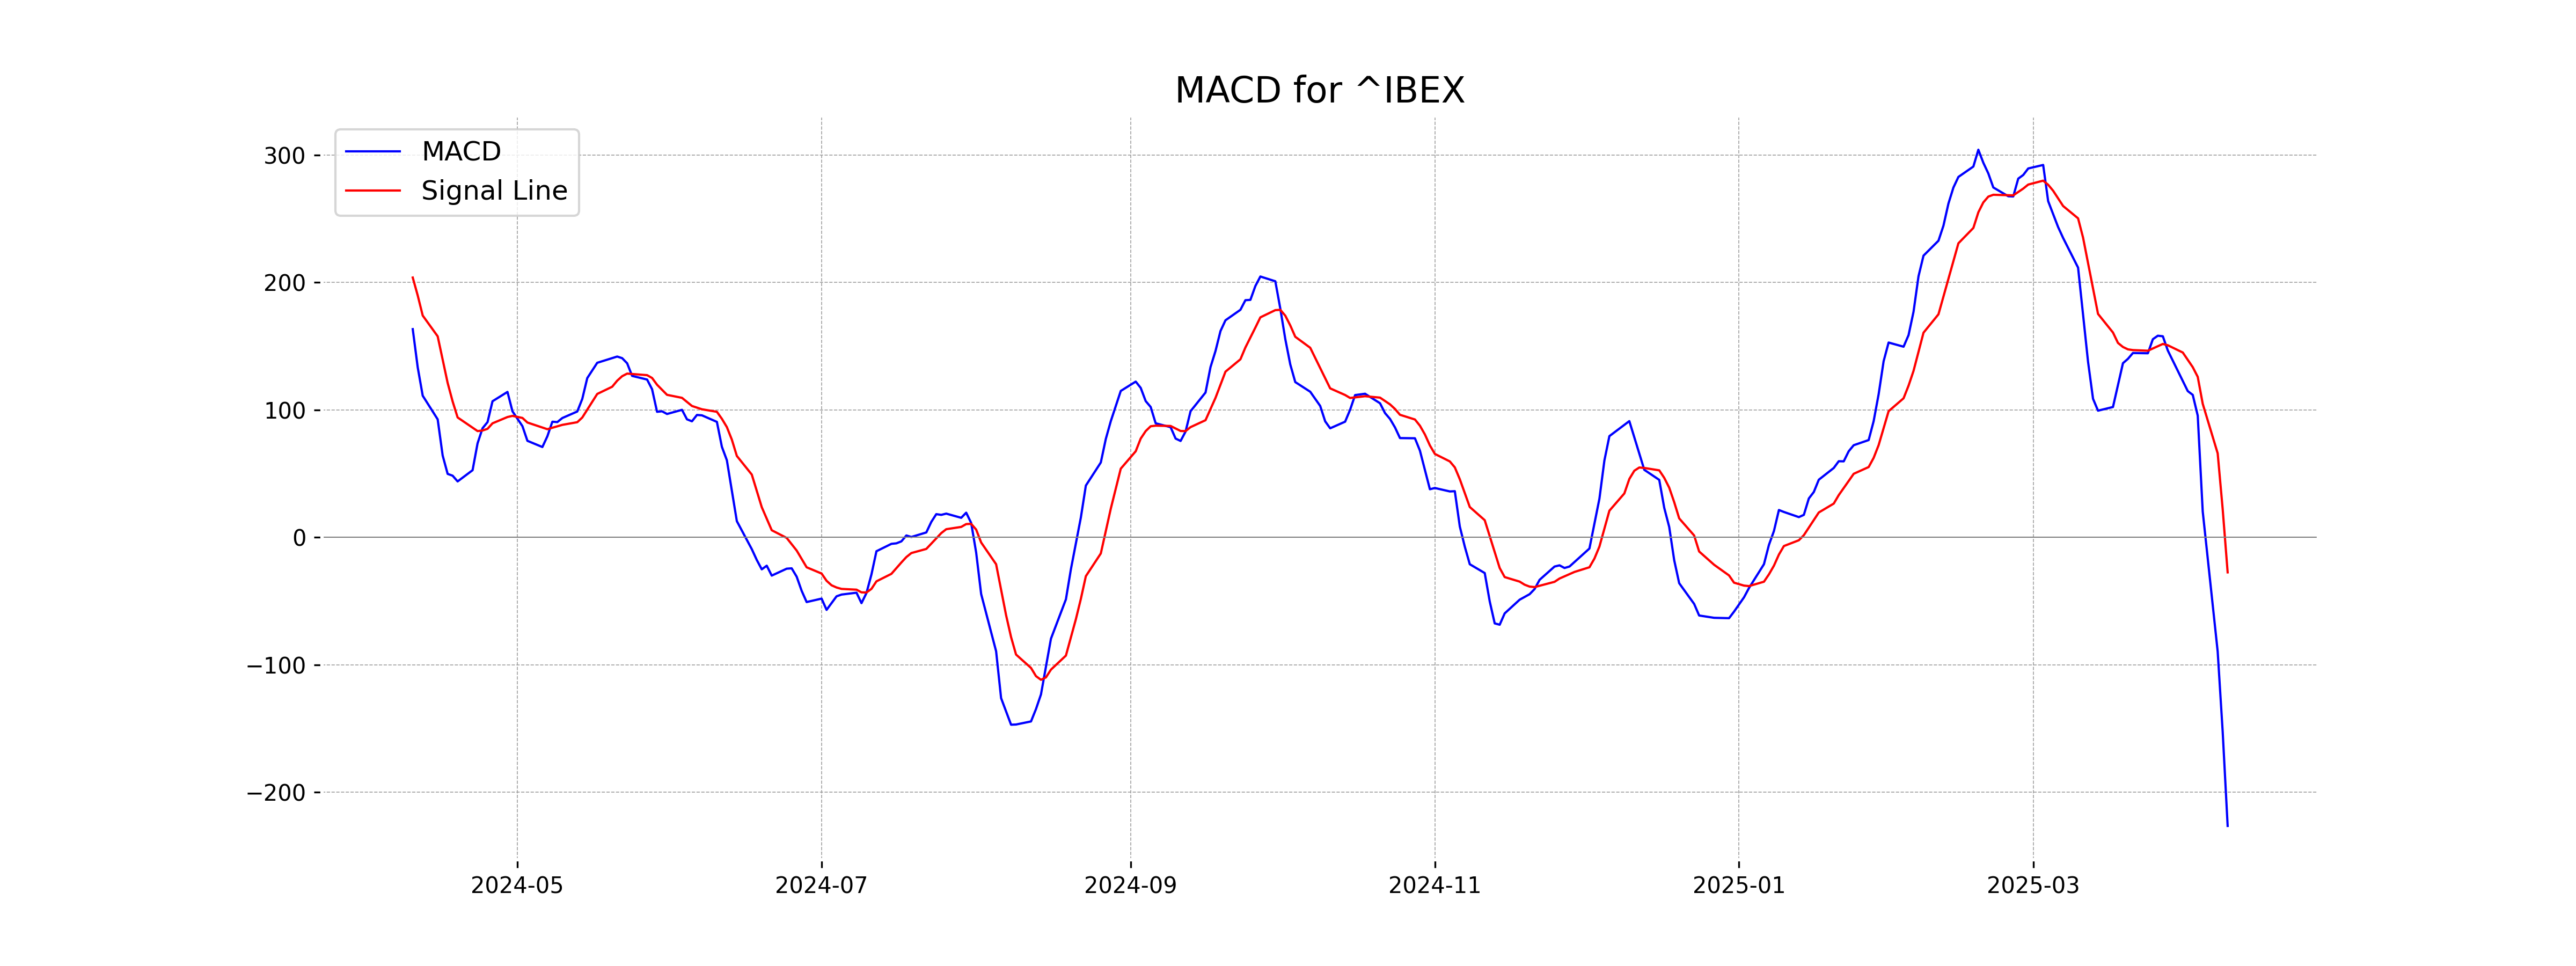
Moving Averages Trend (MACD)
IBEX 35 shows a bearish momentum as the MACD is positioned at -226.48, which is well below the MACD Signal of -27.50. This divergence indicates a strong bearish trend as the MACD line is significantly lower than the signal line.
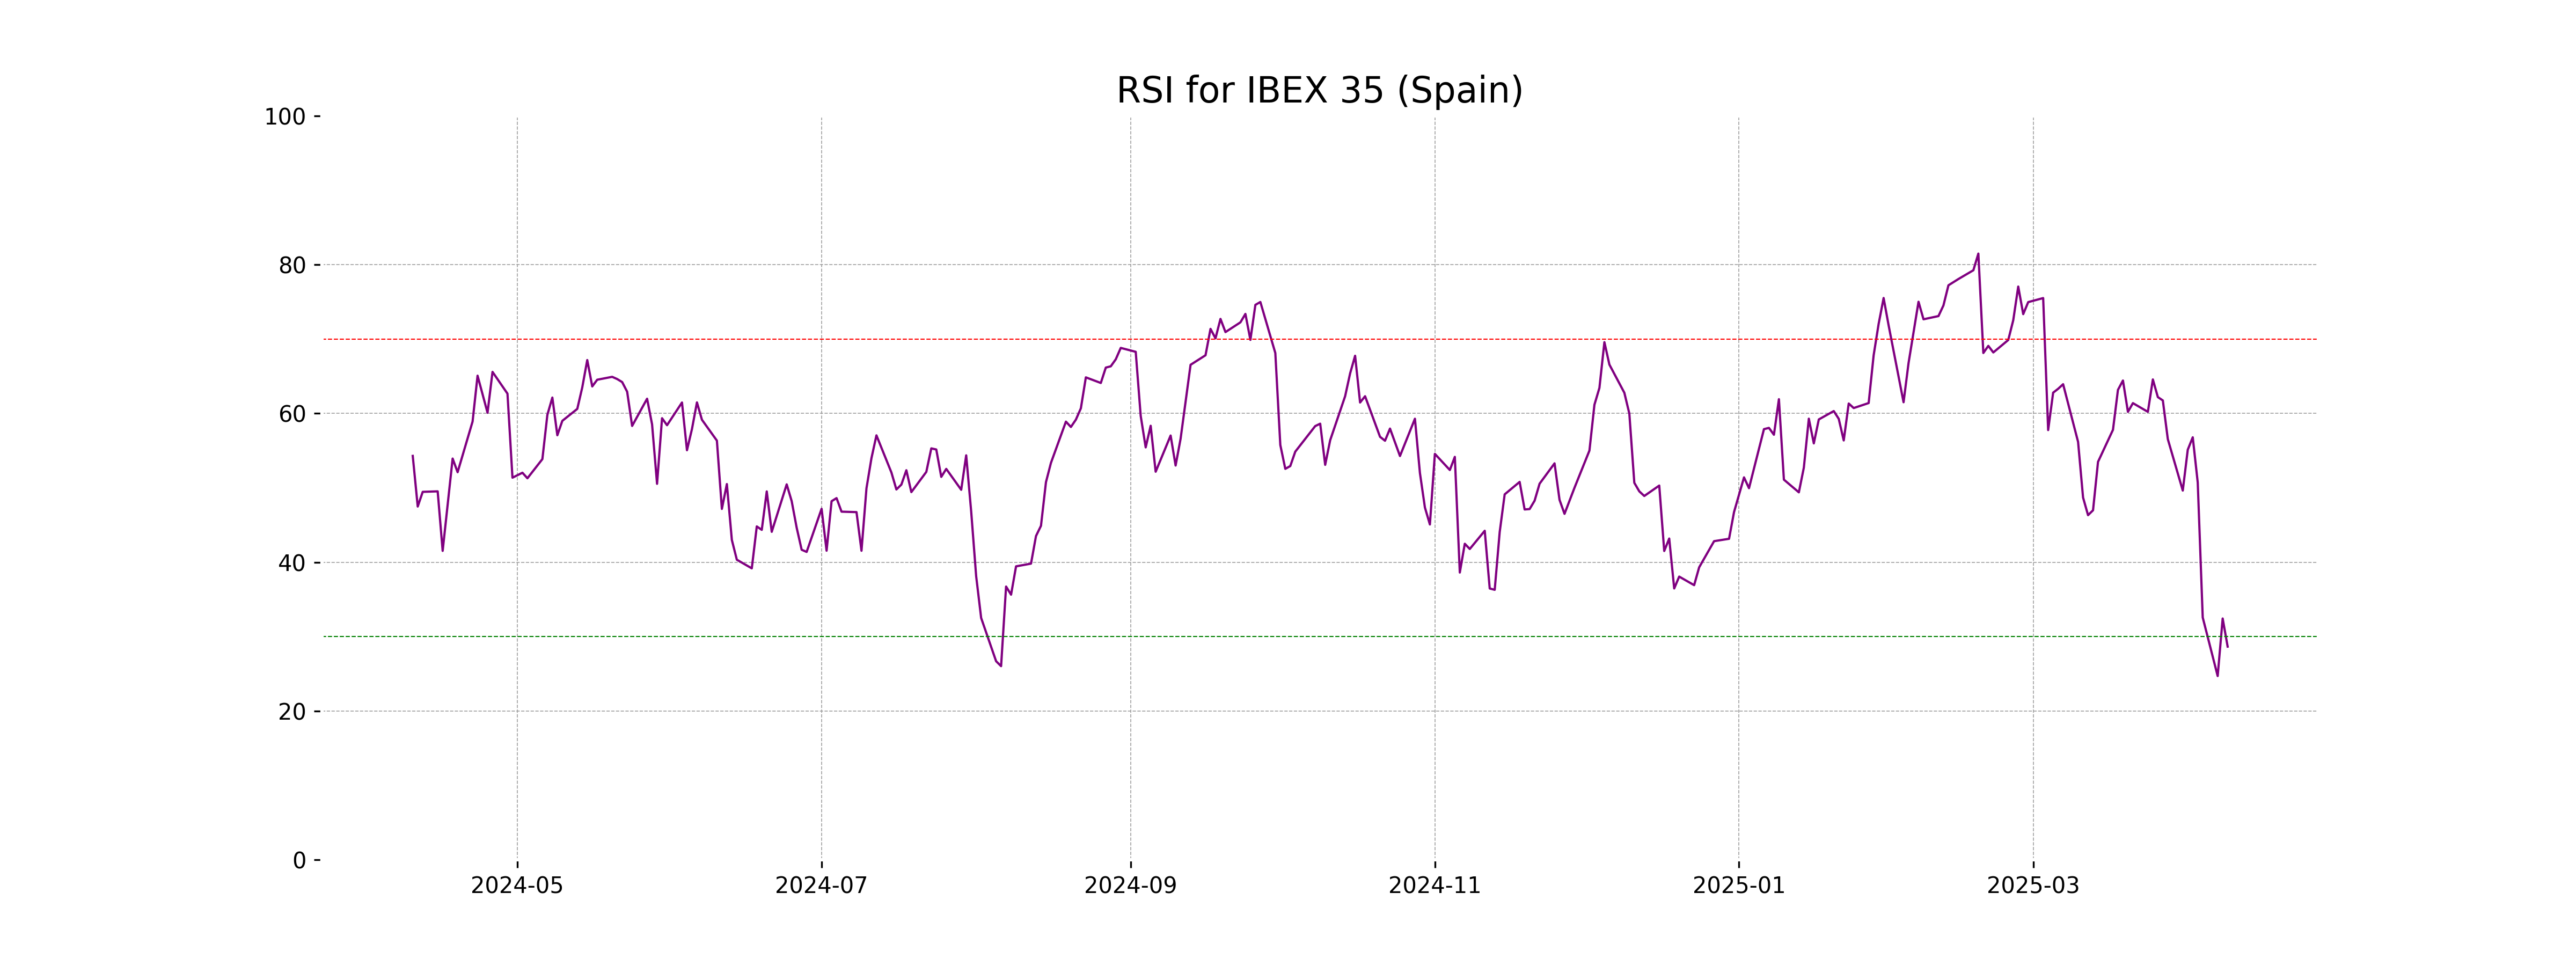
RSI Analysis
The IBEX 35's RSI is at 28.65, which indicates that the index is in the oversold territory. This suggests that the IBEX 35 may be undervalued at the moment and could potentially see a reversal or an upward correction in price if buying pressure increases.
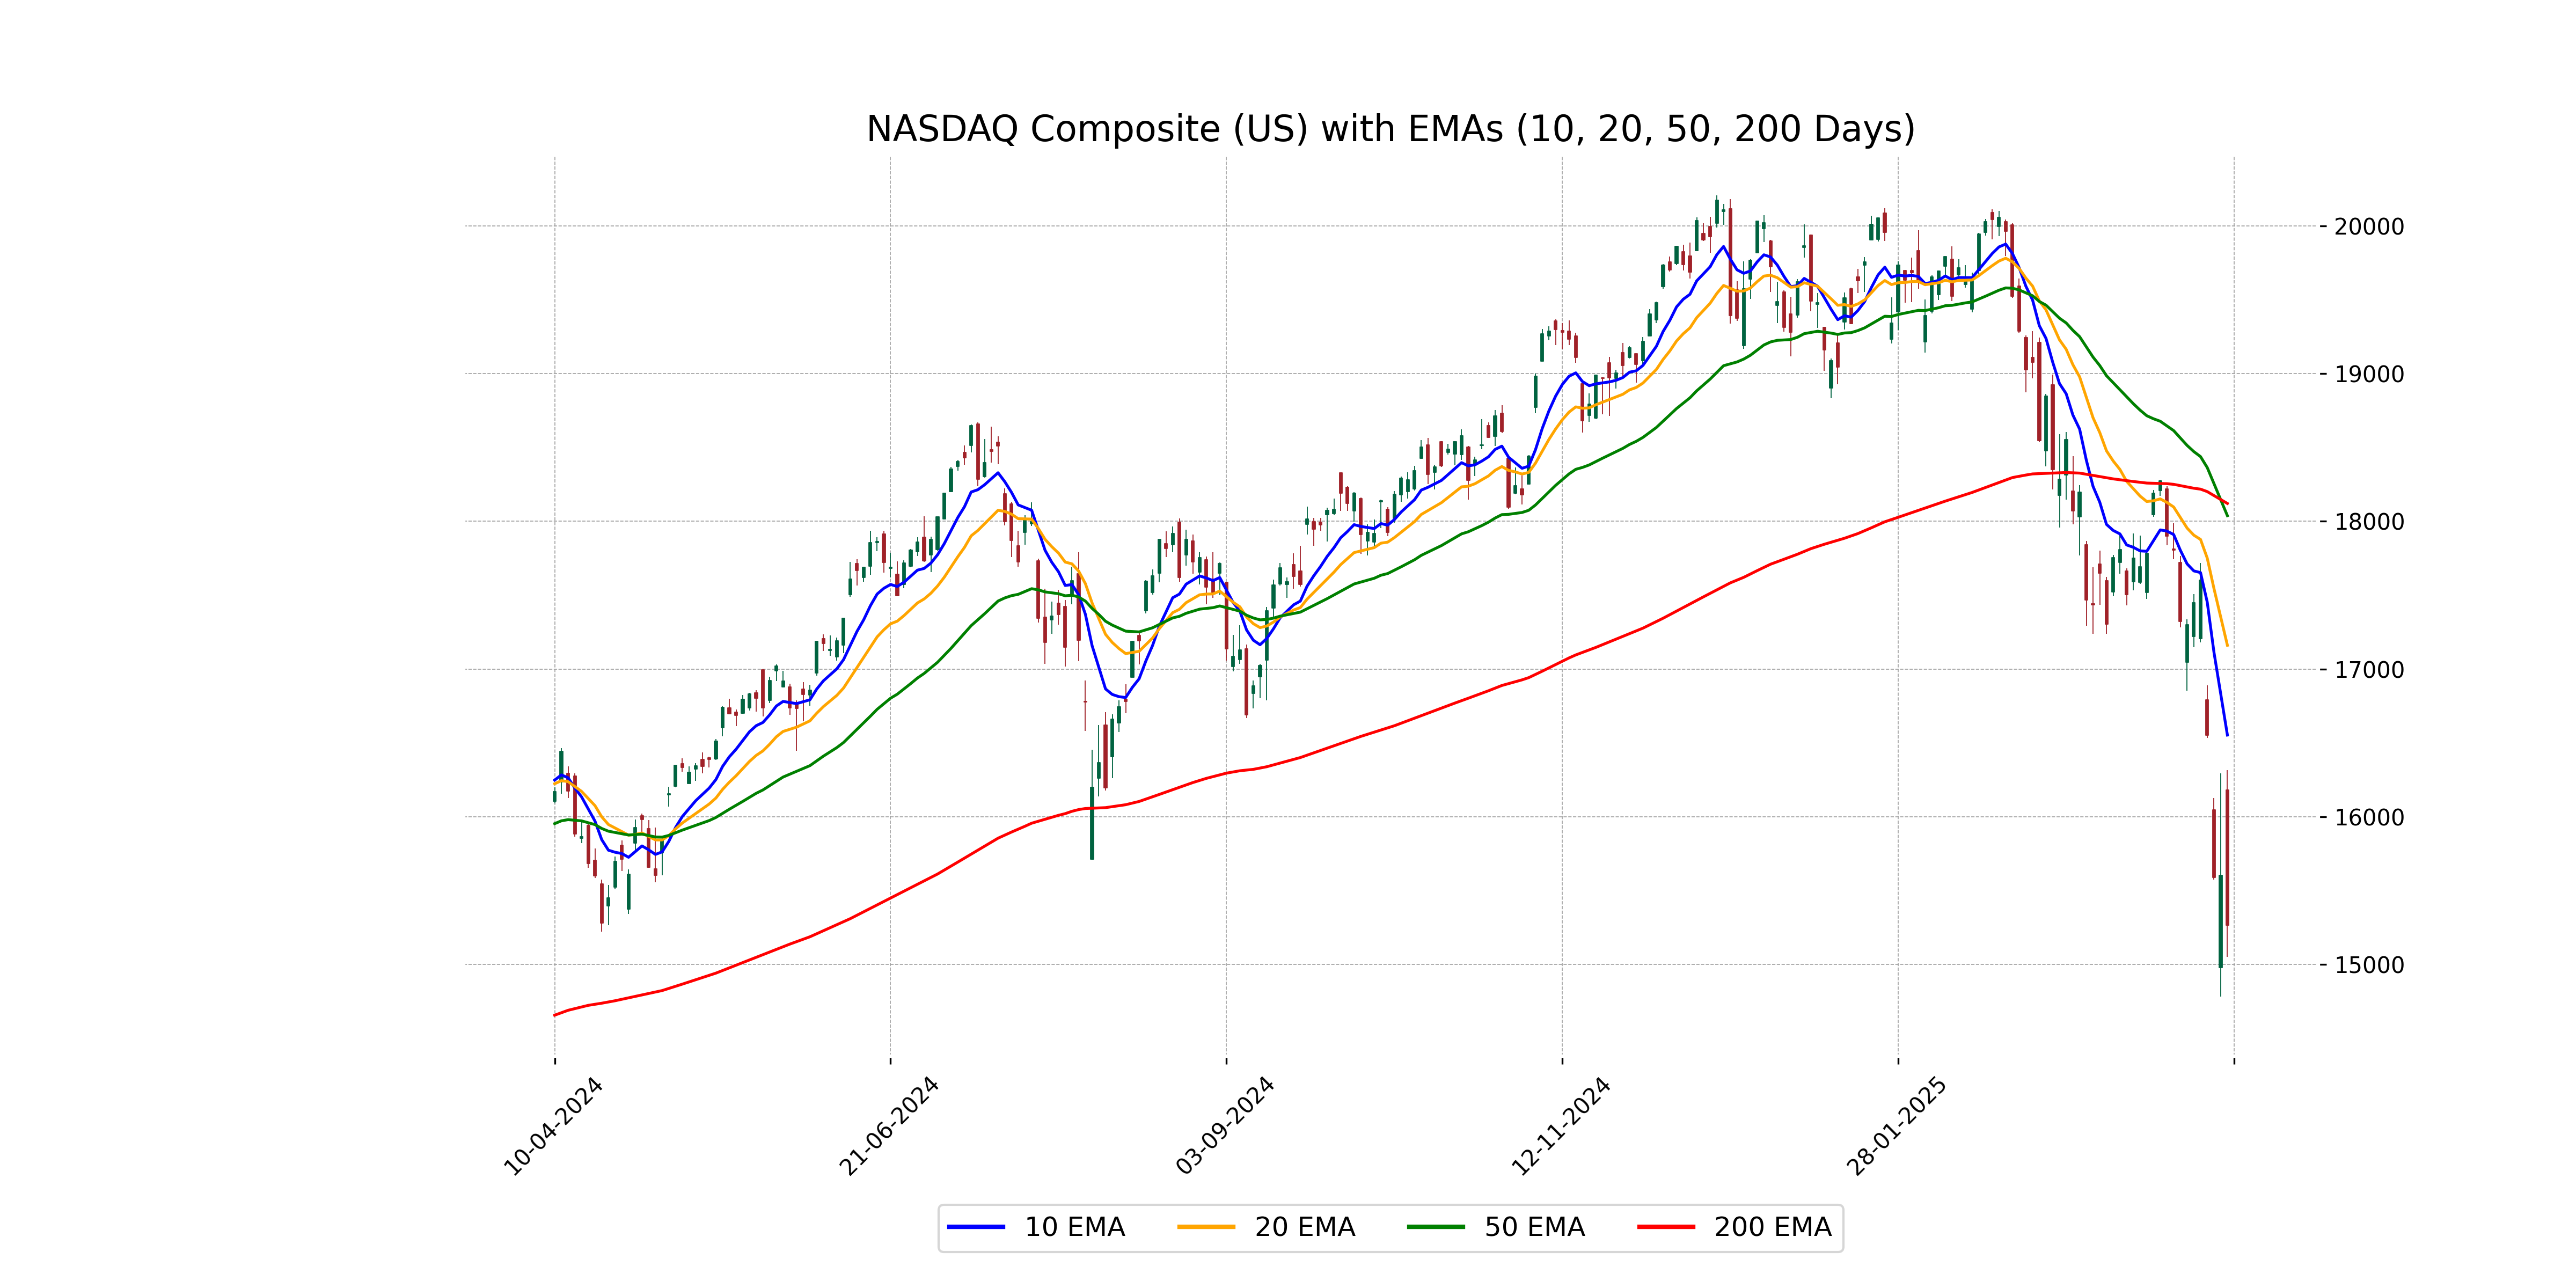
Analysis for NASDAQ Composite (US) - April 09, 2025
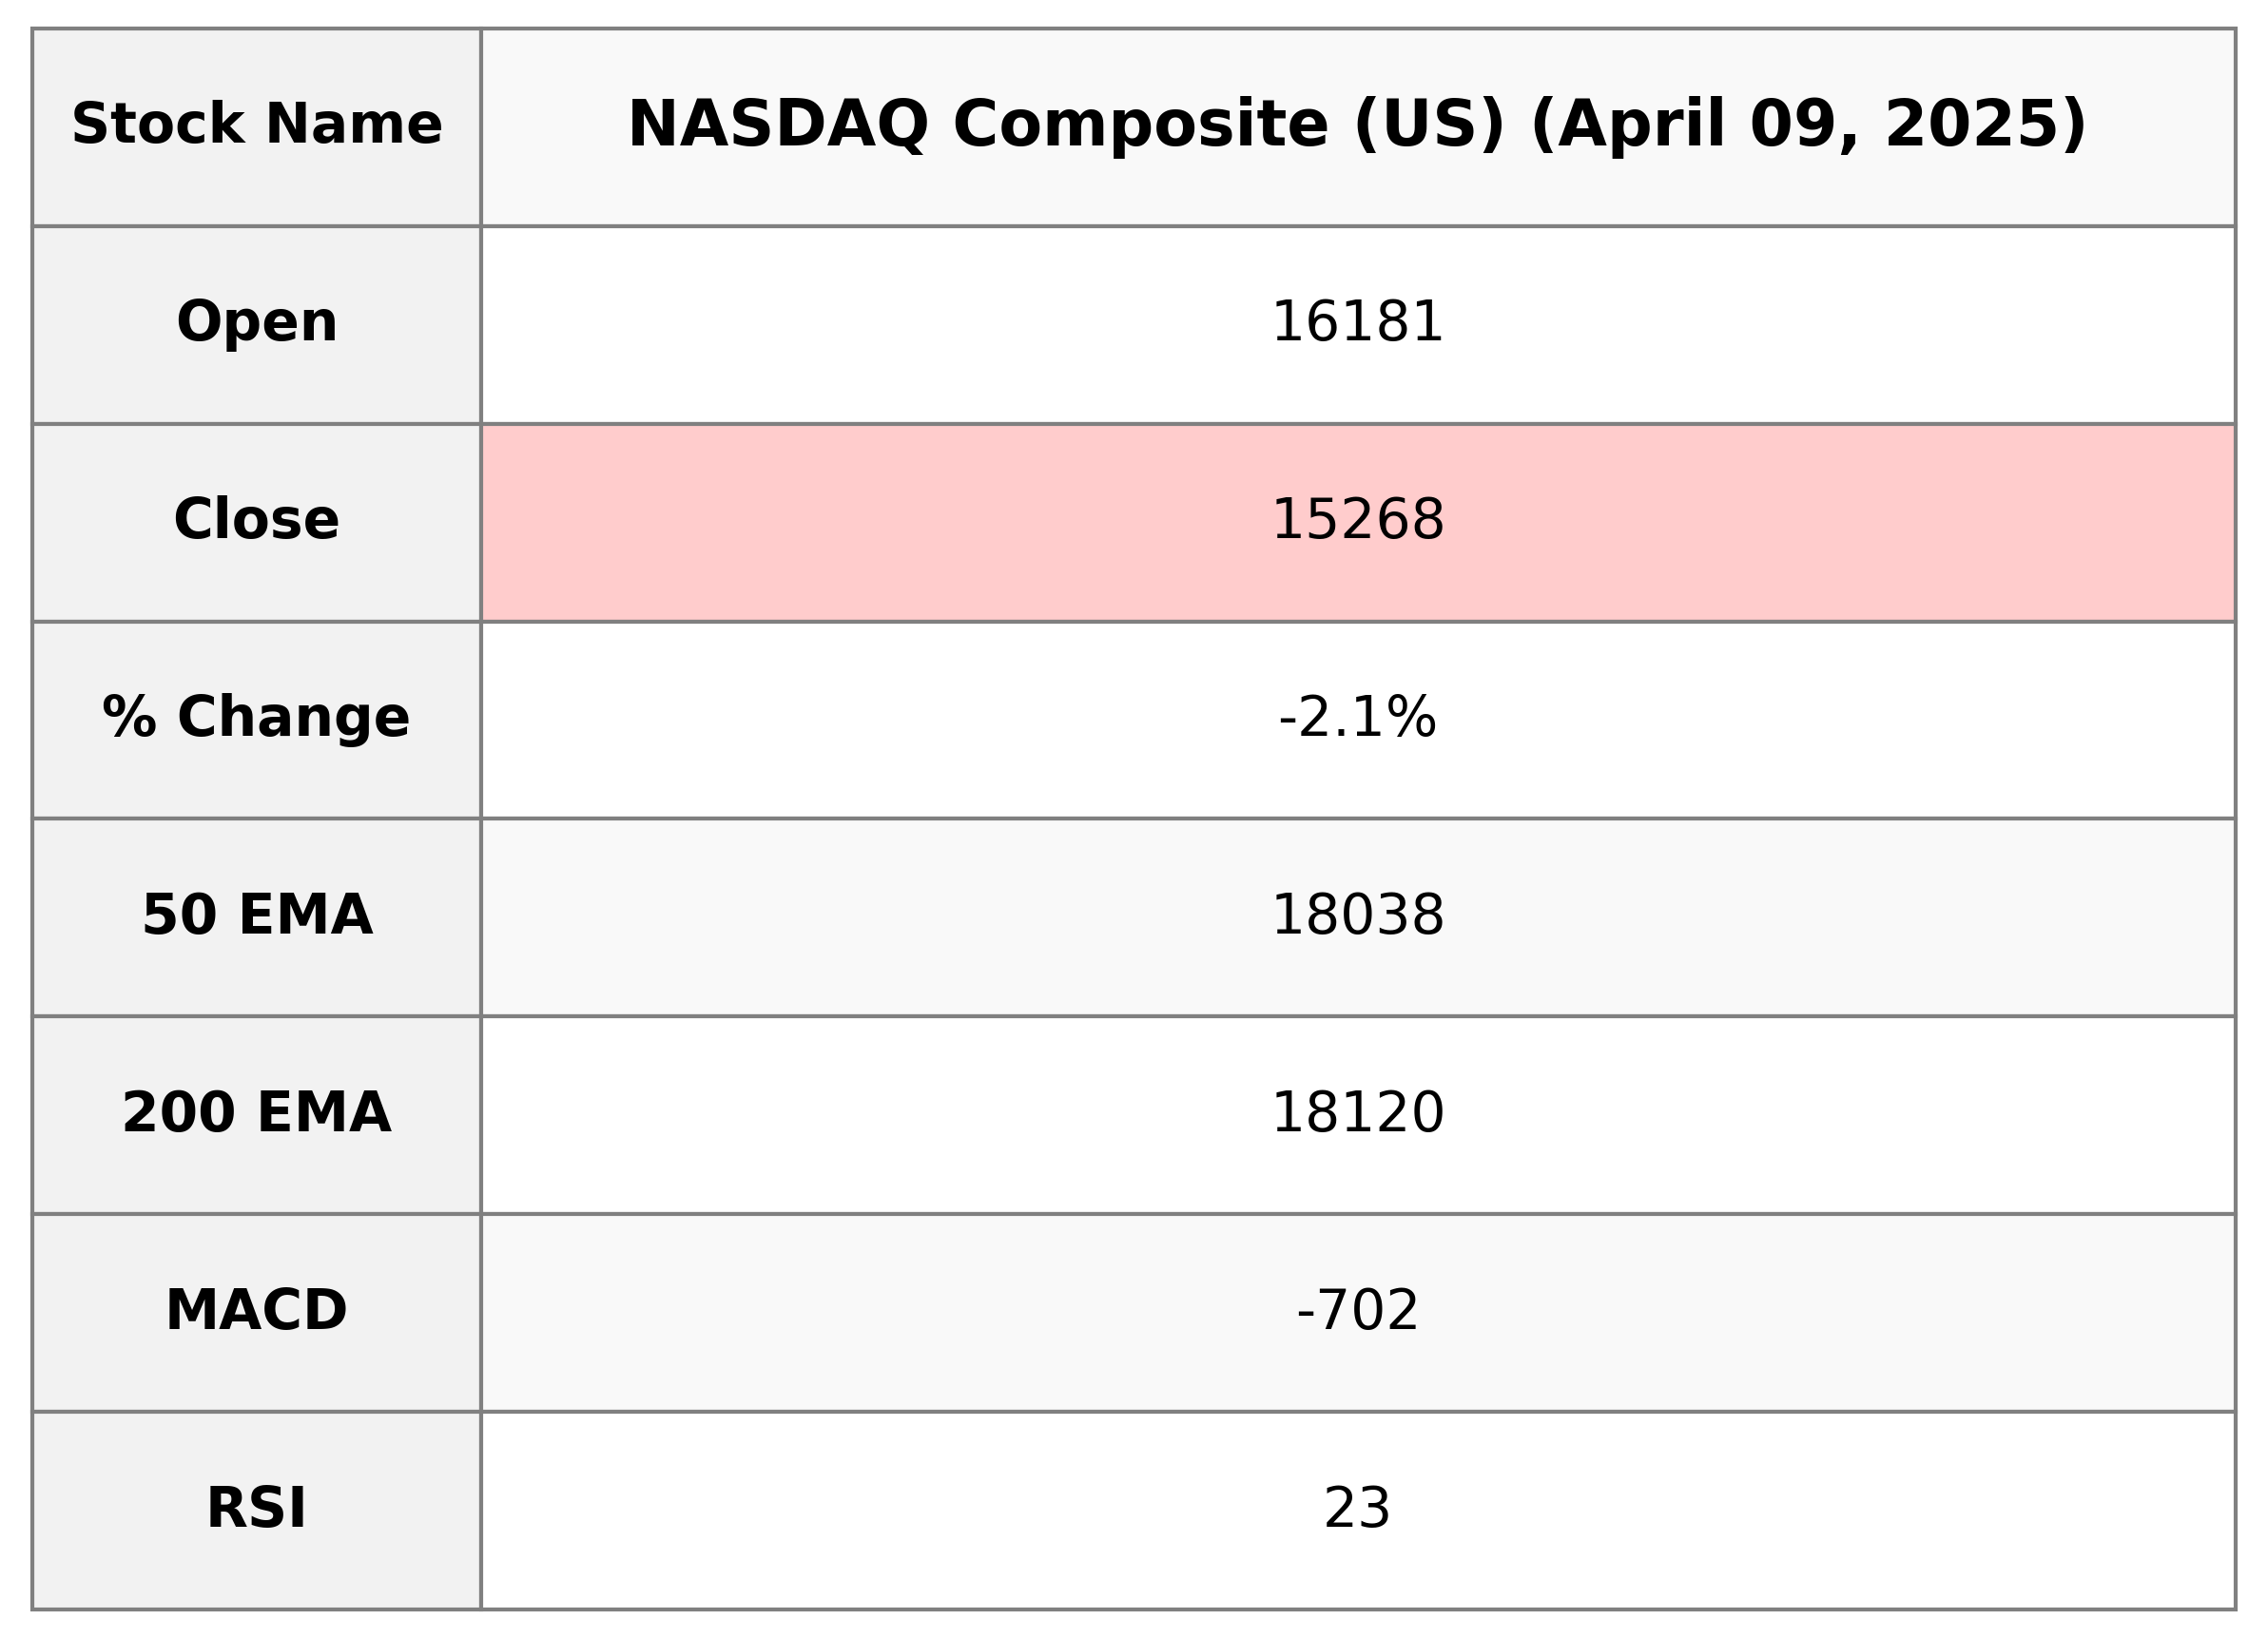
NASDAQ Composite (US) Performance Overview The NASDAQ Composite closed at 15,267.91, a decrease of 335.35 points or 2.15% from the previous close of 15,603.26. The index experienced a high of 16,316.51 and a low of 15,053.39, with a substantial trading volume of approximately 10.5 billion shares. The Relative Strength Index (RSI) at 22.84 indicates an oversold market condition, while the MACD shows a bearish sentiment with a value of -701.79 against a signal line of -492.00.
Relationship with Key Moving Averages
The NASDAQ Composite is currently trading below all its key moving averages, with the 50-day EMA, 200-day EMA, 10-day EMA, and 20-day EMA values higher than the current closing price of 15,267.91. This suggests a bearish trend as the price is below both short-term and long-term averages.
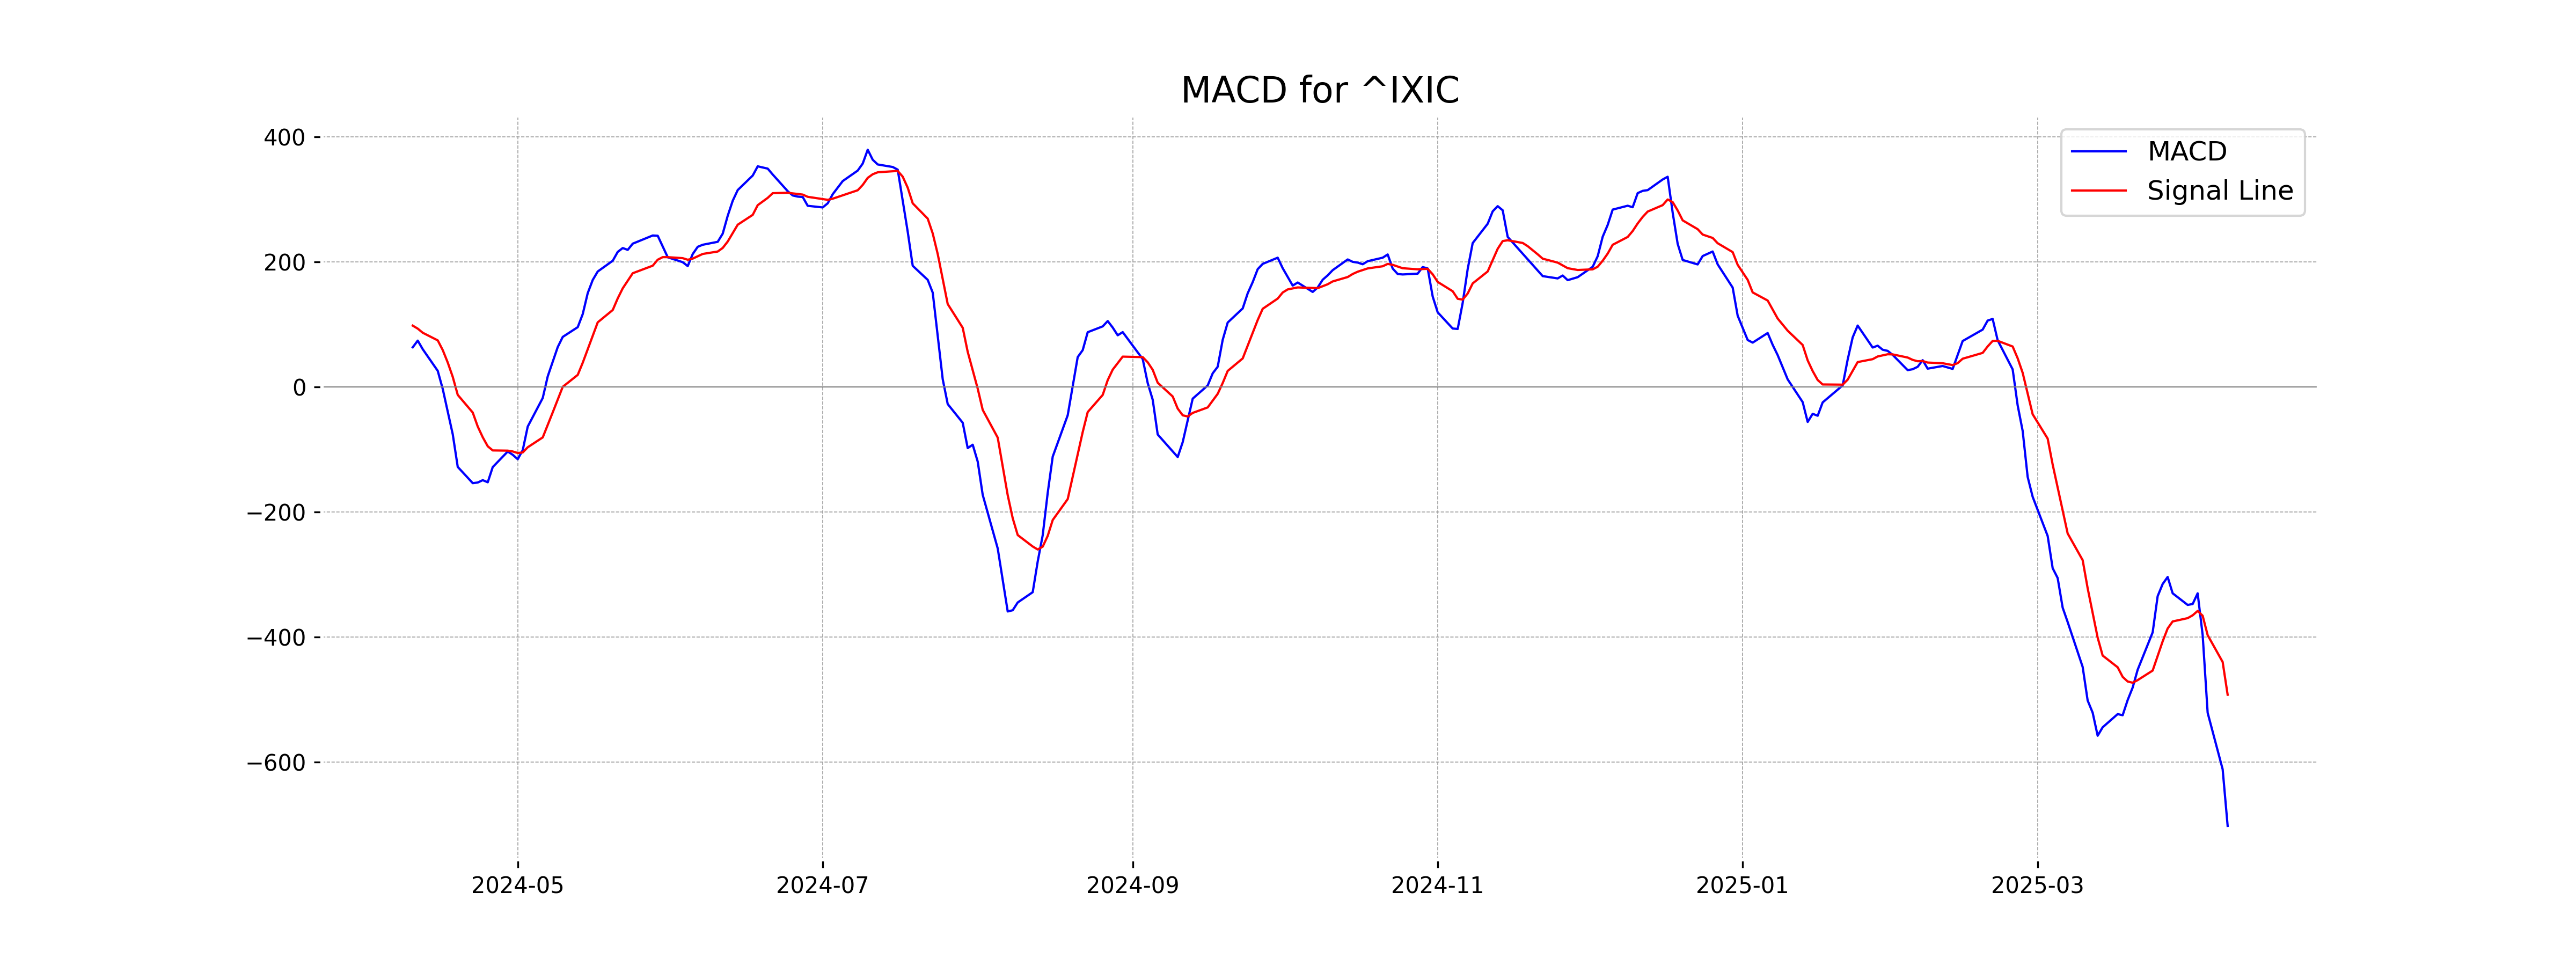
Moving Averages Trend (MACD)
NASDAQ Composite (US) is showing a bearish trend as indicated by the MACD value of -701.79, which is below the MACD Signal of -492.00. This suggests that the downward momentum is strong and could potentially continue.
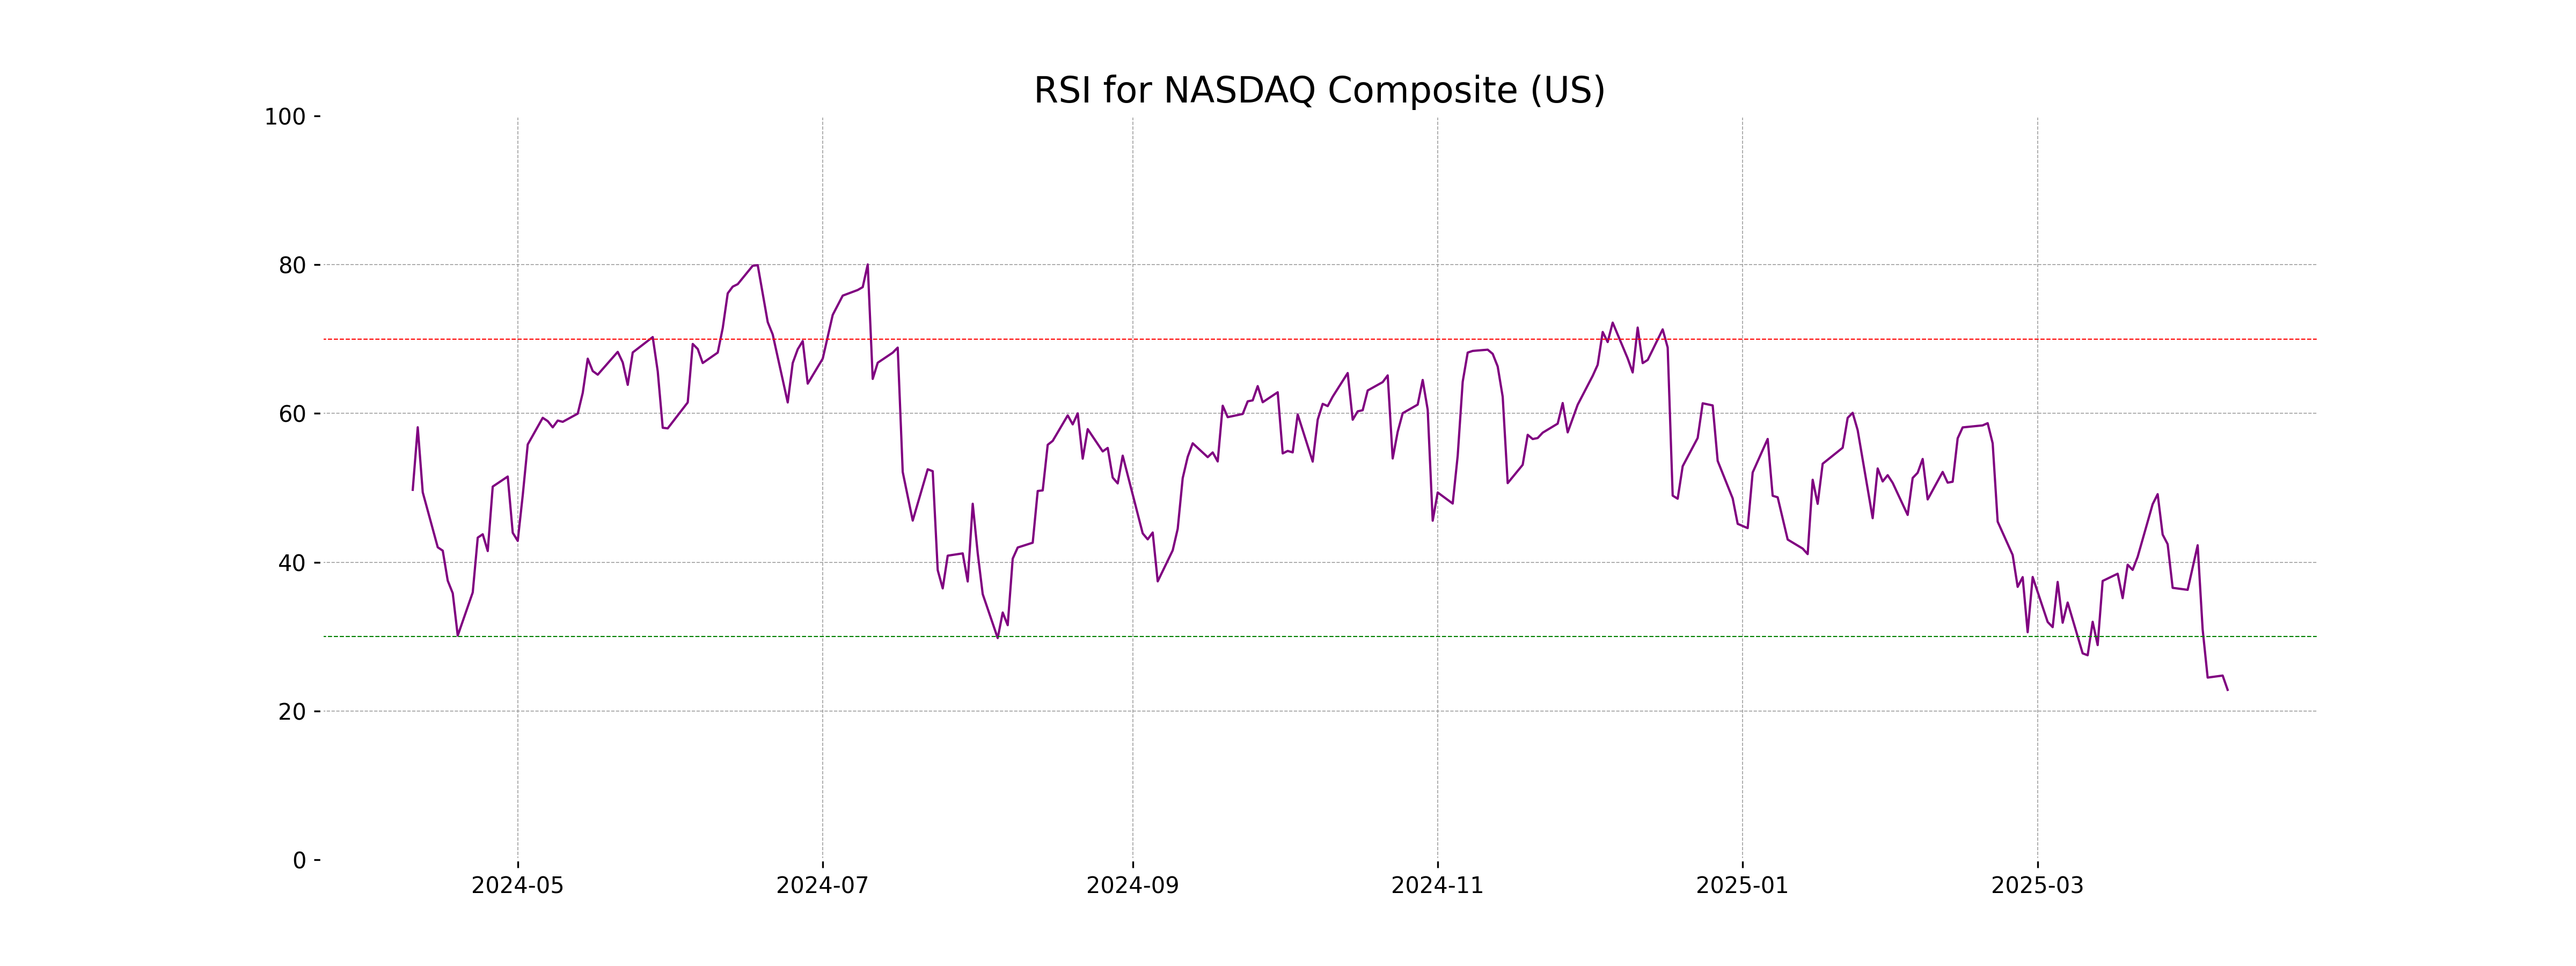
RSI Analysis
NASDAQ Composite (US) RSI Analysis: The RSI for NASDAQ Composite stands at 22.84, which suggests that the index is currently in the oversold territory. This level typically indicates that the market may be due for a reversal or at least a corrective bounce, implying potential buying opportunities.
Analysis for Nikkei 225 (Japan) - April 09, 2025
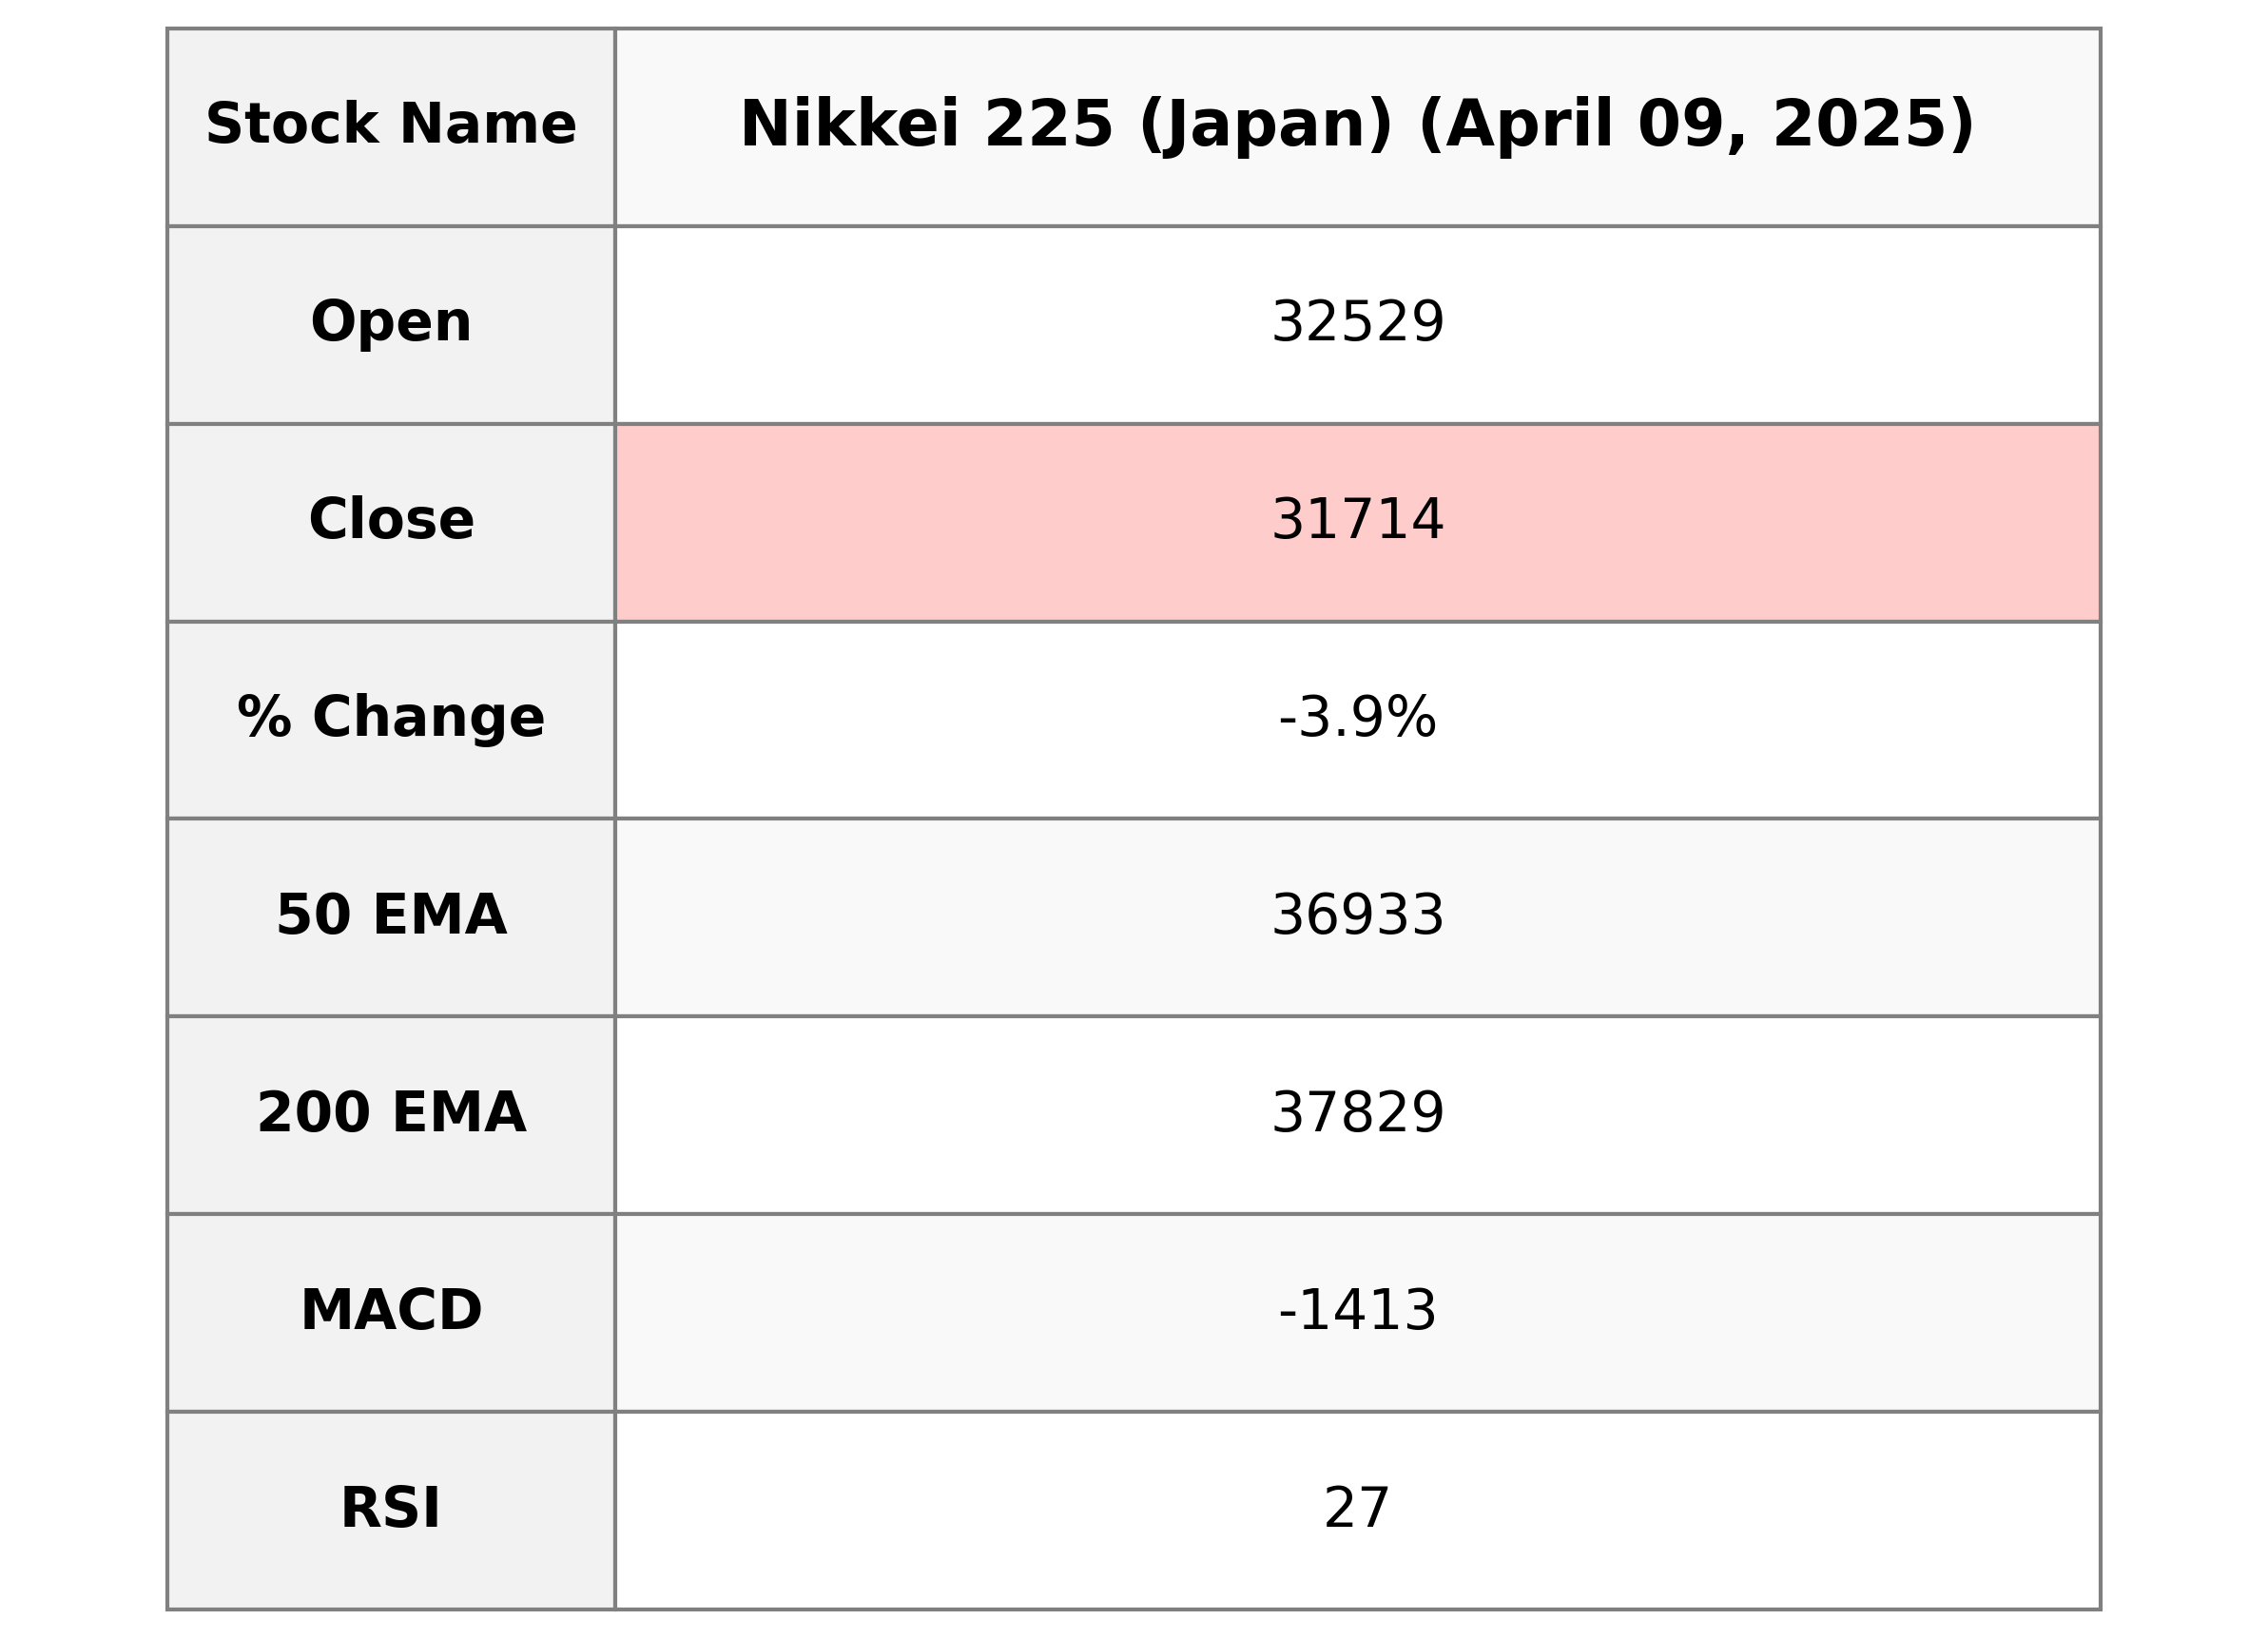
Nikkei 225 (Japan) opened at 32,529.23 and closed at 31,714.03, showing a decline of 3.93% with a points change of -1,298.55. The RSI is 27.18, indicating that the index may be in oversold territory, and the MACD is negative at -1413.33, suggesting a bearish trend.
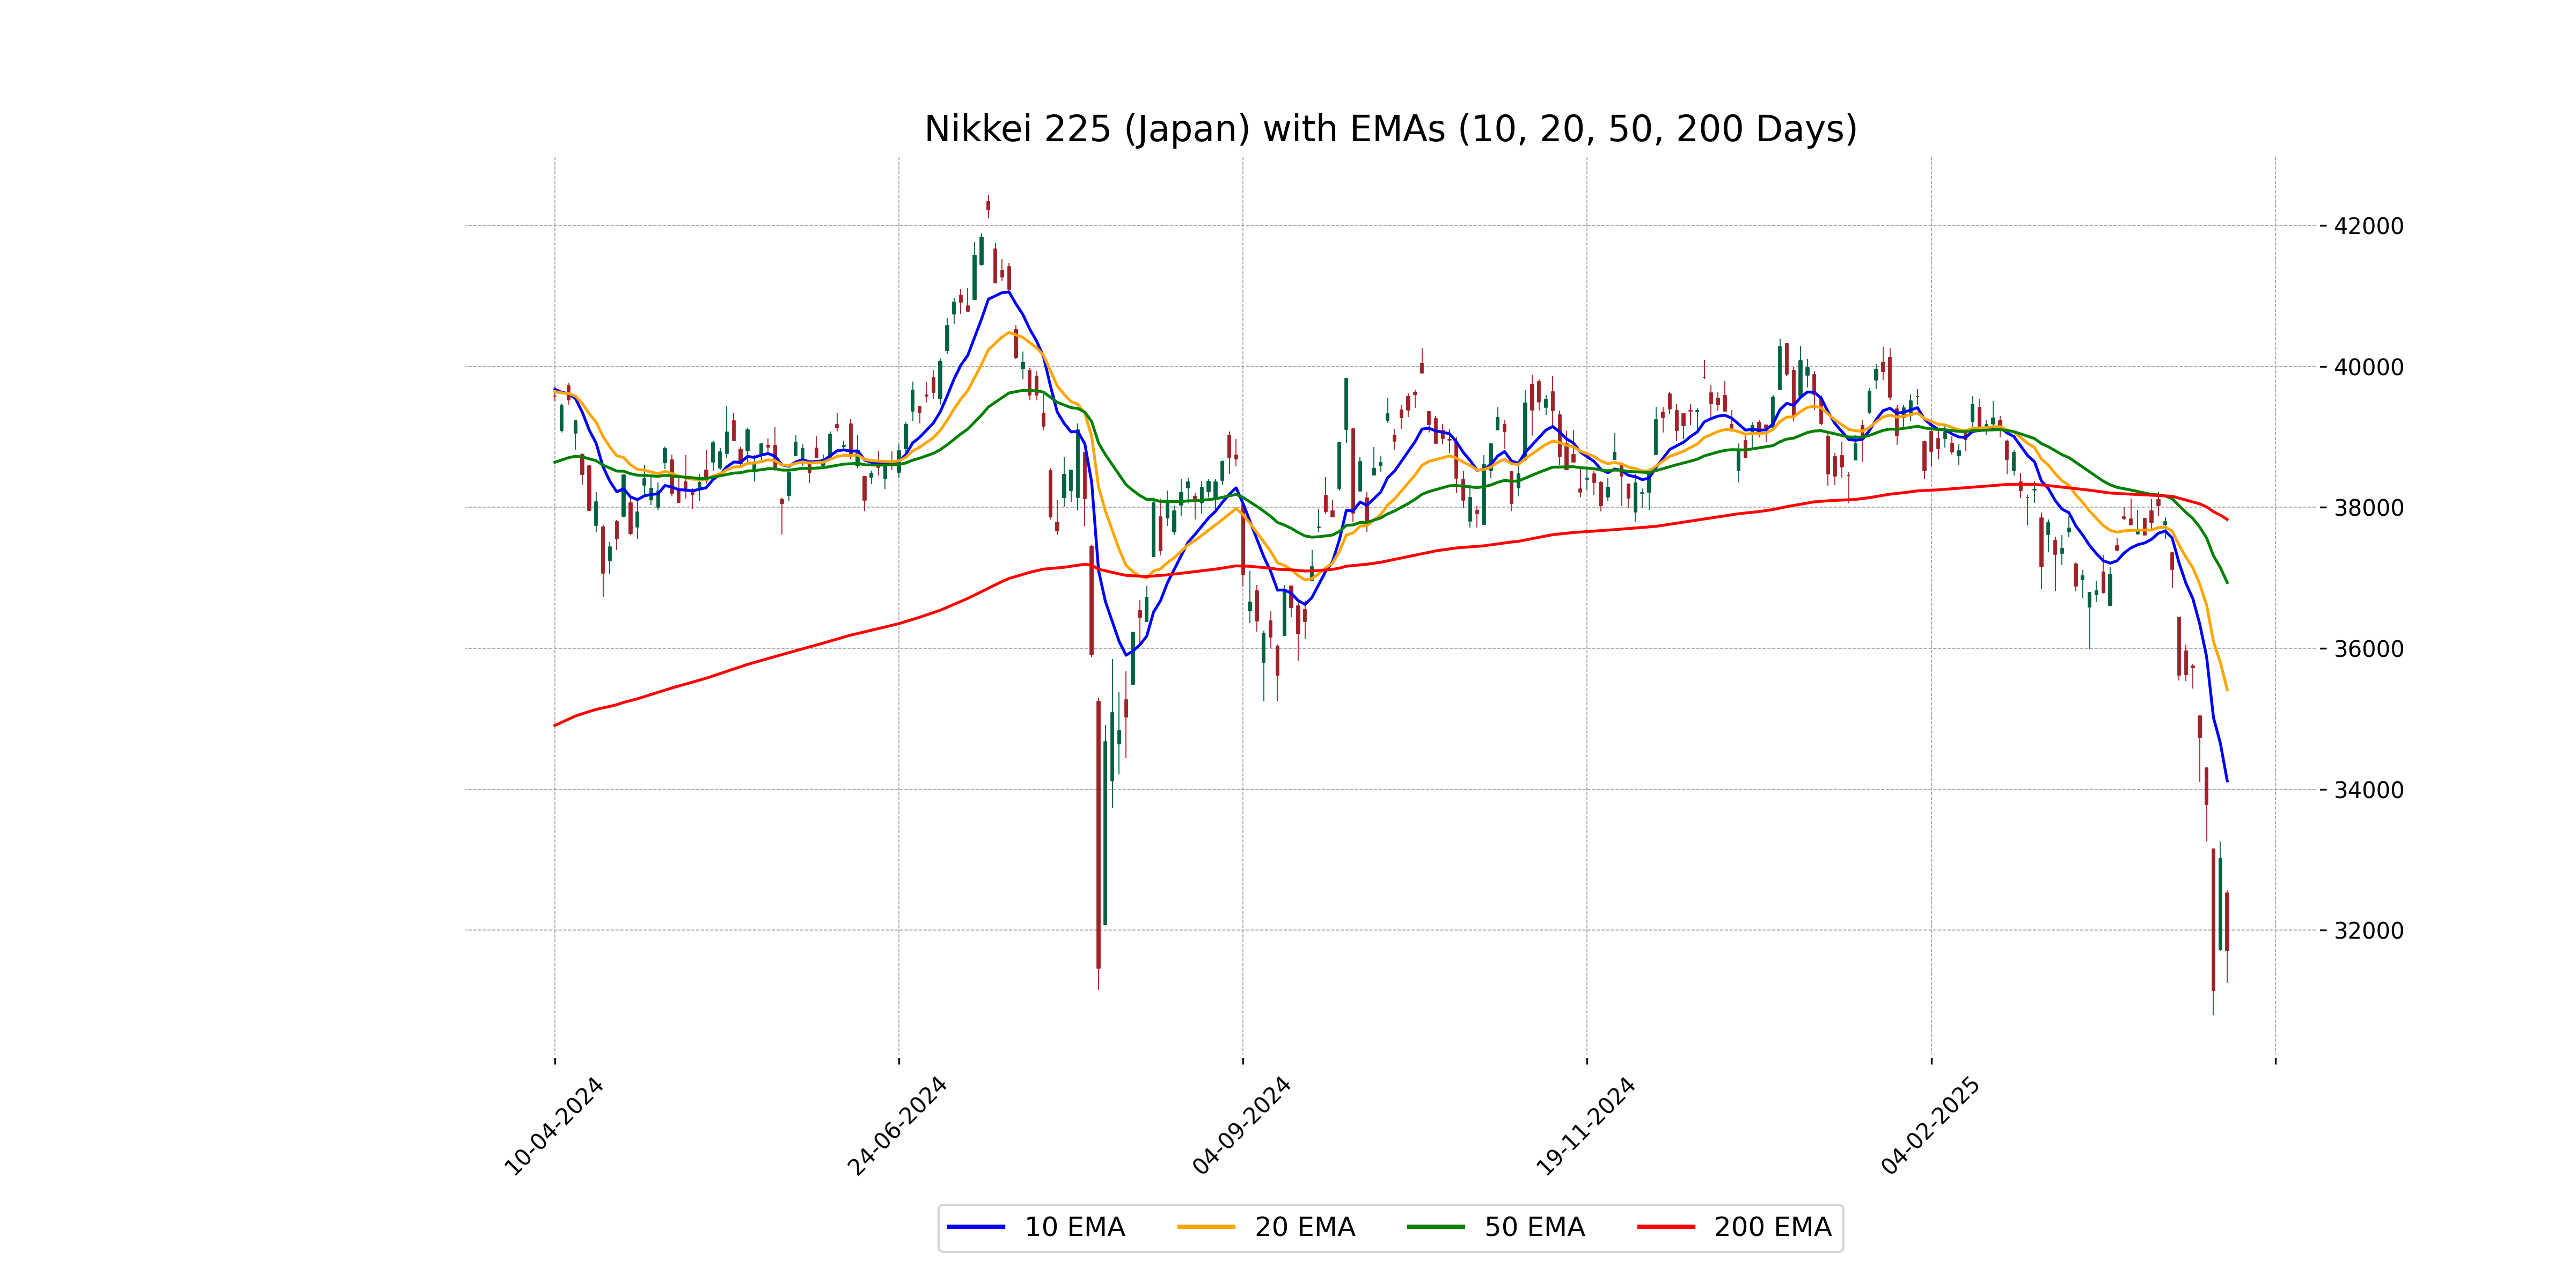
Relationship with Key Moving Averages
The Nikkei 225 currently trades below its key moving averages, with its closing price of 31,714.03 significantly under the 50-day EMA of 36,933.09 and the 200-day EMA of 37,829.08, indicating a bearish trend. The 10-day and 20-day EMAs are also lower than these longer-term EMAs, signaling potential short-term weakness.
Moving Averages Trend (MACD)
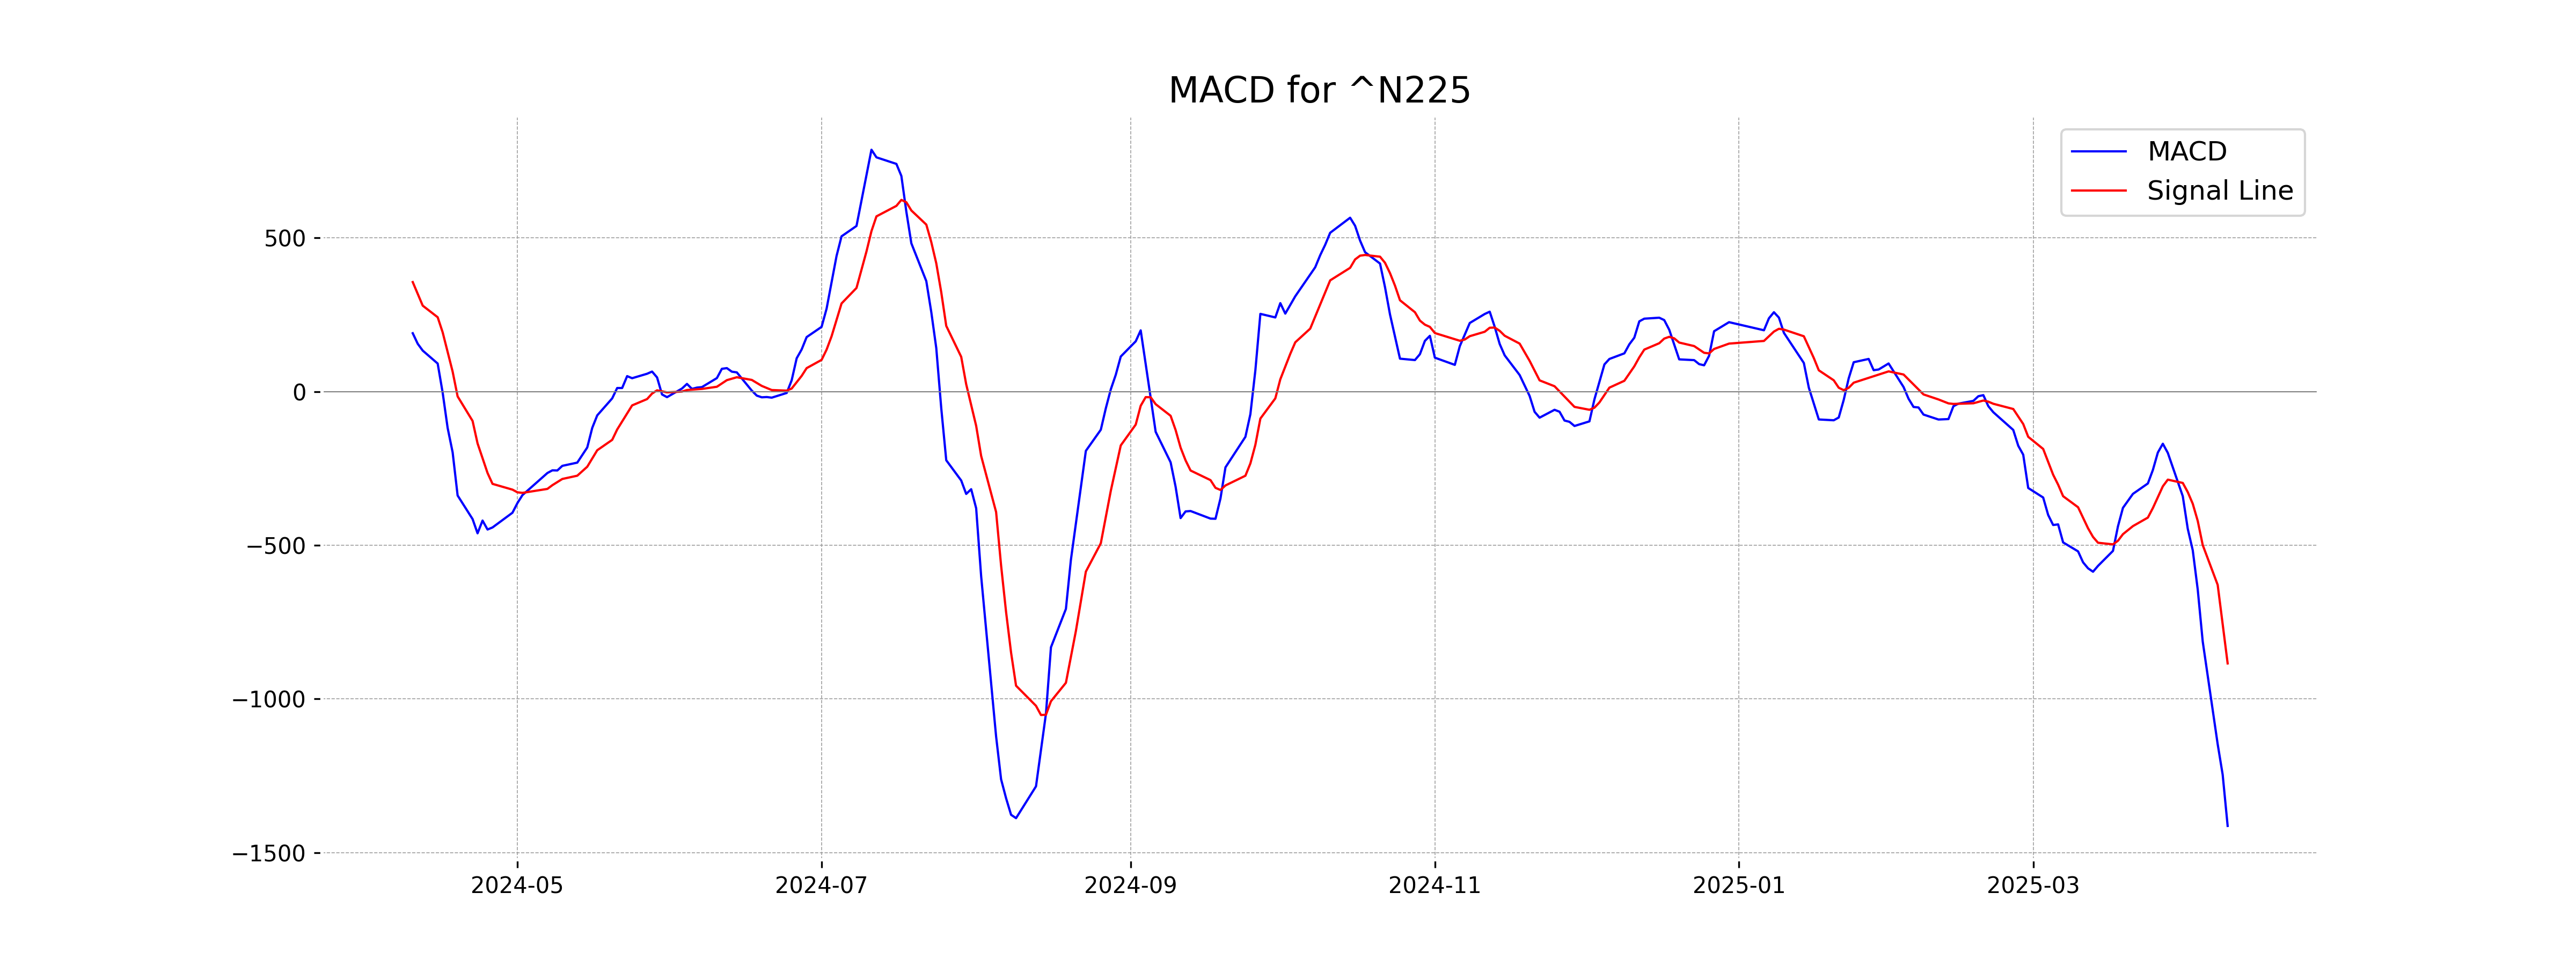
The MACD analysis for Nikkei 225 indicates a bearish trend, as the MACD value of -1413.33 is significantly below the MACD Signal value of -884.62. This suggests that the current momentum is negative and that the index may continue to experience downward pressure.
RSI Analysis
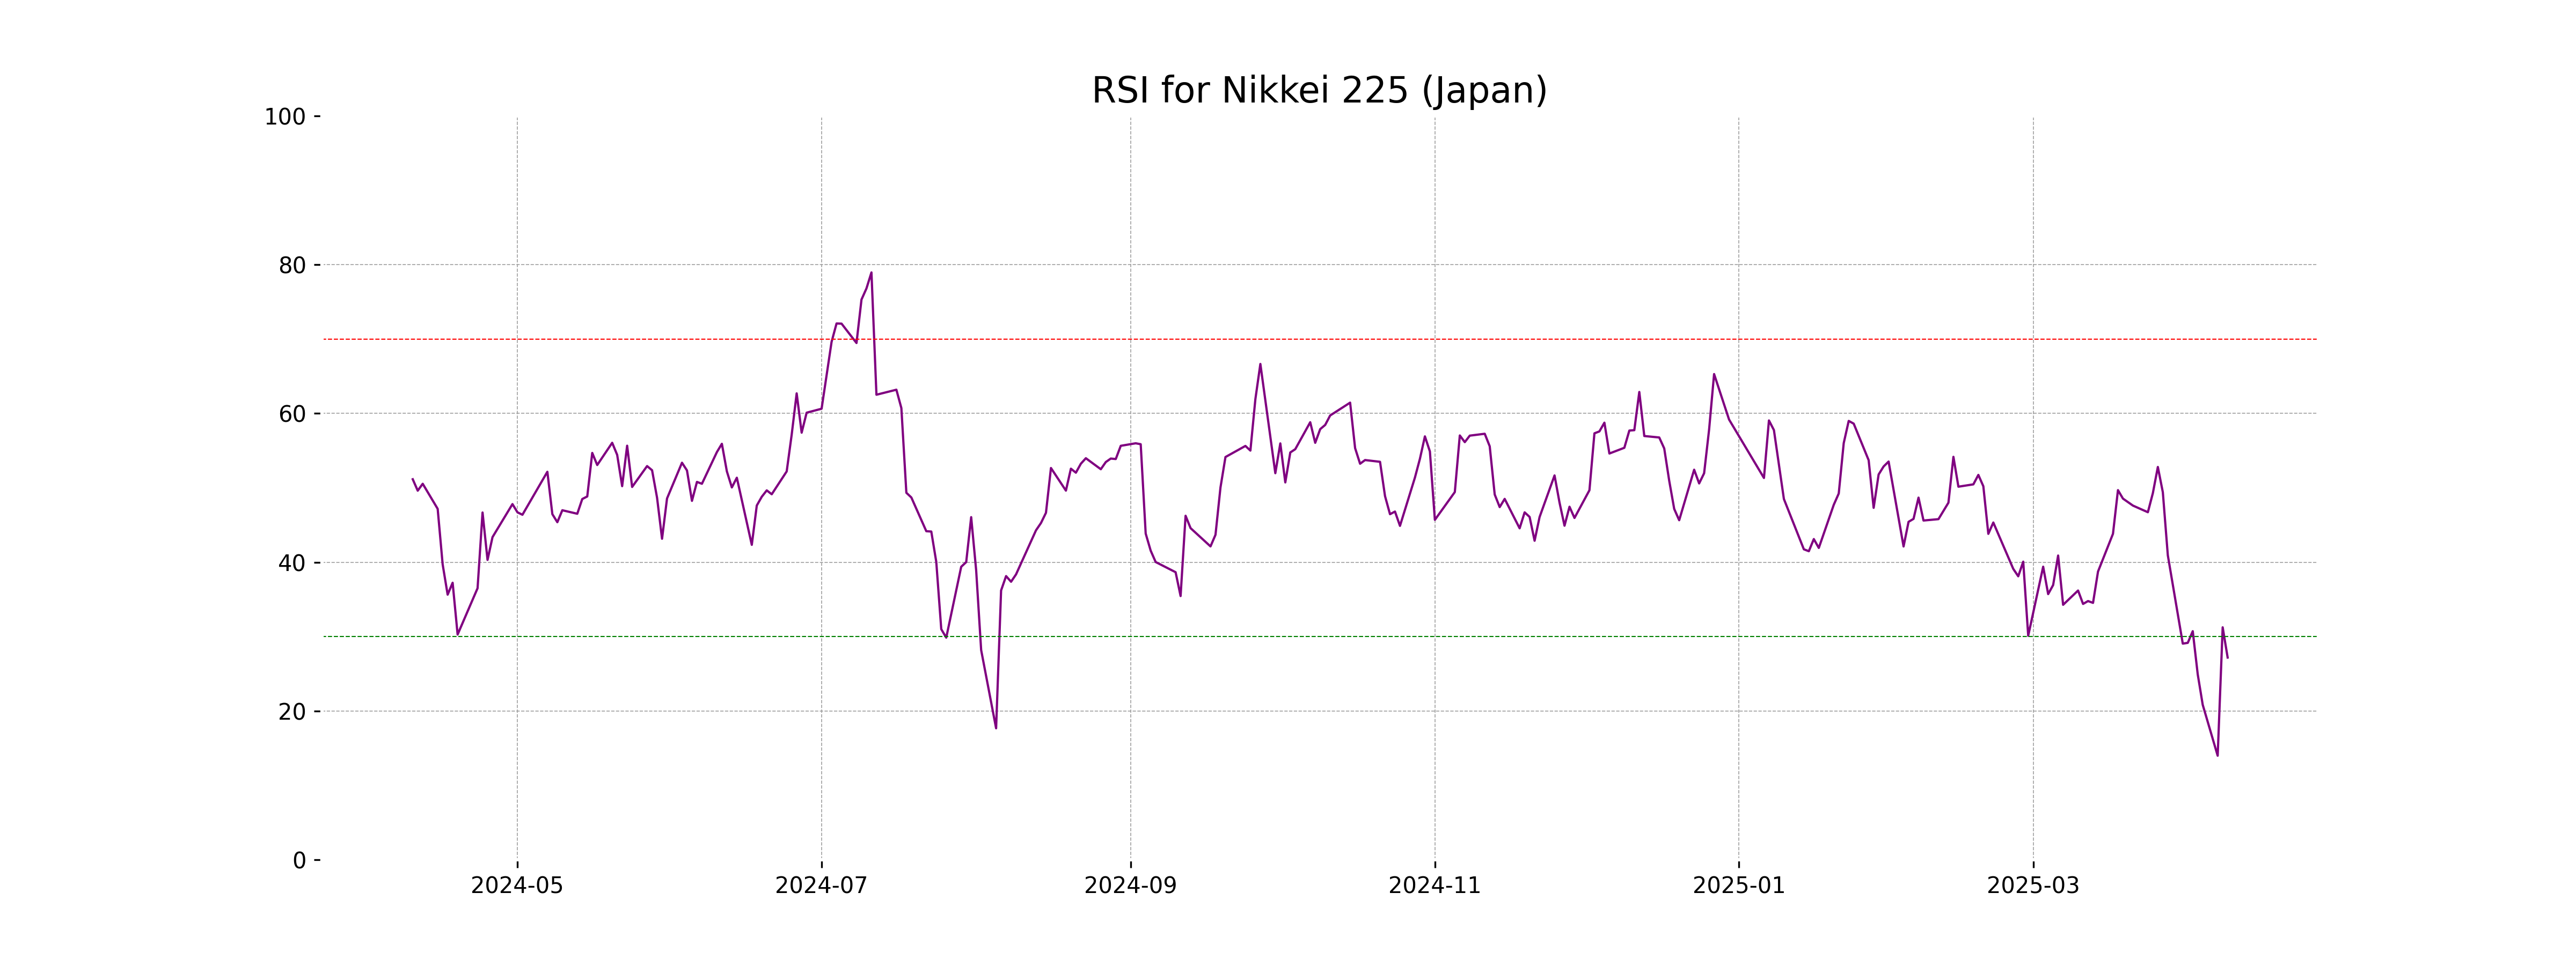
The RSI of 27.18 indicates that the Nikkei 225 is currently in oversold territory, which may suggest potential for a price reversal or upward correction. It reflects weak recent price performance and could attract buyers looking for a market entry point.
Analysis for Nifty Bank - April 09, 2025
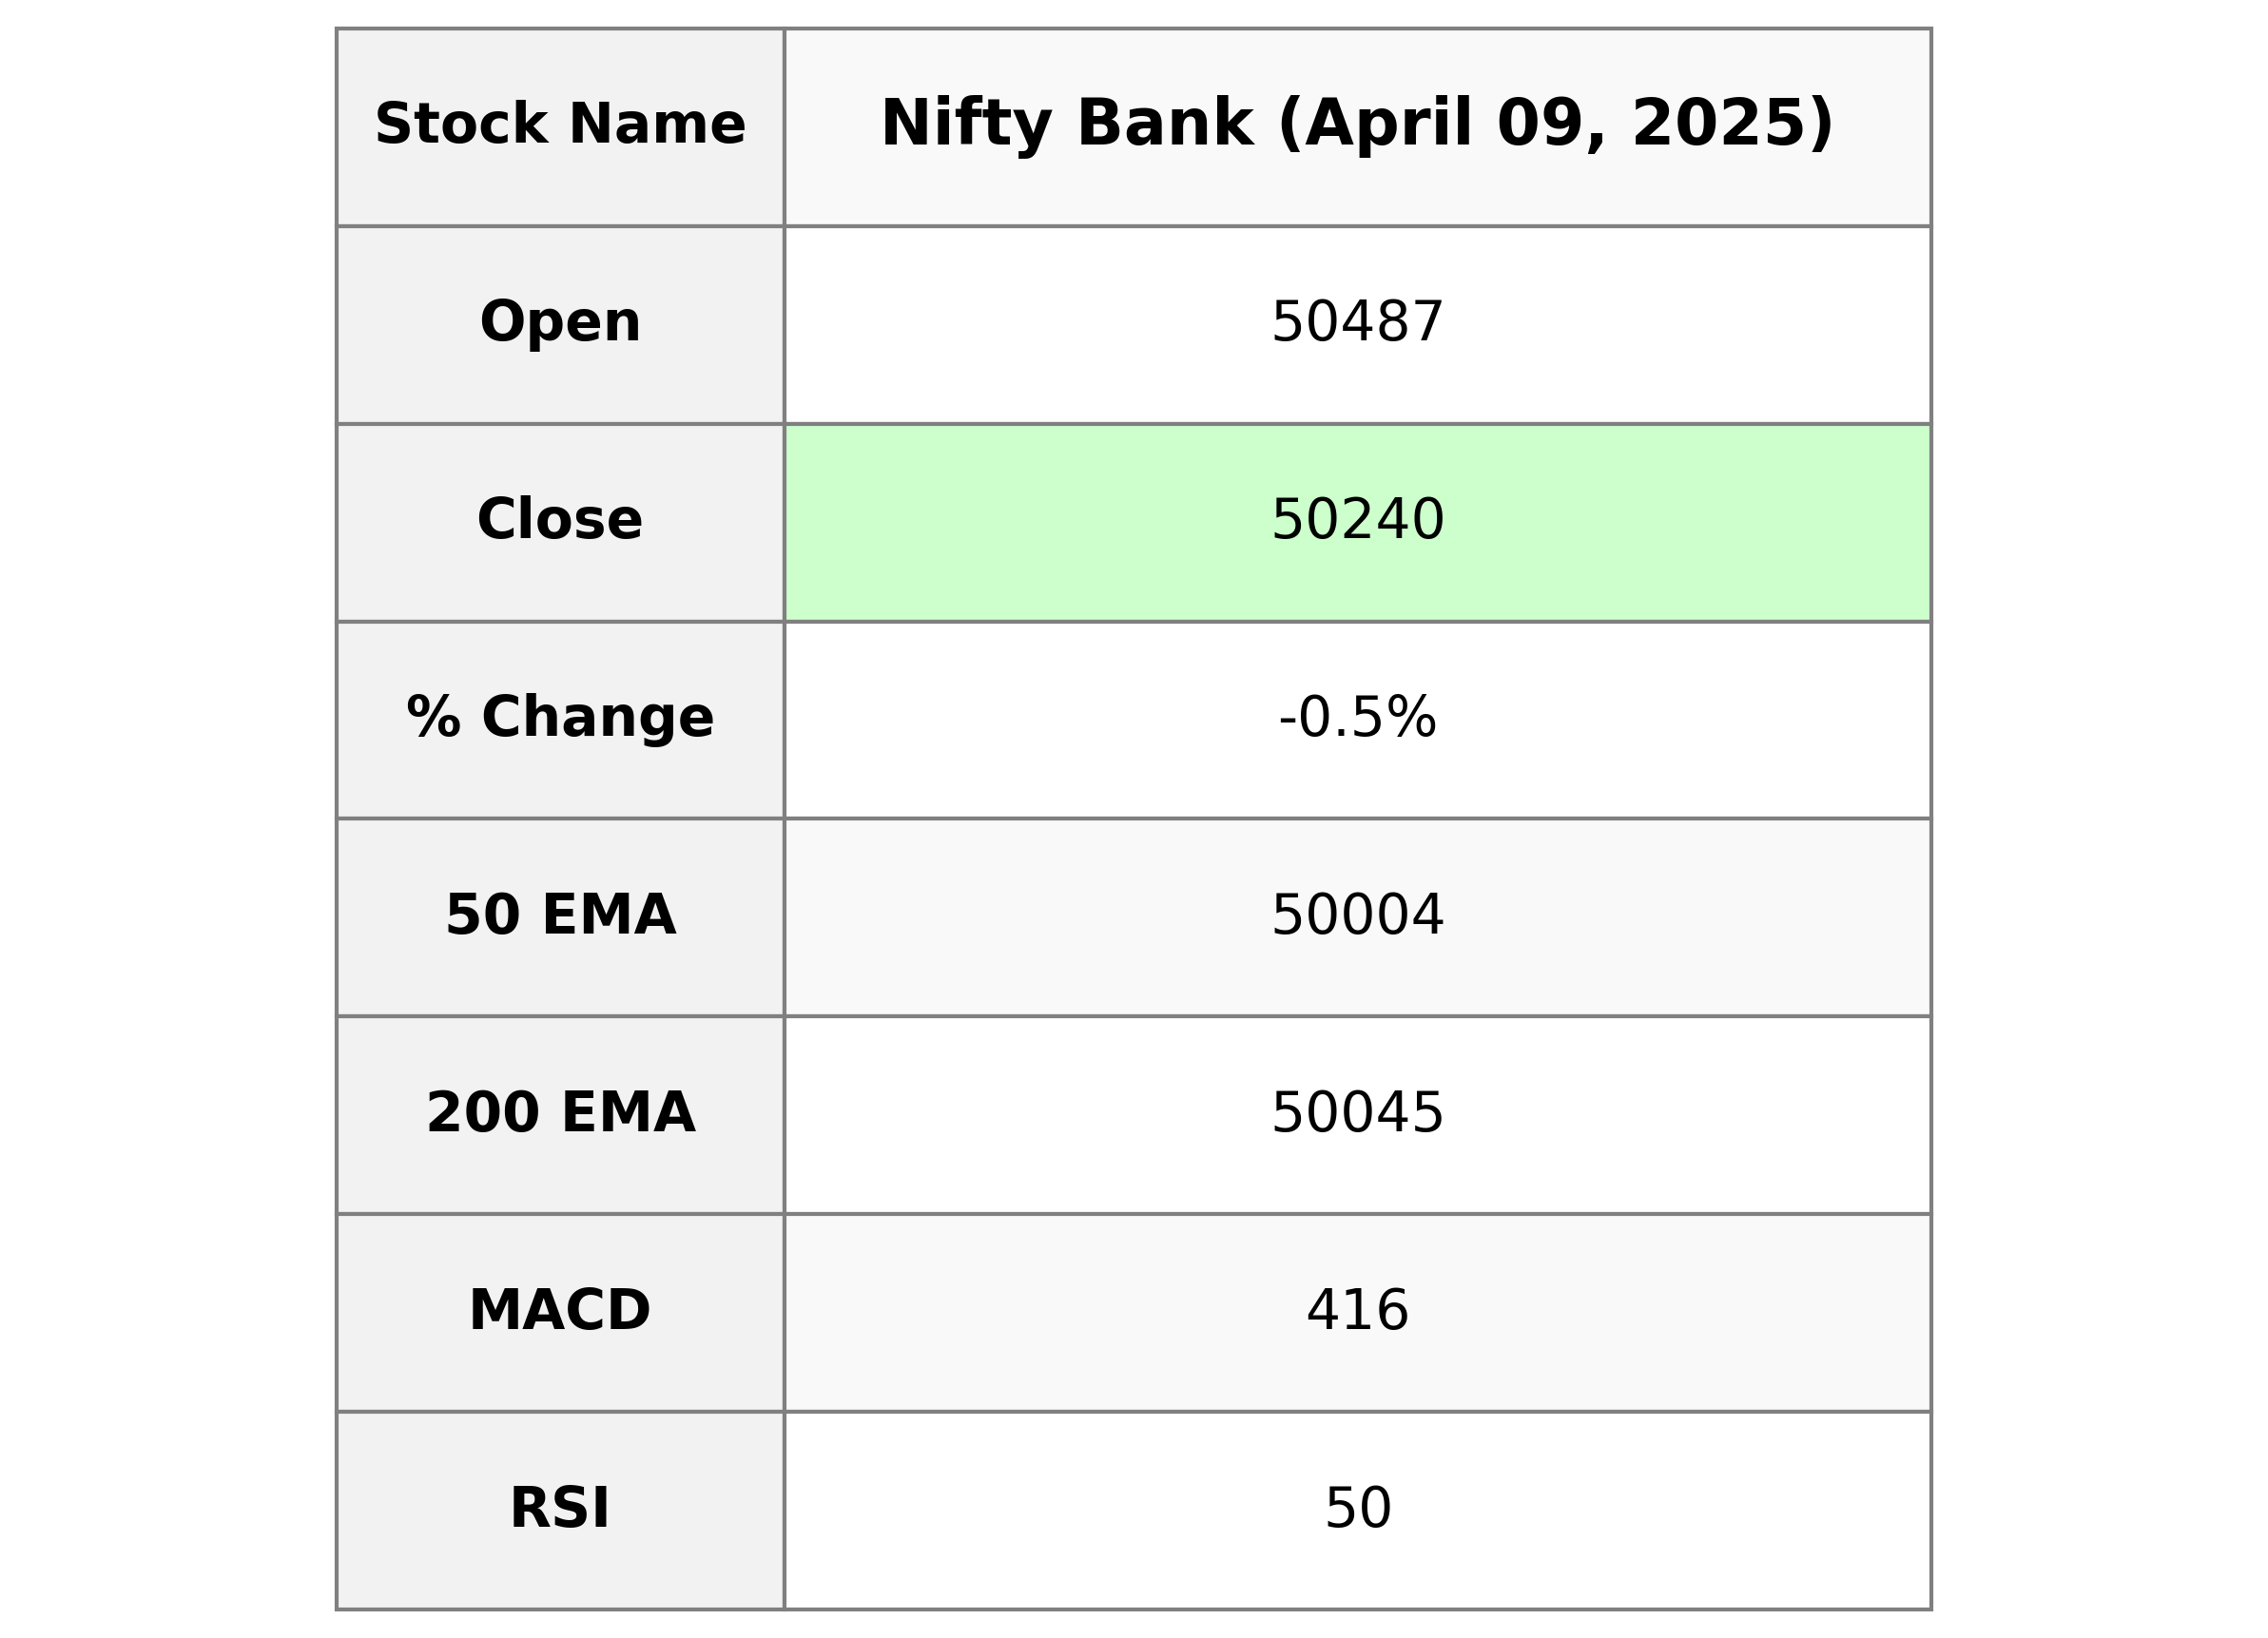
Nifty Bank opened at 50487.10, reached a high of 50496.90 and a low of 49910.85, closing at 50240.15. It experienced a negative change of -0.54% or a points decrease of 270.85 from the previous close of 50511.00. The 50 and 200 EMAs are slightly below the closing price, indicating a recent downtrend relative to its longer trend.
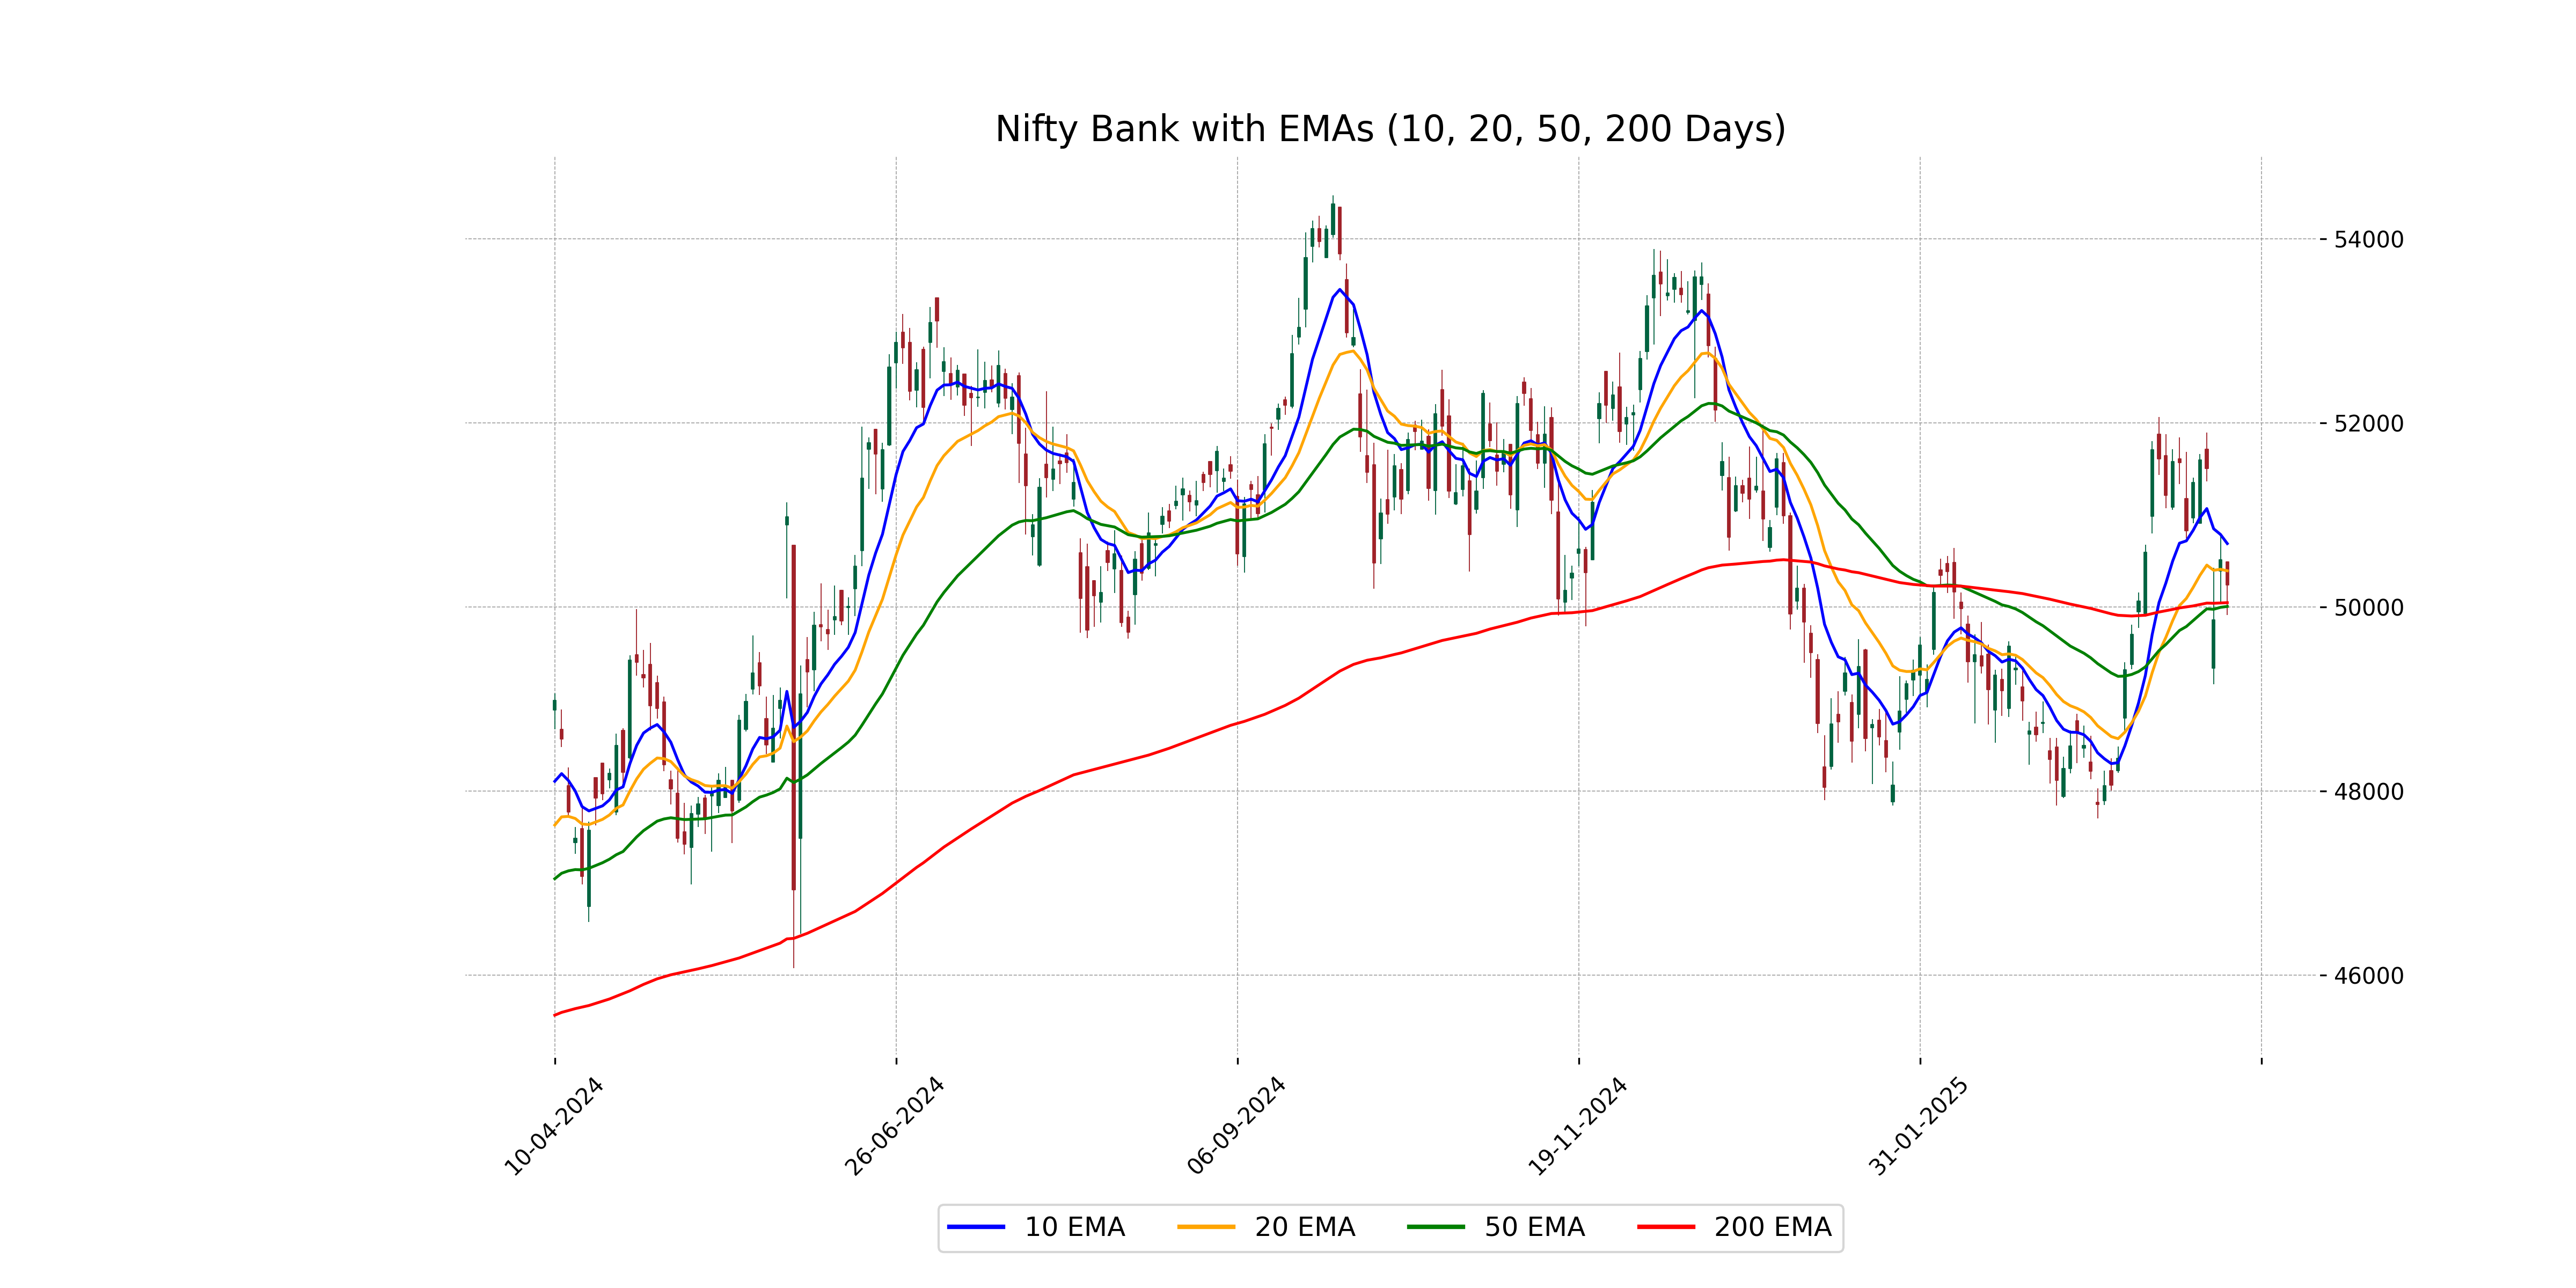
Relationship with Key Moving Averages
Nifty Bank closed at 50,240.15, which is above its 50-day EMA of 50,004.17 and 200-day EMA of 50,045.36, suggesting a bullish trend in the medium to long term. However, it is below the 10-day EMA of 50,687.22 and 20-day EMA of 50,391.79, indicating possible short-term weakness.
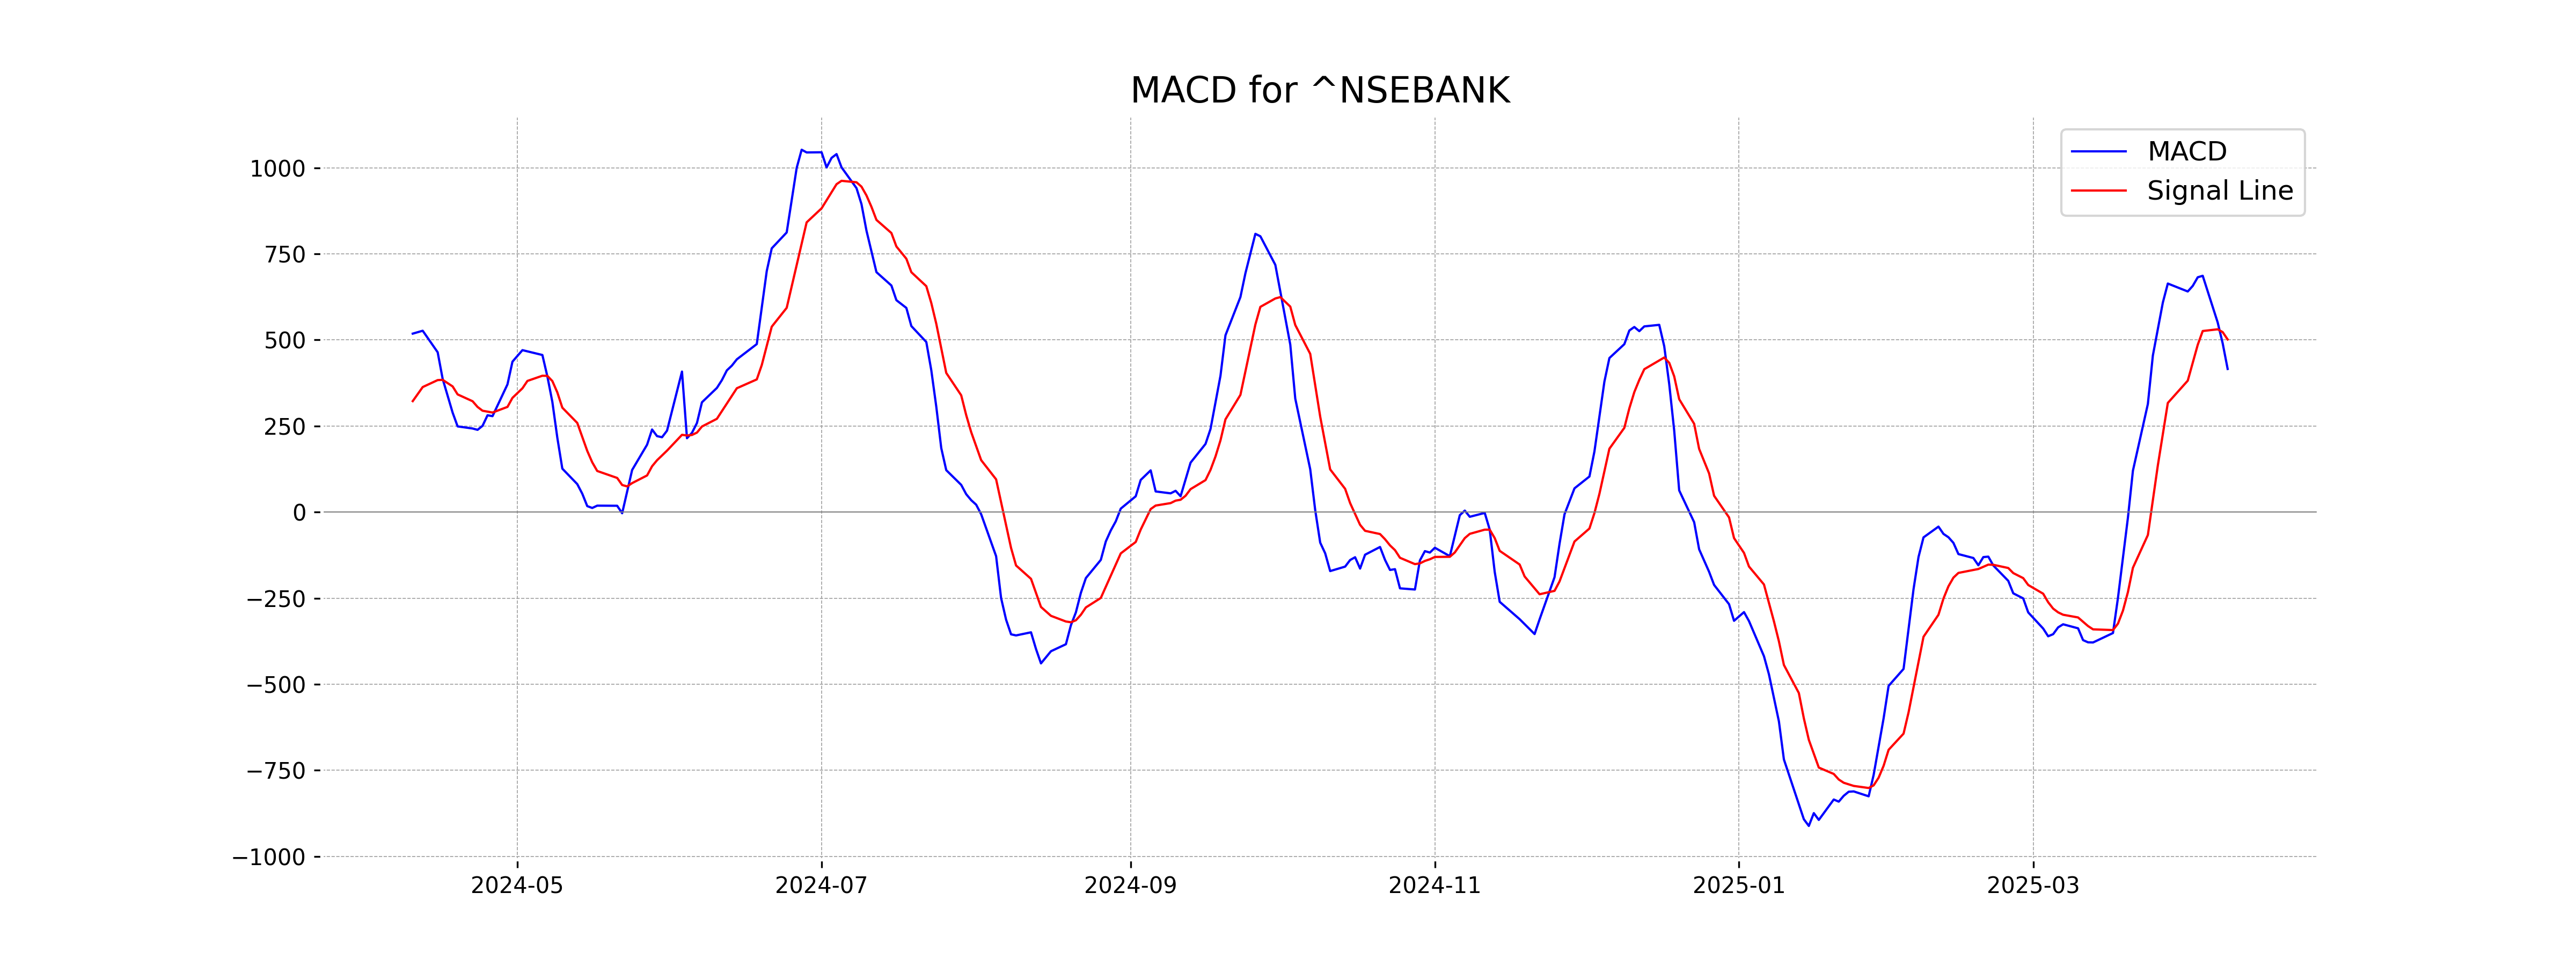
Moving Averages Trend (MACD)
The MACD for Nifty Bank is 415.63, which is below the MACD Signal line of 501.26, indicating a potential bearish trend or weakening momentum. This suggests that sellers might currently have more control than buyers.
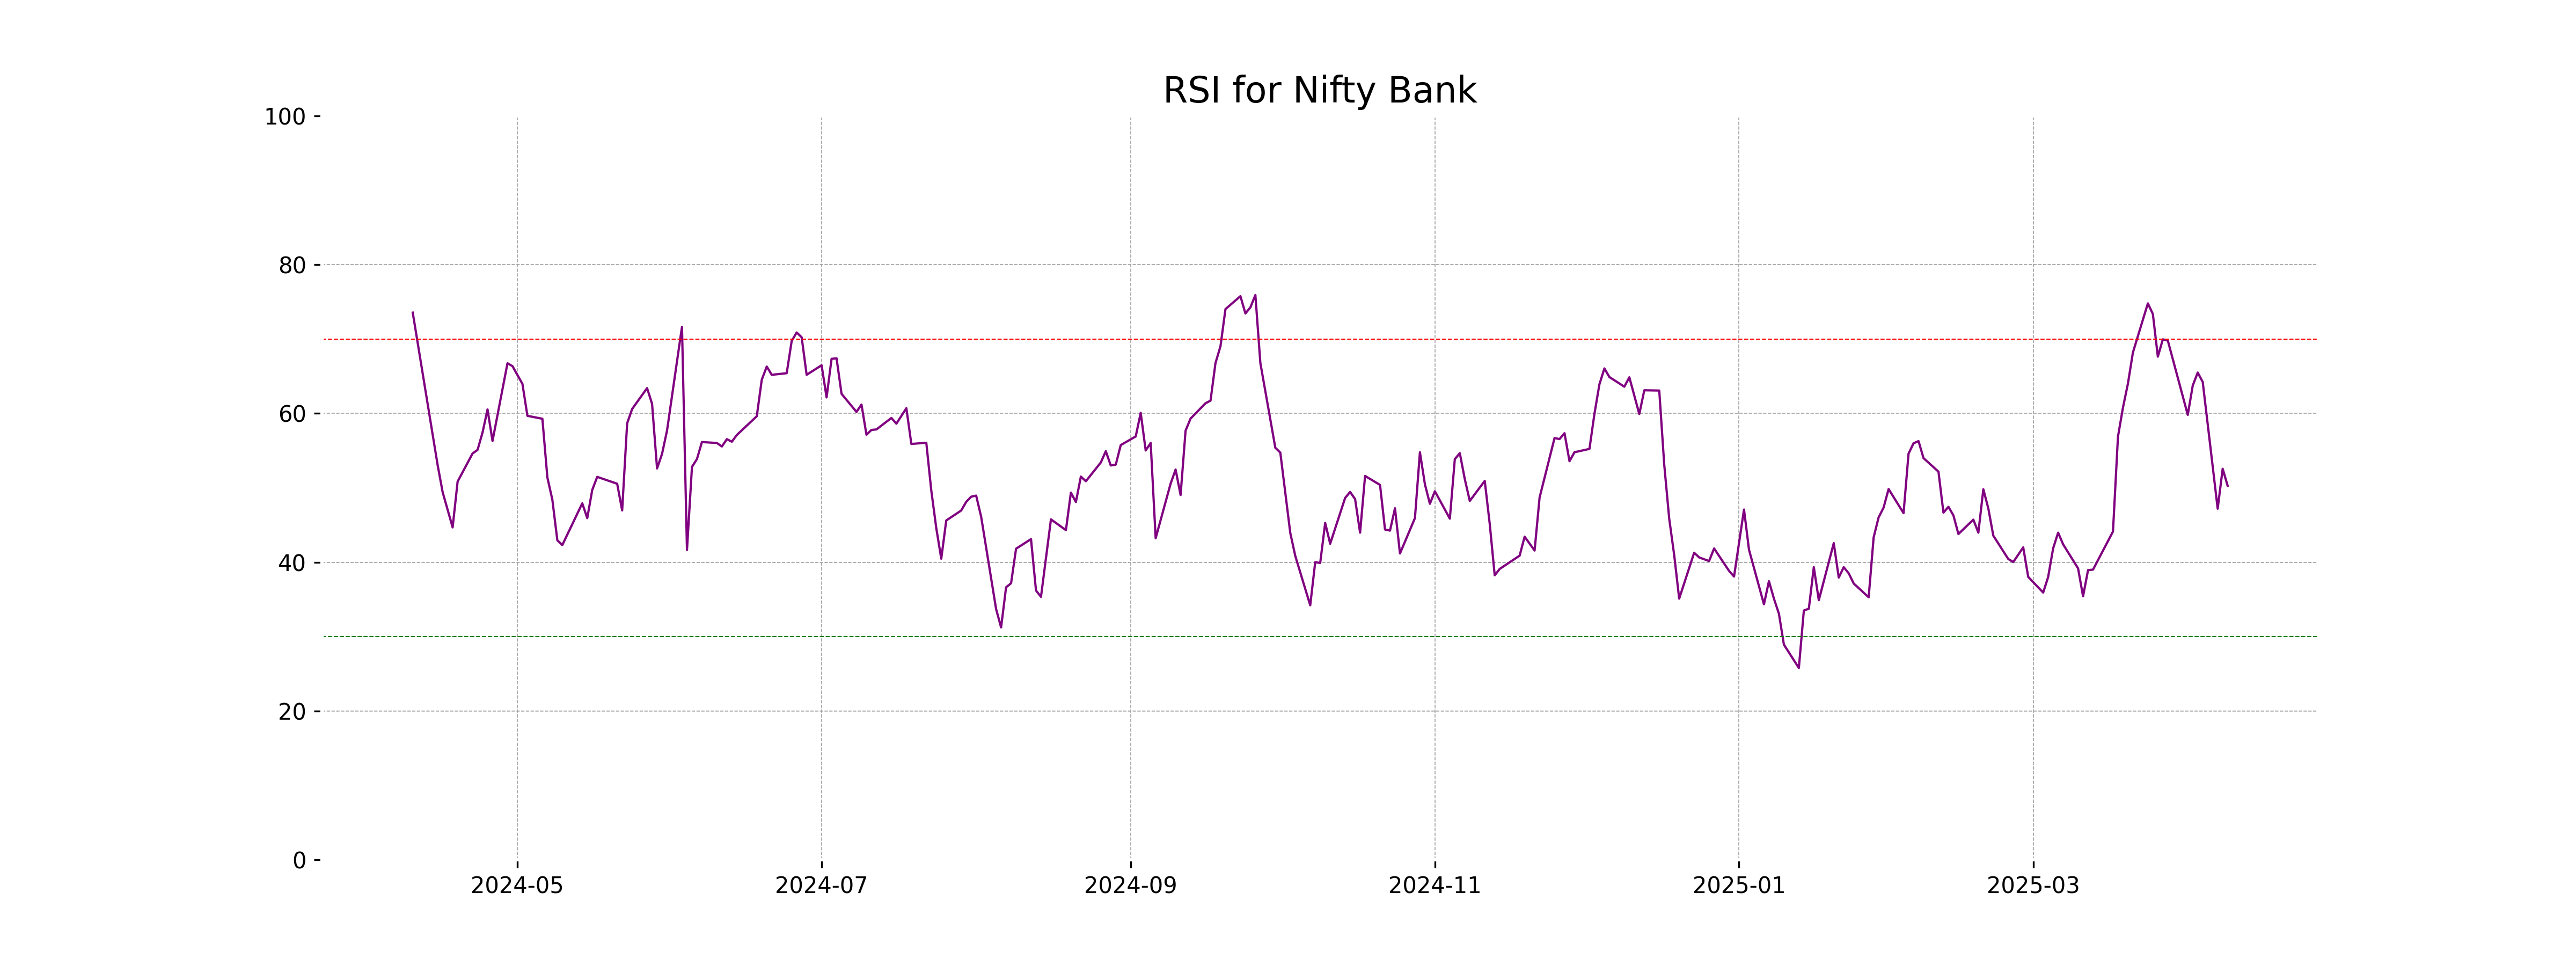
RSI Analysis
The current RSI for Nifty Bank is 50.27, indicating a neutral level, suggesting that the index is neither overbought nor oversold. This level reflects a balanced momentum, where neither bullish nor bearish trends are prominent at this moment.
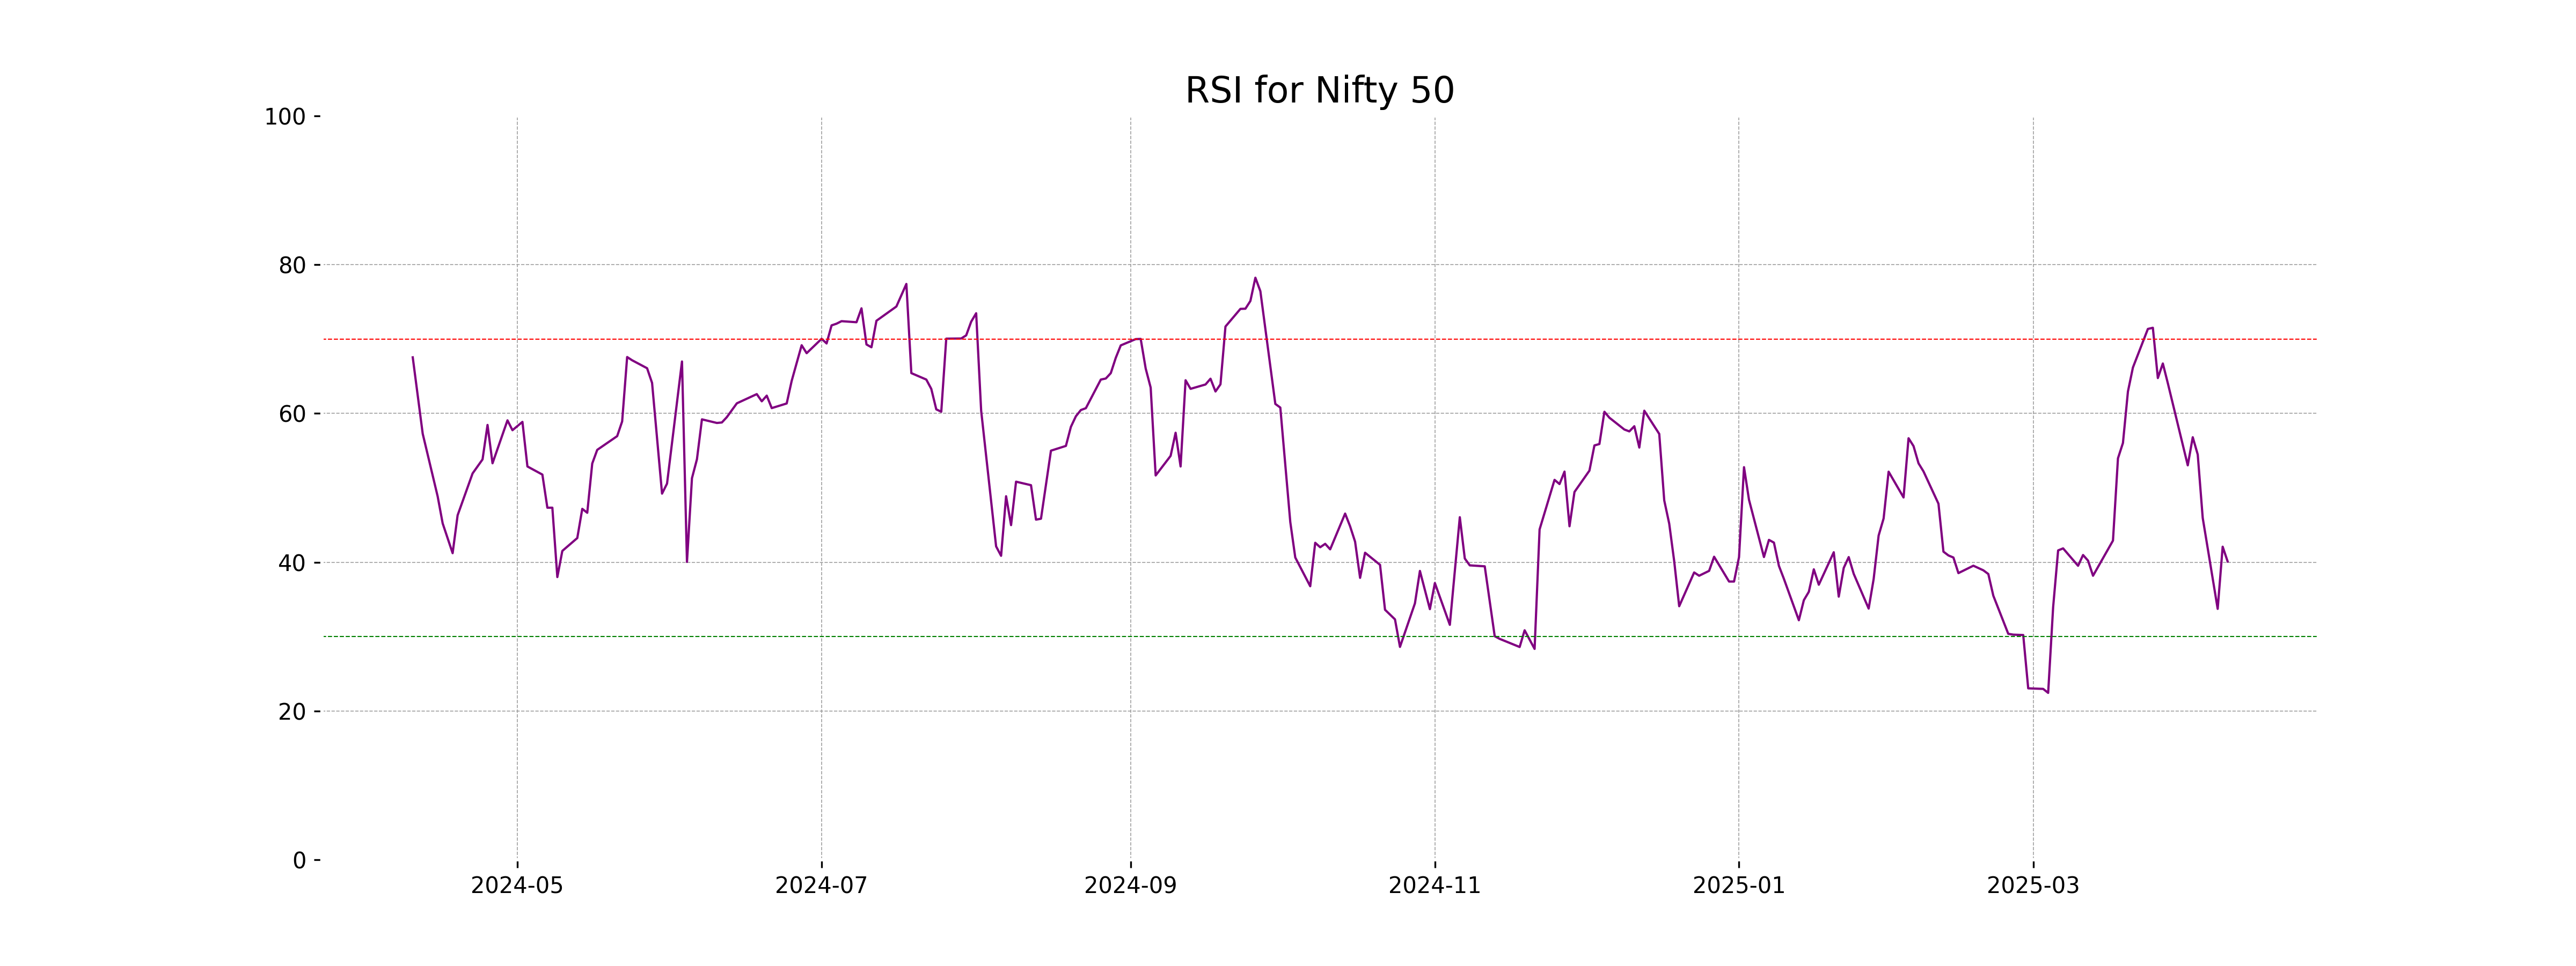
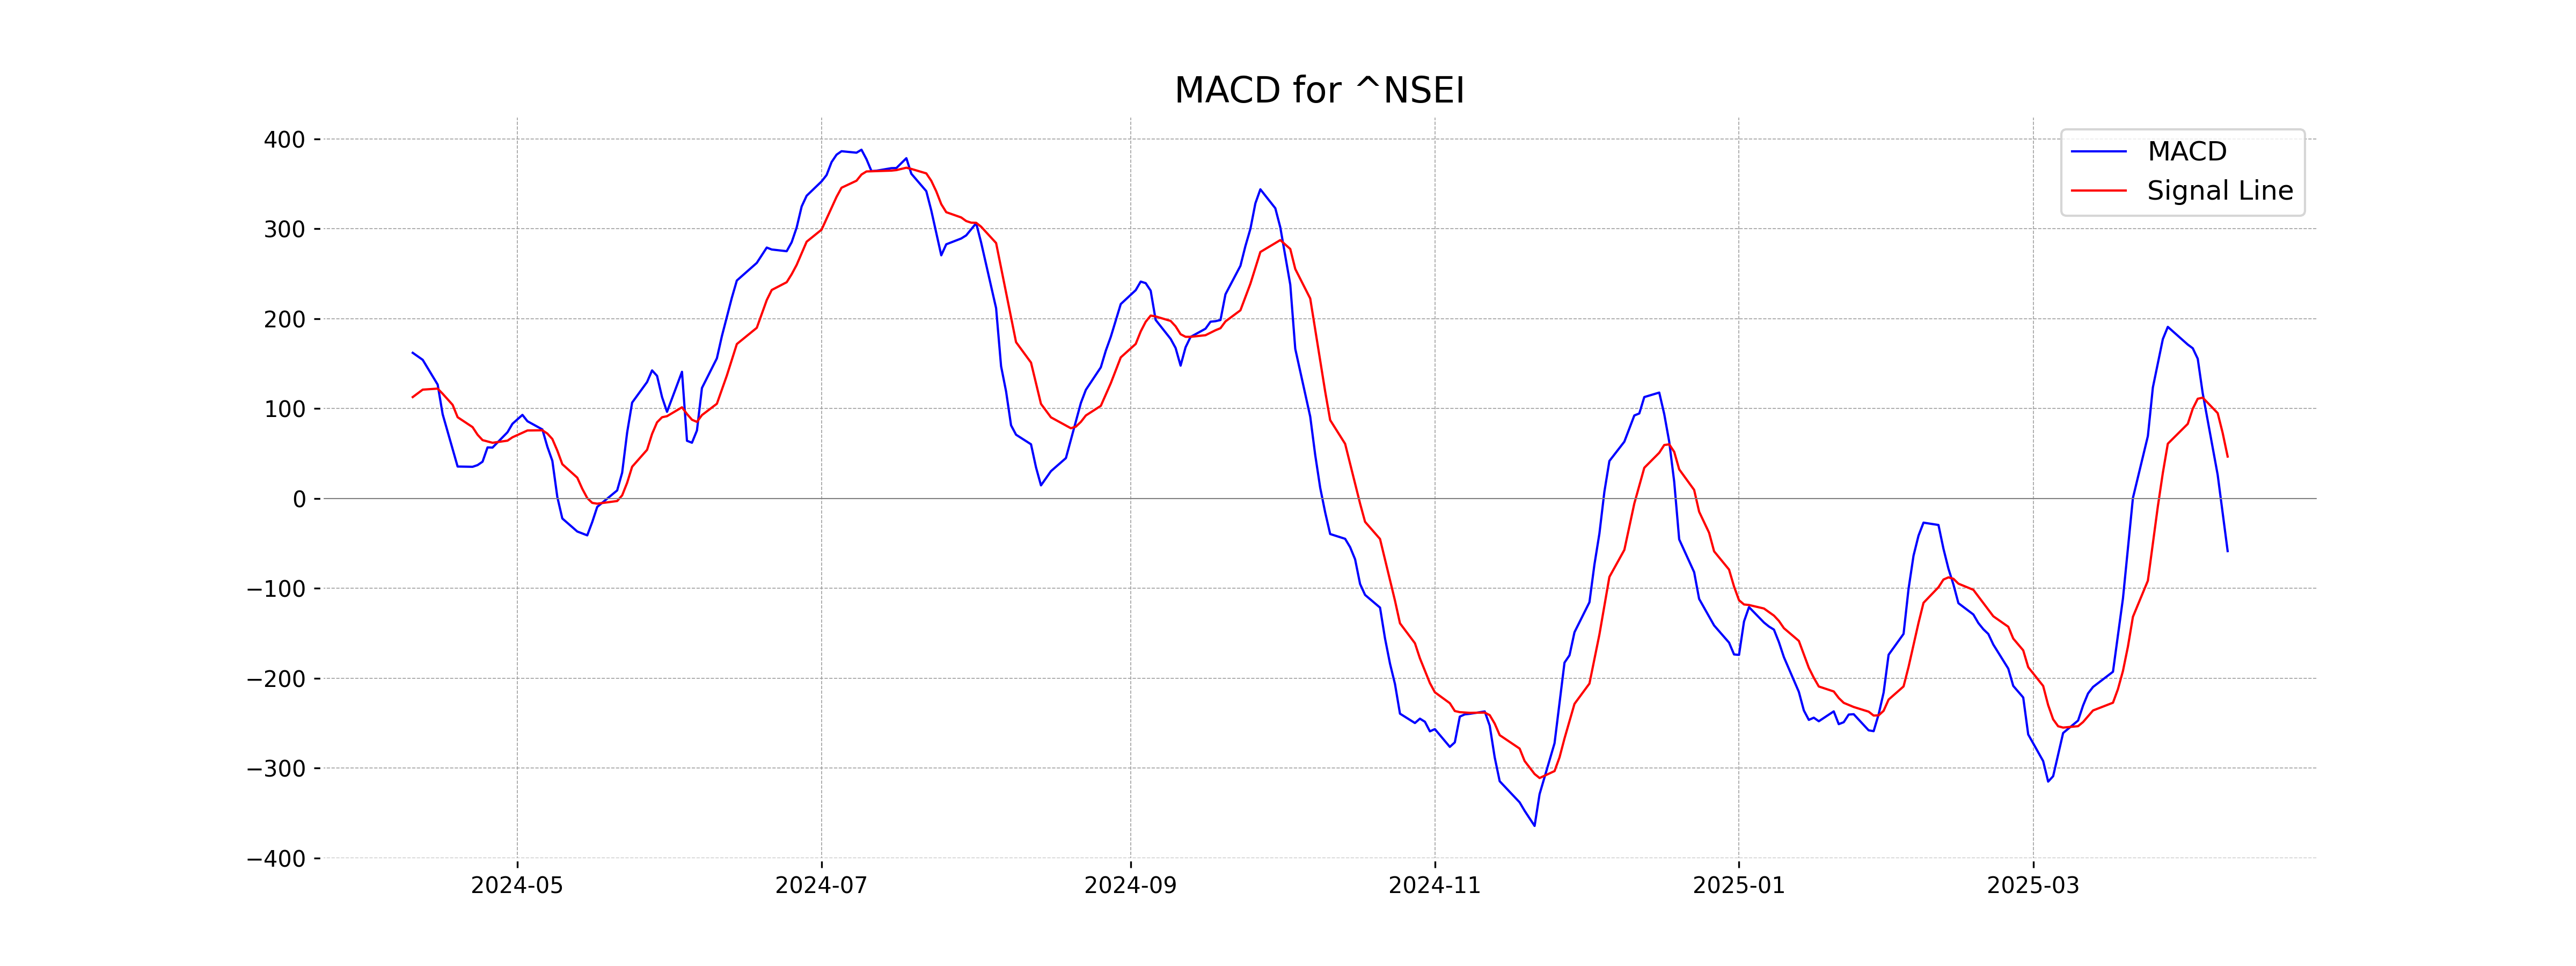
Analysis for Nifty 50 - April 09, 2025

The Nifty 50 opened at 22,460.30 and closed lower at 22,399.15, marking a percentage change of -0.61% with a points decrease of 136.70. The Relative Strength Index (RSI) is at 40.10, indicating bearish momentum, and the Moving Average Convergence Divergence (MACD) is below its signal line at -58.57, suggesting potential downward movement.
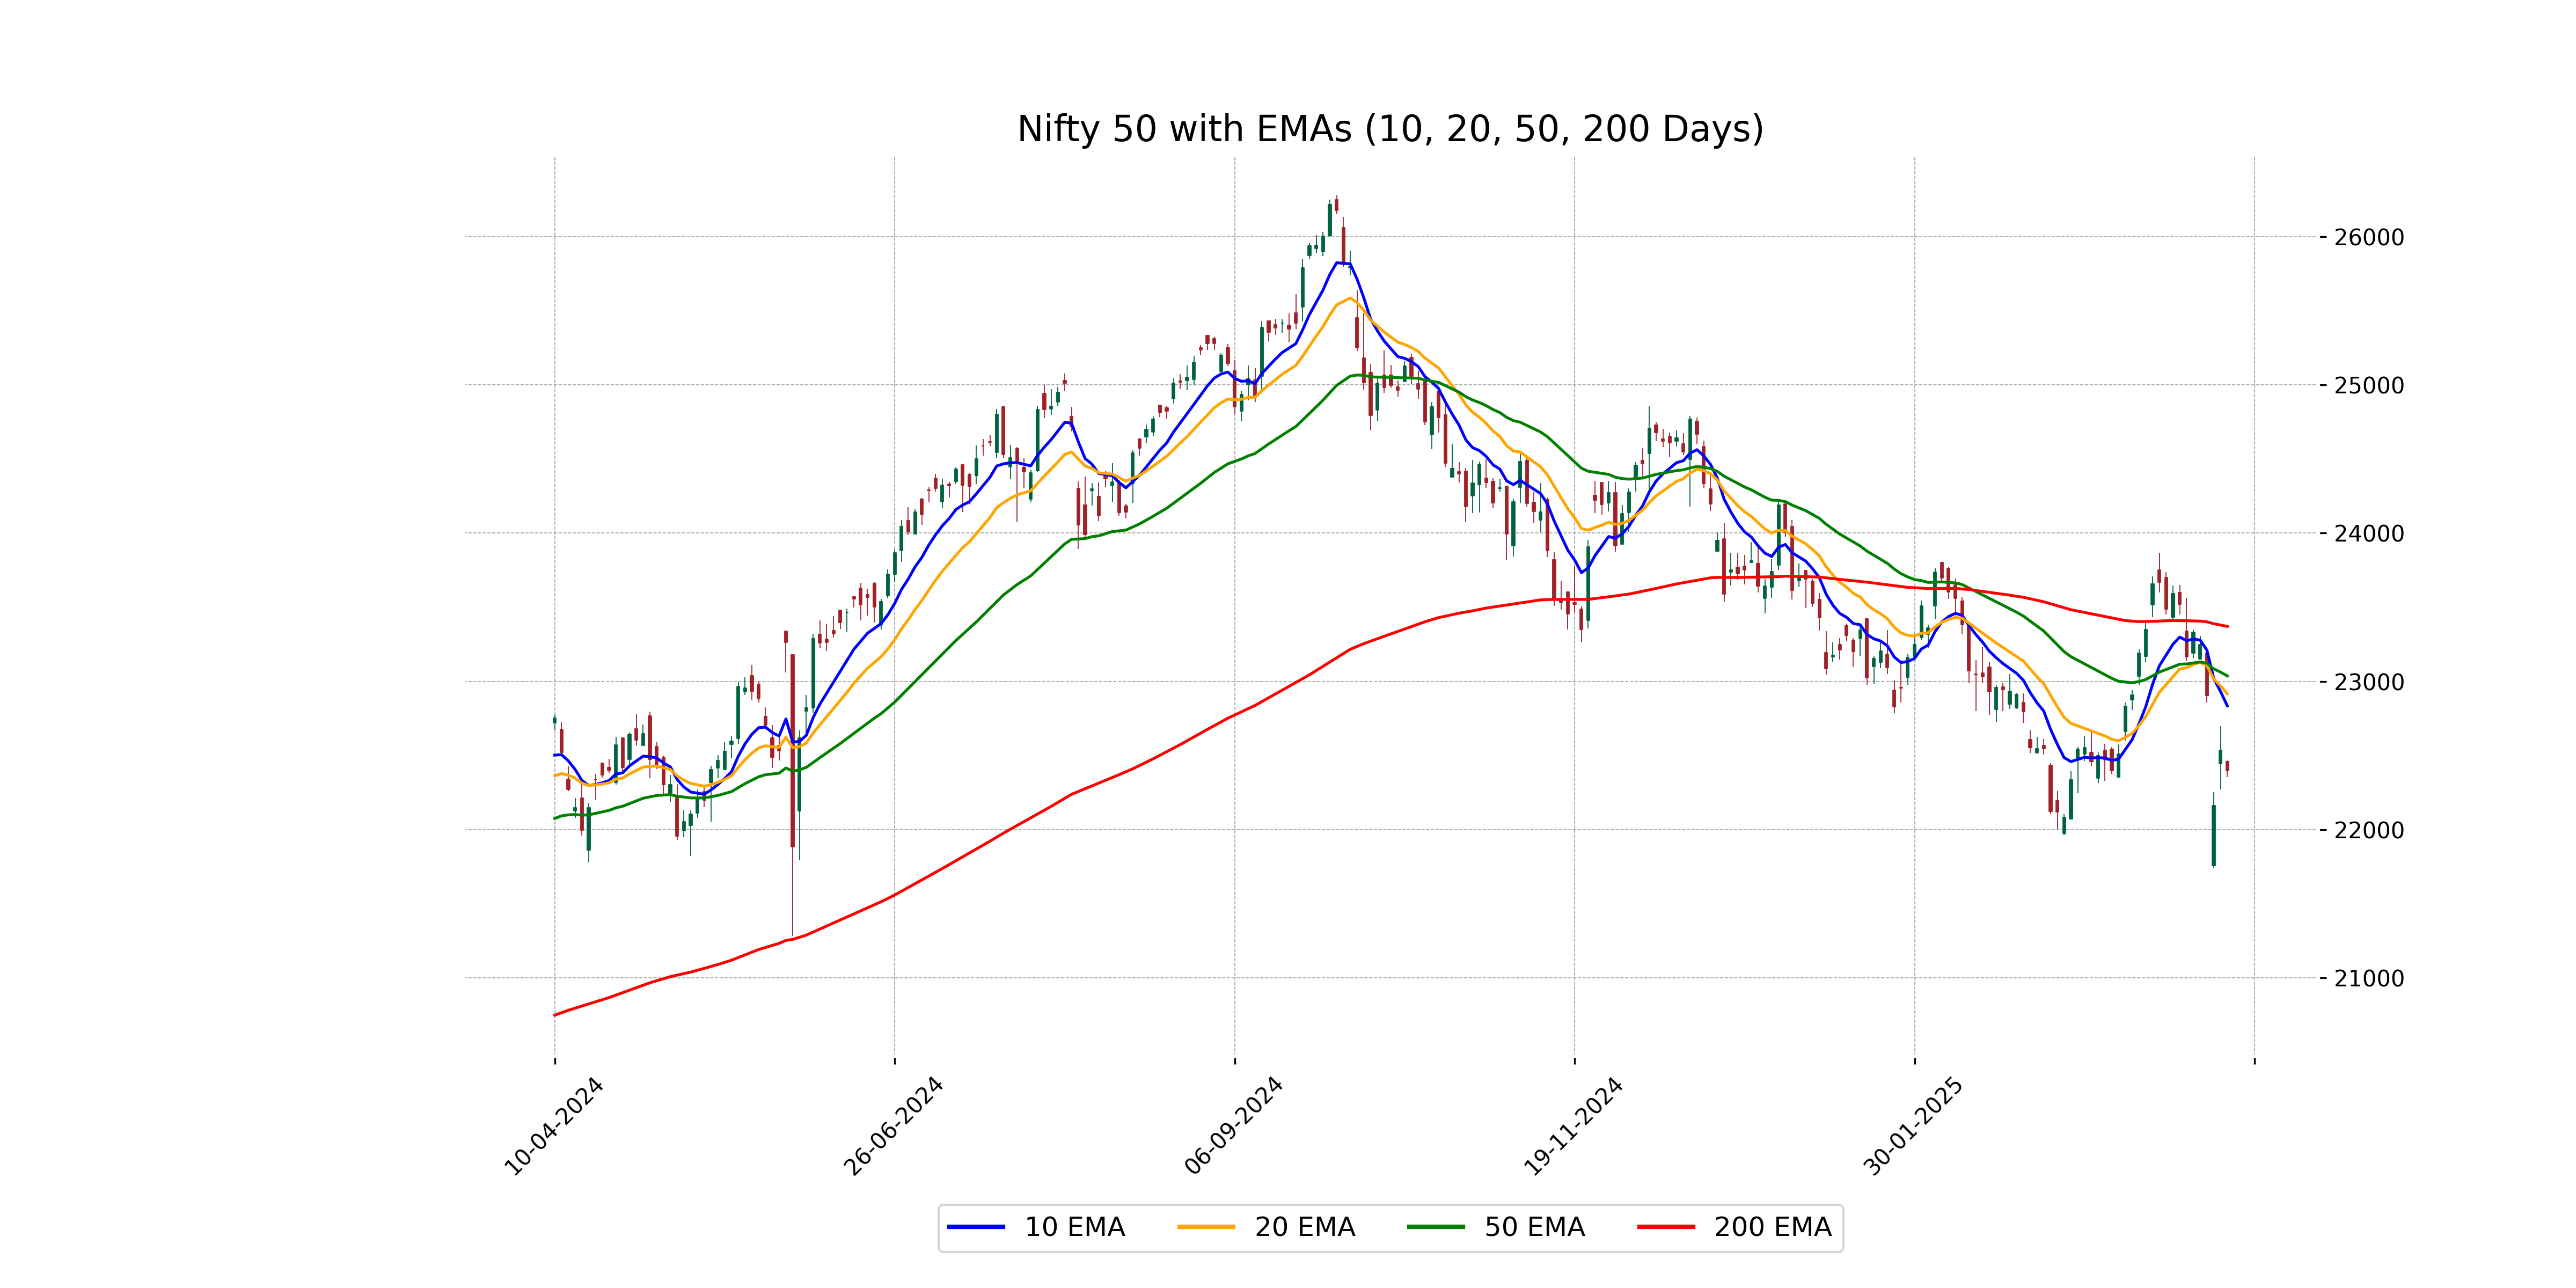
Relationship with Key Moving Averages
Nifty 50 is currently trading below its 10 EMA, 20 EMA, and 50 EMA, indicating a short-term and medium-term downtrend as it struggles to gain momentum. The 10 EMA and 20 EMA are relatively closer to the current price compared to the 50 EMA, suggesting recent bearish pressure.
Moving Averages Trend (MACD)
Nifty 50 is displaying a bearish signal as indicated by its MACD value of -58.57, which is below the MACD Signal of 46.63. This suggests a potential downtrend continuation in the market momentum.
RSI Analysis
The RSI value for Nifty 50 is 40.10, indicating a bearish momentum as it is below 50. This suggests the index may be oversold and could potentially experience a reversal or a continued bearish trend if the RSI decreases further.